Embed Size (px)
Citation preview
Unit-1:
MARKET SHARE OF DIFFERENT TYRE COMPANIES IN TRUCK
SEGMENT
Unit-2: CUSTOMER’S PREFERENCE ON DIFFERENT BRANDS AND TYRE
COMPANIES IN TRUCK SEGMENT
Ambedkar Institute of Management Studies 1
Ambedkar Institute of Management Studies
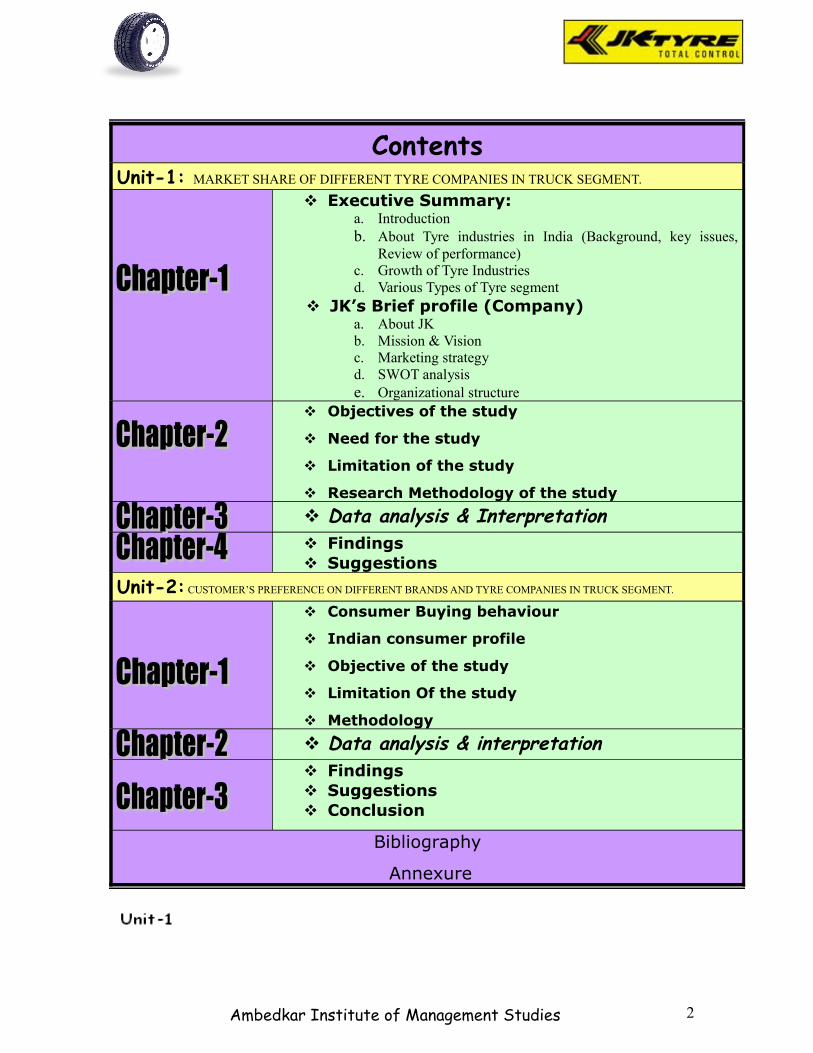
ContentsUnit-1: MARKET SHARE OF DIFFERENT TYRE COMPANIES IN TRUCK SEGMENT.
Executive Summary:a. Introductionb. About Tyre industries in India (Background, key issues,
Review of performance)c. Growth of Tyre Industriesd. Various Types of Tyre segment
JK’s Brief profile (Company)a. About JKb. Mission & Vision c. Marketing strategyd. SWOT analysise. Organizational structure
Objectives of the study
Need for the study
Limitation of the study
Research Methodology of the study
Data analysis & Interpretation Findings Suggestions
Unit-2: CUSTOMER’S PREFERENCE ON DIFFERENT BRANDS AND TYRE COMPANIES IN TRUCK SEGMENT.
Consumer Buying behaviour
Indian consumer profile
Objective of the study
Limitation Of the study
Methodology
Data analysis & interpretation Findings Suggestions Conclusion
Bibliography
Annexure
2
Executive Summary
a. Introduction
Ambedkar Institute of Management Studies
Executive Summary:a. About Tyre industries in India
b. Growth of Tyre Industries
c. Various Types of Tyre segment
JK’s Brief profile (Company)a. About JK
b. Mission & Vision
c. Marketing strategy
d. SWOT analysis
e. Marketing Organization
3
In today’s world of intense competition and rapid dynamism, all the companies
worldwide are tuning their focuses on the customer. Suddenly, the customer had
succeeded in capturing all the attention of the companies towards him, so much so, that
the once famous maxim, “customer is the god” has become so true and relevant today.
There has been a “paradigm shift” in the thinking of these companies and none other then
the customer has brought this about.
Earlier there was a sellers market, since goods and services were in short supply and
the sellers use to call the shots. But, ever since the advent of the era of globalization,
there has been total transformation in the way the customers being perceived. Today,
marketers are directing their efforts in retaining the customers and customers’ base. Their
focus has shifted towards integrating the three elements people, service and marketing.
The customer’s importance has assumed imponderable proportions in today’s
world, because of the inherent value that the customers command. A customers can
“make or break” a company. It is the responsibility of every company to see that all its
customers are equally satisfied with them, for one single dissatisfied customer will tell at
least nine others about the dissatisfaction and will spark off a chain reaction and spell
doom for that company. In such scenario, retention of the existing customers assumes
diabolical proportion. Research has thrown light on some important aspects of customers’
retention it has been proved empirically that acquiring new customers can cost five times
more than the cost involved in satisfying and retaining current customers.
In the past, the customers was taken for a ride, as there were not many players in the
fields, not much importance was attached to product safety, quality, service and product
appeal. The attitude of the manufacture was that of “caveat – emptor”. Thanks to the
government policies on liberalization, globalization and privatization (LPG), the market
scenario has changed today. Today, the customer has a host of defense mechanism like
the customers protection laws, regulation of the government, the powerful hands of the
organization, customers’ courts, switching to substitute or competitors that offer at
competitive prices, etc. The maxim,” caveat – emptor” has been replaced by “caveat
venditor”.
Ambedkar Institute of Management Studies 4
In the past, after sales service was consider as a cost center, Companies were lethargic in
attending to customers complaints. Availability of trainee service personal and quality
genuine spare parts posed serious problems. However, with the rising competition, there
could not be much product differentiation, as price and quality were comparable and
latest technology was to each and every company in the field. Since, there could not be
much differential a tangible assets, the companies concentrated on the “intangible assets”,
namely the “service factor”, which served as a major differentiator. Today after sales
service is an important aspect of every company, and it is no more considered as a cost
center, but considered as a profit center. Every organization strives hard to retain its
existing customers at any cost since it is five times costly to get a new customers, then to
retain an existing customers. Most of the industries today use of information technology
to best services to their customers.
b. About Tyre industries in India
Background
The origin of the Indian Tyre Industry dates back to 1926 when Dunlop Rubber Limited
set up the first tyre company in West Bengal. MRF followed suit in 1946. Since then, the
Indian tyre industry has grown rapidly.
Transportation industry and tyre industry go hand in hand as the two are interdependent.
Transportation industry has experienced 10% growth rate year after year with an absolute
level of 870 billion ton freight. With an extensive road network of 3.2 million km, road
accounts for over 85% of all freight movement in India.
Key Issues of tyre industries
High tax usage
The high tax content on tyres can be gauged from the fact that the percentage of total tax
to the tax excluded price for various categories of tyres is - 44% for Truck Tyre; 41% for
Passenger Car Radial Tyre, 35% for Tractor Rear Tyre and 76% for Truck Tyre Tube.
Ambedkar Institute of Management Studies 5
Increase in raw material costs
Apart from being capital intensive, the tyre industry is highly raw material intensive. Any
change in the prices of raw materials affects the profitability of tyre companies. The raw
materials used in the manufacture of tyres are rubber and petroleum derivatives like
nylon tyre cord, carbon black, styrene butadiene rubber and poly butadiene rubber. The
most important raw material is rubber-natural and synthetic. Natural rubber (NR), with
29% weightage in the cost of raw materials used by tyre industry, is the highest cost item.
Annual consumption of NR by tyre industry is 3.50 lakh tonnes, valued at Rs. 14 billion.
Over 85% of NR consumed' by the industry is procured domestically. 15% is imported.
In the 2003-04 fiscal, as against the Minimum Statutory Price of Rs. 32.0 per kg, the
ruling domestic price of NR had been over Rs. 50 per kg. This is higher than the world
rubber prices. However, this does not entail the tyre industry players to import as a
number of restrictions are imposed on the import of NR. NR can be imported only
through two ports-Kolkata & Visakhapatnam. The customs duty on import of natural
rubber is 20%, with 10% under Bangkok Agreement. However, this is not relevant, as NR
is not cultivated in South Korea, Bangladesh & China (signatories under the Bangkok
Agreement). Hence, NR can be sourced only from Sri Lanka (under the Indo-Sri Lanka
Agreement), which is of bad quality. Thus, the options of rubber import are restricted and
the manufacturers have to rely on the domestic market for procuring rubber.
Import of tyres
During the FY2002, over 1,10,000 passenger car tyres were imported. Although this
constitutes a small percentage (1.5%) of total passenger car tyre production in the
country, since total imports are of radial passenger car tyres, the percentage is higher
when compared against domestic production of radial passenger car tyres. A large
percentage of imports are from South Korea at a concessional rate of customs duty (i.e.
15%) under the Bangkok Agreement - as against 20% normal rate of customs duty.
Even though the Government has imposed a restraint on the import of used tyres into
India, occasionally there are reports of import of such tyres in a clandestine manner,
Ambedkar Institute of Management Studies 6
sometimes as new tyre at low value, since there is no restriction on import of new tyres or
as tyres under the "others" category. Many countries such as Japan, Bangladesh, Pakistan,
Philippines, Thailand, Kenya, South Korea, etc. have either put a complete ban on import
of used tyres or have placed stringent conditions on such imports.
Tyre Exports
The product focus of tyre exports from India has been Traditional Truck Tyres. Globally
this segment of tyre export is shrinking due to greater acceptance of radial tyres. Over the
years, China has emerged as a major exporter in bias tyre category. Additionally, export
of Indian tyres to select countries is subjected to non-tariff barriers (NTBs) by way of
standards, tests, etc. Export of cheaper tyres from China to major tyre importing markets,
like US, is adversely affecting Indian tyre exports to these markets. India's share in
exports to these countries (especially USA) is progressively declining. If the trend is not
reversed, Indian tyre industry will find it extremely difficult to regain its erstwhile
position in these markets. Low rate of interest, cheaper electricity tariff, hidden subsidies
by the Chinese Government, better infrastructure facilities and lower transaction costs are
factors favourable to Chinese tyre industry.
Trends in Production, Consumption, Price & Capacity Utilization
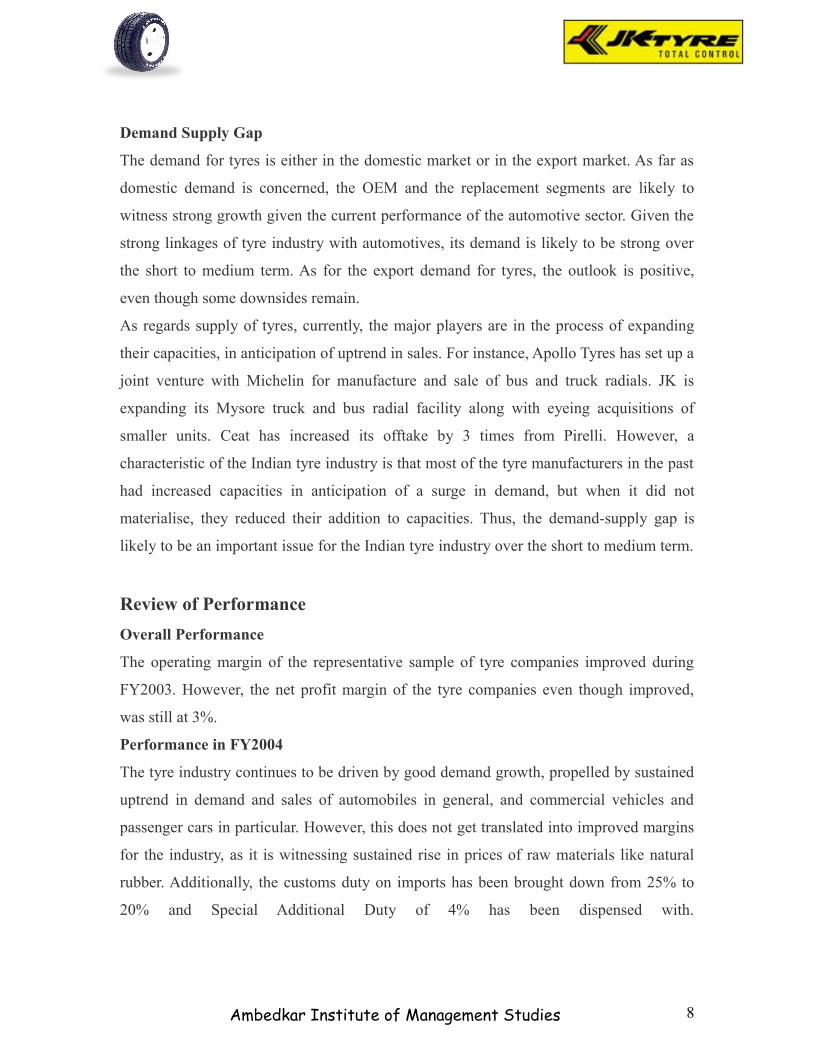
The total tyre produced in the country was 51.58 million units in FY2003 - a 19% growth
rate over FY2002.
CAGR of tyre production (in %) FY 1993-2003 9%FY 1993-1998 7%FY 1999-2003 9%FY 2002-2003 19%
Compiled by INGRESCurrently, the size of the Indian tyre industry is estimated at Rs. 128 billion (0.5% of
Indian GDP), as of FY2003. The total installed capacity of the Indian tyre industry is
around 60.5 mn units, and the capacity utilization is around 85%. The capacity utilization
improved in FY2003 following improved demand from the automotive segment (75% in
FY2001). Additionally, in FY2003, the price realization of tyre manufacturers also
registered an increase by 8%, as against a 0.6% increase in FY2002.
Ambedkar Institute of Management Studies 7
Demand Supply Gap
The demand for tyres is either in the domestic market or in the export market. As far as
domestic demand is concerned, the OEM and the replacement segments are likely to
witness strong growth given the current performance of the automotive sector. Given the
strong linkages of tyre industry with automotives, its demand is likely to be strong over
the short to medium term. As for the export demand for tyres, the outlook is positive,
even though some downsides remain.
As regards supply of tyres, currently, the major players are in the process of expanding
their capacities, in anticipation of uptrend in sales. For instance, Apollo Tyres has set up a
joint venture with Michelin for manufacture and sale of bus and truck radials. JK is
expanding its Mysore truck and bus radial facility along with eyeing acquisitions of
smaller units. Ceat has increased its offtake by 3 times from Pirelli. However, a
characteristic of the Indian tyre industry is that most of the tyre manufacturers in the past
had increased capacities in anticipation of a surge in demand, but when it did not
materialise, they reduced their addition to capacities. Thus, the demand-supply gap is
likely to be an important issue for the Indian tyre industry over the short to medium term.
Review of Performance
Overall Performance
The operating margin of the representative sample of tyre companies improved during
FY2003. However, the net profit margin of the tyre companies even though improved,
was still at 3%.
Performance in FY2004
The tyre industry continues to be driven by good demand growth, propelled by sustained
uptrend in demand and sales of automobiles in general, and commercial vehicles and
passenger cars in particular. However, this does not get translated into improved margins
for the industry, as it is witnessing sustained rise in prices of raw materials like natural
rubber. Additionally, the customs duty on imports has been brought down from 25% to
20% and Special Additional Duty of 4% has been dispensed with.
Ambedkar Institute of Management Studies 8
Outlook
The level of economic activity, performance of domestic automotive industry, and the
faring of the transport sector directly influence the performance of the tyre industry in
India. With the replacement segment dominating the overall tyre demand in India, the
industry remains inherently vulnerable to economic cycles. While radicalization has
become the norm in the passenger car segment, in the bus and truck tyre segment, its
acceptance is still limited. Bus and truck radicalization could emerge in the long term as
the quality of roads improves and the restrictions on overloading are better enforced. The
practice of re-treading, which is gaining increasing acceptance, could pose a challenge to
replacement demand in the medium term. The ability of the re-treading sector to capture
potential replacement demand would depend on the awareness among customers (of the
benefits of retreading) and also the quality of retreading done. Given the low levels of
penetration of two-wheelers and passenger cars in the country, OEM demand is likely to
increase, which in turn would push up replacement demand with a lag.
The prospects of tyre exports from India appear healthy, following efforts by Indian
companies to increasingly enter into outsourcing agreements with tyre producers in
Southeast Asia, Eastern Europe and Latin America. Overall, tyre manufacturers are likely
to tap the export market in an effort to boost sales. The increasing exports of bus and
truck tyres (crossply variety) from India to developing countries is because of the fact
that developing countries are unable to source them from developed countries as these are
no more produced there. Tyre imports are unlikely to pose a threat to the domestic
industry, given that domestic prices are lower than international tyre prices.
In the domestic market, tyre manufacturers are expected to increasingly focus on
expanding their dealership networks & explore possibilities of tie-ups among themselves
to penetrate the growing customer base. They are also likely to pursue innovative
measures (such as "dial-a-tyre service and road shows) to improve customer awareness.
The consolidation of the Indian tyre industry is likely to continue in the coming years
through mergers among existing players. The industry is likely to expand through a
combination of organic and inorganic growth. While organic growth would come from
Ambedkar Institute of Management Studies 9
raising efficiency levels, inorganic growth would be achieved through alliances and
M&As.
c. Growth of Tyre industries in India
The Indian tyre industry is expected to clock a tonnage growth of 9-10 per cent over the
next five years, according to a study by Credit Analysis and Research Limited (CARE), a
noted rating firm that offers a wide range of rating and grading services across sectors.
While the truck and buses tyres are set to register a CAGR (compounded annual growth
rate) of 8 per cent, the LCV (light
Commercial vehicles) tyres are poised for a CAGR of 14 per cent.
According to the CARE study, the growth in the Indian tyre industry will be fuelled by
the expansion plans of the automobile companies, government's focus on development of
road infrastructure and sourcing of auto parts by the global Original Equipment
Manufacturers (OEMs).
However, the tyre industry has to grapple with raw material price volatility, rupee
appreciation and cheap Chinese imports.
The tyre industry in India recorded a CAGR of 9.69 per cent during 2002-07.
The size of the industry was estimated at Rs 19,000 crore in 2006-07 with a total
production of 736 lakh units of tyres.
In 2006-07, the replacement tyres accounted for 53 per cent of the total tyre tonnage
offtake, followed by 31 per cent share of OEM and 15 per cent by exports.
Out of the 736 lakh ton of tyres, 54, 49,560 units worth Rs 2,600 crore were exported.
The exports from India posted a CAGR of 13 per cent in unit terms and 18 per cent in
value terms between 2002-07.
Ambedkar Institute of Management Studies 10
The study points out that on the export front, the Indian tyre companies need to explore
newer markets as the existing market for bias truck tyre which accounts for about 45 per
cent of the total export volume is nearing saturation.
This apart, with rationalization catching up in the foreign markets, the Indian tyre
companies need to graduate to radial tyres so as to protect their share in the export
market.
At present, radicalization of tyres is low in India except for the car tyre market where 95
per cent of the tyres is radicalized while cross ply tyres is preferred in all other categories.
Cross ply tyres are preferred owing to poor road conditions, overloading in trucks, higher
cost of radial tyres and poor awareness among the tyre users in the country.
The CARE report observes that though the tyre technology in India has witnessed several
developments with continuous innovation, the domestic tyre manufacturers still lag
behind their global counterparts in terms of product differentiation.
Global tyre makers offer a wide change of products like tyres with pressure warning
systems, run flat tyres, eco-friendly tyres and energy efficient tyres.
d. Various types of Tyre segment
Tyres by Type
The Indian tyre industry produces the complete range of tyres required by the Indian
automotive industry, except for aero tyres and some specialised tyres. Domestic
manufacturers produce tyres for trucks, buses, passenger cars, jeeps, light trucks, tractors
(front, rear and trailer), animal drawn vehicles, scooters, motorcycles, mopeds, bicycles
and off-the-road vehicles and special defence vehicles.
The scenario in India stands in sharp contrast to that in the world tyre market, where car
tyres (including light trucks) have the major share (88%) by volume followed by truck
Ambedkar Institute of Management Studies 11
Tyres (12%). In India, however, passenger car tyres have a mere 17% share of the overall
tyre market.
Truck and Bus Tyres
The truck and bus tyre segment accounted for 19% of tyres produced in India in FY2003.
Every truck/bus manufactured generates a demand for seven tyres (six regular and one
spare) as against three in the case of two-wheelers and five for passenger cars. In
addition, the price of a truck tyre is significantly higher than that of a passenger car tyre
(roughly 10 times) or a motorcycle tyre. Thus the demand multiple emanating from the
commercial vehicle segment is highest in value terms.
Given the regular use and heavy wear and tear of truck and bus tyres, the demand from
the replacement market in this segment worked out to 68% of the total demand for truck
and bus tyres in FY2003; the OEM demand accounted for around 9% the same year. With
the Indian manufacturers of cross-ply tyres focusing on the export market, this segment
accounts for around 22% of the demand for truck and bus tyres.
Passenger Car Tyres
The passenger car tyre segment accounted for 17% of all tyres produced in India in
FY2003. With passenger car production witnessing a growth of 12% in FY2003 over the
previous year, OEM demand accounted for about 33% of the total sales that year. The
replacement market accounted for around 63% of the total sales of passenger car tyres in
FY2003. Exports accounted for 4% of the total passenger car tyre demand in FY2003.
With the stock of cars increasing, replacement demand is likely to continue.
Motorcycle Tyres
Motorcycles accounted for 76% of two-wheelers sold in the domestic market in FY2003.
Motorcycle tyres constitute the largest segment of the domestic tyre industry (29% of
total tyre demand in FY2003). The replacement market accounted for around 49.8% of
the total motorcycle tyres sold in FY 2003, while OEM demand accounted for around
50%.
Ambedkar Institute of Management Studies 12
Scooter Tyres
Scooters were the dominant segment in the Indian two-wheeler industry till FY1998,
accounting for around 42% of domestic two-wheeler sales. However, the introduction of
new motorcycle models has seen the share of scooters declining to 19% of domestic two-
wheeler sales in FY2003. The OEM segment accounted for around 34% of the total sales
in the scooter tyre segment in FY2003, with the rest being accounted for by the
replacement market.
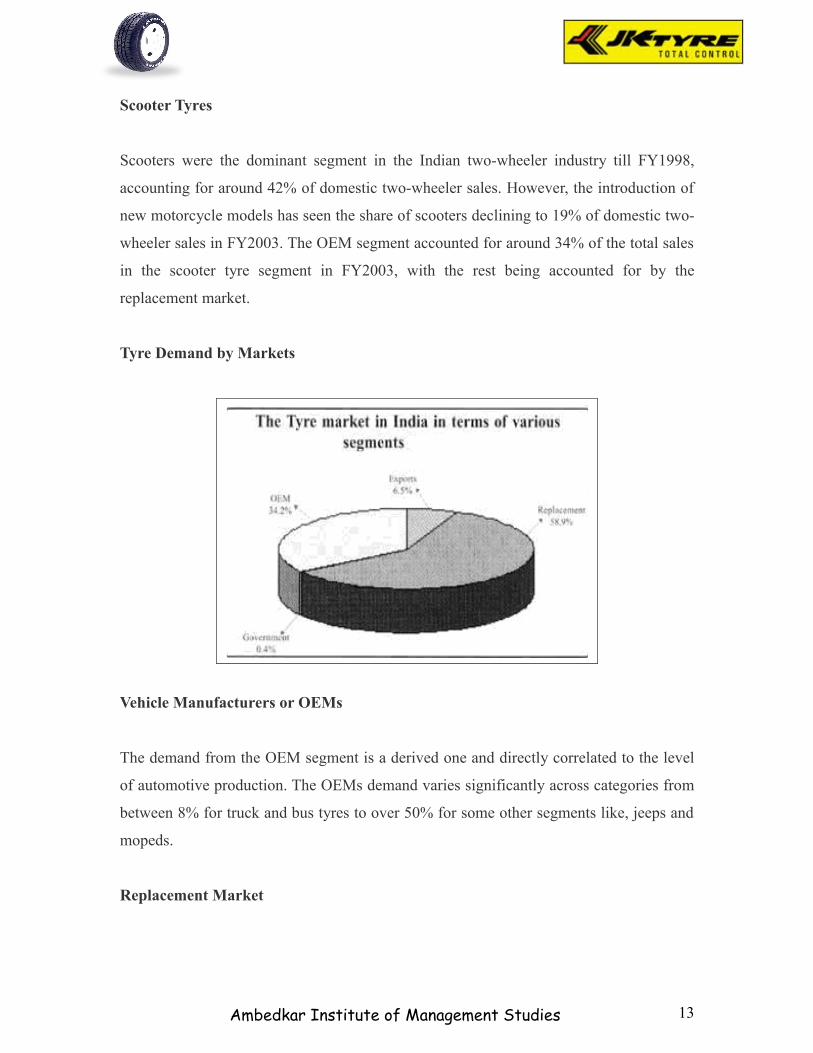
Tyre Demand by Markets
Vehicle Manufacturers or OEMs
The demand from the OEM segment is a derived one and directly correlated to the level
of automotive production. The OEMs demand varies significantly across categories from
between 8% for truck and bus tyres to over 50% for some other segments like, jeeps and
mopeds.
Replacement Market
Ambedkar Institute of Management Studies 13
The replacement market, including State transport undertakings and Government buying,
accounted for around 59% of the total tyre demand in FY2003. The demand in the
replacement market depends on the vehicle population, the level of economic activity, life
of the products transported, kilometreage per vehicle, the price of the tyres and the
quality of the existing road infrastructure. Additionally, the replacement market, which
offers better margins, is extremely competitive. The replacement market is dominated by
the truck and buses segment, which accounted for 22% of all tyre sales in the replacement
market in FY2003.The large size of the replacement in turn is determined by the interplay
of various factors as discussed below:
The replacement demand may be lower because of longer replacement intervals and
lower business mileage if the economic activity slows down.
• Replacement demand in India is higher because of a low vehicle scrap page rate.
• Poor road conditions by lowering the life of tyres, have a positive impact on
replacement demand.
• Stricter enforcement of the MV Act, which seeks to prevent overloading of
vehicles, will result in an increase in the life of tyres and thus impact replacement
demand negatively.
• Applying a new tread or "re-treading" can extend the life of the tyre at a
significantly lower cost, thereby lowering replacement demand. In India, re-
treading finds greater acceptance in the commercial segment.
• Radicalization of tyres is likely to result in lower replacement demand. While car
radicalization in the country has reached a level of 65%, truck and bus
radicalization stands at just 2-10%. Poor road and support infrastructure as well as
traditional vehicle designs act as a barrier to radicalization in the commercial
vehicle segment. Radial technology for trucks and buses would help increase
operating efficiencies by delivering better mileage and minimizing wear and tear.
According to ATMA, even if only 25% of the truck and bus segment is radicalized,
the savings in fuel costs would be around Rs. 7,500 million.
Ambedkar Institute of Management Studies 14
• Introduction of tubeless tyres in the passenger car segment is also likely to affect
replacement demand adversely
• Introduction of eco-friendly radial tyres such as hyper-bonding silica technology
in the passenger car segment may affect replacement demand adversely.
Exports
In the light of the prevailing domestic market situation, most of the tyre manufacturers
have taken to exports to reduce inventory build-ups. In FY2003, Indian tyre exports stood
at Rs. 10.8 billion (10% of the total industry) in value terms and 3.1 million in unit terms
(6.5% of total production). Indian companies have currently entered into sourcing
agreements (for tyres) with neighboring countries. For instance, Ceat and J K Tyres have
sourcing agreements with tyre producers in Sri Lanka and China. This is likely to have a
positive impact on tyre exports from India.
Market Players
Some of the major players in the Indian tyre industry are MRF, Ceat, JK Industries,
Apollo Tyres, Bridgestone India, Goodyear India, Falcon Tyres and TVS Srichakra. The
tyre industry in India is fairly concentrated, with the sample of eight companies
JK’s Brief Profile
a. About JK
Jk Tyre and Industries is a mega corporate entity that is emblematic of excellence,
diversification and pioneering new technologies. A part of JK Organization which ranks
among the top private groups private groups in India, Jk Tyre and Industries is committed
to self reliance and follows an ethic that views customer satisfaction as an index of
achievement.
Over the years, the company has expanded and diversified its business portfolio. It has
developed into a multi product, multi-location corporate entity comprising of following
business divisions:
The advent of JK Organization on the industrial landscape of India almost synchronizes
with the beginning of an era of industrial awareness - an endeavor for self reliance and
Ambedkar Institute of Management Studies 15
the setting up of a dynamic Indian industry. This was way back in the middle of the 19th
century. And the rest that followed is history.
CORE VALUES:
JK Organization has been a forerunner in the economic and social advancement of India.
It always aimed at creating job opportunities for a multitude of countrymen and to
provide high quality products. It has striven to make India self reliant by pioneering the
production of a number of industrial and consumer products, by adopting the latest
technology as well as developing its own know-how. It has also undertaken industrial
ventures in several other countries.
JK Organization is an association of industrial and commercial companies and charitable
trusts. Its member companies, employing nearly 50,000 persons are engaged in the
manufacture of a variety of products and in diverse fields of commerce.
Trusts are devoted to promoting industrial, technical and medical research, education,
religious values and providing better living and recreational facilities. With the spirit of
social consciousness uppermost in mind, J.K. Organization is committed to the cause of
human advancement.
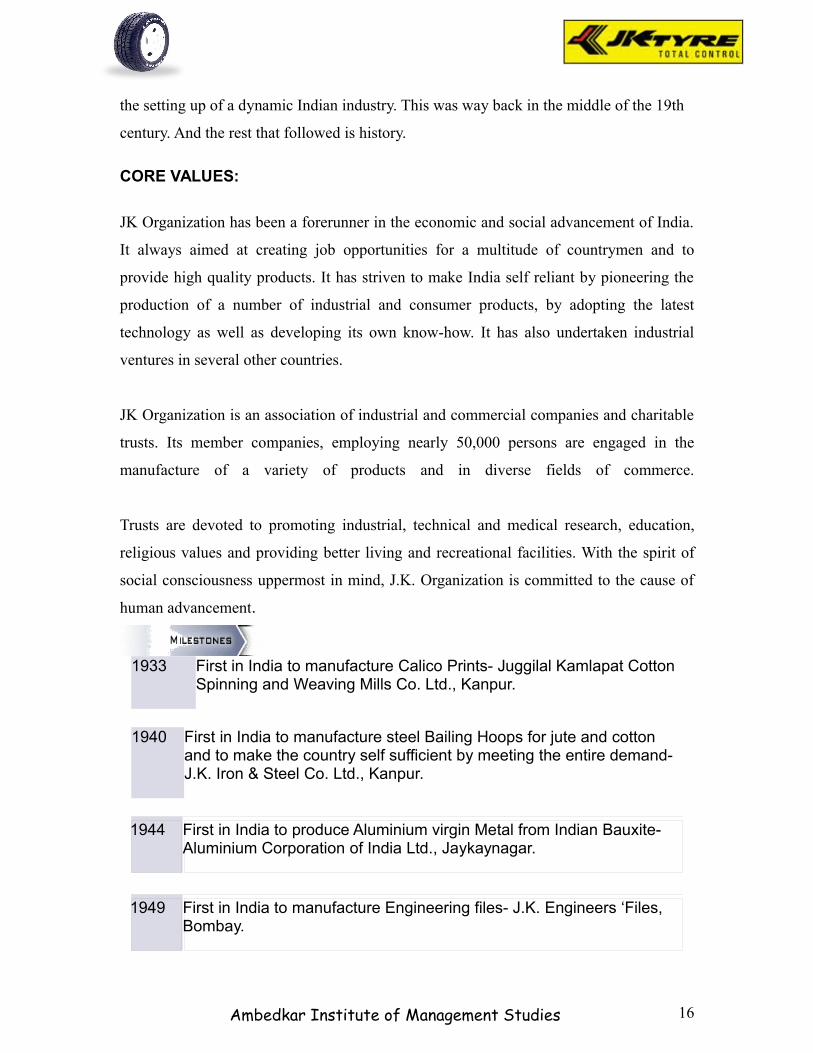
1933 First in India to manufacture Calico Prints- Juggilal Kamlapat Cotton Spinning and Weaving Mills Co. Ltd., Kanpur.
1940 First in India to manufacture steel Bailing Hoops for jute and cotton and to make the country self sufficient by meeting the entire demand-J.K. Iron & Steel Co. Ltd., Kanpur.
1944 First in India to produce Aluminium virgin Metal from Indian Bauxite-Aluminium Corporation of India Ltd., Jaykaynagar.
1949 First in India to manufacture Engineering files- J.K. Engineers ‘Files, Bombay.
Ambedkar Institute of Management Studies 16
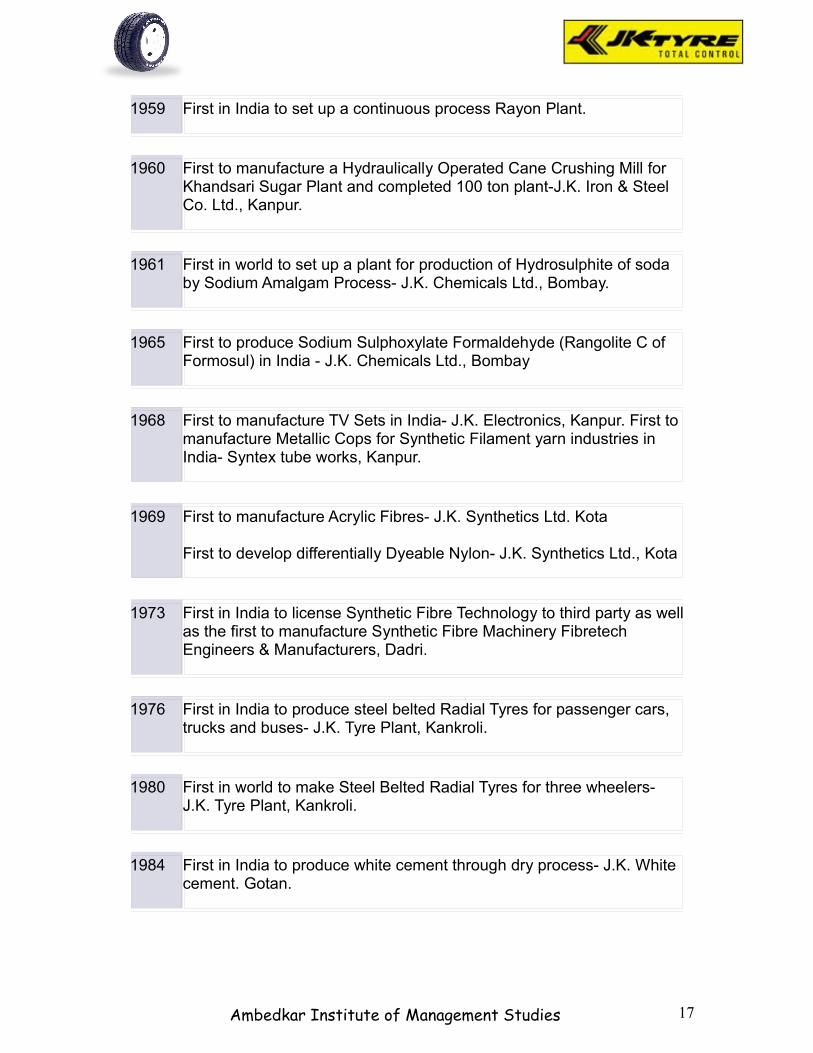
1959 First in India to set up a continuous process Rayon Plant.
1960 First to manufacture a Hydraulically Operated Cane Crushing Mill for Khandsari Sugar Plant and completed 100 ton plant-J.K. Iron & Steel Co. Ltd., Kanpur.
1961 First in world to set up a plant for production of Hydrosulphite of soda by Sodium Amalgam Process- J.K. Chemicals Ltd., Bombay.
1965 First to produce Sodium Sulphoxylate Formaldehyde (Rangolite C of Formosul) in India - J.K. Chemicals Ltd., Bombay
1968 First to manufacture TV Sets in India- J.K. Electronics, Kanpur. First to manufacture Metallic Cops for Synthetic Filament yarn industries in India- Syntex tube works, Kanpur.
1969 First to manufacture Acrylic Fibres- J.K. Synthetics Ltd. Kota
First to develop differentially Dyeable Nylon- J.K. Synthetics Ltd., Kota
1973 First in India to license Synthetic Fibre Technology to third party as well as the first to manufacture Synthetic Fibre Machinery Fibretech Engineers & Manufacturers, Dadri.
1976 First in India to produce steel belted Radial Tyres for passenger cars, trucks and buses- J.K. Tyre Plant, Kankroli.
1980 First in world to make Steel Belted Radial Tyres for three wheelers- J.K. Tyre Plant, Kankroli.
1984 First in India to produce white cement through dry process- J.K. White cement. Gotan.
Ambedkar Institute of Management Studies 17
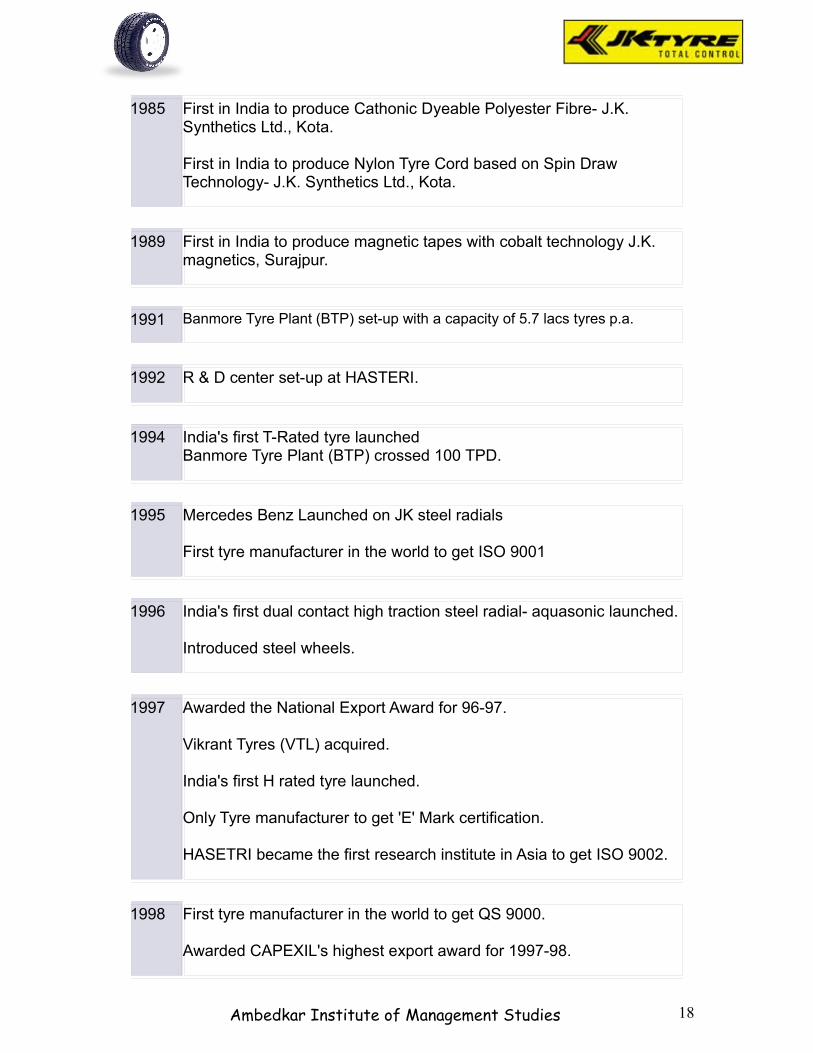
1985 First in India to produce Cathonic Dyeable Polyester Fibre- J.K. Synthetics Ltd., Kota.
First in India to produce Nylon Tyre Cord based on Spin Draw Technology- J.K. Synthetics Ltd., Kota.
1989 First in India to produce magnetic tapes with cobalt technology J.K. magnetics, Surajpur.
1991 Banmore Tyre Plant (BTP) set-up with a capacity of 5.7 lacs tyres p.a.
1992 R & D center set-up at HASTERI.
1994 India's first T-Rated tyre launchedBanmore Tyre Plant (BTP) crossed 100 TPD.
1995 Mercedes Benz Launched on JK steel radials
First tyre manufacturer in the world to get ISO 9001
1996 India's first dual contact high traction steel radial- aquasonic launched.
Introduced steel wheels.
1997 Awarded the National Export Award for 96-97.
Vikrant Tyres (VTL) acquired.
India's first H rated tyre launched.
Only Tyre manufacturer to get 'E' Mark certification.
HASETRI became the first research institute in Asia to get ISO 9002.
1998 First tyre manufacturer in the world to get QS 9000.
Awarded CAPEXIL's highest export award for 1997-98.
Ambedkar Institute of Management Studies 18
1999 Synergy with VTL in procurement, marketing and production flexibility.
Completion of state of the art modernisation of truck radials.
JK Tyres ranked 16th largest Tyre Company in the world.
ISA - 14000 accredition for environment & safety.
2000 JK introduced National Go-Karting Championships.
2001 Recieved CAPEXIL award.J.K. Industries recieved FOCUS LAC export award for the year 1999-2000.Commendation Certificate of CII Exim.IInd National Go-Karting Championships held.
JK Tyre's No 1 market position
In what is being considered as a landmark decision in the highly competitive Indian tyre
industry, the Advertising Standards Council of India (ASCI) has upheld JK Industries
Ltd's claim of being India's No 1 tyre manufacturer in the four-wheeler tyre segment,
reaffirming JK's leadership position in the market.
Expressing his happiness over ASCI's judgement, JK Tyre marketing director T K
Banerjee says: ''This is a fabulous example of why all of us need to have faith in bodies
like ASCI. We believe that the process of self-regulation in Indian advertising is working
for both companies and agencies. We also hope that this would encourage various players
to bring superior technology and consumer service standards and claim leadership in a
more healthier and competitive manner.''
The case was started when few competitors filed a complaint with ASCI against JK Tyre's
print advertisement, in which JK Tyre announced its numero uno position in the four-
wheeler tyre segment, quoting production figures compiled by Automotive Tyre
Manufacturer Association and other authentic industry sources.
Ambedkar Institute of Management Studies 19
But the competitors contradicted the claim, stating the fact that market figures from a
company's annual report should be used as authentic data to claim one's leadership, not
the production figures.
But ASCI considered the case at the Consumer Complaints Council on 23 May 2002 and
upheld JK Tyre's contention that production figures, as compiled by authentic industry
sources and used by JK Tyre to claim its leadership, is a valid and applicable comparison
platform.
Hence, JK Tyre's claim as No 1 tyre manufacturer in India is a perfectly valid and correct
statement. This also reflects ASCI's agreement to JK Tyre's viewpoint that figures, as
stated in the one's annual report, could actually be misleading and could include revenues
from non-tyre-related businesses also.
JK Tyre, pioneers of radial technology in India, is today India's largest manufacturer of
tyres in the four-wheel segment, including tyres for trucks and buses, LCVs, passenger
cars, jeeps, tractors, ADVs and OTRs. After 25 years of pioneering world-class
technologies in India, JK Tyre has recently launched the country's first eco-friendly
coloured tyres as well as steel-belted tractor rear radials.
b. Mission & Vision
Vision:
To be amongst the most admire companies in India committed to be excellence.
Mission:
a. Be a customer obsessed company
b. No.1 Tyre brand in India
c. Deliver enhanced value at all stakeholders
d. Most profitable Tyre Company in India
e. Enhance global presence through acquisition
Ambedkar Institute of Management Studies 20
f. Motivated and committed team development for high performance organization
c. Marketing Strategy
Strategic thinking is key to the evolution of successful marketing strategies of JK tyre.
This involves the following analyses:
i. Understanding markets: Strategic perspective of the market requires skilful analysis
of the trend and how they affect the market size and demand for the firm’s product.
ii. Finding market niches: Price, service, convenience and technology are some of the
niches in Indian market.
iii. Product and service planning: Analysis of the customer’s promotion of the brand,
both of the firm and competitors, besides an analysis of the situation in which the
customer uses the product.
iv. Distribution: Structural changes in inventory management, mobile distribution are
some of the key factors that are going to affect the distribution process in the Indian
market.
v. Managing for result: With pressure on costs, prices, and margins, marketers will
have to make effective utilization of every rupee spent in marketing.
Market opportunity of JK:
Identification of market opportunity is critical before the management of affirm takes a
decision to launch or diversify in any product area. This involves analysis of the
following:
Size of the market
Marketing strategies and the extent and quality of services rendered by other firm in
the industry.
Market programmed required to satisfy market wants
Identification of key success factors in an industry and linking them to a firm’s
strengths and weakness
Market opportunity
Ambedkar Institute of Management Studies 21
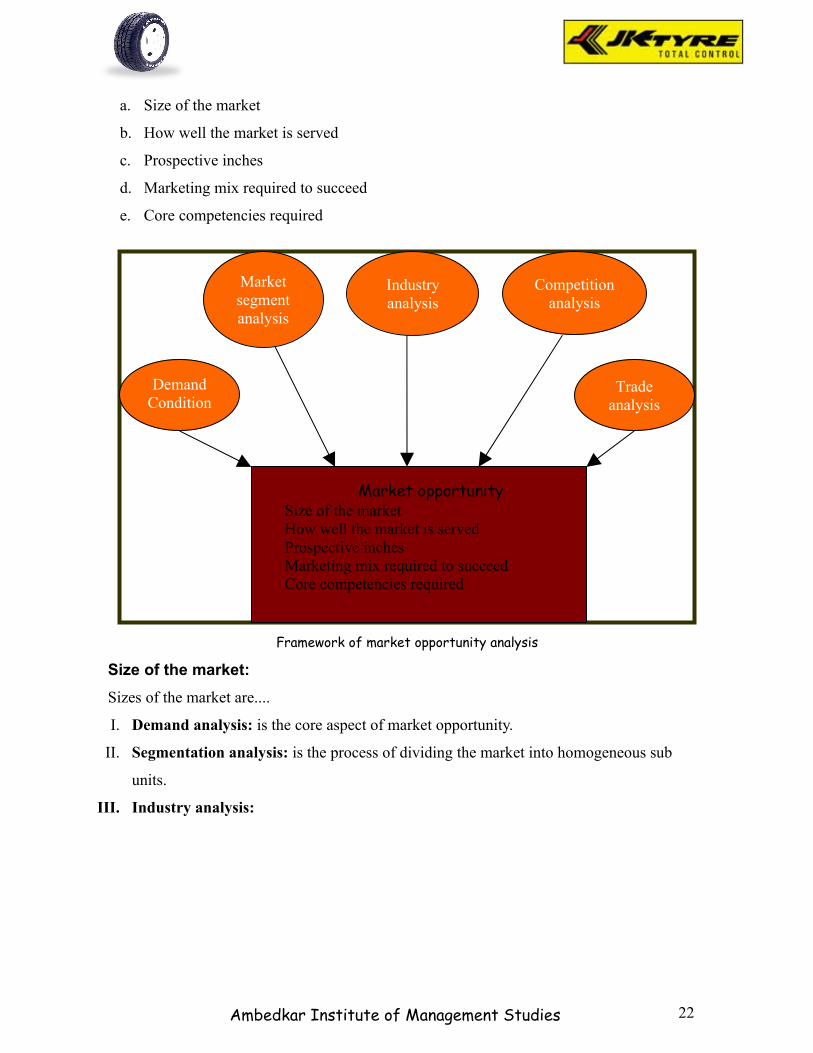
a. Size of the market
b. How well the market is served
c. Prospective inches
d. Marketing mix required to succeed
e. Core competencies required
Framework of market opportunity analysis
Size of the market:
Sizes of the market are....
I. Demand analysis: is the core aspect of market opportunity.
II. Segmentation analysis: is the process of dividing the market into homogeneous sub
units.
III. Industry analysis:
Ambedkar Institute of Management Studies
Market opportunitySize of the marketHow well the market is servedProspective inchesMarketing mix required to succeedCore competencies required
Demand Condition
s
Market segment analysis
Industry analysis
Competition analysis
Trade analysis
22
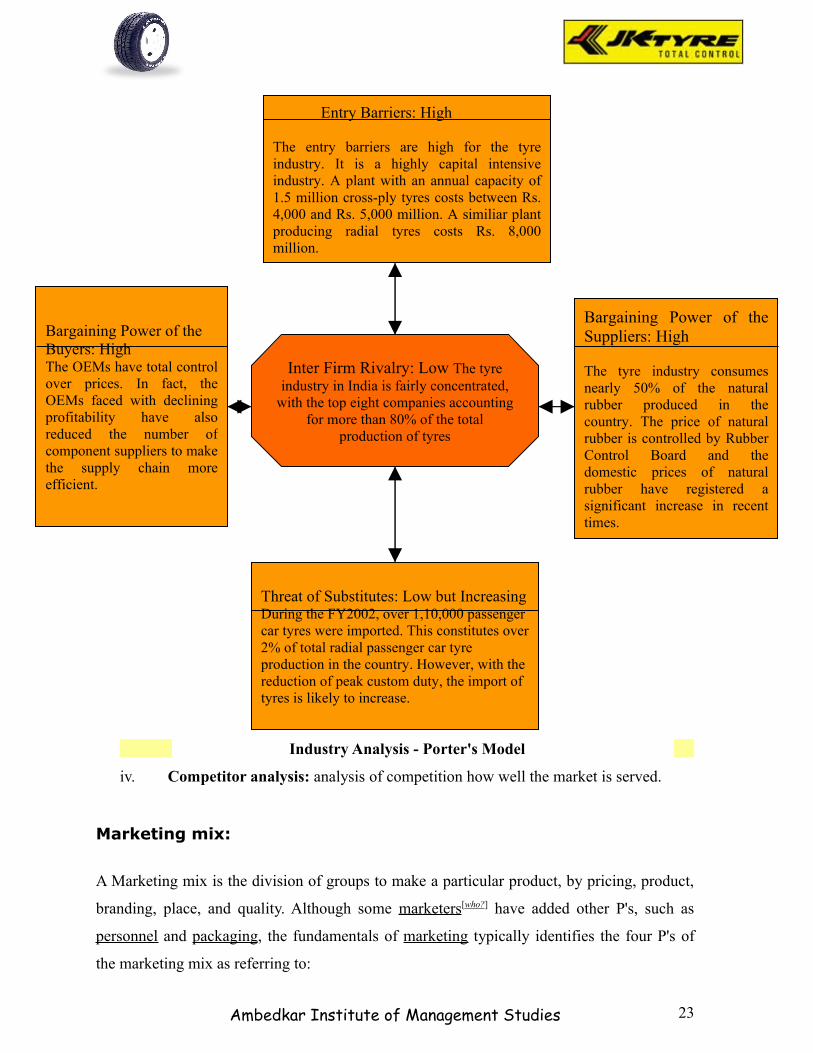
Industry Analysis - Porter's Model
iv. Competitor analysis: analysis of competition how well the market is served.
Marketing mix:
A Marketing mix is the division of groups to make a particular product, by pricing, product,
branding, place, and quality. Although some marketers[who?] have added other P's, such as
personnel and packaging, the fundamentals of marketing typically identifies the four P's of
the marketing mix as referring to:
Ambedkar Institute of Management Studies
Inter Firm Rivalry: Low The tyre industry in India is fairly concentrated,
with the top eight companies accounting for more than 80% of the total
production of tyres
Entry Barriers: High
The entry barriers are high for the tyre industry. It is a highly capital intensive industry. A plant with an annual capacity of 1.5 million cross-ply tyres costs between Rs. 4,000 and Rs. 5,000 million. A similiar plant producing radial tyres costs Rs. 8,000 million.
Bargaining Power of the Suppliers: High
The tyre industry consumes nearly 50% of the natural rubber produced in the country. The price of natural rubber is controlled by Rubber Control Board and the domestic prices of natural rubber have registered a significant increase in recent times.
Bargaining Power of the Buyers: High The OEMs have total control over prices. In fact, the OEMs faced with declining profitability have also reduced the number of component suppliers to make the supply chain more efficient.
Threat of Substitutes: Low but Increasing During the FY2002, over 1,10,000 passenger car tyres were imported. This constitutes over 2% of total radial passenger car tyre production in the country. However, with the reduction of peak custom duty, the import of tyres is likely to increase.
23
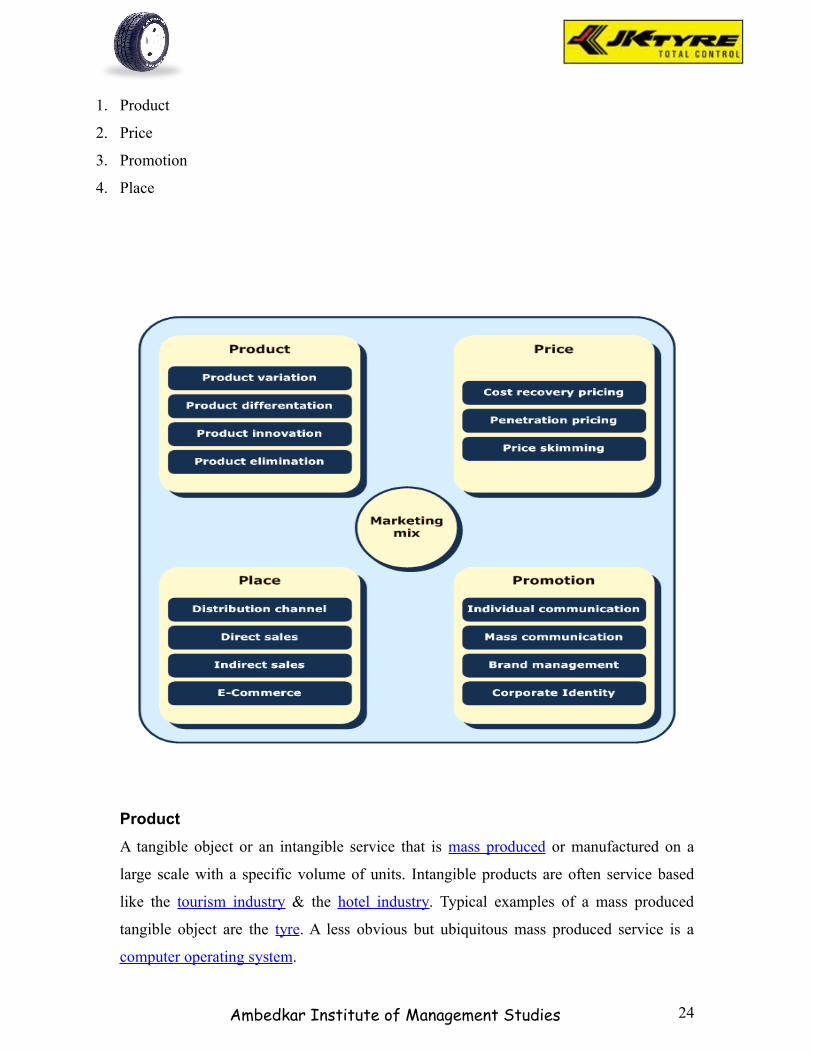
1. Product
2. Price
3. Promotion
4. Place
Product
A tangible object or an intangible service that is mass produced or manufactured on a
large scale with a specific volume of units. Intangible products are often service based
like the tourism industry & the hotel industry. Typical examples of a mass produced
tangible object are the tyre. A less obvious but ubiquitous mass produced service is a
computer operating system.
Ambedkar Institute of Management Studies 24
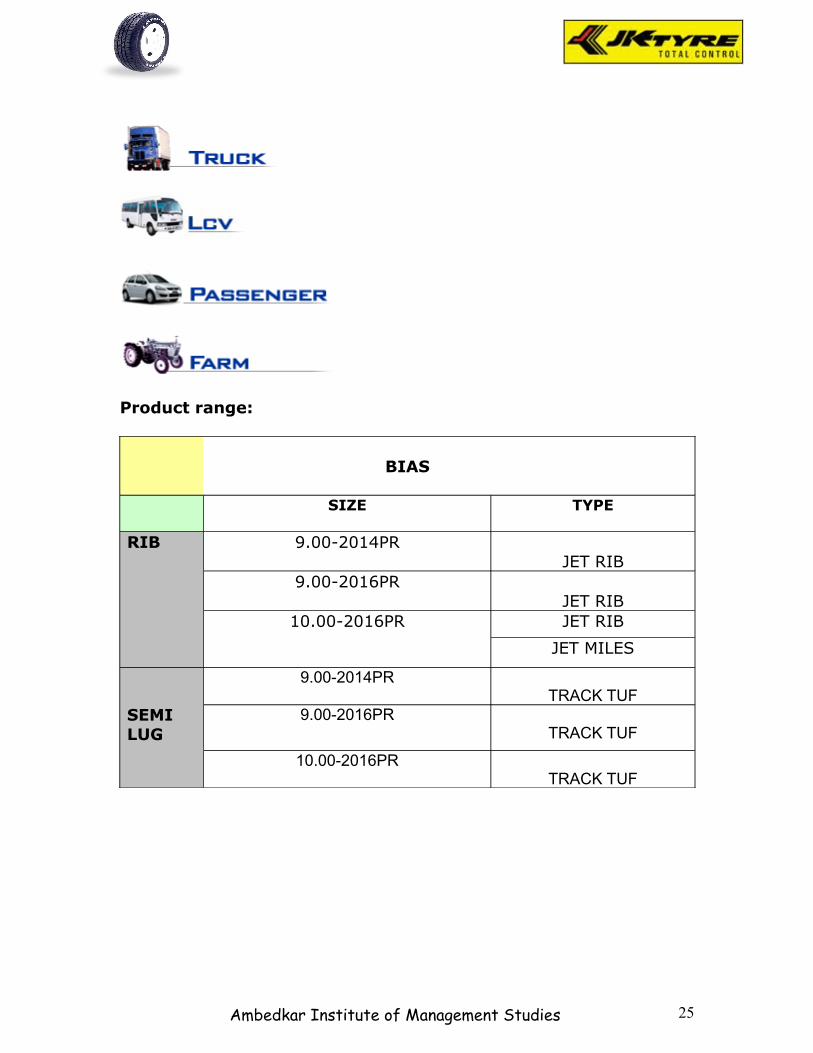
Product range:
BIAS
SIZE TYPE
RIB 9.00-2014PRJET RIB
9.00-2016PRJET RIB
10.00-2016PR JET RIB
JET MILES
SEMI LUG
9.00-2014PRTRACK TUF
9.00-2016PRTRACK TUF
10.00-2016PRTRACK TUF
Ambedkar Institute of Management Studies 25
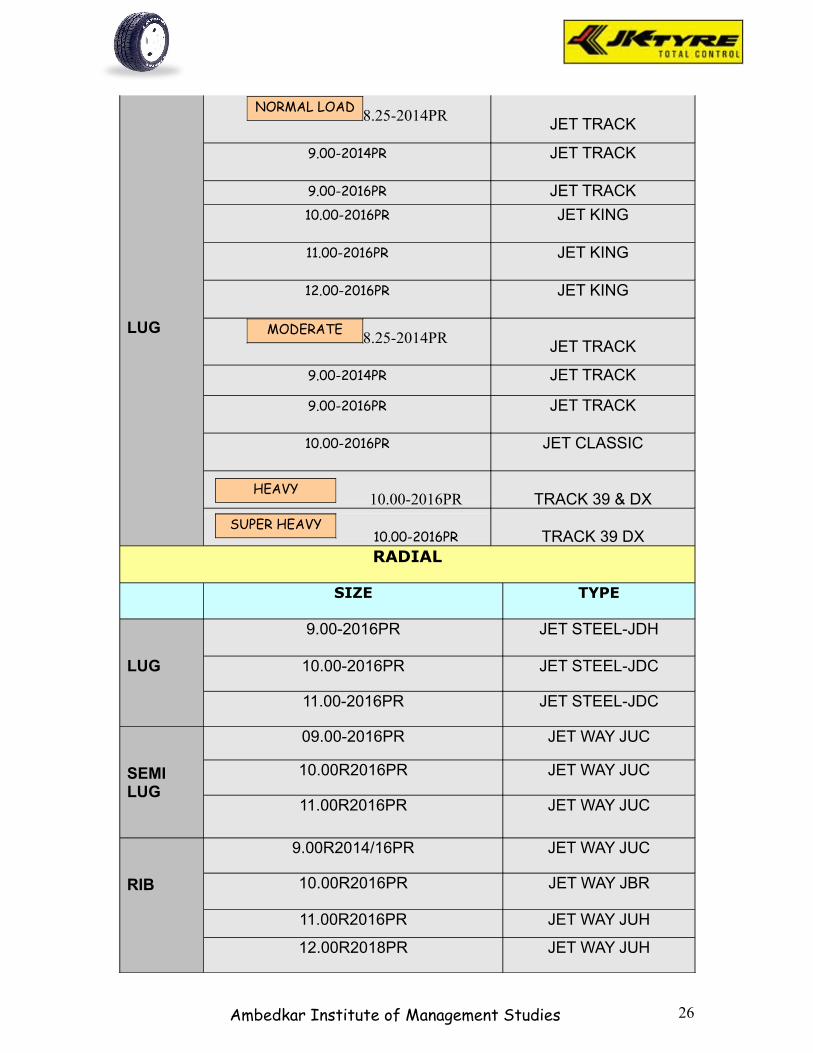
LUG
NORMAL LOAD8.25-2014PR JET TRACK
9.00-2014PR JET TRACK
9.00-2016PR JET TRACK
10.00-2016PR JET KING
11.00-2016PR JET KING
12.00-2016PR JET KING
MODERATE8.25-2014PR JET TRACK
9.00-2014PR JET TRACK
9.00-2016PR JET TRACK
10.00-2016PR JET CLASSIC
10.00-2016PR TRACK 39 & DX
10.00-2016PR TRACK 39 DXRADIAL
SIZE TYPE
LUG
9.00-2016PR JET STEEL-JDH
10.00-2016PR JET STEEL-JDC
11.00-2016PR JET STEEL-JDC
SEMI LUG
09.00-2016PR JET WAY JUC
10.00R2016PR JET WAY JUC
11.00R2016PR JET WAY JUC
RIB
9.00R2014/16PR JET WAY JUC
10.00R2016PR JET WAY JBR
11.00R2016PR JET WAY JUH
12.00R2018PR JET WAY JUH
Ambedkar Institute of Management Studies 26
HEAVY
SUPER HEAVY
Price
The price is the amount a customer pays for the product. It is determined by a number of
factors including market share, competition, material costs, product identity and the
customer's perceived value of the product. The business may increase or decrease the
price of product if other stores have the same product.
Place
Place represents the location where a product can be purchased. It is often referred to as
the distribution channel. It can include any physical store as well as virtual stores on the
Internet.
Promotion
Promotion represents all of the communications that a marketer may use in the
marketplace. Promotion has four distinct elements - advertising, public relations, word of
mouth and point of sale. A certain amount of crossover occurs when promotion uses the
four principal elements together, which is common in film promotion. Advertising covers
any communication that is paid for, from television and cinema commercials, radio and
Internet adverts through print media and billboards. One of the most notable means of
promotion today is the Promotional Product, as in useful items distributed to targeted
audiences with no obligation attached. This category has grown each year for the past
decade while most other forms have suffered. It is the only form of advertising that
targets all five senses and has the recipient thanking the giver. Public relations are where
the communication is not directly paid for and includes press releases, sponsorship deals,
exhibitions, conferences, seminars or trade fairs and events. Word of mouth is any
apparently informal communication about the product by ordinary individuals, satisfied
customers or people specifically engaged to create word of mouth momentum. Sales staff
often plays an important role in word of mouth and Public Relations.
Broadly defined, optimizing the marketing mix is the primary responsibility of
marketing. By offering the product with the right combination of the four Ps marketers
can improve their results and marketing effectiveness. Making small changes in the
marketing mix is typically considered to be a tactical change. Making large changes in
Ambedkar Institute of Management Studies 27
any of the four Ps can be considered strategic. For example, a large change in the price,
say from $19.00 to $39.00 would be considered a strategic change in the position of the
product. However a change of $131 to $130.99 would be considered a tactical change,
potentially related to a promotional offer.
The term "Marketing Mix" however, does not imply that the 4P elements represent
options. They are not trade-offs but are fundamental marketing issues that always need to
be addressed. They are the fundamental actions that marketing requires whether
determined explicitly or by default.
d. SWOT Analysis
STRENGTHS
• Very large distribution
channel
• Reasonable price
• Effective employee in JK
• Economies of scale due to optimum capacity utilization
• Collaboration with Vikrant, know for their technological superiority
bringing together performance, economy, durability and comfort.
• Strong financial positions
WEAKNESSES
• Less Brand Awareness
• Less concern about small car segment
OPPORTUNITIES
• A burgeoning work force and growing middle class population
• High growth potential for its exports as demand for JK tyre in Europe
increasing.
Ambedkar Institute of Management Studies
• Strong brand image
• Being quality oriented rather than quantity
oriented
• Large product width & line (product mix)
28
• Indian customers are mainly value buyers demanding a better overall package.
JK is poised in a better position than other players in the market to capitalise
on this opportunity
• Entry of new players with newer and better technologies in the small car tyre
segment
• So many close competitors like Appolo, Birla, Ceat, Modi, Kaizen etc.
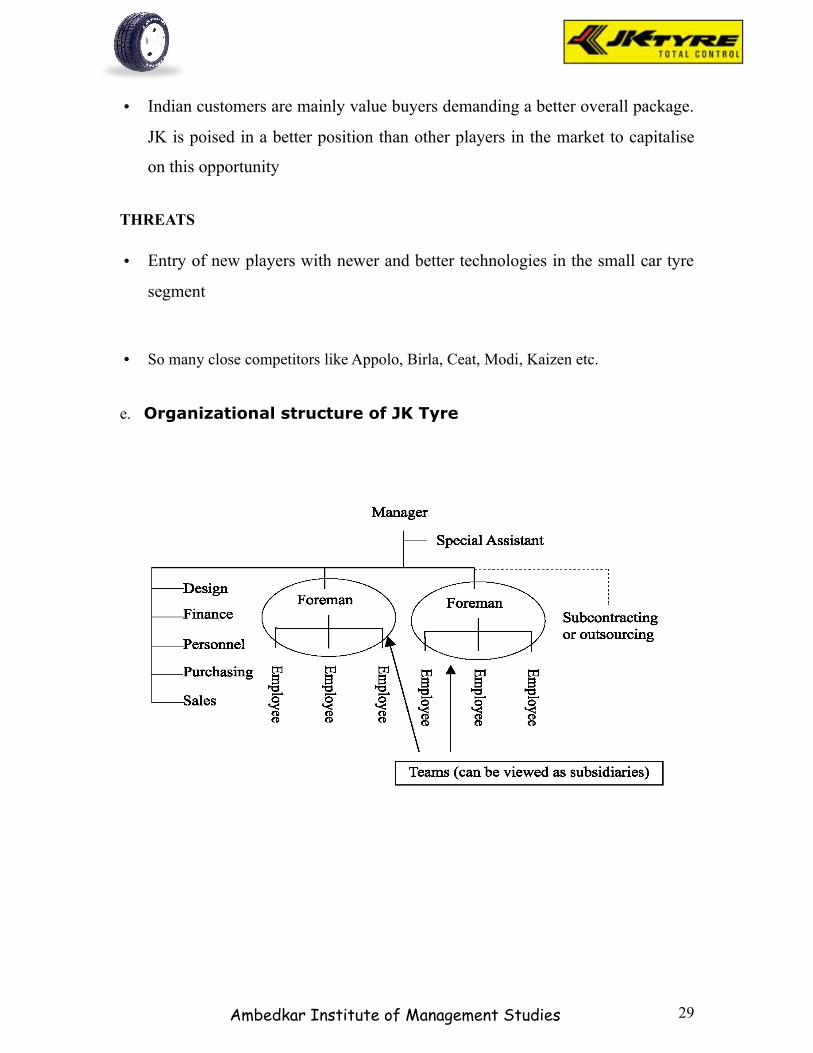
e. Organizational structure of JK Tyre
Ambedkar Institute of Management Studies
THREATS
29
Objectives of the study
To find out market share of JK Tyres.
To understand the marketing strategy of JK Tyres.
To focus on the Marketing mix of JK tyre
Ambedkar Institute of Management Studies
Objectives of the
study
Need for the
study
Limitation of the
study
Research
Methodology of
the study
30
To evaluate the limitations of JK tyre.
To analyze the customer’s needs regarding the product and policies formulated by
the company.
To find out the brand image of JK tyre
Need for the study
Management is like a coin having two sides. One is the theoretical part and second is the
practical part. In the theoretical part of management we learn in our classroom from the
lectures, seminars, group discussions that are arranged from time to time.
To know the practical aspect of management a practical training is provided to the
students. The main idea behind practical training is to bring the management students
face to face with the actual environment of practical management so that he/ she will be
able to apply theory to practical situation before finally moving into the professional
world to show the efficiency and capability.
The project study focused on “JK tyre” as a product and the subject is to understand the
mind set of different customers about the product. Being a student of marketing
management, the inquisitiveness to peep on practical side of consumer perception
promoted in study.
In this study efforts have been made to prepare the report as realistic as possible.
Limitation of the study
The project surfers from the following limitations due to the inherent and restrictive
nature of the study undertaken:
Ambedkar Institute of Management Studies 31
• Due to constraints of time, money and other resources applicable to this
study.
• This study is confined to only a few specified areas of and is not
comprehensive study of the customers of JK tyre all over Kolkata and
North 24 Pgs.
• This study is restricted only to sample space chosen for the study.
• The areas covered under the surveys are: Dunlop, Agarpara, Chiriamore,
Panihati, Titagarh, Khardah,
Research Methodology of the study
SAMPLE SIZE: 500 trucks
METHOD OF COLLECTION: MARKET SURVEY
DATA TYPE:
For the above study both type of data were used such as primary data and secondary data.
For primary data different areas of Kolkata were being visited and for the secondary data
internet & reference books have been used.
• Collecting data from market through Fitment survey of Trucks on road.
• Working on the data.
• Graphical representation of results.
• Analyzing the graph and driving further enquiries.
Ambedkar Institute of Management Studies 32
Data analysis & Interpretation
Exhibit-3.1Table showing market share in RIB & SEMI LUG tyre
Table-3.1
NAMENO. OF RIB & SEMI
LUG TYRES% IN TOTAL RIB & SEMI LUG TYRES
% IN TOTAL TYRES
Ambedkar Institute of Management Studies 33
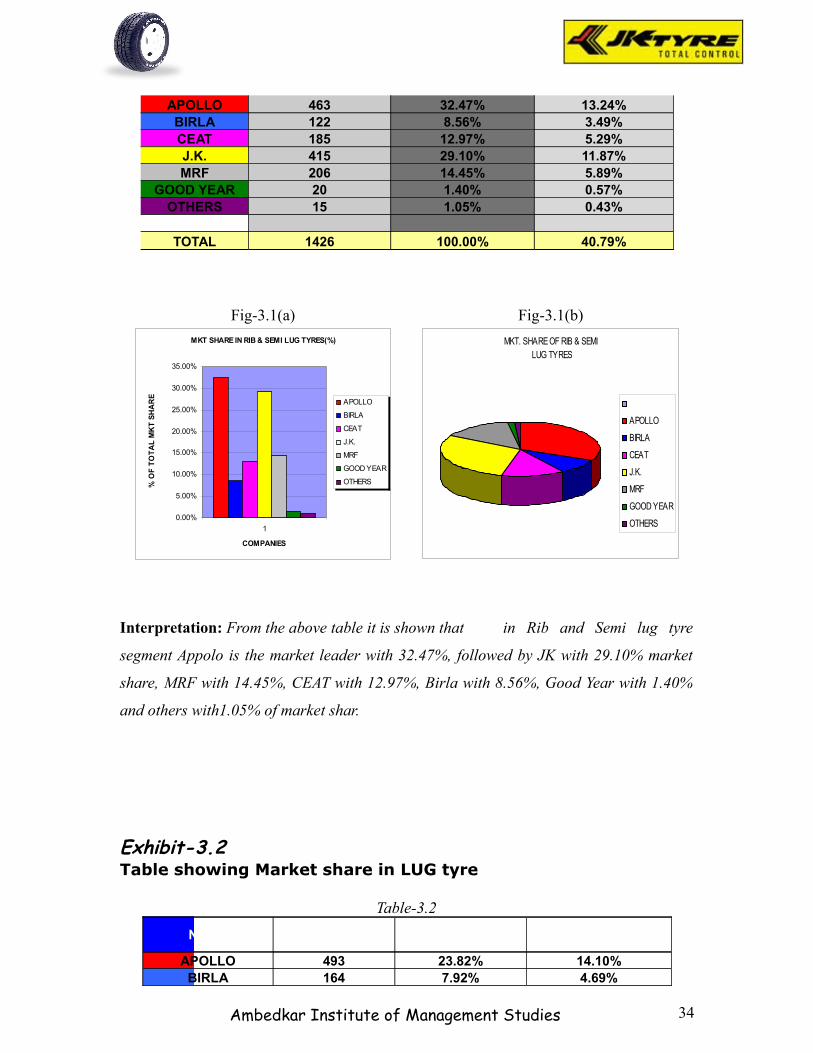
APOLLO 463 32.47% 13.24%BIRLA 122 8.56% 3.49%CEAT 185 12.97% 5.29%J.K. 415 29.10% 11.87%MRF 206 14.45% 5.89%
GOOD YEAR 20 1.40% 0.57%OTHERS 15 1.05% 0.43%
TOTAL 1426 100.00% 40.79%
Fig-3.1(a) Fig-3.1(b)
MKT SHARE IN RIB & SEMI LUG TYRES(%)
0.00%
5.00%
10.00%
15.00%
20.00%
25.00%
30.00%
35.00%
1
COMPANIES
% O
F T
OT
AL
MK
T S
HA
RE
APOLLO
BIRLA
CEAT
J.K.
MRF
GOOD YEAR
OTHERS
MKT. SHARE OF RIB & SEMI LUG TYRES
APOLLO
BIRLA
CEAT
J.K.
MRF
GOOD YEAR
OTHERS
Interpretation: From the above table it is shown that in Rib and Semi lug tyre
segment Appolo is the market leader with 32.47%, followed by JK with 29.10% market
share, MRF with 14.45%, CEAT with 12.97%, Birla with 8.56%, Good Year with 1.40%
and others with1.05% of market shar.
Exhibit-3.2Table showing Market share in LUG tyre
Table-3.2
NAMENO. OF LUG
TYRES% IN TOTAL LUG
TYRES% IN TOTAL TYRES
APOLLO 493 23.82% 14.10%BIRLA 164 7.92% 4.69%
Ambedkar Institute of Management Studies 34

CEAT 435 21.01% 12.44%J.K. 588 28.41% 16.82%MRF 215 10.39% 6.15%
GOOD YEAR 110 5.31% 3.15%OTHERS 65 3.14% 1.86%TOTAL 2070 100.00% 59.21%
Fig-3.2(a) Fig-3.2(b)MKT SHARE IN LUG TYRES(%)
0.00%
5.00%
10.00%
15.00%
20.00%
25.00%
30.00%
1
COMPANIES
% O
F T
OT
AL
MK
T S
HA
RE
TY
RE
S
APOLLO
BIRLA
CEAT
J.K.
MRF
GOOD YEAR
OTHERS
MKT.SHARE OF LUG TYRES IN %
APOLLO
BIRLA
CEAT
J.K.
MRF
GOOD YEAR
OTHERS
Interpretation: From the above table it is shown that in lug tyre segment JK is the
market leader with 28.41% followed by Appolo with 23.82%,CEAT 21.01%, MRF with
10.39%,Birla with 7.92%, Good Year with 5.31%,and others with1.86%
Exhibit-3.2Table showing Total market share
Table-3.3
NAME TOTAL NO OF TYRES % IN TOTAL
APOLLO 956 27.35%BIRLA 286 8.18%
Ambedkar Institute of Management Studies 35
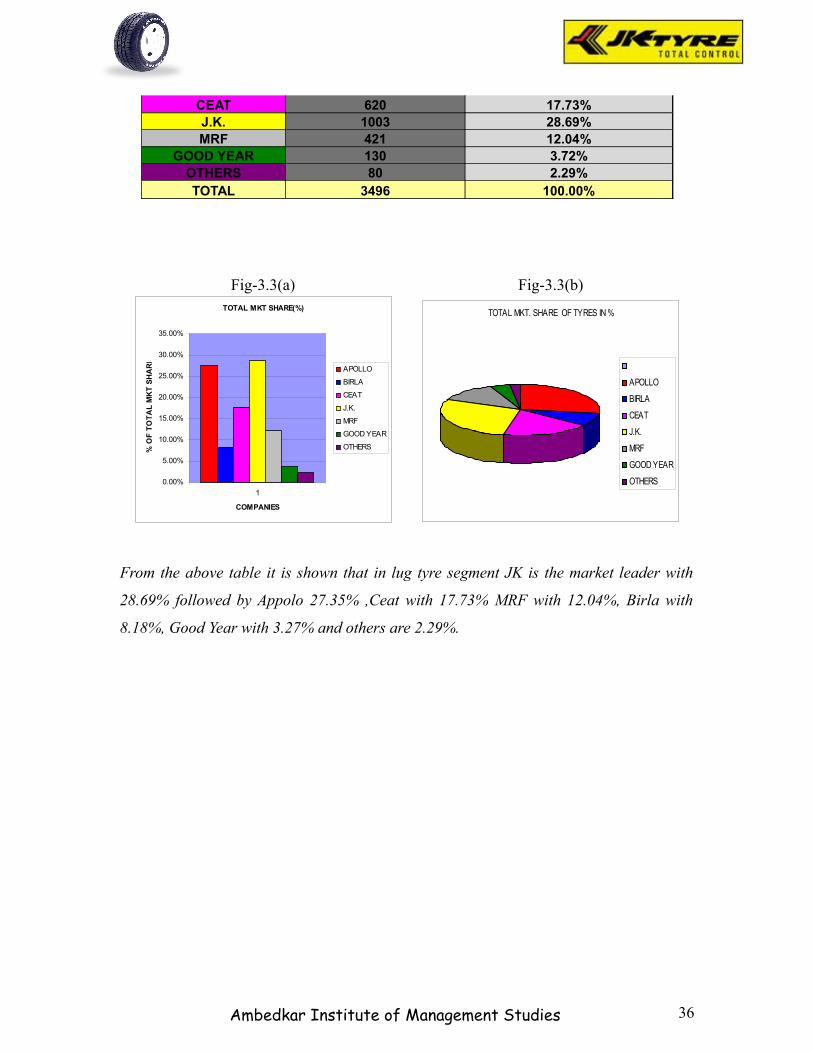
CEAT 620 17.73%J.K. 1003 28.69%MRF 421 12.04%
GOOD YEAR 130 3.72%OTHERS 80 2.29%TOTAL 3496 100.00%
Fig-3.3(a) Fig-3.3(b)TOTAL MKT SHARE(%)
0.00%
5.00%
10.00%
15.00%
20.00%
25.00%
30.00%
35.00%
1
COMPANIES
% O
F T
OT
AL
MK
T S
HA
RE
APOLLO
BIRLA
CEAT
J.K.
MRF
GOOD YEAR
OTHERS
TOTAL MKT. SHARE OF TYRES IN %
APOLLO
BIRLA
CEAT
J.K.
MRF
GOOD YEAR
OTHERS
From the above table it is shown that in lug tyre segment JK is the market leader with
28.69% followed by Appolo 27.35% ,Ceat with 17.73% MRF with 12.04%, Birla with
8.18%, Good Year with 3.27% and others are 2.29%.
Ambedkar Institute of Management Studies 36
Findings
Suggestions
Findings
After taking the feedback of more than 100 customers the study reveals that customers
are fond of different brands in different areas. Like, in Gouripur area almost 70% of
customers prefer BIRLA tyres (especially SAMSON), in Panihati areas customers prefer
JK tyres, where in Dunlop people prefer JK & APOLLO. Not only different choices but
also having different experience on different brands. It is found that many customers
Ambedkar Institute of Management Studies 37
prefer JK’s guaranteed tyres such as “JET TRAK 39” and economy class rib tyre
“VIKRANT TRACK KING” for its milage & reliability but it is also true that many other
brands such as “JET MILES”, “JET PACE”, “JET SUPER LUG” do not have a strong
place in customers mind. The study shows that JK’s strong contender is APOLLO who’s
quality was appreciated by many. APOLLO’s “XT-7” & “LOAD STAR SUPER” are very
much preferred. In guaranteed tyres BIRLA’s “SAMSON” is the main contender of JK.
Incase of normal loaded trucks customers mostly rely on CEAT but in over load
APOLLO & JK are reliable. Certainly MRF has not a good reputation at all.
1. JK is the market leader followed by APOLLO.
2. VIKRANT TRACK KING of JK is most used/preferred tyre overall.
3. In economy segment JK has Strong hold but premium segment is dominated by
APOLLO.
4. JK Tyre is having edge breaking problem
Suggestion
1. JK Tyre is doing well in rib segment but they are based in only on one brand
“Vikrant”. So JK should try to aware to increase the awareness of other brands.
2. “Price-Quality relationship” needs to improve in premium rib and lug tyre
segment.
3. Keep eye to reduce the cost of manufacturing. So price will further reduced and
competition will increased.
4. The company should look after its tread erosion/breaking problem.
Ambedkar Institute of Management Studies 38
Consumer Buying Behaviour
Consumer buying behavior is influenced by the culture and subculture. Habits, likes and
dislikes of the people belonging to a particular culture or subculture can affect the
marketing efforts of a firm to a great extent. The social class to which the individual
belongs tells about the type of products the individual prefers. Other factors that influence
the buying behavior are social factors like reference group and family, personal factors
like the age, life cycle and occupation, and psychological factors like motivation,
perception and attitudes of the customers.
Ambedkar Institute of Management Studies
Unit-2: CUSTOMER’S PREFERENCE ON DIFFERENT BRANDS AND TYRE COMPANIES IN TRUCK SEGMENT.
Consumer Buying behaviour
Indian consumer profile
Objective of the study
Limitation Of the study
Methodology
39
Buying roles and buying decision constitute consumer’s decision-making behavior. A
customer can adapt various buying roles like initiator, influencer, decider, buyer, preparer,
maintainer and disposer in purchasing and using the products. Buying behavior helps
marketers learn the intensity and degree of involvement of customers in purchasing the
products. Customer buying behavior is broadly classified into three types. Extensive
problem solving buying behavior is exhibited when a customer buys high involvement,
expensive and less frequently purchased products. Consumers are involved in routine
problem solving decision-making process, when they purchase routinely purchased, low
cost products. Variety seeking behavior is seen when customers purchase low-
involvement products.
Customers usually go through five stages in arriving at a purchase decision, though it
might not be so in all the cases. In the first stage, the customer identifies an unsatisfied
need in him. In the second stage, customers collect the information about the product and
available brands through personal sources, commercial sources, public sources or
experiential sources. In the third stage, the customers evaluate all the alternatives with the
help of available information. In the fourth stage, the customer makes a purchase
decision. And finally in the fifth stage, he experiences post purchase satisfaction or
dissatisfaction.
Post purchase usage and disposal of the product is also of equal importance to the
marketer, as it can save cost and time of producing as well as help in protecting the
environmental equilibrium.
Factors influencing the behaviour of buyers.
Consumer behaviour is affected by many uncontrollable factors. Just think, what
influences you before you buy a product or service? Your friends, your upbringing, your
culture, the media, a role model or influences from certain groups?
Culture is one factor that influences behaviour. Simply culture is defined as our attitudes
and beliefs. But how are these attitudes and beliefs developed? As an individual growing
up, a child is influenced by their parents, brothers, sister and other family member who
Ambedkar Institute of Management Studies 40
may teach them what is wrong or right. They learn about their religion and culture, which
helps them develop these opinions, attitudes and beliefs (AIO). These factors will
influence their purchase behaviour however other factors like groups of friends, or people
they look up to may influence their choices of purchasing a particular product or service.
Reference groups are particular groups of people some people may look up towards to
that have an impact on consumer behaviour. So they can be simply a band like the Spice
Girls or your immediate family members. Opinion leaders are those people that you look
up to because your respect their views and judgments and these views may influence
consumer decisions. So it maybe a friend who works with the IT trade who may influence
your decision on what computer to buy. The economical environment also has an impact
on consumer behaviour; do consumers have a secure job and a regular income to spend
on goods? Marketing and advertising obviously influence consumers in trying to evoke
them to purchase a particular product or service.
People’s social status will also impact their behaviour. What is their role within society?
Are they Actors? Doctors? Office worker? And mothers and fathers also? Clearly being
parents affects your buying habits depending on the age of the children, the type of job
may mean you need to purchase formal clothes; the income which is earned has an
impact. The lifestyle of someone who earns £250000 would clearly be different from
someone who earns £25000. Also characters have an influence on buying decision.
Whether the person is extrovert (out going and spends on entertainment) or introvert
(keeps to themselves and purchases via online or mail order) again has an impact on the
types of purchases made.
Types of buying behaviour.
There are four typical types of buying behaviour based on the type of products that
intends to be purchased. Complex buying behaviour is where the individual purchases a
high value brand and seeks a lot of information before the purchase is made. Habitual
buying behaviour is where the individual buys a product out of habit e.g. a daily
newspaper, sugar or salt. Variety seeking buying behaviour is where the individual likes
to shop around and experiment with different products. So an individual may shop around
Ambedkar Institute of Management Studies 41
for different breakfast cereals because he/she wants variety in the mornings! Dissonance
reducing buying behaviour is when buyer are highly involved with the purchase of the
product, because the purchase is expensive or infrequent. There is little difference
between existing brands an example would be buying a diamond ring, there is perceived
little difference between existing diamond brand manufacturers.
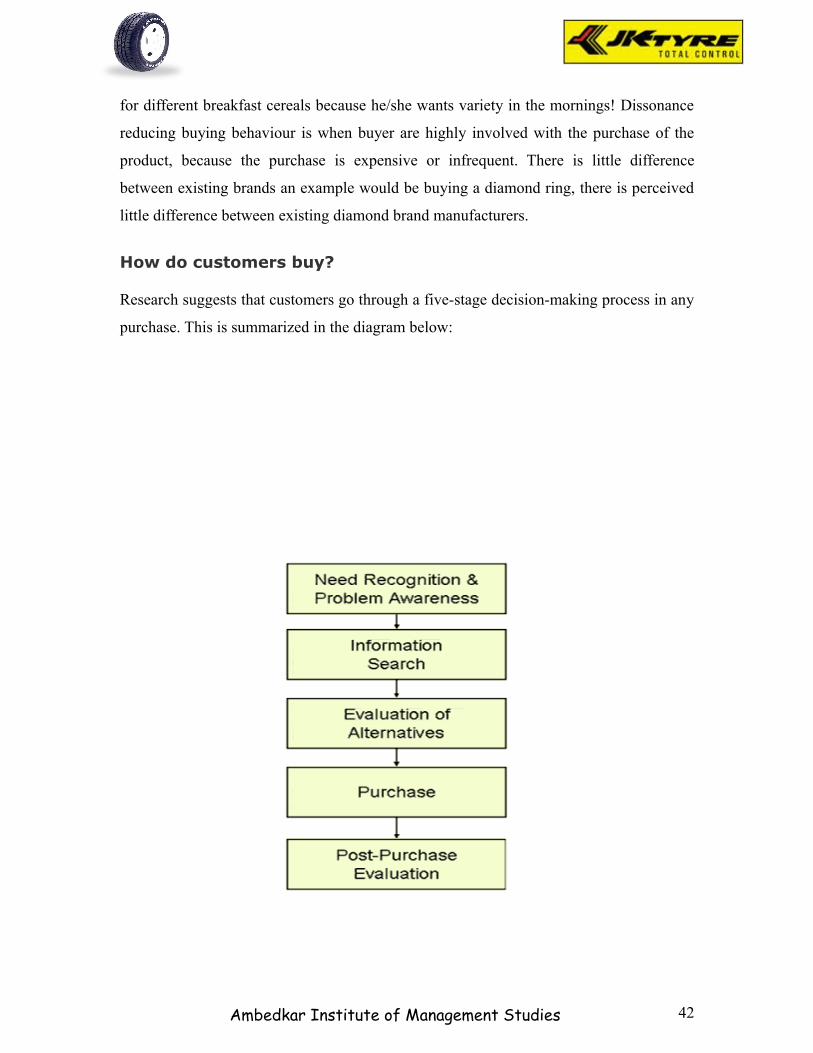
How do customers buy?
Research suggests that customers go through a five-stage decision-making process in any
purchase. This is summarized in the diagram below:
Ambedkar Institute of Management Studies 42
This model is important for anyone making marketing decisions. It forces the marketer to
consider the whole buying process rather than just the purchase decision (when it may be
too late for a business to influence the choice!)
The model implies that customers pass through all stages in every purchase. However, in
more routine purchases, customers often skip or reverse some of the stages.
For example, a student buying a favourite hamburger would recognize the need (hunger)
and go right to the purchase decision, skipping information search and evaluation.
However, the model is very useful when it comes to understanding any purchase that
requires some thought and deliberation.
The buying process starts with need recognition. At this stage, the buyer recognizes a
problem or need (e.g. I am hungry, we need a new sofa, I have a headache) or responds to
a marketing stimulus (e.g. you pass Starbucks and are attracted by the aroma of coffee
and chocolate muffins).
An “aroused” customer then needs to decide how much information (if any) is required.
If the need is strong and there is a product or service that meets the need close to hand,
then a purchase decision is likely to be made there and then. If not, then the process of
information search begins.
A customer can obtain information from several sources:
• Personal sources: family, friends, neighbors etc
• Commercial sources: advertising; salespeople; retailers; dealers; packaging; point-
of-sale displays
• Public sources: newspapers, radio, television, consumer organizations; specialist
magazines
• Experiential sources: handling, examining, using the product
The usefulness and influence of these sources of information will vary by product and by
customer. Research suggests that customer’s value and respect personal sources more
than commercial sources (the influence of “word of mouth”). The challenge for the
Ambedkar Institute of Management Studies 43
marketing team is to identify which information sources are most influential in their
target markets. In the evaluation stage, the customer must choose between the alternative
brands, products
Post-purchase evaluation - Cognitive Dissonance
The final stage is the post-purchase evaluation of the decision. It is common for
customers to experience concerns after making a purchase decision. This arises from a
concept that is known as “cognitive dissonance”. The customer, having bought a product,
may feel that an alternative would have been preferable. In these circumstances that
customer will not repurchase immediately, but is likely to switch brands next time.
To manage the post-purchase stage, it is the job of the marketing team to persuade the
potential customer that the product will satisfy his or her needs. Then after having made a
purchase, the customer should be encouraged that he or she has made the right decision.
Indian consumer profile
Indian consumers are knowledgeable.
They are tech savvy.
Indian consumers are literate.
Most of the Indian are middle class.
Standard of living improved.
Rational and think in a linear manner.
They can explain their thought and behaviour.
Think in words.
OBJECTIVE
• The objective of the project was solely to evaluate preference level of JK tyre
among the minds of customers in respect of certain important factors like
goodwill, acceptance, satisfaction etc.
• To assess the consumer perception
• To understand the factors this motivates the customers for buying.
Ambedkar Institute of Management Studies 44
• To understand the satisfaction level of the customers.
Limitation of the study
The sample size of 100 respondents was too small for generalization.
The survey was restricted only to Kolkata.
The duration of the study is only 45 days, due to the reason the study may not
give full fledged information to the Media Planning Group.
Some of the respondents were reluctant to give the right information.
Methodology of the study
TYPE OF STUDY:
Study is partly descriptive and partly exploratory. It is deceptive as it is concerned with
the descriptions of the variables in the problem model, i.e. what variables or factors
constitute customer satisfaction, and what additional variables or factors could be
included, to constitute an acceptable the present customer satisfaction package or to
increase the degree of satisfaction of the customers from delight to “ecstasy”. It is
exploratory as it is concerned with exploring and discovering the satisfaction levels and
the reasons for dissatisfaction, if any in general.
DATA COLLECTION METHOD:
PRIMARY DATA:
The primary data is collected through survey research by conducting personal interviews
with the customers.
RESEARCH TOOLS:
The customers are administered a carefully prepared, well thought out and structured
questionnaire, which consists of open- ended but mostly be close questions, which
includes multiple choice questions, Dichotomous questions.
SAMPLING DESIGN:
The sample size is 100.
Sampling areas: Kolkata
SECONDARY DATA:
The data has been collected from various Magazines, Books and company Websites.
Ambedkar Institute of Management Studies 45
Ambedkar Institute of Management Studies
Data analysis & interpretation
46
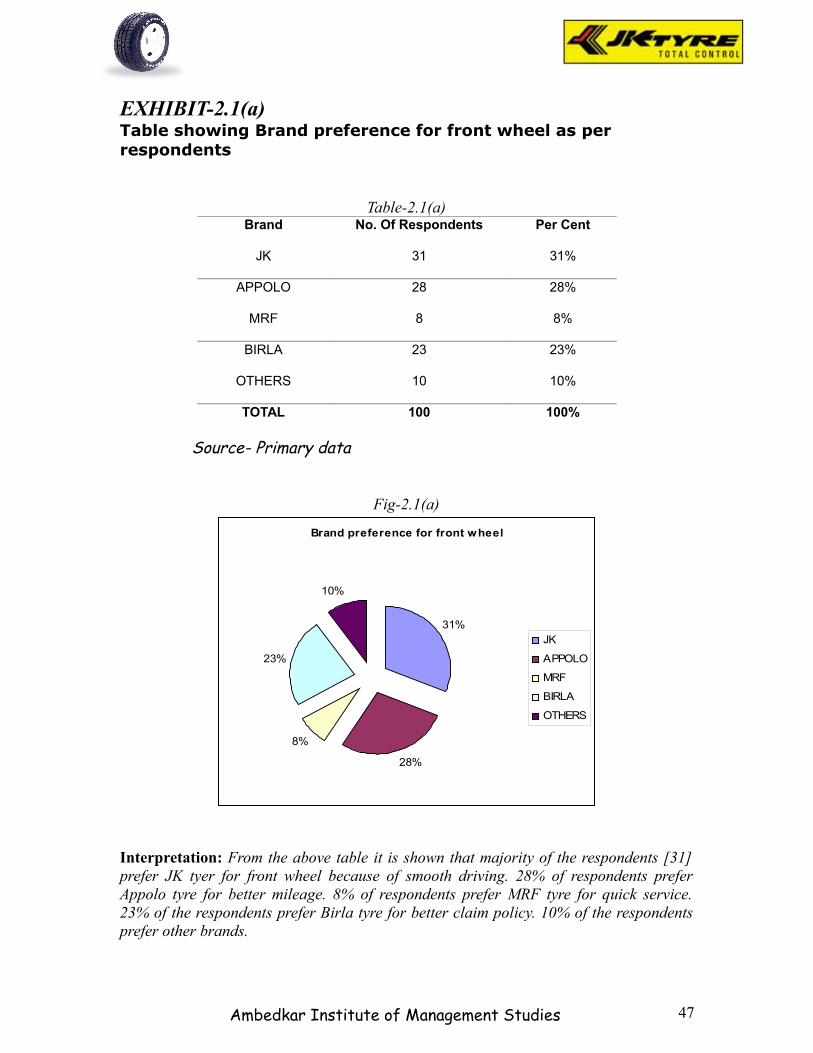
EXHIBIT-2.1(a)Table showing Brand preference for front wheel as per respondents
Table-2.1(a)Brand No. Of Respondents Per Cent
JK 31 31%
APPOLO 28 28%
MRF 8 8%
BIRLA 23 23%
OTHERS 10 10%
TOTAL 100 100%
Source- Primary data
Fig-2.1(a)
Brand preference for front wheel
31%
28%
8%
23%
10%
JK
APPOLO
MRF
BIRLA
OTHERS
Interpretation: From the above table it is shown that majority of the respondents [31] prefer JK tyer for front wheel because of smooth driving. 28% of respondents prefer Appolo tyre for better mileage. 8% of respondents prefer MRF tyre for quick service. 23% of the respondents prefer Birla tyre for better claim policy. 10% of the respondents prefer other brands.
Ambedkar Institute of Management Studies 47
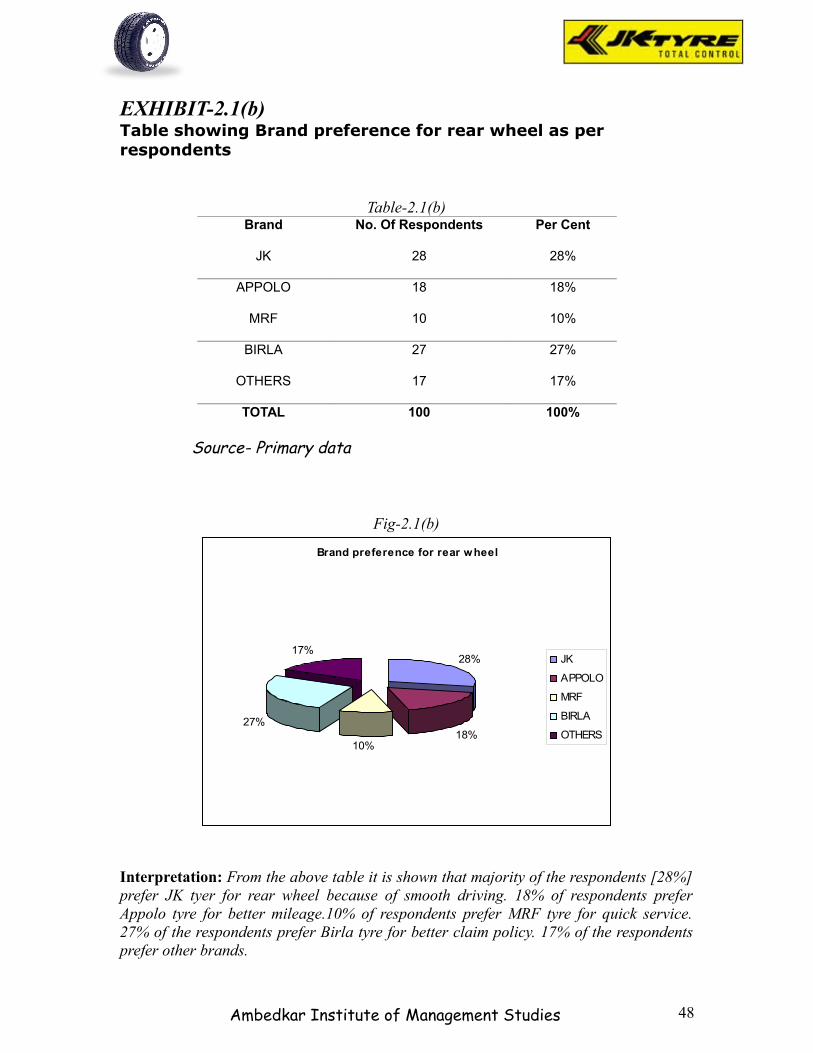
EXHIBIT-2.1(b)Table showing Brand preference for rear wheel as per respondents
Table-2.1(b)Brand No. Of Respondents Per Cent
JK 28 28%
APPOLO 18 18%
MRF 10 10%
BIRLA 27 27%
OTHERS 17 17%
TOTAL 100 100%
Source- Primary data
Fig-2.1(b)
Brand preference for rear wheel
28%
18%10%
27%
17%JK
APPOLO
MRF
BIRLA
OTHERS
Interpretation: From the above table it is shown that majority of the respondents [28%] prefer JK tyer for rear wheel because of smooth driving. 18% of respondents prefer Appolo tyre for better mileage.10% of respondents prefer MRF tyre for quick service. 27% of the respondents prefer Birla tyre for better claim policy. 17% of the respondents prefer other brands.
Ambedkar Institute of Management Studies 48
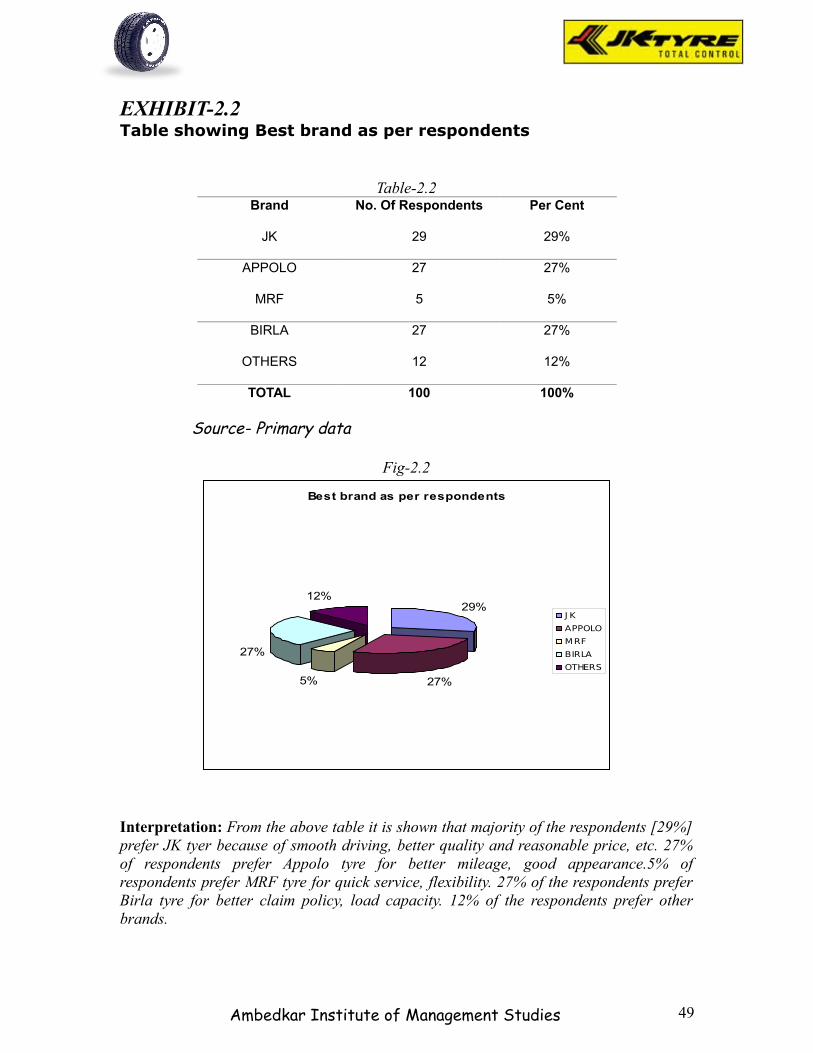
EXHIBIT-2.2Table showing Best brand as per respondents
Table-2.2Brand No. Of Respondents Per Cent
JK 29 29%
APPOLO 27 27%
MRF 5 5%
BIRLA 27 27%
OTHERS 12 12%
TOTAL 100 100%
Source- Primary data
Fig-2.2
Best brand as per respondents
29%
27%5%
27%
12%
J K
APPOLO
MRF
BIRLA
OTHERS
Interpretation: From the above table it is shown that majority of the respondents [29%] prefer JK tyer because of smooth driving, better quality and reasonable price, etc. 27% of respondents prefer Appolo tyre for better mileage, good appearance.5% of respondents prefer MRF tyre for quick service, flexibility. 27% of the respondents prefer Birla tyre for better claim policy, load capacity. 12% of the respondents prefer other brands.
Ambedkar Institute of Management Studies 49
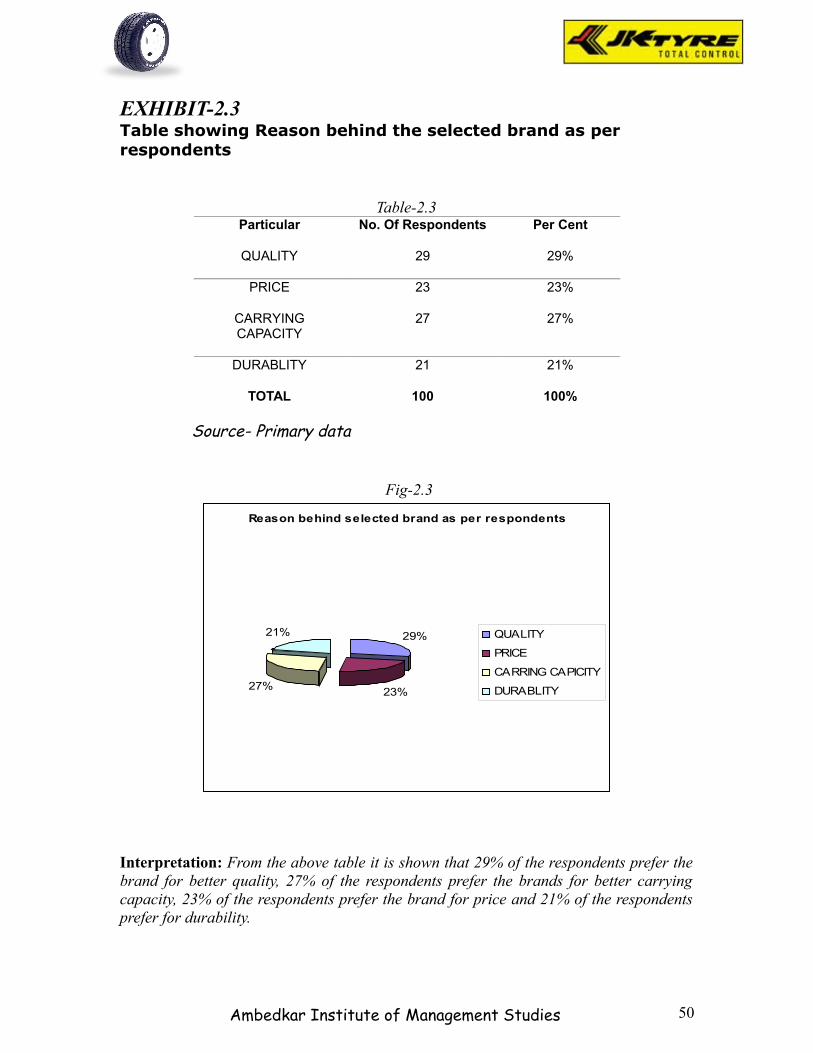
EXHIBIT-2.3Table showing Reason behind the selected brand as per respondents
Table-2.3Particular No. Of Respondents Per Cent
QUALITY 29 29%
PRICE 23 23%
CARRYING CAPACITY
27 27%
DURABLITY 21 21%
TOTAL 100 100%
Source- Primary data
Fig-2.3
Reason behind selected brand as per respondents
29%
23%27%
21% QUALITY
PRICE
CARRING CAPICITY
DURABLITY
Interpretation: From the above table it is shown that 29% of the respondents prefer the brand for better quality, 27% of the respondents prefer the brands for better carrying capacity, 23% of the respondents prefer the brand for price and 21% of the respondents prefer for durability.
Ambedkar Institute of Management Studies 50
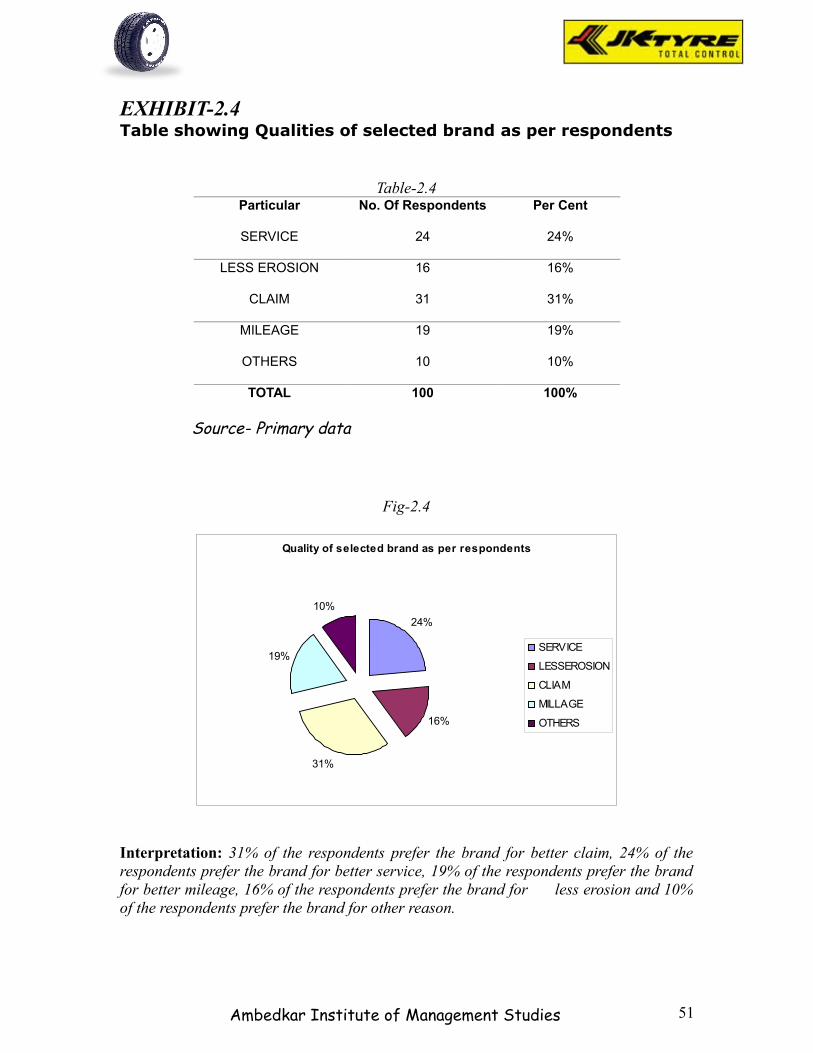
EXHIBIT-2.4Table showing Qualities of selected brand as per respondents
Table-2.4Particular No. Of Respondents Per Cent
SERVICE 24 24%
LESS EROSION 16 16%
CLAIM 31 31%
MILEAGE 19 19%
OTHERS 10 10%
TOTAL 100 100%
Source- Primary data
Fig-2.4
Interpretation: 31% of the respondents prefer the brand for better claim, 24% of the respondents prefer the brand for better service, 19% of the respondents prefer the brand for better mileage, 16% of the respondents prefer the brand for less erosion and 10% of the respondents prefer the brand for other reason.
Ambedkar Institute of Management Studies
Quality of selected brand as per respondents
24%
16%
31%
19%
10%
SERVICE
LESSEROSION
CLIAM
MILLAGE
OTHERS
51
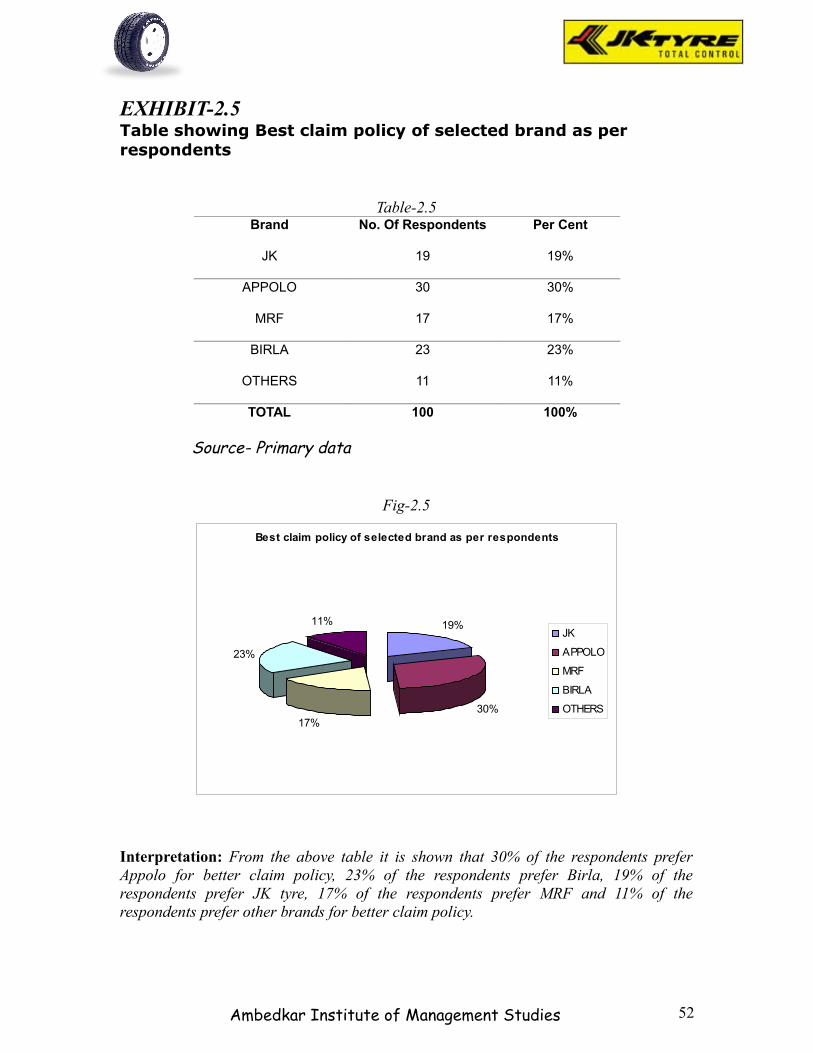
EXHIBIT-2.5Table showing Best claim policy of selected brand as per respondents
Table-2.5Brand No. Of Respondents Per Cent
JK 19 19%
APPOLO 30 30%
MRF 17 17%
BIRLA 23 23%
OTHERS 11 11%
TOTAL 100 100%
Source- Primary data
Fig-2.5
Interpretation: From the above table it is shown that 30% of the respondents prefer Appolo for better claim policy, 23% of the respondents prefer Birla, 19% of the respondents prefer JK tyre, 17% of the respondents prefer MRF and 11% of the respondents prefer other brands for better claim policy.
Ambedkar Institute of Management Studies
Best claim policy of selected brand as per respondents
19%
30%17%
23%
11%JK
APPOLO
MRF
BIRLA
OTHERS
52
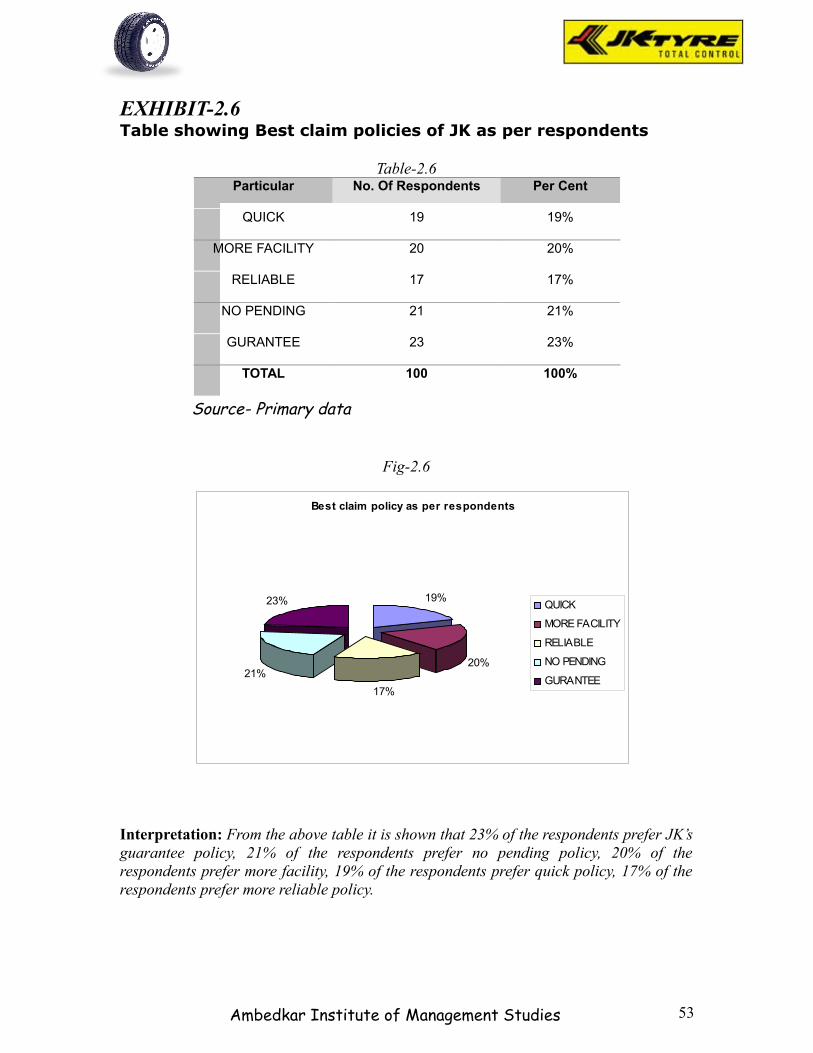
EXHIBIT-2.6Table showing Best claim policies of JK as per respondents
Table-2.6Particular No. Of Respondents Per Cent
QUICK 19 19%
MORE FACILITY 20 20%
RELIABLE 17 17%
NO PENDING 21 21%
GURANTEE 23 23%
TOTAL 100 100%
Source- Primary data
Fig-2.6
Interpretation: From the above table it is shown that 23% of the respondents prefer JK’s guarantee policy, 21% of the respondents prefer no pending policy, 20% of the respondents prefer more facility, 19% of the respondents prefer quick policy, 17% of the respondents prefer more reliable policy.
Ambedkar Institute of Management Studies
Best claim policy as per respondents
19%
20%
17%
21%
23% QUICK
MORE FACILITY
RELIABLE
NO PENDING
GURANTEE
53
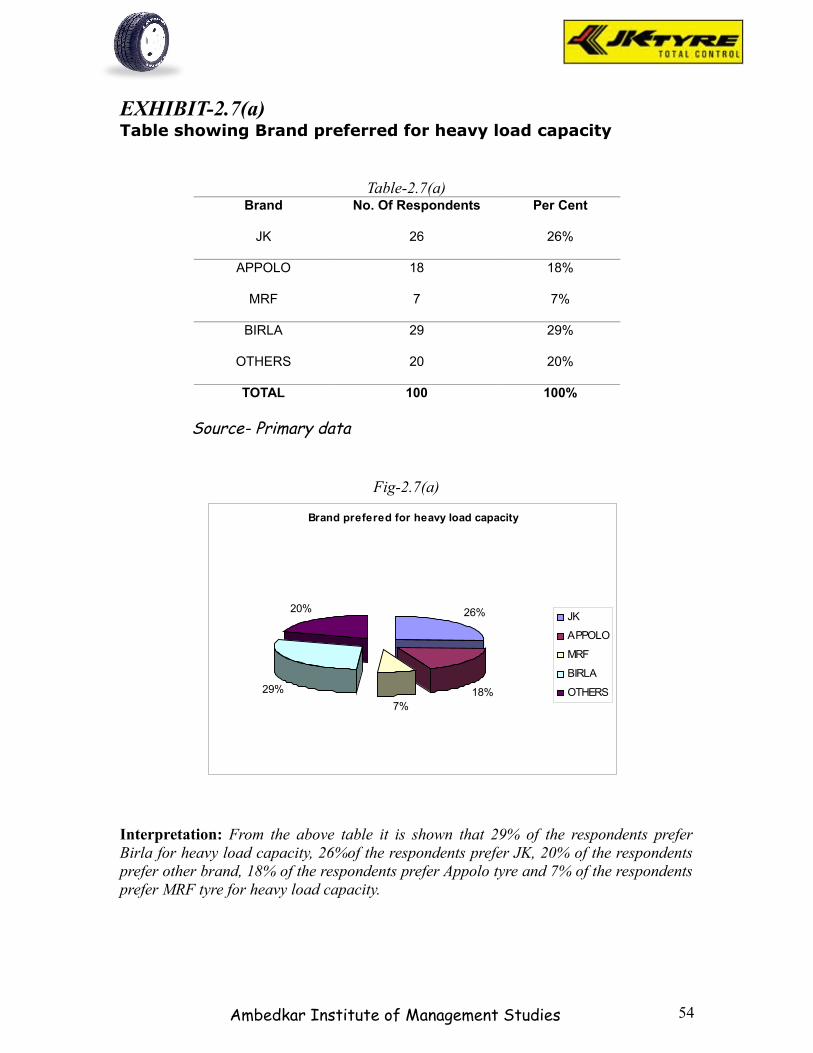
EXHIBIT-2.7(a)Table showing Brand preferred for heavy load capacity
Table-2.7(a)Brand No. Of Respondents Per Cent
JK 26 26%
APPOLO 18 18%
MRF 7 7%
BIRLA 29 29%
OTHERS 20 20%
TOTAL 100 100%
Source- Primary data
Fig-2.7(a)
Interpretation: From the above table it is shown that 29% of the respondents prefer Birla for heavy load capacity, 26%of the respondents prefer JK, 20% of the respondents prefer other brand, 18% of the respondents prefer Appolo tyre and 7% of the respondents prefer MRF tyre for heavy load capacity.
Ambedkar Institute of Management Studies
Brand prefered for heavy load capacity
26%
18%7%
29%
20%JK
APPOLO
MRF
BIRLA
OTHERS
54
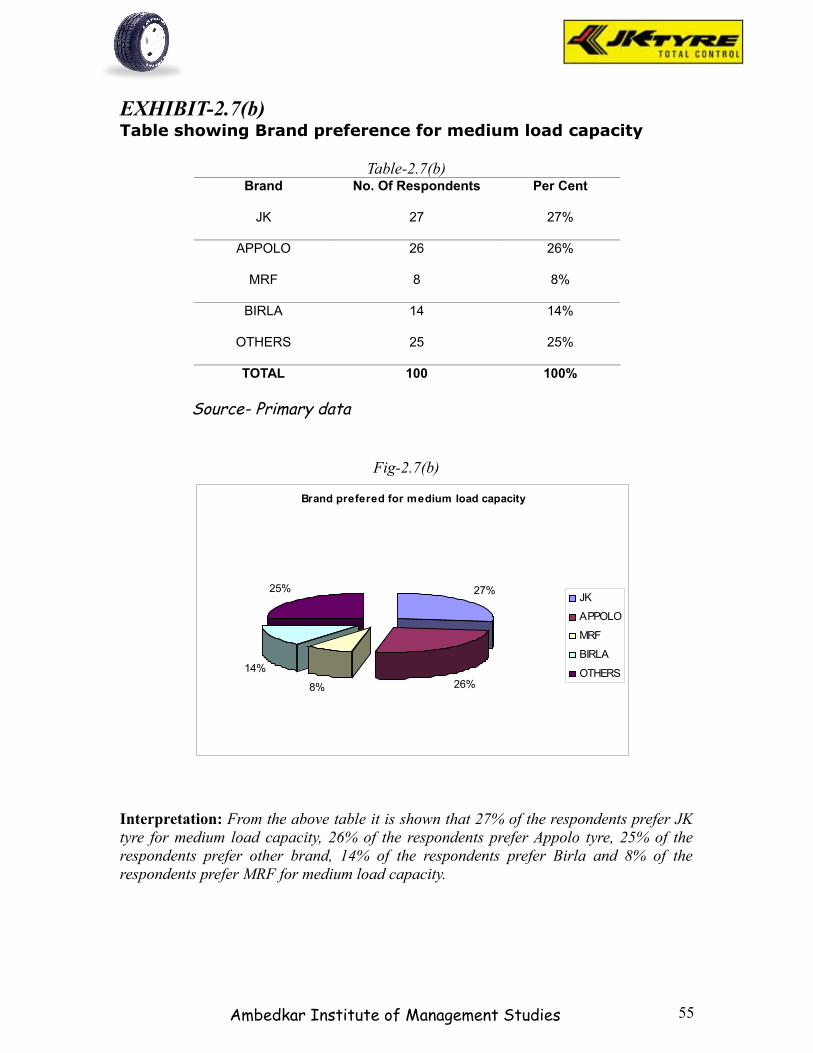
EXHIBIT-2.7(b)Table showing Brand preference for medium load capacity
Table-2.7(b)Brand No. Of Respondents Per Cent
JK 27 27%
APPOLO 26 26%
MRF 8 8%
BIRLA 14 14%
OTHERS 25 25%
TOTAL 100 100%
Source- Primary data
Fig-2.7(b)
Interpretation: From the above table it is shown that 27% of the respondents prefer JK tyre for medium load capacity, 26% of the respondents prefer Appolo tyre, 25% of the respondents prefer other brand, 14% of the respondents prefer Birla and 8% of the respondents prefer MRF for medium load capacity.
Ambedkar Institute of Management Studies
Brand prefered for medium load capacity
27%
26%8%
14%
25%JK
APPOLO
MRF
BIRLA
OTHERS
55
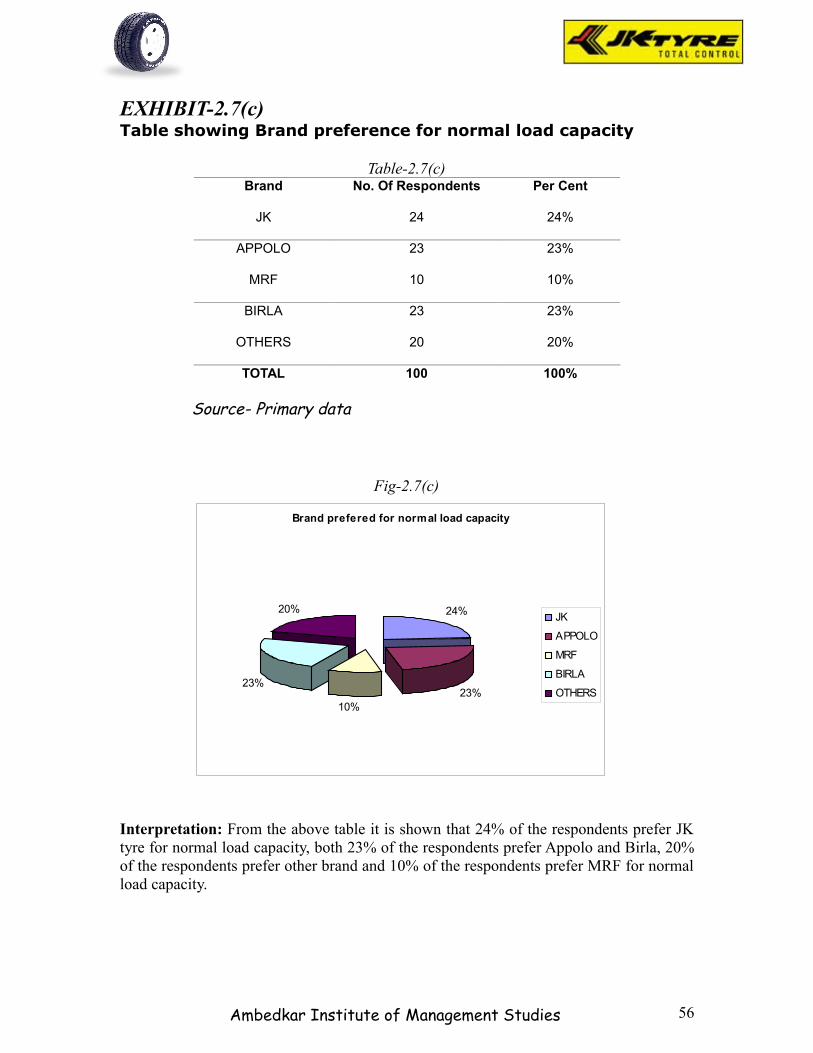
EXHIBIT-2.7(c)Table showing Brand preference for normal load capacity
Table-2.7(c)Brand No. Of Respondents Per Cent
JK 24 24%
APPOLO 23 23%
MRF 10 10%
BIRLA 23 23%
OTHERS 20 20%
TOTAL 100 100%
Source- Primary data
Fig-2.7(c)
Interpretation: From the above table it is shown that 24% of the respondents prefer JK tyre for normal load capacity, both 23% of the respondents prefer Appolo and Birla, 20% of the respondents prefer other brand and 10% of the respondents prefer MRF for normal load capacity.
Ambedkar Institute of Management Studies
Brand prefered for normal load capacity
24%
23%10%
23%
20%JK
APPOLO
MRF
BIRLA
OTHERS
56
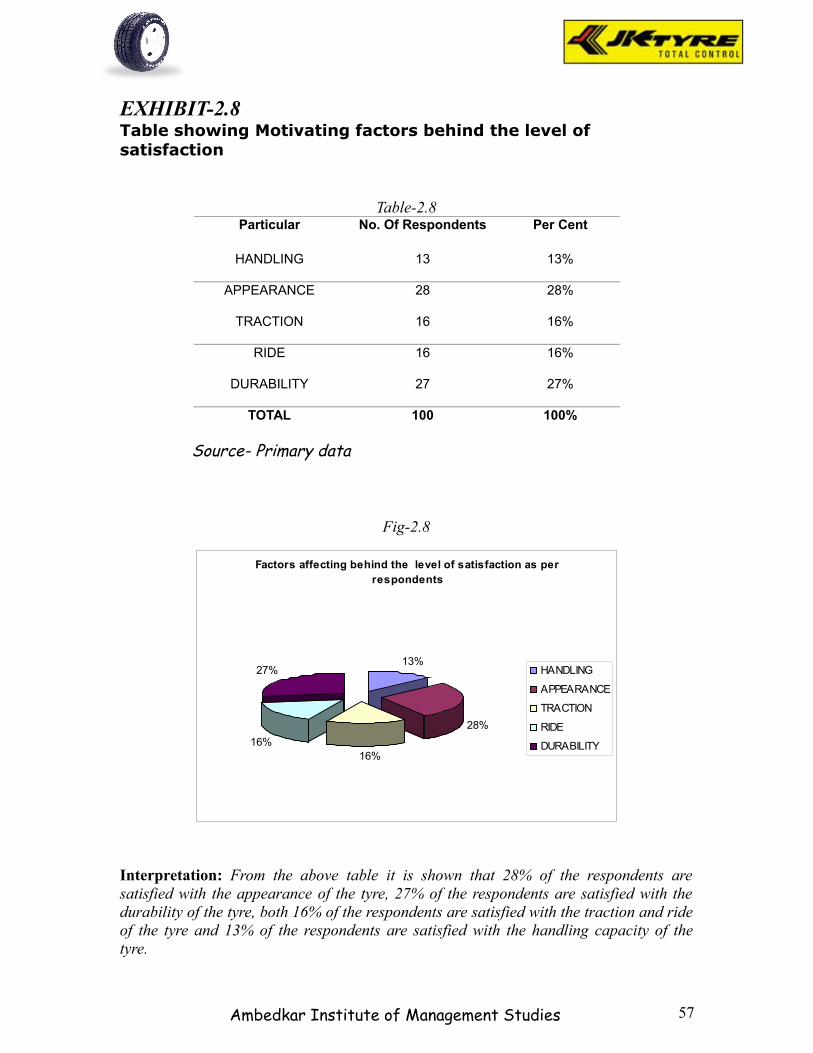
EXHIBIT-2.8Table showing Motivating factors behind the level of satisfaction
Table-2.8Particular No. Of Respondents Per Cent
HANDLING 13 13%
APPEARANCE 28 28%
TRACTION 16 16%
RIDE 16 16%
DURABILITY 27 27%
TOTAL 100 100%
Source- Primary data
Fig-2.8
Interpretation: From the above table it is shown that 28% of the respondents are satisfied with the appearance of the tyre, 27% of the respondents are satisfied with the durability of the tyre, both 16% of the respondents are satisfied with the traction and ride of the tyre and 13% of the respondents are satisfied with the handling capacity of the tyre.
Ambedkar Institute of Management Studies
Factors affecting behind the level of satisfaction as per respondents
13%
28%
16%16%
27% HANDLING
APPEARANCE
TRACTION
RIDE
DURABILITY
57
Ambedkar Institute of Management Studies
FindingsSuggestionsConclusion
58
Findings
1. Customers are loyal to different brands in different areas.
2. In claim policy JK Tyre beat others by mile.
3. Durability of JK Tyre is satisfactory
Suggestions
1. Some customers are not satisfied with the claim policies as it is not properly clear to
the customers why the claim has been rejected.
2. Today more people prefer guaranteed tyres like “JET TRAK 39”, “BIRLA
SAMSON” so JK can modify its guaranty policy to attract more customers.
3. Need to increase relationship with customers
Conclusion
JK is one of the best Tyre manufacturing companies in India. Where the
improvement is required is the relationship with its potential customer. Also
in some segment JK has not any strong hold compare to APOLLO, CEAT,
BIRLA and others. So it can further increase its market share through
customer relationship program and brand awareness strategy.
Ambedkar Institute of Management Studies 59
BIBLIOGRAPHY
Marketing management, Rajan Saxsena
Marketing management, Philip Kittler
www.indiacar.net
www.jktyre.com
www.businessstandard.com
Ambedkar Institute of Management Studies 60