Embed Size (px)
Citation preview
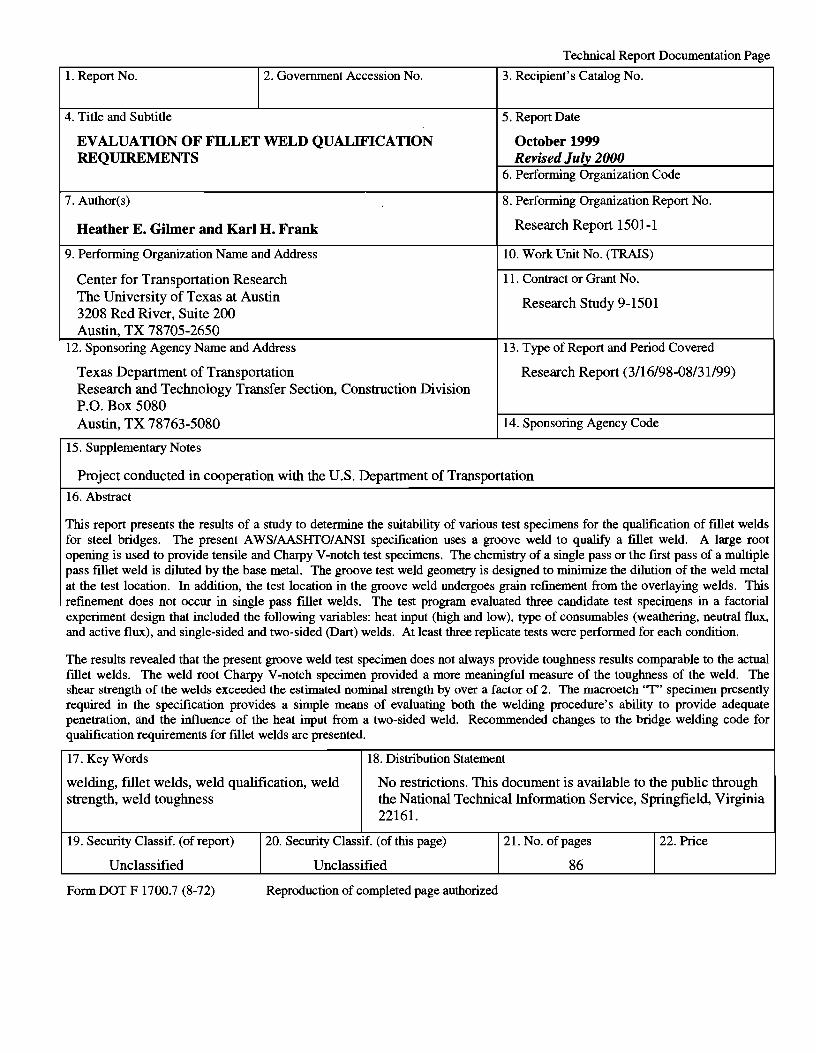
Technical Report Documentation Page
1. Report No. 2. Government Accession No. 3. Recipient's Catalog No.
4. Title and Subtitle 5. Report Date
EVALUATION OF Fll..LET WELD QUALIFICATION October 1999 REQUIREMENTS Revised July 2000
6. Performing Organization Code
7. Author(s) 8. Performing Organization Report No.
Heather E. Gilmer and Karl H. Frank Research Report 1501-1
9. Performing Organization Name and Address 10. Work Unit No. (TRAIS)
Center for Transportation Research 11. Contract or Grant No. The University of Texas at Austin Research Study 9-1501 3208 Red River, Suite 200 Austin, TX 78705-2650
12. Sponsoring Agency Name and Address 13. Type of Report and Period Covered
Texas Department of Transportation Research Report (3/16/98-08/31/99) Research and Technology Transfer Section, Construction Division P.O. Box 5080 Austin, TX 78763-5080 14. Sponsoring Agency Code
15. Supplementary Notes
Project conducted in cooperation with the U.S. Department of Transportation
16. Abstract
This report presents the results of a study to determine the suitability of various test specimens for the qualification of fillet welds for steel bridges. The present A WS/ AASHTO/ ANSI specification uses a groove weld to qualify a fillet weld. A large root opening is used to provide tensile and Charpy V -notch test specimens. The chemistry of a single pass or the frrst pass of a multiple pass fillet weld is diluted by the base metal. The groove test weld geometry is designed to minimize the dilution of the weld metal at the test location. In addition, the test location in the groove weld undergoes grain refmement from the overlaying welds. This refinement does not occur in single pass fillet welds. The test program evaluated three candidate test specimens in a factorial experiment design that included the following variables: heat input (high and low), type of consumables (weathering, neutral flux, and active flux), and single-sided and two-sided (Dart) welds. At least three replicate tests were performed for each condition.
The results revealed that the present groove weld test specimen does not always provide toughness results comparable to the actual fillet welds. The weld root Charpy V -notch specimen provided a more meaningful measure of the toughness of the weld. The shear strength of the welds exceeded the estimated nominal strength by over a factor of 2. The macroetch ''T" specimen presently required in the specification provides a simple means of evaluating both the welding procedure's ability to provide adequate penetration, and the influence of the heat input from a two-sided weld. Recommended changes to the bridge welding code for qualification requirements for fillet welds are presented.
17. Key Words 18. Distribution Statement
welding, fillet welds, weld qualification, weld No restrictions. This document is available to the public through strength, weld toughness the National Technical Information Service, Springfield, Virginia
22161.
19. Security Class if. (of report) 20. Security Classif. (of this page) 21. No. of pages 22. Price
Unclassified Unclassified 86
Form DOT F 1700.7 (8-72) Reproduction of completed page authorized

EVALUATION OF FILLET WELD
QUALIFICATION REQUIREMENTS
by
Heather E. Gilmer and Karl H. Frank
Research Report 1501-1
Research Project 9-1501
FILLET WELDING PROCEDURE QUAUFICATION RESEARCH
conducted for the
Texas Department of Transportation
In cooperation with the
U.S. Department of Transportation
Federal Highway Administration
by the
CENTER FOR TRANSPORTATION RESEARCH
BUREAU OF ENGINEERING RESEARCH
THE UNIVERSITY OF TEXAS AT AUSTIN
October 1999
Revised July 2000
Research performed in cooperation with the Texas Department of Transportation and the U.S. Department of Transportation, Federal Highway Administration.
ACKNOWLEDGMENTS
We greatly appreciate the financial support from the Texas Department of Transportation that made this project possible. The support of the project director, Ronnie Medlock (CSTM), is also very much appreciated. We would also like to thank monitoring committee members, Fred Beckmann (consultant), Hardy Campbell (American Welding Society), Wayne Casteel (Arkansas Department of Transportation), William Domico (florida Department of Transportation), Randy Foil (previously with Trinity Industries), Chris Hahin (lllinois Department of Transportation), Mitch Hiles (Tennessee Department of Transportation), John Mieske (PDM Bridge), Duane Miller (Lincoln Electric), William Miller (Pennsylvania Department of Transportation), Todd Niemann (Minnesota Department of Transportation), Steven Olson (National Steel Bridge Alliance), Russ Panico (High Steel Structures), Krishna Verma (Federal Highway Administration) and Rick Wong (Naval Surface Warfare Center, Carderock), for their guidance on this project. We would further like to thank PDM Bridge (particularly Ben Bristol and Buck Roberds) and Trinity Industries (particularly Haskell Ray) for fabricating the test specimens.
DISCLAIMER The contents of this report reflect the views of the authors, who are responsible for the facts and the accuracy of the data presented herein. The contents do not necessarily reflect the view of the Federal Highway Administration or the Texas Department of Transportation. This report does not constitute a standard, specification, or regulation.
NOT INfENDED FOR CONSTRUCTION,
PERMIT, OR BIDDING PURPOSES
Karl H. Frank, P.E., TX #48953
Research Supervisor
iv
TABLE OF CONTENTS
CHAPTER 1: INTRODUCTION ............................................................................................................. 1
1.1 BACKGROUND .................................................................................................................................. 1
1.2 SCOPE OF REsEARCH ....................................................................................................................... 2
1.2.1 Materials and Fabrication ..................................................................................................... 3
1.2.2 Heat Input .............................................................................................................................. 4
1.2.3 Weld and Base Metal Chemistry ............................................................................................ 5
1.2.4 Welding Method ..................................................................................................................... 8
1.2.5 Test Types .............................................................................................................................. 8
1.3 STATISTICALMETHODS ................................................................................................................. 10
1.4 OVERVIEW ..................................................................................................................................... 10
CHAPTER 2: Fll..tLET WELD Slffi,AR TEST ..................................................................................... 11
2.1 FABRICATION ................................................................................................................................. 11
2.2 TESTING AND MEASlJREMENT ....................................................................................................... 13
2.3 REsULTS AND ANALYSIS ............................................................................................................... 18
2.3.1 Weathering Consutnables .................................................................................................... 18
2.3.2 Neutral Flux Consutnables .................................................................................................. 21
2.3.3 Active Flux Consumables ..................................................................................................... 23
2.3.4 Sumtnary .............................................................................................................................. 24
CHAPTER 3: T -BEND TEST ................................................................................................................. 27
3.1 FABRICATION ................................................................................................................................. 27
3.2 TEsTING ......................................................................................................................................... 30
3.3 REsULTS AND ANALYSIS ............................................................................................................... 33
3.3.1 Weathering Consutnables .................................................................................................... 35
3.3.2 Neutral Flux Consutnables .................................................................................................. 39
3.3.3 Active Flux Consutnables ..................................................................................................... 43
3.3.4 Sumtnary .............................................................................................................................. 48
CHAPTER 4: WELD ROOT CVN TEST ............................................................................................ 49
4.1 FABRICATION ................................................................................................................................. 49
4.2 TESTING ......................................................................................................................................... 53
4.3 REsULTS AND ANALYSIS ............................................................................................................... 53
4.3.1 Effects of Heat Input and Consutnables ............................................................................... 53
4.3.2 Effect of Depth ofV-Notch into Weld .................................................................................. 58
v
4.4 COMPARISON W1TH QUAUFICATION 'TESTS .................................................................................. 58
CHAPTERS: Sumt:ARY AND CONCLUSIONS ............................................................................. 61
5.1 EVALUATIONOFREsULTS ............................................................................................................. 61
5.1.1 Weld Shear Strength ............................................................................................................ 61
5.1.2 T-Bend Test .......................................................................................................................... 61
5.1.3 Weld-Root CVNTest ............................................................................................................ 61
5.2 WELDING CONSUMABLES .............................................................................................................. 62
5.3 CONCLUSIONS AND RECOMMENDED FILLET WELD QUALIFICATION REQUIREMENTS ................. 62
APPEND IX .•••••••••••••••••••••••••••••••••••••••••••••••.•••..••..••.••..•••...••••••••••••••••••••••••••••••••••••••••••••••••••••••••••••••••••••••••• 65
BffiLIOGRAPHY ..................................................................................................................................... 73
vi
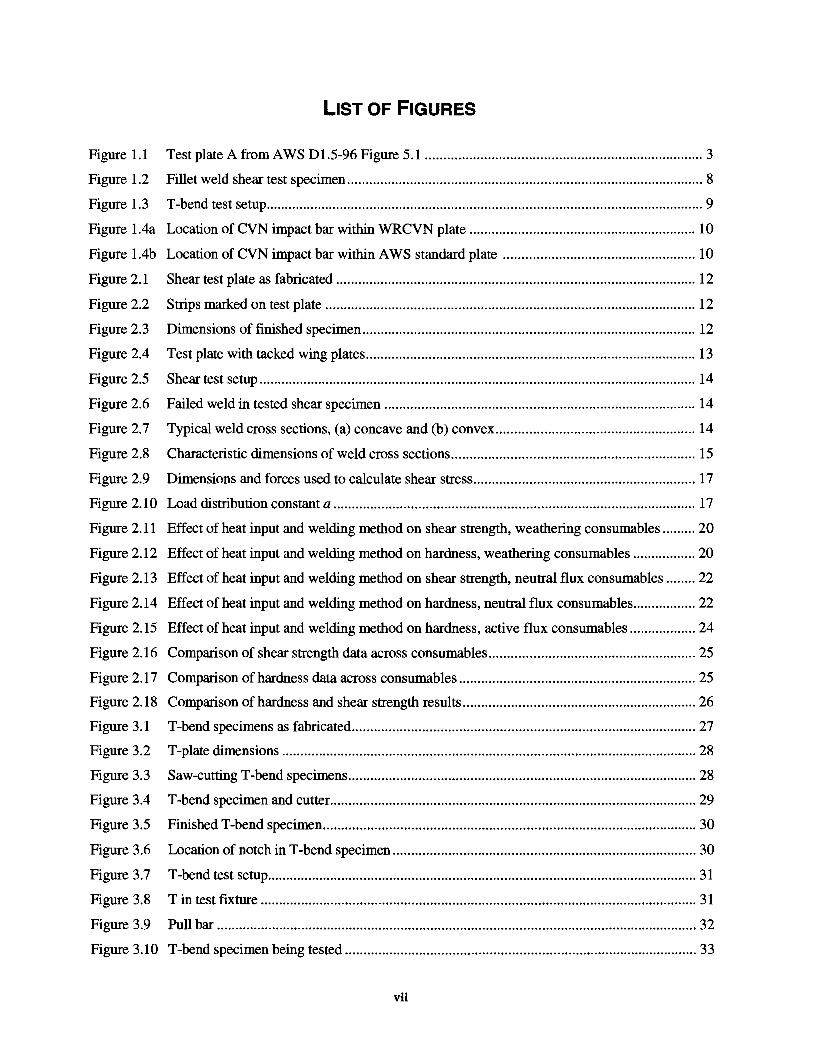
Figure 1.1
Figure 1.2
Figure 1.3
Figure 1.4a
Figure 1.4b
Figure 2.1
Figure 2.2
Figure 2.3
Figure 2.4
Figure 2.5
Figure 2.6
Figure 2.7
Figure 2.8
Figure 2.9
LIST OF FIGURES
Test plate A from A WS D 1.5-96 Figure 5.1 ........................................................................... 3
Fillet weld shear test specimen ................................................................................................ 8
T -bend test setup ...................................................................................................................... 9
Location of CVN impact bar within WRCVN plate ............................................................. 10
Location of CVN impact bar within A WS standard plate .................................................... 10
Shear test plate as fabricated ................................................................................................. 12
Strips marked on test plate .................................................................................................... 12
Dimensions of finished specimen .......................................................................................... 12
Test plate with tacked wing plates ......................................................................................... 13
Shear test setup .. .. .. . . .. . . .. . .... . .... . .. . . . . .. . . .. .. . . ... .. ... .......... ... .. .. . . . . . . . . ... . .. .. .. .. .. . .. . .. .... ... .... .. .. .. . . .. . .. 14
Failed weld in tested shear specimen .................................................................................... 14
Typical weld cross sections, (a) concave and (b) convex ...................................................... 14
Characteristic dimensions of weld cross sections .................................................................. 15
Dimensions and forces used to calculate shear stress ............................................................ 17
Figure 2.10 Load distribution constant a .................................................................................................. 17
Figure 2.11 Effect of heat input and welding method on shear strength, weathering consumables ......... 20
Figure 2.12 Effect of heat input and welding method on hardness, weathering consumables ................. 20
Figure 2.13 Effect of heat input and welding method on shear strength, neutral flux consumables ........ 22
Figure 2.14 Effect of heat input and welding method on hardness, neutral flux consumables ................. 22
Figure 2.15 Effect of heat input and welding method on hardness, active flux consumables .................. 24
Figure 2.16 Comparison of shear strength data across consumables ........................................................ 25
Figure 2.17 Comparison of hardness data across consumables ................................................................ 25
Figure 2.18 Comparison of hardness and shear strength results ............................................................... 26
Figure 3.1 T-bend specimens as fabricated ............................................................................................. 27
Figure 3.2 T -plate dimensions ................................................................................................................ 28
Figure 3.3 Saw-cutting T-bend specimens .............................................................................................. 28
Figure 3.4
Figure 3.5
Figure 3.6
Figure 3.7
T -bend specimen and cutter ................................................................................................... 29
Finished T -bend specimen ..................................................................................................... 30
Location of notch in T -bend specimen .................................................................................. 30
T -bend test setup .................................................................................................................... 31
Figure 3.8 Tin test fixture ...................................................................................................................... 31
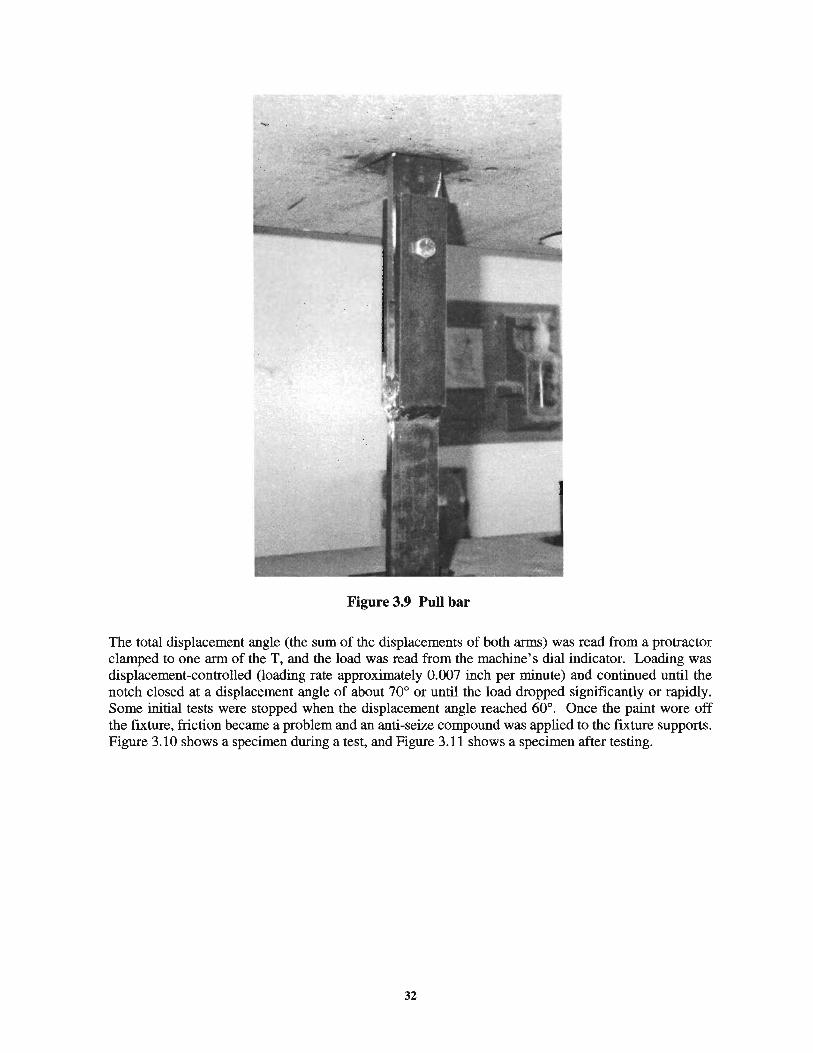
Figure 3.9 Pull bar .................................................................................................................................. 32
Figure 3.10 T-bend specimen being tested ............................................................................................... 33
vii
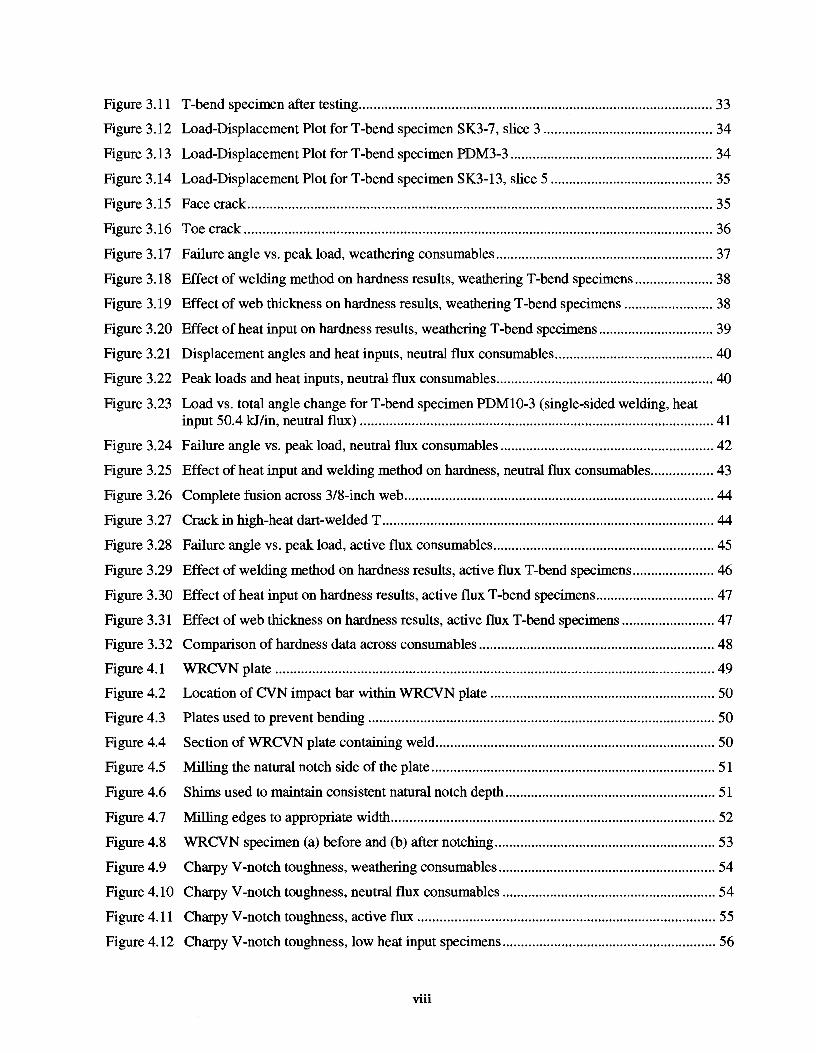
Figure 3.11 T-bend specimen after testing ................................................................................................. 33
Figure 3.12 Load-Displacement Plot forT -bend specimen SK3-7, slice 3 .............................................. 34
Figure 3.13 Load-Displacement Plot forT -bend specimen PDM3-3 ....................................................... 34
Figure 3.14 Load-Displacement Plot forT-bend specimen SK3-13, slice 5 ............................................ 35
Figure 3.15 Face crack .............................................................................................................................. 35
Figure 3.16 Toe crack ............................................................................................................................... 36
Figure 3.17 Failure angle vs. peak load, weathering consumables ........................................................... 37
Figure 3.18 Effect of welding method on hardness results, weathering T -bend specimens ..................... 38
Figure 3.19 Effect of web thickness on hardness results, weathering T-bend specimens ........................ 38
Figure 3.20 Effect of heat input on hardness results, weathering T-bend specimens ............................... 39
Figure 3.21 Displacement angles and heat inputs, neutral flux consumables ........................................... 40
Figure 3.22 Peak loads and heat inputs, neutral flux consumables ........................................................... 40
Figure 3.23 Load vs. total angle change forT-bend specimen PDMI0-3 (single-sided welding, heat input 50.4 kJ/in, neutral flux) ................................................................................................ 41
Figure 3.24 Failure angle vs. peak load, neutral flux consumables .......................................................... 42
Figure 3.25 Effect of heat input and welding method on hardness, neutral flux consumables ................. 43
Figure 3.26 Complete fusion across 3/8-inch web .................................................................................... 44
Figure 3.27 Crack in high-heat dart-welded T .......................................................................................... 44
Figure 3.28 Failure angle vs. peak load, active flux consumables ............................................................ 45
Figure 3.29 Effect of welding method on hardness results, active flux T-bend specimens ...................... 46
Figure 3.30 Effect of heat input on hardness results, active flux T-bend specimens ................................ 47
Figure 3.31 Effect of web thickness on hardness results, active flux T -bend specimens ......................... 47
Figure 3.32 Comparison of hardness data across consumables ................................................................ 48
Figure 4.1 WRCVN plate ....................................................................................................................... 49
Figure 4.2
Figure 4.3
Figure 4.4
Location of CVN impact bar within WRCVN plate ............................................................. 50
Plates used to prevent bending .............................................................................................. 50
Section of WRCVN plate containing weld ............................................................................ 50
Figure 4.5 Milling the natural notch side of the plate ............................................................................. 51
Figure 4.6 Shims used to maintain consistent natural notch depth ......................................................... 51
Figure 4. 7 Milling edges to appropriate width ........................................................................................ 52
Figure 4.8 WRCVN specimen (a) before and (b) after notching ............................................................ 53
Figure 4.9 Charpy V -notch toughness, weathering consumables ........................................................... 54
Figure 4.10 Charpy V -notch toughness, neutral flux consumables .......................................................... 54
Figure 4.11 Charpy V -notch toughness, active flux ................................................................................. 55
Figure 4.12 Charpy V-notch toughness, low heat input specimens .......................................................... 56
viii
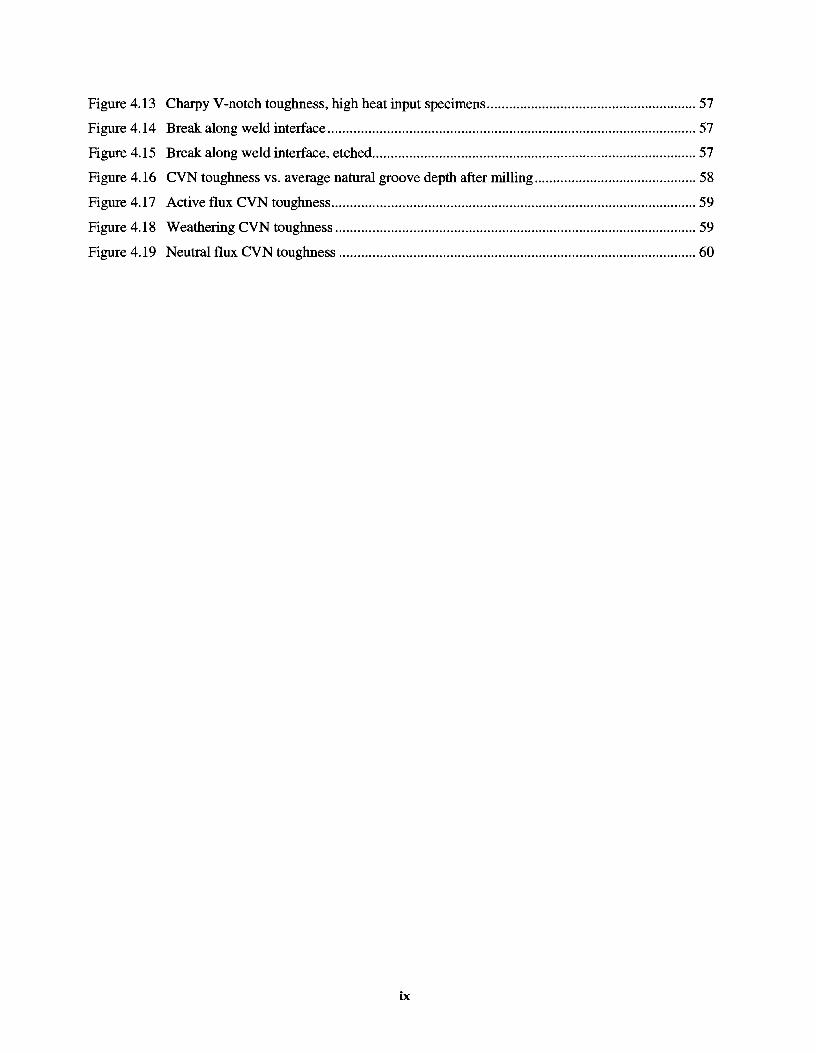
Figure 4.13 Charpy V-notch toughness, high heat input specimens ......................................................... 57
Figure 4.14 Break along weld interface .................................................................................................... 57
Figure 4.15 Break along weld interface, etched ........................................................................................ 57
Figure 4.16 CVN toughness vs. average natural groove depth after milling ............................................ 58
Figure 4.17 Active flux CVN toughness ................................................................................................... 59
Figure 4.18 Weathering CVN toughness .................................................................................................. 59
Figure 4.19 Neutral flux CVN toughness ................................................................................................. 60
ix
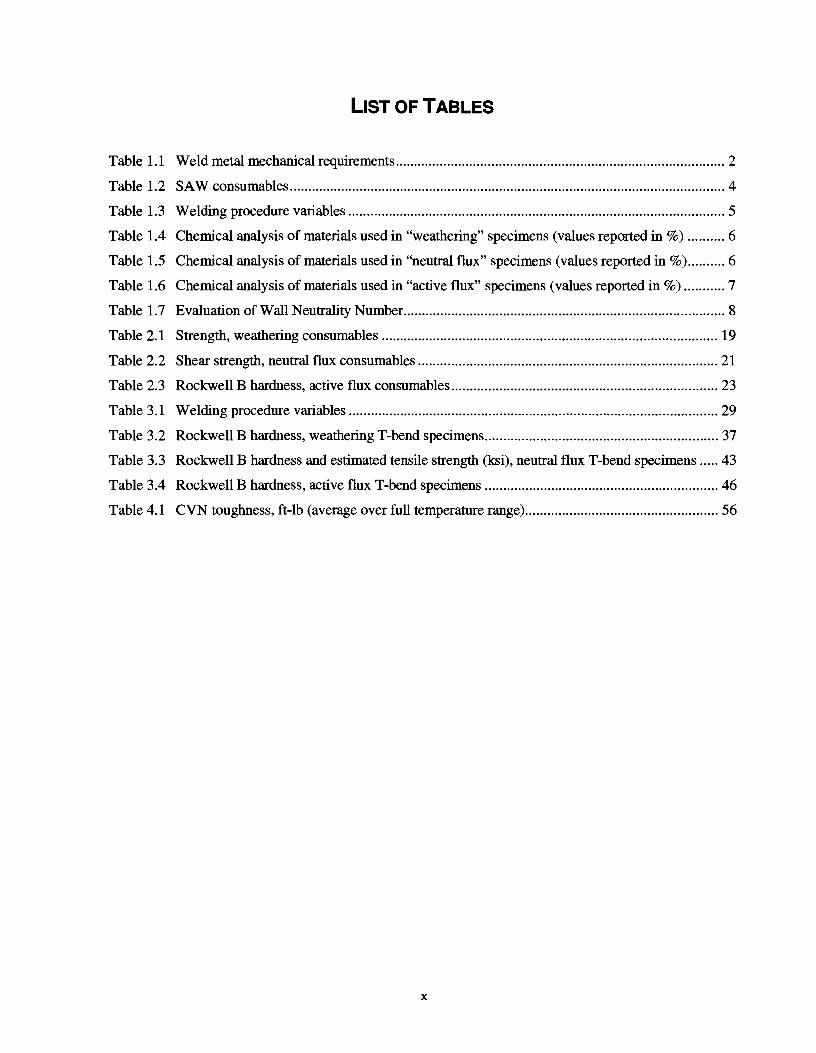
LIST OF TABLES
Table 1.1 Weld metal mechanical requirements ......................................................................................... 2
Table 1.2 SAW consumables ...................................................................................................................... 4
Table 1.3 Welding procedure variables ...................................................................................................... 5
Table 1.4 Chemical analysis of materials used in "weathering" specimens (values reported in %) .......... 6
Table 1.5 Chemical analysis of materials used in "neutral flux" specimens (values reported in%) .......... 6
Table 1.6 Chemical analysis of materials used in "active flux" specimens (values reported in %) ........... 7
Table 1.7 Evaluation of Wall Neutrality Number. ...................................................................................... 8
Table 2.1 Strength, weathering consumables ........................................................................................... 19
Table 2.2 Shear strength, neutral flux consumables ................................................................................. 21
Table 2.3 Rockwell B hardness, active flux consumables ........................................................................ 23
Table 3.1 Welding procedure variables .................................................................................................... 29
Table 3.2 Rockwell B hardness, weathering T -bend specimens ............................................................... 37
Table 3.3 Rockwell B hardness and estimated tensile strength (ksi), neutral flux T-bend specimens ..... 43
Table 3.4 Rockwell B hardness, active flux T-bend specimens ............................................................... 46
Table 4.1 CVN toughness, ft-lb (average over full temperature range) .................................................... 56
X
SUMMARY
This report presents the results of a study to determine the suitability of various test specimens for the qualification of fillet welds for steel bridges. The present A WS/ AASHTO/ ANSI specification uses a groove weld to qualify a fillet weld. A large root opening is used to provide tensile and Charpy V -notch test specimens. The chemistry of a single pass or the first pass of a multiple pass fillet weld is diluted by the base metal. The groove test weld geometry is designed to minimize the dilution of the weld metal at the test location. In addition, the test location in the groove weld undergoes grain refmement from the overlaying welds. This refmement does not occur in single pass fillet welds. The test program evaluated three candidate test specimens in a factorial experiment design that included the following variables: heat input (high and low), type of consumables (weathering, neutral flux, and active flux), and single-sided and two-sided (Dart) welds. At least three replicate tests were performed for each condition.
The results revealed that the present groove weld test specimen does not always provide toughness results comparable to the actual fillet welds. The weld root Charpy V -notch specimen provided a more meaningful measure of the toughness of the weld. The shear strength of the welds exceeded the estimated nominal strength by over a factor of 2. The macroetch "T" specimen presently required in the specification provides a simple means of evaluating both the welding procedure's ability to provide adequate penetration, and the influence of the heat input from a two-sided weld. Recommended changes to the bridge welding code for qualification requirements for fillet welds are presented.
xi

CHAPTER 1: INTRODUCTION
1.1 BACKGROUND
The motivation for this research was the desire by steel fabricators to use active submerged arc fluxes when making fillet welds on bridge structures. Active fluxes are formulated for limited-pass welding. They contain active deoxidizers, such as manganese, silicon, or both, to improve the resistance to porosity and weld cracking caused by contaminants on or in the base metal. Most fillet welds are single-pass welds applied to unprepared surfaces. The enhanced ability of active fluxes to deoxidize the weld metal is particularly important for fillet welds. The amount of manganese and silicon in the weld metal varies with the arc voltage, and so the arc voltage must be carefully controlled when making multipass welds with active fluxes. The change in the amount of silicon and manganese when the arc voltage is changed is used as an index to differentiate between active and inactive or neutral fluxes. More active fluxes will show a larger change in deposited weld metal chemistry for an incremental change in voltage.
The fillet weld qualification requirements in the current bridge welding code, ANSI/ AASHTO/ A WS 01.5-96, henceforth "AWS Dl.5," specify that fillet welding procedures be qualified using a groove weld specimen (AWS Dl.5, Section 5.10). Fillet welds have different properties from groove welds, however, so this test does not provide information about fillet weld characteristics. A typical small fillet weld will have more dilution of weld metal with base metal than the material at the center of a large groove weld, which is what is examined in the standard test. In addition, the groove weld microstructure will be refined in subsequent passes; fillet welds are typically single-pass. In practice, welding procedures that give good test results for a groove weld do not necessarily produce the best fillet welds. In particular, fabricators have reported that the heat input required to produce a groove weld specimen that will pass the specified tests is too high for many fillet welds. This requirement is particularly problematic with T -joints welded simultaneously on both sides, where the total heat input to the welded area is greatly increased. There are anecdotal reports that fillet welds made with procedures that pass the qualification tests have failed in the field.
One particular type of failure is described in Miller (1997). When two high-heat welds are made on opposite sides of a T -joint with a relatively thin stem, the fusion zones of the two welds may join, or "bridge," forming a single region of molten metal that can develop a plane of weakness and crack as it cools.
In addition, many fabricators think that much of the testing is unnecessary. They feel that they are wasting time and money by conducting tests on procedures that have been tested repeatedly in the past and are expected to perform consistently in the future. In addition, some tests may not be necessary because the results may depend more on the quality of the welding materials than on the procedure, and so as long as the welding electrode manufacturers conduct appropriate tests of their materials, these properties need not be tested in the finished welds.
A WS D 1.5 has the same requirements for fillet welds and multipass groove welds for the acceptance and performance of a set of submerged arc consumables. The mechanical requirements for the allweld-metal test of F7 AO-EXXX weld metal for non weathering bridge steels with a 50-ksi yield strength are summarized in Table 1.1. The less stringent base metal requirements are shown for comparison. The all-weld-metal tests are taken from a special qualification weld joint designed to produce specimens that have a chemistry undiluted by the base metal and refined by adjacent weld passes. None of the currently specified tests measure the strength or toughness of a fillet weld. The only fillet weld test specimen required in AWS Dl.5 is aT-shaped macroetch specimen that has no strength requirements.
1
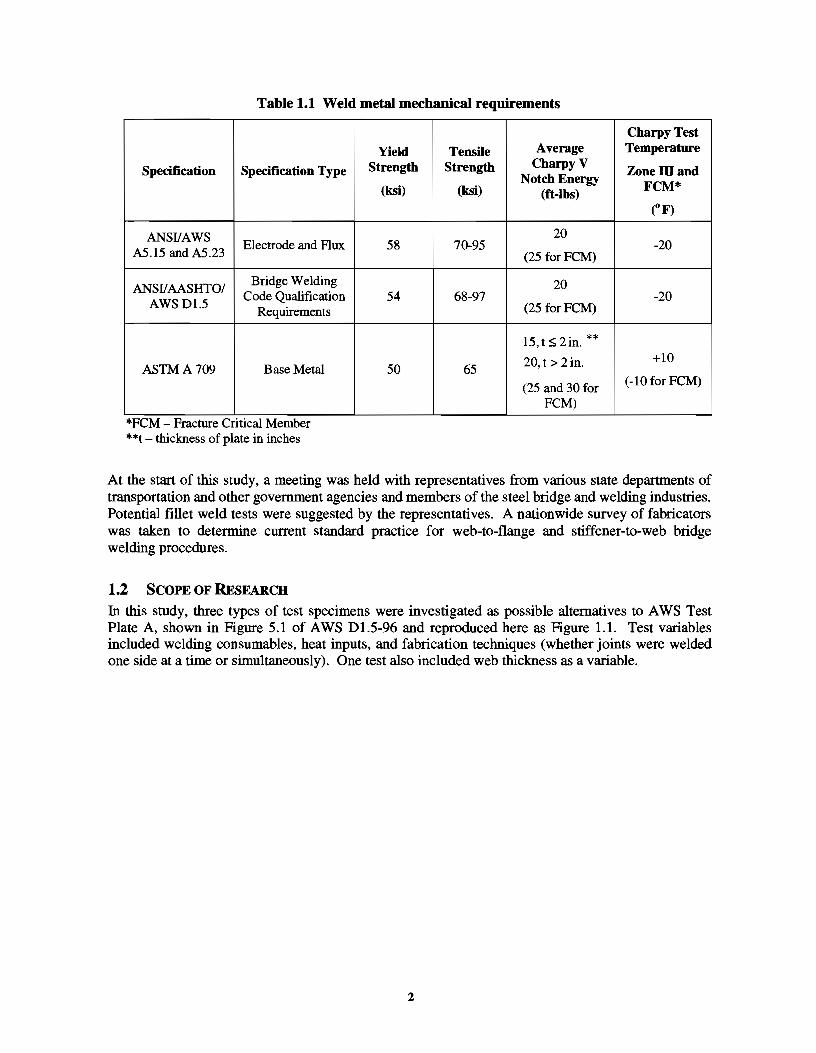
Table 1.1 Weld metal mechanical requirements
Specification Specification Type
ANSIIAWS A5.15 and A5.23
Electrode and Flux
ANSI! AASHTO/ Bridge Welding
AWSD1.5 Code Qualification
Requirements
ASTMA709 Base Metal
.. *FCM Fracture Cnttcal Member **t- thickness of plate in inches
Yield Strength
(ksi)
58
54
50
Tensile Average
Strength CharpyV
(ksi) Notch Energy
(ft-lbs)
20 70-95
(25 forFCM)
20 68-97
(25 forFCM)
15, t :5 2in. **
65 20, t > 2in.
(25 and 30 for FCM)
CharpyTest Temperature
Zonemand FCM*
~F)
-20
-20
+10
(-10 for FCM)
At the start of this study, a meeting was held with representatives from various state departments of transportation and other government agencies and members of the steel bridge and welding industries. Potential fillet weld tests were suggested by the representatives. A nationwide survey of fabricators was taken to determine current standard practice for web-to-flange and stiffener-to-web bridge welding procedures.
1.2 SCOPE OF RESEARCH
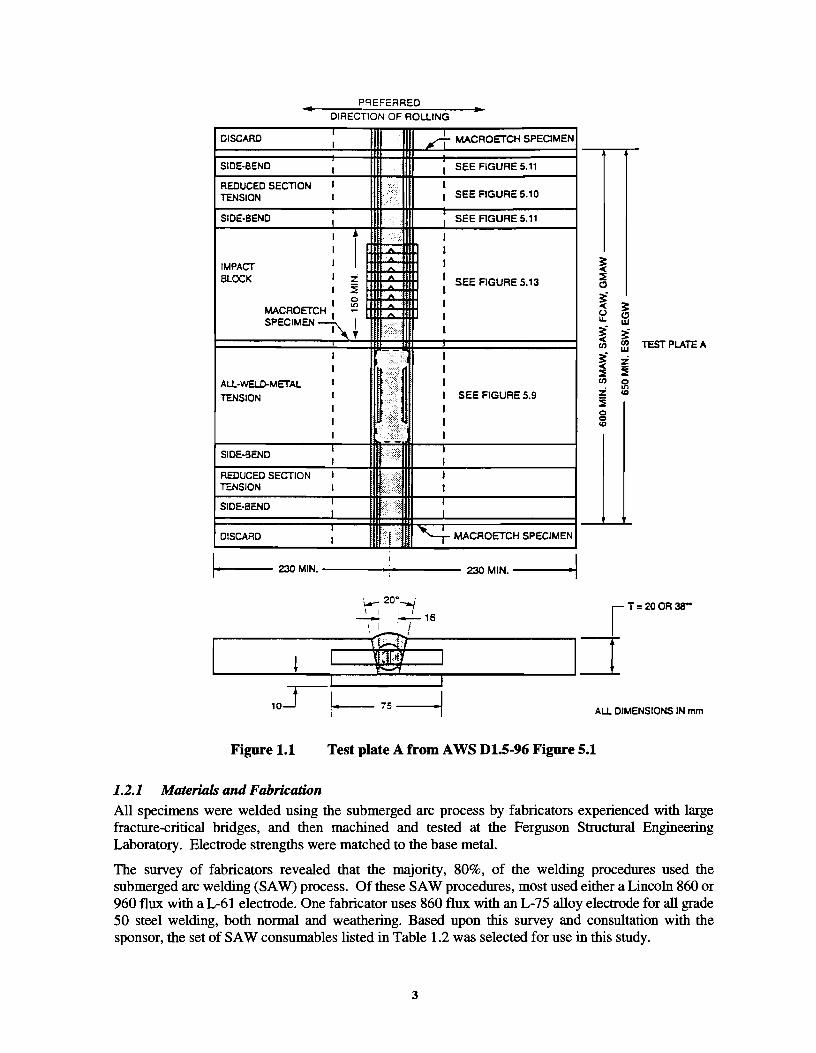
In this study, three types of test specimens were investigated as possible alternatives to AWS Test Plate A, shown in Figure 5.1 of AWS Dl.S-96 and reproduced here as Figure 1.1. Test variables included welding consumables, heat inputs, and fabrication techniques (whether joints were welded one side at a time or simultaneously). One test also included web thickness as a variable.
2
PREFERRED
DIRECTION OF ROLLING
DISCARD I A MACROETCH SPECIMEN I
SIDE·BEND I I SEE FIGURE 5.11
REDUCED SECTION I
.···········•·
I TENSION I I SEE FIGURE 5.10
SIDE-BEND I I SEE FIGURE 5.11
I i ::·;,. I I ,.. .. I I 'A
I IMPACT A ~ BLOCK I z ~ I SEE FIGURE 5.13
I ~ ~ I I 0 I
MACAO ETCH ~
SPECIMEN~ I A I
I 'f 1·<\ I
::E C!l
~ ~ u C!l u.. w
~ ~ Cl) Cl) TEST PLATE A w
I ... :.:.;.~L: I
I
<~ I
ALL·WELD-METAL I
•••••••
I
TENSION I I SEE FIGURE 5.9 I
••••••••••••••••
I I ·.>::·:·.·::::::·.::· I
~ z ::E ~ Cl) 0
z "' "' :3 0 0
"' I ... -:.-·:·:·:··:;.,
I --SIDE·3END
I ! i( I I I
REDUCED SECTION I l: I TENSION I I
SIDE-BEND I •• i)
I
I I
DISCARD I fj/ '-i- MACAOETCH SPECIMEN
f-1•--- 230 MIN.---------- 230 MIN. --------1•1 ·~ 20°--.j
~ i ....:._/ -1-6--------.,, __[ T • 20 OR 38"
l: \it': _l ALL DIMENSIONS IN mm
Figure 1.1 Test plate A from A WS D1.5-96 Figure 5.1
1.2.1 Materitzls and Fabrication All specimens were welded using the submerged arc process by fabricators experienced with large fracture-critical bridges, and then machined and tested at the Ferguson Structural Engineering Laboratory. Electrode strengths were matched to the base metal.
The survey of fabricators revealed that the majority, 80%, of the welding procedures used the submerged arc welding (SAW) process. Of these SAW procedures, most used either a Lincoln 860 or 960 flux with a L-61 electrode. One fabricator uses 860 flux with an L-75 alloy electrode for all grade 50 steel welding, both normal and weathering. Based upon this survey and consultation with the sponsor, the set of SAW consumables listed in Table 1.2 was selected for use in this study.
3
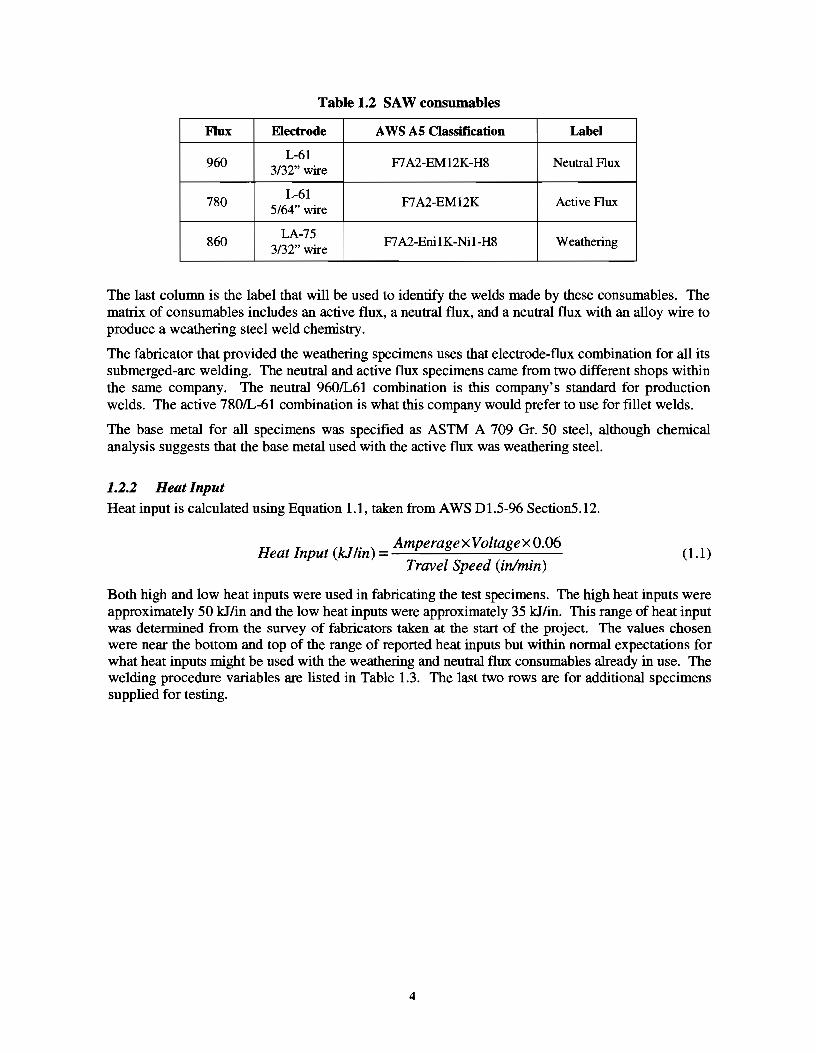
Table 1.2 SAW consumables
Flux A WS AS Classification Label
F7 A2-EM12K-H8 Neutral Flux
F7A2-EM12K Active Flux
860 F7A2-EnilK-Nil-H8 Weathering
The last column is the label that will be used to identify the welds made by these consumables. The matrix of consumables includes an active flux, a neutral flux, and a neutral flux with an alloy wire to produce a weathering steel weld chemistry.
The fabricator that provided the weathering specimens uses that electrode-flux combination for all its submerged-arc welding. The neutral and active flux specimens came from two different shops within the same company. The neutral 960/L61 combination is this company's standard for production welds. The active 780/L-61 combination is what this company would prefer to use for fillet welds.
The base metal for all specimens was specified as ASTM A 709 Gr. 50 steel, although chemical analysis suggests that the base metal used with the active flux was weathering steel.
1.2.2 Heat Input Heat input is calculated using Equation 1.1, taken from A WS D 1.5-96 SectionS .12.
u l (k.J~' ) AmperagexVoltagex0.06 ueat nput tln = -~-..::::..._ __ ___.:; __ _ Travel Speed (in/min)
(1.1)
Both high and low heat inputs were used in fabricating the test specimens. The high heat inputs were approximately 50 k:J/in and the low heat inputs were approximately 35 kJ/in. This range of heat input was detennined from the survey of fabricators taken at the start of the project. The values chosen were near the bottom and top of the range of reported heat inputs but within normal expectations for what heat inputs might be used with the weathering and neutral flux consumables already in use. The welding procedure variables are listed in Table 1.3. The last two rows are for additional specimens supplied for testing.
4
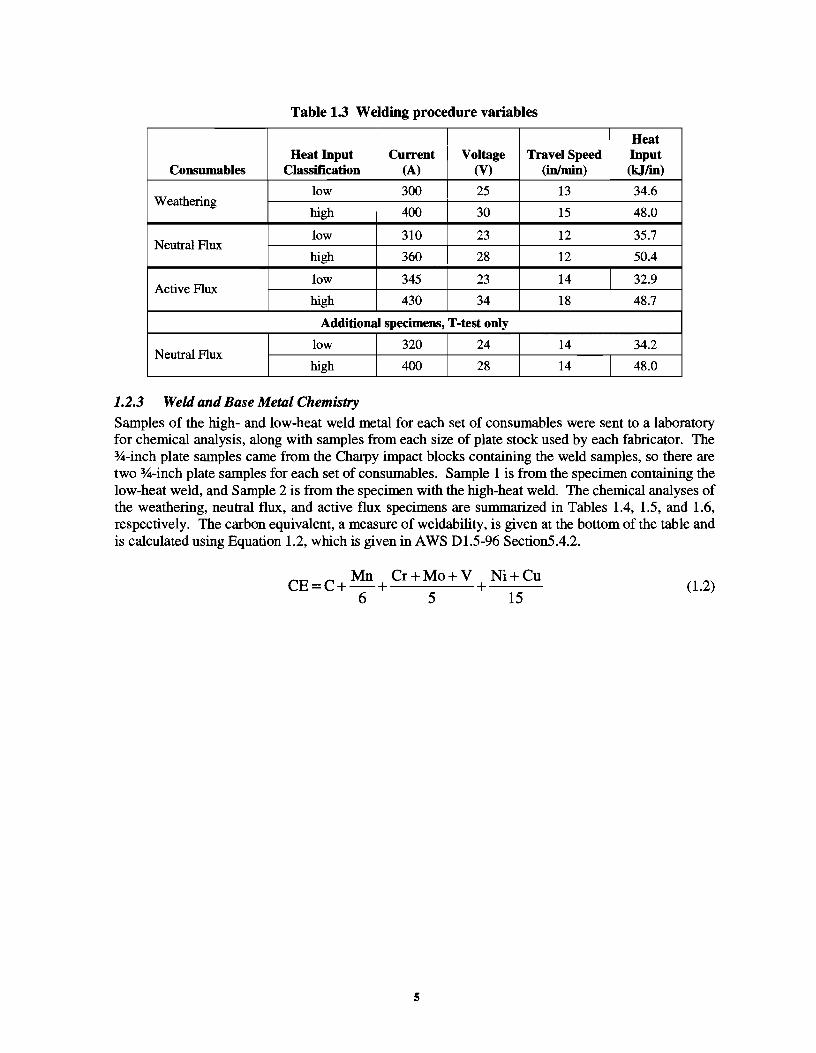
Table 1.3 Welding procedure variables
Heat Heat Input Current Voltage Travel Speed Input
Consumables Classification (A) (V) (in/min) (k.Jfm)
low 300 25 13 34.6 Weathering
high 400 30 15 48.0
low Neutral Flux
310 23 12 35.7
high 360 28 12 50.4
Active Flux low 345 23 14 32.9
high 430 34 18 48.7
Additional specimens, T-test only
low 320 Neutral Flux
24 14 34.2
high 400 28 14 48.0
1.2.3 Weld and Base Metal Chemistry Samples of the high- and low-heat weld metal for each set of consumables were sent to a laboratory for chemical analysis, along with samples from each size of plate stock used by each fabricator. The %-inch plate samples came from the Charpy impact blocks containing the weld samples, so there are two %-inch plate samples for each set of consumables. Sample 1 is from the specimen containing the low-heat weld, and Sample 2 is from the specimen with the high-heat weld. The chemical analyses of the weathering, neutral flux, and active flux specimens are summarized in Tables 1.4, 1.5, and 1.6, respectively. The carbon equivalent, a measure of weldability, is given at the bottom of the table and is calculated using Equation 1.2, which is given in AWS D1.5-96 Section5.4.2.
CE C Mn Cr+Mo+ V Ni+Cu
= +--+ +---6 5 15
(1.2)
s
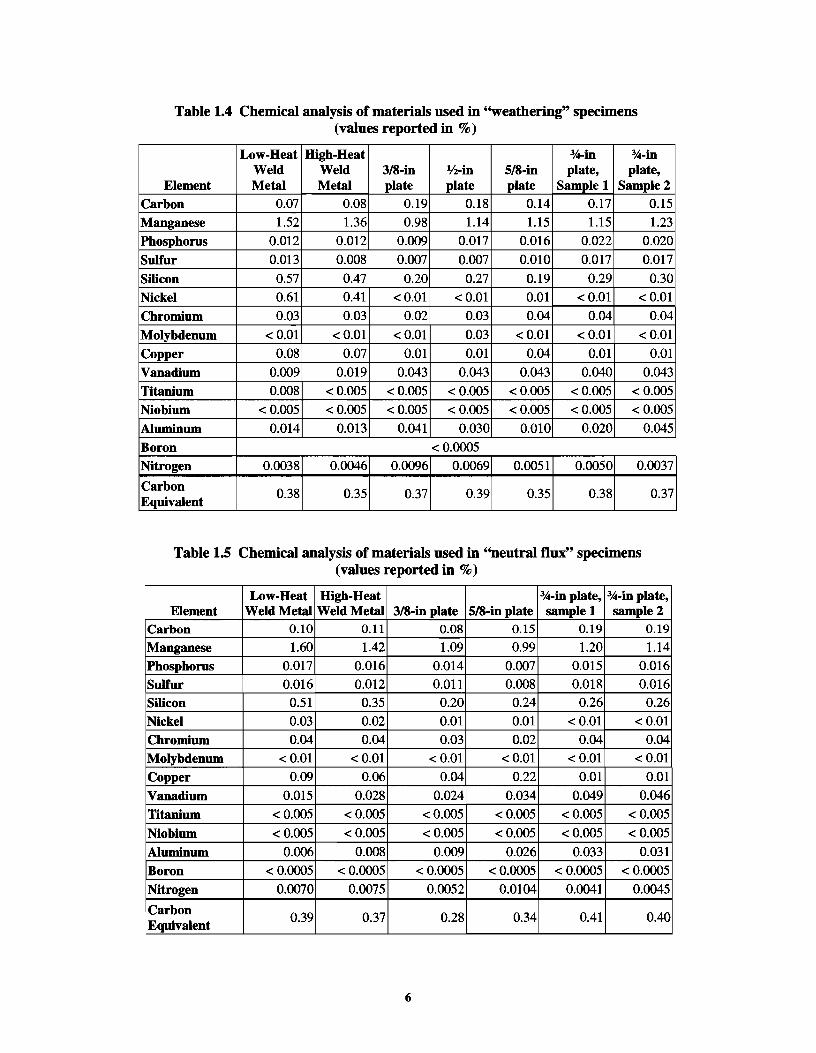
Table 1.4 Chemical analysis of materials used in ''weathering" specimens (values reported in %)
Low-Heat High-Heat ~-in ~-in
Weld Weld 3/8-in 1/z-in 5/8-in plate, plate, Element Metal Metal plate plate plate Sample 1 Sample 2
Carbon 0.07 0.08 0.19 0.18 0.14 0.17 0.15
Manganese 1.52 1.36 0.98 1.14 1.15 1.15 1.23
Phosphorus 0.012 0.012 0.009 0.017 0.016 0.022 0.020
Sulfur 0.013 0.008 0.007 0.007 0.010 0.017 0.017
Silicon 0.57 0.47 0.20 0.27 0.19 0.29 0.30
Nickel 0.61 0.41 <0.01 <0.01 0.01 <0.01 < 0.01
Chromium 0.03 0.03 0.02 0.03 0.04 0.04 0.04
Molybdenum < 0.01 <0.01 < O.Ql 0.03 < O.Ql <0.01 <0.01
Copper 0.08 0.07 0.01 0.01 0.04 0.01 0.01
Vanadium 0.009 0.019 0.043 0.043 0.043 0.040 0.043
Titanium 0.008 <0.005 <0.005 < 0.005 < 0.005 < 0.005 < 0.005
Niobium < 0.005 < 0.005 <0.005 < 0.005 < 0.005 < 0.005 < 0.005
Aluminum 0.014 0.013 0.041 0.030 0.010 0.020 0.045
Boron < 0.0005
Nitrogen 0.0038 0.0046 0.0096 0.0069 0.0051 0.0050 0.0037
Carbon 0.38 0.35 0.37 0.39 0.35 0.38 0.37 Equivalent
Table 1.5 Chemical analysis of materials used in ''neutral flux" specimens (values reported in %)
Low-Heat High-Heat ~-in plate, ~-in plate, Element Weld Metal Weld Metal 3/8-in plate 518-in plate sample 1 sample 2
Carbon 0.10 0.11 0.08 0.15 0.19 0.19
Manganese 1.60 1.42 1.09 0.99 1.20 1.14
Phosphorus 0.017 0.016 0.014 0.007 0.015 0.016
Sulfur 0.016 0.012 0.011 0.008 0.018 0.016
Silicon 0.51 0.35 0.20 0.24 0.26 0.26
Nickel 0.03 0.02 0.01 0.01 <0.01 <0.01
Chromium 0.04 0.04 0.03 0.02 0.04 0.04
Molybdenum <0.01 < 0.01 <0.01 <0.01 < 0.01 <0.01
Copper 0.09 0.06 0.04 0.22 0.01 0.01
Vanadium O.Q15 0.028 0.024 0.034 0.049 0.046
Titanium < 0.005 < 0.005 <0.005 < 0.005 < 0.005 < 0.005
Niobium < 0.005 < 0.005 < 0.005 < 0.005 < 0.005 < 0.005
Aluminum 0.006 0.008 0.009 0.026 0.033 0.031
Boron < 0.0005 < 0.0005 < 0.0005 < 0.0005 < 0.0005 < 0.0005
Nitrogen 0.0070 0.0075 0.0052 0.0104 0.0041 0.0045
Carbon 0.39 0.37 0.28 0.34 0.41 0.40
Equivalent
6
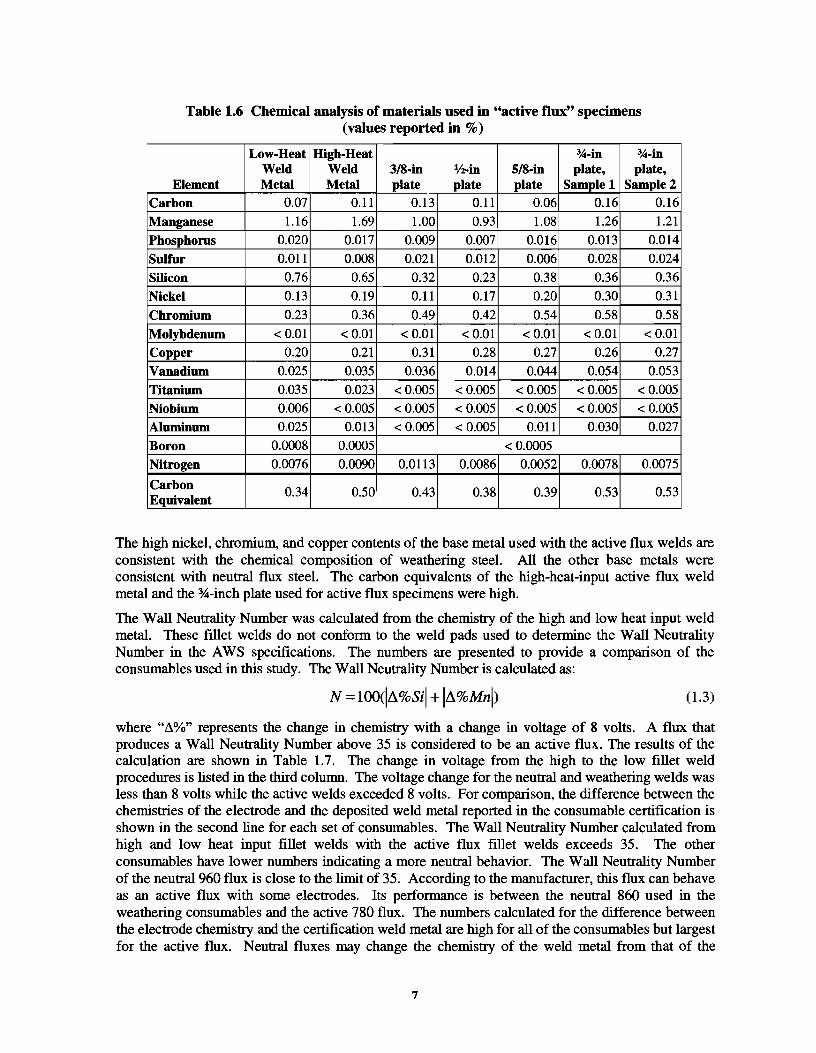
Table 1.6 Chemical analysis of materials used in "active flux" specimens (values reported in %)
Low-Heat High-Heat ~-in ~-in
Weld Weld 3/8-in lf2-in 5/8-in plate, plate, Element Metal Metal plate plate plate Sample 1 Sample2
Carbon 0.07 0.11 0.13 0.11 0.06 0.16 0.16
Manganese 1.16 1.69 1.00 0.93 1.08 1.26 1.21
Phosphorus 0.020 0.017 0.009 0.007 0.016 0.013 0.014
SuHur 0.011 0.008 0.021 0.012 0.006 0.028 0.024
Silicon 0.76 0.65 0.32 0.23 0.38 0.36 0.36
Nickel 0.13 0.19 0.11 0.17 0.20 0.30 0.31
Chromium 0.23 0.36 0.49 0.42 0.54 0.58 0.58
Molybdenum < 0.01 < 0.01 < 0.01 < 0.01 < 0.01 < 0.01 < 0.01
Copper 0.20 0.21 0.31 0.28 0.27 0.26 0.27
Vanadium 0.025 0.035 0.036 0.014 0.044 0.054 0.053
Titanium 0.035 0.023 < 0.005 < 0.005 < 0.005 < 0.005 < 0.005
Niobium 0.006 < 0.005 < 0.005 < 0.005 < 0.005 < 0.005 < 0.005
Aluminum 0.025 0.013 < 0.005 < 0.005 0.011 0.030 0.027
Boron 0.0008 0.0005 < 0.0005
Nitrogen 0.0076 0.0090 0.0113 0.0086 0.0052 0.0078 0.0075
Carbon 0.34 0.50 0.43 0.38 0.39 0.53 0.53
Equivalent
The high nickel, chromium, and copper contents of the base metal used with the active flux welds are consistent with the chemical composition of weathering steel. All the other base metals were consistent with neutral flux steel. The carbon equivalents of the high-heat-input active flux weld metal and the %-inch plate used for active flux specimens were high.
The Wall Neutrality Number was calculated from the chemistry of the high and low heat input weld metal. These fillet welds do not conform to the weld pads used to determine the Wall Neutrality Number in the A WS specifications. The numbers are presented to provide a comparison of the consumables used in this study. The Wall Neutrality Number is calculated as:
(1.3)
where "~%" represents the change in chemistry with a change in voltage of 8 volts. A flux that produces a Wall Neutrality Number above 35 is considered to be an active flux. The results of the calculation are shown in Table 1. 7. The change in voltage from the high to the low fillet weld procedures is listed in the third column. The voltage change for the neutral and weathering welds was less than 8 volts while the active welds exceeded 8 volts. For comparison, the difference between the chemistries of the electrode and the deposited weld metal reported in the consumable certification is shown in the second line for each set of consumables. The Wall Neutrality Number calculated from high and low heat input fillet welds with the active flux fillet welds exceeds 35. The other consumables have lower numbers indicating a more neutral behavior. The Wall Neutrality Number of the neutral 960 flux is close to the limit of 35. According to the manufacturer, this flux can behave as an active flux with some electrodes. Its performance is between the neutral 860 used in the weathering consumables and the active 780 flux. The numbers calculated for the difference between the electrode chemistry and the certification weld metal are high for all of the consumables but largest for the active flux. Neutral fluxes may change the chemistry of the weld metal from that of the
7
electrode but should maintain this chemistry when the voltage is changed. The voltage change specified in the standard Wall Neutrality Number test is 8 volts.
Table 1. 7 Evaluation of Wall Neutrality Number
Voltage Wall
Weld Type Source Neutrality Change
Number
Fillet 5 34 Neutral Flux
Certification NA 49
Fillet 11 64 Active Flux
Certificatio NA 93
Fillet 5 26 Weathering
Certification NA 76
1.2.4 Welding Method Some of the test specimens had fillet welds on opposite sides of a plate, similar to a stiffener-to-web or web-to-flange weld. The welds can be made one side at a time, or on both sides simultaneously using an opposing arc system such as a Dart Welder. The welds made on one side at a time will be referred to as single-sided and the welds made on both sides simultaneously (without offsetting the opposing electrodes from one another along the axis of the weld) will be referred to as dart-welded. Dart welding increases the total heat input to the welded area, so it should have a similar effect to that of higher heat input, unless the plate between the opposing arcs is thick enough to prevent their interaction.
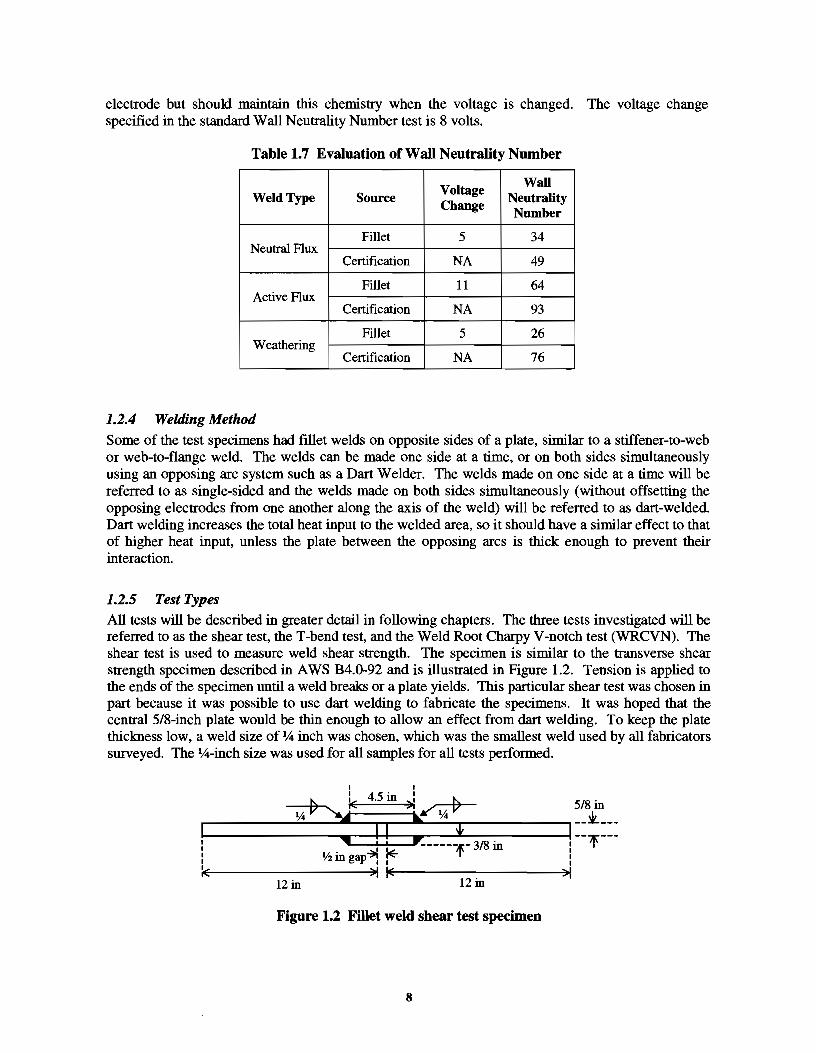
1.2.5 Test Types All tests will be described in greater detail in following chapters. The three tests investigated will be referred to as the shear test, the T -bend test, and the Weld Root Charpy V -notch test (WRCVN). The shear test is used to measure weld shear strength. The specimen is similar to the transverse shear strength specimen described in AWS B4.0-92 and is illustrated in Figure 1.2. Tension is applied to the ends of the specimen until a weld breaks or a plate yields. This particular shear test was chosen in part because it was possible to use dart welding to fabricate the specimens. It was hoped that the central 5/8-inch plate would be thin enough to allow an effect from dart welding. To keep the plate thickness low, a weld size of ~ inch was chosen, which was the smallest weld used by all fabricators surveyed. The ~-inch size was used for all samples for all tests performed.
I I I 45 • I
1A ~ ~OE · m >l~,.r 1A ~ 5/8 in r-----_.;..;. __ .__'"T'"T---~-~-r------..., __ :} ___ _ 1-------_.--H! !-----li:------11
1--T---
Yl in ~ap~ j-E- ------tf- 3/8 in ! T
~----------------~ ~K------------------~>1 12 in 12 in
Figure 1.2 Fillet weld shear test specimen
8
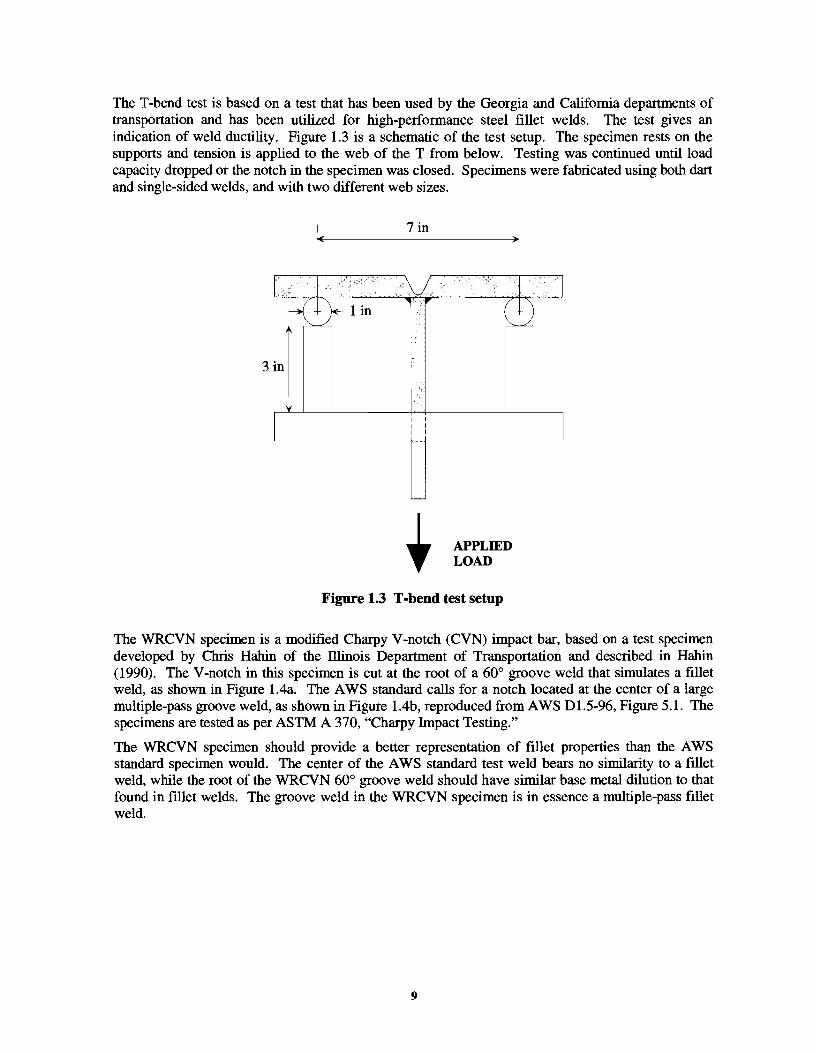
The T -bend test is based on a test that has been used by the Georgia and California departments of transportation and has been utilized for high-performance steel fillet welds. The test gives an indication of weld ductility. Figure 1.3 is a schematic of the test setup. The specimen rests on the supports and tension is applied to the web of the T from below. Testing was continued until load capacity dropped or the notch in the specimen was closed. Specimens were fabricated using both dart and single-sided welds, and with two different web sizes.
I
3 in
I
m
\J :0-lin
I I I I I I
-
0l
APPLIED LOAD
Figure 1.3 T-bend test setup
I
I
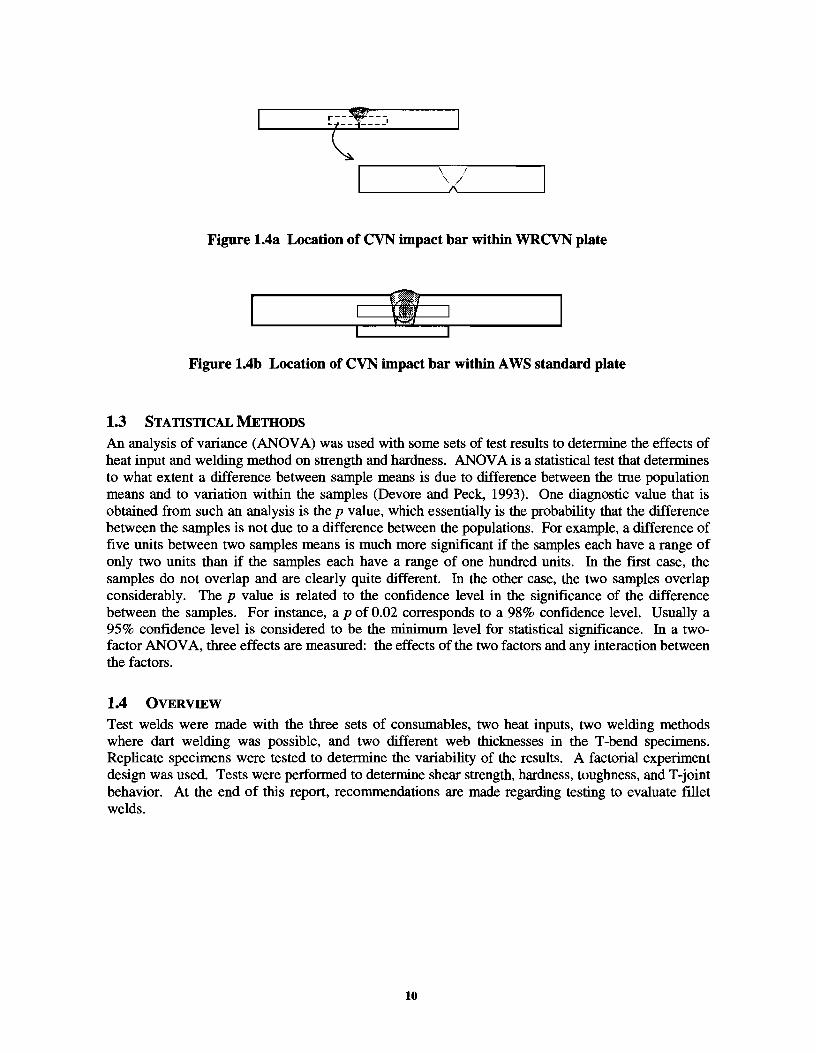
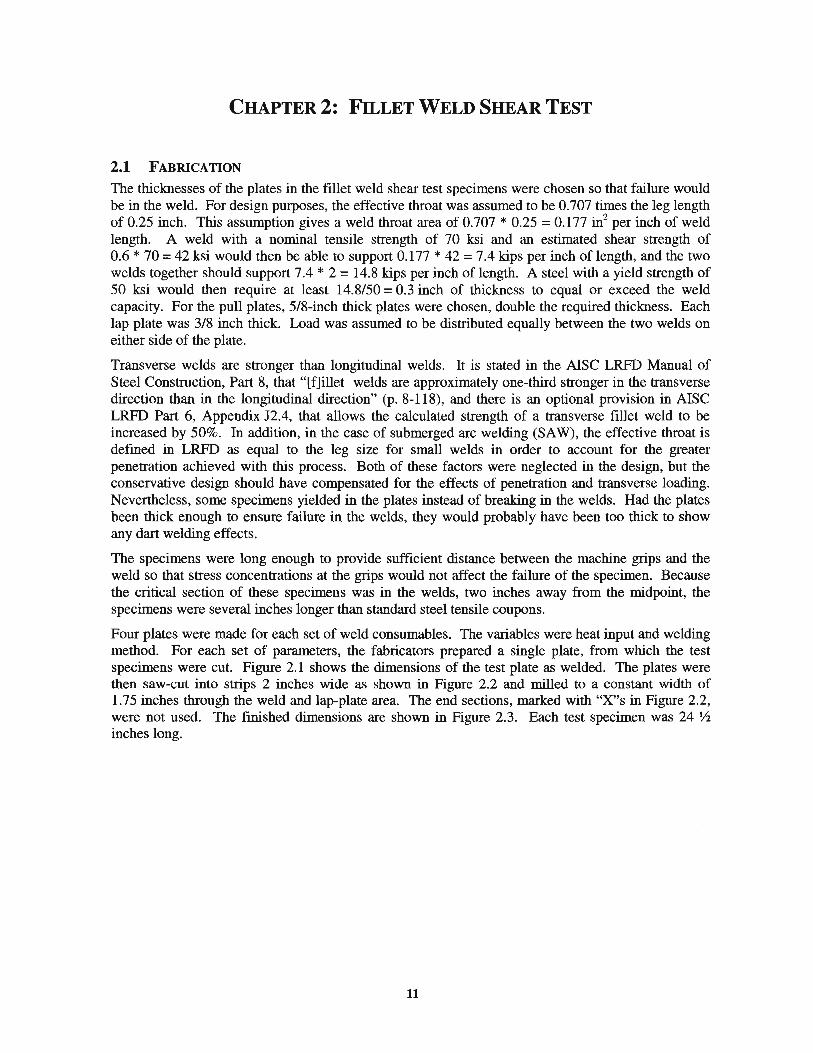
The WRCVN specimen is a modified Charpy V-notch (CVN) impact bar, based on a test specimen developed by Chris Hahin of the illinois Department of Transportation and described in Hahin (1990). The V-notch in this specimen is cut at the root of a 60° groove weld that simulates a fillet weld, as shown in Figure 1.4a. The A WS standard calls for a notch located at the center of a large multiple-pass groove weld, as shown in Figure 1.4b, reproduced from A WS Dl.5-96, Figure 5.1. The specimens are tested as per ASTM A 370, "Charpy Impact Testing."
The WRCVN specimen should provide a better representation of fillet properties than the A WS standard specimen would. The center of the A WS standard test weld bears no similarity to a fillet weld, while the root of the WRCVN 60° groove weld should have similar base metal dilution to that found in fillet welds. The groove weld in the WRCVN specimen is in essence a multiple-pass fillet weld.
9
I \ ·, /
~--------~A~------~
Figure 1.4a Location of CVN impact bar within WRCVN plate
Figure 1.4b Location of CVN impact bar within A WS standard plate
1.3 STATISTICAL METHODS
An analysis of variance (ANOV A) was used with some sets of test results to determine the effects of heat input and welding method on strength and hardness. ANOV A is a statistical test that determines to what extent a difference between sample means is due to difference between the true population means and to variation within the samples (Devore and Peck. 1993). One diagnostic value that is obtained from such an analysis is the p value, which essentially is the probability that the difference between the samples is not due to a difference between the populations. For example, a difference of five units between two samples means is much more significant if the samples each have a range of only two units than if the samples each have a range of one hundred units. In the first case, the samples do not overlap and are clearly quite different. In the other case, the two samples overlap considerably. The p value is related to the confidence level in the significance of the difference between the samples. For instance, a p of 0.02 corresponds to a 98% confidence level. Usually a 95% confidence level is considered to be the minimum level for statistical significance. In a twofactor ANOV A, three effects are measured: the effects of the two factors and any interaction between the factors.
1.4 OVERVIEW
Test welds were made with the three sets of consumables, two heat inputs, two welding methods where dart welding was possible, and two different web thicknesses in the T -bend specimens. Replicate specimens were tested to determine the variability of the results. A factorial experiment design was used. Tests were performed to determine shear strength, hardness, toughness, and T-joint behavior. At the end of this report, recommendations are made regarding testing to evaluate fillet welds.
10
CHAPTER 2: FILLET WELD SHEAR TEST
2.1 FABRICATION
The thicknesses of the plates in the fillet weld shear test specimens were chosen so that failure would be in the weld. For design purposes, the effective throat was assumed to be 0.707 times the leg length of 0.25 inch. This assumption gives a weld throat area of 0.707 * 0.25 = 0.177 in2 per inch of weld length. A weld with a nominal tensile strength of 70 ksi and an estimated shear strength of 0.6 * 70 = 42 ksi would then be able to support 0.177 * 42 = 7.4 kips per inch of length, and the two welds together should support 7.4 * 2 = 14.8 kips per inch of length. A steel with a yield strength of 50 ksi would then require at least 14.8/50 = 0.3 inch of thickness to equal or exceed the weld capacity. For the pull plates, 5/8-inch thick plates were chosen, double the required thickness. Each lap plate was 3/8 inch thick. Load was assumed to be distributed equally between the two welds on either side of the plate.
Transverse welds are stronger than longitudinal welds. It is stated in the AISC LRFD Manual of Steel Construction, Part 8, that "[f]illet welds are approximately one-third stronger in the transverse direction than in the longitudinal direction" (p. 8-118), and there is an optional provision in AISC LRFD Part 6, Appendix 12.4, that allows the calculated strength of a transverse fillet weld to be increased by 50%. In addition, in the case of submerged arc welding (SAW), the effective throat is defined in LRFD as equal to the leg size for small welds in order to account for the greater penetration achieved with this process. Both of these factors were neglected in the design, but the conservative design should have compensated for the effects of penetration and transverse loading. Nevertheless, some specimens yielded in the plates instead of breaking in the welds. Had the plates been thick enough to ensure failure in the welds, they would probably have been too thick to show any dart welding effects.
The specimens were long enough to provide sufficient distance between the machine grips and the weld so that stress concentrations at the grips would not affect the failure of the specimen. Because the critical section of these specimens was in the welds, two inches away from the midpoint, the specimens were several inches longer than standard steel tensile coupons.
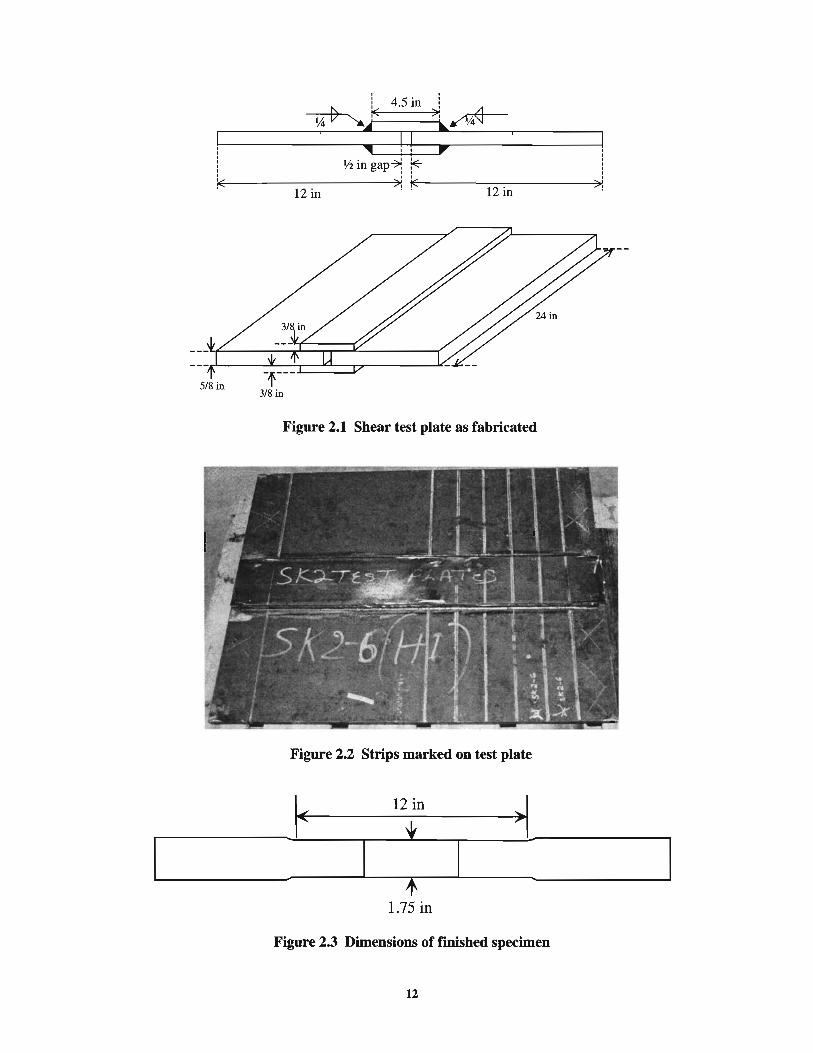
Four plates were made for each set of weld consumables. The variables were heat input and welding method. For each set of parameters, the fabricators prepared a single plate, from which the test specimens were cut. Figure 2.1 shows the dimensions of the test plate as welded. The plates were then saw-cut into strips 2 inches wide as shown in Figure 2.2 and milled to a constant width of 1.75 inches through the weld and lap-plate area. The end sections, marked with "X"s in Figure 2.2, were not used. The finished dimensions are shown in Figure 2.3. Each test specimen was 24 'h inches long.
11
l 4.5in l ..-A-~~( ·~..--14~
~ ! ! ~ I
'12 in gap~ ~ I I I I
~----------------~ ~------~~--------~ 12 in 12 in
3/8 in
Figure 2.1 Shear test plate as fabricated
Figure 2.2 Strips marked on test plate
12 in ~I
1.75 in
Figure 2.3 Dimensions of finished specimen
12
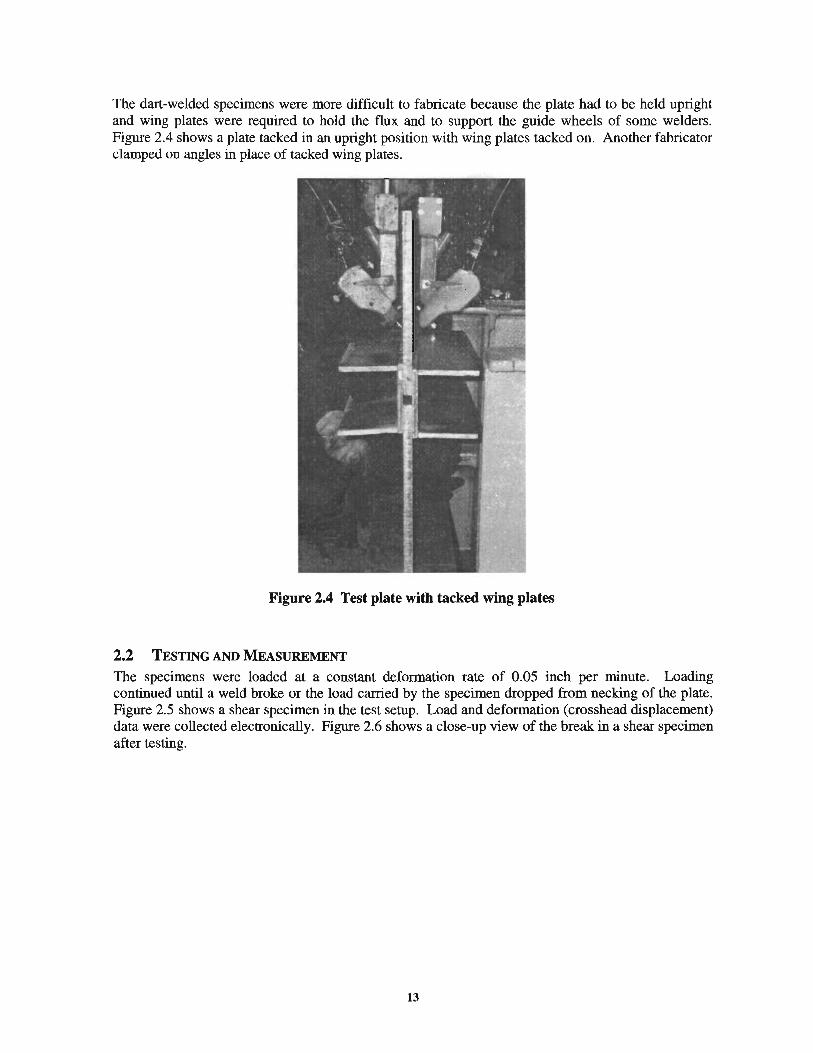
The dart -welded specimens were more difficult to fabricate because the plate had to be held upright and wing plates were required to hold the flux and to support the guide wheels of some welders. Figure 2.4 shows a plate tacked in an upright position with wing plates tacked on. Another fabricator clamped on angles in place of tacked wing plates.
Figure 2.4 Test plate with tacked wing plates
2.2 TESTING AND MEASUREMENT
The specimens were loaded at a constant deformation rate of 0.05 inch per minute. Loading continued until a weld broke or the load carried by the specimen dropped from necking of the plate. Figure 2.5 shows a shear specimen in the test setup. Load and deformation (crosshead displacement) data were collected electronically. Figure 2.6 shows a close-up view of the break in a shear specimen after testing.
13
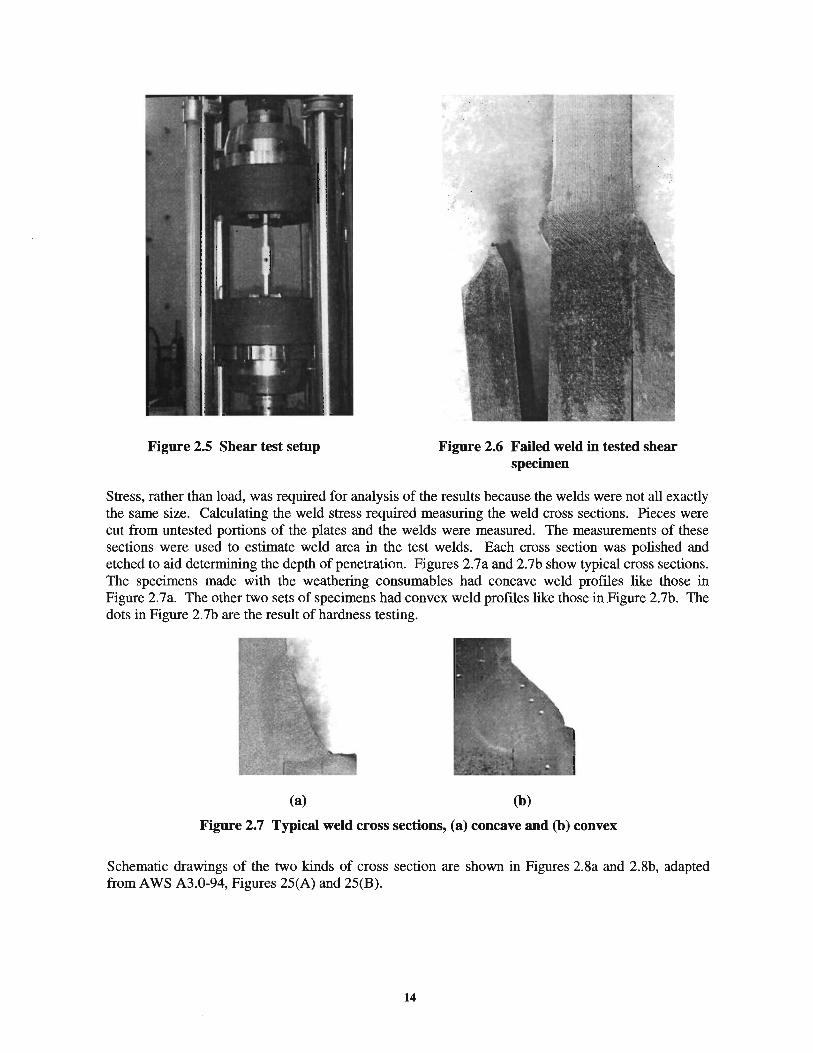
Figure 2.5 Shear test setup Figure 2.6 Failed weld in tested shear specimen
Stress, rather than load, was required for analysis of the results because the welds were not all exactly the same size. Calculating the weld stress required measuring the weld cross sections. Pieces were cut from untested portions of the plates and the welds were measured. The measurements of these sections were used to estimate weld area in the test welds. Each cross section was polished and etched to aid determining the depth of penetration. Figures 2.7a and 2.7b show typical cross sections. The specimens made with the weathering consumables had concave weld proftles like those in Figure 2.7a. The other two sets of specimens had convex weld profiles like those in Figure 2.7b. The dots in Figure 2. 7b are the result of hardness testing.
(a) (b)
Figure 2.7 Typical weld cross sections, (a) concave and (b) convex
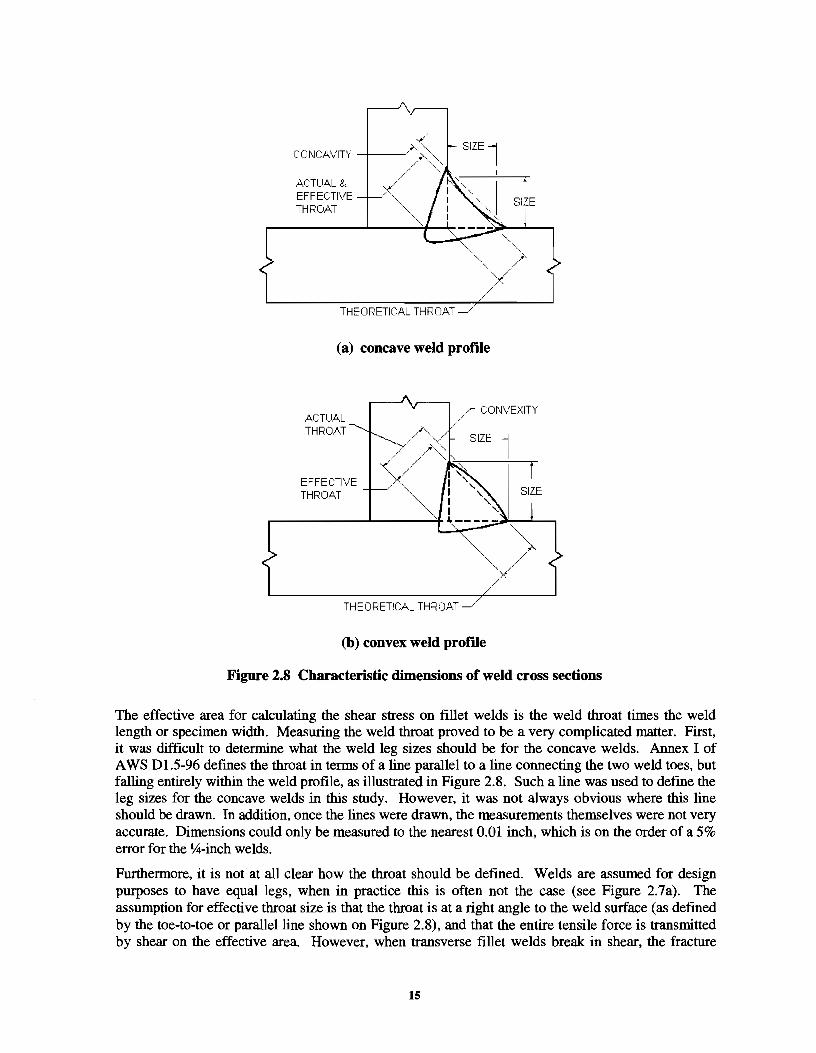
Schematic drawings of the two kinds of cross section are shown in Figures 2.8a and 2.8b, adapted from A WS A3.0-94, Figures 25(A) and 25(B).
14
COf'JCAVITY -+---'
ACTU.A1 & EFFECTIVE THROAT
THEORETICAL THROAT _ _/
(a) concave weld profile
l
ACTUAL THROAT
///" CONVEXITY
SIZE I EFFECTIVE THRO.A.T
THEORETICAL THROAT_/
(b) convex weld profile
Figure 2.8 Characteristic dimensions of weld cross sections
The effective area for calculating the shear stress on fillet welds is the weld throat times the weld length or specimen width. Measuring the weld throat proved to be a very complicated matter. First, it was difficult to determine what the weld leg sizes should be for the concave welds. Annex I of AWS D1.5-96 defmes the throat in terms of a line parallel to a line connecting the two weld toes, but falling entirely within the weld profile, as illustrated in Figure 2.8. Such a line was used to defme the leg sizes for the concave welds in this study. However, it was not always obvious where this line should be drawn. In addition, once the lines were drawn, the measurements themselves were not very accurate. Dimensions could only be measured to the nearest 0.01 inch, which is on the order of a 5% error for the ~-inch welds.
Furthermore, it is not at all clear how the throat should be defmed. Welds are assumed for design purposes to have equal legs, when in practice this is often not the case (see Figure 2.7a). The assumption for effective throat size is that the throat is at a right angle to the weld surface (as defmed by the toe-to-toe or parallel line shown on Figure 2.8), and that the entire tensile force is transmitted by shear on the effective area. However, when transverse fillet welds break in shear, the fracture
15
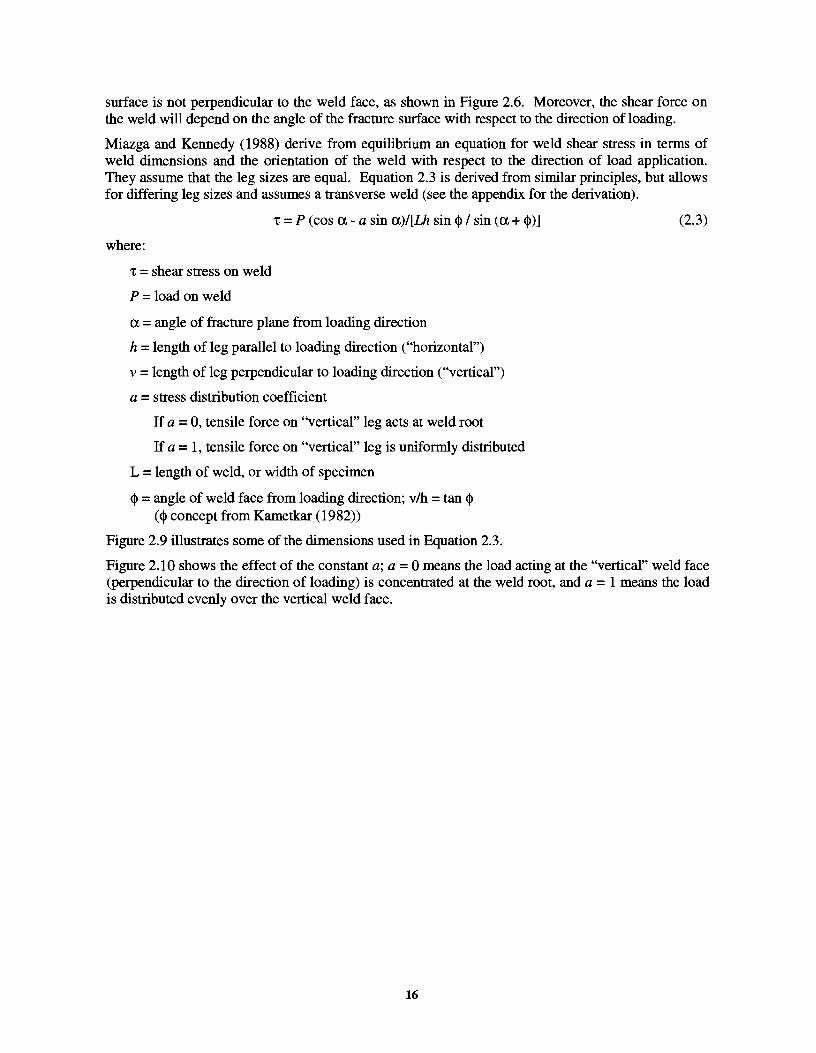
surface is not perpendicular to the weld face, as shown in Figure 2.6. Moreover, the shear force on the weld will depend on the angle of the fracture surface with respect to the direction of loading.
Miazga and Kennedy (1988) derive from equilibrium an equation for weld shear stress in terms of weld dimensions and the orientation of the weld with respect to the direction of load application. They assume that the leg sizes are equal. Equation 2.3 is derived from similar principles, but allows for differing leg sizes and assumes a transverse weld (see the appendix for the derivation).
where:
't = shear stress on weld
P = load on weld
't = P (cos a- a sin a)/[I.h sin <1> I sin (a+<!>)]
a = angle of fracture plane from loading direction
h = length of leg parallel to loading direction ("horizontal")
v = length of leg perpendicular to loading direction ("vertical")
a = stress distribution coefficient
If a = 0, tensile force on "vertical" leg acts at weld root
If a = 1, tensile force on "vertical" leg is uniformly distributed
L = length of weld, or width of specimen
<1> = angle of weld face from loading direction; vlh = tan <1>
(<I> concept from Kametkar (1982))
Figure 2.9 illustrates some of the dimensions used in Equation 2.3.
(2.3)
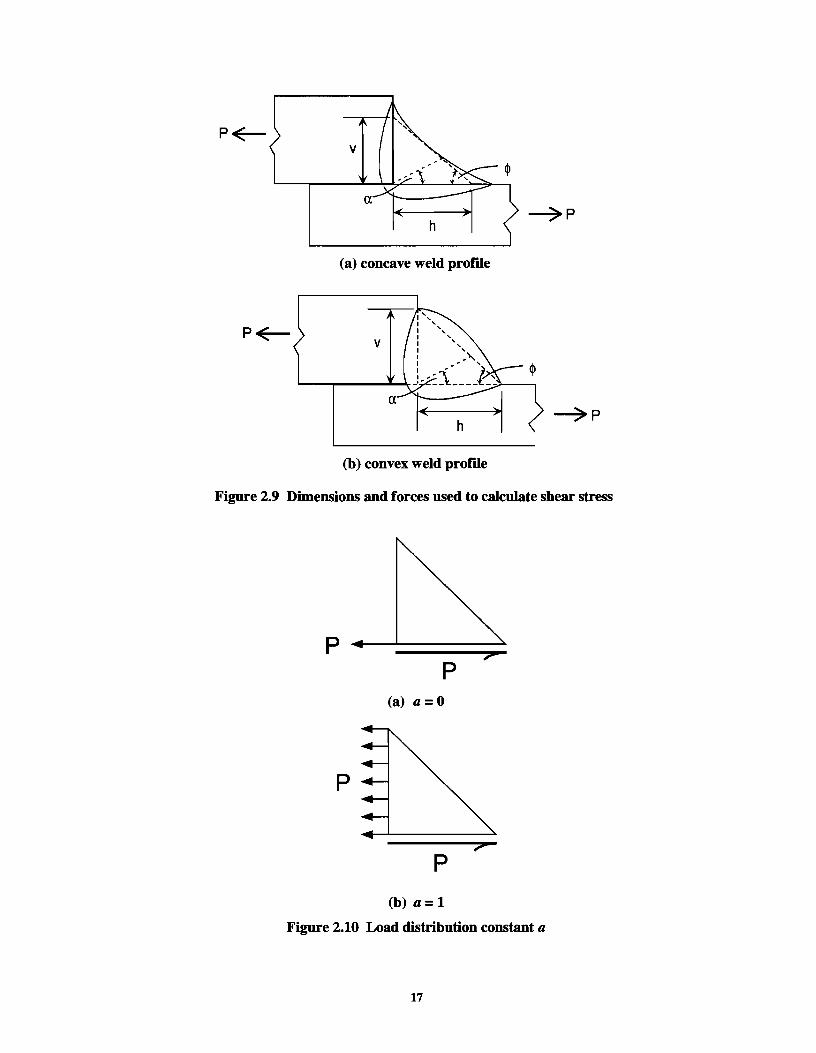
Figure 2.10 shows the effect of the constant a; a = 0 means the load acting at the "vertical" weld face (perpendicular to the direction of loading) is concentrated at the weld root, and a = 1 means the load is distributed evenly over the vertical weld face.
16
p~ v
~p
(a) concave weld profile
p~ v
~p
(b) convex weld profile
Figure 2.9 Dimensions and forces used to calculate shear stress
p p
(a) a= 0
p
p
(b)a=l
Figure 2.10 Load distribution constant a
17
The angle a at which 't reaches a maximum should be the failure angle. For a :5: 45°, 't is highest for a= 0 and lowest for a= 1. If equal legs of length d (h = v =d), a fracture angle a of 45°, and a= 0 are all assumed, then Equation 2.3 gives shear stress 't = P/Ld, where d is leg length, not throat. Under the standard design assumption, shear stress is calculated as P/Lx, where xis effective throat length. The throat is defmed at a 45° angle to the legs, so shear stress is PI(Ld sin 45°). It then appears that the standard assumption overestimates the shear stress by a factor of 1/sin 45°, or 1.41, even if it is appropriate to assume a fracture angle of 45°. However, for equal leg lengths and a= 0, shear stress 't reaches a maximum at a fracture angle a of 22.5°, not 45°. This angle is in fact much closer to actual weld fracture behavior, as was shown in Figure 2.6. For this smaller fracture angle, 't = P cos 22.5° sin 67.5°/(Ld sin 45°) = P cos2 22.5°/(Ld sin 45°). Under the standard assumption, shear stress is overestimated by a factor of 1/cos2 22.5°, or 1.17. If the SAW provision for effective throat in LRFD is used, the shear stress is underestimated by a factor of sin 45°/cos2 22.5°, or 0.83.
Miazga and Kennedy empirically determined that the value for the stress distribution factor a should be 0.345. However, their study had only equal-leg welds. They did not report weld process either in their own experiment or in the data from their literature survey, but the process was probably not SAW. There is no reason to assume that this value should be appropriate for unequal-leg welds or for different welding processes. Values of a= 0, 0.345, and 1 were considered in evaluating the data from this study. The best fit of predicted to measured weld parameters (fracture surface angle and length) appears to be a = 0. Choosing a = 0 also gives the best correlation of weld strength to the weld hardness results. Therefore, this value was used in all stress calculations. However, the difficulty in determining the value of a should be considered another source of uncertainty in the stress calculations. The size of the welds is an additional uncertainty.
As an example, consider a nominal %-inch weld of length L = 1.702 inches, with leg sizes h = 0.29 inch and v = 0.33 inch, and carrying a load P of 35.2 kips. cjl = tan-1(v/h) = 0.850 rad. The value of a is assumed to be zero. The value of a used in calculating 'tin Equation 2.3 is a maximum at 0.350 rad, or 20.1 o. At this fracture angle, the shear stress is calculated as
't = 35.2 cos(0.350)/[1.702 * 0.29 sin(0.850)/sin(0.350 + 0.850)] = 88.4 ksi.
The shear stress based on an assumed 45° throat, the normal design assumption, would be P/(0.707*Ld), where dis the smaller of the leg sizes hand v. For the example under consideration, 't = 35.2/(0.707 * 1.702* 0.29) = 101 ksi, 14% higher than 't calculated using Equation 2.3. The shear stress based on an assumed throat equal to the leg size would be P/Ld, where d is the smaller of the leg sizes hand v. For the example under consideration, 't = 35.2/1.702* 0.29 = 71.3 ksi, 19% lower than 't calculated using Equation 2.3.
Rockwell B hardness tests of the welds provided an estimate of the weld metal strength. Two welds were tested from each plate, with three points tested per weld, for a total of six readings per plate. Hardness correlates with strength; the correspondences can be found in ASTM A 370, Table 2B.
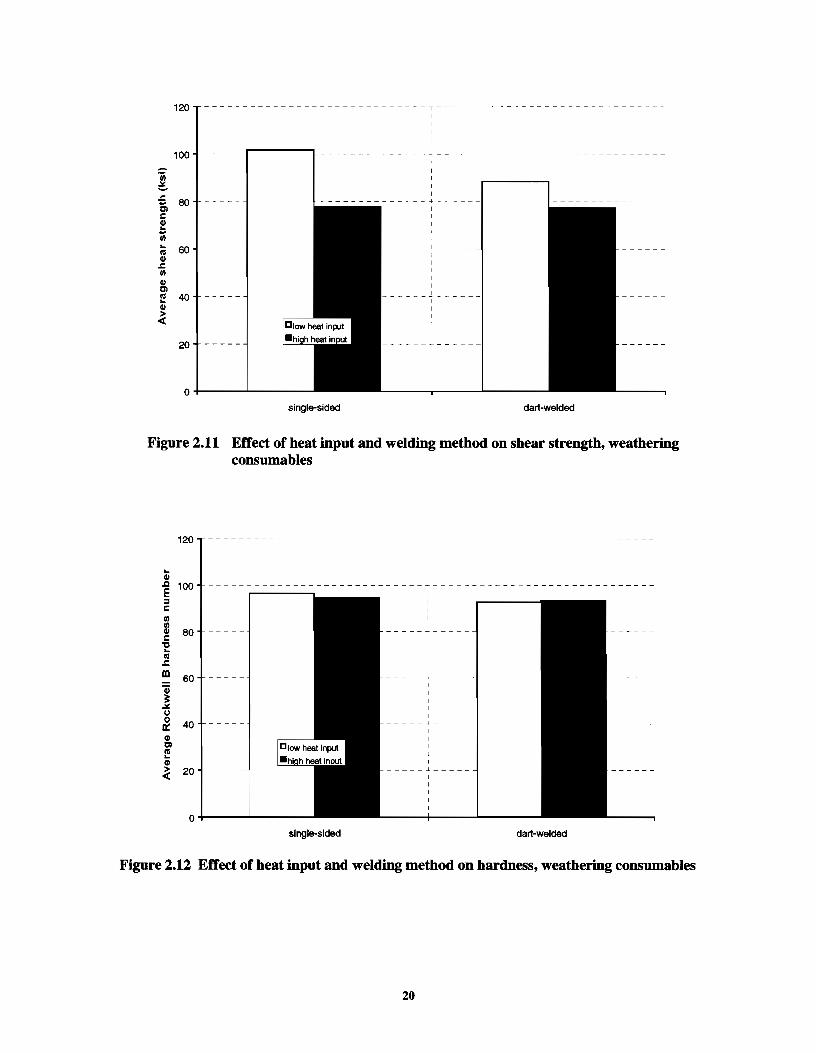
An A WS test plate was welded at each of the two heat inputs for the weathering consumables. Allweld-metal tension specimens were made from these test plates as per AWS 01.5-96 Figures 5.1 and 5.9 and tested in accordance with ASTM A 370.
2.3 RESULTS AND ANALYSIS
2.3.1 Weathering Consumables Most of the specimens welded one side at a time at high heat input yielded in the base metal instead of fracturing in the weld. The capacities of the welds were thus higher than those calculated based on the failure load. The stress in the smallest weld-the highest of the stresses in the four welds-was
18
used to represent the weld stress in these specimens at maximum load. However, weld fractures did not always occur in the weld with the smallest effective area in the other specimens. Failed welds were up to 14% larger than the smallest weld in the same specimen. The calculated stresses represent a lower-bound strength estimate of the weld.
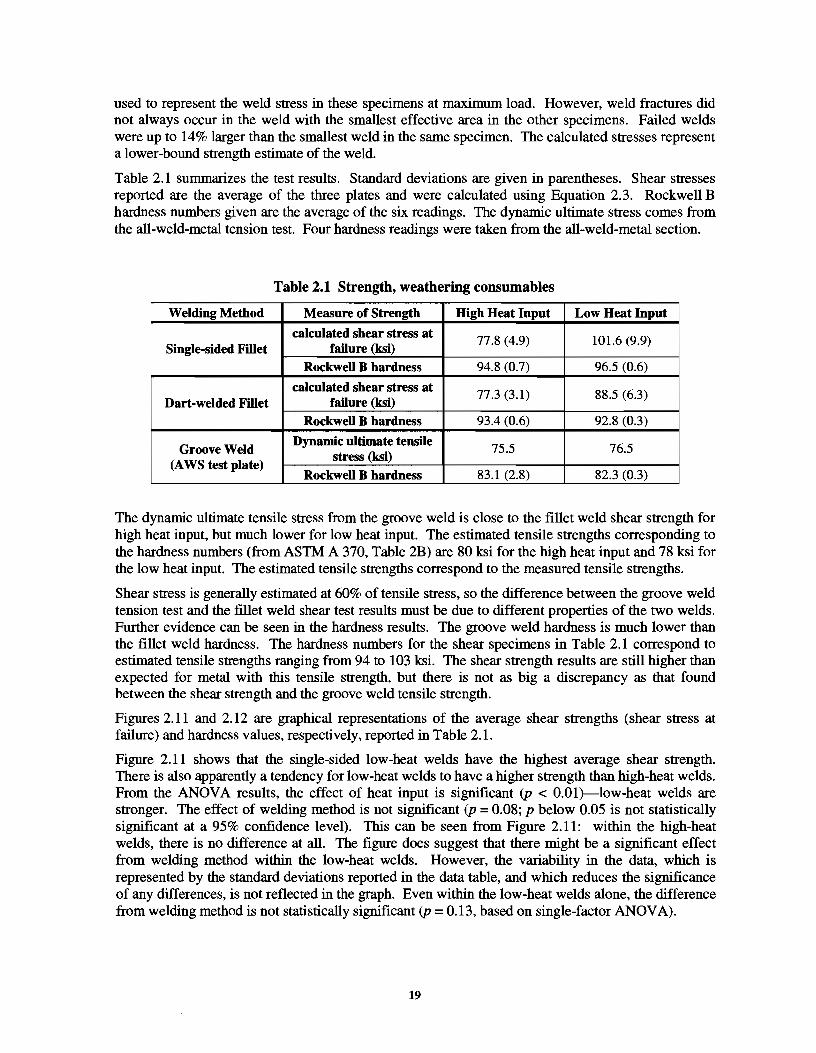
Table 2.1 summarizes the test results. Standard deviations are given in parentheses. Shear stresses reported are the average of the three plates and were calculated using Equation 2.3. Rockwell B hardness numbers given are the average of the six readings. The dynamic ultimate stress comes from the all-weld-metal tension test. Four hardness readings were taken from the all-weld-metal section.
Table 2.1 Strength, weathering consumables
Welding Method Measure of Strength High Heat Input Low Heat Input
calculated shear stress at 77.8 (4.9) 101.6 (9.9) Single-sided Fillet failure (ksi)
RockweU B hardness 94.8 (0.7) 96.5 (0.6)
calculated shear stress at 77.3 (3.1) 88.5 (6.3) Dart-welded Fillet failure (ksi)
RockweU B hardness 93.4 (0.6) 92.8 (0.3)
Groove Weld Dynamic ultimate tensile
75.5 76.5 (A WS test plate)
stress (ksi)
RockweU B hardness 83.1 (2.8) 82.3 (0.3)
The dynamic ultimate tensile stress from the groove weld is close to the fillet weld shear strength for high heat input, but much lower for low heat input. The estimated tensile strengths corresponding to the hardness numbers (from ASTM A 370, Table 2B) are 80 ksi for the high heat input and 78 ksi for the low heat input. The estimated tensile strengths correspond to the measured tensile strengths.
Shear stress is generally estimated at 60% of tensile stress, so the difference between the groove weld tension test and the fillet weld shear test results must be due to different properties of the two welds. Further evidence can be seen in the hardness results. The groove weld hardness is much lower than the fillet weld hardness. The hardness numbers for the shear specimens in Table 2.1 correspond to estimated tensile strengths ranging from 94 to 103 ksi. The shear strength results are still higher than expected for metal with this tensile strength, but there is not as big a discrepancy as that found between the shear strength and the groove weld tensile strength.
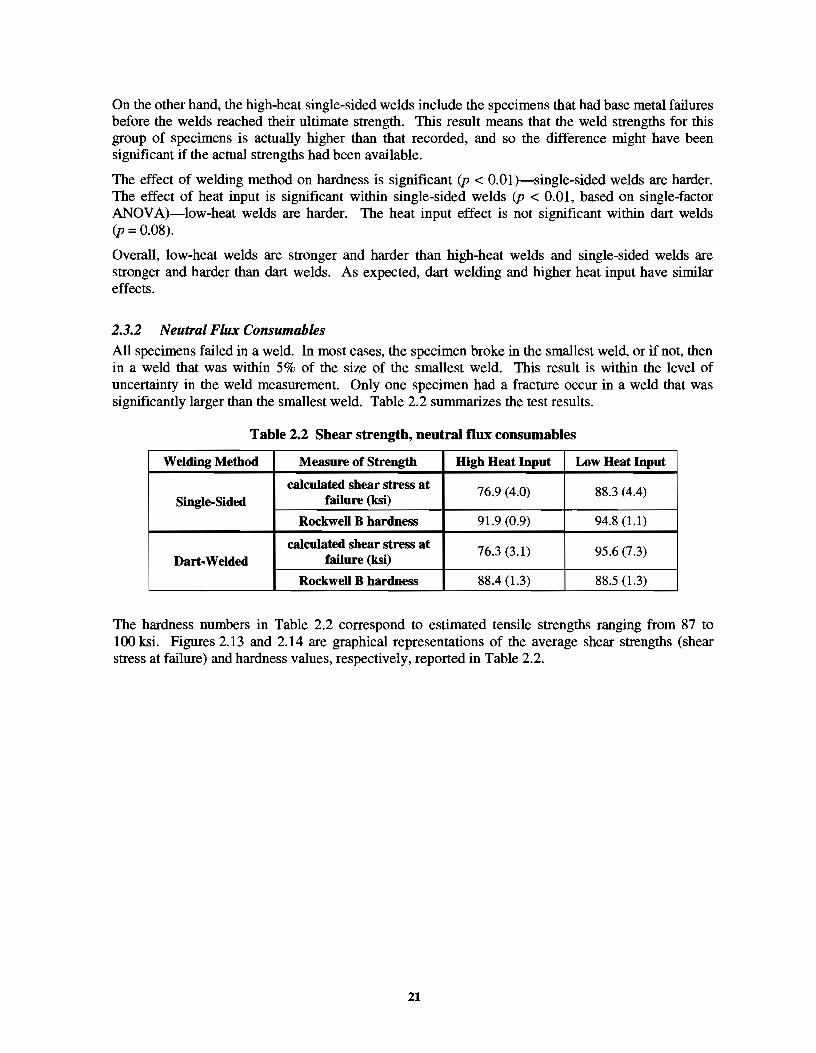
Figures 2.11 and 2.12 are graphical representations of the average shear strengths (shear stress at failure) and hardness values, respectively, reported in Table 2.1.
Figure 2.11 shows that the single-sided low-heat welds have the highest average shear strength. There is also apparently a tendency for low-heat welds to have a higher strength than high-heat welds. From the ANOV A results, the effect of heat input is significant (p < 0.01)-low-heat welds are stronger. The effect of welding method is not significant (p = 0.08; p below 0.05 is not statistically significant at a 95% confidence level). This can be seen from Figure 2.11: within the high-heat welds, there is no difference at all. The figure does suggest that there might be a significant effect from welding method within the low-heat welds. However, the variability in the data, which is represented by the standard deviations reported in the data table, and which reduces the significance of any differences, is not reflected in the graph. Even within the low-heat welds alone, the difference from welding method is not statistically significant (p = 0.13, based on single-factor ANOVA).
19
o+-----~-------
single-sided dart-welded
Figure 2.11 EtTect of heat input and welding method on shear strength, weathering consumables
120
... Ill
.t:J. 100 E = 1:
!II
~ I
BO ~ c 'C ... I'll .s:: m 60 Q; ~
Ji(. 0 0 40 0::: Ill C) I'll ... Ill
~ 20
0 single-sided dart-welded
Figure 2.12 EtTect of heat input and welding method on hardness, weathering consumables
20
On the other hand, the high-heat single-sided welds include the specimens that had base metal failures before the welds reached their ultimate strength. This result means that the weld strengths for this group of specimens is actually higher than that recorded, and so the difference might have been significant if the actual strengths had been available.
The effect of welding method on hardness is significant (p < 0.0 1)-single-sided welds are harder. The effect of heat input is significant within single-sided welds (p < 0.01, based on single-factor ANOV A)-low-heat welds are harder. The heat input effect is not significant within dart welds (p = 0.08).
Overall, low-heat welds are stronger and harder than high-heat welds and single-sided welds are stronger and harder than dart welds. As expected, dart welding and higher heat input have similar effects.
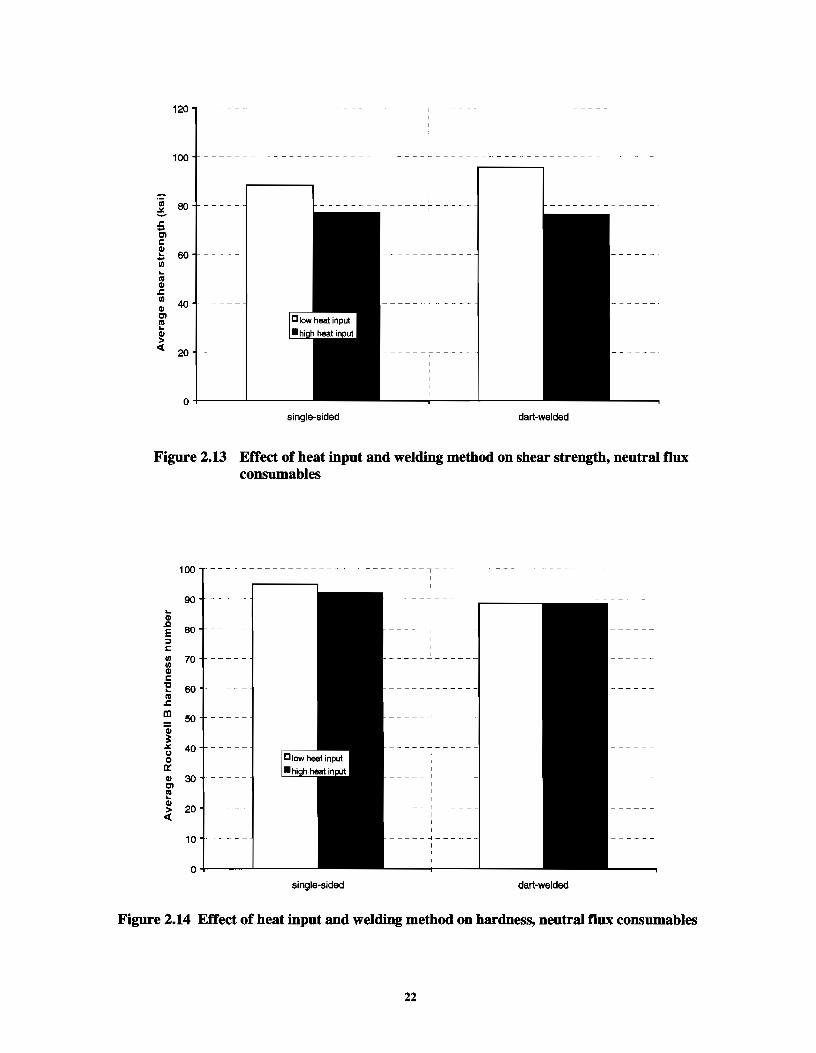
2.3.2 Neutral Flux Consumables All specimens failed in a weld. In most cases, the specimen broke in the smallest weld, or if not, then in a weld that was within 5% of the size of the smallest weld. This result is within the level of uncertainty in the weld measurement. Only one specimen had a fracture occur in a weld that was significantly larger than the smallest weld. Table 2.2 summarizes the test results.
Table 2.2 Shear strength, neutral flux consumables
Welding Method Measure of Strength High Heat Input Low Heat Input
calculated shear stress at 76.9 (4.0) 88.3 (4.4) Single-Sided failure (ksi)
Rockwell B hardness = 91.9 (0.9) 94.8 (1.1)
calculated shear stress at 76.3 (3.1) 95.6 (7.3) Dart-Welded failure (ksi)
Rockwell B hardness 88.4 (1.3) 88.5 (1.3)
The hardness numbers in Table 2.2 correspond to estimated tensile strengths ranging from 87 to 100 ksi. Figures 2.13 and 2.14 are graphical representations of the average shear strengths (shear stress at failure) and hardness values, respectively, reported in Table 2.2.
21
120
100
·;; eo ;. .:: ... 0'1 c: Gl I
.= 60 r-----Ill .. Ill Gl .:: en 40 Gl 0'1 E Gl
~ 20
o+-----'-----single-sided dart-welded
Figure 2.13 Effect of heat input and welding method on shear strength, neutral flux consumables
100
90 .. Gl .Q
80 E :I c: en 70 en Gl c:
"C 60 .. Ill .:: m 50 "'iii ~
.:t:. 40 (J 0 a: Q) 30 0'1 Ill .. Gl
20 ~
10
0 single-sided dart-welded
Figure 2.14 Effect of heat input and welding method on hardness, neutral flux consumables
22
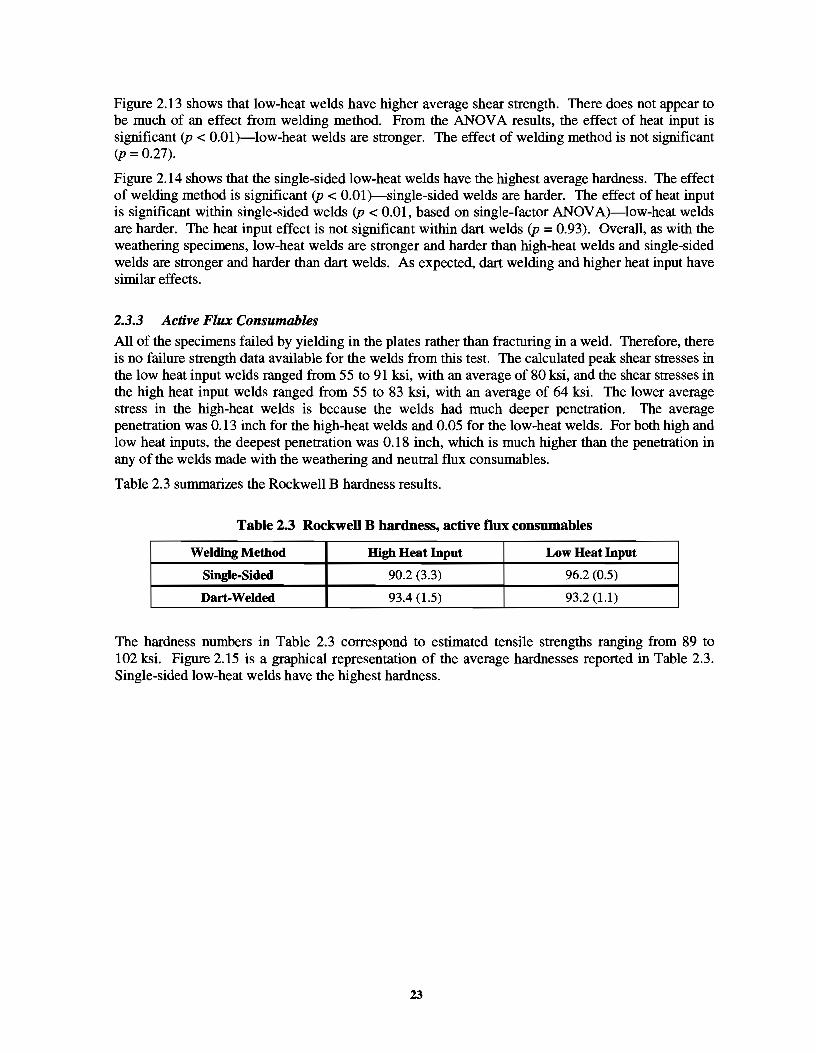
Figure 2.13 shows that low-heat welds have higher average shear strength. There does not appear to be much of an effect from welding method. From the ANOV A results, the effect of heat input is significant (p < 0.01)-low-heat welds are stronger. The effect of welding method is not significant (p = 0.27).
Figure 2.14 shows that the single-sided low-heat welds have the highest average hardness. The effect of welding method is significant (p < 0.01)-single-sided welds are harder. The effect ofheat input is significant within single-sided welds (p < 0.01, based on single-factor ANOVA)-low-heat welds are harder. The heat input effect is not significant within dart welds (p = 0.93). Overall, as with the weathering specimens, low-heat welds are stronger and harder than high-heat welds and single-sided welds are stronger and harder than dart welds. As expected, dart welding and higher heat input have similar effects.
2.3.3 Active Flux Consumables All of the specimens failed by yielding in the plates rather than fracturing in a weld. Therefore, there is no failure strength data available for the welds from this test. The calculated peak shear stresses in the low heat input welds ranged from 55 to 91 ksi, with an average of 80 ksi, and the shear stresses in the high heat input welds ranged from 55 to 83 ksi, with an average of 64 ksi. The lower average stress in the high-heat welds is because the welds had much deeper penetration. The average penetration was 0.13 inch for the high-heat welds and 0.05 for the low-heat welds. For both high and low heat inputs, the deepest penetration was 0.18 inch, which is much higher than the penetration in any of the welds made with the weathering and neutral flux consumables.
Table 2.3 summarizes the Rockwell B hardness results.
Table 2.3 Rockwell B hardness, active flux consumables
Welding Method High Heat Input Low Heat Input
Single-Sided 90.2 (3.3) 96.2 (0.5)
Dart-Welded 93.4 (1.5) 93.2 (1.1)
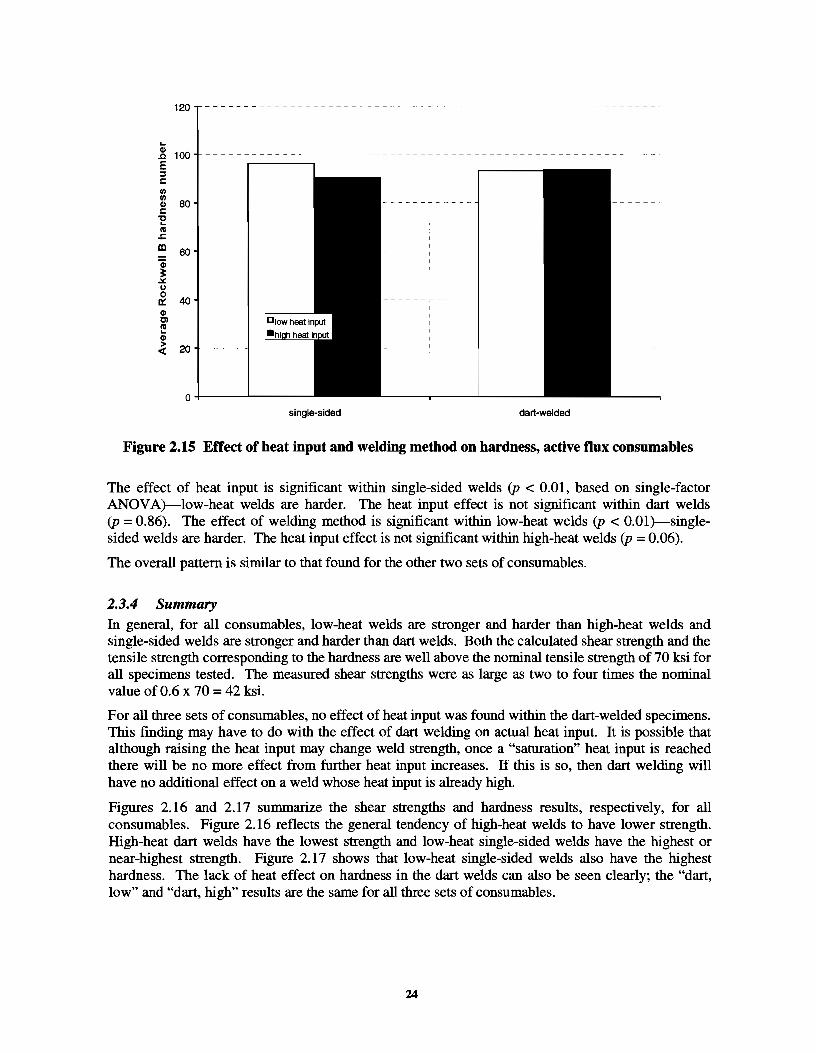
The hardness numbers in Table 2.3 correspond to estimated tensile strengths ranging from 89 to 102 ksi. Figure 2.15 is a graphical representation of the average hardnesses reported in Table 2.3. Single-sided low-heat welds have the highest hardness.
23
120
.. 1S 100 -- - --E r-----~ :::l c: (I)
~ 80 ----!:
'E cu
.:::: m eo
~ .:J{. ~ 0 a: G> tll cu .. ~
..;( 20
0 +-----'------single-sided
--------~-----------------------
I I
I I
_L_ __
dart-welded
Figure 2.15 Effect of heat input and welding method on hardness, active tlux consumables
The effect of heat input is significant within single-sided welds (p < 0.01, based on single-factor ANOV A)--low-heat welds are harder. The heat input effect is not significant within dart welds (p = 0.86). The effect of welding method is significant within low-heat welds (p < 0.01)--singlesided welds are harder. The heat input effect is not significant within high-heat welds (p = 0.06).
The overall pattern is similar to that found for the other two sets of consumables.
2.3.4 Summary
In general, for all consumables, low-heat welds are stronger and harder than high-heat welds and single-sided welds are stronger and harder than dart welds. Both the calculated shear strength and the tensile strength corresponding to the hardness are well above the nominal tensile strength of 70 ksi for all specimens tested. The measured shear strengths were as large as two to four times the nominal value of 0.6 x 70 = 42 ksi.
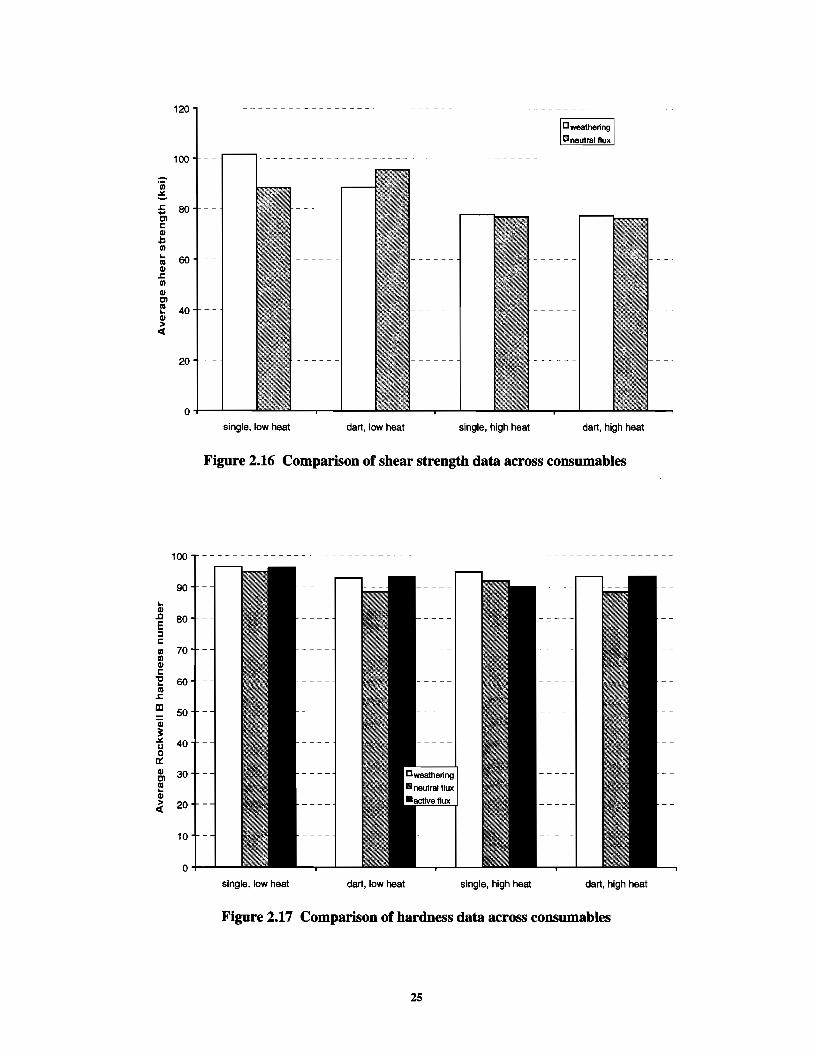
For all three sets of consumables, no effect of heat input was found within the dart-welded specimens. This fmding may have to do with the effect of dart welding on actual heat input. It is possible that although raising the heat input may change weld strength, once a "saturation" heat input is reached there will be no more effect from further heat input increases. If this is so, then dart welding will have no additional effect on a weld whose heat input is already high.
Figures 2.16 and 2.17 summarize the shear strengths and hardness results, respectively, for all consumables. Figure 2.16 reflects the general tendency of high-heat welds to have lower strength. High-heat dart welds have the lowest strength and low-heat single-sided welds have the highest or near-highest strength. Figure 2.17 shows that low-heat single-sided welds also have the highest hardness. The lack of heat effect on hardness in the dart welds can also be seen clearly; the "dart, low" and "dart, high" results are the same for all three sets of consumables.
24
100
-·; :. ..r: 80 ... Ol c: G) .. ... Ill .. 60 111 G) ..r: Ill G) Ol I! 40 G) > <
20
single, low heat dart, low heat single, high heat dart, high heat
Figure 2.16 Comparison of shear strength data across consumables
100
90 .. G)
..a 80 E :I c: Ill 70 Ill G) c -e 60
111 ..r: m 50 Cii ~ 40 u 0
0:: G) 30 Ol 111 .. G)
~ 20
10
0 single, low heat dart, low heat single, high heat dart, high heat
Figure 2.17 Comparison of hardness data across consumables
25
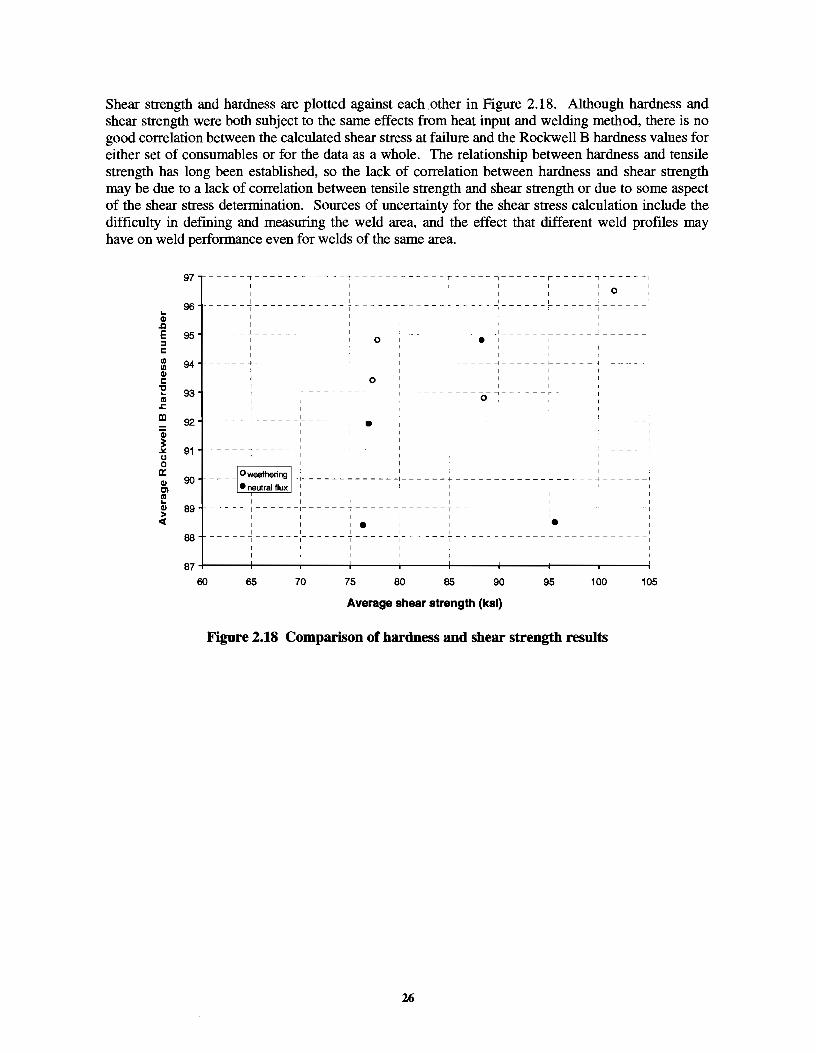
Shear strength and hardness are plotted against each other in Figure 2.18. Although hardness and shear strength were both subject to the same effects from heat input and welding method, there is no good correlation between the calculated shear stress at failure and the Rockwell B hardness values for either set of consumables or for the data as a whole. The relationship between hardness and tensile strength has long been established, so the lack of correlation between hardness and shear strength may be due to a lack of correlation between tensile strength and shear strength or due to some aspect of the shear stress determination. Sources of uncertainty for the shear stress calculation include the difficulty in defining and measuring the weld area, and the effect that different weld profiles may have on weld performance even for welds of the same area.
97
96 .. Cl .Q
E 95 = c II) 94 Ill Cl c '0 93 .. 111 .r: m 92 "iii ~
91 .¥ I> 0
0:: Cl 90 m Ill .. Cl 89 ~
88
87 60 65
-~~-----:-- -- --;-
----------~-
70
I
~
I 0
75 80 85
: 0
------------------ ----• -f--- --.1-
1
0 :---"~--r---- ·····r
i ' ---~-----------------
- -:------~------.-----·-1
i ,. i
i i I -----~-----~--- ------1
90 95 100 105
Average shear strength (ksl)
Figure 2.18 Comparison of hardness and shear strength results
26
CHAPTER3: T-BENDTEST
3.1 FABRICATION
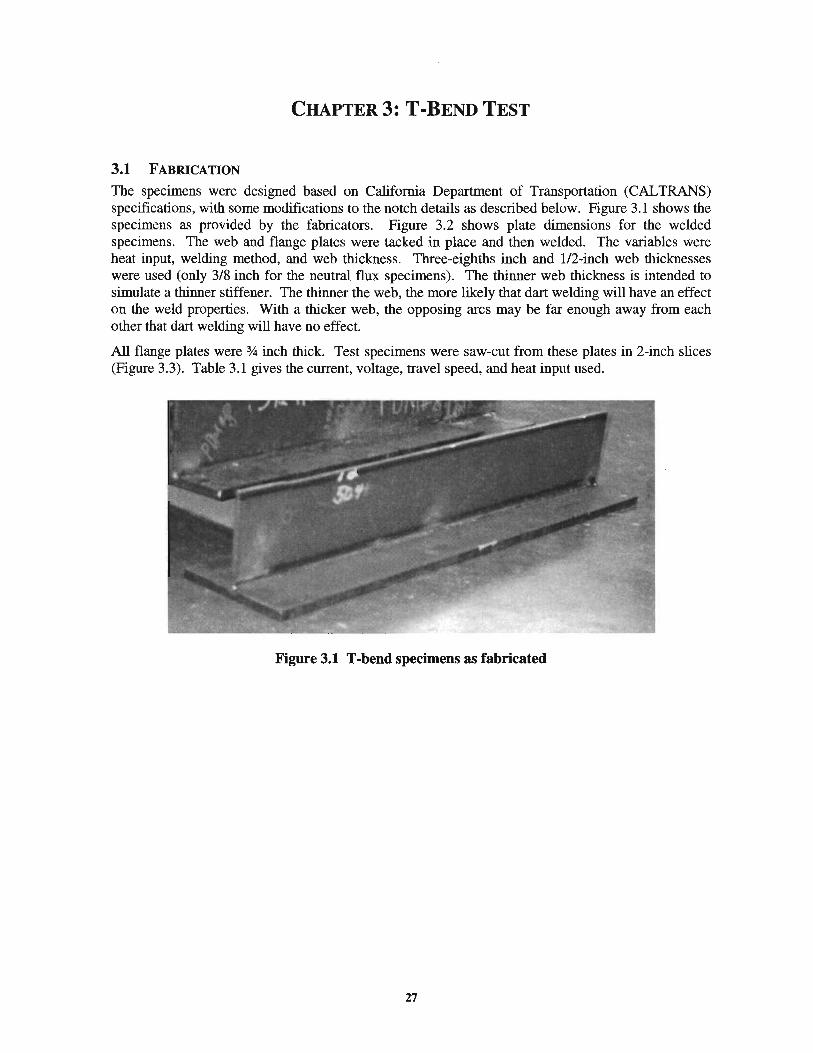
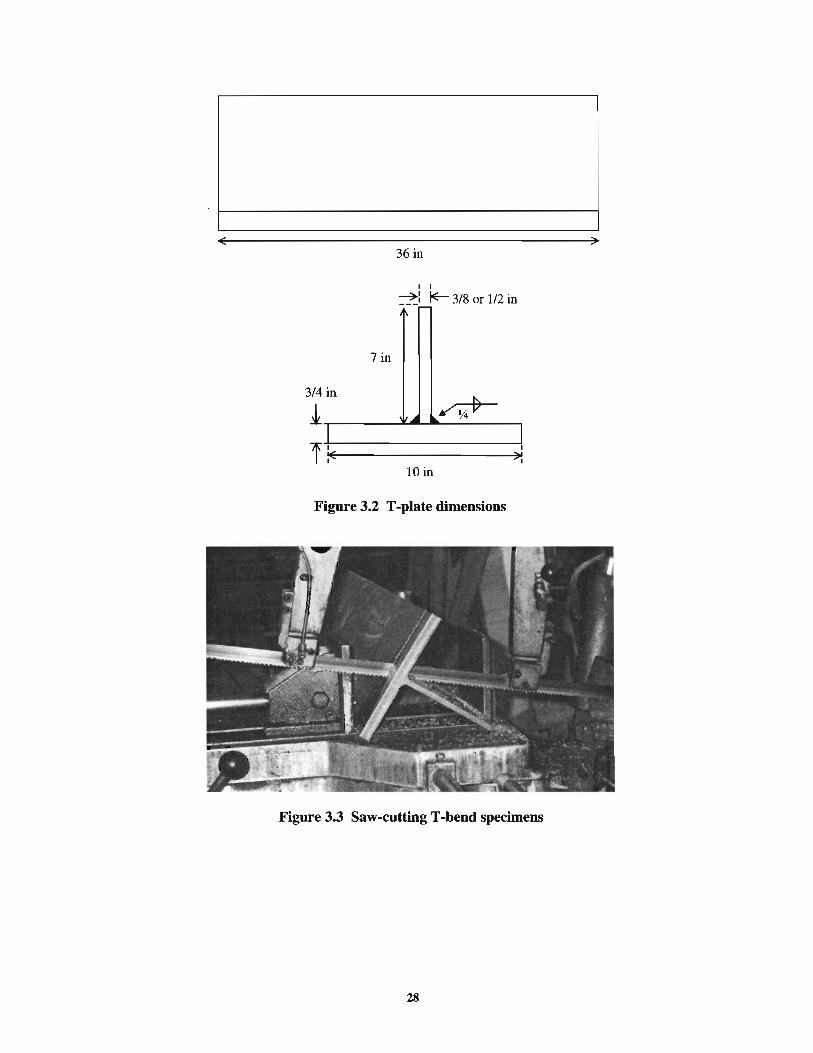
The specimens were designed based on California Department of Transportation (CALTRANS) specifications, with some modifications to the notch details as described below. Figure 3.1 shows the specimens as provided by the fabricators. Figure 3.2 shows plate dimensions for the welded specimens. The web and flange plates were tacked in place and then welded. The variables were heat input, welding method, and web thickness. Three-eighths inch and 1/2-inch web thicknesses were used (only 3/8 inch for the neutral flux specimens). The thinner web thickness is intended to simulate a thinner stiffener. The thinner the web, the more likely that dart welding will have an effect on the weld properties. With a thicker web, the opposing arcs may be far enough away from each other that dart welding will have no effect.
All flange plates were % inch thick. Test specimens were saw-cut from these plates in 2-inch slices (Figure 3.3). Table 3.1 gives the current, voltage, travel speed, and heat input used.
Figure 3.1 T -bend specimens as fabricated
27
36 in
I I
:Z: ~ 3/8 or 1/2 in
7 in
3/4 in
1-.--~----~-1A_4 ----, r~: -----~
10 in
Figure 3.2 T -plate dimensions
Figure 3.3 Saw-cutting T -bend specimens
28
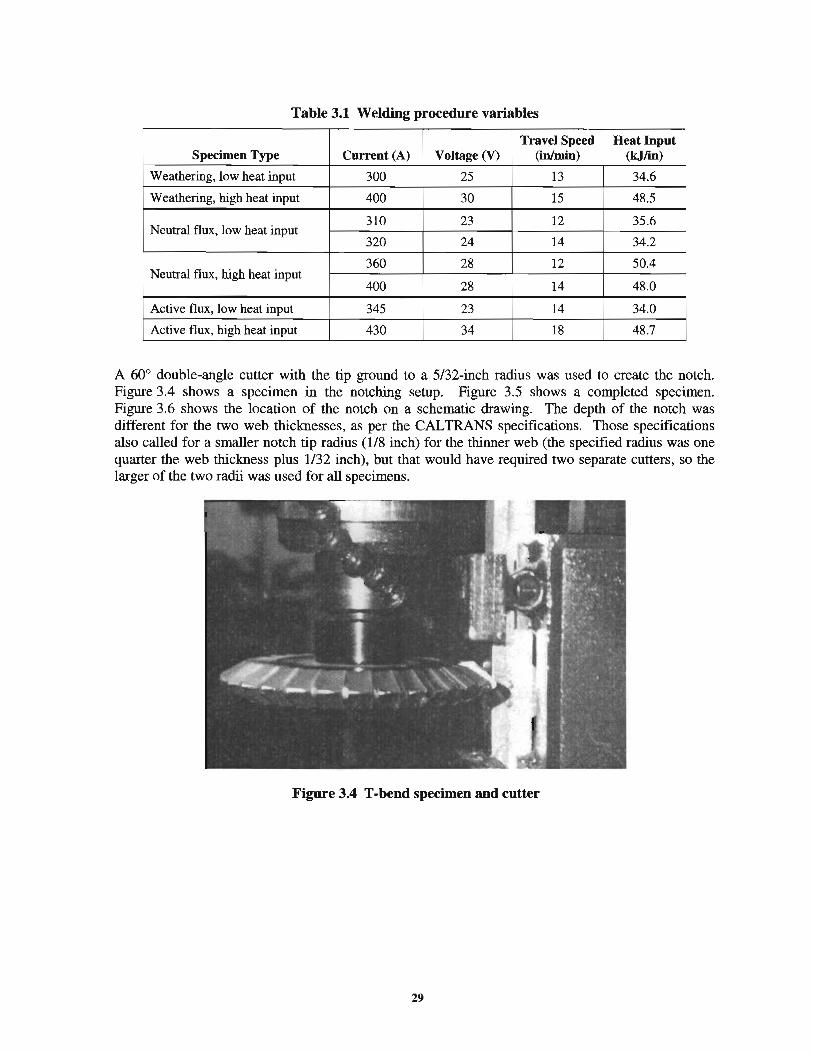
Table 3.1 Welding procedure variables
Travel Speed Heat Input Specimen Type Current (A) Voltage (V) (in/min) (k.J/in)
Weathering, low heat input 300 25 13 34.6
Weathering, high heat input 400 30 15 48.5
Neutral flux, low heat input 310 23 12 35.6
320 24 14 34.2
360 28 12 50.4 Neutral flux, high heat input
400 28 14 48.0
Active flux, low heat input 345 23 14 34.0
Active flux, high heat input 430 34 18 48.7
A 60° double-angle cutter with the tip ground to a 5/32-inch radius was used to create the notch. Figure 3.4 shows a specimen in the notching setup. Figure 3.5 shows a completed specimen. Figure 3.6 shows the location of the notch on a schematic drawing. The depth of the notch was different for the two web thicknesses, as per the CAL TRANS specifications. Those specifications also called for a smaller notch tip radius (1/8 inch) for the thinner web (the specified radius was one quarter the web thickness plus 1132 inch), but that would have required two separate cutters, so the larger of the two radii was used for all specimens.
Figure 3.4 T -bend specimen and cutter
29
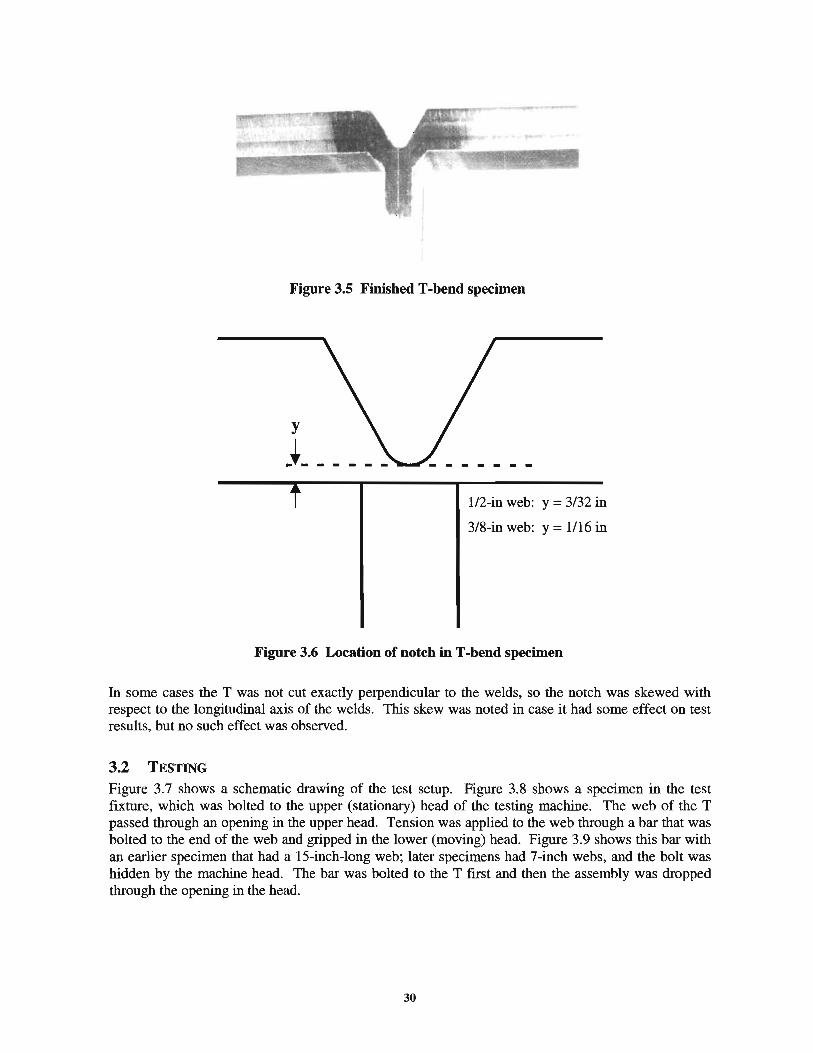
Figure 3.5 Finished T -bend specimen
y
-•-1/2-in web: y = 3/32 in
3/8-in web: y = 1/16 in
Figure 3.6 Location of notch in T -bend specimen
In some cases the T was not cut exactly perpendicular to the welds, so the notch was skewed with respect to the longitudinal axis of the welds. This skew was noted in case it had some effect on test results, but no such effect was observed.
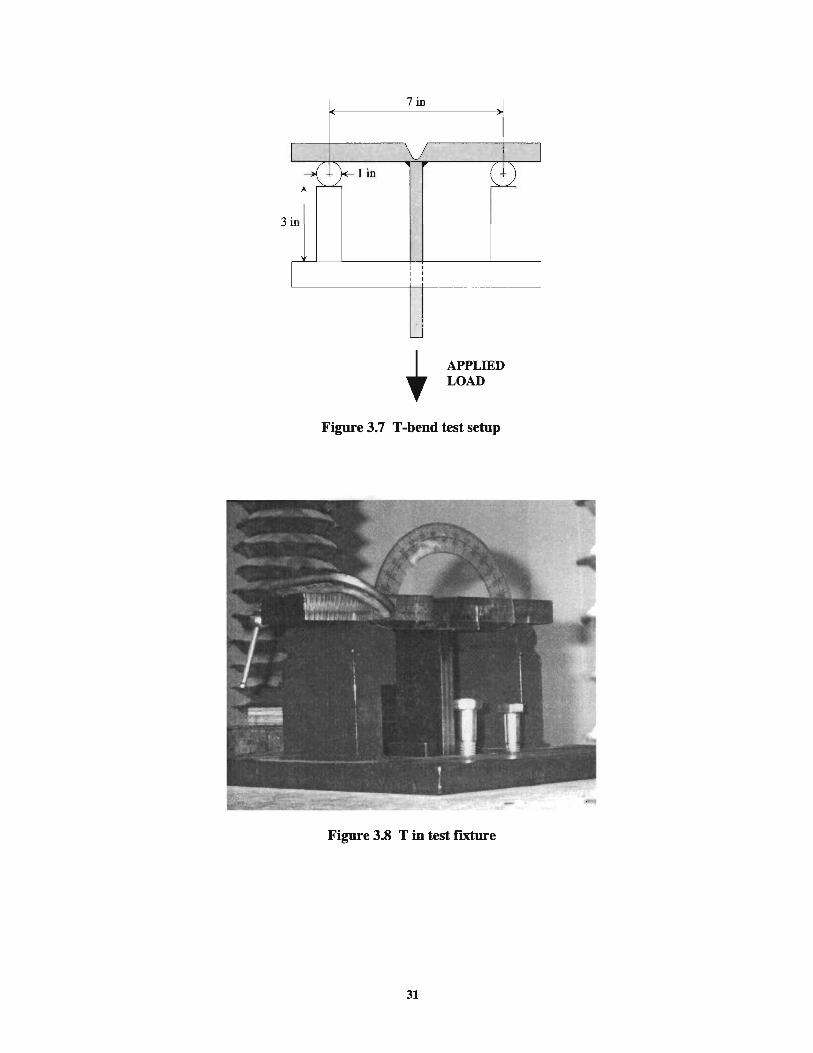
3.2 TESTING
Figure 3.7 shows a schematic drawing of the test setup. Figure 3.8 shows a specimen in the test fixture, which was bolted to the upper (stationary) head of the testing machine. The web of the T passed through an opening in the upper head. Tension was applied to the web through a bar that was bolted to the end of the web and gripped in the lower (moving) head. Figure 3.9 shows this bar with an earlier specimen that had a 15-inch-long web; later specimens had 7-inch webs, and the bolt was hidden by the machine head. The bar was bolted to the T first and then the assembly was dropped through the opening in the head.
30
I
3 in
I
ill
v .Vlin
~
I I I I I I I
I
I I I
_j
~
APPLIED LOAD
Figure 3.7 T-bend test setup
Figure 3.8 T in test fixture
31
I
I
-
Figure 3.9 Pull bar
The total displacement angle (the sum of the displacements of both arms) was read from a protractor clamped to one arm of the T, and the load was read from the machine' s dial indicator. Loading was displacement-controlled (loading rate approximately 0.007 inch per minute) and continued until the notch closed at a displacement angle of about 70° or until the load dropped significantly or rapidly. Some initial tests were stopped when the displacement angle reached 60°. Once the paint wore off the fixture, friction became a problem and an anti-seize compound was applied to the f1Xture supports. Figure 3.10 shows a specimen during a test, and Figure 3.11 shows a specimen after testing.
32
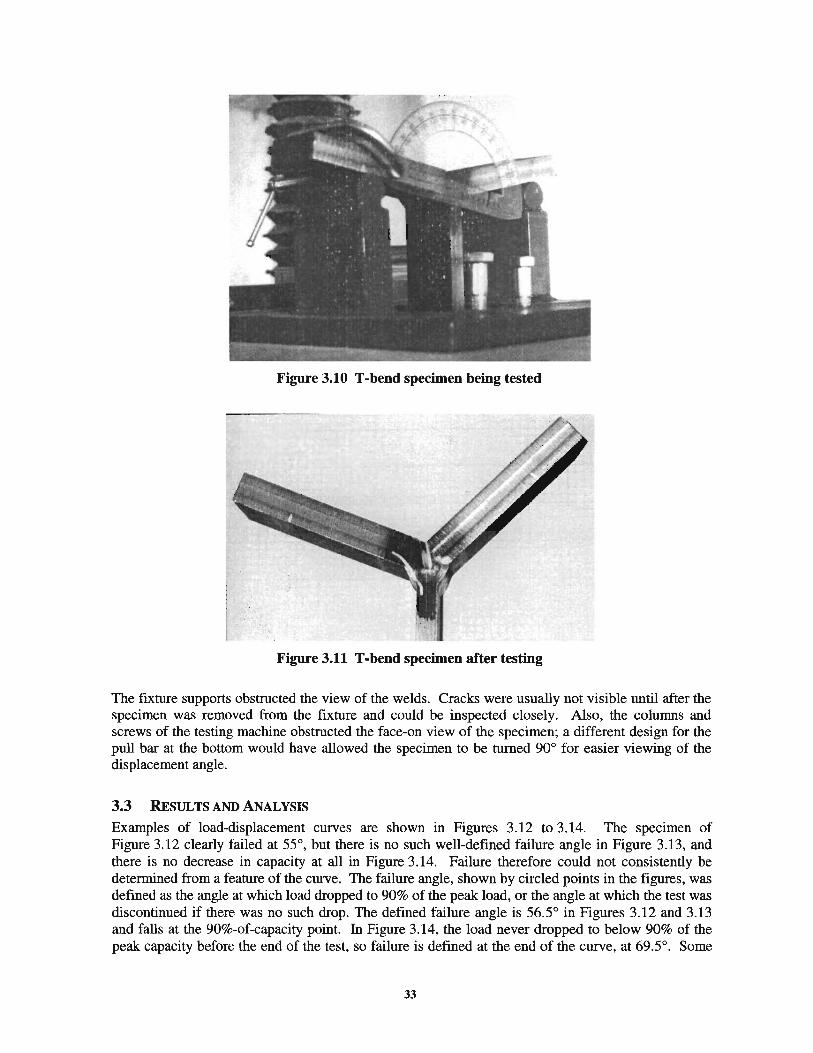
Figure 3.10 T -bend specimen being tested
Figure 3.11 T -bend specimen after testing
The fixture supports obstructed the view of the welds. Cracks were usually not visible until after the specimen was removed from the fixture and could be inspected closely. Also, the columns and screws of the testing machine obstructed the face-on view of the specimen; a different design for the pull bar at the bottom would have allowed the specimen to be turned 90° for easier viewing of the displacement angle.
3.3 RESULTS AND ANALYSIS
Examples of load-displacement curves are shown in Figures 3.12 to 3.14. The specimen of Figure 3.12 clearly failed at 55°, but there is no such well-defined failure angle in Figure 3.13, and there is no decrease in capacity at all in Figure 3.14. Failure therefore could not consistently be determined from a feature of the curve. The failure angle, shown by circled points in the figures, was defmed as the angle at which load dropped to 90% of the peak load, or the angle at which the test was discontinued if there was no such drop. The defined failure angle is 56.5° in Figures 3.12 and 3.13 and falls at the 90%-of-capacity point. In Figure 3.14, the load never dropped to below 90% of the peak capacity before the end of the test, so failure is defined at the end of the curve, at 69.5°. Some
33
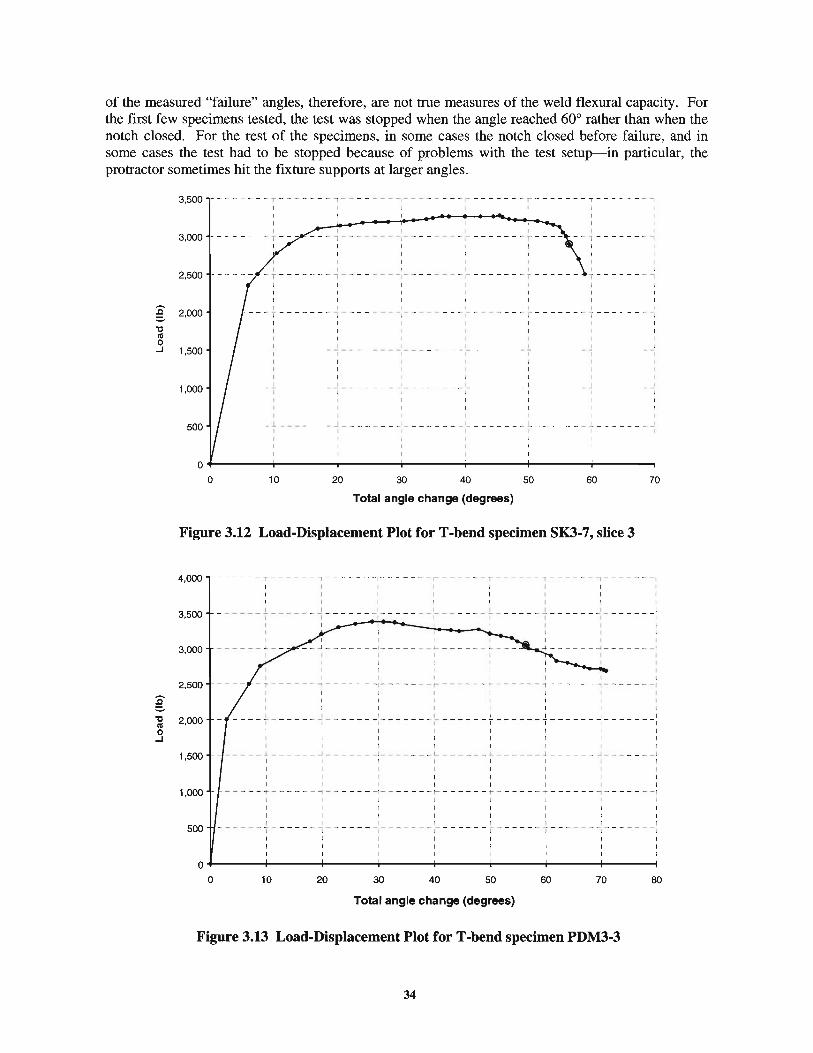
of the measured "failure" angles, therefore, are not true measures of the weld flexural capacity. For the first few specimens tested, the test was stopped when the angle reached 60° rather than when the notch closed. For the rest of the specimens, in some cases the notch closed before failure, and in some cases the test had to be stopped because of problems with the test setup--in particular, the protractor sometimes hit the fixture supports at larger angles.
:c :::. "0 nl 0
...J
:c "0 nl 0
...J
3,500
3,000
2,500
2,000
1,500
1,000
500
0
0
------ - T ------ - ~-- -- ---~--- - - -- - r ------ - r -------,------ - ,
I I
I
I I I - - - - -- ~ ~ - - - - - ..... - -; ------ -.,
I
I I ! I I ------ - .,- - -- ---~- - -- --- - r ------ - r ------ , ------ --
I
------ - ~- - -- ---~
1
I I I -- -- - r - --- -- -r ------ - r ------ -~
I
I I I I J -y------ - -- - -- ------- ---- - r ------ -- ------ -- ------ --
I I I - ---- - - ------ -~-- ---- - - - ------ - ~ -------~------ - ~ ------ -l
----- - 1 -- -- -- - ~ - - -- - -- ~ - ------ - L ______ _ l ______ __ ______ _ ~ I I I I t I
10 20
I I
30
I I
40
Total angle change (degrees)
50 60 70
Figure 3.12 Load-Displacement Plot forT-bend specimen SK3-7, slice 3
4,000
3,500
3,000
2,500
2,000
1,500
1,000
500
0
0
----- - T---- -- .., ------ -~----- --r---- - - r- --- --,.---- - - .,----- - -~
I I I I I I
I I I I I I - -- ---T- - - ---1 ------ - - ---- --~-- -- - -r- ---- - ~ ------ - - ------
- -~-- ---- ~-- -- - -- L - - - - - - ~ - - -1 I I
I
I
, ------ 4- ---- --- ------r------ ~ ------ ;- ---- - -
I
I
1
I I I I I I I - ---- r- ---- -l - - ---- ~ - -- - -- - r --------- --- -1--------------
I I I
--- -- L- ----- ~-- ---- ~---- -- -L ----- --- ---- -4 ------ ~- - - --- - 1 I I I l I I I I I I
I
' ----- - - ----- ; -- ---- --- ---- -~ ------ r- ---- -~ ------ ;- ---- - -1
I I I I I I I I I I I I j I I I I l I
- - -- -- r- ---- -,-- ---- ~-- - - - --r ------ r- ---- -, -- ----,- ---- - -
1 I I
10 20 30 40 50 60 70 80
Total angle change (degrees)
Figure 3.13 Load-Displacement Plot for T -bend specimen PDM3-3
34
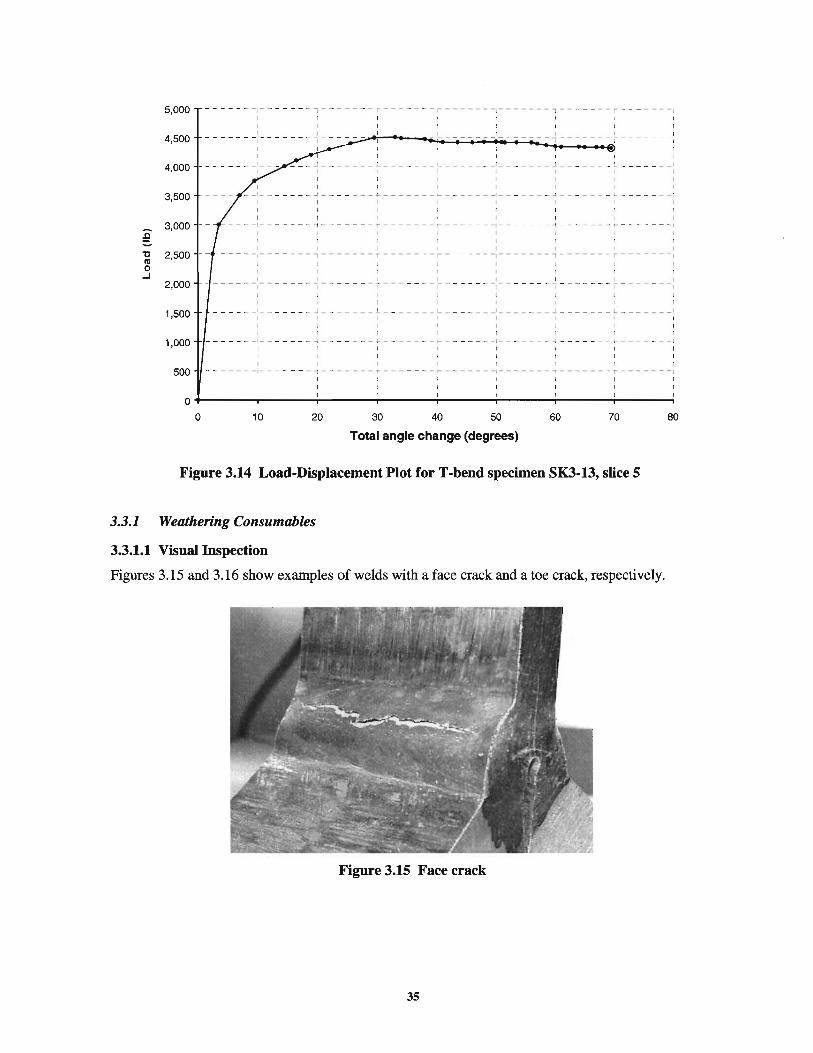
:c 'C nl 0
...J
3.3.1
5,000
4,500
4,000
3,500
3,000
2,500
2 ,000
1,500
1,000
500
- - - - · - - -,- - - - - - - t - - · - - - - - r - - - - - - - r - - - · - - - -,- - - -- -- , - - - - - - - .-- - - - - -- -, I I I I
I I I I I I I I
------- : - ----- --:- --~: 81 .... :1 I I I~- I 1-._ 1
1 II aa@)- - - -----
1 I I I
-- -l.--- - --_I ----- - - '-- - ---- ..1-- - -
- - 1-- ---- - ~- - -- ---.!...-------L- - ---- --1-- - --- -...! -- - --- - - - -- - - - - ' I
- - - -1- - - - - - - -t - - - - - - - - - - - - - - -r- - - - - - - ---1 - - - - - - - -t - - - - - - - ..._ - - - - - - - I
I I I I I I I I I I I I I J - --- ---,-- -- ---,-------r----- - -r- -- - ---,-------~ - ----- - r-------,
I I I I I I I -,-- ---- - i-- ---- - - --- -- - -,-- ---- - --- ---- - , - --- --- - - --- - --I I
I I I
- - - - - -'- - - - - - - .J- - - - - - - L - - - - - - - - - - - - -- _I_ - - - - - - .J - - - - - - -I I I
- -- ---_I I I I
--- - - - -1-- - -- - - _.- - - - - -- "--- - -----I-- -- - - -_,_- --- --- ... ----- -- ... - - - - - --I I I I I I I
I I
- - ---- -r-- - - - - - "'1 ---- - -- ?"-- - - - - - ~- - - --- -r-- - --- - ""! -- - ---- - ~ - - - ----1
0+-------,-------,-------~------~------~-------r-------r------~
0 10 20 30 40 50 60 70 80
Total angle change (degrees)
Figure 3.14 Load-Displacement Plot forT -bend specimen SK3-13, slice 5
Weathering Consumables
3.3.1.1 Visual Inspection
Figures 3.15 and 3_16 show examples of welds with a face crack and a toe crack, respectively.
Figure 3.15 Face crack
35
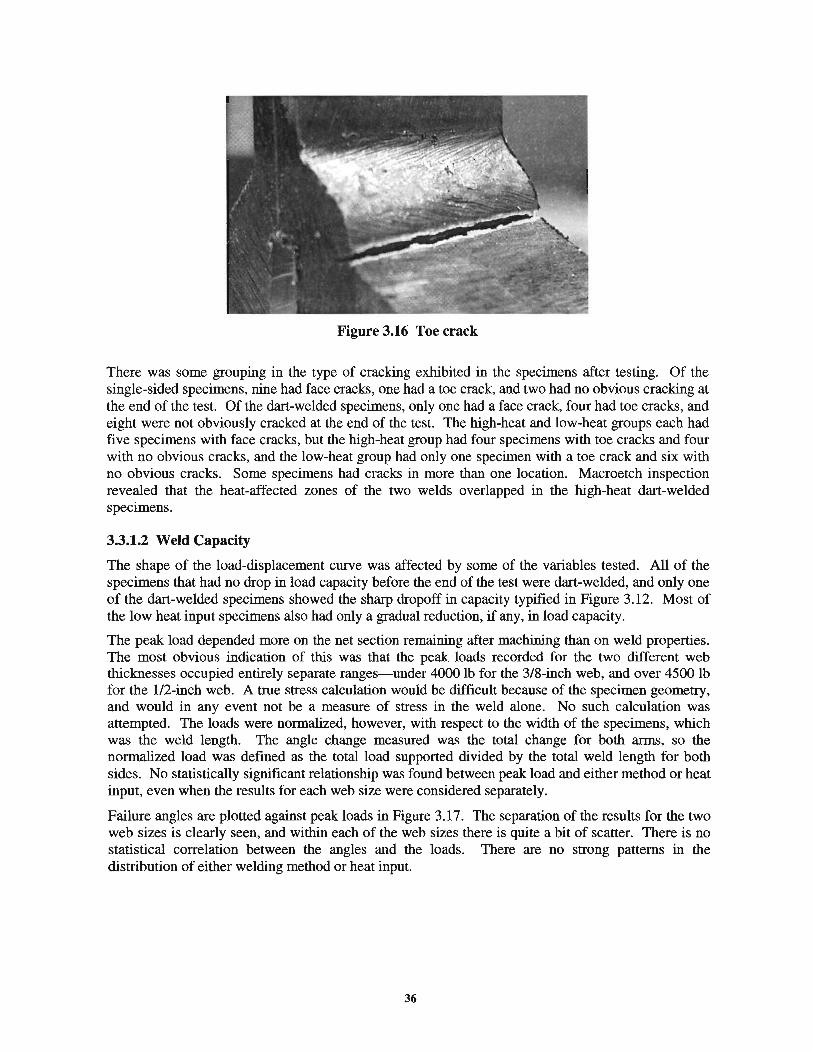
Figure 3.16 Toe crack
There was some grouping in the type of cracking exhibited in the specimens after testing. Of the single-sided specimens, nine had face cracks, one had a toe crack, and two had no obvious cracking at the end of the test. Of the dart-welded specimens, only one had a face crack, four had toe cracks, and eight were not obviously cracked at the end of the test. The high-heat and low-heat groups each had five specimens with face cracks, but the high-heat group had four specimens with toe cracks and four with no obvious cracks, and the low-heat group had only one specimen with a toe crack and six with no obvious cracks. Some specimens had cracks in more than one location. Macroetch inspection revealed that the heat-affected zones of the two welds overlapped in the high-heat dart-welded specimens.
3.3.1.2 Weld Capacity
The shape of the load-displacement curve was affected by some of the variables tested. All of the specimens that had no drop in load capacity before the end of the test were dart-welded, and only one of the dart-welded specimens showed the sharp dropoff in capacity typified in Figure 3.12. Most of the low heat input specimens also had only a gradual reduction, if any, in load capacity.
The peak load depended more on the net section remaining after machining than on weld properties. The most obvious indication of this was that the peak loads recorded for the two different web thicknesses occupied entirely separate ranges- under 4000 lb for the 3/8-inch web, and over 4500 lb for the 1/2-inch web. A true stress calculation would be difficult because of the specimen geometry, and would in any event not be a measure of stress in the weld alone. No such calculation was attempted. The loads were normalized, however, with respect to the width of the specimens, which was the weld length. The angle change measured was the total change for both arms, so the normalized load was defmed as the total load supported divided by the total weld length for both sides. No statistically significant relationship was found between peak load and either method or heat input, even when the results for each web size were considered separately.
Failure angles are plotted against peak loads in Figure 3.17. The separation of the results for the two web sizes is clearly seen, and within each of the web sizes there is quite a bit of scatter. There is no statistical correlation between the angles and the loads. There are no strong patterns in the distribution of either welding method or heat input.
36
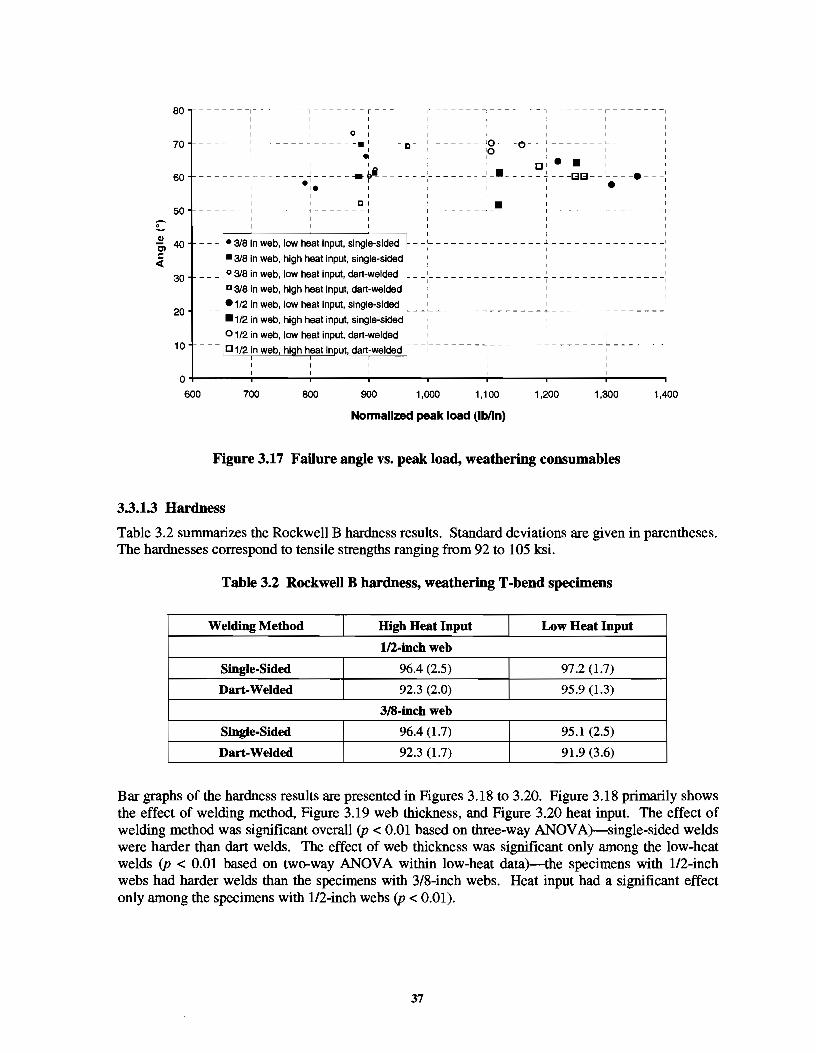
-~ (!)
a, c: <(
80 - ---- - -~- -----------r-- - - I - - - - - - -I
70
60
50
40
30
20
10 -
0
600
1 I I I
-1 ---
I I
•' I. I I
I I
0 ' -• ~ - D- . .,
I
--~-----1
I Ill
-'O -o '0 ' [J ••
--•-----~ 1;3(3~ I :·
... I
I ·- --
I --1--- 4 -------r-----··· ____ .. ___ _ r - ---- ~ ~~
I I
I I
In web, low heat input, single-sided
• 318 In web, high heat input, single-sided
• o 318 in web, low heat input, dart-welded
I c 318 in web, high heat input, dart-welded
I
_I_----- ..l. ------ -I
' ! •112 in web, low heat input, single-sided
•112 in web, high heat input, single-sided
1 0 112 in web, low heat input, dart-welded
-----j-------*'t" - - - ,... - - - - - - -1
' I I
1 C 112 in web, hi h heat In ut, dart-welded __ I ________ 1
I I --..l-------L---
1
700 800 900 1,000 1,100 1,200 1,300 1,400
Normalized peak load (lblln)
Figure 3.17 Failure angle vs. peak load, weathering consumables
3.3.1.3 Hardness
Table 3.2 summarizes the Rockwell B hardness results. Standard deviations are given in parentheses. The hardnesses correspond to tensile strengths ranging from 92 to 105 ksi.
Table 3.2 Rockwell B hardness, weathering T -bend specimens
Welding Method High Heat Input Low Heat Input
1/2-inch web
Single-Sided 96.4 (2.5) 97.2 (1.7)
Dart-Welded 92.3 (2.0) 95.9 (1.3)
3/8-inch web
Single-Sided 96.4 (1.7) 95.1 (2.5)
Dart-Welded 92.3 (1.7) 91.9 (3.6)
Bar graphs of the hardness results are presented in Figures 3.18 to 3.20. Figure 3.18 primarily shows the effect of welding method, Figure 3.19 web thickness, and Figure 3.20 heat input. The effect of welding method was significant overall (p < 0.01 based on three-way ANOV A)-single-sided welds were harder than dart welds. The effect of web thickness was significant only among the low-heat welds (p < 0.01 based on two-way ANOV A within low-heat data)-the specimens with 1/2-inch webs had harder welds than the specimens with 3/8-inch webs. Heat input had a significant effect only among the specimens with 1/2-inch webs (p < 0.01).
37
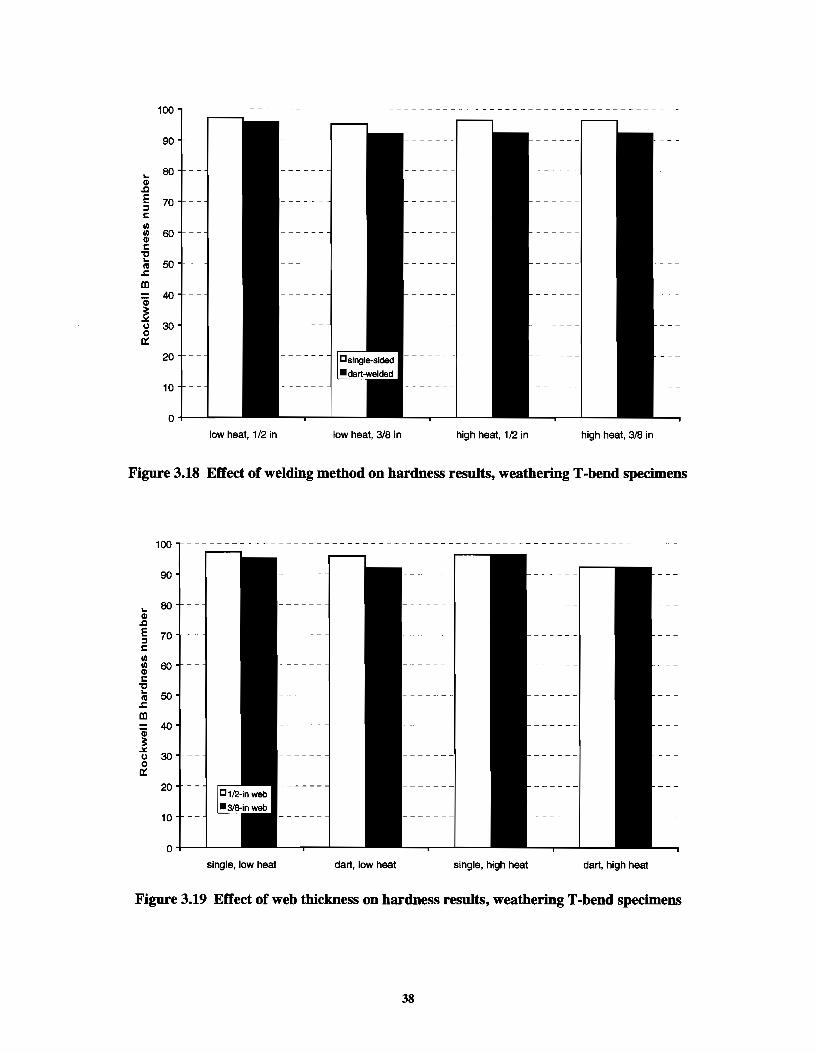
100
90
... 80 CD .c E 70 :l t: Ill Ill 60 CD t: "0 ...
50 nl .t: Ill
Gi 40
~ .X u 30 0 0::
20
10
0
low heat, 1/2 in low heat, 3/8 in high heat, 1/2 in high heat, 318 in
Figure 3.18 Effect of welding method on hardness results, weathering T -bend specimens
100
90
... 80 CD .c E 70 :l c Ill Ill 60 CD c
"0 ... 50 ell
.t: Ill
1 40
.X 30 u
0 0::
10
0
single, low heat dart, low heat single, high heat dart, high heat
Figure 3.19 Effect of web thickness on hardness results, weathering T-bend specimens
38
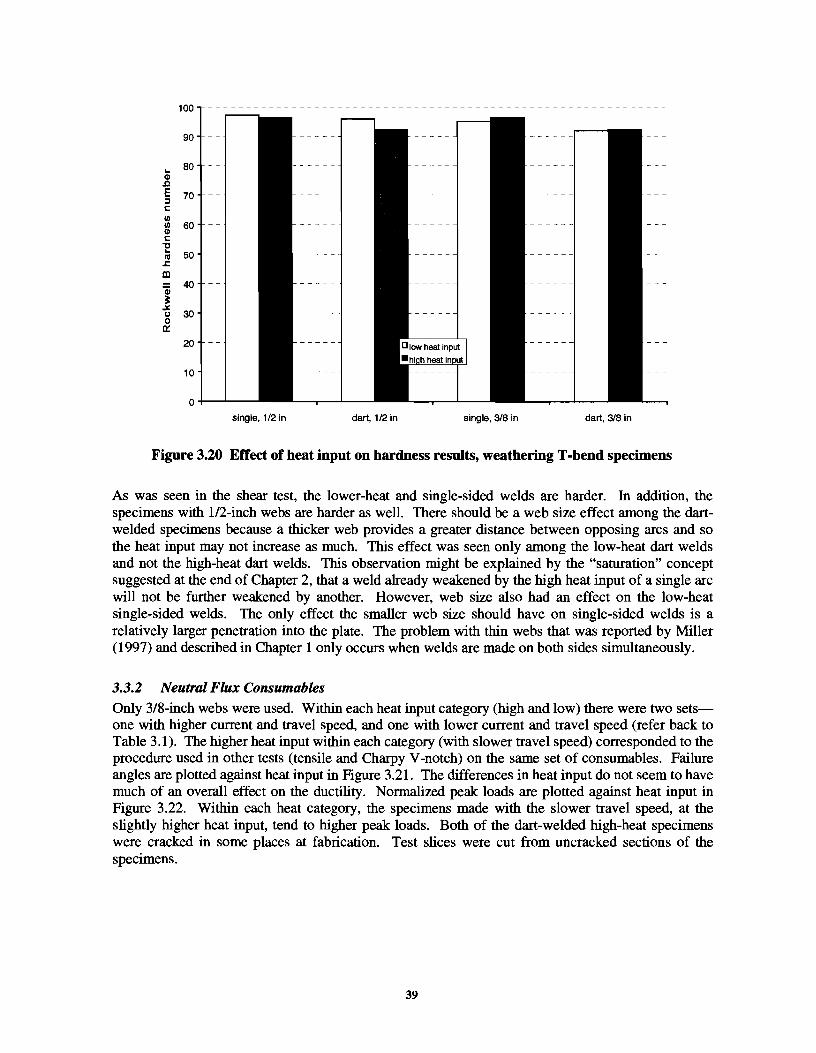
100
90
... 80 Cll
.t:J E 70 ::J t: 1/) 1/) 60 Cll t:
"'C ... 50 ns
.s= ID
Gi 40
:= ,:;t. tJ 0
30
D::
20
10
0
single, 1/2 in dart, 1/2 in single, 318 in dart, 318 in
Figure 3.20 Effect of heat input on hardness results, weathering T -bend specimens
As was seen in the shear test, the lower-heat and single-sided welds are harder. In addition, the specimens with 1/2-inch webs are harder as well. There should be a web size effect among the dartwelded specimens because a thicker web provides a greater distance between opposing arcs and so the heat input may not increase as much. This effect was seen only among the low-heat dart welds and not the high-heat dart welds. This observation might be explained by the "saturation" concept suggested at the end of Chapter 2, that a weld already weakened by the high heat input of a single arc will not be further weakened by another. However, web size also had an effect on the low-heat single-sided welds. The only effect the smaller web size should have on single-sided welds is a relatively larger penetration into the plate. The problem with thin webs that was reported by Miller (1997) and described in Chapter 1 only occurs when welds are made on both sides simultaneously.
3.3.2 Neutral Flux Consumables Only 3/8-inch webs were used. Within each heat input category (high and low) there were two setsone with higher current and travel speed, and one with lower current and travel speed (refer back to Table 3.1). The higher heat input within each category (with slower travel speed) corresponded to the procedure used in other tests (tensile and Charpy V -notch) on the same set of consurnables. Failure angles are plotted against heat input in Figure 3.21. The differences in heat input do not seem to have much of an overall effect on the ductility. Normalized peak loads are plotted against heat input in Figure 3.22. Within each heat category, the specimens made with the slower travel speed, at the slightly higher heat input, tend to higher peak loads. Both of the dart-welded high-heat specimens were cracked in some places at fabrication. Test slices were cut from uncracked sections of the specimens.
39
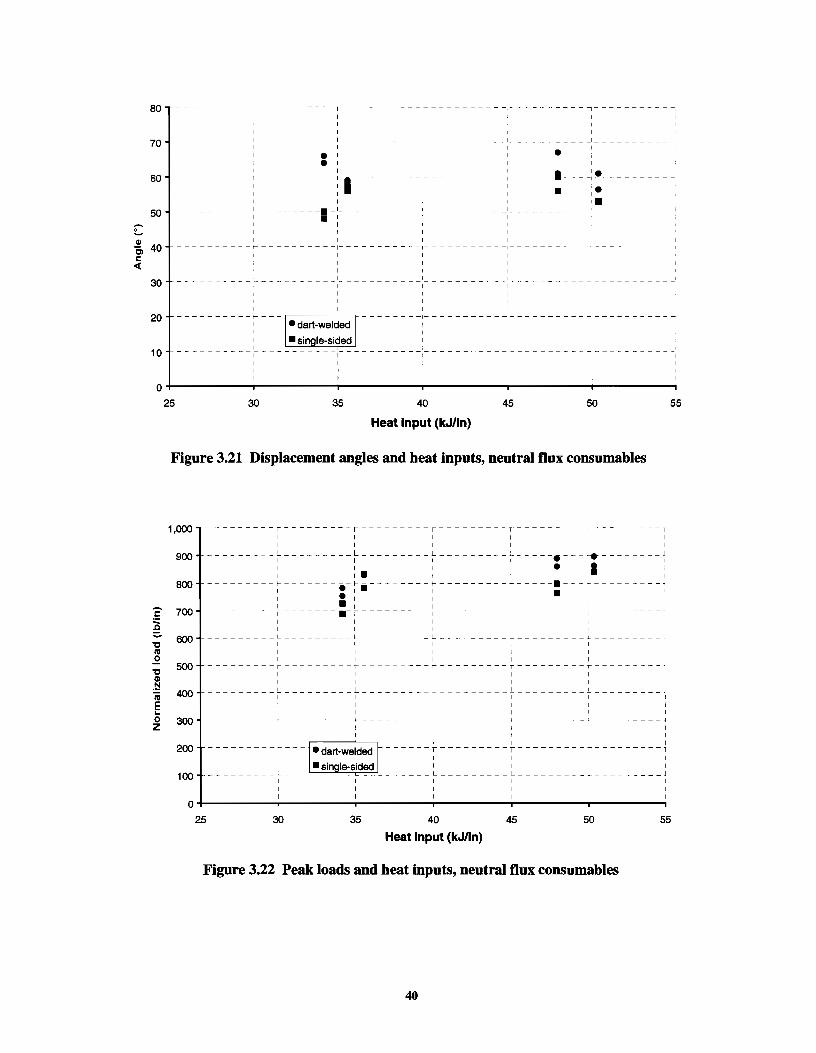
80
70
60
50 -!!... Cl>
40 = c <
30
20
10
0
c ! 'tl IV ..2 'tl 111 .~ iii E ... 0 z
~---------------r--------- ···;
- _!_- - --- - --------
• ------ ...... ···;··· -1-
•
-r----------r----
- - - - -I_ - - - - -I
25 30 35 40 45 50 55
Heat Input (kJ/ln)
Figure 3.21 Displacement angles and heat inputs, neutral flux consumables
1,000
900
800
700
800
500
400
300
200
100
0 25
------r--------- ---1
' ----~---------L_____ -~-1 I I.
~~~-----~-------~-~~------- ~
I • :
I • I ---,-------.-,-------1 '
I
-----L---------~----1
' ' ~~r -----r---------r---1
-. • -· •
I
I I I ------~---------~---------r-----
1
I L
30 35 40 45 50
Heat Input (kJ/Jn)
Figure 3.22 Peak loads and heat inputs, neutral flux consumables
40
--- l
55
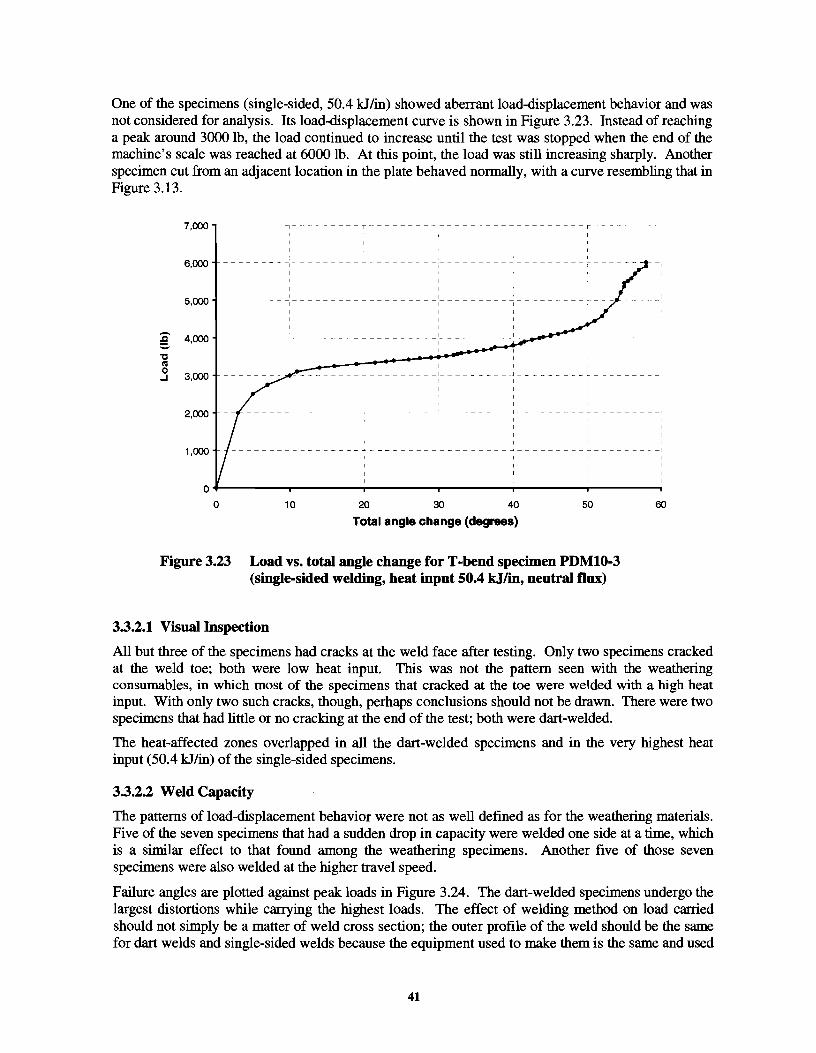
One of the specimens (single-sided, 50.4 kJ/in) showed aberrant load-displacement behavior and was not considered for analysis. Its load-displacement curve is shown in Figure 3.23. Instead of reaching a peak around 3000 lb, the load continued to increase until the test was stopped when the end of the machine's scale was reached at 6000 lb. At this point, the load was still increasing sharply. Another specimen cut from an adjacent location in the plate behaved normally, with a curve resembling that in Figure 3.13.
7,000 - - - - - - - - -I - - - - - - - - - T - - - - - - - - - - - - - - - - - - -, - - - - - - - - - r- - - - - - - - -'
6,000
5,000
:c 4,000 -"C C'il
' I
--------~---------- --------~------------------~------
1
'
----------------------------~-------------------' I I
I
I __________________ ! _________ l ________ j __
I I
I
I
_________ L _________ L--------~---------L- -------0 3,000 ..J 1 I
I
2,000 - - - - - -1- - - - - - - - - __:_ - - - - - - - - - ·- - - . - - - - - -1 - - - - - - - - - .1- - - - - - - - - -1
I I
1,000 -------~---------~---------~--------~---------~---------1 I I I
0
0 10 20 30 40 50
Total angle change (degrees)
Figure 3.23 Load vs. total angle change for T -bend specimen PDMl0-3 (single-sided welding, heat input 50.4 kJ/in, neutral flux)
3.3.2.1 Visual Inspection
60
All but three of the specimens had cracks at the weld face after testing. Only two specimens cracked at the weld toe; both were low heat input. This was not the pattern seen with the weathering consumables, in which most of the specimens that cracked at the toe were welded with a high heat input. With only two such cracks, though, perhaps conclusions should not be drawn. There were two specimens that had little or no cracking at the end of the test; both were dart-welded.
The heat-affected zones overlapped in all the dart-welded specimens and in the very highest heat input (50.4 kJ/in) of the single-sided specimens.
3.3.2.2 Weld Capacity
The patterns of load-displacement behavior were not as well defmed as for the weathering materials. Five of the seven specimens that had a sudden drop in capacity were welded one side at a time, which is a similar effect to that found among the weathering specimens. Another five of those seven specimens were also welded at the higher travel speed.
Failure angles are plotted against peak loads in Figure 3.24. The dart-welded specimens undergo the largest distortions while carrying the highest loads. The effect of welding method on load carried should not simply be a matter of weld cross section; the outer profile of the weld should be the same for dart welds and single-sided welds because the equipment used to make them is the same and used
41
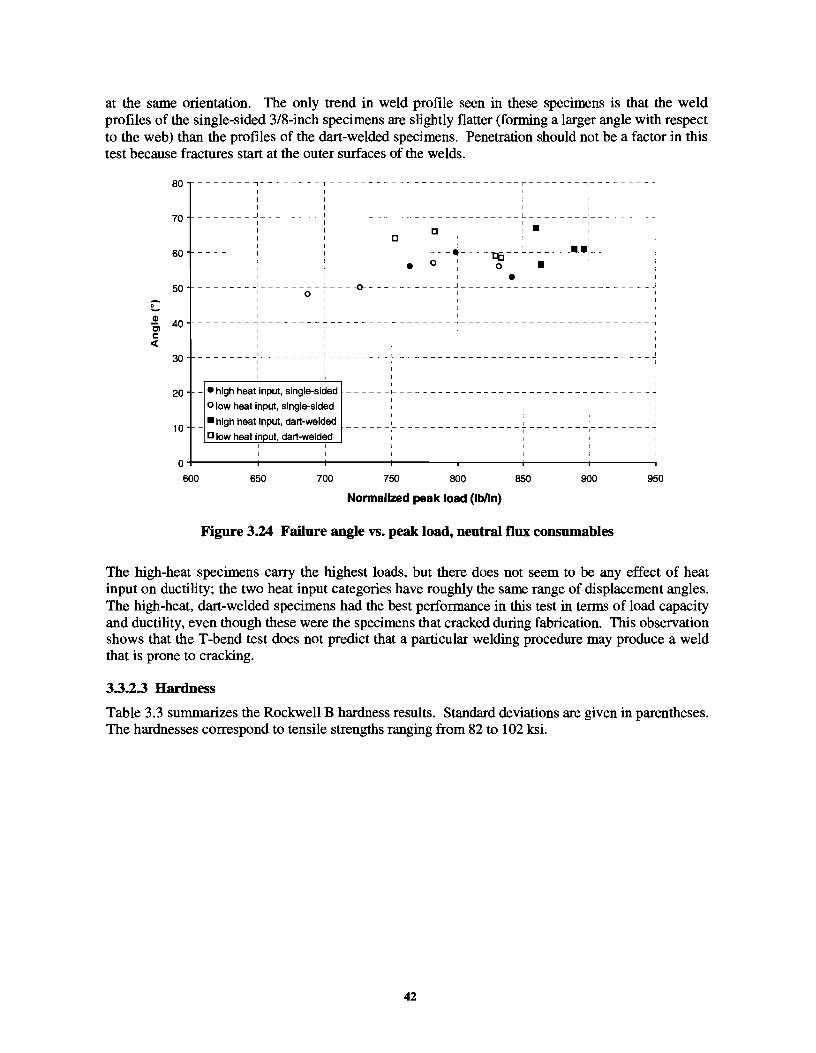
at the same orientation. The only trend in weld profile seen in these specimens is that the weld profiles of the single-sided 3/8-inch specimens are slightly flatter (forming a larger angle with respect to the web) than the profiles of the dart-welded specimens. Penetration should not be a factor in this test because fractures start at the outer surfaces of the welds.
80 -------,--------T-------------------------r-----------------1 I I I
________ I ________ _l_ ______ -·- __________________ l_ ________ I ________ -· ...J
I I I • c 70
I I I 10
60 I I I . _..,
------- -~-------- T------- -~----- ·-- -·- -·- ·-l:C-------- ---------I : I • 0 I O • '
I I • I
50 ________ I ________ _l_ ___ --o- ___ I ________ _j ________ -'-- ____________________ ,
I 0 I i I I I I
Gl c, 40 ------- -1---------+-------- !-----------<-------- t-------- -~-------- ---j
I I 1: <(
30
20
10
I I
________________ ! _________________________ L ______________ J I I '
I I
- • high heat input, single-sided
o low heat input, single-sided
_ • high heat input, dart-welded
c low heat input, dart-welded I I
------~-------~-----------------·--------· I I
I I I -----------------------r----------------l
0+-------~-------+------~------~~------r-------T-------~
600 650 700 750 800 850 900 950
Normalized peak load (lblln)
Figure 3.24 Failure angle vs. peak load, neutral flux consumables
The high-heat specimens carry the highest loads, but there does not seem to be any effect of heat input on ductility; the two heat input categories have roughly the same range of displacement angles. The high-heat, dart-welded specimens had the best performance in this test in terms of load capacity and ductility, even though these were the specimens that cracked during fabrication. This observation shows that the T -bend test does not predict that a particular welding procedure may produce a weld that is prone to cracking.
3.3.2.3 Hardness
Table 3.3 summarizes the Rockwell B hardness results. Standard deviations are given in parentheses. The hardnesses correspond to tensile strengths ranging from 82 to 102 ksi.
42
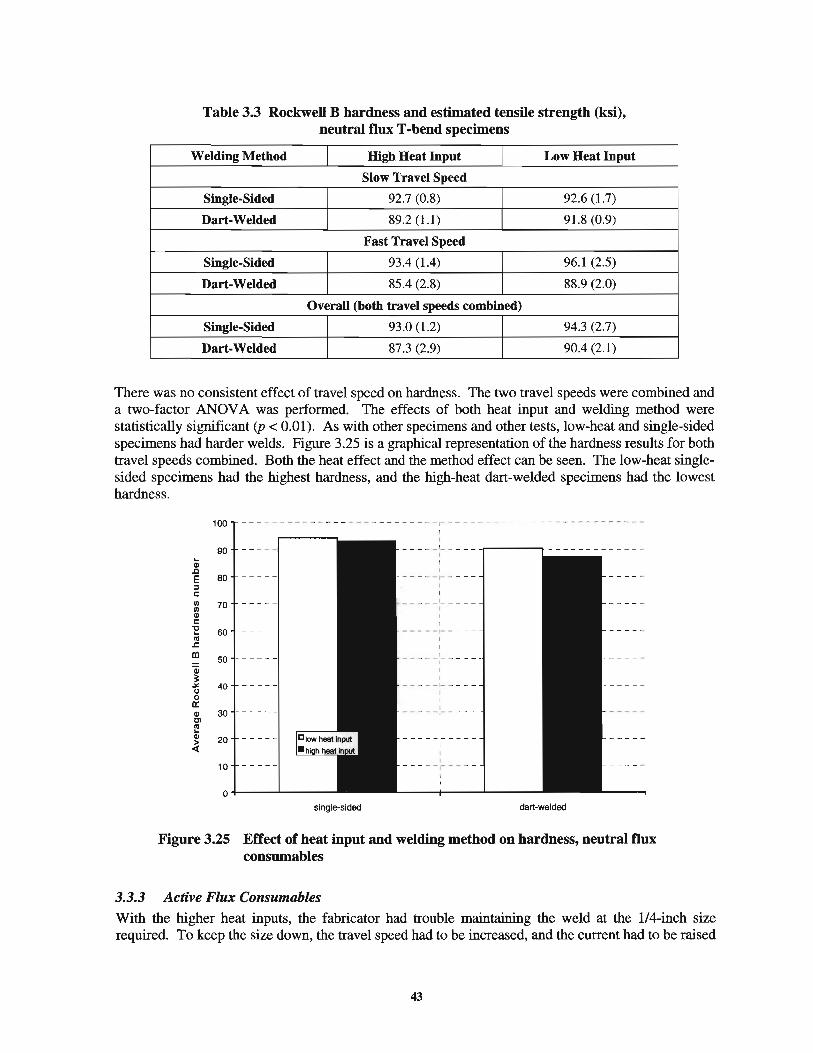
Table 3.3 Rockwell B hardness and estimated tensile strength (ksi), neutral flux T -bend specimens
Welding Method High Heat Input Low Heat Input
Slow Travel Speed
Single-Sided 92.7 (0.8) 92.6 (1.7)
Dart-Welded 89.2 (1.1) 91.8 (0.9)
Fast Travel Speed
Single-Sided 93.4 (1.4) 96.1 (2.5)
Dart-Welded 85.4 (2.8) 88.9 (2.0)
Overall (both travel speeds combined)
Single-Sided 93.0 (1.2) 94.3 (2.7)
Dart-Welded 87.3 (2.9) 90.4 (2.1)
There was no consistent effect of travel speed on hardness. The two travel speeds were combined and a two-factor ANOV A was performed. The effects of both heat input and welding method were statistically significant (p < 0.01). As with other specimens and other tests, low-heat and single-sided specimens had harder welds. Figure 3.25 is a graphical representation of the hardness results for both travel speeds combined. Both the heat effect and the method effect can be seen. The low-heat singlesided specimens had the highest hardness, and the high-heat dart-welded specimens had the lowest hardness.
100
90 a; .!l E 80 ::s c: VI 70 VI Ql
c: "0 60 ... Ill .t:. I!) 50 Qj ~ -"' 40 u 0 a: Ql 30 C1 l! Q) 20 > <t
10
0
Figure3.25
- --- --- -- ---- ------ --.- -------------- - ---- ----- -
single-sided
- - - - - I_ - - - - __,..----'!
I --- --r-- ---
1 I
-----~- - ---1 I I _____ , __ __ _ I I I
- - - - - 1- - - - -
I I
-----1-- ---1
I
I ----~,-- -- -
1 I
-----1-----1
I I -- - --- -- - -
dan-welded
Effect of heat input and welding method on hardness, neutral flux consumables
3.3.3 Active Flux Consumables With the higher heat inputs, the fabricator had trouble maintaining the weld at the 1/4-inch size required. To keep the size down, the travel speed had to be increased, and the current had to be raised
43
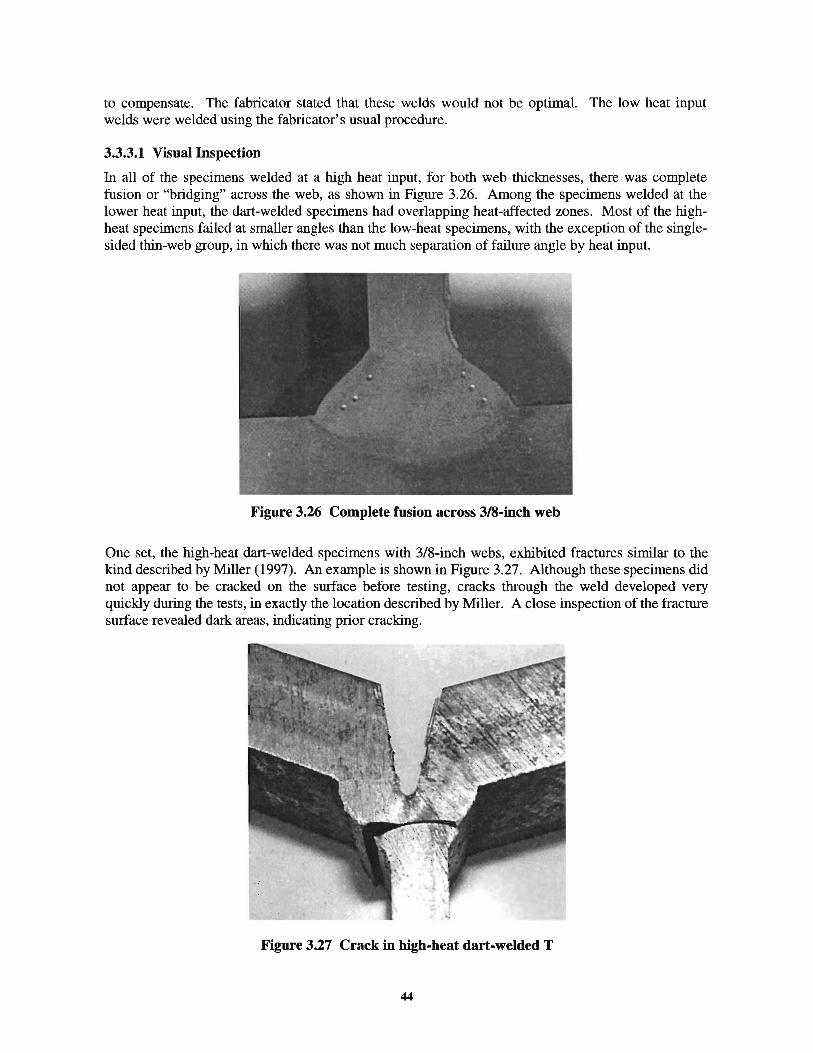
to compensate. The fabricator stated that these welds would not be optimal. The low heat input welds were welded using the fabricator's usual procedure.
3.3.3.1 Visual Inspection
In all of the specimens welded at a high heat input, for both web thicknesses, there was complete fusion or "bridging" across the web, as shown in Figure 3.26. Among the specimens welded at the lower heat input, the dart-welded specimens had overlapping heat-affected zones. Most of the highheat specimens failed at smaller angles than the low-heat specimens, with the exception of the singlesided thin-web group, in which there was not much separation of failure angle by heat input.
Figure 3.26 Complete fusion across 3/8-inch web
One set, the high-heat dart-welded specimens with 3/8-inch webs, exhibited fractures similar to the kind described by Miller (1997). An example is shown in Figure 3.27. Although these specimens did not appear to be cracked on the surface before testing, cracks through the weld developed very quickly during the tests, in exactly the location described by Miller. A close inspection of the fracture surface revealed dark areas, indicating prior cracking.
Figure 3.27 Crack in high-heat dart-welded T
44
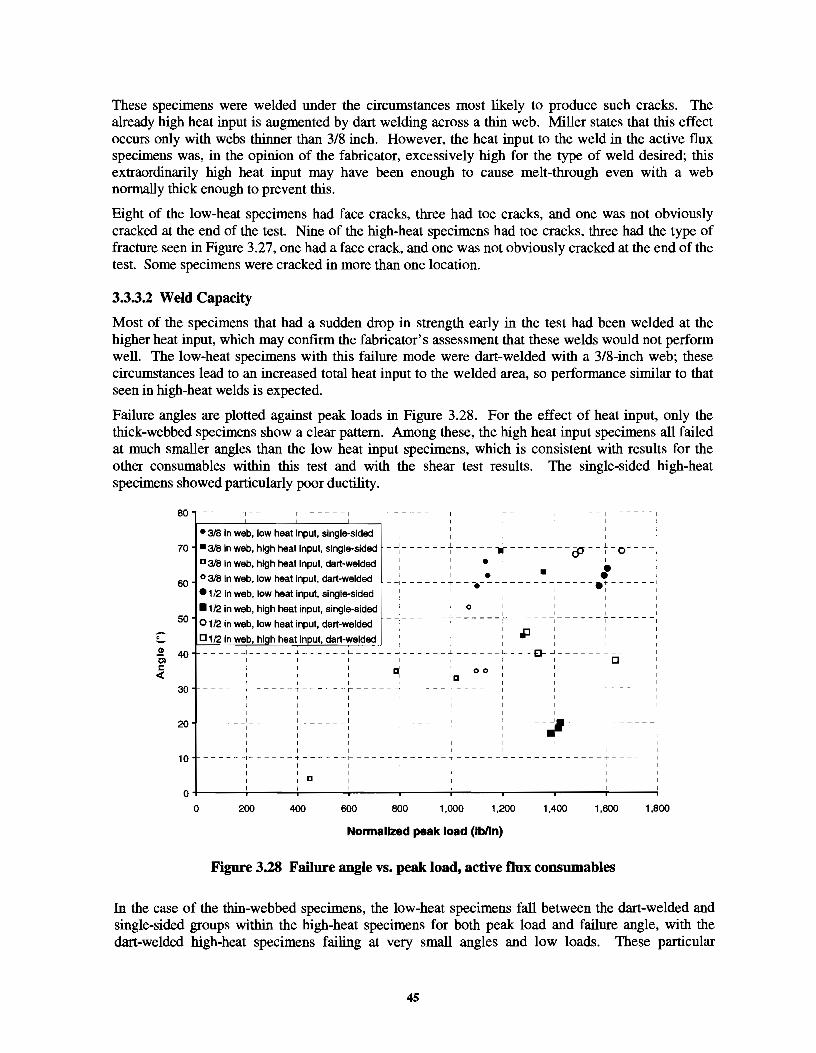
These specimens were welded under the circumstances most likely to produce such cracks. The already high heat input is augmented by dart welding across a thin web. Miller states that this effect occurs only with webs thinner than 3/8 inch. However, the heat input to the weld in the active flux specimens was, in the opinion of the fabricator, excessively high for the type of weld desired; this extraordinarily high heat input may have been enough to cause melt-through even with a web normally thick enough to prevent this.
Eight of the low-heat specimens had face cracks, three had toe cracks, and one was not obviously cracked at the end of the test. Nine of the high-heat specimens had toe cracks, three had the type of fracture seen in Figure 3.27, one had a face crack, and one was not obviously cracked at the end of the test. Some specimens were cracked in more than one location.
3.3.3.2 Weld Capacity
Most of the specimens that had a sudden drop in strength early in the test had been welded at the higher heat input, which may confirm the fabricator's assessment that these welds would not perform well. The low-heat specimens with this failure mode were dart-welded with a 3/8-inch web; these circumstances lead to an increased total heat input to the welded area, so performance similar to that seen in high-heat welds is expected.
Failure angles are plotted against peak loads in Figure 3.28. For the effect of heat input, only the thick-webbed specimens show a clear pattern. Among these, the high heat input specimens all failed at much smaller angles than the low heat input specimens, which is consistent with results for the other consumables within this test and with the shear test results. The single-sided high-heat specimens showed particularly poor ductility.
80
70
60
50 ..... t.. Cl)
40 c, c <(
30
20
10
0 0
• 318 in web, low heat input, single-sided
• 318 in web, high heat input, single-sided
D 318 in web, high heat input, dart-welded
o 318 in web, low heat input, dart-welded
•1 12 in web, low heat input, single-sided
•112 in web, high heat input, single-sided
0 112 in web, low heat input, dart-welded 1
C 112 In web, hi h heet In ut, dart-welded 1
------1
I I
- -;-
I _L _______ _ . ' I • '
• I I :
--- ~-- .- ----- -1 .+---' I
I 0 I I -------- ------~-
I ____ _..J._ ______ c ••• D-_j _______ .l.
I I []
00
I
----I
I
I T --r··--- -----~--·- -~------,
I I I L ____ I __
I I
:---- -.. -I I
···-t---~ r I I I I 1 D I
I
200 400 600 800 1,000 1,200 1,400
Normalized peak load (IMn)
I I i-
1,600
Figure 3.28 Failure angle vs. peak load, active Dux consumables
' ·'
1,800
In the case of the thin-webbed specimens, the low-heat specimens fall between the dart-welded and single-sided groups within the high-heat specimens for both peak load and failure angle, with the dart-welded high-heat specimens failing at very small angles and low loads. These particular
45
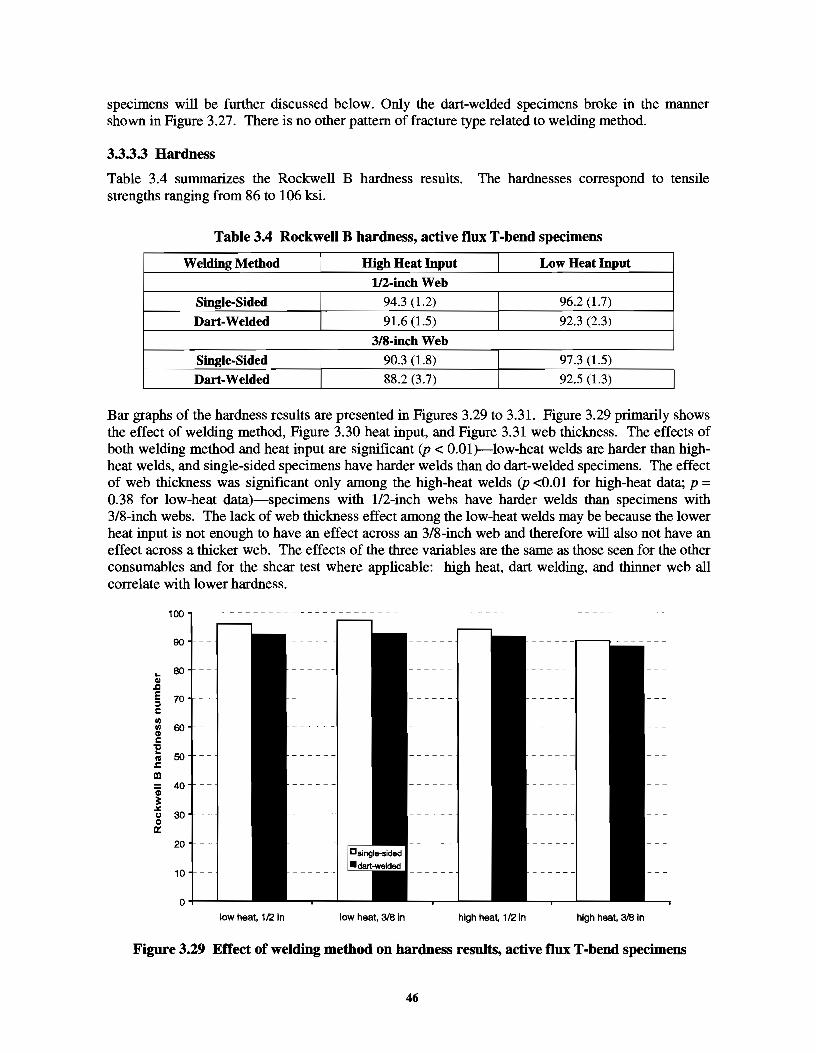
specimens will be further discussed below. Only the dart-welded specimens broke in the manner shown in Figure 3.27. There is no other pattern of fracture type related to welding method.
3.3.3.3 Hardness
Table 3.4 summarizes the Rockwell B hardness results. The hardnesses correspond to tensile strengths ranging from 86 to 106 ksi.
Table 3.4 Rockwell B hardness, active nux T -bend specimens
I Welding Method High Heat Input Low Heat Input
1/2-incb Web
Single-Sided 94.3 (1.2) 96.2 (1.7)
Dart· Welded 91.6 (1.5) 92.3 (2.3)
3/8-incb Web
Single-Sided 90.3 (1.8) 97.3 (1.5)
Dart-Welded 88.2 (3.7) 92.5 (1.3)
Bar graphs of the hardness results are presented in Figures 3.29 to 3.31. Figure 3.29 primarily shows the effect of welding method, Figure 3.30 heat input, and Figure 3.31 web thickness. The effects of both welding method and heat input are significant (p < 0.01)-low-heat welds are harder than highheat welds, and single-sided specimens have harder welds than do dart-welded specimens. The effect of web thickness was significant only among the high-heat welds (p <0.01 for high-heat data; p = 0.38 for low-heat data)-specimens with 1/2-inch webs have harder welds than specimens with 3/8-inch webs. The lack of web thickness effect among the low-heat welds may be because the lower heat input is not enough to have an effect across an 3/8-inch web and therefore will also not have an effect across a thicker web. The effects of the three variables are the same as those seen for the other consumables and for the shear test where applicable: high heat, dart welding, and thinner web all correlate with lower hardness.
100
90
.. 80 (I) .c E 10 :1 c Ill Ill (I) c l! tG 50 .s: ID
~ 40
~ 30
20
10
low heat, 112 in low heat, 318 in high heat, 1 /2 in high heat, 318 in
Figure 3.29 Effect of welding method on hardness results, active nux T -bend specimens
46
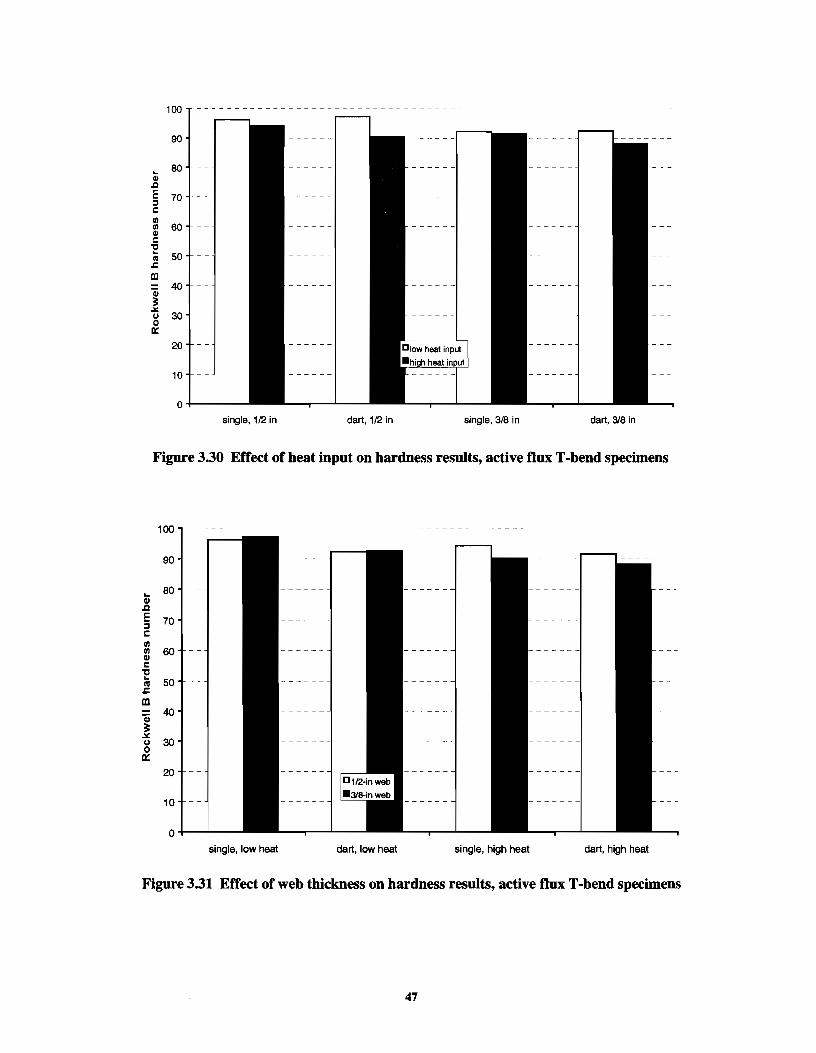
100
90
.... 80 Ql
.1:1 E 70 :I c 1/) 1/) 60 Ql c "C ....
50 Cll .r:: ID
Q; 40
~ (.,) 0
30 a::
20
10
0 single, 1 f2 in dart, 112 in single, 3/8 in dart, 318 in
Figure 3.30 Effect of heat input on hardness results, active nux T -bend specimens
100
90
.. 80 <D
.1:1 E 70 :1 c 1/) II) 60 <D c
"C .... 50 Ill .r::
ID
Q; 40
~ .:J:.
30 (.,) 0 a::
20
10
0 single, low heat dart, low heat single, high heat dart, high heat
Figure 3.31 Effect of web thickness on hardness results, active nux T -bend specimens
47
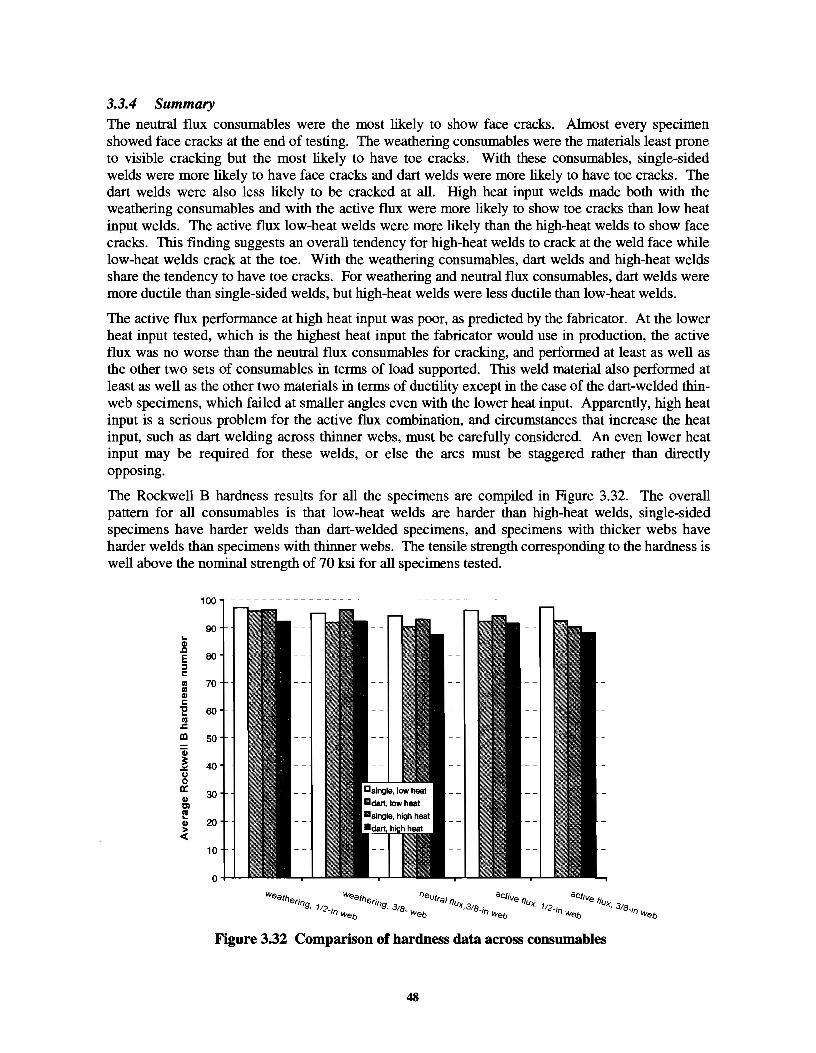
3.3.4 Summary The neutral flux consumables were the most likely to show face cracks. Almost every specimen showed face cracks at the end of testing. The weathering consumables were the materials least prone to visible cracking but the most likely to have toe cracks. With these consumables, single-sided welds were more likely to have face cracks and dart welds were more likely to have toe cracks. The dart welds were also less likely to be cracked at all. High heat input welds made both with the weathering consumables and with the active flux were more likely to show toe cracks than low heat input welds. The active flux low-heat welds were more likely than the high-heat welds to show face cracks. This finding suggests an overall tendency for high-heat welds to crack at the weld face while low-heat welds crack at the toe. With the weathering consumables, dart welds and high-heat welds share the tendency to have toe cracks. For weathering and neutral flux consumables, dart welds were more ductile than single-sided welds, but high-heat welds were less ductile than low-heat welds.
The active flux performance at high heat input was poor, as predicted by the fabricator. At the lower heat input tested, which is the highest heat input the fabricator would use in production, the active flux was no worse than the neutral flux consumables for cracking, and performed at least as well as the other two sets of consumables in terms of load supported. This weld material also performed at least as well as the other two materials in terms of ductility except in the case of the dart-welded thinweb specimens, which failed at smaller angles even with the lower heat input. Apparently, high heat input is a serious problem for the active flux combination, and circumstances that increase the heat input, such as dart welding across thinner webs, must be carefully considered. An even lower heat input may be required for these welds, or else the arcs must be staggered rather than directly opposing.
The Rockwell B hardness results for all the specimens are compiled in Figure 3.32. The overall pattern for all consumables is that low-heat welds are harder than high-heat welds, single-sided specimens have harder welds than dart-welded specimens, and specimens with thicker webs have harder welds than specimens with thinner webs. The tensile strength corresponding to the hardness is well above the nominal strength of 70 ksi for all specimens tested.
100
90 .. Gl ..c eo E ::J 1: Ul 70 Ul Gl 1:
'E 60 c; J::.
ID 50 'ii 3: 40 .X u 0 0::
30 Gl Cl 1.!
20 Gl > <
10
0
Figure 3.32 Comparison of hardness data across consumables
48
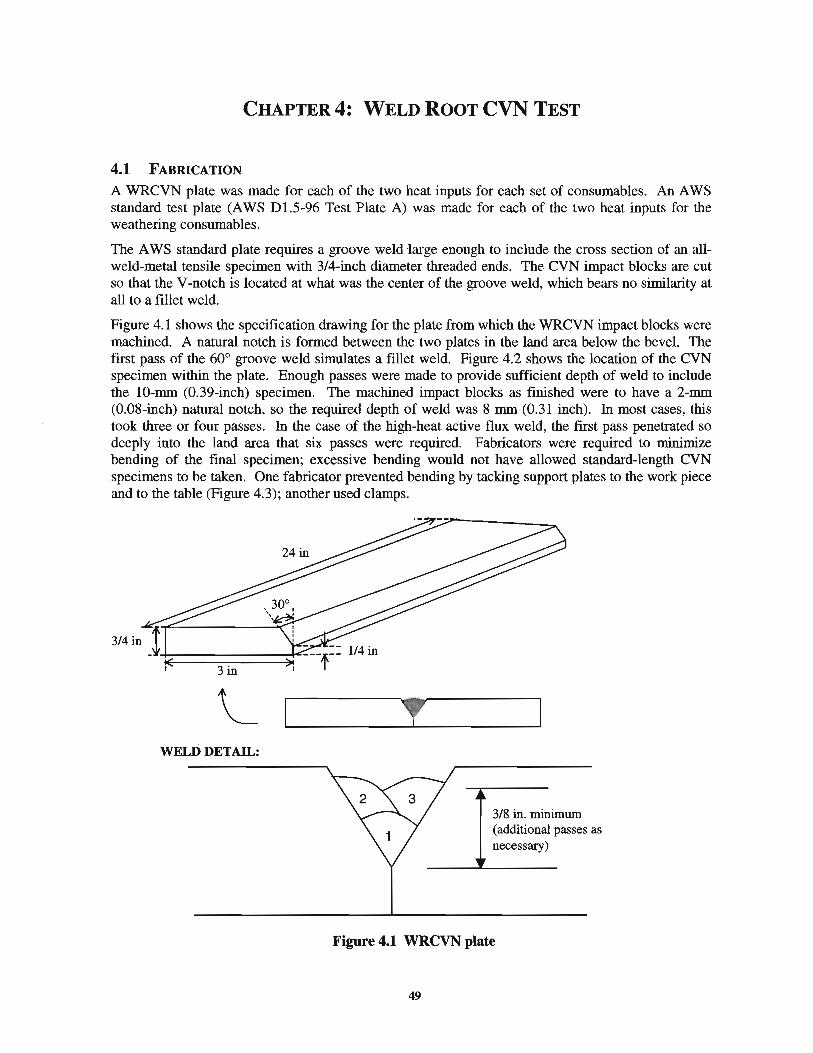
CHAPTER 4: WELD ROOT CVN TEST
4.1 FABRICATION
A WRCVN plate was made for each of the two heat inputs for each set of consumables. An A WS standard test plate (A WS 01.5-96 Test Plate A) was made for each of the two heat inputs for the weathering consumables.
The A WS standard plate requires a groove weld large enough to include the cross section of an allweld-metal tensile specimen with 3/4-inch diameter threaded ends. The CVN impact blocks are cut so that the V -notch is located at what was the center of the groove weld, which bears no similarity at all to a fillet weld.
Figure 4.1 shows the specification drawing for the plate from which the WRCVN impact blocks were machined. A natural notch is formed between the two plates in the land area below the bevel. The first pass of the 60° groove weld simulates a fillet weld. Figure 4.2 shows the location of the CVN specimen within the plate. Enough passes were made to provide sufficient depth of weld to include the 10-mm (0.39-inch) specimen. The machined impact blocks as finished were to have a 2-mm (0.08-inch) natural notch, so the required depth of weld was 8 mm (0.31 inch). In most cases, this took three or four passes. In the case of the high-heat active flux weld, the first pass penetrated so deeply into the land area that six passes were required. Fabricators were required to minimize bending of the final specimen; excessive bending would not have allowed standard-length CVN specimens to be taken. One fabricator prevented bending by tacking support plates to the work piece and to the table (Figure 4.3); another used clamps.
WELD DETAD.-: ' 3/8 in. minimum (additional passes as necessary)
Figure 4.1 WRCVN plate
49
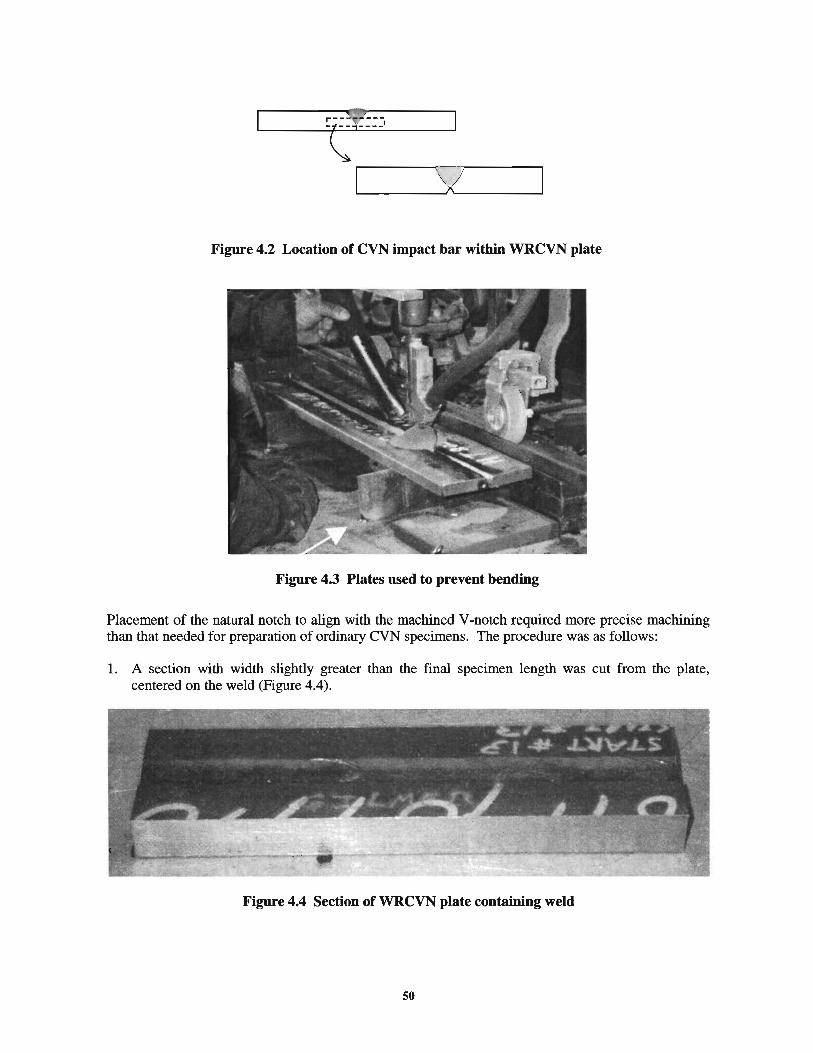
1~------~\-,-./-;--------~
~---------~A~--------~
Figure 4.2 Location of CVN impact bar within WRCVN plate
Figure 4.3 Plates used to prevent bending
Placement of the natural notch to align with the machined V -notch required more precise machining than that needed for preparation of ordinary CVN specimens. The procedure was as follows:
1. A section with width slightly greater than the fmal specimen length was cut from the plate, centered on the weld (Figure 4.4).
Figure 4.4 Section of WRCVN plate containing weld
50
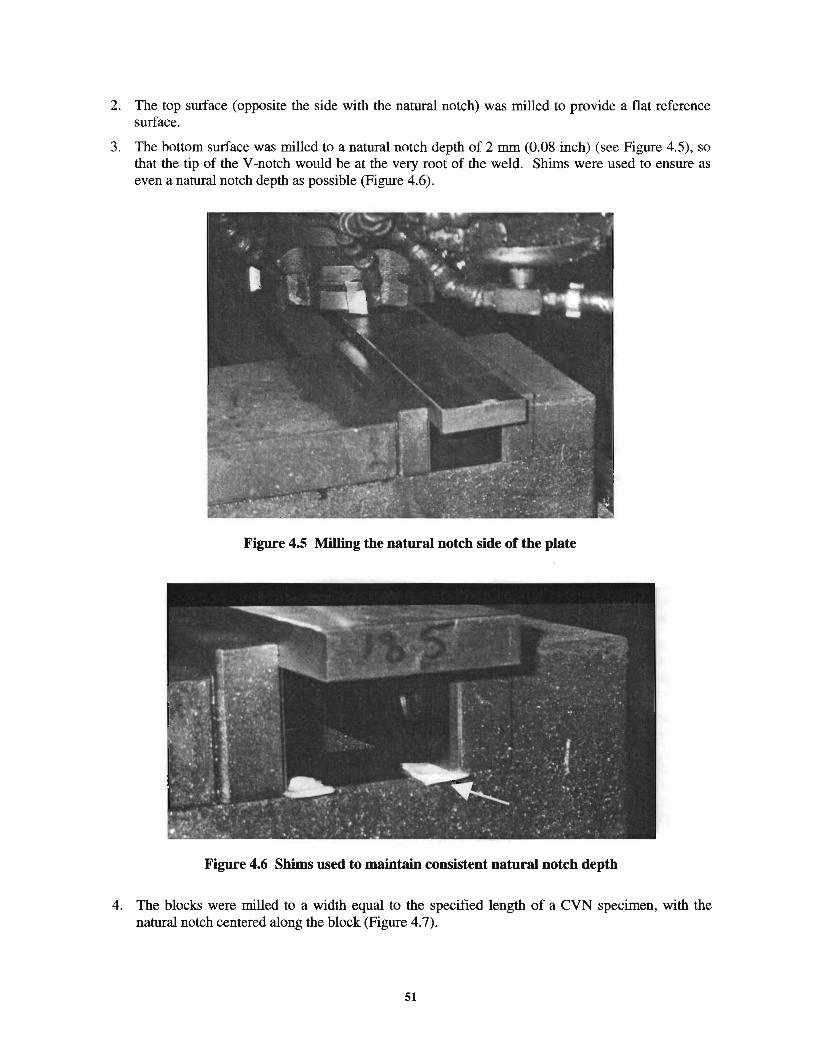
2. The top surface (opposite the side with the natural notch) was milled to provide a flat reference surface.
3. The bottom surface was milled to a natural notch depth of 2 mm (0.08 inch) (see Figure 4.5), so that the tip of the V -notch would be at the very root of the weld. Shims were used to ensure as even a natural notch depth as possible (Figure 4.6).
Figure 4.5 Milling the natural notch side of the plate
Figure 4.6 Shims used to maintain consistent natural notch depth
4. The blocks were milled to a width equal to the specified length of a CVN specimen, with the natural notch centered along the block (Figure 4.7).
51
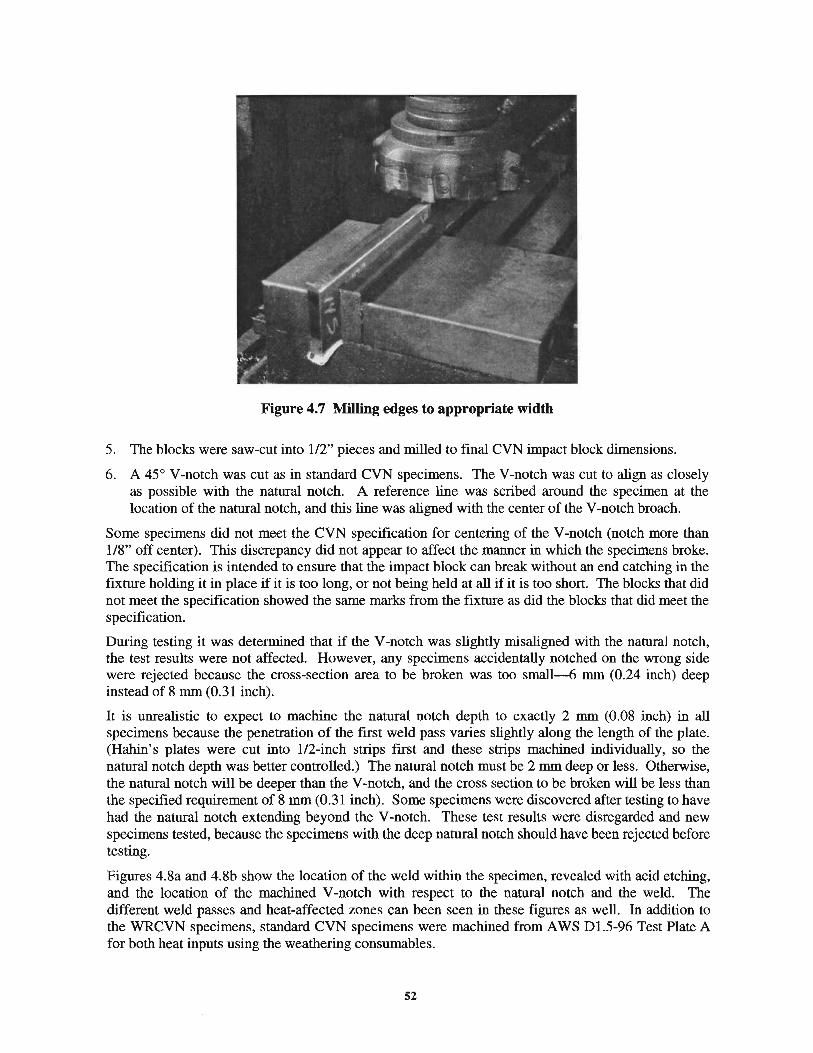
Figure 4.7 Milling edges to appropriate width
5. The blocks were saw-cut into 1/2" pieces and milled to final CVN impact block dimensions.
6. A 45° V -notch was cut as in standard CVN specimens. The V -notch was cut to align as closely as possible with the natural notch. A reference line was scribed around the specimen at the location of the natural notch, and this line was aligned with the center of the V -notch broach.
Some specimens did not meet the CVN specification for centering of the V -notch (notch more than 1/8" off center). This discrepancy did not appear to affect the manner in which the specimens broke. The specification is intended to ensure that the impact block can break without an end catching in the fixture holding it in place if it is too long, or not being held at all if it is too short. The blocks that did not meet the specification showed the same marks from the fixture as did the blocks that did meet the specification.
During testing it was determined that if the V -notch was slightly misaligned with the natural notch, the test results were not affected. However, any specimens accidentally notched on the wrong side were rejected because the cross-section area to be broken was too small--6 mm (0.24 inch) deep instead of 8 mm (0.31 inch).
It is unrealistic to expect to machine the natural notch depth to exactly 2 mm (0.08 inch) in all specimens because the penetration of the first weld pass varies slightly along the length of the plate. (Hahin's plates were cut into 1/2-inch strips first and these strips machined individually, so the natural notch depth was better controlled.) The natural notch must be 2 mm deep or less. Otherwise, the natural notch will be deeper than the V -notch, and the cross section to be broken will be less than the specified requirement of 8 mm (0.31 inch). Some specimens were discovered after testing to have had the natural notch extending beyond the V -notch. These test results were disregarded and new specimens tested, because the specimens with the deep natural notch should have been rejected before testing.
Figures 4.8a and 4.8b show the location of the weld within the specimen, revealed with acid etching, and the location of the machined V -notch with respect to the natural notch and the weld. The different weld passes and heat-affected zones can been seen in these figures as well. In addition to the WRCVN specimens, standard CVN specimens were machined from A WS D1.5-96 Test Plate A for both heat inputs using the weathering consurnables.
52
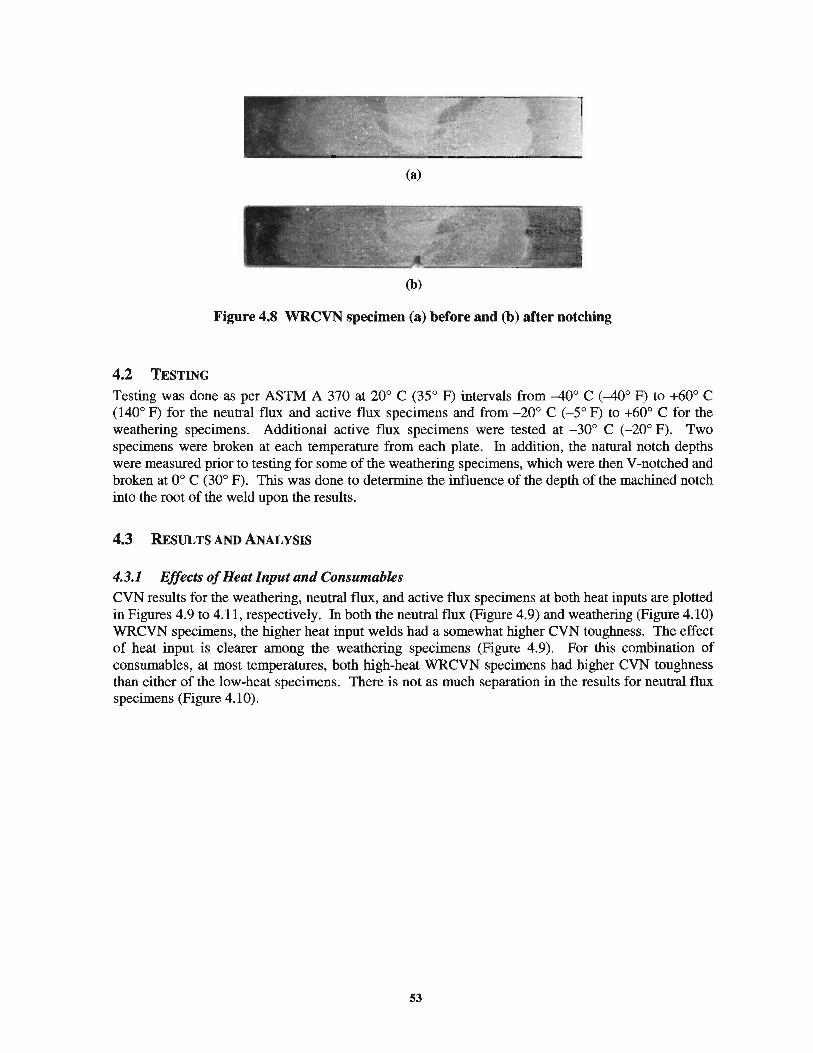
(a)
(b)
Figure 4.8 WRCVN specimen (a) before and (b) after notching
4.2 TESTING
Testing was done as per ASTM A 370 at 20° C (35° F) intervals from -40° C ( -40° F) to +60° C (140° F) for the neutral flux and active flux specimens and from -20° C (-5° F) to +60° C for the weathering specimens. Additional active flux specimens were tested at -30° C (-20° F). Two specimens were broken at each temperature from each plate. In addition, the natural notch depths were measured prior to testing for some of the weathering specimens, which were then V -notched and broken at 0° C (30° F). This was done to determine the influence of the depth of the machined notch into the root of the weld upon the results.
4.3 RESULTS AND ANALYSIS
4.3.1 Effects of Heat Input and Consumables CVN results for the weathering, neutral flux, and active flux specimens at both heat inputs are plotted in Figures 4.9 to 4.11, respectively. In both the neutral flux (Figure 4.9) and weathering (Figure 4.10) WRCVN specimens, the higher heat input welds had a somewhat higher CVN toughness. The effect of heat input is clearer among the weathering specimens (Figure 4.9). For this combination of consumables, at most temperatures, both high-heat WRCVN specimens had higher CVN toughness than either of the low-heat specimens. There is not as much separation in the results for neutral flux specimens (Figure 4.10).
53
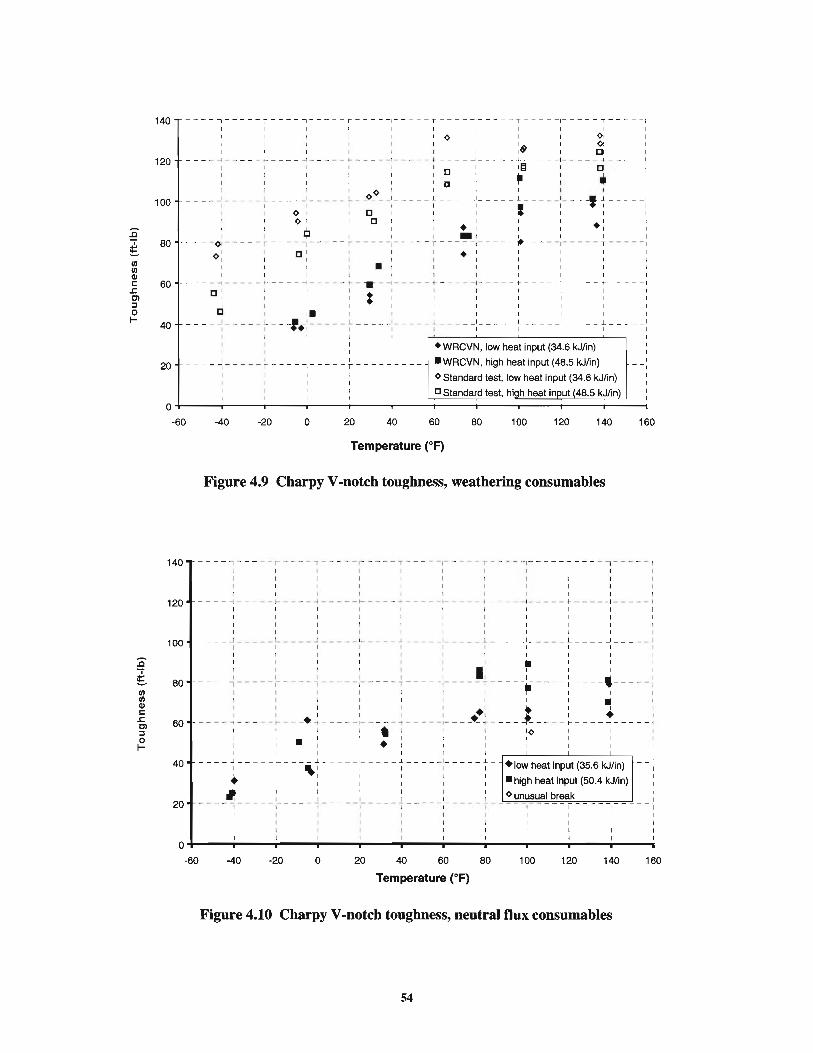
~
t Vl II) Ql 1: s= Cl ::1 0 1-
140 -- - - , -- -- - r ---- , ----- r---- - ,----- r---- - ,-- --- T - --- - ~--- -- T- - -- - ,
120
100
80
60
40
20
I I ¢ I ~
:~ g --- ~ -1-- -- - ~ - --- -l - - -- - ~ --- - - 1- - - -- f- -- -- -1-- - -- -1- -- - - - I - --- - I ~ -- - I
I I I I I I [] I 11:;1 I []
: I I : a ~ • I
I I ' () I I I I I J I -----'-- ---~ -- - ~ -1 .----:--:---:-----~ - - - - -:---- -~--- --:----t:-- ---: ¢ I I [J I .I
I r!l : I :. : I I : I --- -o. - - - - r - - -- '- -- -- r - -- - r---- -~- - - -- ~ - - - -~----- T---- - ~
o l I
... [J I
I
[J : : • I
I • ' I I I
- - - +- -- - - -j - -- - - '·- T - -1--- -- +-- -- - - 1- --- - + - - - - -I
: I : : I I : I
I I I
C I I. I I I I I I
--- --- - - --~- - -1.;- - --- L ---- -- - --- ~ -- - - - : - - - -- t --- - _I
-- + -- - - I
I
I I _ _ j_ ___ _ _ l
I I
I I I I I ---- , -----r - - --,- -- - - r - - - -,- - --• WRCVN, low heat input (34.6 kJ/in)
•wRCVN, high heat input (48.5 kJ!in)
o Standard test, low heat input (34.6 kJ/in)
c Standard test, high heat input (48.5 kJ/in)
0~--~--~--~--~--~--~==~==~==~==~~ -60 -40 -20 0 20 40 60 80 100 120 140 160
Temperature eF)
Figure 4.9 Charpy V -notch toughness, weathering consumables
140 - -- - , -·-- -- r---- -r-- - - -r ---- T ·-- - - ~- - --- r- ~-- - --r --- - , --- - - 1
120
100
80
60
40
20
I I I I I I I
-- - - -t - -- -- ~- - - - I --- - -I-- - - - -+ ---- - 1----- + - -- - - I - -- -- 1- - -- -J --- - - I I I I I I I
I I I I I I I I I I I
- - -- ~-----L----J-----L- --- ~ - ---~-----~- --- ~- --- - L --- -~ -- - --1 I I I I I I I I I
I I I I I • I I I
I I I : I I ' I I I I
--- - ,----- r - ------ - --r- -- -,--- -- ~---- + - -- - J-- -- - } --- -·-- ---l I I ~ I I I
I I I I I I • I I I I I I . I • I I I
----~-- -· ~ - -- --~- - - - ~ - ----:---~~ ~ --- --t-- --- ~--- - ~- - - - - : I t : :<> I
• • I
I
---- ....J - - --- L --- - ..l--- - _J_ ---- ...l. ---- -1- -- - - J..-'I I I
~ I 1 I : I ---- , -------- -- ,-----r----r-- --------r-1 I I I I I
+low heat input (35.6 kJ/in)
• high heat input (50.4 kJ/in)
o unusual break
--I
I 0+---~~---r----~---,----~----~--~----,---~~---r--~
-60 -40 -20 0 20 40 60 80 100 120 140 160
Temperature (•F)
Figure 4.10 Charpy V -notch toughness, neutral flux consumables
54
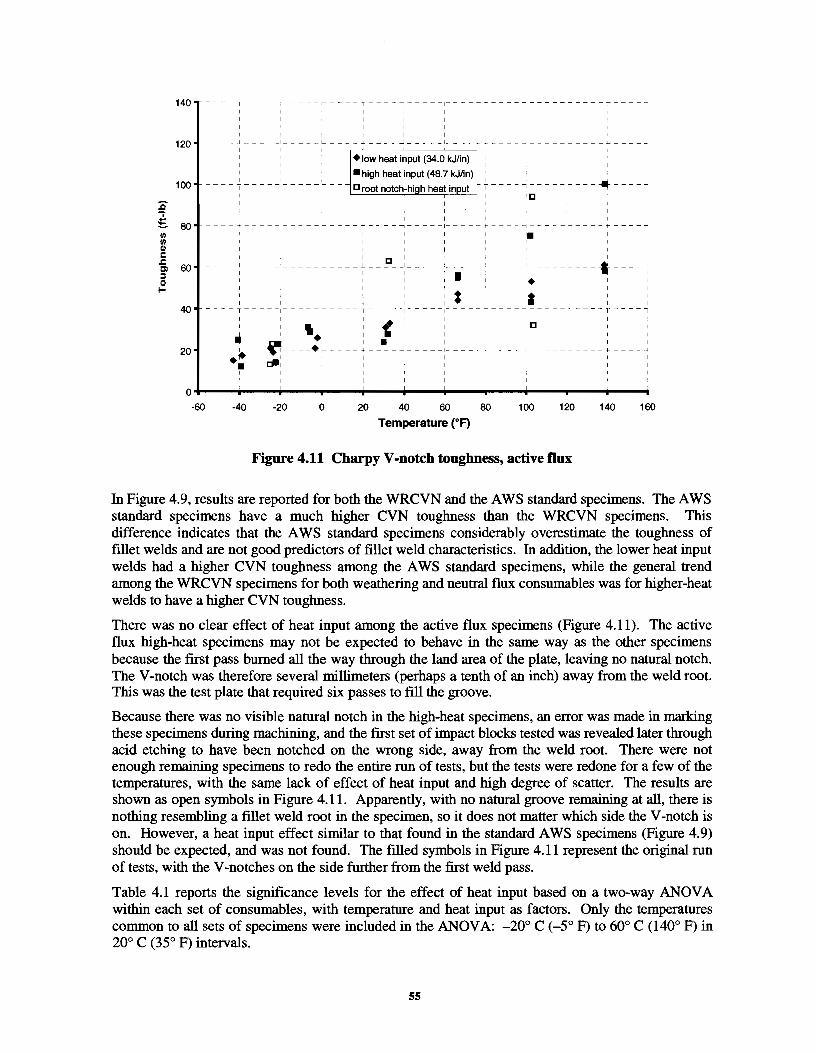
;§' t !J) !J)
Ql c .c Cl :I 0
1-
140
120
100
80
80
40
20
r----T- ·· ··1
I I I I
-- -1 --
I I I I ,__
+low heat input (34.0 kJ/in)
•high heat Input (48.7 kJ!In) - - - - - - D root notch-high heat input
r --- T
I I
I I
I [I I -----~----l----~-
I I I I
I I
I
t ... ·- -- -:-- -- - ,--- -- T---- -1
.~•
I I
I 'I I i I I .I I II I
~----·~----~-----~--- I ~:~~: ' : : I
I I
------ ----·----~ I [I
~
I ---,----.---- '
I
I ----------------T--
I
I -1
[]
- - - - ,_ - - - - +- - - - - --l
I I
I I
I
0+---~----T----+----~---r----~---P--~~--~--~--~ -60 -20 0 20 40 60 80 100 120 140 160
Temperature (0 F)
Figure 4.11 Charpy V -notch toughness, active flux
In Figure 4.9, results are reported for both the WRCVN and the A WS standard specimens. The A WS standard specimens have a much higher CVN toughness than the WRCVN specimens. This difference indicates that the A WS standard specimens considerably overestimate the toughness of fillet welds and are not good predictors of fillet weld characteristics. In addition, the lower heat input welds had a higher CVN toughness among the A WS standard specimens, while the general trend among the WRCVN specimens for both weathering and neutral flux consumables was for higher-heat welds to have a higher CVN toughness.
There was no clear effect of heat input among the active flux specimens (Figure 4.11). The active flux high-heat specimens may not be expected to behave in the same way as the other specimens because the frrst pass burned all the way through the land area of the plate, leaving no natural notch. The V -notch was therefore several millimeters (perhaps a tenth of an inch) away from the weld root. This was the test plate that required six passes to fill the groove.
Because there was no visible natural notch in the high-heat specimens, an error was made in marking these specimens during machining, and the first set of impact blocks tested was revealed later through acid etching to have been notched on the wrong side, away from the weld root. There were not enough remaining specimens to redo the entire run of tests, but the tests were redone for a few of the temperatures, with the same lack of effect of heat input and high degree of scatter. The results are shown as open symbols in Figure 4.11. Apparently, with no natural groove remaining at all, there is nothing resembling a fillet weld root in the specimen, so it does not matter which side the V -notch is on. However, a heat input effect similar to that found in the standard A WS specimens (Figure 4.9) should be expected, and was not found. The filled symbols in Figure 4.11 represent the original run of tests, with the V -notches on the side further from the first weld pass.
Table 4.1 reports the significance levels for the effect of heat input based on a two-way ANOVA within each set of consumables, with temperature and heat input as factors. Only the temperatures common to all sets of specimens were included in the ANOVA: -20° C (-5° F) to 60° C (140° F) in 20° C (35° F) intervals.
55
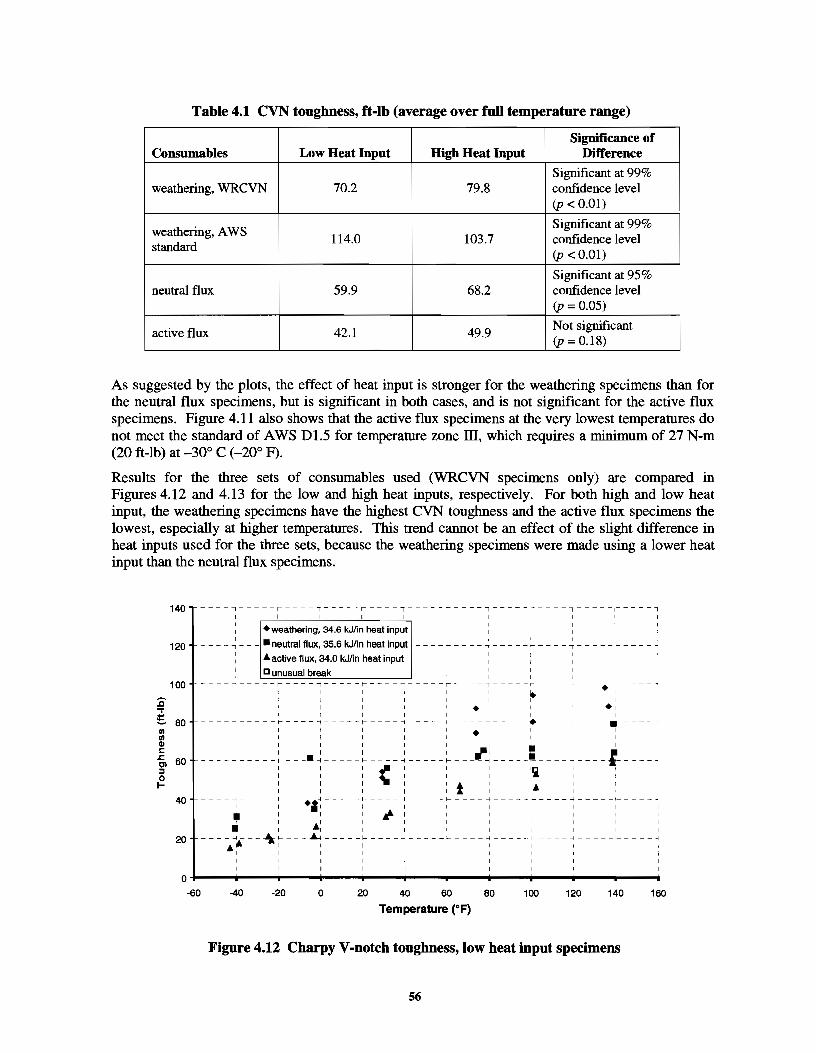
Table 4.1 CVN toughness, ft-lb (average over full temperature range)
Significance of Consumables Low Heat Input High Heat Input Difference
Significant at 99% weathering, WRCVN 70.2 79.8 confidence level
(p < 0.01)
weathering, A WS Significant at 99%
114.0 103.7 confidence level standard
(p <0.01)
Significantat95% neutral flux 59.9 68.2 confidence level
(p = 0.05)
active flux 42.1 49.9 Not significant (p = 0.18)
As suggested by the plots, the effect of heat input is stronger for the weathering specimens than for the neutral flux specimens, but is significant in both cases, and is not significant for the active flux specimens. Figure 4.11 also shows that the active flux specimens at the very lowest temperatures do not meet the standard of AWS Dl.5 for temperature zone ill, which requires a minimum of 27 N-m (20 ft-lb) at -30° C (-20° F).
Results for the three sets of consumables used (WRCVN specimens only) are compared in Figures 4.12 and 4.13 for the low and high heat inputs, respectively. For both high and low heat input, the weathering specimens have the highest CVN toughness and the active flux specimens the lowest, especially at higher temperatures. This trend cannot be an effect of the slight difference in heat inputs used for the three sets, because the weathering specimens were made using a lower heat input than the neutral flux specimens.
;e ~ Ill Ill Cll c s:. en ~ 0 1-
140
120
100
80
60
40
20 • • .. ... ... -.1-....
I
I I r-------j---~"t-
1 I I I I I I I
-r----•-1~ I I I
I I ~---r------1---~-r-
1 +al I I I I
: ·: : ~~ _.., _____ 1-
r--------- ~-
-r-----,----1 I
I
• I I
--r------t-• I
'
•
~~J---- _; .. 'i
: t I : ...
----1-------t
L-----.-+--1
I .,.-----~-----.,
I
""
I
I I .-:---- - ~
I
+:
~-.----~~
-· ... ----I-----_;
0+---~-----r----~--~----~----~---+----~--~~---P--~ ·60 -40 -20 0 20 40 60 80 100 120 140 160
Temperature (0 F)
Figure 4.12 Charpy V -notch toughness, low heat input specimens
56
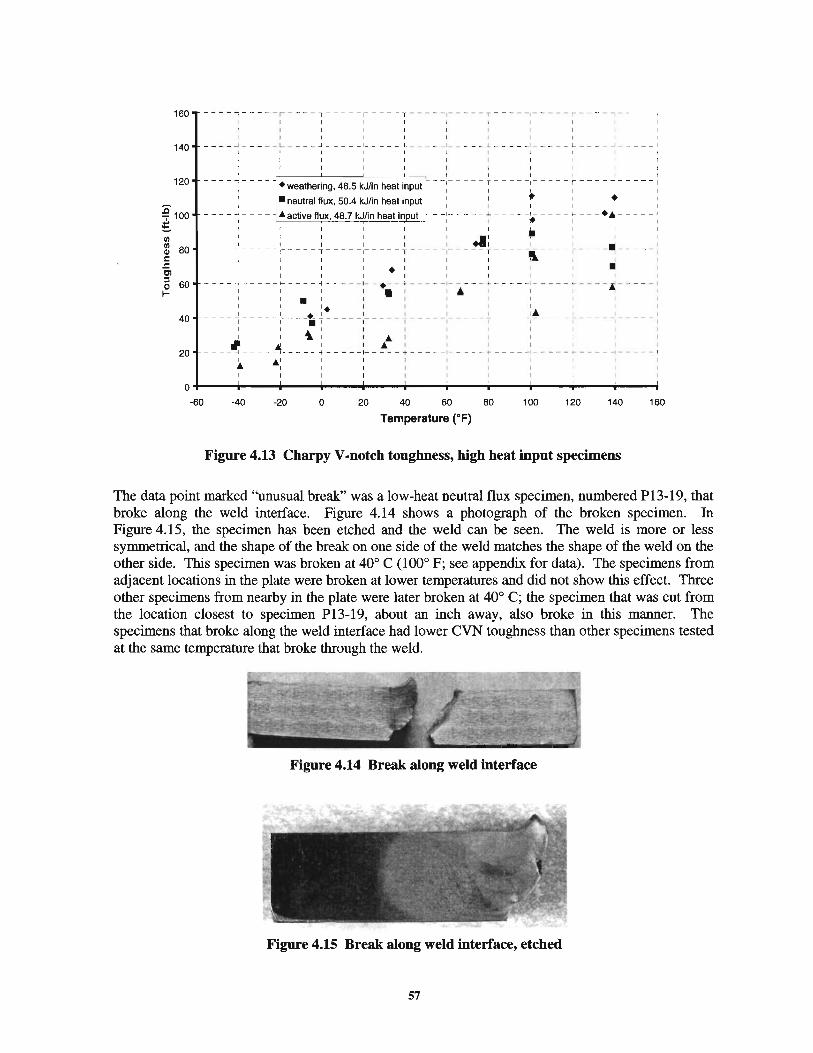
160 - -- -, --- -- r - - - - ,---- -~---- - T --- - -~-- -- T -- - - -~- --- r- -- - I- - --- I
140
120
;e 100
~ (/)
~ 80 1: .I:. Cl
5 60 1-
40
20
I I I I
I I I t I I ---- ~- -- --~- -- 3 _____ L ____ l _ 1-- -- - .J.. - - - - • I_ - - _ - L __ - --..! _ _ _ __ I
I I I 1 I I I
t I
-- -- ~ ---- r-----'-----'----.J...._---,_- - :------ ~---- - :----- ~ ---- -:----- : +weathering, 48.5 kJ/in heat input
' I I
t l I I I • neutral flux, 50.4 kJ/In heat input ~ •
---- ~---- A active flux, 48.7 kJ/In heat input --:-- --- ~ ---- -;.---- ~-- -+~-----: I I I I I I I .. I I I
---- ~ -----!----- ~--- -+---- + - --- -:-- - ~t---- i- --- ~- - --~ - - -- - i I • I I • I I I I I I I I I I
--- -~---- ~-- - - -:- - · -- ~ - -- - -:- . -- - ~ - - - - -:- -- -- :·----6. -- -- -: I I • I l • I I I I I I
I I I. I I I :... : I I ---- ~---- -:--- -t. ~---- -~--- - - +--- --:- --- - -- ---,- ---- ,- -- --,- --- -: : ~: : A : I I
--- -~---- );_---- ~-- - - -:-- ~-- ~--- - -1- - -- - ---- · : - · - ·· - t - ----1- - -- - I
I A' I I A I I
I I
o+---~~---+----~----~--~----~----~--~~--~----~--~ -60 -40 -20 0 20 40 60 80 100 120 140 160
Temperature (°F)
Figure 4.13 Charpy V -notch toughness, high heat input specimens
The data point marked ''unusual break'' was a low-heat neutral flux specimen, numbered Pl3-19, that broke along the weld interface. Figure 4.14 shows a photograph of the broken specimen. In Figure 4.15, the specimen has been etched and the weld can be seen. The weld is more or less symmetrical, and the shape of the break on one side of the weld matches the shape of the weld on the other side. This specimen was broken at 40° C (100° F; see appendix for data). The specimens from adjacent locations in the plate were broken at lower temperatures and did not show this effect. Three other specimens from nearby in the plate were later broken at 40° C; the specimen that was cut from the location closest to specimen P13-19, about an inch away, also broke in this manner. The specimens that broke along the weld interface had lower CVN toughness than other specimens tested at the same temperature that broke through the weld.
Figure 4.14 Break along weld interface
Figure 4.15 Break along weld interface, etched
57
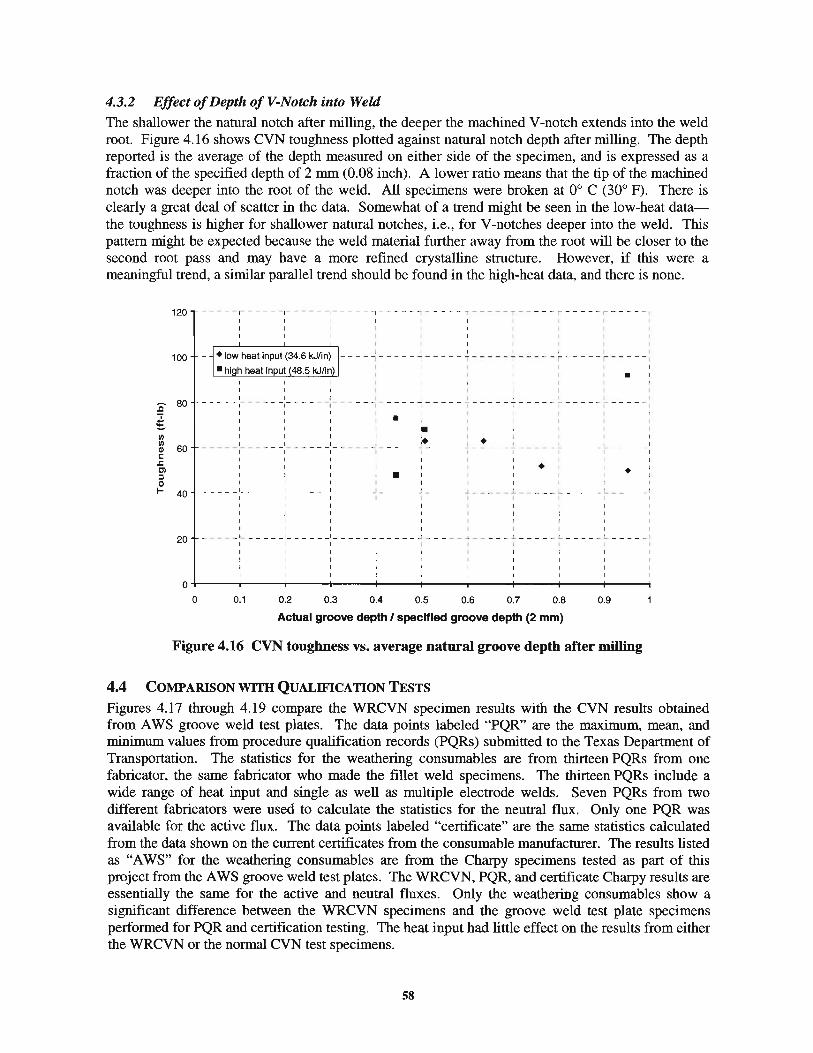
4.3.2 Effect of Depth of V-Notch into Weld
The shallower the natural notch after milling, the deeper the machined V -notch extends into the weld root. Figure 4.16 shows CVN toughness plotted against natural notch depth after milling. The depth reported is the average of the depth measured on either side of the specimen, and is expressed as a fraction of the specified depth of 2 mm (0.08 inch). A lower ratio means that the tip of the machined notch was deeper into the root of the weld. All specimens were broken at 0° C (30° F). There is clearly a great deal of scatter in the data. Somewhat of a trend might be seen in the low-heat datathe toughness is higher for shallower natural notches, i.e., for V -notches deeper into the weld. This pattern might be expected because the weld material further away from the root will be closer to the second root pass and may have a more refined crystalline structure. However, if this were a meaningful trend, a similar parallel trend should be found in the high-heat data, and there is none.
120 -- - - - ~----- - ~- - - - - -~ - --- - '----- 1- - - - - 1 ----- T-- - - - r - - - - - r - - - - - ~
I I I I I I I I I I I I I I I I
I I I 100 - ---- , -----,----- -----,-----,-----------
1
• I
I I I I I I :c 80 ---- - ~--- - - -~---- --,--- -- -~ - --- -,-----I
-----~---- - ---- - .- - - -- -•
!/) I I :. _! __ _ 1_ _ ___ _
~ 60 - ---- :--- - - -: - - . -- -:- - - -·--,- ---- -- ----I
____ _ :.._ ____ _ I
t: ..c:: Cl ::J 0
I
I I • I • •
I I I I I I I _____ 1_ _ _ __ I_ _ _ __ I _____ J _ ____ ...I _ ____ .J. _ _ _ ~- _ ~ _ _ __ _ L ____ _ L _ _ _ _ _ I
I I I I I I I I 1- 40
I I I I
I I I I
20 - --- - :~ - --- -:-- -- - -:---- - ~----- ~ - - - -- ~ - -- - - - ~ ---- - ~ ---- - ~ --- - - ' I I I I I I I I I
o+---+---+---+---~--~--~--~--r--~1---~
0 0.1 0.2 0.3 0.4 0.5 0.6 0.7 0.8
Actual groove depth I specified groove depth (2 mm)
0.9
Figure 4.16 CVN toughness vs. average natural groove depth after milling
4.4 COMPARISON WITH QUALIFICATION TESTS
Figures 4.17 through 4.19 compare the WRCVN specimen results with the CVN results obtained from A WS groove weld test plates. The data points labeled "PQR" are the maximum, mean, and minimum values from procedure qualification records (PQRs) submitted to the Texas Department of Transportation. The statistics for the weathering consumables are from thirteen PQRs from one fabricator, the same fabricator who made the fillet weld specimens. The thirteen PQRs include a wide range of heat input and single as well as multiple electrode welds. Seven PQRs from two different fabricators were used to calculate the statistics for the neutral flux. Only one PQR was available for the active flux. The data points labeled "certificate" are the same statistics calculated from the data shown on the current certificates from the consumable manufacturer. The results listed as "AWS" for the weathering consumables are from the Charpy specimens tested as part of this project from the A WS groove weld test plates. The WRCVN, PQR, and certificate Charpy results are essentially the same for the active and neutral fluxes. Only the weathering consumables show a significant difference between the WRCVN specimens and the groove weld test plate specimens performed for PQR and certification testing. The heat input had little effect on the results from either the WRCVN or the normal CVN test specimens.
58
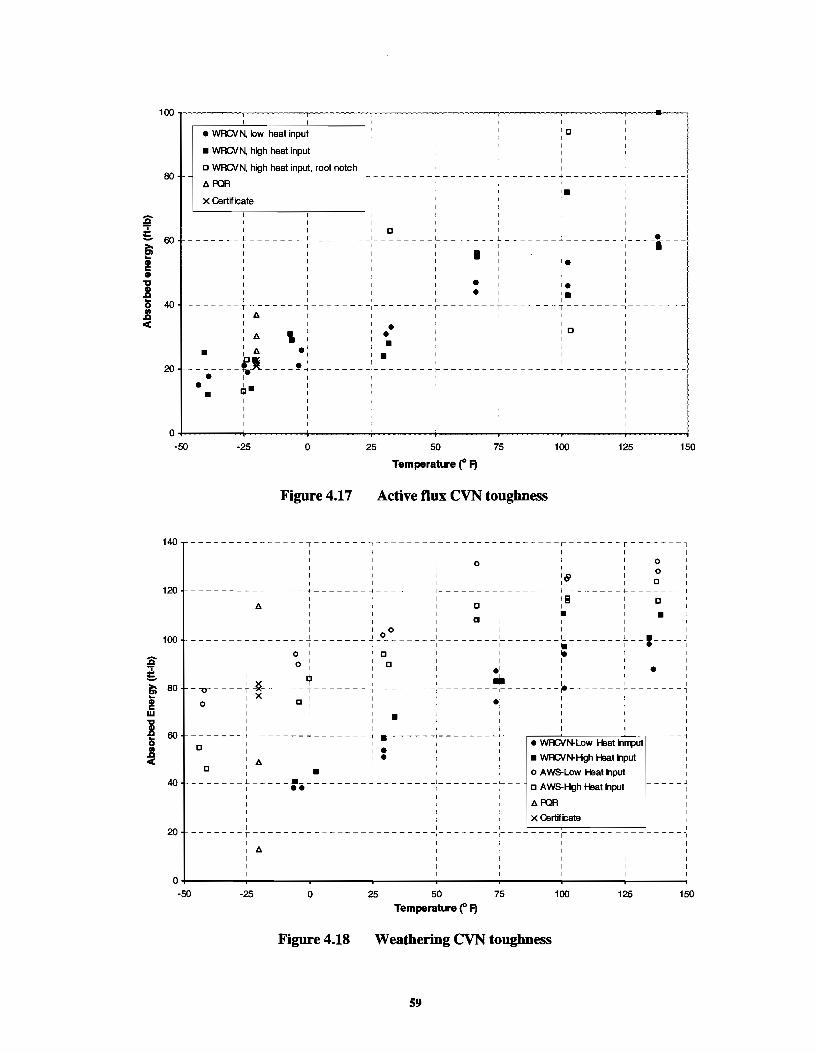
:a E ~ ... ! • 1 15 ! c(
80
60
40
20
0 -50
140
• WOCVN. low heat input
• WOCVN. high heat input
c WOCVN. high heat input, root notch
Ill. R:IR
X Cert~icate
I I I L ____ _J __
I I I
I I I ------ T l I Ill.
Ill. ' • I Ill. •• ' ----(_l ___ •• _ _, • I I
• ~· I
•
-25 0
Figure4.17
r--------:-
25
c ' ---------
I
• • --------T-
• • • •
50
Temperature(" f)
75
I
Ia I
I
D
-------+
100
Active f1ux CVN toughness
-----r-
0 ' :e
125
r
0 0 c
150
120 -+--------!---- ------:--- -!
•Ill I
----+-----
100
80 -.,-----.~ IX
0
0 0
Ejl
' cl
60 --+- -------t
c
D I
40 -------.1..-
I
20 I I
Ill.
0 -50 ·25
I I. ._J •• I
---------·-·
0
Figure4.18
c a
j 0-~----' c
c
I
I •
;-.-
25
• •
I -------~--
50 Temperature (" f)
••
75
• -----~---~-
111 • I I I
j_ I
I
c
• 1-
•
__ j I
-~- --,------1
• WOCVN-Low ~-Sat nrrput
• WOCVN-Hgh li:lat hput
o AW8-Low Heat hput
c AW8-Hgh li:lat hput
Ill. R:IR
100 125 150
Weathering CVN toughness
59
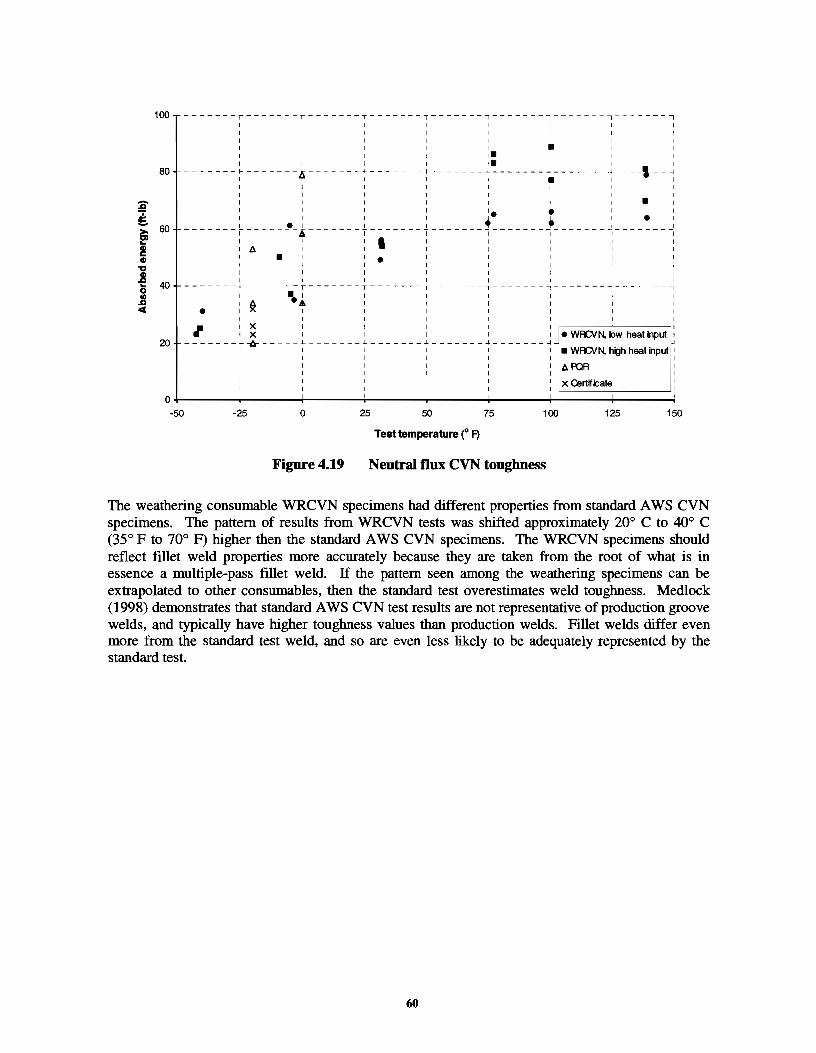
100
80
20
-50
-~--~----- T I I
I
I
-------~-------~
I I • I -------,--------. I
I A I •
I I I
-------r------ r I •• I :t ,. • I
I 1 X •X
-----1--lr---1
I
-25
l-1
0
Figure4.19
T I
----T------
--+--------+---
I _l _______ _!_ __
I
I I •
-, I I I I ,. I. +-
I I
'• ~ ,-
I I I
T ------T-------1 I I I I I I I I
-,-------,------ -, I I I I I I • I
I I I
... ------1----1 _, • I I I I I • • I
, I • I I -,-- ~---- -,--I
I
' I ,-------,-------~
I I I I I I I I I I
I I I
J..--------+----j ______ j J•wf'CVN, 1ow heat input :
' '• WFOIN, high heat Input '
25
1 I
50
Test temperature(" F)
75 100
Neutral flux CVN toughness
I
ARlR
X Certificate
125 150
The weathering consumable WRCVN specimens had different properties from standard A WS CVN specimens. The pattern of results from WRCVN tests was shifted approximately 20° C to 40° C (35° F to 70° F) higher then the standard A WS CVN specimens. The WRCVN specimens should reflect fillet weld properties more accurately because they are taken from the root of what is in essence a multiple-pass fillet weld. lf the pattern seen among the weathering specimens can be extrapolated to other consumables, then the standard test overestimates weld toughness. Medlock (1998) demonstrates that standard A WS CVN test results are not representative of production groove welds, and typically have higher toughness values than production welds. Fillet welds differ even more from the standard test weld, and so are even less likely to be adequately represented by the standard test.
60
CHAPTER 5: SUMMARY AND CONCLUSIONS
5.1 EVALUATION OF RESULTS
5.1.1 Weld Shear Strength The test results showed that the shear strength of the single-pass fillet welds tested in this project were significantly greater then the strength used to set design shear values.
The welds are much stronger than the nominal electrode strength, and also stronger than the design strength that assumes shear fracture on a 45° throat. Tests were run on specimens from three different fabricators using three sets of welding consumables, at two different heat inputs, and with both dart welding and single-sided welding. Lower heat input welds had higher calculated strength then high heat input welds. Double sided Dart welds had lower strengths then single sided welds with the same heat input per electrode. The strength differences were not always reflected in the measured hardness of the fillet welds, which indicates that the methods and errors associated with the calculation and measurement of the shear area of the weld are also a source of variation. In all of these cases, the weld strength exceeded requirements. This suggests that extensive strength testing by fabricators should not be required, as long as the weld workmanship is appropriate and the electrode manufacturer maintains sufficient product quality to maintain the tensile strength measured in the weld certification.
5.1.2 T-Bend Test The T-bend test measures weld ductility, not strength. It is difficult to evaluate and use results from this test. The entire run of tests taken as a whole gave some information about the effects of the test parameters, but testing a single T does not tell much about the particular weld used to make that T. However, even if the T -bend test is not of much use, aT -specimen is still valuable. The T -macroetch specimen, already required by AWS D1.5-96 Section 5.10.3, can be used for hardness testing of joints welded to the same fillet weld specifications to be used in the field (e.g., same plate thicknesses, use of single or dart welds, number of passes). The macroetch test can also be used to evaluate the depth of fusion and the possible reduction in strength due to bridging, particularly with active fluxes.
5.1.3 Weld-Root CVN Test The WRCVN tests using the active and neutral flux consumables were similar to the results reported in the PQRs and certifications. The similarity of the results was not expected since the values reported in the PQRs and certifications are from a completely different weld geometry, a large root opening groove weld. The dilution of the weld metal and the lack of grain refinement at the weld root in the WRCVN specimens did not alter toughness significantly at the test temperature of -20° F. Hahin (1990) has reported similar correlation between the two CVN tests. The weathering steel flux WRCVN test results were significantly lower then the all-weld-metal tests from the groove weld test plate. The WRCVN toughness at o<>p was half the value of the standard specimen from the groovewelded plate. Weld heat input had a small but significant effect on the weathering results. The toughness of the other consumables was not strongly affected by the heat input.
The standard test requirement is more of a reference than it is an indication of the toughness expected in a production weld. The WRCVN test, on the other hand, provides a measure of actual weld toughness. Fillet welds have been made to the current toughness standard for years with no apparent problems in the field, even though the actual weld toughness may be lower than the test toughness. Therefore the actual fillet weld toughness may not need to be as high as that called for in the standard. There is no need for the weld to be any tougher than the surrounding base metal.
61
A drawback of the WRCVN test is that the effect of dart welding on toughness cannot be tested. A specimen with a web thin enough for dart welding to have an effect will not be large enough to have a CVN specimen taken from it. However, the effect of dart welding is due to the increase in total heat input, and so using a higher heat input may simulate this effect. In addition, the difference due to heat input among specimens of the same type is far smaller than the difference between the WRCVN and the A WS CVN specimens. Even if the effect of dart welding is neglected, the WRCVN test will still give a more accurate representation of the fillet weld CVN toughness than the A WS CVN test does currently.
5.2 WELDING CONSUMABLES
If appropriate precautions are taken regarding heat input, the active flux combination (780/L-61) performs at least as well in strength tests as the well-established weathering (860/LA-75) and neutral flux (960/L-61) consumable combinations. The CVN toughness of the active flux welds is lower than that of the other weld metals and does not meet current A WS standards, but if a new CVN toughness standard is developed for the WRCVN specimens, this material may be found to have appropriate CVN toughness.
5.3 CONCLUSIONS AND RECOMMENDED FILLET WELD QUALIFICATION
REQUIREMENTS
The results of this research indicate that the tensile strength requirements of the weld certification tests are adequate to ensure the strength of fillet welds. Based upon these results, the weld qualification tests presently required in A WS Dl.5 are not necessary to ensure the strength of a fillet weld. The T -bend specimen did not provide a useful measure of the strength or ductility of a fillet weld. The T -weldment does provide a simple means to evaluate the influence of double sided weld upon the geometry of the weld and melt-through of the stem. The WRCVN specimen provides a convenient method of characterizing the toughness of the fillet weld root material. The WRCVN toughness may be comparable or less than the toughness measured in the standard all-weld metal tests. The WRCVN test is recommended as a simple means to ensure that the fillet weld toughness is adequate. Toughness comparable to the base metal should be sufficient for the root of the fillet The base metal is directly adjacent to the weld metal at the root of the weld. Consequently, a fracture will propagate in either the weld or base metal, whichever has the lowest toughness. There is no benefit to having the weld metal toughness significantly tougher than the base metal. A weld root toughness corresponding to the non-fractnre-critical base metal requirement for 4-inch plates in Temperature Zone ill should be adequate for all bridges. For example, the required toughness for Gr. 50 steel would be 20 ft-lbs at 10° F, per ASTM A 709 Table S1.2.
Based upon the results of this study, the following recommended changes to the specifications are proposed:
1. The consumable supplier shall perform the following tests annually:
a. Two weld certification tests, one at the highest and the other at the lowest weld heat input recommended by the manufacturer. If the fabricator stays within these heat inputs, no groove weld qualification testing is required by the fabricator. The essential variables are those defmed in AWS Dl.S-96 Section 5.12.2, "Maximum-Minimum Heat Input."
b. A WRCVN test plate shall be welded using the maximum and minimum heat input recommended. The average of three specimens from each test weld should be equal to or greater than the non-fracture-critical base metal requirement for 4-inch plates in Temperature Zone ill. For 36-ksi material, the requirement for 50-ksi material should be used.
62
2. The fabricator shall perform the T -weldment test described below every 5 years or whenever the essential variables are changed. The fillet weld T-weldment is similar to the fillet weld soundness test required in A WS D 1.5-96 Section 5.1 0, with the following exceptions.
a. The plate thickness shown in A WS D1.5-96 Figure 5.8 shall be the maximum rather than the minimum plate thickness.
b. The welds shall be made at the highest heat input in the WPS.
c. If two-sided Dart welding will be used in the production weld, the same method should be used for fabricating the T -weldment.
d. The spacing of the electrodes in a two-sided weld shall be the minimum specified in the WPS.
e. A T -weld test is required for each weld size, or for the minimum and maximum weld sizes.
f. The welds are to be sectioned in accordance with A WS D 1.5-96 Section 5.10.3 and tested in accordance with Section 5.19.3. In addition, the maximum penetration of each weld shall not exceed 113 of the thickness of the T stem (dimension T2 in A WS Dl.5-96 Figure 5.8).
63

64
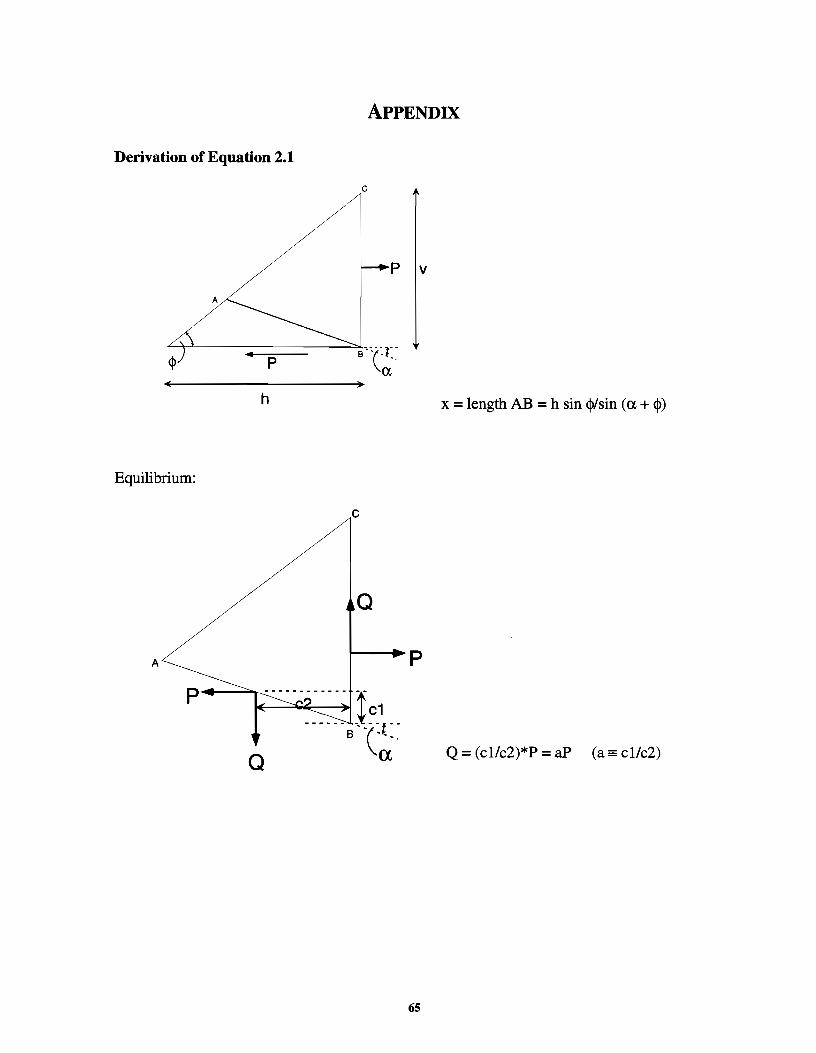
APPENDIX
Derivation of Equation 2.1
c
p v
A
h x = length AB = h sin <I>/ sin (a + <1>)
Equilibrium:
c
Q
A p
p
Q = (cl/c2)*P = aP (a= cl/c2)
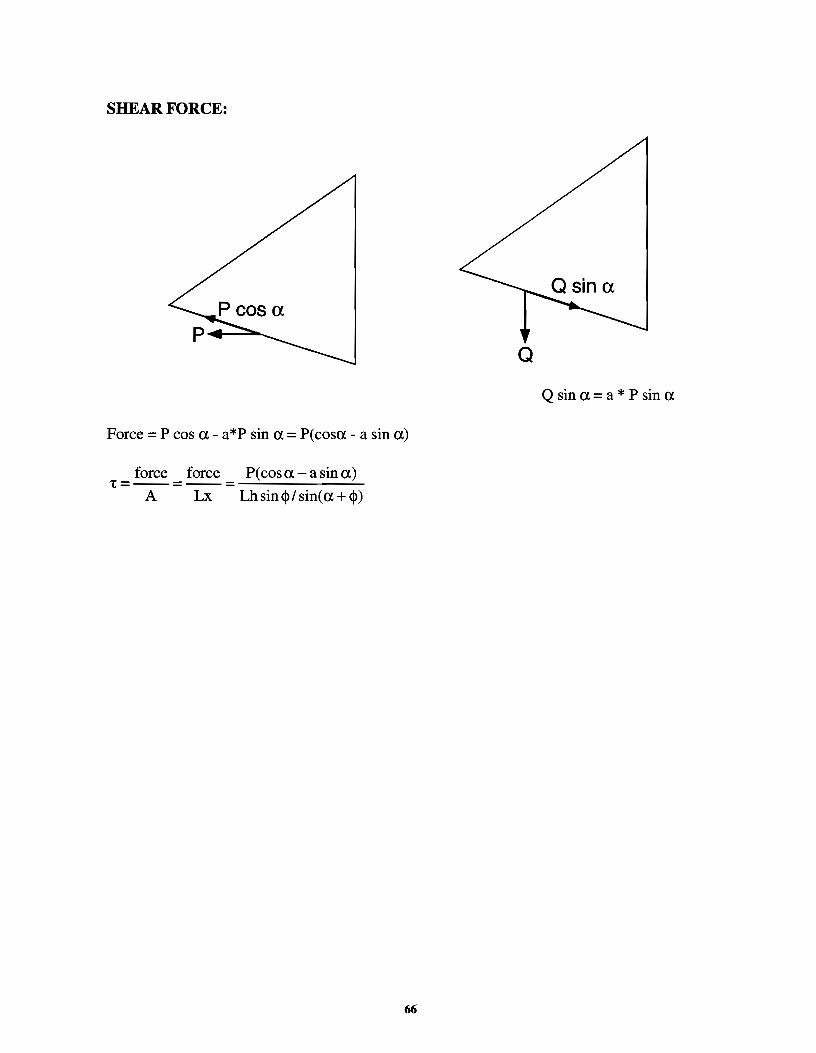
SHEAR FORCE:
a Q sin a= a * P sin a
Force= P cos a- a*P sin a= P(cosa- a sin a)
force force P( cos a- a sin a) 't = --= --= _.;..__ ___ ____;_
A Lx Lhsincp/sin(a+$)
66
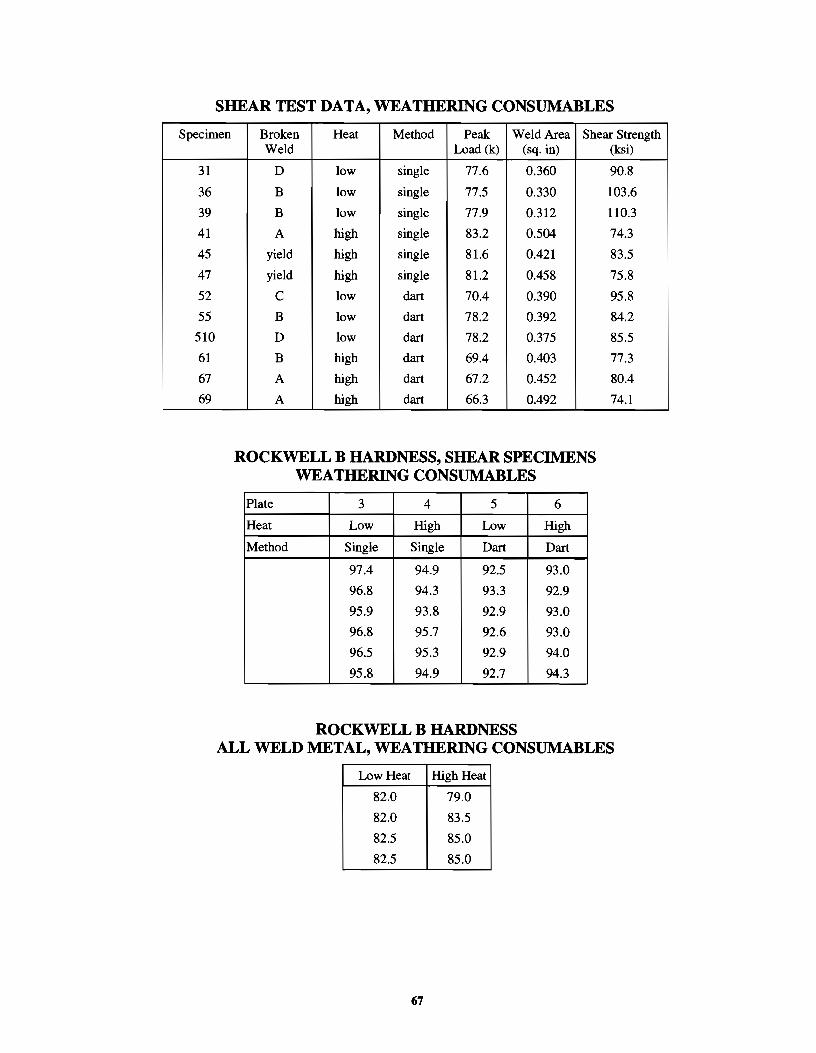
SHEAR TEST DATA, WEATHERING CONSUMABLES
Specimen Broken Heat Method Peak Weld Area Shear Strength
31
36
39
41
45
47
52
55
510
61
67
69
Weld Load (k) (sq. in)
D low single 77.6 0.360
B low single 77.5 0.330
B low single 77.9 0.312
A high single 83.2 0.504
yield high single 81.6 0.421
yield high single 81.2 0.458
c low dart 70.4 0.390
B low dart 78.2 0.392
D low dart 78.2 0.375
B high dart 69.4 0.403
A high dart 67.2 0.452
A high dart 66.3 0.492
ROCKWELL B HARDNESS, SHEAR SPECIMENS WEATHERING CONSUMABLES
Plate 3 4 5 6
Heat Low High Tnm I High
Method Single Single Dart Dart
97.4 94.9 92.5 93.0
96.8 94.3 93.3 92.9
95.9 93.8 92.9 93.0
96.8 95.7 92.6 93.0
96.5 95.3 92.9 94.0
95.8 94.9 92.7 94.3
ROCKWELL B HARDNESS
(ksi)
90.8
103.6
110.3
74.3
83.5
75.8
95.8
84.2
85.5
77.3
80.4
74.1
ALL WELD METAL, WEATHERING CONSUMABLES
Low Heat High Heat
82.0 79.0
82.0 83.5
82.5 85.0
82.5 85.0
67
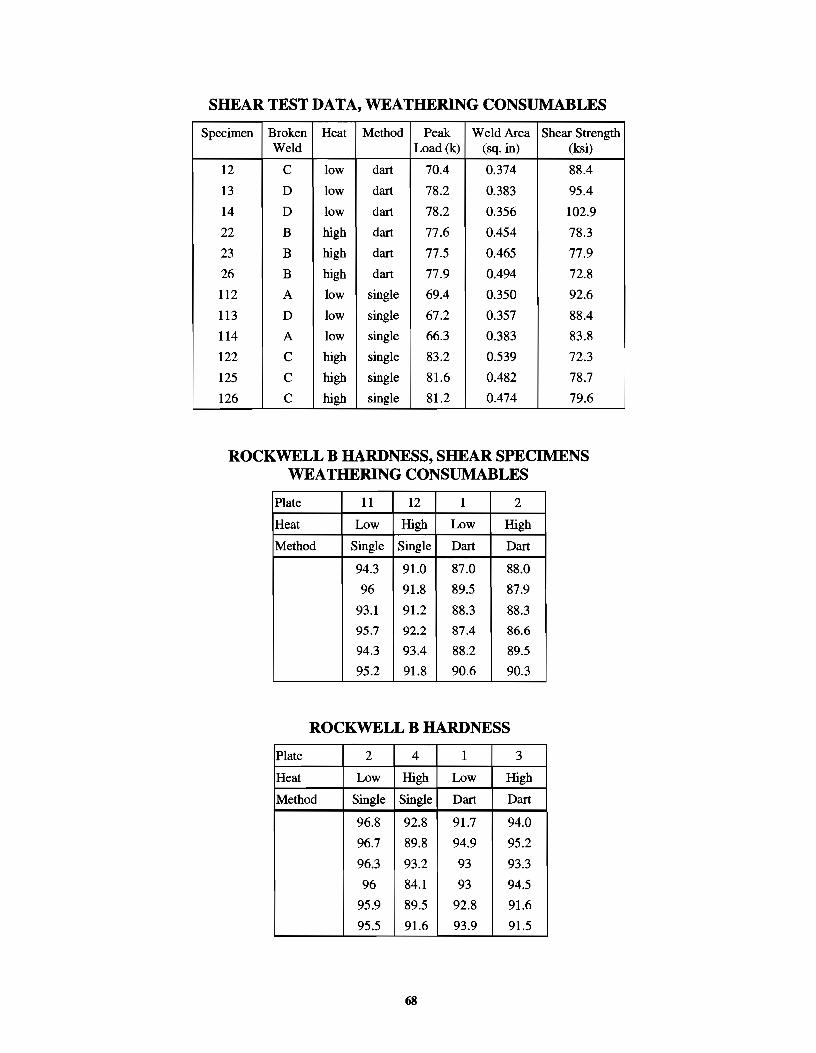
SHEAR TEST DATA, WEATHERING CONSllMABLES
Specimen Broken Heat Method Peak Weld Area Shear Strength Weld Load (k) (sq. in) (ksi)
12 c low dart 70.4 0.374 88.4
13 D low dart 78.2 0.383 95.4
14 D low dart 78.2 0.356 102.9
22 B high dart 77.6 0.454 78.3
23 B high dart 77.5 0.465 77.9
26 B high dart 77.9 0.494 72.8
112 A low single 69.4 0.350 92.6
113 D low single 67.2 0.357 88.4
114 A low single 66.3 0.383 83.8
122 c high single 83.2 0.539 72.3
125 c high single 81.6 0.482 78.7
126 c high single 81.2 0.474 79.6
ROCKWELL B HARDNESS, SHEAR SPECIMENS WEATHERING CONSUMABLES
Plate 11 12 1 2
Heat Low High Low High
Method Single Single Dart
94.3 91.0 87.0 88.0
96 91.8 89.5 87.9
93.1 91.2 88.3 88.3
95.7 92.2 87.4 86.6
94.3 93.4 88.2 89.5
95.2 91.8 90.6 90.3
ROCKWELL B HARDNESS
Plate 2 4 1 3
Heat Low High Low High
Method Single Single Dart Dart
96.8 92.8 91.7 94.0
96.7 89.8 94.9 95.2
96.3 93.2 93 93.3
96 84.1 93 94.5
95.9 89.5 92.8 91.6
95.5 91.6 93.9 91.5
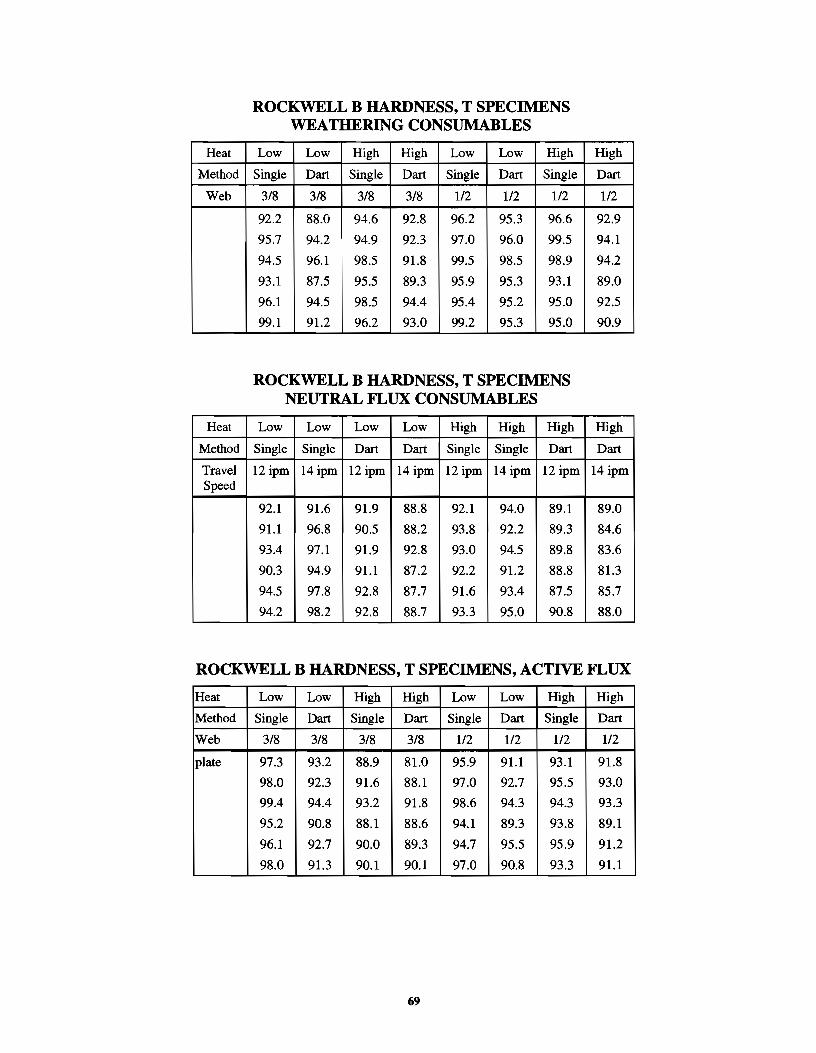
Heat
Method
Web
Heat
Method
Travel Speed
ROCKWELL B HARDNESS, T SPECIMENS WEATHERING CONSUMABLES
Low Low High I High Low ! Low High
Single Dart Si Dart Single Dart Single
3/8 318 3/8 3/8 112 1/2 112
92.2 88.0 94.6 92.8 96.2 95.3 96.6
95.7 94.2 94.9 92.3 97.0 96.0 99.5
94.5 96.1 98.5 91.8 99.5 98.5 98.9
93.1 87.5 95.5 89.3 95.9 95.3 93.1
96.1 94.5 98.5 94.4 95.4 95.2 95.0
99.1 91.2 96.2 93.0 99.2 95.3 95.0
ROCKWELL B HARDNESS, T SPECIMENS NEUTRAL FLUX CONSUMABLES
Low Low Low Low High High I High Single Single Dart Dart Single Single
12ipm 14ipm 12ipm 14ipm 12ipm 14ipm 12ipm
92.1 91.6 91.9 88.8 92.1 94.0 89.1
91.1 96.8 90.5 88.2 93.8 92.2 89.3
93.4 97.1 91.9 92.8 93.0 94.5 89.8
90.3 94.9 91.1 87.2 92.2 91.2 88.8
94.5 97.8 92.8 87.7 91.6 93.4 87.5
94.2 98.2 92.8 88.7 93.3 95.0 90.8
High
Dart
1/2
92.9
94.1
94.2
89.0
92.5
90.9
High
Dart
14 ipm
89.0
84.6
83.6
81.3
85.7
88.0
ROCKWELL B HARDNESS, T SPECIMENS, ACTIVE FLUX
Heat Low Low High High Low Low High High
Method Single Dart Single Dart Single Dart Single Dart
Web 3/8 3/8 3/8 3/8 112 112 112 112
plate 97.3 93.2 88.9 81.0 95.9 91.1 93.1 91.8
98.0 92.3 91.6 88.1 97.0 92.7 95.5 93.0
99.4 94.4 93.2 91.8 98.6 94.3 94.3 93.3
95.2 90.8 88.1 88.6 94.1 89.3 93.8 89.1
96.1 92.7 90.0 89.3 94.7 95.5 95.9 91.2
98.0 91.3 90.1 90.1 97.0 90.8 93.3 91.1
69
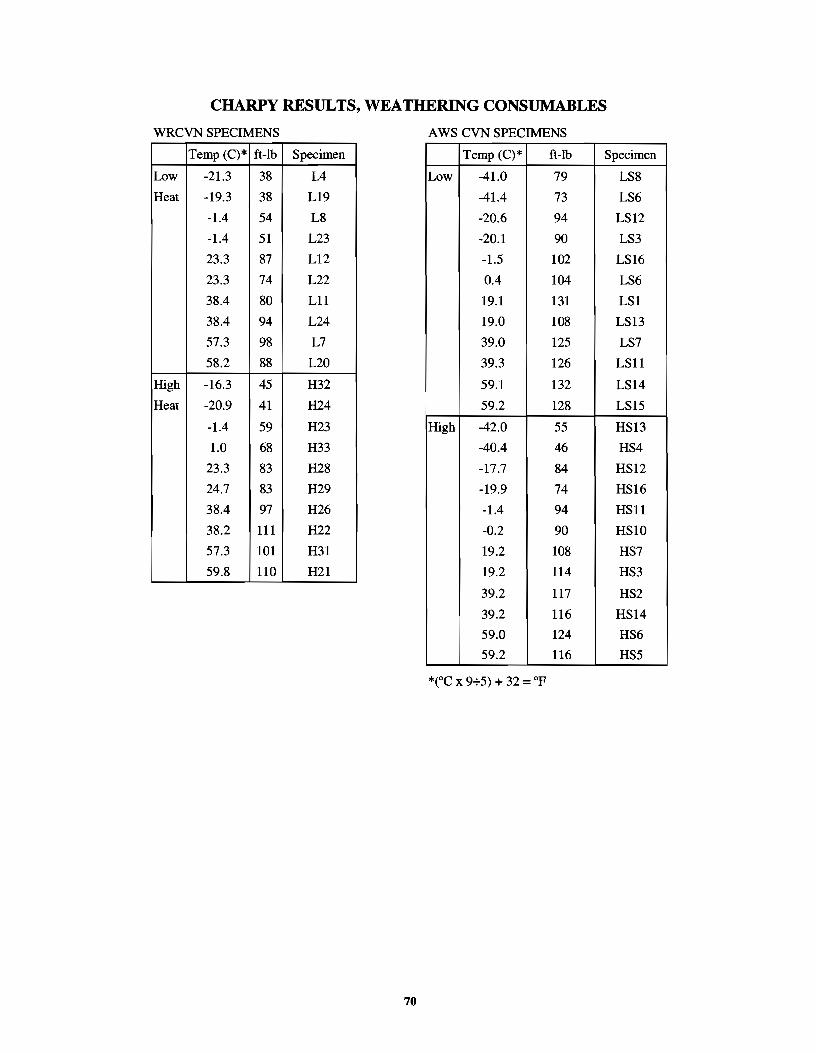
CHARPY RESULTS, WEATHERING CONSUMABLES
WRCVN SPECIMENS A WS CVN SPECIMENS
Temp (C)* ft-Jb Specimen Temp (C)* ft-lb Specimen
Low -21.3 38 lA Low -41.0 79 LS8
Heat -19.3 38 Ll9 -41.4 73 LS6
-1.4 54 L8 -20.6 94 LS12
-1.4 51 L23 -20.1 90 LS3
23.3 87 L12 -1.5 102 LS16
23.3 74 L22 0.4 104 LS6
38.4 80 Lll 19.1 131 LSI
38.4 94 L24 19.0 108 LS13
57.3 98 L7 39.0 125 LS7
58.2 88 L20 39.3 126 LSll
High -16.3 45 H32 59.1 132 LS14
Heat -20.9 41 H24 59.2 128 LS15
-1.4 59 H23 High -42.0 55 HS13
1.0 68 H33 -40.4 46 HS4
23.3 83 H28 -17.7 84 HS12
24.7 83 H29 -19.9 74 HS16
38.4 97 H26 -1.4 94 HSll
38.2 111 H22 -0.2 90 HS10
57.3 101 H31 19.2 108 HS7
59.8 110 H21 19.2 114 HS3
39.2 117 HS2
39.2 116 HS14
59.0 124 HS6
59.2 116 HS5
*("C x 9+5) + 32 = op
70
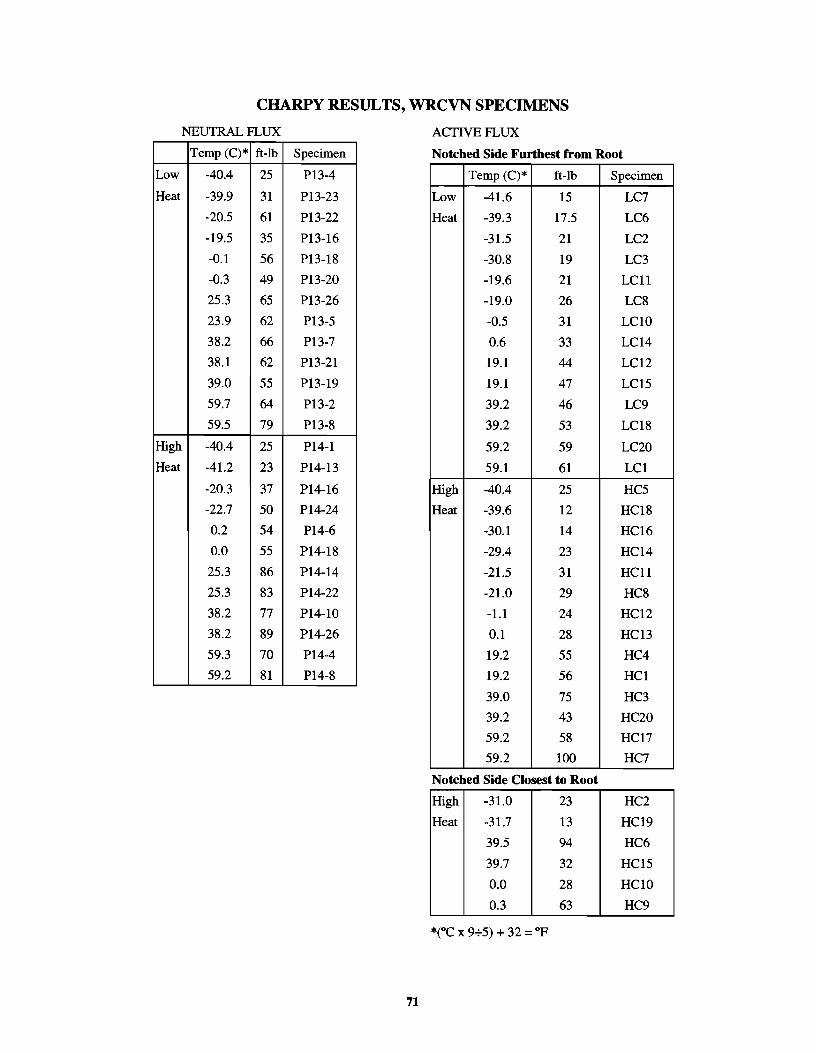
CHARPY RESULTS, WRCVN SPECIMENS
NEUTRAL FLUX ACTIVE FLUX
Temp (C)* ft-1b Specimen Notched Side Furthest from Root
Low -40.4 25 P13-4 Temp (C)* ft-1b Specimen
Heat -39.9 31 P13-23 Low -41.6 15 LC7
-20.5 61 P13-22 Heat -39.3 17.5 LC6
-19.5 35 P13-16 -31.5 21 LC2
-0.1 56 P13-18 -30.8 19 LC3
-0.3 49 P13-20 -19.6 21 LCll
25.3 65 P13-26 -19.0 26 LC8
23.9 62 P13-5 -0.5 31 LCIO
38.2 66 P13-7 0.6 33 LC14
38.1 62 P13-21 19.1 44 LC12
39.0 55 P13-19 19.1 47 LC15
59.7 64 P13-2 39.2 46 LC9
59.5 79 Pl3-8 39.2 53 LC18
High -40.4 25 P14-1 59.2 59 LC20
Heat -41.2 23 P14-13 59.1 61 LC1
-20.3 37 P14-16 High -40.4 25 HC5
-22.7 50 P14-24 Heat -39.6 12 HC18
0.2 54 P14-6 -30.1 14 HC16
0.0 55 P14-18 -29.4 23 HC14
25.3 86 P14-14 -21.5 31 HCll
25.3 83 P14-22 -21.0 29 HC8
38.2 77 P14-10 -1.1 24 HC12
38.2 89 P14-26 0.1 28 HC13
59.3 70 P14-4 19.2 55 HC4
59.2 81 P14-8 19.2 56 HC1
39.0 75 HC3
39.2 43 HC20
59.2 58 HC17
59.2 100 HC7
Notched Side Closest to Root
High -31.0 23 HC2
Heat -31.7 13 HC19
39.5 94 HC6
39.7 32 HC15
0.0 28 HC10
0.3 63 HC9
71

72
BmLIOGRAPHY
AISC, 1995. Manual of Steel Construction: Load and Resistance Factor Design, 2nd ed., American fustitute of Steel Construction.
AWS, 1992. Standard methods for mechanical testing of welds. ANSI/AWS B4.0-92, American Welding Society, Miami, FL.
AWS, 1996. Bridge Welding Code. ANSI/AASHTO/AWS Dl.5-96, American Welding Society, Miami, FL.
ASTM, 1994. Standard methods and definitions for mechanical testing of steel products. ASTM A370-94, American Society for Testing and Materials, Philadelphia, PA.
Devore, J. and Peck, R, 1993. Statistics: The Exploration and Analysis of Data, 2nd ed., Duxbury Press, Belmont, CA.
Hahin, C., 1990. Development of an as-welded notch impact toughness test for steel weldments. Submitted to Welding Journal July 1990.
Medlock, R., 1998. Qualification of Welding Procedures for Bridges: An Evaluation ofthe Heat Input Method. Master's thesis, University of Texas at Austin.
Miazga, G. and Kennedy, D., 1988. Behavior of fillet welds as a function of the angle of loading. Canadian Journal of Civil Engineering, 16: 585-599.
Miller, D., 1997. Thicker steel permits the use of opposing arcs. Welding Innovation, XIV(2): 7-8.
Salmon, C. and Johnson, J, 1996. Steel Structures: Design and Behavior, Emphasizing Load and Resistance Factor Design, 4th ed., Harper Collins, NY.
73