Embed Size (px)
Citation preview
94032~
~ ~ lC U ,IE lIDJ\1l L~,: /'
LEGISLATIVE REFERENCE LIBRARY- SlATE CAPITOL
'" iT~PAUI, MN. ,. P51S5~.. ,-., _."'".~ ':~'-, ~:'-,.':..;..::._-~': ,-- ' .. -'
ALCOHOL, TOBACCO AND PREGNANCY:THE BELIEFS AND PRACTICES OF
MINNESOTA WOMEN
Prepared for:
The Minnesota Department of Health
By:
Daniel P. Mueller, Ph.D.Wilder Research Center
Amherst H. Wilder Foundation
March, 1994
This study was funded by a state appropriation to the Chemical Abuse Prevention ResourceCouncil. The funds were dispersed through the Minnesota Department of Public Safety, Office ofDrug Policy and Violence Prevention, to the Minnesota Department of Health. The study wasinitiated by the FAS/FAE Prevention Program, Division of Health Promotion and Education,Minnesota Department of Health. Wilder Research Center conducted the study and prepared thisreport under contract to the Department of Health.
Consultant's Report
This document is made available electronically by the Minnesota Legislative Reference Library as part of an ongoing digital archiving project. http://www.leg.state.mn.us/lrl/lrl.asp

EXECUTIVE SUMMARY
PURPOSE AND SURVEY SAMPLE
Women of child-bearing age in Minnesota were surveyed regarding their use of alcohol and
tobacco, and their beliefs about such use during pregnancy. The survey is part of a statewide
effort conducted by the Minnesota Department of Health to prevent fetal alcohol syndrome, fetal
alcohol effects, and drug exposed infants in Minnesota. This prevention effort has three
components: research, professional education and public awareness. Research strongly suggests
that of the drugs that are most damaging to the developing fetus, alcohol and tobacco are the
greatest culprits. The statewide survey is intended to provide a current portrait of the beliefs and
behavior of 18 to 45 year old women concerning the use of alcohol and tobacco during pregnancy.
It is expected that the survey results will be useful in guiding prevention strategies.
A representative sample of 1,017 Minnesota women age 18 to 45 were surveyed by
telephone between October 30, 1993 and January 9, 1994. The sample was drawn proportionately
by region of the state to insure geographic representativeness. The women surveyed tended to be
married (65%), high school graduates (96%), and employed (81 %). Most had contact with health
care providers, 86 percent having visited a doctor or health care clinic within the past 12 months.
Two-thirds of those surveyed had been pregnant at least once in their lives for five or more
months.
KEY FINDINGS
1. What are the current alcohol and tobacco use patterns among women of childbearing age in Minnesota?
Sixty-two percent of the women surveyed were current drinkers (Le., they drank alcohol in
the past 30 days). Most current drinkers were light to moderate drinkers, only 4 percent having
drunk 30 or more drinks in the past month. Twenty-two percent of current drinkers reported binge
drinking in the past 30 days (Le., having five or more drinks on an occasion). Binge drinkers and
those who drank more heavily tended to be younger (under age 25), never married, less educated
(not a high school graduate) and in blue collar occupations.
Sixty-one percent of the women surveyed had tried cigarettes, 45 percent were regular
smokers at some time during their lives, and 27 percent were current smokers. Higher rates of
current smoking were found among younger women, the previously married, the less educated,
and those in blue collar and service industry occupations. Of current smokers, 51 percent reported
smoking 10 or fewer cigarettes per day, 39 percent smoked 11 to 20, and 10 percent smoked 21 or
more. Current smokers were not more likely to be current drinkers, nor vice versa
-i-
2 . Among Minnesota women of child-bearing age, do alcohol and tobacco usepatterns change in any way during pregnancy? If so, how?
Survey results indicate that awareness of the dangers of alcohol and tobacco use during
pregnancy is widespread among women of child-bearing age. About one-quarter (24%) reported
drinking alcohol during their most recent pregnancy and almost all of these women drank lightly,
nine in 10 averaging one drink per week or less. Only I percent reported binge drinking during
pregnancy.
Similarly, slightly less than one-quarter (22%) reported smoking during their most recent
pregnancy, and most who did smoke tended to smoke lightly -- over six in 10 reported smoking 10
or fewer cigarettes per day. Only about 1 percent of the women surveyed reported smoking more
than a pack of cigarettes per day during pregnancy. We should caution, however, that alcohol and
tobacco use are self-reported and may be subject to underreporting.
High proportions of women who were drinking and smoking prior to pregnancy reported
reducing or stopping while pregnant. Ninety-three percent of those who were drinking prior to
their most recent pregnancy reported reducing or stopping during the pregnancy. Eighty percent of
smokers reported reducing or stopping during their most recent pregnancy. Those who smoked
during pregnancy tended to be younger (especially 18 to 20), to be currently unmarried, to have
less education (especially those who had not completed high school), and to have blue collar or
service industry jobs. Many women reduced or stopped their alcohol or tobacco use during
pregnancy without being advised by their doctors to do so. Nevertheless, those who were
specifically advised by their doctors not to use alcohol or tobacco while pregnant were more likely
to stop their use of these substances.
3 • What do Minnesota women of child-bearing age know and believe aboutalcohol/tobacco use during pregnancy?
Most of the women surveyed believed that daily drinking, binge drinking, and daily cigarette
smoking during pregnancy were extremely likely to cause harm to the newborn. About one-third
felt that occasional drinking or occasional smoking during pregnancy were extremely likely to
cause such harm.
Most women correctly believed that harm to the newborn would be the same regardless of
whether a pregnant woman drank beer, wine or alcohol. However, 61 percent wrongly believed
that crack/cocaine use during pregnancy is causing harm to the largest number of newborns in the
United States. Alcohol and tobacco, in fact, cause harm to larger numbers of newborns.
-ii-
4 . What is the social climate or social norms regarding alcohol use duringpregnancy in Minnesota?
Most of the women surveyed said that the people close to them (parents, spouse, family and
friends) would be concerned if they drank during pregnancy. Furthermore, seven in 10 women
reported that almost none of the women they knew drank alcohol during pregnancy. However,
those who knew more women who drank during pregnancy, or who had people close to them who
were less concerned about drinking during pregnancy, were more likely to drink themselves while
pregnant.
Women differed somewhat in their opinions about the degree to which people should
discourage or prohibit pregnant women from drinking. Nearly two-thirds agreed that neither
friends nor bartenders should serve alcoholic drinks to pregnant women. Most women agreed that
they should warn a pregnant friend drinking at a bar not to drink, but only one-third said that they
should so warn a pregnant stranger.
IMPLICATIONS OF THE SURVEY RESULTS
Despite widespread awareness of the risks, survey findings suggest a number of areas of
concern regarding alcohol and tobacco use during pregnancy among Minnesota women. These
concerns or issues have implications for professional education, public information strategies,
prevention programs and future research.
Professional Education
The advice or counsel of the doctor appears to make a difference in reducing or stopping
alcohol and tobacco use during pregnancy. Yet many women are still not advised to reduce or stop
by their doctors or health care providers. Since almost all of the women surveyed were in regular
contact with health care providers, the health care system is a potentially effective means of
disseminating information or warnings on this issue. Health care professionals should· also be
made aware of higher risk groups for alcohol/tobacco use during pregnancy (e.g., younger
women, the less educated) so that they can make special efforts to reach these groups.
Public Information Stratel:ies
Public information campaigns may want to concentrate on delivering more specific messages
about alcohol/tobacco use during pregnancy to a public that is already quite knowledgeable about
the general issue. Specific messages suggested by the survey fmdings are as follows:
• Drinking early in pregnancy can be harmful to the fetus. It could be beneficial (especially forheavier drinkers and binge drinkers) to stop drinking when planning or trying to becomepregnant.
-iii-
•
•
Heavy drinking and heavy smoking during pregnancy cause harm to more newborns thancocaine use, although cocaine use is clearly dangerous too.
Binge drinking can be especially dangerous while pregnant.
Prevention Proerams
Programs to prevent alcohoVtobacco use during pregnancy need to begin early because
drinking and smoking are common among teens. Prevention efforts might seek to discourage
advertisers of alcohol and tobacco products from targeting young women and/or seek to counter
the messages of such advertising. A priority for prevention programs should be high school
dropouts. This group of women was found to be a high-risk group for both smoking and drinking
during pregnancy.
Future Research
Further research is needed on high-risk groups for alcohoVtobacco use during pregnancy
(e.g., teens, high school dropouts). We need to have a better understanding of how to reach these
groups and what prevention approaches are likely to be most effective with them. More study of
alcohoVtobacco use patterns during pregnancy in raciaVethnic minority groups may also be helpful
to prevention efforts. The current study was unable to address this potentially important area.
-iv-
TABLE OF CONTENTS
Page
Executive Summary , .
CHAPTER I: Introduction to the Survey............................................. 1
Background. .. .. . .. . . . .. .. .. .. .. . .. .. .. .. . . 1
Survey Questions.................................................................................. 2
Survey Methods................................................................................... 2
Organization of the Report ,.. .. .. . .. .. .. . 4
CHAPTER II: Demographic Profile and Health Care Utilization............ 5
Demographic Characteristics. .. .. .. ... . ... .. .. .. . .. . . .. . . .. ... .. .. . .. . . .. .. .. . . .. ... .. .. .. .. .. . .. 5
Health Care Utilization............................................................................ 8
Summary 9
CHAPTER III: Drinking Patterns Among Women ofChild-Bearing Age 10
Age First Drank Alcohol.......................................................................... 10
Current Drinking 11
Drinking Patterns Among Current Drinkers.................................................... 13
Reductions in Drinking. .. .. . . .. .. . .. .. . . . . .. . .. .. .. . . .. .. . .. .. .. . .. . . .. ... . . .. . . ... .. .. .. .. .. . 15
Summary. ... . . ... .. . .. . . .. . . .. . . . .. ... . . .. . . .. . . . . . .. . .. . .. .... .. ... .. . .. .. .. .. . .. .. ... .. . .. . .. . 16
CHAPTER IV: Cigarette Smoking Among Women ofChild-Bearing Age 17
Lifetime and Current Smoking Prevalence. ... . . .. .. . . .. . .. .. .. . . .. . .. .. .. . .. .. .. .. . ... . . .. . .. . 17
Smoking Patterns. ............•............................................................. ... .... 19
Summary 20
-v-
TABLE OF CONTENTS (Continued)
Page
CHAPTER V: Drinking During Most Recent Pregnancy........................ 21
Pregnancies Among the Women Surveyed..................................................... 21
Drinking Patterns During Most Recent Pregnancy. . . . .. .. . . . . . . . . . . . . . . . . . . . . . . . . . . . . . . .. . . . . 23
Changes in Drinking Due to Pregnancy 27.
Doctor's Advice and Drinking During Most Recent Pregnancy.. .. . .. . . . .. 28
Warning Signs and Messages About Drinking During Pregnancy.......................... 30
Summary 31
CHAPTER VI: Cigarette Smoking During Most Recent Pregnancy.. 33
Smoking Behavior During Most Recent Pregnancy............ 33
Change in Smoking Due to Pregnancy......... .. .. .. . .. . . 38
Doctor's Advice and Smoking During Most Recent Pregnancy................ . .. 40
Summary 42
CHAPTER VII: Knowledge and Beliefs About SubstanceUse During Pregnancy..... 43
Beliefs About Harm Caused by Substance Use During Pregnancy......................... 43
Type of Substance Use Thought to Cause Harm to the Largest Number of Newborns .. 45
Summary ,.................................................................................... 47
CHAPTER VIII: Social Norms and Behaviors Regarding DrinkingDuring Pregnancy............................................................................. 48
Behavior and Beliefs of Those Known to Respondent. .. .. . . . . . .. . . .. . . . .. . . . . . . . . . . 48
Social Norms Regarding Drinking 50
Summary.................... 55
CHAPTER IX: Conclusions and Implications........................... 56
Overall Conclusions............................................................................... 56
Implications ~ . . . . . . . . . . . . . . . . . . . . . . . . . . . . . . . . . . . . . . 57
-vi-
TABLE OF CONTENTS (Continued)
Page
APPENDIX A: Description of the Minnesota Department of Health Fetal AlcoholSyndrome, Fetal Alcohol Effects, and Drug-Exposed Infants Prevention Program.. .... 60
APPENDIX B: Survey Instrument.......................................................... 63
APPENDIX C: Study Methods.............................................................. 80
-vii-

LIST OF TABLES
Table Page
3. 1 Age at Which Women Had Their First Alcoholic Drink by Current Age. . .. . . .. . . 11
3.2 Demographic Characteristics and Current Drinking................... 12
3.3 Reasons Women Reduced Their Alcohol Intake at Some Time in the Past........ 15
4.1 Demographic Characteristics and Current Smoking.................................. 18
8.1 Concern of Family and Friends About Drinking While Pregnant............ . . . . .. 50
-viii-

LIST OF FIGURES
Figure Page
2.1 Demographic Profile of the Women Surveyed........................................ 6
2.2 Occupation (Current or Most Recent) of Women Surveyed......................... 7
2.3 Length of Time Since Last Visit to a Doctor or Health Care Clinic................. 8
3.1 Age When Had First Drink of Alcohol .. . . . . . . ... .. .. . . .. . .. .. . . .. . .. .. ... . 10
3.2 Most Recent Time Had Alcoholic Drink...... ................•............ 11
3.3 Current Drinking Patterns Among Women Who Drank in The Past 30 Days..... 13
4.1 Cigarette Smoking Among the Women Surveyed.................................... 17
4.2 Among Women Who Smoked in the Past Month, Average Number ofCigarettes Smoked Per Day -' .. . .. . . .. .. .. . . . . . . .. . . . .. .. . . ... . .. . ... ... . .. . 19
5.1 Women Ever Pregnant For Five or More Months........ . . . 21
5.2 Number of Years Ago of Most Recent Pregnancy of Five or More Months 22
5.3 Women Who Drank Any Alcoholic Drinks During Most RecentPregnancy of Five or More Months.... .. 23
5.4 Number of Drinks Per Month During Most Recent Pregnancy... .. .. 24
5.5 Number of Drinks Consumed Per Month During Most RecentPregnancy by Number of Years Ago That It Occurred......... ...... ... .. .. 24
5.6 Period During Most Recent Pregnancy When Women Drank More.. . . 26
5.7 Change/Stability in Drinking During Most Recent Pregnancyof Five or More Months ... .... . . .. . . .. . . . .. .. . . .. .. .. . . . .. . ... ... . . . .. ... .. . . ... . .. ... .. 27
5.8 Doctor's Advice Regarding Drinking During Most Recent Pregnancyof Five or More Months , " . .. .. . ... . .. . 28
5.9 Doctor's Advice and Drinking During Most Recent Pregnancy.... . .. 29
5.10 Age and Seeing Warning SignslMessages About Drinking During Pregnancy. . . 30
6.1 Cigarette Smoking During Most Recent Pregnancy of Five or More Months..... 33
6.2 Number of Cigarettes Smoked Per Day During Most Recent Pregnancy.......... 33
6.3 Smoking During Most Recent Pregnancy and Demographic Characteristics...... 35
-ix-
LIST OF FIGURES (Continued)
Figure Page
6.4 Smoking During Most Recent Pregnancy by Number of Years AgoThat It Occurred ...............................................................•.......... 36
6.5 Smoking and Drinking During Most Recent Pregnancy of Five orMore Months. 37
6.6 Changes in Cigarette Smoking During Most Recent Pregnancy of Five orMore Months 39
6.7 Doctor's Advice Regarding Smoking During Most RecentPregnancy of Five or More Months. . . ... . . .. .. .. .. . .. .. .. . ...... .. . . . . .. . . .. . . .. . . .. .. 40
6.8 Doctor's Advice and Smoking During Most Recent Pregnancy 41
7.1 Beliefs About Likelihood of Harm Being Caused to Baby by Use ofSubstances During Pregnancy 44
7.2 Type of Substance Use Thought to Cause Harm to the LargestNumber of Newborns.. . . . .. 45
7.3 Type of Substance Use Thought to Cause Harm to the LargestNumber of Newborns by Respondent's Educational LeveL....................... 46
8.1 Drinking During Pregnancy Among Women the Respondent Knows. .. . . . 48
8.2 Education Level and Knowing Women Who Drank During Pregnancy........... 49
8.3 Opinions About Drinking-Related Behaviors 52
8.4 Distribution of Scores on the Drinking During Pregnancy Opinion Scale......... 53
8.5 Drinking and Scores on the Drinking During Pregnancy Opinion Scale.. 54
-x-
CHAPTER I: INTRODUCTION TO THE SURVEY
Women of child-bearing age in Minnesota were surveyed regarding their use of alcohol and
tobacco, and their beliefs about such use during pregnancy. The survey is part of a statewide
effort conducted by the Minnesota Department of Health to prevent fetal alcohol syndrome (FAS),
fetal alcohol effects (FAE), and drug exposed infants in Minnesota. This prevention effort has
three components: research, professional education and public awareness.
BACKGROUND
Ranked with Down's Syndrome and spina bifida as the most common known causes of
mental retardation, in utero exposure to alcohol is the most prevalent cause of preventable mental
retardation. The tragedy is that FAS and FAE are permanent and irreversible. There are no cures
and no effective methods of treatment. The hope lies in the fact that FASfFAE are totally
preventable. This is also true for drug-exposed infants.
The Fetal Alcohol Syndrome, Fetal Alcohol Effects and Drug-Exposed Infants Prevention
Program at the Minnesota Department of Health is funded by the State Legislature. The purpose of
the program is to prevent FAS and FAE and to reduce the number of drug-exposed infants in
Minnesota. The program has three emphases: research, professional education and public
awareness. The statewide survey of women of child-bearing age is one of the research projects to
be funded with the current appropriation. A fuller description of the program is provided in
AppendixA.
The survey was identified as a priority research project for the program through a six-month
planning process. The planning process included input from the Healthy"Roots Coalition, the
Maternal/Child Substance Abuse Council and the Minnesota Department of Health FAS Work
Group. Members of these groups include health, social services and educational professionals as
well as adoptive parents of FAE children.
Research strongly suggests that of the drugs that are most damaging.to the developing fetus,
alcohol and tobacco are the greatest culprits. Though the use of all drugs is of concern, often their
use occurs in tandem with that of alcohol andlor tobacco. The primary focus of the survey is on
the use of alcohol among women of childbearing age in Minnesota. A secondary focus is on their
use of tobacco.
The tragedy of fetal alcohol syndrome has received growing attention in the past few years.
Nevertheless, we know very little about how women of childbearing age in Minnesota use alcohol
and tobacco, what they know about FASIFAE, nor do we have a clear idea of their knowledge and
beliefs about the use of alcohol and tobacco during pregnancy, or where they get their information
about drinking during pregnancy. In addition, our social climate encourages the use of alcohol and
-1-
often works against making healthy decisions to not use alcohol in a given situation or for a given
reason.
The FAS, FAE and Drug-Exposed Infant Prevention Program operates under the assumption
that women want to do their best to have a healthy baby. Lack of knowledge or faulty information
about the hazards of substance use during pregnancy, a non-supportive social environment, or
tobacco/alcohol dependency are barriers that may keep some women from engaging in healthy
practices during pregnancy. The survey is intended to provide a current portrait of the knowledge,
beliefs and behavior of 18 to 45 year old women concerning the use of alcohol and tobacco during
pregnancy. It is expected that the survey's fmdings will be useful in guiding prevention efforts on
this issue.
SURVEY QUESTIONS
The survey was designed to address the following questions:
1. What are the current alcohol and tobacco use patterns among women of child-bearing age inMinnesota?
2. Do these patterns change in any way during pregnancy? Ifso, how?
3. What do Minnesota women of child-bearing age know and believe about alcohol/tobacco useduring pregnancy?
4. What is the social climate or the social norms regarding alcohol use during pregnancy inMinnesota?
SURVEY METHODS
Survey Sample
The sample for the survey was designed with the aim of obtaining a representative sample of
Minnesota women of child-bearing age living in households with telephones. A random digit
sample of telephone numbers across the state was drawn. The sample was drawn proportionately
by region of the state to insure geographic representativeness of the sample. One woman age 18 to
45 was surveyed in each selected household where one or more 18 to 45 year old women resided.
Younger females (13 to 17 year olds) were excluded because information about their alcohol and
tobacco use was already available from other studies (Le., Minnesota Student Survey, Minnesota
Department of Education, 1989-1992). Furthermore, obtaining parental consent to survey minors
would have been difficult in a telephone survey.
-2-
Telephone survey interviews were successfully completed with 1,017 women. The
interviews were conducted between October 30, 1993 and January 9, 1994. Eighty percent of
those selected for the survey sample completed the interview.
Survey Instrument
The survey instrument is a structured telephone interview designed to gather information
about alcohol and tobacco use by women of child-bearing age, and knowledge, beliefs and social
norms regarding such use during pregnancy. (The survey instrument is included in Appendix B.)
The instrument includes questions drawn from previous surveys as well as newly created
questions. Questions about the use of alcohol and tobacco during pregnancy focus upon the most
recent pregnancy that lasted five or more months. It was decided to focus on pregnancies of this
length because it is likely that after five months the woman intends to carry the pregnancy to full
term. This intention may affect the behaviors in which the woman engages related to trying to have
a healthy newborn.
The survey instrument was field tested prior to being finalized. Interviewers were
thoroughly trained in the study procedures and in the administration of the survey instrument.
Quality control techniques were used to ensure that the interviews were done accurately and
completely. See Appendix C for a detailed description of the sampling design and survey
methods.
Limitations of the Survey
Figures derived from the survey are subject to sampling error. With a sample size of slightly
over one thousand (Le., 1,017), sampling error is estimated at plus or minus 3 percent. That is,
we can be 95 percent confident that the true figure in the population is within 3 percent above or
below the figure obtained from the sample. For example, survey results indicated that 27 percent
of women age 18 to 45 smoked cigarettes in the past month. We can be 95 percent confident that
the true figure is between 24 and 30 percent. Sampling error will generally be larger for figures
derived from subgroups of the sample (e.g., women age 18 to 24, those who didn't complete high
school, women who used alcohol during pregnancy). Hence, caution is advised in drawing
conclusions based on figures from such subgroups.
In addition to sampling error, a couple of other notes of caution about the accuracy of survey
results should be mentioned. First, despite anonymity and confidentiality of respondents'
answers, underreporting of alcohol consumption may occur in surveys of this type because of the
social undesirability of particular responses. Reporting of alcohol use during pregnancy may be
especially influenced by this social desirability factor, and consequently, may not always be
accurate. The degree to which underreporting occurred, if it occurred at all, cannot be estimated.
Second, some of the survey questions ask respondents to recall behavior or events that occurred
-3-
five, tell or more years ago. Recall over such lengthy periods of time may be prone to
inaccuracies.
Comparisons to the 1990 Census suggest that the sample is quite representative of Minnesota
women of child-bearing age, except that younger women appear to be slightly underrepresented.
This apparent underrepresentation should be kept in mind as it may affect some of the figures
obtained from the survey that are age-related (for example, current rates of binge drinking among
women of child-bearing age).
Finally, it is important to remember that because this is a household-based telephone survey,
women of child-bearing age living in households and other places (e.g., institutions, homeless
shelters) without telephones are excluded from the survey. Very few households in Minnesota are
without telephones, however. According to the 1990 Census, 98 percent of the households in
Minnesota have telephones.
ORGANIZATION OF THE REPORT
The report is organized into nine chapters. This first chapter is an introductory chapter that
has provided a brief overview of the purpose, background and methods of the survey. Chapter II .
offers a demographic portrait of the women surveyed. It also briefly describes their access and use
of health care. Chapter III describes current drinking patterns among women of child-bearing age
with some information on past use of alcohol, including age when they first drank alcohol. .
Chapter IV describes current patterns of cigarette smoking among women of child-bearing age and
lifetime prevalence of smoking. Drinking patterns during most recent pregnancy are described in
Chapter V among the women who have ever been pregnant for five or more months (two-thirds of
the sample). Results are presented concerning the number and characteristics of women who
drank while pregnant, the amount they drank, !!!~ changes that occurred in drinking due to
pregnancy, and the nature/frequency of doctors' acIviceabout drinking during pregnancy and its
effect. Results regarding cigarette smoking during most recent pregnancy are presented in Chapter
VI. This includes number and characteristics of women who smoked during pregnancy, number
of cigarettes smoked, changes in smoking due to pregnancy, and doctor's advice and its effect.
Chapter VII describes women's beliefs about the harm caused to newborns by use of alcohol,
tobacco and cocaine during pregnancy. Chapter VIII presents results regarding the behavior and
beliefs about drinking during pregnancy of other people whom the women surveyed knew, and
results concerning the social norms surrouuding drinking during pregnancy. The fmal chapter,
Chapter IX, offers general conclusions drawn from the survey, and presents implications of
survey results for professional education,' public information strategies, prevention programs, and
future research.
-4-
CHAPTER II: DEMOGRAPHIC PROFILE ANDHEALTH CARE UTILIZATION
DEMOGRAPHIC CHARACTERISTICS
Figure 2.1 provides a demographic profile of the women surveyed. Women included in the
survey had to be of child-bearing age. This was defined as between 18 and 45 years old. There
were more women at the older end of this age range than at the younger end. The average (mean)
age of the women surveyed was 33. Over two-thirds of the women surveyed (68%) were age 30
and older, including 23 percent who were age 40 to 45. Only 4 percent of the women surveyed
were under age 21. The higher numbers of women at older ages reflects the post Wodd War IT
"baby boom" phenomenon. Women age 30 and older in the survey were born during the baby
boom period (i.e., 1946 to 1964).
Most women (65%) were married, 22 percent had never married, and 13 percent were
previously married -- 10 percent divorced, 2 percent separated and 1 percent widowed.
Only 4 percent of the women surveyed did not have a high school diploma or equivalency
degree. Sixty percent of the women had attended college, including 34 percent who were college
graduates. Eight percent had post-graduate degrees. As a whole, the women surveyed had
relatively high education levels compared to women nationally. This probably is due to the age
group surveyed (predominantly baby boom generation) and the comparatively high education
levels found in Minnesota
Finally, Figure 2.1 shows that over half the women surveyed (57%) lived in the Twin Cities
Metropolitan Area, while 43 percent lived in areas of the state outside the Metro Area (i.e., greater
Minnesota).
-5-
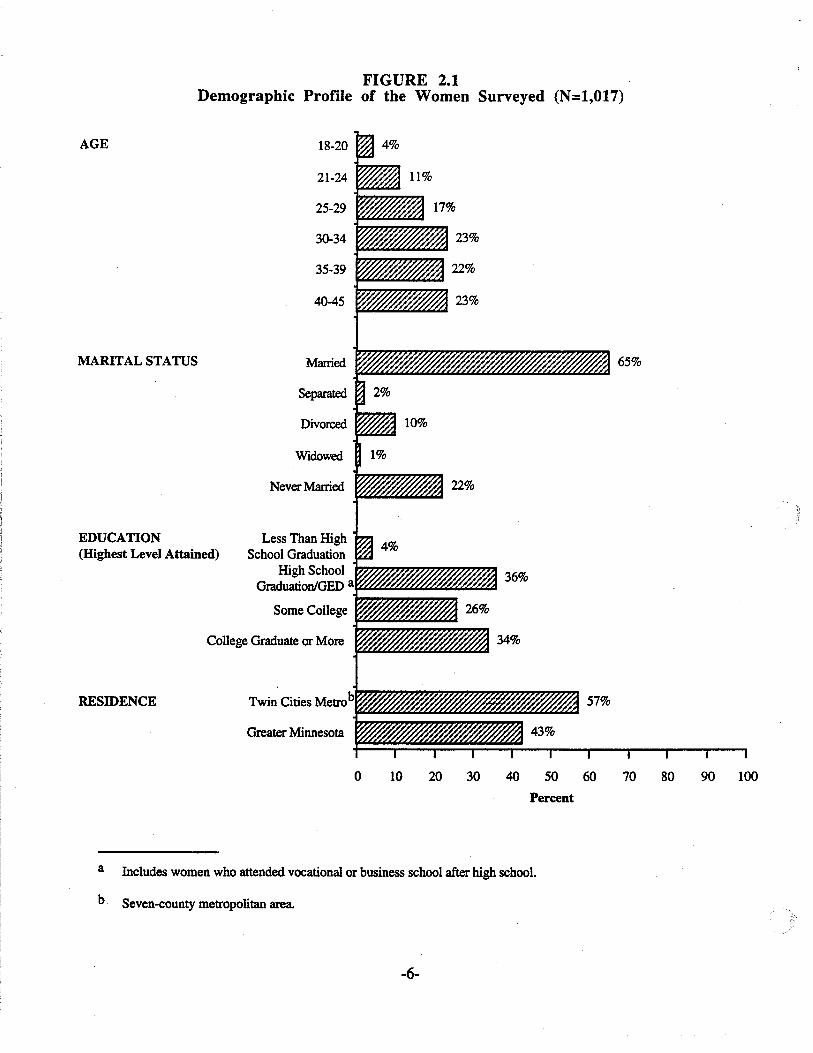
FIGURE 2.1Demographic Profile of the Women Surveyed (N=1,017)
College Graduate or More
AGE
MARITAL STATUS
EDUCATION(Highest Level Attained)
RESIDENCE
18-20
21-24
25-29
30-34
35-39
40-45
Married
Separated
Divorced
Widowed
Never Married
Less Than HighSchool Graduation
High SchoolGraduation/GED a
Some College
Twin Cities Metrob
Greater Minnesota
o 10 20 30 40 50 60
Percent
70 80 90 100
a Includes women who attended vocational or business school after high school.
b. Seven-county metropolitan area.
-6-
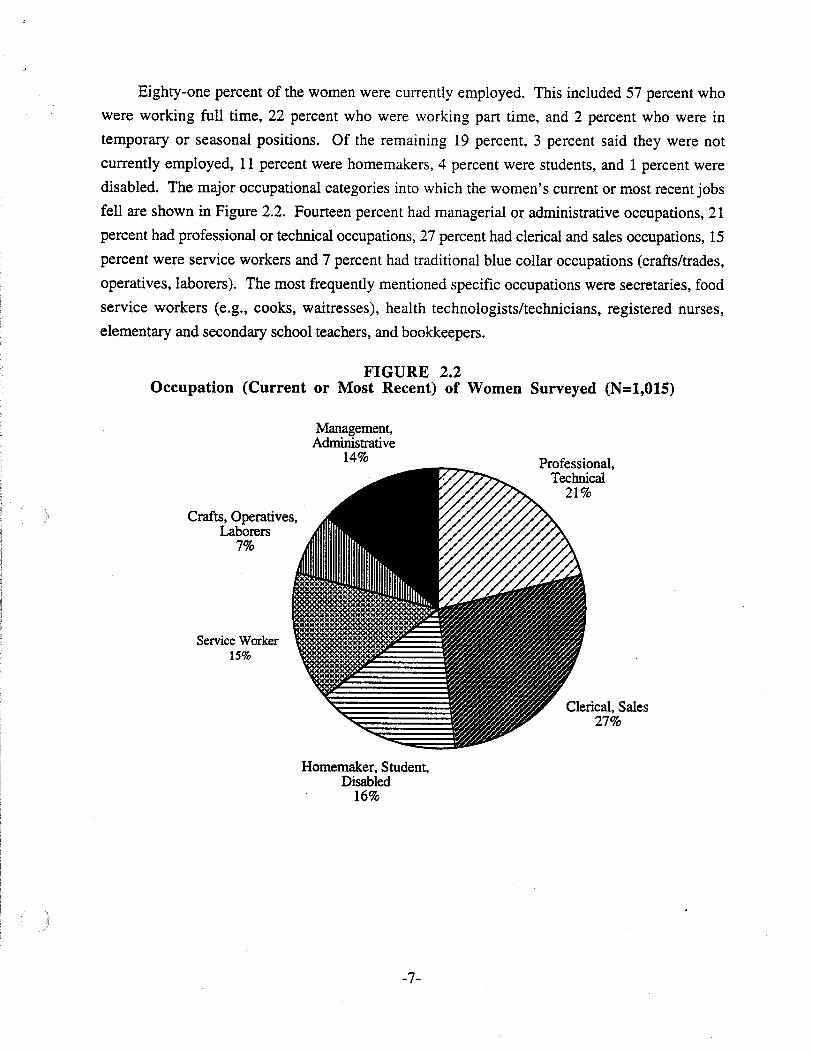
Eighty-one percent of the women were currently employed. This included 57 percent who
were working full time, 22 percent who were working part time, and 2 percent who were in
temporary or seasonal positions. Of the remaining 19 percent, 3 percent said they were not
currently employed, 11 percent were homemakers, 4 percent were students, and 1 percent were
disabled. The major occupational categories into which the women's current or most recent jobs
fell are shown in Figure 2.2. Fourteen percent had managerial or administrative occupations, 21
percent had professional or technical occupations, 27 percent had clerical and sales occupations, 15
percent were service workers and 7 percent had traditional blue collar occupations (crafts/trades,
operatives, laborers). The most frequently mentioned specific occupations were secretaries, food
service workers (e.g., cooks, waitresses), health technologists/technicians, registered nurses,
elementary and secondary school teachers, and bookkeepers.
FIGURE 2.2Occupation (Current or Most Recent) of Women Surveyed (N=1,015)
Crafts, Operatives,Laborers
7%
Service Worker15%
Management,Administrative
14%
Homemaker, Student,Disabled
16%
-7-
Professional,Technical
21%
Clerical, Sales27%
HEALTH CARE UTILIZATION
Ninety-one percent of the women surveyed said they had health care insurance for
themselves. Among these women, 81 percent had private health insurance (including HMO
coverage), 8 percent had Medical Assistance, and 2 percent had Minnesota Care. Thirteen percent
of all the survey respondents said that there was a time within the last year when they needed to see
a doctor but couldn't due to the cost. Not surprisingly, those most likely to say this were women
who lacked health insurance.
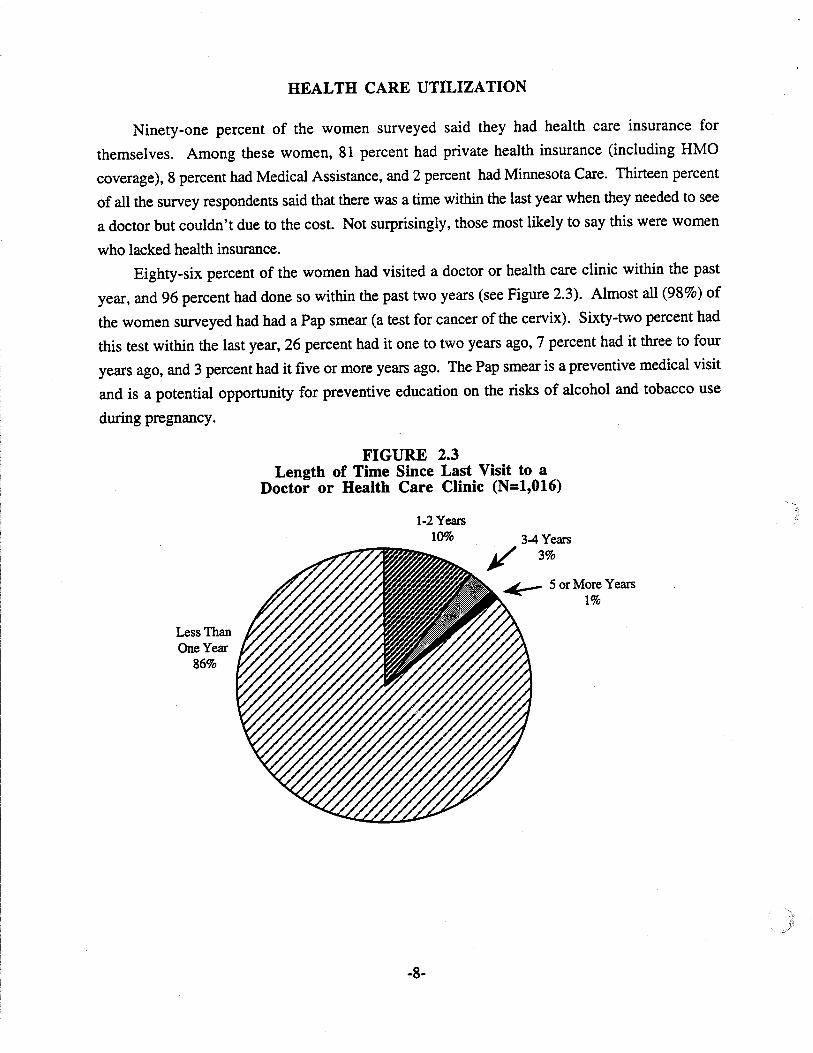
Eighty-six percent of the women had visited a doctor or health care clinic within the past
year, and 96 percent had done so within the past two years (see Figure 2.3). Almost all (98%) of
the women surveyed had had a Pap smear (a test for cancer of the cervix). Sixty-two percent had
this test within the last year, 26 percent had it one to two years ago, 7 percent had it three to four
years ago, and 3 percent had it five or more years ago. The Pap smear is a preventive medical visit
and is a potential opportunity for preventive education on the risks of alcohol and tobacco use
during pregnancy.
FIGURE 2.3Length of Time Since Last Visit to a
Doctor or Health Care Clinic (N=1,016)
1-2 Years10%
~ 5 or More Years1%
Less ThanOne Year
86%
-8-
SUMMARY
Demol:raphic Characteristics
• Among the women surveyed of child-bearing age (ages 18 to 45),68 percent were age 30 orolder. The higher number of women at older ages within the child-bearing age range reflectsthe post WorId War II "baby boom" phenomenon.
• Most of the women surveyed were married (65%).
• Educational attainment levels were quite high -- 34 percent of the women were collegegraduates and only 4 percent had not completed high school.
• A high proportion of women were currently employed (81 %) including 57 percent who wereemployed full time.
Health Care Utilization
• Nine percent of the women surveyed had no health care insurance.
• Ninety-six percent had visited a doctor or health care clinic within the past two years, and 86percent had done so within the last year.
• Eighty-seven percent reported having a Pap smear within the past two years, and 62 percentreported having one within the last year.
.....
-9-

CHAPTER III: DRINKING PATTERNS AMONGWOMEN OF CHILD-BEARING "AGE
AGE FIRST DRANK ALCOHOL
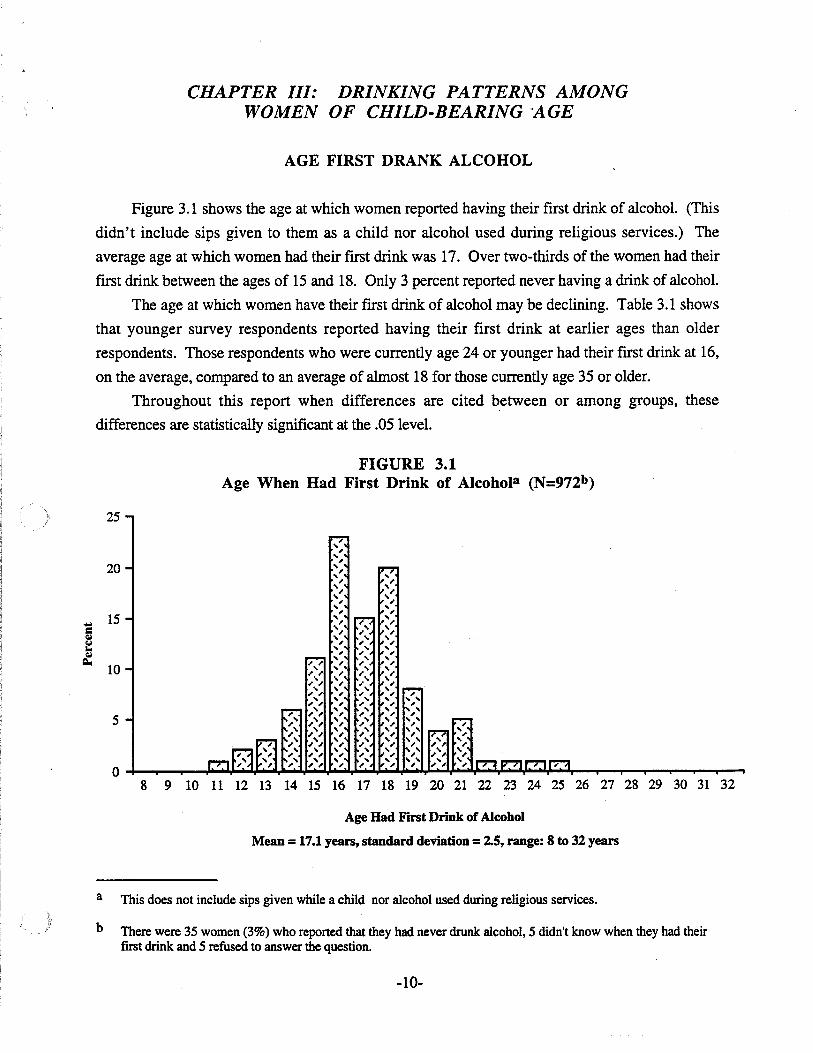
Figure 3.1 shows the age at which women reported having their first drink of alcohol. (This
didn't include sips given to them as a child nor alcohol used during religious services.) The
average age at which women had their first drink was 17. Over two-thirds of the women had their
first drink between the ages of 15 and 18. Only 3 percent reported never having a drink of alcohol.
The age at which women have their first drink of alcohol may be declining. Table 3.1 shows
that younger survey respondents reported having their first drink at earlier ages than older
respondents. Those respondents who were currently age 24 or younger had their first drink at 16,
on the average, compared to an average of almost 18 for those currently age 35 or older.
Throughout this report when differences are cited between or among groups, these
differences are statistically significant at the .05 level.
FIGURE 3.1Age When Had First Drink of Alcohola (N=972b)
25
20
5
... 15=q,j
~
~10
Age Had First Drink of Alcohol
Mean =17.1 years, standard deviation =2.5, range: 8 to 32 years
a This does not include sips given while a child nor alcohol used during religious services.
b There were 35 women (3%) who reported that they had never drunk alcohol, 5 didn't know when they had theirfirst drink and 5 refused to answer the question.
-10-
N149
386434
969
TABLE 3.1Age at Which Women Had Their First Alcoholic Drink by Current Age
Aee Had First Alcoholic Drink. Mean
16.2
16.6
17.817.1
Current Aee18 - 24
25 - 3435 -45
Total
F (2,966) = 35.89, p< .001
CURRENT DRINKING
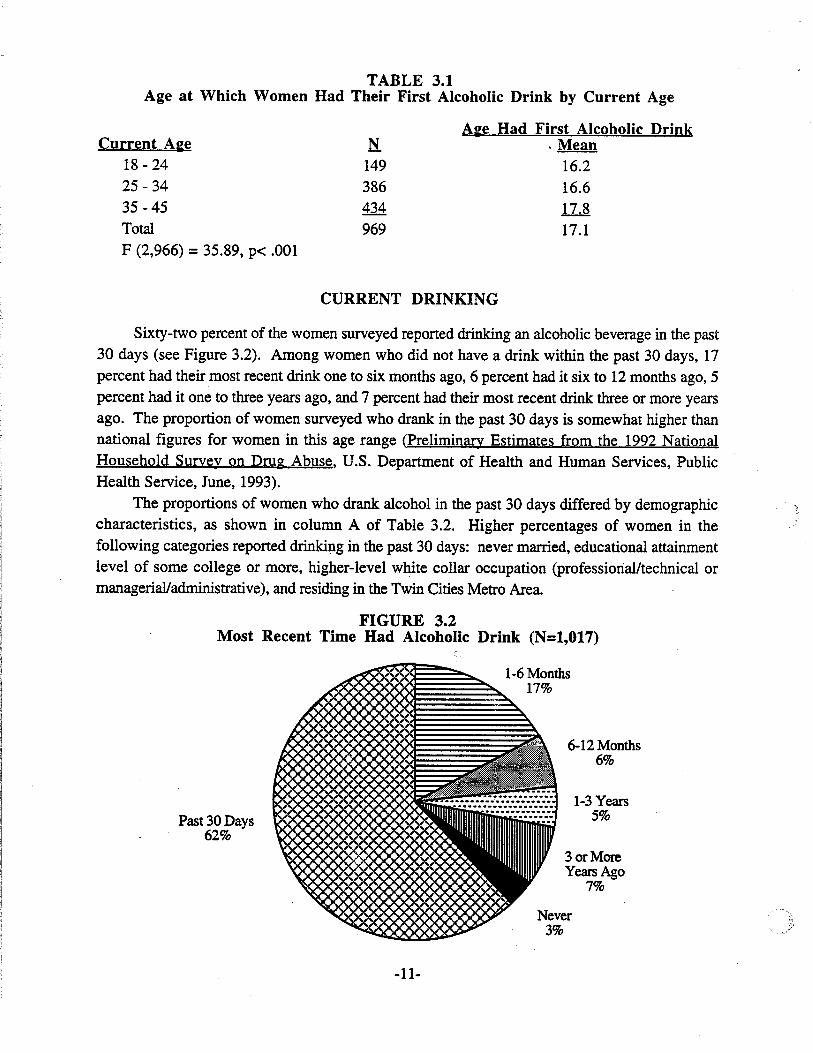
Sixty-two percent of the women surveyed reported drinking an alcoholic beverage in the past
30 days (see Figure 3.2). Among women who did not have a drink within the past 30 days, 17
percent had their most recent drink one to six months ago, 6 percent had it six to 12 months ago, 5percent had it one to three years ago, and 7 percent had their most recent drink three or more years
ago. The proportion of women surveyed who drank in the past 30 days is somewhat higher thannational figures for women in this age range (Preliminary Estimates from the 1992 National
Household Survey on Drug Abuse, U.S. Department of Health and Human Services, Public
Health Service, June, 1993).The proportions of women who drank alcohol in the past 30 days differed by demographic
characteristics, as shown in column A of Table 3.2. Higher percentages of women in thefollowing categories reported drinking in the past 30 days: never married, educational attainment
level of some college or more, higher-level white collar occupation (professional/technical or
managerial/administrative), and residing in the Twin Cities Metro Area.
FIGURE 3.2Most Recent Time Had Alcoholic Drink (N=I,OI7)
1-6 Months17%
Past 30 Days62%
6-12 Months6%
1-3 Years5%
3 or MoreYears Ago
7%
3%
-11-
TABLE 3.2Demographic Characteristics and Current Drinking
Only Respondents Who Drank in Past 30 DaysA. B. C.
Drank in' Mean number Drank 5+past 30 of drinks in drinks on an
days past 30 days occasionin the past
30 daysCharacteristic (N=1017) (N=624) (N=626)
TOTAL 62% 8.5 22%
Age 18 - 20 59% 12.8 42%
21- 24 65% 11.1 43%
25 -34 62% 8.0 ** 25% ***35 -45 62% 7.9 12%
Marital Status Married 60% 7.1 17%
Previously married 57% * 8.8 *** 20% ***Never married 70% 12.1 37%
Education Less than high school graduation 51% 16.1 50%
High school graduationlGED 55% *** 7.9 ** 25% **Some college or more 67% 8.4 19%
Occupation Professional/technical 71% 7.1 14%
Managerial/administrative 68% 8.6 18%
Clerical/sales 62% 8.5 26%
Crafts/operativesllaborers 54% ** 12.6 * 47% ***
Service workers 56% 10.5 26%
Homemaker/student/disabled 54% 7.6 17%
Residence Twin Cities Metro 67% 8.8 21%
Greater Minnesota 56% ** 8.1 24%
******
p < .05
P < .01
P <.001
-12-
DRINKING PATTERNS AMONG CURRENT DRINKERS
Figure 3.3 indicates the number of drinks women reported consuming in the past 30 days
and the number of occasions on which they had five or more drinks during the same period. Only
women who reported drinking in the past 30 days are included in the figure. Three-quarters of the
women reported having 10 or fewer drinks in the past 30 days, and only 4 percent reporting
having more than 30 drinks during this period.
Most of the women who drank in the past 30 days did not have five or more drinks on any
occasion during that time. However, 22 percent had five or more drinks on at least one occasion in
the past 30 days, including 9 percent who had done so on two or more occasions. Having five or
more drinks on an occasion is considered binge drinking for purposes of this survey. The time of
the year that the survey was done (Le., during the "holiday season" months of November and
December) may have resulted in a higher rate of binge drinking being found than if the survey had
been had done at another time of year. The comments of several respondents suggested that
although they had done binge drinking at a holiday party in the past month, this was not their usual
pattern.
FIGURE 3.3Current Drinking Patterns Among Women
Who Drank in the Past 30 Days,
78%o~:;:;:;t""'"'~~~~~~~~"'-'I
1~.....""'"'"
2
3 or More
31 or More
Number of Drinks Consumed 5 or Fewerin the Past 30 Days ~;;:~::;:;;:;:;-""'-'~:;"':;"""""","'-'~,"",,
(N=624) 6-10-F;:;::;::;;:;:;-~
11-20~-'-'~~
21-30
Number of O~casions Had 5 orMore Drinks in Past 30 Days(N=626)
o 10 20 30 40 50 60 70 80 90 100
Percent
-13-
We tested to see whether women who consumed more drinks in the past 30 days, or did
binge drinking, differed demographically from other women who drank during the past 30 days
(see Table 3.2, columns B and C). Results showed a similar pattern for women who consumed
more drinks and women who did binge drinking. First, women who drank more or binge drank
were younger. The point of differentiation seemed to be greatest between those 24 and younger
and those 25 and older. For example, over four in 10 women under age 25, who drank in the past
30 days, reported binge drinking.
Never married women tended to consume more drinks and to be more likely to binge drink
than married or previously married women. This finding seems consistent with the finding that
younger women consume more drinks/binge drink, since never married women tend to be
younger.
Consuming more drinks in the past 30 days and binge drinking were also more likely among
women who had not completed high school and among women who worked in traditional blue
collar occupations (e.g., crafts or trades, operatives, or laborers). About half the women in these
categories reported binge drinking in the past 30 days.
It is interesting to note that college educated women, and women in higher-level white collar
jobs were more likely to drink (at least one drink) in the past 30 days. Yet among women who
drank in the past 30 days, it was the less educated and blue collar workers who drank more or did
binge drinking.
-14-
REDUCTIONS IN DRINKING
Fifty-eight percent of the women who had ever drunk alcohol said that there was a time in the
past when they drank more than they currently do. Most (67%) said that the time in the past that
they had drunk more was five or more years ago. The age group that was most likely to be
drinking less now than in the past was 25 to 34 year olds (64 percent reported a reduction), and 18
to 20 year olds were least likely to report a reduction (40 percent reported a reduction).
We asked those who had reported a reduction in drinking whether there was any special
circumstance or event that caused them to make this reduction. Fifty-eight percent said "yes" there
was a special circumstance or event. Table 3.3 indicates the circumstances/events, and their
frequency, that respondents said caused them to reduce their alcohol intake. The leading reason
was "maturity/grew up/out of college/more responsibilities," followed by "pregnancy/trying to
become pregnant."
Four percent (n=38) of the women surveyed reported that they had been treated in an alcohol
or drug treatment program. Previously married women and those who had not completed high
school were more likely to have been in such a program. Also, those who had been through an
alcohol/drug treatment program were much less likely to be current drinkers compared to other
women who had drunk sometime during their lives (24% vs. 66%).
TABLE 3.3Reasons Women Reduced Their Alcohol Intake at
Some Time in the Pasta
Maturity, grew up, out of college, more responsibilities
Pregnancy, trying to become pregnant
Health concerns
Family, spending time with children
Concerns about others (alcoholic friends or relatives)
Went through treatment
Lost desire to drink, didn't like it
Marriage
29%
26%
7%
5%
4%
4%
4%
4%
a Includes only women who said they drank more in the past than :"ley do now and who said there was a specialcircumstance or event that caused them to reduce their alcohol intake (n=332).
NOTE: Other reasons mentioned by 2 percent or less were: concerns about own drinking, religious reasons, newdriving laws (e.g., DWl laws), job change or working hours change, car accident, trying to lose weight,affected job performance, divorce or separation, death of friend or relative, started or changed schools,ended abusive relationship, to reduce stress, lack of tolerance for alcohol, financial reasons, legal reasons,no time. job regulations. got raped while drunk, designated driver. and moved.
-15-
SUMMARY
A&e First Drank Alcohol
• The average age that women had their first drink of alcohol was 17. However, the agewomen begin drinking may be declining. On the average, younger women in the survey(under age 25) reported having their first drink at age 16.
Current Drinkin&
• Sixty-two percent of the women surveyed reported drinking in the past 30 days.
• Women who were never married, were college educated, held higher-level white collar jobsand lived in the Twin Cities Metro Area were more likely to report drinking in the past 30days.
Drinkin& Patterns Amon& Current Drinkers
• Among current women drinkers, three-quarters reported drinking 10 or fewer drinks in thepast 30 days, while 4 percent reported drinking more than 30 drinks during this period.
• Of current women drinkers, 22 percent reported binge drinking (5+ drinks) on at least oneoccasion in the past 30 days, including 9 percent who did this two or more times during thisperiod. The rate of binge drinking found in the survey may be somewhat elevated because ofthe time of year the survey was conducted -- i.e., during the holiday season.
• Among current drinkers, women who consumed more drinks or binge drank in the past 30days had similar demographic characteristics. They tended to be younger (under 25), nevermarried, less educated (not a high school graduate) and in blue collar occupations.
Reductions in Drinkin&
• Fifty-eight percent of women who had ever drunk alcohol said there was a time in the pastduring which they drank more than they do now. Many of these women said that there was aspecial circumstance or event that caused them to reduce their drinking. "Growing up/moreresponsibility" and "pregnancy" were the leading reasons cited for reducing drinking.
• Four percent of the women surveyed had been in an alcohol or drug treatment program.Only 24 percent of these women were current drinkers.
-16-

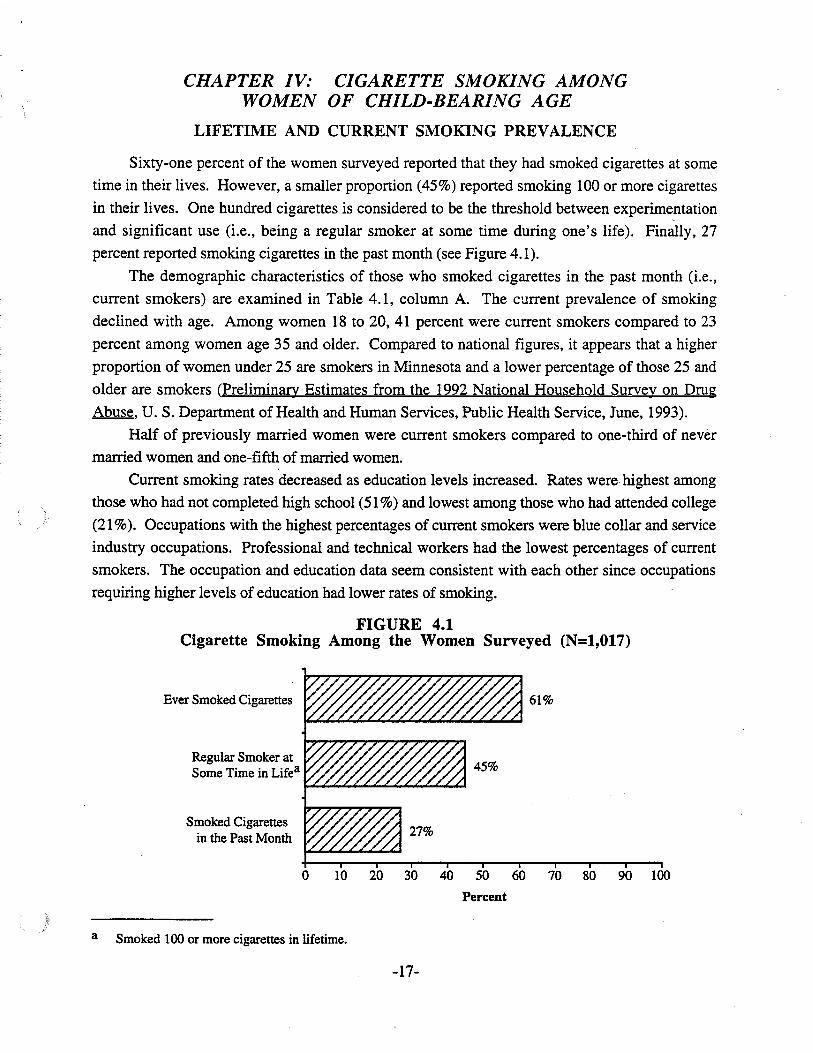
CHAPTER IV: CIGARETTE SMOKING AMONGWOMEN OF CHILD-BEARING AGE
LIFETIME AND CURRENT SMOKING PREVALENCE
Sixty-one percent of the women surveyed reported that they had smoked cigarettes at some
time in their lives. However, a smaller proportion (45%) reported smoking 100 or more cigarettes
in their lives. One hundred cigarettes is considered to be the threshold between experimentation
and significant use (Le., being a regular smoker at some time during one's life). Finally, 27
percent reported smoking cigarettes in the past month (see Figure 4.1).
The demographic characteristics of those who smoked cigarettes in the past month (i.e.,
current smokers) are examined in Table 4.1, column A. The current prevalence of smoking
declined with age. Among women 18 to 20, 41 percent were current smokers compared to 23
percent among women age 35 and older. Compared to national figures, it appears that a higher
proportion of women under 25 are smokers in Minnesota and a lower percentage of those 25 and
older are smokers (Preliminary Estimates from the 1992 National Household Survey on Drug
Abuse, U. S. Department of Health and Human Services, Public Health Service, June, 1993).
Half of previously married women were current smokers compared to one-third of never
married women and one-fifth of married women.
Current smoking rates decreased as education levels increased. Rates were highest among
those who had not completed high school (51 %) and lowest among those who had attended college
(21 %). Occupations with the highest percentages of current smokers were blue collar and service
industry occupations. Professional and technical workers had the lowest percentages of current
smokers. The occupation and education data seem consistent with each other since occupations
requiring higher levels of education had lower rates of smoking.
FIGURE 4.1Cigarette Smoking Among the Women Surveyed (N=1,OI7)
Ever Smoked Cigarettes
Regular Smoker atSome Time in Lifea
Smoked Cigarettesin the Past Month
61%
a
o 10 20 30 40 50 60 70 80 90 100
Percent
Smoked 100 or more cigarettes in lifetime.
-17-
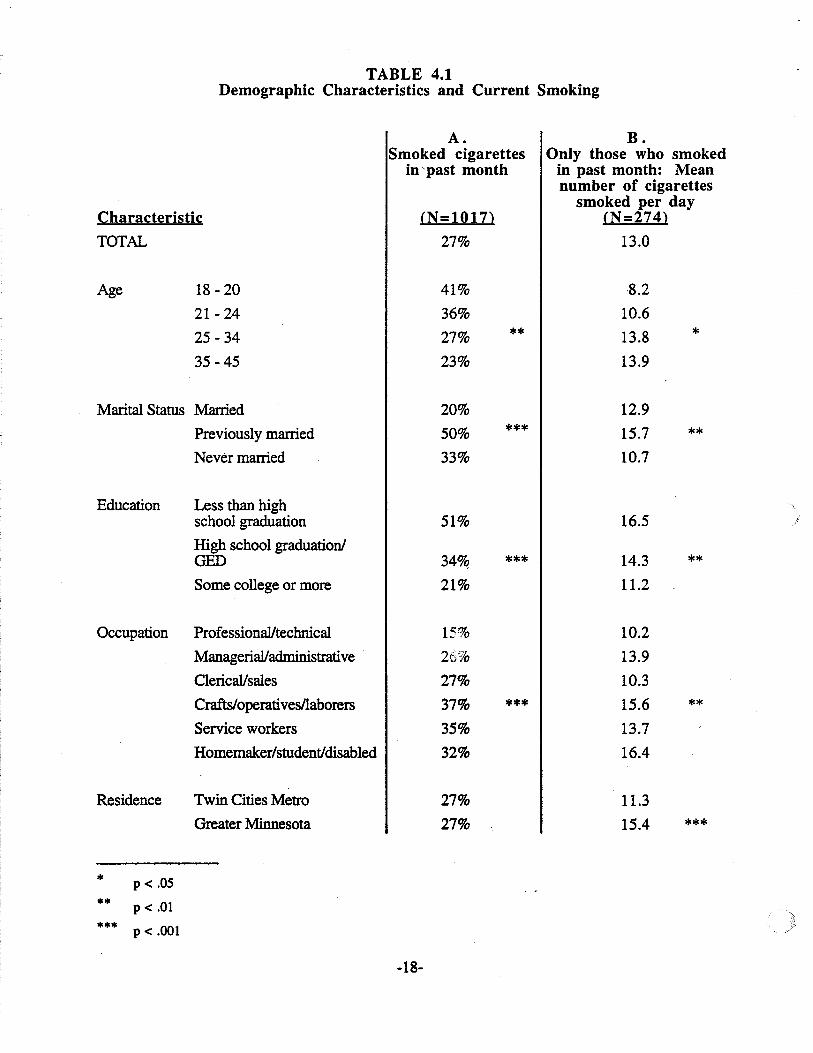
TABLE 4.1Demographic Characteristics and Current Smoking
A. B.Smoked cigarettes Only those who smoked
in 'past month in past month: Meannumber of cigarettes
smoked per dayCharacteristic (N-IOI7) (N=274)
TOTAL 27% 13.0
Age 18 - 20 41% ,8.2
21- 24 36% 10.6
25 - 34 27% ** 13.8 *
35 - 45 23% 13.9
Marital Status Married 20% 12.9
Previously married 50% *** 15.7 **Never married 33% 10.7
Education Less than highschool graduation 51% 16.5
High school graduation!OED 34% *** 14.3 **Some college or more 21% 11.2
Occupation Professional/technical 15% 10.2
Managerial/administrative 26% 13.9
Oerical/sales 27% 10.3
Crafts/operativesllaborers 37% *** 15.6 **Service workers 35% 13.7
Homemaker/student/disabled 32% 16.4
Residence Twin Cities Metro 27% 11.3
Greater Minnesota 27% 15.4 ***
******
p< .05
P < .01
P < .001
-18-
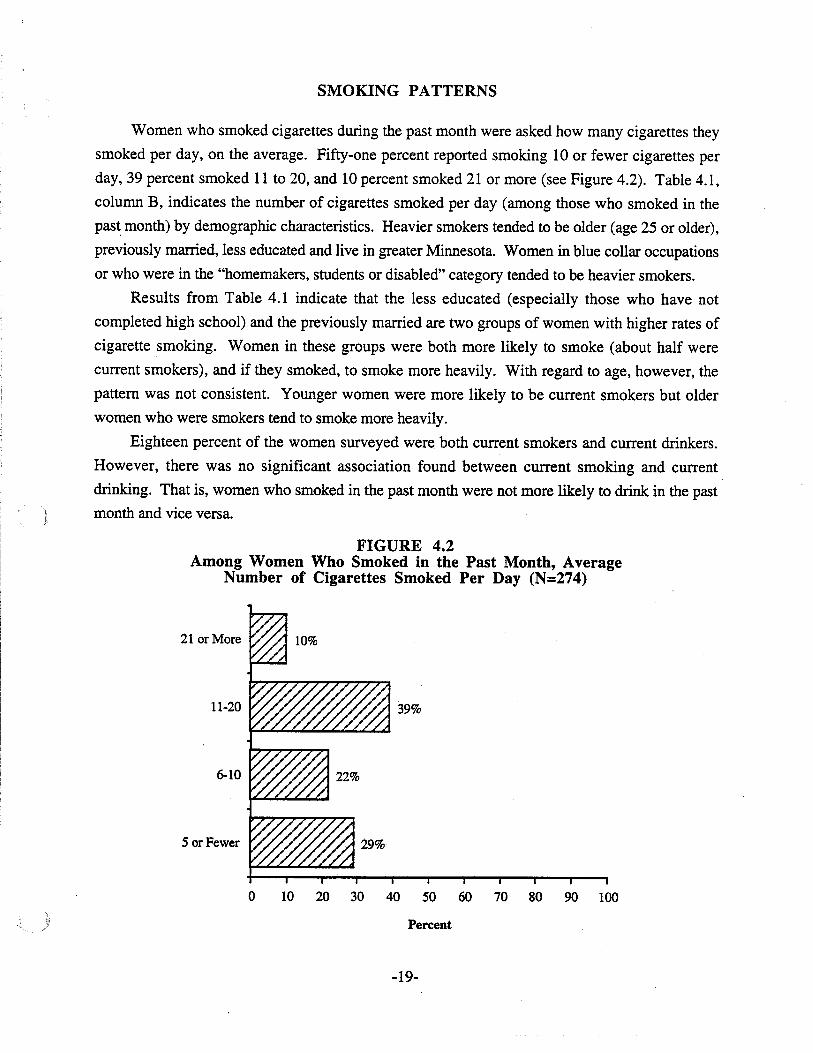
SMOKING PATTERNS
Women who smoked cigarettes during the past month were asked how many cigarettes they
smoked per day, on the average. Fifty-one percent reported smoking 10 or fewer cigarettes per
day, 39 percent smoked 11 to 20, and 10 percent smoked 21 or more (see Figure 4.2). Table 4.1,
column B, indicates the number of cigarettes smoked per day (among those who smoked in the
pas~ month) by demographic characteristics. Heavier smokers tended to be older (age 25 or older),
previously married, less educated and live in greater Minnesota. Women in blue collar occupations
or who were in the "homemakers, students or disabled" category tended to be heavier smokers.
Results from Table 4.1 indicate that the less educated (especially those who have not
completed high school) and the previously married are two groups of women with higher rates of
cigarette smoking. Women in these groups were both more likely to smoke (about half were
current smokers), and if they smoked, to smoke more heavily. With regard to age, however, the
pattern was not consistent. Younger women were more likely to be current smokers but older
women who were smokers tend to smoke more heavily.
Eighteen percent of the women surveyed were both current smokers and current drinkers.
However, there was no significant association found between current smoking and current
drinking. That is, women who smoked in the past month were not more likely to drink in the past
month and vice versa.
FIGURE 4.2Among Women Who Smoked in the Past Month, Average
Number of Cigarettes Smoked Per Day (N=274)
21 or More
11-20
6-10
5 or Fewer
39%
o 10 20 30 40 50 60 70 80 90 100
Percent
-19-
SUMMARY
• Sixty-one percent of the women surveyed had tried smoking cigarettes, 45 percent had beenregular smokers at some time during their lives, and 27 percent were current smokers (i.e.,smoked in the past month).
• Higher rates of current smoking were found among younger women, the previously married,the less educated, and those in blue collar and service industry occupations.
• Of current smokers, 51 percent reported smoking 10 or fewer cigarettes per day, 39 percentsmoked 11 to 20, and 10 percent smoked 21 or more.
• Heavier smokers tended to be older, previously married, less educated, and living in greaterMinnesota.
• Current smokers were not more likely to be current drinkers, nor vice versa.
-20-
CHAPTER V: DRINKING DURING MOSTRECENT PREGNANCY
PREGNANCIES AMONG THE WOMEN SURVEYED
The survey findings reported in this chapter refer to the most recent pregnancy of five or
more months. Recall that this length was chosen because there is a high likelihood that the woman
intends to carry the pregnancy to full term after reaching this point.
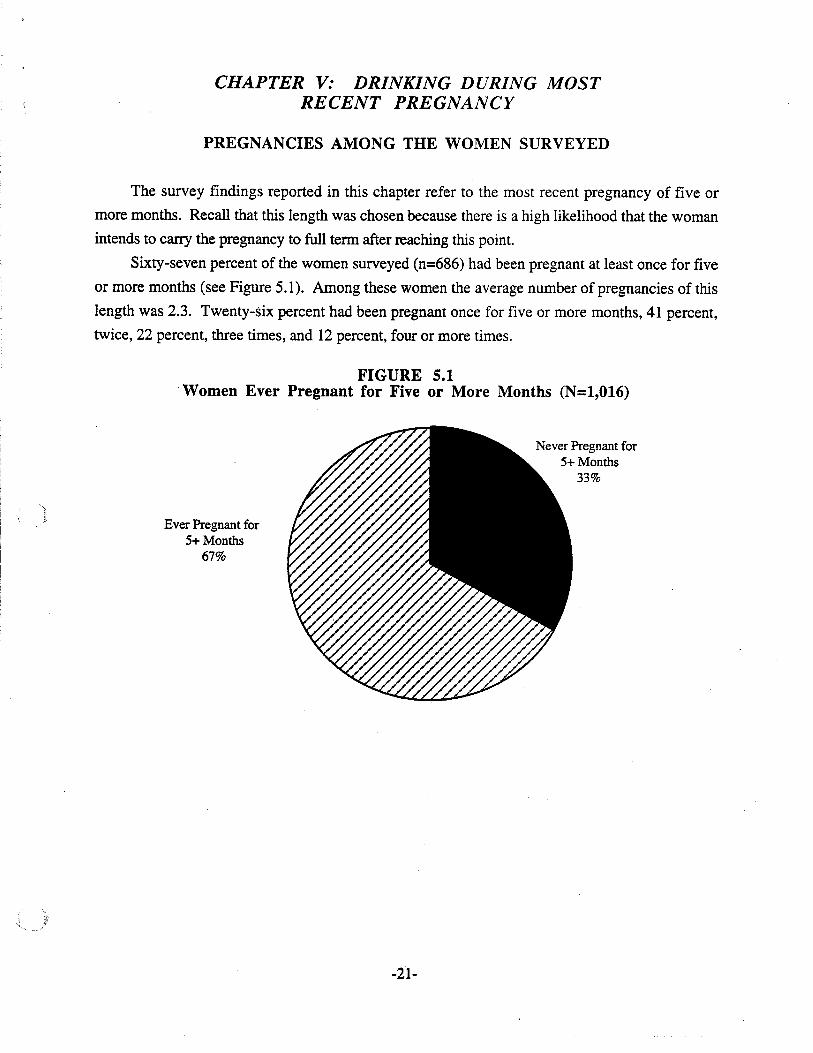
Sixty-seven percent of the women surveyed (n=686) had been pregnant at least once for five
or more months (see Figure 5.1). Among these women the average number of pregnancies of this
length was 2.3. Twenty-six percent had been pregnant once for five or more months, 41 percent,
twice, 22 percent, three times, and 12 percent, four or more times.
FIGURE 5.1Women Ever Pregnant for Five or More Months (N=1,016)
Ever Pregnant for5+ Months
67%
Never Pregnant for5+ Months
33%
-21-
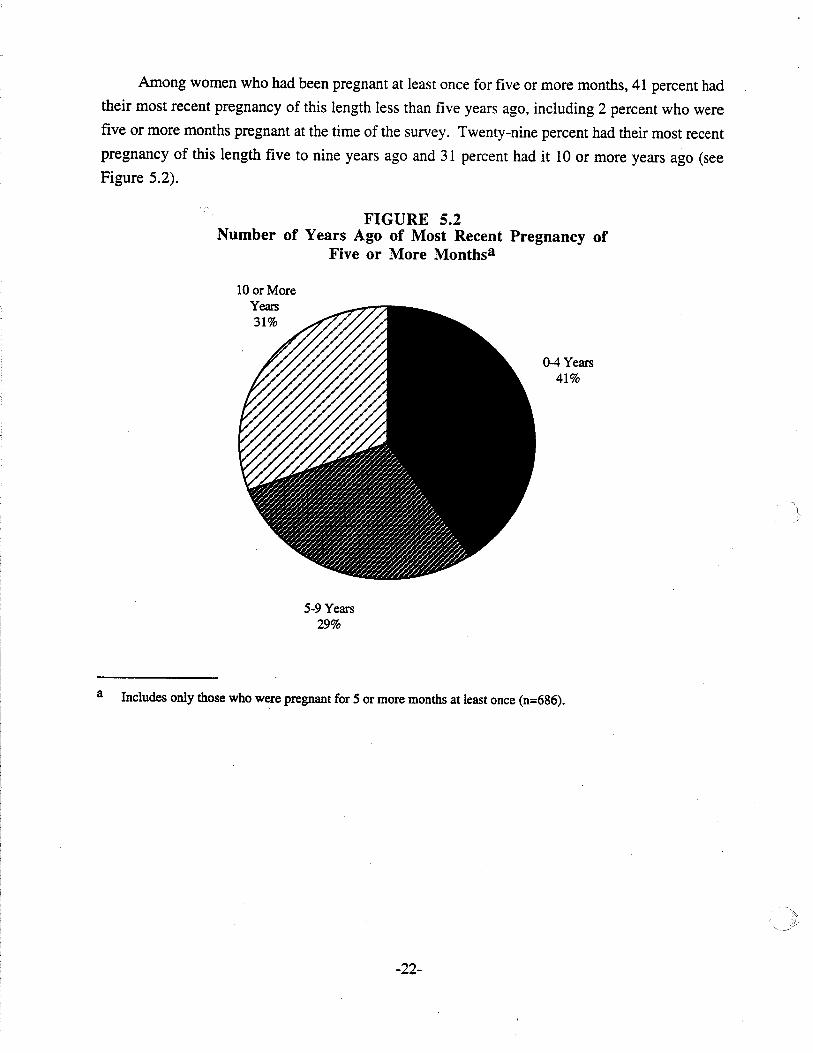
Among women who had been pregnant at least once for five or more months, 41 percent had
their most recent pregnancy of this length less than five years ago, including 2 percent who were
five or more months pregnant at the time of the survey. Twenty-nine percent had their most recent
pregnancy of this length five to nine years ago and 31 percent had it 10 or more years ago (see
Figure 5.2).
FIGURE 5.2Number of Years Ago of Most Recent Pregnancy of
Five or More Monthsa
10 or MoreYears31%
0-4 Years41%
5-9 Years29%
a Includes only those who were pregnant for 5 or more months at least once (n=686).
-22-
DRINKING PATTERNS DURING MOST RECENT PREGNANCY
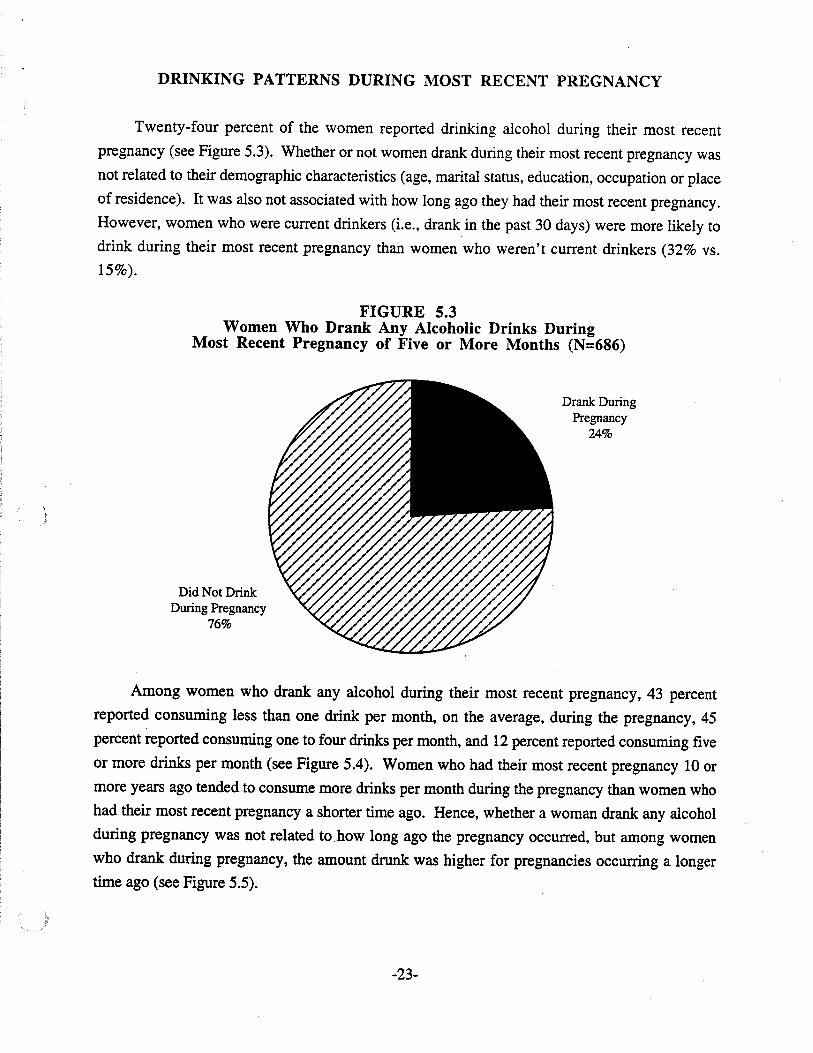
Twenty-four percent of the women reported drinking alcohol during their most recent
pregnancy (see Figure 5.3). Whether or not women drank during their most recent pregnancy was
not related to their demographic characteristics (age, marital status, education, occupation or place
of residence). It was also not associated with how long ago they had their most recent pregnancy.
However, women who were current drinkers (Le., drank in the past 30 days) were more likely to
drink during their most recent pregnancy than women who weren't current drinkers (32% vs.
15%).
FIGURE 5.3Women Who Drank Any Alcoholic Drinks During
Most Recent Pregnancy of Five or More Months (N=686)
Did Not DrinkDuring Pregnancy
76%
Drank DuringPregnancy
24%
Among women who drank any alcohol during their most recent pregnancy, 43 percent
reported consuming less than one drink per month, on the average, during the pregnancy, 45
percent reported consuming one to four drinks per month, and 12 percent reported consuming five
or more drinks per month (see Figure 5.4). Women who had their most recent pregnancy 10 or
more years ago tended to consume more drinks per month during the pregnancy than women who
had their most recent pregnancy a shorter time ago. Hence, whether a woman drank any alcohol
during pregnancy was not related to. how long ago the pregnancy occurred, but among women
who drank during pregnancy, the amount drunk was higher for pregnancies occurring a longer
time ago (see Figure 5.5).
-23-
FIGURE 5.4Number of Drinks Per Month During Most Recent Pregnancya
Average Number ofDrinks Per Month:
5 or more
1-4
Less than one
o 10 20
Percent
30 40 50
a Includes only those who drank during their most recent pregnancy of five or more months (n=164).
FIGURE 5.5Number of Drinks Consumed Per Month During Most Recent
Pregnancy by Number of Years Ago That It Occurreda
10 or more
Number of Years Ago 5-9That Most RecentPregnancy Occurred
0-4
4.3
F (2,161) =3.50, P < .05.
o 123 4
Average Number of Drinks C'.\Dsumed Per Month
5
a Includes only those who drank alcohol during their most recent pregnancy of five or more months (n=I64).
-24-
Among women who drank during pregnancy, the amount consumed per month was not
associated with demographic characteristics, with one exception. Women who were previously
married at the time of the survey drank more during their most recent pregnancy than women who
were married or never married -- an average of 3.1 drinks per month compared to 0.9 for married
women and 1.2 for never married women. It should be noted that the marital status of these
previously married women may have been different at the time of their pregnancy -- Le., many of
them may have been married at the time of their pregnancy.
Only 5 percent (n=8) of the women who drank during their most recent pregnancy reported
having five or more drinks on an occasion during the pregnancy. Hence, binge drinking during
pregnancy was rare among the women surveyed. Most pregnant women (79%) who drank
averaged only one drink per day on the days they drank, 15 percent averaged two drinks, and 6
percent averaged three to four drinks.
Among women who drank during their most recent pregnancy, 34 percent drank more at the
beginning of the pregnancy, 6 percent more in the middle, 13 percent more at the end, and 47
percent the same throughout (see Figure 5.6). One reason why some women drank more at the
beginning is that they stopped drinking once they realized they were pregnant. Nevertheless, those
who said that they drank the same throughout the pregnancy did not report drinking significantly
larger amounts during pregnancy than women who drank more at the beginning, middle or end of
their pregnancies. The women who drank the same throughout the pregnancy were also not
different demographically from the other women.
The 1989 Minnesota Household Survey of Drug and Alcohol Use Among Adults found a
higher rate of drinking during most recent pregnancy than the current survey -- 41 percent vs. 24
percent (Research News, Minnesota Department of Human Services, Chemical Dependency
Division, January, 1993.) However, the 1989 survey also found that most women who drank
while pregnant drank very lightly.
-25-
FIGURE 5.6Period During Most Recent Pregnancy When Women Drank Morea
Same Throughout47%
Middle6%
a
End13% .
Includes only those who drank alcohol during their most recent pregnancy of five or more months (n=163).
-26-
CHANGES IN DRINKING DUE TO PREGNANCY
Figure 5.7 indicates changes or stability in drinking during the most recent pregnancy forwomen who ever drank alcohol. Fifty-two percent stopped drinking during the pregnancy, 15percent reduced the amount they were drinking, 28 percent were not drinking prior to thepregnancy and didn't drink during the pregnancy, and 5 percent made no reduction in theirdrinking while pregnant. Of those who were drinking prior to their pregnancy, 93 percent either'reduced or stopped their drinking while pregnant. Those who didn't reduce their drinking duringpregnancy tended to be light drinkers. They did not drink any more per month during pregnancythan those who reduced their drinking (average of 2.4 and 2.5 drinks per month, respectively).Those who reduced or stopped drinking during pregnancy did not differ demographically fromthose who continued to drink the same amount during pregnancy.
It should also be noted that among those who reduced or stopped their drinking duringpregnancy, most (93%) apparently did so after they realized they were pregnant rather than prior totheir pregnancy (7%) because they were planning to become pregnant.
Most (79%) of the women who reduced or stopped their drinking during their most recentpregnancy resumed (Le., started or increased) their drinking after their pregnancy ended.However, the length of time after the pregnancy ended that they resumed drinking varied. Twentynine percent resumed within four weeks after the pregnancy ended, 20 percent did so within five toeight weeks, another 20 percent within nine to 16 weeks, and 31 percent after 17 or more weeks.
FIGURE 5.7Change/Stability in Drinking During Most Recent
Pregnancy of Five or More Monthsa
Not DrinkingPrior to Pregnancy
and Didn't DrinkDuring Pregnancy
28%
ReducedDrinking
15%
No ~
Reduction ~ Other b5% <1%
StoppedDrinking
52%
a Includes only women who ever drank alcohol (n=661).
b Includes one respondent who started drinking during pregnancy, and one who decreased her drinking early in thepregnancy and, then, increased it
-27-
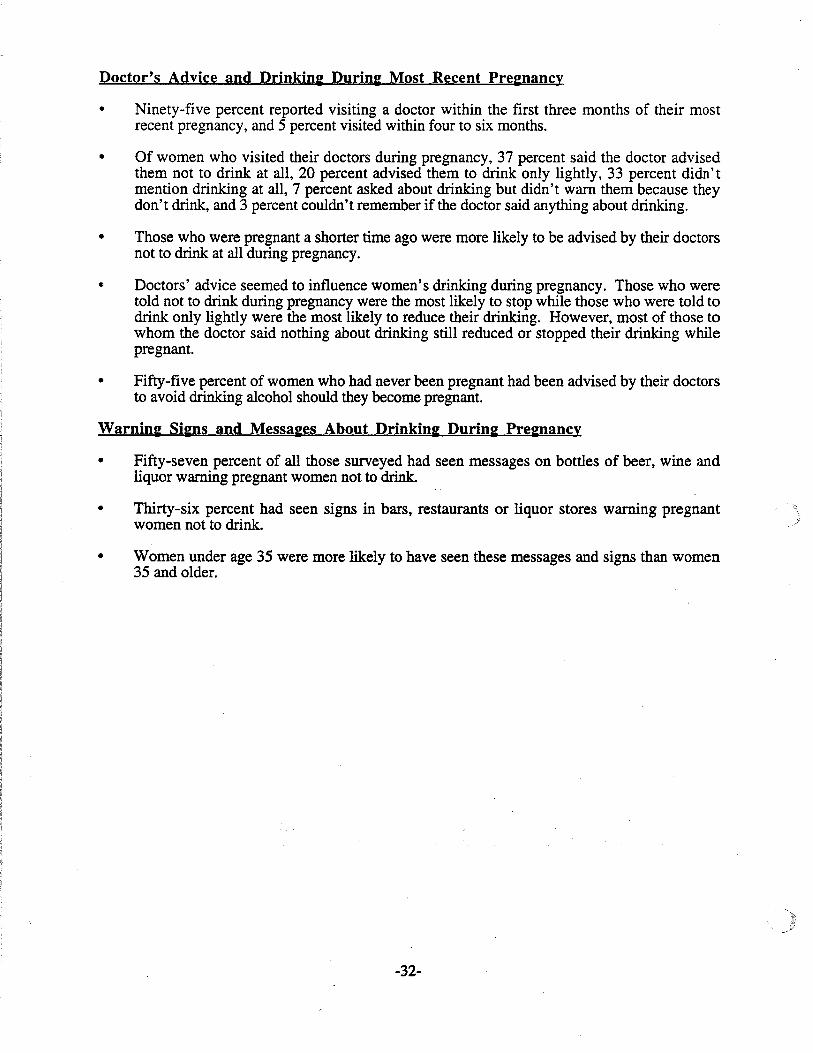
DOCTOR'S ADVICE AND DRINKINGDURING MOST RECENT PREGNANCY
Ninety-five percent of the women said they visited a doctor within the first three months of
their most recent pregnancy. Five percent visited within four to six months, and only one
respondent didn't visit a doctor at all. Most of the women (89%) visited the doctor nine or more
times during the pregnancy, including 36 percent who visited the doctor 15 or more times.
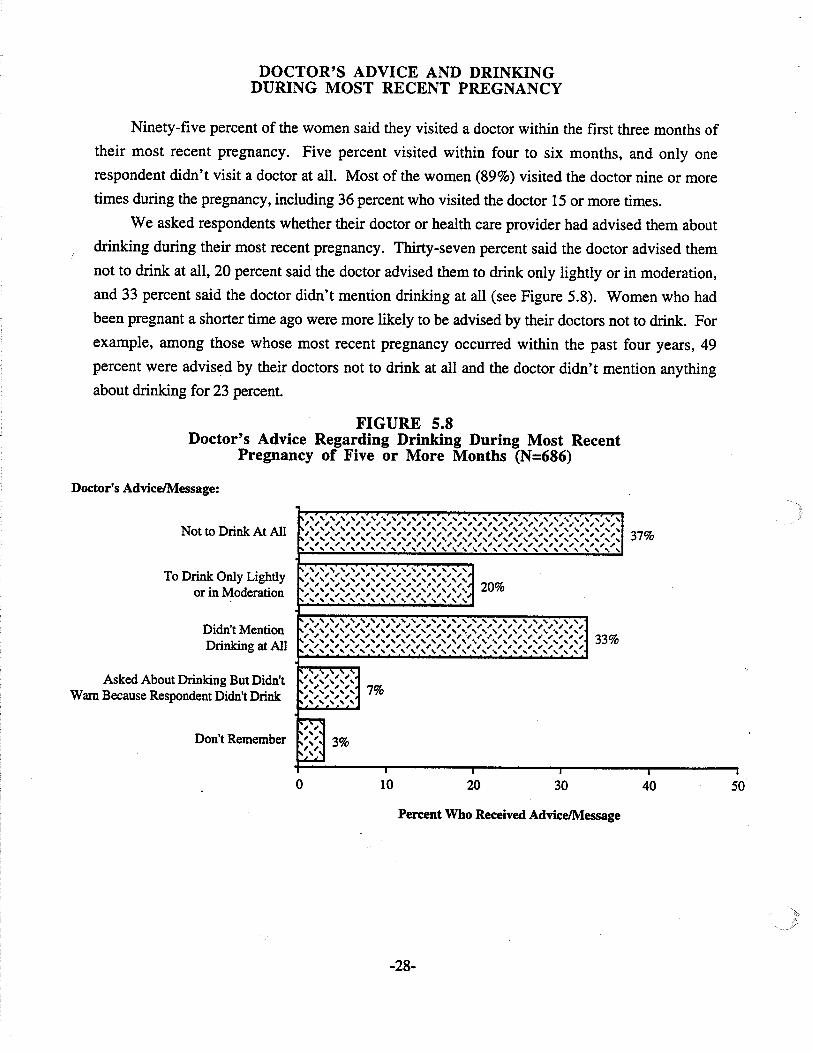
We asked respondents whether their doctor or health care provider had advised them about
drinking during their most recent pregnancy. Thirty-seven percent said the doctor advised them
not to drink at all, 20 percent said the doctor advised them to drink only lightly or in moderation,
and 33 percent said the doctor didn't mention drinking at all (see Figure 5.8). Women who had
been pregnant a shorter time ago were more likely to be advised by their doctors not to drink. For
example, among those whose most recent pregnancy occurred within the past four years, 49
percent were advised by their doctors not to drink at all and the doctor didn't mention anything
about drinking for 23 percent.
FIGURE 5.8Doctor's Advice Regarding Drinking During Most Recent
Pregnancy of Five or More Months (N=686)
Doctor's AdviceJMessage:
Not to Drink At All
To Drink Only Lightlyor in Moderation
Didn't MentionDrinking at All
Asked About Drinking But Didn'tWarn Because Respondent Didn't Drink
Don't Remember
r'o.' " " " " " " " " " " " " " " " "" """ " """ " " " " " "~ , , , , , , , , , , , , , , , , ,. , , , , , , , , , , , , ,~.' " " " " " " " " " " " " " " " " " " " " " " " " " " " " " " 37%' , , , , , , , , , , , , , , , , , , , , , , , , , , , , , ,~.' " " " " " " " " " " " " " " " " " " " " " " " " " " " " " ,, , , , , , , , , , , , , , , , , , , , , , , , , , , , , , ,
" " " " " " " " " , " " " " " " " " " " " " " " " " " " " " "~,',',',',',',',',',',',',',',',',
~,~,~,~,~,~,~,~,~,~,~,~,~,~,~,~,~, 20%~"""""""""""""""",
" " " " " " " " " " " " " " " " " " " " " " " " " " ", , , , , , , , , , , , , , , , , , , , , , , , , , , ," " " " " " " " " " " " " " " " " " " " " " " " " " ", , , , , , , , , , , , , , , , .~ , , ~ , ~ , ~ , , , , 33%
',',',','~',','~',','~'~',',','~',',','~','~'~',','~', ", , , , , , , , , , , , , , , , , , , , , , , , , , ,:- ' , , , ,, ~ , , ,'.' , , , ,, ~ ~ , ~ 7%'.' , , , ,, , , , ,, , , , ,
~~,', 3%',',~
I I ,o 10 20 30 40 50
Percent Who Received AdviceJMessage
-28-
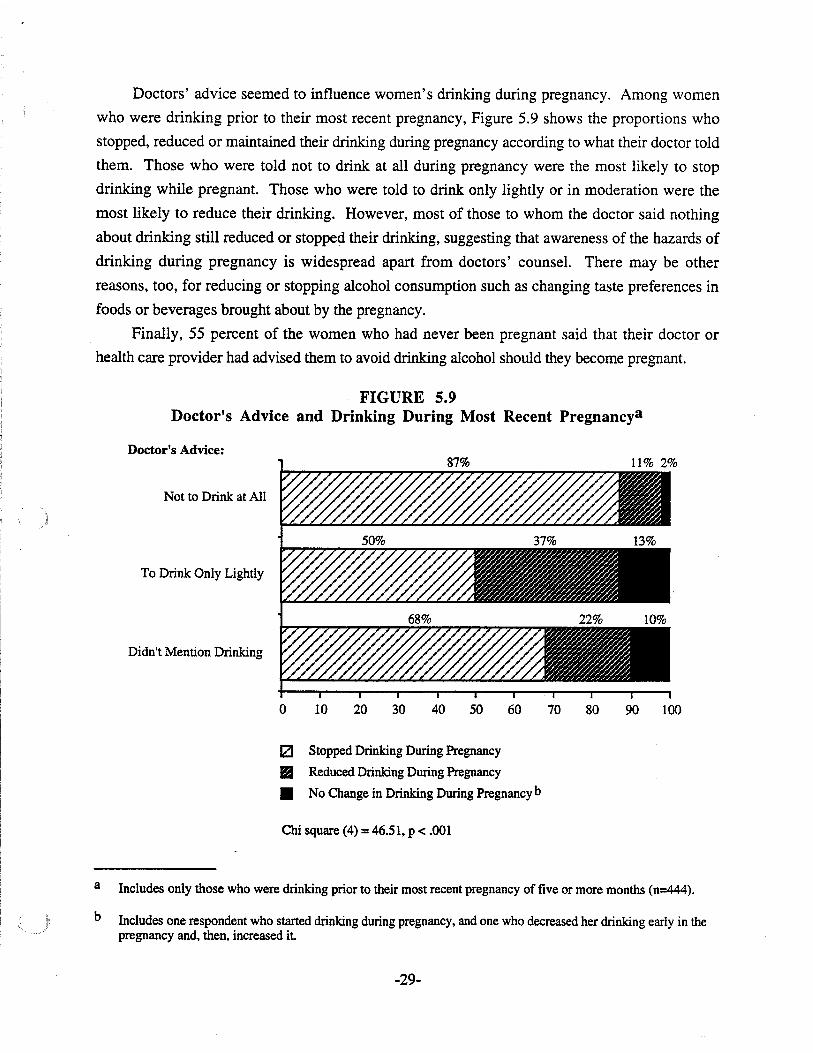
Doctors' advice seemed to influence women's drinking during pregnancy. Among women
who were drinking prior to their most recent pregnancy, Figure 5.9 shows the proportions who
stopped, reduced or maintained their drinking during pregnancy according to what their doctor told
them. Those who were told not to drink at all during pregnancy were the most likely to stop
drinking while pregnant. Those who were told to drink only lightly or in moderation were the
most likely to reduce their drinking. However, most of those to whom the doctor said nothing
about drinking still reduced or stopped their drinking, suggesting that awareness of the hazards of
drinking during pregnancy is widespread apart from doctors' counsel. There may be other
reasons, too, for reducing or stopping alcohol consumption such as changing taste preferences in
foods or beverages brought about by the pregnancy.
Finally, 55 percent of the women who had never been pregnant said that their doctor or
health care provider had advised them to avoid drinking alcohol should they become pregnant.
FIGURE 5.9Doctor's Advice and Drinking During Most Recent Pregnancya
Doctor's Advice:87% 11% 2%
Not to Drink at All
To Drink Only Lightly
Didn't Mention Drinking
o 10 20 30 40 50 60 70 80 90 100
a
b
IZJ Stopped Drinking During Pregnancy
II Reduced Drinking During Pregnancy
• No Change in Drinking During Pregnancy b
Chi square (4) = 46.51, P < .001
Includes only those who were drinking prior to their most recent pregnancy of five or more months (n=444).
Includes one respondent who started drinking during pregnancy, and one who decreased her drinking early in thepregnancy and, then, increased it
-29-
WARNING SIGNS AND MESSAGESABOUT DRINKING DURING PREGNANCY
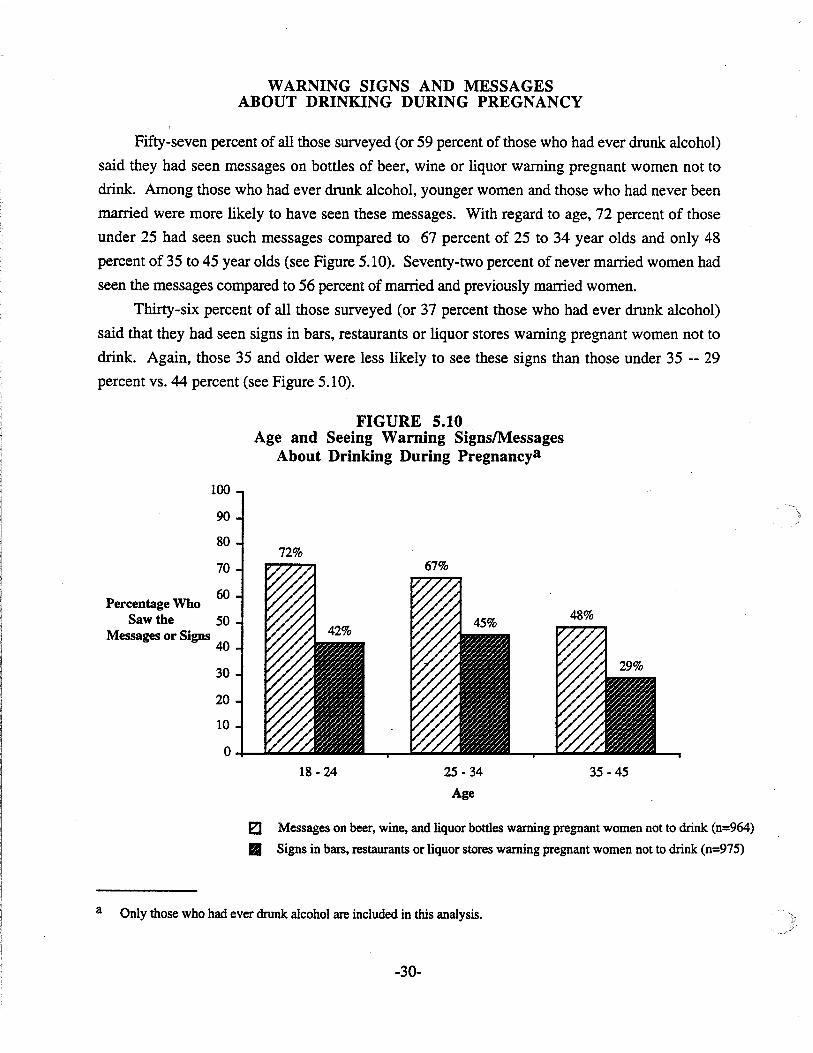
Fifty-seven percent of all those surveyed (or 59 percent of those who had ever drunk alcohol)
said they had seen messages on bottles of beer, wine or liquor warning pregnant women not to
drink. Among those who had ever drunk alcohol, younger women and those who had never been
married were more likely to have seen these messages. With regard to age, 72 percent of those
under 25 had seen such messages compared to 67 percent of 25 to 34 year olds and only 48
percent of 35 to 45 year olds (see Figure 5.10). Seventy-two percent of never married women had
seen the messages compared to 56 percent of married and previously married women.
Thirty-six percent of all those surveyed (or 37 percent those who had ever drunk alcohol)
said that they had seen signs in bars, restaurants or liquor stores warning pregnant women not to
drink. Again, those 35 and older were less likely to see these signs than those under 35 -- 29
percent vs. 44 percent (see Figure 5.10).
FIGURE 5.10Age and Seeing Warning SignslMessages
About Drinking During Pregnancya
35 -45
100
90
8072%
70
Percentage Who60
Saw the 50Messages or Signs
40
30
20
10
0
18 - 24 2S - 34
Age
E:J Messages on beer, wine, and liquor bottles warning pregnant women not to drink (n=964)
.. Signs in bars, restaurants or liquor stores warning pregnant women not to drink (n=975)
a Only those who had ever drunk alcohol are included in this analysis.
-30-
SUMMARY
Preenancies Arnone the Women Surveyed
•
•
Two-thirds of the women surveyed had been pregnant sometime during their lives for five ormore months.
Among these women, 41 percent had their most recent pregnancy of five or more monthsless than five years ago, 29 percent had it five to nine years ago, and 31 percent had it 10 ormore years ago.
Drinkine Patterns Durine Most Recent Preenancy
• About one-quarter (24%) reported drinking alcohol during their most recent pregnancy offive or more months.
• Those who drank during their pregnancy tended to drink lightly. Forty-three percent saidthey consumed less than one drink per month during pregnancy, 45 percent averaged one tofour drinks per month, and 12 percent averaged five or more drinks per month.
• Binge drinking during pregnancy was rare. Only 5 percent (n=8) of the women who drankduring pregnancy reported binge drinking (which is 1 percent of all the women who werepregnant).
• Those who had their most recent pregnancy 10 or more years ago were not more likely todrink during the pregnancy, but if they drank, they tended to drink more than women whowere pregnant a shorter time ago.
• Women who drank during their most recent pregnancy were similar demographically to thosewho didn't.
• Current drinkers were more likely to have drunk during their most recent pregnancy.
Chanees in Drinkine Due to Preenancy
• Of those who were drinking prior to their most recent pregnancy, 93 percent either reducedor stopped drinking while pregnant.
• Most women who reduced or stopped drinking during pregnancy apparently did not do sountil after they realized they were pregnant rather than doing so prior to pregnancy becausethey were planning to become pregnant.
• Those who did not reduce their drinking during pregnancy tended to be light drinkers. Theydid not drink any more during pregnancy than those who reduced their drinking.
• Most (79%) of the women who reduced or stopped their drinking during pregnancy resumed(Le., started or increased) their drinking after the pregnancy ended.
-31-
Doctor's Advice and Drinkinll Durinll Most Recent Prellnancy
• Ninety-five percent reported visiting a doctor within the first three months of their mostrecent pregnancy, and 5 percent visited within four to six months.
• Of women who visited their doctors during pregnancy, 37 percent said the doctor advisedthem not to drink at all, 20 percent advised them to drink only lightly, 33 percent didn'tmention drinking at all, 7 percent asked about drinking but didn't warn them because theydon't drink, and 3 percent couldn't remember if the doctor said anything about drinking.
• Those who were pregnant a shorter time ago were more likely to be advised by their doctorsnot to drink at all during pregnancy.
• Doctors' advice seemed to influence women's drinking during pregnancy. Those who weretold not to drink during pregnancy were the most likely to stop while those who were told todrink only lightly were the most likely to reduce their drinking. However, most of those towhom the doctor said nothing about drinking still reduced or stopped their drinking whilepregnant.
• Fifty-five percent of women who had never been pregnant had been advised by their doctorsto avoid drinking alcohol should they become pregnant.
Warninll Sillns and Messa&es About Drinkin& Durinll Prellnancy
• Fifty-seven percent of all those surveyed had seen messages on bottles of beer, wine andliquor warning pregnant women not to drink.
• Thirty-six percent had seen signs in bars, restaurants or liquor stores warning pregnantwomen not to drink.
• Women under age 35 were more likely to have seen these messages and signs than women35 and older.
-32-
CHAPTER VI: CIGARETTE SMOKING DURINGMOST RECENT PREGNANCY
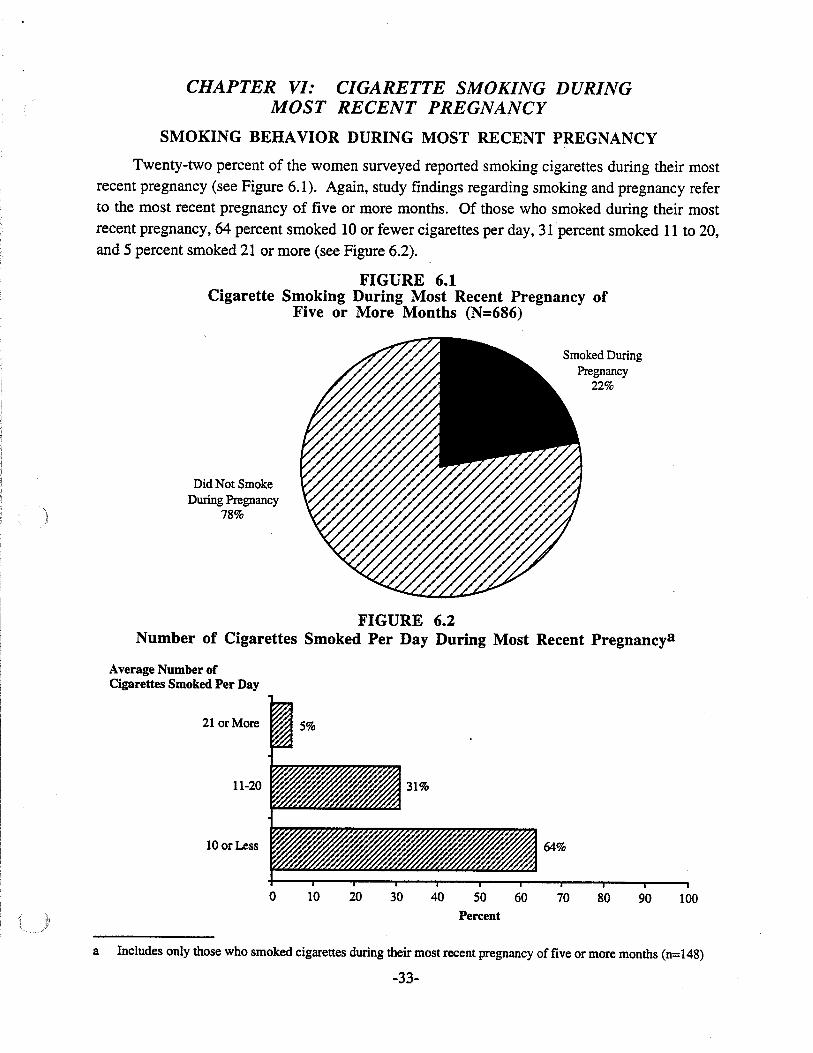
SMOKING BEHAVIOR DURING MOST RECENT PREGNANCY
Twenty-two percent of the women surveyed reported smoking cigarettes during their mostrecent pregnancy (see Figure 6.1). Again, study findings regarding smoking and pregnancy referto the most recent pregnancy of five or more months. Of those who smoked during their mostrecent pregnancy, 64 percent smoked 10 or fewer cigarettes per day, 31 percent smoked 11 to 20,and 5 percent smoked 21 or more (see Figure 6.2).
FIGURE 6.1Cigarette Smoking During Most Recent Pregnancy of
Five or More Months (N=686)
Did Not SmokeDuring Pregnancy
78%
Smoked DuringPregnancy
22%
FIGURE 6.2Number of Cigarettes Smoked Per Day During Most Recent Pregnancya
Average Number ofCigarettes Smoked Per Day
21 or More
11-20
lOorLess 64%
o 10 20 30 40 50
Percent
60 70 80 90 100
a Includes only those who smoked cigarettes during their most recent pregnancy of five or more months (n=148)
-33-
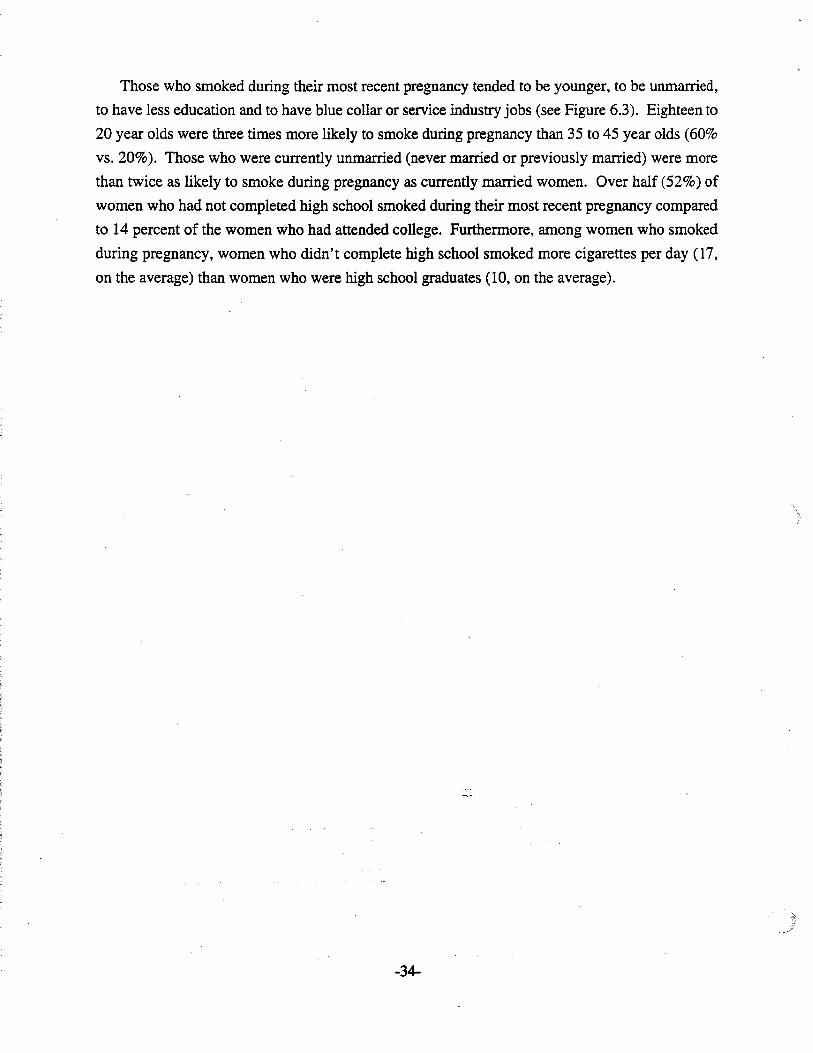
Those who smoked during their most recent pregnancy tended to be younger, to be unmarried,
to have less education and to have blue collar or service industry jobs (see Figure 6.3). Eighteen to
20 year olds were three times more likely to smoke during pregnancy than 35 to 45 year olds (60%
vs. 20%). Those who were currently unmarried (never married or previously married) were more
than twice as likely to smoke during pregnancy as currently married women. Over half (52%) of
women who had not completed high school smoked during their most recent pregnancy compared
to 14 percent of the women who had attended college. Furthermore, among women who smoked
during pregnancy, women who didn't complete high school smoked more cigarettes per day (17,
on the average) than women who were high school graduates (10, on the average).
-34-
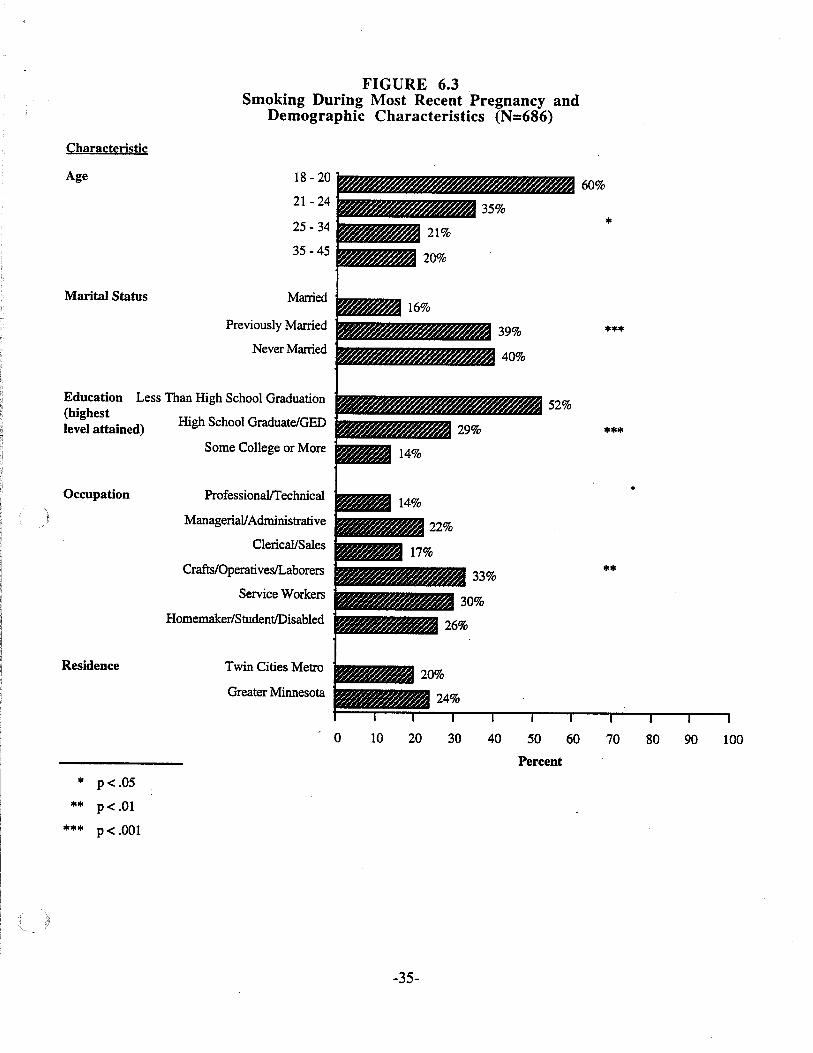
FIGURE 6.3Smoking During Most Recent Pregnancy and
Demographic Characteristics (N=686)
Characteristic
18 - 20
21 - 24
25 - 34
35 - 45
Married
Previously Married
Never Married
Twin Cities Metro
Greater Minnesota
Some College or More
ProfessionalfI'echnical
Managerial/Administrative
Clerical/Sales
Crafts/OperativeslLaborers
Service Workers
High School GraduateiGED
Homemaker/StudentlDisabled
Age
Marital Status
Occupation
Residence
Education Less Than High School Graduation(highestlevel attained)
o 10 20 30 40 50 60 70 80 90 100
Percent
* p< .05
** p< .01
*** p< .001
-35-
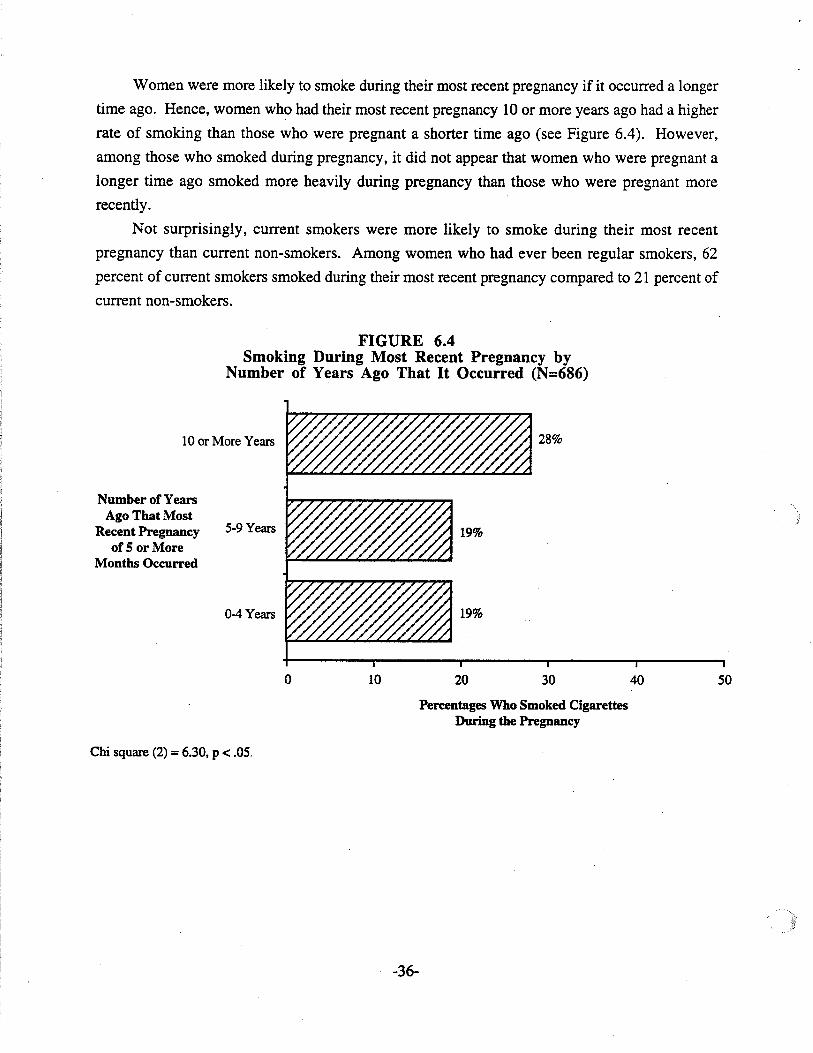
Women were more likely to smoke during their most recent pregnancy if it occurred a longer
time ago. Hence, women who had their most recent pregnancy 10 or more years ago had a higher
rate of smoking than those who were pregnant a shorter time ago (see Figure 6.4). However,
among those who smoked during pregnancy, it did not appear that women who were pregnant a
longer time ago smoked more heavily during pregnancy than those who were pregnant more
recently.
Not surprisingly, current smokers were more likely to smoke during their most recent
pregnancy than current non-smokers. Among women who had ever been regular smokers, 62
percent of current smokers smoked during their most recent pregnancy compared to 21 percent of
current non-smokers.
FIGURE 6.4Smoking During Most Recent Pregnancy by
Number of Years Ago That It Occurred (N=686)
10 or More Years
Number of YearsAgo That Most
Recent Pregnancyof 5 or More
Months Occurred
5-9 Years
().4 Years
o 10 20
28%
30 40 50
Chi square (2) = 6.30, p < .05.
Percentages Who Smoked CigarettesDuring the Pregnancy
-36-
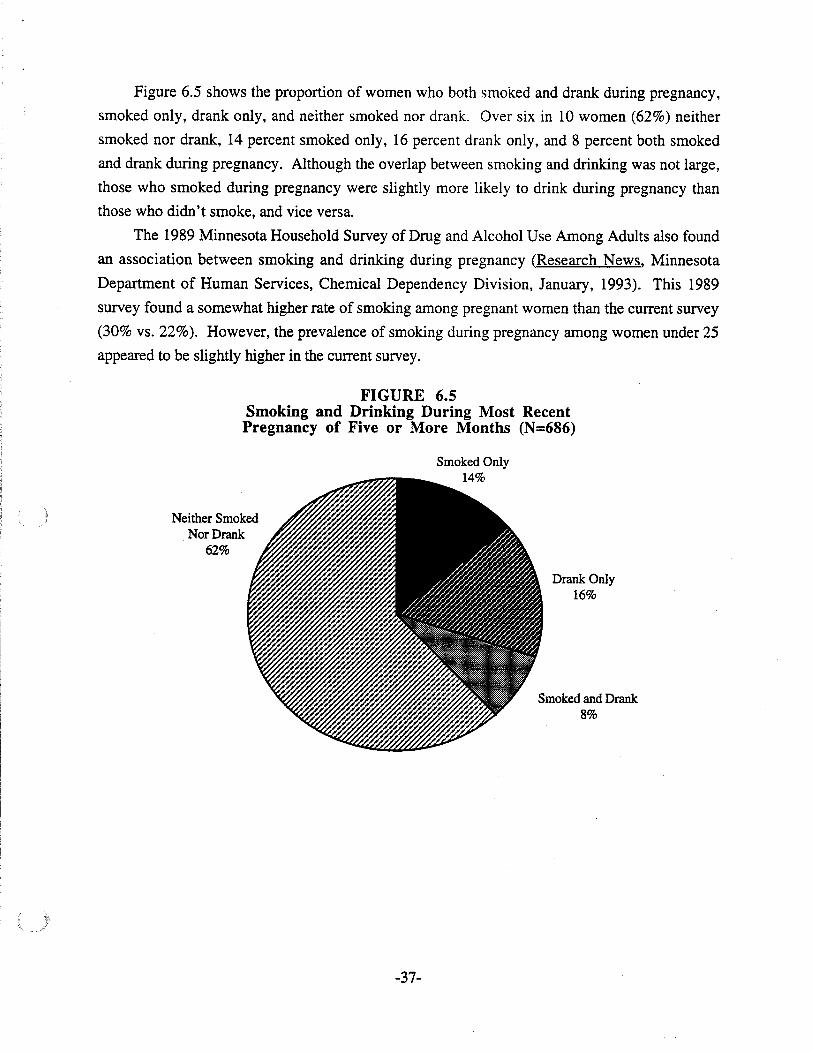
Figure 6.5 shows the proportion of women who both smoked and drank during pregnancy,
smoked only, drank only, and neither smoked nor drank. Over six in 10 women (62%) neither
smoked nor drank, 14 percent smoked only, 16 percent drank only, and 8 percent both smoked
and drank during pregnancy. Although the overlap between smoking and drinking was not large,
those who smoked during pregnancy were slightly more likely to drink during pregnancy than
those who didn't smoke, and vice versa.
The 1989 Minnesota Household Survey of Drug and Alcohol Use Among Adults also found
an association between smoking and drinking during pregnancy (Research News, Minnesota
Department of Human Services, Chemical Dependency Division, January, 1993). This 1989
survey found a somewhat higher rate of smoking among pregnant women than the current survey
(30% vs. 22%). However, the prevalence of smoking during pregnancy among women under 25
appeared to be slightly higher in the current survey.
FIGURE 6.5Smoking and Drinking During Most RecentPregnancy of Five or More Months (N=686)
Smoked Only14%
Neither SmokedNor Drank
62%
Drank Only16%
Smoked and Drank8%
-37-
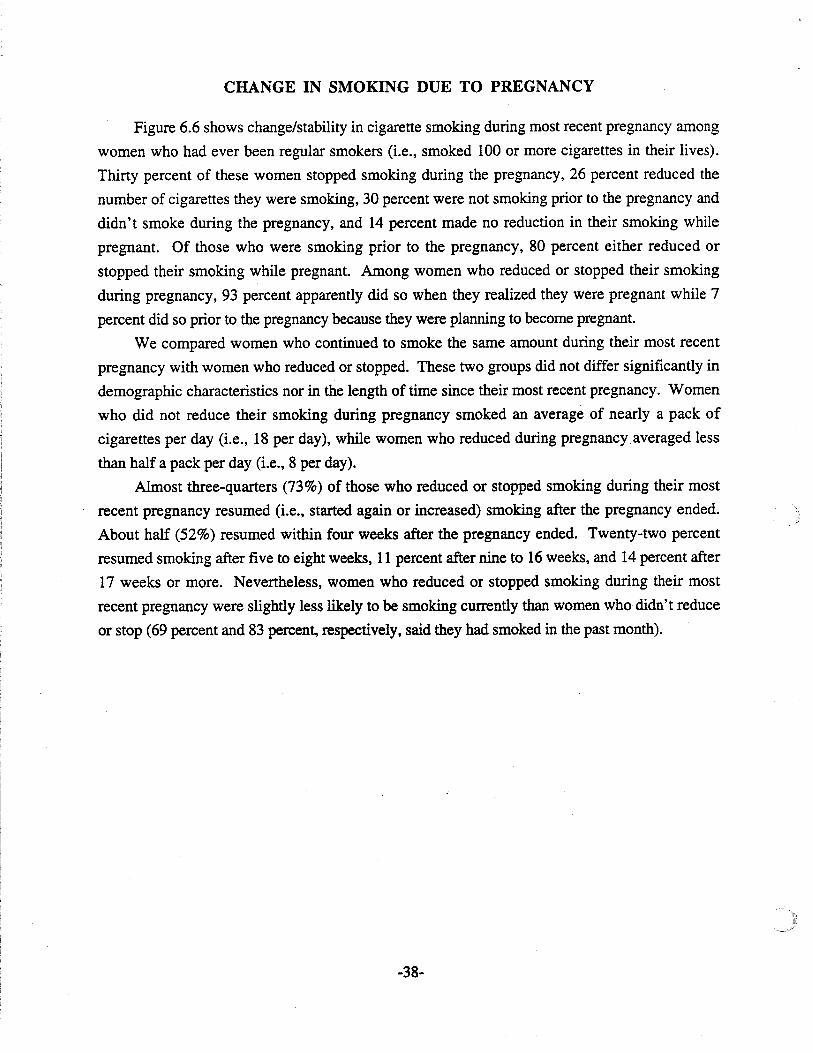
CHANGE IN SMOKING DUE TO PREGNANCY
Figure 6.6 shows change/stability in cigarette smoking during most recent pregnancy among
women who had ever been regular smokers (Le., smoked 100 or more cigarettes in their lives).
Thirty percent of these women stopped smoking during the pregnancy, 26 percent reduced the
number of cigarettes they were smoking, 30 percent were not smoking prior to the pregnancy and
didn't smoke during the pregnancy, and 14 percent made no reduction in their smoking while
pregnant. Of those who were smoking prior to the pregnancy, 80 percent either reduced or
stopped their smoking while pregnant. Among women who reduced or stopped their smoking
during pregnancy, 93 percent apparently did so when they realized they were pregnant while 7
percent did so prior to the pregnancy because they were planning to become pregnant.
We compared women who continued to smoke the same amount during their most recent
pregnancy with women who reduced or stopped. These two groups did not differ significantly in
demographic characteristics nor in the length of time since their most recent pregnancy. Women
who did not reduce their smoking during pregnancy smoked an average of nearly a pack of
cigarettes per day (Le., 18 per day), while women who reduced during pregnancy averaged less
than half a pack per day (Le., 8 per day).
Almost three-quarters (73%) of those who reduced or stopped smoking during their most
recent pregnancy resumed (Le., started again or increased) smoking after the pregnancy ended.
About half (52%) resumed within four weeks after the pregnancy ended. Twenty-two percent
resumed smoking after five to eight weeks, 11 percent after nine to 16 weeks, and 14 percent after
17 weeks or more. Nevertheless, women who reduced or stopped smoking during their most
recent pregnancy were slightly less likely to be smoking currently than women who didn't reduce
or stop (69 percent and 83 percent, respectively, said they had smoked in the past month).
-38-
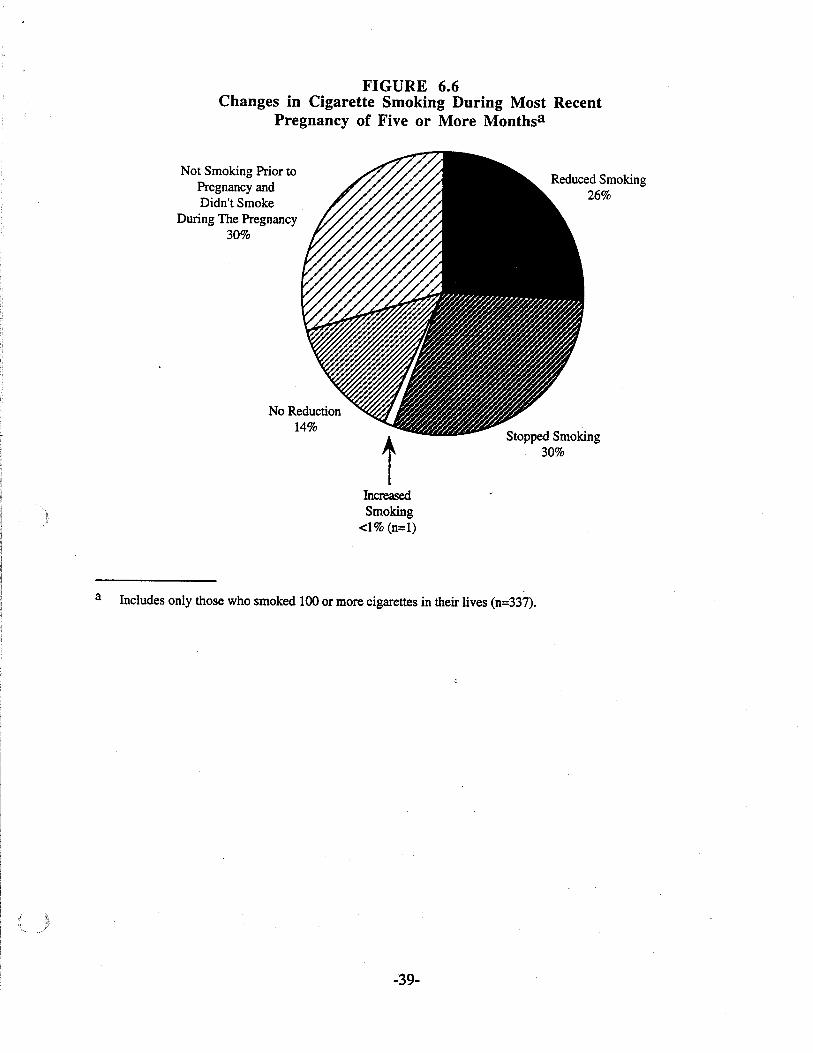
FIGURE 6.6Changes in Cigarette Smoking During Most Recent
Pregnancy of Five or More Monthsa
Not Smoking Prior toPregnancy andDidn't Smoke
During The Pregnancy30%
No Reduction14%
IncreasedSmoking
<1% (n=l)
Reduced Smoking26%
Stopped Smoking30%
a Includes only those who smoked 100 or more cigarettes in their lives (n=337).
-39-
DOCTOR'S ADVICE AND SMOKING DURINGMOST RECENT PREGNANCY
The women surveyed were asked whether their doctor or health care provider advised them
about smoking cigarettes during their most recent pregnancy. Recall that 95 percent of the women
visited a doctor within the fIrst three months of the pregnancy and the remaining 5 percent visited
the doctor within the next three months. Figure 6.7 indicates the nature of the doctor's advice
women said they received. Only women who were regular smokers at some time in their lives are
included in the fIgure. About half (52%) of the women said the doctor told them not to smoke at
all, 9 percent said the doctor told them to smoke only lightly or occasionally, and 25 percent said
the doctor didn't mention anything at all about smoking. The remaining 14 percent said the doctor
asked about smoking but didn't warn them because they didn't smoke at the time. Women who
had been pregnant a shorter time ago were slightly more likely to be advised by their doctors not to
smoke. For example, among those whose most recent pregnancy occurred within the past four
years, 58 percent were advised by their doctors not to smoke atall, and the doctor didn't mention
anything about smoking for 17 percent.
FIGURE 6.7Doctor's Advice Regarding Smoking During Most
Recent Pregnancy of Five or More Monthsa
Doctor's AdviceIMessage:
Not to Smoke At All
To Smoke Only Lightlyor Occasionally
52%
Didn't Mention Smoking At All 25%
Asked About Smoking But Didn't WarnBecause Respondent Didn't Smoke
o 10
14%
20 30I
40•
50 60•
70 80.
90I
100
Percent Who Received AdviceIMessage
a Includes only those who smoked 100 or more cigarettes in their lives (n=334). One respondent who said thedoctor told her it was okay to smoke during pregnancy is excluded from the graph.
-40-
Figure 6.8 strongly suggests that doctors' advice affects smoking during pregnancy. Among
women who were smoking prior to their most recent pregnancy, 34 percent continued to smoke the
same amount during pregnancy if the doctor said nothing about smoking, compared to 25 percent
of those who were told by the doctor to smoke only lightly, and 15 percent of those who were told
not to smoke at all. Almost half (48%) of those who were told not to smoke at all stopped
smoking during pregnancy and 37 percent reduced their smoking. Most (71 %) of those who were
told to smoke only lightly by their doctors reduced their smoking, but only 4 percent stopped
smoking while pregnant. Among those to whom the doctor said nothing about smoking, 38
percent stopped smoking and 28 percent reduced their smoking during pregnancy, suggesting that
many women were aware of the dangers of smoking during pregnancy even though they weren't
warned by their doctors.
Among women who had never been pregnant, 58 percent said a doctor or health care
provider had advised them to avoid smoking should they become pregnant. The percentage that
had been advised was slightly higher (64%) among the subgroup of never pregnant women who
were regular smokers at some time in their lives.
FIGURE 6.8Doctor's Advice and Smoking During Most Recent Pregnancya
Doctor's Advice: 48% 37% 15%
Not to Smoke at All
To Smoke OnlyLightly or Moderately
Didn't Mention Smoking at All
o 10 20 30 40 50 60 70 80 90 100
a
12I Stopped Smoking During Pregnancy
.. Reduced Smoking During Pregnancy
11 No Change in Smoking During Pregnancy (or Increased, N=l)
Chi square (4) = 28.85, P < .001
Includes only those who were smoking prior to their most recent pregnancy of five or more months (n=225).
-41-
SUMMARY
Smokin& Behavior Durin& Most Recent Pre&nancy
•
•
•
•
•
•
Twenty-two percent of the women surveyed reported smoking cigarettes during their mostrecent pregnancy.
Of those who smoked while pregnant, 64 percent smoked 10 or fewer cigarettes per day, 31percent smoked 11 to 20, and 5 percent smoked 21 or more.
Those who smoked during pregnancy tended to be younger (especially age 18 to 20), to becurrently unmarried, to have less education (especially those who had not completed highschool), and to have blue collar or service industry jobs.
Among those who smoked during pregnancy, women who had not completed high schooltended to smoke more heavily.
Women who had their most recent pregnancy 10 or more years ago were more likely tosmoke while pregnant than women who were pregnant a shorter time ago.
Eight percent of the women both smoked and drank during their most recent pregnancy.
Chan&es in Smokin& Due to Pre&nancy
•
•
Of those who were smoking cigarettes prior to their most recent pregnancy, 80 percent eitherreduced or stopped smoking while pregnant.
Nearly three-quarters of those who reduced or stopped smoking during their most recentpregnancy resumed smoking (started again or increased) after the pregnancy ended.
Doctors' Advice and Smokin& Durin& Most Recent Premancy
•
•
•
•
Among women who were regular smokers at some time in their lives, 52 percent were toldby the doctor during their most recent pregnancy not to smoke at all, 9 percent were told tosmoke only lightly or occasionally, 25 percent weren't told anything about smoking, and 14percent were asked about smoking by the doctor but not warned because they were notsmoking at that time.
Those who were pregnant a shorter time ago were more likely to be advised by their doctorsnot to smoke at all during pregnancy.
Doctors' advice seemed to affect women's smoking during pregnancy. Women who weretold not to smoke at all by their doctors were the most likely to quit smoking duringpregnancy. Those who were told to smoke only lightly were the most likely to reduce theirsmoking during pregnancy. Nevertheless, many women stopped or reduced their smokingduring pregnancy even though they hadn't been advised by their doctors to do so.
Sixty-four percent of never pregnant women who were regular smokers at some time in theirlives had been advised by their doctors to avoid smoking s)";:ld they become pregnant.
-42-
CHAPTER VII: KNOWLEDGE AND BELIEFS ABOUTSUBSTANCE USE DURING PREGNANCY
BELIEFS ABOUT HARM CAUSED BYSUBSTANCE USE DURING PREGNANCY
The women surveyed were asked to rate a series of items describing use of substances by a
pregnant woman. They were to rate each item according to the likelihood that harm would be
caused to the baby before it was born using a 5-point scale, where 1 meant not at all likely that
harm would be caused and 5 meant extremely likely. Figure 7.1 indicates the percentage of
women who rated each item as extremely likely to cause harm.
Most women rated the following things, if done during pregnancy, as extremely likely to
cause harm to the baby: occasional or regular use of crack/cocaine, daily cigarette smoking, daily
drinking, and binge drinking (five or more drinks on an occasion). Among those who thought
binge drinking during pregnancy would be harmful, 55 percent felt it would be more harmful if
done early in the pregnancy, 2 percent felt it would be more harmful if done in the middle, 2
percent more harmful if done at the end, and 41 percent felt the harm would be the same regardless
of when it occurred during the pregnancy.
Approximately one-third of the women rated occasional cigarette smoking and occasional
drinking during pregnancy as extremely likely to cause harm to the baby. Current smokers and
those who smoked during pregnancy tended to rate occasional smoking during pregnancy as less
likely to cause harm to the newborn. Current drinkers and those who drank during pregnancy
'tended to rate occasional drinking during pregnancy as less likely to cause harm to the newborn.
Ratings on these two items did not differ much by demographic characteristics. However,
previously married women had a slight tendency to rate occasional smoking or drinking during
pregnancy as less harmful than other women.
Over eight in 10 women (83%) correctly believed harm to the newborn would be the same
regardless of whether a pregnant woman drank beer, wine or liquor. Most of the remaining
women (15%) said that liquor would cause the most harm. Answers to the question did not differ
by demographic characteristics.
-43-
FIGURE 7.1Beliefs About Likelihood of Harm Being Caused to Baby by
Use of Substances During Pregnancy (N=1,OI7)
Percentage saying that it is extremely likely that the· behaviordescribed will cause harm to the baby before it is born.a
Percentage saying that it is extremely likely that the behaviordescribed will cause harm to the baby before it is born. a
99%
6%
70 80 90 10050 6020 30 4010
89%
30%
72%
37%
82%
9
79%
I I I
o
2. Regular use of crack or cocaine.
1. Occasional use of crack or cocaine by awoman, say once or twice during pregnancy.
3. Occasional smoking of a cigarette by apregnant woman.
6 Daily drinking of one or two drinks perday.
5. Occasional drinking of alcohol by a .pregnant women.
7. Daily drinking of 3 or more drinks perday.
4. Daily cigarette smoking.
8 Drinking 5 or more alcoholic drinks onanyone occasion.
Percent
a Respondents rated each iterr'';::1 a 5-point scale, ranging from 1, not at all likely to cause harm to the baby to 5,extremely likely to cause harm.
(
-44-
TYPE OF SUBSTANCE USE THOUGHT TO CAUSE HARMTO THE LARGEST NUMBER OF NEWBORNS
Women were asked to indicate which of the following is currently causing hann to the largest
number of newborns in the United States: heavy cigarette smoking, heavy alcohol use, or
crack/cocaine use during pregnancy. Most women (61 %) said that crack or cocaine use during
pregnancy was causing hann to the largest number of newborns, although the research evidence
doesn't support this view. Twenty-seven percent said heavy alcohol use was causing hann to the
largest number and 12 percent said heavy smoking (see Figure 7.2). Women who had attended.
college were more likely to say heavy alcohol use or heavy smoking during pregnancy were
causing harm to the largest number of newborns compared to women who had not attended college
(see Figure 7.3). Answers to the question did not differ by age, marital status or place of residence
(Metro area vs. greater Minnesota).
Women who smoked cigarettes during their most recent pregnancy were less likely to say
that heavy cigarette smoking is causing harm to the largest number of newborns compared to those
who didn't smoke during pregnancy (2% vs. 15%). Current smokers were also less likely than
non-smokers to say that heavy cigarette smoking during pregnancy is causing harm to the largest
number of newborns. Current drinkers and those who drank during their most recent pregnancy
did not differ from others in their answers to what was causing harm to the largest number of
newborns.
FIGURE 7.2Type of Substance Use Thought to Cause Harm to the
Largest Number of Newborns (N=lOOl)a
Which of the following is causing harm to the largestnumber of newborns in the United States today?
Heavy cigarette smoking during pregnancy
Heavy alcohol use during pregnancy
Crack or cocaine use during pregnancy
~ ~ ~ ~, , ,~ , , ,, , ,
12%, , , ,, , ,, " ,r,;/",;/",;/",;/'
, , , , , , , , ,',',',',',',',',',',',',',',',',',', 27%',',',',',',',',',, , , , , , , , ,
, ,', ,', , , , , , , , , , , , , , , , ,, , , , , , , , , , , , , , , , , , , ,, , , , , , , , , , , , , , , , , , , , ,, , , , , , , , , , , , , , , , , , , ,61%, , , , , , , , , , , , , , , , , , , , ,, , , , , , , , , , , , , , , , , , , ,, , , , , , , , , , , , , , , , , , , , ,, , , , , , , , , , , , , , , , , , , ,
I • • I I I
o 10 20 30 40 50 60 70 80 90 100
Percent
a There were 16 women who answered "don't know" who are excluded from the graph.
-45-
FIGURE 7.3Type of Substance Use Thought to Cause Harm to the Largest
Number of Newborns by Respondent's Educational Level (N=l,OOl)
Highest EducationLevel Attained
Less Than High School Graduation
High School Graduate/GED
Some College or More
8% 18% 74%
0 10 20 30 40 50 60 70 80 90 100
Percent
E'2 Heavy Cigarette Smoking During Pregnancy.. Heavy Alcohol Use During Pregnancy
• Crack or Cocaine Use During Pregnancy
-46-
SUMMARY
Beliefs About the Harm Caused by Substance Use Durin2 Pre2nancy
• Most women felt the following things, if done during pregnancy, were extremely likely tocause harm to the newborn: occasional or regular use of crack/cocaine, daily cigarettesmoking, daily drinking and binge drinking.
• About one-third felt that occasional smoking or occasional drinking during pregnancy wereextremely likely to cause harm to the newborn. Current drinkers and those who drank duringtheir most recent pregnancy tended to rate occasional drinking during pregnancy as lessharmful to the newborn. Similarly, current smokers and those who smoked during theirmost recent pregnancy tended to rate occasional smoking during pregnancy as less harmful tothe newborn.
• Most women (83%) correctly believed that harm to the newborn would be the sameregardless of whether a pregnant woman drank beer, wine or liquor.
Type of Substance Use Thou2ht to Cause Harm to the Lar2estNumber ofNewborns
• Sixty-one percent said that crack/cocaine use during pregnancy is causing harm to the largestnumber of newborns in the United States, although the research evidence doesn't supportthis view. Twenty-seven percent said heavy alcohol use was causing the most harm, and 12percent said heavy smoking.
• Women who had attended college were more likely to say heavy alcohol use or heavysmoking during pregnancy were causing harm to the largest number of newborns comparedto women who had not attended college.
• Current smokers and those who smoked during their most recent pregnancy were less likelyto say that heavy smoking is causing harm to the largest number of newborns. However,current drinkers and those who drank during pregnancy did not differ from others in theiranswers to what was causing harm to the largest number of newborns.
-47-

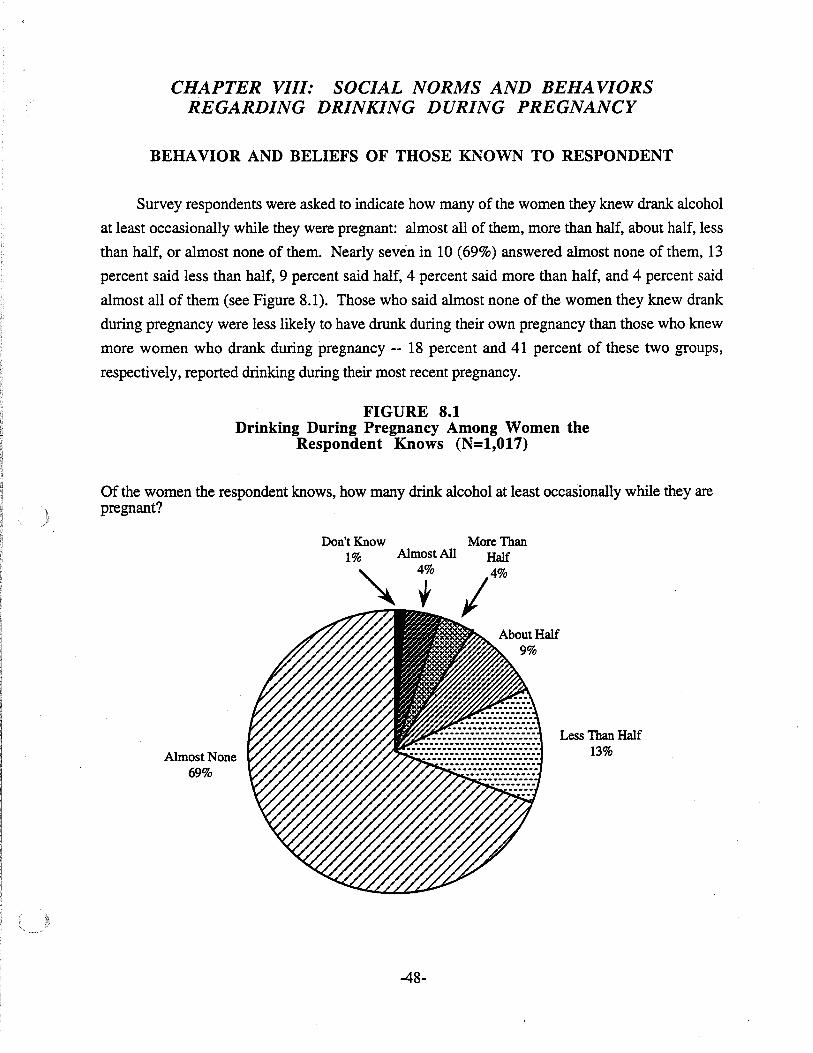
CHAPTER VIII: SOCIAL NORMS AND BEHAVIORSREGARDING DRINKING DURING PREGNANCY
BEHAVIOR AND BELIEFS OF THOSE KNOWN TO RESPONDENT
Survey respondents were asked to indicate how many of the women they knew drank alcohol
at least occasionally while they were pregnant: almost all of them, more than half, about half, less
than half, or almost none of them. Nearly seven in 10 (69%) answered almost none of them, 13
percent said less than half, 9 percent said half, 4 percent said more than half, and 4 percent said
almost all of them (see Figure 8.1). Those who said almost none of the women they knew drank
during pregnancy were less likely to have drunk during their own pregnancy than those who knew
more women who drank during pregnancy -- 18 percent and 41 percent of these two groups,
respectively, reported drinking during their most recent pregnancy.
FIGURE 8.1Drinking During Pregnancy Among Women the
Respondent Knows (N=1,017)
Of the women the respondent knows, how many drink alcohol at least occasionally while they arepregnant?
Less Than Half13%
More ThanHalf
14
%
Almost All4%
Don't Know1%
Almost None69%
-48-
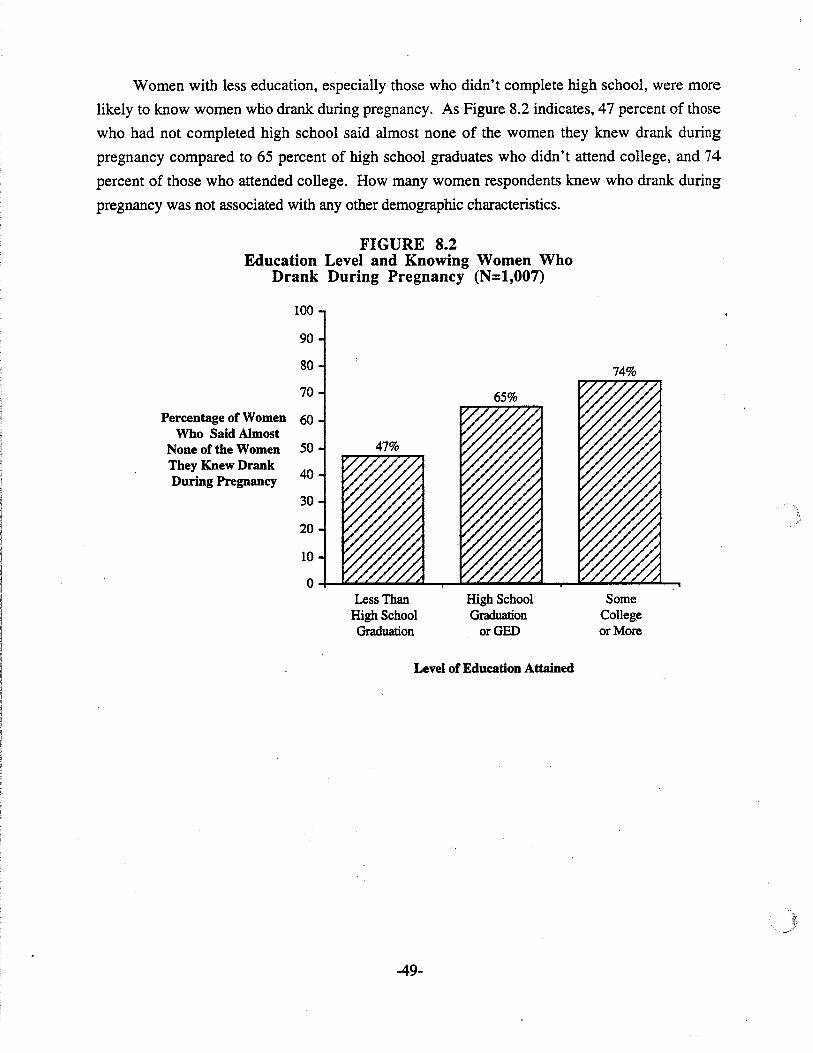
Women with less education, especially those who didn't complete high school, were more
likely to know women who drank during pregnancy. As Figure 8.2 indicates, 47 percent of those
who had not completed high school said almost none of the women they knew drank during
pregnancy compared to 65 percent of high school graduates who didn't attend college, and 74
percent of those who attended college. How many women respondents knew who drank during
pregnancy was not associated with any other demographic characteristics.
FIGURE 8.2Education Level and Knowing Women Who
Drank During Pregnancy (N=1,007)
100
74%
50
40
30
20
10
O+--"-"""""""""''''''-''''''""....,........''''''''''''''-'-'-''~L.-.....-~-'-''~ ....~....
90
80
70
Percentage of Women 60Who Said Almost
None of the WomenThey Knew DrankDuring Pregnancy
Less ThanHigh SchoolGraduation
HighSchoolGraduation
orGED
SomeCollegeor More
Level of Education Attained
-49-
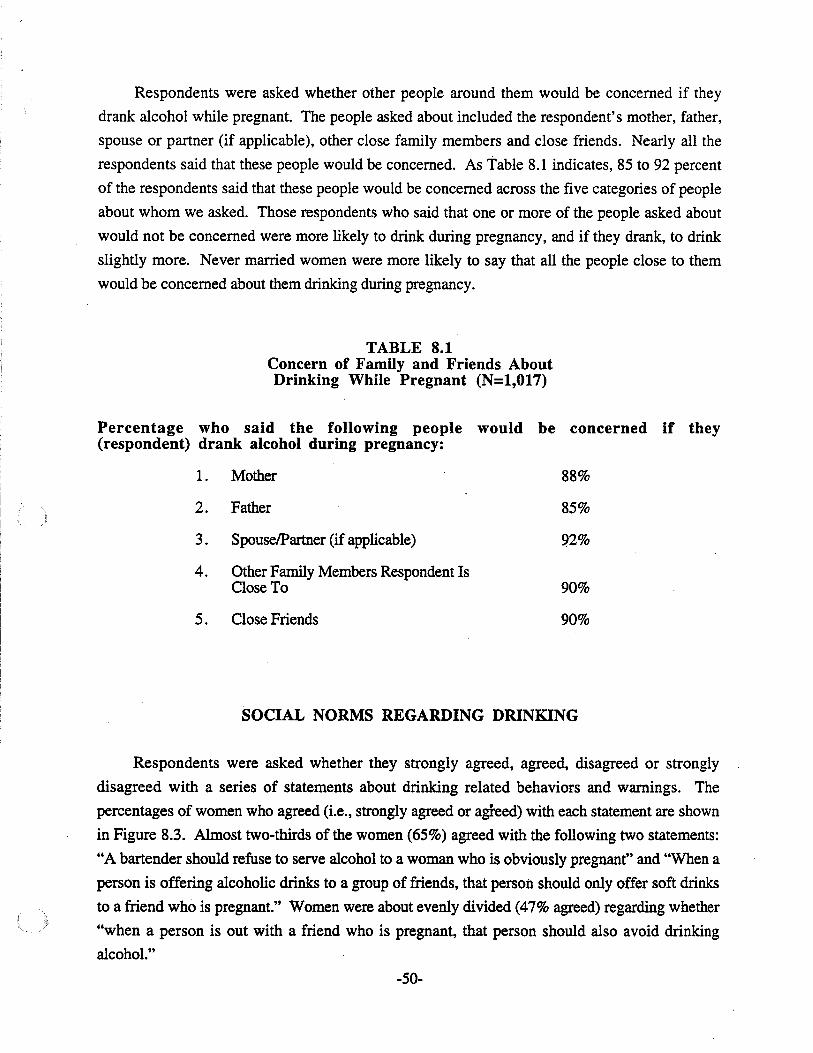
Respondents were asked whether other people around them would be concerned if they
drank alcohol while pregnant. The people asked about included the respondent's mother, father,
spouse or partner (if applicable), other close family members and close friends. Nearly all the
respondents said that these people would be concerned. As Table 8.1 indicates, 85 to 92 percent
of the respondents said that these people would be concerned across the five categories of people
about whom we asked. Those respondents who said that one or more of the people asked about
would not be concerned were more likely to drink during pregnancy, and if they drank, to drink
slightly more. Never married women were more likely to say that all the people close to them
would be concerned about them drinking during pregnancy.
TABLE 8.1Concern of Family and Friends AboutDrinking While Pregnant (N=1,017)
Percentage who said the following people would be concerned if they(respondent) drank alcohol during pregnancy:
l. Mother 88%
2. Father 85%
3. SpouseIPartner (if applicable) 92%
4. Other Family Members Respondent IsClose To 90%
5. Close Friends 90%
SOCIAL NORMS REGARDING DRINKING
Respondents were asked whether they strongly agreed, agreed, disagreed or strongly
disagreed with a series of statements about drinking related behaviors and warnings. The
percentages of women who agreed (Le., strongly agreed or agreed) with each statement are shown
in Figure 8.3. Almost two-thirds of the women (65%) agreed with the following two statements:
"A bartender should refuse to serve alcohol to a woman who is obviously pregnant" and "When a
person is offering alcoholic drinks to a group of friends, that person should only offer soft drinks
to a friend who is pregnant." Women were about evenly divided (47% agreed) regarding whether
"when a person is out with a friend who is pregnant, that person should also avoid drinking
alcohol."
-50-
Only one-third of the women agreed that "when you see an obviously pregnant woman
drinking alcohol at a bar who is not someone you know, you should warn her not to drink."
Those who agreed that the pregnant woman should be warned were divided about whether they
actually would warn her. In contrast, nearly nine in 10 women agreed (87%) that "when you see
an obviously pregnant friend drinking alcohol at a bar, you should warn her not to drink." And
most (82%) who agreed the friend should be warned said they actually would warn her.
About eight in 10 agreed (83%) that "bars and restaurants should be required to post signs
warning pregnant women not to drink." Women who had seen these signs in bars, restaurants or
liquor stores were slightly more likely to agree that such signs should be required than women who
hadn't seen them (91 % vs. 79%).
Women were evenly divided (50% agreed) about whether "it is sometimes okay for a woman
who is not pregnant to get drunk." However, over nine in 10 agreed (94%) that "it is okay for a
woman who is not pregnant to have one or two alcoholic drinks at a party."
The frrst six items in Figure 8.3; all of which deal with behavior or warnings to discourage
pregnant women from drinking, were combined into a scale. Scores on the "Drinking During
Pregnancy Opinion" Scale were obtained by summing the scores to each of the items which were
scored as follows: strongly agree = 4, agree = 3, disagree = 2, and strongly disagree = 1. Hence,
scores could range from six to 24, with higher scores indicating stronger endorsement of behaviors
or warnings discouraging pregnant women from drinking. 1 The distribution of scores on the scale
is shown in Figure 8.4 (mean =16.9, standard deviation =3.2).
1 The Drinking During Pregnancy Opinion Scale was constructed based on a principal components factor analysiswith varimax rotation of the eight items in Figure 8.3. Two factors emerged. The first factor contained the fIrstsix items in Figure 8.3 (loadings ranged from .60 to .78) and explained 38.5 percent of the total variance. Thesecond factor contained the last two items (loadings of .75 and .81) and explained 16.4 percent of the totalvariance. The Drinking During Pregnancy Opinion Scale was created from the six first items. Internalconsistency reliability for the scale was acceptable (Cronbach's alpha = .81).
-51-
FIGURE 8.3Opinions About Drinking-Related Behaviors (N=1,017)
Percentage Agreeinga
1. A bartender should refuse to servealcohol to a woman who isobviously pregnant.
2. When a person is out with a friendwho is pregnant, that person shouldalso avoid drinking alcohol.
3. When a person is offering alcoholic drinks toa group of friends, th,at person should onlyoffer soft drinks to a friend who is pregnant.
4. When you see an obviously pregnant womandrinking alcohol at a bar who is not someoneyou know, you should warn her not to drink.
5. When you see an obviously pregnantfriend drinking alcohol at a bar, you shouldwarn her not to drink.
6. Bars and restaurants should be requiredto post signs warning pregnant womennot to drink.
7. It is sometimes okay for a women who~not pregnant to get drunk.
8. It is okay for a woman who ii.n.Q1.pregnant to have one or two alcoholicdrinks at a party.
o 10 20 30 40 50 60 70 80 90 100
Percent
a Respondents indicated whether they strongly agreed, agreed, disagreed, or strongly disagreed with each item. Thepercentage who strongly agreed or agreed is reported.
-52-
FIGURE 8.4Distribution of Scores on the Drinking During
Pregnancy Opinion Scale (N=l,Oll)
140
120
100
~ 80,.Q
E!=Z 60
40
20
6 7 8 9 10 11 12 13 14 15 1617 18 19 20 21 22 23 24
Scale Scorea(Mean = 16.9, Standard deviation = 3.2)
a Scores on the scale were obtained by summing the scores to each of the six items included in the scale. Each ofthe items was scored as follows: strongly agree =4, agree =3. disagree =2, and strongly disagree =1.
-53-
Those who did not drink during their most recent pregnancy tended to score higher on the
Drinking During Pregnancy Opinion Scale -- that is, they were somewhat more likely to endorse
behaviors and warnings that discourage pregnant women from drinking. Similarly, women who
were not current drinkers (Le., did not drink alcohol in the past 30 days) tended to score higher on
the scale (see Figure 8.5).
Scores on the Drinking During Pregnancy Opinion Scale differed slightly by age and marital
status. Those under age 25 tended to have higher scores than those 25 and older -- mean scores of
17.9 and 16.7, respectively. Never married women tended to score higher than married/previously
married women -- mean scores of 17.5 and 16.7, respectively. Hence, never married and younger
women were slightly more likely to endorse behaviors and warnings that discourage pregnant
women from drinking.
FIGURE 8.5Drinking and Scores on the Drinking During
Pregnancy Opinion Scale
Drank alcohol in the past 30 days?(n=l,Ol1)
Yes
No
Drank alcohol during most recentpregnancy of 5 or more months?(n=690)
Yes
No
***
***
o 1 2 3 4 5 6 7 8 9 10 11 12 13 14 15 16 17 18 1920
Average Score on Drinking DuringPregnancy Opinion Scale
*** p< .001.
-54-
SUMMARY
Behavior and Beliefs of Those Known to Respondent
• About seven in 10 women reported that almost none of the women they knew drank alcoholduring pregnancy.
• Those who knew more women who drank during pregnancy were more likely to drinkthemselves during pregnancy.
• Less educated women, especially those who had not completed high school, were morelikely to know women who drank while pregnant.
• Most women said that the people close to them (parents, spouse, family and friends) wouldbe concerned if they drank during pregnancy.
• Women who reported that some people close to them would not be concerned if they drankduring pregnancy were more likely to drink while pregnant.
Social Norms Reiardini Drinkini
• Women differed in their opinions about the degree to which people should engage Inbehaviors that discourage or prohibit pregnant women from drinking.
• Nearly two-thirds (65%) agreed that neither friends nor bartenders should serve alcoholicdrinks to pregnant women.
• Most women agreed that they should warn a pregnant friend drinking at a bar not to drink,but only one-third said that they should so warn a pregnant stranger.
• Those women who did not drink during their most recent pregnancy or don't drink currentlywere more likely to endorse behaviors or warnings that discourage pregnant women fromdrinking.
• Never married and younger women (under age 25) were slightly more likely to endorsebehaviors and warnings that discourage pregnant women from drinking.
-55- ..
CHAPTER IX: CONCLUSIONS AND IMPLICATIONS
OVERALL CONCLUSIONS
Women age 18 to 45 years old in Minnesota were surveyed regarding their use of alcohol and
tobacco, and their beliefs about such use during pregnancy. This was a statewide telephone survey
of a representative sample of 1,017 women of child-bearing age conducted in late 1993. The
women surveyed tended to be married (65%), high school graduates (96%), and employed (81 %).
Most had contact with health care providers, 86 percent having visited a doctor or health care clinic
within the past 12 months. Two-thirds of those surveyed had been pregnant at least once in their
lives for five or more months.
Generally speaking, survey results indicate that awareness of the dangers of drinking alcohol
and smoking tobacco during pregnancy is widespread among Minnesota women of child-bearing
age. Evidence for this statement comes from the generally low use of these substances during
pregnancy as reported by the women surveyed as well as their beliefs, and the beliefs of those
around them, about the hazards of using these substances while pregnant. About one-quarter of
the women reported drinking alcohol during their most recent pregnancy, and almost all of these
women drank lightly, averaging about one drink per week or less. Only about 1 percent of the
women surveyed did binge drinking (five or more drinks on an occasion) during their most recent
pregnancy. Similarly, slightly less than one-quarter of the women reported smoking during
pregnancy, and most who did smoke tended to smoke lightly -- Le., 10 or fewer cigarettes per
day. Only about 1 percent of the women reported smoking more than a pack of cigarettes per day
during their most recent pregnancy. We should caution, however, that these are self-reported
behaviors that may be subject to underreporting.
Further evidence for widespread awareness of the dangers of alcohol and substance use
during pregnancy includes the high proportions of women who were drinking or smoking prior to
pregnancy who reported reducing or stopping their use while pregnant. Ninety-three percent of
those who were drinking prior to their most recent pregnancy reported reducing or stopping their
drinking during pregnancy. Eighty percent of the smokers reported reducing or stopping their
smoking during their most recent pregnancy. Many of these women reduced or stopped their
drinking or smoking without being warned by their doctor or health care provider.
Results indicate a decline in alcohol and tobacco use during pregnancy in the past 10 years,
suggesting that women's awareness of the hazards of using these substances while pregnant is
rising. However, the decline in the use of alcohol during pregnancy may also be partially the result
of a general decline in the prevalence of alcohol use among women of child-bearing age
(Preliminary Estimates from the 1992 National Household Survey on Drug Abuse, U.S.
Department of Health and Human Services, Public Health Service, June, 1993).
. -56-
Most of the women surveyed believed that daily drinking, binge drinking, and daily cigarette
smoking during pregnancy were extremely likely to cause harm to the newborn. Most of the
women also said that the people around them (parents, spouse, family and friends) would be
concerned if they drank during pregnancy.
Despite widespread awareness of the risks, survey findings suggest a couple of areas of
potential concern regarding alcohol and tobacco use during pregnancy. First, alcohol use early in
pregnancy before the woman realizes she is pregnant may be cause for concern, particularly in
some groups. Among women who drank during pregnancy, one-third reported drinking more at
the beginning of their pregnancies. Comments from some of the women indicated that this often
. occurred because women didn't reduce or stop drinking until after they realized they were
pregnant, which might be several weeks after conception. For women who drank more heavily or
did binge drinking, the risk to the fetus during the early stages of pregnancy might be significant.
Younger women (under age 25) and those who hadn't completed high school were more likely to
binge drink or drink more heavily. Among those groups, especfally, it could be beneficial to
promote the idea that one should stop drinking when one is trying to become pregnant, rather than
waiting until after the pregnancy is confmned.
With regard to cigarette smoking during pregnancy, over half of 18 to 20 year olds and those
who had not completed high school smoked during pregnancy. Those who had not completed
high school were a particularly high-risk group since they were not only more likely to smoke
while pregnant, but tended to smoke more heavily as well. Hence, there appears to be a need for
greater preventive efforts among teens and high school dropouts to reduce smoking during
pregnancy.
IMPLICATIONS
Professional Education
• Most women of child-bearing age appear to be in regular contact with health care providers.Hence, the health care system is a potentially effective means of disseminating information orwarnings regarding the dangers of alcohol or tobacco use while pregnant.
• The advice or counsel of the doctor appears to make a difference in reducing or stoppingalcohol and tobacco use during pregnancy. Even though awareness of these issues isgenerally high, those who received specific advice from doctors not to drink or smoke duringpregnancy tended to do these things less frequently.
-57-
• More efforts could be made by doctors or health care providers to advise pregnant womenabout the dangers of alcohol or tobacco use. Almost one-quarter of the women who hadbeen pregnant in the past four years said their doctor didn't mention anything about drinkingalcohol during pregnancy. Seventeen percent of those women who were regular smokers atsome time in their lives and were pregnant in the past four years said the doctor didn'tmention anything about smoking during their most recent pregnancy.
• Similarly, more efforts might be made to advise women who have never been pregnant aboutthe dangers of alcohol and tobacco use during pregnancy. Only between 50 and 60 percentof these women said they had been so advised by their doctors.
• Health care professionals should be made aware of the groups at highest risk for usingalcohol and tobacco during pregnancy. This awareness would enable them to make specialefforts to reach these groups such as younger women and those with less education.
Public Information Strate2ies
• Awareness is high of the general message that alcohol (and tobacco) use during pregnancycan cause harm to the newborn. Hence, public information campaigns may want toconcentrate on delivering more specific messages to a public that is already quiteknowledgeable about the issue. Specific messages suggested by the survey fmdings are asfollows:
1) Drinking early in pregnancy can be harmful to the fetus. It could be beneficial(especially for heavier drinkers and binge drinkers) to stop drinking when planning ortrying to become pregnant.
2) Heavy drinking and heavy smoking during pregnancy cause harm to more newbornsthan cocaine use, although cocaine use is clearly dangerous too.
3) Binge drinking can be especially dangerous while pregnant.
• Since most women are in regular contact with the health care system, this system is apromising avenue for dissemination of information on substance use and pregnancy. r
• Most women of child-bearing age are in the labor force. Thus, providing information via theworkplace or through employers is a potentially effective means, although some of thehighest risk groups (teens, high school dropouts) may not be reached well using thisapproach.
• Signs in bars, restaurants and liquor stores warning pregnant women not to drink are onlyseen by slightly over one-third of the women of child-bearing age. To be a more effectivepublic information vehicle, these signs may need to be more widely used and moreprominently displayed.
Prevention Pro2rams
• Programs to prevent alcohoVtobacco use during pregnancy need to begin early. Drinking andsmoking are common during the teen years. Among 18 to 20 year old women, six in 10were currently drinking and four in 10 were currently smoking. The age at which womenbegin drinking appears to be decreasing.
-58-
• The survey findings suggest that advertisers of alcohol and tobacco products are successfulin making them appealing to young women. Prevention efforts might seek to discourageadvertisers from targeting young women (or at least teens) or seek to counter the messages ofsuch advertising.
• A priority for prevention programs should be high school dropouts. Although these womenmay be difficult to reach, they are a high-risk group for substance use during pregnancy.Non-high school completers were more likely to smoke during pregnancy, and if they did, tosmoke more heavily. Half of those who had not completed high school were current bingedrinkers and were more likely to have women around them who drank during theirpregnancies.
Future Research
• Further study of high-risk groups for alcohol/tobacco use during pregnancy (e.g., teens,high school dropouts) should be a focus of future research efforts. For prevention efforts tosucceed with these groups we need more information on such questions as:
1) How can these groups be reached by prevention programs or campaigns?
2) What are the factors that cause them to use alcohol or tobacco, particularly duringpregnancy?
3) What prevention approaches and what messages are likely to be successful with thesegroups?
• More study of alcohol/tobacco use patterns during pregnancy in racial or ethnic minoritygroups may be helpful to prevention efforts. The current study, being a general survey ofwomen of child-bearing age across the state, did not address this potentially important area.
-59-
APPENDIX A
Description of the Minnesota Department of Health Fetal Alcohol Syndrome, Fetal
Alcohol Effects, and Drug-Exposed Infants Prevention Program.
-60-

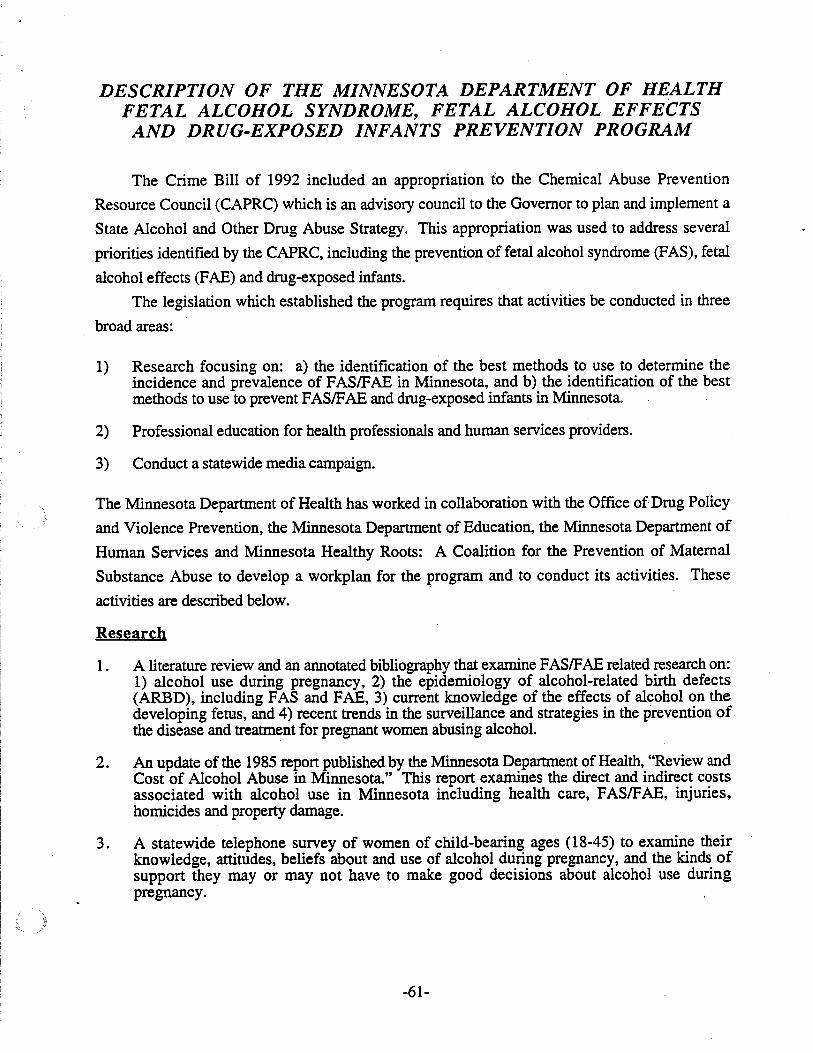
DESCRIPTION OF THE MINNESOTA DEPARTMENT OF HEALTHFETAL ALCOHOL SYNDROME, FETAL ALCOHOL EFFECTSAND DRUG-EXPOSED INFANTS PREVENTION PROGRAM
The Crime Bill of 1992 included an appropriation to the Chemical Abuse Prevention
Resource Council (CAPRC) which is an advisory council to the Governor to plan and implement a
State Alcohol and Other Drug Abuse Strategy. This appropriation was used to address several
priorities identified by the CAPRC, including the prevention of fetal alcohol syndrome (FAS), fetal
alcohol effects (FAE) and drug-exposed infants.
The legislation which established the program requires that activities be conducted in three
broad areas:
1) Research focusing on: a) the identification of the best methods to use to determine theincidence and prevalence of FASIFAE in Minnesota, and b) the identification of the bestmethods to use to prevent FASIFAE and drug-exposed infants in Minnesota
2) Professional education for health professionals and human services providers.
3) Conduct a statewide media campaign.
The Minnesota Department of Health has worked in collaboration with the Office ofDrug Policy
and Violence Prevention, the Minnesota Department of Education, the Minnesota Department of
Human Services and Minnesota Healthy Roots: A Coalition for the Prevention of Maternal
Substance Abuse to develop a workplan for the program and to conduct its activities. These
activities are described below.
Research
1. A literature review and an annotated bibliography that examine FASIFAE related research on:1) alcohol use during pregnancy, 2) the epidemiology of alcohol-related birth defectsCARBO), including FAS and FAE, 3) current knowledge of the effects of alcohol on thedeveloping fetus, and 4) recent trends in the surveillance and strategies in the prevention ofthe disease and treatment for pregnant women abusing alcohol.
2. An update of the 1985 report published by the Minnesota Department of Health, "Review andCost of Alcohol Abuse in Minnesota" This report examines the direct and indirect costsassociated with alcohol use in Minnesota including health care, FASIFAE, injuries,homicides and property damage.
3. A statewide telephone survey of women of child-bearing ages (18-45) to examine theirknowledge, attitudes, beliefs about and use of alcohol during pregnancy, and the kinds ofsupport they mayor may not have to make good decisions about alcohol use duringpregnancy.
-61-
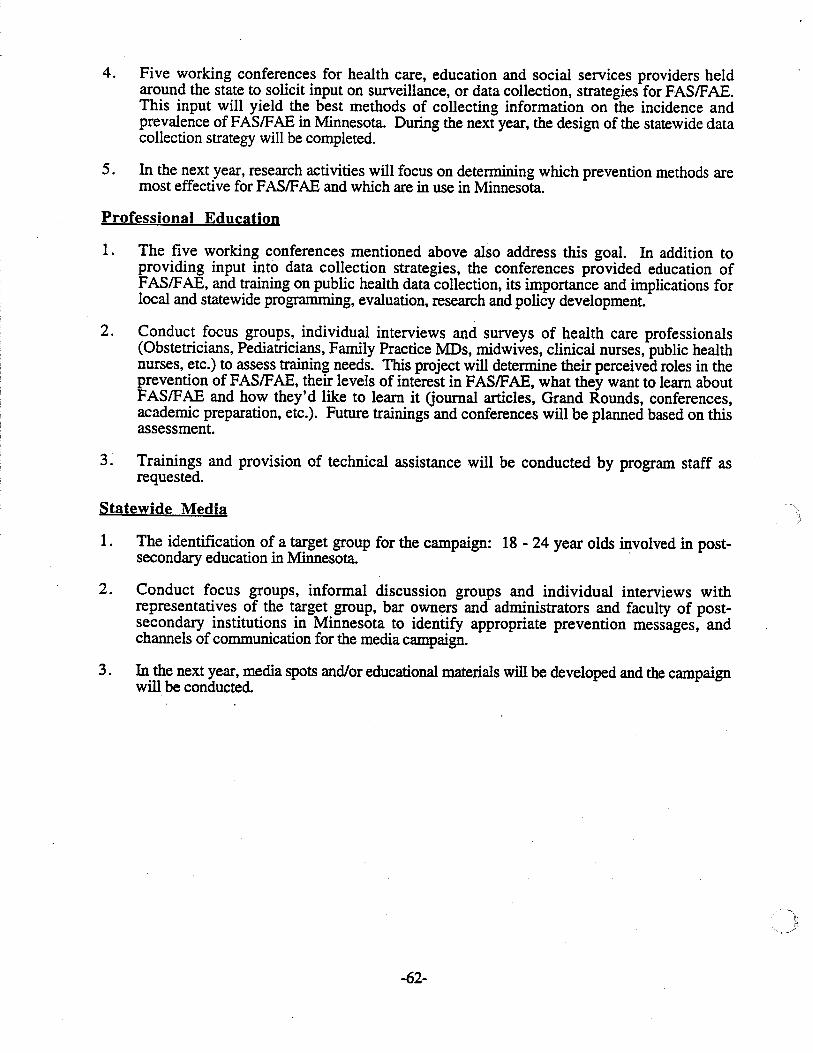
4. Five working conferences for health care, education and social services providers heldaround the state to solicit input on surveillance, or data collection, strategies for FASIFAE.This input will yield the best methods of collecting information on the incidence andprevalence of FASIFAE in Minnesota. During the next year, the design of the statewide datacollection strategy will be completed.
5. In the next year, research activities will focus on detennining which prevention methods aremost effective for FASIFAE and which are in use in Minnesota.
Professional Education
1. The five working conferences mentioned above also address this goal. In addition toproviding input into data collection strategies, the conferences provided education ofFASIFAE, and training on public health data collection, its importance and implications forlocal and statewide programming, evaluation, research and policy development.
2. Conduct focus groups, individual interviews and surveys of health care professionals(Obstetricians, Pediatricians, Family Practice MOs, midwives, clinical nurses, public healthnurses, etc.) to assess training needs. This project will determine their perceived roles in theprevention ofFASIFAE, their levels of interest in FASIFAE, what they want to learn aboutFASIFAE and how they'd like to learn it Gournal articles, Grand Rounds, conferences,academic preparation, etc.). Future trainings and conferences will be planned based on thisassessment.
3 . Trainings and provision of technical assistance will be conducted by program staff asrequested.
Statewide Media
1. The identification of a target group for the campaign: 18 - 24 year olds involved in postsecondary education in Minnesota.
2. Conduct focus groups, informal discussion groups and individual interviews withrepresentatives of the target group, bar owners and administrators and faculty of postsecondary institutions in Minnesota to identify appropriate prevention messages, andchannels of communication for the media campaign.
3. In the next year, media spots and/or educational materials will be developed and the campaignwill be conducted.
-62-
APPENDIX B
SURVEY INSTRUMENT
-63- WRC: 11102193

MINNESOTA WOMEN'S HEALTH SURVEY
Hello, my name is and I'm calling from the Wilder Research Center in 5t. Paul.
The Minnesota Department of Health has asked us to speak with women between the ages of 18
and 45 to find out about their access to health care and other issues for women of child bearing
ages.
A. How many women between the ages of 18 and 45 live in this household?
a. O-+-~~ (DISCONTINUE INTERVIEW, RECORD AS INELIGIBLE)
b. 1
c. More than one-~~ __ (RECORD NUMBER)
I'd like to speak to the woman between those ages who celebrated herbirthday most recently.
(CONTINUE WITH THIS WOMAN IF AVAILABLE, OR ARRANGE ANAPPOINTMENT)
B. Is the area in which you live a city, town, SUburb, or open country?
a. city/town/suburb~~ What is the name of your (ANSWER FROM a.)?
(RECORD NAME) (CODE)
b. open country
C. In what county do you live?
-==-==-=-:::-=-::::--:~=-=====-=-:-~::-:- (DISCONTINUE IF NOT NEEDED FOR QUOTA)~~(RECORD COUNTY NAME) (CODE)
Your household was selected at random to be included in this survey. We're interested in your
opinions and awareness of health care issues concerning women of child bearing ages. The results
of this survey will be used to help health care and other service providers better inform womert.
It's confidential, no one will know that you participated. If there are any questions you prefer not
to answer, just tell me and we'll skip over them.
My fIrst question concerns health care and your access to it.
-64- WRC: 11102/93
1. Yes~~~ 4a.
2. No
7. Refused
8. Don't know
Section I. Health Care
1. What kind of health care insurance do you have for yourself? Do you have:
1. private health insurance, including HMO coverage,
2. Medical assistance,
3. Minnesota Care, or
4. no health insurance coverage?
7. Refused
8. Don't know
2. During the last 12 months, did you visit a doctor or health care clinic for any reason related toyour own health?
1. Yes
2. No~~~ 2a. How long has it been since you last visited a doctor or health careclinic for your own health:
7. Refused 1. 1-2 years,
8. Don't know 2. 3-4 years, or
3. 5 or more years ago?
7. Refused
8. Don't know
9: NA
3. Was there a time during the last 12 months when you needed to see a doctor, but could notdue to the cost?
1. Yes
2, No
7. Refused
8. Don't know
4. A Pap smear is a test for cancer of the cervix. Have you-ever had a Pap smear?
How long has it been since you had your last Pap smear:
1. less than one year ago,
2. 1-2 years,
3. 3-4 years, or
4. 5 or more years ago?
7. Refused
8. Don't know
9. NA
-65- WRC: 11/02/93
Section II. Health Habits
The next few questions are about some of your health habits.
5. About how old were you when you had your first drink of alcohol? This does not includesips given to you as a child, and it does not include alcohol used in religious services.
_____ years old
-7. Refused
-8. Don't know
-9. Never had a drink of alcohol~~~ SKIP TO Q.ll
6. When was the most recent time you had an alcoholic beverage such as beer, wine, winecooler or liquor? Was it:
1. within the past 30 days,
2. within the past 6 months but more than a month ago,
3. six months to a year ago
4. more than a year to 3 years ago, or
5 . more than 3 years ago?
7. Refused
8. Don't know
9. NA
~~~ SKIP TO Q.I0
7. During the past 30 days, on about how many different days did you have one or moredrinks?
_____ number of days
-7. Refused
-8. Don'tknow
-9. NA
8. A drink is one can or bottle of beer, one glass of wine, one can or bottle of wine cooler, onecocktail, or a shot of liquor. On the days that you drank during the past 30 days about howmany drinks did you usually have a day on the average?
_____ number of drinks
-7. Refused
-8. Don't know
-9. NA
9. Considering all types of alcoholic beverages, how many times in the past 30 days did youhave five or more drinks on an occasion?
_____ number of times
-7. Refused
-8. Don'tknow
-9. NA
-66- WRC: 11102/93
10. Has there ever been a time in the past when you drank more alcohol, on average, than you donow?
1. Yes-+--7~ lOa. Was this:
2 No 1. less than one year ago,
7. Refused 2. 1-2 years,
8. Don't know 3. 3-4 years,
9. NA 4. 5-10 years, or
5. more than 10 years ago?
7. Refused
8. Don't know
9. NA
lOb. Was there any special circumstance or event that ever caused youto reduce the amount you were drinking?1. Yes~~ Whatwasthis? _
2. No
7. Refused
8. Don'tknow
9. NA
11. Have you ever been treated in an alcohol or drug treatment program?
1. Yes~~~
2. No
7. Refused
8. Don't know
9. NA
lla. Was this:
1. less than 1 year ago,
2. 1-2 years,
3. 3-4 years,
4. 5-10 years, or
5. more than 10 years ago?
7. Refused
8. Don't know
9. NA
IF TREATED MORE THAN ONCE, CODE THE MOSTRECENT TIME
-67- WRC: 11102/93
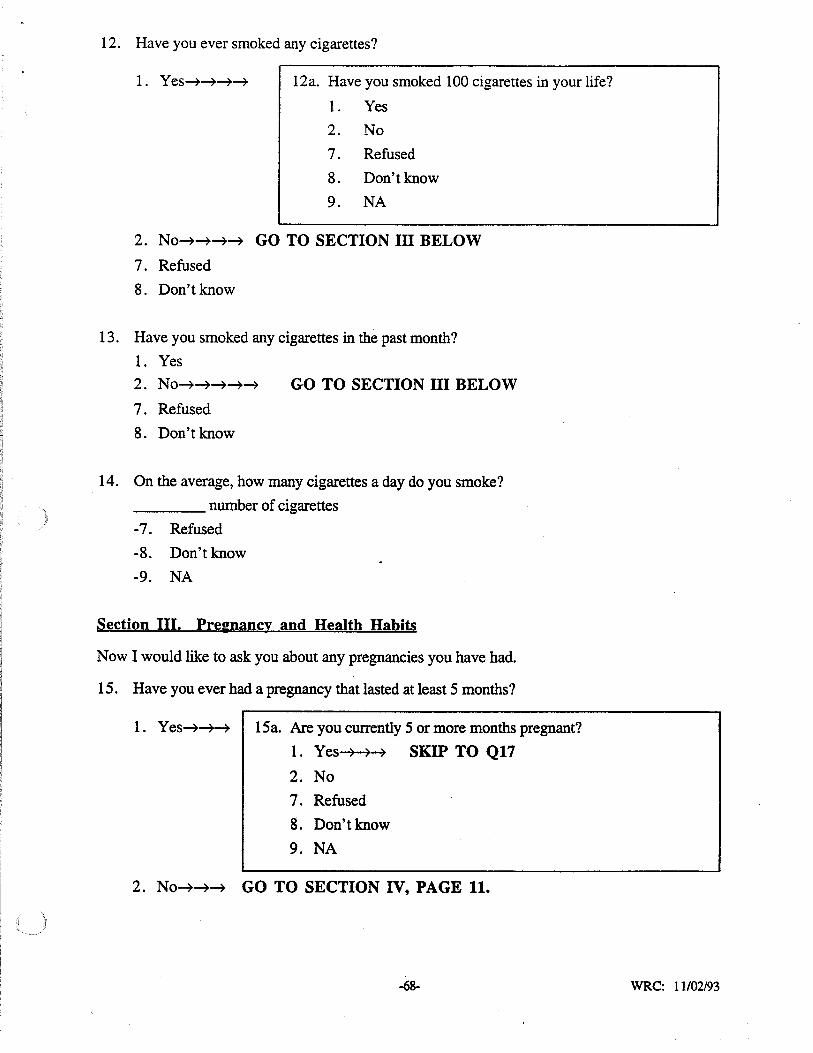
12. Have you ever smoked any cigarettes?
1. Yes-+-+....~-7 12a. Have you smoked 100 cigarettes in your life?
1. Yes
2. No
7. Refused
8. Don't know
9. NA
2. NO-7-7-7-7 GO TO SECTION III BELOW
7. Refused
8. Don't know
13. Have you smoked any cigarettes in the past month?
1. Yes
2. NO-7-7-7-7-7 GO TO SECTION III BELOW
7. Refused
8. Don't know
14. On the average, how many cigarettes a day do you smoke?
____ number of cigarettes
-7. Refused
-8. Don't know
-9. NA
Section III. Prel:nancy and Health Habits
Now I would like to ask you about any pregnancies you have had.
15. Have you ever had a pregnancy that lasted at least 5 months?
1. Yes-7-7-7 15a. Are you currently 5 or more months pregnant?
1. Yes-7-7-7 SKIP TO Q17
2. No
7. Refused
8. Don't know
9. NA
2. NO-7-7-7 GO TO SECTION IV, PAGE 11.
-68- WRC: 11/02/93
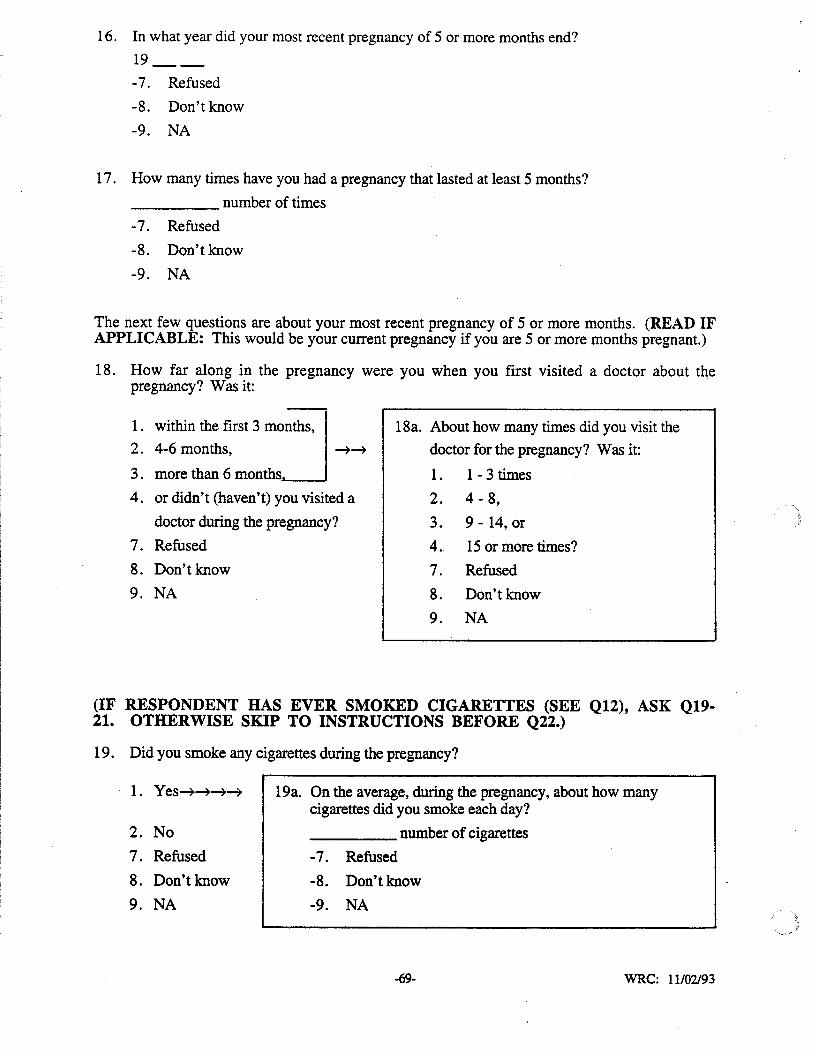
18a. About how many times did you visit the
doctor for the pregnancy? Was it:
1. 1 - 3 times
2. 4 - 8,
3. 9 - 14, or
4. 15 or more times?
7. Refused
8. Don't know
9. NA
16. In what year did your most recent pregnancy of 5 or more months end?19__
-7. Refused
-8. Don't know
-9. NA
17. How many times have you had a pregnancy that lasted at least 5 months?
_____ number of times
-7. Refused
-8. Don't know
-9. NA
The next few questions are about your most recent pregnancy of 5 or more months. (READ IFAPPLICABLE: This would be your current pregnancy if you are 5 or more months pregnant.)
18. How far along in the pregnancy were you when you first visited a doctor about thepregnancy? Was it:
1. within the first 3 ~nths'l2. 4-6 months, -+-~
3. more than 6 months
4. or didn't (haven't) you visited a
doctor during the pregnancy?
7. Refused
8. Don't know
9. NA
(IF RESPONDENT HAS EVER SMOKED CIGARETTES (SEE Q12), ASK Q1921. OTHERWISE SKIP TO INSTRUCTIONS BEFORE Q22.)
19. Did you smoke any cigarettes during the pregnancy?
1. Yes-+-~~~
2. No
7. Refused
8. Don't know
9. NA
19a. On the average, during the pregnancy, about how manycigarettes did you smoke each day?
_____ number of cigarettes
-7. Refused
-8. Don't know
-9. NA
-69- WRC: 11102193
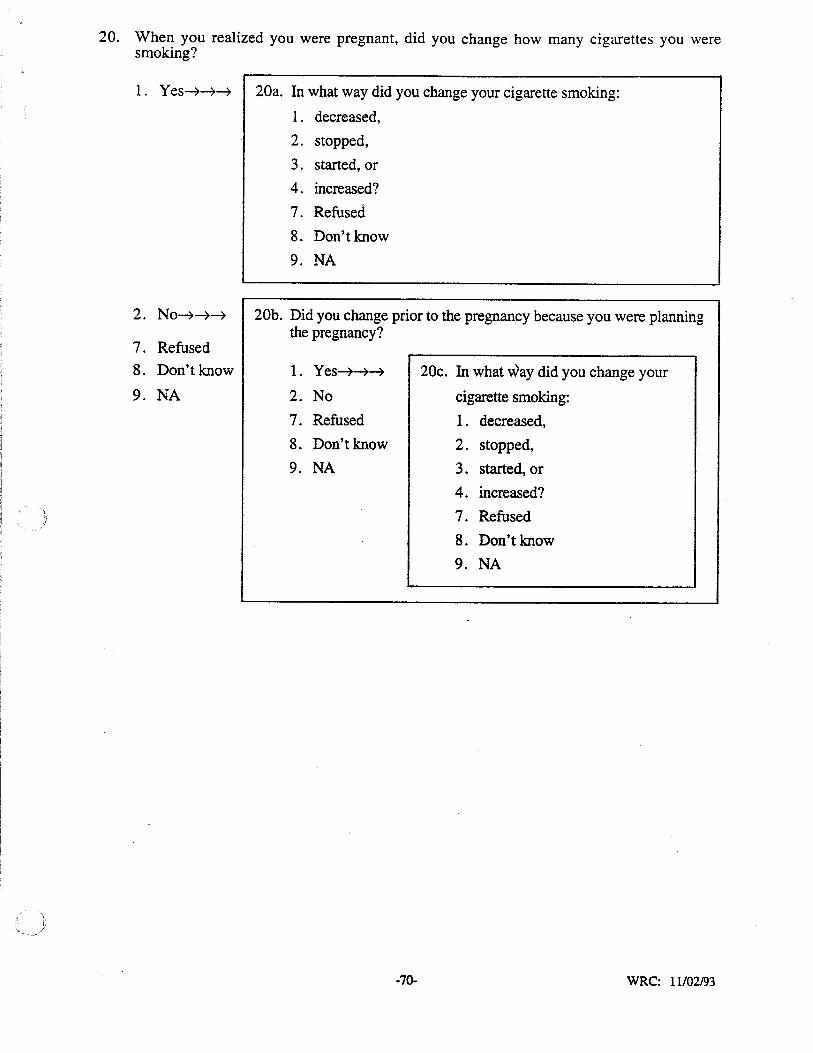
20. When you realized you were pregnant, did you change how many cigarettes you weresmoking?
1. Yes---7---7---7 20a. In what way did you change your cigarette smoking:
1. decreased,
2. stopped,
3. started, or
4. increased?
7. Refused
8. Don't know
9. NA
20b. Did you change prior to the pregnancy because you were planningthe pregnancy?
2. N0---7---7---7
7. Refused
8. Don't know
9. NA
1. Yes---7---7--7
2. No
7. Refused
8. Don't know
9. NA
-70-
20c. In what way did you change your
cigarette smoking:
1. decreased,
2. stopped,
3. started,or
4. increased?
7. Refused
8. Don't know
9. NA
WRC: 11/02/93
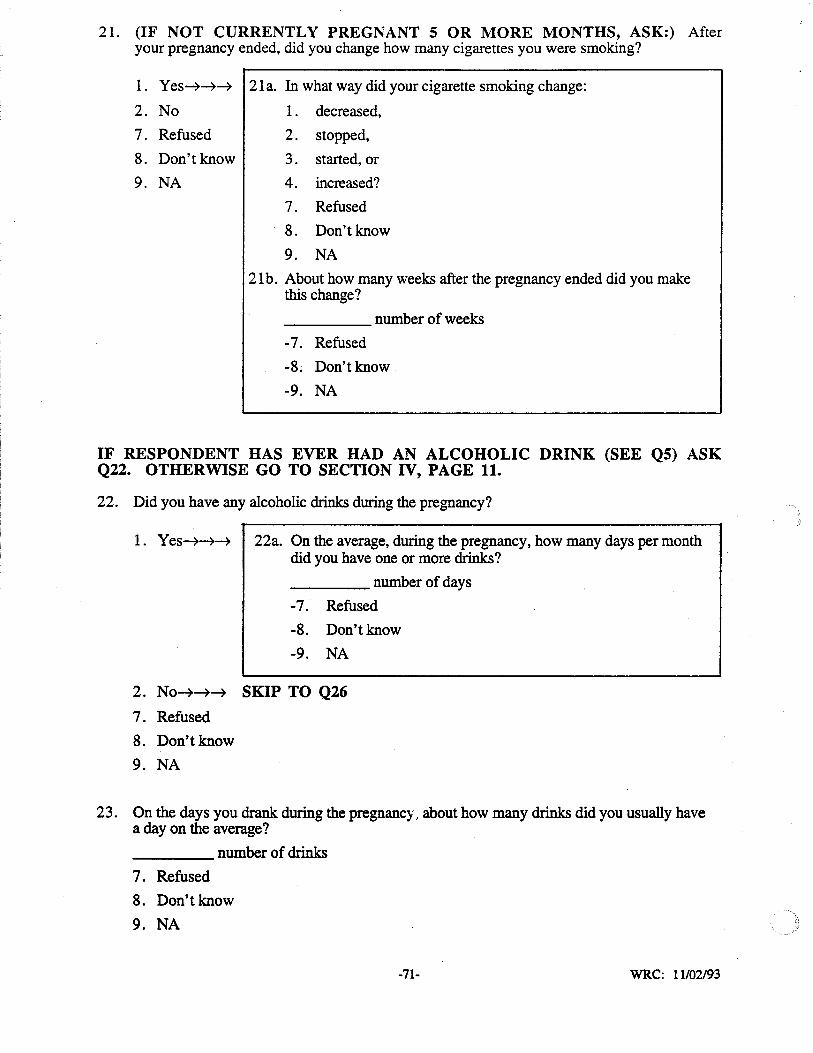
l. Yes~~~
2. No
7. Refused
8. Don't know
9. NA
21. (IF NOT CURRENTLY PREGNANT 5 OR MORE MONTHS, ASK:) Afteryour pregnancy ended, did you change how many cigarettes you were smoking?
21 a. In what way did your cigarette smoking change:
1. decreased,
2. stopped,
3. started, or
4. increased?
7. Refused
8. Don't know
9. NA
21b. About how many weeks after the pregnancy ended did you makethis change?
____ number of weeks
-7. Refused
-8. Don't know
-9. NA
IF RESPONDENT HAS EVER HAD AN ALCOHOLIC DRINK (SEE QS) ASKQ22. OTHERWISE GO TO SECTION IV, PAGE 11.
22. Did you have any alcoholic drinks during the pregnancy?
1. Yes~~~ 22a. On the average, during the pregnancy, how many days per monthdid you have one or more drinks?
____ number of days
-7. Refused
-8. Don'tknow
-9. NA
2. No~~~ SKIP TO Q26
7. Refused
8. Don't know
9. NA
23. On the days you drank during the pregnancy, about how many drinks did you usually havea day on the average?
____ number of drinks
7. Refused
8. Don't know
9. NA
-71- WRC: 11102/93
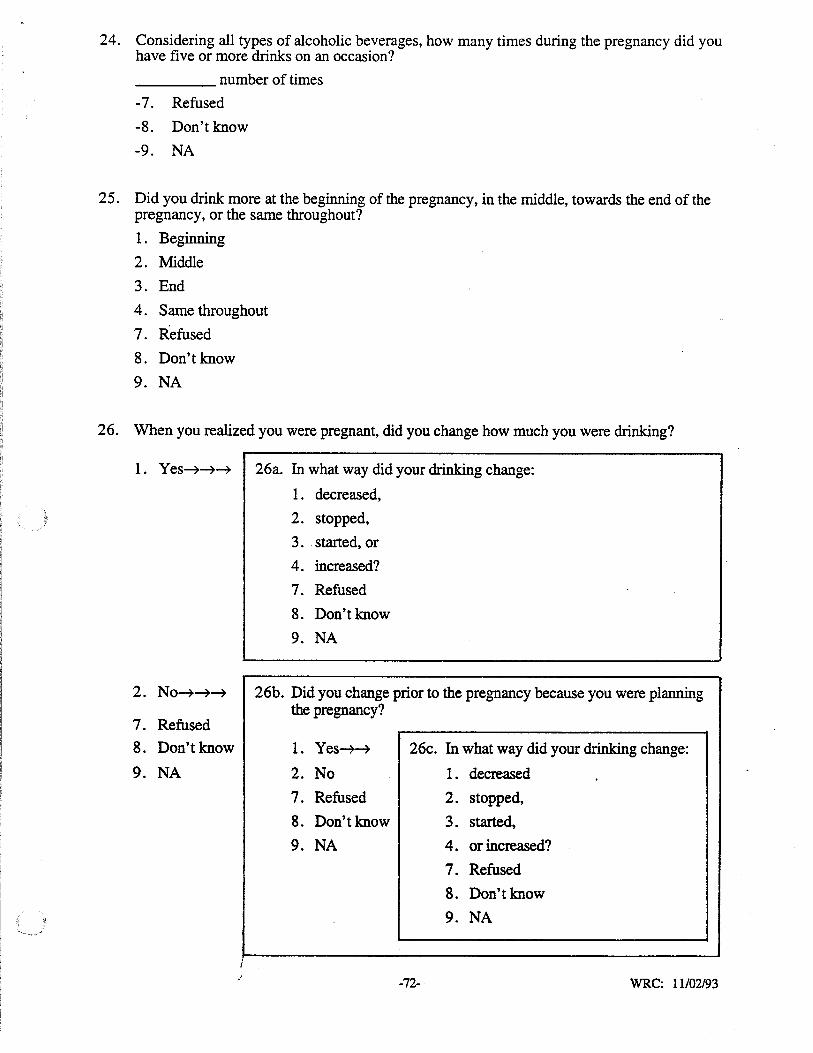
24. Considering all types of alcoholic beverages, how many times during the pregnancy did youhave five or more drinks on an occasion?
____ number of times
-7. Refused
-8. Don't know
-9. NA
25. Did you drink more at the beginning of the pregnancy, in the middle, towards the end of thepregnancy, or the same throughout?
1. Beginning
2. Middle
3. End
4. Same throughout
7. Refused
8. Don't know
9. NA
26. When you realized you were pregnant, did you change how much you were drinking?
1. Yes~~~ 26a. In what way did your drinking change:
1. decreased,
2. stopped,
3. started, or
4. increased?
7. Refused
8. Don't know
9. NA
26b. Did you change prior to the pregnancy because you were planningthe pregnancy?
2. No~~~
7. Refused
8. Don't know
9. NA
1. Yes~~
2. No
7. Refused
8. Don't know
9. NA
26c. In what way did your drinking change:
1. decreased
2. stopped,
3. started,
4. or increased?
7. Refused
8. Don't know
9. NA
-72- WRC: 11/02/93
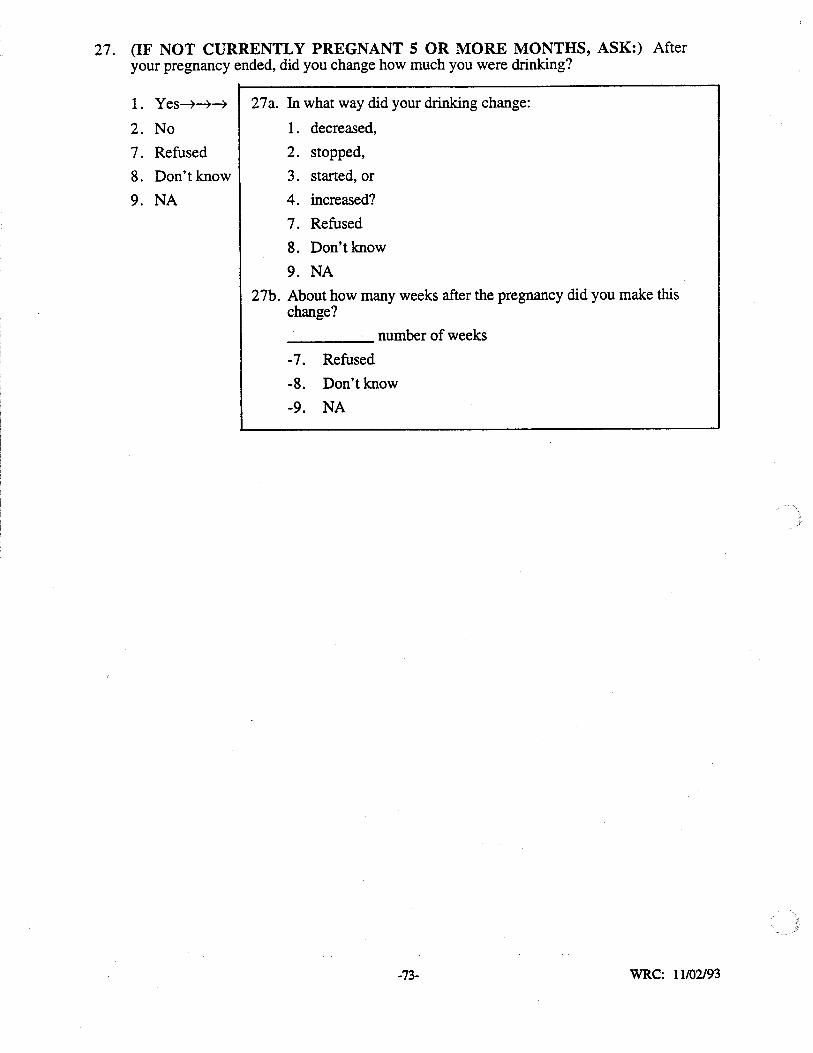
27. (IF NOT CURRENTLY PREGNANT 5 OR MORE MONTHS, ASK:) Afteryour pregnancy ended, did you change how much you were drinking?
l. Yes~-+-~
2. No
7. Refused
8. Don't know
9. NA
27a. In what way did your drinking change:
1. decreased,
2. stopped,
3. started, or
4. increased?
7. Refused
8. Don't know
9. NA
27b. About how many weeks after the pregnancy did you make thischange?_____ number of weeks
-7. Refused
-8. Don't know
-9. NA
-73- WRC: 11102193
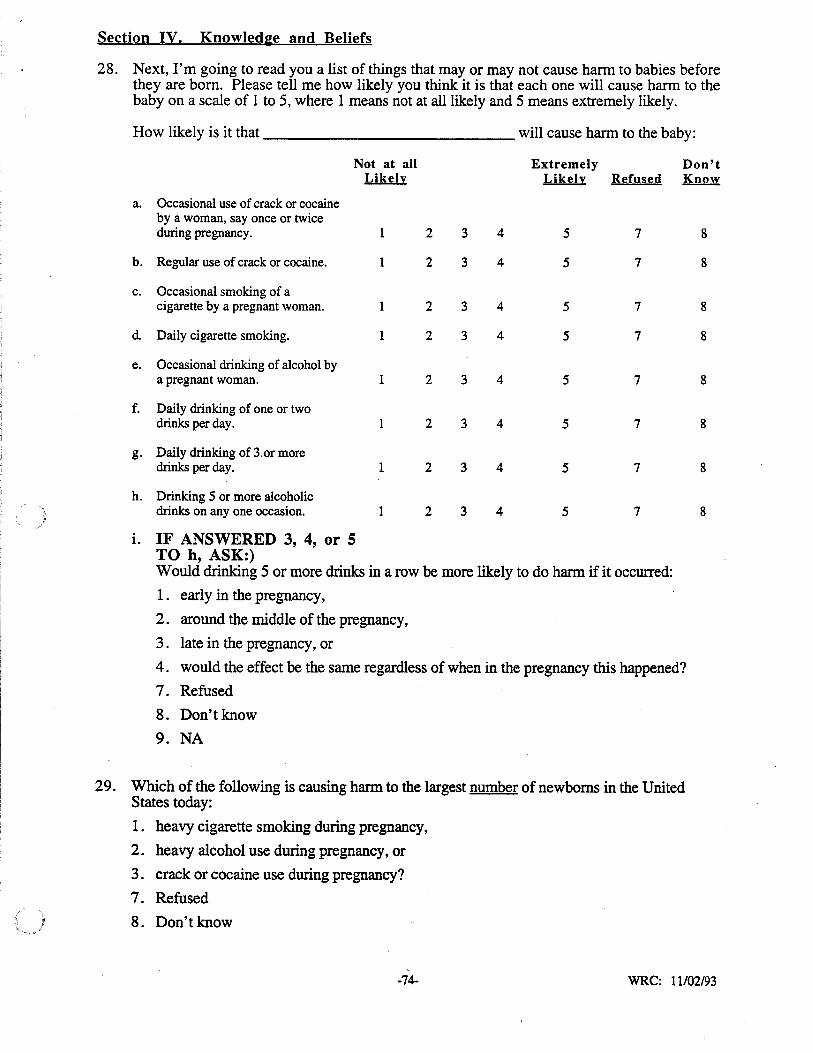
Section IV. Knowled~e and Beliefs
28. Next, I'm going to read you a list of things that mayor may not cause harm to babies beforethey are born. Please tell me how likely you think it is that each one will cause harm to thebaby on a scale of 1 to 5, where 1 means not at all likely and 5 means extremely likely.
How likely is it that will cause harm to the baby:
Not at all Extremely Don'tLikely Likely Refused Know
a. Occasional use of crack or cocaineby a woman, say once or twiceduring pregnancy. 2 3 4 5 7 8
b. Regular use of crack or cocaine. 1 2 3 4 5 7 8
c. Occasional smoking of acigarette by a pregnant woman. 2 3 4 5 7 8
d Daily cigarette smoking. 1 2 3 4 5 7 8
e. Occasional drinking of alcohol bya pregnant woman. 1 2 3 4 5 7 8
f. Daily drinking of one or twodrinks per day. 1 2 3 4 5 7 8
g. Daily drinking of 3.or moredrinks per day. 1 2 3 4 5 7 8
h. Drinking 5 or more alcoholicdrinks on anyone occasion. 1 2 3 4 5 7 8
1. IF ANSWERED 3, 4, or 5TO h, ASK:)Would drinking 5 or more drinks in a row be more likely to do harm if it occurred:
l. early in the pregnancy,
2. around the middle of the pregnancy,
3. late in the pregnancy, or
4. would the effect be the same regardless of when in the pregnancy this happened?
7. Refused
8. Don't know
9. NA
29. Which of the following is causing harm to the largest number ofnewboms in the UnitedStates today:
1. heavy cigarette smoking during pregnancy,
2. heavy alcohol use during pregnancy, or
3. crack or cocaine use during pregnancy?
7. Refused
8. Don't know
-74- WRC: 11/02/93
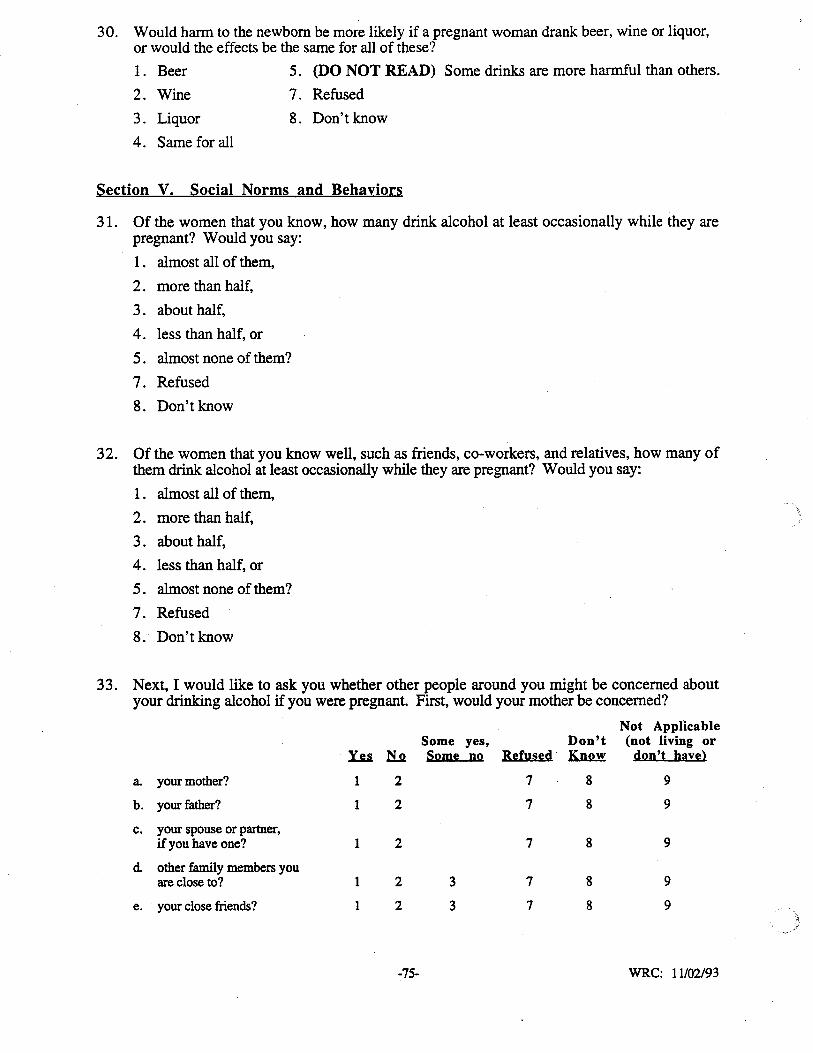
30. Would harm to the newborn be more likely if a pregnant woman drank beer, wine or liquor,or would the effects be the same for all of these?
1. Beer 5. (DO NOT READ) Some drinks are more harmful than others.
2. Wine 7. Refused
3. Liquor 8. Don't know
4. Same for all
Section V. Social Norms and Behaviors
31. Of the women that you know, how many drink alcohol at least occasionally while they arepregnant? Would you say:
1. almost all of them,
2. more than half,
3 . about half,
4. less than half, or
5. almost none of them?
7. Refused
8. Don't know
32. Of the women that you know well, such as friends, co-workers, and relatives, how many ofthem drink alcohol at least occasionally while they are pregnant? Would you say:
1. almost all of them,
2. more than half,
3 . about half,
4. less than half, or
5. almost none of them?
7. Refused
8. Don't know
33. Next, I would like to ask you whether other people around you might be concerned aboutyour drinking alcohol ifyou were pregnant. First, would your mother be concerned?
Not ApplicableSome yes, Don't (not living or
Yu IiJl Some no Refused K.wu! don't have)
a. your mother? 1 2 7 8 9
b. your father? 1 2 7 8 9
c. your spouse or partner,ifyou have one? 1 2 7 8 9
d other family members youare close to? 1 2 3 7 8 9
e. your close friends? 1 2 3 7 8 9
-75- WRC: 11/02/93
34. Please tell me whether you strongly agree, agree, disagree, or strongly disagree with thefollowing statements.
Strongly Strongly Don't~ Agree Disagree Disagree Refused Know
a. A bartender should refuse to servealcohol to a woman who isobviously pregnant. 2 3 4 7 8
b. When a person is out with a friendwho is pregnant, that person shouldalso avoid drinking alcohol. 1 2 3 4 7 8
c. When a person is offering alcoholicdrinks to a group of friends, that personshould only offer soft drinks to a friendwho is pregnant. 1 2 3 4 7 8
d When you see an obviously pregnantwoman drinking alcohol at a bar who isnot someone you know, you shouldwarn her not to drink.
112 I 3 4 7 8
J,
d1. Would you warn her? 1. Yes 2. No 3. Maybe 7. Ref 8. DK 9. NA
e. When you see an obviously pregnantfriend drinking alcohol at a bar, you
tshould warn her not to drink. 2 I 3 4 7 8
J,
el. Would you warn her? l. Yes 2. No 3. Maybe 7. Ref 8. DK 9. NA
f. Bars and restaurants should be requiredto post signs warning pregnant womennot to drink. 1 2 3 4 7 8
g. It is sometimes okay for a woman whois not pregnant to get drunk. 1 2 3 4 7 8
h. It is okay for a woman who~pregnant to have one or two alcoholicdrinks at a party. 1 2 3 4 7 8
-76- WRC: 11/02/93
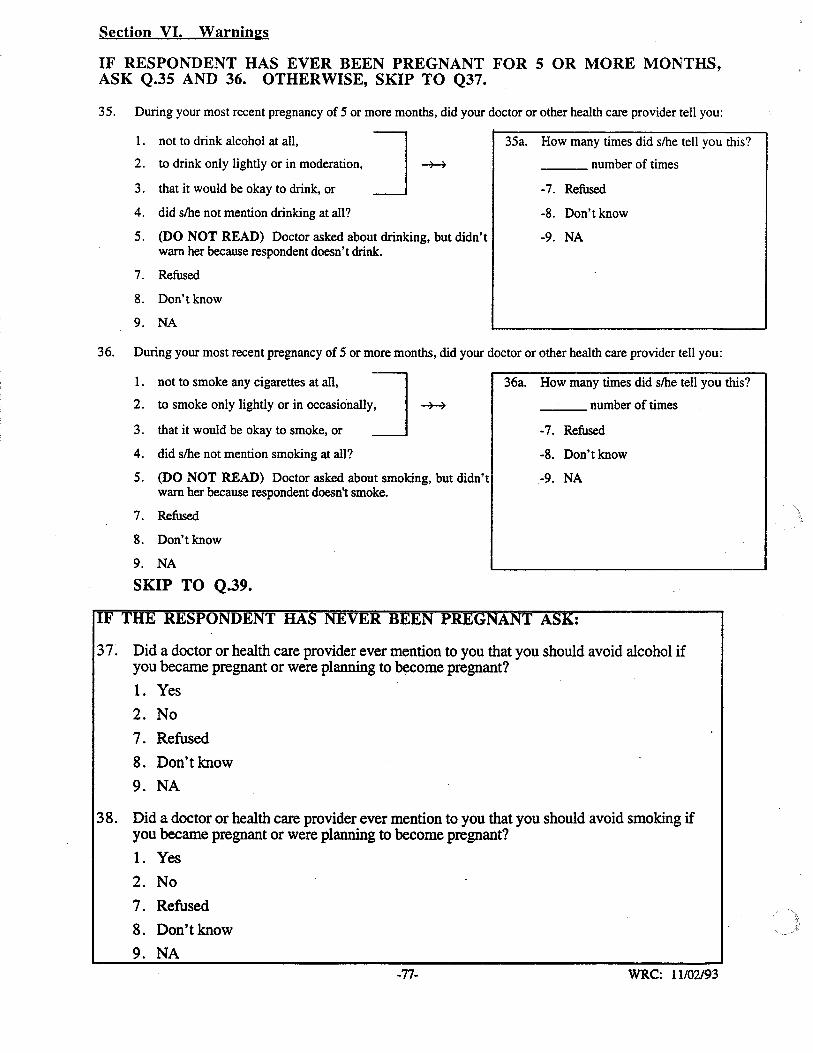
Section VI. Warnina:s
IF RESPONDENT HAS EVER BEEN PREGNANT FOR 5 OR MORE MONTHS,ASK Q.35 AND 36. OTHERWISE, SKIP TO Q37.
35. During your most recent pregnancy of 5 or more months, did your doctor or other health care provider tell you:
J~I. not to drink alcohol at all,
2. to drink only lightly or in moderation,
3. that it would be okay to drink, or
4. did s/he not mention drinking at all?
5. (DO NOT READ) Doctor asked about drinking, but didn'twarn her because respondent doesn't drink.
7. Refused
8. Don't know
9. NA
35a. How many times did s/he tell you this?
___ number of times
-7. Refused
-8. Don't know
-9. NA
36. During your most recent pregnancy of 5 or more months, did your doctor or other health care provider tell you:
1. not to smoke any cigarettes at all, J2. to smoke only lightly or in occasionally,
3. that it would be okay to smoke, or
4. did slhe not mention smoking at all?
5. (DO NOT READ) Doctor asked about smoking, but didn'twarn her because respondent doesn't smoke.
7. Refused
8. Don't know
9. NA
SKIP TO Q.39.
36a. How many times did s/he tell you this?
___ number of times
-7. Refused
-8. Don't know
-9. NA
37. Did a doctor or health care provider ever mention to you that you should avoid alcohol ifyou became pregnant or were planning to become pregnant?
1. Yes
2. No
7. Refused
8. Don't know
9. NA
38. Did a doctor or health care provider ever mention to you that you should avoid smoking ifyou became pregnant or were planning to become pregnant?
1. Yes2. No
7. Refused
8. Don't know
9. NA-77- WRC: 11102193
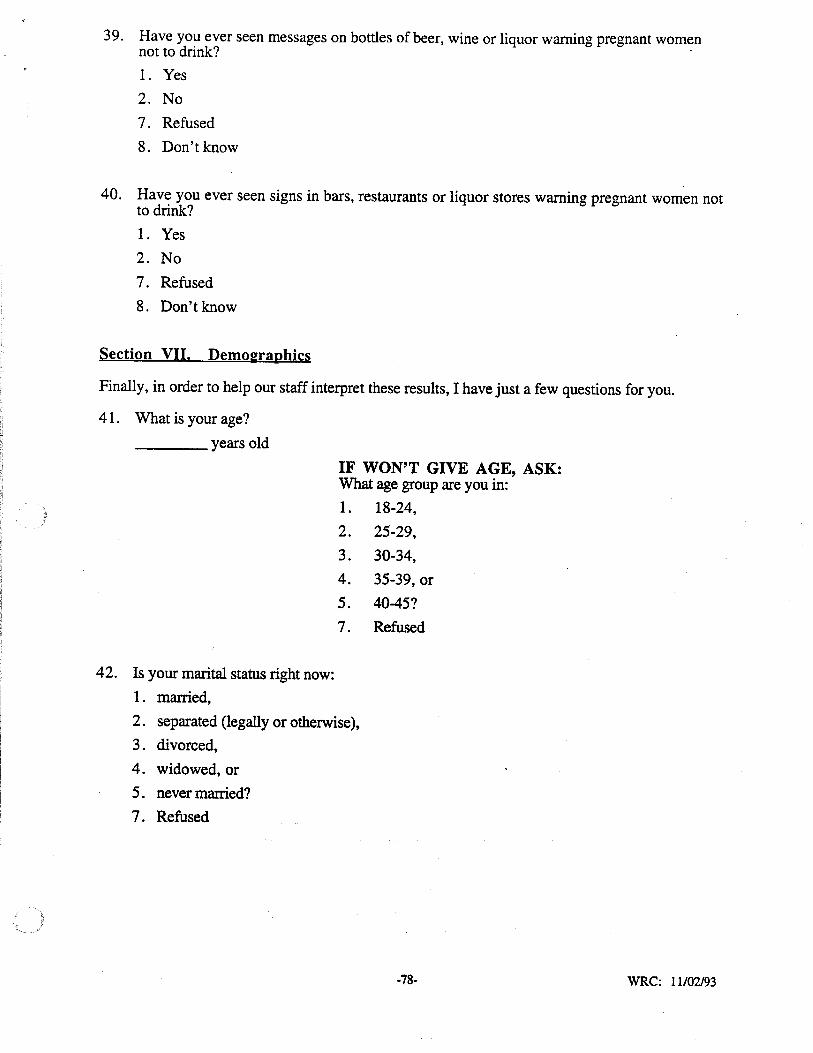
39. Have you ever seen messages on bottles of beer, wine or liquor warning pregnant womennot to drink? .
1. Yes
2. No
7. Refused
8. Don't know
,
40. Have you ever seen signs in bars, restaurants or liquor stores warning pregnant women notto drink?
1. Yes
2. No
7. Refused
8. Don't know
Section VII. Demoeraphics
Finally, in order to help our staff interpret these results, I have just a few questions for you.
41. What is your age?____ years old
IF WON'T GIVE AGE, ASK:What age group are you in:
1. 18-24,
2. 25-29,
3. 30-34,
4. 35-39, or
5. 4O-45?
7. Refused
42. Is your marital status right now:
1. married,
2. separated (legally or otherwise),
3. divorced,
4. widowed, or
5. never married?
7. Refused
-78- WRC: 11102193
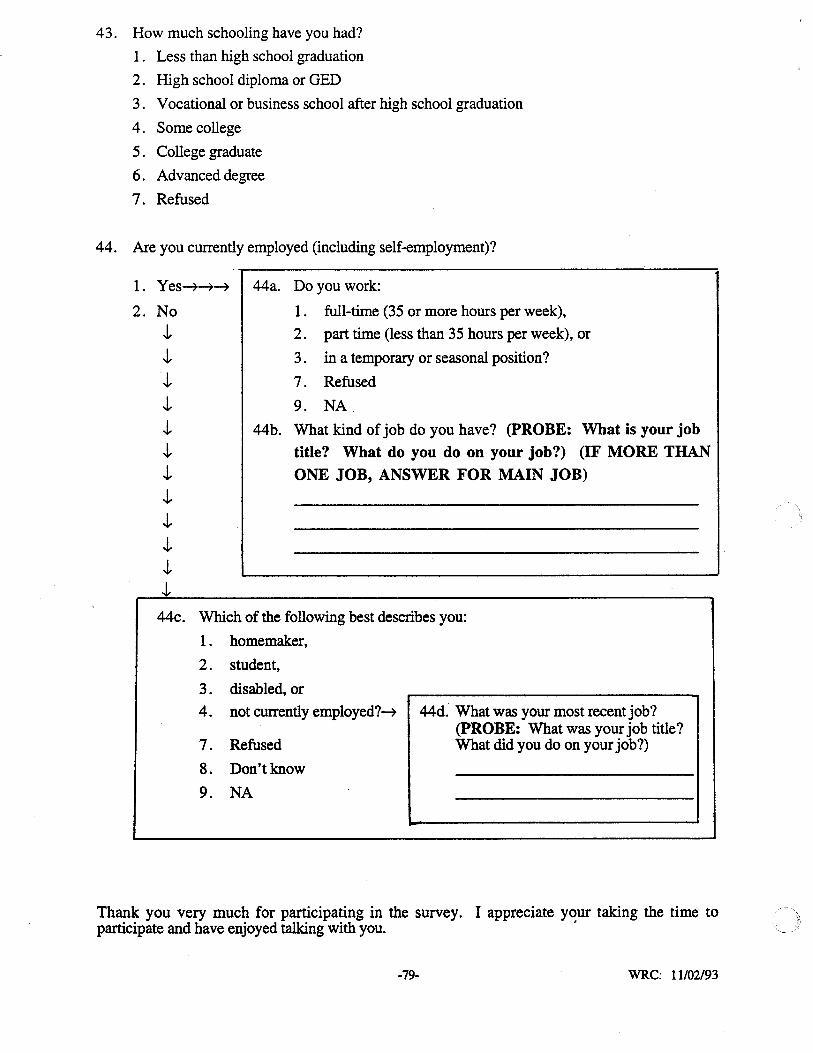
43. How much schooling have you had?
1. Less than high school graduation
2. High school diploma or GED
3. Vocational or business school after high school graduation
4. Some college
5 . College graduate
6. Advanced degree
7. Refused
44. Are you currently employed (including self-employment)?
1. Yes~~~
2. NoJ,J,J,J,J,J,J,J,J,J,J,J,
44a. Do you work:
1. full-time (35 or more hours per week),
2. part time (less than 35 hours per week), or
3 . in a temporary or seasonal position?
7. Refused
9. NA
44b. What kind of job do you have? (pROBE: What is your job
title? What do you do on your job?) (IF MORE THANONE JOB, ANSWER FOR MAIN JOB)
44c. Which of the following best describes you:
1. homemaker,
2. student,
3. disabled, or
4. not currently employed?~ 44d. What was your most recent job?(pROBE: What was your job title?
7. Refused What did you do on your job?)
8. Don't know
9. NA
Thank you very much for participating in the survey. I appreciate y~ur taking the time toparticipate and have enjoyed talking with you.
-79- WRC: 11102/93
APPENDIX C
STUDY METHODS
-80-

STUDY METHODS
SURVEY SAMPLE
SampliD,,: Desi,,:D
The aim of the sampling design was to obtain a representative sample of women of child
bearing age (i.e., 18 to 45 years old) residing in Minnesota in households with telephones.
Furthermore, the sample needed to be geographically representative of the state and of sufficient
size such that figures derived from the survey would be reasonably precise (i.e., have a confidence
interval of 5 percent).
To achieve these goals, a geographically stratified random sample of households with
telephones was used. The total sample size was set at 1,000. One woman age 18 to 45 was
surveyed in each randomly selected household in which one or more women in this age range
resided.
The sampling design was implemented by first determining the number of women age 18 to
45 who resided in each of the 13 development regions of the state, and what percentage this
number represented in each region of the total state population of women in this age range. The
regions are clusters of counties that have been established for planning and development purposes.
Figure C.l shows the percentage of the total state population of 18 to 45 year old women that
reside in each region according to the 1990 Census. By multiplying these percentages (and
moving the decimal point two places to the left) by the sample size (i.e., 1,000) in each region, the .
number of 18 to 45 year old women that needed to be surveyed in each region was determined.
For example, the number needed in Region 3 was 62 (.0623 x 1000 = 62). Because Region 11
contains such a large proportion of the total state population of 18 to 45 year old women (58%),
we substratified this region into three parts (Hennepin, Ramsey, and the other five remaining
counties) for purposes of sampling.
Next, a random digit sample of telephone numbers was purchased from Survey Sampling,
Inc., of Fairfield, Connecticut. The sample of telephone numbers was divided into separate
subsamples for each region, which are made up of counties. The sample provided by Survey
Sampling is drawn in such a way as to be geographically representative of telephone households.
This is accomplished by stratifying the sample of telephone numbers in proportion to each county's
share of telephone households in the state. Within each county, geographic representativeness is
approximated by systematically sampling from among all working blocks of numbers (fourth and
fifth digits) of all working telephone exchanges (first three digits) assigned to a county. Within
each selected block, the final two digits of the telephone number are randomly chosen. This
approach to drawing the telephone numbers, plus our stratification of the sample by region
according to the proportion of the state's 18 to 45 year old women living in each region, helped to
-81-
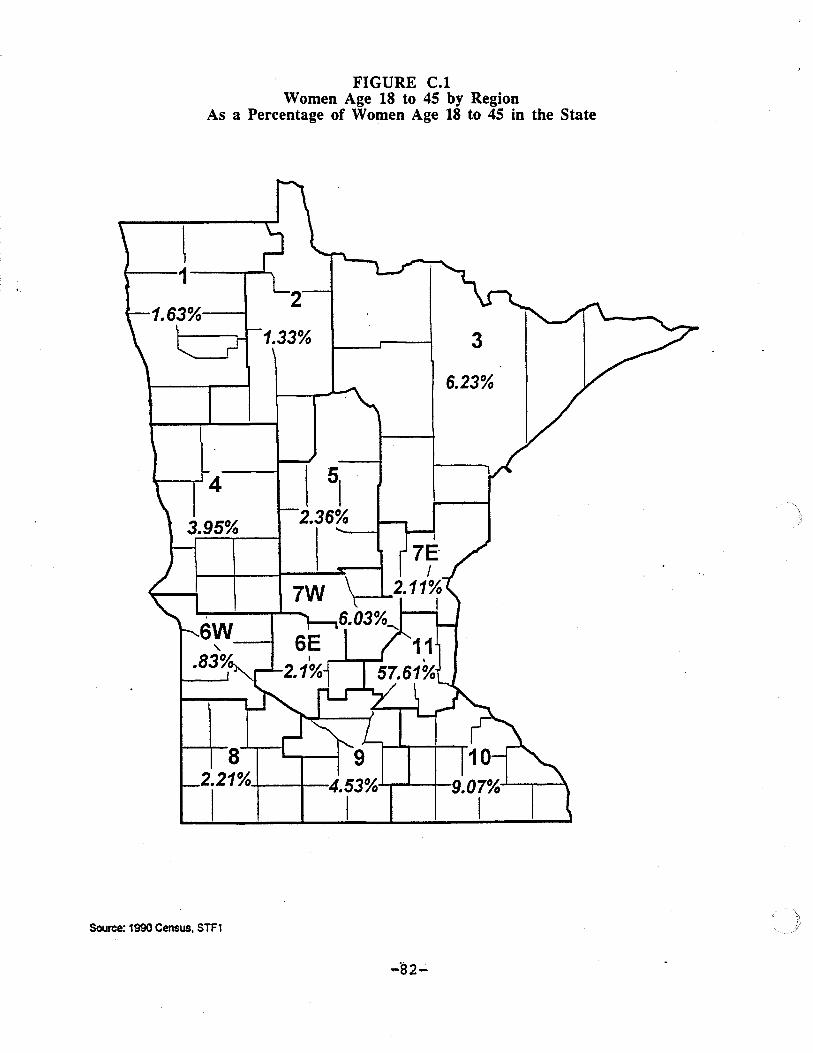
FIGURE C.1Women Age 18 to 45 by Region
As a Percentage of Women Age 18 to 45 in the State
3
6.23%
1.33%
4 I ~2.36%
7W
82.21%,-+----t--4.53%·~M-_j._
I I
,
6W-f"-
.83%
1.63%·---1
~1---1----.......
Source: 1990 Census, STF1
-82-
ensure a geographically representative sample. It also allows both households with listed
telephone numbers and those with unlisted numbers to be sampled.
After determining the number we needed to survey in each region, and having obtained the
list of randomly selected telephone numbers for each region, the next step in the sampling process
was to identify eligible survey respondents at the households called. Interviewers established
whether there was a woman age 18 to 45 living in the household. If there was one, the interviewer
would speak to this person, verify the county of residence, provide a brief introduction to the
survey, invite the woman to participate, and proceed with the interview with her consent. If there
were two or more women age 18 to 45 in the household, we randomly selected one to be surveyed
using the next (or most recent) birthday method of respondent selection (Salmon, C.T. and
Nichols, I.S. Public Opinion Ouarterly 47:270-276, 1983). This is an efficient and unbiased way
of selecting the respondent. The interviewer simply asked to speak to the 18 to 45 year old woman
in the household who had the most recent birthday. About 90 percent of the households containing
18 to 45 year old women have only one woman in this age range (based on 1990 Census
information).
Sample Outcome
Table C.1 indicates the goal for number of interviews in each region (based on Figure C.1)
and the number actually completed. The goal is based on the proportion of the state's 18 to 45 year
old women who reside in each region as previously described. The goal was met in each region,
and sometimes it was slightly exceeded. The total number of interviews actually done across all
regions was 1,017, or 17 more than the goal.
The reason we went over the number needed in some regions is because telephone exchanges
cross county lines, and therefore, one cannot exactly determine the county in which a household is
located by the telephone number (and hence, also what region it is in). This fact made it difficult to
obtain precisely the number of interviews needed in a region, since some completed interviews
were later assigned to a different region (based on information obtained on the location of the
household during the interview) from that originally assigned based on the telephone number. We
decided to keep these interviews in the sample since there are not enough to seriously compromise
the geographic representativeness of the sample.
Table C.2 lists the outcomes for each of the telephone numbers selected. A total of 4,266
telephone numbers were called to obtain 1,017 completed interviews. Other outcomes included
those eligible women who refused to participate. Those who initially refused were usually called
back and asked again if they would consider participating. This sometimes resulted in their
agreeing to be interviewed. Initial refusals frequently occur because the respondent
misunderstands the purpose of the call or is caught at a bad time. Nevertheless, 166 ultimately
refused to be surveyed.
-83-
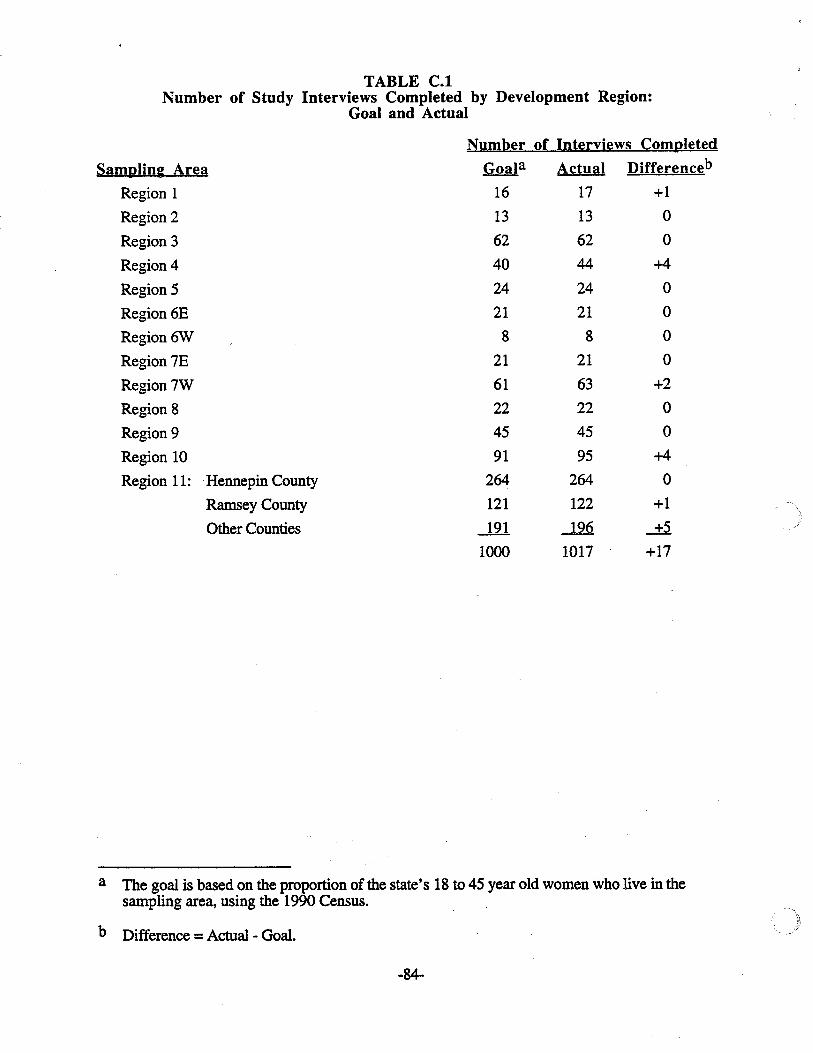
TABLE C.INumber of Study Interviews Completed by Development Region:
Goal and Actual
Sampling Area
Region 1
Region 2
Region 3
Region 4
Region 5
Region 6E
Region6W
Region 7E
Region 7W
Region 8
Region 9
Region 10
Region 11: Hennepin County
Ramsey County
Other Counties
Number of Interviews Completed
Goala Actual Differenceb
16 17 +1
13 13 0
62 62 0
40 44 +4
24 24 0
21 21 0
8 8 0
21 21 0
61 63 +2
22 22 0
45 45 0
91 95 +4
264 264 0
121 122 +1
-l2l -l..2Q +5
1000 1017 +17
a The goal is based on the proportion of the state's 18 to 45 year old women who live in thesampling area, using the 1990 Census.
b Difference =Actual - Goal.
-84-
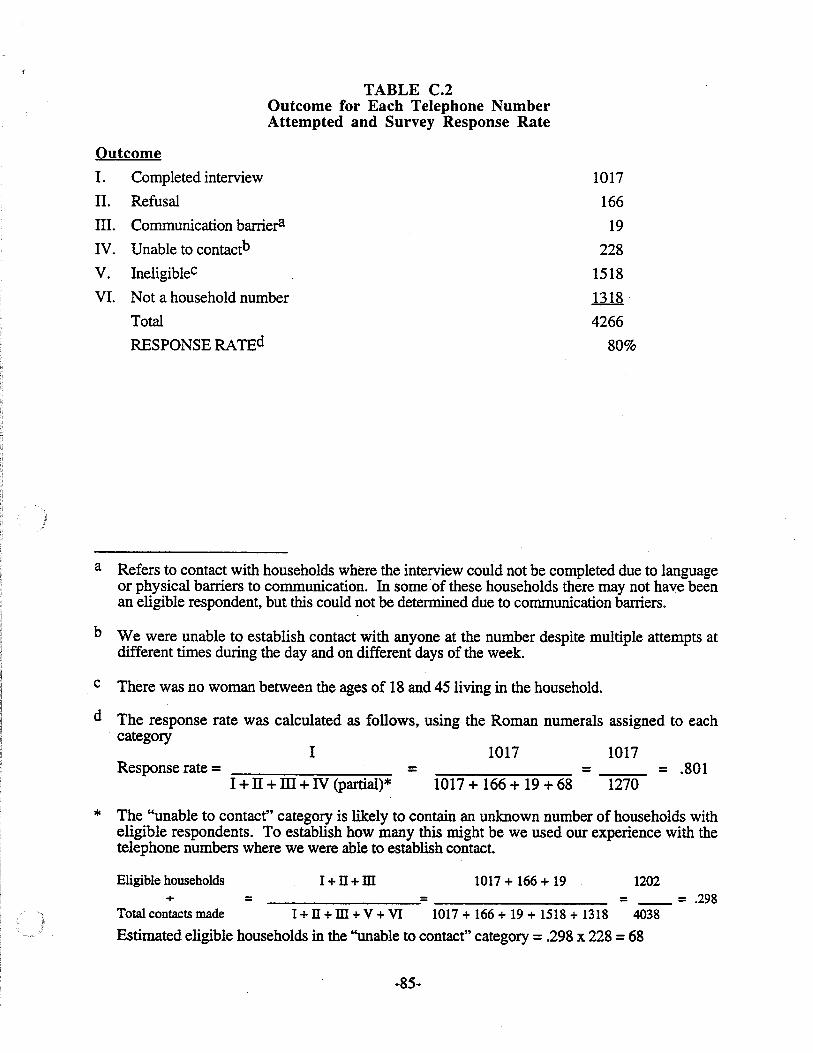
TABLE C.2Outcome for Each Telephone NumberAttempted and Survey Response Rate
Outcome
1. Completed interview
II. Refusal
III. Communication barrier'l
IV. Unable to contactb
V. IneligibleC
VI. Not a household number
Total
RESPONSE RATEd
1017
166
19
228
1518
1318
4266
80%
a Refers to contact with households where the interview could not be completed due to languageor physical barriers to communication. In some of these households there may not have beenan eligible respondent, but this could not be determined due to communication barriers.
b We were unable to establish contact with anyone at the number despite multiple attempts atdifferent times during the day and on different days of the week.
c There was no woman between the ages of 18 and 45 living in the household.
d The response rate was calculated as follows, using the Roman numerals assigned to eachcategory
Response rate =I
I + IT +ill + IV (partial)*=
1017
1017 + 166 + 19 + 68=
1017
1270= .801
* The "unable to contact" category is likely to contain an unknown number of households witheligible respondents. To establish how many this might be we used our experience with thetelephone numbers where we were able to establish contact.
Eligible households 1+ n+ m 1017 + 166 + 19 1202+ = = __ = .298
Total contacts made 1+ n+ m+ V + VI 1017 + 166 + 19 + 1518 + 1318 4038
Estimated eligible households in the ''unable to contact" category =.298 x 228 =68
-85-
Of the 19 communication barriers, 11 were due to hearing problems, two to confusion, and
six to language (two Laotian, one Korean, one Chinese, and two undetermined). Some of these
households probably did not have an eligible respondent, but this could not be determined. All 19
households were classified as eligible for purposes of calculating the response rate.
Several interviews were conducted in Hmong. We were unable to establish contact with a
person for 228 telephone numbers despite multiple attempts on different days of the week and at
different times during the day. Sometimes all we could get was an answering machine. Many of
the households contacted did not have an eligible respondent. We also encountered quite a few
non-household or business numbers.
The response rate achieved was 80 percent. The details of how the response rate was
calculated are provided in Table C.2. Essentially, the response rate (proportion) is determined by
dividing the number of completed interviews by the number of potential interviews. The number
of potential interviews includes completed interviews, refusals, communication barriers and a
proportion of those we were unable to contact. This latter proportion is based on an estimate of
how many of these telephone numbers would have yielded eligible households had we been able to
establish contact. The estimate was derived from our experience with households where we did
establish contact (see Table C.2).
Comparison of Sample Characteristics to 1990 Census
The demographic characteristics of women of child-bearing age as found in our telephone
survey were compared to those obtained in the 1990 Census to gain a better understanding of the
representativeness of our survey sample. Table C.3 shows the distributions for age, marital status
and education as found in the survey and in the census.
Results indicate that our sample has lower proportions of younger women (especially age 18
to 20) and higher proportions of older women (age 35 to 45) than the census. This may be
partially due to changes in the age structure of the population in the nearly four years since the
census was conducted. That is, the aging of the baby boom generation in these four years would
be expected to increase the proportion of women age 35 and older somewhat and correspondingly
reduce the proportion of younger women to some degree.
This is not likely to account for the entire age difference between the survey and the census,
however. Other reasons that may account for part of the difference are that younger women (18 to
20 year olds, in particular): 1) may be less likely to have a telephone if they live on their own, 2)
may be more likely to live in households with more than one woman of child-bearing age (thus,
having a reduced probability of being selected for the sample), and 3) may be harder to contact or
more likely to refuse to participate in the survey.
-86-
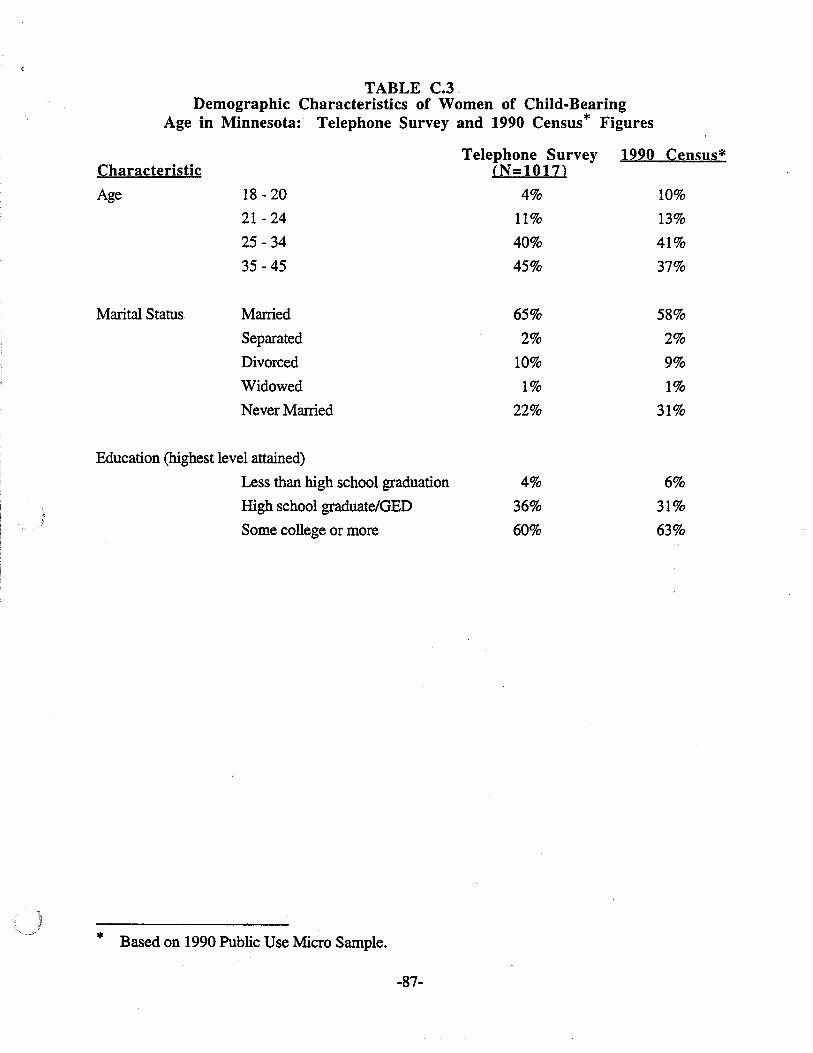
TABLE C.3.Demographic Characteristics of Women of Child-Bearing
Age in Minnesota: Telephone Survey and 1990 Census* Figures
Characteristic
Age
Marital Status
Telephone Survey 1990 Census*(N=1017)
18 - 20 4% 10%
21 - 24 11% 13%
25 - 34 40% 41%
35 - 45 45% 37%
Married 65% 58%
Separated 2% 2%
Divorced 10% 9%
Widowed 1% 1%
Never Married 22% 31%
Education (highest level attained)
Less than high school graduation
High school graduate/OED
Some college or more
* Based on 1990 Public Use Micro Sample.
-87-
4%
36%
60%
6%
31%
63%
Comparisons to the census figures also indicate that never married women are somewhat
underrepresented in the sample while married women are somewhat overrepresented. These
differences are no doubt related to the fact that the study sample has fewer younger women and
more older women, proportionately, compared to the census as just described.
The study sample and the census figures are quite similar regarding the proportions of
women at different educational levels. The distribution of occupations for women in the survey
sample was also similar to the census. It appeared, however, that professional/technical
occupations were slightly overrepresented in the sample and sales occupations were slightly
underrepresented.
In sum, the study sample has somewhat lower proportions of younger women and higher
proportions of older women than the 1990 Census. This difference may be partially due to
changes in the age structure since the 1990 Census was conducted. However, it seems likely that
younger women are underrepresented, at least to a slight degree, in the study sample. This
underrepresentation should be kept in mind as it may affect some of the figures derived from the
sample that are age-related (e.g., current rate of binge drinking among women of child-bearing
age).
It is also important to remember that because this is a household-based telephone survey,
women of child-bearing age living in households and other places (e.g., institutions, homeless
shelters) without telephones are excluded from the survey. Very few households in Minnesota are
without telephones, however. According to the 1990 Census, 98 percent of the households in
Minnesota have telephones.
How to Interpret Sample Fi&Ures
Because the survey was conducted on a sample of Minnesota women of child-bearing age,
the figures reported from the survey are estimates of the true population figures and, therefore,
subject to sampling error. In general, the larger the sample size, assuming random sampling, the
greater the accuracy of the estimates of population figures derived from the sample. With the
sample size of 1,017, we calculated the 95 percent confidence interval for a range of percentages
derived from the sample. The conf~':o.nce interval indicates the range in which the true population
figure is likely to fall 95 percent the time given the sample figure. Confidence intervals are
shown below.
-88-
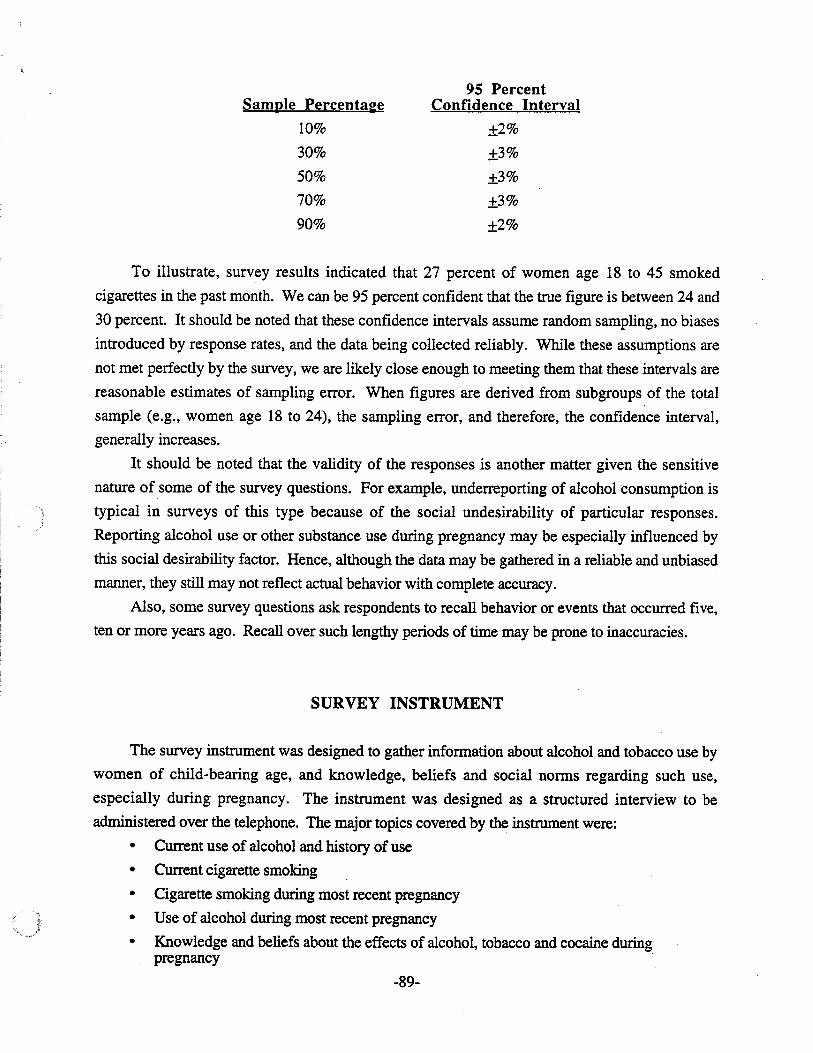
Sample Percentaee
10%
30%
50%
70%
90%
95 PercentConfidence Interval
±2%±3%±3%±3%±2%
To illustrate, survey results indicated that 27 percent of women age 18 to 45 smoked
cigarettes in the past month. We can be 95 percent confident that the true figure is between 24 and
30 percent. It should be noted that these confidence intervals assume random sampling, no biases
introduced by response rates, and the data being collected reliably. While these assumptions are
not met perfectly by the survey, we are likely close enoughto meeting them that these intervals are
reasonable estimates of sampling error. When figures are derived from subgroups of the total
sample (e.g., women age 18 to 24), the sampling error, and therefore, the confidence interval,
generally increases.
It should be noted that the validity of the responses is another matter given the sensitive
nature of some of the survey questions. For example, underreporting of alcohol consumption is
typical in surveys of this type because of the social undesirability of particular responses.
Reporting alcohol use or other substance use during pregnancy may be especially influenced by
this social desirability factor. Hence, although the data may be gathered in a reliable and unbiased
manner, they still may not reflect actual behavior with complete accuracy.
Also, some survey questions ask respondents to recall behavior or events that occurred five,
ten or more years ago. Recall over such lengthy periods of time may be prone to inaccuracies.
SURVEY INSTRUMENT
The survey instrument was designed to gather information about alcohol and tobacco use by
women of child-bearing age, and knowledge, beliefs and social norms regarding such use,
especially during pregnancy. The instrument was designed as a structured interview to be
administered over the telephone. The major topics covered by the instrument were:
• Current use of alcohol and history of use
• Current cigarette smoking
• Cigarette smoking during most recent pregnancy
• Use of alcohol during most recent pregnancy
• Knowledge and beliefs about the effects of alcohol, tobacco and cocaine duringpregnancy .
-89-
• Social nonns regarding use of alcohol during pregnancy
• Contact with health care providers
• Health care provider warnings regarding the use of alcohol and tobacco duringpregnancy
• Demographic characteristics of the respondent.
The instrument included questions drawn from previous surveys of alcohol and tobacco use
as well as newly created questions. Questions about the use of these substances during pregnancy
focused upon the most recent pregnancy that lasted five or more months. The format of the
instrument is fairly complex with many potential skips and branching. This is because many
questions only applied to some of the women -- e.g., those who had ever been pregnant, those
who drank alcohol or those who smoked cigarettes. The instrument was reviewed and critiqued by
a number of staff within the Minnesota Department of Health and the Department of Human
Services during its development.
A pretest was conducted by Wilder Research Center interviewers to field test the instrument
prior to launching the survey. Telephone interviews were conducted with 20 women of child
bearing age. Their telephone numbers were randomly selected from Twin Cities and greater
Minnesota telephone directories. Before calling, each telephone number was checked to make sure
it wasn't included in the list of numbers to be used for the survey. Women in the pretest ranged in
age from 20 to 42, some lived in the Metro Area and some were from greater Minnesota, and some
had been pregnant and some had not. There was also variation across the sample in alcohol and
tobacco use patterns. Hence, the range of circumstances we were likely to encounter in the survey
were covered quite well in the pretest.
After the pretest, the survey instrument was finalized. Minor revisions were made in the
wording of some questions for ease of administration, answer categories were added for several
questions, and a couple of follow-up questions were added as a result of the pretest experience. It
took 13 minutes, on the average, to administer the instrume~t by telephone.
SURVEYIMWLEMENTED
Interviewer TraininK
The interviewer training included the following components: briefmg.on the background and
purpose of the study, explaining procedures for identifying eligible respondents and introducing
the survey to them, going through the survey instrument item by item, and doing practice
interviews. Less experienced interviewers also received training in general survey interviewing
techniques and prOCedures. A total of 23 women were trained for the survey.
-90-
Conductin2 the Survey
The survey was conducted from October 30, 1993 to January 9, 1994. The telephone
interviewers worked in three to four hour shifts. Monday to Thursday each week there were three
shifts: 9:00 a.m. to 12:00 p.m., 1:00 - 5:00 p.m., and 6:00 - 9:00 p.m. On Friday and Saturday,
there were morning and afternoon shifts, but no evening shift. On Sunday, there was one shift,
from 12:00 - 4:00 p.m. No survey interviewing was done on holidays. There was some
flexibility to this schedule. For example, an appointment to do an interview was kept regardless of
whether it fell within normal shift hours.
A number of procedures were followed for quality control and sample monitoring purposes.
Interviewer supervisors did on-line monitoring of survey interviews in progress. Completed
surveys were reviewed on a daily basis for completeness and to identify any problems. If missing
information or a mistake was identified, interviewers called back the respondents so that the survey
form could be corrected. The data from the survey forms were entered into the computer on an
ongoing basis. Errors were also caught during this data entry process and turned over to the
interviewers for follOW-Up with respondents and correction.
The sample was also monitored on an ongoing basis. As telephone numbers in the sample
were determined to be unusable (e.g., ineligible household, business phone number) they were
replaced with new numbers taken in the sequence in which they had been selected. As mentioned
earlier, refusals were not dropped from the active list right away. Most were called back and re
asked to participate. Progress toward reaching the goal for number of interviews completed in
each region was monitored on a daily basis using the computer.
-91-