Embed Size (px)
Citation preview
1NCP102: Introducing the Natural Capital Approach in Department of Defense Environments
SYNTHESIZING INVEST OUTPUTS DoD demonstration examples
2NCP102: Introducing the Natural Capital Approach in Department of Defense Environments
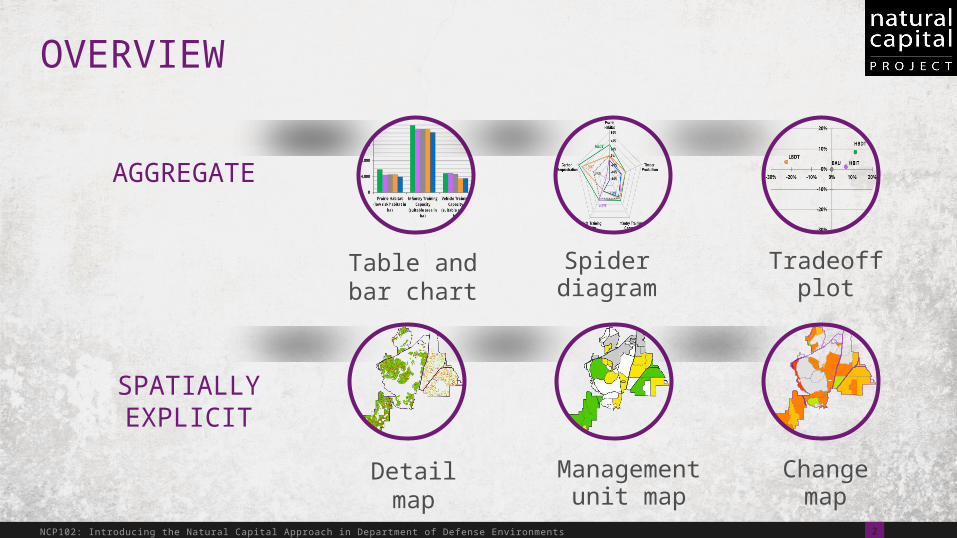
OVERVIEW
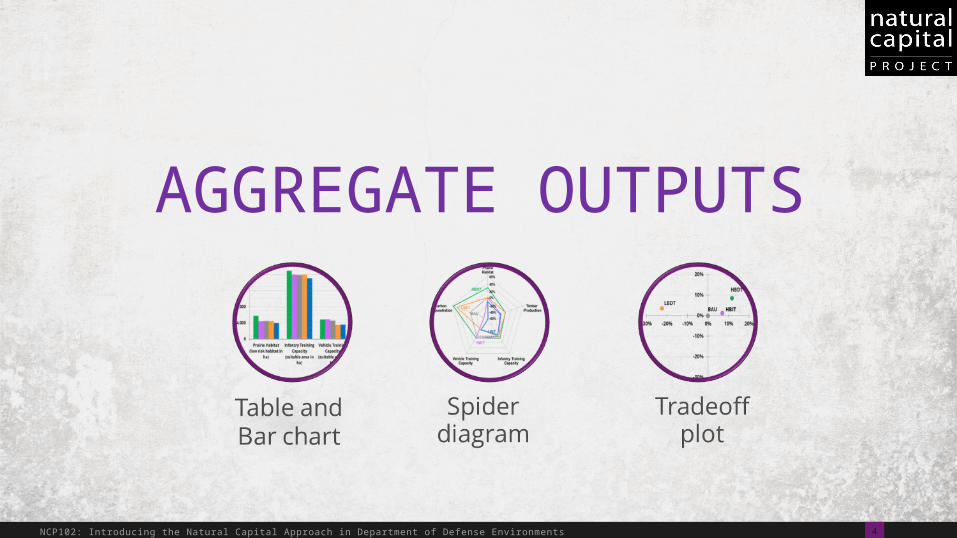
AGGREGATE
SPATIALLY EXPLICIT
Table and bar chart
Spider diagram
Tradeoff plot
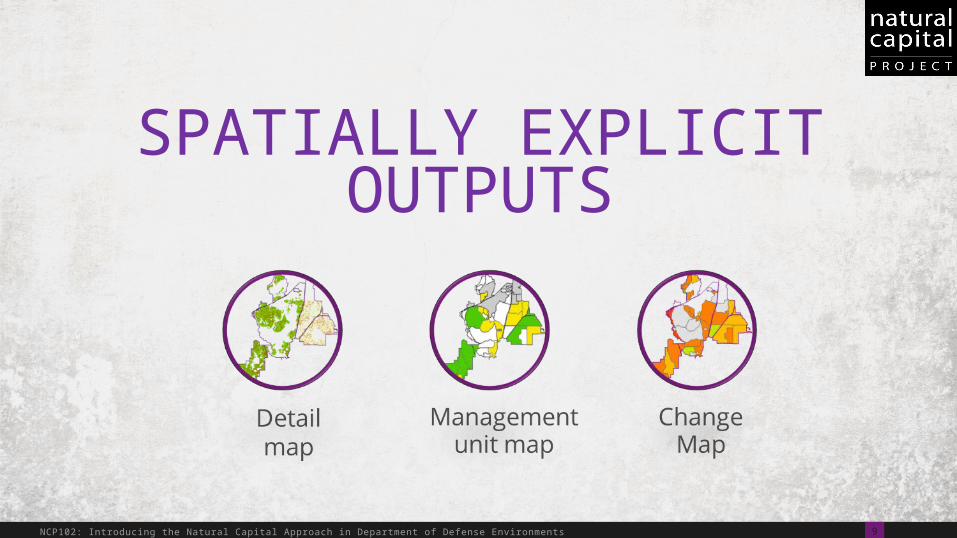
Detailmap
Management unit map
Change map
3NCP102: Introducing the Natural Capital Approach in Department of Defense Environments
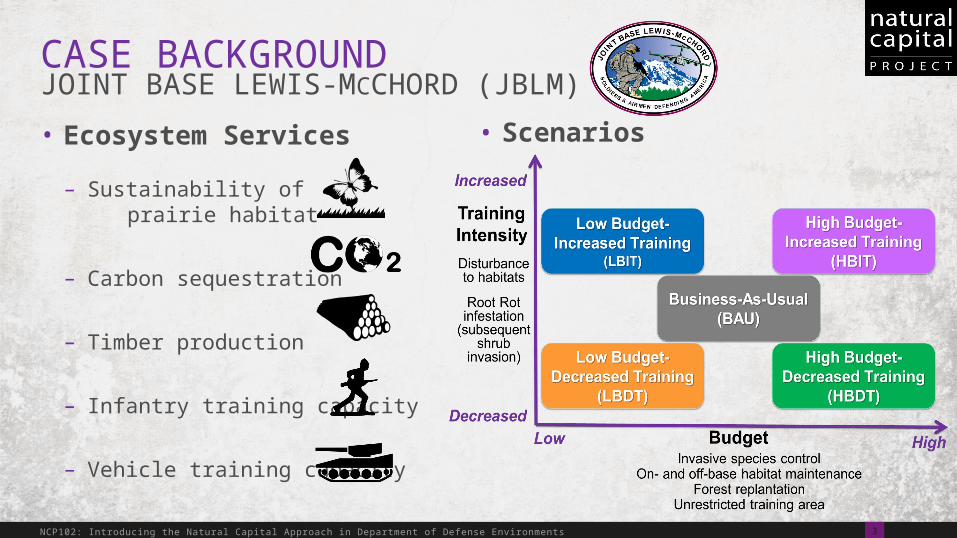
CASE BACKGROUNDJOINT BASE LEWIS-MCCHORD (JBLM)
• Ecosystem Services
– Sustainability of prairie habitat
– Carbon sequestration
– Timber production
– Infantry training capacity
– Vehicle training capacity
• Scenarios
4NCP102: Introducing the Natural Capital Approach in Department of Defense Environments
AGGREGATE OUTPUTS
5NCP102: Introducing the Natural Capital Approach in Department of Defense Environments
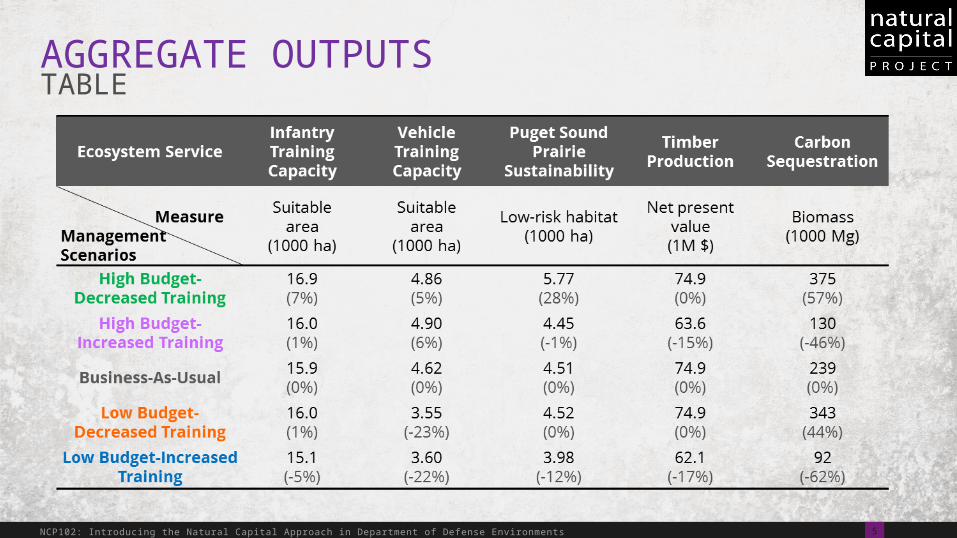
AGGREGATE OUTPUTSTABLE
6NCP102: Introducing the Natural Capital Approach in Department of Defense Environments
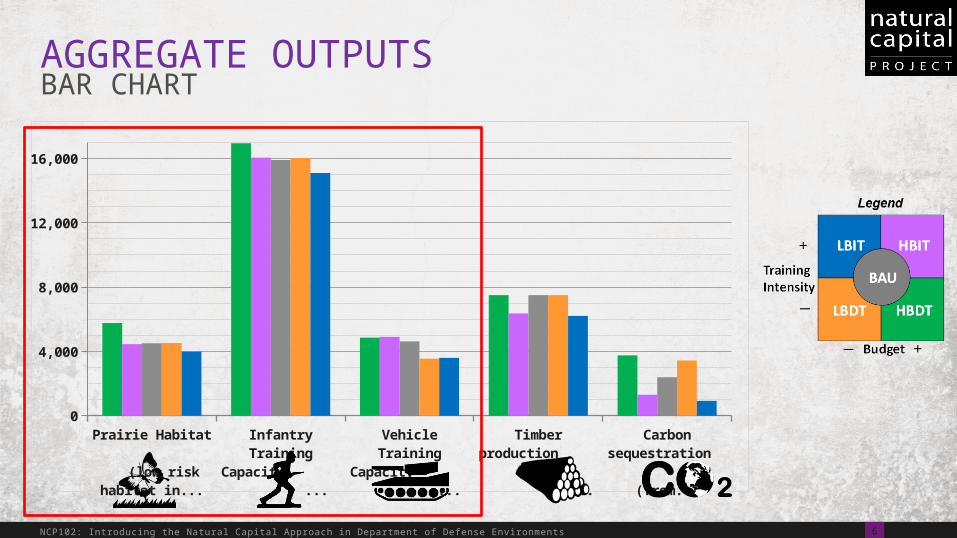
AGGREGATE OUTPUTSBAR CHART
0
4,000
8,000
12,000
16,000
7NCP102: Introducing the Natural Capital Approach in Department of Defense Environments
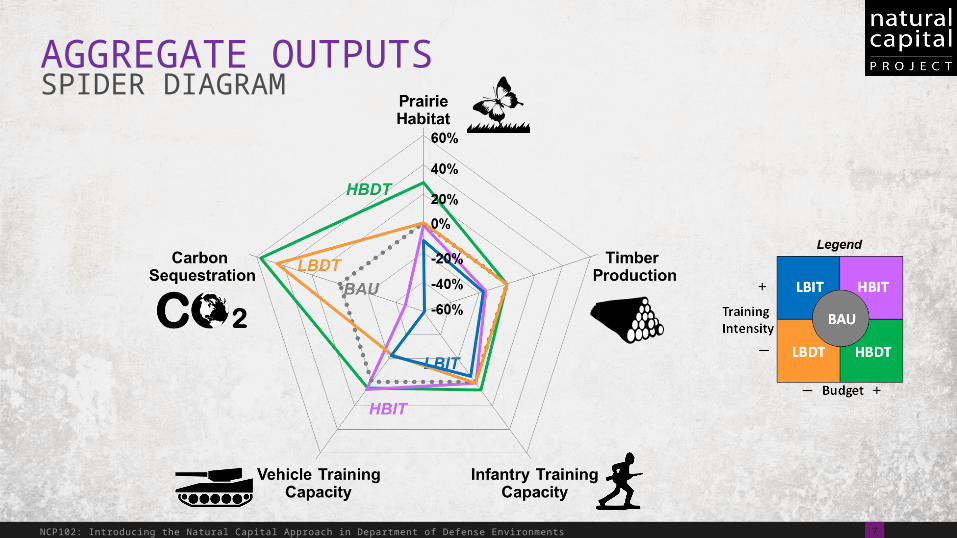
AGGREGATE OUTPUTSSPIDER DIAGRAM
8NCP102: Introducing the Natural Capital Approach in Department of Defense Environments
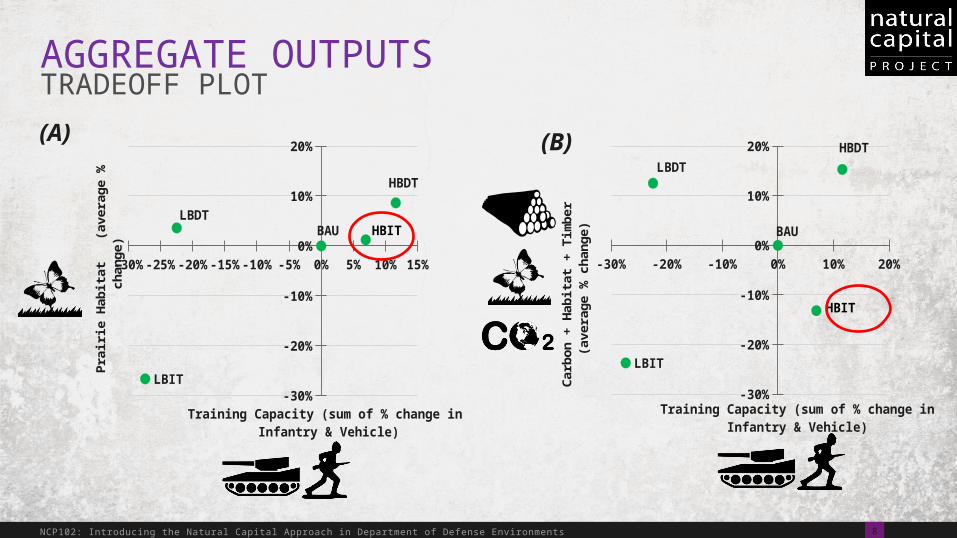
AGGREGATE OUTPUTSTRADEOFF PLOT
-30% -20% -10% 0% 10% 20%
-30%
-20%
-10%
0%
10%
20%
HBDT
HBITBAULBDT
LBIT
Training Capacity (sum of % change in Infantry & Vehicle)
Pra
irie
Habit
at
(a
vera
ge %
ch
ange)
-30% -20% -10% 0% 10% 20%
-30%
-20%
-10%
0%
10%
20% HBDT
HBIT
BAU
LBDT
LBIT
Training Capacity (sum of % change in Infantry & Vehicle)
Carb
on +
Habit
at
+ T
imber
(ave
rage %
change)
(A) (B)
9NCP102: Introducing the Natural Capital Approach in Department of Defense Environments
SPATIALLY EXPLICIT OUTPUTS
10NCP102: Introducing the Natural Capital Approach in Department of Defense Environments
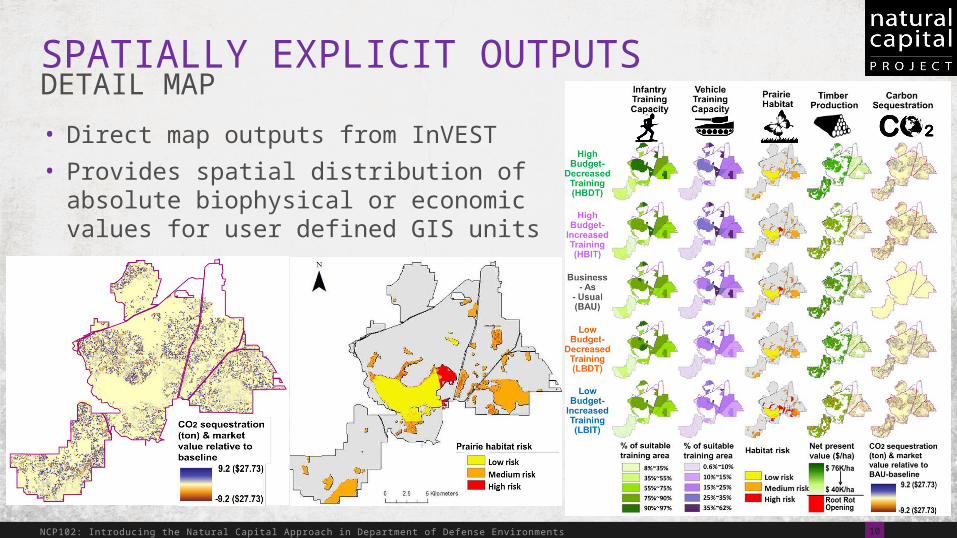
SPATIALLY EXPLICIT OUTPUTSDETAIL MAP
• Direct map outputs from InVEST
• Provides spatial distribution of absolute biophysical or economic values for user defined GIS units
11NCP102: Introducing the Natural Capital Approach in Department of Defense Environments
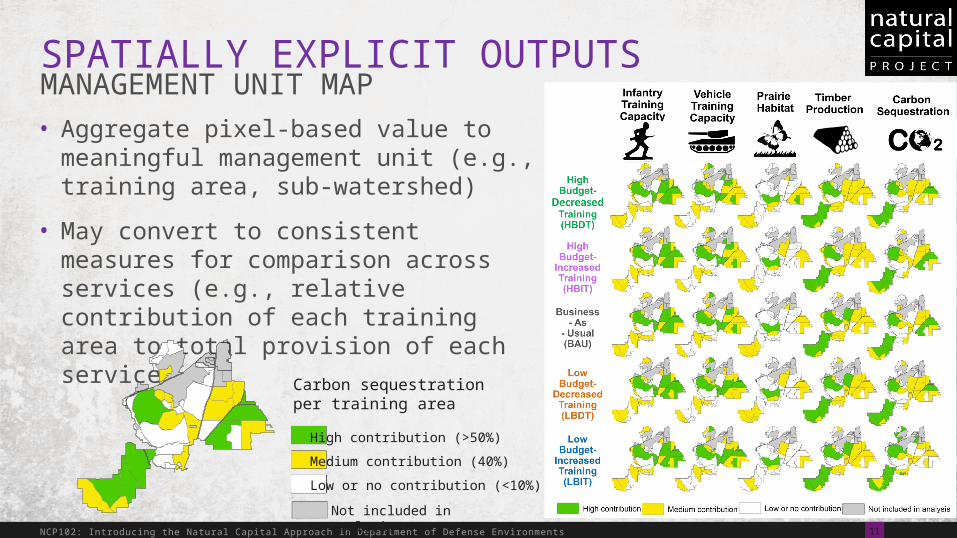
SPATIALLY EXPLICIT OUTPUTSMANAGEMENT UNIT MAP• Aggregate pixel-based value to
meaningful management unit (e.g., training area, sub-watershed)
• May convert to consistent measures for comparison across services (e.g., relative contribution of each training area to total provision of each service)
Carbon sequestration per training area
High contribution (>50%)
Medium contribution (40%)
Low or no contribution (<10%)
Not included in analysis
12NCP102: Introducing the Natural Capital Approach in Department of Defense Environments
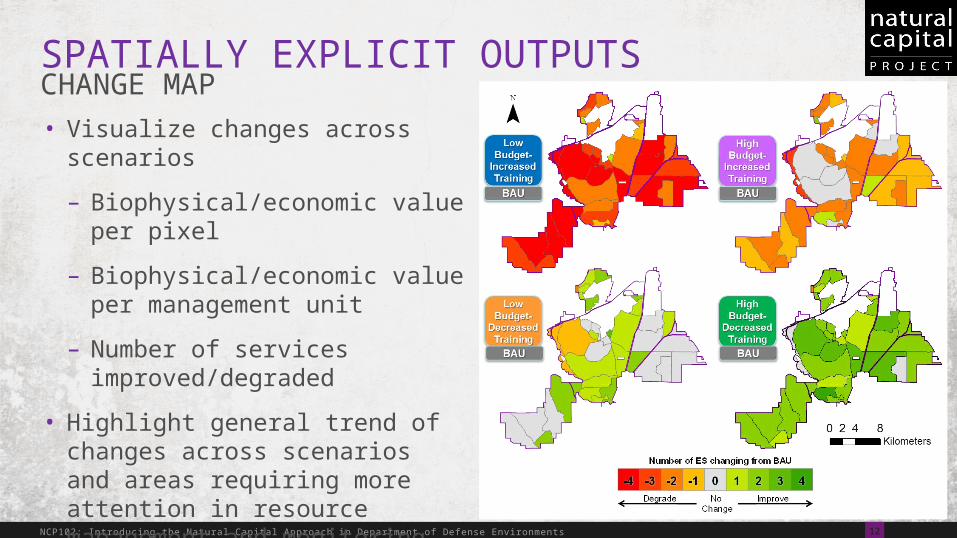
SPATIALLY EXPLICIT OUTPUTSCHANGE MAP• Visualize changes across
scenarios
– Biophysical/economic value per pixel
– Biophysical/economic value per management unit
– Number of services improved/degraded
• Highlight general trend of changes across scenarios and areas requiring more attention in resource management and monitoring.