Embed Size (px)
DESCRIPTION
http://www.aviasg.com/private/uploads/files/docs/2_Enclosure_ASG_GROUP_financial_statementst_audited_2012.pdf
Citation preview
`
AVIA SOLUTIONS GROUP AB Independent Auditor’s Report,
Separate and Consolidated Financial Statements, Consolidated Annual Report
For the Year Ended 31 December 2012
` CONTENTS Pages
INDEPENDENT AUDITOR’S REPORT ............................................................................................................................... 3
STATEMENTS OF COMPREHENSIVE INCOME .............................................................................................................. 5
BALANCE SHEETS................................................................................................................................................................. 7
STATEMENTS OF CHANGES IN EQUITY ......................................................................................................................... 9
STATEMENTS OF CASH FLOWS ...................................................................................................................................... 11
NOTES TO THE FINANCIAL STATEMENTS .................................................................................................................. 13
CONSOLIDATED ANNUAL REPORT .............................................................................................................................. 62
3
4
AVIA SOLUTIONS GROUP AB SEPARATE AND CONSOLIDATED FINANCIAL STATEMENTS FOR THE YEAR ENDED 31 DECEMBER 2012 (All tabular amounts are in LTL ‘000 unless otherwise stated)
5
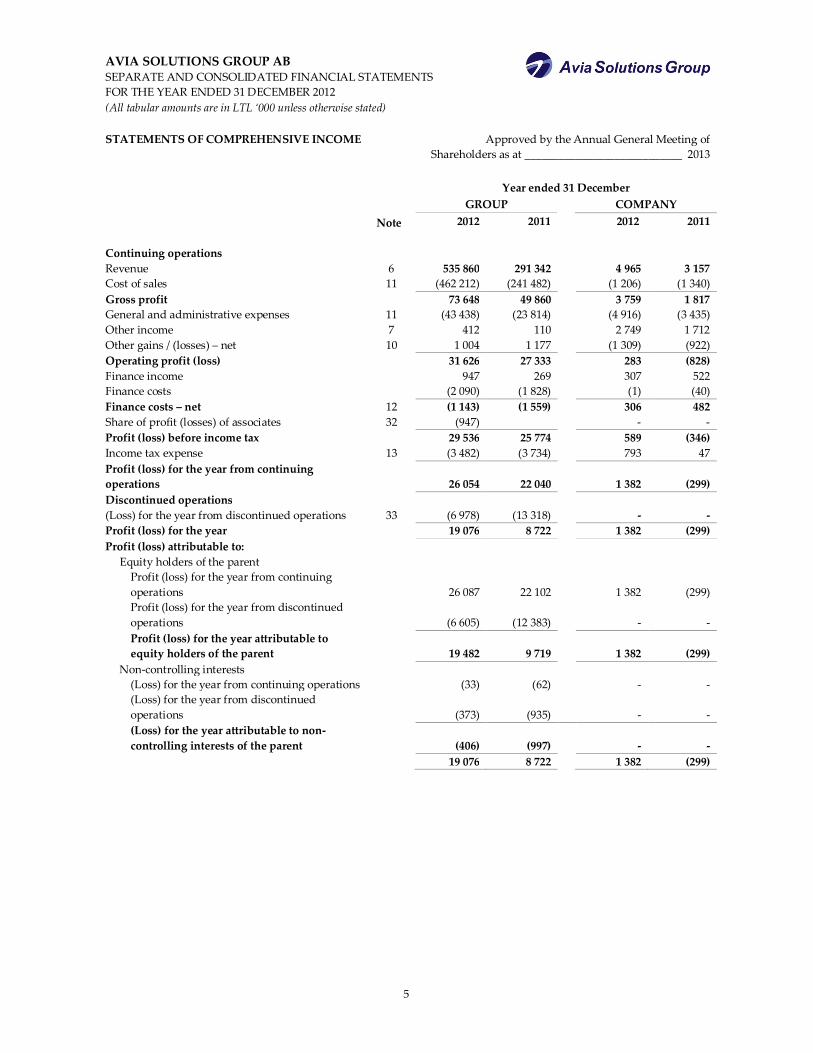
STATEMENTS OF COMPREHENSIVE INCOME Approved by the Annual General Meeting of Shareholders as at ____________________________ 2013
Year ended 31 December GROUP COMPANY Note 2012 2011 2012 2011 Continuing operations Revenue 6 535 860 291 342 4 965 3 157 Cost of sales 11 (462 212) (241 482) (1 206) (1 340) Gross profit 73 648 49 860 3 759 1 817 General and administrative expenses 11 (43 438) (23 814) (4 916) (3 435) Other income 7 412 110 2 749 1 712 Other gains / (losses) – net 10 1 004 1 177 (1 309) (922) Operating profit (loss) 31 626 27 333 283 (828) Finance income 947 269 307 522 Finance costs (2 090) (1 828) (1) (40) Finance costs – net 12 (1 143) (1 559) 306 482 Share of profit (losses) of associates 32 (947) - - Profit (loss) before income tax 29 536 25 774 589 (346) Income tax expense 13 (3 482) (3 734) 793 47 Profit (loss) for the year from continuing operations
26 054 22 040 1 382 (299)
Discontinued operations (Loss) for the year from discontinued operations 33 (6 978) (13 318) - - Profit (loss) for the year 19 076 8 722 1 382 (299) Profit (loss) attributable to: Equity holders of the parent
Profit (loss) for the year from continuing operations
26 087 22 102
1 382 (299)
Profit (loss) for the year from discontinued operations
(6 605) (12 383)
- -
Profit (loss) for the year attributable to equity holders of the parent
19 482 9 719
1 382 (299)
Non-controlling interests (Loss) for the year from continuing operations (33) (62) - - (Loss) for the year from discontinued operations
(373) (935)
- -
(Loss) for the year attributable to non-controlling interests of the parent
(406) (997)
- -
19 076 8 722 1 382 (299)
AVIA SOLUTIONS GROUP AB SEPARATE AND CONSOLIDATED FINANCIAL STATEMENTS FOR THE YEAR ENDED 31 DECEMBER 2012 (All tabular amounts are in LTL ‘000 unless otherwise stated)
6
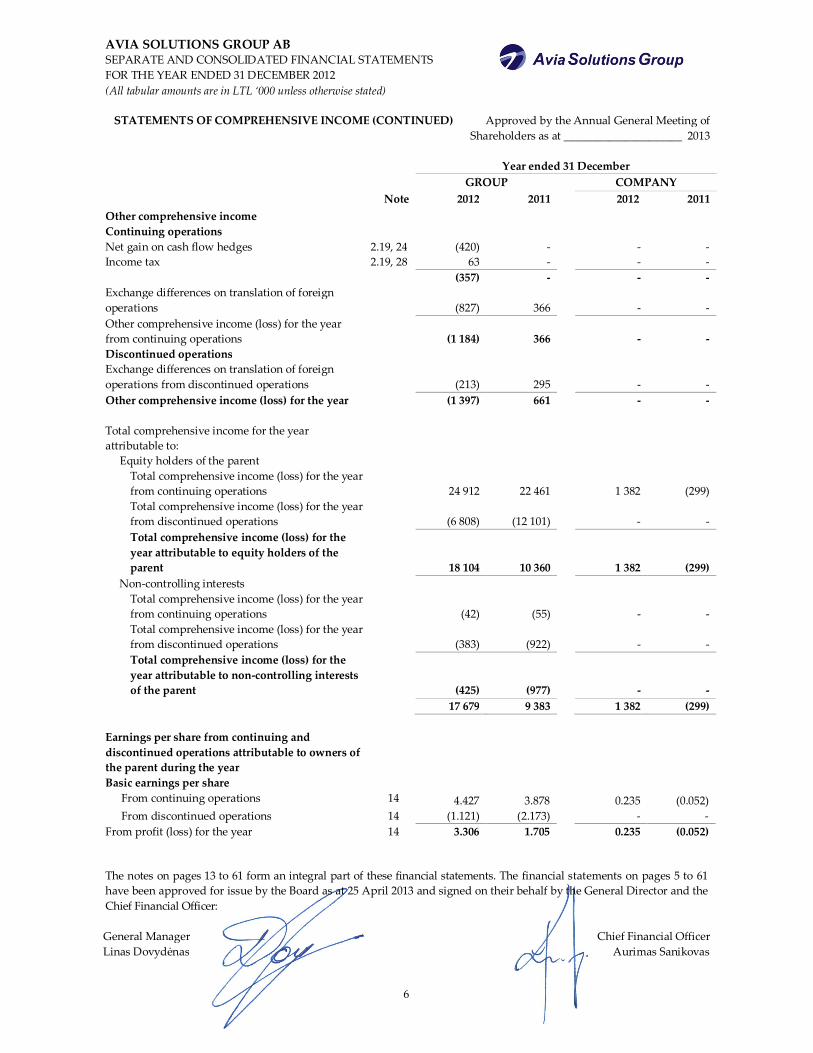
STATEMENTS OF COMPREHENSIVE INCOME (CONTINUED) Approved by the Annual General Meeting of Shareholders as at _____________________ 2013
Year ended 31 December GROUP COMPANY Note 2012 2011 2012 2011 Other comprehensive income Continuing operations Net gain on cash flow hedges 2.19, 24 (420) - - - Income tax 2.19, 28 63 - - - (357) - - - Exchange differences on translation of foreign operations
(827) 366 - -
Other comprehensive income (loss) for the year from continuing operations
(1 184) 366 - -
Discontinued operations Exchange differences on translation of foreign operations from discontinued operations
(213) 295 - -
Other comprehensive income (loss) for the year (1 397) 661 - - Total comprehensive income for the year attributable to:
Equity holders of the parent Total comprehensive income (loss) for the year from continuing operations
24 912 22 461
1 382 (299)
Total comprehensive income (loss) for the year from discontinued operations
(6 808) (12 101)
- -
Total comprehensive income (loss) for the year attributable to equity holders of the parent
18 104 10 360
1 382 (299) Non-controlling interests
Total comprehensive income (loss) for the year from continuing operations
(42) (55)
- -
Total comprehensive income (loss) for the year from discontinued operations
(383) (922)
- -
Total comprehensive income (loss) for the year attributable to non-controlling interests of the parent
(425) (977)
- - 17 679 9 383 1 382 (299)
Earnings per share from continuing and discontinued operations attributable to owners of the parent during the year Basic earnings per share
From continuing operations 14 4.427 3.878 0.235 (0.052) From discontinued operations 14 (1.121) (2.173) - -
From profit (loss) for the year 14 3.306 1.705 0.235 (0.052) The notes on pages 13 to 61 form an integral part of these financial statements. The financial statements on pages 5 to 61 have been approved for issue by the Board as at 25 April 2013 and signed on their behalf by the General Director and the Chief Financial Officer: General Manager Chief Financial Officer Linas Dovydėnas Aurimas Sanikovas
AVIA SOLUTIONS GROUP AB SEPARATE AND CONSOLIDATED FINANCIAL STATEMENTS FOR THE YEAR ENDED 31 DECEMBER 2012 (All tabular amounts are in LTL ‘000 unless otherwise stated)
7
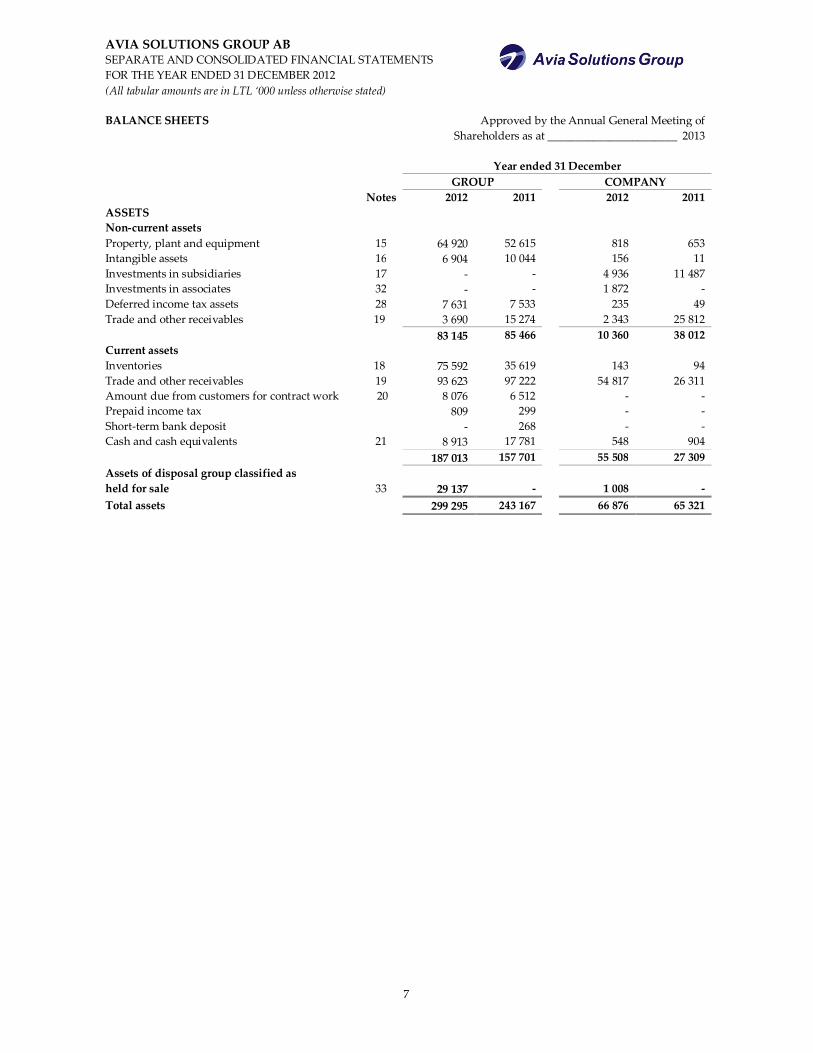
BALANCE SHEETS Approved by the Annual General Meeting of Shareholders as at _______________________ 2013
Year ended 31 December GROUP COMPANY Notes 2012 2011 2012 2011 ASSETS Non-current assets Property, plant and equipment 15 64 920 52 615 818 653 Intangible assets 16 6 904 10 044 156 11 Investments in subsidiaries 17 - - 4 936 11 487 Investments in associates 32 - - 1 872 - Deferred income tax assets 28 7 631 7 533 235 49 Trade and other receivables 19 3 690 15 274 2 343 25 812 83 145 85 466 10 360 38 012 Current assets Inventories 18 75 592 35 619 143 94 Trade and other receivables 19 93 623 97 222 54 817 26 311 Amount due from customers for contract work 20 8 076 6 512 - - Prepaid income tax 809 299 - - Short-term bank deposit - 268 - - Cash and cash equivalents 21 8 913 17 781 548 904 187 013 157 701 55 508 27 309 Assets of disposal group classified as held for sale 33 29 137 - 1 008 - Total assets 299 295 243 167 66 876 65 321
AVIA SOLUTIONS GROUP AB SEPARATE AND CONSOLIDATED FINANCIAL STATEMENTS FOR THE YEAR ENDED 31 DECEMBER 2012 (All tabular amounts are in LTL ‘000 unless otherwise stated)
8
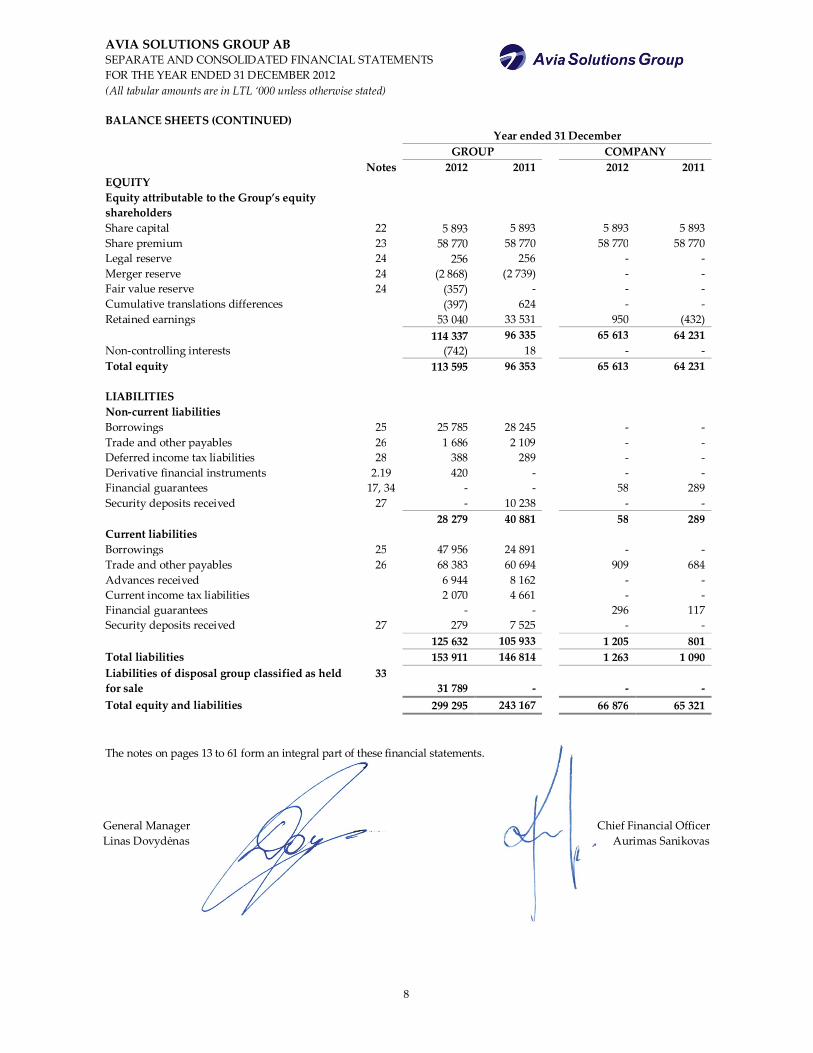
BALANCE SHEETS (CONTINUED) Year ended 31 December
GROUP COMPANY Notes 2012 2011 2012 2011 EQUITY Equity attributable to the Group’s equity shareholders
Share capital 22 5 893 5 893 5 893 5 893 Share premium 23 58 770 58 770 58 770 58 770 Legal reserve 24 256 256 - - Merger reserve 24 (2 868) (2 739) - - Fair value reserve 24 (357) - - - Cumulative translations differences (397) 624 - - Retained earnings 53 040 33 531 950 (432) 114 337 96 335 65 613 64 231 Non-controlling interests (742) 18 - - Total equity 113 595 96 353 65 613 64 231 LIABILITIES Non-current liabilities Borrowings 25 25 785 28 245 - - Trade and other payables 26 1 686 2 109 - - Deferred income tax liabilities 28 388 289 - - Derivative financial instruments 2.19 420 - - - Financial guarantees 17, 34 - - 58 289 Security deposits received 27 - 10 238 - - 28 279 40 881 58 289 Current liabilities Borrowings 25 47 956 24 891 - - Trade and other payables 26 68 383 60 694 909 684 Advances received 6 944 8 162 - - Current income tax liabilities 2 070 4 661 - - Financial guarantees - - 296 117 Security deposits received 27 279 7 525 - - 125 632 105 933 1 205 801 Total liabilities 153 911 146 814 1 263 1 090 Liabilities of disposal group classified as held for sale
33 31 789 - - -
Total equity and liabilities 299 295 243 167 66 876 65 321 The notes on pages 13 to 61 form an integral part of these financial statements. General Manager Chief Financial Officer Linas Dovydėnas Aurimas Sanikovas
AVIA SOLUTIONS GROUP AB SEPARATE AND CONSOLIDATED FINANCIAL STATEMENTS FOR THE YEAR ENDED 31 DECEMBER 2012 (All tabular amounts are in LTL ‘000 unless otherwise stated)
9
STATEMENTS OF CHANGES IN EQUITY Approved by the Annual General Meeting of Shareholders as at ________________________________ 2013
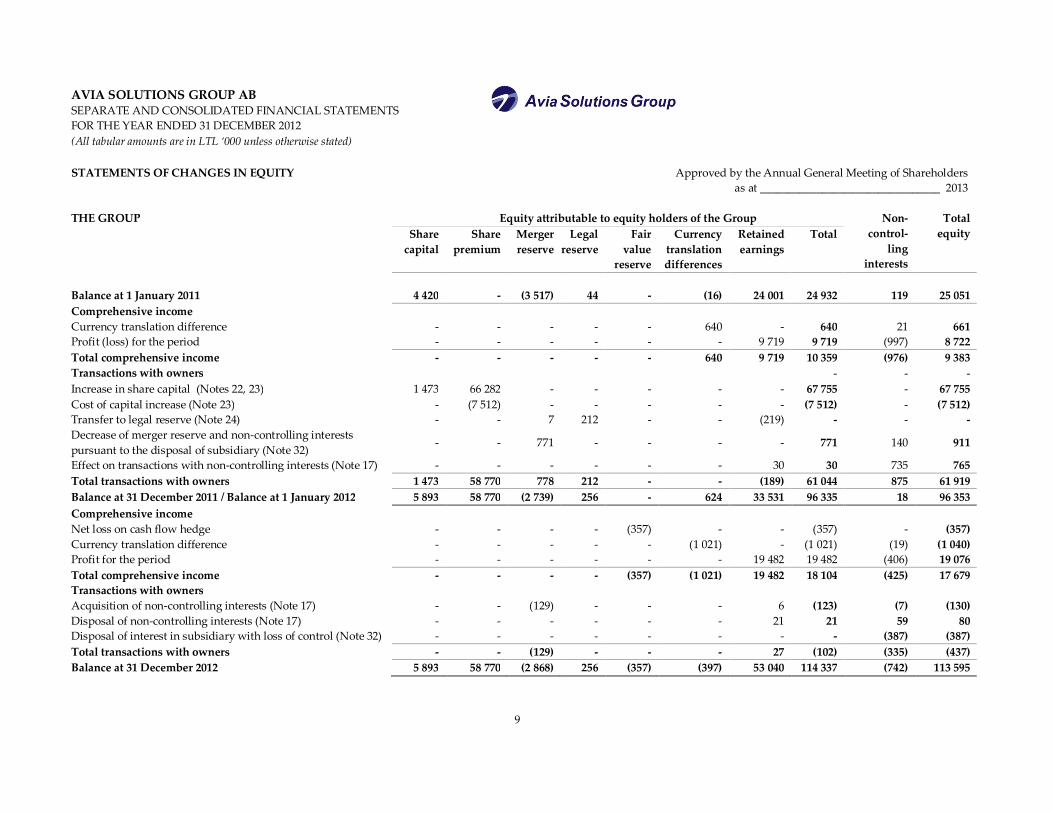
THE GROUP Equity attributable to equity holders of the Group Non-
control-ling
interests
Total equity Share
capital Share
premium Merger reserve
Legal reserve
Fair value
reserve
Currency translation differences
Retained earnings
Total
Balance at 1 January 2011 4 420 - (3 517) 44 - (16) 24 001 24 932 119 25 051 Comprehensive income Currency translation difference - - - - - 640 - 640 21 661 Profit (loss) for the period - - - - - - 9 719 9 719 (997) 8 722 Total comprehensive income - - - - - 640 9 719 10 359 (976) 9 383 Transactions with owners - - - Increase in share capital (Notes 22, 23) 1 473 66 282 - - - - - 67 755 - 67 755 Cost of capital increase (Note 23) - (7 512) - - - - - (7 512) - (7 512) Transfer to legal reserve (Note 24) - - 7 212 - - (219) - - - Decrease of merger reserve and non-controlling interests pursuant to the disposal of subsidiary (Note 32)
- - 771 - - - - 771 140 911
Effect on transactions with non-controlling interests (Note 17) - - - - - - 30 30 735 765 Total transactions with owners 1 473 58 770 778 212 - - (189) 61 044 875 61 919 Balance at 31 December 2011 / Balance at 1 January 2012 5 893 58 770 (2 739) 256 - 624 33 531 96 335 18 96 353 Comprehensive income Net loss on cash flow hedge - - - - (357) - - (357) - (357) Currency translation difference - - - - - (1 021) - (1 021) (19) (1 040) Profit for the period - - - - - - 19 482 19 482 (406) 19 076 Total comprehensive income - - - - (357) (1 021) 19 482 18 104 (425) 17 679 Transactions with owners Acquisition of non-controlling interests (Note 17) - - (129) - - - 6 (123) (7) (130) Disposal of non-controlling interests (Note 17) - - - - - - 21 21 59 80 Disposal of interest in subsidiary with loss of control (Note 32) - - - - - - - - (387) (387) Total transactions with owners - - (129) - - - 27 (102) (335) (437) Balance at 31 December 2012 5 893 58 770 (2 868) 256 (357) (397) 53 040 114 337 (742) 113 595
AVIA SOLUTIONS GROUP AB SEPARATE AND CONSOLIDATED FINANCIAL STATEMENTS FOR THE YEAR ENDED 31 DECEMBER 2012 (All tabular amounts are in LTL ‘000 unless otherwise stated)
10
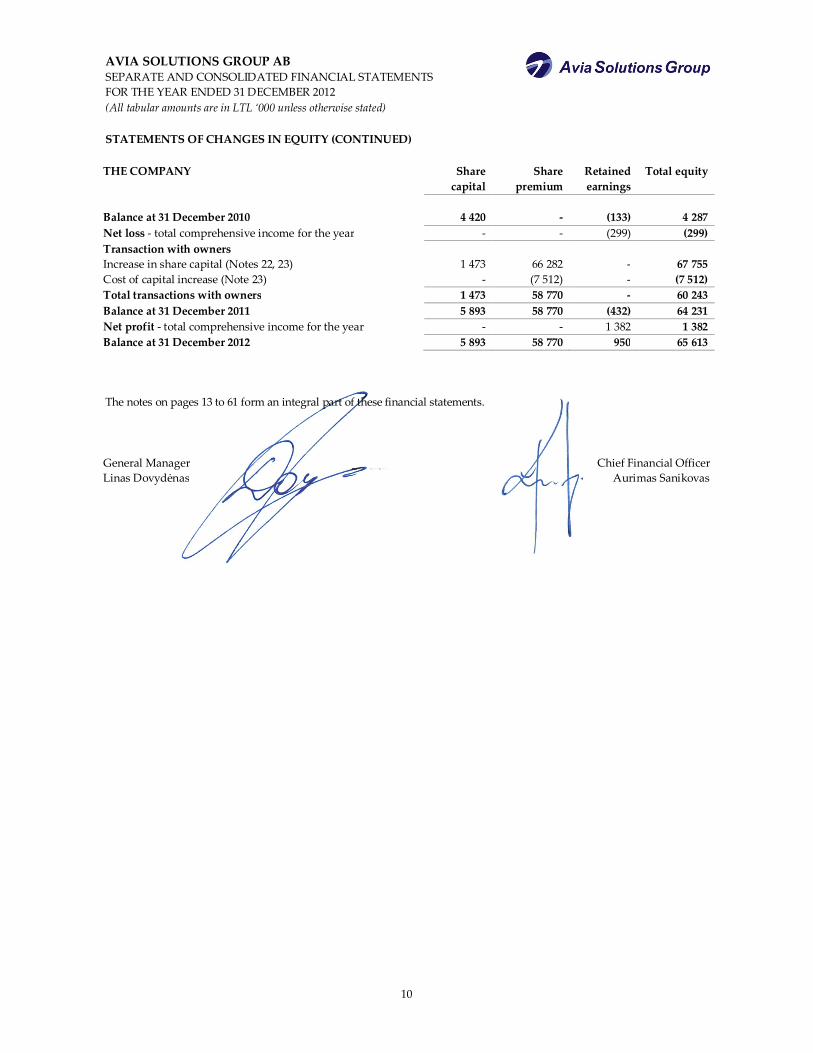
STATEMENTS OF CHANGES IN EQUITY (CONTINUED) THE COMPANY
Share
capital Share
premium Retained earnings
Total equity
Balance at 31 December 2010 4 420 - (133) 4 287 Net loss - total comprehensive income for the year - - (299) (299) Transaction with owners Increase in share capital (Notes 22, 23) 1 473 66 282 - 67 755 Cost of capital increase (Note 23) - (7 512) - (7 512) Total transactions with owners 1 473 58 770 - 60 243 Balance at 31 December 2011 5 893 58 770 (432) 64 231 Net profit - total comprehensive income for the year - - 1 382 1 382 Balance at 31 December 2012 5 893 58 770 950 65 613 The notes on pages 13 to 61 form an integral part of these financial statements. General Manager Chief Financial Officer Linas Dovydėnas Aurimas Sanikovas
AVIA SOLUTIONS GROUP AB SEPARATE AND CONSOLIDATED FINANCIAL STATEMENTS FOR THE YEAR ENDED 31 DECEMBER 2012 (All tabular amounts are in LTL ‘000 unless otherwise stated)
11
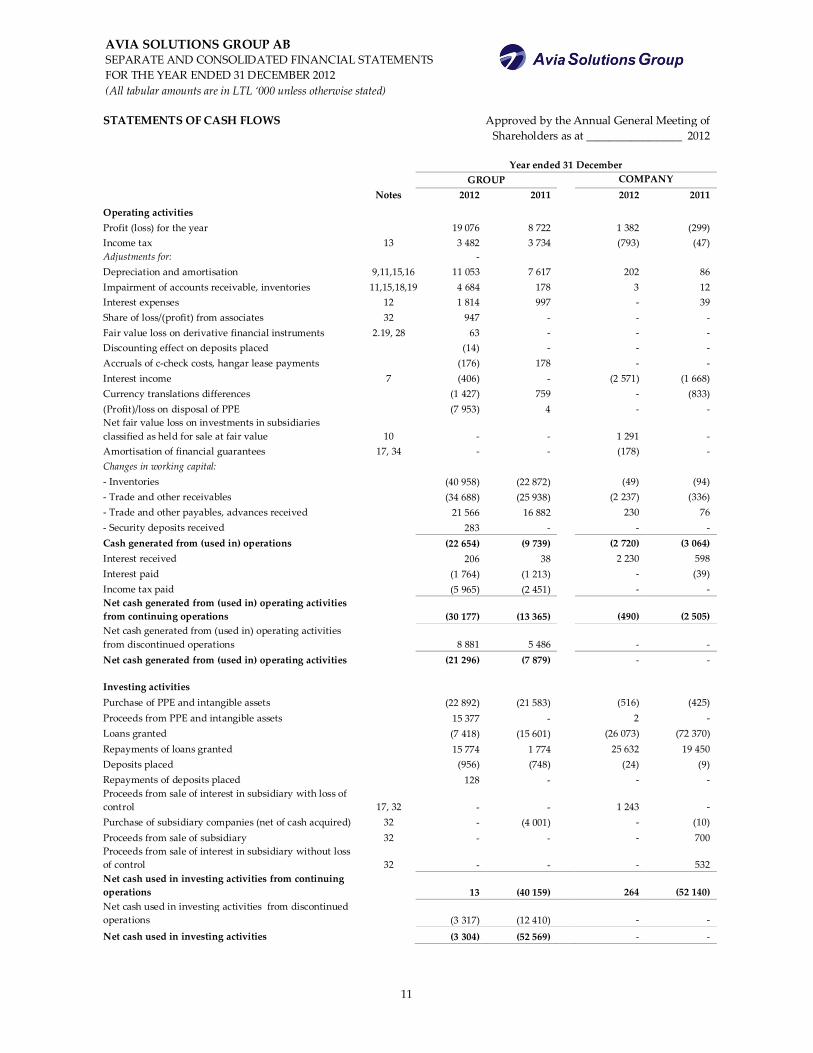
STATEMENTS OF CASH FLOWS Approved by the Annual General Meeting of Shareholders as at _________________ 2012
Year ended 31 December
GROUP COMPANY
Notes 2012 2011 2012 2011
Operating activities Profit (loss) for the year 19 076 8 722 1 382 (299) Income tax 13 3 482 3 734 (793) (47) Adjustments for: - Depreciation and amortisation 9,11,15,16 11 053 7 617 202 86 Impairment of accounts receivable, inventories 11,15,18,19 4 684 178 3 12 Interest expenses 12 1 814 997 - 39 Share of loss/(profit) from associates 32 947 - - - Fair value loss on derivative financial instruments 2.19, 28 63 - - - Discounting effect on deposits placed (14) - - - Accruals of c-check costs, hangar lease payments (176) 178 - - Interest income 7 (406) - (2 571) (1 668) Currency translations differences (1 427) 759 - (833) (Profit)/loss on disposal of PPE (7 953) 4 - - Net fair value loss on investments in subsidiaries classified as held for sale at fair value 10 - - 1 291 - Amortisation of financial guarantees 17, 34 - - (178) - Changes in working capital: - Inventories (40 958) (22 872) (49) (94) - Trade and other receivables (34 688) (25 938) (2 237) (336) - Trade and other payables, advances received 21 566 16 882 230 76 - Security deposits received 283 - - - Cash generated from (used in) operations (22 654) (9 739) (2 720) (3 064) Interest received 206 38 2 230 598 Interest paid (1 764) (1 213) - (39) Income tax paid (5 965) (2 451) - - Net cash generated from (used in) operating activities from continuing operations (30 177) (13 365) (490) (2 505) Net cash generated from (used in) operating activities from discontinued operations 8 881 5 486 - - Net cash generated from (used in) operating activities (21 296) (7 879) - - Investing activities Purchase of PPE and intangible assets (22 892) (21 583) (516) (425) Proceeds from PPE and intangible assets 15 377 - 2 - Loans granted (7 418) (15 601) (26 073) (72 370) Repayments of loans granted 15 774 1 774 25 632 19 450 Deposits placed (956) (748) (24) (9) Repayments of deposits placed 128 - - - Proceeds from sale of interest in subsidiary with loss of control 17, 32 - - 1 243 - Purchase of subsidiary companies (net of cash acquired) 32 - (4 001) - (10) Proceeds from sale of subsidiary 32 - - - 700 Proceeds from sale of interest in subsidiary without loss of control 32 - - - 532 Net cash used in investing activities from continuing operations 13 (40 159) 264 (52 140) Net cash used in investing activities from discontinued operations (3 317) (12 410) - - Net cash used in investing activities (3 304) (52 569) - -
AVIA SOLUTIONS GROUP AB SEPARATE AND CONSOLIDATED FINANCIAL STATEMENTS FOR THE YEAR ENDED 31 DECEMBER 2012 (All tabular amounts are in LTL ‘000 unless otherwise stated)
12
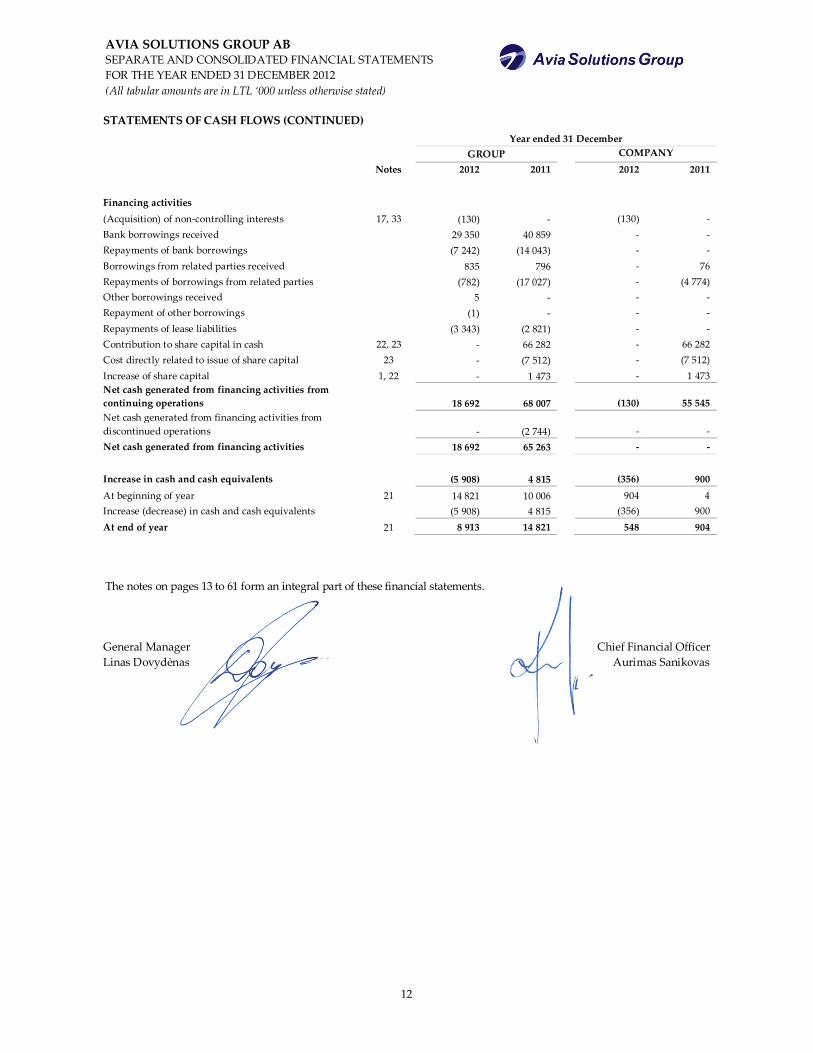
STATEMENTS OF CASH FLOWS (CONTINUED) Year ended 31 December GROUP COMPANY
Notes 2012 2011 2012 2011
Financing activities (Acquisition) of non-controlling interests 17, 33 (130) - (130) - Bank borrowings received 29 350 40 859 - - Repayments of bank borrowings (7 242) (14 043) - - Borrowings from related parties received 835 796 - 76 Repayments of borrowings from related parties (782) (17 027) - (4 774) Other borrowings received 5 - - - Repayment of other borrowings (1) - - - Repayments of lease liabilities (3 343) (2 821) - - Contribution to share capital in cash 22, 23 - 66 282 - 66 282 Cost directly related to issue of share capital 23 - (7 512) - (7 512) Increase of share capital 1, 22 - 1 473 - 1 473 Net cash generated from financing activities from continuing operations 18 692 68 007 (130) 55 545 Net cash generated from financing activities from discontinued operations - (2 744) - - Net cash generated from financing activities 18 692 65 263 - - Increase in cash and cash equivalents (5 908) 4 815 (356) 900 At beginning of year 21 14 821 10 006 904 4 Increase (decrease) in cash and cash equivalents (5 908) 4 815 (356) 900 At end of year 21 8 913 14 821 548 904 The notes on pages 13 to 61 form an integral part of these financial statements. General Manager Chief Financial Officer Linas Dovydėnas Aurimas Sanikovas
AVIA SOLUTIONS GROUP AB SEPARATE AND CONSOLIDATED FINANCIAL STATEMENTS FOR THE YEAR ENDED 31 DECEMBER 2012 (All tabular amounts are in LTL ‘000 unless otherwise stated)
13
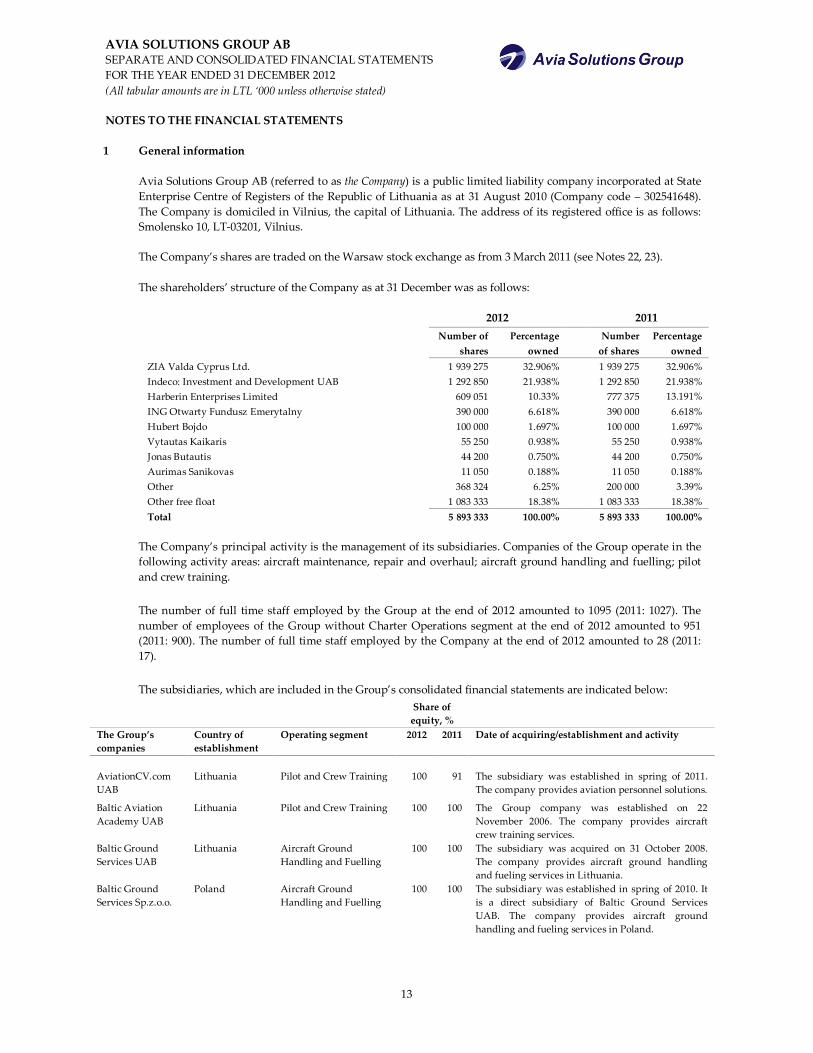
NOTES TO THE FINANCIAL STATEMENTS 1 General information Avia Solutions Group AB (referred to as the Company) is a public limited liability company incorporated at State
Enterprise Centre of Registers of the Republic of Lithuania as at 31 August 2010 (Company code – 302541648). The Company is domiciled in Vilnius, the capital of Lithuania. The address of its registered office is as follows: Smolensko 10, LT-03201, Vilnius.
The Company’s shares are traded on the Warsaw stock exchange as from 3 March 2011 (see Notes 22, 23). The shareholders’ structure of the Company as at 31 December was as follows: 2012 2011 Number of
shares Percentage
owned Number
of shares Percentage
owned ZIA Valda Cyprus Ltd. 1 939 275 32.906% 1 939 275 32.906% Indeco: Investment and Development UAB 1 292 850 21.938% 1 292 850 21.938% Harberin Enterprises Limited 609 051 10.33% 777 375 13.191% ING Otwarty Fundusz Emerytalny 390 000 6.618% 390 000 6.618% Hubert Bojdo 100 000 1.697% 100 000 1.697% Vytautas Kaikaris 55 250 0.938% 55 250 0.938% Jonas Butautis 44 200 0.750% 44 200 0.750% Aurimas Sanikovas 11 050 0.188% 11 050 0.188% Other 368 324 6.25% 200 000 3.39% Other free float 1 083 333 18.38% 1 083 333 18.38% Total 5 893 333 100.00% 5 893 333 100.00%
The Company’s principal activity is the management of its subsidiaries. Companies of the Group operate in the
following activity areas: aircraft maintenance, repair and overhaul; aircraft ground handling and fuelling; pilot and crew training.
The number of full time staff employed by the Group at the end of 2012 amounted to 1095 (2011: 1027). The
number of employees of the Group without Charter Operations segment at the end of 2012 amounted to 951 (2011: 900). The number of full time staff employed by the Company at the end of 2012 amounted to 28 (2011: 17).
The subsidiaries, which are included in the Group’s consolidated financial statements are indicated below:
Share of equity, %
The Group’s companies
Country of establishment
Operating segment 2012 2011 Date of acquiring/establishment and activity
AviationCV.com UAB
Lithuania Pilot and Crew Training 100 91 The subsidiary was established in spring of 2011. The company provides aviation personnel solutions.
Baltic Aviation Academy UAB
Lithuania Pilot and Crew Training
100 100 The Group company was established on 22 November 2006. The company provides aircraft crew training services.
Baltic Ground Services UAB
Lithuania Aircraft Ground Handling and Fuelling
100 100 The subsidiary was acquired on 31 October 2008. The company provides aircraft ground handling and fueling services in Lithuania.
Baltic Ground Services Sp.z.o.o.
Poland Aircraft Ground Handling and Fuelling
100 100 The subsidiary was established in spring of 2010. It is a direct subsidiary of Baltic Ground Services UAB. The company provides aircraft ground handling and fueling services in Poland.
AVIA SOLUTIONS GROUP AB SEPARATE AND CONSOLIDATED FINANCIAL STATEMENTS FOR THE YEAR ENDED 31 DECEMBER 2012 (All tabular amounts are in LTL ‘000 unless otherwise stated)
14
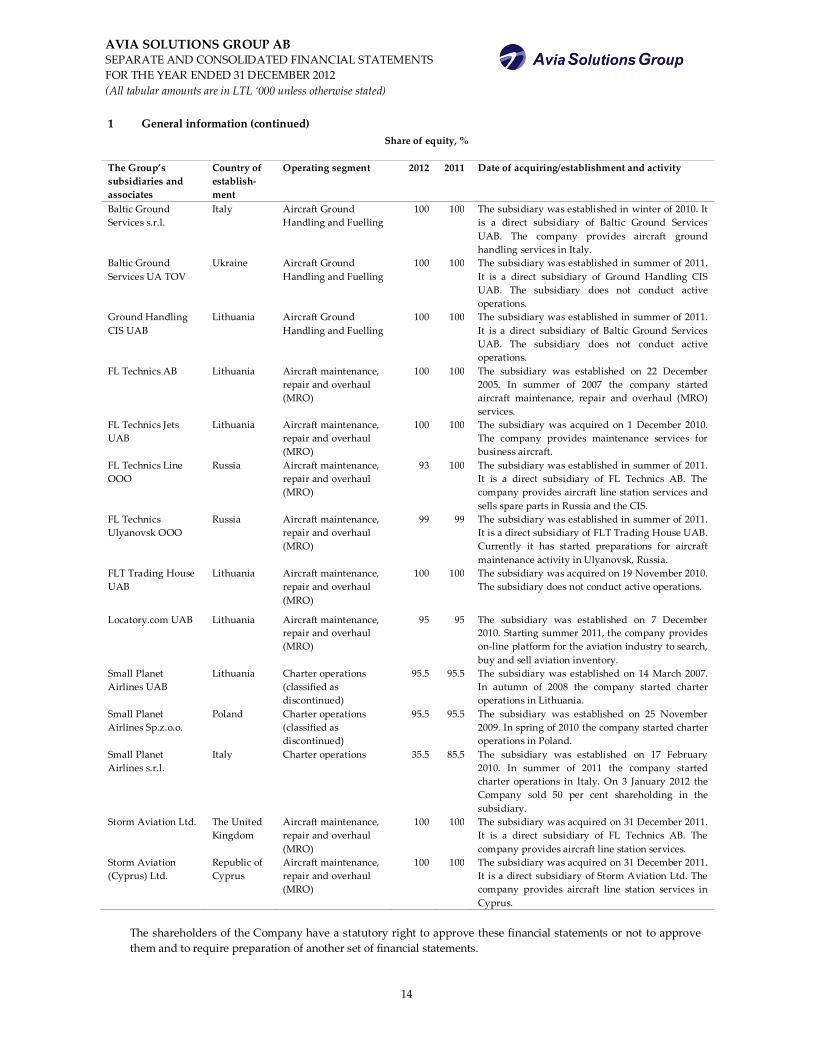
The shareholders of the Company have a statutory right to approve these financial statements or not to approve
them and to require preparation of another set of financial statements.
1 General information (continued) Share of equity, %
The Group’s subsidiaries and associates
Country of establish- ment
Operating segment 2012 2011 Date of acquiring/establishment and activity
Baltic Ground Services s.r.l.
Italy Aircraft Ground Handling and Fuelling
100 100 The subsidiary was established in winter of 2010. It is a direct subsidiary of Baltic Ground Services UAB. The company provides aircraft ground handling services in Italy.
Baltic Ground Services UA TOV
Ukraine Aircraft Ground Handling and Fuelling
100 100 The subsidiary was established in summer of 2011. It is a direct subsidiary of Ground Handling CIS UAB. The subsidiary does not conduct active operations.
Ground Handling CIS UAB
Lithuania Aircraft Ground Handling and Fuelling
100 100 The subsidiary was established in summer of 2011. It is a direct subsidiary of Baltic Ground Services UAB. The subsidiary does not conduct active operations.
FL Technics AB Lithuania Aircraft maintenance, repair and overhaul (MRO)
100 100 The subsidiary was established on 22 December 2005. In summer of 2007 the company started aircraft maintenance, repair and overhaul (MRO) services.
FL Technics Jets UAB
Lithuania Aircraft maintenance, repair and overhaul (MRO)
100 100 The subsidiary was acquired on 1 December 2010. The company provides maintenance services for business aircraft.
FL Technics Line OOO
Russia Aircraft maintenance, repair and overhaul (MRO)
93 100 The subsidiary was established in summer of 2011. It is a direct subsidiary of FL Technics AB. The company provides aircraft line station services and sells spare parts in Russia and the CIS.
FL Technics Ulyanovsk OOO
Russia Aircraft maintenance, repair and overhaul (MRO)
99 99 The subsidiary was established in summer of 2011. It is a direct subsidiary of FLT Trading House UAB. Currently it has started preparations for aircraft maintenance activity in Ulyanovsk, Russia.
FLT Trading House UAB
Lithuania Aircraft maintenance, repair and overhaul (MRO)
100 100 The subsidiary was acquired on 19 November 2010. The subsidiary does not conduct active operations.
Locatory.com UAB Lithuania Aircraft maintenance, repair and overhaul (MRO)
95 95 The subsidiary was established on 7 December 2010. Starting summer 2011, the company provides on-line platform for the aviation industry to search, buy and sell aviation inventory.
Small Planet Airlines UAB
Lithuania Charter operations (classified as discontinued)
95.5 95.5 The subsidiary was established on 14 March 2007. In autumn of 2008 the company started charter operations in Lithuania.
Small Planet Airlines Sp.z.o.o.
Poland Charter operations (classified as discontinued)
95.5 95.5 The subsidiary was established on 25 November 2009. In spring of 2010 the company started charter operations in Poland.
Small Planet Airlines s.r.l.
Italy Charter operations 35.5 85.5 The subsidiary was established on 17 February 2010. In summer of 2011 the company started charter operations in Italy. On 3 January 2012 the Company sold 50 per cent shareholding in the subsidiary.
Storm Aviation Ltd. The United Kingdom
Aircraft maintenance, repair and overhaul (MRO)
100 100 The subsidiary was acquired on 31 December 2011. It is a direct subsidiary of FL Technics AB. The company provides aircraft line station services.
Storm Aviation (Cyprus) Ltd.
Republic of Cyprus
Aircraft maintenance, repair and overhaul (MRO)
100 100 The subsidiary was acquired on 31 December 2011. It is a direct subsidiary of Storm Aviation Ltd. The company provides aircraft line station services in Cyprus.
AVIA SOLUTIONS GROUP AB SEPARATE AND CONSOLIDATED FINANCIAL STATEMENTS FOR THE YEAR ENDED 31 DECEMBER 2012 (All tabular amounts are in LTL ‘000 unless otherwise stated)
15
2 Summary of significant accounting policies The principal accounting policies applied in the preparation of these consolidated financial statements are set out
below. These policies have been consistently applied to all the years presented, unless otherwise stated. 2.1 Basis of preparation
The financial statements have been prepared in accordance with International Financial Reporting Standards (IFRS), as adopted by the EU. The financial statements have been prepared on a going concern basis and under the historical cost convention. These financial statements include the consolidated financial statements of the Group and stand-alone financial statement of the company for the year ended 31 December 2012. The preparation of financial statements in conformity with IFRS requires the use of certain critical accounting estimates. It also requires management to exercise its judgment in the process of applying the Group's accounting policies. The areas involving a higher degree of judgment or complexity, or areas where assumptions and estimates are significant to the consolidated financial statements are disclosed in Note 4. a) New and emended standards and interpretations adopted by the Group and the Company There are no IFRSs or IFRIC interpretations that are effective for the first time for the financial year beginning on or after 1 January 2012 that would be expected to have a material impact on the Group and the Company. (b) Standards, amendments and interpretations to existing standards effective in 2012 but not relevant to the Group and the Company:
Disclosures—Transfers of Financial Assets – Amendments to IFRS 7 (effective for annual periods beginning on or after 1 July 2012). The amendment requires additional disclosures in respect of risk exposures arising from transferred financial assets. The amendment includes a requirement to disclose by class of asset the nature, carrying amount and a description of the risks and rewards of financial assets that have been transferred to another party yet remain on the entity's balance sheet. Disclosures are also required to enable a user to understand the amount of any associated liabilities, and the relationship between the financial assets and associated liabilities. Where financial assets have been derecognised but the entity is still exposed to certain risks and rewards associated with the transferred asset, additional disclosure are required to enable the effects of those risks to be understood. This amendment did not have any impact on the Group’s financial statements.
c) Standards, amendments and interpretations to existing standards that are not yet effective and have not been early adopted by the Group and the Company:
IFRS 9, Financial Instruments: Classification and Measurement. IFRS 9, (issued in November 2009; not yet adopted by the EU), replaces those parts of IAS 39 relating to the classification and measurement of financial assets. IFRS 9 was further amended in October 2010 to address the classification and measurement of financial liabilities and in December 2011 to (i) change its effective date to annual periods beginning on or after 1 January 2015 and (ii) add transition disclosures. The Group and the Company are yet to assess the impact of the standard on its financial statements.
IFRS 10, Consolidated Financial Statements (effective for annual periods beginning on or after 1 January 2014), replaces all of the guidance on control and consolidation in IAS 27 “Consolidated and separate financial statements” and SIC-12 “Consolidation - special purpose entities”. IFRS 10 changes the definition of control so that the same criteria are applied to all entities to determine control. This definition is supported by extensive application guidance. The Group is currently assessing the impact of the standard on its financial statements.
AVIA SOLUTIONS GROUP AB SEPARATE AND CONSOLIDATED FINANCIAL STATEMENTS FOR THE YEAR ENDED 31 DECEMBER 2012 (All tabular amounts are in LTL ‘000 unless otherwise stated)
16
2.1 Basis of preparation (continued)
IFRS 11, Joint Arrangements, (effective for annual periods beginning on or after 1 January 2014), replaces IAS 31 “Interests in Joint Ventures” and SIC-13 “Jointly Controlled Entities—Non-Monetary Contributions by Ventures”. Changes in the definitions have reduced the number of types of joint arrangements to two: joint operations and joint ventures. The existing policy choice of proportionate consolidation for jointly controlled entities has been eliminated. Equity accounting is mandatory for participants in joint ventures. The Group and the Company do not expect this standard to have any material effect on its financial statements.
IFRS 12, Disclosure of Interest in Other Entities, (effective for annual periods beginning on or after 1 January 2014), applies to entities that have an interest in a subsidiary, a joint arrangement, an associate or an unconsolidated structured entity. IFRS 12 sets out the required disclosures for entities reporting under the two new standards: IFRS 10, Consolidated financial statements, and IFRS 11, Joint arrangements, and replaces the disclosure requirements currently found in IAS 28 “Investments in associates”. IFRS 12 requires entities to disclose information that helps financial statement readers to evaluate the nature, risks and financial effects associated with the entity’s interests in subsidiaries, associates, joint arrangements and unconsolidated structured entities. To meet these objectives, the new standard requires disclosures in a number of areas, including (i) significant judgements and assumptions made in determining whether an entity controls, jointly controls, or significantly influences its interests in other entities, (ii) extended disclosures on share of non-controlling interests in group activities and cash flows, (iii) summarised financial information of subsidiaries with material non-controlling interests, and (iv) detailed disclosures of interests in unconsolidated structured entities. The Group and the Company are currently assessing the impact of the standard on its financial statements.
IFRS 13, Fair value measurement, (effective for annual periods beginning on or after 1 January 2013), aims to improve consistency and reduce complexity by providing a revised definition of fair value, and a single source of fair value measurement and disclosure requirements for use across IFRSs. The Group and the Company are currently assessing the impact of the standard on its financial statements.
IAS 27, Separate Financial Statements, (revised in May 2011 and effective for annual periods beginning on or after 1 January 2014). The objective of the revised standard is to prescribe the accounting and disclosure requirements for investments in subsidiaries, joint ventures and associates when an entity prepares separate financial statements. The guidance on control and consolidated financial statements was replaced by IFRS 10, Consolidated Financial Statements. The Group and the Company are currently assessing the impact of the standard on its financial statements.
IAS 28, Investments in Associates and Joint Ventures, (revised in May 2011 and effective for annual periods beginning on or after 1 January 2014). The standard was revised following the issue of IFRS 11 and it now includes the requirements for joint ventures, as well as associates, to be equity accounted. The Group and the Company do not expect this standard to have any material effect on its financial statements.
Amended IAS 19, Employee Benefits, (effective for annual periods beginning on or after 1 January 2013, makes significant changes (i) to the recognition and measurement of defined benefit pension expense and termination benefits, and (ii) to the disclosures for all employee benefits. The standard requires recognition of all changes in the net defined benefit liability (asset) when they occur, as follows: (i) service cost and net interest in profit or loss; and (ii) re-measurements in other comprehensive income. The Group and the Company are currently assessing the impact of the standard on its financial statements.
Presentation of Items of Other Comprehensive Income, amendments to IAS 1, (effective for annual periods beginning on or after 1 July 2012). The amendments require entities to separate items presented in other comprehensive income into two groups, based on whether or not they may be reclassified to profit or loss in the future. The suggested title used by IAS 1 has changed to ‘statement of profit or loss and other comprehensive income’. The Group and the Company expect the amended standard to change presentation of its financial statements, but have no impact on measurement of transactions and balances.
AVIA SOLUTIONS GROUP AB SEPARATE AND CONSOLIDATED FINANCIAL STATEMENTS FOR THE YEAR ENDED 31 DECEMBER 2012 (All tabular amounts are in LTL ‘000 unless otherwise stated)
17
2.1 Basis of preparation (continued)
Recovery of Underlying Assets – Amendment to IAS 12 (effective for annual periods beginning on or after 1 January 2013). The amendment introduces an exception to the existing principle for the measurement of deferred tax assets or liabilities arising on investment property measured at fair value. The Group and the Company do not expect the amendments to have any material effect on its financial statements.
Offsetting Financial Assets and Financial Liabilities - Amendments to IAS 32 (effective for annual periods beginning on or after 1 January 2014). The amendment added application guidance to IAS 32 to address inconsistencies identified in applying some of the offsetting criteria. This includes clarifying the meaning of ‘currently has a legally enforceable right of set-off’ and that some gross settlement systems may be considered equivalent to net settlement. The Group and the Company do not expect the amendments to have any material effect on its financial statements.
Disclosures—Offsetting Financial Assets and Financial Liabilities - Amendments to IFRS 7 (effective for annual periods beginning on or after 1 January 2013). The amendment requires disclosures that will enable users of an entity’s financial statements to evaluate the effect or potential effect of netting arrangements, including rights of set-off. The amendment will have an impact on disclosures but will have no effect on measurement and recognition of financial instruments.
There are no other new or revised standards or interpretations that are not yet effective that would be expected to have a material impact on the Group and the Company.
2.2 Consolidation
Subsidiaries A subsidiary is an entity in which the Group, directly or indirectly, has interest of more than 50% of the shares with voting rights or otherwise has power to govern the operating and financial policies so as to obtain economic benefits. All subsidiaries have been consolidated in the Group’s financial statements. A subsidiary is consolidated from the date on which control is transferred to the Group and is no longer consolidated from the date on which control ceases. The group uses the acquisition method of accounting to account for business combinations. The consideration transferred for the acquisition of a subsidiary is the fair values of the assets transferred, the liabilities incurred and the equity interests issued by the group. The consideration transferred includes the fair value of any asset or liability resulting from a contingent consideration arrangement. Acquisition-related costs are expensed as incurred. Identifiable assets acquired and liabilities and contingent liabilities assumed in a business combination are measured initially at their fair values at the acquisition date. The excess of the consideration transferred the amount of any non-controlling interest in the acquisition and the acquisition-date fair value of any previous equity interest in the acquisition over the fair value of the group’s share of the identifiable net assets acquired is recorded as goodwill. If this is less than the fair value of the net assets of the subsidiary acquired in the case of a bargain purchase, the difference is recognised directly in the statement of comprehensive income. Inter-company transactions, balances and unrealised gains on transactions between entities included within the consolidated financial statements have been eliminated. Disposal of subsidiaries When the Group ceases to have control any retained interest in the entity is remeasured to its fair value at the date when control is lost, with the change in carrying amount recognised in profit or loss. The fair value is the initial carrying amount for the purposes of subsequently accounting for the retained interest as an associate, joint venture or financial asset. In addition, any amounts previously recognised in other comprehensive income in respect of that entity are accounted for as if the Group had directly disposed of the related assets or liabilities. This may mean that amounts previously recognised in other comprehensive income are reclassified to profit or loss.
AVIA SOLUTIONS GROUP AB SEPARATE AND CONSOLIDATED FINANCIAL STATEMENTS FOR THE YEAR ENDED 31 DECEMBER 2012 (All tabular amounts are in LTL ‘000 unless otherwise stated)
18
2.2 Consolidation (continued) Non-controlling interest Non-controlling interest is that part of the net results and of the net assets of a subsidiary, including the fair value adjustments, which is attributable to interests which are not owned, directly or indirectly, by the Group. Non-controlling interest forms a separate component of the Group’s equity. Transactions with non-controlling interest The Group treats transactions with non-controlling interests as transactions with equity owners of the Group. For purchases from non-controlling interests, the difference between any consideration paid and the relevant share acquired of the carrying value of net assets of the subsidiary is recorded in equity. Gains or losses on disposals to non-controlling interests are also recorded in equity.
2.3 Foreign currency translation Functional and presentation currency Items included in the financial statements of each of the Group's entities are measured using the currency of the primary economic environment in which the entity operates ('the functional currency'). The consolidated financial statements are presented in Lithuanian Litas (LTL), which is the functional currency of the Company and the Group. The litas is pegged to the euro at an exchange rate of LTL 3.4528 = EUR 1. Transactions and balances Foreign currency transactions are translated into the functional currency using the exchange rates prevailing at the dates of the transactions or valuation where items are remeasured. Foreign exchange gains and losses resulting from the settlement of such transactions and from the translation at year-end exchange rates of monetary assets and liabilities denominated in foreign currencies are recognised in the statement of comprehensive income. Foreign exchange gains and losses that relate to borrowings, cash and cash equivalents are presented in the statement of comprehensive income within “finance income or cost”. All other foreign exchange gains and losses are presented in the statement of comprehensive income within “other gains / (loss) – net”.
Group companies The results and financial position of all the Group entities (none of which has the currency of a hyper-
inflationary economy) that have a functional currency different from the presentation currency are translated into the presentation currency as follows:
- Assets and liabilities for each balance sheet presented are translated at the closing rate at the date of that balance sheet; - Income and expenses for each income statement are translated at average exchange rates (unless this average is not a reasonable approximation of the cumulative effect of the rates prevailing on the transaction dates, in which case income and expenses are translated at rates prevailing at the dates of the transactions); - All resulting exchange differences are recognised as a separate component of equity.
2.4 Segment information Operating segments are reported in a manner consistent with the internal reporting provided to the Chief
Operating Decision Maker (CODM). The Chief Operating Decision Maker, who is responsible for allocating resources and assessing performance of the operating segments, has been identified as the Board of the Company that makes strategic decisions.
AVIA SOLUTIONS GROUP AB SEPARATE AND CONSOLIDATED FINANCIAL STATEMENTS FOR THE YEAR ENDED 31 DECEMBER 2012 (All tabular amounts are in LTL ‘000 unless otherwise stated)
19
2.5 Property, plant and equipment Property, plant and equipment consist of buildings and structures, vehicles, machinery and other non-current
tangible assets. Property, plant and equipment are carried at their historical cost less any accumulated depreciation and any accumulated impairment loss. Historical cost includes expenditures that are directly attributable to the acquisition of the items.
Subsequent costs are included in the asset's carrying amount or recognised as a separate asset, as appropriate,
only when it is probable that future economic benefits associated with the item will flow to the Group and the cost of the item can be measured reliably. The carrying amount of the replaced part is derecognised. All other repairs and maintenance are charged to the profit or loss during the financial period in which they are incurred. Land is not depreciated. Depreciation is calculated on the straight-line basis to write off the cost of assets to their residual values over their estimated useful life as follows:
Buildings and structures 8 – 22 years Vehicles 5 – 10 years Machinery 5 – 7 years Other non-current tangible assets 3 – 7 years Major additions, modifications and improvements expenditure relating to flight equipment for aircraft leased are
capitalized and depreciated over the remaining lease period of the aircraft. Major improvements performed for leased aircraft are capitalized leasehold improvements and depreciated over the period till the next improvement or during the useful life of certain asset. Leasehold improvements are classified as other non-current tangible assets. The assets’ residual value and useful lives are reviewed periodically and adjusted if appropriate.
Where the carrying amount of an asset is greater than its estimated recoverable amount, it is written down
immediately to its recoverable amount. When property is retired or otherwise disposed, the cost and related depreciation are removed from the financial statements and any related gains or losses are included in the profit or loss.
2.6 Intangible assets Intangible assets expected to provide economic benefit to the Group and the Company in future periods have
finite useful life and are valued at acquisition cost less any accumulated amortisation and any accumulated impairment losses. Amortisation is calculated on the straight-line method to allocate the cost of intangible asset over estimated benefit period as follows:
Licenses Software Web-site costs Other non-current intangible assets
3 - 5 years 3 - 5 years
5 years 1 - 4 years
Acquired computer software licences are capitalised on the basis of the costs incurred to acquire and bring to use
the specific software. Costs associated with developing or maintaining computer software programmes are recognised as an expense as incurred. Costs that are directly associated with the development of identifiable and unique software products controlled by the Group, and that will probably generate economic benefits exceeding costs beyond one year, are recognised as intangible assets.
Directly attributable costs, which are incurred to comply with the requirements of certification authority in order
to obtain the Air Operator‘s Certificate (hereinafter – AOC) are capitalised as part of the commercial license. Such expenses include aircraft basic and supplemental rent expenses, aircraft insurance expenses, preparation of aircraft technical documentation expenses, rent and maintenance of premises expenses, employee related expenses and crew training expenses, that have been incurred during the period of the submission of the application for an initial issue of an AOC and the date of receipt of the AOC.
AVIA SOLUTIONS GROUP AB SEPARATE AND CONSOLIDATED FINANCIAL STATEMENTS FOR THE YEAR ENDED 31 DECEMBER 2012 (All tabular amounts are in LTL ‘000 unless otherwise stated)
20
2.6 Intangible assets (continued) Line maintenance approvals and basic licences for B1/B2 courses are recognised by the Group on the acquisition
date of the entity on the basis of the costs, and classified as part of commercial license. The cost related to acquiring a basic licence for is based on an estimate provided by Group’s Quality Manager of the cost of reaching the status of B1/B2 engineer, including relevant college courses, exams, preparation of application and cost of submission. The cost related to acquiring line maintenance approvals is based on an estimate of the direct costs, including internal audit, application to the authority, travel and external audit and interviews costs.
The costs incurred at each stage in development and operation of Group’s own web-site is recognised as part of
intangible assets. Such expenses include expenses on purchasing or creating content for a web-site, expenses to enable use of the content on the web-site and directly attributable employee related expenses, that have been incurred during the stage of the development of the web-site and additional development of the web-site expenses, that have been incurred during the stage of the operation of the web-site after initial recognition of the intangible assets.
Goodwill Goodwill represents the excess of the cost of an acquisition over the fair value of the Group’s share of the net
identifiable assets of the acquired subsidiary/associate at the date of acquisition. Goodwill on acquisitions of subsidiaries is included in ‘intangible assets’. Goodwill on acquisitions of associates is included in ‘investments in associates’. Separately recognised goodwill is tested annually for impairment and carried at cost less accumulated impairment losses. Impairment losses on goodwill are not reversed. Gains and losses on a disposal of an entity include the carrying amount of goodwill relating to the entity sold. Goodwill is allocated to cash-generating units for the purpose of impairment testing. The allocation is made to those cash-generating units or groups of cash-generating units that are expected to benefit from the business combination in which the goodwill arose.
2.7 Impairment of non-financial assets Assets that are subject to depreciation and amortisation are reviewed for impairment whenever events or changes
in circumstances indicate that the carrying amount may not be recoverable. An impairment loss is recognised for the amount by which the asset‘s carrying amount exceeds its recoverable amount. The recoverable amount is the higher of an asset‘s fair value less costs to sell and value in use. For the purposes of assessing impairment, assets are grouped at the lowest levels for which there are separately identifiable cash flows (cash-generating units). Non-financial assets other than goodwill that suffered impairment are reviewed for possible reversal of the impairment at each reporting date.
2.8 Financial assets The Group classifies its financial assets into one of four measurement categories: loans and receivables, financial
assets at fair value through profit or loss, held to maturity investments and available-for-sale financial assets. The classification depends on the purpose for which the financial assets were acquired. Management determines the classification of its financial assets at initial recognition. During the current period the Group did not hold any financial assets at fair value through profit or loss, held to maturity investments and available-for-sale financial assets.
Loans and receivables Loans and receivables are non-derivative financial assets with fixed or determinable payments that are not quoted
in an active market. They are included in current assets, except for maturities greater than 12 months after the balance sheet date. These are classified as non-current assets. Loans and receivables are classified as ‘trade and other receivables’ in the balance sheet. The Group assesses at each balance sheet date whether there is objective evidence that a financial assets is impaired. Impairment testing of trade receivables is described in Note 3.1.
AVIA SOLUTIONS GROUP AB SEPARATE AND CONSOLIDATED FINANCIAL STATEMENTS FOR THE YEAR ENDED 31 DECEMBER 2012 (All tabular amounts are in LTL ‘000 unless otherwise stated)
21
2.9 Investments in subsidiaries and associates in the separate financial statements of the Company
Investments in subsidiaries that are included in the separate financial statements of the Company are accounted at cost less impairment provision. Cost is adjusted to reflect changes in consideration arising from contingent consideration amendments.
2.10 Investments in associates in the consolidated financial statements of the Group The Group’s investments in its associates are accounted for using the equity method of accounting. An associate
is an entity in which the Group has significant influence and which is neither a subsidiary nor a joint venture. Under the equity method, the investment in the associate is carried in the consolidated statement of financial position at cost plus post acquisition changes in the Group’s share of net assets of the associate. The income statement reflects the share of the results of operations of the associate. The reporting dates of the associate and the Group are identical and the associate’s accounting policies conform to those used by the Group for like transactions and events in similar circumstances. After application of the equity method, the Group determines whether it is necessary to recognise an additional impairment loss of the Group’s investment in its associates. The Group determines at each reporting date whether there is any objective evidence that the investment in associate is impaired. If this is the case the Group calculates the amount of impairment as being the difference between the fair value of the associate and the acquisition cost and recognises the amount in the income statement. When the group’s share of losses in an associate equals or exceeds its interest in the associate, including any other unsecured receivables, the group does not recognise further losses, unless it has incurred obligations or made payments on behalf of the associate. If the ownership interest in an associate is reduced but significant influence is retained, only a proportionate share of the amounts previously recognised in other comprehensive income are reclassified to profit or loss where appropriate.
Upon loss of significant influence over the associate, the Group measures and recognises any retaining
investment at its fair value. Any difference between the carrying amount of the associate upon loss of significant influence and the fair value of the retaining investment and proceeds from disposal is recognised in profit or loss.
2.11 Non-current assets (or disposal groups) held-for-sale and discontinued operations
Non-current assets (or disposal groups) are classified as assets held for sale when their carrying amount is to be recovered principally through a sale transaction and a sale is considered highly probable. They are stated at the lower of carrying amount and fair value less costs to sell if their carrying amount is to be recovered principally through a sale transaction rather than through continuing use. In the consolidated income statement of the reporting period and of the comparable period of the previous year, income and expenses from discontinued operations are reported separately from income and expenses from continuing activities, down to the level of profit after taxes, even when the Group retains a non-controlling interest in the subsidiary after the sale. The resulting profit or loss (after taxes) is reported separately in the income statement. Where a disposal group is still operating, transactions may occur between the disposal group and other companies within the Group. All intra-group balances, intra-group interest income, expenses and other intra-group transactions where goods are sold / purchased between the disposal group and the continuing business are eliminated in full. The principle of elimination of intra-group sales transactions is based on the guidance in IAS 35 which only allowed expenses to be attributed to the discontinuing operation if they would be eliminated when the operation is disposed of. If the arrangement is expected to continue, the sales and costs are recorded in continuing operations and, therefore, the elimination entries are recorded in discontinued operations.
AVIA SOLUTIONS GROUP AB SEPARATE AND CONSOLIDATED FINANCIAL STATEMENTS FOR THE YEAR ENDED 31 DECEMBER 2012 (All tabular amounts are in LTL ‘000 unless otherwise stated)
22
2.12 Inventories Inventories are stated at the lower of cost and net realizable value. Cost is determined using the first-in, first-out
(FIFO) method. The cost of inventories comprises purchase price, taxes (other than those subsequently recoverable by the Group from the tax authorities), transport, handling and other costs directly attributable to the acquisition of inventories. Net realizable value is the estimate of the selling price in the ordinary course of business, less the applicable selling expenses. Inventories that are no longer appropriate for sale are written off.
2.13 Trade receivables Trade receivables are recognized initially at fair value and subsequently measured at amortized cost using the
effective interest method, less provision for impairment. A provision for impairment of trade receivables is established when there is objective evidence that the Group will not be able to collect all amounts due according to the original terms of receivables. Significant financial difficulties of the debtor, probability that the debtor will enter bankruptcy or financial reorganization and default or delinquency in payments are considered indicators that the trade receivable is impaired. The amount of the provision is the difference between the asset’s carrying amount and the present value of estimated future cash flows, discounted at the effective interest rate. The carrying amount of the asset is reduced through the use of an allowance account, and the amount of the loss is recognized in the profit or loss. When a trade receivable is uncollectible, it is written off against the allowance account for trade receivables. Subsequent recoveries of amounts previously written off are credited against in the profit or loss.
2.14 Cash and cash equivalents Cash and cash equivalents includes cash in hand, deposits held at call with banks, other short-term highly liquid
investments with original maturities of three months or less. Bank overdrafts are shown within borrowings in current liabilities on the balance sheet. Bank overdrafts are subtracted from the cash and cash equivalents in the consolidated statements of cash flows.
2.15 Share capital Ordinary shares are stated at their par value and classified as equity.
Where the Company or its subsidiaries purchase the Company‘s equity share capital (treasury shares), in the
Company‘s and the Group‘s financial statements the consideration paid, including any directly attributable incremental costs (net of income taxes), is deducted from equity attributable to the Company‘s equity holders until the shares are cancelled or reissued. Where such shares are subsequently reissued, any consideration received, net of any directly attributable incremental transaction cost and the related income tax effects, is included in equity attributable to the Company‘s equity holders. Incremental costs directly attributable to the issue of new ordinary shares are shown in equity as a deduction, net of tax, from the proceeds.
2.16 Trade payables Trade payables are obligations to pay for goods or services that have been acquired in ordinary course of
business. Accounts payable are classified as current liabilities if payment is due within one year or less. If not, they are presented as non-current liabilities. Trade payables are recognized initially at fair value and subsequently measured at amortized cost using the effective interest method.
AVIA SOLUTIONS GROUP AB SEPARATE AND CONSOLIDATED FINANCIAL STATEMENTS FOR THE YEAR ENDED 31 DECEMBER 2012 (All tabular amounts are in LTL ‘000 unless otherwise stated)
23
2.17 Borrowings Borrowings are recognised initially at fair value, net of transaction costs incurred. Borrowings are
subsequently stated at amortised cost; any difference between the proceeds (net of transaction costs) and the redemption value is recognised in the profit or loss over the period of the borrowings using the effective interest method. Borrowings are classified as current liabilities unless the Group has an unconditional right to defer settlement of the liability for at least 12 months after the balance sheet date.
Borrowing costs that are directly attributable to the acquisition of a qualifying asset are capitalised as part of the
cost of that asset during the period of time that is required to complete and prepare the asset for its intended use. Other borrowing costs are expensed. The capitalising of borrowing costs ceases when substantially all the activities necessary to prepare the qualifying asset for its intended use are complete.
2.18 Provisions Provisions are recognised when the Group has a present legal or constructive obligation as a result of past events,
it is probable that an outflow of resources will be required to settle the obligation and a reliable estimate of the amount can be made. Where the Group expects a provision to be reimbursed, the reimbursement is recognised as a separate asset but only when the reimbursement is virtually certain.
Provisions are measured at the present value of the expenditures expected to be required to settle the obligation using a pre-tax rate that reflects current market assessments of the time value of money and the risks specific to the obligation. The increase in the provision due to passage of time is recognised as interest expense.
2.19 Derivative financial instruments and hedge accounting
The Group uses derivative financial instruments such as interest rate swaps to hedge its cash flow interest rate risks. Such derivative financial instruments are initially recognised at fair value on the date on which a derivative contract is entered into and are subsequently re-measured at fair value. Derivatives are carried as financial assets when the fair value is positive and as financial liabilities when the fair value is negative. The portion of the gain or loss on the hedging instrument designated as a cash flow hedge is recognised directly in as other comprehensive income in the cash flow hedge reserve. Fair value of derivatives in the balance sheet are segregated to long-term and short-term parts:
- long-term part of the financial instrument represent discounted cash flows arising from the financial instrument after 1 year, and
- short-term part of the financial instrument represents discounted cash flows arising from the financial instrument within 1 year.
2.20 Grants relating to expenses and purchase of property, plant and equipment Grants are recognised at their fair value where there is a reasonable assurance that the grant will be received and
the Group will comply with all attached conditions. Grants relating to the purchase of property, plant and equipment are included in non-current liabilities and are credited to the profit or loss on a straight-line basis over the expected lives of the related assets. Grants relating to the expenses are included in non-current liabilities and are credited to the profit or loss on basis to match the appropriate expenses.
AVIA SOLUTIONS GROUP AB SEPARATE AND CONSOLIDATED FINANCIAL STATEMENTS FOR THE YEAR ENDED 31 DECEMBER 2012 (All tabular amounts are in LTL ‘000 unless otherwise stated)
24
2.21 Accounting for leases a) Accounting for leases where the Group is the lessee Operating leases Leases in which a significant portion of the risks and rewards of ownership are retained by the lessor are classified
as operating leases. Payments made under operating leases (net of any incentives received from the lessor) are charged to the profit or loss on a straight-line basis over the period of the lease.
Finance leases Leases of property, plant and equipment where the Group has substantially all the risks and rewards of ownership
are classified as finance leases. Finance leases are capitalised at the lease’s commencement at the lower of the fair value of the leased property and the present value of the minimum lease payments. Each lease payment is allocated between the liability and finance charges so as to achieve a constant rate on the finance balance outstanding. The corresponding rental obligations, net of finance charges, are included in long-term payables except for instalments due within 12 months which are included in current liabilities.
The property, plant and equipment acquired under finance leases are depreciated over the shorter of the asset’s
useful life and the lease term.
b) Accounting for leases where the Group is the sub - lessor Rental income from operating sub – lease is recognized on a straight-line basis over the period of the lease. c) Accounting for leases where the Group is the lessor Operating leases When assets are leased out under an operating lease, the asset is included in the balance sheet based on the nature
of the asset. They are depreciated over their expected useful lives on a basis consistent with similar assets. Lease income is recognised over the term of the lease on a straight-line basis.
2.22 Current and deferred income tax The tax expenses for the period comprise current and deferred tax. Tax is recognised in the profit or loss, except to
the extent that it relates to items recognised in other comprehensive income or directly in equity. In this case, the tax is also recognised in other comprehensive income or directly in equity, respectively.
Deferred income tax is recognised, using the liability method, on temporary differences arising between the tax
bases of assets and liabilities and their carrying amounts in the financial statements. Deferred income tax is determined using tax rates (and laws) that have been enacted or substantially enacted by the balance sheet date and are expected to apply when the related deferred income tax asset is realised or the deferred income tax liability is settled.
Profit for 2012 is taxable at a rate of 15% (2011: 15%) in accordance with Lithuanian regulatory legislation on taxation. Profit for 2012 is taxable at a rate of 19% (2011: 19%) in accordance with Polish regulatory legislation on taxation. Profit for 2012 is taxable at a rate of 19% (2011: 19%) in accordance with Ukrainian regulatory legislation on taxation. Profit for 2012 is taxable at a rate of 20% (2011: 26%) in accordance with United Kingdom regulatory legislation on taxation. Profit for 2012 is taxable at a rate of 20% (2011: 20%) in accordance with Russian regulatory legislation on taxation. Profit for 2011 is taxable at a rate of 27.5% in accordance with Italian regulatory legislation on taxation
The current income tax charge is calculated and accrued for in the financial statements on the basis of information
available at the moment of the preparation of the financial statements and estimates of income tax performed by the management in accordance with legislation on taxation in the country where the Group operates.
AVIA SOLUTIONS GROUP AB SEPARATE AND CONSOLIDATED FINANCIAL STATEMENTS FOR THE YEAR ENDED 31 DECEMBER 2012 (All tabular amounts are in LTL ‘000 unless otherwise stated)
25
2.22 Current and deferred income tax (continued) Deferred income tax assets are recognised only to the extent that it is probable that future taxable profit will be
available against which the temporary differences and unused tax losses can be utilised. According to Lithuanian and British legislation, tax losses accumulated as of 31 December 2012 are carried
forward indefinitely; according to Polish legislation, tax losses accumulated as of 31 December 2012 are carried forward during 5 years. Tax losses can be carried forward for indefinite period, except for the losses incurred as a result of disposal of securities and/or derivative financial instruments. Such carrying forward is disrupted if the Company changes its activities due to which these losses incurred except when the Company does not continue its activities due to reasons which do not depend on the Company itself. The losses from disposal of securities and/or derivative financial instruments can be carried forward for 5 consecutive years and only be used to reduce the taxable income earned from the transactions of the same nature.
Deferred tax assets and liabilities are offset only if the Group has a legally enforceable right to set off current tax
assets against current tax liabilities and only if the deferred tax assets and deferred tax liabilities relate to income taxes levied by the same taxation authority.
2.23 Revenue recognition Revenue comprises the fair value of the consideration received or receivable for the sale of goods and services in
the ordinary course of the Group’s activities. Revenue of the Group is shown net of value-added tax, returns, rebates and discounts, sales taxes. Revenue is recognised when the amount of revenue can be reliably measured, it is probable that future economic benefits will flow to the entity and specific criteria have been met for each of the Group’s activities as described below. The amount of revenue is not considered to be reliably measurable until all contingencies relating to the sale have been resolved. The Group bases its estimates on historical results, taking into consideration the type of customer, the type of transaction and the specifics of each arrangement.
Sales of services Revenue of the Group consists of passenger’s revenue (discontinued operations), aircraft and aircraft components
maintenance and overhaul, training of aviation specialists, technical consulting, aircraft ground handling services, into-plane fuelling and web-site subscription services.
Passengers’ revenue, aircraft ground handling and into-plane fuelling revenue is recognized as earned, - upon
completion of the air transportation or upon delivery of services to the customer. Aircraft and aircraft components maintenance, training and technical consulting, web-site subscription services
are provided to the customers on time and material basis or as a fixed-price contract, with contract generally ranging from less than one year (single contract) to the long-term contract. Revenue from fixed-price contracts is recognized under the service period. Under this method, revenue is generally recognized in proportion to each service month.
Revenue from fixed-price contracts is recognised under the percentage-of-completion method. Under this method, revenue is generally recognised based on the services performed to date as a percentage of the total services to be performed. Stage of completion is determined with a reference to the proportion that man hours worked to date bear to the estimated total man hours per contract.
AVIA SOLUTIONS GROUP AB SEPARATE AND CONSOLIDATED FINANCIAL STATEMENTS FOR THE YEAR ENDED 31 DECEMBER 2012 (All tabular amounts are in LTL ‘000 unless otherwise stated)
26
2.23 Revenue recognition (continued) Sales of goods Sales of goods are recognised when goods are delivered to the customer, the customer has full discretion over the
use of the products, and there is no unfulfilled obligation that could affect the customer’s acceptance of the products. Delivery does not occur until the products have been shipped to the specified location, the risks of obsolescence and loss have been transferred to the customer, and either the customer has accepted the products in accordance with the sales contract, the acceptance provisions have lapsed, or the Group have objective evidence that all criteria for acceptance have been satisfied.
Interest income Interest income is recognized on a time-proportion basis using the effective interest method. When a receivable is
impaired, the Group reduces the carrying amount to its recoverable amount, being the estimated future cash flow discounted at original effective interest rate of the instrument, and continues unwinding the discount as interest income. Interest income on loans granted are classified as „other income”, while interest income on cash and cash equivalents are classified as „finance income” in the consolidated statement of comprehensive income.
2.24 Employee benefits Social security contributions The Group pays social security contributions to the state Social Security Fund (the Fund) on behalf of its
employees based on the defined contribution plan in accordance with the local legal requirements. A defined contribution plan is a plan under which the Group pays fixed contributions into the Fund and will have no legal or constructive obligations to pay further contributions if the Fund does not hold sufficient assets to pay all employees benefits relating to employee service in the current and prior period. The social security contributions are recognized as an expense on an accrual basis and are included within employee related expenses.
Bonus plans The Group recognises a liability and an expense for bonuses based on predefined targets. The Group recognises
related liability where contractually obliged or where there is a past practice that has created a constructive obligation.
Supplementary health insurance The Group paid supplementary health insurance contributions to the insurance company on behalf of its
employees. Supplementary health insurance for employees is the possibility to get health care and health improvement services in a selected health care institution. The supplementary health insurance contributions are recognized as an expense when incurred.
Termination benefits Termination benefits are payable whenever an employee’s employment is terminated before the normal
retirement date or whenever an employee accepts voluntary redundancy in exchange for these benefits. The Group recognises termination benefits when it is demonstrably committed to either terminate the employment of current employees according to a detailed formal plan without possibility of withdrawal or to provide termination benefits as a result of an offer made to encourage voluntary redundancy. Benefits falling due more than 12 months after balance sheet date are discounted to present value.
AVIA SOLUTIONS GROUP AB SEPARATE AND CONSOLIDATED FINANCIAL STATEMENTS FOR THE YEAR ENDED 31 DECEMBER 2012 (All tabular amounts are in LTL ‘000 unless otherwise stated)
27
2.25 Financial guarantee contracts Financial guarantee contracts issued by the Group are those contracts that require a payment to be made to
reimburse the holder for a loss it incurs because the specified debtor fails to make a payment when due in accordance with the terms of a debt instrument. Financial guarantee contracts are recognised as financial liabilities at the date the guarantee is issued. Liabilities arising from financial guarantee contracts are initially recognised at fair value and subsequently measured at the higher of the expected liability under the guarantee and the amount initially recognised less any cumulative amortisation. The Company, issuer of an intra-group financial guarantee, recognizes the guarantee liability at its fair value. Where parent entity guarantees the debt of its subsidiary then that transaction is accounted for as an investment in subsidiary as the guarantee is given for the benefit of the subsidiary. Subsequent amortisation and any change in the carrying amount of the liability are recognised in profit or loss. The fair value of the financial guarantee is determined the estimated amount that would be payable to a third party for assuming the obligation.
3 Financial risk management 3.1 Financial risk factors The Group’s activities expose it to a variety of financial risks: market risk (including currency risk, fair value
interest rate risk, cash flow interest rate risk and price risk), credit risk and liquidity risk. The Group’s overall risk management programme focuses on the unpredictability of financial markets and seeks to minimize potential adverse effects of the financial performance of the Group.
Risk management is carried out by Group’s top management close cooperation with the Board of the Company. Top
management meetings are held to discuss overall risk management and analyze each case, as well as actions to cover specific areas, such as foreign exchange risk, interest rate risk, credit risk and investing excess liquidity.
Market risk (a) Foreign exchange risk The Group operates internationally and is exposed to foreign exchange risk arising from various currency
exposures primarily with respect to US Dollar (USD). Foreign exchange risk arises from future commercial transactions, recognized assets and liabilities.
For calculation of foreign exchange risk‘s sensitivity trade and other receivables and trade and other payables,
denominated at US-dollars are multiplied by reasonably possible change of EUR (to which LTL is pegged) to US dollars. Reasonable possible change is provided in the table below:
GROUP Company 2012 2011 2012 2011 Reasonably possible change of EUR to US dollars 2 % 2 % - - At 31 December 2012 the Group’s post-tax profit for the year would have been LTL 1 087 thousand (2011: LTL
890 thousand) higher/lower, mainly as a result of foreign exchange gains/losses on translation of US dollar-denominated trade and other receivables and trade and other payables.
Foreign exchange risk is controlled by monitoring the foreign currency exposure of its purchase contracts and
lease commitments. The Group seeks to reduce its foreign rate exchange exposure through a policy of matching possible receipts and payments in each individual currency.
AVIA SOLUTIONS GROUP AB SEPARATE AND CONSOLIDATED FINANCIAL STATEMENTS FOR THE YEAR ENDED 31 DECEMBER 2012 (All tabular amounts are in LTL ‘000 unless otherwise stated)
28
3.1 Financial risk factors (continued) (b) Price risk The Group is not exposed to price risk of financial instruments since it does not possess any material financial
instruments that could be sensitive to such risk. (c) Cash flow and fair value interest rate risk The Group’s interest rate risk arises from short-term and long-term bank borrowings and finance lease liabilities
at floating interest rates. The Group is not exposed to fair value interest rate risk as loans granted to related parties and interest free deposit placed as a guarantee for lease of aircraft are accounted at amortized cost and are with fixed interest rate.
To manage the interest rate risk the Group’s company entered into interest rate swap in 2012, in which it agreed to exchange, at specified intervals, the difference between fixed and variable rate interest amounts calculated by reference to an agreed-upon notional principal amounts. These swaps are designated to hedge the bank loan.
Borrowings received at variable interest rates and denominated in the LTL, EUR and GBP currencies expose the Group to cash flow interest rate risk. As at 31 December 2012 and 2011 Group’s non-current borrowings at variable rate of 6 month EURIBOR plus fixed margin were denominated in EUR and finance lease liabilities at variable rate of 6 months EURIBOR plus fixed margin were denominated in EUR and GBP.
For calculation of interest rate risk sensitivity interest expenses on borrowings, received at variable interest rates, are multiplied by possible interest rate change (hereinafter „reasonable shift“), which are prescribed by the Group. Possible interest rate changes are provided in the table below:
Currency of borrowings Reasonable shift LTL 4.00 % EUR 1.00 % The presumable interest rate change creates acceptable impact on Group’s annual profit as well as equity and
makes LTL 637 thousand in 2012 (2011: LTL 311 thousand) impact on profit or loss. Credit risk Credit risk arises from cash and cash equivalents and deposits with banks, financial institutions, shareholders
and their related parties, lessor as well as credit exposures to customers, including outstanding receivables and committed transactions. Credit risks are controlled by the application of credit terms and monitoring procedures. The Group’s procedures are in force to ensure that services are sold only to customers with an appropriate credit history and do not exceed acceptable credit exposure limit. Cash transactions are limited to high credit quality financial institutions.
AVIA SOLUTIONS GROUP AB SEPARATE AND CONSOLIDATED FINANCIAL STATEMENTS FOR THE YEAR ENDED 31 DECEMBER 2012 (All tabular amounts are in LTL ‘000 unless otherwise stated)
29
3.1 Financial risk factors (continued) (a) Maximum exposure of credit risk The table below summarises all credit risk exposures relating to on-balance sheet items of the Group. Maximum
exposure to credit risk before collateral held or other credit enhancements:
GROUP COMPANY 2012 2011 2012 2011 Trade receivables (Note 19) 62 969 56 984 1 404 60 Cash and cash equivalents (Note 21) 8 913 17 781 548 904 Loans provided (Note 19) 4 007 14 706 3 887 13 396 Loans provided to related parties (Notes 19, 34) 2 930 750 46 322 36 323 Trade receivables from related parties (Notes 19, 34) 1 837 4 190 3 980 1 239 Security deposit with lessor (Note 19) 1 780 14 754 33 9 Other receivables (Note 19) 1 187 1 561 223 146 Other receivables from related parties (Note 19) 72 21 1 187 930 83 695 110 747 57 584 53 007
(b) Financial assets neither past due nor impaired Trade receivables and trade receivables from related parties The Group‘s customers do not have external credit ratings, however the management of the Group measures credit quality of trade receivables and trade receivables from related parties based on the period of relationship with certain debtor. Two groups are distinguished: new customers/related parties (period of relationship less than 6 months) and old customers/related parties (more than 6 months). For analysis of credit quality of neither past due not impaired trade receivables and trade receivables from related parties based see the table below:
GROUP COMPANY 2012 2011 2012 2011 Group 1: new customers/related parties (less than 6 months) 4 459 4 303 1 15 Group 2: old customers/related parties (more than 6 months) 19 713 18 935 1 239 369 24 172 23 238 1 240 384 Cash and cash equivalents (assessed in accordance with long-term borrowings ratings*) * - external long term credit ratings set by international agencies Standarts & Poors as at August 2011 and FitchRatings as at March
2011/2012.
AVIA SOLUTIONS GROUP AB SEPARATE AND CONSOLIDATED FINANCIAL STATEMENTS FOR THE YEAR ENDED 31 DECEMBER 2012 (All tabular amounts are in LTL ‘000 unless otherwise stated)
30
3.1 Financial risk factors (continued) All cash and cash equivalents held by the Group as of the periods presented are neither past due, nor impaired.
The Group chooses the banks and financial institutions with a Fitch rating not lower than B. See the table below for analysis of the Group‘s cash and cash equivalents according to the credit quality.
GROUP COMPANY 2012 2011 2012 2011 AA- 589 - - - A+ 5 738 12 057 485 834 A- 60 1 195 60 56 BBB+ 374 1 526 - - BBB 1 532 1 540 - - BB 3 - 3 - B - 165 - - other 124 687 - 14 Cash on hand 493 611 - - 8 913 17 781 548 904
Security deposit with lessor, loans to related parties Security deposit with lessor and loans to related parties held by the Group as of the periods presented are neither past due nor impaired. The Group does not analyse these financial assets according to credit quality.
(c) Financial assets past due but not impaired Trade receivables that are past due up to 6 months and for which no evident impairment indicator is identified by the Group are classified as past due but not impaired. Trade receivables overdue more than 6 months may be considered as not impaired if the Group has evidence that the amounts due will be repaid. The ageing of past due, but not impaired trade receivables is as follows:
GROUP COMPANY 2012 2011 2012 2011 Overdue up to 3 months 27 534 27 421 1 581 749 overdue from 4 to 6 months 5 197 5 638 835 110 overdue over 6 months 7 903 4 877 1 729 57 40 634 37 936 4 145 916
AVIA SOLUTIONS GROUP AB SEPARATE AND CONSOLIDATED FINANCIAL STATEMENTS FOR THE YEAR ENDED 31 DECEMBER 2012 (All tabular amounts are in LTL ‘000 unless otherwise stated)
31
3.1 Financial risk factors (continued)
d) Impaired financial assets Trade and other receivables for which the Group has identified evident impairment indicator irrespective of the payment delay period are considered as impaired receivables. Evident impairment indicators include significant financial difficulties of the debtor or other events that significantly increase the risk of default on a receivable amount. The impairment of trade and other receivables is performed going individually through the customers list and assessing the expectation of recovery.
GROUP COMPANY 2012 2011 2012 2011 Impaired trade receivables – gross amount 3 932 3 647 - - Less: provision for impairment of trade receivables related to continuing
operations (Note 19) (3 932) (197) - - Less: provision for impairment of trade receivables related to discontinued
operations (Note 19) - (2 932) - - Impaired trade receivables – net amount - 518 - - Impaired other receivables – gross amount - 364 - 2 Less: provision for impairment of trade receivables related to continuing
operations (Note 19) - (4) - (2) Less: provision for impairment of other receivables related to discontinued
operations (Note 19) - (360) - - Impaired other receivables – net amount - - - - Impaired loans provided – gross amount - 10 - 10 Less: provision for impairment of loans provided related to continuing
operations (Note 19) - (10) - (10) Impaired loans provided – net amount - - - - Movements on the Group’s provision for impairment of
receivables: At 1 January 3 503 1 420 12 - Transferred of provision for impairment of receivables to assets held
for sale (3 292) - - - Provision for receivables impairment (continuing operations, Note
19) 3 932 211 - 12 Provision for receivables impairment (discontinued operations) - 3 292 Receivables written off during the year as uncollectible (211) (1 420) - - At 31 December (Note 19) 3 932 3 503 - 12 Liquidity risk Liquidity risk management implies maintaining sufficient cash and the availability of funding through other group
companies. Liquidity risk is managed by the General Managers of entities of the Group in close cooperation with the Company to maintain a minimum required liquidity position. As at 31 December 2012 current liabilities in eleven subsidiaries of the Group exceeded the current assets. Management of the Group believes that this will not have any impact on the ability of subsidiaries of the Group to continue as going concern. In addition the parent company – Avia Solutions Group AB – is able to provide financial support to enable subsidiaries to continue operations for at least twelve months from the date of approval of the financial statements, if needed.
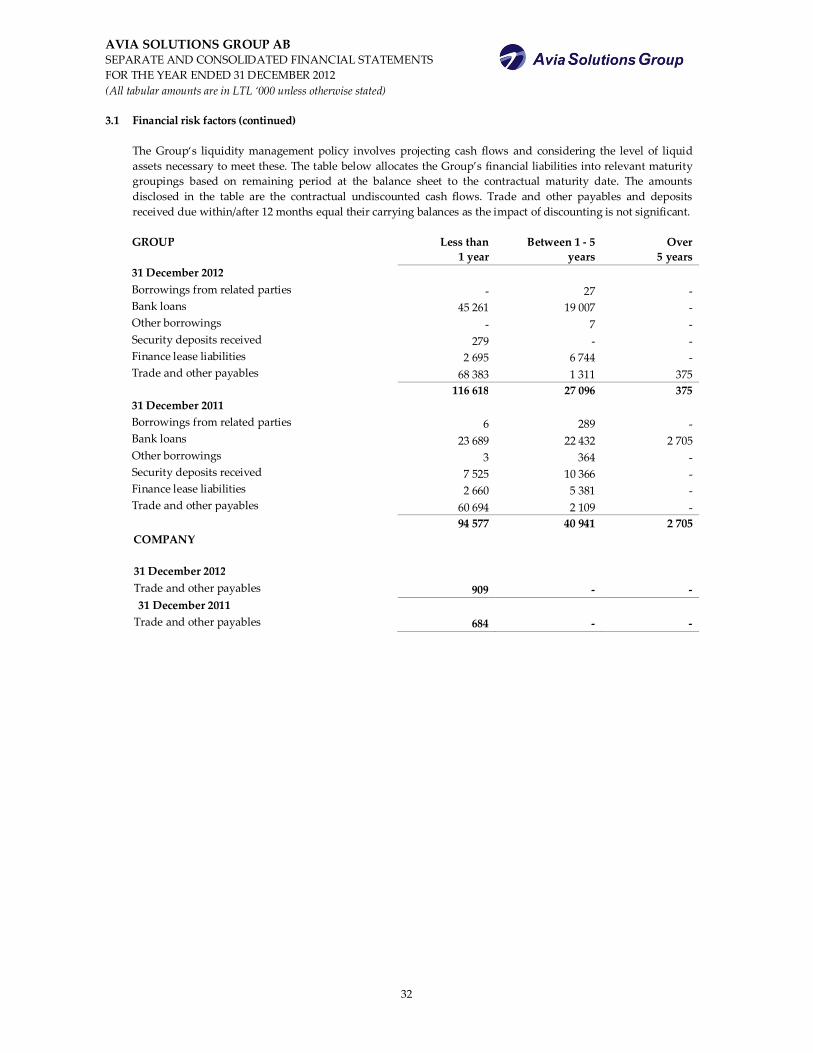
AVIA SOLUTIONS GROUP AB SEPARATE AND CONSOLIDATED FINANCIAL STATEMENTS FOR THE YEAR ENDED 31 DECEMBER 2012 (All tabular amounts are in LTL ‘000 unless otherwise stated)
32
3.1 Financial risk factors (continued) The Group‘s liquidity management policy involves projecting cash flows and considering the level of liquid
assets necessary to meet these. The table below allocates the Group’s financial liabilities into relevant maturity groupings based on remaining period at the balance sheet to the contractual maturity date. The amounts disclosed in the table are the contractual undiscounted cash flows. Trade and other payables and deposits received due within/after 12 months equal their carrying balances as the impact of discounting is not significant.
GROUP Less than
1 year Between 1 - 5
years Over
5 years 31 December 2012 Borrowings from related parties - 27 - Bank loans 45 261 19 007 - Other borrowings - 7 - Security deposits received 279 - - Finance lease liabilities 2 695 6 744 - Trade and other payables 68 383 1 311 375 116 618 27 096 375 31 December 2011 Borrowings from related parties 6 289 - Bank loans 23 689 22 432 2 705 Other borrowings 3 364 - Security deposits received 7 525 10 366 - Finance lease liabilities 2 660 5 381 - Trade and other payables 60 694 2 109 - 94 577 40 941 2 705 COMPANY
31 December 2012
Trade and other payables 909 - - 31 December 2011 Trade and other payables 684 - -
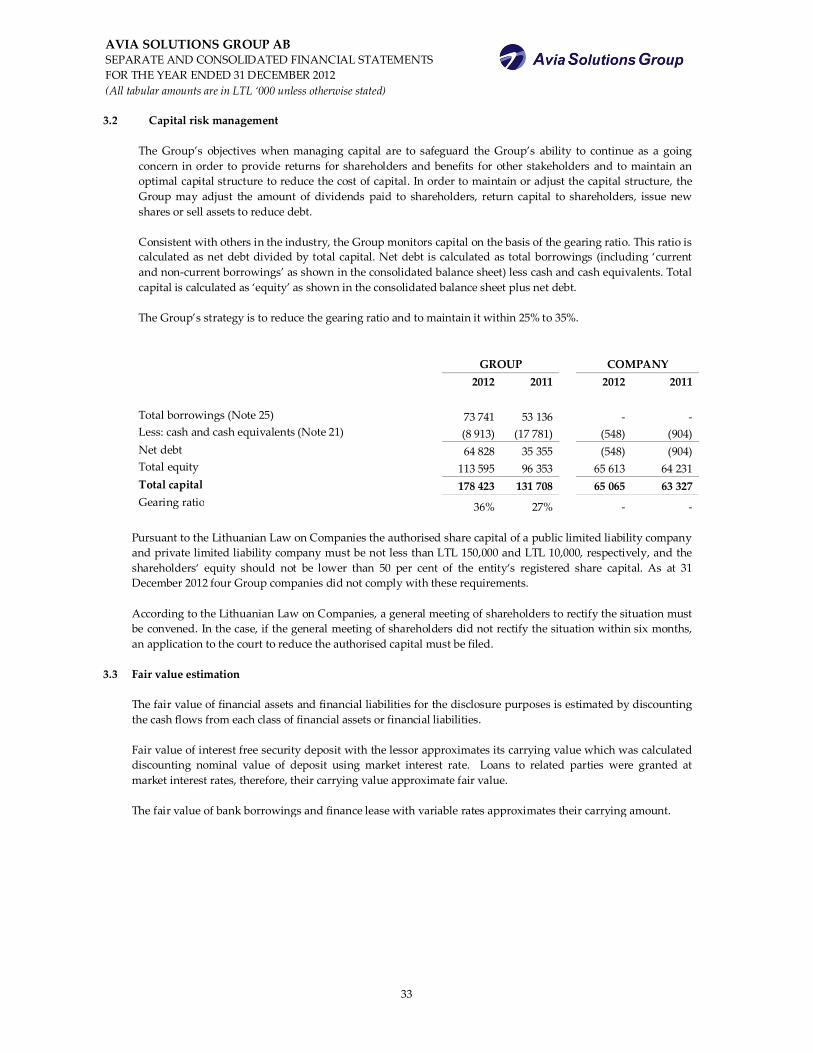
AVIA SOLUTIONS GROUP AB SEPARATE AND CONSOLIDATED FINANCIAL STATEMENTS FOR THE YEAR ENDED 31 DECEMBER 2012 (All tabular amounts are in LTL ‘000 unless otherwise stated)
33
3.2 Capital risk management The Group’s objectives when managing capital are to safeguard the Group’s ability to continue as a going
concern in order to provide returns for shareholders and benefits for other stakeholders and to maintain an optimal capital structure to reduce the cost of capital. In order to maintain or adjust the capital structure, the Group may adjust the amount of dividends paid to shareholders, return capital to shareholders, issue new shares or sell assets to reduce debt.
Consistent with others in the industry, the Group monitors capital on the basis of the gearing ratio. This ratio is calculated as net debt divided by total capital. Net debt is calculated as total borrowings (including ‘current and non-current borrowings’ as shown in the consolidated balance sheet) less cash and cash equivalents. Total capital is calculated as ‘equity’ as shown in the consolidated balance sheet plus net debt.
The Group’s strategy is to reduce the gearing ratio and to maintain it within 25% to 35%.
GROUP COMPANY 2012 2011 2012 2011 Total borrowings (Note 25) 73 741 53 136 - - Less: cash and cash equivalents (Note 21) (8 913) (17 781) (548) (904) Net debt 64 828 35 355 (548) (904) Total equity 113 595 96 353 65 613 64 231 Total capital 178 423 131 708 65 065 63 327 Gearing ratio 36% 27% - - Pursuant to the Lithuanian Law on Companies the authorised share capital of a public limited liability company
and private limited liability company must be not less than LTL 150,000 and LTL 10,000, respectively, and the shareholders‘ equity should not be lower than 50 per cent of the entity‘s registered share capital. As at 31 December 2012 four Group companies did not comply with these requirements.
According to the Lithuanian Law on Companies, a general meeting of shareholders to rectify the situation must
be convened. In the case, if the general meeting of shareholders did not rectify the situation within six months, an application to the court to reduce the authorised capital must be filed.
3.3 Fair value estimation The fair value of financial assets and financial liabilities for the disclosure purposes is estimated by discounting
the cash flows from each class of financial assets or financial liabilities. Fair value of interest free security deposit with the lessor approximates its carrying value which was calculated
discounting nominal value of deposit using market interest rate. Loans to related parties were granted at market interest rates, therefore, their carrying value approximate fair value.
The fair value of bank borrowings and finance lease with variable rates approximates their carrying amount.
AVIA SOLUTIONS GROUP AB SEPARATE AND CONSOLIDATED FINANCIAL STATEMENTS FOR THE YEAR ENDED 31 DECEMBER 2012 (All tabular amounts are in LTL ‘000 unless otherwise stated)
34
4 Critical Accounting Estimates and Significant Judgements Estimates and judgments are continually evaluated and are based on historical experience and other factors,
including expectations of future events that are believed to be reasonable under the circumstances. The Group makes estimates and assumptions that affect the reported amounts of assets and liabilities within the next financial year. Estimates and judgments are continually evaluated and are based on management’s experience and other factors, including expectations of future events that are believed to be reasonable under the circumstances.
Management also makes certain judgments, apart from those involving estimations, in the process of applying
the accounting policies. Judgments that have the most significant effect on the amounts recognised in the financial statements and estimates that can cause a significant adjustment to the carrying amount of assets and liabilities within the next financial year include:
(a) C-check costs accruals During the aircraft lease term and until the lease contract termination date, the Group (lessee) has the obligation,
at its expense, to maintain and repair the aircraft in accordance with the maintenance program. C-check expenses are incurred once in 18 – 24 months. Accruals for such expenses is based on an average cost of all C-Check per flight hour and recognised in the profit or loss in proportion of flight hours.
(b) Premises lease payments accruals Under the terms of two aircraft hangars and training building operating lease agreement, various rentals were
payable during the lease term and until the lease contract termination date. Lease payments have been apportioned to ensure that they are charged to the comprehensive income statement on a straight-line basis over the period of the lease.
(c) Related-party transactions In the normal course of business the Group enters into transactions with their related parties. These transactions
are priced predominantly at market rates. Judgement is applied in determining if transactions are priced at market or non-market rates, where there is no active market for such transactions. The basis for judgement is pricing for similar types of transactions with unrelated parties.
(d) Income taxes Tax authorities have a right to examine accounting records of the Group at any time during the 5 year period
after the current tax year and account for additional taxes and fines. In the opinion of the Group’s management, currently there are no circumstances that might result in a potential material liability in this respect to the Group. The Group is subject to income taxes in numerous jurisdictions. Significant judgement is required in determining the worldwide provision for income taxes. There are many transactions and calculations for which the ultimate tax determination is uncertain. The Group recognises liabilities for anticipated tax audit issues based on estimates of whether additional taxes will be due. Where the final tax outcome of these matters is different from the amounts that were initially recorded, such differences will impact the current and deferred income tax assets and liabilities in the period in which such determination is made.
AVIA SOLUTIONS GROUP AB SEPARATE AND CONSOLIDATED FINANCIAL STATEMENTS FOR THE YEAR ENDED 31 DECEMBER 2012 (All tabular amounts are in LTL ‘000 unless otherwise stated)
35
4 Critical Accounting Estimates and Significant Judgements (continued) (e) Provision for impairment of accounts receivable Impairment loss of accounts receivable was determined based on the management’s estimates on recoverability
and timing relating to the amounts that will not be collectable according to the original terms of receivables. This determination requires significant judgement. Judgement is exercised based on significant financial difficulties of the debtor, probability that the debtor will enter bankruptcy or financial reorganisation, and default or delinquency in payments. Current estimates of the management could change significantly as a result of change in situation in the market and the economy as a whole. Recoverability rate also highly depends on success rate and actions employed relating to recovery of significantly overdue amounts receivable. For further details, see Note 3.
(f) Intangible assets Costs that are directly attributable to obtain the AOC are recognized as intangible assets (Note 2.6). The AOC
expected to provide economic benefits to the Group in future periods are measured at acquisition cost, which includes directly attributable expenses, as described in Note 2.6, less subsequent accumulated amortisation and any accumulated impairment losses. Amortisation is calculated on the straight-line basis over estimated economic benefit period of 5 years.
As at acquisition date of the subsidiary (Note 32) line maintenance approvals and basic licenses with carrying amount LTL 3,528 thousand were recognised as intangible assets (Note 2.6) The licences expected to provide economic benefits to the Group in future periods are measured at acquisition cost, which includes directly attributable expenses, as described in Note 2.6, less subsequent accumulated amortisation and any accumulated impairment losses. Amortisation is calculated on the straight-line basis over estimated economic benefit period of 5 years.
(g) Property, plant and equipment Estimates concerning useful lives of property, plant and equipment may change due to constant technology
advancement. Useful lives of property, plant and equipment are disclosed Note 2.5 and depreciation charge for the year is disclosed in Note 15. Increasing an asset’s expected useful life or its residual value would result in a reduced depreciation charge. The useful lives of property, plant and equipment are determined by the management at the time the asset is acquired and reviewed on an annual basis for appropriateness. The lives are based on historical experiences with similar assets as well as anticipation of future events, which may impact their life, such as changes in technology. Most of property, plant and equipment of the Group comprise machinery, buildings and vehicles. (h) Estimated impairment of goodwill The Group tests annually whether goodwill has suffered any impairment, in accordance with the accounting policy stated in the note 2.6. The recoverable amounts of cash-generating units have been determined based on value-in-use calculations. These calculations require the use of estimates (Note 16).
AVIA SOLUTIONS GROUP AB SEPARATE AND CONSOLIDATED FINANCIAL STATEMENTS FOR THE YEAR ENDED 31 DECEMBER 2012 (All tabular amounts are in LTL ‘000 unless otherwise stated)
36
5 Segment information For management purposes, the Group is organised into business units based on the services provided, and has
five reportable operating segments: Aircraft Maintenance, Repair and Overhaul (MRO) The aircraft maintenance, repair and overhaul (MRO) segment is involved in aircraft and aircraft components’
maintenance, repair, overhaul, engineering, spare parts and consumable sale, technical personnel training. Aircraft Ground Handling and Fuelling The aircraft ground handling and fuelling segment is involved aircraft handling, passengers servicing, tickets
sale and into-plane fuelling.
Pilot and Crew Training The pilot and crew training segment is involved in full scope of integrated flight training solutions Unallocated Sales The Unallocated sales include sales of management services, which cannot be attributed to the other segments.
In the segment Note is no longer disclosed the Charter Operations segment, which was reclassified to assets held for sale in the financial statements for the year ended 31 December 2012 and was disposed on 26 March 2013 (Note 33).
Management monitors the operating results of its business units separately for the purpose of making decisions about resource allocation and performance assessment. The segment performance is analysed on monthly basis based on internal reports provided to the chief operating decision maker of the Group. The accounting policies of the reportable segments are the same as the Group‘s accounting policies described in Note 2.
Management analyses the activities of the Group both from geographic and business perspective.
From business perspective the Management used to analyse the Group sales volume and gross profit (loss) based on businesses the Group is involved in (according to the Group companies’ activities), referred to as segments. Gross profit (loss) is a measure of segment profit or loss for management analysis purposes.
Operating expenses, which are directly related to the operating segments (including administration employee
related expenses, rent and maintenance of administration premises, depreciation and amortization of non-current assets, used for administrative purposes, business travel expenses, related to sales, consultation expenses, office administrative expenses and other), and the amount of impairment losses, recognised in profit or loss during the period, are allocated to the particular segments. Other operating expenses, indirectly related to the operating segments, are not allocated to the operating segments. Financial activities and income taxes are managed on a Group level and are not allocated to the operating segments as well. Management also regularly reviews capital investments on segment basis therefore additions to non-current assets has been separately disclosed according to each operating segment.
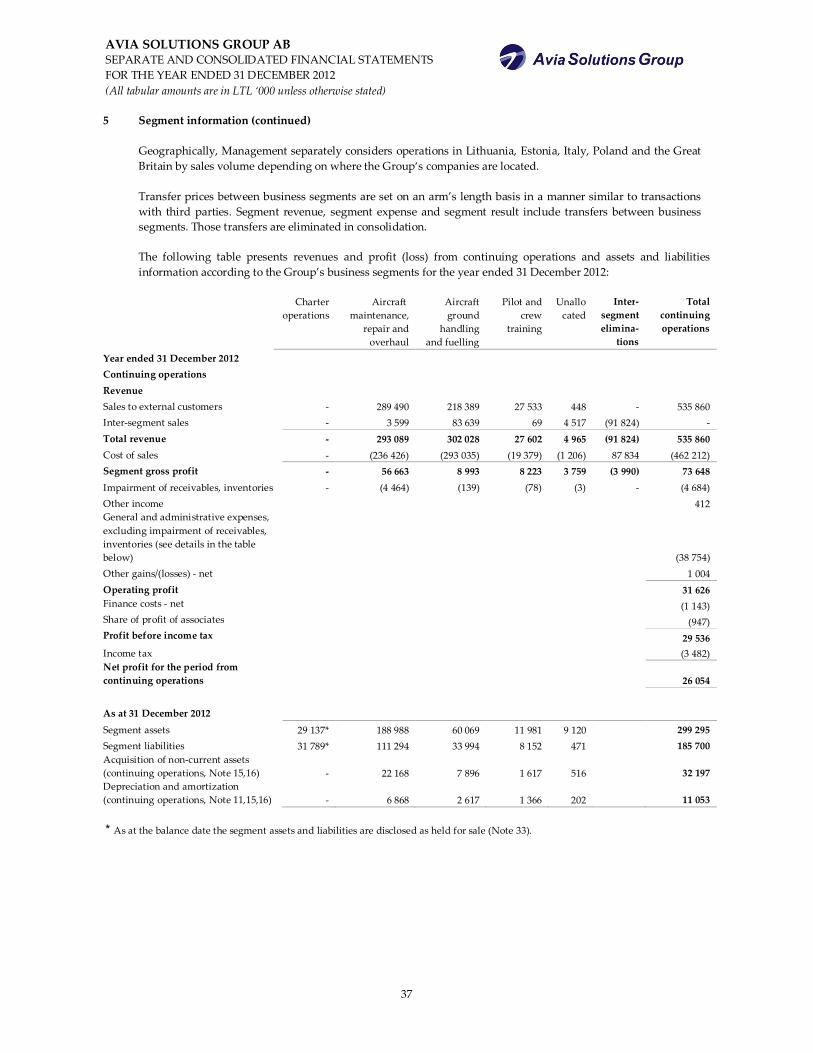
AVIA SOLUTIONS GROUP AB SEPARATE AND CONSOLIDATED FINANCIAL STATEMENTS FOR THE YEAR ENDED 31 DECEMBER 2012 (All tabular amounts are in LTL ‘000 unless otherwise stated)
37
5 Segment information (continued) Geographically, Management separately considers operations in Lithuania, Estonia, Italy, Poland and the Great
Britain by sales volume depending on where the Group‘s companies are located. Transfer prices between business segments are set on an arm’s length basis in a manner similar to transactions with third parties. Segment revenue, segment expense and segment result include transfers between business segments. Those transfers are eliminated in consolidation.
The following table presents revenues and profit (loss) from continuing operations and assets and liabilities
information according to the Group’s business segments for the year ended 31 December 2012:
Charter operations
Aircraft maintenance,
repair and overhaul
Aircraft ground
handling and fuelling
Pilot and crew
training
Unallocated
Inter-segment elimina-
tions
Total continuing operations
Year ended 31 December 2012 Continuing operations Revenue Sales to external customers - 289 490 218 389 27 533 448 - 535 860 Inter-segment sales - 3 599 83 639 69 4 517 (91 824) - Total revenue - 293 089 302 028 27 602 4 965 (91 824) 535 860 Cost of sales - (236 426) (293 035) (19 379) (1 206) 87 834 (462 212) Segment gross profit - 56 663 8 993 8 223 3 759 (3 990) 73 648 Impairment of receivables, inventories - (4 464) (139) (78) (3) - (4 684) Other income 412 General and administrative expenses, excluding impairment of receivables, inventories (see details in the table below) (38 754) Other gains/(losses) - net 1 004 Operating profit 31 626 Finance costs - net (1 143) Share of profit of associates (947) Profit before income tax 29 536 Income tax (3 482) Net profit for the period from continuing operations 26 054 As at 31 December 2012 Segment assets 29 137* 188 988 60 069 11 981 9 120 299 295 Segment liabilities 31 789* 111 294 33 994 8 152 471 185 700 Acquisition of non-current assets (continuing operations, Note 15,16) - 22 168 7 896 1 617 516 32 197 Depreciation and amortization (continuing operations, Note 11,15,16) - 6 868 2 617 1 366 202 11 053 * As at the balance date the segment assets and liabilities are disclosed as held for sale (Note 33).
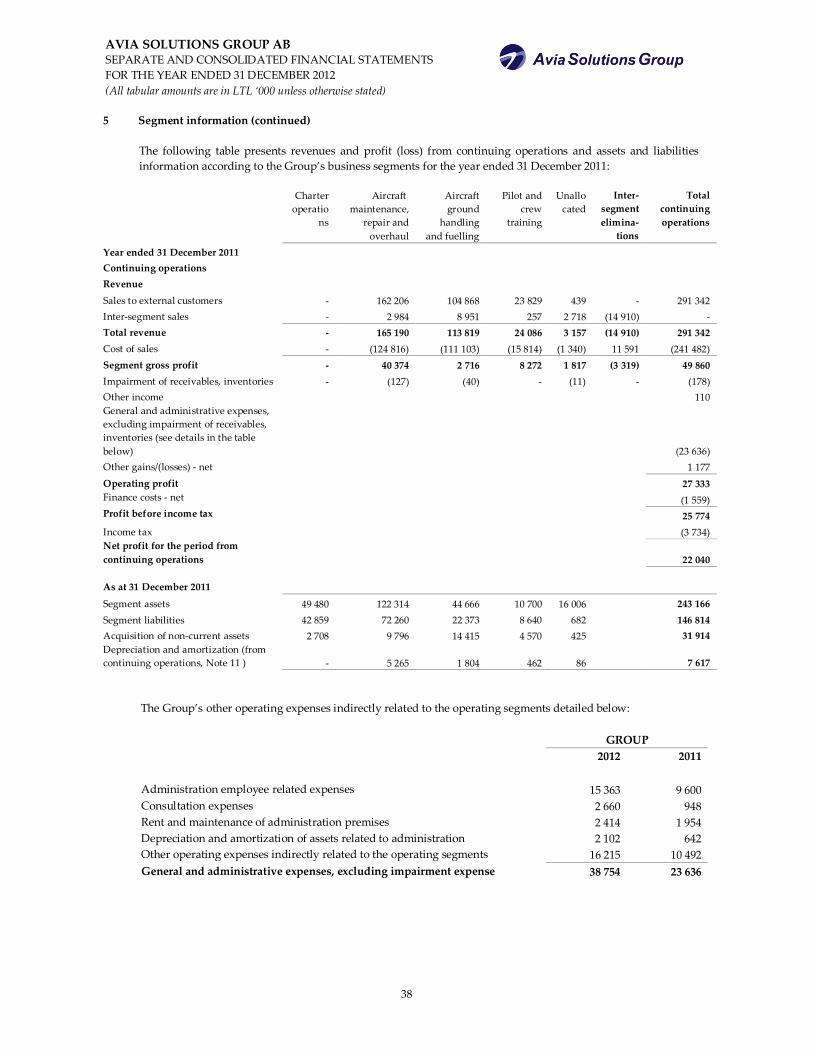
AVIA SOLUTIONS GROUP AB SEPARATE AND CONSOLIDATED FINANCIAL STATEMENTS FOR THE YEAR ENDED 31 DECEMBER 2012 (All tabular amounts are in LTL ‘000 unless otherwise stated)
38
5 Segment information (continued) The following table presents revenues and profit (loss) from continuing operations and assets and liabilities
information according to the Group’s business segments for the year ended 31 December 2011:
Charter operatio
ns
Aircraft maintenance,
repair and overhaul
Aircraft ground
handling and fuelling
Pilot and crew
training
Unallocated
Inter-segment elimina-
tions
Total continuing operations
Year ended 31 December 2011 Continuing operations Revenue Sales to external customers - 162 206 104 868 23 829 439 - 291 342 Inter-segment sales - 2 984 8 951 257 2 718 (14 910) - Total revenue - 165 190 113 819 24 086 3 157 (14 910) 291 342 Cost of sales - (124 816) (111 103) (15 814) (1 340) 11 591 (241 482) Segment gross profit - 40 374 2 716 8 272 1 817 (3 319) 49 860 Impairment of receivables, inventories - (127) (40) - (11) - (178) Other income 110 General and administrative expenses, excluding impairment of receivables, inventories (see details in the table below) (23 636) Other gains/(losses) - net 1 177 Operating profit 27 333 Finance costs - net (1 559) Profit before income tax 25 774 Income tax (3 734) Net profit for the period from continuing operations 22 040 As at 31 December 2011 Segment assets 49 480 122 314 44 666 10 700 16 006 243 166 Segment liabilities 42 859 72 260 22 373 8 640 682 146 814 Acquisition of non-current assets 2 708 9 796 14 415 4 570 425 31 914 Depreciation and amortization (from continuing operations, Note 11 ) - 5 265 1 804 462 86 7 617
The Group’s other operating expenses indirectly related to the operating segments detailed below:
GROUP 2012 2011
Administration employee related expenses 15 363 9 600 Consultation expenses 2 660 948 Rent and maintenance of administration premises 2 414 1 954 Depreciation and amortization of assets related to administration 2 102 642 Other operating expenses indirectly related to the operating segments 16 215 10 492 General and administrative expenses, excluding impairment expense 38 754 23 636
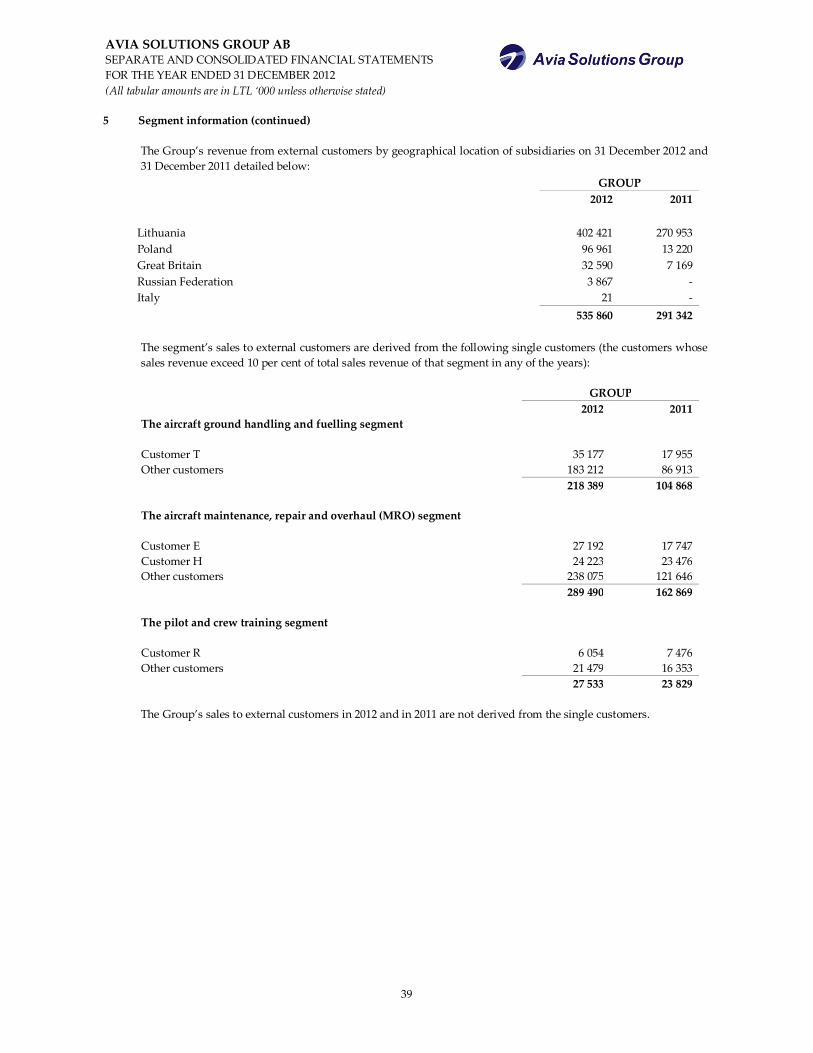
AVIA SOLUTIONS GROUP AB SEPARATE AND CONSOLIDATED FINANCIAL STATEMENTS FOR THE YEAR ENDED 31 DECEMBER 2012 (All tabular amounts are in LTL ‘000 unless otherwise stated)
39
5 Segment information (continued)
The Group’s revenue from external customers by geographical location of subsidiaries on 31 December 2012 and 31 December 2011 detailed below:
GROUP 2012 2011
Lithuania 402 421 270 953 Poland 96 961 13 220 Great Britain 32 590 7 169 Russian Federation 3 867 - Italy 21 -
535 860 291 342
The segment’s sales to external customers are derived from the following single customers (the customers whose sales revenue exceed 10 per cent of total sales revenue of that segment in any of the years):
GROUP 2012 2011
The aircraft ground handling and fuelling segment Customer T 35 177 17 955 Other customers 183 212 86 913 218 389 104 868 The aircraft maintenance, repair and overhaul (MRO) segment Customer E 27 192 17 747 Customer H 24 223 23 476 Other customers 238 075 121 646 289 490 162 869 The pilot and crew training segment Customer R 6 054 7 476 Other customers 21 479 16 353
27 533 23 829
The Group’s sales to external customers in 2012 and in 2011 are not derived from the single customers.
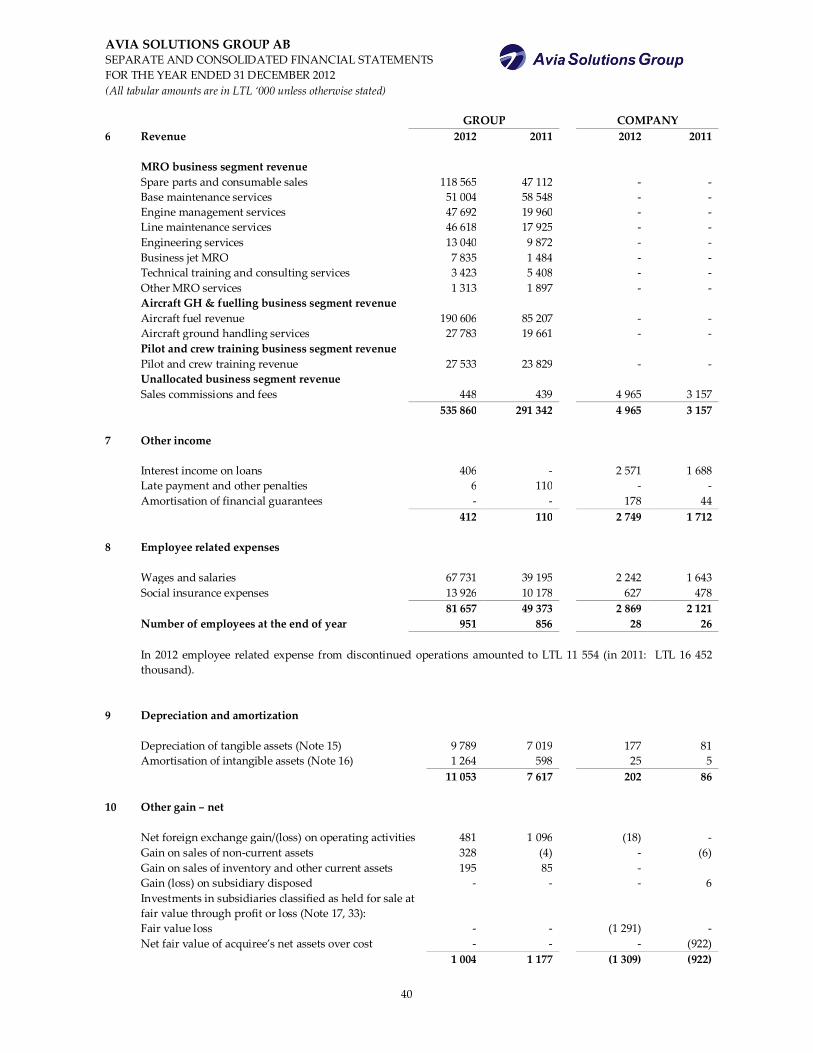
AVIA SOLUTIONS GROUP AB SEPARATE AND CONSOLIDATED FINANCIAL STATEMENTS FOR THE YEAR ENDED 31 DECEMBER 2012 (All tabular amounts are in LTL ‘000 unless otherwise stated)
40
GROUP COMPANY 6 Revenue 2012 2011 2012 2011 MRO business segment revenue Spare parts and consumable sales 118 565 47 112 - - Base maintenance services 51 004 58 548 - - Engine management services 47 692 19 960 - - Line maintenance services 46 618 17 925 - - Engineering services 13 040 9 872 - - Business jet MRO 7 835 1 484 - - Technical training and consulting services 3 423 5 408 - - Other MRO services 1 313 1 897 - - Aircraft GH & fuelling business segment revenue Aircraft fuel revenue 190 606 85 207 - - Aircraft ground handling services 27 783 19 661 - - Pilot and crew training business segment revenue Pilot and crew training revenue 27 533 23 829 - - Unallocated business segment revenue Sales commissions and fees 448 439 4 965 3 157 535 860 291 342 4 965 3 157 7 Other income Interest income on loans 406 - 2 571 1 688 Late payment and other penalties 6 110 - - Amortisation of financial guarantees - - 178 44 412 110 2 749 1 712 8 Employee related expenses Wages and salaries 67 731 39 195 2 242 1 643 Social insurance expenses 13 926 10 178 627 478 81 657 49 373 2 869 2 121 Number of employees at the end of year 951 856 28 26
In 2012 employee related expense from discontinued operations amounted to LTL 11 554 (in 2011: LTL 16 452 thousand).
9 Depreciation and amortization Depreciation of tangible assets (Note 15) 9 789 7 019 177 81 Amortisation of intangible assets (Note 16) 1 264 598 25 5 11 053 7 617 202 86 10 Other gain – net Net foreign exchange gain/(loss) on operating activities 481 1 096 (18) - Gain on sales of non-current assets 328 (4) - (6) Gain on sales of inventory and other current assets 195 85 - Gain (loss) on subsidiary disposed - - - 6
Investments in subsidiaries classified as held for sale at fair value through profit or loss (Note 17, 33): Fair value loss - - (1 291) -
Net fair value of acquiree’s net assets over cost - - - (922) 1 004 1 177 (1 309) (922)
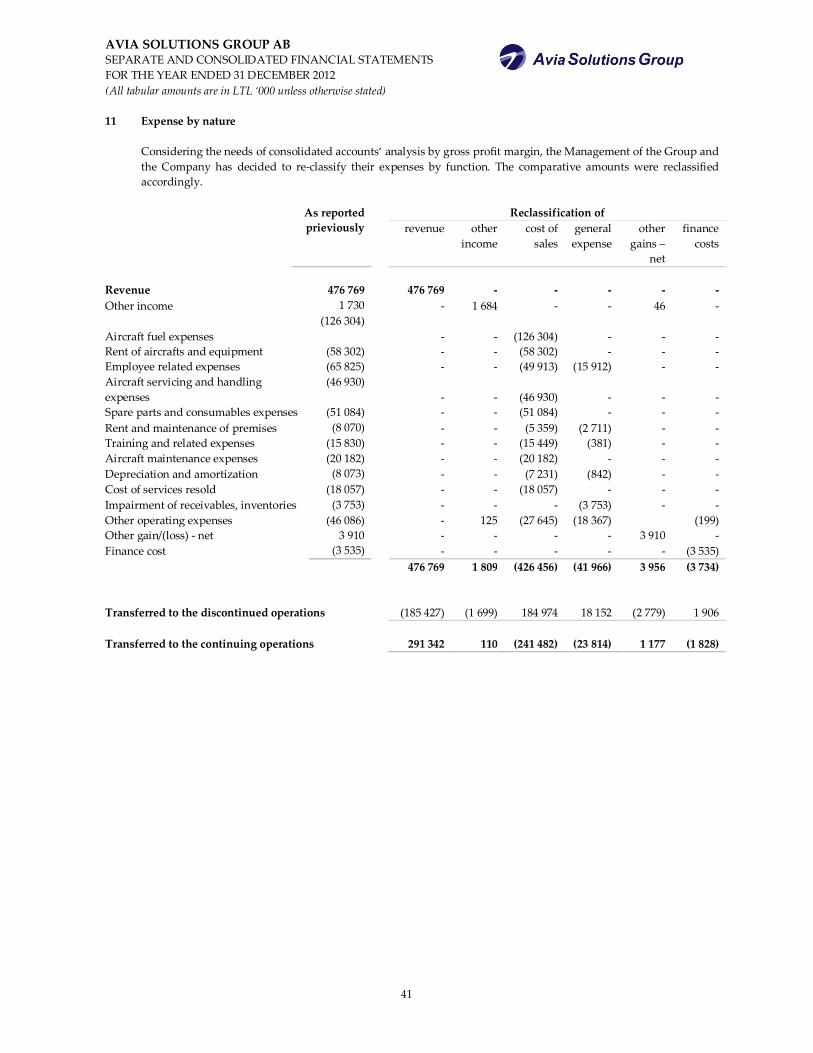
AVIA SOLUTIONS GROUP AB SEPARATE AND CONSOLIDATED FINANCIAL STATEMENTS FOR THE YEAR ENDED 31 DECEMBER 2012 (All tabular amounts are in LTL ‘000 unless otherwise stated)
41
11 Expense by nature
Considering the needs of consolidated accounts‘ analysis by gross profit margin, the Management of the Group and the Company has decided to re-classify their expenses by function. The comparative amounts were reclassified accordingly.
As reported
prieviously Reclassification of
revenue other income
cost of sales
general expense
other gains –
net
finance costs
Revenue 476 769 476 769 - - - - - Other income 1 730 - 1 684 - - 46 -
Aircraft fuel expenses (126 304)
- - (126 304) - - - Rent of aircrafts and equipment (58 302) - - (58 302) - - - Employee related expenses (65 825) - - (49 913) (15 912) - - Aircraft servicing and handling expenses
(46 930) - - (46 930) - - -
Spare parts and consumables expenses (51 084) - - (51 084) - - - Rent and maintenance of premises (8 070) - - (5 359) (2 711) - - Training and related expenses (15 830) - - (15 449) (381) - - Aircraft maintenance expenses (20 182) - - (20 182) - - - Depreciation and amortization (8 073) - - (7 231) (842) - - Cost of services resold (18 057) - - (18 057) - - - Impairment of receivables, inventories (3 753) - - - (3 753) - - Other operating expenses (46 086) - 125 (27 645) (18 367) (199) Other gain/(loss) - net 3 910 - - - - 3 910 - Finance cost (3 535) - - - - - (3 535)
476 769 1 809 (426 456) (41 966) 3 956 (3 734)
Transferred to the discontinued operations (185 427) (1 699) 184 974 18 152 (2 779) 1 906
Transferred to the continuing operations 291 342 110 (241 482) (23 814) 1 177 (1 828)
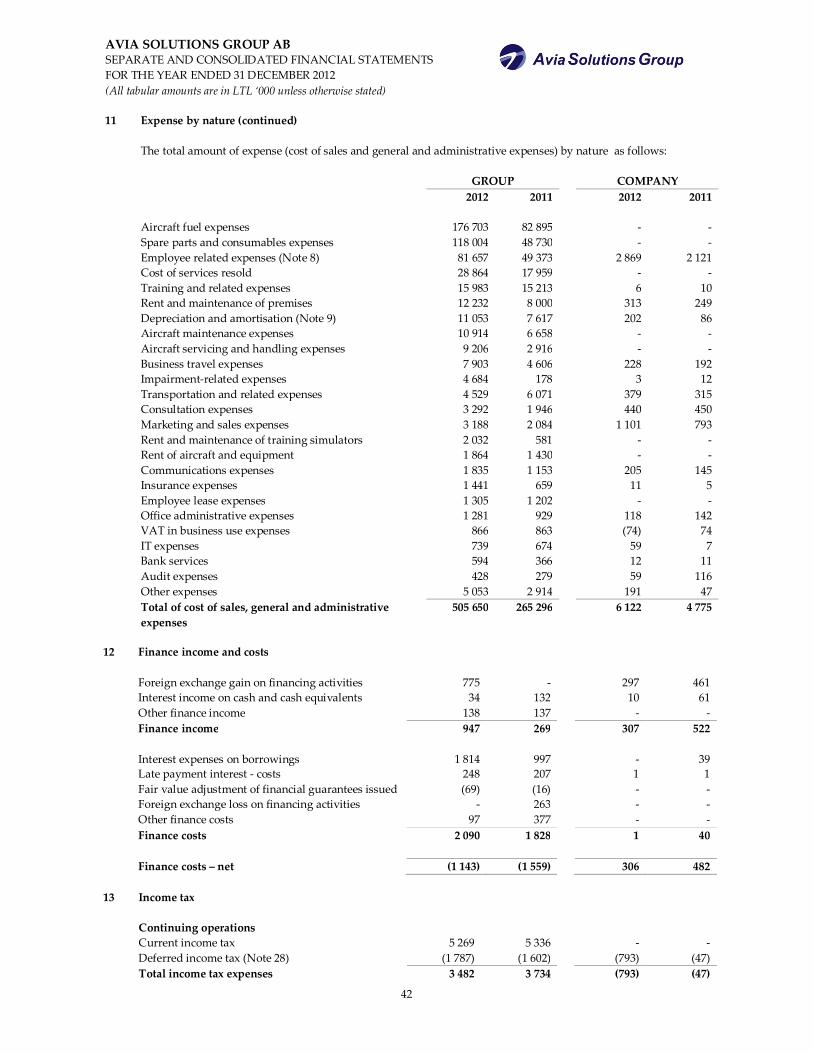
AVIA SOLUTIONS GROUP AB SEPARATE AND CONSOLIDATED FINANCIAL STATEMENTS FOR THE YEAR ENDED 31 DECEMBER 2012 (All tabular amounts are in LTL ‘000 unless otherwise stated)
42
11 Expense by nature (continued) The total amount of expense (cost of sales and general and administrative expenses) by nature as follows:
GROUP COMPANY 2012 2011 2012 2011 Aircraft fuel expenses 176 703 82 895 - - Spare parts and consumables expenses 118 004 48 730 - - Employee related expenses (Note 8) 81 657 49 373 2 869 2 121 Cost of services resold 28 864 17 959 - - Training and related expenses 15 983 15 213 6 10 Rent and maintenance of premises 12 232 8 000 313 249 Depreciation and amortisation (Note 9) 11 053 7 617 202 86 Aircraft maintenance expenses 10 914 6 658 - - Aircraft servicing and handling expenses 9 206 2 916 - - Business travel expenses 7 903 4 606 228 192 Impairment-related expenses 4 684 178 3 12 Transportation and related expenses 4 529 6 071 379 315 Consultation expenses 3 292 1 946 440 450 Marketing and sales expenses 3 188 2 084 1 101 793 Rent and maintenance of training simulators 2 032 581 - - Rent of aircraft and equipment 1 864 1 430 - - Communications expenses 1 835 1 153 205 145 Insurance expenses 1 441 659 11 5 Employee lease expenses 1 305 1 202 - - Office administrative expenses 1 281 929 118 142 VAT in business use expenses 866 863 (74) 74 IT expenses 739 674 59 7 Bank services 594 366 12 11 Audit expenses 428 279 59 116 Other expenses 5 053 2 914 191 47
Total of cost of sales, general and administrative expenses
505 650 265 296 6 122 4 775
12 Finance income and costs Foreign exchange gain on financing activities 775 - 297 461 Interest income on cash and cash equivalents 34 132 10 61 Other finance income 138 137 - - Finance income 947 269 307 522 Interest expenses on borrowings 1 814 997 - 39 Late payment interest - costs 248 207 1 1 Fair value adjustment of financial guarantees issued (69) (16) - - Foreign exchange loss on financing activities - 263 - - Other finance costs 97 377 - - Finance costs 2 090 1 828 1 40 Finance costs – net (1 143) (1 559) 306 482 13 Income tax Continuing operations Current income tax 5 269 5 336 - - Deferred income tax (Note 28) (1 787) (1 602) (793) (47) Total income tax expenses 3 482 3 734 (793) (47)
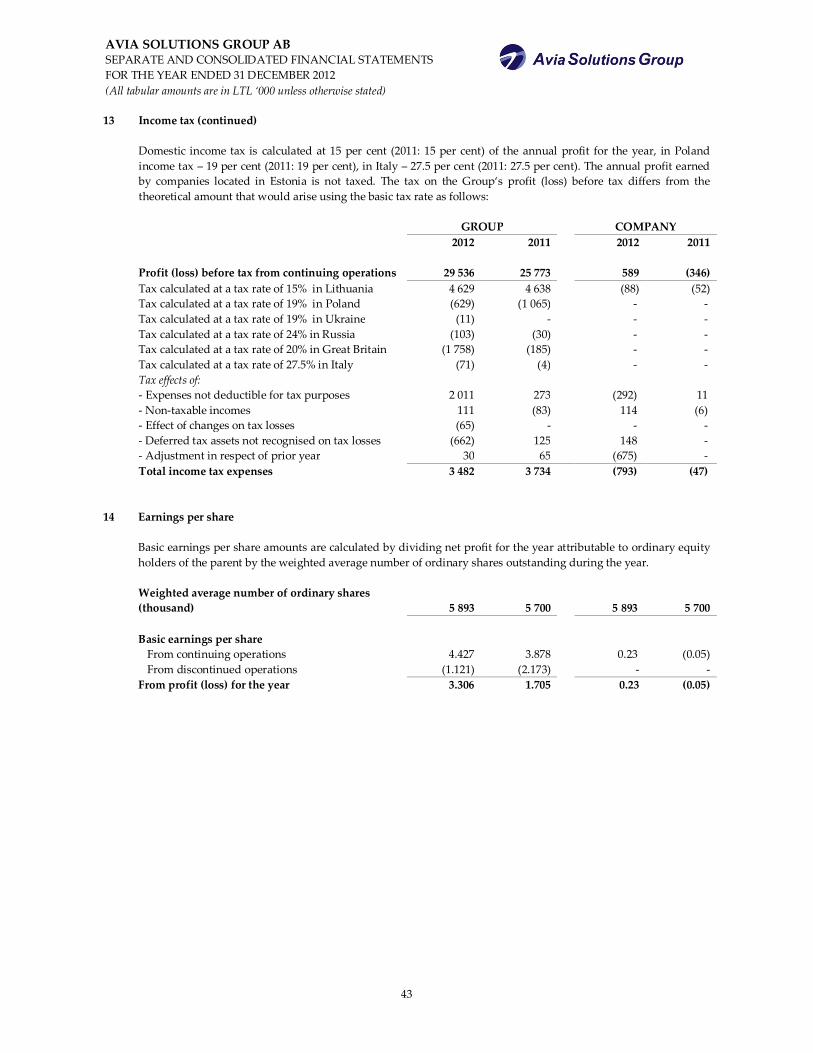
AVIA SOLUTIONS GROUP AB SEPARATE AND CONSOLIDATED FINANCIAL STATEMENTS FOR THE YEAR ENDED 31 DECEMBER 2012 (All tabular amounts are in LTL ‘000 unless otherwise stated)
43
13 Income tax (continued)
Domestic income tax is calculated at 15 per cent (2011: 15 per cent) of the annual profit for the year, in Poland income tax – 19 per cent (2011: 19 per cent), in Italy – 27.5 per cent (2011: 27.5 per cent). The annual profit earned by companies located in Estonia is not taxed. The tax on the Group‘s profit (loss) before tax differs from the theoretical amount that would arise using the basic tax rate as follows:
GROUP COMPANY 2012 2011 2012 2011 Profit (loss) before tax from continuing operations 29 536 25 773 589 (346) Tax calculated at a tax rate of 15% in Lithuania 4 629 4 638 (88) (52) Tax calculated at a tax rate of 19% in Poland (629) (1 065) - - Tax calculated at a tax rate of 19% in Ukraine (11) - - - Tax calculated at a tax rate of 24% in Russia (103) (30) - - Tax calculated at a tax rate of 20% in Great Britain (1 758) (185) - - Tax calculated at a tax rate of 27.5% in Italy (71) (4) - - Tax effects of: - Expenses not deductible for tax purposes 2 011 273 (292) 11 - Non-taxable incomes 111 (83) 114 (6) - Effect of changes on tax losses (65) - - - - Deferred tax assets not recognised on tax losses (662) 125 148 - - Adjustment in respect of prior year 30 65 (675) - Total income tax expenses 3 482 3 734 (793) (47)
14 Earnings per share Basic earnings per share amounts are calculated by dividing net profit for the year attributable to ordinary equity
holders of the parent by the weighted average number of ordinary shares outstanding during the year. Weighted average number of ordinary shares
(thousand) 5 893 5 700 5 893 5 700 Basic earnings per share From continuing operations 4.427 3.878 0.23 (0.05) From discontinued operations (1.121) (2.173) - - From profit (loss) for the year 3.306 1.705 0.23 (0.05)
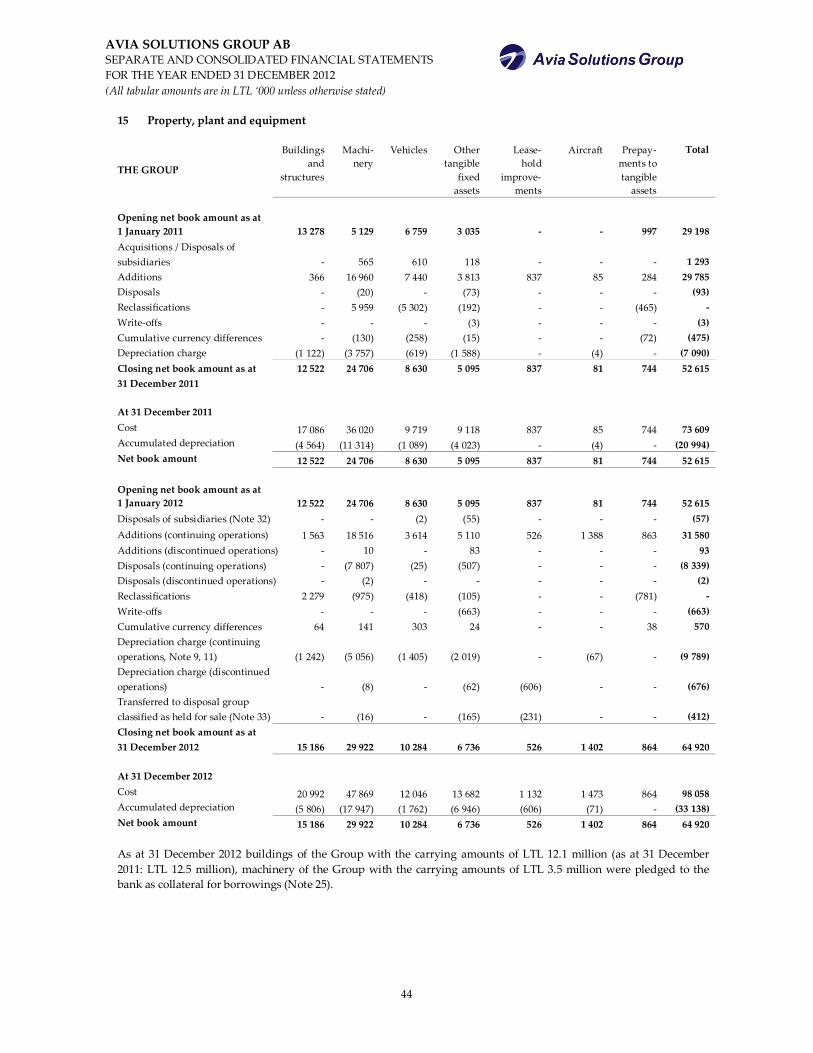
AVIA SOLUTIONS GROUP AB SEPARATE AND CONSOLIDATED FINANCIAL STATEMENTS FOR THE YEAR ENDED 31 DECEMBER 2012 (All tabular amounts are in LTL ‘000 unless otherwise stated)
44
15 Property, plant and equipment
THE GROUP
Buildings and
structures
Machi-nery
Vehicles Other tangible
fixed assets
Lease-hold
improve-ments
Aircraft Prepay-ments to tangible
assets
Total
Opening net book amount as at 1 January 2011 13 278 5 129 6 759 3 035 - - 997 29 198 Acquisitions / Disposals of subsidiaries - 565 610 118 - - - 1 293 Additions 366 16 960 7 440 3 813 837 85 284 29 785 Disposals - (20) - (73) - - - (93) Reclassifications - 5 959 (5 302) (192) - - (465) - Write-offs - - - (3) - - - (3) Cumulative currency differences - (130) (258) (15) - - (72) (475) Depreciation charge (1 122) (3 757) (619) (1 588) - (4) - (7 090) Closing net book amount as at 31 December 2011
12 522 24 706 8 630 5 095 837 81 744 52 615
At 31 December 2011 Cost 17 086 36 020 9 719 9 118 837 85 744 73 609 Accumulated depreciation (4 564) (11 314) (1 089) (4 023) - (4) - (20 994) Net book amount 12 522 24 706 8 630 5 095 837 81 744 52 615 Opening net book amount as at 1 January 2012 12 522 24 706 8 630 5 095 837 81 744 52 615 Disposals of subsidiaries (Note 32) - - (2) (55) - - - (57) Additions (continuing operations) 1 563 18 516 3 614 5 110 526 1 388 863 31 580 Additions (discontinued operations) - 10 - 83 - - - 93 Disposals (continuing operations) - (7 807) (25) (507) - - - (8 339) Disposals (discontinued operations) - (2) - - - - - (2) Reclassifications 2 279 (975) (418) (105) - - (781) - Write-offs - - - (663) - - - (663) Cumulative currency differences 64 141 303 24 - - 38 570 Depreciation charge (continuing operations, Note 9, 11) (1 242) (5 056) (1 405) (2 019) - (67) - (9 789) Depreciation charge (discontinued operations) - (8) - (62) (606) - - (676) Transferred to disposal group classified as held for sale (Note 33) - (16) - (165) (231) - - (412) Closing net book amount as at 31 December 2012 15 186 29 922 10 284 6 736 526 1 402 864 64 920 At 31 December 2012 Cost 20 992 47 869 12 046 13 682 1 132 1 473 864 98 058 Accumulated depreciation (5 806) (17 947) (1 762) (6 946) (606) (71) - (33 138) Net book amount 15 186 29 922 10 284 6 736 526 1 402 864 64 920 As at 31 December 2012 buildings of the Group with the carrying amounts of LTL 12.1 million (as at 31 December 2011: LTL 12.5 million), machinery of the Group with the carrying amounts of LTL 3.5 million were pledged to the bank as collateral for borrowings (Note 25).
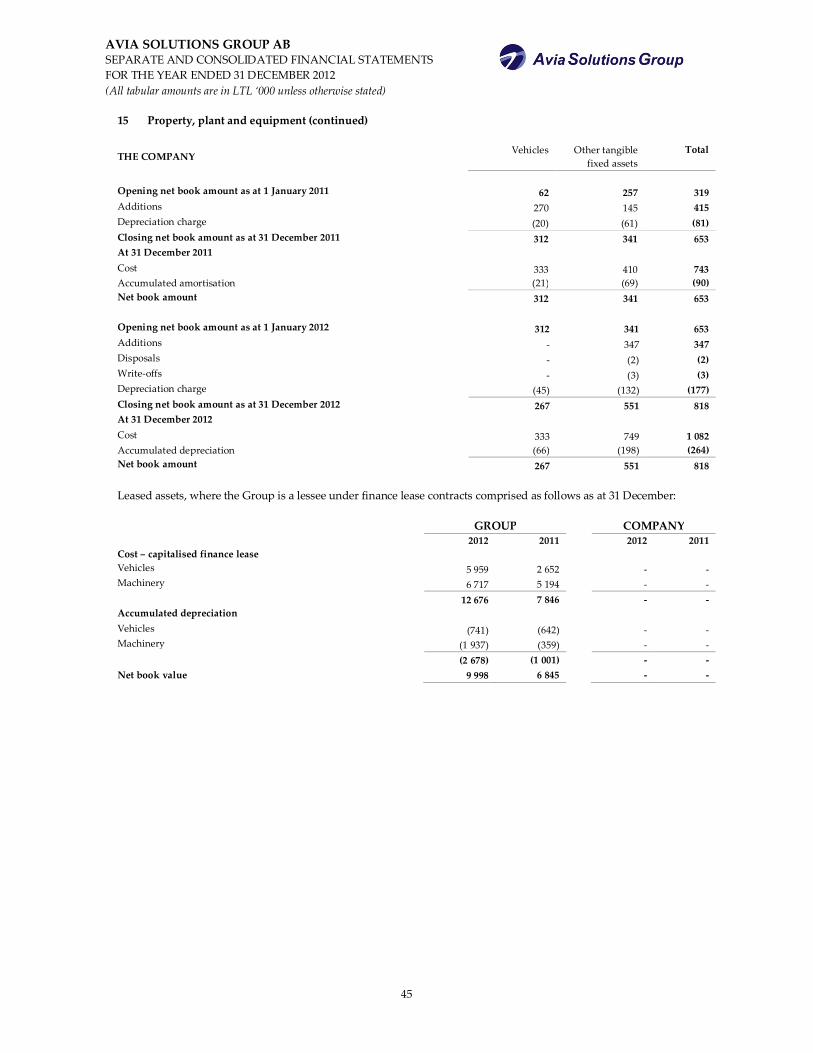
AVIA SOLUTIONS GROUP AB SEPARATE AND CONSOLIDATED FINANCIAL STATEMENTS FOR THE YEAR ENDED 31 DECEMBER 2012 (All tabular amounts are in LTL ‘000 unless otherwise stated)
45
15 Property, plant and equipment (continued)
THE COMPANY Vehicles Other tangible
fixed assets Total
Opening net book amount as at 1 January 2011 62 257 319 Additions 270 145 415 Depreciation charge (20) (61) (81) Closing net book amount as at 31 December 2011 312 341 653 At 31 December 2011 Cost 333 410 743 Accumulated amortisation (21) (69) (90) Net book amount 312 341 653
Opening net book amount as at 1 January 2012 312 341 653 Additions - 347 347 Disposals - (2) (2) Write-offs - (3) (3) Depreciation charge (45) (132) (177) Closing net book amount as at 31 December 2012 267 551 818 At 31 December 2012 Cost 333 749 1 082 Accumulated depreciation (66) (198) (264) Net book amount 267 551 818 Leased assets, where the Group is a lessee under finance lease contracts comprised as follows as at 31 December: GROUP COMPANY 2012 2011 2012 2011 Cost – capitalised finance lease Vehicles 5 959 2 652 - - Machinery 6 717 5 194 - - 12 676 7 846 - - Accumulated depreciation Vehicles (741) (642) - - Machinery (1 937) (359) - - (2 678) (1 001) - - Net book value 9 998 6 845 - -
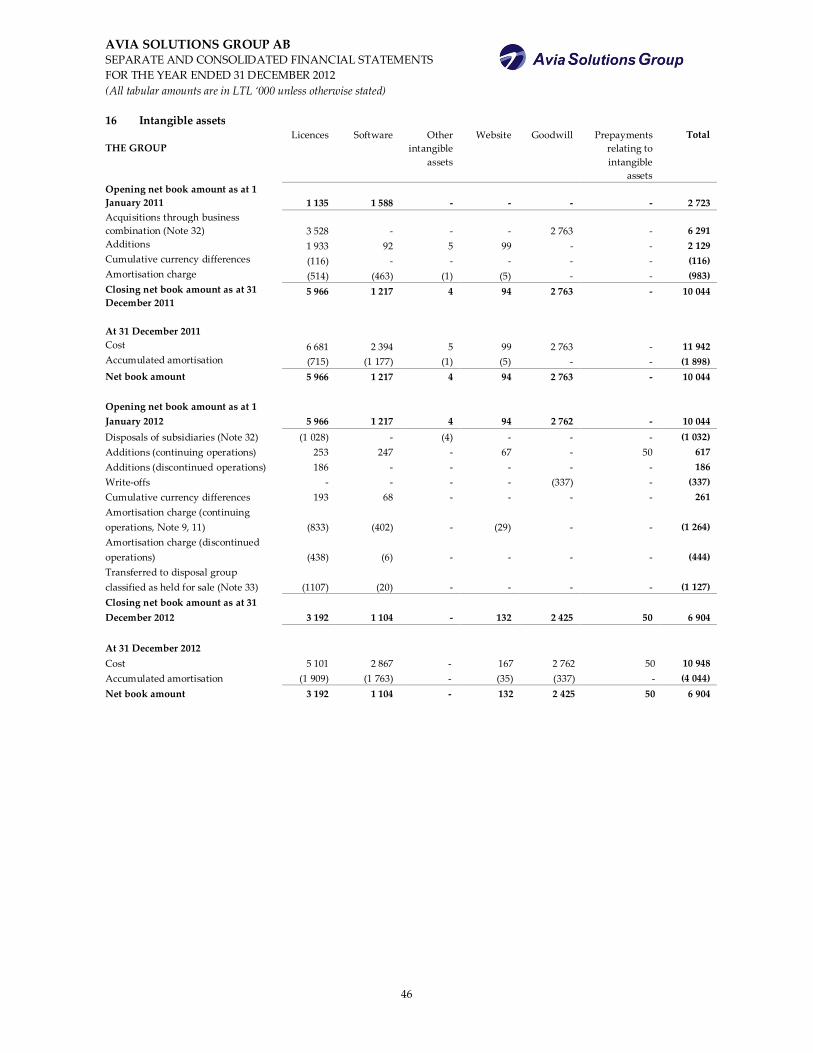
AVIA SOLUTIONS GROUP AB SEPARATE AND CONSOLIDATED FINANCIAL STATEMENTS FOR THE YEAR ENDED 31 DECEMBER 2012 (All tabular amounts are in LTL ‘000 unless otherwise stated)
46
16 Intangible assets
THE GROUP
Licences Software Other intangible
assets
Website Goodwill Prepayments relating to intangible
assets
Total
Opening net book amount as at 1 January 2011 1 135 1 588 - - - - 2 723 Acquisitions through business combination (Note 32) 3 528 - - - 2 763 - 6 291 Additions 1 933 92 5 99 - - 2 129 Cumulative currency differences (116) - - - - - (116) Amortisation charge (514) (463) (1) (5) - - (983) Closing net book amount as at 31 December 2011
5 966 1 217 4 94 2 763 - 10 044
At 31 December 2011 Cost 6 681 2 394 5 99 2 763 - 11 942 Accumulated amortisation (715) (1 177) (1) (5) - - (1 898) Net book amount 5 966 1 217 4 94 2 763 - 10 044 Opening net book amount as at 1 January 2012 5 966 1 217 4 94 2 762 - 10 044 Disposals of subsidiaries (Note 32) (1 028) - (4) - - - (1 032) Additions (continuing operations) 253 247 - 67 - 50 617 Additions (discontinued operations) 186 - - - - - 186 Write-offs - - - - (337) - (337) Cumulative currency differences 193 68 - - - - 261 Amortisation charge (continuing operations, Note 9, 11) (833) (402) - (29) - - (1 264) Amortisation charge (discontinued operations) (438) (6) - - - - (444) Transferred to disposal group classified as held for sale (Note 33) (1107) (20) - - - - (1 127) Closing net book amount as at 31 December 2012 3 192 1 104 - 132 2 425 50 6 904 At 31 December 2012
Cost 5 101 2 867 - 167 2 762 50 10 948 Accumulated amortisation (1 909) (1 763) - (35) (337) - (4 044) Net book amount 3 192 1 104 - 132 2 425 50 6 904
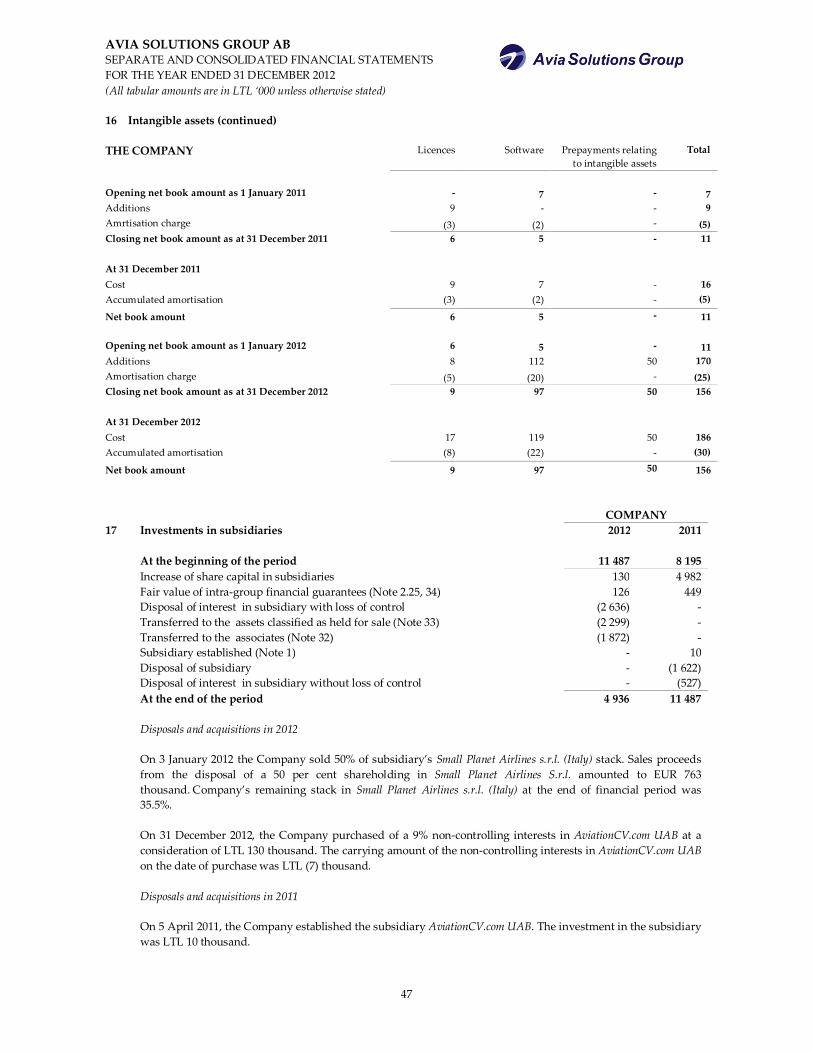
AVIA SOLUTIONS GROUP AB SEPARATE AND CONSOLIDATED FINANCIAL STATEMENTS FOR THE YEAR ENDED 31 DECEMBER 2012 (All tabular amounts are in LTL ‘000 unless otherwise stated)
47
16 Intangible assets (continued)
THE COMPANY Licences Software Prepayments relating
to intangible assets Total
Opening net book amount as 1 January 2011 - 7 - 7 Additions 9 - - 9 Amrtisation charge (3) (2) - (5) Closing net book amount as at 31 December 2011 6 5 - 11
At 31 December 2011 Cost 9 7 - 16 Accumulated amortisation (3) (2) - (5)
Net book amount 6 5 - 11 Opening net book amount as 1 January 2012 6 5 - 11 Additions 8 112 50 170 Amortisation charge (5) (20) - (25) Closing net book amount as at 31 December 2012 9 97 50 156
At 31 December 2012 Cost 17 119 50 186 Accumulated amortisation (8) (22) - (30)
Net book amount 9 97 50 156
COMPANY 17 Investments in subsidiaries 2012 2011 At the beginning of the period 11 487 8 195 Increase of share capital in subsidiaries 130 4 982 Fair value of intra-group financial guarantees (Note 2.25, 34) 126 449 Disposal of interest in subsidiary with loss of control (2 636) - Transferred to the assets classified as held for sale (Note 33) (2 299) - Transferred to the associates (Note 32) (1 872) - Subsidiary established (Note 1) - 10 Disposal of subsidiary - (1 622) Disposal of interest in subsidiary without loss of control - (527) At the end of the period 4 936 11 487 Disposals and acquisitions in 2012
On 3 January 2012 the Company sold 50% of subsidiary’s Small Planet Airlines s.r.l. (Italy) stack. Sales proceeds from the disposal of a 50 per cent shareholding in Small Planet Airlines S.r.l. amounted to EUR 763 thousand. Company’s remaining stack in Small Planet Airlines s.r.l. (Italy) at the end of financial period was 35.5%. On 31 December 2012, the Company purchased of a 9% non-controlling interests in AviationCV.com UAB at a consideration of LTL 130 thousand. The carrying amount of the non-controlling interests in AviationCV.com UAB on the date of purchase was LTL (7) thousand. Disposals and acquisitions in 2011 On 5 April 2011, the Company established the subsidiary AviationCV.com UAB. The investment in the subsidiary was LTL 10 thousand.
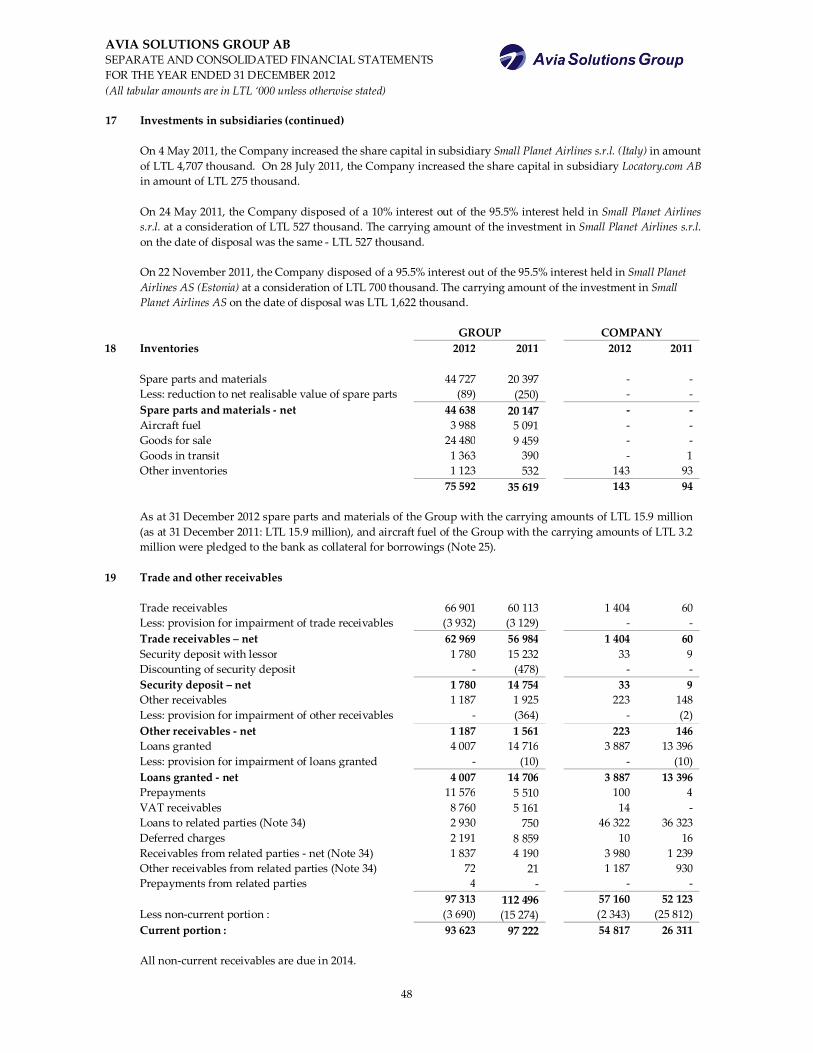
AVIA SOLUTIONS GROUP AB SEPARATE AND CONSOLIDATED FINANCIAL STATEMENTS FOR THE YEAR ENDED 31 DECEMBER 2012 (All tabular amounts are in LTL ‘000 unless otherwise stated)
48
17 Investments in subsidiaries (continued) On 4 May 2011, the Company increased the share capital in subsidiary Small Planet Airlines s.r.l. (Italy) in amount of LTL 4,707 thousand. On 28 July 2011, the Company increased the share capital in subsidiary Locatory.com AB in amount of LTL 275 thousand. On 24 May 2011, the Company disposed of a 10% interest out of the 95.5% interest held in Small Planet Airlines s.r.l. at a consideration of LTL 527 thousand. The carrying amount of the investment in Small Planet Airlines s.r.l. on the date of disposal was the same - LTL 527 thousand. On 22 November 2011, the Company disposed of a 95.5% interest out of the 95.5% interest held in Small Planet Airlines AS (Estonia) at a consideration of LTL 700 thousand. The carrying amount of the investment in Small Planet Airlines AS on the date of disposal was LTL 1,622 thousand.
GROUP COMPANY 18 Inventories 2012 2011 2012 2011 Spare parts and materials 44 727 20 397 - - Less: reduction to net realisable value of spare parts (89) (250) - - Spare parts and materials - net 44 638 20 147 - - Aircraft fuel 3 988 5 091 - - Goods for sale 24 480 9 459 - - Goods in transit 1 363 390 - 1 Other inventories 1 123 532 143 93 75 592 35 619 143 94
As at 31 December 2012 spare parts and materials of the Group with the carrying amounts of LTL 15.9 million (as at 31 December 2011: LTL 15.9 million), and aircraft fuel of the Group with the carrying amounts of LTL 3.2 million were pledged to the bank as collateral for borrowings (Note 25).
19 Trade and other receivables Trade receivables 66 901 60 113 1 404 60 Less: provision for impairment of trade receivables (3 932) (3 129) - - Trade receivables – net 62 969 56 984 1 404 60 Security deposit with lessor 1 780 15 232 33 9 Discounting of security deposit - (478) - - Security deposit – net 1 780 14 754 33 9 Other receivables 1 187 1 925 223 148 Less: provision for impairment of other receivables - (364) - (2) Other receivables - net 1 187 1 561 223 146 Loans granted 4 007 14 716 3 887 13 396 Less: provision for impairment of loans granted - (10) - (10) Loans granted - net 4 007 14 706 3 887 13 396 Prepayments 11 576 5 510 100 4 VAT receivables 8 760 5 161 14 - Loans to related parties (Note 34) 2 930 750 46 322 36 323 Deferred charges 2 191 8 859 10 16 Receivables from related parties - net (Note 34) 1 837 4 190 3 980 1 239 Other receivables from related parties (Note 34) 72 21 1 187 930 Prepayments from related parties 4 - - - 97 313 112 496 57 160 52 123 Less non-current portion : (3 690) (15 274) (2 343) (25 812) Current portion : 93 623 97 222 54 817 26 311
All non-current receivables are due in 2014.
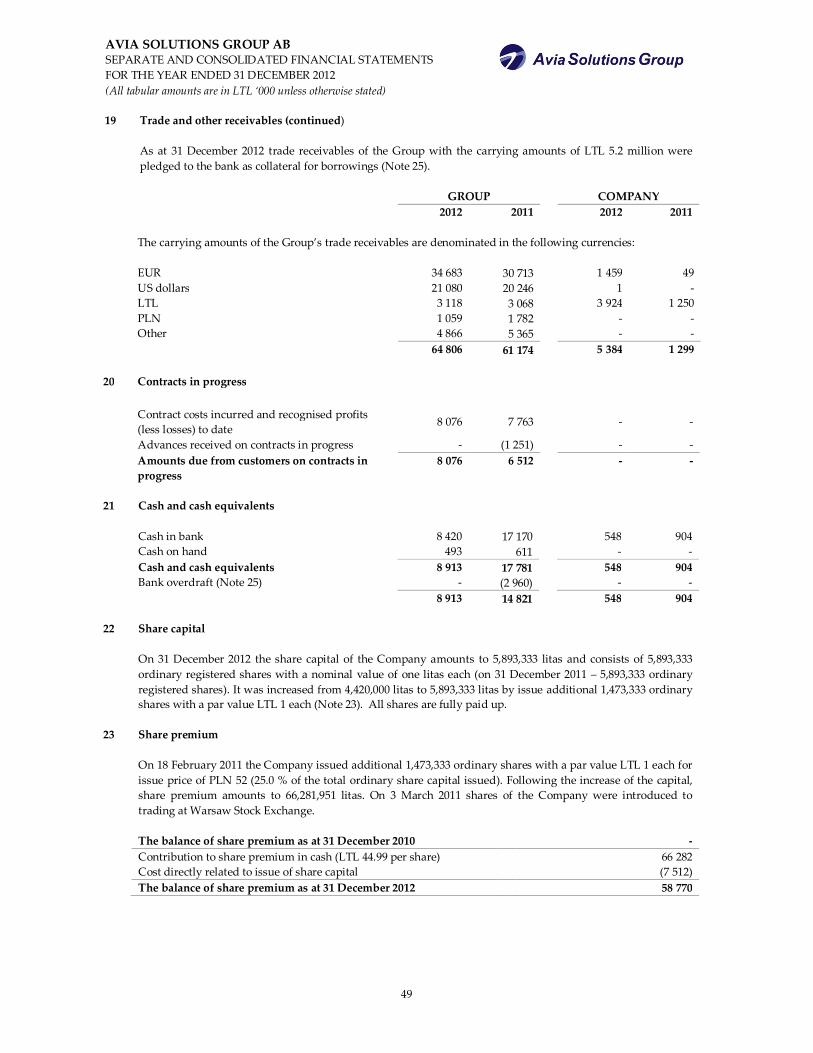
AVIA SOLUTIONS GROUP AB SEPARATE AND CONSOLIDATED FINANCIAL STATEMENTS FOR THE YEAR ENDED 31 DECEMBER 2012 (All tabular amounts are in LTL ‘000 unless otherwise stated)
49
19 Trade and other receivables (continued)
As at 31 December 2012 trade receivables of the Group with the carrying amounts of LTL 5.2 million were pledged to the bank as collateral for borrowings (Note 25).
GROUP COMPANY 2012 2011 2012 2011
The carrying amounts of the Group’s trade receivables are denominated in the following currencies: EUR 34 683 30 713 1 459 49 US dollars 21 080 20 246 1 - LTL 3 118 3 068 3 924 1 250 PLN 1 059 1 782 - - Other 4 866 5 365 - - 64 806 61 174 5 384 1 299 20 Contracts in progress Contract costs incurred and recognised profits
(less losses) to date 8 076 7 763 - -
Advances received on contracts in progress - (1 251) - - Amounts due from customers on contracts in
progress 8 076 6 512 - -
21 Cash and cash equivalents Cash in bank 8 420 17 170 548 904 Cash on hand 493 611 - - Cash and cash equivalents 8 913 17 781 548 904 Bank overdraft (Note 25) - (2 960) - -
8 913 14 821 548 904
22 Share capital On 31 December 2012 the share capital of the Company amounts to 5,893,333 litas and consists of 5,893,333
ordinary registered shares with a nominal value of one litas each (on 31 December 2011 – 5,893,333 ordinary registered shares). It was increased from 4,420,000 litas to 5,893,333 litas by issue additional 1,473,333 ordinary shares with a par value LTL 1 each (Note 23). All shares are fully paid up.
23 Share premium On 18 February 2011 the Company issued additional 1,473,333 ordinary shares with a par value LTL 1 each for
issue price of PLN 52 (25.0 % of the total ordinary share capital issued). Following the increase of the capital, share premium amounts to 66,281,951 litas. On 3 March 2011 shares of the Company were introduced to trading at Warsaw Stock Exchange.
The balance of share premium as at 31 December 2010 - Contribution to share premium in cash (LTL 44.99 per share) 66 282 Cost directly related to issue of share capital (7 512) The balance of share premium as at 31 December 2012 58 770
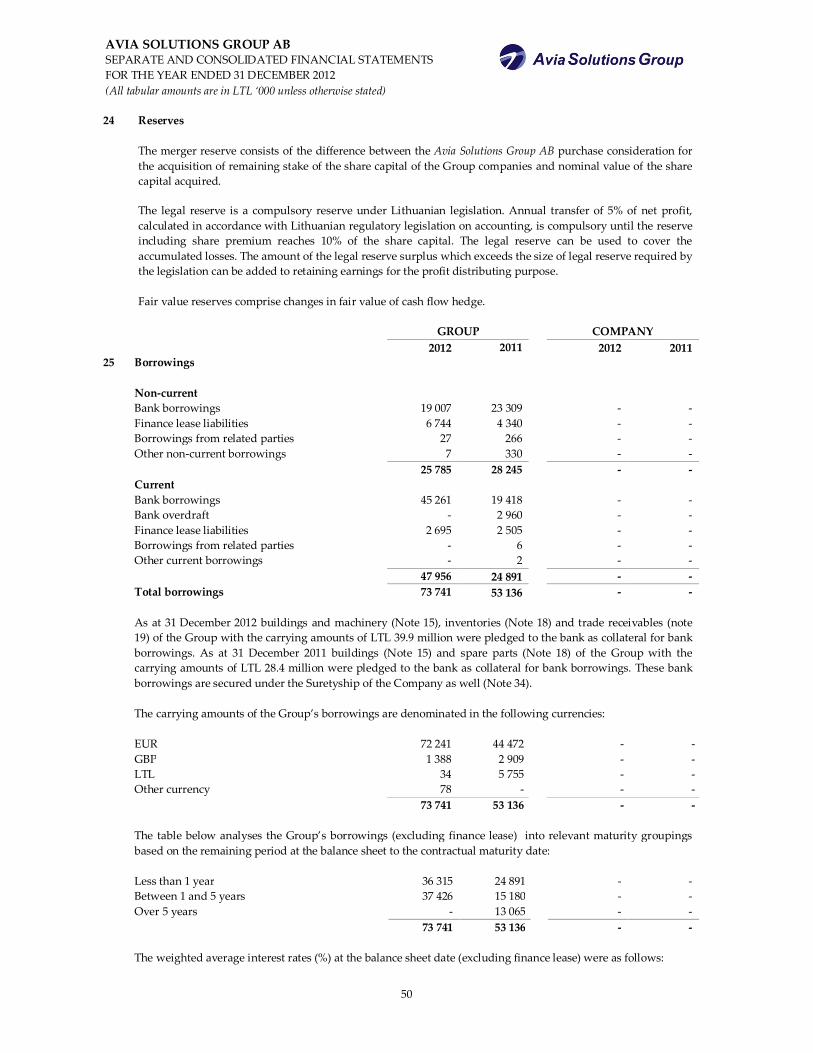
AVIA SOLUTIONS GROUP AB SEPARATE AND CONSOLIDATED FINANCIAL STATEMENTS FOR THE YEAR ENDED 31 DECEMBER 2012 (All tabular amounts are in LTL ‘000 unless otherwise stated)
50
24 Reserves The merger reserve consists of the difference between the Avia Solutions Group AB purchase consideration for
the acquisition of remaining stake of the share capital of the Group companies and nominal value of the share capital acquired. The legal reserve is a compulsory reserve under Lithuanian legislation. Annual transfer of 5% of net profit, calculated in accordance with Lithuanian regulatory legislation on accounting, is compulsory until the reserve including share premium reaches 10% of the share capital. The legal reserve can be used to cover the accumulated losses. The amount of the legal reserve surplus which exceeds the size of legal reserve required by the legislation can be added to retaining earnings for the profit distributing purpose. Fair value reserves comprise changes in fair value of cash flow hedge.
GROUP COMPANY 2012 2011 2012 2011 25 Borrowings Non-current Bank borrowings 19 007 23 309 - - Finance lease liabilities 6 744 4 340 - - Borrowings from related parties 27 266 - - Other non-current borrowings 7 330 - - 25 785 28 245 - - Current Bank borrowings 45 261 19 418 - - Bank overdraft - 2 960 - - Finance lease liabilities 2 695 2 505 - - Borrowings from related parties - 6 - - Other current borrowings - 2 - - 47 956 24 891 - - Total borrowings 73 741 53 136 - - As at 31 December 2012 buildings and machinery (Note 15), inventories (Note 18) and trade receivables (note
19) of the Group with the carrying amounts of LTL 39.9 million were pledged to the bank as collateral for bank borrowings. As at 31 December 2011 buildings (Note 15) and spare parts (Note 18) of the Group with the carrying amounts of LTL 28.4 million were pledged to the bank as collateral for bank borrowings. These bank borrowings are secured under the Suretyship of the Company as well (Note 34). The carrying amounts of the Group’s borrowings are denominated in the following currencies:
EUR 72 241 44 472 - - GBP 1 388 2 909 - - LTL 34 5 755 - - Other currency 78 - - - 73 741 53 136 - - The table below analyses the Group’s borrowings (excluding finance lease) into relevant maturity groupings
based on the remaining period at the balance sheet to the contractual maturity date: Less than 1 year 36 315 24 891 - - Between 1 and 5 years 37 426 15 180 - - Over 5 years - 13 065 - - 73 741 53 136 - - The weighted average interest rates (%) at the balance sheet date (excluding finance lease) were as follows:
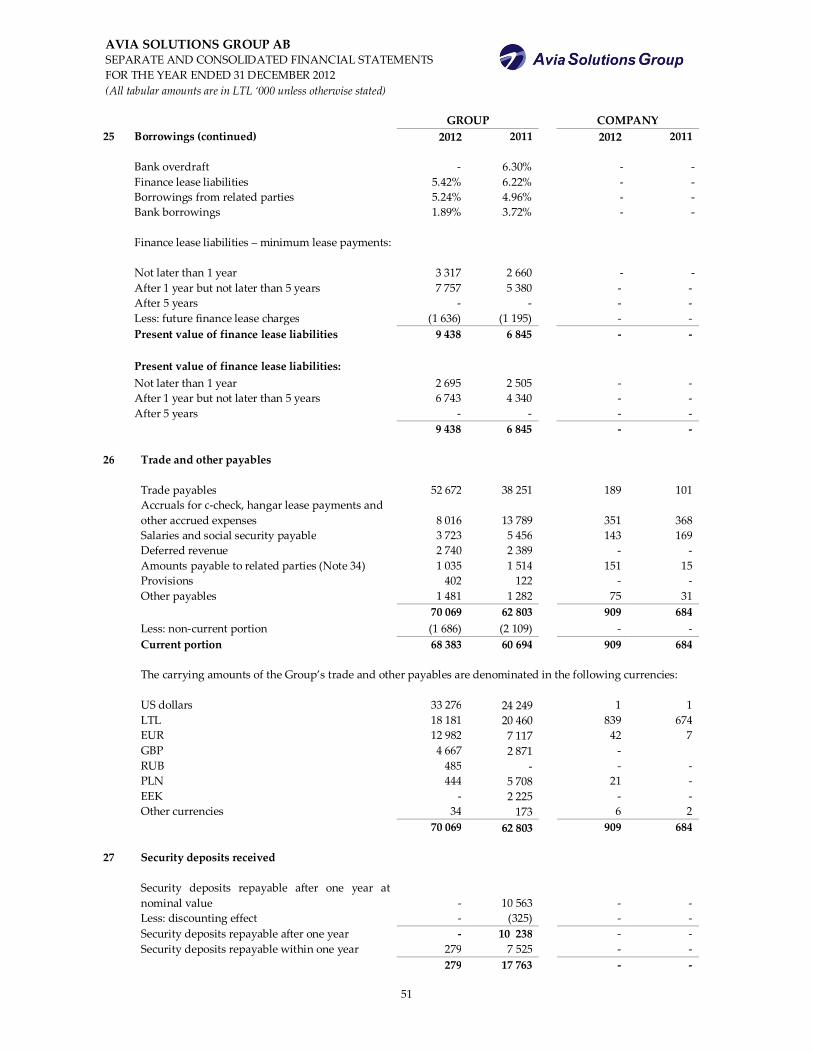
AVIA SOLUTIONS GROUP AB SEPARATE AND CONSOLIDATED FINANCIAL STATEMENTS FOR THE YEAR ENDED 31 DECEMBER 2012 (All tabular amounts are in LTL ‘000 unless otherwise stated)
51
GROUP COMPANY 25 Borrowings (continued) 2012 2011 2012 2011 Bank overdraft - 6.30% - - Finance lease liabilities 5.42% 6.22% - - Borrowings from related parties 5.24% 4.96% - - Bank borrowings 1.89% 3.72% - - Finance lease liabilities – minimum lease payments: Not later than 1 year 3 317 2 660 - - After 1 year but not later than 5 years 7 757 5 380 - - After 5 years - - - - Less: future finance lease charges (1 636) (1 195) - - Present value of finance lease liabilities 9 438 6 845 - - Present value of finance lease liabilities: Not later than 1 year 2 695 2 505 - - After 1 year but not later than 5 years 6 743 4 340 - - After 5 years - - - - 9 438 6 845 - - 26 Trade and other payables
Trade payables 52 672 38 251 189 101
Accruals for c-check, hangar lease payments and other accrued expenses 8 016 13 789 351 368
Salaries and social security payable 3 723 5 456 143 169 Deferred revenue 2 740 2 389 - - Amounts payable to related parties (Note 34) 1 035 1 514 151 15 Provisions 402 122 - - Other payables 1 481 1 282 75 31 70 069 62 803 909 684 Less: non-current portion (1 686) (2 109) - - Current portion 68 383 60 694 909 684
The carrying amounts of the Group’s trade and other payables are denominated in the following currencies: US dollars 33 276 24 249 1 1 LTL 18 181 20 460 839 674 EUR 12 982 7 117 42 7 GBP 4 667 2 871 - RUB 485 - - - PLN 444 5 708 21 - EEK - 2 225 - - Other currencies 34 173 6 2 70 069 62 803 909 684 27 Security deposits received Security deposits repayable after one year at
nominal value - 10 563 - - Less: discounting effect - (325) - - Security deposits repayable after one year - 10 238 - - Security deposits repayable within one year 279 7 525 - - 279 17 763 - -
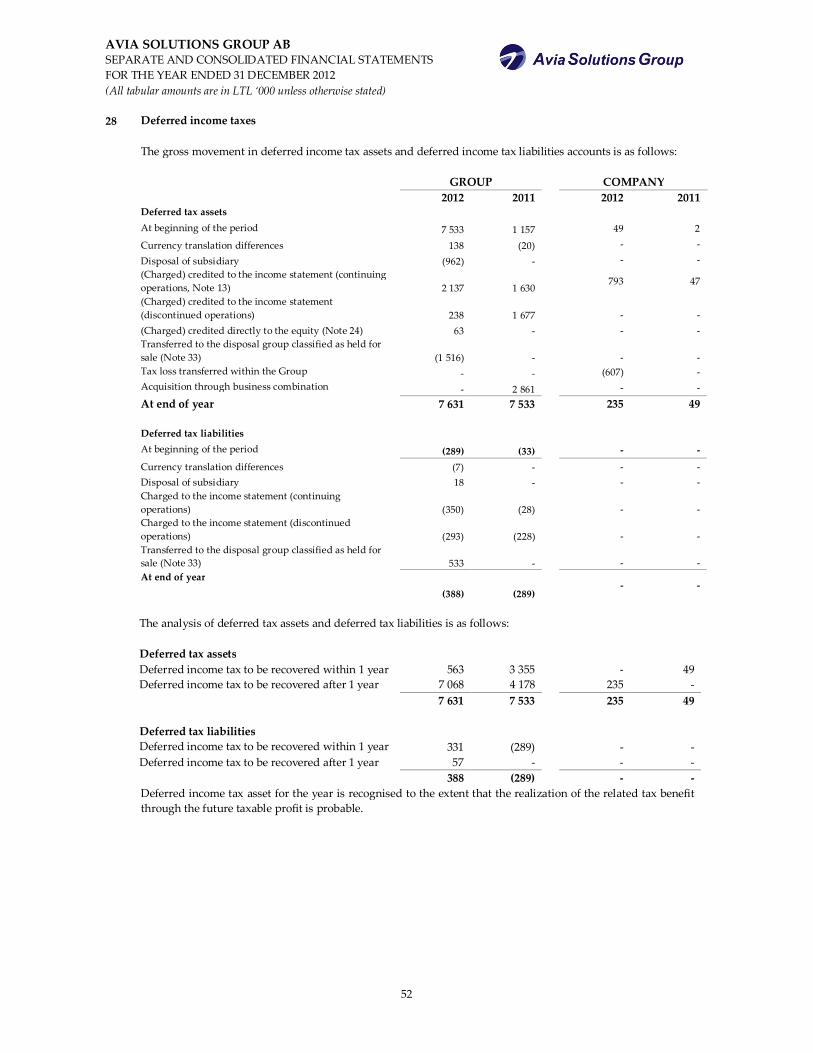
AVIA SOLUTIONS GROUP AB SEPARATE AND CONSOLIDATED FINANCIAL STATEMENTS FOR THE YEAR ENDED 31 DECEMBER 2012 (All tabular amounts are in LTL ‘000 unless otherwise stated)
52
28 Deferred income taxes
The gross movement in deferred income tax assets and deferred income tax liabilities accounts is as follows:
GROUP COMPANY 2012 2011 2012 2011 Deferred tax assets At beginning of the period 7 533 1 157 49 2 Currency translation differences 138 (20) - - Disposal of subsidiary (962) - - -
(Charged) credited to the income statement (continuing operations, Note 13) 2 137 1 630
793 47
(Charged) credited to the income statement (discontinued operations) 238 1 677
- -
(Charged) credited directly to the equity (Note 24) 63 - - -
Transferred to the disposal group classified as held for sale (Note 33) (1 516) -
- -
Tax loss transferred within the Group - - (607) - Acquisition through business combination - 2 861 - -
At end of year 7 631 7 533 235 49 Deferred tax liabilities At beginning of the period (289) (33) - - Currency translation differences (7) - - - Disposal of subsidiary 18 - - -
Charged to the income statement (continuing operations) (350) (28)
- -
Charged to the income statement (discontinued operations) (293) (228)
- -
Transferred to the disposal group classified as held for sale (Note 33) 533 -
- -
At end of year
(388) (289) - -
The analysis of deferred tax assets and deferred tax liabilities is as follows:
Deferred tax assets Deferred income tax to be recovered within 1 year 563 3 355 - 49 Deferred income tax to be recovered after 1 year 7 068 4 178 235 - 7 631 7 533 235 49 Deferred tax liabilities Deferred income tax to be recovered within 1 year 331 (289) - - Deferred income tax to be recovered after 1 year 57 - - - 388 (289) - - Deferred income tax asset for the year is recognised to the extent that the realization of the related tax benefit
through the future taxable profit is probable.
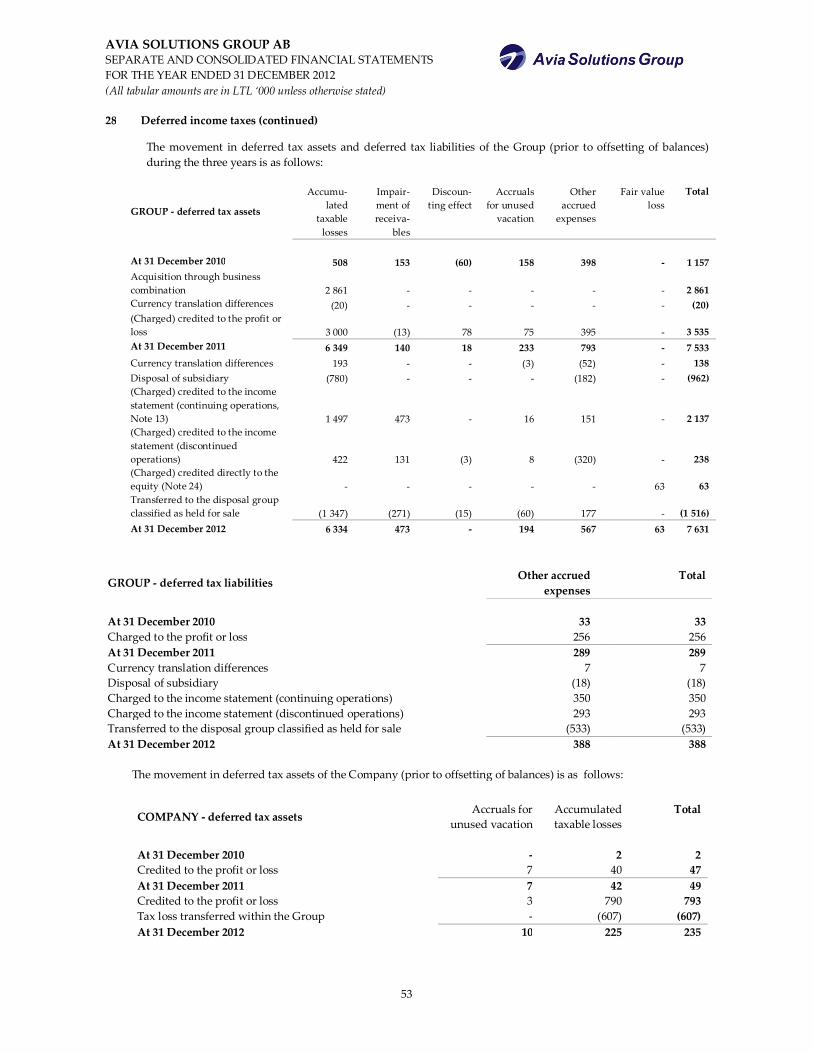
AVIA SOLUTIONS GROUP AB SEPARATE AND CONSOLIDATED FINANCIAL STATEMENTS FOR THE YEAR ENDED 31 DECEMBER 2012 (All tabular amounts are in LTL ‘000 unless otherwise stated)
53
28 Deferred income taxes (continued)
The movement in deferred tax assets of the Company (prior to offsetting of balances) is as follows:
COMPANY - deferred tax assets Accruals for unused vacation
Accumulated taxable losses
Total
At 31 December 2010 - 2 2 Credited to the profit or loss 7 40 47 At 31 December 2011 7 42 49 Credited to the profit or loss 3 790 793 Tax loss transferred within the Group - (607) (607) At 31 December 2012 10 225 235
The movement in deferred tax assets and deferred tax liabilities of the Group (prior to offsetting of balances) during the three years is as follows:
GROUP - deferred tax assets
Accumu-lated
taxable losses
Impair-ment of receiva-
bles
Discoun-ting effect
Accruals for unused
vacation
Other accrued
expenses
Fair value loss
Total
At 31 December 2010 508 153 (60) 158 398 - 1 157
Acquisition through business combination 2 861 - - - - - 2 861
Currency translation differences (20) - - - - - (20)
(Charged) credited to the profit or loss 3 000 (13) 78 75 395 - 3 535
At 31 December 2011 6 349 140 18 233 793 - 7 533 Currency translation differences 193 - - (3) (52) - 138 Disposal of subsidiary (780) - - - (182) - (962)
(Charged) credited to the income statement (continuing operations, Note 13) 1 497 473 - 16 151 - 2 137
(Charged) credited to the income statement (discontinued operations) 422 131 (3) 8 (320) - 238
(Charged) credited directly to the equity (Note 24) - - - - - 63 63
Transferred to the disposal group classified as held for sale (1 347) (271) (15) (60) 177 - (1 516)
At 31 December 2012 6 334 473 - 194 567 63 7 631
GROUP - deferred tax liabilities Other accrued expenses
Total
At 31 December 2010 33 33 Charged to the profit or loss 256 256 At 31 December 2011 289 289 Currency translation differences 7 7 Disposal of subsidiary (18) (18) Charged to the income statement (continuing operations) 350 350 Charged to the income statement (discontinued operations) 293 293 Transferred to the disposal group classified as held for sale (533) (533) At 31 December 2012 388 388
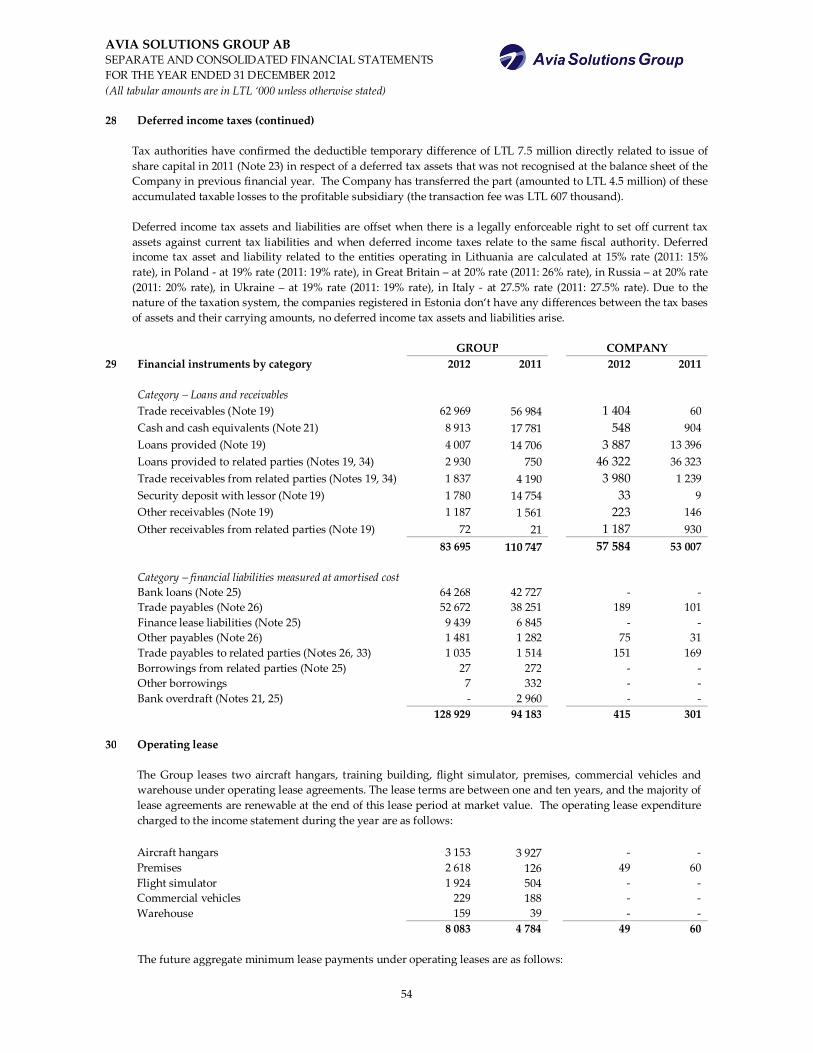
AVIA SOLUTIONS GROUP AB SEPARATE AND CONSOLIDATED FINANCIAL STATEMENTS FOR THE YEAR ENDED 31 DECEMBER 2012 (All tabular amounts are in LTL ‘000 unless otherwise stated)
54
28 Deferred income taxes (continued)
Tax authorities have confirmed the deductible temporary difference of LTL 7.5 million directly related to issue of share capital in 2011 (Note 23) in respect of a deferred tax assets that was not recognised at the balance sheet of the Company in previous financial year. The Company has transferred the part (amounted to LTL 4.5 million) of these accumulated taxable losses to the profitable subsidiary (the transaction fee was LTL 607 thousand). Deferred income tax assets and liabilities are offset when there is a legally enforceable right to set off current tax assets against current tax liabilities and when deferred income taxes relate to the same fiscal authority. Deferred income tax asset and liability related to the entities operating in Lithuania are calculated at 15% rate (2011: 15% rate), in Poland - at 19% rate (2011: 19% rate), in Great Britain – at 20% rate (2011: 26% rate), in Russia – at 20% rate (2011: 20% rate), in Ukraine – at 19% rate (2011: 19% rate), in Italy - at 27.5% rate (2011: 27.5% rate). Due to the nature of the taxation system, the companies registered in Estonia don‘t have any differences between the tax bases of assets and their carrying amounts, no deferred income tax assets and liabilities arise.
GROUP COMPANY 29 Financial instruments by category 2012 2011 2012 2011 Category – Loans and receivables Trade receivables (Note 19) 62 969 56 984 1 404 60 Cash and cash equivalents (Note 21) 8 913 17 781 548 904 Loans provided (Note 19) 4 007 14 706 3 887 13 396 Loans provided to related parties (Notes 19, 34) 2 930 750 46 322 36 323 Trade receivables from related parties (Notes 19, 34) 1 837 4 190 3 980 1 239 Security deposit with lessor (Note 19) 1 780 14 754 33 9 Other receivables (Note 19) 1 187 1 561 223 146 Other receivables from related parties (Note 19) 72 21 1 187 930 83 695 110 747 57 584 53 007
Category – financial liabilities measured at amortised cost
Bank loans (Note 25) 64 268 42 727 - - Trade payables (Note 26) 52 672 38 251 189 101 Finance lease liabilities (Note 25) 9 439 6 845 - - Other payables (Note 26) 1 481 1 282 75 31 Trade payables to related parties (Notes 26, 33) 1 035 1 514 151 169 Borrowings from related parties (Note 25) 27 272 - - Other borrowings 7 332 - - Bank overdraft (Notes 21, 25) - 2 960 - - 128 929 94 183 415 301 30 Operating lease The Group leases two aircraft hangars, training building, flight simulator, premises, commercial vehicles and
warehouse under operating lease agreements. The lease terms are between one and ten years, and the majority of lease agreements are renewable at the end of this lease period at market value. The operating lease expenditure charged to the income statement during the year are as follows:
Aircraft hangars 3 153 3 927 - - Premises 2 618 126 49 60 Flight simulator 1 924 504 - - Commercial vehicles 229 188 - - Warehouse 159 39 - - 8 083 4 784 49 60 The future aggregate minimum lease payments under operating leases are as follows:
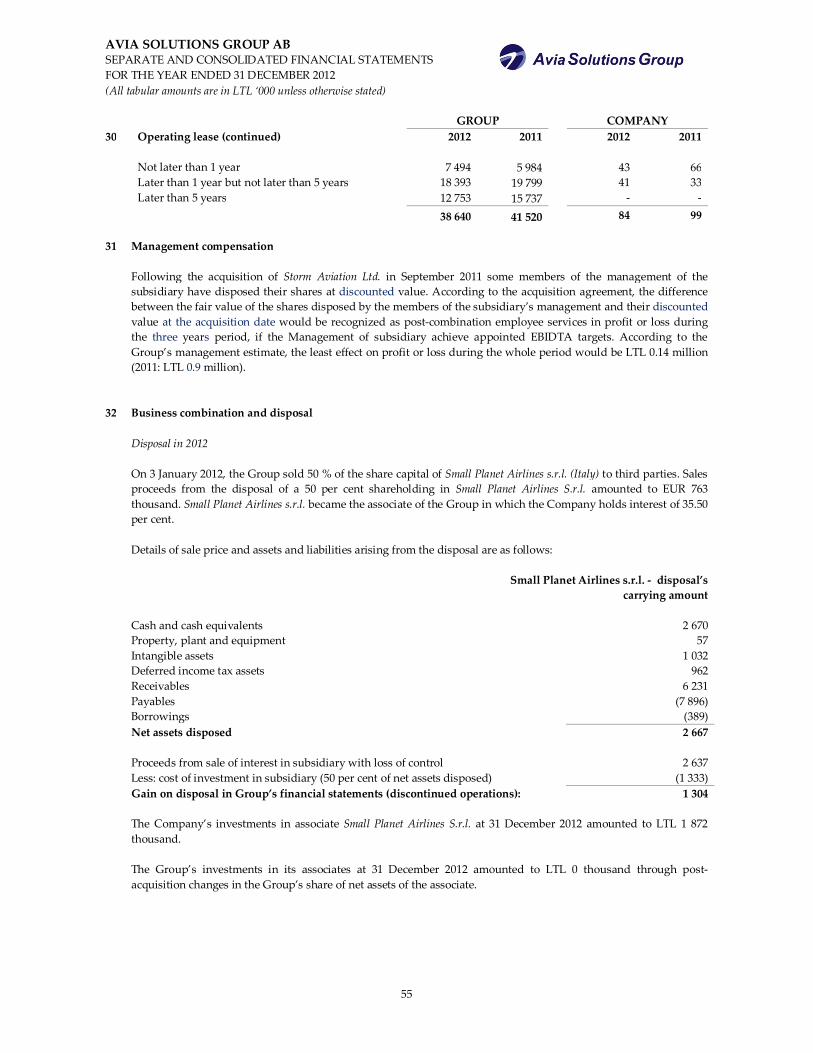
AVIA SOLUTIONS GROUP AB SEPARATE AND CONSOLIDATED FINANCIAL STATEMENTS FOR THE YEAR ENDED 31 DECEMBER 2012 (All tabular amounts are in LTL ‘000 unless otherwise stated)
55
GROUP COMPANY 30 Operating lease (continued) 2012 2011 2012 2011 Not later than 1 year 7 494 5 984 43 66 Later than 1 year but not later than 5 years 18 393 19 799 41 33 Later than 5 years 12 753 15 737 - - 38 640 41 520 84 99 31 Management compensation Following the acquisition of Storm Aviation Ltd. in September 2011 some members of the management of the
subsidiary have disposed their shares at discounted value. According to the acquisition agreement, the difference between the fair value of the shares disposed by the members of the subsidiary’s management and their discounted value at the acquisition date would be recognized as post-combination employee services in profit or loss during the three years period, if the Management of subsidiary achieve appointed EBIDTA targets. According to the Group’s management estimate, the least effect on profit or loss during the whole period would be LTL 0.14 million (2011: LTL 0.9 million).
32 Business combination and disposal
Disposal in 2012
On 3 January 2012, the Group sold 50 % of the share capital of Small Planet Airlines s.r.l. (Italy) to third parties. Sales proceeds from the disposal of a 50 per cent shareholding in Small Planet Airlines S.r.l. amounted to EUR 763 thousand. Small Planet Airlines s.r.l. became the associate of the Group in which the Company holds interest of 35.50 per cent. Details of sale price and assets and liabilities arising from the disposal are as follows:
Small Planet Airlines s.r.l. - disposal’s
carrying amount Cash and cash equivalents 2 670 Property, plant and equipment 57 Intangible assets 1 032 Deferred income tax assets 962 Receivables 6 231 Payables (7 896) Borrowings (389) Net assets disposed 2 667 Proceeds from sale of interest in subsidiary with loss of control 2 637 Less: cost of investment in subsidiary (50 per cent of net assets disposed) (1 333) Gain on disposal in Group’s financial statements (discontinued operations): 1 304 The Company’s investments in associate Small Planet Airlines S.r.l. at 31 December 2012 amounted to LTL 1 872
thousand. The Group’s investments in its associates at 31 December 2012 amounted to LTL 0 thousand through post-acquisition changes in the Group’s share of net assets of the associate.
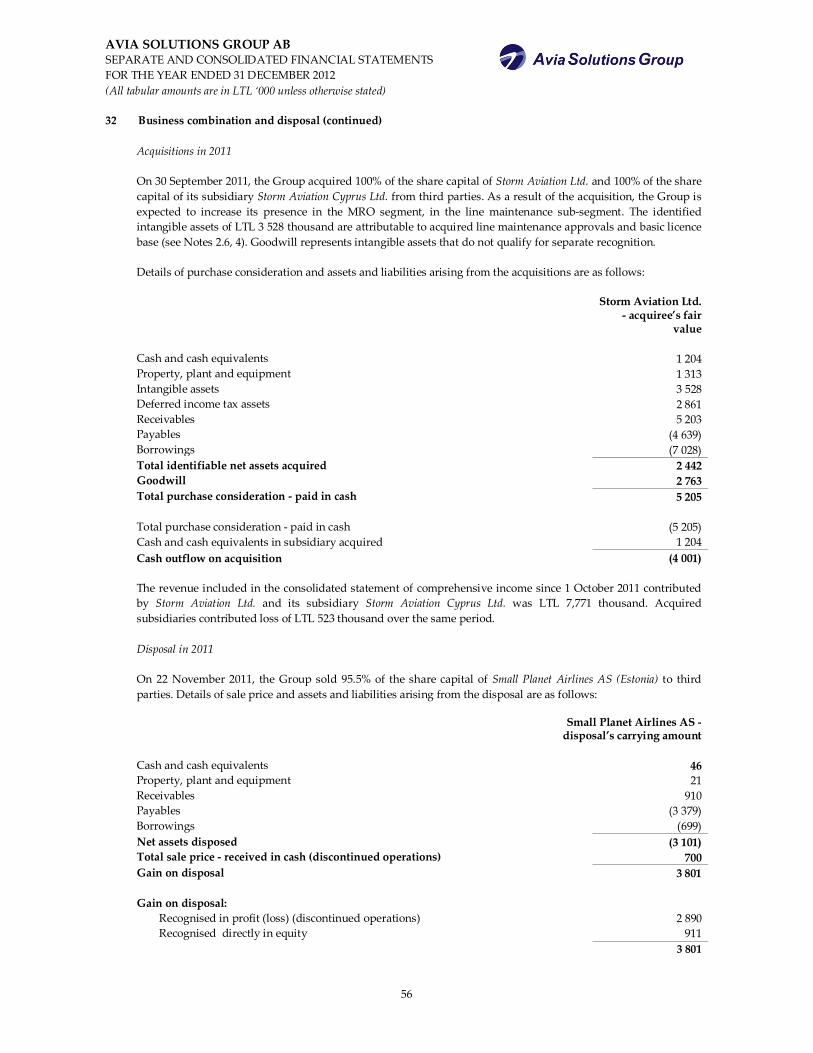
AVIA SOLUTIONS GROUP AB SEPARATE AND CONSOLIDATED FINANCIAL STATEMENTS FOR THE YEAR ENDED 31 DECEMBER 2012 (All tabular amounts are in LTL ‘000 unless otherwise stated)
56
32 Business combination and disposal (continued)
Acquisitions in 2011 On 30 September 2011, the Group acquired 100% of the share capital of Storm Aviation Ltd. and 100% of the share capital of its subsidiary Storm Aviation Cyprus Ltd. from third parties. As a result of the acquisition, the Group is expected to increase its presence in the MRO segment, in the line maintenance sub-segment. The identified intangible assets of LTL 3 528 thousand are attributable to acquired line maintenance approvals and basic licence base (see Notes 2.6, 4). Goodwill represents intangible assets that do not qualify for separate recognition. Details of purchase consideration and assets and liabilities arising from the acquisitions are as follows:
Storm Aviation Ltd. - acquiree’s fair
value Cash and cash equivalents 1 204 Property, plant and equipment 1 313 Intangible assets 3 528 Deferred income tax assets 2 861 Receivables 5 203 Payables (4 639) Borrowings (7 028) Total identifiable net assets acquired 2 442 Goodwill 2 763 Total purchase consideration - paid in cash 5 205 Total purchase consideration - paid in cash (5 205) Cash and cash equivalents in subsidiary acquired 1 204 Cash outflow on acquisition (4 001) The revenue included in the consolidated statement of comprehensive income since 1 October 2011 contributed
by Storm Aviation Ltd. and its subsidiary Storm Aviation Cyprus Ltd. was LTL 7,771 thousand. Acquired subsidiaries contributed loss of LTL 523 thousand over the same period.
Disposal in 2011 On 22 November 2011, the Group sold 95.5% of the share capital of Small Planet Airlines AS (Estonia) to third parties. Details of sale price and assets and liabilities arising from the disposal are as follows:
Small Planet Airlines AS - disposal’s carrying amount
Cash and cash equivalents 46 Property, plant and equipment 21 Receivables 910 Payables (3 379) Borrowings (699) Net assets disposed (3 101) Total sale price - received in cash (discontinued operations) 700 Gain on disposal 3 801 Gain on disposal: Recognised in profit (loss) (discontinued operations) 2 890 Recognised directly in equity 911
3 801
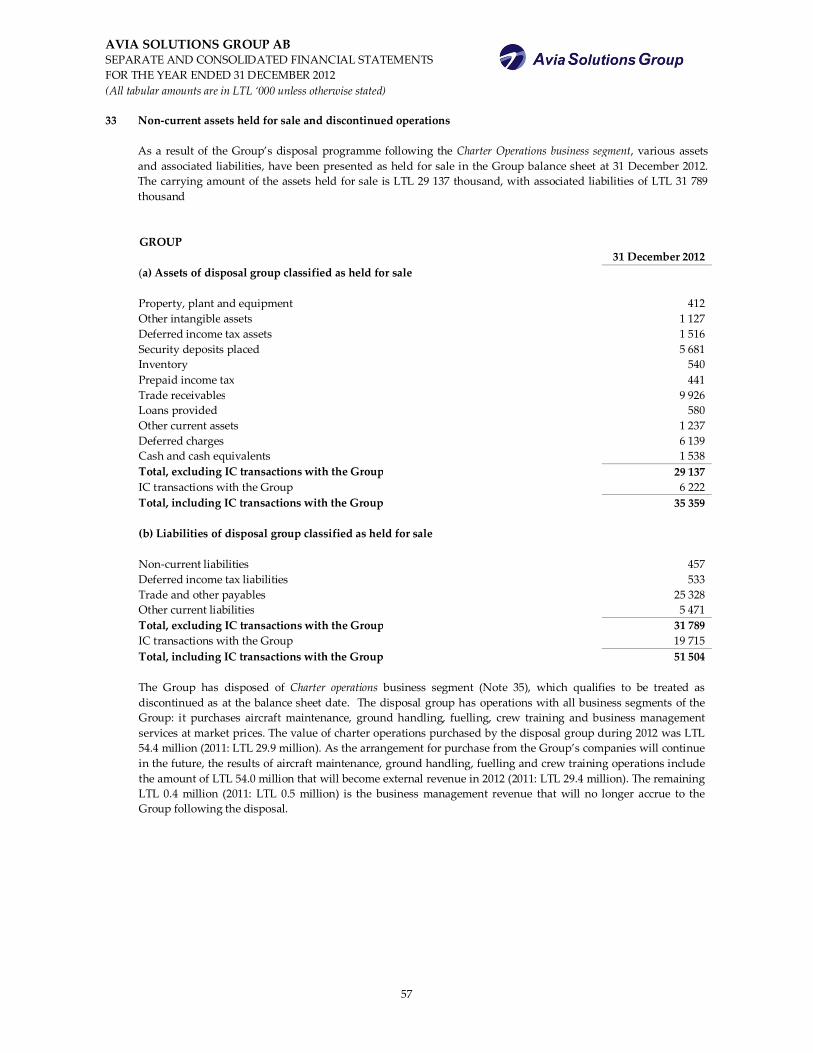
AVIA SOLUTIONS GROUP AB SEPARATE AND CONSOLIDATED FINANCIAL STATEMENTS FOR THE YEAR ENDED 31 DECEMBER 2012 (All tabular amounts are in LTL ‘000 unless otherwise stated)
57
33 Non-current assets held for sale and discontinued operations As a result of the Group’s disposal programme following the Charter Operations business segment, various assets
and associated liabilities, have been presented as held for sale in the Group balance sheet at 31 December 2012. The carrying amount of the assets held for sale is LTL 29 137 thousand, with associated liabilities of LTL 31 789 thousand
GROUP 31 December 2012 (a) Assets of disposal group classified as held for sale Property, plant and equipment 412 Other intangible assets 1 127 Deferred income tax assets 1 516 Security deposits placed 5 681 Inventory 540 Prepaid income tax 441 Trade receivables 9 926 Loans provided 580 Other current assets 1 237 Deferred charges 6 139 Cash and cash equivalents 1 538 Total, excluding IC transactions with the Group 29 137 IC transactions with the Group 6 222 Total, including IC transactions with the Group 35 359 (b) Liabilities of disposal group classified as held for sale Non-current liabilities 457 Deferred income tax liabilities 533 Trade and other payables 25 328 Other current liabilities 5 471 Total, excluding IC transactions with the Group 31 789 IC transactions with the Group 19 715 Total, including IC transactions with the Group 51 504 The Group has disposed of Charter operations business segment (Note 35), which qualifies to be treated as discontinued as at the balance sheet date. The disposal group has operations with all business segments of the Group: it purchases aircraft maintenance, ground handling, fuelling, crew training and business management services at market prices. The value of charter operations purchased by the disposal group during 2012 was LTL 54.4 million (2011: LTL 29.9 million). As the arrangement for purchase from the Group’s companies will continue in the future, the results of aircraft maintenance, ground handling, fuelling and crew training operations include the amount of LTL 54.0 million that will become external revenue in 2012 (2011: LTL 29.4 million). The remaining LTL 0.4 million (2011: LTL 0.5 million) is the business management revenue that will no longer accrue to the Group following the disposal.
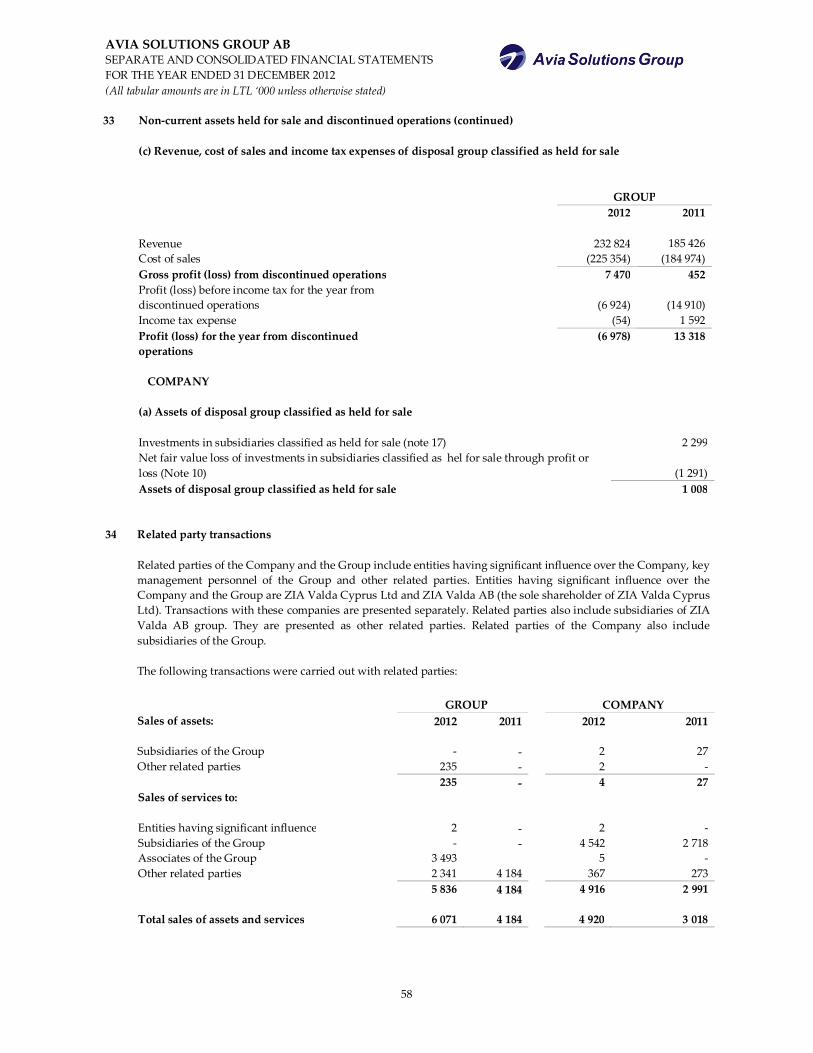
AVIA SOLUTIONS GROUP AB SEPARATE AND CONSOLIDATED FINANCIAL STATEMENTS FOR THE YEAR ENDED 31 DECEMBER 2012 (All tabular amounts are in LTL ‘000 unless otherwise stated)
58
33 Non-current assets held for sale and discontinued operations (continued) (c) Revenue, cost of sales and income tax expenses of disposal group classified as held for sale GROUP 2012 2011 Revenue 232 824 185 426 Cost of sales (225 354) (184 974) Gross profit (loss) from discontinued operations 7 470 452 Profit (loss) before income tax for the year from discontinued operations (6 924) (14 910) Income tax expense (54) 1 592 Profit (loss) for the year from discontinued operations
(6 978) 13 318
COMPANY
(a) Assets of disposal group classified as held for sale Investments in subsidiaries classified as held for sale (note 17) 2 299 Net fair value loss of investments in subsidiaries classified as hel for sale through profit or loss (Note 10) (1 291) Assets of disposal group classified as held for sale 1 008
34 Related party transactions Related parties of the Company and the Group include entities having significant influence over the Company, key
management personnel of the Group and other related parties. Entities having significant influence over the Company and the Group are ZIA Valda Cyprus Ltd and ZIA Valda AB (the sole shareholder of ZIA Valda Cyprus Ltd). Transactions with these companies are presented separately. Related parties also include subsidiaries of ZIA Valda AB group. They are presented as other related parties. Related parties of the Company also include subsidiaries of the Group.
The following transactions were carried out with related parties:
GROUP COMPANY Sales of assets: 2012 2011 2012 2011 Subsidiaries of the Group - - 2 27 Other related parties 235 - 2 - 235 - 4 27 Sales of services to: Entities having significant influence 2 - 2 - Subsidiaries of the Group - - 4 542 2 718 Associates of the Group 3 493 5 - Other related parties 2 341 4 184 367 273 5 836 4 184 4 916 2 991 Total sales of assets and services 6 071 4 184 4 920 3 018
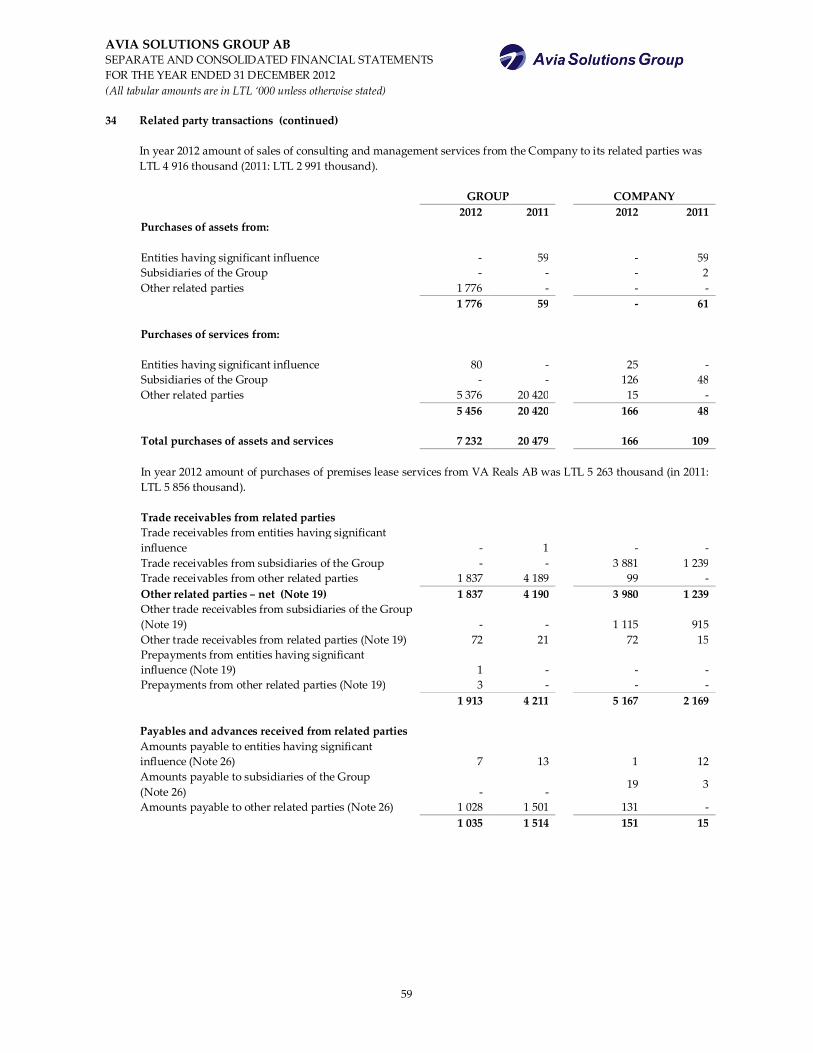
AVIA SOLUTIONS GROUP AB SEPARATE AND CONSOLIDATED FINANCIAL STATEMENTS FOR THE YEAR ENDED 31 DECEMBER 2012 (All tabular amounts are in LTL ‘000 unless otherwise stated)
59
34 Related party transactions (continued) In year 2012 amount of sales of consulting and management services from the Company to its related parties was
LTL 4 916 thousand (2011: LTL 2 991 thousand).
GROUP COMPANY 2012 2011 2012 2011 Purchases of assets from: Entities having significant influence - 59 - 59 Subsidiaries of the Group - - - 2 Other related parties 1 776 - - - 1 776 59 - 61 Purchases of services from: Entities having significant influence 80 - 25 - Subsidiaries of the Group - - 126 48 Other related parties 5 376 20 420 15 - 5 456 20 420 166 48 Total purchases of assets and services 7 232 20 479 166 109
In year 2012 amount of purchases of premises lease services from VA Reals AB was LTL 5 263 thousand (in 2011: LTL 5 856 thousand).
Trade receivables from related parties Trade receivables from entities having significant
influence - 1 - - Trade receivables from subsidiaries of the Group - - 3 881 1 239 Trade receivables from other related parties 1 837 4 189 99 - Other related parties – net (Note 19) 1 837 4 190 3 980 1 239 Other trade receivables from subsidiaries of the Group
(Note 19) - - 1 115 915 Other trade receivables from related parties (Note 19) 72 21 72 15 Prepayments from entities having significant
influence (Note 19) 1 - - - Prepayments from other related parties (Note 19) 3 - - - 1 913 4 211 5 167 2 169 Payables and advances received from related parties Amounts payable to entities having significant
influence (Note 26) 7 13 1 12 Amounts payable to subsidiaries of the Group
(Note 26) - - 19 3
Amounts payable to other related parties (Note 26) 1 028 1 501 131 - 1 035 1 514 151 15
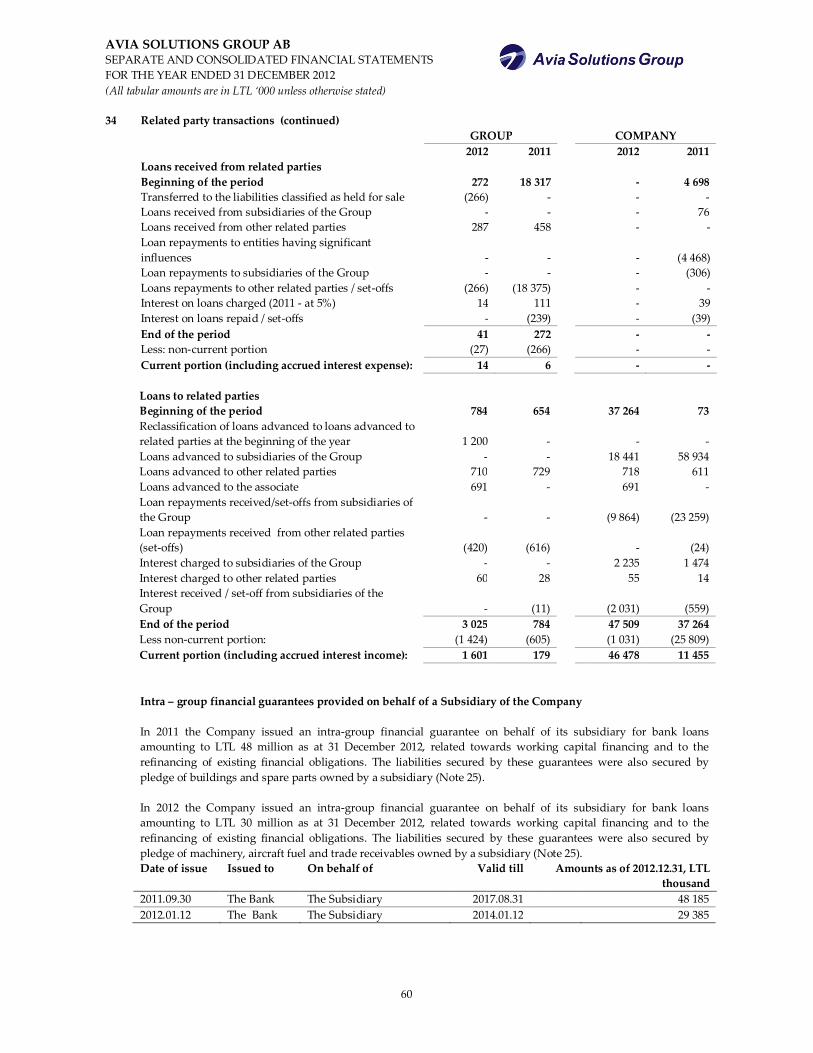
AVIA SOLUTIONS GROUP AB SEPARATE AND CONSOLIDATED FINANCIAL STATEMENTS FOR THE YEAR ENDED 31 DECEMBER 2012 (All tabular amounts are in LTL ‘000 unless otherwise stated)
60
34 Related party transactions (continued) GROUP COMPANY 2012 2011 2012 2011 Loans received from related parties Beginning of the period 272 18 317 - 4 698 Transferred to the liabilities classified as held for sale (266) - - - Loans received from subsidiaries of the Group - - - 76 Loans received from other related parties 287 458 - - Loan repayments to entities having significant
influences - - - (4 468) Loan repayments to subsidiaries of the Group - - - (306) Loans repayments to other related parties / set-offs (266) (18 375) - - Interest on loans charged (2011 - at 5%) 14 111 - 39 Interest on loans repaid / set-offs - (239) - (39) End of the period 41 272 - - Less: non-current portion (27) (266) - - Current portion (including accrued interest expense): 14 6 - - Loans to related parties Beginning of the period 784 654 37 264 73 Reclassification of loans advanced to loans advanced to
related parties at the beginning of the year 1 200 - - - Loans advanced to subsidiaries of the Group - - 18 441 58 934 Loans advanced to other related parties 710 729 718 611 Loans advanced to the associate 691 - 691 - Loan repayments received/set-offs from subsidiaries of
the Group - - (9 864) (23 259) Loan repayments received from other related parties
(set-offs) (420) (616) - (24) Interest charged to subsidiaries of the Group - - 2 235 1 474 Interest charged to other related parties 60 28 55 14 Interest received / set-off from subsidiaries of the
Group - (11) (2 031) (559) End of the period 3 025 784 47 509 37 264 Less non-current portion: (1 424) (605) (1 031) (25 809) Current portion (including accrued interest income): 1 601 179 46 478 11 455
Intra – group financial guarantees provided on behalf of a Subsidiary of the Company
In 2011 the Company issued an intra-group financial guarantee on behalf of its subsidiary for bank loans
amounting to LTL 48 million as at 31 December 2012, related towards working capital financing and to the refinancing of existing financial obligations. The liabilities secured by these guarantees were also secured by pledge of buildings and spare parts owned by a subsidiary (Note 25). In 2012 the Company issued an intra-group financial guarantee on behalf of its subsidiary for bank loans amounting to LTL 30 million as at 31 December 2012, related towards working capital financing and to the refinancing of existing financial obligations. The liabilities secured by these guarantees were also secured by pledge of machinery, aircraft fuel and trade receivables owned by a subsidiary (Note 25).
Date of issue Issued to On behalf of Valid till Amounts as of 2012.12.31, LTL thousand
2011.09.30 The Bank The Subsidiary 2017.08.31 48 185 2012.01.12 The Bank The Subsidiary 2014.01.12 29 385
AVIA SOLUTIONS GROUP AB SEPARATE AND CONSOLIDATED FINANCIAL STATEMENTS FOR THE YEAR ENDED 31 DECEMBER 2012 (All tabular amounts are in LTL ‘000 unless otherwise stated)
61
35 Remuneration of the Group’s and the Company’s key management Key management includes General Directors of the Group companies, Chief Financial Officer, Financial
Directors of the Group companies, Directors of main units and departments. Transactions with Group’s key management are as follows:
GROUP COMPANY 2012 2011 2012 2011 Salaries 8 103 6 125 720 525 Social insurance expenses 2 457 1 724 222 163 Bonuses 206 195 - - 10 766 8 044 942 688 The number of key management at the end of year 56 60 3 3 36 Events after the balance sheet date The Company sold it‘s 95,5% stakes in Small Planet Airlines UAB (Lithuania) and Small Planet Airlines Sp. z o. o.
(Poland) to the management of these companies Mr. Vytautas Kaikaris (65,5%) and Mr. Andrius Staniulis (30%). Before the transaction Mr. Vytautas Kaikaris already owned 4,5% stake in both companies. On the 8 April 2013 the Company issued guarantee to a bank on behalf of a subsidiary in the amount of EUR 5.32 million to secure the bank loan for financing the cost related to the aviation hangar construction.
General Manager Chief Financial Officer Linas Dovydėnas Aurimas Sanikovas