Embed Size (px)
Citation preview
1FY2014 Results – Investors Presentation
20 May 2014
FY2014 Results –Investors PresentationAshokRamamurthy, Group ManagingDirector
Your Bank. Malaysia’s Bank. AmBank.

2Your Bank. Malaysia’s Bank. AmBank.
FY2014 Results – Investors PresentationYour Bank. Malaysia’s Bank. AmBank.
AGENDA Page
1. EXECUTIVE SUMMARY 3
2. STRATEGIC PARTNERSHIP/INTEGRATION UPDATES 10
3. FY2014 GROUP FINANCIAL PERFORMANCE 17
4. OUTLOOK & STRATEGIC PRIORITIES 32
5. DIVISIONAL STRATEGY & PERFORMANCE 38
6. SUPPLEMENTARY INFORMATION 45
- AMBANK GROUP
- ECONOMY & INDUSTRY
3Your Bank. Malaysia’s Bank. AmBank.
FY2014 Results – Investors Presentation
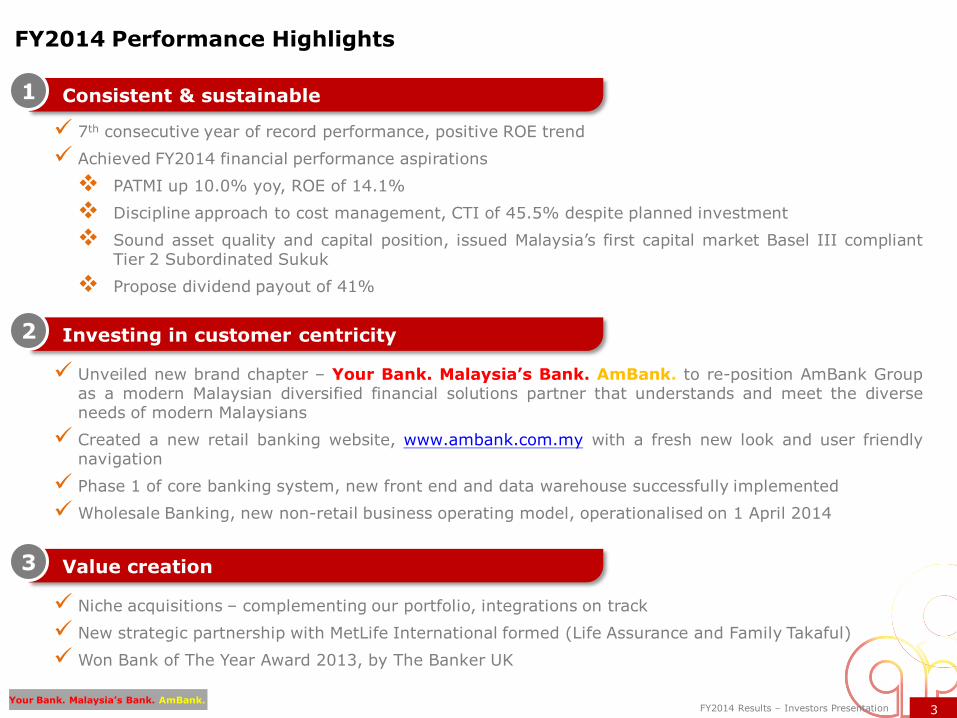
FY2014 Performance Highlights
7th consecutive year of record performance, positive ROE trend
Achieved FY2014 financial performance aspirations
PATMI up 10.0% yoy, ROE of 14.1%
Discipline approach to cost management, CTI of 45.5% despite planned investment
Sound asset quality and capital position, issued Malaysia‟s first capital market Basel III compliantTier 2 Subordinated Sukuk
Propose dividend payout of 41%
Unveiled new brand chapter – Your Bank. Malaysia’s Bank. AmBank. to re-position AmBank Groupas a modern Malaysian diversified financial solutions partner that understands and meet the diverseneeds of modern Malaysians
Created a new retail banking website, www.ambank.com.my with a fresh new look and user friendlynavigation
Phase 1 of core banking system, new front end and data warehouse successfully implemented
Wholesale Banking, new non-retail business operating model, operationalised on 1 April 2014
Niche acquisitions – complementing our portfolio, integrations on track
New strategic partnership with MetLife International formed (Life Assurance and Family Takaful)
Won Bank of The Year Award 2013, by The Banker UK
Consistent & sustainable 1
Investing in customer centricity2
Value creation3
4Your Bank. Malaysia’s Bank. AmBank.
FY2014 Results – Investors Presentation
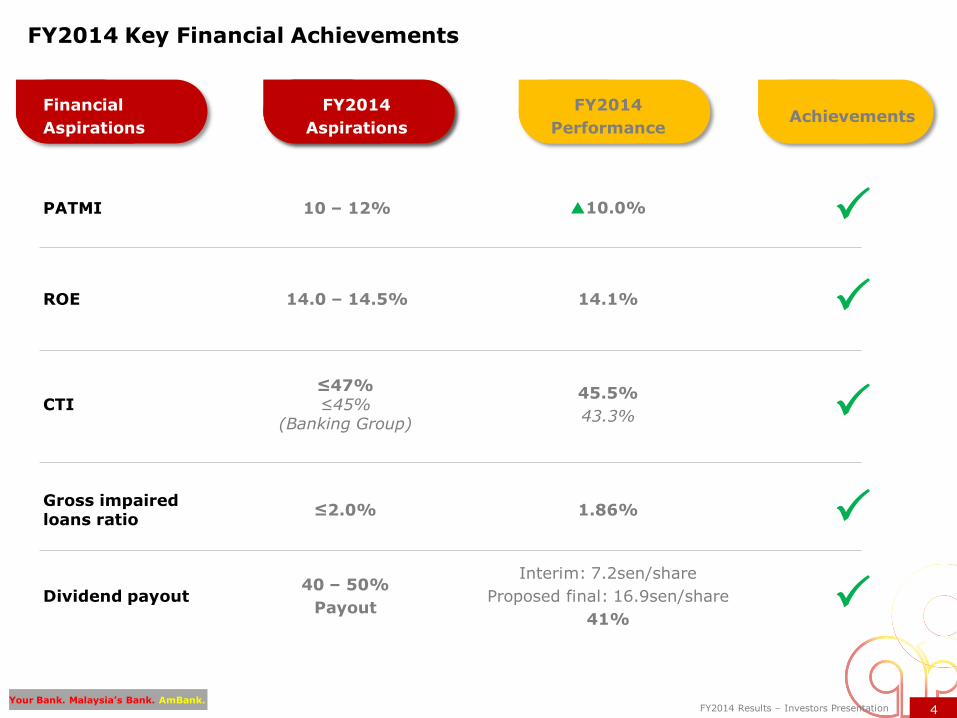
FY2014 Key Financial Achievements
Financial
Aspirations
FY2014
Aspirations
FY2014
PerformanceAchievements
PATMI 10 – 12% 10.0% P
ROE 14.0 – 14.5% 14.1% P
CTI≤47%≤45%
(Banking Group)
45.5%
43.3% P
Gross impaired loans ratio
≤2.0% 1.86% P
Dividend payout40 – 50%
Payout
Interim: 7.2sen/share
Proposed final: 16.9sen/share
41%P
5Your Bank. Malaysia’s Bank. AmBank.
FY2014 Results – Investors Presentation
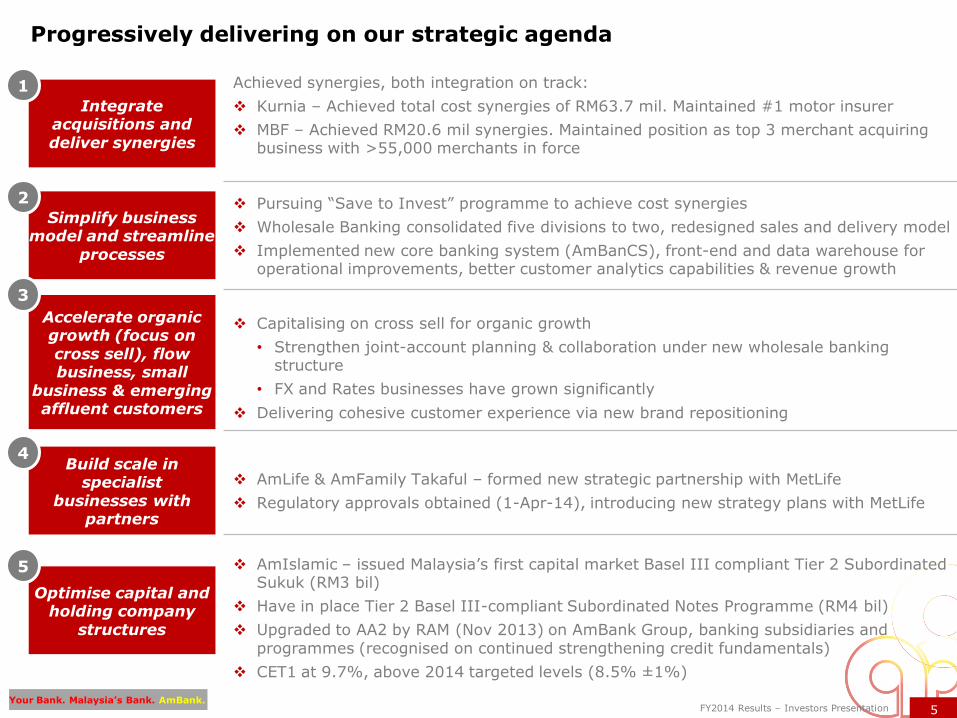
Progressively delivering on our strategic agenda
Integrate acquisitions and deliver synergies
Achieved synergies, both integration on track:
Kurnia – Achieved total cost synergies of RM63.7 mil. Maintained #1 motor insurer
MBF – Achieved RM20.6 mil synergies. Maintained position as top 3 merchant acquiring business with >55,000 merchants in force
Pursuing “Save to Invest” programme to achieve cost synergies
Wholesale Banking consolidated five divisions to two, redesigned sales and delivery model
Implemented new core banking system (AmBanCS), front-end and data warehouse for operational improvements, better customer analytics capabilities & revenue growth
Capitalising on cross sell for organic growth
• Strengthen joint-account planning & collaboration under new wholesale banking structure
• FX and Rates businesses have grown significantly
Delivering cohesive customer experience via new brand repositioning
AmLife & AmFamily Takaful – formed new strategic partnership with MetLife
Regulatory approvals obtained (1-Apr-14), introducing new strategy plans with MetLife
AmIslamic – issued Malaysia‟s first capital market Basel III compliant Tier 2 Subordinated Sukuk (RM3 bil)
Have in place Tier 2 Basel III-compliant Subordinated Notes Programme (RM4 bil)
Upgraded to AA2 by RAM (Nov 2013) on AmBank Group, banking subsidiaries and programmes (recognised on continued strengthening credit fundamentals)
CET1 at 9.7%, above 2014 targeted levels (8.5% ±1%)
Simplify business model and streamline
processes
Accelerate organic growth (focus on cross sell), flow business, small
business & emerging affluent customers
Build scale in specialist
businesses with partners
Optimise capital and holding company
structures
1
2
3
4
5
6Your Bank. Malaysia’s Bank. AmBank.
FY2014 Results – Investors Presentation
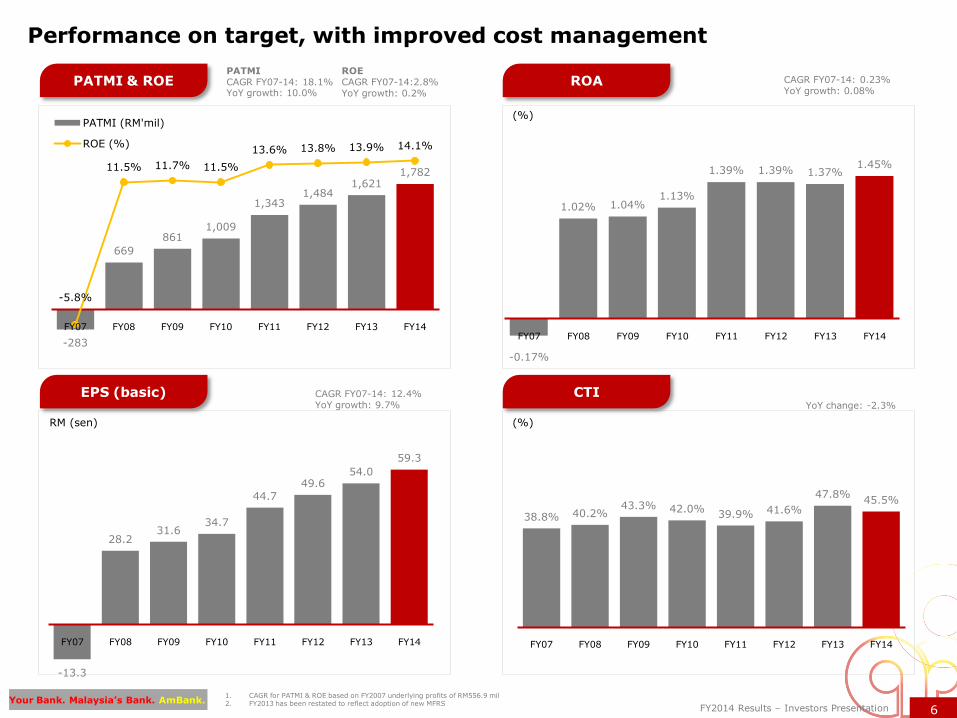
-13.3
28.231.6
34.7
44.749.6
54.0
59.3
FY07 FY08 FY09 FY10 FY11 FY12 FY13 FY14
38.8% 40.2%43.3% 42.0%
39.9% 41.6%
47.8%45.5%
FY07 FY08 FY09 FY10 FY11 FY12 FY13 FY14
-283
669
8611,009
1,3431,484
1,6211,782
-5.8%
11.5% 11.7% 11.5%
13.6% 13.8% 13.9% 14.1%
FY07 FY08 FY09 FY10 FY11 FY12 FY13 FY14
PATMI (RM'mil)
ROE (%)
-0.17%
1.02% 1.04%1.13%
1.39% 1.39% 1.37%1.45%
FY07 FY08 FY09 FY10 FY11 FY12 FY13 FY14
CTI
Performance on target, with improved cost management
CAGR FY07-14: 0.23%YoY growth: 0.08%
CAGR FY07-14: 12.4%YoY growth: 9.7% YoY change: -2.3%
ROECAGR FY07-14:2.8%YoY growth: 0.2%
PATMICAGR FY07-14: 18.1%YoY growth: 10.0%
1. CAGR for PATMI & ROE based on FY2007 underlying profits of RM556.9 mil2. FY2013 has been restated to reflect adoption of new MFRS
RM (sen) (%)
(%)
PATMI & ROE ROA
CTIEPS (basic)
7Your Bank. Malaysia’s Bank. AmBank.
FY2014 Results – Investors Presentation
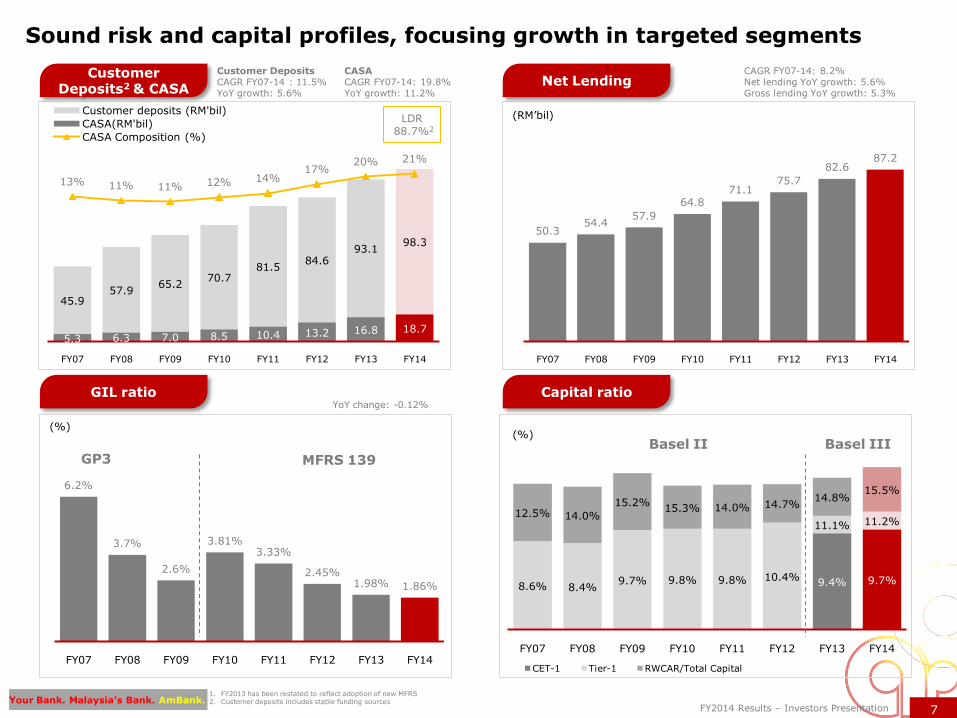
9.4% 9.7%8.6% 8.4%
9.7% 9.8% 9.8% 10.4%
11.1% 11.2%12.5% 14.0%
15.2%15.3% 14.0% 14.7%
14.8%15.5%
FY07 FY08 FY09 FY10 FY11 FY12 FY13 FY14
CET-1 Tier-1 RWCAR/Total Capital
6.2%
3.7%
2.6%
3.81%3.33%
2.45%1.98% 1.86%
FY07 FY08 FY09 FY10 FY11 FY12 FY13 FY14
50.354.4
57.9
64.871.1
75.7
82.687.2
FY07 FY08 FY09 FY10 FY11 FY12 FY13 FY14
5.3 6.3 7.0 8.5 10.4 13.2 16.8 18.7
45.957.9
65.270.7
81.584.6
93.198.3
13% 11% 11% 12% 14%17%
20% 21%
FY07 FY08 FY09 FY10 FY11 FY12 FY13 FY14
Customer deposits (RM'bil)
CASA(RM'bil)
CASA Composition (%)
Net Lending
Sound risk and capital profiles, focusing growth in targeted segments
CAGR FY07-14: 8.2%Net lending YoY growth: 5.6%Gross lending YoY growth: 5.3%
Customer DepositsCAGR FY07-14 : 11.5%YoY growth: 5.6%
GP3 MFRS 139
YoY change: -0.12%
(RM‟bil)
(%)(%)
Customer Deposits2 & CASA
Net Lending
GIL ratio Capital ratio
1. FY2013 has been restated to reflect adoption of new MFRS2. Customer deposits includes stable funding sources
LDR88.7%2
Basel II Basel III
CASACAGR FY07-14: 19.8%YoY growth: 11.2%
8Your Bank. Malaysia’s Bank. AmBank.
FY2014 Results – Investors Presentation
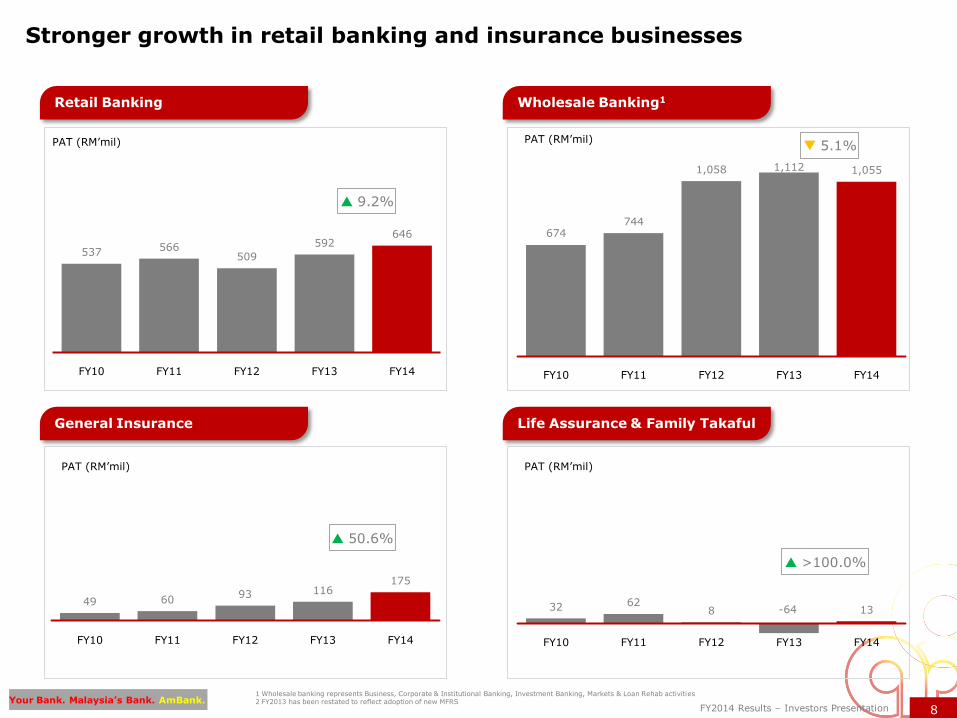
32 628 -64 13
FY10 FY11 FY12 FY13 FY14
49 6093 116
175
FY10 FY11 FY12 FY13 FY14
674744
1,058 1,112 1,055
FY10 FY11 FY12 FY13 FY14
537 566509
592646
FY10 FY11 FY12 FY13 FY14
PAT (RM‟mil)
PAT (RM‟mil) PAT (RM‟mil)
1 Wholesale banking represents Business, Corporate & Institutional Banking, Investment Banking, Markets & Loan Rehab activities2 FY2013 has been restated to reflect adoption of new MFRS
PAT (RM‟mil)
Retail Banking Wholesale Banking1
General Insurance Life Assurance & Family Takaful
9.2%
5.1%
50.6%
>100.0%
Stronger growth in retail banking and insurance businesses

9Your Bank. Malaysia’s Bank. AmBank.
FY2014 Results – Investors PresentationYour Bank. Malaysia’s Bank. AmBank.
AGENDA Page
1. EXECUTIVE SUMMARY 3
2. STRATEGIC PARTNERSHIP/INTEGRATION UPDATES 10
3. FY2014 GROUP FINANCIAL PERFORMANCE 17
4. OUTLOOK & STRATEGIC PRIORITIES 32
5. DIVISIONAL STRATEGY & PERFORMANCE 38
6. SUPPLEMENTARY INFORMATION 45
- AMBANK GROUP
- ECONOMY & INDUSTRY
10Your Bank. Malaysia’s Bank. AmBank.
FY2014 Results – Investors Presentation
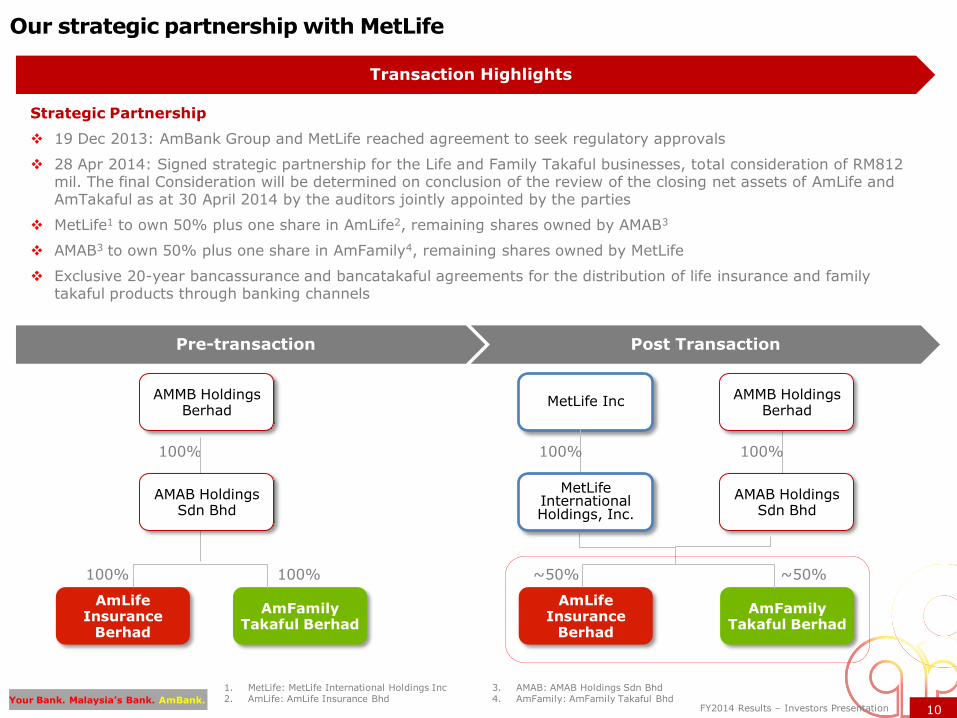
Transaction Highlights
Strategic Partnership
19 Dec 2013: AmBank Group and MetLife reached agreement to seek regulatory approvals
28 Apr 2014: Signed strategic partnership for the Life and Family Takaful businesses, total consideration of RM812 mil. The final Consideration will be determined on conclusion of the review of the closing net assets of AmLife and AmTakaful as at 30 April 2014 by the auditors jointly appointed by the parties
MetLife1 to own 50% plus one share in AmLife2, remaining shares owned by AMAB3
AMAB3 to own 50% plus one share in AmFamily4, remaining shares owned by MetLife
Exclusive 20-year bancassurance and bancatakaful agreements for the distribution of life insurance and family takaful products through banking channels
1. MetLife: MetLife International Holdings Inc2. AmLife: AmLife Insurance Bhd
3. AMAB: AMAB Holdings Sdn Bhd4. AmFamily: AmFamily Takaful Bhd
Our strategic partnership with MetLife
AmLifeInsurance
Berhad
AmFamilyTakaful Berhad
AMMB Holdings Berhad
Pre-transaction Post Transaction
100%
AMAB Holdings Sdn Bhd
MetLife Inc
100% 100%
~50%~50%
AMMB Holdings Berhad
MetLife International Holdings, Inc.
AMAB Holdings Sdn Bhd
AmLifeInsurance
Berhad
AmFamily Takaful Berhad
100% 100%
11Your Bank. Malaysia’s Bank. AmBank.
FY2014 Results – Investors Presentation
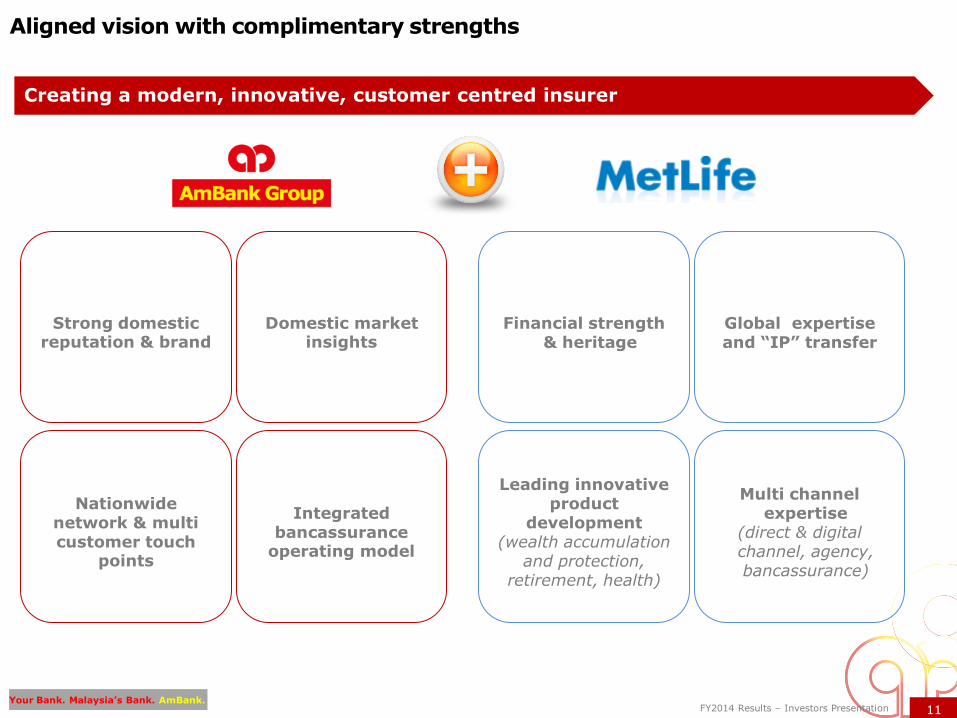
Aligned vision with complimentary strengths
Creating a modern, innovative, customer centred insurer
Strong domestic reputation & brand
Domestic market insights
Integrated bancassurance
operating model
Nationwide network & multi customer touch
points
Financial strength & heritage
Global expertise and “IP” transfer
Leading innovative product
development(wealth accumulation
and protection, retirement, health)
Multi channel expertise
(direct & digital channel, agency, bancassurance)
12Your Bank. Malaysia’s Bank. AmBank.
FY2014 Results – Investors Presentation
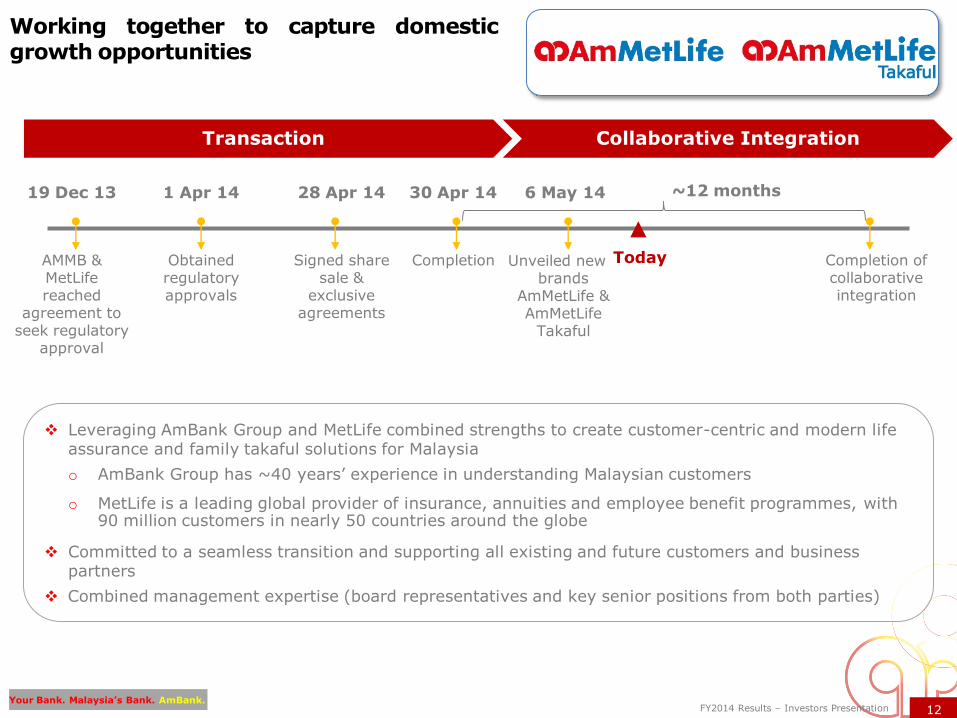
Working together to capture domesticgrowth opportunities
Transaction Collaborative Integration
19 Dec 13
AMMB & MetLife reached
agreement to seek regulatory
approval
1 Apr 14 28 Apr 14 30 Apr 14 ~12 months
Obtained regulatory approvals
Signed share sale &
exclusive agreements
Completion Completion of collaborative integration
Today
Leveraging AmBank Group and MetLife combined strengths to create customer-centric and modern life assurance and family takaful solutions for Malaysia
o AmBank Group has ~40 years‟ experience in understanding Malaysian customers
o MetLife is a leading global provider of insurance, annuities and employee benefit programmes, with 90 million customers in nearly 50 countries around the globe
Committed to a seamless transition and supporting all existing and future customers and business partners
Combined management expertise (board representatives and key senior positions from both parties)
6 May 14
Unveiled new brands
AmMetLife & AmMetLife
Takaful
13Your Bank. Malaysia’s Bank. AmBank.
FY2014 Results – Investors Presentation
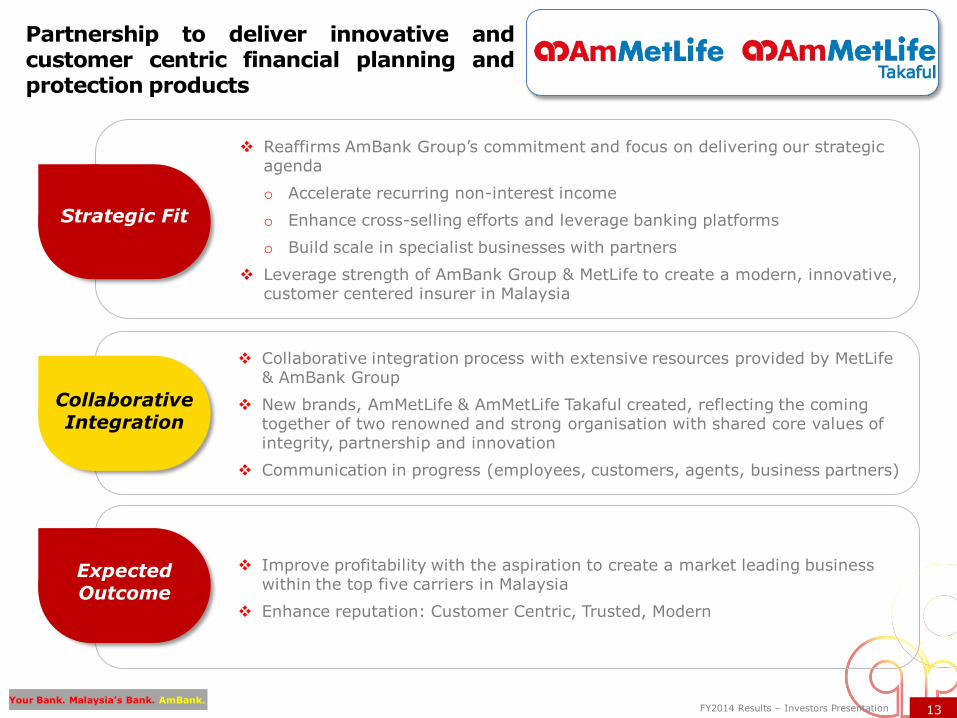
Reaffirms AmBank Group‟s commitment and focus on delivering our strategic agenda
o Accelerate recurring non-interest income
o Enhance cross-selling efforts and leverage banking platforms
o Build scale in specialist businesses with partners
Leverage strength of AmBank Group & MetLife to create a modern, innovative, customer centered insurer in Malaysia
Collaborative integration process with extensive resources provided by MetLife & AmBank Group
New brands, AmMetLife & AmMetLife Takaful created, reflecting the coming together of two renowned and strong organisation with shared core values of integrity, partnership and innovation
Communication in progress (employees, customers, agents, business partners)
Improve profitability with the aspiration to create a market leading business within the top five carriers in Malaysia
Enhance reputation: Customer Centric, Trusted, Modern
Collaborative Integration
Expected Outcome
Strategic Fit
Partnership to deliver innovative andcustomer centric financial planning andprotection products
14Your Bank. Malaysia’s Bank. AmBank.
FY2014 Results – Investors Presentation
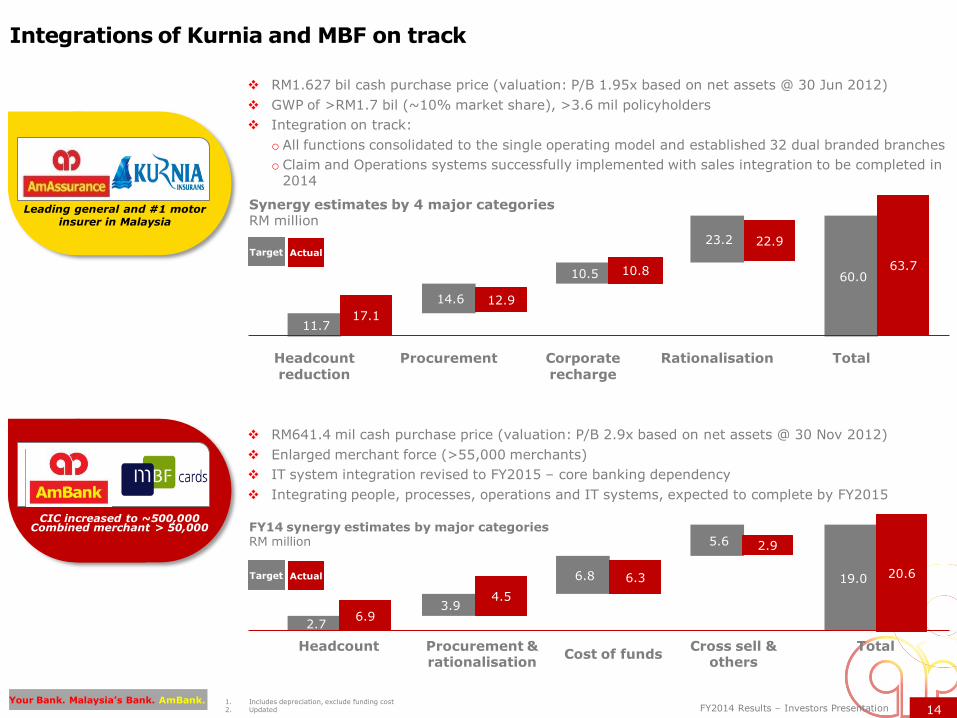
RM641.4 mil cash purchase price (valuation: P/B 2.9x based on net assets @ 30 Nov 2012)
Enlarged merchant force (>55,000 merchants)
IT system integration revised to FY2015 – core banking dependency
Integrating people, processes, operations and IT systems, expected to complete by FY2015
Integrations of Kurnia and MBF on track
CIC increased to ~500,000 Combined merchant > 50,000
1. Includes depreciation, exclude funding cost2. Updated
2.7
19.0
3.9
6.8
5.6 FY14 synergy estimates by major categoriesRM million
6.3 20.6Target Actual
6.9
4.5
2.9
Headcount Procurement & rationalisation
Cost of fundsCross sell &
othersTotal
RM1.627 bil cash purchase price (valuation: P/B 1.95x based on net assets @ 30 Jun 2012)
GWP of >RM1.7 bil (~10% market share), >3.6 mil policyholders
Integration on track:
o All functions consolidated to the single operating model and established 32 dual branded branches
o Claim and Operations systems successfully implemented with sales integration to be completed in 2014
11.7
60.0
14.6
10.5
23.2
Headcount
reductionProcurement Corporate
rechargeRationalisation Total
Leading general and #1 motor insurer in Malaysia
Synergy estimates by 4 major categoriesRM million
17.1
12.9
10.8
22.9
63.7Target Actual
15Your Bank. Malaysia’s Bank. AmBank.
FY2014 Results – Investors Presentation
20 May 2014
FY2014 Results –Investors PresentationMandySimpson,ChiefFinancialOfficer
Your Bank. Malaysia’s Bank. AmBank.
16Your Bank. Malaysia’s Bank. AmBank.
FY2014 Results – Investors PresentationYour Bank. Malaysia’s Bank. AmBank.
AGENDA Page
1. EXECUTIVE SUMMARY 3
2. STRATEGIC PARTNERSHIP/INTEGRATION UPDATES 10
3. FY2014 GROUP FINANCIAL PERFORMANCE 17
4. OUTLOOK & STRATEGIC PRIORITIES 32
5. DIVISIONAL STRATEGY & PERFORMANCE 38
6. SUPPLEMENTARY INFORMATION 45
- AMBANK GROUP
- ECONOMY & INDUSTRY
17Your Bank. Malaysia’s Bank. AmBank.
FY2014 Results – Investors Presentation
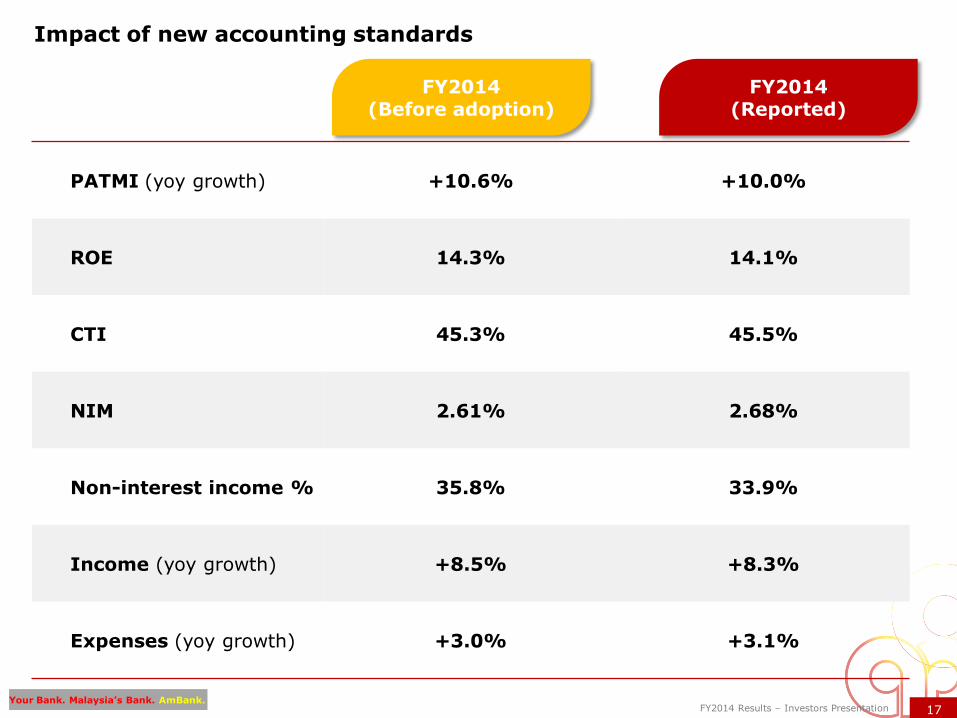
Impact of new accounting standards
PATMI (yoy growth) +10.6% +10.0%
ROE 14.3% 14.1%
CTI 45.3% 45.5%
NIM 2.61% 2.68%
Non-interest income % 35.8% 33.9%
Income (yoy growth) +8.5% +8.3%
Expenses (yoy growth) +3.0% +3.1%
FY2014(Before adoption)
FY2014(Reported)
18Your Bank. Malaysia’s Bank. AmBank.
FY2014 Results – Investors Presentation
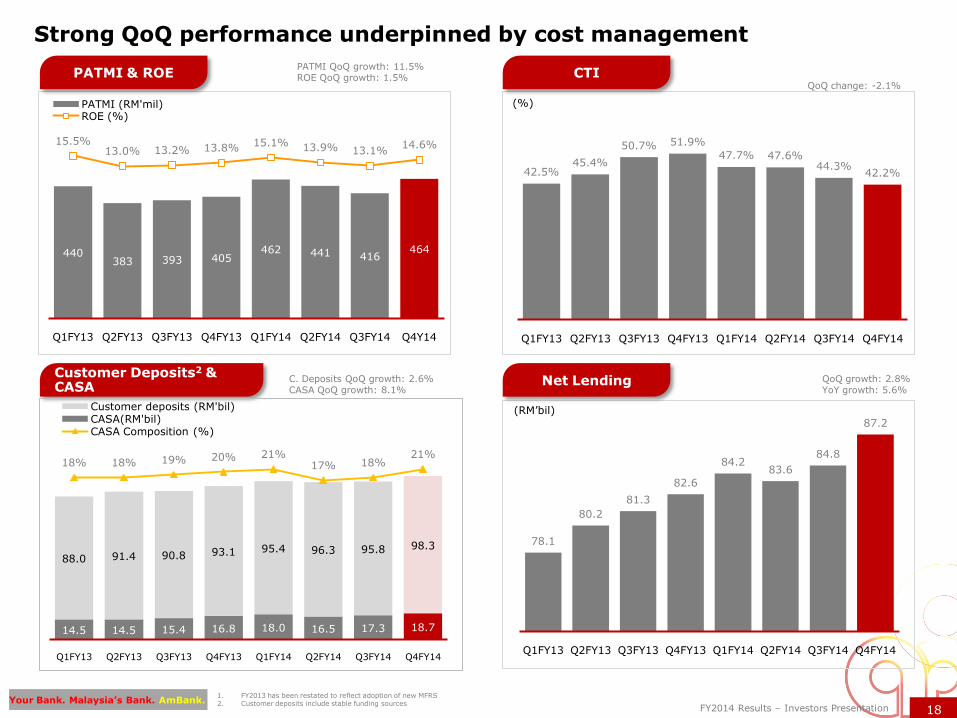
78.1
80.2
81.3
82.6
84.283.6
84.8
87.2
Q1FY13 Q2FY13 Q3FY13 Q4FY13 Q1FY14 Q2FY14 Q3FY14 Q4FY14
(RM‟bil)
C. Deposits QoQ growth: 2.6%CASA QoQ growth: 8.1%
440383 393 405
462 441 416464
15.5%13.0% 13.2% 13.8%
15.1% 13.9% 13.1%14.6%
Q1FY13 Q2FY13 Q3FY13 Q4FY13 Q1FY14 Q2FY14 Q3FY14 Q4Y14
PATMI (RM'mil)ROE (%)
42.5%45.4%
50.7% 51.9%
47.7% 47.6%44.3%
42.2%
Q1FY13 Q2FY13 Q3FY13 Q4FY13 Q1FY14 Q2FY14 Q3FY14 Q4FY14
PATMI QoQ growth: 11.5%ROE QoQ growth: 1.5%
QoQ growth: 2.8%YoY growth: 5.6%
Strong QoQ performance underpinned by cost management
(%)
PATMI & ROE CTI
Net LendingCustomer Deposits2 & CASA
1. FY2013 has been restated to reflect adoption of new MFRS2. Customer deposits include stable funding sources
QoQ change: -2.1%
14.5 14.5 15.4 16.8 18.0 16.5 17.3 18.7
88.0 91.4 90.8 93.1 95.4 96.3 95.8 98.3
18% 18% 19% 20% 21%17% 18%
21%
Q1FY13 Q2FY13 Q3FY13 Q4FY13 Q1FY14 Q2FY14 Q3FY14 Q4FY14
Customer deposits (RM'bil)CASA(RM'bil)CASA Composition (%)
19Your Bank. Malaysia’s Bank. AmBank.
FY2014 Results – Investors Presentation
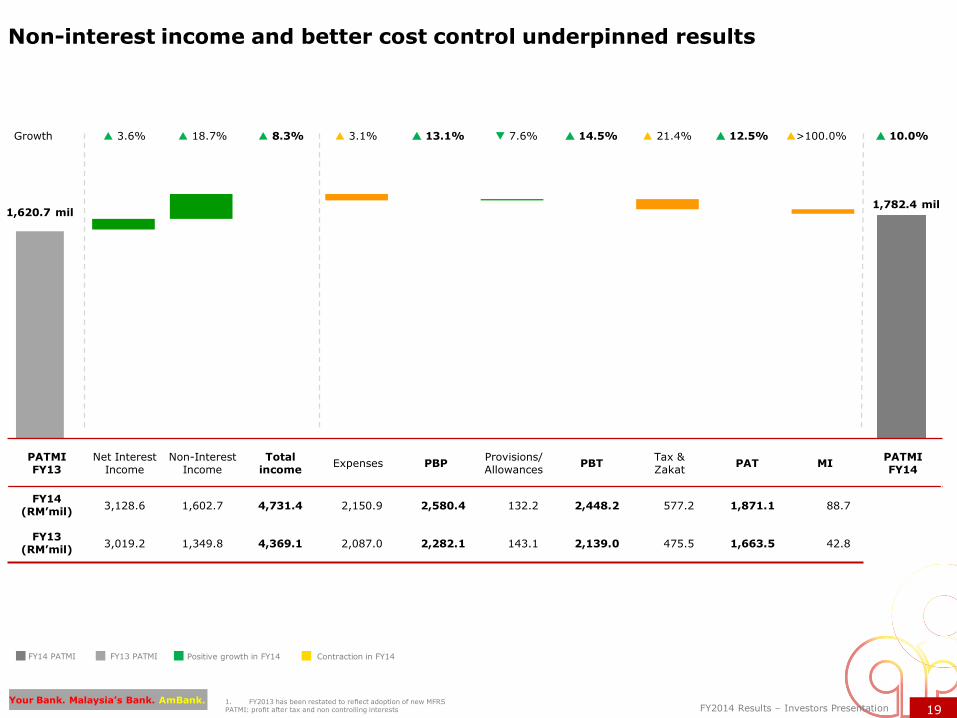
18.7% 7.6% 3.1% >100.0%
1,782.4 mil
10.0% 8.3% 13.1% 14.5% 12.5%
1,620.7 mil
3.6%
FY13 PATMI FY14 PATMI Positive growth in FY14 Contraction in FY14
Non-interest income and better cost control underpinned results
Growth 21.4%
PATMIFY13
Net Interest Income
Non-Interest Income
Total income
Expenses PBPProvisions/Allowances
PBTTax & Zakat
PAT MIPATMIFY14
FY14 (RM’mil)
3,128.6 1,602.7 4,731.4 2,150.9 2,580.4 132.2 2,448.2 577.2 1,871.1 88.7
FY13(RM’mil)
3,019.2 1,349.8 4,369.1 2,087.0 2,282.1 143.1 2,139.0 475.5 1,663.5 42.8
1. FY2013 has been restated to reflect adoption of new MFRSPATMI: profit after tax and non controlling interests
20Your Bank. Malaysia’s Bank. AmBank.
FY2014 Results – Investors Presentation
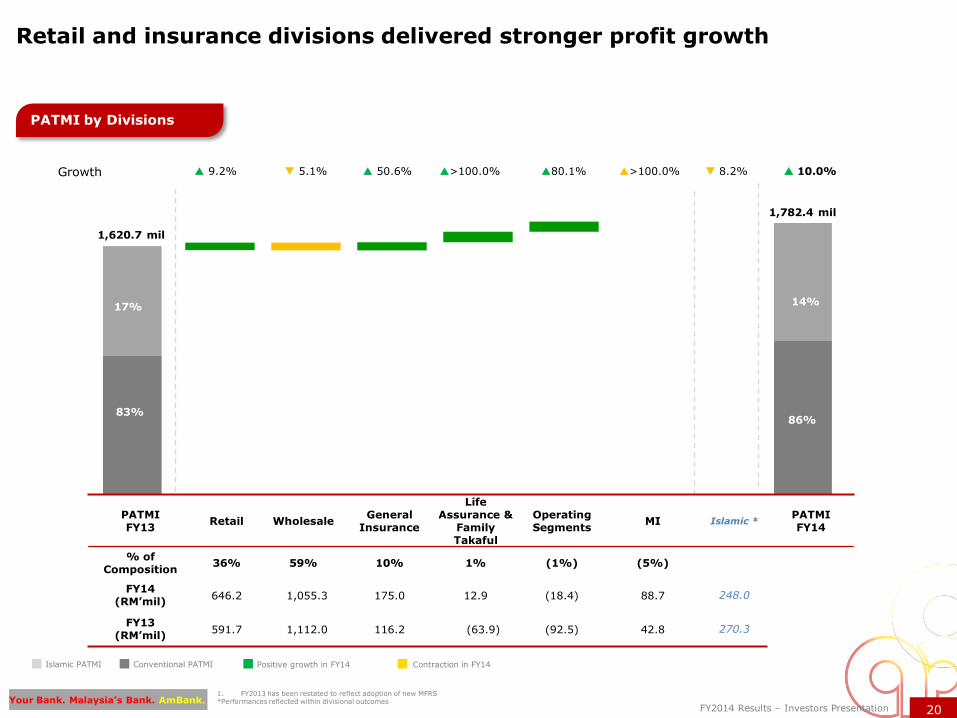
5.1% 50.6% 10.0%>100.0%
1. FY2013 has been restated to reflect adoption of new MFRS*Performances reflected within divisional outcomes
9.2% 80.1% 8.2%
Conventional PATMIIslamic PATMI Positive growth in FY14 Contraction in FY14
1,620.7 mil
1,782.4 mil
Growth >100.0%
86%83%
17%14%
PATMIFY13
Retail WholesaleGeneral
Insurance
Life Assurance &
Family Takaful
Operating Segments
MI Islamic *PATMI FY14
% of Composition
36% 59% 10% 1% (1%) (5%)
FY14 (RM’mil)
646.2 1,055.3 175.0 12.9 (18.4) 88.7 248.0
FY13(RM’mil)
591.7 1,112.0 116.2 (63.9) (92.5) 42.8 270.3
Retail and insurance divisions delivered stronger profit growth
PATMI by Divisions
21Your Bank. Malaysia’s Bank. AmBank.
FY2014 Results – Investors Presentation
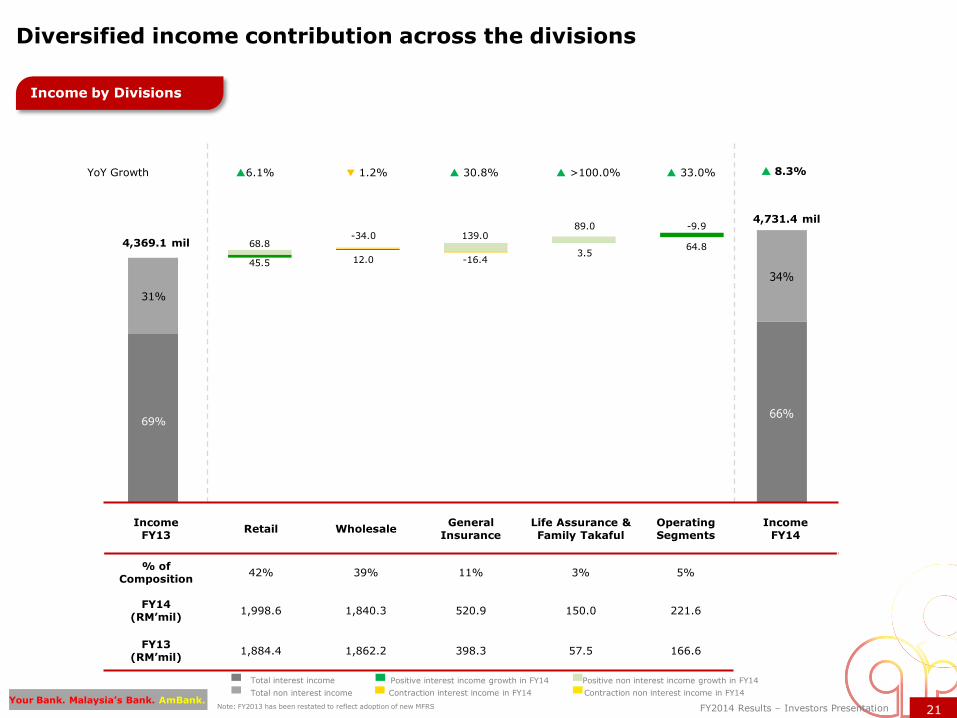
Total Income FY13 Retail Wholesale AmG AmLife + AmFam OptSeg Total Income FY14
66% 69%
34% 31%
66% 69%
34% 31%
1.2% 8.3%6.1%
4,369.1 mil
4,731.4 mil
YoY Growth 30.8% >100.0% 33.0%
68.8
45.5
Total non interest income
Total interest income Positive interest income growth in FY14
Contraction interest income in FY14
Positive non interest income growth in FY14
Contraction non interest income in FY14
IncomeFY13
Retail WholesaleGeneral
InsuranceLife Assurance & Family Takaful
Operating Segments
Income FY14
% of Composition
42% 39% 11% 3% 5%
FY14
(RM’mil)1,998.6 1,840.3 520.9 150.0 221.6
FY13(RM’mil)
1,884.4 1,862.2 398.3 57.5 166.6
Diversified income contribution across the divisions
Income by Divisions
-34.0
12.0
139.0
-16.4
89.0
3.5
-9.9
64.8
Note: FY2013 has been restated to reflect adoption of new MFRS
22Your Bank. Malaysia’s Bank. AmBank.
FY2014 Results – Investors Presentation
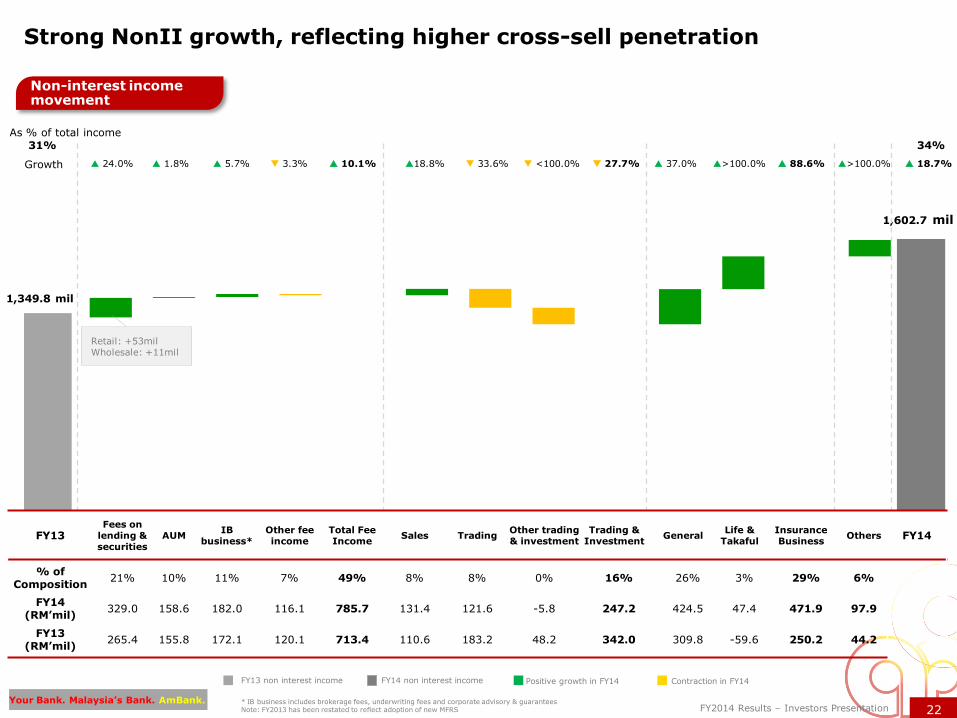
Fees on loans AUM IB business Other fee inc Total Fee income Sales Trading Other trading inc Total Trading &Investment
General Life & Takaful Total Insurance Other
* IB business includes brokerage fees, underwriting fees and corporate advisory & guarantees
As % of total income 31% 34%
>100.0% 24.0%Growth 1.8% 5.7% 33.6%
1,602.7 mil
<100.0%18.8% 27.7% >100.0% 18.7% 10.1%
FY14 non interest income Positive growth in FY14 Contraction in FY14
Retail: +53milWholesale: +11mil
FY13 non interest income
1,349.8 mil
FY13Fees on
lending & securities
AUMIB
business*Other fee income
Total Fee Income
Sales TradingOther trading& investment
Trading & Investment
GeneralLife &
TakafulInsuranceBusiness
Others FY14
% of Composition
21% 10% 11% 7% 49% 8% 8% 0% 16% 26% 3% 29% 6%
FY14
(RM’mil)329.0 158.6 182.0 116.1 785.7 131.4 121.6 -5.8 247.2 424.5 47.4 471.9 97.9
FY13(RM’mil)
265.4 155.8 172.1 120.1 713.4 110.6 183.2 48.2 342.0 309.8 -59.6 250.2 44.2
3.3%
Non-interest income movement
Strong NonII growth, reflecting higher cross-sell penetration
37.0% 88.6%
Note: FY2013 has been restated to reflect adoption of new MFRS
23Your Bank. Malaysia’s Bank. AmBank.
FY2014 Results – Investors Presentation
272.2268.5
0.6 2.77.0
FY13 Asset mix Funding mix Rates FY14
264.6
276.5
1.8 0.4
13.3
Q3FY14 Asset mix Funding mix Rates Q4FY14
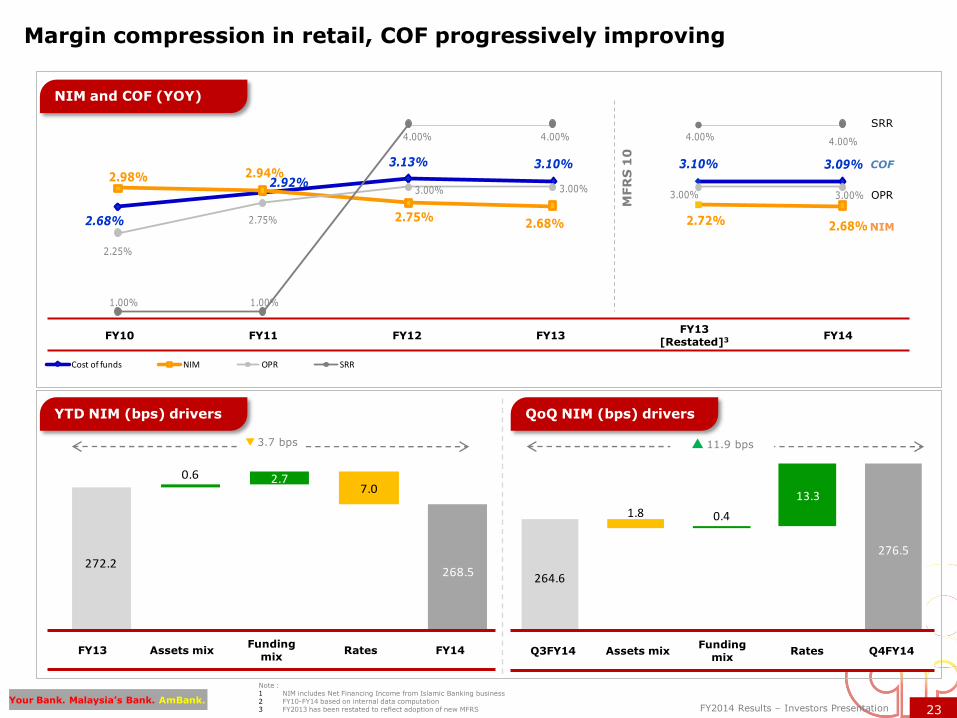
Margin compression in retail, COF progressively improving
Note :1 NIM includes Net Financing Income from Islamic Banking business2 FY10-FY14 based on internal data computation3 FY2013 has been restated to reflect adoption of new MFRS
COF
NIM
SRR
OPR
3.7 bps
FY10 FY11 FY12 FY13FY13
[Restated]3 FY14
FY13 Assets mixFunding
mixRates FY14
NIM and COF (YOY)
YTD NIM (bps) drivers
Q3FY14 Assets mixFunding
mixRates Q4FY14
11.9 bps
QoQ NIM (bps) drivers
MFR
S 1
0
2.68%
2.92%
3.13% 3.10% 3.10% 3.09%2.98% 2.94%
2.75%2.68% 2.72% 2.69%
2.25%
2.75%
3.00% 3.00%3.00% 3.00%
1.00% 1.00%
4.00% 4.00% 4.00% 4.00%
FY10 FY11 FY12 FY13 1 Apr 2013 FY14Cost of funds NIM OPR SRR
2.68%
2.92%
3.13% 3.10% 3.10% 3.09%2.98% 2.94%
2.75%2.68% 2.72% 2.68%
2.25%
2.75%
3.00% 3.00%3.00% 3.00%
1.00% 1.00%
4.00% 4.00% 4.00% 4.00%
FY10 FY11 FY12 FY13 1 Apr 2013 FY14Cost of funds NIM OPR SRR
24Your Bank. Malaysia’s Bank. AmBank.
FY2014 Results – Investors Presentation
89.0% 89.4%
90.9%
21.0% 20.0%
24.0%41.8% 40.2% 40.5%
44.3% 43.3%
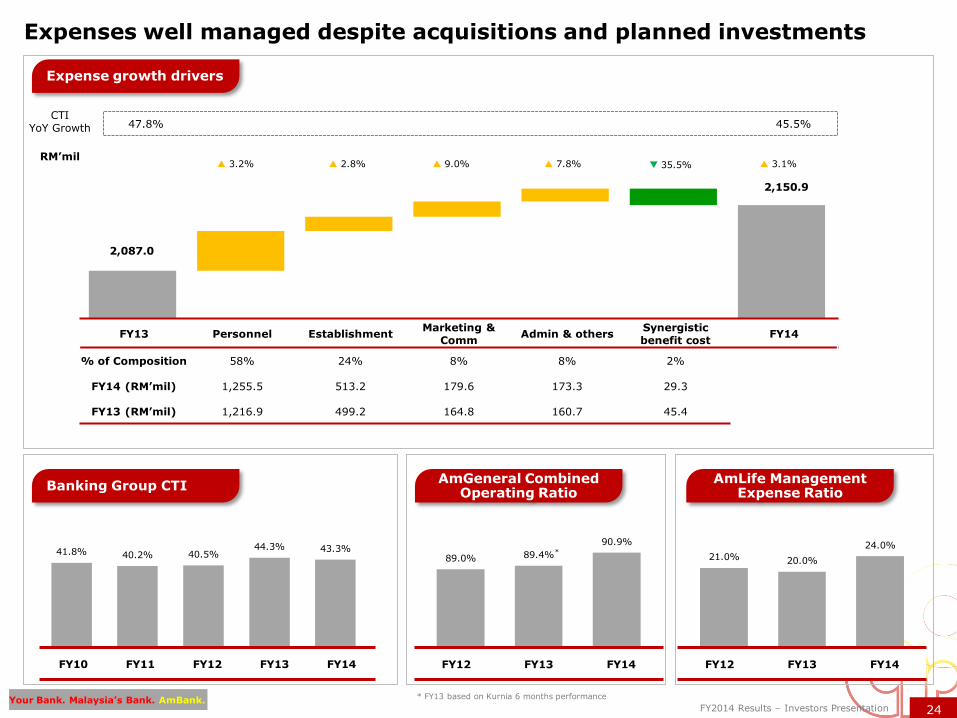
Expenses well managed despite acquisitions and planned investments
FY13 Personnel EstablishmentMarketing &
CommAdmin & others
Synergisticbenefit cost
FY14
% of Composition 58% 24% 8% 8% 2%
FY14 (RM’mil) 1,255.5 513.2 179.6 173.3 29.3
FY13 (RM’mil) 1,216.9 499.2 164.8 160.7 45.4
3.2% 2.8% 9.0% 7.8%
47.8% 45.5%CTI
YoY Growth
RM’mil
2,087.0
2,150.9
Expense growth drivers
Banking Group CTIAmGeneral Combined
Operating RatioAmLife Management
Expense Ratio
FY12 FY13 FY14FY12 FY13 FY14FY10 FY11 FY12 FY13 FY14
35.5% 3.1%
*
* FY13 based on Kurnia 6 months performance
25Your Bank. Malaysia’s Bank. AmBank.
FY2014 Results – Investors Presentation
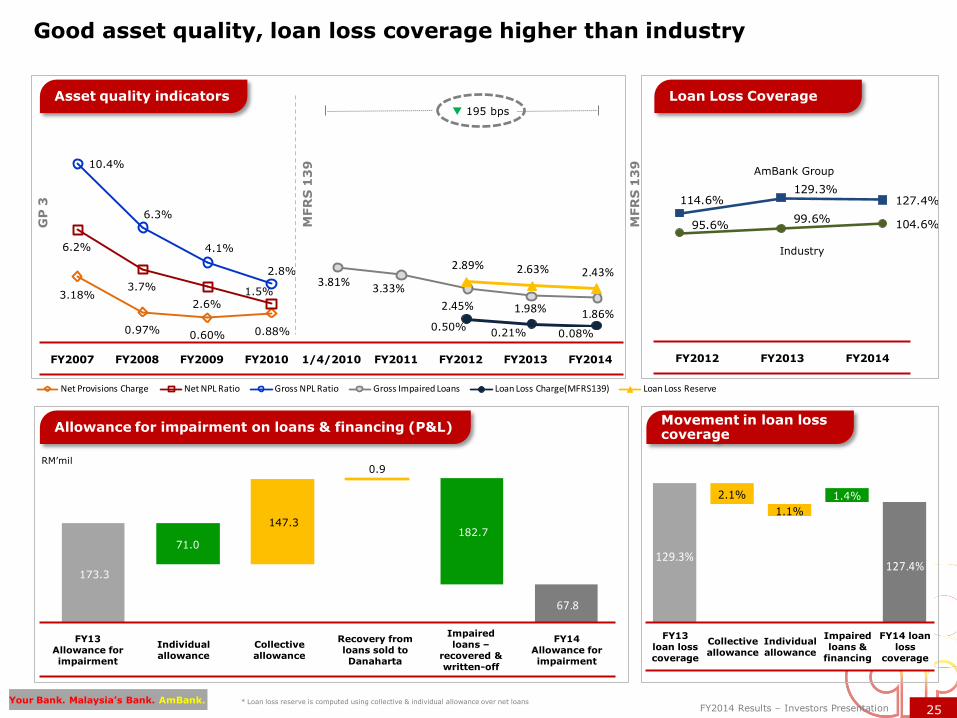
95.6%99.6%
104.6%
114.6%129.3%
127.4%
Industry AmBank Group
173.3
67.8
147.3
0.9
71.0182.7
129.3%127.4%
2.1%
1.1%
1.4%
3.18%
0.97%0.60% 0.88%
6.2%
3.7%
2.6%1.5%
10.4%
6.3%
4.1%
2.8%3.81%
3.33%
2.45% 1.98% 1.86%0.50%
0.21% 0.08%
2.89% 2.63% 2.43%
3.18%
0.97%0.60%
0.88%
6.2%
3.7%
2.6%
1.5%
10.4%
6.3%
4.1%
2.8%
3.81%3.33%
2.45% 1.98% 1.97%0.50%
0.21% 0.01%
2.87% 2.64% 2.41%
Net Provisions Charge Net NPL Ratio Gross NPL Ratio Gross Impaired Loans Loan Loss Charge(MFRS139) Loan Loss Reserve
Loan Loss Coverage
Good asset quality, loan loss coverage higher than industry
195 bps
MFR
S 1
39
MFR
S 1
39
RM‟mil
GP
3
FY2007 FY2008 FY2009 FY2010 1/4/2010 FY2011 FY2012 FY2013 FY2014
FY13 loan losscoverage
Collective allowance
Individual allowance
Impaired loans &
financing
FY14 loan loss
coverage
FY13 Allowance for impairment
Individual allowance
Collective allowance
Recovery from loans sold to Danaharta
Impaired loans –
recovered & written-off
FY14 Allowance for impairment
Asset quality indicators
Allowance for impairment on loans & financing (P&L) Movement in loan loss coverage
FY2012 FY2013 FY2014
* Loan loss reserve is computed using collective & individual allowance over net loans
AmBank Group
Industry
26Your Bank. Malaysia’s Bank. AmBank.
FY2014 Results – Investors Presentation
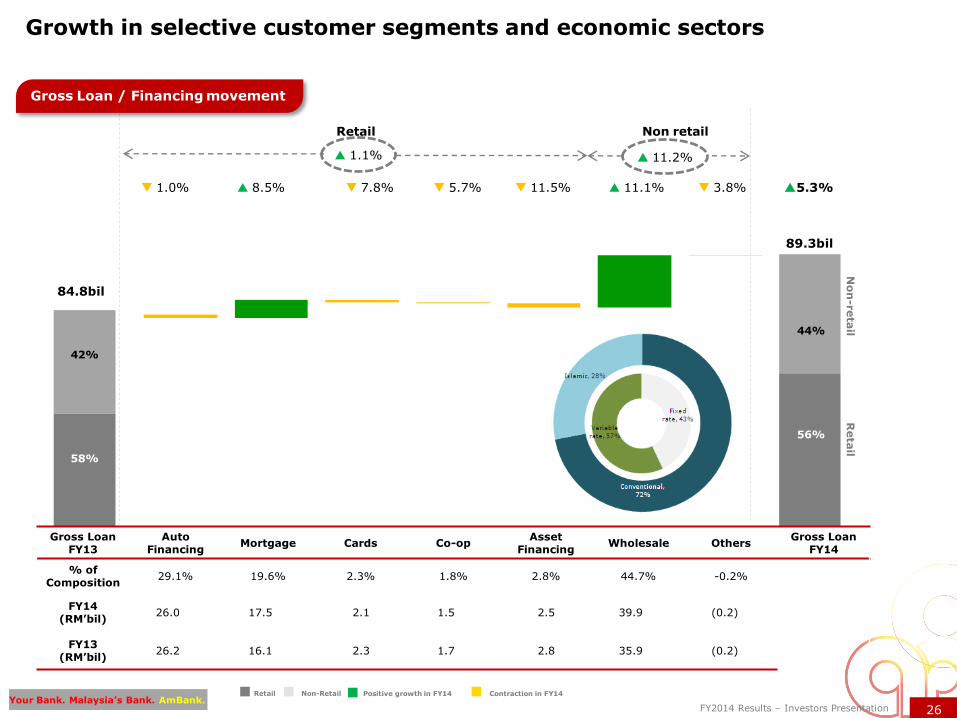
Growth in selective customer segments and economic sectors
Retail Non retail
1.1% 11.2%
84.8bil
8.5% 7.8% 11.1% 3.8% 11.5% 5.3%
89.3bil
5.7%
No
n-re
tail
Reta
il
1.0%
Non-RetailRetail Positive growth in FY14 Contraction in FY14
Gross LoanFY13
Auto Financing
Mortgage Cards Co-opAsset
FinancingWholesale Others
Gross Loan FY14
% of Composition
29.1% 19.6% 2.3% 1.8% 2.8% 44.7% -0.2%
FY14 (RM’bil)
26.0 17.5 2.1 1.5 2.5 39.9 (0.2)
FY13(RM’bil)
26.2 16.1 2.3 1.7 2.8 35.9 (0.2)
Gross Loan / Financing movement
56%
44%
58%
42%
Your Bank. Malaysia’s Bank. AmBank.27FY2014 Results – Investors Presentation
3.83.0 8.2 1.3 4.6 5.8
2.9 3.0 7.8 1.2
47.0
0.4
89.3
Mar-14
32.2 8.4 96.7 14.0 52.1 89.9
29.8 87.3 72.6
38.6
706.7
18.4
1,246.7
Mar-14
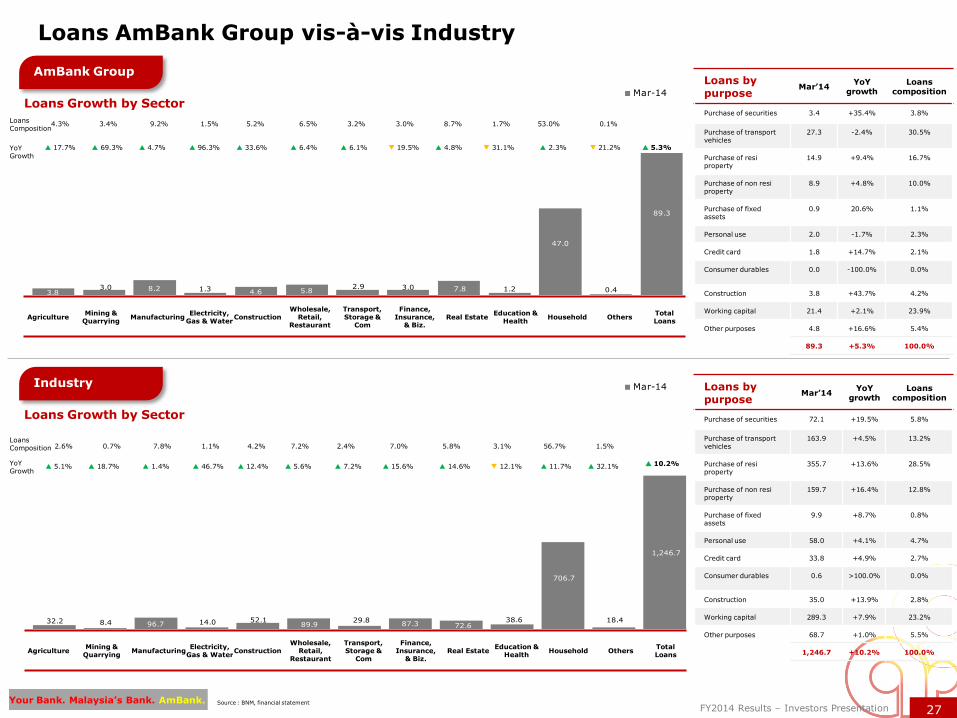
2.6% 0.7% 7.8% 1.1% 4.2% 7.2% 2.4% 7.0% 5.8% 3.1% 56.7% 1.5%
4.3% 3.4% 9.2% 1.5% 5.2% 6.5% 3.2% 3.0% 8.7% 1.7% 53.0% 0.1%
Loans AmBank Group vis-à-vis Industry
Source : BNM, financial statementYour Bank. Malaysia’s Bank. AmBank.
AmBank Group
Industry
AgricultureMining &
QuarryingManufacturing
Electricity, Gas & Water
ConstructionWholesale,
Retail, Restaurant
Transport, Storage &
Com
Finance, Insurance,
& Biz. Real Estate
Education & Health
Household OthersTotal Loans
5.3%
LoansComposition
YoYGrowth
5.1% 18.7% 1.4% 46.7% 12.4% 5.6% 7.2% 15.6% 14.6% 12.1% 11.7% 32.1% 10.2%
2.6% 0.7% 7.8% 1.1% 4.2% 7.2% 2.4% 7.0% 5.8% 3.1% 56.7% 1.5%
3.83.0 8.2 1.3 4.6 5.8
2.9 2.7 7.8 1.5
47.3
0.1
89.3
Mar-14
17.7% 69.3% 4.7% 96.3% 33.6% 6.4% 6.1% 19.5% 4.8% 31.1% 2.3% 21.2%
Loans by purpose
Mar’14YoY
growthLoans
composition
Purchase of securities 3.4 +35.4% 3.8%
Purchase of transport vehicles
27.3 -2.4% 30.5%
Purchase of resiproperty
14.9 +9.4% 16.7%
Purchase of non resiproperty
8.9 +4.8% 10.0%
Purchase of fixedassets
0.9 20.6% 1.1%
Personal use 2.0 -1.7% 2.3%
Credit card 1.8 +14.7% 2.1%
Consumer durables 0.0 -100.0% 0.0%
Construction 3.8 +43.7% 4.2%
Working capital 21.4 +2.1% 23.9%
Other purposes 4.8 +16.6% 5.4%
89.3 +5.3% 100.0%
AgricultureMining &
QuarryingManufacturing
Electricity, Gas & Water
ConstructionWholesale,
Retail, Restaurant
Transport, Storage &
Com
Finance, Insurance,
& Biz. Real Estate
Education & Health
Household OthersTotal Loans
Loans by purpose
Mar’14YoY
growthLoans
composition
Purchase of securities 72.1 +19.5% 5.8%
Purchase of transport vehicles
163.9 +4.5% 13.2%
Purchase of resiproperty
355.7 +13.6% 28.5%
Purchase of non resiproperty
159.7 +16.4% 12.8%
Purchase of fixedassets
9.9 +8.7% 0.8%
Personal use 58.0 +4.1% 4.7%
Credit card 33.8 +4.9% 2.7%
Consumer durables 0.6 >100.0% 0.0%
Construction 35.0 +13.9% 2.8%
Working capital 289.3 +7.9% 23.2%
Other purposes 68.7 +1.0% 5.5%
1,246.7 +10.2% 100.0%
LoansComposition
YoYGrowth
Loans Growth by Sector
Loans Growth by Sector
3.83.0 8.2 1.3 4.6 5.8
2.9 2.7 7.8 1.5
47.3
0.1
89.3
Mar-14
28Your Bank. Malaysia’s Bank. AmBank.
FY2014 Results – Investors Presentation
8.5 10.4
13.2
16.8 18.7
12% 14%17%
20% 21%
FY2010 FY2011 FY2012 FY2013 FY2014
CASA CASA composition
93.1
98.3
FY07 FY10 FY13 FY14
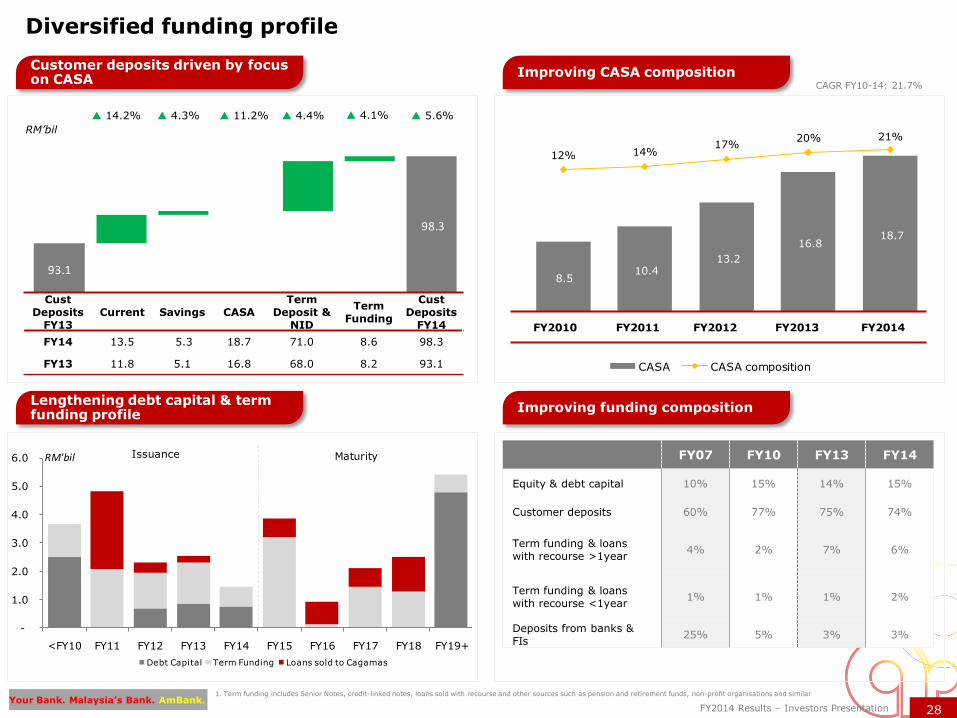
Equity & debt capital 10% 15% 14% 15%
Customer deposits 60% 77% 75% 74%
Term funding & loans with recourse >1year
4% 2% 7% 6%
Term funding & loans with recourse <1year
1% 1% 1% 2%
Deposits from banks & FIs
25% 5% 3% 3%
1. Term funding includes Senior Notes, credit-linked notes, loans sold with recourse and other sources such as pension and retirement funds, non-profit organisations and similar
Diversified funding profile
14.2% 4.3% 11.2% 4.4% 5.6%
RM’bil
FY2010 FY2011 FY2012 FY2013 FY2014
CAGR FY10-14: 21.7%
8.5 10.4
13.2
16.8 18.0
12% 14%17%
20% 19%
FY2010 FY2011 FY2012 FY2013 H1FY2014
CASA CASA composition
Customer deposits driven by focus on CASA
Improving CASA composition
Lengthening debt capital & term funding profile
Improving funding composition
CustDeposits
FY13Current Savings CASA
Term Deposit &
NID
Term Funding
CustDeposits
FY14
FY14 13.5 5.3 18.7 71.0 8.6 98.3
FY13 11.8 5.1 16.8 68.0 8.2 93.1
4.1%
-
1.0
2.0
3.0
4.0
5.0
6.0
<FY10 FY11 FY12 FY13 FY14 FY15 FY16 FY17 FY18 FY19+
RM'bil
Debt Capital Term Funding Loans sold to Cagamas
Issuance Maturity
29Your Bank. Malaysia’s Bank. AmBank.
FY2014 Results – Investors Presentation
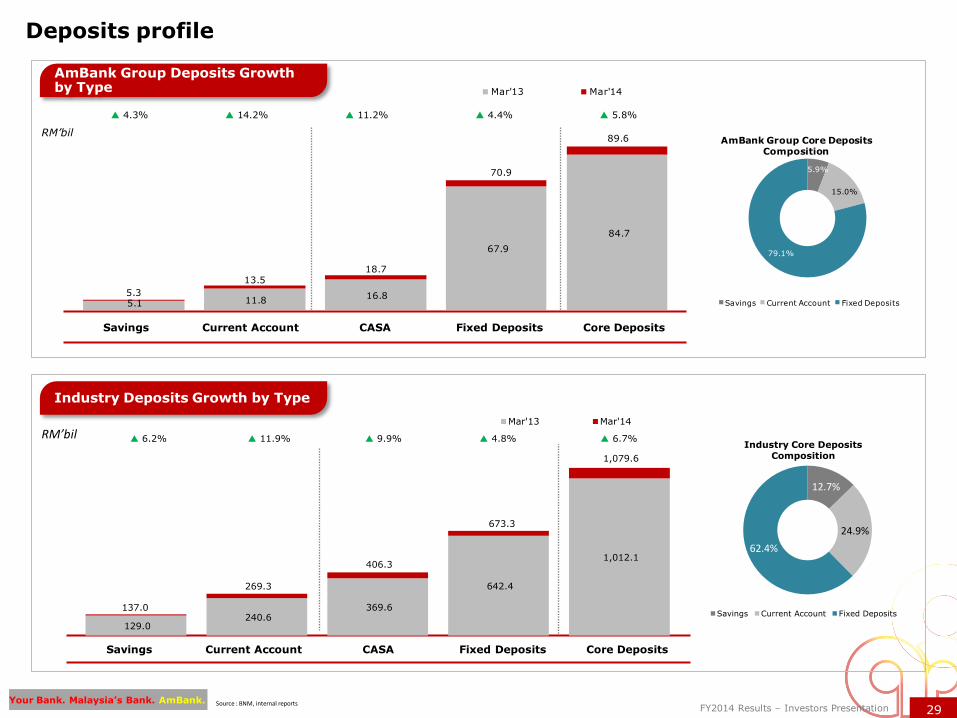
5.1 11.8 16.8
67.9
84.7
5.3
13.518.7
70.9
89.6
Mar'13 Mar'14
RM’bil
Deposits profile
Source : BNM, internal reports
RM’bil
Savings Current Account CASA Fixed Deposits Core Deposits
Savings Current Account CASA Fixed Deposits Core Deposits
AmBank Group Deposits Growth by Type
Industry Deposits Growth by Type
4.3% 14.2% 11.2% 4.4% 5.8%
5.9%
15.0%
79.1%
AmBank Group Core Deposits Composition
Savings Current Account Fixed Deposits
129.0 240.6
369.6
642.4
1,012.1
137.0
269.3
406.3
673.3
1,079.6
Mar'13 Mar'14
6.2% 11.9% 9.9% 4.8% 6.7%
12.7%
24.9%
62.4%
Industry Core Deposits Composition
Savings Current Account Fixed Deposits
30Your Bank. Malaysia’s Bank. AmBank.
FY2014 Results – Investors Presentation
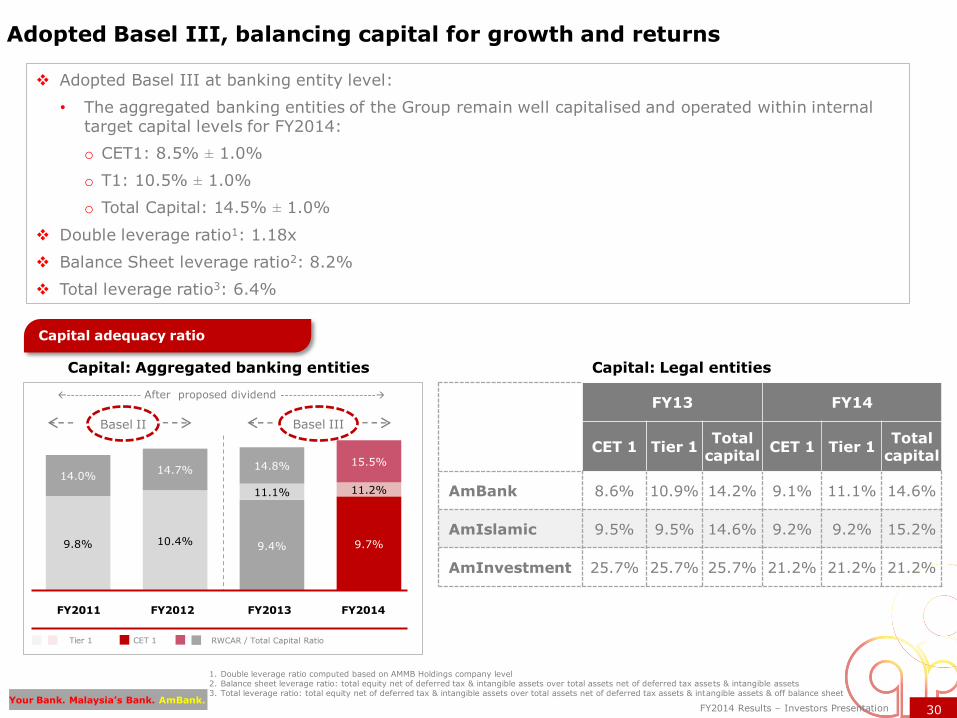
9.4% 9.7%9.8% 10.4%
11.1% 11.2%
14.0%14.7% 14.8% 15.5%
Adopted Basel III at banking entity level:
• The aggregated banking entities of the Group remain well capitalised and operated within internal target capital levels for FY2014:
o CET1: 8.5% ± 1.0%
o T1: 10.5% ± 1.0%
o Total Capital: 14.5% ± 1.0%
Double leverage ratio1: 1.18x
Balance Sheet leverage ratio2: 8.2%
Total leverage ratio3: 6.4%
Adopted Basel III, balancing capital for growth and returns
1. Double leverage ratio computed based on AMMB Holdings company level2. Balance sheet leverage ratio: total equity net of deferred tax & intangible assets over total assets net of deferred tax assets & intangible assets 3. Total leverage ratio: total equity net of deferred tax & intangible assets over total assets net of deferred tax assets & intangible assets & off balance sheet
Capital: Aggregated banking entities
Basel II Basel III
------------------ After proposed dividend -----------------------
Capital: Legal entities
FY13 FY14
CET 1 Tier 1Total
capitalCET 1 Tier 1
Total capital
AmBank 8.6% 10.9% 14.2% 9.1% 11.1% 14.6%
AmIslamic 9.5% 9.5% 14.6% 9.2% 9.2% 15.2%
AmInvestment 25.7% 25.7% 25.7% 21.2% 21.2% 21.2%
FY2011 FY2012 FY2013 FY2014
CET 1Tier 1 RWCAR / Total Capital Ratio
Capital adequacy ratio
31Your Bank. Malaysia’s Bank. AmBank.
FY2014 Results – Investors PresentationYour Bank. Malaysia’s Bank. AmBank.
AGENDA Page
1. EXECUTIVE SUMMARY 3
2. STRATEGIC PARTNERSHIP/INTEGRATION UPDATES 10
3. FY2014 GROUP FINANCIAL PERFORMANCE 17
4. OUTLOOK & STRATEGIC PRIORITIES 32
5. DIVISIONAL STRATEGY & PERFORMANCE 38
6. SUPPLEMENTARY INFORMATION 45
- AMBANK GROUP
- ECONOMY & INDUSTRY
Your Bank. Malaysia’s Bank. AmBank.32FY2014 Results – Investors Presentation
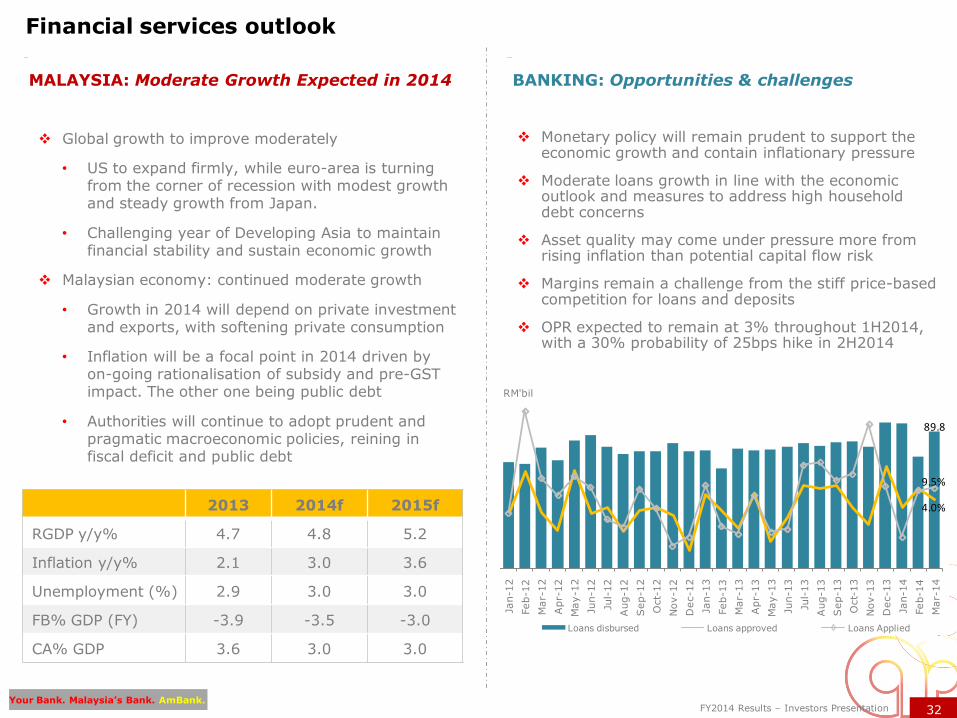
Financial services outlook
MALAYSIA: Moderate Growth Expected in 2014
Monetary policy will remain prudent to support the economic growth and contain inflationary pressure
Moderate loans growth in line with the economic outlook and measures to address high household debt concerns
Asset quality may come under pressure more from rising inflation than potential capital flow risk
Margins remain a challenge from the stiff price-based competition for loans and deposits
OPR expected to remain at 3% throughout 1H2014, with a 30% probability of 25bps hike in 2H2014
BANKING: Opportunities & challenges
Global growth to improve moderately
• US to expand firmly, while euro-area is turning from the corner of recession with modest growth and steady growth from Japan.
• Challenging year of Developing Asia to maintain financial stability and sustain economic growth
Malaysian economy: continued moderate growth
• Growth in 2014 will depend on private investment and exports, with softening private consumption
• Inflation will be a focal point in 2014 driven by on-going rationalisation of subsidy and pre-GST impact. The other one being public debt
• Authorities will continue to adopt prudent and pragmatic macroeconomic policies, reining in fiscal deficit and public debt
2013 2014f 2015f
RGDP y/y% 4.7 4.8 5.2
Inflation y/y% 2.1 3.0 3.6
Unemployment (%) 2.9 3.0 3.0
FB% GDP (FY) -3.9 -3.5 -3.0
CA% GDP 3.6 3.0 3.0
89.8
4.0%
9.5%
Jan-1
2
Feb-1
2
Mar-
12
Apr-
12
May-1
2
Jun-1
2
Jul-
12
Aug-1
2
Sep-1
2
Oct-
12
Nov-1
2
Dec-1
2
Jan-1
3
Feb-1
3
Mar-
13
Apr-
13
May-1
3
Jun-1
3
Jul-
13
Aug-1
3
Sep-1
3
Oct-
13
Nov-1
3
Dec-1
3
Jan-1
4
Feb-1
4
Mar-
14
RM'bil
Loans disbursed Loans approved Loans Applied
Your Bank. Malaysia’s Bank. AmBank.33FY2014 Results – Investors Presentation
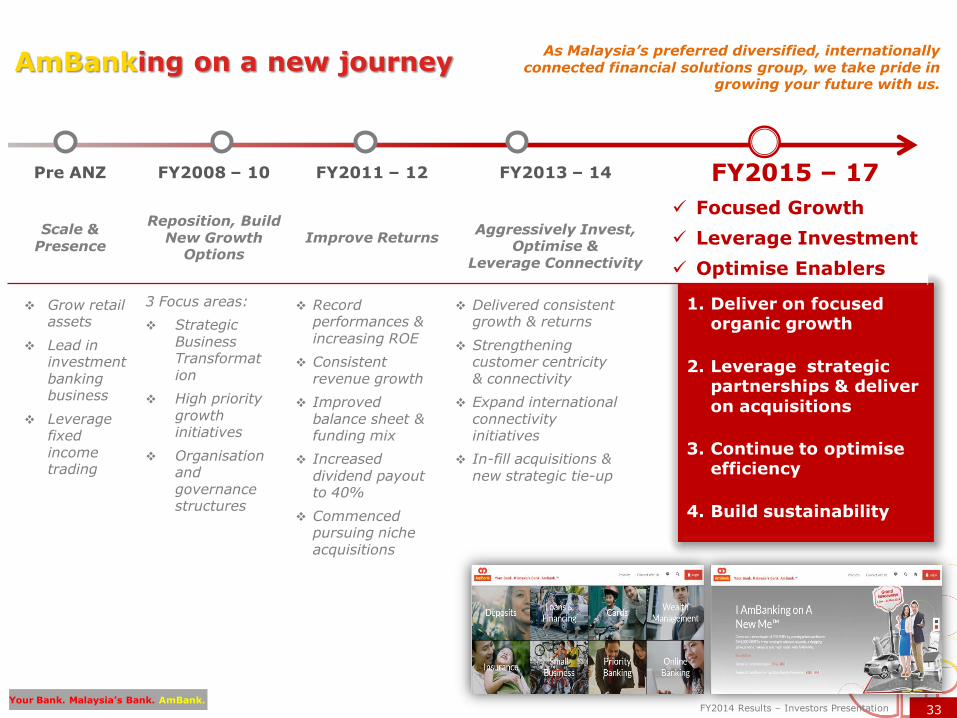
As Malaysia’s preferred diversified, internationally connected financial solutions group, we take pride in
growing your future with us.
Record performances & increasing ROE
Consistent revenue growth
Improved balance sheet & funding mix
Increased dividend payout to 40%
Commenced pursuing niche acquisitions
3 Focus areas:
Strategic Business Transformation
High priority growth initiatives
Organisationand governance structures
Delivered consistent growth & returns
Strengthening customer centricity & connectivity
Expand international connectivity initiatives
In-fill acquisitions & new strategic tie-up
Grow retail assets
Lead in investment banking business
Leverage fixed income trading
AmBanking on a new journey
1. Deliver on focused organic growth
2. Leverage strategic partnerships & deliver on acquisitions
3. Continue to optimiseefficiency
4. Build sustainability
Pre ANZ FY2008 – 10 FY2011 – 12 FY2013 – 14 FY2015 – 17
Scale & Presence
Reposition, Build New Growth
OptionsImprove Returns
Aggressively Invest, Optimise &
Leverage Connectivity
Focused Growth
Leverage Investment
Optimise Enablers
Your Bank. Malaysia’s Bank. AmBank.34FY2014 Results – Investors Presentation
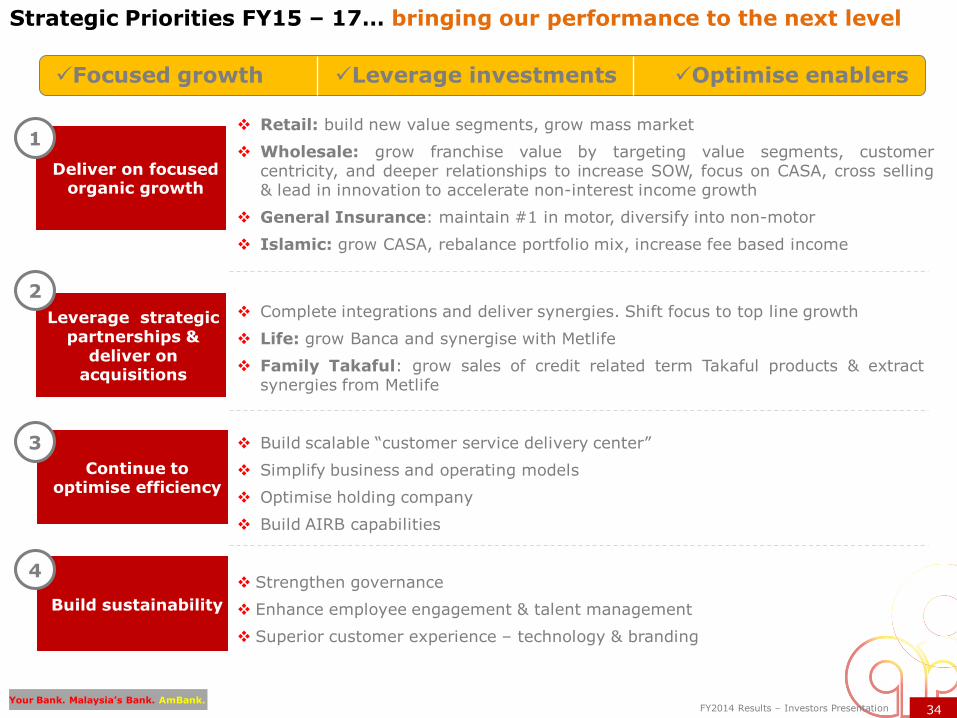
Focused growth Leverage investments Optimise enablers
Strategic Priorities FY15 – 17… bringing our performance to the next level
Retail: build new value segments, grow mass market
Wholesale: grow franchise value by targeting value segments, customercentricity, and deeper relationships to increase SOW, focus on CASA, cross selling& lead in innovation to accelerate non-interest income growth
General Insurance: maintain #1 in motor, diversify into non-motor
Islamic: grow CASA, rebalance portfolio mix, increase fee based income
Complete integrations and deliver synergies. Shift focus to top line growth
Life: grow Banca and synergise with Metlife
Family Takaful: grow sales of credit related term Takaful products & extractsynergies from Metlife
Build scalable “customer service delivery center”
Simplify business and operating models
Optimise holding company
Build AIRB capabilities
Strengthen governance
Enhance employee engagement & talent management
Superior customer experience – technology & branding
Deliver on focused organic growth
Leverage strategic partnerships &
deliver on acquisitions
Continue to optimise efficiency
Build sustainability
1
2
3
4
35Your Bank. Malaysia’s Bank. AmBank.
FY2014 Results – Investors Presentation
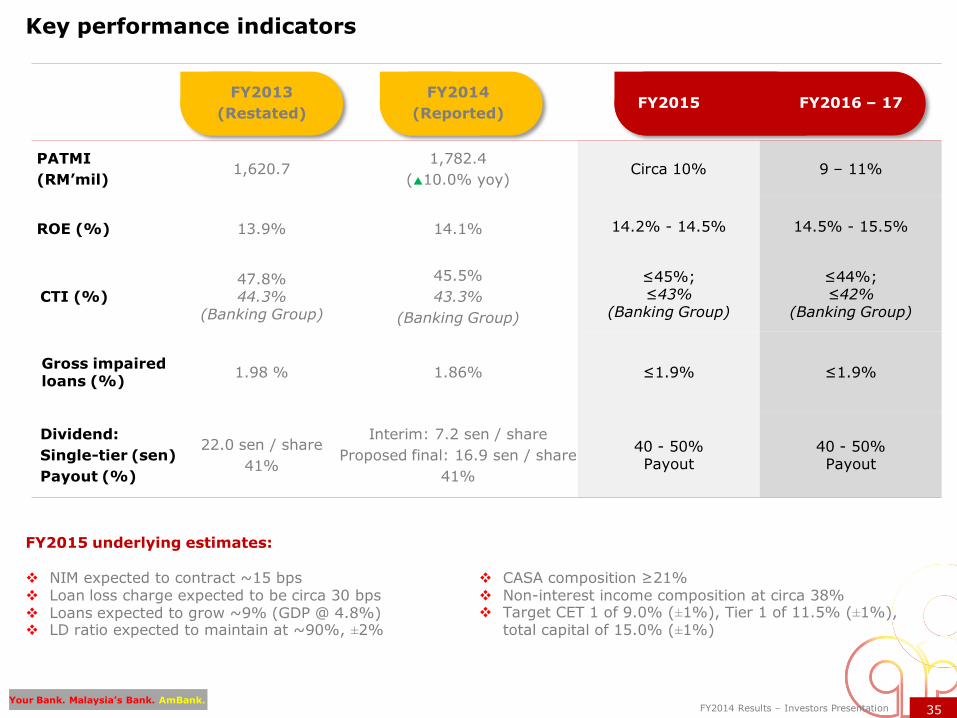
FY2013
(Restated)
FY2014
(Reported)FY2015 FY2016 – 17
PATMI
(RM’mil)1,620.7
1,782.4
(10.0% yoy)Circa 10% 9 – 11%
ROE (%) 13.9% 14.1% 14.2% - 14.5% 14.5% - 15.5%
CTI (%)47.8%44.3%
(Banking Group)
45.5%
43.3%
(Banking Group)
≤45%;≤43%
(Banking Group)
≤44%;≤42%
(Banking Group)
Gross impaired loans (%)
1.98 % 1.86% ≤1.9% ≤1.9%
Dividend:
Single-tier (sen)
Payout (%)
22.0 sen / share
41%
Interim: 7.2 sen / share
Proposed final: 16.9 sen / share
41%
40 - 50%Payout
40 - 50%Payout
Key performance indicators
FY2015 underlying estimates:
NIM expected to contract ~15 bps Loan loss charge expected to be circa 30 bps Loans expected to grow ~9% (GDP @ 4.8%) LD ratio expected to maintain at ~90%, ±2%
CASA composition ≥21% Non-interest income composition at circa 38% Target CET 1 of 9.0% (±1%), Tier 1 of 11.5% (±1%),
total capital of 15.0% (±1%)
36Your Bank. Malaysia’s Bank. AmBank.
FY2014 Results – Investors Presentation
3
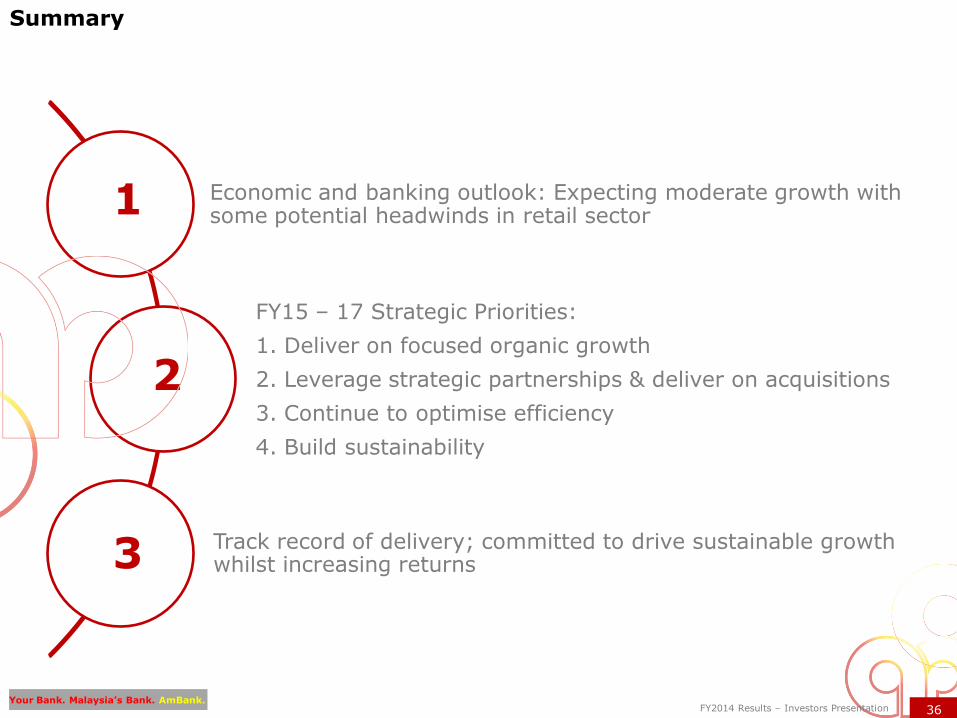
Summary
Economic and banking outlook: Expecting moderate growth with some potential headwinds in retail sector
FY15 – 17 Strategic Priorities:
1. Deliver on focused organic growth
2. Leverage strategic partnerships & deliver on acquisitions
3. Continue to optimise efficiency
4. Build sustainability
Track record of delivery; committed to drive sustainable growth whilst increasing returns
1
2
3
37Your Bank. Malaysia’s Bank. AmBank.
FY2014 Results – Investors PresentationYour Bank. Malaysia’s Bank. AmBank.
AGENDA Page
1. EXECUTIVE SUMMARY 3
2. STRATEGIC PARTNERSHIP/INTEGRATION UPDATES 10
3. FY2014 GROUP FINANCIAL PERFORMANCE 17
4. OUTLOOK & STRATEGIC PRIORITIES 32
5. DIVISIONAL STRATEGY & PERFORMANCE 38
6. SUPPLEMENTARY INFORMATION 45
- AMBANK GROUP
- ECONOMY & INDUSTRY
38Your Bank. Malaysia’s Bank. AmBank.
FY2014 Results – Investors Presentation
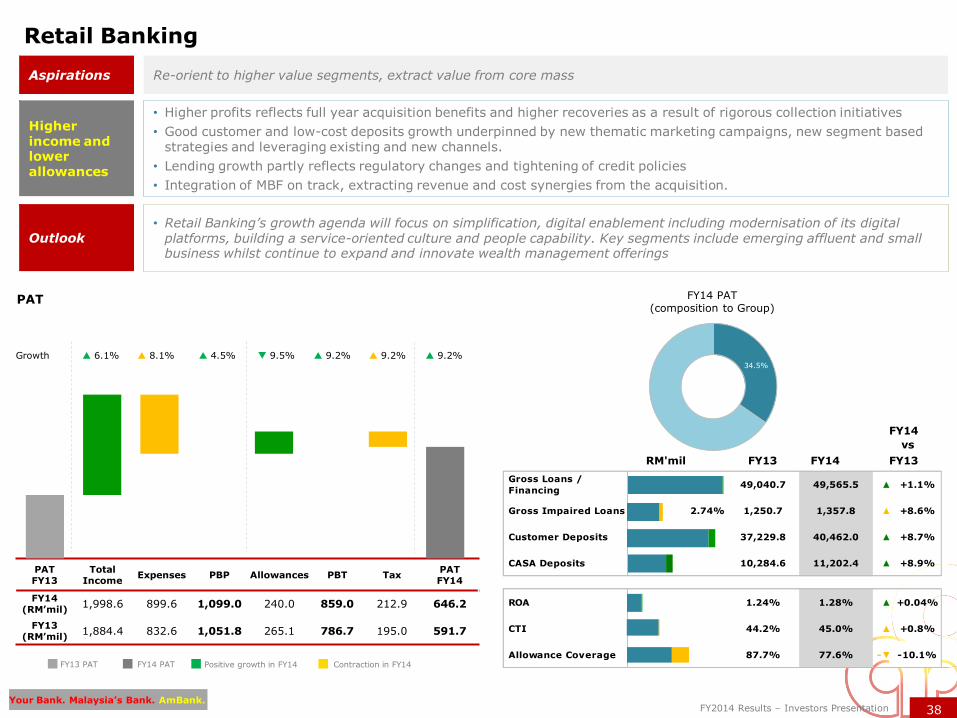
Retail Banking
Re-orient to higher value segments, extract value from core massAspirations
6.1%Growth 4.5% 8.1% 9.5% 9.2% 9.2% 9.2%
• Retail Banking’s growth agenda will focus on simplification, digital enablement including modernisation of its digital platforms, building a service-oriented culture and people capability. Key segments include emerging affluent and small business whilst continue to expand and innovate wealth management offerings
Outlook
PAT
FY14 PATFY13 PAT Positive growth in FY14 Contraction in FY14
• Higher profits reflects full year acquisition benefits and higher recoveries as a result of rigorous collection initiatives
• Good customer and low-cost deposits growth underpinned by new thematic marketing campaigns, new segment based strategies and leveraging existing and new channels.
• Lending growth partly reflects regulatory changes and tightening of credit policies
• Integration of MBF on track, extracting revenue and cost synergies from the acquisition.
Higher income and lower allowances
FY14 PAT
(composition to Group)
FY14
vs
RM'mil FY13 FY14 FY13
PATFY13
TotalIncome
Expenses PBP Allowances PBT TaxPATFY14
FY14 (RM’mil)
1,998.6 899.6 1,099.0 240.0 859.0 212.9 646.2
FY13(RM’mil)
1,884.4 832.6 1,051.8 265.1 786.7 195.0 591.7
34.5%
Gross Loans /
Financing 49,040.7 49,565.5 ▲ +1.1%
Gross Impaired Loans 2.74% 1,250.7 1,357.8 ▲ +8.6%
Customer Deposits 37,229.8 40,462.0 ▲ +8.7%
CASA Deposits 10,284.6 11,202.4 ▲ +8.9%
ROA 1.24% 1.28% ▲ +0.04%
CTI 44.2% 45.0% ▲ +0.8%
Allowance Coverage 87.7% 77.6% -▼ -10.1%
39Your Bank. Malaysia’s Bank. AmBank.
FY2014 Results – Investors Presentation
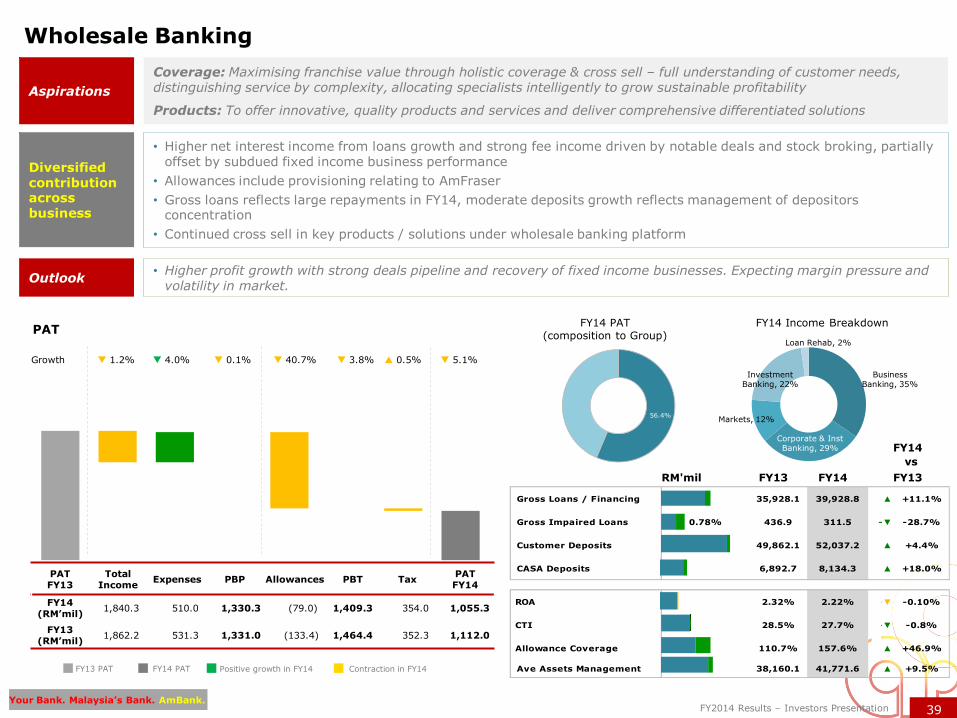
Wholesale Banking
1.2%Growth 0.1% 4.0% 40.7% 3.8% 0.5% 5.1%
FY14 PATFY13 PAT Positive growth in FY14 Contraction in FY14
PATFY13
TotalIncome
Expenses PBP Allowances PBT TaxPATFY14
FY14 (RM’mil)
1,840.3 510.0 1,330.3 (79.0) 1,409.3 354.0 1,055.3
FY13(RM’mil)
1,862.2 531.3 1,331.0 (133.4) 1,464.4 352.3 1,112.0
PAT
Coverage: Maximising franchise value through holistic coverage & cross sell – full understanding of customer needs, distinguishing service by complexity, allocating specialists intelligently to grow sustainable profitability
Products: To offer innovative, quality products and services and deliver comprehensive differentiated solutions
Aspirations
Outlook • Higher profit growth with strong deals pipeline and recovery of fixed income businesses. Expecting margin pressure and
volatility in market.
• Higher net interest income from loans growth and strong fee income driven by notable deals and stock broking, partially offset by subdued fixed income business performance
• Allowances include provisioning relating to AmFraser
• Gross loans reflects large repayments in FY14, moderate deposits growth reflects management of depositors concentration
• Continued cross sell in key products / solutions under wholesale banking platform
Diversified contribution across business
56.4%
FY14 PAT(composition to Group)
FY14 Income Breakdown
Business Banking, 35%
Corporate & Inst Banking, 29%
Investment Banking, 22%
Markets, 12%
Loan Rehab, 2%
FY14
vs
RM'mil FY13 FY14 FY13
Gross Loans / Financing 35,928.1 39,928.8 ▲ +11.1%
Gross Impaired Loans 0.78% 436.9 311.5 -▼ -28.7%
Customer Deposits 49,862.1 52,037.2 ▲ +4.4%
CASA Deposits 6,892.7 8,134.3 ▲ +18.0%
ROA 2.32% 2.22% -▼ -0.10%
CTI 28.5% 27.7% -▼ -0.8%
Allowance Coverage 110.7% 157.6% ▲ +46.9%
Ave Assets Management 38,160.1 41,771.6 ▲ +9.5%
40Your Bank. Malaysia’s Bank. AmBank.
FY2014 Results – Investors Presentation
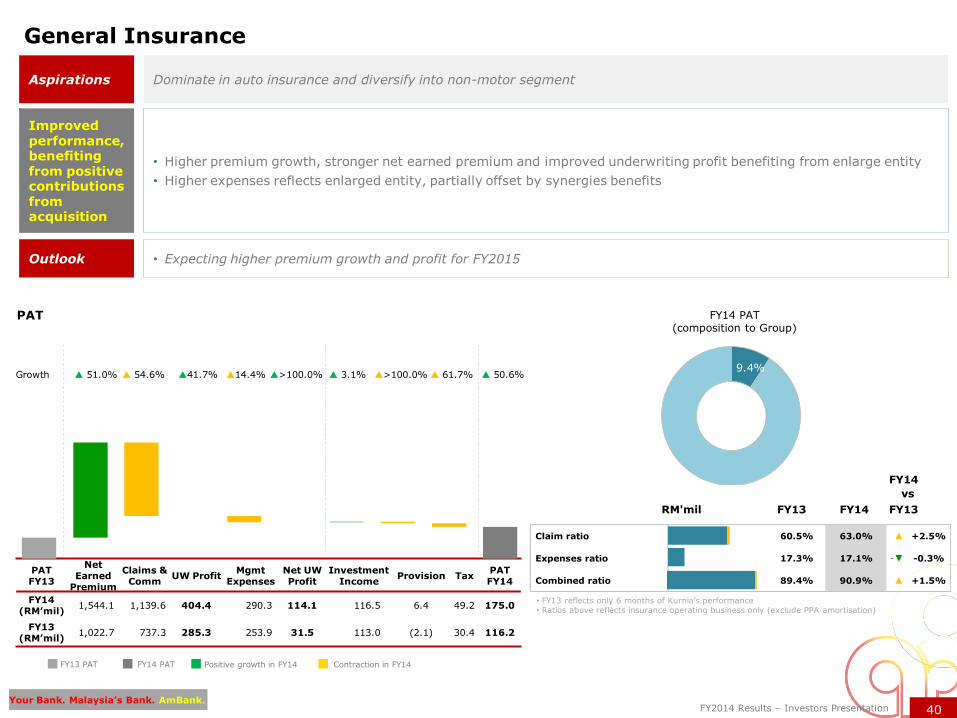
General Insurance
Dominate in auto insurance and diversify into non-motor segment Aspirations
51.0%Growth 41.7% 54.6% 14.4% >100.0% >100.0% 50.6%
Outlook
PAT FY14 PAT(composition to Group)
• Higher premium growth, stronger net earned premium and improved underwriting profit benefiting from enlarge entity
• Higher expenses reflects enlarged entity, partially offset by synergies benefits
Improved performance, benefiting from positive contributions from acquisition
• Expecting higher premium growth and profit for FY2015
PATFY13
Net Earned
Premium
Claims & Comm
UW ProfitMgmt
ExpensesNet UW Profit
Investment Income
Provision TaxPATFY14
FY14 (RM’mil)
1,544.1 1,139.6 404.4 290.3 114.1 116.5 6.4 49.2 175.0
FY13(RM’mil)
1,022.7 737.3 285.3 253.9 31.5 113.0 (2.1) 30.4 116.2
FY14 PATFY13 PAT Positive growth in FY14 Contraction in FY14
FY14
vs
RM'mil FY13 FY14 FY13
61.7% 3.1%9.4%
• FY13 reflects only 6 months of Kurnia‟s performance• Ratios above reflects insurance operating business only (exclude PPA amortisation)
Claim ratio 60.5% 63.0% ▲ +2.5%
Expenses ratio 17.3% 17.1% -▼ -0.3%
Combined ratio 89.4% 90.9% ▲ +1.5%
G
GGG
GGGG
G
G
GGG
GG
GGG
GGG
GG
41Your Bank. Malaysia’s Bank. AmBank.
FY2014 Results – Investors Presentation
0.7%
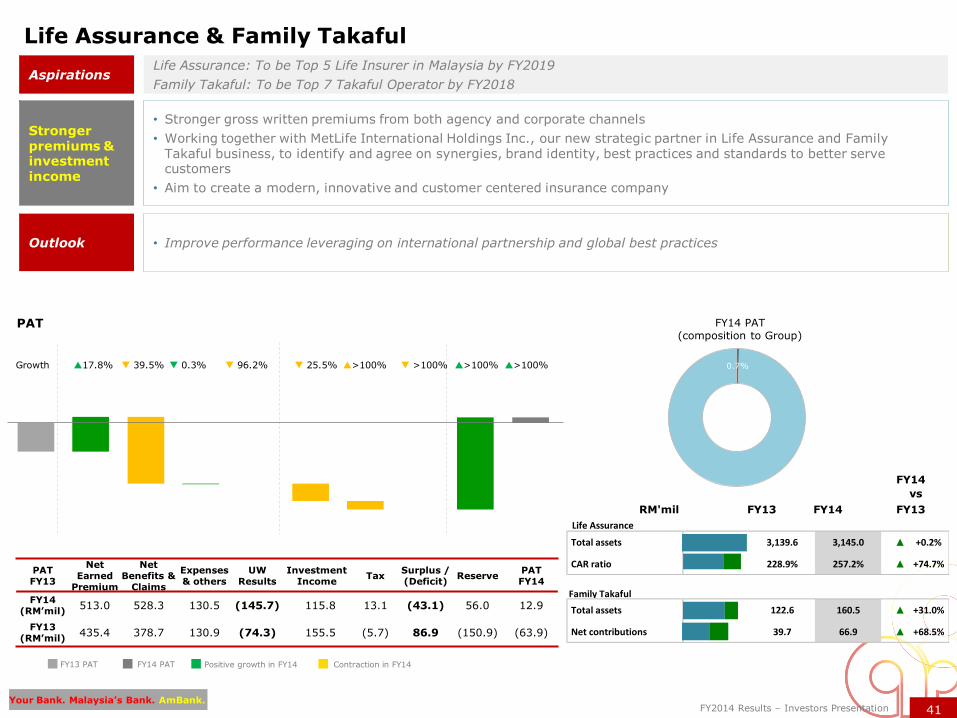
Life Assurance & Family Takaful
Life Assurance: To be Top 5 Life Insurer in Malaysia by FY2019
Family Takaful: To be Top 7 Takaful Operator by FY2018Aspirations
Growth 39.5% 25.5%17.8% 0.3% >100% >100%
Outlook • Improve performance leveraging on international partnership and global best practices
PAT FY14 PAT(composition to Group)
• Stronger gross written premiums from both agency and corporate channels
• Working together with MetLife International Holdings Inc., our new strategic partner in Life Assurance and Family Takaful business, to identify and agree on synergies, brand identity, best practices and standards to better serve customers
• Aim to create a modern, innovative and customer centered insurance company
Stronger premiums & investment income
PATFY13
Net Earned
Premium
Net Benefits &
Claims
Expenses & others
UW Results
Investment Income
TaxSurplus / (Deficit)
ReservePATFY14
FY14 (RM’mil)
513.0 528.3 130.5 (145.7) 115.8 13.1 (43.1) 56.0 12.9
FY13(RM’mil)
435.4 378.7 130.9 (74.3) 155.5 (5.7) 86.9 (150.9) (63.9)
FY14 PATFY13 PAT Positive growth in FY14 Contraction in FY14
FY14
vs
RM'mil FY13 FY14 FY13
96.2% >100% >100%
Life Assurance
Total assets 3,139.6 3,145.0 ▲ +0.2%
CAR ratio 228.9% 257.2% ▲ +74.7%
Family Takaful
Total assets 122.6 160.5 ▲ +31.0%
Net contributions 39.7 66.9 ▲ +68.5%
G
42Your Bank. Malaysia’s Bank. AmBank.
FY2014 Results – Investors Presentation
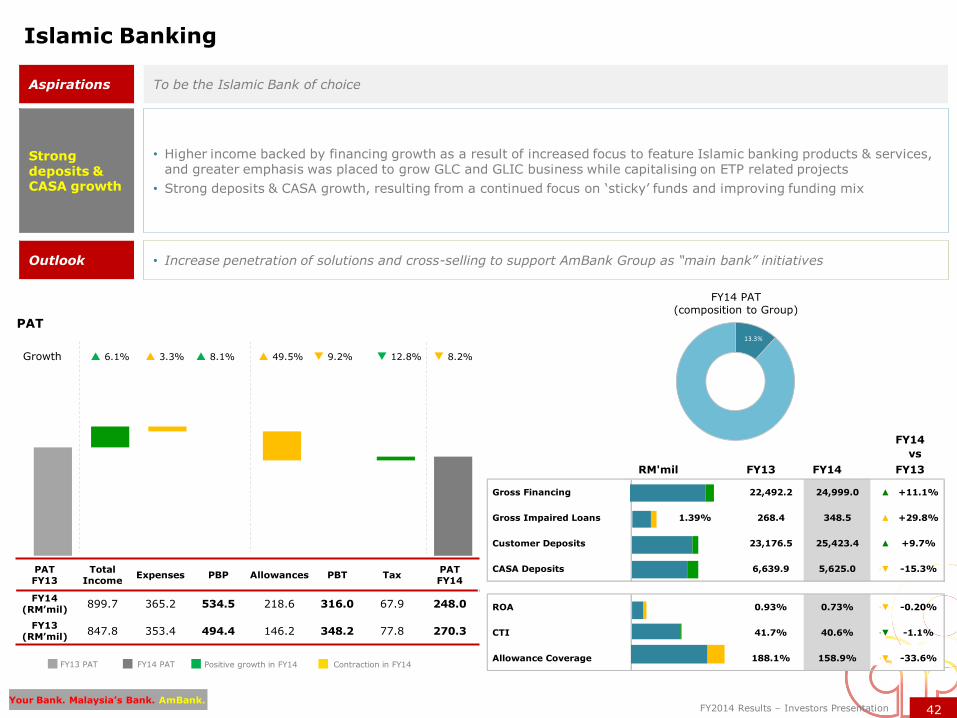
FY14 PAT(composition to Group)
• Higher income backed by financing growth as a result of increased focus to feature Islamic banking products & services, and greater emphasis was placed to grow GLC and GLIC business while capitalising on ETP related projects
• Strong deposits & CASA growth, resulting from a continued focus on „sticky‟ funds and improving funding mix
Islamic Banking
To be the Islamic Bank of choiceAspirations
Strong deposits & CASA growth
6.1%Growth 8.1% 3.3% 49.5% 9.2% 12.8% 8.2%
Outlook • Increase penetration of solutions and cross-selling to support AmBank Group as “main bank” initiatives
PAT
PATFY13
TotalIncome
Expenses PBP Allowances PBT TaxPATFY14
FY14 (RM’mil)
899.7 365.2 534.5 218.6 316.0 67.9 248.0
FY13(RM’mil)
847.8 353.4 494.4 146.2 348.2 77.8 270.3
FY14 PATFY13 PAT Positive growth in FY14 Contraction in FY14
FY14
vs
RM'mil FY13 FY14 FY13
1
13.3%
Gross Financing 22,492.2 24,999.0 ▲ +11.1%
Gross Impaired Loans 1.39% 268.4 348.5 ▲ +29.8%
Customer Deposits 23,176.5 25,423.4 ▲ +9.7%
CASA Deposits 6,639.9 5,625.0 -▼ -15.3%
ROA 0.93% 0.73% -▼ -0.20%
CTI 41.7% 40.6% -▼ -1.1%
Allowance Coverage 188.1% 158.9% -▼ -33.6%
G
43Your Bank. Malaysia’s Bank. AmBank.
FY2014 Results – Investors Presentation
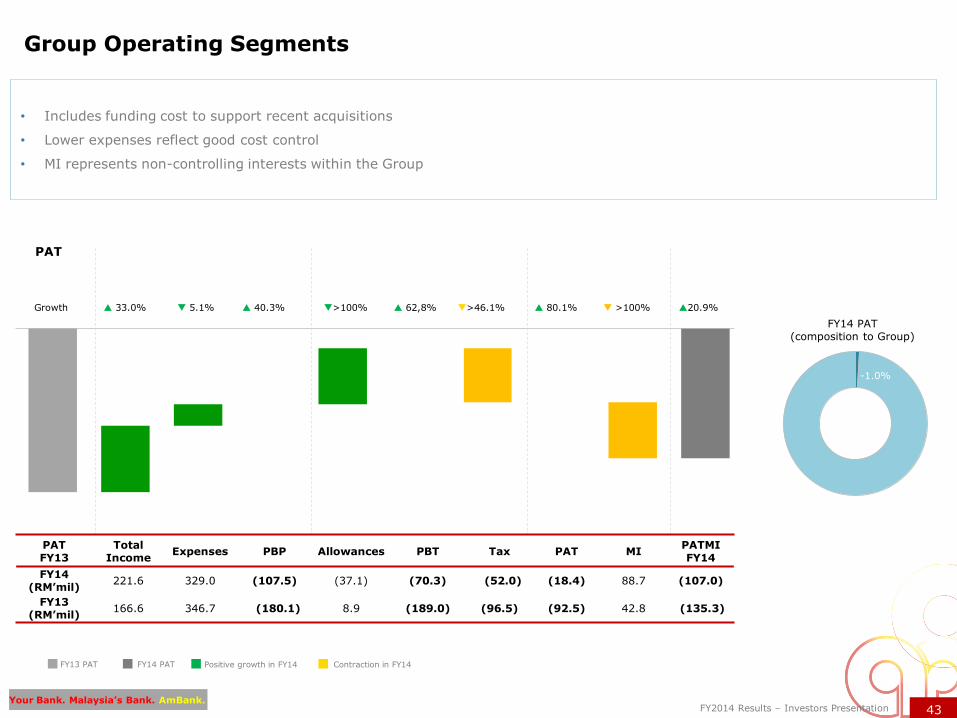
• Includes funding cost to support recent acquisitions
• Lower expenses reflect good cost control
• MI represents non-controlling interests within the Group
Group Operating Segments
FY14 PAT(composition to Group)
3.0% 33.0%Growth 40.3% 5.1% >100% 62,8% >46.1% 80.1%
PAT
20.9%
FY14 PATFY13 PAT Positive growth in FY14 Contraction in FY14
PATFY13
TotalIncome
Expenses PBP Allowances PBT Tax PAT MIPATMIFY14
FY14 (RM’mil)
221.6 329.0 (107.5) (37.1) (70.3) (52.0) (18.4) 88.7 (107.0)
FY13(RM’mil)
166.6 346.7 (180.1) 8.9 (189.0) (96.5) (92.5) 42.8 (135.3)
>100%
-1.0%
44Your Bank. Malaysia’s Bank. AmBank.
FY2014 Results – Investors PresentationYour Bank. Malaysia’s Bank. AmBank.
AGENDA Page
1. EXECUTIVE SUMMARY 3
2. STRATEGIC PARTNERSHIP/INTEGRATION UPDATES 10
3. FY2014 GROUP FINANCIAL PERFORMANCE 17
4. OUTLOOK & STRATEGIC PRIORITIES 32
5. DIVISIONAL STRATEGY & PERFORMANCE 38
6. SUPPLEMENTARY INFORMATION 45
- AMBANK GROUP
- ECONOMY & INDUSTRY
45Your Bank. Malaysia’s Bank. AmBank.
FY2014 Results – Investors Presentation
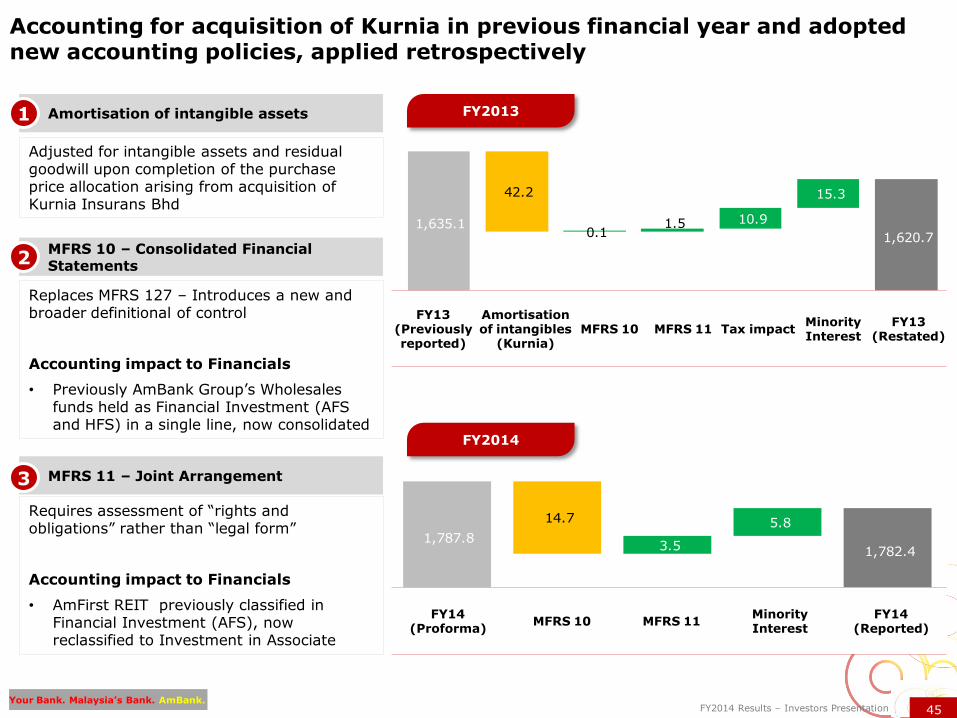
1,787.8 1,782.4 3.5
5.8 14.7
1,635.1 1,620.7 0.1
1.5 10.9
15.3 42.2
MFRS 11 – Joint Arrangement
MFRS 10 – Consolidated Financial Statements
Requires assessment of “rights and obligations” rather than “legal form”
Accounting impact to Financials
• AmFirst REIT previously classified in Financial Investment (AFS), now reclassified to Investment in Associate
Replaces MFRS 127 – Introduces a new and broader definitional of control
Accounting impact to Financials
• Previously AmBank Group‟s Wholesales funds held as Financial Investment (AFS and HFS) in a single line, now consolidated
2
3
Accounting for acquisition of Kurnia in previous financial year and adopted new accounting policies, applied retrospectively
FY13(Previously reported)
Amortisationof intangibles
(Kurnia)MFRS 10 MFRS 11 Tax impact
Minority Interest
FY13 (Restated)
FY14(Proforma)
MFRS 10 MFRS 11Minority Interest
FY14(Reported)
Amortisation of intangible assets
Adjusted for intangible assets and residual goodwill upon completion of the purchase price allocation arising from acquisition of Kurnia Insurans Bhd
1 FY2013
FY2014
46Your Bank. Malaysia’s Bank. AmBank.
FY2014 Results – Investors Presentation
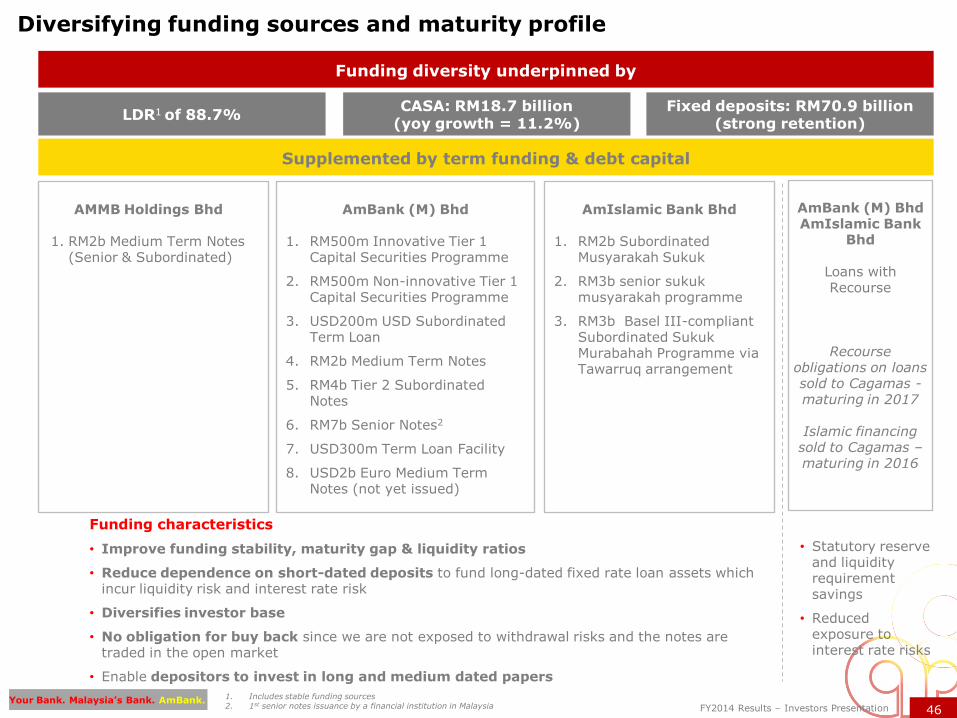
Diversifying funding sources and maturity profile
LDR1 of 88.7%
AmIslamic Bank Bhd
1. RM2b Subordinated Musyarakah Sukuk
2. RM3b senior sukukmusyarakah programme
3. RM3b Basel III-compliant Subordinated SukukMurabahah Programme via Tawarruq arrangement
AMMB Holdings Bhd
1. RM2b Medium Term Notes (Senior & Subordinated)
Funding diversity underpinned by
CASA: RM18.7 billion (yoy growth = 11.2%)
Fixed deposits: RM70.9 billion (strong retention)
Supplemented by term funding & debt capital
AmBank (M) Bhd
1. RM500m Innovative Tier 1 Capital Securities Programme
2. RM500m Non-innovative Tier 1 Capital Securities Programme
3. USD200m USD Subordinated Term Loan
4. RM2b Medium Term Notes
5. RM4b Tier 2 Subordinated Notes
6. RM7b Senior Notes2
7. USD300m Term Loan Facility
8. USD2b Euro Medium Term Notes (not yet issued)
1. Includes stable funding sources 2. 1st senior notes issuance by a financial institution in Malaysia
AmBank (M) BhdAmIslamic Bank
Bhd
Loans with Recourse
Recourse obligations on loans sold to Cagamas -maturing in 2017
Islamic financing sold to Cagamas –maturing in 2016
• Statutory reserve and liquidity requirement savings
• Reduced exposure to interest rate risks
Funding characteristics
• Improve funding stability, maturity gap & liquidity ratios
• Reduce dependence on short-dated deposits to fund long-dated fixed rate loan assets which incur liquidity risk and interest rate risk
• Diversifies investor base
• No obligation for buy back since we are not exposed to withdrawal risks and the notes are traded in the open market
• Enable depositors to invest in long and medium dated papers
47Your Bank. Malaysia’s Bank. AmBank.
FY2014 Results – Investors Presentation
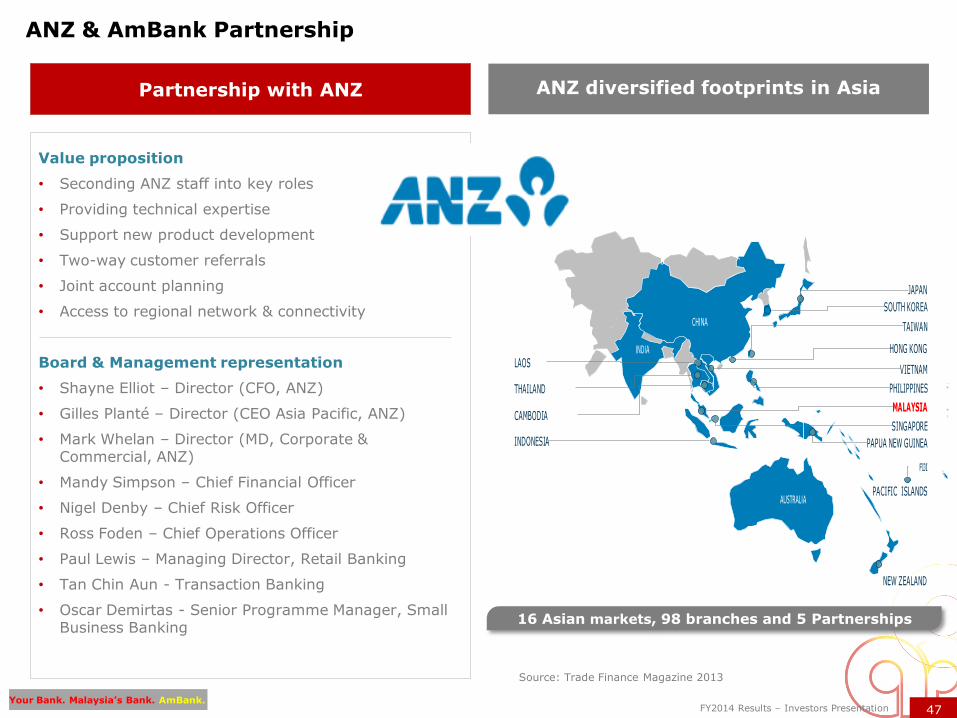
ANZ diversified footprints in Asia
Value proposition
• Seconding ANZ staff into key roles
• Providing technical expertise
• Support new product development
• Two-way customer referrals
• Joint account planning
• Access to regional network & connectivity
Board & Management representation
• Shayne Elliot – Director (CFO, ANZ)
• Gilles Planté– Director (CEO Asia Pacific, ANZ)
• Mark Whelan – Director (MD, Corporate & Commercial, ANZ)
• Mandy Simpson – Chief Financial Officer
• Nigel Denby – Chief Risk Officer
• Ross Foden – Chief Operations Officer
• Paul Lewis – Managing Director, Retail Banking
• Tan Chin Aun - Transaction Banking
• Oscar Demirtas - Senior Programme Manager, Small Business Banking
Partnership with ANZ
Source: Trade Finance Magazine 2013
CHINA
HONG KONG
PHILIPPINES
VIETNAM
NEW ZEALAND
SOUTH KOREA
JAPAN
TAIWAN
INDONESIA
AUSTRALIAPACIFIC ISLANDS
SINGAPORE
LAOS
THAILAND
CAMBODIAMALAYSIA
PAPUA NEW GUINEA
FIJI
INDIA
ANZ & AmBank Partnership
16 Asian markets, 98 branches and 5 Partnerships
48Your Bank. Malaysia’s Bank. AmBank.
FY2014 Results – Investors Presentation
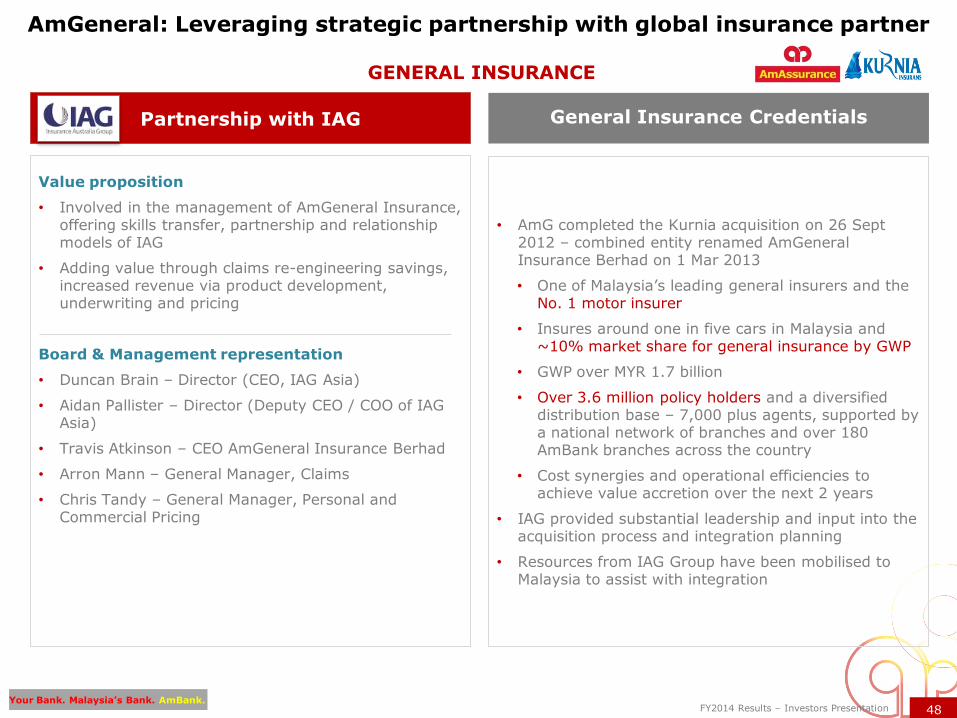
General Insurance Credentials
• AmG completed the Kurnia acquisition on 26 Sept 2012 – combined entity renamed AmGeneralInsurance Berhad on 1 Mar 2013
• One of Malaysia‟s leading general insurers and the No. 1 motor insurer
• Insures around one in five cars in Malaysia and ~10% market share for general insurance by GWP
• GWP over MYR 1.7 billion
• Over 3.6 million policy holders and a diversified distribution base – 7,000 plus agents, supported by a national network of branches and over 180 AmBank branches across the country
• Cost synergies and operational efficiencies to achieve value accretion over the next 2 years
• IAG provided substantial leadership and input into the acquisition process and integration planning
• Resources from IAG Group have been mobilised to Malaysia to assist with integration
Value proposition
• Involved in the management of AmGeneral Insurance, offering skills transfer, partnership and relationship models of IAG
• Adding value through claims re-engineering savings, increased revenue via product development, underwriting and pricing
Board & Management representation
• Duncan Brain – Director (CEO, IAG Asia)
• Aidan Pallister – Director (Deputy CEO / COO of IAG Asia)
• Travis Atkinson – CEO AmGeneral Insurance Berhad
• Arron Mann – General Manager, Claims
• Chris Tandy – General Manager, Personal and Commercial Pricing
Partnership with IAG
GENERAL INSURANCE
AmGeneral: Leveraging strategic partnership with global insurance partner
49Your Bank. Malaysia’s Bank. AmBank.
FY2014 Results – Investors Presentation
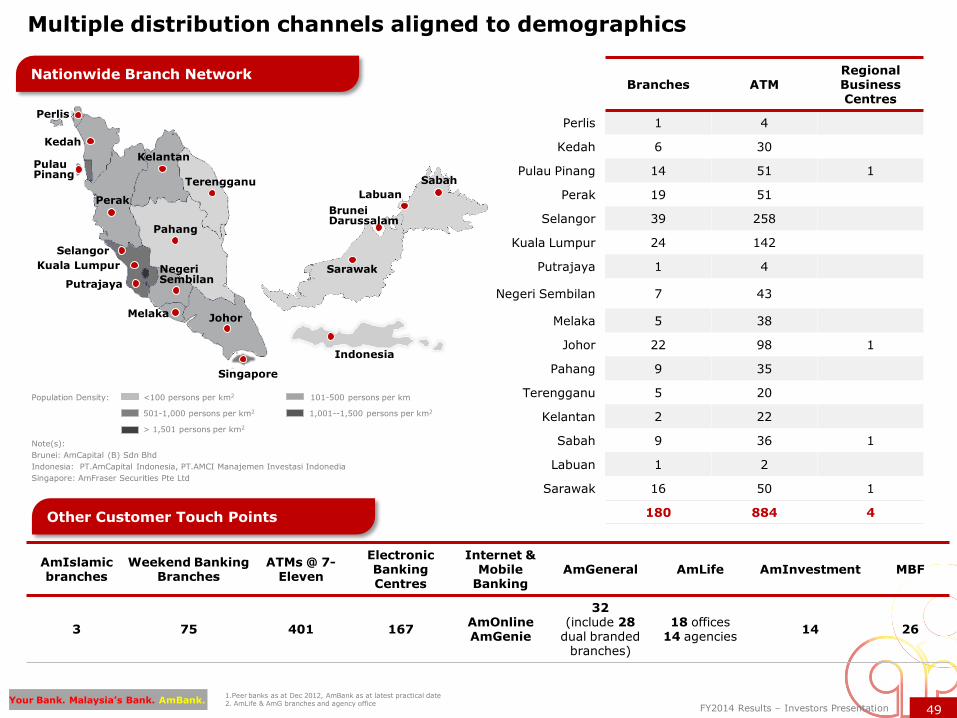
Branches ATMRegional Business Centres
Perlis 1 4
Kedah 6 30
Pulau Pinang 14 51 1
Perak 19 51
Selangor 39 258
Kuala Lumpur 24 142
Putrajaya 1 4
Negeri Sembilan 7 43
Melaka 5 38
Johor 22 98 1
Pahang 9 35
Terengganu 5 20
Kelantan 2 22
Sabah 9 36 1
Labuan 1 2
Sarawak 16 50 1
180 884 4
1.Peer banks as at Dec 2012, AmBank as at latest practical date2. AmLife & AmG branches and agency office
Multiple distribution channels aligned to demographics
Population Density: <100 persons per km2 101-500 persons per km
501-1,000 persons per km2 1,001--1,500 persons per km2
> 1,501 persons per km2
Perlis
Kedah
PulauPinang
Perak
SarawakKuala Lumpur
Putrajaya
NegeriSembilan
Melaka Johor
Pahang
Singapore
Indonesia
Selangor
Labuan
SabahTerengganu
Kelantan
AmIslamicbranches
Weekend Banking Branches
ATMs @ 7-Eleven
ElectronicBanking Centres
Internet & Mobile
BankingAmGeneral AmLife AmInvestment MBF
3 75 401 167AmOnlineAmGenie
32(include 28
dual branded branches)
18 offices14 agencies
14 26
Note(s):
Brunei: AmCapital (B) Sdn Bhd
Indonesia: PT.AmCapital Indonesia, PT.AMCI Manajemen Investasi Indonedia
Singapore: AmFraser Securities Pte Ltd
Brunei Darussalam
Nationwide Branch Network
Other Customer Touch Points
50Your Bank. Malaysia’s Bank. AmBank.
FY2014 Results – Investors Presentation
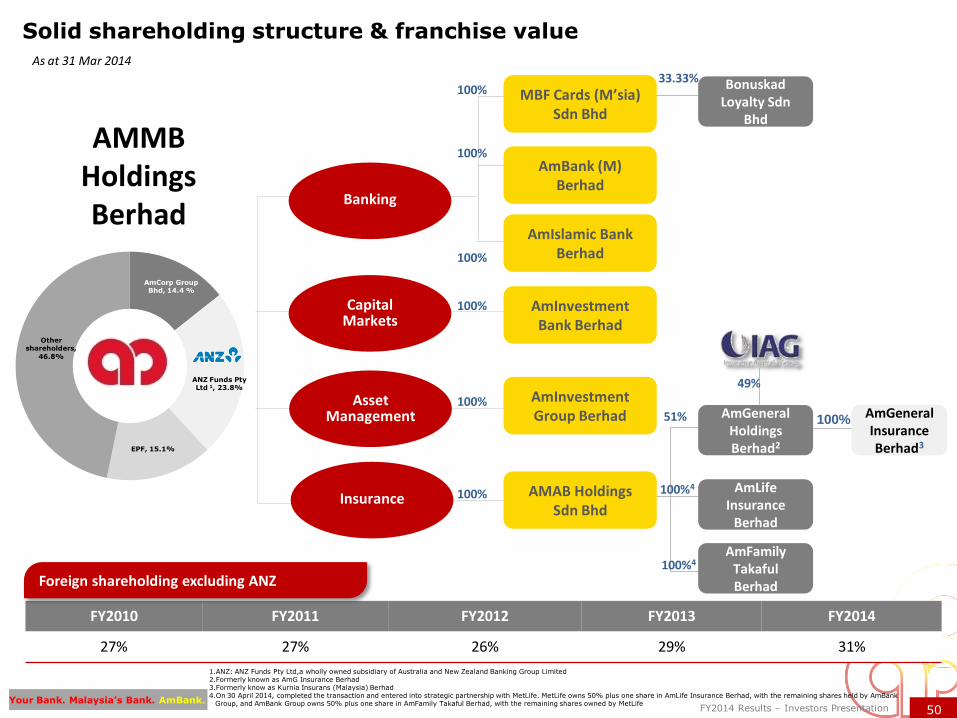
AmInvestmentGroup Berhad
AmCorp Group Bhd, 14.4 %
ANZ Funds Pty Ltd 1, 23.8%
EPF, 15.1%
Other shareholders,
46.8%
FY2010 FY2011 FY2012 FY2013 FY2014
27% 27% 26% 29% 31%
Solid shareholding structure & franchise value
As at 31 Mar 2014
AmLifeInsurance
Berhad
AMMB Holdings Berhad
Capital Markets
100%
100%
100%Asset Management
100%
51%
Banking
Insurance
AmGeneralHoldingsBerhad2
AmFamilyTakaful Berhad
AmBank (M) Berhad
AmIslamic Bank Berhad
AmInvestmentBank Berhad
AMAB Holdings Sdn Bhd
100% MBF Cards (M’sia) Sdn Bhd
BonuskadLoyalty Sdn
Bhd
33.33%
100%
AmGeneralInsurance Berhad3
100%
1.ANZ: ANZ Funds Pty Ltd,a wholly owned subsidiary of Australia and New Zealand Banking Group Limited2.Formerly known as AmG Insurance Berhad3.Formerly know as Kurnia Insurans (Malaysia) Berhad4.On 30 April 2014, completed the transaction and entered into strategic partnership with MetLife. MetLife owns 50% plus one share in AmLife Insurance Berhad, with the remaining shares held by AmBank
Group, and AmBank Group owns 50% plus one share in AmFamily Takaful Berhad, with the remaining shares owned by MetLife
49%
Foreign shareholding excluding ANZ100%4
100%4
51Your Bank. Malaysia’s Bank. AmBank.
FY2014 Results – Investors Presentation
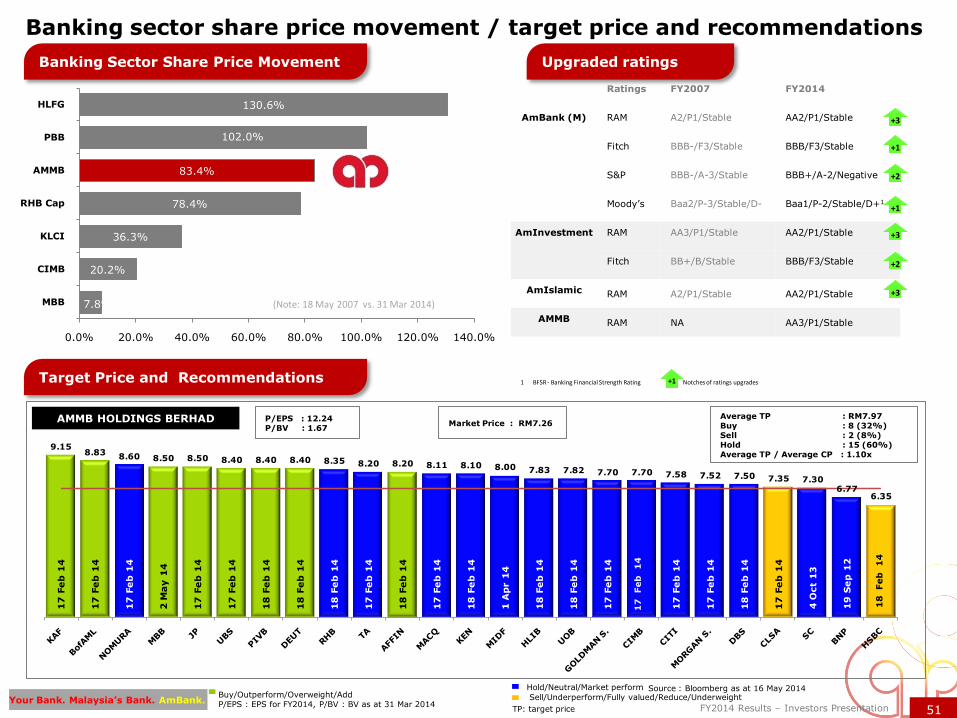
9.158.83
8.60 8.50 8.50 8.40 8.40 8.40 8.35 8.20 8.20 8.11 8.10 8.00 7.83 7.82 7.70 7.70 7.58 7.52 7.50 7.35 7.306.77
6.35
17
Fe
b 1
4
17
Fe
b 1
4
17
Fe
b 1
4
2 M
ay
14
17
Fe
b 1
4
17
Fe
b 1
4
18
Fe
b 1
4
18
Fe
b 1
4
18
Fe
b 1
4
17
Fe
b 1
4
18
Fe
b 1
4
17
Fe
b 1
4
18
Fe
b 1
4
1 A
pr 1
4
18
Fe
b 1
4
18
Fe
b 1
4
17
Fe
b 1
4
17
Fe
b 1
4
17
Fe
b 1
4
18
Fe
b 1
4
17
Fe
b 1
4
4 O
ct
13
19
Se
p 1
2
Buy/Outperform/Overweight/AddP/EPS : EPS for FY2014, P/BV : BV as at 31 Mar 2014
Banking sector share price movement / target price and recommendations
7.8%
20.2%
36.3%
78.4%
83.4%
102.0%
130.6%
0.0% 20.0% 40.0% 60.0% 80.0% 100.0% 120.0% 140.0%
MBB
CIMB
KLCI
RHB Cap
AMMB
PBB
HLFG
(Note: 18 May 2007 vs. 31 Mar 2014)
Ratings FY2007 FY2014
AmBank (M) RAM A2/P1/Stable AA2/P1/Stable
Fitch BBB-/F3/Stable BBB/F3/Stable
S&P BBB-/A-3/Stable BBB+/A-2/Negative
Moody‟s Baa2/P-3/Stable/D- Baa1/P-2/Stable/D+1
AmInvestment RAM AA3/P1/Stable AA2/P1/Stable
Fitch BB+/B/Stable BBB/F3/Stable
AmIslamic RAM A2/P1/Stable AA2/P1/Stable
AMMB RAM NA AA3/P1/Stable
TP: target price
Sell/Underperform/Fully valued/Reduce/Underweight
Hold/Neutral/Market perform Source : Bloomberg as at 16 May 2014
1 BFSR - Banking Financial Strength Rating
+3
+1
+2
+2
+3
+1 Notches of ratings upgrades
+1
AMMB HOLDINGS BERHAD P/EPS : 12.24P/BV : 1.67
Market Price : RM7.26
Banking Sector Share Price Movement Upgraded ratings
Target Price and Recommendations
+3
Average TP : RM7.97Buy : 8 (32%)Sell : 2 (8%)Hold : 15 (60%)Average TP / Average CP : 1.10x
17
Feb
1
4
18
Feb
1
4
52Your Bank. Malaysia’s Bank. AmBank.
FY2014 Results – Investors Presentation
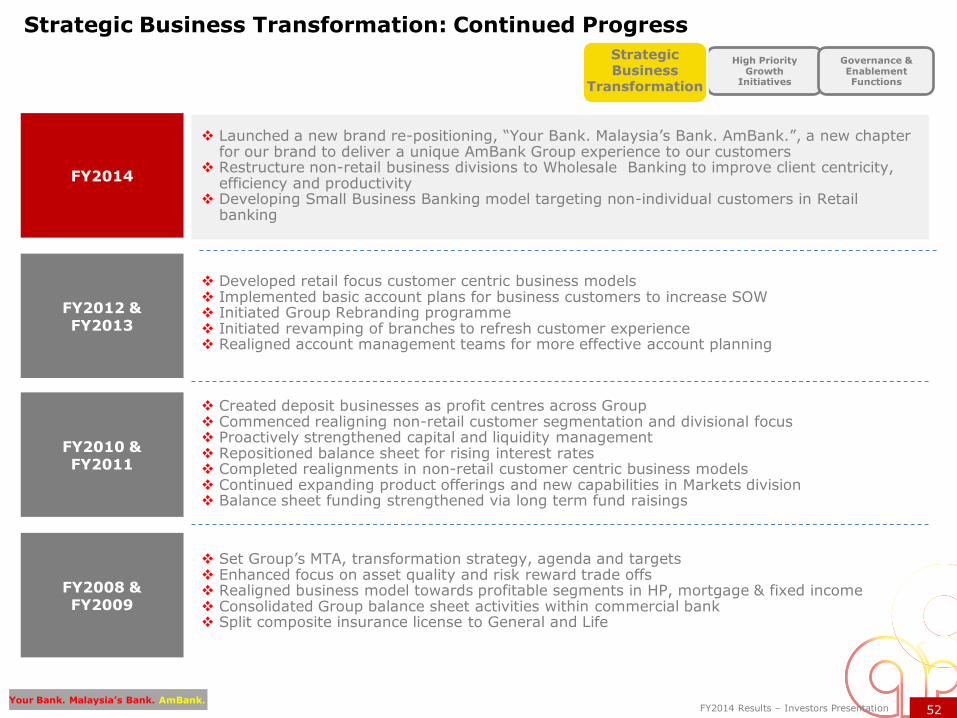
Strategic Business Transformation: Continued Progress
Set Group‟s MTA, transformation strategy, agenda and targets Enhanced focus on asset quality and risk reward trade offs Realigned business model towards profitable segments in HP, mortgage & fixed income Consolidated Group balance sheet activities within commercial bank Split composite insurance license to General and Life
High Priority Growth
Initiatives
Governance & Enablement Functions
Created deposit businesses as profit centres across Group Commenced realigning non-retail customer segmentation and divisional focus Proactively strengthened capital and liquidity management Repositioned balance sheet for rising interest rates Completed realignments in non-retail customer centric business models Continued expanding product offerings and new capabilities in Markets division Balance sheet funding strengthened via long term fund raisings
Developed retail focus customer centric business models Implemented basic account plans for business customers to increase SOW Initiated Group Rebranding programme Initiated revamping of branches to refresh customer experience Realigned account management teams for more effective account planning
Launched a new brand re-positioning, “Your Bank. Malaysia‟s Bank. AmBank.”, a new chapter for our brand to deliver a unique AmBank Group experience to our customers
Restructure non-retail business divisions to Wholesale Banking to improve client centricity, efficiency and productivity
Developing Small Business Banking model targeting non-individual customers in Retail banking
FY2014
FY2012 & FY2013
FY2010 & FY2011
FY2008 & FY2009
Strategic Business
Transformation
53Your Bank. Malaysia’s Bank. AmBank.
FY2014 Results – Investors Presentation
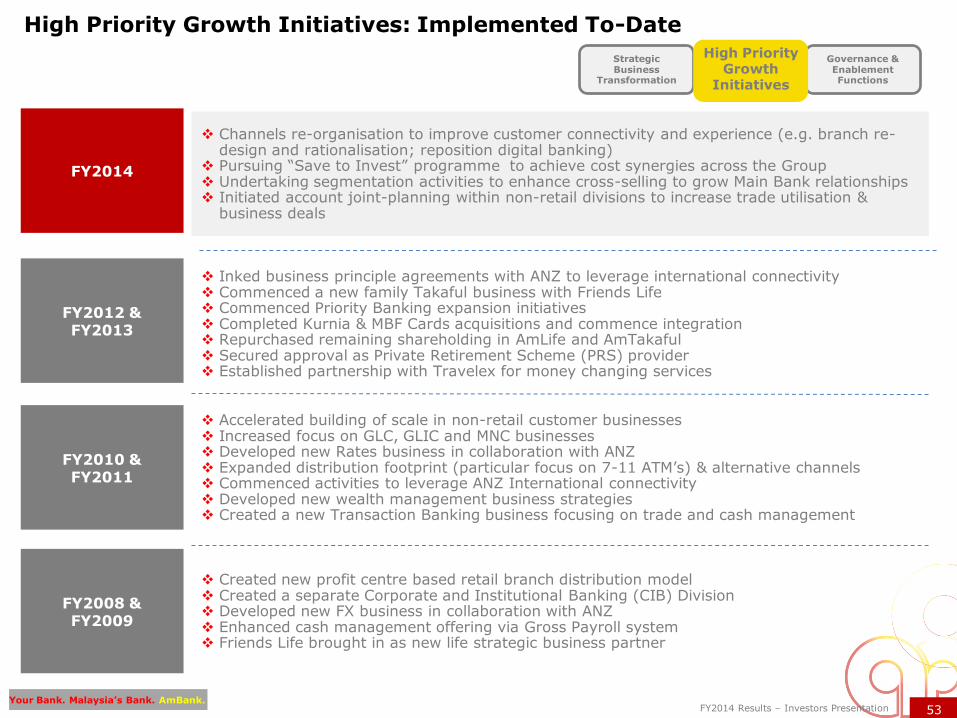
High Priority Growth Initiatives: Implemented To-Date
Created new profit centre based retail branch distribution model Created a separate Corporate and Institutional Banking (CIB) Division Developed new FX business in collaboration with ANZ Enhanced cash management offering via Gross Payroll system Friends Life brought in as new life strategic business partner
Accelerated building of scale in non-retail customer businesses Increased focus on GLC, GLIC and MNC businesses Developed new Rates business in collaboration with ANZ Expanded distribution footprint (particular focus on 7-11 ATM‟s) & alternative channels Commenced activities to leverage ANZ International connectivity Developed new wealth management business strategies Created a new Transaction Banking business focusing on trade and cash management
Inked business principle agreements with ANZ to leverage international connectivity Commenced a new family Takaful business with Friends Life Commenced Priority Banking expansion initiatives Completed Kurnia & MBF Cards acquisitions and commence integration Repurchased remaining shareholding in AmLife and AmTakaful Secured approval as Private Retirement Scheme (PRS) provider Established partnership with Travelex for money changing services
Channels re-organisation to improve customer connectivity and experience (e.g. branch re-design and rationalisation; reposition digital banking)
Pursuing “Save to Invest” programme to achieve cost synergies across the Group Undertaking segmentation activities to enhance cross-selling to grow Main Bank relationships Initiated account joint-planning within non-retail divisions to increase trade utilisation &
business deals
Strategic Business
Transformation
Governance & Enablement Functions
FY2014
FY2012 & FY2013
FY2010 & FY2011
FY2008 & FY2009
High Priority Growth
Initiatives
54Your Bank. Malaysia’s Bank. AmBank.
FY2014 Results – Investors Presentation
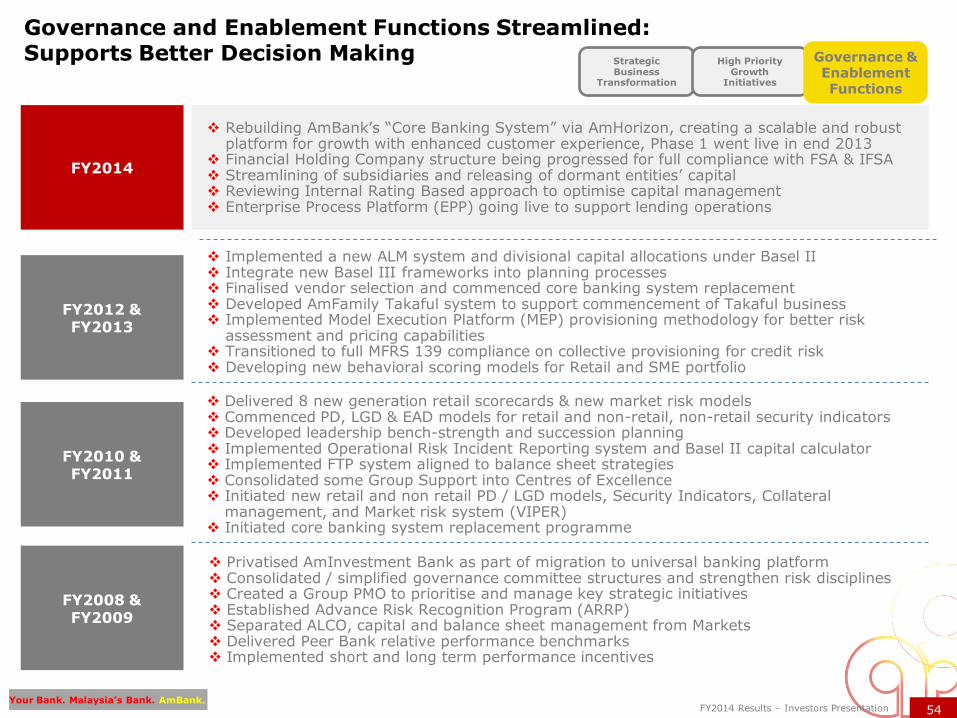
Rebuilding AmBank‟s “Core Banking System” via AmHorizon, creating a scalable and robust platform for growth with enhanced customer experience, Phase 1 went live in end 2013
Financial Holding Company structure being progressed for full compliance with FSA & IFSA Streamlining of subsidiaries and releasing of dormant entities‟ capital Reviewing Internal Rating Based approach to optimise capital management Enterprise Process Platform (EPP) going live to support lending operations
Governance and Enablement Functions Streamlined:Supports Better Decision Making
Privatised AmInvestment Bank as part of migration to universal banking platform Consolidated / simplified governance committee structures and strengthen risk disciplines Created a Group PMO to prioritise and manage key strategic initiatives Established Advance Risk Recognition Program (ARRP) Separated ALCO, capital and balance sheet management from Markets Delivered Peer Bank relative performance benchmarks Implemented short and long term performance incentives
Delivered 8 new generation retail scorecards & new market risk models Commenced PD, LGD & EAD models for retail and non-retail, non-retail security indicators Developed leadership bench-strength and succession planning Implemented Operational Risk Incident Reporting system and Basel II capital calculator Implemented FTP system aligned to balance sheet strategies Consolidated some Group Support into Centres of Excellence Initiated new retail and non retail PD / LGD models, Security Indicators, Collateral
management, and Market risk system (VIPER) Initiated core banking system replacement programme
Strategic Business
Transformation
High Priority Growth
Initiatives
Implemented a new ALM system and divisional capital allocations under Basel II Integrate new Basel III frameworks into planning processes Finalised vendor selection and commenced core banking system replacement Developed AmFamily Takaful system to support commencement of Takaful business Implemented Model Execution Platform (MEP) provisioning methodology for better risk
assessment and pricing capabilities Transitioned to full MFRS 139 compliance on collective provisioning for credit risk Developing new behavioral scoring models for Retail and SME portfolio
FY2014
FY2012 & FY2013
FY2010 & FY2011
FY2008 & FY2009
Governance & Enablement Functions

55Your Bank. Malaysia’s Bank. AmBank.
FY2014 Results – Investors PresentationYour Bank. Malaysia’s Bank. AmBank.
AGENDA Page
1. EXECUTIVE SUMMARY 3
2. STRATEGIC PARTNERSHIP/INTEGRATION UPDATES 10
3. FY2014 GROUP FINANCIAL PERFORMANCE 17
4. OUTLOOK & STRATEGIC PRIORITIES 32
5. DIVISIONAL STRATEGY & PERFORMANCE 38
6. SUPPLEMENTARY INFORMATION 45
- AMBANK GROUP
- ECONOMY & INDUSTRY
56Your Bank. Malaysia’s Bank. AmBank.
FY2014 Results – Investors Presentation
103.1
0.0
20.0
40.0
60.0
80.0
100.0
120.0
140.0
Q1 Q2 Q3 Q4 Q1 Q2 Q3 Q4 Q1 Q2 Q3 Q4 Q1 Q2 Q3 Q4 Q1 Q2 Q3 Q4 Q1 Q2 Q3 Q4 Q1
2008 2009 2010 2011 2012 2013 2014
BCI
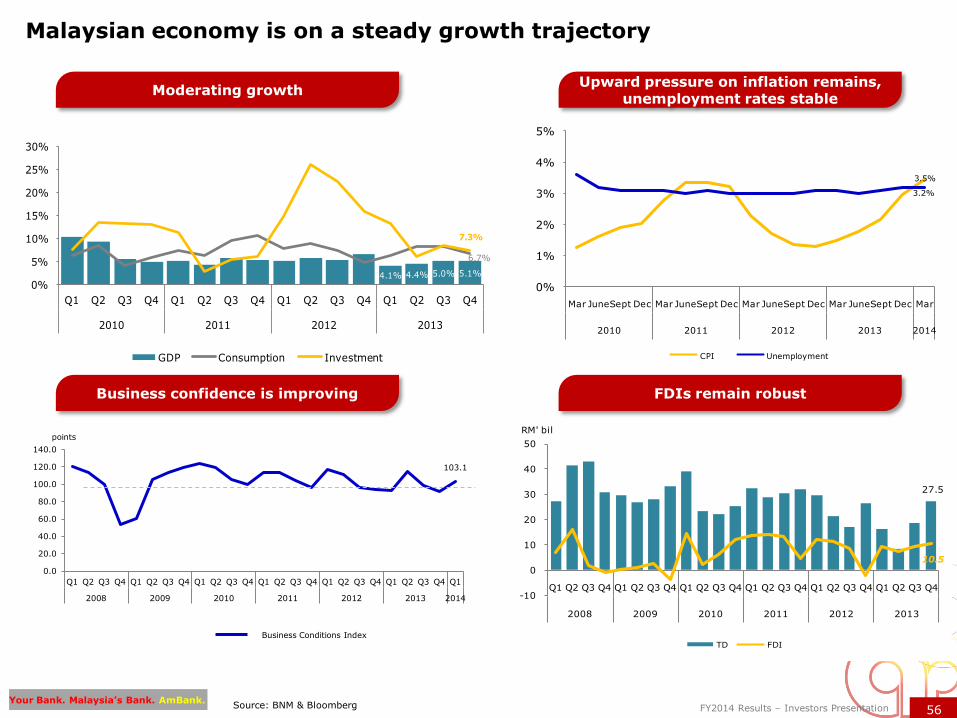
Malaysian economy is on a steady growth trajectory
Business Conditions Index
Moderating growth
Business confidence is improving
Upward pressure on inflation remains, unemployment rates stable
FDIs remain robust
points
Source: BNM & Bloomberg
4.1% 4.4% 5.0% 5.1%
6.7%
7.3%
0%
5%
10%
15%
20%
25%
30%
Q1 Q2 Q3 Q4 Q1 Q2 Q3 Q4 Q1 Q2 Q3 Q4 Q1 Q2 Q3 Q4
2010 2011 2012 2013
GDP Consumption Investment
3.5%
3.2%
0%
1%
2%
3%
4%
5%
Mar JuneSept Dec Mar JuneSept Dec Mar JuneSept Dec Mar JuneSept Dec Mar
2010 2011 2012 2013 2014
CPI Unemployment
27.5
10.5
-10
0
10
20
30
40
50
Q1 Q2 Q3 Q4 Q1 Q2 Q3 Q4 Q1 Q2 Q3 Q4 Q1 Q2 Q3 Q4 Q1 Q2 Q3 Q4 Q1 Q2 Q3 Q4
2008 2009 2010 2011 2012 2013
TD FDI
RM' bil
57Your Bank. Malaysia’s Bank. AmBank.
FY2014 Results – Investors Presentation
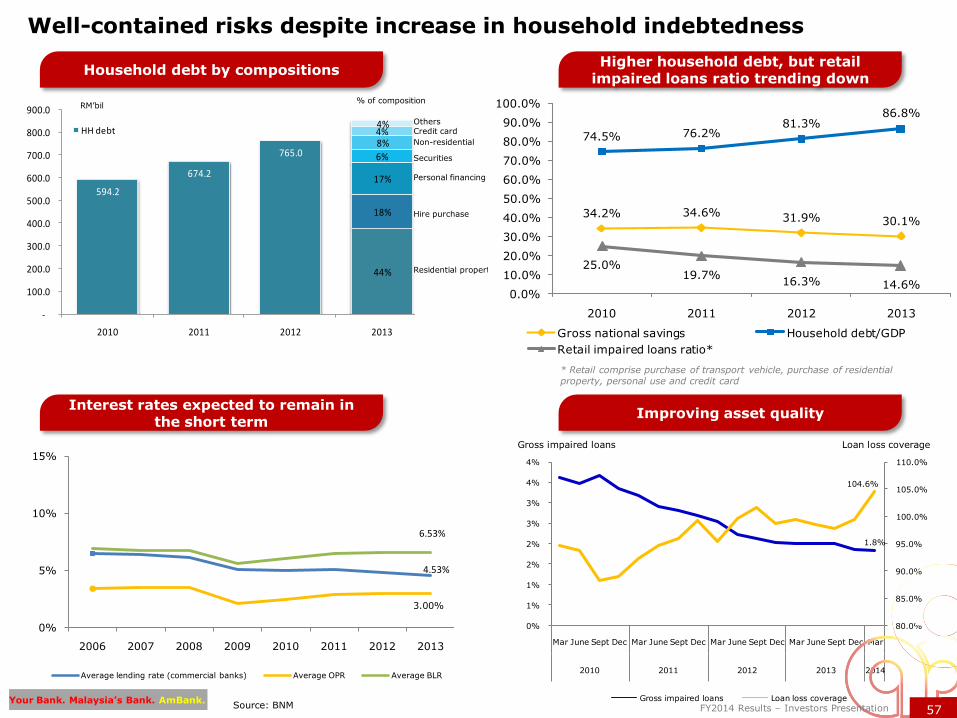
1.8%
104.6%
80.0%
85.0%
90.0%
95.0%
100.0%
105.0%
110.0%
0%
1%
1%
2%
2%
3%
3%
4%
4%
Mar June Sept Dec Mar June Sept Dec Mar June Sept Dec Mar June Sept Dec Mar
2010 2011 2012 2013 2014
Gross impaired loans Loan loss coverage
594.2
674.2
765.0
44%
18%
17%
6%
8%4%4%
-
100.0
200.0
300.0
400.0
500.0
600.0
700.0
800.0
900.0
2010 2011 2012 2013
HH debt Residential property Hire purchasePersonal financing Securities Non-residentialCredit card Others
4.53%
3.00%
6.53%
0%
5%
10%
15%
2006 2007 2008 2009 2010 2011 2012 2013
Average lending rate (commercial banks) Average OPR Average BLR
Well-contained risks despite increase in household indebtedness
To be updated for the his
Household debt by compositions
Interest rates expected to remain in the short term
Improving asset quality
Source: BNM
RM‟bil% of composition
594.2
674.2
765.0
44%
18%
17%
6%
8%4%4%
-
100.0
200.0
300.0
400.0
500.0
600.0
700.0
800.0
900.0
2010 2011 2012 2013
HH debt Residential property Hire purchase Personal financing Securities Non-residential Credit card Others
Loan loss coverageGross impaired loans
OthersCredit card
Non-residential
Securities
Personal financing
Hire purchase
Residential property
* Retail comprise purchase of transport vehicle, purchase of residential property, personal use and credit card
57FY2014 Results – Investors Presentation
34.2% 34.6% 31.9% 30.1%
74.5% 76.2%81.3%
86.8%
25.0%19.7%
16.3% 14.6%0.0%
10.0%
20.0%
30.0%
40.0%
50.0%
60.0%
70.0%
80.0%
90.0%
100.0%
2010 2011 2012 2013
Gross national savings Household debt/GDP
Retail impaired loans ratio*
Higher household debt, but retail impaired loans ratio trending down
58Your Bank. Malaysia’s Bank. AmBank.
FY2014 Results – Investors Presentation
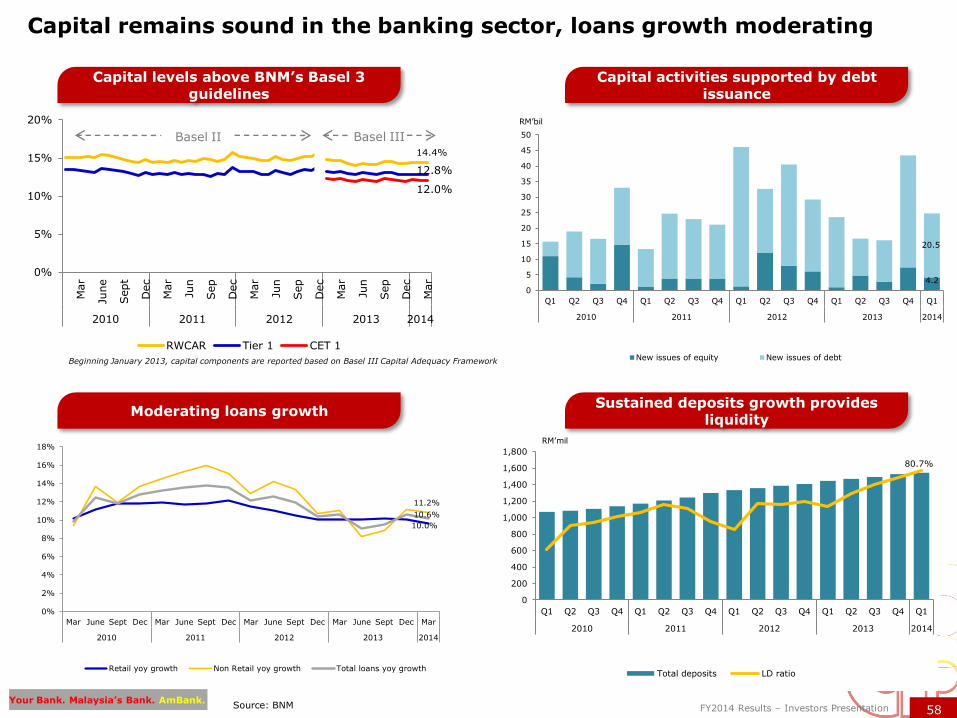
80.7%
0
200
400
600
800
1,000
1,200
1,400
1,600
1,800
Q1 Q2 Q3 Q4 Q1 Q2 Q3 Q4 Q1 Q2 Q3 Q4 Q1 Q2 Q3 Q4 Q1
2010 2011 2012 2013 2014
Total deposits LD ratio
4.2
20.5
0
5
10
15
20
25
30
35
40
45
50
Q1 Q2 Q3 Q4 Q1 Q2 Q3 Q4 Q1 Q2 Q3 Q4 Q1 Q2 Q3 Q4 Q1
2010 2011 2012 2013 2014
New issues of equity New issues of debt
14.4%
12.8%
12.0%
0%
5%
10%
15%
20%
Mar
June
Sept
Dec
Mar
Jun
Sep
Dec
Mar
Jun
Sep
Dec
Mar
Jun
Sep
Dec
Mar
2010 2011 2012 2013 2014
RWCAR Tier 1 CET 1
Source: BNM
Capital remains sound in the banking sector, loans growth moderating
RM‟mil
Capital levels above BNM’s Basel 3 guidelines
Capital activities supported by debt issuance
Sustained deposits growth provides liquidity
Beginning January 2013, capital components are reported based on Basel III Capital Adequacy Framework
RM‟bil
Basel II Basel III
10.0%
11.2%
10.6%
0%
2%
4%
6%
8%
10%
12%
14%
16%
18%
Mar June Sept Dec Mar June Sept Dec Mar June Sept Dec Mar June Sept Dec Mar
2010 2011 2012 2013 2014
Retail yoy growth Non Retail yoy growth Total loans yoy growth
Moderating loans growth

59Your Bank. Malaysia’s Bank. AmBank.
FY2014 Results – Investors Presentation
ETP: Propelling Malaysia towards becoming a high-income, developed nationby 2020
Target RM1.7 trillion 3.3 million RM1.4 trillion
To-date RM250.1 billion 513,000 RM214.0 billion
% of Target 14.7% 15.5% 15.0%
National Key Economic Area Target Investment (RM’bil) To-date (RM’bil) % of Target
Wholesale & Retail 255 13 5%
Oil, Gas & Energy 218 95 44%
Financial services 211 - -%
Tourism 204 17 8%
Greater KL 172 58 34%
Palm Oil 124 2 2%
Electronics & Electrical 78 10 12%
Communications content & Infrastructure
51 2 3%
Business Services 41 5 13%
Healthcare 23 6 26%
Agriculture 22 1 7%
Education 20 5 24%
182 Projects Initiated
GROSS NATIONAL INCOME
JOB CREATIONINVESTMENT &
TRANSFORMATIONAL ACTIONS
Note: Data was correct as on ETP announcement date, the ETP is an evolving programme, in the past 2 years, some EPPs have been dropped, some new ones were added
ETP : Economic Transformation Programme Source Pemandu , www.pemandu.gov.my
60Your Bank. Malaysia’s Bank. AmBank.
FY2014 Results – Investors Presentation
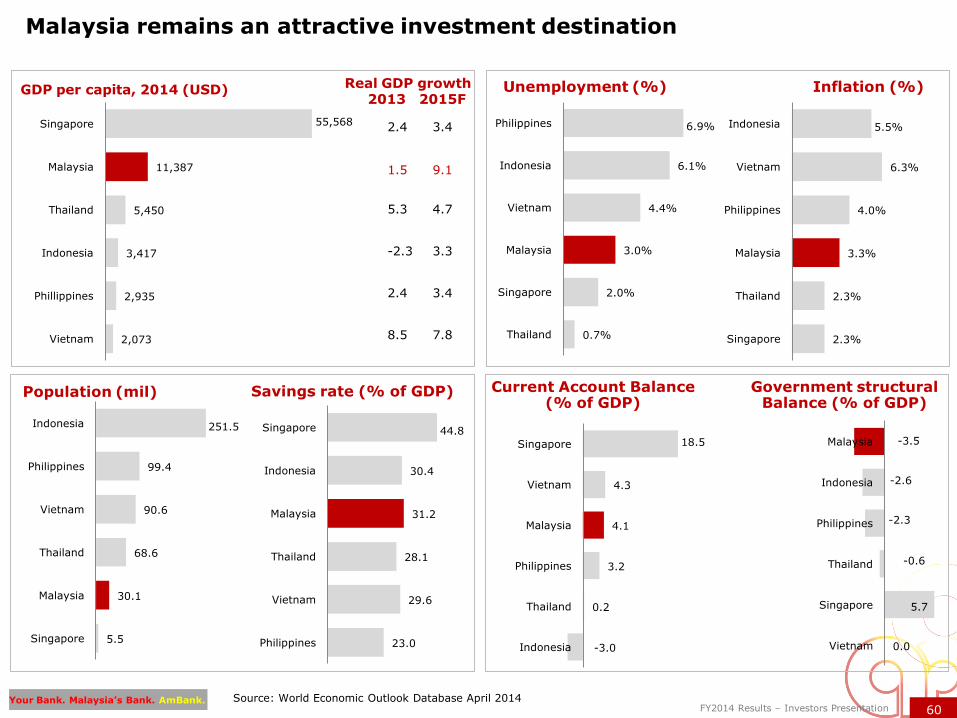
2,073
2,935
3,417
5,450
11,387
55,568
Vietnam
Phillippines
Indonesia
Thailand
Malaysia
Singapore
0.0
5.7
-0.6
-2.3
-2.6
-3.5
Vietnam
Singapore
Thailand
Philippines
Indonesia
Malaysia
Malaysia remains an attractive investment destination
GDP per capita, 2014 (USD)
2.4 3.4
1.5 9.1
5.3 4.7
-2.3 3.3
2.4 3.4
8.5 7.8 0.7%
2.0%
3.0%
4.4%
6.1%
6.9%
Thailand
Singapore
Malaysia
Vietnam
Indonesia
Philippines
2.3%
2.3%
3.3%
4.0%
6.3%
5.5%
Singapore
Thailand
Malaysia
Philippines
Vietnam
Indonesia
Unemployment (%) Inflation (%)
5.5
30.1
68.6
90.6
99.4
251.5
Singapore
Malaysia
Thailand
Vietnam
Philippines
Indonesia
23.0
29.6
28.1
31.2
30.4
44.8
Philippines
Vietnam
Thailand
Malaysia
Indonesia
Singapore
Population (mil) Savings rate (% of GDP)
-3.0
0.2
3.2
4.1
4.3
18.5
Indonesia
Thailand
Philippines
Malaysia
Vietnam
Singapore
Current Account Balance(% of GDP)
Government structuralBalance (% of GDP)
Real GDP growth 2013 2015F
Source: World Economic Outlook Database April 2014
61Your Bank. Malaysia’s Bank. AmBank.
FY2014 Results – Investors Presentation
Glossary / Disclaimer of warranty and limitation of liability
Reported PerformanceReported performance refers to the financial performance as reported in the audited financial statements and disclosed to the market
One OffsOne offs comprise those impacts on financial performance that arise from changes to :
• accounting and provisioning policies (eg 5 and 7 year rules)• differences between economic and accounting hedges• prior period catch ups (eg backdated salary costs)• strategic investments and divestments (eg ANZ partnership), and • tax and regulatory regimes (eg deferred tax asset write off due to reduction in corporate tax rates)
Underlying PerformanceUnderlying performance refers to the financial performance adjusted for one off impacts as above
Business Divisions
Business divisions • comprise AmBank Group‟s core operating businesses that generate profits from direct customer transactions and interactions• have relatively more stable income streams, incur the bulk of the costs and typically have a lower risk profile• in most instances have market shares and growth metrics that can be measured and benchmarked externally
Operating SegmentsOperating segments
• have more volatile and lumpy income streams, with the former a direct function of risk appetite • include
• income and expenses associated with shareholder funds, loan rehabilitation and legacy businesses, plus• costs associated with corporate, shared services and governance functions currently not charged back to the business units
The information provided is believed to be correct at the time of presentation. AMMB Holdings Berhad or AMMB Holdings or “AMMB” or its affiliates do not make any representation or warranty, express or implied, as to the adequacy, accuracy, completeness or fairness of any such information and opinion contained and shall not be liable for any consequences of any reliance thereon. Neither AMMB Holdings nor its affiliates are acting as your financial advisor or agent. The individual is responsible to make your own independent assessment of the information herein and should not treat such content as advice relating to legal, accounting, and taxation or investment matters and should consult your own advisers.
Forward looking statements are based upon the current beliefs and expectations of the AMMB Holdings and are subject to signif icant risks and uncertainties. Actual results may differ from those set forth in the forward looking statements. AMMB Holdings does not undertake to update the forward looking statements to reflect impact of circumstances or events that may arise after the date of this presentation.
The information in the presentation is not and should not be construed as an offer or recommendation to buy or sell securities. Neither does this presentation purport to contain all the information that a prospective investor may require. Because it is not possible for AMMB Holdings or its affiliates to have regard to the investment objectives, financial situation and particular needs of each individual who reads the information contained thus the
information presented may not be appropriate for all persons.
The information contained is not allowed to be reproduced, redistributed, transmitted or passed on, directly or indirectly, to any other person or published electronically or via print, in whole or in part, for any purpose.
The term "AMMB Holdings" and “AmBank Group” denotes all Group companies within the AMMB Holdings Group and this Disclaimer of Warranty and
Limitation of Liability policy applies to the financial institutions under AMMB Holdings.
Disclaimer of Warranty and Limitation of Liability
62Your Bank. Malaysia’s Bank. AmBank.
FY2014 Results – Investors Presentation
Glossary / Disclaimer of warranty and limitation of liability
The information provided is believed to be correct at the time of presentation. AMMB Holdings Berhad or AMMB Holdings or “AMMB” or its affiliates do not make any representation or warranty, express or implied, as to the adequacy, accuracy, completeness or fairness of any such information and opinion contained and shall not be liable for any consequences of any reliance thereon. Neither AMMB Holdings nor its affiliates are acting as your financial advisor or agent. The individual is responsible to make your own independent assessment of the information herein and should not treat such content as advice relating to legal, accounting, and taxation or investment matters and should consult your own advisers.
Forward looking statements are based upon the current beliefs and expectations of the AMMB Holdings and are subject to signif icant risks and uncertainties. Actual results may differ from those set forth in the forward looking statements. AMMB Holdings does not undertake to update the forward looking statements to reflect impact of circumstances or events that may arise after the date of this presentation.
The information in the presentation is not and should not be construed as an offer or recommendation to buy or sell securities. Neither does this presentation purport to contain all the information that a prospective investor may require. Because it is not possible for AMMB Holdings or its affiliates to have regard to the investment objectives, financial situation and particular needs of each individual who reads the information contained thus the information presented may not be appropriate for all persons.
The information contained is not allowed to be reproduced, redistributed, transmitted or passed on, directly or indirectly, to any other person or published electronically or via print, in whole or in part, for any purpose.
The term "AMMB Holdings" and “AmBank Group” denotes all Group companies within the AMMB Holdings Group and this Disclaimer of Warranty and Limitation of Liability policy applies to the financial institutions under AMMB Holdings.
Disclaimer of Warranty and Limitation of Liability
Your Bank. Malaysia’s Bank. AmBank.
The material in this presentation is general background information about AmBank Group‟sactivities current at the date of the presentation. It is information given in summary form anddoes not purport to be complete. It is not intended to be relied upon as advice to investors orpotential investors and does not take into account the investment objectives, financialsituation or needs of any particular investor. These should be considered, with or withoutprofessional advice when deciding if an investment is appropriate.
For further information, visit www.ambankgroup.com;
or contact
Ganesh Kumar Nadarajah
Group General Manager, Strategic Planning & Investor Relations
Karen Chuah
Senior Manager, Strategic Planning & Investor Relations
Tel: +603 2036 1435 or +6019 2093 955
Fax: +603 2031 7384
e-mail: [email protected];
![Information Memorandum...Information Memorandum 5 Social Islami Bank Ltd. Report to the eligible investors Rule 2(3) of Schedule “B”] Dear Investors, Social Islami Bank Limited](https://img.pdfslide.net/doc/110x75/5e734343a64b2544a1088fee/information-memorandum-information-memorandum-5-social-islami-bank-ltd-report.jpg)