Embed Size (px)
Citation preview
2003-2004Technical Progress
Reports
University of California
Salinity/Drainage Research Program
Division of Agriculture and Natural Resources University of California
October 2004

This publication is available on the website of the UC Center for Water Resources at:www.waterresources.ucr.edu
Funding for this publication is provided by the University of California.It is available to the general public free of charge.
The University of California prohibits discrimination or harassment of any person on the basis of race, color, national origin, religion, sex, gender identity, pregnancy (including childbirth, and medical conditions related to pregnancy or childbirth), physical or mental disability, medical condi-tion (cancer-related or genetic characteristics), ancestry, marital status, age, sexual orientation, citizenship, or status as a covered veteran (covered veterans are special disabled veterans, recently separated veterans, Vietnam era veterans, or any other veterans who served on active duty during a war or in a campaign or expedition for which a campaign badge has been authorized) in any of its programs or activities.
University policy is intended to be consistent with the provisions of applicable State and Federal laws.
Inquiries regarding the University’s nondiscrimination policies may be directed to the Affi rmative Action/Staff Personnel Services Director, Univer-sity of California, Agriculture and Natural Resources, 300 Lakeside Drive, 6th Floor, Oakland, CA 94612-3550, (510) 987-0096.
This publication is a continuation of the Salinity/Drainage Program Annual Report series. It is published and distributed by the DIRECTOR’S OFFICE of the UC CENTER FOR WATER RESOURCES. The Center sponsors projects in salinity and drainage and related research within the state of California with funds provided by various state and federal agencies and private industry. Copies of this and other reports published by the Center may be obtained by contacting:
UC CENTER FOR WATER RESOURCESRUBIDOUX HALL – 094
UNIVERSITY OF CALIFORNIARIVERSIDE, CA 92521-0436
ATTENTION: PUBLICATIONS(951) 827-4327
Copies of Center publications may be examined at:
Water Resources Archives410 O’Brien Hall
University of CaliforniaBerkeley, CA 94720
(510) 642-2666
Or downloaded from: www.waterresources.ucr.edu
i Table of Contents
TABLE OF CONTENTS
Foreword ....................................................................................................................................... ii
Advisory Council Members........................................................................................................... iii
Salinity/Drainage Program Annual Meeting Agenda .................................................................... iv
Teresa W-M. Fan, Richard HigashiInteraction of Se Biogeochemistry with Foodchain Disruption in Full-Scale Evaporation Basins and Pilot-Scale Drain Water systems ........................................................................1
W. T. Frankenberger, Jr., Yiqiang ZhangRemoval of Selenium from Water by Zero-Valent Iron..................................................................9
Steve Grattan, Catherine Grieve, Jim Poss, Don SuarezDoes Saline Drainage Water Affect Crop Tolerance to Boron? ..................................................19
Kurt A. Schwabe, Keith KnappIntegrated Drainwater Management in the Central Valley: A Regional Analysis of
Irrigated Agriculture ..............................................................................................................33
Norman Terry, Yi-Chieh ChangPhytoremediation of Selenium-Contaminated Drainage Sediments and Different
Transgenic Lines of Indian Mustard (Brassica juncea).........................................................45

FOREWORD
The UC Salinity/Drainage Program was initiated in 1985 to develop, interpret, and disseminate research knowledge addressing critical agricultural and environmental problems of salinity, drainage, and toxic trace elements in the West Side of the San Joaquin Valley in California. The Water Resources Center and the Salinity/Drainage Program were administratively combined with the UC Center for Water Resources in 1993.
A major function of the UC Salinity/Drainage Program is to support research and extension activities that will contribute to developing optimal management strategies to cope with salinity/drainage/toxics problems in the western San Joaquin Valley. Funded research projects must be both relevant and scientifi cally sound. An external advisory committee consisting of UC scientists and individuals, listed on page iv, evaluates the merits of proposals. Appreciation is expressed to all the individuals that devoted time and made valuable contributions to the selection of the research to be supported.
This publication reports the research fi ndings of projects funded by the Salinity/Drainage Program in 2003-2004. The number of projects supported during this year is signifi cantly lower than in previous years because of the 47% reduction in budget as compared to previous years.
Foreword ii
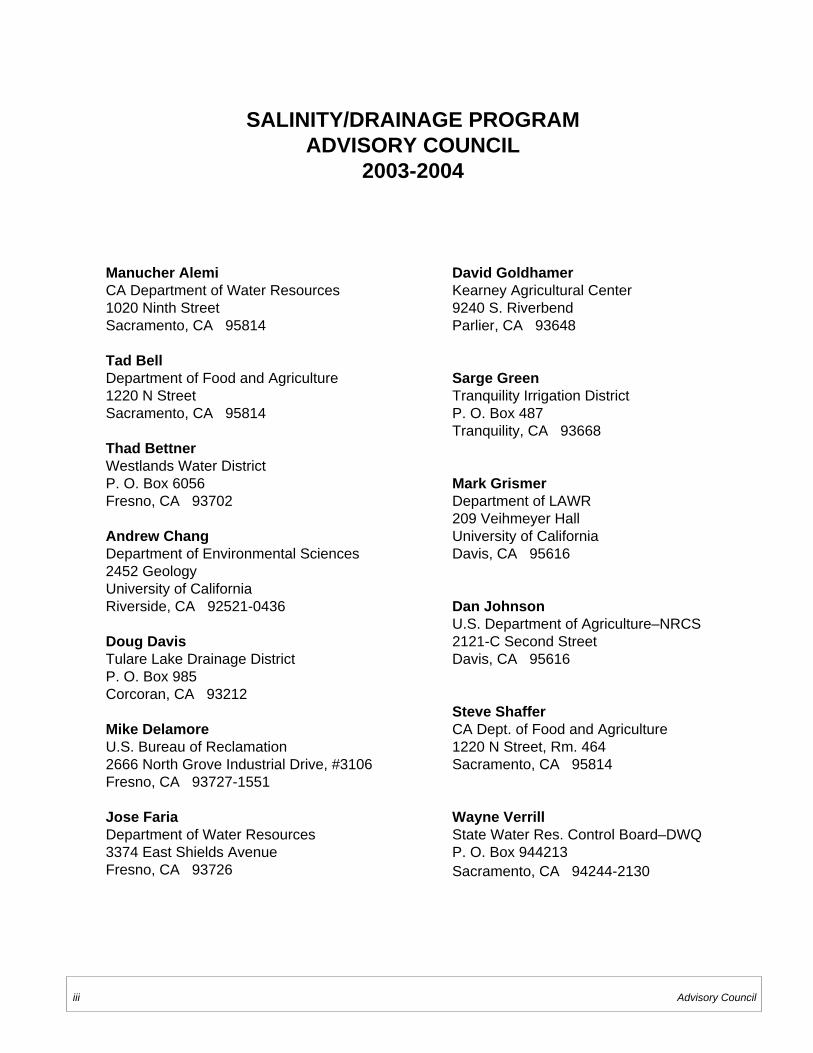
iii Advisory Council
Manucher AlemiCA Department of Water Resources1020 Ninth StreetSacramento, CA 95814
Tad BellDepartment of Food and Agriculture1220 N StreetSacramento, CA 95814
Thad BettnerWestlands Water DistrictP. O. Box 6056Fresno, CA 93702
Andrew ChangDepartment of Environmental Sciences2452 GeologyUniversity of CaliforniaRiverside, CA 92521-0436
Doug DavisTulare Lake Drainage DistrictP. O. Box 985Corcoran, CA 93212
Mike DelamoreU.S. Bureau of Reclamation2666 North Grove Industrial Drive, #3106Fresno, CA 93727-1551
Jose FariaDepartment of Water Resources3374 East Shields AvenueFresno, CA 93726
SALINITY/DRAINAGE PROGRAMADVISORY COUNCIL
2003-2004
David GoldhamerKearney Agricultural Center9240 S. RiverbendParlier, CA 93648
Sarge GreenTranquility Irrigation DistrictP. O. Box 487Tranquility, CA 93668
Mark GrismerDepartment of LAWR209 Veihmeyer HallUniversity of CaliforniaDavis, CA 95616
Dan JohnsonU.S. Department of Agriculture–NRCS2121-C Second StreetDavis, CA 95616
Steve ShafferCA Dept. of Food and Agriculture1220 N Street, Rm. 464Sacramento, CA 95814
Wayne VerrillState Water Res. Control Board–DWQP. O. Box 944213Sacramento, CA 94244-2130
Meeting Agenda iv
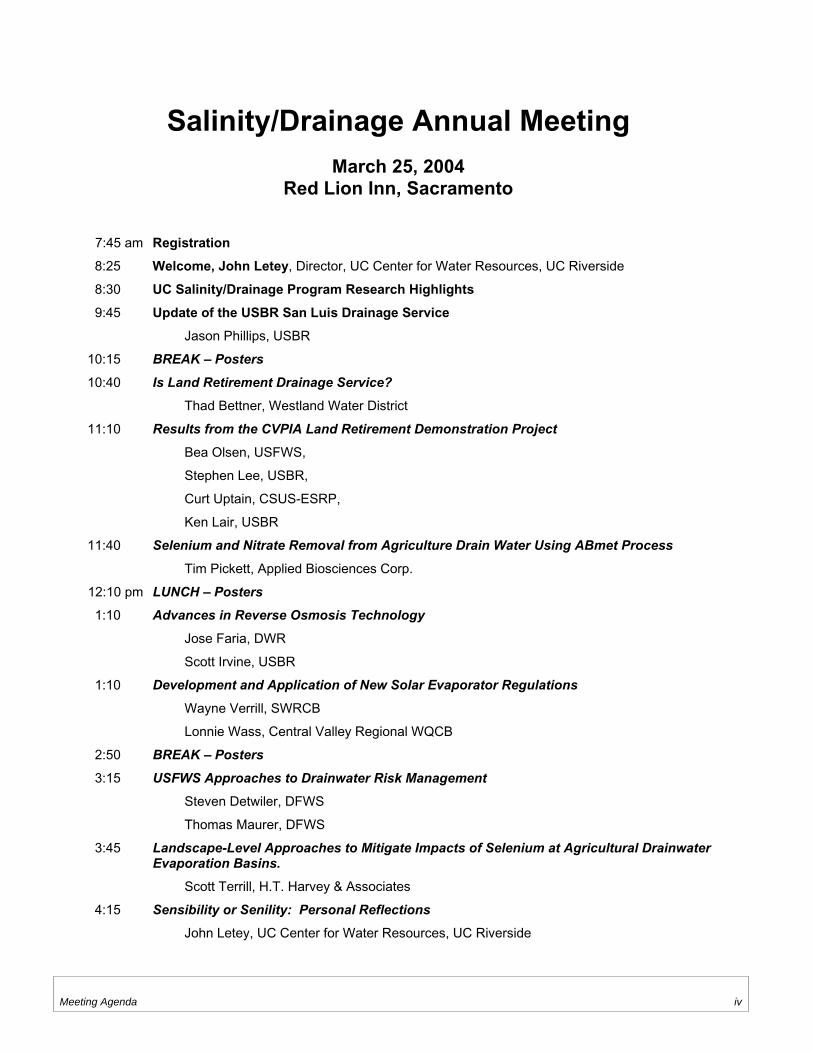
Salinity/Drainage Annual Meeting March 25, 2004
Red Lion Inn, Sacramento
7:45 am Registration
8:25 Welcome, John Letey, Director, UC Center for Water Resources, UC Riverside
8:30 UC Salinity/Drainage Program Research Highlights
9:45 Update of the USBR San Luis Drainage Service
Jason Phillips, USBR
10:15 BREAK – Posters
10:40 Is Land Retirement Drainage Service?
Thad Bettner, Westland Water District
11:10 Results from the CVPIA Land Retirement Demonstration Project
Bea Olsen, USFWS,
Stephen Lee, USBR,
Curt Uptain, CSUS-ESRP,
Ken Lair, USBR
11:40 Selenium and Nitrate Removal from Agriculture Drain Water Using ABmet Process
Tim Pickett, Applied Biosciences Corp.
12:10 pm LUNCH – Posters
1:10 Advances in Reverse Osmosis Technology
Jose Faria, DWR
Scott Irvine, USBR
1:10 Development and Application of New Solar Evaporator Regulations
Wayne Verrill, SWRCB
Lonnie Wass, Central Valley Regional WQCB
2:50 BREAK – Posters
3:15 USFWS Approaches to Drainwater Risk Management
Steven Detwiler, DFWS
Thomas Maurer, DFWS
3:45 Landscape-Level Approaches to Mitigate Impacts of Selenium at Agricultural DrainwaterEvaporation Basins.
Scott Terrill, H.T. Harvey & Associates
4:15 Sensibility or Senility: Personal Reflections
John Letey, UC Center for Water Resources, UC Riverside

v
1
Interaction of Se Biogeochemistry with FoodchainDisruption in Full-Scale Evaporation Basins and Pilot-Scale
Drain Water Systems
Project Investigators:
Teresa FanOffi ce: (530) 752-1450, E-mail: [email protected]
Department of Land, Air & Water ResourcesUniversity of California, Davis
Richard HigashiOffi ce: (530) 752-1830, E-mail: [email protected]
Center for Health and the EnvironmentUniversity of California, Davis
Research Staff:
Chris Coelho, PGRWilliam Schilling, PGRTeresa Cassel, SRA
Krassi Hristova, Assistant Researcher
2
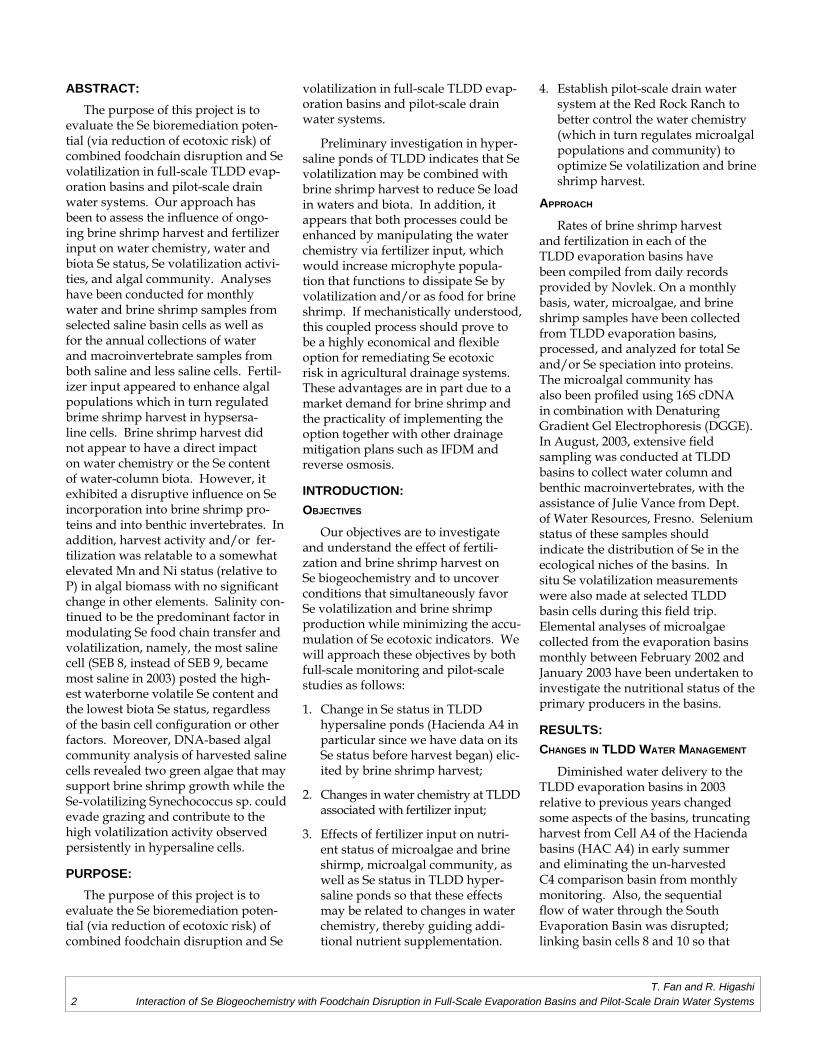
ABSTRACT:The purpose of this project is to
evaluate the Se bioremediation poten-tial (via reduction of ecotoxic risk) of combined foodchain disruption and Se volatilization in full-scale TLDD evap-oration basins and pilot-scale drain water systems. Our approach has been to assess the infl uence of ongo-ing brine shrimp harvest and fertilizer input on water chemistry, water and biota Se status, Se volatilization activi-ties, and algal community. Analyses have been conducted for monthly water and brine shrimp samples from selected saline basin cells as well as for the annual collections of water and macro invertebrate samples from both saline and less saline cells. Fertil-izer input appeared to enhance algal populations which in turn regulated brime shrimp harvest in hypsersa-line cells. Brine shrimp harvest did not appear to have a direct impact on water chemistry or the Se content of water-column biota. However, it exhibited a disruptive infl uence on Se incorporation into brine shrimp pro-teins and into benthic invertebrates. In addition, harvest activity and/or fer-tilization was relatable to a somewhat elevated Mn and Ni status (relative to P) in algal biomass with no signifi cant change in other elements. Salinity con-tinued to be the predominant factor in modulating Se food chain transfer and volatilization, namely, the most saline cell (SEB 8, instead of SEB 9, became most saline in 2003) posted the high-est waterborne volatile Se content and the lowest biota Se status, regardless of the basin cell confi guration or other factors. Moreover, DNA-based algal community analysis of harvested saline cells revealed two green algae that may support brine shrimp growth while the Se-volatilizing Synechococcus sp. could evade grazing and contribute to the high volatilization activity observed persistently in hypersaline cells.
PURPOSE:The purpose of this project is to
evaluate the Se bioremediation poten-tial (via reduction of ecotoxic risk) of combined foodchain disruption and Se
volatilization in full-scale TLDD evap-oration basins and pilot-scale drain water systems.
Preliminary investigation in hyper-saline ponds of TLDD indicates that Se volatilization may be combined with brine shrimp harvest to reduce Se load in waters and biota. In addition, it appears that both processes could be enhanced by manipulating the water chemistry via fertilizer input, which would increase microphyte popula-tion that functions to dissipate Se by volatilization and/or as food for brine shrimp. If mechanistically understood, this coupled process should prove to be a highly economical and fl exible option for remediating Se ecotoxic risk in agricultural drainage systems. These advantages are in part due to a market demand for brine shrimp and the practicality of implementing the option together with other drainage mitigation plans such as IFDM and reverse osmosis.
INTRODUCTION:OBJECTIVES
Our objectives are to investigate and understand the effect of fertili- zation and brine shrimp harvest on Se biogeochemistry and to uncover conditions that simultaneously favor Se volatilization and brine shrimp production while minimizing the accu-mulation of Se ecotoxic indicators. We will approach these objectives by both full-scale monitoring and pilot-scale studies as follows:
1. Change in Se status in TLDD hypersaline ponds (Hacienda A4 in particular since we have data on its Se status before harvest began) elic-ited by brine shrimp harvest;
2. Changes in water chemistry at TLDD associated with fertilizer input;
3. Effects of fertilizer input on nutri-ent status of microalgae and brine shirmp, microalgal community, as well as Se status in TLDD hyper-saline ponds so that these effects may be related to changes in water chemistry, thereby guiding addi-tional nutrient supplementation.
4. Establish pilot-scale drain water system at the Red Rock Ranch to better control the water chemistry (which in turn regulates microalgal populations and community) to optimize Se volatilization and brine shrimp harvest.
APPROACH
Rates of brine shrimp harvest and fertilization in each of the TLDD evaporation basins have been compiled from daily records provided by Novlek. On a monthly basis, water, microalgae, and brine shrimp samples have been collected from TLDD evaporation basins, processed, and analyzed for total Se and/or Se speciation into proteins. The microalgal community has also been profi led using 16S cDNA in combination with Denaturing Gradient Gel Electrophoresis (DGGE). In August, 2003, extensive fi eld sampling was conducted at TLDD basins to collect water column and benthic macroinvertebrates, with the assistance of Julie Vance from Dept. of Water Resources, Fresno. Selenium status of these samples should indicate the distribution of Se in the ecological niches of the basins. In situ Se volatilization measurements were also made at selected TLDD basin cells during this fi eld trip. Elemental analyses of microalgae collected from the evaporation basins monthly between February 2002 and January 2003 have been undertaken to investigate the nutritional status of the primary producers in the basins.
RESULTS:CHANGES IN TLDD WATER MANAGEMENT
Diminished water delivery to the TLDD evaporation basins in 2003 relative to previous years changed some aspects of the basins, truncating harvest from Cell A4 of the Hacienda basins (HAC A4) in early summer and eliminating the un-harvested C4 comparison basin from monthly monitoring. Also, the sequential fl ow of water through the South Evaporation Basin was disrupted; linking basin cells 8 and 10 so that
T. Fan and R. HigashiInteraction of Se Biogeochemistry with Foodchain Disruption in Full-Scale Evaporation Basins and Pilot-Scale Drain Water Systems
3
both SEB 9 and SEB 10 were directly supplied by SEB 8 and the salinity of those three basins fl uctuated substantially. In terms of the annual average salinity, SEB 8 became the highest (125 ppth), SEB 9 was next (111 ppth) and SEB 10 was the least saline (86 ppth). Thus, while the most saline basin (SEB 8) continues to be the most Se volatilizing (cf. Fig. 17), it was not harvested much for brine shrimp. The basin with the highest brine shrimp yields actually had the lowest average salinity but this was probably due to the regular infl ux of relatively fresh water needed to maintain the water level for brine shrimp harvest operation.
WATER CHEMISTRY AND SE STATUS IN TLDD MICROALGAE AND MACROINVERTEBRATES
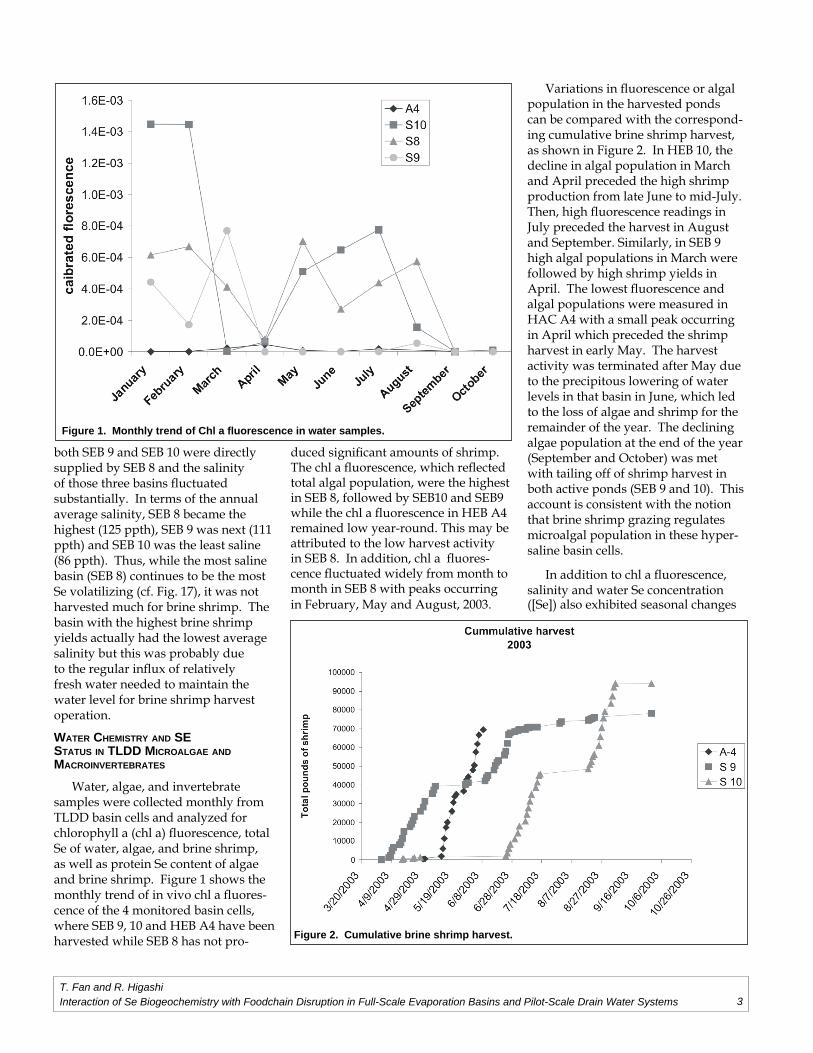
Water, algae, and invertebrate samples were collected monthly from TLDD basin cells and analyzed for chlorophyll a (chl a) fl uorescence, total Se of water, algae, and brine shrimp, as well as protein Se content of algae and brine shrimp. Figure 1 shows the monthly trend of in vivo chl a fl uores-cence of the 4 monitored basin cells, where SEB 9, 10 and HEB A4 have been harvested while SEB 8 has not pro-
duced signifi cant amounts of shrimp. The chl a fl uorescence, which refl ected total algal population, were the highest in SEB 8, followed by SEB10 and SEB9 while the chl a fl uorescence in HEB A4 remained low year-round. This may be attributed to the low harvest activity in SEB 8. In addition, chl a fl uores-cence fl uctuated widely from month to month in SEB 8 with peaks occurring in February, May and August, 2003.
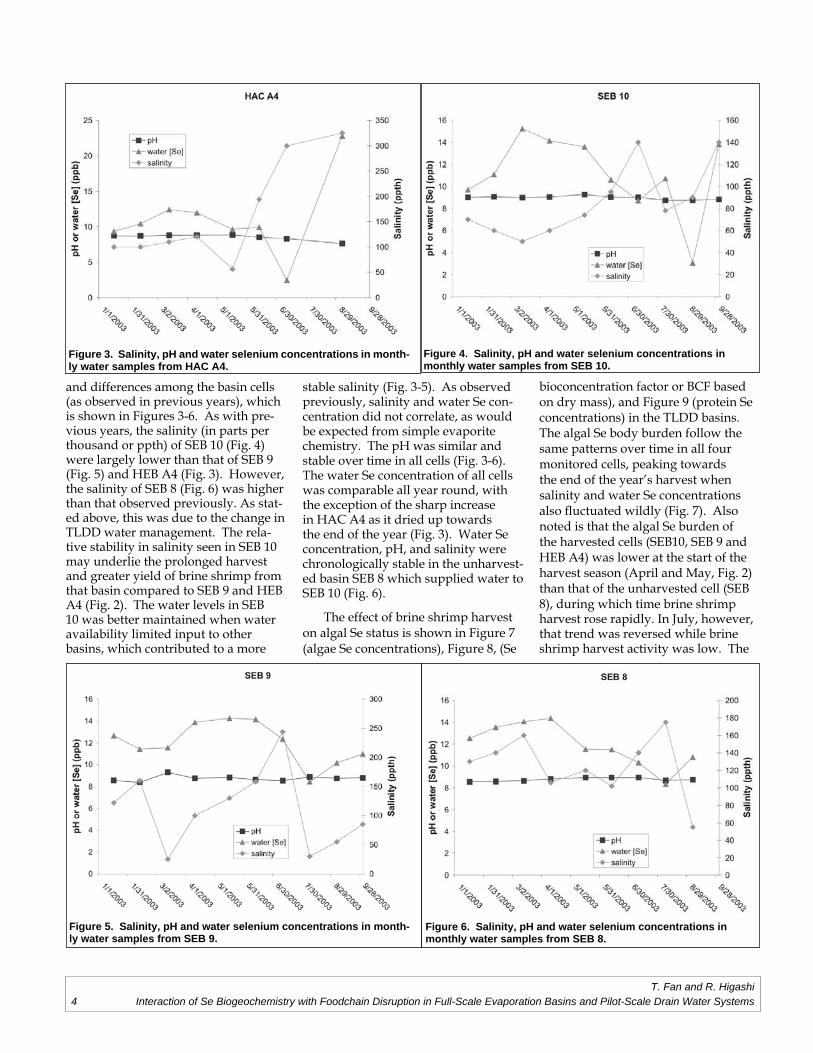
Variations in fl uorescence or algal population in the harvested ponds can be compared with the correspond-ing cumulative brine shrimp harvest, as shown in Figure 2. In HEB 10, the decline in algal population in March and April preceded the high shrimp production from late June to mid-July. Then, high fl uorescence readings in July preceded the harvest in August and September. Similarly, in SEB 9 high algal populations in March were followed by high shrimp yields in April. The lowest fl uorescence and algal populations were measured in HAC A4 with a small peak occurring in April which preceded the shrimp harvest in early May. The harvest activity was terminated after May due to the precipitous lowering of water levels in that basin in June, which led to the loss of algae and shrimp for the remainder of the year. The declining algae population at the end of the year (September and October) was met with tailing off of shrimp harvest in both active ponds (SEB 9 and 10). This account is consistent with the notion that brine shrimp grazing regulates microalgal population in these hyper-saline basin cells.
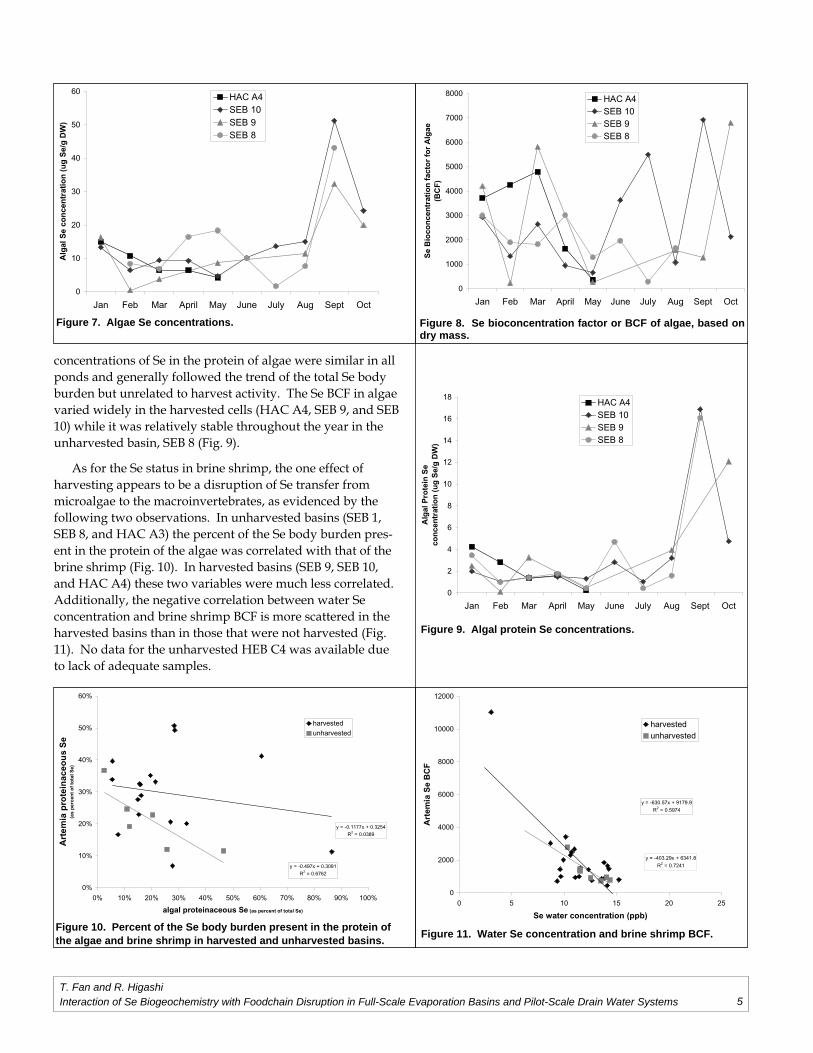
In addition to chl a fl uorescence, salinity and water Se concentration ([Se]) also exhibited seasonal changes
T. Fan and R. HigashiInteraction of Se Biogeochemistry with Foodchain Disruption in Full-Scale Evaporation Basins and Pilot-Scale Drain Water Systems
Figure 1. Monthly trend of Chl a fl uorescence in water samples.
Figure 2. Cumulative brine shrimp harvest.
4
and differences among the basin cells (as observed in previous years), which is shown in Figures 3-6. As with pre-vious years, the salinity (in parts per thousand or ppth) of SEB 10 (Fig. 4) were largely lower than that of SEB 9 (Fig. 5) and HEB A4 (Fig. 3). However, the salinity of SEB 8 (Fig. 6) was higher than that observed previously. As stat-ed above, this was due to the change in TLDD water management. The rela-tive stability in salinity seen in SEB 10 may underlie the prolonged harvest and greater yield of brine shrimp from that basin compared to SEB 9 and HEB A4 (Fig. 2). The water levels in SEB 10 was better maintained when water availability limited input to other basins, which contributed to a more
stable salinity (Fig. 3-5). As observed previously, salinity and water Se con-centration did not correlate, as would be expected from simple evaporite chemistry. The pH was similar and stable over time in all cells (Fig. 3-6). The water Se concentration of all cells was comparable all year round, with the exception of the sharp increase in HAC A4 as it dried up towards the end of the year (Fig. 3). Water Se concentration, pH, and salinity were chronologically stable in the unharvest-ed basin SEB 8 which supplied water to SEB 10 (Fig. 6).
The effect of brine shrimp harvest on algal Se status is shown in Figure 7 (algae Se concentrations), Figure 8, (Se
bioconcentration factor or BCF based on dry mass), and Figure 9 (protein Se concentrations) in the TLDD basins. The algal Se body burden follow the same patterns over time in all four monitored cells, peaking towards the end of the year’s harvest when salinity and water Se concentrations also fl uctuated wildly (Fig. 7). Also noted is that the algal Se burden of the harvested cells (SEB10, SEB 9 and HEB A4) was lower at the start of the harvest season (April and May, Fig. 2) than that of the unharvested cell (SEB 8), during which time brine shrimp harvest rose rapidly. In July, however, that trend was reversed while brine shrimp harvest activity was low. The
Figure 4. Salinity, pH and water selenium concentrations in monthly water samples from SEB 10.
Figure 6. Salinity, pH and water selenium concentrations in monthly water samples from SEB 8.
Figure 3. Salinity, pH and water selenium concentrations in month-ly water samples from HAC A4.
Figure 5. Salinity, pH and water selenium concentrations in month-ly water samples from SEB 9.
T. Fan and R. HigashiInteraction of Se Biogeochemistry with Foodchain Disruption in Full-Scale Evaporation Basins and Pilot-Scale Drain Water Systems
5
concentrations of Se in the protein of algae were similar in all ponds and generally followed the trend of the total Se body burden but unrelated to harvest activity. The Se BCF in algae varied widely in the harvested cells (HAC A4, SEB 9, and SEB 10) while it was relatively stable throughout the year in the unharvested basin, SEB 8 (Fig. 9).
As for the Se status in brine shrimp, the one effect of harvesting appears to be a disruption of Se transfer from microalgae to the macroinvertebrates, as evidenced by the following two observations. In unharvested basins (SEB 1, SEB 8, and HAC A3) the percent of the Se body burden pres-ent in the protein of the algae was correlated with that of the brine shrimp (Fig. 10). In harvested basins (SEB 9, SEB 10, and HAC A4) these two variables were much less correlated. Additionally, the negative correlation between water Se concentration and brine shrimp BCF is more scattered in the harvested basins than in those that were not harvested (Fig. 11). No data for the unharvested HEB C4 was available due to lack of adequate samples.
0
2
4
6
8
10
12
14
16
18
Jan Feb Mar April May June July Aug Sept Oct
Alg
al P
rote
in S
eco
nce
ntr
atio
n (
ug
Se/
g D
W)
HAC A4SEB 10SEB 9SEB 8
Figure 9. Algal protein Se concentrations.
y = -0.497x + 0.3091R2 = 0.6762
y = -0.1177x + 0.3254R2 = 0.0389
0%
10%
20%
30%
40%
50%
60%
0% 10% 20% 30% 40% 50% 60% 70% 80% 90% 100%
algal proteinaceous Se (as percent of total Se)
Art
emia
pro
tein
aceo
us
Se
(as
per
cen
t o
fto
tal S
e)
harvestedunharvested
Figure 10. Percent of the Se body burden present in the protein of the algae and brine shrimp in harvested and unharvested basins.
y = -403.29x + 6341.8R2 = 0.7241
y = -630.57x + 9179.9R2 = 0.5974
0
2000
4000
6000
8000
10000
12000
0 5 10 15 20 25
Se water concentration (ppb)
Art
emia
Se
BC
F
harvestedunharvested
Figure 11. Water Se concentration and brine shrimp BCF.
0
10
20
30
40
50
60
Jan Feb Mar April May June July Aug Sept Oct
Alg
al S
e co
nce
ntr
atio
n (
ug
Se/
g D
W)
HAC A4SEB 10SEB 9SEB 8
Figure 7. Algae Se concentrations.
0
1000
2000
3000
4000
5000
6000
7000
8000
Jan Feb Mar April May June July Aug Sept Oct
Se
Bio
con
cen
trat
ion
fac
tor
for
Alg
ae(B
CF
)
HAC A4SEB 10SEB 9SEB 8
Figure 8. Se bioconcentration factor or BCF of algae, based on dry mass.
T. Fan and R. HigashiInteraction of Se Biogeochemistry with Foodchain Disruption in Full-Scale Evaporation Basins and Pilot-Scale Drain Water Systems
6
In addition to monthly sampling of algae and brine shrimp in hypersaline cells, a composite each of water column and benthic organisms was collected from TLDD basin cells of low to high salinity on August 5, 2003. The Se status of these samples along with the water [Se] is shown in Figure 12 (total Se) and 13 (protein Se). The total Se concentration measured in biota from the unharvested basins (SEB 1, SEB 8, and HAC A3) exhibit no trend related to taxa. In the harvested basins (SEB 9 and SEB 10), however, the Se body burden of the water column macro-invertebrates is consistently higher than that in the algae or in the benthic organisms. Basin fertilization and
exhaustive harvest of the brine shrimp may help funnel Se to the water col-umn organisms via enhancing algal growth, while reducing Se incorpora-tion into benthic organisms by limiting detrital deposition and, thus, growth and consumption of Se by benthic organisms . A similar trend was observed for the proteinaceous Se bur-den of algae, water column and benthic macroinvertebrates composites (Fig. 13). In fact, total and proteinaceous Se concentrations were well correlated in the annual survey samples (data not shown). As observed in previ-ous years, no clear correlation was discerned from the water [Se] to the Se burden of algae, water column or
benthic invertebrates and from salinity (cf. Fig. 16) to water [Se]; the former indicates that water [Se] is not a good predictor of Se accumulation in aquatic biota. This is presumably due to the infl uence of complex Se biogeochem-istry on Se bioaccumulation. The lack of water Se buildup with increasing salinity is consistent with Se removal via volatilization and/or brine shrimp harvest (see Se volatilization by Micro-algae).
Monthly water samples col-lected from February 2002 to January 2003 were also fi ltered to trap the microalgae which were analyzed by Inductively Coupled Plasma Mass Spectrometry (ICP-MS) for the follow-
Figure 12. Total Se concentrations in algae, water column inver-tebrates, benthic invertebrates, and water samples collected on August 5, 2003.
proteinaceous Se concentration
0
1
2
3
4
5
6
7
8
9
10
S1 S8 A3 S10 S9
[pro
tein
Se]
(u
g/g
DW
)
algae
water column
benthic
Figure 13. Proteinaceous Se concentrations in algae, water column invertebrates, benthic invertebrates, and water samples collected on August 5, 2003.
Micronutrients in algaeIron
-0.6
-0.4
-0.2
0
0.2
0.4
0.6
0.8
1
-0.2 0 0.2 0.4 0.6 0.8 1
Phosphorus concentration (ug/ml H2O)
Mic
roel
emen
tco
nce
ntr
atio
n (
ug
/ml H
2O)
fertilizednon-fertilized
Figure 14. Concentrations of Iron relative to Phosphorus in algae collected from fertilized and non-fertilized evaporation basins.
Micronutrients in algaeManganese
-0.01
0
0.01
0.02
0.03
0.04
0.05
-0.2 0 0.2 0.4 0.6 0.8 1
Phosphorus concentration (ug/ml H2O)
Mic
roel
emen
t co
nce
ntr
atio
n (
ug
/ml H
2O)
fertilizednon-fertilized
Figure 15. Concentrations of Manganese relative to Phosphorus in algae collected from fertilized and non-fertilized evaporation basins.
T. Fan and R. HigashiInteraction of Se Biogeochemistry with Foodchain Disruption in Full-Scale Evaporation Basins and Pilot-Scale Drain Water Systems
7
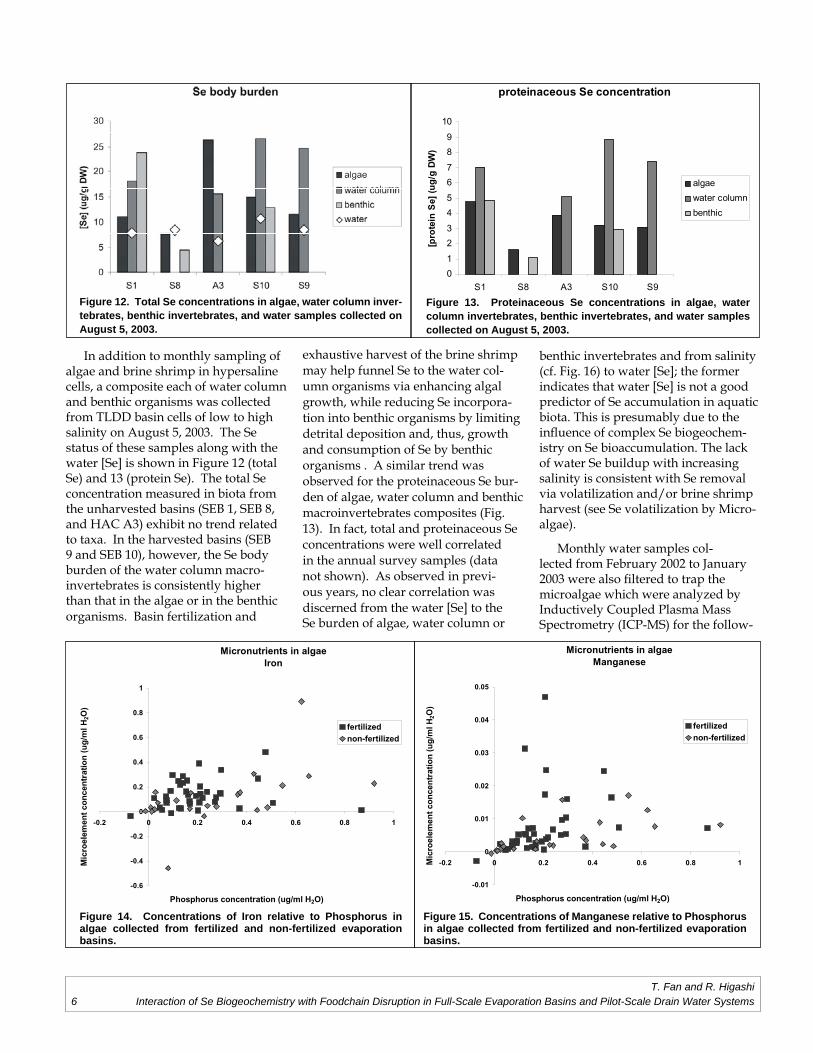
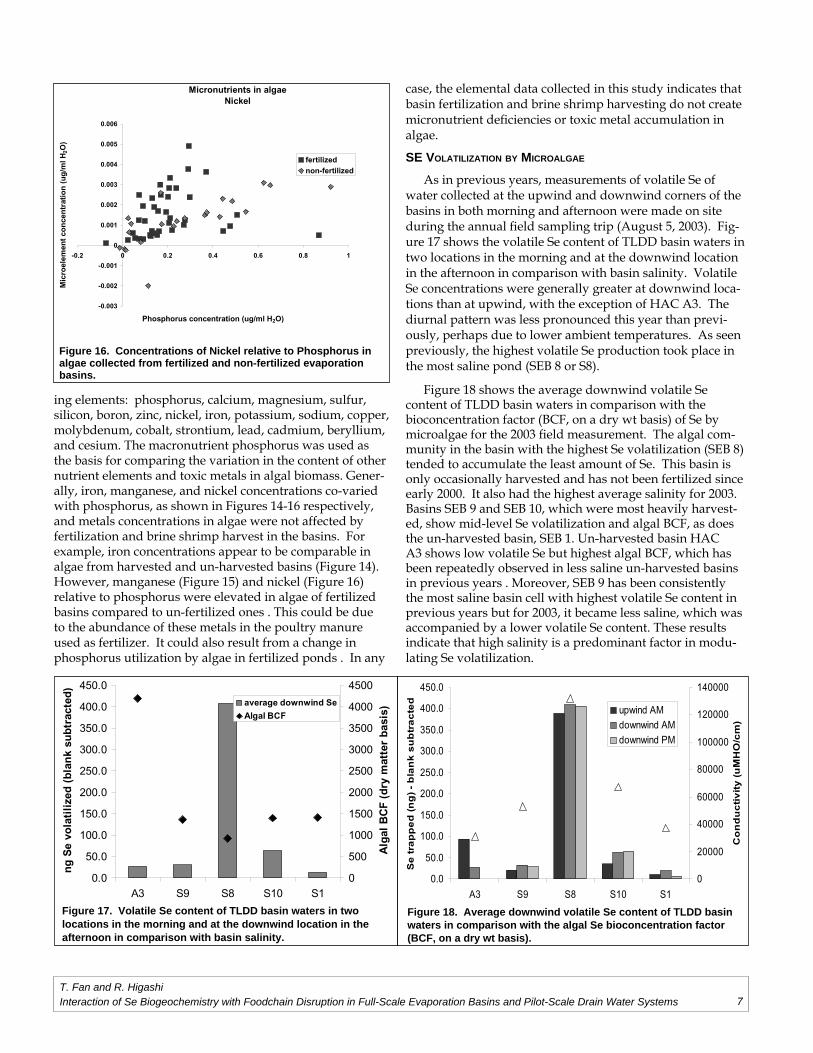
ing elements: phosphorus, calcium, magnesium, sulfur, silicon, boron, zinc, nickel, iron, potassium, sodium, copper, molybdenum, cobalt, strontium, lead, cadmium, beryllium, and cesium. The macronutrient phosphorus was used as the basis for comparing the variation in the content of other nutrient elements and toxic metals in algal biomass. Gener-ally, iron, manganese, and nickel concentrations co-varied with phosphorus, as shown in Figures 14-16 respectively, and metals concentrations in algae were not affected by fertilization and brine shrimp harvest in the basins. For example, iron concentrations appear to be comparable in algae from harvested and un-harvested basins (Figure 14). However, manganese (Figure 15) and nickel (Figure 16) relative to phosphorus were elevated in algae of fertilized basins compared to un-fertilized ones . This could be due to the abundance of these metals in the poultry manure used as fertilizer. It could also result from a change in phosphorus utilization by algae in fertilized ponds . In any
case, the elemental data collected in this study indicates that basin fertilization and brine shrimp harvesting do not create micronutrient defi ciencies or toxic metal accumulation in algae.
SE VOLATILIZATION BY MICROALGAE
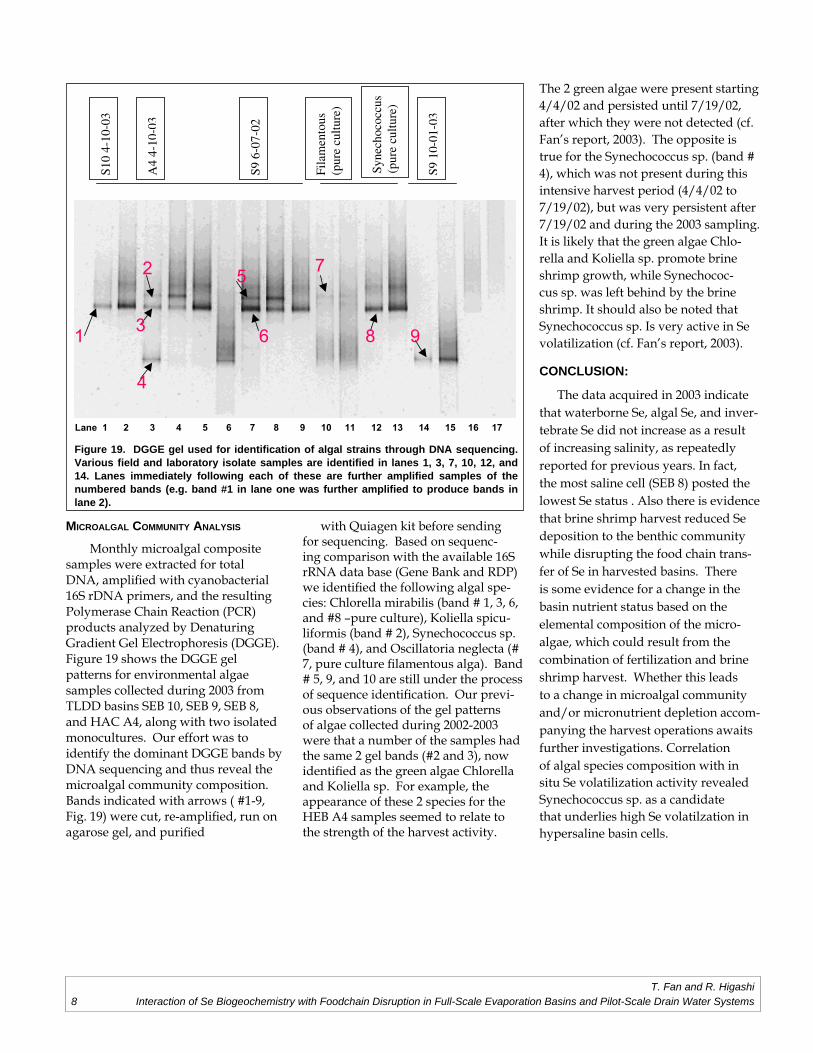
As in previous years, measurements of volatile Se of water collected at the upwind and downwind corners of the basins in both morning and afternoon were made on site during the annual fi eld sampling trip (August 5, 2003). Fig-ure 17 shows the volatile Se content of TLDD basin waters in two locations in the morning and at the downwind location in the afternoon in comparison with basin salinity. Volatile Se concentrations were generally greater at downwind loca-tions than at upwind, with the exception of HAC A3. The diurnal pattern was less pronounced this year than previ-ously, perhaps due to lower ambient temperatures. As seen previously, the highest volatile Se production took place in the most saline pond (SEB 8 or S8).
Figure 18 shows the average downwind volatile Se content of TLDD basin waters in comparison with the bioconcentration factor (BCF, on a dry wt basis) of Se by microalgae for the 2003 fi eld measurement. The algal com-munity in the basin with the highest Se volatilization (SEB 8) tended to accumulate the least amount of Se. This basin is only occasionally harvested and has not been fertilized since early 2000. It also had the highest average salinity for 2003. Basins SEB 9 and SEB 10, which were most heavily harvest-ed, show mid-level Se volatilization and algal BCF, as does the un-harvested basin, SEB 1. Un-harvested basin HAC A3 shows low volatile Se but highest algal BCF, which has been repeatedly observed in less saline un-harvested basins in previous years . Moreover, SEB 9 has been consistently the most saline basin cell with highest volatile Se content in previous years but for 2003, it became less saline, which was accompanied by a lower volatile Se content. These results indicate that high salinity is a predominant factor in modu-lating Se volatilization.
0.0
50.0
100.0
150.0
200.0
250.0
300.0
350.0
400.0
450.0
A3 S9 S8 S10 S1
Se
tra
pp
ed
(n
g)
-b
lan
k s
ub
tra
cte
d
0
20000
40000
60000
80000
100000
120000
140000
Co
nd
uc
tiv
ity
(u
MH
O/c
m)
upwind AMdownwind AMdownwind PM
Figure 18. Average downwind volatile Se content of TLDD basin waters in comparison with the algal Se bioconcentration factor (BCF, on a dry wt basis).
0.0
50.0
100.0
150.0
200.0
250.0
300.0
350.0
400.0
450.0
A3 S9 S8 S10 S1
ng
Se
vola
tili
zed
(b
lan
k su
btr
acte
d)
0
500
1000
1500
2000
2500
3000
3500
4000
4500
Alg
al B
CF
(d
ry m
atte
r b
asis
)average downwind Se
Algal BCF
Figure 17. Volatile Se content of TLDD basin waters in two locations in the morning and at the downwind location in the afternoon in comparison with basin salinity.
Micronutrients in algaeNickel
-0.003
-0.002
-0.001
0
0.001
0.002
0.003
0.004
0.005
0.006
-0.2 0 0.2 0.4 0.6 0.8 1
Phosphorus concentration (ug/ml H2O)
Mic
roel
emen
t co
nce
ntr
atio
n (
ug
/mlH
2O)
fertilizednon-fertilized
Figure 16. Concentrations of Nickel relative to Phosphorus in algae collected from fertilized and non-fertilized evaporation basins.
T. Fan and R. HigashiInteraction of Se Biogeochemistry with Foodchain Disruption in Full-Scale Evaporation Basins and Pilot-Scale Drain Water Systems
8
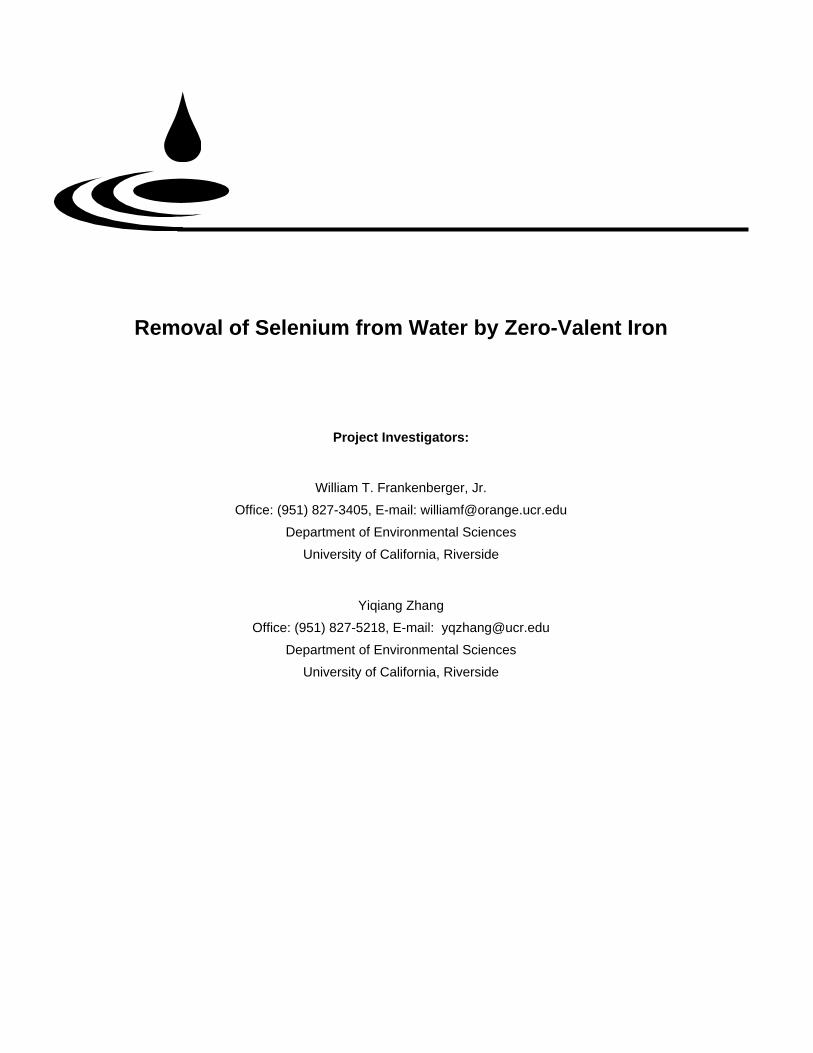
MICROALGAL COMMUNITY ANALYSIS
Monthly microalgal composite samples were extracted for total DNA, amplifi ed with cyanobacterial 16S rDNA primers, and the resulting Polymerase Chain Reaction (PCR) products analyzed by Denaturing Gradient Gel Electrophoresis (DGGE). Figure 19 shows the DGGE gel patterns for environmental algae samples collected during 2003 from TLDD basins SEB 10, SEB 9, SEB 8, and HAC A4, along with two isolated monocultures. Our effort was to identify the dominant DGGE bands by DNA sequencing and thus reveal the microalgal community composition. Bands indicated with arrows ( #1-9, Fig. 19) were cut, re-amplifi ed, run on agarose gel, and purifi ed
with Quiagen kit before sending for sequencing. Based on sequenc-ing comparison with the available 16S rRNA data base (Gene Bank and RDP) we identifi ed the following algal spe-cies: Chlorella mirabilis (band # 1, 3, 6, and #8 –pure culture), Koliella spicu-liformis (band # 2), Synechococcus sp. (band # 4), and Oscillatoria neglecta (# 7, pure culture fi lamentous alga). Band # 5, 9, and 10 are still under the process of sequence identifi cation. Our previ-ous observations of the gel patterns of algae collected during 2002-2003 were that a number of the samples had the same 2 gel bands (#2 and 3), now identifi ed as the green algae Chlorella and Koliella sp. For example, the appearance of these 2 species for the HEB A4 samples seemed to relate to the strength of the harvest activity.
The 2 green algae were present starting 4/4/02 and persisted until 7/19/02, after which they were not detected (cf. Fan’s report, 2003). The opposite is true for the Synechococcus sp. (band # 4), which was not present during this intensive harvest period (4/4/02 to 7/19/02), but was very persistent after 7/19/02 and during the 2003 sampling. It is likely that the green algae Chlo-rella and Koliella sp. promote brine shrimp growth, while Synechococ-cus sp. was left behind by the brine shrimp. It should also be noted that Synechococcus sp. Is very active in Se volatilization (cf. Fan’s report, 2003).
CONCLUSION:
The data acquired in 2003 indicate that waterborne Se, algal Se, and inver-tebrate Se did not increase as a result of increasing salinity, as repeatedly reported for previous years. In fact, the most saline cell (SEB 8) posted the lowest Se status . Also there is evidence that brine shrimp harvest reduced Se deposition to the benthic community while disrupting the food chain trans-fer of Se in harvested basins. There is some evidence for a change in the basin nutrient status based on the elemental composition of the micro-algae, which could result from the combination of fertilization and brine shrimp harvest. Whether this leads to a change in microalgal community and/or micronutrient depletion accom-panying the harvest operations awaits further investigations. Correlation of algal species composition with in situ Se volatilization activity revealed Synechococcus sp. as a candidate that underlies high Se volatilzation in hypersaline basin cells.
Syne
choc
occu
s(p
ure
cultu
re)
S10
4-10
-03
A4
4-10
-03
S9 6
-07-
02
Fila
men
tous
(pur
e cu
ltur
e)
S910
-01-
03
98
7
6
5
4
3
2
1
Lane 1 2 3 4 5 6 7 8 9 10 11 12 13 14 15 16 17
Figure 19. DGGE gel used for identifi cation of algal strains through DNA sequencing. Various fi eld and laboratory isolate samples are identifi ed in lanes 1, 3, 7, 10, 12, and 14. Lanes immediately following each of these are further amplifi ed samples of the numbered bands (e.g. band #1 in lane one was further amplifi ed to produce bands in lane 2).
T. Fan and R. HigashiInteraction of Se Biogeochemistry with Foodchain Disruption in Full-Scale Evaporation Basins and Pilot-Scale Drain Water Systems
9
Removal of Selenium from Water by Zero-Valent Iron
Project Investigators:
William T. Frankenberger, Jr.
Offi ce: (951) 827-3405, E-mail: [email protected]
Department of Environmental Sciences
University of California, Riverside
Yiqiang Zhang
Offi ce: (951) 827-5218, E-mail: [email protected]
Department of Environmental Sciences
University of California, Riverside
10W. Frankenberger and Y. Zhang
Removal of Selenium from Water by Zero-Valent Iron
ABSTRACTZero-valent iron (ZVI) has been
widely used in the removal of envi-ronmental contaminants from water. In this study, ZVI was used to remove selenate [Se(VI)] at a level of 1000 µg/L in the presence of varying con-centrations of Cl-, SO4
2-, NO3-, HCO3
-, and PO4
3-. Results showed that Se(VI) was rapidly removed during the cor-rosion of ZVI to Fe oxyhydroxides (FeOH). During 16 h of the experiments, 100 and 56% of the added Se(VI) was removed in 10 mM Cl- and SO4
2- solu-tions under a closed contained system, respectively. Under an open condition, 100 and 93% of the added Se(VI) were removed in the Cl- and SO4
2- solutions, respectively. Analysis of Se species in ZVI-FeOH revealed that selenite [Se(IV)] and nonextractable Se increased dur-ing the fi rst 2-4 h of reaction, with a decrease of Se(VI) in the Cl- experi-ment and no detection of Se(VI) in the SO4
2- experiment. Two mechanisms can be attributed to the rapid removal of Se(VI) from the solutions. One is the reduction of Se(VI) to Se(IV), followed by rapid adsorption of Se(IV) to FeOH. The other is the adsorption of Se(VI) directly to FeOH, followed by its reduc-tion to Se(IV). The results also show that there was little effect on Se(VI) removal in the presence of Cl- (5, 50, and 100 mM), NO3
- (1, 5 and 10 mM), SO4
2- (5 mM), HCO3- (1 and 5 mM), and
PO43- (1 mM) and only a slight effect in
the presence of SO42- (50 and 100 mM),
HCO3- (10 mM), and PO4
3- (5 mM) dur-ing a 2 day experiment, whereas, 10 mM PO4
3- signifi cantly inhibited Se(VI) removal. This work suggests that ZVI may be an effective agent to remove Se from Se-contaminated water.
INTRODUCTIONElevated selenium (Se) concentra-
tions in agricultural drainage water have been found in many sites of Cali-fornia. In the San Joaquin Valley (SJV), California, Se in the drainage water is frequently at a concentration level of 140-1400 µg/L (Amweg et al., 2003; Cantafi o et al., 1996; Sylvester, 1990). In the Salton Sea region, elevated Se is in the range of 3 to 300 µg/L in the
subsurface drainwater (Setmire and Schroeder, 1998). In an effort to mini-mize environmental impacts of Se, the State of California Water Resources Control Board (SWRCB, 1989) has recommended an interim maximum mean monthly Se concentration of 2 to 5 µg/L in rivers and wetlands receiv-ing agricultural drainage water. So far no treatment technology has proven economically feasible for meeting this criterion.
Several biotreatment systems have been used to treat Se-contaminated agricultural drainage water in the SJV. In a pilot-scale Se bioremediation sys-tem using a Se(VI) reducer, Thauera selenatis and acetate in liquid phase as an electron donor, Cantafi o et al. (1996) reported that bacterial reduction of Se(VI) to elemental Se [Se(0)] proceed-ed rapidly in a series of four columns fi lled with Jaeger Tri-packs and /or silica sand. About 98% of Se(VI) and selenite [Se(IV)] in agricultural drain-age water were reduced. However, high costs make it less feasible to use acetate as an electron donor and car-bon source for bacteria to reduce Se(VI) to Se(0) during full-scale operation in fi eld conditions.
By using economical organic carbon sources, an Algal-Bacterial Selenium Removal System (ABSRS) has been used as an economic way to remove large amounts of Se from drainage water (Lundquist et al., 1995). How-ever, increase in concentration of the most bioavailable organic Se in the treated water creates greater bioavail-ability of Se to biota than that in the infl uent (drainage water) (Amweg et al., 2003), which could propose greater toxicological risk to biota if the treated water fl ows into nearby wetlands. Therefore, there is a need for alter-native technique to remove Se from drainage water.
Zero-valent iron (ZVI) is an inexpensive and moderately strong reducing agent (Genin, et al, 1998). It is used as a catalyst for chemical synthesis in industrial applications (Campbell, 1988) and is capable of removing many common environ-
mental contaminants, such as Cr(VI), U(VI), and NO3
- (Alowitz and Scherer, 2002; Farrell et al., 1999; Huang et al., 1998; Powell et al., 1995; Qiu et al., 2000). The corrosion of ZVI is an elec-trochemical process during which iron is oxidized to soluble Fe2+. Reaction of Fe2+ with OH- forms Fe(OH)2 that can be further oxidized to green rust I [Fe3(II)Fe(III)(OH)8Cl], ([Fe4(III)Fe2(II)(OH)12][CO3
.2H2O]), green rust II ([Fe4(III)Fe3(II)(OH)12][SO4
.2H2O]), magnetite (α-Fe3O4), lepidocrocite (γ-FeOOH), ferrihydrite Fe(OH)3 and goethite (α-FeOOH) (Furukawa et al., 2002; Genin et al., 1998; Phillips et al., 2003).The green rust can also serve as a reducing agent to abiotically reduce Se(VI) to Se(IV) and Se(0) (Myneni et al., 1997; Refait et al., 2000). Ferrihydrite and goethite are also strong adsorbents that can be used to effectively remove Se(IV) from water (Balistrieri and Chao, 1987; 1990). Therefore, ZVI may be an inexpensive potential agent to remove Se(VI) from Se-contaminated water.
This study was conducted to deter-mine the removal of Se(VI) by ZVI in varying concentrations of Cl-, SO4
2-, NO3
-, HCO3-, and PO4
3-. The removal process was characterized in a series of batch experiments.
MATERIALS AND METHODSSelenium standards used in this
study included Se(IV) (selenite refer-ence standard solution) purchased from Fisher Scientifi c (Pittsburgh, PA), Se(VI) (Na2SeO4) from Sigma (St. Louis, MO). Se(0) was obtained by the chemical reaction of Se(IV) with ascorbic acid (Sigma) (Combs. et al. 1996). After the reaction, a red Se(0) solution was passed through a 0.1 µm fi lter, followed by wash-ing 6 times with deionized water to remove ascorbic acid and un-reacted Se(IV). Se(0) accumulated on the fi lter membrane was transferred to a 20 mL glass vial with deionized water and was then sonicated for 15 min prior to use. Other chemicals, such as sodium sulfate (Na2SO4), sodium chloride (NaCl), sodium hydroxide (NaOH), and sodium phosphate (NaH2PO4
11W. Frankenberger and Y. ZhangRemoval of Selenium from Water by Zero-Valent Iron
and Na2HPO4) were purchased from Fisher Scientifi c. ZVI (40-60 mesh) was obtained from Peerless (Peerless Metal Powers and Abrasive, Detroit, MI) and was used as received. The surface area was 1.63 m2/g.
STABILITY TEST OF SE SPECIES IN A PO43-
EXTRACTANT
Stability of Se species in extractants needed to be tested in order to cor-rectly extract Se accumulated in ZVI-Fe oxyhydroxides (ZVI-FeOH) described below. In this study, the term ”Fe oxy-hydroxides” is defi ned to represent all corrosion products of ZVI iron in NaCl and Na2SO4 solutions. Phosphate (PO4
3-) and NaOH, the most commonly used extractants in Se speciation stud-ies (Jackson and Miller, 2000), were selected for extracting Se species in ZVI-FeOH. The extractant solution containing 0.35 M of PO4
3- with a pH range of 7-12.6 was used. In the test, 1.25 g of ZVI was added to each 40-mL glass vial, followed by 1 ml of 1 mM Cl- and SO4
2-. The vials were opened to the atmosphere and stood overnight allowing the formation of FeOH (yel-lowish-brown color) on the surface of some ZVI particles prior to the addi-tion of the extractants. Afterwards, 24 mL of the extractant was added to each vial, followed by spiking with standard Se(VI), Se(IV), and Se(0) in different vials to a fi nal concentration of 1000, 1000, 2600 µg/L, respectively. The vials were tightly capped and horizontally shaken in a gyrotory shaker for 2 and 5h at 180 rpm. Then, solution samples were collected for analysis of Se species after centrifugation for 14 min at 12000 rpm to precipitate ZVI-FeOH.
CHARACTERIZATION OF SE(VI) REMOVAL
A series of time course experiments were conducted in the laboratory to determine the removal of Se(VI) by ZVI in a 10 mM Cl- and a 10 mM SO4
2- solu-tion. These experiments were designed to examine whether Se(VI) can be removed from solution under natural conditions. Therefore, pH and Eh were not controlled during the experiments and dissolved O2 in solution was not removed before the experiments. In a closed contained experiment, 25 ml of
10 mM Cl- or SO42- solution containing
1000 µg/L of Se(VI) was placed to 40-mL EPA glass vials, followed by 1.25 g of ZVI. The vials were tightly capped and placed horizontally in a gyrotory shaker for shaking at a speed of 180 rpm. The vials were removed from the shaker at the time of 0.125, 0.25, 0.5, 1, 2, 4, 7, and 16 h. Each sample was passed through a 0.2-µm membrane fi lter (Fisher Scientifi c) into another 40-ml glass vial for Se species, pH, and Eh analysis. ZVI-FeOH residue in the vials was washed two times with 5 mL of DI water and re-fi ltrated. The ZVI-FeOH on the fi lter membrane was replaced into the original vials for extraction of accumulated Se to ZVI-FeOH particles. During the extraction, 25 ml of 0.35 M PO4
3-solution with a pH of 12.6 was added to each vial. The vials were tightly capped, placed horizontally in a gyrotory shaker, and shaken for 2 h at a speed of 180 rpm. Then, solution samples were collected for Se species analysis by centrifugation for 14 min at 12000 rpm to precipitate ZVI-FeOH. All of the experiments were run in tripli-cates at room temperature (21±1 °C).
In an open system experiment, 25 ml of 10 mM Cl- or SO4
2- solution con-taining 1000 µg/L of Se(VI) was placed in 50-mL Pyrex fl asks, followed by 1.25 g of ZVI. The fl asks were not capped and shaken in a gyrotory shaker at a speed of 180 rpm. The sample collec-tion and extraction of accumulated Se to ZVI-FeOH were the same as the closed system experiment described above.
EFFECTS OF DIFFERENT ANIONS ON SE(VI) REMOVAL
Effects of different anions (Cl-, SO42-
, HCO3-, PO4
3-, and NO3-) on Se(VI)
removal by ZVI were examined in a series of batch experiments under aero-bic conditions. In these experiments, 150 ml of 1000 µg/L of Se(VI) contain-ing one of the anions was placed in 150-mL Pyrex fl asks, followed by 5 g of ZVI. These anions included a Cl- and SO4
2- level of 5, 50, and 100 mM, and a HCO3
-, PO43-, and NO3
- range of 1, 5, and 10 mM. The fl asks were not capped and shaken in a gyrotory
shaker at a speed of 180 rpm. 1.5 mL of the samples was collected at the time of 0.5, 1, 2, 4, 7, 24, 31, and 48 h for Se species analysis by centrifugation for 14 min at 12000 rpm to precipitate ZVI-FeOH. pH and Eh in the samples were not determined. All of the experi-ments were run in triplicates at room temperature (21±1 °C). The rate con-stant of Se(VI) removal by ZVI in these experiments was calculated using a simple fi rst order kinetics equation: dSe(VI)/dt = -kSe(VI), where k is the rate constant of Se(VI) removal. Se data that were close to zero were not used in the calculation because Se(VI) in these samples was almost completely removed during the experiments.
ANALYSIS
Redox potential and pH in the fi ltered samples were immediately measured after collection with a 720A pH/ISE meter (Thermo Orion, Beverly, MA). pH was measured using an Accumet pH combination electrode. The redox potential was measured with an Accumet combina-tion platinum electrode (Ag/AgCl). The measured potential (Ehmeasured) was converted to potential in the solu-tion (Ehactual) relative to a standard H electrode as Ehactural = Ehmeasured + 224.4 mV (Jayaweera and Biggar, 1996).
Only total Se and Se(IV) were monitored in the fi ltered samples and PO4
3- extract because there were no organic materials and organic Se in the solution-ZVI-Fe oxyhydroxides system. Se(IV) in the samples was determined in a 6 N HCl solution. Total soluble Se in the samples was determined after a reduction of Se(VI) to Se(IV) in 6 N HCl (8.9 mL) added with 0.1 mL of 5% K2S2O8 at 90 ºC for 15 min. Se con-centrations in all prepared solutions were analyzed by hydride genera-tion atomic absorption spectrometry (HGAAS) (Zhang et al., 1999a). Se(VI) concentration was calculated as the difference between total soluble Se concentration and Se(IV). Estimation of nonextractable Se was performed as the differences between the added Se and sum of the total soluble Se and total extractable Se in each sample.
12W. Frankenberger and Y. Zhang
Removal of Selenium from Water by Zero-Valent Iron
F : Total Se; J : Se(IV); H: Se(VI); B: Nonextractable Se
Se in
sol
utio
nsg/
L
Sein
sol
utio
nsg/
L
Se in
ZV
I-Fe
OH
g/g
Se in
ZV
I-Fe
OH
g/g
0
0.4
0.8
4
6
8
10
0 5 10 15
Eh
(V)
pH
0
0.4
0.8
4
6
8
10
0 5 10 15
Eh
(V)
pH
0
200
400
600
800
1000
0 5 10 15
10 mM Cl-
0
200
400
600
800
1000
0 5 10 15
10 mM SO42-
-4
0
4
8
12
16
20
0 5 10 15
Time (h)
-4
0
4
8
12
16
20
0 5 10 15
Time (h)
pH pH
Eh Eh
C
A A
B B
C
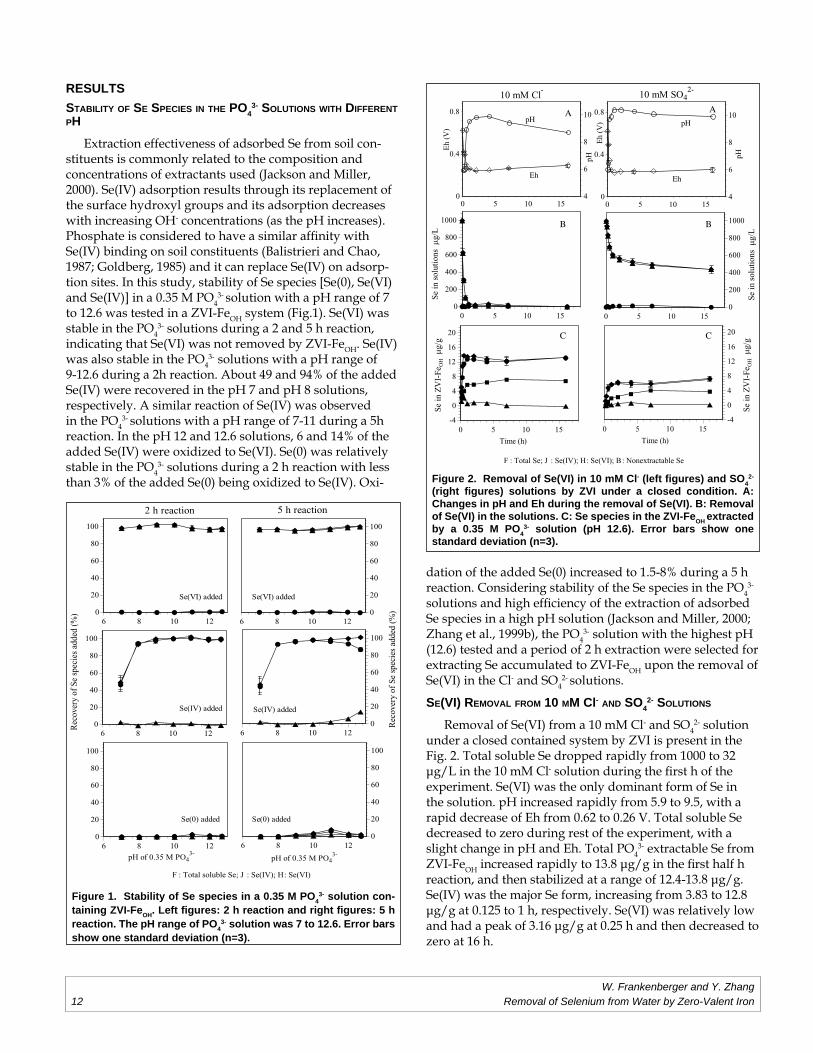
Figure 2. Removal of Se(VI) in 10 mM Cl- (left fi gures) and SO42-
(right fi gures) solutions by ZVI under a closed condition. A: Changes in pH and Eh during the removal of Se(VI). B: Removal of Se(VI) in the solutions. C: Se species in the ZVI-FeOH extracted by a 0.35 M PO4
3- solution (pH 12.6). Error bars show one standard deviation (n=3).
Rec
over
y of
Se
spec
ies
adde
d (%
)
Rec
over
y of
Se
spec
ies
adde
d (%
)
F : Total soluble Se; J : Se(IV); H: Se(VI)
0
20
40
60
80
100
6 8 10 120
20
40
60
80
100
6 8 10 12
0
20
40
60
80
100
6 8 10 120
20
40
60
80
100
6 8 10 12
0
20
40
60
80
100
6 8 10 12
pH of 0.35 M PO43-
0
20
40
60
80
100
6 8 10 12
pH of 0.35 M PO43-
2 h reaction 5 h reaction
Se(VI) added Se(VI) added
Se(IV) added Se(IV) added
Se(0) added Se(0) added
Figure 1. Stability of Se species in a 0.35 M PO43- solution con-
taining ZVI-FeOH. Left fi gures: 2 h reaction and right fi gures: 5 h reaction. The pH range of PO4
3- solution was 7 to 12.6. Error bars show one standard deviation (n=3).
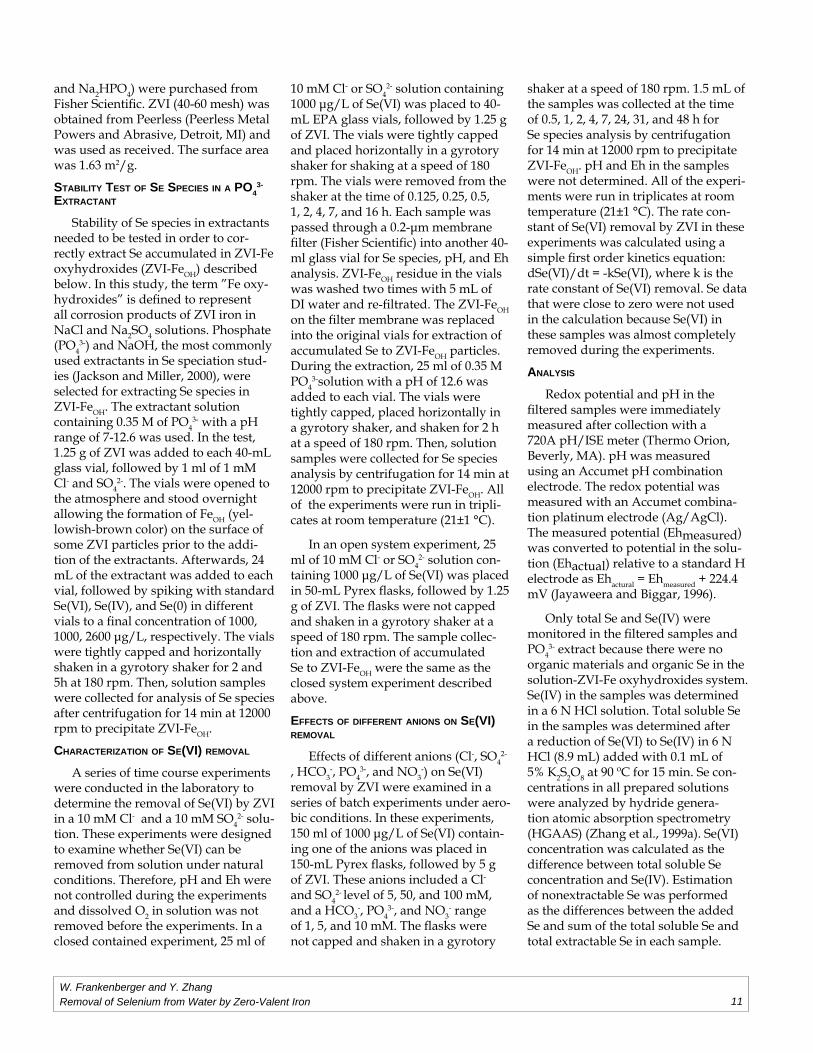
RESULTSSTABILITY OF SE SPECIES IN THE PO4
3- SOLUTIONS WITH DIFFERENT PH
Extraction effectiveness of adsorbed Se from soil con-stituents is commonly related to the composition and concentrations of extractants used (Jackson and Miller, 2000). Se(IV) adsorption results through its replacement of the surface hydroxyl groups and its adsorption decreases with increasing OH- concentrations (as the pH increases). Phosphate is considered to have a similar affi nity with Se(IV) binding on soil constituents (Balistrieri and Chao, 1987; Goldberg, 1985) and it can replace Se(IV) on adsorp-tion sites. In this study, stability of Se species [Se(0), Se(VI) and Se(IV)] in a 0.35 M PO4
3- solution with a pH range of 7 to 12.6 was tested in a ZVI-FeOH system (Fig.1). Se(VI) was stable in the PO4
3- solutions during a 2 and 5 h reaction, indicating that Se(VI) was not removed by ZVI-FeOH. Se(IV) was also stable in the PO4
3- solutions with a pH range of 9-12.6 during a 2h reaction. About 49 and 94% of the added Se(IV) were recovered in the pH 7 and pH 8 solutions, respectively. A similar reaction of Se(IV) was observed in the PO4
3- solutions with a pH range of 7-11 during a 5h reaction. In the pH 12 and 12.6 solutions, 6 and 14% of the added Se(IV) were oxidized to Se(VI). Se(0) was relatively stable in the PO4
3- solutions during a 2 h reaction with less than 3% of the added Se(0) being oxidized to Se(IV). Oxi-
dation of the added Se(0) increased to 1.5-8% during a 5 h reaction. Considering stability of the Se species in the PO4
3-
solutions and high effi ciency of the extraction of adsorbed Se species in a high pH solution (Jackson and Miller, 2000; Zhang et al., 1999b), the PO4
3- solution with the highest pH (12.6) tested and a period of 2 h extraction were selected for extracting Se accumulated to ZVI-FeOH upon the removal of Se(VI) in the Cl- and SO4
2- solutions.
SE(VI) REMOVAL FROM 10 MM Cl- AND SO42- SOLUTIONS
Removal of Se(VI) from a 10 mM Cl- and SO42- solution
under a closed contained system by ZVI is present in the Fig. 2. Total soluble Se dropped rapidly from 1000 to 32 µg/L in the 10 mM Cl- solution during the fi rst h of the experiment. Se(VI) was the only dominant form of Se in the solution. pH increased rapidly from 5.9 to 9.5, with a rapid decrease of Eh from 0.62 to 0.26 V. Total soluble Se decreased to zero during rest of the experiment, with a slight change in pH and Eh. Total PO4
3- extractable Se from ZVI-FeOH increased rapidly to 13.8 µg/g in the fi rst half h reaction, and then stabilized at a range of 12.4-13.8 µg/g. Se(IV) was the major Se form, increasing from 3.83 to 12.8 µg/g at 0.125 to 1 h, respectively. Se(VI) was relatively low and had a peak of 3.16 µg/g at 0.25 h and then decreased to zero at 16 h.
13W. Frankenberger and Y. ZhangRemoval of Selenium from Water by Zero-Valent Iron
0
20
40
60
80
100
120
0 10 20 30 40 50
0
20
40
60
80
100
120
0 10 20 30 40 5
Time (h)
JJ
JJ
JJJ
HH
HHHHH0
3
6
0 20
Ln(
Co/C
)
Time (d)
J
JJ
JJJJJ
HHH
HHHHH0
3
0 20 40
Ln(
Co/C
)
Time (d)
Se(V
I) in
sol
utio
ns (
C/C
o)
: 5 mM Cl-
: 50 mM Cl-
: 100 mM Cl-
: 5 mM SO42-
: 50 mM SO42-
: 100 mM SO42-
0
Figure 4. Effect of Cl- and SO42- concen-
tra tions on the removal of Se(VI) by ZVI. Error bars show one standard deviation (n=3). Inserted small fi gures show the fi rst order kinetics of Se(VI) removal.
F : Total Se; J : Se(IV); H: Se(VI); B : Nonextractable Se
Sein
sol
utio
nsg/
L
Sein
sol
utio
nsg/
L
Se in
ZV
I-Fe
OH
g/g
Se in
ZV
I-Fe
OH
g/g
0
200
400
600
800
1000
0 5 10 15
10 mM Cl-
0
200
400
600
800
1000
0 5 10 15
10 mM SO42-
-4
0
4
8
12
16
20
0 5 10 15
Time (h)
-4
0
4
8
12
16
20
0 5 10 15
Time (h)
0
0.4
0.8
4
6
8
10
0 5 10 15
Eh
(V)
pH
0
0.4
0.8
4
6
8
10
0 5 10 15
Eh
(V)
pH
pH
pH
Eh Eh
A A
B B
C C
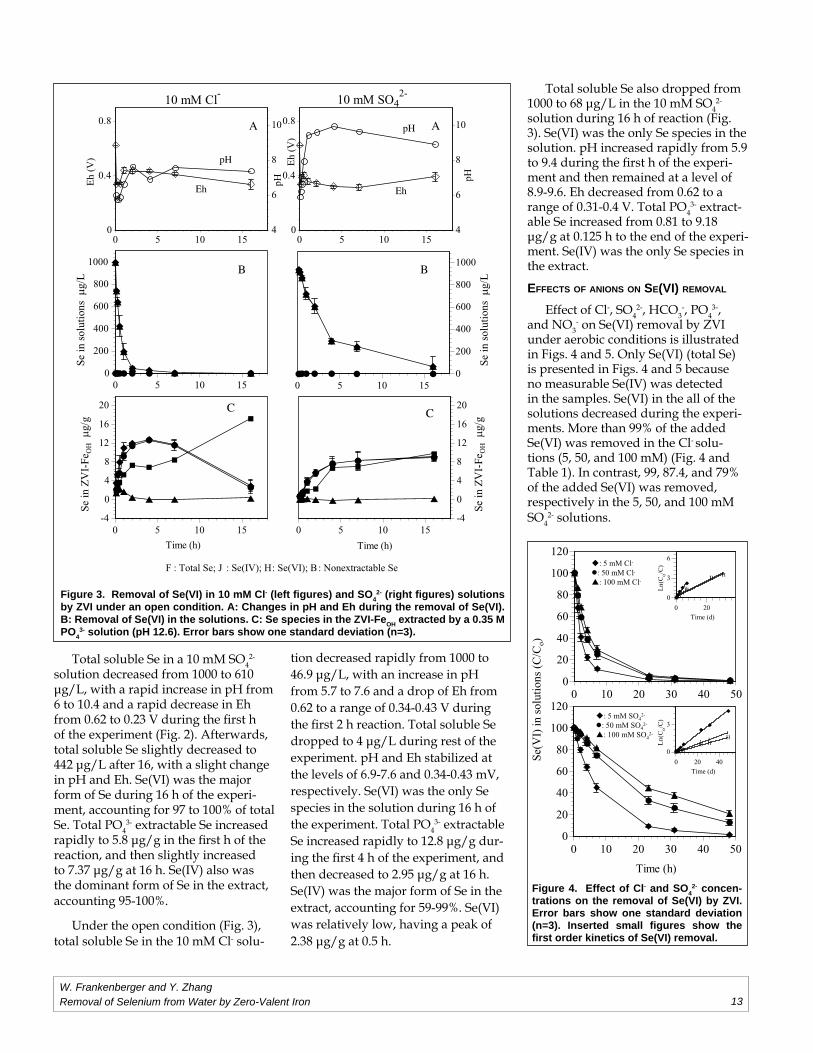
Figure 3. Removal of Se(VI) in 10 mM Cl- (left fi gures) and SO42- (right fi gures) solutions
by ZVI under an open condition. A: Changes in pH and Eh during the removal of Se(VI). B: Removal of Se(VI) in the solutions. C: Se species in the ZVI-FeOH extracted by a 0.35 M PO4
3- solution (pH 12.6). Error bars show one standard deviation (n=3).
Total soluble Se in a 10 mM SO42-
solution decreased from 1000 to 610 µg/L, with a rapid increase in pH from 6 to 10.4 and a rapid decrease in Eh from 0.62 to 0.23 V during the fi rst h of the experiment (Fig. 2). Afterwards, total soluble Se slightly decreased to 442 µg/L after 16, with a slight change in pH and Eh. Se(VI) was the major form of Se during 16 h of the experi-ment, accounting for 97 to 100% of total Se. Total PO4
3- extractable Se increased rapidly to 5.8 µg/g in the fi rst h of the reaction, and then slightly increased to 7.37 µg/g at 16 h. Se(IV) also was the dominant form of Se in the extract, accounting 95-100%.
Under the open condition (Fig. 3), total soluble Se in the 10 mM Cl- solu-
tion decreased rapidly from 1000 to 46.9 µg/L, with an increase in pH from 5.7 to 7.6 and a drop of Eh from 0.62 to a range of 0.34-0.43 V during the fi rst 2 h reaction. Total soluble Se dropped to 4 µg/L during rest of the experiment. pH and Eh stabilized at the levels of 6.9-7.6 and 0.34-0.43 mV, respectively. Se(VI) was the only Se species in the solution during 16 h of the experiment. Total PO4
3- extractable Se increased rapidly to 12.8 µg/g dur-ing the fi rst 4 h of the experiment, and then decreased to 2.95 µg/g at 16 h. Se(IV) was the major form of Se in the extract, accounting for 59-99%. Se(VI) was relatively low, having a peak of 2.38 µg/g at 0.5 h.
Total soluble Se also dropped from 1000 to 68 µg/L in the 10 mM SO4
2- solution during 16 h of reaction (Fig. 3). Se(VI) was the only Se species in the solution. pH increased rapidly from 5.9 to 9.4 during the fi rst h of the experi-ment and then remained at a level of 8.9-9.6. Eh decreased from 0.62 to a range of 0.31-0.4 V. Total PO4
3- extract-able Se increased from 0.81 to 9.18 µg/g at 0.125 h to the end of the experi-ment. Se(IV) was the only Se species in the extract.
EFFECTS OF ANIONS ON SE(VI) REMOVAL
Effect of Cl-, SO42-, HCO3
-, PO43-,
and NO3- on Se(VI) removal by ZVI
under aerobic conditions is illustrated in Figs. 4 and 5. Only Se(VI) (total Se) is presented in Figs. 4 and 5 because no measurable Se(IV) was detected in the samples. Se(VI) in the all of the solutions decreased during the experi-ments. More than 99% of the added Se(VI) was removed in the Cl- solu-tions (5, 50, and 100 mM) (Fig. 4 and Table 1). In contrast, 99, 87.4, and 79% of the added Se(VI) was removed, respectively in the 5, 50, and 100 mM SO4
2- solutions.
14W. Frankenberger and Y. Zhang
Removal of Selenium from Water by Zero-Valent Iron
In a range of 1, 5, and 10 mM of NO3
-, removal of Se(VI) was much faster than that of HCO3
- solutions, which was faster than that in the PO4
3-
solutions (Fig. 5 and Table 2). Se(VI) was almost completely removed in the 1, 5, and 10 mM NO3
-, 1 mM HCO3- and
1 mM PO43- solutions during the fi rst 24
h. Approximately 99, 82., 88, and 43% removal of Se(VI) occurred in the 5 and 10 mM HCO3
- and PO43- solutions at
the end of the experiment, respectively.
DISCUSSIONZero-valent iron has been used
to treat Cr(VI), NO3-, and U(VI)-con-
taminated waters as a reducing agent (Alowitz and Scherer, 2002; Farrell et al., 1999; Huang et al., 1998; Powell et al., 1995; Qiu et al., 2000). This study revealed that ZVI is also capable of removing Se(VI) from 10 mM Cl- and SO4
2- solutions. After a short period of time (16 h), the added Se(VI) was com-pletely removed from the Cl- solution, and 56 and 93% of the added Se(VI) was removed in the SO4
2- solution under a closed contained and open condition, respectively.
The major mechanism for the rapid removal of Se(VI) by ZVI and FeOH can be attributed to the reduction of Se(VI) to Se(IV) by Fe(II) oxidized from ZVI (Murphy, 1988), followed by rapid adsorption of Se(IV) to FeOH due to lower redox potentials of Fe(III)/Fe(II) than that of Se(VI)/Se(IV) (Genin, et al, 1998) and stronger adsorption of Se(IV) to FeOH than Se(VI) (Balistrieri and
Chao, 1987; 1990). Zingaro et al. (1997) reported that 99% of added Se(VI) was rapidly reduced after 7 h reaction with Fe(II) at an initial Fe(II)/Se(VI) molar ratio of 9. Manning and Burau (1995) extracted both Se(VI) and Se(IV) from Fe precipitates after a reaction of Fe(II) with Se(VI) in 0.1 M NaClO4 solution. In this study, little Se(IV) was found in both 10 mM Cl- and SO4
2- solutions during the removal of Se(VI), revealing that Se(IV) formed from the reduction Se(VI) to Se(IV) by ZVI and Fe(II) was rapidly adsorbed to FeOH. Analysis of Se species in the PO4
3- extract shown that Se(IV) increased rapidly in the FeOH, with a rapid decrease of Se(VI) in the Cl- and SO4
2- solutions.
Another mechanism that can not be ruled out for the removal of Se(VI) might be the direct adsorp-tion of Se(VI) to FeOH, followed by the reduction of adsorbed Se(VI) to Se(IV). Several studies have reported that Se(VI) can be adsorbed to FeOH via surface complexes of outer-sphere layer or inner-sphere layer, and or both layers (Hayes et al., 1987; Manceau and Charlet, 1994; Su and Suarez, 2000). Refait et al. (2000) reported that SO4
2- in green rust II [GR(SO42-)], one
of the Fe corrosion products, can be replaced by SeO4
2- to form GR(SeO42-)
and Se(VI) can be reduced to Se(IV) after the replacement. In a study on abiotic reduction of Se(VI) by green rust using X-ray absorption near edge structure (XANES) and extended X-ray absorption fi ne structure (EXAFS)
spectroscopy, Myneni et al. (1997) reported that Se(VI) can be incorpo-rated into the interlayers of green rust to form bidentate binuclear and edge-sharing complex with structural Fe(II) and reduced immediately to Se(IV). In this study, we visually observed that greenish FeOH on the fi lter membranes after fi ltration at initial period of the experiments, showing the existence of green rust I in the Cl- solution and green rust II in the SO4
2- solution. Anal-ysis of Se species in the ZVI and FeOH revealed that extracted Se(VI) from ZVI-FeOH accounted for as high as 30-40% of total extractable Se during fi rst 0.5 h of the Cl- experiment and then decreased rapidly to zero, providing evidence that Se(VI) was adsorbed to FeOH. These studies indicate that Se(VI) can be reduced rapidly to Se(IV) when it is adsorbed to FeOH (e.g. green rust I and II).
Further reduction of Se(IV) to Se(0) might occur in the FeOH. Calculation of Se mass showed that nonextractable Se increased with time. At the end of the experiment, nonextractable Se was 17.3 and 9.75 µg/g in the Cl- and SO4
2- experiments under an open condition, respectively. Under a closed contained system, it was 6.86 and 3.78 µg/g in the Cl- and SO4
2- experiments, respectively. By using X-ray absorption near edge structure (XANES) and extended X-ray absorption fi ne structure (EXAFS) spectroscopy, Myneni et al. (1997) detected that Se(0) existed in the green rust after a reduction of Se(VI). Using X-ray absorption near edge structure (XANES), Roberson (1999) also report-ed that Se(IV) and Se(0) was observed in FeOH during a study on the removal of Se(VI) by ZVI. After a reaction of Se(VI) with Fe(II), Zingaro et al. (1997) identifi ed Se(0) in the Fe precipitates using XPS and TEM-EDS analysis. These results may suggest that nonex-tractable Se in the present study might partly be a form of Se(0), which cannot be extracted by a basic PO4
3- extract-ant in a short period of the time (2 h). The increase of nonextractable Se may reveal a further reduction of Se(IV) to Se(0). Part of nonextractable Se might be attributed to the formation Fe(II)-
Table 1. Rate constant (k, h-1) of Se(VI) removal by ZVI in the presence of Cl- or SO42-
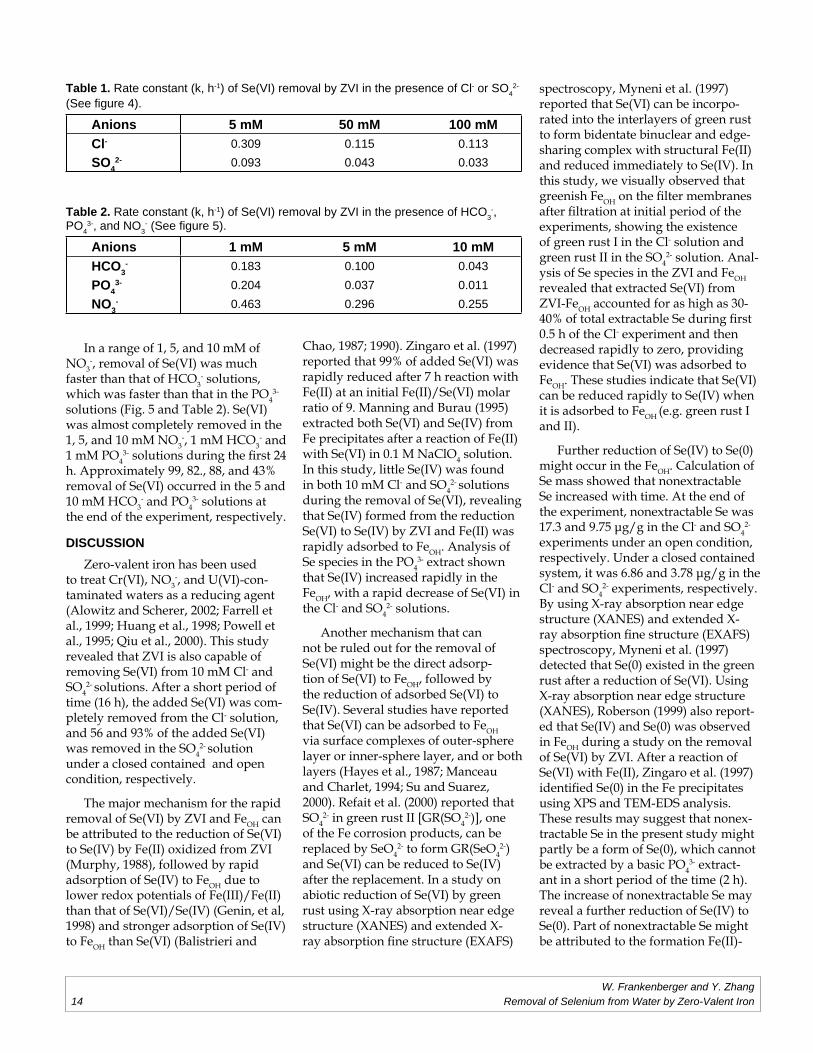
(See fi gure 4).
Anions 5 mM 50 mM 100 mMCl- 0.309 0.115 0.113SO4
2- 0.093 0.043 0.033
Table 2. Rate constant (k, h-1) of Se(VI) removal by ZVI in the presence of HCO3-,
PO43-, and NO3
- (See fi gure 5).
Anions 1 mM 5 mM 10 mMHCO3
- 0.183 0.100 0.043PO4
3- 0.204 0.037 0.011NO3
- 0.463 0.296 0.255
15W. Frankenberger and Y. ZhangRemoval of Selenium from Water by Zero-Valent Iron
0
20
40
60
80
100
120
0 10 20 30 40 50
0
20
40
60
80
100
120
0 10 20 30 40 50
0
20
40
60
80
100
120
0 10 20 30 40 5
Time (d)
J
J
JJJJJ
HHH
HHHHH0
3
6
0 20 40
Ln(
Co/
C)
Time (d)
JJJ
JJJJJHHHHHHHH0
3
6
0 20 40
Ln(
Co/
C)
Time (d)
J
JJ
JJ
HH
HHH0
3
0 1
Ln(
Co/C
)
Time (d)
Se(V
I) in
sol
utio
ns (
C/C
o)
: 1 mM HCO3-
: 5 mM HCO3-
: 10 mM HCO3-
1 mM PO43-
5 mM PO43-
10 mM PO43-
: 1 mM NO3-
: 5 mM NO3-
: 10 mM NO3-
0
0
Figure 5. Effect of HCO3-, PO4
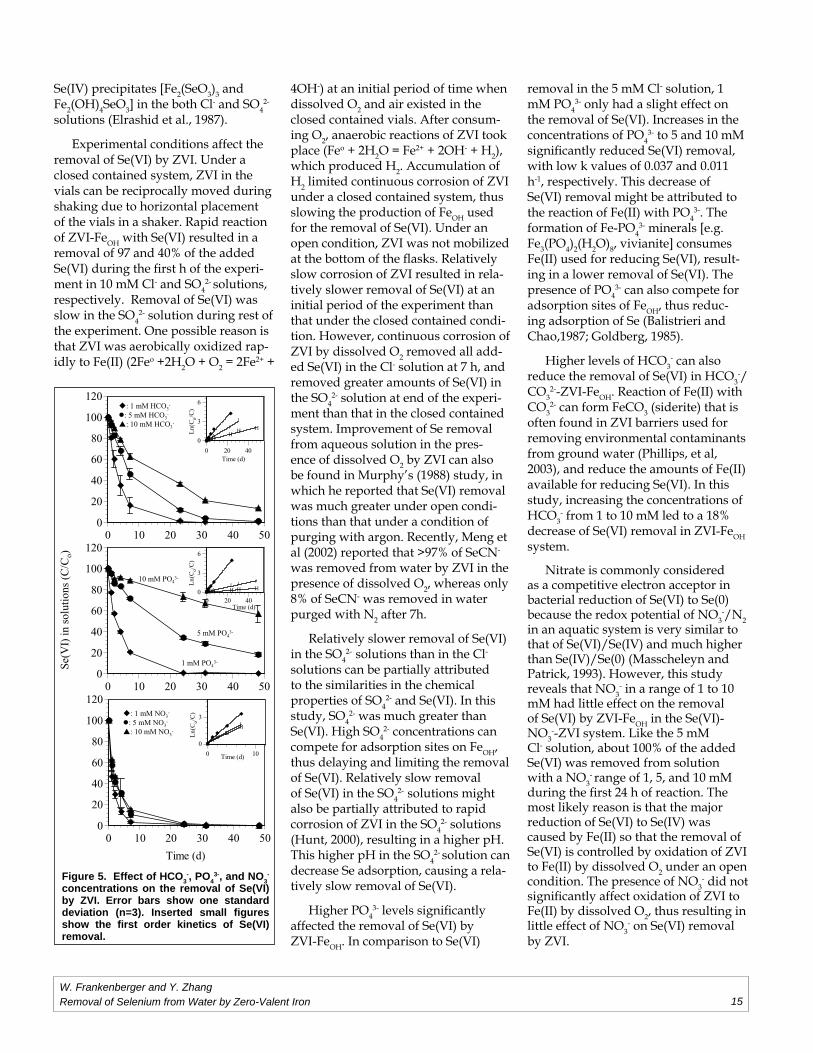
3-, and NO3-
concentrations on the removal of Se(VI) by ZVI. Error bars show one standard deviation (n=3). Inserted small fi gures show the fi rst order kinetics of Se(VI) removal.
Se(IV) precipitates [Fe2(SeO3)3 and Fe2(OH)4SeO3] in the both Cl- and SO4
2- solutions (Elrashid et al., 1987).
Experimental conditions affect the removal of Se(VI) by ZVI. Under a closed contained system, ZVI in the vials can be reciprocally moved during shaking due to horizontal placement of the vials in a shaker. Rapid reaction of ZVI-FeOH with Se(VI) resulted in a removal of 97 and 40% of the added Se(VI) during the fi rst h of the experi-ment in 10 mM Cl- and SO4
2- solutions, respectively. Removal of Se(VI) was slow in the SO4
2- solution during rest of the experiment. One possible reason is that ZVI was aerobically oxidized rap-idly to Fe(II) (2Feo +2H2O + O2 = 2Fe2+ +
4OH-) at an initial period of time when dissolved O2 and air existed in the closed contained vials. After consum-ing O2, anaerobic reactions of ZVI took place (Feo + 2H2O = Fe2+ + 2OH- + H2), which produced H2. Accumulation of H2 limited continuous corrosion of ZVI under a closed contained system, thus slowing the production of FeOH used for the removal of Se(VI). Under an open condition, ZVI was not mobilized at the bottom of the fl asks. Relatively slow corrosion of ZVI resulted in rela-tively slower removal of Se(VI) at an initial period of the experiment than that under the closed contained condi-tion. However, continuous corrosion of ZVI by dissolved O2 removed all add-ed Se(VI) in the Cl- solution at 7 h, and removed greater amounts of Se(VI) in the SO4
2- solution at end of the experi-ment than that in the closed contained system. Improvement of Se removal from aqueous solution in the pres-ence of dissolved O2 by ZVI can also be found in Murphy’s (1988) study, in which he reported that Se(VI) removal was much greater under open condi-tions than that under a condition of purging with argon. Recently, Meng et al (2002) reported that >97% of SeCN- was removed from water by ZVI in the presence of dissolved O2, whereas only 8% of SeCN- was removed in water purged with N2 after 7h.
Relatively slower removal of Se(VI) in the SO4
2- solutions than in the Cl- solutions can be partially attributed to the similarities in the chemical properties of SO4
2- and Se(VI). In this study, SO4
2- was much greater than Se(VI). High SO4
2- concentrations can compete for adsorption sites on FeOH, thus delaying and limiting the removal of Se(VI). Relatively slow removal of Se(VI) in the SO4
2- solutions might also be partially attributed to rapid corrosion of ZVI in the SO4
2- solutions (Hunt, 2000), resulting in a higher pH. This higher pH in the SO4
2- solution can decrease Se adsorption, causing a rela-tively slow removal of Se(VI).
Higher PO43- levels signifi cantly
affected the removal of Se(VI) by ZVI-FeOH. In comparison to Se(VI)
removal in the 5 mM Cl- solution, 1 mM PO4
3- only had a slight effect on the removal of Se(VI). Increases in the concentrations of PO4
3- to 5 and 10 mM signifi cantly reduced Se(VI) removal, with low k values of 0.037 and 0.011 h-1, respectively. This decrease of Se(VI) removal might be attributed to the reaction of Fe(II) with PO4
3-. The formation of Fe-PO4
3- minerals [e.g. Fe3(PO4)2(H2O)8, vivianite] consumes Fe(II) used for reducing Se(VI), result-ing in a lower removal of Se(VI). The presence of PO4
3- can also compete for adsorption sites of FeOH, thus reduc-ing adsorption of Se (Balistrieri and Chao,1987; Goldberg, 1985).
Higher levels of HCO3- can also
reduce the removal of Se(VI) in HCO3-/
CO32--ZVI-FeOH. Reaction of Fe(II) with
CO32- can form FeCO3 (siderite) that is
often found in ZVI barriers used for removing environmental contaminants from ground water (Phillips, et al, 2003), and reduce the amounts of Fe(II) available for reducing Se(VI). In this study, increasing the concentrations of HCO3
- from 1 to 10 mM led to a 18% decrease of Se(VI) removal in ZVI-FeOH system.
Nitrate is commonly considered as a competitive electron acceptor in bacterial reduction of Se(VI) to Se(0) because the redox potential of NO3
-/N2 in an aquatic system is very similar to that of Se(VI)/Se(IV) and much higher than Se(IV)/Se(0) (Masscheleyn and Patrick, 1993). However, this study reveals that NO3
- in a range of 1 to 10 mM had little effect on the removal of Se(VI) by ZVI-FeOH in the Se(VI)-NO3
--ZVI system. Like the 5 mM Cl- solution, about 100% of the added Se(VI) was removed from solution with a NO3
- range of 1, 5, and 10 mM during the fi rst 24 h of reaction. The most likely reason is that the major reduction of Se(VI) to Se(IV) was caused by Fe(II) so that the removal of Se(VI) is controlled by oxidation of ZVI to Fe(II) by dissolved O2 under an open condition. The presence of NO3
- did not signifi cantly affect oxidation of ZVI to Fe(II) by dissolved O2, thus resulting in little effect of NO3
- on Se(VI) removal by ZVI.
16W. Frankenberger and Y. Zhang
Removal of Selenium from Water by Zero-Valent Iron
CONCLUSIONS
Results from this study reveal that Se(VI) can be removed from aqueous solutions with varying concentra-tions of Cl-, SO42-, NO3
-, HCO3-, and
PO43-. During 16 h of the experiment,
100 and 56% of the added Se(VI) was removed in 10 mM Cl- and SO42- solu-tions under a closed contained system, respectively. Under an open condition,
100 and 93% of the added Se(VI) were removed in the Cl- and SO42- solu-tions, respectively. The experiments also showed that there was little effect of Cl- (5, 50, and 100 mM), SO4
2- (5 and 50 mM), NO3
- (1, 5 and 10 mM), HCO3-
(1 and 5 mM), and PO43- (1 mM) and a
slight effect of SO42- (100 mM), HCO3
- (10 mM), and PO4
3- (5 mM) on Se(VI) removal. Only higher PO4
3- (10 mM) levels signifi cantly inhibited Se(VI)
removal by ZVI. In California, Se-con-taminated drainage water contains an average concentration of 987 (Cl-), 2282 (SO42-), 97 (NO3
-), 214 (HCO3-), and
0.12 mg/L (PO43-) (Oswald et al., 1989),
which are much lower levels than those tested in our study. Our work suggests that ZVI may be an inexpen-sive agent that can be used to treat Se-contaminated drainage water.
REFERENCES CITEDAlowitz, M.J. and M.M. Scherer. 2002. Kinetics of nitrate, nitrite, and Cr(VI) reduction by iron metal. Environ. Sci. Technol.
36:299-306.
Amweg, E.L., D.L. Stuart, and D.P. Weston. 2003. Comparative bioavailability of selenium to aquatic organisms after bio-logical treatment of agricultural drainage water. Aquatic Toxicol. 63:13-25.
Balistrieri, L.S. and T.T. Chao. 1987. Selenium adsorption by geothite. Soil Sci. Soc. Am. J. 51:1145-1151.
Balistrieri, L.S. and T.T. Chao. 1990. Adsorption of selenium by amorphous iron oxyhydroxides and manganese dioxide. Geochim. Cosmochim. Acta 54:739-751.
Campbell, I.M. Catalysis Surfaces, Chapman and Hall, London, 1988
Cantafi o, A.W., K.D. Hagen, G.E. Lewis, T.L. Bledsoe, K.M. Nunan, and J.M. Macy. 1996. Pilot-scale selenium bioremedia-tion of San Joaquin drainage water with Thauera selenatis. Appl. Environ. Microbiol. 62:3298-3303.
Combs, G.F., C. Garbisu, B.C. Yee, A. Yee, D.E. Donald, N.R. Smith, A.C. Magyarosy, T. Leighton, and B.B. Buchanan. 1996. Bioavailability of selenium accumulated by selenite-reducing bacteria. Biol. Trace Elem. Res. 52:209-225.
Elrashidi M.A., D.C. Adriano, S.M. Workman, and W.L. Lindsay. 1987. Chemical equilivria of selenium in soil: A theoretical development. Soil Sci. 144:141-152
Farrell, J., W.D. Bostick, R.J. Jarabek, and J.N. Fiedor. 1999. Uranium removal from ground water using zero valent iron media. Ground Water. 37:618-624.
Furukawa, Y., J.W. Kim, J. Watkins, and R.T. Wilkin. 2002. Formation of ferrihydrite and associated iron corrosion products in permeable reactive barriers of zero-valent iron. Environ. Sci. Technol. 36:5469-5475.
Genin, J.M., G. Bourrie, F. Trolard, M. Abdelmoula, A. Jaffrezic, P. Refait, V. Maitre, B. Humbert, and A. Herbillon. 1998. Thermodynamic equilibria in aqueous suspensions of synthetic and natural Fe(II)-Fe(III) green rusts: occurrences of the mineral in hydromorphic soils. 32:1058-1068.
Goldberg, S. 1985. Chemical modeling of anion competition on Goethite using the constant capacitance model. Soil Sci. Soc. Am. J. 49: 851-856.
Hayes, K.F., A.L. Roe, G.E. Brown, K.O. Hodgson, J.O. Leckie, and G.A. Parks. 1987. In situ x-ray absorption study of sur-face complexes: selenium oxyanions on α-FeOOH. Science 238:783-786.
Huang, C.P., H.W. Wang, and P.C. Chiu. 1998. Nitrate reduction by metallic iron. Wat. Res. 32:2257-2264.
Hunt M.L. 2000. MS. thesis. Redox transformation and reactions of inorganic arsenic with aero-valent iron and iron oxides. University of California, Riverside, CA, USA.
Jackson, B.P. and W.P. Miller. 2000. Effectiveness of phosphate and hydroxide for desorption of arsenic and selenium spe-cies from iron oxides. soil Sci. Soc. Am. J. 64:1616
Jayaweera, G.R., and J.W. Biggar. 1996. Role of redox potential in chemical transformations of selenium in soils. Soil Sci. Soc. Am. J. 60:1056-1063.
Lundquist, T.J., B.F. Green, B.R. Tresan, R.D. Newman, W.J. Oswald and M.B. Gerhardt 1995. The algal-bacterial selenium removal system: mechanisms and fi eld study. p. 251-279. In Frankenberger Jr. W.T. (ed) Selenium in Environment. CRC Press, Inc.
17W. Frankenberger and Y. ZhangRemoval of Selenium from Water by Zero-Valent Iron
Manceau A., and L. Charlet. 1994. The mechanism of selenate adsorption on goethite and hydrous ferric-oxide. J. Colloid interface Sci. 168:87-93.
Masscheleyn, P.H., and W.H.J. Patrick. 1993. Biogeochemical processes affecting selenium cycling in wetlands. Environ. Toxicol. Chem. 12:2235-2243.
Manning B.A and R.G. Burau. 1995. Selenium immobilized in evaporation pond sediment by in situ precipitation of ferric oxyhydroxide. Environ. Sci. Technol. 29: 2639-2646.
Meng X., S. Bang and G.P. Korfi atis. 2002 Removal of selenocyanate from water using elemental iron. Water Res. 36: 3867-3873.
Murphy A.P. 1988. Removal of selenate from water by chemical reduction. Ind. Eng. Chem. Res. 27: 187-191.
Myneni, S.C.B., T.K. Tokunaga and G.E. Brown Jr. 1997. Abiotic selenium redox transformation in the presence of Fe(II,III) oxides. Science 278:1106-1109.
Oswald, W.J., P.H. Chen, M.B. Gerhardt, B.F. Green, Y. Nurdogan, D.F. Von Hippel, R.D. Newman, L. Chown, and C.S. Tam 1989. The role of microalgae in removal of selenate from subsurface tile drainage. p. 131-141. In M.E. Huntley (ed) Biotreatment of agricultural wastewater. CRC Press, Boca Raton, FL.
Phillips, D.H., B. Gu, D.B. Watson, and Y. Roh. 2003. Impact of sample preparation on mineralogical analysis of zero-valent iron reactive barrier materials. J. Environ. Qual. 32:1299-1305.
Qiu, S.R., H.F. Lai, M.J. Roberson, M.L. Hunt, C. Amrhein, L.C. Giancarlo, G.W. Flynn, and J.A. Yarmoff. 2000. Removal of contaminants from aqueous solution by reaction with iron surface. Langmuir 16:2230-2236.
Powell, R.M., R.W. Puls, S.K. Hightower and D.A. Sabatini. 1995. Coupled iron corrosion and chromate reduction: mecha-nisms for subsurface remediation. Environ. Sci. Technol. 29:1913-1922.
Refait, P., L. Simon, and J.M.R. Fenin. 2000. Reduction of SeO42- anions and anoxic formation of iron(II)―Iron(III) hydroxy-
selenate green rust. Environ. Sci. Technol. 34:819-825.
Roberson, M.J. 1999. Ph.D. thesis. Removal of selenate from irrigation drainage water using zero-valent iron. University of California, Riverside, CA, USA.
Setmire, J. G. and R.A. Schroeder. Selenium and salinity concerns in the Salton Sea area of California. In Environmental Chemistry of Selenium; Frankenberger, Jr. W.T., and R.A. Engberg, Eds.; Marcel Dekker, Inc. New Tork, NY, 1998; pp 205-221.
Su, C. and D.L. Suarez. 2000. Selenate and selenite sorption on iron oxides: an infrared and electrophoretic study. Soil Sci. Soc. Am. J. 64:101-111.
[SWRCB] State Water Resources Control Board. 1989. Water quality control plan (Basin Plan for the San Joaquin River Basin). Amendment Resolution # 1989-88, Sacramento, CA. p. 61.
Sylvester, M.A. 1990. Overview of the salt and agricultural drainage problem in the western San Joaquin Valley, California. US Geological Survey Circular, No. 1033c pp119-124.
Zingaro, R.A., D.C. Dufner, A.P. Murphy, and C.D. Moody. Reduction of oxoselenium anions by iron(II) hydroxide. Envi-ron. Internat. 23: 299-304.
Zhang, Y.Q., J.N. Moore, and W.T. Frankenberger Jr. 1999a. Speciation of soluble selenium in agricultural drainage waters and aqueous soil-sediment extracts using hydride generation atomic absorption spectrometry. Environ. Sci. Technol. 33: 1652-1656.
Zhang, Y.Q., W.T. Frankenberger Jr., and J.N. Moore. 1999b. Measurement of selenite in sediment extracts by using hydride generation atomic absorption spectrometry. Sci. Total Environ. 229: 183-193.
PUBLICATIONS AND REPORTSZhang, Y.Q., J. Wang, C. Amrhein and W.T. Frankenberger Jr. 2003. Removal of Selenium from water by Zero-Valent Iron. J. Envi-
ron. Qual. (in review).
Zhang, Y.Q., and W.T. Frankenberger Jr. 2004. Removal of Selenium from River Water by Enterobacter Taylorae in an Organic Car-bon Coated Sand Column. (in preparation).

18W. Frankenberger and Y. Zhang
Removal of Selenium from Water by Zero-Valent Iron
19
Does Saline Drainage Water Affect CropTolerance to Boron?
Project Investigators:
Steve GrattanOffi ce: (530) 752-4618, E-mail: [email protected]
Department of Land, Air, and Water ResourcesUniversity of California, Davis
Catherine GrieveE-mail: [email protected]
USDA-ARS George E. Brown, Jr. Salinity LaboratoryUniversity of California campus, Riverside
Jim PossE-mail: [email protected]
USDA-ARS George E. Brown, Jr. Salinity LaboratoryUniversity of California campus, Riverside
Don SuarezE-mail: [email protected]
USDA-ARS George E. Brown, Jr. Salinity LaboratoryUniversity of California campus, Riverside
Research Staff:
Tim Smith, Ph.D. StudentDepartment of Soil Science, University of California, Davis
Several casual part-time UC Riverside students
20
ABSTRACT A potential limitation in
implementing a drainage water reuse system is determining the extent by which boron, a naturally occurring element in the drainage water, affects the selection, growth and yield of crops in the reuse system.
Boron is a concern for several reasons. First, boron is an element that is essential for crops but has a small concentration window between that what is considered defi cient and that which is potentially toxic. Second, it has a higher affi nity to the soil than common salts requiring much more water to reclaim soil B to pre-existing levels than it does to reduce the salinity to pre-salinization levels. Furthermore, the B concentration in San Joaquin Valley drainage water varies widely but in nearly all cases, it far exceeds levels that would result in toxic conditions based on B-tolerance guidelines.
Unlike guidelines for salt tolerance, the guidelines for boron tolerance are more limited. With the exception of a few sand tank studies that actually pro-vide B coeffi cients (i.e. threshold and slope) for a few crops (see Maas and Grattan, 1999), most of the B classifi ca-tion has come from work conducted over a half a century ago by Eaton et al. (1944). More importantly, these older studies defi ned the B-tolerance limit based on the development of incipient injury on the crop (i.e. foliar burn), not yield response under a range of B con-centrations.
The question is often raised, are the effects of salinity and boron on crops additive, synergistic or antagonistic? Despite the common occurrence of high boron and high salinity in many parts of the world, very little research has been done to study the interaction of the two. For those that have been done, contradictory results have been obtained. Greenhouse studies are underway to evaluate B tolerance particularly in relation to salinity. Our goal is to answer this question. Should the answer be that the effects of the
two are antagonistic, B may not be as limiting a factor in reuse systems than previously thought.
A comprehensive greenhouse ex-periment was conducted in 2003 at the US Salinity Laboratory in Riverside to evaluate the interactions between B and saline drainage water on the per-formance of broccoli and to get a better indication how limiting B really is to plants grown in drainage reuse sys-tems. Particular interest in this study was directed towards the composition of the salinizing solution to determine what role various salts have on the salinity-boron interaction. Results from this study indicate that both Cl-based salts and those characteristic of shallow saline drainage water (i.e. a mixture of salts dominated by sodium sulfate) showed a signifi cant salinity-boron interaction. That is at high salinity, increased B concentration was less detrimental, both visually and quan-titatively (i.e. biomass), than it was at low salinity. That is, plants could tolerate a higher solution B-concentra-tion at higher salinity. However there was no signifi cant difference between salt types. The effects on head weights were more exaggerated than those on shoot biomass. Therefore these data indicate that salinity and B are antago-nistic.
Extensive ion analyses have been conducted over the past 9 months to evaluate the infl uence of salinity on ion uptake and distribution within broccoli shoots. To date, ion concentration data are only complete from plant samples taken on April 24th. This mid-season vegetative-harvest included whole shoot samples as well as leaf blade, leaf margins and petioles. Shoot B concen-tration was infl uenced by salinity, but interestingly the direction of infl uence was dependent upon the B concentra-tion in the solution. Regardless of the composition of the salinizing solution, increased salinity increased shoot B concentration when B concentrations in the solution were relatively low (i.e. 0.5 mg/L). At the highest solution B concentration (28 mg/L), increased salinity reduced shoot B concentra-
tion. Solution B in itself had very little infl uence on shoot ion accumulation but both salinity (i.e. EC) and salinity composition had very strong infl u-ences on shoot tissue ion composition. A detailed summary is provided in the results along with a discussion on the distribution of ions within the shoot.
Cumulative water use of broccoli was evaluated in relation to the various treatments. Cumulative ET was, for the most part, directly related to cumulative biomass; the higher the cumulative biomass the higher the cumulative ET. Stable isotopic ratios of oxygen in the solution were used to separate evaporation and transpiration. With these estimates, we were able to provide insight into whether B uptake is truly passive with the transpiration stream as many have suggested in the literature or whether the plant is able to regulate the amount of B absorbs and transports to the shoot. In no treatment did shoot B accumulate to a level predicted based on transpiration volume times solution B-concentration. Plants treated with low B contained the largest percent of B uptake (10-60%), expressed relative to predicted passive uptake. Salinity treatments, regardless of composition, represented the higher percentage range. On the other hand, plants treated with high B (14 or 28 mg/L) only accumulated 1-2% of that predicted if uptake and accumulation were truly passive. Therefore based on our data, it appears that broccoli can reduce that amount of B it absorbs and/or transports to the shoot at high solution B concentrations.
Further experiments are needed using crops (e.g. cucumber and wheat) that have been known to show enhanced sensitivity to B in the presence of Cl salinity. Only after these experiments are conducted and the data analyzed and interpreted can one determine whether SJV salts reduces boron’s toxic effect to crops.
INTRODUCTION Reuse of saline drainage water is a
management option on the west side of the San Joaquin Valley (SJV) that is
S. Grattan, C. Grieve, J. Poss, and D. SuarezDoes Saline Drainage Water Affect Crop Tolerance to Boron?
21
necessary for reducing the volume of drainage water (San Joaquin Valley Drainage Implementation Program, 2000). Several methods of utilizing saline water (i.e. sequential, cyclic and blending) have been tested experimen-tally or demonstrated under fi eld con-ditions. In addition to these methods of reuse, saline water table control has also been tested as a means of allowing certain agronomic crops (such as cotton and saffl ower) to extract water directly from this saturated zone. Regardless of how crops utilize this saline drainage water, crop roots are exposed to water containing both high concentrations of sulfate and chloride salts as well as high concentrations of boron.
There is considerable controversy over the extent by which boron limits the reuse of SJV drainage water. On the one hand, there is concern that boron is one of the most limiting factors in the long-term success of drainage water reuse systems. The concern stems from several relationships. First, there is a small concentration window between the level in the soil that is required for optimal crop growth and that considered toxic (Gupta et al., 1985). Second, the boron concentrations in drainage water exceed the published boron tolerance coeffi cients for most crops grown in the San Joaquin Valley, despite the fact that many are classifi ed as moderately B-tolerant to B-tolerant (Maas and Grattan, 1999). Third, boron is adsorbed tightly to the soil and therefore is not as readily leached from the crop rootzone as the other salts are. This phenomenon provides the opportunity for boron to accumulate in the root zone more rapidly than salinity, eventually affecting crop selection and ultimately having a negative effect on crop growth and yield. Because of these concerns, it has long been thought that B is a much more limiting factor in drainage water reuse than is the salinity of the drainage water.
On the other hand, some argue that the boron coeffi cients might be too conservative (e.g. Letey et al., 2001). Most of the coeffi cients are based on
the concentration of B in the soil water that produces incipient injury and are not based on yield reduction criteria (i.e. yield reduction as a function of increased B in the soil solution). More-over, these coeffi cients were developed in non-saline environments suggesting that they may not be appropriate for crops grown under saline conditions.
Toxicity occurs in crops when boron concentrations increase in either stem and leaf tissues to lethal levels, but soil and plant-tissue analyses can only be used as general guidelines for assessing the risk of B-toxicity (Nable et al., 1997). Although experimental evidence indicates that plants absorb B passively as H3BO3, contradictions between experimental results and observations in the fi eld suggest that other factors, yet unknown, may affect B uptake (Hu and Brown, 1997). Once B has accumulated in a particular organ within the shoot, it has restricted mobility in most plant species but not all (Brown and Shelp, 1997). In some plant species, particularly those that produce substantial amounts of polyols, B is readily translocated as B-polyol complexes.
The question has recently been raised, are the effects of salinity and boron on crops additive, synergistic, or antagonistic? Despite the common occurrence of high boron and high salinity in many parts of the world, very little research has been done to study the interaction of the two (Grattan and Grieve, 1999). From a review of the limited number of studies that addressed the combined effects of salinity and boron on the plant, it appears that the results are contradictory.
In sand-culture experiments con-ducted in a greenhouse, researchers found that wheat responded to boron in the soil solution independently of salinity, made up of sodium chloride (NaCl) and calcium chloride (CaCl2) salts (Bingham et al., 1987). That is, there was no salinity - B interaction with respect to leaf B concentration. Similarly, others have found that boron and salinity effects were independent
of each other for corn, barley and alfalfa (Shani and Hanks, 1993 and Mikkelsen et al., 1988).
However in more recent studies, investigators found that Cl-based salinity enhanced B sensitivity in wheat (Grieve and Poss, 2000; Lauchli et al. 2001; Wimmer et al., 2003). Wheat is one of those crops that are tolerant to salinity but sensitive to B. Grieve and Poss (2000) found that Cl-salinity increased B accumulation in leaves and was associated with more injury. Wimmer et al., (2003) attribute its effect on B compartmentalization within the plant. They found that under saline conditions, total B concentration was reduced in the root, was unaffected in the basal portion of the leaf, and increased in the leaf tip. Therefore salinity enhanced B mobility within the plant.
In a recent greenhouse study using soil in pots, investigators found that NaCl salinity increased B sensitivity in tomato and cucumber (Alpaslan and Gunes, 2001). However they found that salinity reduced B concentration in tomato but increased it in cucumber. These results question the hypothesis that B is taken up passively by plants via the transpiration stream. Further-more, these investigators found that NaCl increased membrane permeabil-ity but increasing B in the soil to toxic levels did not, except in the presence of salinity.
On the other hand, investigators who used a mixture of salts (i.e. Na+, Ca2+, Cl- and SO4
2-) found the opposite effect. In one fi eld study conducted in Northern Chile, a number of vegetable crop species and prickly pear cactus were irrigated with saline water (8.2 dS/m) containing a mixture of ions including 17 mg/L of boron (Ferreyra et al., 1997). Plant growth and crop yields of artichoke, asparagus, broad bean, red and sugar beets, Swiss chard, carrot, celery, a local variety of sweet corn, potato, prickly pear cactus, onion, shallot, spinach, were all greater than expected based on published salt and boron tolerance coeffi cients. These in-vestigators found that salinity reduced
S. Grattan, C. Grieve, J. Poss, and D. SuarezDoes Saline Drainage Water Affect Crop Tolerance to Boron?
22
leaf boron levels. If separate effects of salinity and boron are additive, little or no growth would be expected for any of these crops. Interactions likely occur which increase the crop’s tolerance for boron in the presence of saline condi-tions. The investigators suggested that a reduction in plant water uptake, due to higher salinity levels, would reduce the rate boron accumulation in the plant tissue thereby extending the time during which boron levels are not af-fecting plant growth.
Others also found that salinity, using a mixture of salts, reduced leaf B concentration of chickpea (Yadav et al., 1989), wheat (Holloway and Alston, 1992) as well as reduced B uptake and accumulation in the stem of several Prunus rootstocks (El-Motaium et al., 1994), thereby de-creasing B-toxicity symptoms. In the latter study, the investigators found a negative relationship between B and SO4
2- concentrations in tissue suggest-ing that SO4
2- could be responsible for the salinity-induced reduction in tissue B. Others have also found that a mixture of chloride and sulfate salin-ity reduces leaf injury in Eucalyptus camaldulensis (Grattan et al., 1996) by reducing tissue B concentrations and in pistachio (Ferguson et al. 2002) by some unknown mechanism. Studies that include a mixture of salts (i.e Na+, Mg2+, Ca2+, Cl- and SO4
2- ) are much more appropriate for conditions of the San Joaquin Valley as well as a num-ber of coastal valleys than those using chloride salts alone.
In no study, however, were in-vestigators able to suggest the actual mechanism that supports this phenom-enon such as direct ion interactions, reduced transpiration in salt-stressed conditions or both. Consequently, many questions regarding the interac-tions between salinity and boron re-main unresolved. Questions related to (1) the relationship between visual leaf symptoms and yield; (2) the dynamic relationships between boron concentra-tion in irrigation water, adsorption of boron, boron uptake and distribution
within the plant; (3) the infl uence of salinity, both concentration and com-position, on boron tolerance of the crop; and (4) whether boron damage will ever exceed salinity damage when using saline drainage water.
The most important information that is needed is to have boron toler-ance coeffi cients related to yield rather than visual symptoms, and that the boron tolerance coeffi cients be evalu-ated as a function of salinity (i.e. saline drainage water).
We are currently conducting experi-ments in sand cultures to address these questions. Sand-culture facilities are useful because salt concentrations and compositions can readily be controlled creating uniform profi les such that true comparisons can be made among the treatments. An interdisciplinary re-search project involving scientists from the University of California and the USDA-ARS with expertise in soils and irrigation management, plant physiol-ogy, salinity and plant nutrition are currently conducting experiments to evaluate salinity – B interactions and to develop crop response functions to B in both the presence and absence of salinity.
MATERIALS AND METHODSA greenhouse experiment was con-
ducted at the USDA-ARS, George E. Brown, Jr. Salinity Laboratory located at the UC Riverside campus. The ex-periment was designed to determine the interactive effects of salinity and boron on broccoli performance includ-ing growth, yield, injury, and ion rela-tions. Broccoli (Brassica oleracea L., botrytis group, cv Seminis PX511018) was selected because it is a crop com-mon to the Westside of the SJV and is known to be moderately sensitive to salinity and moderately sensitive to B in non-saline systems.
The greenhouse experiment was conducted using an elaborate sand tank system. This system creates a uniform and controlled environment and consists of 60 large tanks (1.2 m x 0.6 m x 0.5 m deep) fi lled with washed sand having an average bulk density of
1.2 Mg m-3. At saturation, the sand has an average volumetric water content of 0.34 m3 m-3. Each tank is irrigated with a solution prepared in individual reservoirs having a volume of approxi-mately 890 L. Salinity-B treatments were complemented with modifi ed half-strength Hoagland’s nutrient solu-tion. Solutions were pumped from reservoirs, located below the sand-tank facility, to the tanks and then returned to the reservoirs through a subsurface drainage system at the bottom of each sand tank. Each reservoir irrigated three replicate tanks. Irrigation fre-quencies (i.e. several times per day) were suffi cient to allow the sand-water concentration to approach that in the irrigation water, thereby creating a uniform distribution of salt in the crop rootzone. Calculat ions indicate that the salinity of the irrigation water was more or less equivalent to that of the sand water and previous studies (Wang, 2002) have indicated that the EC of the sand water is approximately 2.2 times the EC of the saturated soil extract (ECe), the salinity parameter used to characterize salt-tolerance. Total evapotranspiration from each tank was measured by solution-vol-ume changes in the storage reservoirs and water lost was replenished to maintain constant osmotic potentials in the treatment irrigation waters.
Several sand tanks were not planted but irrigated to provide maximum evaporation estimates. These tanks were also used as a reference for stable isotope analyses in order to separate evaporation from transpiration in the planted tanks using an approach described in a previous report (Grat-tan et al. 1998). The overall principle is that enrichment in the delta 18O in the reservoirs occurs by evaporation only and that crop water uptake (i.e. tran-spiration) does not discriminate in iso-topic differences of water. Delta 18O (δ sample) is defi ned below where 18O/16O is the isotopic ratio of H2
18O to H216O
in the water sample or standard mean ocean water (SMOW).
18O/16O sample – 18O/16O SMOW
18O/16O SMOW
sample =
S. Grattan, C. Grieve, J. Poss, and D. SuarezDoes Saline Drainage Water Affect Crop Tolerance to Boron?
23
Therefore if a system lost water by transpiration only, the reservoirs isotopic signature would not change as the reservoirs lost water. On the other hand, if evaporation occurs, the solution will become more enriched in H2
18O. These measurements were done so that crop growth and ion accumulation can be expressed rela-tive to consumptive water use (T) and that comparisons can be made to the total water consumed by the crop and the total boron absorbed by the crop (mg/plant) relative to its potential if truly a passive process (i.e. cumula-tive transpiration time solution boron concentration). This is an important component of the study since B uptake is thought to occur passively by plants and its distribution follows the transpi-ration stream (Marschner, 1995).
The irrigation treatments consisted of three salinity levels representing non-saline (1.5 dS/m), moderately saline (11dS/m) and saline (18 dS/m) conditions. Based on sand-water (ECsw)- ECe relations described above, these saline treatments translate into average rootzone salinities (ECe) of 0.7, 5.0 and 8.2 dS/m. Each salinity level was comprised of either 1) chloride dominated salts or 2) synthetic saline drainage water with an ion composition typical to that found in shallow, saline water tables in the western SJV. The compositions of each saline treatment are presented in Table 1. The SJV salt solutions were prepared from predictions based on appropriate simulations (Suarez and Simunek, 1997). Each of these treatments had three boron concentrations ranging from very low, such as that found in solution cultures (i.e. 0.23-0.5 mg/L), high (14 mg/L) and very high B concentrations (28 mg/L ). The pH of the solutions was maintained between (5.7 and 6.7) using additions of sulfuric acid.
Broccoli was planted on 4 February, 2003 and salinization began 16 days later when plants had approximately two leaves. Several plants were periodically harvested from each tank for biomass and ion accumulation.
Broccoli was fi rst harvested on March 28th and again on April 24th. On April 24th, total shoot biomass was determined and plants were divided into leaf blades, leaf margins, and petioles. The remainder of the plants were harvested at maturity on May 21st (90 days after saliniization). Broccoli shoots were divided into heads, stems, young leaves (most fully expanded leaf and younger), and old leaves (all remaining leaves). Immature heads, from salt-stressed treatments, were given the opportunity to mature and these heads were harvested on May 29th. Fresh and dry weight measurements were made on all harvested biomass. Tissue ion concentrations (e.g. B, Na, Ca, Mg, Cl, K and S) were determined on total shoots and various organs from the April 24th harvest and will be determined on the various organs of the crop at fi nal harvest. ANOVA and surface regression model analysis were performed on the data.
Remote sensing was used to characterize treatment effects on broccoli visual injury and to quantify specifi c refl ectance data. The leaf normalized difference vegetative index (NDVI) has been used in many studies to quantify remotely sensed refl ectance data. Primarily it has been related to chlorophyll concentration and photosynthetically active leaf area (Broge and Leblanc, 2000, Gamon and Surfus, 1999). For example, elephant grass exposed to salinity had reduced total chlorophyll content on a per plant basis and was proportional to a remotely determined single ratio vegetation index (SRVI). The salinity stress reduced the SRVI primarily by reducing refl ectance in the near-infrared spectrum region (Wang, et al., 2002).
Leaf refl ectance of the lower leaves in the canopy was measured near the initial development of the broccoli heads on March 15th, 2003. Percent refl ectance after an optimization and calibration procedure every other measurement was obtained with an Analytical
Spectral Devices™, FieldSpec Pro JR fi tted with a High Intensity Contact Probe Model A122300 using a 4.25 VDC 4W refl ectorized bulb. The portable instrument is a fast scanning spectroradiometer covering the 350nm to 2500nm region. The spectral resolution is 3nm at 700nm and 10nm at 1400 nm and 2100 nm. The 1.5- meter fi ber optic input was adapted with the contact probe and light source.
Leaf refl ectance NDVI was calculated as:
where R is the refl ectance at the specifi ed spectral region (nm) of interest.
Two other indices were also calcu-lated from the spot probe leaf spectra. The Derivative chlorophyll Index (Zarco-Tejada et al., 2002), is defi ned as the ratio of the derivative of the refl ec-tance at 705 nm to the derivative of the refl ectance at 722nm and is reported to be indicative of the chlorophyll con-tent in plant leaves. The third index applied to this experiment was the pseudo-absorbance red-edge position index ,REPabs (Rinehart et al, 2002) which is reported to be a general stress indicator were also calculated.
RESULTS AND DISCUSSIONBIOMASS
Shoot biomass data indicate that both increased salinity and boron reduced shoot growth. There were no signifi cant effects regarding the com-position of the salt. Therefore Cl based salts behaved similarly to SJV-type salts. However, there was a signifi cant salinity-B interaction. At low B con-centration, increased salinity reduced biomass relatively more than it did at high B. Similarly, at low salinity, increased B was far more damaging than it was at high salinity. The pre-dicted three-dimensional surface plot is shown in Figure 1. Therefore these data indicate that broccoli is more tolerant to boron in the presence of salinity sug-
NDVI =(R745:755 – R700:710)
(R745:755 + R700:710)
S. Grattan, C. Grieve, J. Poss, and D. SuarezDoes Saline Drainage Water Affect Crop Tolerance to Boron?
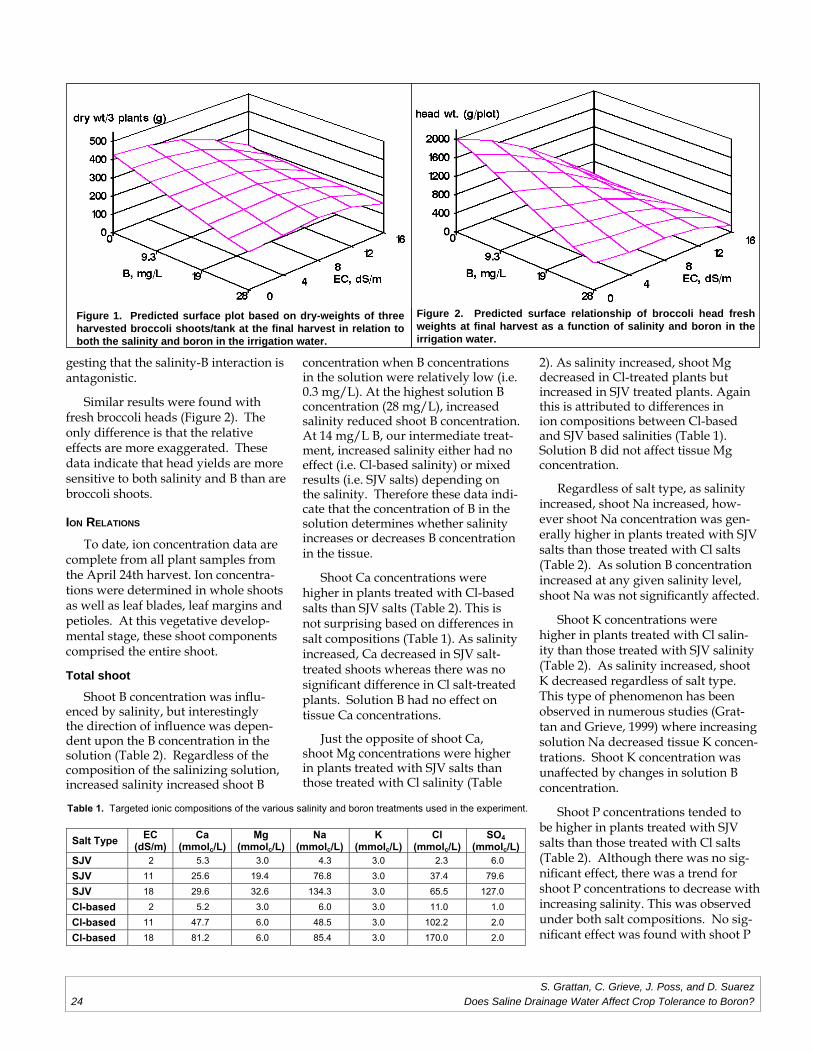
24
gesting that the salinity-B interaction is antagonistic.
Similar results were found with fresh broccoli heads (Figure 2). The only difference is that the relative effects are more exaggerated. These data indicate that head yields are more sensitive to both salinity and B than are broccoli shoots.
ION RELATIONS
To date, ion concentration data are complete from all plant samples from the April 24th harvest. Ion concentra-tions were determined in whole shoots as well as leaf blades, leaf margins and petioles. At this vegetative develop-mental stage, these shoot components comprised the entire shoot.
Total shoot
Shoot B concentration was infl u-enced by salinity, but interestingly the direction of infl uence was depen-dent upon the B concentration in the solution (Table 2). Regardless of the composition of the salinizing solution, increased salinity increased shoot B
concentration when B concentrations in the solution were relatively low (i.e. 0.3 mg/L). At the highest solution B concentration (28 mg/L), increased salinity reduced shoot B concentration. At 14 mg/L B, our intermediate treat-ment, increased salinity either had no effect (i.e. Cl-based salinity) or mixed results (i.e. SJV salts) depending on the salinity. Therefore these data indi-cate that the concentration of B in the solution determines whether salinity increases or decreases B concentration in the tissue.
Shoot Ca concentrations were higher in plants treated with Cl-based salts than SJV salts (Table 2). This is not surprising based on differences in salt compositions (Table 1). As salinity increased, Ca decreased in SJV salt-treated shoots whereas there was no signifi cant difference in Cl salt-treated plants. Solution B had no effect on tissue Ca concentrations.
Just the opposite of shoot Ca, shoot Mg concentrations were higher in plants treated with SJV salts than those treated with Cl salinity (Table
2). As salinity increased, shoot Mg decreased in Cl-treated plants but increased in SJV treated plants. Again this is attributed to differences in ion compositions between Cl-based and SJV based salinities (Table 1). Solution B did not affect tissue Mg concentration.
Regardless of salt type, as salinity increased, shoot Na increased, how-ever shoot Na concentration was gen-erally higher in plants treated with SJV salts than those treated with Cl salts (Table 2). As solution B concentration increased at any given salinity level, shoot Na was not signifi cantly affected.
Shoot K concentrations were higher in plants treated with Cl salin-ity than those treated with SJV salinity (Table 2). As salinity increased, shoot K decreased regardless of salt type. This type of phenomenon has been observed in numerous studies (Grat-tan and Grieve, 1999) where increasing solution Na decreased tissue K concen-trations. Shoot K concentration was unaffected by changes in solution B concentration.
Shoot P concentrations tended to be higher in plants treated with SJV salts than those treated with Cl salts (Table 2). Although there was no sig-nifi cant effect, there was a trend for shoot P concentrations to decrease with increasing salinity. This was observed under both salt compositions. No sig-nifi cant effect was found with shoot P
Table 1. Targeted ionic compositions of the various salinity and boron treatments used in the experiment.
Salt Type EC(dS/m)
Ca(mmolc/L)
Mg(mmolc/L)
Na(mmolc/L)
K(mmolc/L)
Cl(mmolc/L)
SO4
(mmolc/L)SJV 2 5.3 3.0 4.3 3.0 2.3 6.0
SJV 11 25.6 19.4 76.8 3.0 37.4 79.6
SJV 18 29.6 32.6 134.3 3.0 65.5 127.0
Cl-based 2 5.2 3.0 6.0 3.0 11.0 1.0
Cl-based 11 47.7 6.0 48.5 3.0 102.2 2.0
Cl-based 18 81.2 6.0 85.4 3.0 170.0 2.0
S. Grattan, C. Grieve, J. Poss, and D. SuarezDoes Saline Drainage Water Affect Crop Tolerance to Boron?
Figure 1. Predicted surface plot based on dry-weights of three harvested broccoli shoots/tank at the fi nal harvest in relation to both the salinity and boron in the irrigation water.
Figure 2. Predicted surface relationship of broccoli head fresh weights at fi nal harvest as a function of salinity and boron in the irrigation water.
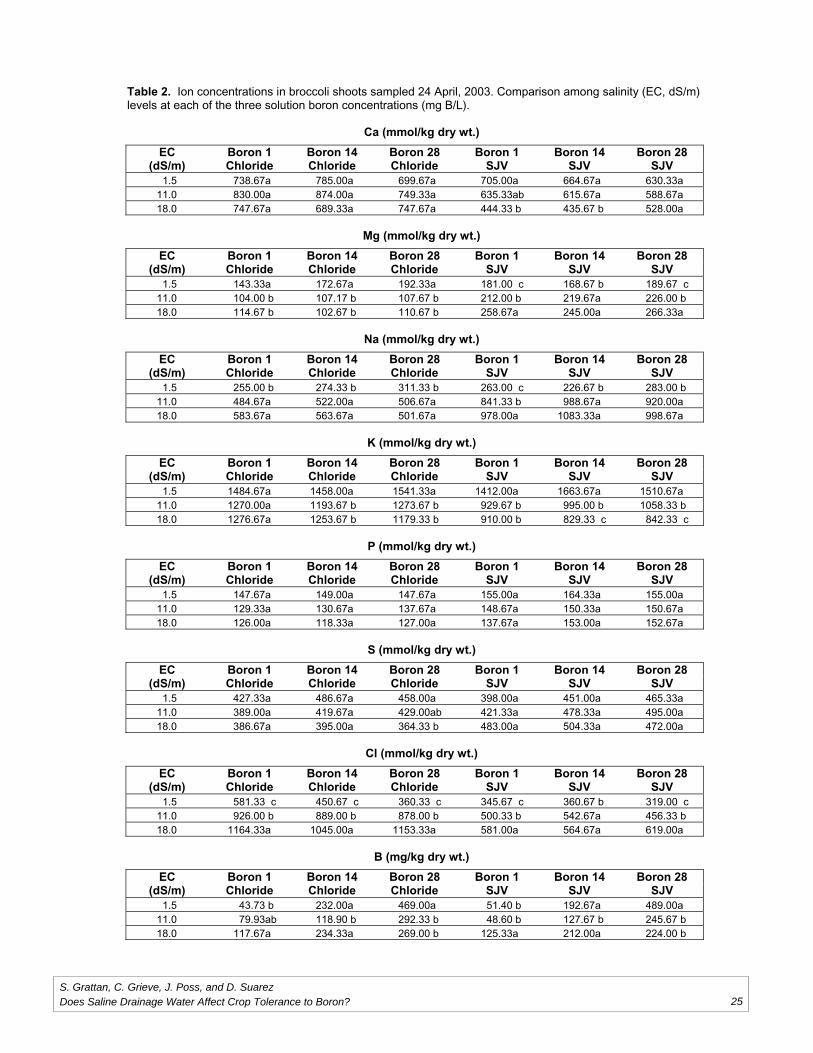
25
Table 2. Ion concentrations in broccoli shoots sampled 24 April, 2003. Comparison among salinity (EC, dS/m) levels at each of the three solution boron concentrations (mg B/L).
Ca (mmol/kg dry wt.)
EC Boron 1 Boron 14 Boron 28 Boron 1 Boron 14 Boron 28 (dS/m) Chloride Chloride Chloride SJV SJV SJV
1.5 738.67a 785.00a 699.67a 705.00a 664.67a 630.33a11.0 830.00a 874.00a 749.33a 635.33ab 615.67a 588.67a18.0 747.67a 689.33a 747.67a 444.33 b 435.67 b 528.00a
Mg (mmol/kg dry wt.)
EC Boron 1 Boron 14 Boron 28 Boron 1 Boron 14 Boron 28 (dS/m) Chloride Chloride Chloride SJV SJV SJV
1.5 143.33a 172.67a 192.33a 181.00 c 168.67 b 189.67 c 11.0 104.00 b 107.17 b 107.67 b 212.00 b 219.67a 226.00 b 18.0 114.67 b 102.67 b 110.67 b 258.67a 245.00a 266.33a
Na (mmol/kg dry wt.)
EC Boron 1 Boron 14 Boron 28 Boron 1 Boron 14 Boron 28 (dS/m) Chloride Chloride Chloride SJV SJV SJV
1.5 255.00 b 274.33 b 311.33 b 263.00 c 226.67 b 283.00 b 11.0 484.67a 522.00a 506.67a 841.33 b 988.67a 920.00a18.0 583.67a 563.67a 501.67a 978.00a 1083.33a 998.67a
K (mmol/kg dry wt.)
EC Boron 1 Boron 14 Boron 28 Boron 1 Boron 14 Boron 28 (dS/m) Chloride Chloride Chloride SJV SJV SJV
1.5 1484.67a 1458.00a 1541.33a 1412.00a 1663.67a 1510.67a11.0 1270.00a 1193.67 b 1273.67 b 929.67 b 995.00 b 1058.33 b 18.0 1276.67a 1253.67 b 1179.33 b 910.00 b 829.33 c 842.33 c
P (mmol/kg dry wt.)
EC Boron 1 Boron 14 Boron 28 Boron 1 Boron 14 Boron 28 (dS/m) Chloride Chloride Chloride SJV SJV SJV
1.5 147.67a 149.00a 147.67a 155.00a 164.33a 155.00a11.0 129.33a 130.67a 137.67a 148.67a 150.33a 150.67a18.0 126.00a 118.33a 127.00a 137.67a 153.00a 152.67a
S (mmol/kg dry wt.)
EC Boron 1 Boron 14 Boron 28 Boron 1 Boron 14 Boron 28 (dS/m) Chloride Chloride Chloride SJV SJV SJV
1.5 427.33a 486.67a 458.00a 398.00a 451.00a 465.33a11.0 389.00a 419.67a 429.00ab 421.33a 478.33a 495.00a18.0 386.67a 395.00a 364.33 b 483.00a 504.33a 472.00a
Cl (mmol/kg dry wt.)
EC Boron 1 Boron 14 Boron 28 Boron 1 Boron 14 Boron 28 (dS/m) Chloride Chloride Chloride SJV SJV SJV
1.5 581.33 c 450.67 c 360.33 c 345.67 c 360.67 b 319.00 c 11.0 926.00 b 889.00 b 878.00 b 500.33 b 542.67a 456.33 b 18.0 1164.33a 1045.00a 1153.33a 581.00a 564.67a 619.00a
B (mg/kg dry wt.)
EC Boron 1 Boron 14 Boron 28 Boron 1 Boron 14 Boron 28 (dS/m) Chloride Chloride Chloride SJV SJV SJV
1.5 43.73 b 232.00a 469.00a 51.40 b 192.67a 489.00a11.0 79.93ab 118.90 b 292.33 b 48.60 b 127.67 b 245.67 b 18.0 117.67a 234.33a 269.00 b 125.33a 212.00a 224.00 b
S. Grattan, C. Grieve, J. Poss, and D. SuarezDoes Saline Drainage Water Affect Crop Tolerance to Boron?
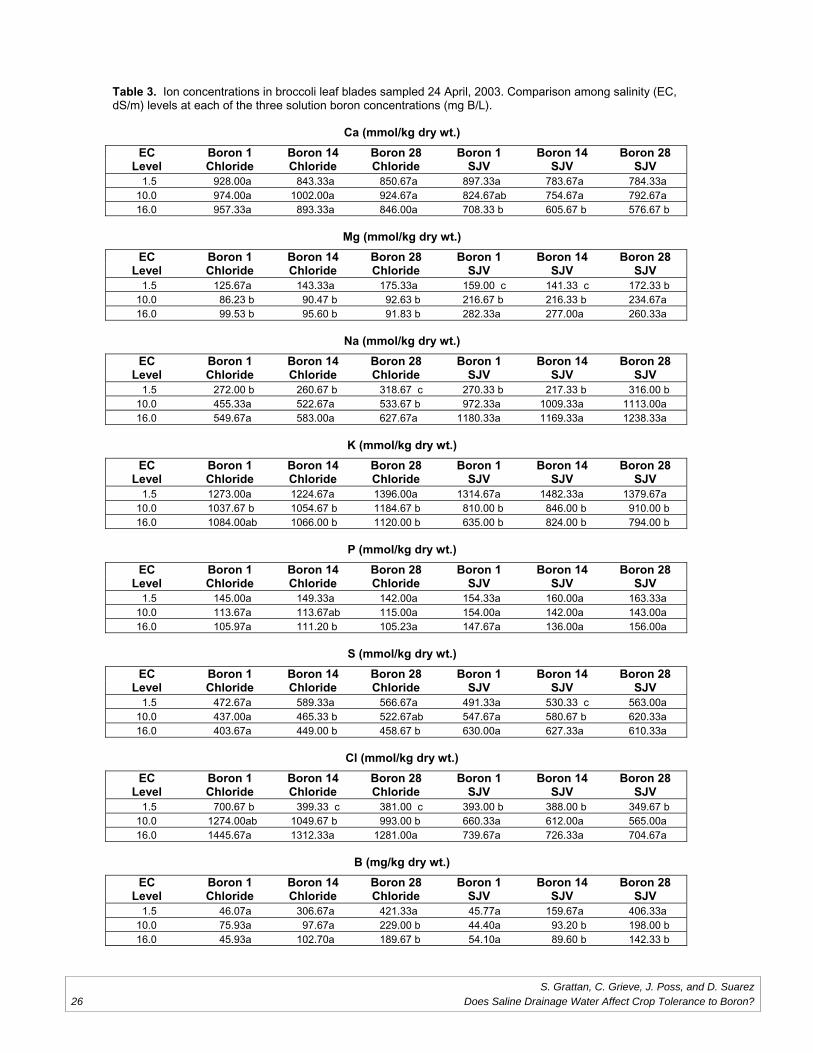
26
Table 3. Ion concentrations in broccoli leaf blades sampled 24 April, 2003. Comparison among salinity (EC, dS/m) levels at each of the three solution boron concentrations (mg B/L).
Ca (mmol/kg dry wt.)
EC Boron 1 Boron 14 Boron 28 Boron 1 Boron 14 Boron 28 Level Chloride Chloride Chloride SJV SJV SJV
1.5 928.00a 843.33a 850.67a 897.33a 783.67a 784.33a10.0 974.00a 1002.00a 924.67a 824.67ab 754.67a 792.67a16.0 957.33a 893.33a 846.00a 708.33 b 605.67 b 576.67 b
Mg (mmol/kg dry wt.)
EC Boron 1 Boron 14 Boron 28 Boron 1 Boron 14 Boron 28 Level Chloride Chloride Chloride SJV SJV SJV
1.5 125.67a 143.33a 175.33a 159.00 c 141.33 c 172.33 b 10.0 86.23 b 90.47 b 92.63 b 216.67 b 216.33 b 234.67a16.0 99.53 b 95.60 b 91.83 b 282.33a 277.00a 260.33a
Na (mmol/kg dry wt.)
EC Boron 1 Boron 14 Boron 28 Boron 1 Boron 14 Boron 28 Level Chloride Chloride Chloride SJV SJV SJV
1.5 272.00 b 260.67 b 318.67 c 270.33 b 217.33 b 316.00 b 10.0 455.33a 522.67a 533.67 b 972.33a 1009.33a 1113.00a16.0 549.67a 583.00a 627.67a 1180.33a 1169.33a 1238.33a
K (mmol/kg dry wt.)
EC Boron 1 Boron 14 Boron 28 Boron 1 Boron 14 Boron 28 Level Chloride Chloride Chloride SJV SJV SJV
1.5 1273.00a 1224.67a 1396.00a 1314.67a 1482.33a 1379.67a10.0 1037.67 b 1054.67 b 1184.67 b 810.00 b 846.00 b 910.00 b 16.0 1084.00ab 1066.00 b 1120.00 b 635.00 b 824.00 b 794.00 b
P (mmol/kg dry wt.)
EC Boron 1 Boron 14 Boron 28 Boron 1 Boron 14 Boron 28 Level Chloride Chloride Chloride SJV SJV SJV
1.5 145.00a 149.33a 142.00a 154.33a 160.00a 163.33a10.0 113.67a 113.67ab 115.00a 154.00a 142.00a 143.00a16.0 105.97a 111.20 b 105.23a 147.67a 136.00a 156.00a
S (mmol/kg dry wt.)
EC Boron 1 Boron 14 Boron 28 Boron 1 Boron 14 Boron 28 Level Chloride Chloride Chloride SJV SJV SJV
1.5 472.67a 589.33a 566.67a 491.33a 530.33 c 563.00a10.0 437.00a 465.33 b 522.67ab 547.67a 580.67 b 620.33a16.0 403.67a 449.00 b 458.67 b 630.00a 627.33a 610.33a
Cl (mmol/kg dry wt.)
EC Boron 1 Boron 14 Boron 28 Boron 1 Boron 14 Boron 28 Level Chloride Chloride Chloride SJV SJV SJV
1.5 700.67 b 399.33 c 381.00 c 393.00 b 388.00 b 349.67 b 10.0 1274.00ab 1049.67 b 993.00 b 660.33a 612.00a 565.00a16.0 1445.67a 1312.33a 1281.00a 739.67a 726.33a 704.67a
B (mg/kg dry wt.)
EC Boron 1 Boron 14 Boron 28 Boron 1 Boron 14 Boron 28 Level Chloride Chloride Chloride SJV SJV SJV
1.5 46.07a 306.67a 421.33a 45.77a 159.67a 406.33a10.0 75.93a 97.67a 229.00 b 44.40a 93.20 b 198.00 b 16.0 45.93a 102.70a 189.67 b 54.10a 89.60 b 142.33 b
S. Grattan, C. Grieve, J. Poss, and D. SuarezDoes Saline Drainage Water Affect Crop Tolerance to Boron?
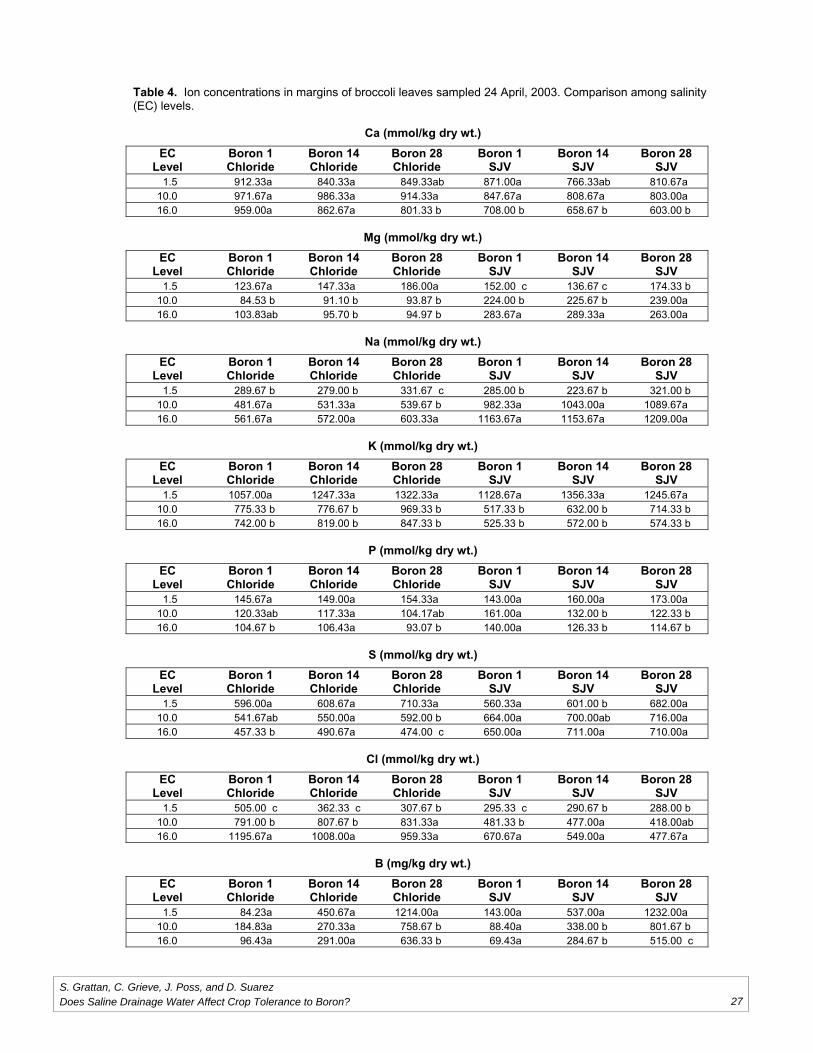
27
Table 4. Ion concentrations in margins of broccoli leaves sampled 24 April, 2003. Comparison among salinity (EC) levels.
Ca (mmol/kg dry wt.)
EC Boron 1 Boron 14 Boron 28 Boron 1 Boron 14 Boron 28 Level Chloride Chloride Chloride SJV SJV SJV
1.5 912.33a 840.33a 849.33ab 871.00a 766.33ab 810.67a10.0 971.67a 986.33a 914.33a 847.67a 808.67a 803.00a16.0 959.00a 862.67a 801.33 b 708.00 b 658.67 b 603.00 b
Mg (mmol/kg dry wt.)
EC Boron 1 Boron 14 Boron 28 Boron 1 Boron 14 Boron 28 Level Chloride Chloride Chloride SJV SJV SJV
1.5 123.67a 147.33a 186.00a 152.00 c 136.67 c 174.33 b 10.0 84.53 b 91.10 b 93.87 b 224.00 b 225.67 b 239.00a16.0 103.83ab 95.70 b 94.97 b 283.67a 289.33a 263.00a
Na (mmol/kg dry wt.)
EC Boron 1 Boron 14 Boron 28 Boron 1 Boron 14 Boron 28 Level Chloride Chloride Chloride SJV SJV SJV
1.5 289.67 b 279.00 b 331.67 c 285.00 b 223.67 b 321.00 b 10.0 481.67a 531.33a 539.67 b 982.33a 1043.00a 1089.67a16.0 561.67a 572.00a 603.33a 1163.67a 1153.67a 1209.00a
K (mmol/kg dry wt.)
EC Boron 1 Boron 14 Boron 28 Boron 1 Boron 14 Boron 28 Level Chloride Chloride Chloride SJV SJV SJV
1.5 1057.00a 1247.33a 1322.33a 1128.67a 1356.33a 1245.67a10.0 775.33 b 776.67 b 969.33 b 517.33 b 632.00 b 714.33 b 16.0 742.00 b 819.00 b 847.33 b 525.33 b 572.00 b 574.33 b
P (mmol/kg dry wt.)
EC Boron 1 Boron 14 Boron 28 Boron 1 Boron 14 Boron 28 Level Chloride Chloride Chloride SJV SJV SJV
1.5 145.67a 149.00a 154.33a 143.00a 160.00a 173.00a10.0 120.33ab 117.33a 104.17ab 161.00a 132.00 b 122.33 b 16.0 104.67 b 106.43a 93.07 b 140.00a 126.33 b 114.67 b
S (mmol/kg dry wt.)
EC Boron 1 Boron 14 Boron 28 Boron 1 Boron 14 Boron 28 Level Chloride Chloride Chloride SJV SJV SJV
1.5 596.00a 608.67a 710.33a 560.33a 601.00 b 682.00a10.0 541.67ab 550.00a 592.00 b 664.00a 700.00ab 716.00a16.0 457.33 b 490.67a 474.00 c 650.00a 711.00a 710.00a
Cl (mmol/kg dry wt.)
EC Boron 1 Boron 14 Boron 28 Boron 1 Boron 14 Boron 28 Level Chloride Chloride Chloride SJV SJV SJV
1.5 505.00 c 362.33 c 307.67 b 295.33 c 290.67 b 288.00 b 10.0 791.00 b 807.67 b 831.33a 481.33 b 477.00a 418.00ab16.0 1195.67a 1008.00a 959.33a 670.67a 549.00a 477.67a
B (mg/kg dry wt.)
EC Boron 1 Boron 14 Boron 28 Boron 1 Boron 14 Boron 28 Level Chloride Chloride Chloride SJV SJV SJV
1.5 84.23a 450.67a 1214.00a 143.00a 537.00a 1232.00a10.0 184.83a 270.33a 758.67 b 88.40a 338.00 b 801.67 b 16.0 96.43a 291.00a 636.33 b 69.43a 284.67 b 515.00 c
S. Grattan, C. Grieve, J. Poss, and D. SuarezDoes Saline Drainage Water Affect Crop Tolerance to Boron?
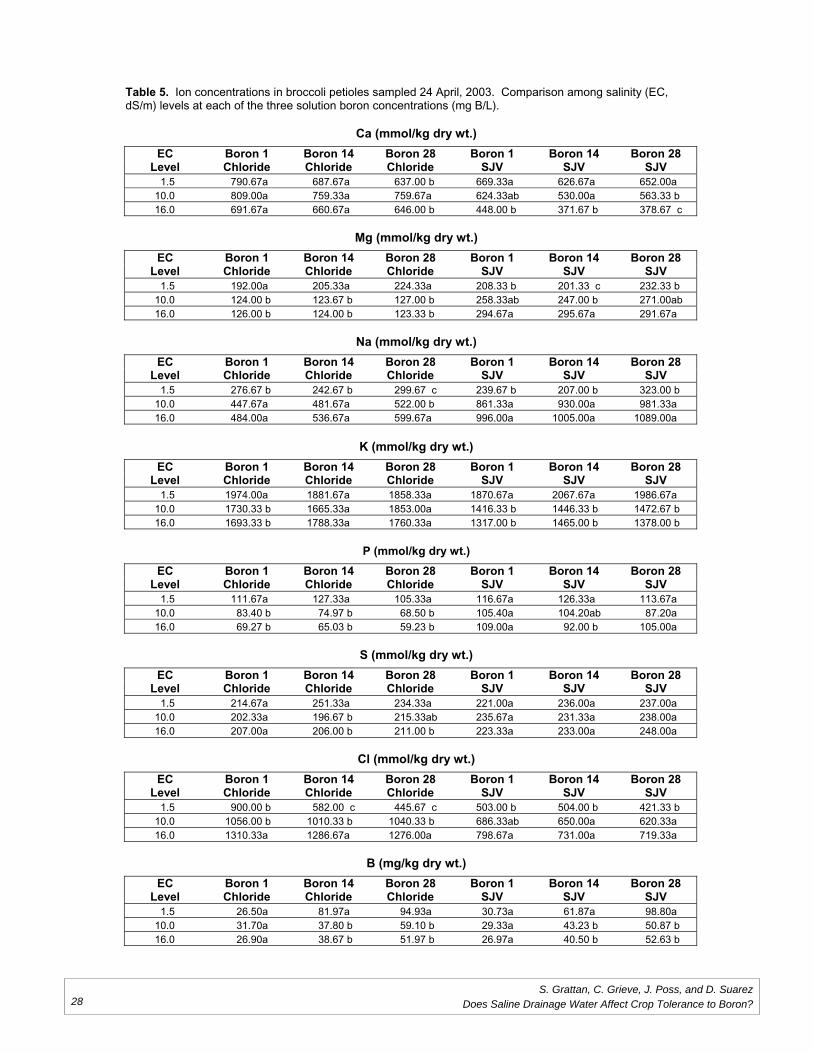
28
Table 5. Ion concentrations in broccoli petioles sampled 24 April, 2003. Comparison among salinity (EC, dS/m) levels at each of the three solution boron concentrations (mg B/L).
Ca (mmol/kg dry wt.)
EC Boron 1 Boron 14 Boron 28 Boron 1 Boron 14 Boron 28 Level Chloride Chloride Chloride SJV SJV SJV
1.5 790.67a 687.67a 637.00 b 669.33a 626.67a 652.00a10.0 809.00a 759.33a 759.67a 624.33ab 530.00a 563.33 b 16.0 691.67a 660.67a 646.00 b 448.00 b 371.67 b 378.67 c
Mg (mmol/kg dry wt.)
EC Boron 1 Boron 14 Boron 28 Boron 1 Boron 14 Boron 28 Level Chloride Chloride Chloride SJV SJV SJV
1.5 192.00a 205.33a 224.33a 208.33 b 201.33 c 232.33 b 10.0 124.00 b 123.67 b 127.00 b 258.33ab 247.00 b 271.00ab16.0 126.00 b 124.00 b 123.33 b 294.67a 295.67a 291.67a
Na (mmol/kg dry wt.)
EC Boron 1 Boron 14 Boron 28 Boron 1 Boron 14 Boron 28 Level Chloride Chloride Chloride SJV SJV SJV
1.5 276.67 b 242.67 b 299.67 c 239.67 b 207.00 b 323.00 b 10.0 447.67a 481.67a 522.00 b 861.33a 930.00a 981.33a16.0 484.00a 536.67a 599.67a 996.00a 1005.00a 1089.00a
K (mmol/kg dry wt.)
EC Boron 1 Boron 14 Boron 28 Boron 1 Boron 14 Boron 28 Level Chloride Chloride Chloride SJV SJV SJV
1.5 1974.00a 1881.67a 1858.33a 1870.67a 2067.67a 1986.67a10.0 1730.33 b 1665.33a 1853.00a 1416.33 b 1446.33 b 1472.67 b16.0 1693.33 b 1788.33a 1760.33a 1317.00 b 1465.00 b 1378.00 b
P (mmol/kg dry wt.)
EC Boron 1 Boron 14 Boron 28 Boron 1 Boron 14 Boron 28 Level Chloride Chloride Chloride SJV SJV SJV
1.5 111.67a 127.33a 105.33a 116.67a 126.33a 113.67a10.0 83.40 b 74.97 b 68.50 b 105.40a 104.20ab 87.20a16.0 69.27 b 65.03 b 59.23 b 109.00a 92.00 b 105.00a
S (mmol/kg dry wt.)
EC Boron 1 Boron 14 Boron 28 Boron 1 Boron 14 Boron 28 Level Chloride Chloride Chloride SJV SJV SJV
1.5 214.67a 251.33a 234.33a 221.00a 236.00a 237.00a10.0 202.33a 196.67 b 215.33ab 235.67a 231.33a 238.00a16.0 207.00a 206.00 b 211.00 b 223.33a 233.00a 248.00a
Cl (mmol/kg dry wt.)
EC Boron 1 Boron 14 Boron 28 Boron 1 Boron 14 Boron 28 Level Chloride Chloride Chloride SJV SJV SJV
1.5 900.00 b 582.00 c 445.67 c 503.00 b 504.00 b 421.33 b 10.0 1056.00 b 1010.33 b 1040.33 b 686.33ab 650.00a 620.33a16.0 1310.33a 1286.67a 1276.00a 798.67a 731.00a 719.33a
B (mg/kg dry wt.)
EC Boron 1 Boron 14 Boron 28 Boron 1 Boron 14 Boron 28 Level Chloride Chloride Chloride SJV SJV SJV
1.5 26.50a 81.97a 94.93a 30.73a 61.87a 98.80a10.0 31.70a 37.80 b 59.10 b 29.33a 43.23 b 50.87 b 16.0 26.90a 38.67 b 51.97 b 26.97a 40.50 b 52.63 b
S. Grattan, C. Grieve, J. Poss, and D. SuarezDoes Saline Drainage Water Affect Crop Tolerance to Boron?
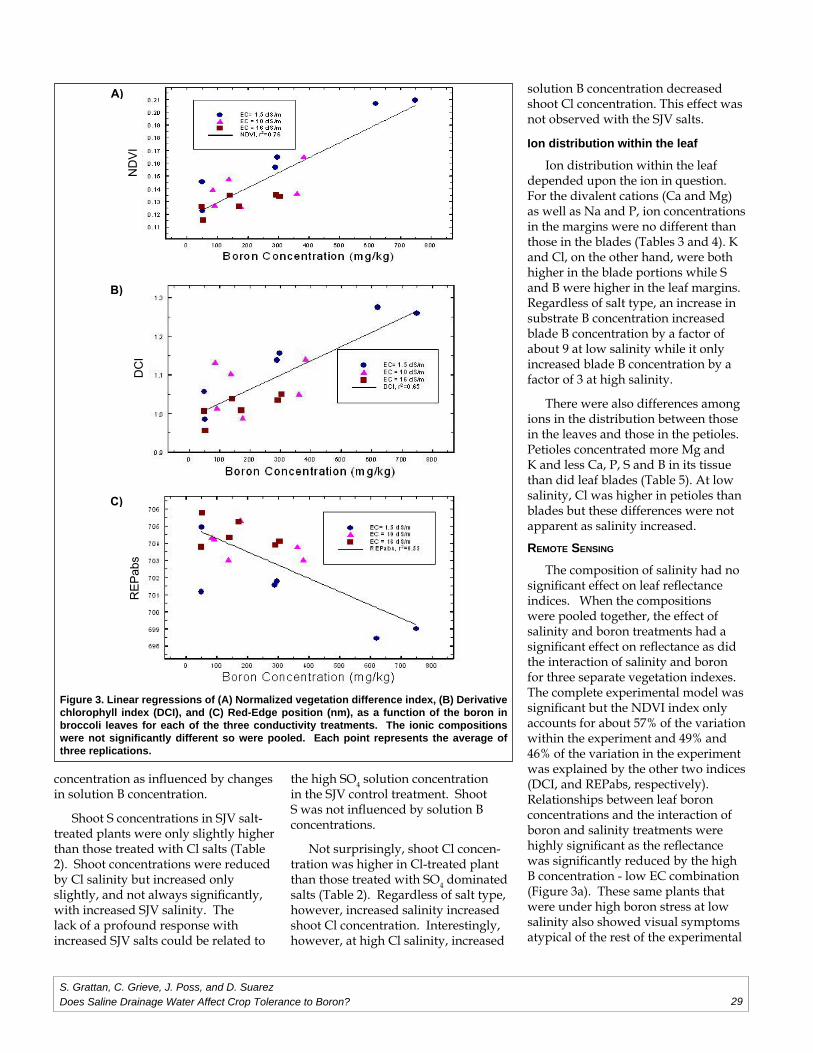
29
concentration as infl uenced by changes in solution B concentration.
Shoot S concentrations in SJV salt-treated plants were only slightly higher than those treated with Cl salts (Table 2). Shoot concentrations were reduced by Cl salinity but increased only slightly, and not always signifi cantly, with increased SJV salinity. The lack of a profound response with increased SJV salts could be related to
the high SO4 solution concentration in the SJV control treatment. Shoot S was not infl uenced by solution B concentrations.
Not surprisingly, shoot Cl concen-tration was higher in Cl-treated plant than those treated with SO4 dominated salts (Table 2). Regardless of salt type, however, increased salinity increased shoot Cl concentration. Interestingly, however, at high Cl salinity, increased
solution B concentration decreased shoot Cl concentration. This effect was not observed with the SJV salts.
Ion distribution within the leaf
Ion distribution within the leaf depended upon the ion in question. For the divalent cations (Ca and Mg) as well as Na and P, ion concentrations in the margins were no different than those in the blades (Tables 3 and 4). K and Cl, on the other hand, were both higher in the blade portions while S and B were higher in the leaf margins. Regardless of salt type, an increase in substrate B concentration increased blade B concentration by a factor of about 9 at low salinity while it only increased blade B concentration by a factor of 3 at high salinity.
There were also differences among ions in the distribution between those in the leaves and those in the petioles. Petioles concentrated more Mg and K and less Ca, P, S and B in its tissue than did leaf blades (Table 5). At low salinity, Cl was higher in petioles than blades but these differences were not apparent as salinity increased.
REMOTE SENSING
The composition of salinity had no signifi cant effect on leaf refl ectance indices. When the compositions were pooled together, the effect of salinity and boron treatments had a signifi cant effect on refl ectance as did the interaction of salinity and boron for three separate vegetation indexes. The complete experimental model was signifi cant but the NDVI index only accounts for about 57% of the variation within the experiment and 49% and 46% of the variation in the experiment was explained by the other two indices (DCI, and REPabs, respectively). Relationships between leaf boron concentrations and the interaction of boron and salinity treatments were highly signifi cant as the refl ectance was signifi cantly reduced by the high B concentration - low EC combination (Figure 3a). These same plants that were under high boron stress at low salinity also showed visual symptoms atypical of the rest of the experimental
S. Grattan, C. Grieve, J. Poss, and D. SuarezDoes Saline Drainage Water Affect Crop Tolerance to Boron?
Figure 3. Linear regressions of (A) Normalized vegetation difference index, (B) Derivative chlorophyll index (DCI), and (C) Red-Edge position (nm), as a function of the boron in broccoli leaves for each of the three conductivity treatments. The ionic compositions were not signifi cantly different so were pooled. Each point represents the average of three replications.
ND
VI
A)
DC
l
B)
RE
Pab
s
C)
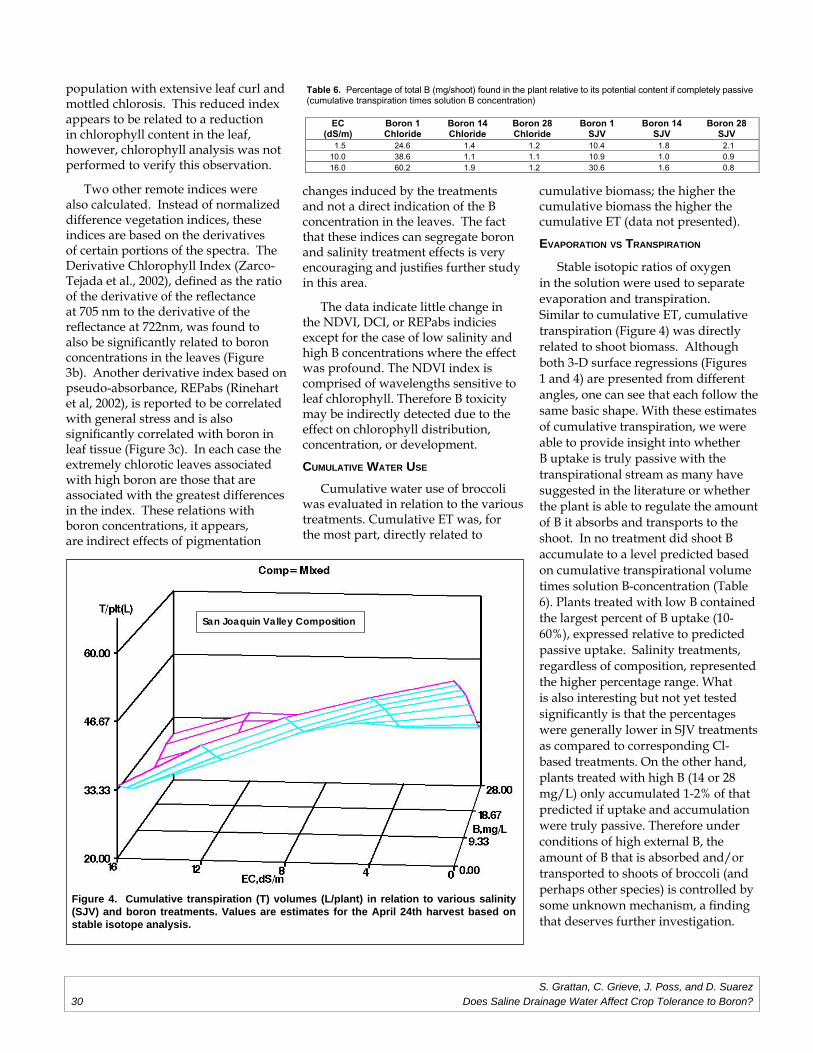
30
population with extensive leaf curl and mottled chlorosis. This reduced index appears to be related to a reduction in chlorophyll content in the leaf, however, chlorophyll analysis was not performed to verify this observation.
Two other remote indices were also calculated. Instead of normalized difference vegetation indices, these indices are based on the derivatives of certain portions of the spectra. The Derivative Chlorophyll Index (Zarco-Tejada et al., 2002), defi ned as the ratio of the derivative of the refl ectance at 705 nm to the derivative of the refl ectance at 722nm, was found to also be signifi cantly related to boron concentrations in the leaves (Figure 3b). Another derivative index based on pseudo-absorbance, REPabs (Rinehart et al, 2002), is reported to be correlated with general stress and is also signifi cantly correlated with boron in leaf tissue (Figure 3c). In each case the extremely chlorotic leaves associated with high boron are those that are associated with the greatest differences in the index. These relations with boron concentrations, it appears, are indirect effects of pigmentation
changes induced by the treatments and not a direct indication of the B concentration in the leaves. The fact that these indices can segregate boron and salinity treatment effects is very encouraging and justifi es further study in this area.
The data indicate little change in the NDVI, DCI, or REPabs indicies except for the case of low salinity and high B concentrations where the effect was profound. The NDVI index is comprised of wavelengths sensitive to leaf chlorophyll. Therefore B toxicity may be indirectly detected due to the effect on chlorophyll distribution, concentration, or development.
CUMULATIVE WATER USE
Cumulative water use of broccoli was evaluated in relation to the various treatments. Cumulative ET was, for the most part, directly related to
cumulative biomass; the higher the cumulative biomass the higher the cumulative ET (data not presented).
EVAPORATION VS TRANSPIRATION
Stable isotopic ratios of oxygen in the solution were used to separate evaporation and transpiration. Similar to cumulative ET, cumulative transpiration (Figure 4) was directly related to shoot biomass. Although both 3-D surface regressions (Figures 1 and 4) are presented from different angles, one can see that each follow the same basic shape. With these estimates of cumulative transpiration, we were able to provide insight into whether B uptake is truly passive with the transpirational stream as many have suggested in the literature or whether the plant is able to regulate the amount of B it absorbs and transports to the shoot. In no treatment did shoot B accumulate to a level predicted based on cumulative transpirational volume times solution B-concentration (Table 6). Plants treated with low B contained the largest percent of B uptake (10-60%), expressed relative to predicted passive uptake. Salinity treatments, regardless of composition, represented the higher percentage range. What is also interesting but not yet tested signifi cantly is that the percentages were generally lower in SJV treatments as compared to corresponding Cl-based treatments. On the other hand, plants treated with high B (14 or 28 mg/L) only accumulated 1-2% of that predicted if uptake and accumulation were truly passive. Therefore under conditions of high external B, the amount of B that is absorbed and/or transported to shoots of broccoli (and perhaps other species) is controlled by some unknown mechanism, a fi nding that deserves further investigation.
Table 6. Percentage of total B (mg/shoot) found in the plant relative to its potential content if completely passive (cumulative transpiration times solution B concentration)
EC Boron 1 Boron 14 Boron 28 Boron 1 Boron 14 Boron 28 (dS/m) Chloride Chloride Chloride SJV SJV SJV
1.5 24.6 1.4 1.2 10.4 1.8 2.110.0 38.6 1.1 1.1 10.9 1.0 0.916.0 60.2 1.9 1.2 30.6 1.6 0.8
S. Grattan, C. Grieve, J. Poss, and D. SuarezDoes Saline Drainage Water Affect Crop Tolerance to Boron?
San Joaquin Valley Composition
Figure 4. Cumulative transpiration (T) volumes (L/plant) in relation to various salinity (SJV) and boron treatments. Values are estimates for the April 24th harvest based on stable isotope analysis.
31
REFERENCES
Alpaslan, M. and A. Gunes. 2001. Interactive effects of boron and salinity stress on the growth, membrane permeability and mineral composition of tomato and cucumber plants. Plant Soil 236: 123-128
Bingham, F.T., Strong, J. E., Rhoades, J. D. and Keren, R., 1987. Effects of salinity and varying boron concentrations on boron uptake and growth of wheat. Plant Soil 97: 345-351.
Broge, N. H. and Leblanc, E. 2000. Comparing prediction power and stability of broadband and hyperspectral vegetation indices for estimation of green leaf area index and canopy chlorophyll density. Remote Sens. Environ: 76:156-172
Brown, P.H., and B.J. Shelp. 1997. Boron mobility in plants. Plant Soil 193: 85-101.
Eaton, F.M. 1944. Deficiency, toxicity, and accumulation of boron in plants. J. Agric. Res. 69:237-277.
El-Motaium, R., Hu, H. and Brown, P. H., 1994. The relative tolerance of six Prunus rootstocks to boron and salinity. J. Amer. Soc. Hort. Sci 119: 1169-1175.
Ferreyra, R.E., A.U. Alijaro, R.S. Ruiz, L.P. Rojas and J.D. Oster. 1997. Behavior of 42 crop species grown in saline soils with high boron concentrations. Agric. Water Manag 32:111-124.
Ferguson, L., J.A. Poss, S.R. Grattan, C.M. Grieve, D. Wang, C. Wilson, T.J. Donovan, and C.T. Chao. 2002. Pistachio rootstocks influence scion growth and ion relations under salinity and boron stress. J. Am. Soc. Hort. Sci. 127:194-199
Gamon, J. A., and Surfus, J. S. 1999. Assessing leaf pigment content activity with a reflectometer. New Phytologist. 143:105-117.
Grattan, S.R., S.E. Benes, D.W. Peters, J.P. Mitchell and WK Thomas. 1998. Growth, quality, and water relations of the halophyte Salicornia bigelovii grown with hyper-saline San Joaquin Valley Drainage Water. San Joaquin pistachios. 1997-98 Technical Progess Report: UC Salinity/Drainage Research Program. DANR. University of California. pp 16-29
Grattan, S.R. and C.M. Grieve. 1999. Salinity – mineral nutrient relations in horticultural crops. Sci. Hort. 78: 127-157.
Grattan, S.R., Shannon, M. C., Grieve, C. M., Poss, J. A., Suarez, D. L. and Francois, L. E. 1996. Interactive effects of salinity and boron on the performance and water use of eucalyptus. Acta Hort. 449:607-613
Grieve, C.M. and J.P. Poss. 2000. Wheat response to interactive effects of boron and salinity. J. Plant Nutr. 23: 1217-1226.
Gupta, U.C., Jame, Y. W., Campbell, C. A., Leyshon, A. J. and Nicholaichuk, W., 1985. Boron toxicity and deficiency: A review. Can. J. Soil Sci. 65: 381-409.
Holloway, R.E., and A.M. Alston. 1992. The effects of salt and boron on growth of wheat. Aust. J. Agric. Res., 43:987-1001.
Hu, H. and P.H. Brown. 1997. Absorption of boron by plant roots. Plant Soil 193: 49-58.
Lauchli, A., M.A. Wimmer, K.H. Muehling, P.H. Brown, and H.E. Goldbach. 2001. Interaction of salinity and boron toxicity: The significance of boron partitioning. Am. Soc. Plant Biologists (ASPB). Annual conference. July 21-25 Rhode Island.
Letey, J., S. Grattan and J. Oster. 2001. Findings and recommendations to develop the six-year activity plan for the Department’s drainage reduction and reuse program. Task Order 5. Final Report Submitted to the California State Department of Water Resources Contract # 98-7200-B80933 156 pp.
Maas, E. V. and S. R. Grattan. 1999. Crop yields as affected by salinity. In: Agricultural Drainage, Agronomy Monograph 38. (R. W. Skaggs and J. vanSchilfgaard, eds.) Am. Soc. Agron., Madison, WI.
Marschner, H. 1995. Mineral nutrition of higher plants. Second Edition. Academic Press. London pp 395-396.
Mikkelsen, R.L., B.H. Haghnia, A.L. Page, and F.T. Bingham. 1988. The influence of selenium, salinity and boron on alfalfa tissue composition and yield. J. Environ. Qual. 17:85-88.
Nable ,R.O., G.S. Bañuelos and J.G. Paull. 1997. Boron toxicity. Plant Soil, 193:181-198.
Rinehart, G. J., J. H. Baird, R. N. Calhoun, and O. Schabbenberger. 2002. Remote sensing of brown patch and dollar spont on creepng bentgrass and annual bluegrass turf using visible and near-infrared spectroscopy. Australian Turfgrass Management Vol. 4.2 (April-May)
San Joaquin Valley Drainage Implementation Program. 2000. Evaluation of the 1990 Drainage Management Plan for the Westside San Joaquin Valley, California. Final Report submitted to the Management Group of the San Joaquin Valley Drainage Implementation Program (SJVDIP).
S. Grattan, C. Grieve, J. Poss, and D. SuarezDoes Saline Drainage Water Affect Crop Tolerance to Boron?
32
January, 2000. SJVDIP and University of California Ad Hoc Coordination Committee 87pp
Shani, U., and R.J. Hanks. 1993. Model of integrated effects of boron, inert salt, and water flow on crop yield. Agron. J. 85:713-717.
Suarez, D.L. and J. Simunek, 1997. UNSATCHEM: Unsaturated water and solute transport model with equilibrium and kinetic chemistry. Soil Sci. Soc. Am. J. 61:1633-1646.
Wang, D. 2002. Dynamics of soil water and temperatures in above ground sand cultures used for screening plant salt tolerance. Soil Sci. Soc. Am. J. 66:1484-1491.
Wang, D., J. A. Poss, T. J. Donovan, M. C. Shannon, and S. M. Lesch. 2002. Biophysical properties and biomass production of elephant grass under saline conditions. Journal of Arid Environments. 52:447-456.
Wimmer, M. A., K.H. Muhling, A. Lauchli, P.H. Brown, and H.E. Goldbach. 2003. The interaction between salinity and boron toxicity affects the subcellular distribution of ions and proteins in wheat leaves. Plant, Cell Envrion. 26: 1267
Yadav, H. D., O. P.Yadav, O. P. Dhankar, and M. C. Oswal. 1989. Effect of chloride salinity and boron on germination,
S. Grattan, C. Grieve, J. Poss, and D. SuarezDoes Saline Drainage Water Affect Crop Tolerance to Boron?

33
Integrated Drainwater Management In the Central Valley: A Regional Analysis of
Irrigated Agriculture
Project Investigators:
Kurt A. SchwabeOffi ce: 951/827-2361, E-mail: [email protected]
Department of Environmental SciencesUniversity of California, Riverside
Keith KnappOffi ce: 951/827-4195, E-mail: [email protected]
Department of Environmental SciencesUniversity of California, Riverside
Research Staff:
Phyllis Nash, Statistician
34
ABSTRACTThis research evaluates the effi cien-
cy of alternative management strate-gies towards maintaining agricultural productivity under various drainage constraints, economic considerations, and biophysical characteristics. A variety of strategies can be imple-mented in response to the closed basin restriction, including source control (e.g., changing crop mix or changing irrigation technology or intensity), reuse of drainage water on salt-tolerant crops, and drainage into an evapora-tion pond. Empirical analysis using data and parameters representative of the WWD demonstrates that effi ciency generally requires the use of multiple management strategies. Reuse seems to be the most promising strategy, achieving drainage requirements at minimal losses (approximately 5% rela-tive to the unconstrained case). Under the reuse option, drainage control is largely in the form of a transfer of freshwater land area to reuse produc-tion, with minimal source control on a per-acre basis (e.g. shift to higher uni-formity irrigation systems). Evapora-tion ponds, alternatively, led to losses of between nearly 10 to 34% depending on whether compensating habitat acre-age was required. Hence, evaporation ponds did not prove to be an effi cient mechanism for hydrologic balance under the base conditions.
Issues that might impact the attrac-tiveness of reuse as a means of disposal include decreasing cotton prices and increasing salinity levels. The primary reuse crop is cotton whose prices have recently declined. Empirical analysis considering a range of cotton prices did fi nd signifi cant reductions in agri-cultural income (approximately 36% differential across the range of cotton prices that represent recent highs and lows) and a partial shift to wheat as the reuse crop. However, agricultural returns were still higher under reuse than any other strategy. An investiga-tion of the sustainability of agricul-tural production with and without the drainage constraint showed that a large part of price change affected income
regardless of whether the hydrologic constraint was binding or not. Another concern with reuse as a single disposal strategy is that eventually salt concen-trations will rise within the aquifer. However, our results suggest that agri-cultural production can still be profi t-ably maintained even with a doubling of salt concentration. Furthermore, a dynamic analysis suggests that aquifer salt concentrations are likely to rise only very slowly over time.
The empirical analysis fi nds mod-est use, if any, of evaporation ponds. Pond areas range from zero to less than 7% of the land area depending on the range of management options consid-ered. However, several additional fac-tors need to be considered. The analy-sis here is only for average conditions and pond area comes out of productive land. In general there can be spatial variability such that some land may not be suitable for reuse; conversely there may be low-quality land avail-able for ponds with minimal oppor-tunity cost. Furthermore, if birds and wildlife can be kept off the evaporation ponds, then provision of the compen-sating habitat may be an environmen-tal benefi t, especially in areas such as the SJV where there has already been excessive wetland loss. Well-run evaporation ponds in conjunction with mitigation and compensation measures may well have a larger social role than that found (and analyzed) here.
INTRODUCTIONA variety of strategies for reducing
external drainage and meeting closed basin restrictions have been investi-gated, promoted, and in some cases, implemented. One strategy is source control, which includes measures such as changing crop mix, installing more uniform irrigation systems, and vary-ing irrigation timing to more closely meet plants needs. This category of methods has seen considerable eco-nomic research, as well as adoption of some of the lower cost options. A second category of drainage control is reuse of drainage water on salt-tolerant
crops. This category, which provides both drainage disposal and water con-servation services, has received consid-erable scientifi c research, yet relatively little economic research, and very lim-ited adoption. Two additional strate-gies that have been and continue to be considered, especially in light of any disposal restrictions, include evapora-tion ponds and land retirement. Evap-oration ponds serve as an in-region disposal option, while land retirement reduces the total amount of drainage by taking land, preferably with poor quality soils, out of production.
This research investigates integrat-ed drainwater management for irri-gated agriculture at the regional level. Schwabe and Knapp (2003) develop a regional mathematical programming model to evaluate integrated drain-water management in the San Joaquin Valley (SJV) in California. Research questions are effi cient combinations and levels of various management strategies, response and sensitivity to alternate conditions, policy instru-ments for closed basin management, benefi ts to producers from external drainage facilities, and agricultural sustainability. Research this year developed theoretical insight into regional management with novel fi nd-ings that general equilibrium effects could reverse what might be expected from partial equilibrium analysis. The empirical model was also expanded and applied to additional topics. A complete technical description of the analysis and results can be found in Schwabe, Knapp, and Kan (2004).
The regional programming model assumes a constant water table level and aquifer salt concentration; how-ever, in principle these can evolve over time which can alter effi cient manage-ment. Knapp (1997, 1998) develops a lumped parameter dynamic model for saline aquifers and reports preliminary results. Research this year developed the theory of common property usage and a revised empirical specifi cation utilizing the structure and data of the static regional programming model and additional data on surface water
K. Schwabe and K. KnappIntegrated Drainwater Management in the Central Valley: A Regional Analysis of Irrigated Agriculture
35
costs. Overview of the general results and explicit new fi ndings are described below. A complete technical descrip-tion of the model as well as summary of the general results discussed below is contained in Knapp (2004).
STUDY AREA AND DATAThe empirical analysis focuses on
the San Joaquin Valley (SJV), with par-ticular attention towards the 570,000 acres of irrigable farmland comprising the Westlands Water District (WWD). The agricultural mathematical pro-gramming model includes six crops and fi ve irrigation systems (table 1). The crops include cotton, processing tomatoes, wheat, lettuce, alfalfa, and bermuda grass. Non-water produc-tion costs and market prices for each cropping system are derived from both the UC Cooperative Extension Service (crop budgets) and Fresno County Crop Report (2000). The irrigation sys-tems (and their respective Christensen Uniformity Coeffi cient) include Fur-row 0.5 mile (CUC=70), Furrow 0.25 mile (CUC=75), Linear move sprin-klers (CUC=85), Low-energy precise application system (CUC=90), and Subsurface drip (CUC=90). The costs of irrigating include amortized capi-tal costs along with maintenance and operating costs. One option for dis-posal of drainage water is through the use of evaporation ponds. Our evapo-ration pond infrastructure construction and pumping costs come from Pos-nikoff and Knapp (1997). To calculate surface and groundwater costs, we assume a weighted-average of surface water prices in WWD for cost of sur-face water to growers. Groundwater pumping costs from the confi ned aquifer are calculated based on energy requirements (www. westland water .org). Finally, to account for hetero-geneous land quality characteristics, we calibrate the model with attention to historic crop acreage allocations in WWD.
INTEGRATED MANAGEMENT AND EVOLVING BASIN CONDITIONS
Formed in 1952, WWD relied most-ly on groundwater for irrigation until
1968, at which time it started receiving appreciable amounts of Central Valley Project surface water supplies follow-ing development of the San Luis Unit. The San Luis Unit, which consists of over a 1000 miles of conveyance and distribution pipes and canals, was built as part of a 1963 agreement between WWD and the Bureau of Reclamation. This agreement relegated the Bureau to supply 900,000 ac-ft of water to WWD at stipulated prices for a 40 year pe-riod, and provide drainage services for drainage originating in WWD.
Prior to 1985, WWD growers oper-ated with essentially no constraints on drainage discharge. For those growers in drainage service areas, drainage was discharged into a system terminating at the Kesterson reservoir. The effi -cient solution under this pre-1985 sce-nario can be simulated with our model by relaxing the hydrologic balance constraint. The fi rst column in table 2 reports the effi cient solution when net fl ows to the watertable are not con-strained. As shown, traditional irriga-tion systems are selected, no reuse is used, and deep percolation fl ows aver-age slightly over 1 ft/yr, which is con-sistent with the historical average for deep percolation fl ows in this region (Tanji and Karajeh 1993).
To address the threat of a rising watertable, and fulfi ll its legal obliga-tions associated with providing drain-age services, in 1976 the Bureau began construction of a system of drain lines and a regional collector system, the San Luis Drain. This drainage system was intended to provide drainage services for nearly 42,000 acres of irrigated agri-cultural lands, with the outlet of the San Luis drain terminating in Kester-son Reservoir. In 1985, though, Kester-son Reservoir was closed and drainage services stopped following the discov-ery of high concentrations of selenium and bird deformities at the reservoir. The selenium, along with other toxic trace elements, was linked to drainage fl ows from upstream agriculture. Since then, the district has existed largely as a closed drainage basin. Consequently, the amount of acreage having a shal-
low groundwater depth of between 0 and 5 feet has increased from nearly 70,000 in 1985 to approximately 190,000 in 1998 (Westlands Water District 1998).
One response by growers to the cessation of drainage services was to implement various source control strat-egies for water conservation, primarily in the form of a shift in irrigation sys-tems. In particular, there is evidence of a shift from traditional furrow irriga-tion systems (½ mile runs) to higher uniformity furrow systems (1/4 mile runs). Another response observed in the SJV region was disposal of col-lected drainage waters in evaporation ponds. This strategy required setting aside a fraction of land that would be used for disposal alone. Compensating habitat was not required nor was reuse practiced.
The hydrologic balance constraint is imposed in the empirical model to sat-isfy the in-region disposal requirement. The results are presented in column 2 of table 2. Without a reuse option nor compensating habitat requirement, effi cient management entails both a substantial level of source control and evaporation pond construction. Total crop area declines to accommodate ponds, and irrigation systems switch from traditional to more uniform systems. Average deep percolation fl ows decline by over 50% due to im-provements in irrigation effi ciency and reductions in applied water. Evapora-tion pond acreage amounts to 8% of the regional area. Net benefi ts decline by 9% relative to the unconstrained case, an outcome that still seems eco-nomically viable and is consistent with the observed continued production in the region.
Similar to the events at the Kester-son reservoir, selenium bioaccumula-tion in the evaporation ponds eventu-ally threatened wildlife. Consequently, evaporation pond operators were subject to more stringent environmen-tal regulations, including a one-to-one compensating habitat to evaporation pond acreage requirement. From a partial equilibrium perspective, addi-
K. Schwabe and K. KnappIntegrated Drainwater Management in the Central Valley: A Regional Analysis of Irrigated Agriculture
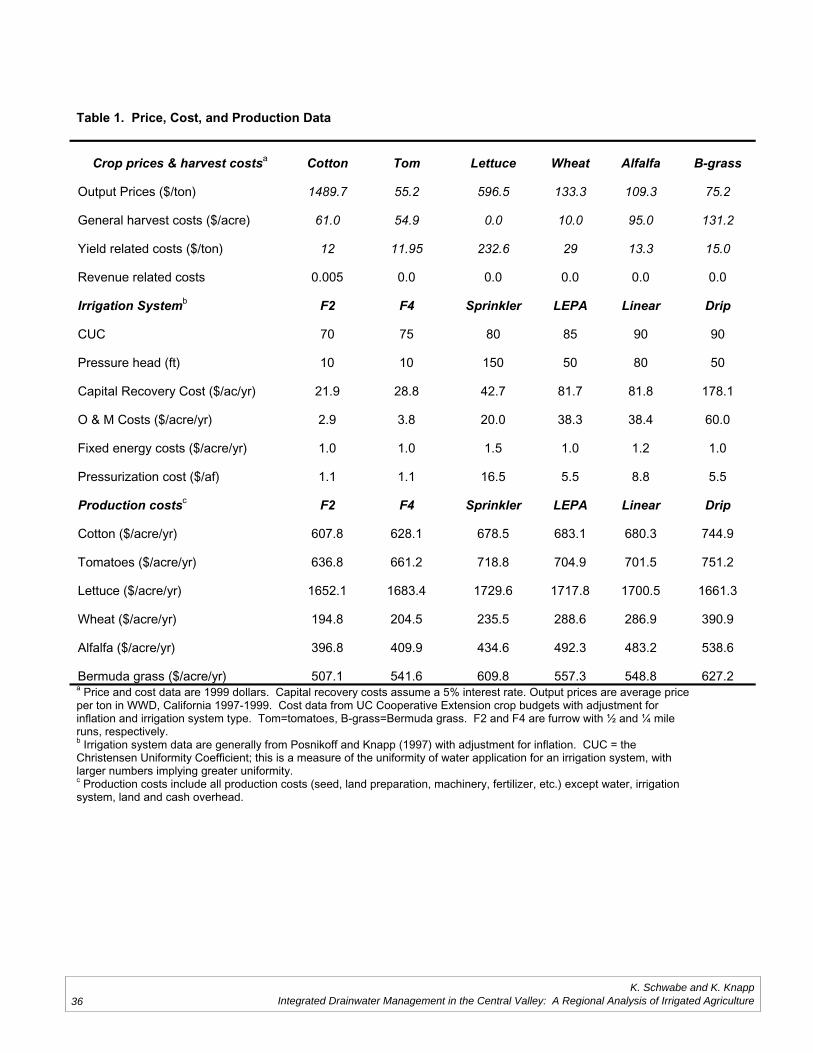
36
Table 1. Price, Cost, and Production Data
Crop prices & harvest costsa Cotton Tom Lettuce Wheat Alfalfa B-grass
Output Prices ($/ton) 1489.7 55.2 596.5 133.3 109.3 75.2
General harvest costs ($/acre) 61.0 54.9 0.0 10.0 95.0 131.2
Yield related costs ($/ton) 12 11.95 232.6 29 13.3 15.0
Revenue related costs 0.005 0.0 0.0 0.0 0.0 0.0
Irrigation Systemb F2 F4 Sprinkler LEPA Linear Drip
CUC 70 75 80 85 90 90
Pressure head (ft) 10 10 150 50 80 50
Capital Recovery Cost ($/ac/yr) 21.9 28.8 42.7 81.7 81.8 178.1
O & M Costs ($/acre/yr) 2.9 3.8 20.0 38.3 38.4 60.0
Fixed energy costs ($/acre/yr) 1.0 1.0 1.5 1.0 1.2 1.0
Pressurization cost ($/af) 1.1 1.1 16.5 5.5 8.8 5.5
Production costsc F2 F4 Sprinkler LEPA Linear Drip
Cotton ($/acre/yr) 607.8 628.1 678.5 683.1 680.3 744.9
Tomatoes ($/acre/yr) 636.8 661.2 718.8 704.9 701.5 751.2
Lettuce ($/acre/yr) 1652.1 1683.4 1729.6 1717.8 1700.5 1661.3
Wheat ($/acre/yr) 194.8 204.5 235.5 288.6 286.9 390.9
Alfalfa ($/acre/yr) 396.8 409.9 434.6 492.3 483.2 538.6
Bermuda grass ($/acre/yr) 507.1 541.6 609.8 557.3 548.8 627.2a Price and cost data are 1999 dollars. Capital recovery costs assume a 5% interest rate. Output prices are average price per ton in WWD, California 1997-1999. Cost data from UC Cooperative Extension crop budgets with adjustment for inflation and irrigation system type. Tom=tomatoes, B-grass=Bermuda grass. F2 and F4 are furrow with ½ and ¼ mile runs, respectively.b Irrigation system data are generally from Posnikoff and Knapp (1997) with adjustment for inflation. CUC = the Christensen Uniformity Coefficient; this is a measure of the uniformity of water application for an irrigation system, with larger numbers implying greater uniformity. c Production costs include all production costs (seed, land preparation, machinery, fertilizer, etc.) except water, irrigation system, land and cash overhead.
K. Schwabe and K. KnappIntegrated Drainwater Management in the Central Valley: A Regional Analysis of Irrigated Agriculture
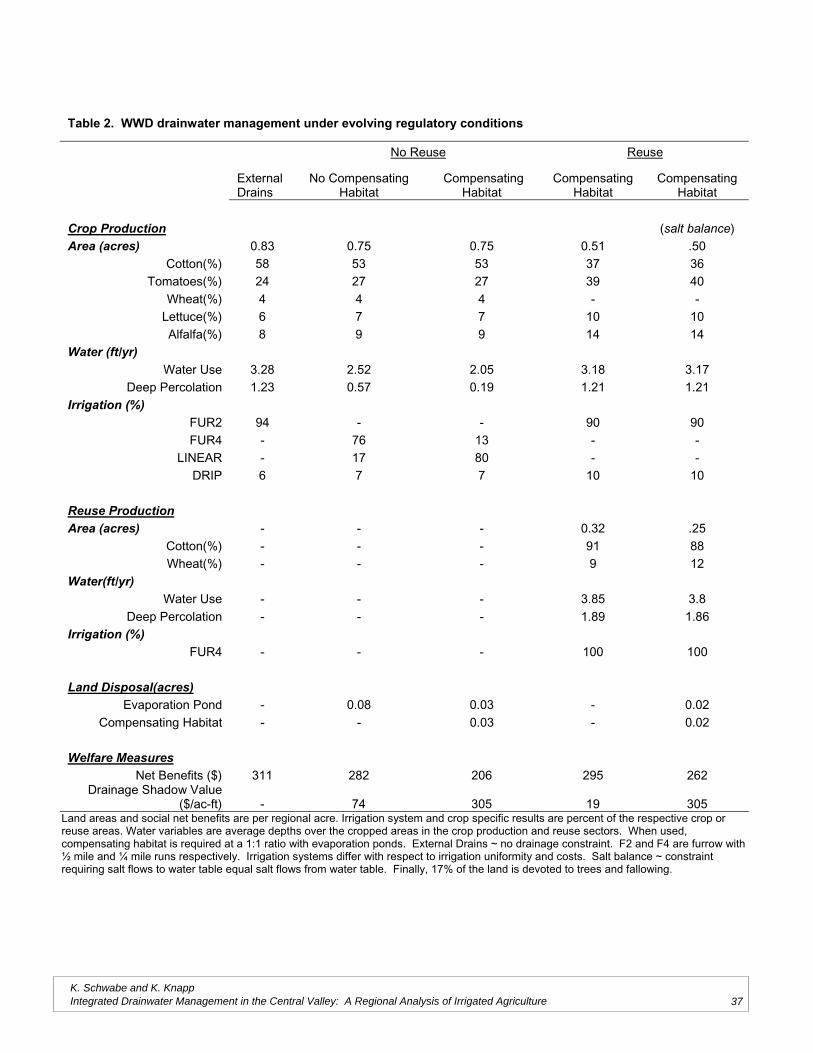
37
Table 2. WWD drainwater management under evolving regulatory conditions
Land areas and social net benefits are per regional acre. Irrigation system and crop specific results are percent of the respective crop or reuse areas. Water variables are average depths over the cropped areas in the crop production and reuse sectors. When used, compensating habitat is required at a 1:1 ratio with evaporation ponds. External Drains ~ no drainage constraint. F2 and F4 are furrow with½ mile and ¼ mile runs respectively. Irrigation systems differ with respect to irrigation uniformity and costs. Salt balance ~ constraint requiring salt flows to water table equal salt flows from water table. Finally, 17% of the land is devoted to trees and fallowing.
No Reuse Reuse
ExternalDrains
No CompensatingHabitat
CompensatingHabitat
CompensatingHabitat
CompensatingHabitat
Crop Production (salt balance)Area (acres) 0.83 0.75 0.75 0.51 .50
Cotton(%) 58 53 53 37 36Tomatoes(%) 24 27 27 39 40
Wheat(%) 4 4 4 - -Lettuce(%) 6 7 7 10 10Alfalfa(%) 8 9 9 14 14
Water (ft/yr) Water Use 3.28 2.52 2.05 3.18 3.17
Deep Percolation 1.23 0.57 0.19 1.21 1.21Irrigation (%)
FUR2 94 - - 90 90FUR4 - 76 13 - -
LINEAR - 17 80 - -DRIP 6 7 7 10 10
Reuse ProductionArea (acres) - - - 0.32 .25
Cotton(%) - - - 91 88Wheat(%) - - - 9 12
Water(ft/yr)Water Use - - - 3.85 3.8
Deep Percolation - - - 1.89 1.86Irrigation (%)
FUR4 - - - 100 100
Land Disposal(acres)Evaporation Pond - 0.08 0.03 - 0.02
Compensating Habitat - - 0.03 - 0.02
Welfare MeasuresNet Benefits ($) 311 282 206 295 262
Drainage Shadow Value($/ac-ft) - 74 305 19 305
K. Schwabe and K. KnappIntegrated Drainwater Management in the Central Valley: A Regional Analysis of Irrigated Agriculture
38
tional compensating habitat require-ments would likely be accommodated by (i) devoting fewer acres to crop pro-duction and (ii) increasing source con-trol measures per unit area. However, contrasting general equilibrium effects might arise. For example, reducing applied water depths decreases crop profi ts and, consequently, decreases both the opportunity cost of land and the shadow value on drainage. Theo-retical analysis suggests that, a priori, the impact of a compensating habi-tat requirement on acreage devoted to crop production and drainage is unknown.
Empirically, the quantitative effect of requiring compensating habitat (col-umn 3 in table 2) is dramatic. The shift to more uniform irrigation systems is increasingly pronounced, and deep percolation fl ows are reduced by 85% relative to the unconstrained solution. Corresponding to the comparative static analysis, there is a reduction in surface water use, no change in the area devoted to crop production, and a decrease in pond size. Pond acreage is minimal (3%), although an equal amount goes into compensating habitat for a total of 6% of the regional land area. Most signifi cantly, net benefi ts to agricultural production – while still positive – are reduced by 34% relative to the unconstrained level. Justifying compensating habitat on economic effi -ciency grounds would require substan-tial ecological benefi ts.
Despite a large amount of scientifi c research and funding, drainwater reuse has not been adopted in the District. Should one use evaporation ponds, reuse, or both in closed drainage basin management? Analytic derivations illustrate that reuse is the less costly alternative when land values are low, while evaporation ponds are prefer-able when land values are high. The trade-off arises because reuse, while less costly per-acre than ponds (and quite possibly having positive returns), generally disposes of less water per unit area than ponds. Thus the choice of disposal method depends, in part,
on the profi tability of freshwater crop production, a nominally independent entity.
Column 4 in table 2 presents results under the condition that efforts to meet the in-region drainage constraint can be achieved by both reuse and evaporation ponds (with the requisite compensating habitat). The results suggest that drainwater reuse offers great promise in maintaining agricul-tural production and hydrologic bal-ance in the region. Compared to the unconstrained case, net benefi ts decline by only 5% under reuse. The area devoted to freshwater crop production is reduced quite substantially to allow for reuse production. Compared to the external drainage solution, reuse opportunities require little source control from growers. There is a 5% reduction in the use of less uniform irrigation systems, deep percolation fl ows increase slightly, and most of the drainwater reuse is applied to cotton. Cotton as a reuse crop is practical since it is moderately salt tolerant (Mass and Hoffman 1977) and, given the current groundwater salinity concentration, somewhat profi table. Note that with the reuse option, no acreage is allo-cated to evaporation ponds.
COTTON PRICES AND AQUIFER SALT CONCENTRATIONS
Over the past 8 years there has been a downward trend in upland cotton prices by nearly 50%. While cot-ton acreage is slowly being allocated towards prima cotton, whose price is substantially higher and hasn’t expe-rienced as great a downward trend, upland cotton still comprises over 70% of cropped cotton acreage. Given that the favorable drainage management strategy noted above relies on cotton as the reuse crop, it is prudent to evalu-ate the robustness of this conclusion to changing cotton prices. From an analytical perspective, results show that in an unconstrained setting, lower cotton prices discourage water use as one moves back along the production function. Lower cotton prices also decrease profi ts in the reuse sector, in effect increasing net drainage costs and
again, negatively infl uencing water application rates. However, lower cotton prices also imply lower land opportunity costs and, hence, lower drainage prices. These latter results tend to have a contrary effect on water depths and source control.
Empirical results were presented in last year’s report. Our results suggest-ed that regardless of whether a drain-age restriction is imposed, a reduction in cotton prices from the high level to the low level had dramatic implica-tions for agricultural production as it resulted in a near 36% decrease in grower profi ts. This was identifi ed as an upper bound on losses given the minimum bounds placed on crop acre-age. However, the effects on drainage management from this price change are limited. When there are no drain-age restrictions the qualitative impacts of lowering cotton prices is essentially borne by a reduction in crop produc-tion and a slight decrease in applied water rates. Alternatively, when the drainage constraint is imposed, the price change results in a similar reduction in freshwater crop acreage (mostly in cotton), a slight increase in applied water rates, and a substan-tial shift to less effi cient irrigation in the reuse sector. More importantly, under either price scenario the effi cient management response to the drainage constraint is reuse, not evaporation ponds. The reduction in net benefi ts from the drainage constraint relative to the unconstrained solution is only 5%. Thus while agriculture is substantially impacted by lower cotton prices, this is a general effect occurring regardless of the drainage regulation. The conclu-sions noted above about the desirabil-ity of reuse for drainage management and viability of agriculture in a closed drainage basin continue to hold.
A concern with reuse is the possible increase in aquifer salt concentration. Since ET is almost completely pure water and soil salinity has to be main-tained at an appropriate level for crop production, reuse ultimately just recir-culates salts in the basin while surface water infl ows import salts. Given no
K. Schwabe and K. KnappIntegrated Drainwater Management in the Central Valley: A Regional Analysis of Irrigated Agriculture
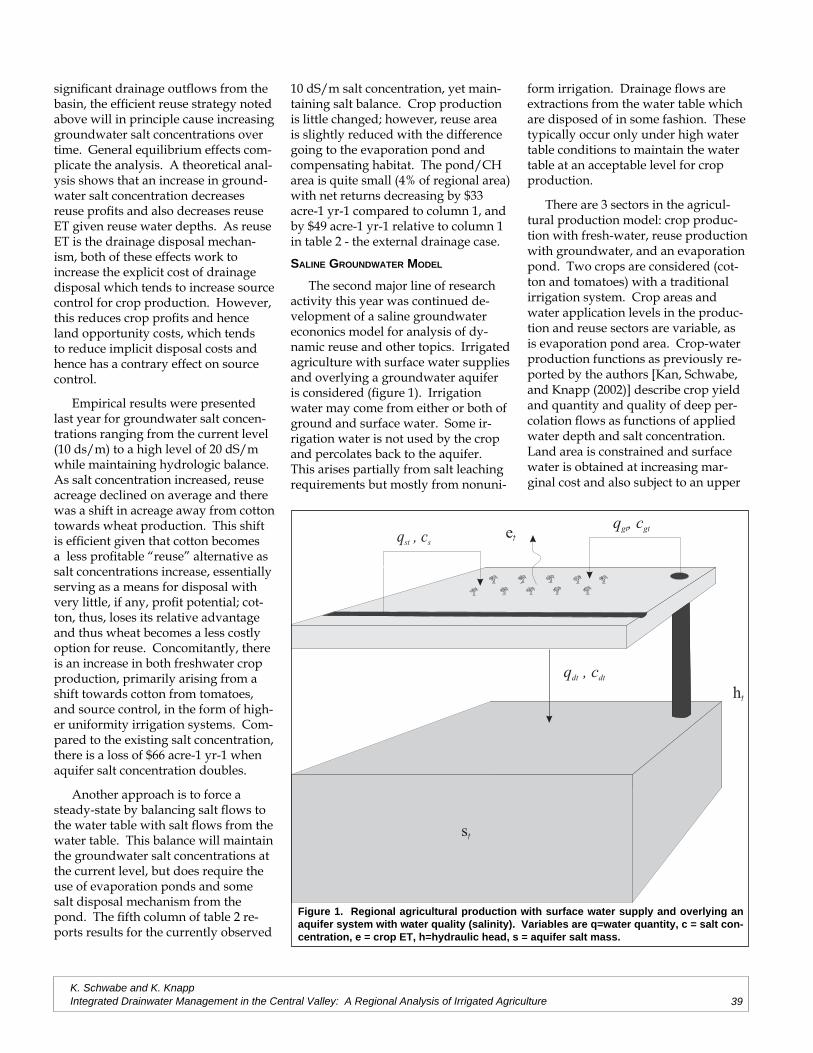
39
signifi cant drainage outfl ows from the basin, the effi cient reuse strategy noted above will in principle cause increasing groundwater salt concentrations over time. General equilibrium effects com-plicate the analysis. A theoretical anal-ysis shows that an increase in ground-water salt concentration decreases reuse profi ts and also decreases reuse ET given reuse water depths. As reuse ET is the drainage disposal mechan-ism, both of these effects work to increase the explicit cost of drainage disposal which tends to increase source control for crop production. However, this reduces crop profi ts and hence land opportunity costs, which tends to reduce implicit disposal costs and hence has a contrary effect on source control.
Empirical results were presented last year for groundwater salt concen-trations ranging from the current level (10 ds/m) to a high level of 20 dS/m while maintaining hydrologic balance. As salt concentration increased, reuse acreage declined on average and there was a shift in acreage away from cotton towards wheat production. This shift is effi cient given that cotton becomes a less profi table “reuse” alternative as salt concentrations increase, essentially serving as a means for disposal with very little, if any, profi t potential; cot-ton, thus, loses its relative advantage and thus wheat becomes a less costly option for reuse. Concomitantly, there is an increase in both freshwater crop production, primarily arising from a shift towards cotton from tomatoes, and source control, in the form of high-er uniformity irrigation systems. Com-pared to the existing salt concentration, there is a loss of $66 acre-1 yr-1 when aquifer salt concentration doubles.
Another approach is to force a steady-state by balancing salt fl ows to the water table with salt fl ows from the water table. This balance will maintain the groundwater salt concentrations at the current level, but does require the use of evaporation ponds and some salt disposal mechanism from the pond. The fi fth column of table 2 re-ports results for the currently observed
10 dS/m salt concentration, yet main-taining salt balance. Crop production is little changed; however, reuse area is slightly reduced with the difference going to the evaporation pond and compensating habitat. The pond/CH area is quite small (4% of regional area) with net returns decreasing by $33 acre-1 yr-1 compared to column 1, and by $49 acre-1 yr-1 relative to column 1 in table 2 - the external drainage case.
SALINE GROUNDWATER MODEL
The second major line of research activity this year was continued de-velopment of a saline groundwater econonics model for analysis of dy-namic reuse and other topics. Irrigated agriculture with surface water supplies and overlying a groundwater aquifer is considered (fi gure 1). Irrigation water may come from either or both of ground and surface water. Some ir-rigation water is not used by the crop and percolates back to the aquifer. This arises partially from salt leaching requirements but mostly from nonuni-
form irrigation. Drainage fl ows are extractions from the water table which are disposed of in some fashion. These typically occur only under high water table conditions to maintain the water table at an acceptable level for crop production.
There are 3 sectors in the agricul-tural production model: crop produc-tion with fresh-water, reuse production with groundwater, and an evaporation pond. Two crops are considered (cot-ton and tomatoes) with a traditional irrigation system. Crop areas and water application levels in the produc-tion and reuse sectors are variable, as is evaporation pond area. Crop-water production functions as previously re-ported by the authors [Kan, Schwabe, and Knapp (2002)] describe crop yield and quantity and quality of deep per-colation fl ows as functions of applied water depth and salt concentration. Land area is constrained and surface water is obtained at increasing mar-ginal cost and also subject to an upper
etq , cst s
q , cgt gt
ht
st
q , cdt dt
Figure 1. Regional agricultural production with surface water supply and overlying an aquifer system with water quality (salinity). Variables are q=water quantity, c = salt con-centration, e = crop ET, h=hydraulic head, s = aquifer salt mass.
K. Schwabe and K. KnappIntegrated Drainwater Management in the Central Valley: A Regional Analysis of Irrigated Agriculture
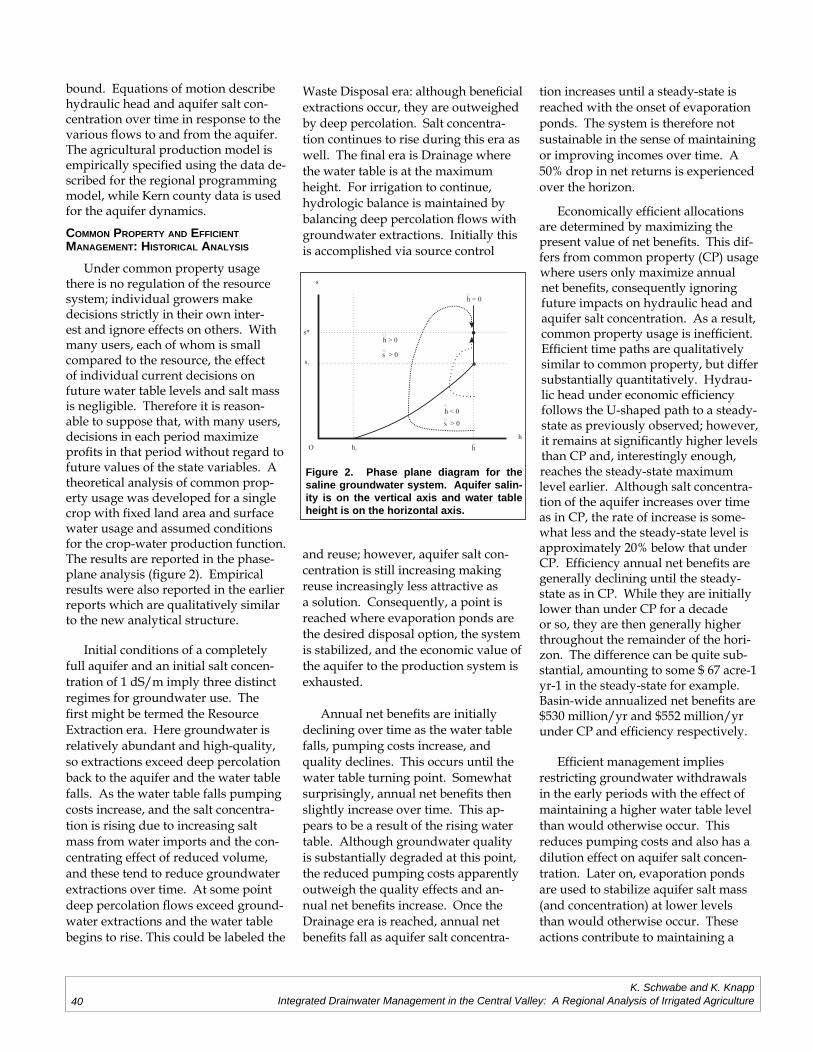
40
bound. Equations of motion describe hydraulic head and aquifer salt con-centration over time in response to the various fl ows to and from the aquifer. The agricultural production model is empirically specifi ed using the data de-scribed for the regional programming model, while Kern county data is used for the aquifer dynamics.
COMMON PROPERTY AND EFFICIENT MANAGEMENT: HISTORICAL ANALYSIS
Under common property usage there is no regulation of the resource system; individual growers make decisions strictly in their own inter-est and ignore effects on others. With many users, each of whom is small compared to the resource, the effect of individual current decisions on future water table levels and salt mass is negligible. Therefore it is reason-able to suppose that, with many users, decisions in each period maximize profi ts in that period without regard to future values of the state variables. A theoretical analysis of common prop-erty usage was developed for a single crop with fi xed land area and surface water usage and assumed conditions for the crop-water production function. The results are reported in the phase-plane analysis (fi gure 2). Empirical results were also reported in the earlier reports which are qualitatively similar to the new analytical structure.
Initial conditions of a completely full aquifer and an initial salt concen-tration of 1 dS/m imply three distinct regimes for groundwater use. The fi rst might be termed the Resource Extraction era. Here groundwater is relatively abundant and high-quality, so extractions exceed deep percolation back to the aquifer and the water table falls. As the water table falls pumping costs increase, and the salt concentra-tion is rising due to increasing salt mass from water imports and the con-centrating effect of reduced volume, and these tend to reduce groundwater extractions over time. At some point deep percolation fl ows exceed ground-water extractions and the water table begins to rise. This could be labeled the
Waste Disposal era: although benefi cial extractions occur, they are outweighed by deep percolation. Salt concentra-tion continues to rise during this era as well. The fi nal era is Drainage where the water table is at the maximum height. For irrigation to continue, hydrologic balance is maintained by balancing deep percolation fl ows with groundwater extractions. Initially this is accomplished via source control
and reuse; however, aquifer salt con-centration is still increasing making reuse increasingly less attractive as a solution. Consequently, a point is reached where evaporation ponds are the desired disposal option, the system is stabilized, and the economic value of the aquifer to the production system is exhausted.
Annual net benefi ts are initially declining over time as the water table falls, pumping costs increase, and quality declines. This occurs until the water table turning point. Somewhat surprisingly, annual net benefi ts then slightly increase over time. This ap-pears to be a result of the rising water table. Although groundwater quality is substantially degraded at this point, the reduced pumping costs apparently outweigh the quality effects and an-nual net benefi ts increase. Once the Drainage era is reached, annual net benefi ts fall as aquifer salt concentra-
tion increases until a steady-state is reached with the onset of evaporation ponds. The system is therefore not sustainable in the sense of maintaining or improving incomes over time. A 50% drop in net returns is experienced over the horizon.
Economically effi cient allocations are determined by maximizing the present value of net benefi ts. This dif-fers from common property (CP) usage where users only maximize annual net benefi ts, consequently ignoring future impacts on hydraulic head and aquifer salt concentration. As a result, common property usage is ineffi cient. Effi cient time paths are qualitatively similar to common property, but differ substantially quantitatively. Hydrau-lic head under economic effi ciency follows the U-shaped path to a steady-state as previously observed; however, it remains at signifi cantly higher levels than CP and, interestingly enough, reaches the steady-state maximum level earlier. Although salt concentra-tion of the aquifer increases over time as in CP, the rate of increase is some-what less and the steady-state level is approximately 20% below that under CP. Effi ciency annual net benefi ts are generally declining until the steady-state as in CP. While they are initially lower than under CP for a decade or so, they are then generally higher throughout the remainder of the hori-zon. The difference can be quite sub-stantial, amounting to some $ 67 acre-1 yr-1 in the steady-state for example. Basin-wide annualized net benefi ts are $530 million/yr and $552 million/yr under CP and effi ciency respectively.
Effi cient management implies restricting groundwater withdrawals in the early periods with the effect of maintaining a higher water table level than would otherwise occur. This reduces pumping costs and also has a dilution effect on aquifer salt concen-tration. Later on, evaporation ponds are used to stabilize aquifer salt mass (and concentration) at lower levels than would otherwise occur. These actions contribute to maintaining a
s
h
s*
s1
h1 h
h > 0
s > 0
h < 0
s > 0
h = 0
O
Figure 2. Phase plane diagram for the saline groundwater system. Aquifer salin-ity is on the vertical axis and water table height is on the horizontal axis.
K. Schwabe and K. KnappIntegrated Drainwater Management in the Central Valley: A Regional Analysis of Irrigated Agriculture
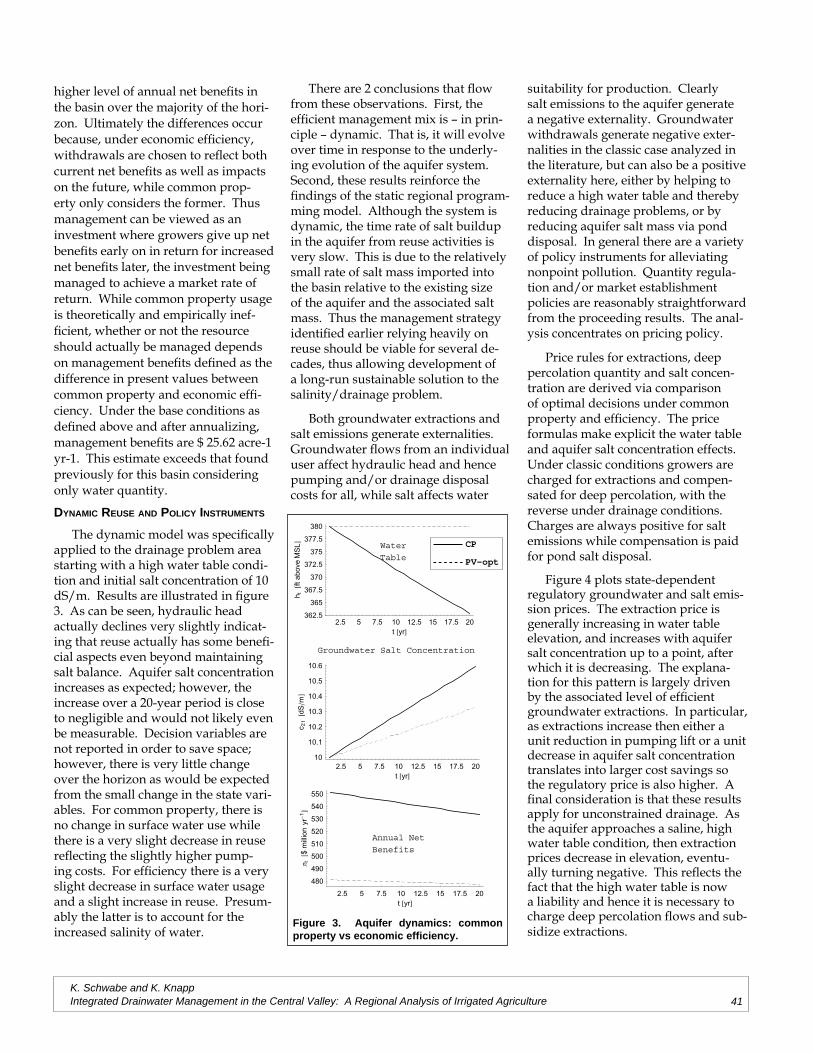
41
higher level of annual net benefi ts in the basin over the majority of the hori-zon. Ultimately the differences occur because, under economic effi ciency, withdrawals are chosen to refl ect both current net benefi ts as well as impacts on the future, while common prop-erty only considers the former. Thus management can be viewed as an investment where growers give up net benefi ts early on in return for increased net benefi ts later, the investment being managed to achieve a market rate of return. While common property usage is theoretically and empirically inef-fi cient, whether or not the resource should actually be managed depends on management benefi ts defi ned as the difference in present values between common property and economic effi -ciency. Under the base conditions as defi ned above and after annualizing, management benefi ts are $ 25.62 acre-1 yr-1. This estimate exceeds that found previously for this basin considering only water quantity.
DYNAMIC REUSE AND POLICY INSTRUMENTS
The dynamic model was specifi cally applied to the drainage problem area starting with a high water table condi-tion and initial salt concentration of 10 dS/m. Results are illustrated in fi gure 3. As can be seen, hydraulic head actually declines very slightly indicat-ing that reuse actually has some benefi -cial aspects even beyond maintaining salt balance. Aquifer salt concentration increases as expected; however, the increase over a 20-year period is close to negligible and would not likely even be measurable. Decision variables are not reported in order to save space; however, there is very little change over the horizon as would be expected from the small change in the state vari-ables. For common property, there is no change in surface water use while there is a very slight decrease in reuse refl ecting the slightly higher pump-ing costs. For effi ciency there is a very slight decrease in surface water usage and a slight increase in reuse. Presum-ably the latter is to account for the increased salinity of water.
There are 2 conclusions that fl ow from these observations. First, the effi cient management mix is – in prin-ciple – dynamic. That is, it will evolve over time in response to the underly-ing evolution of the aquifer system. Second, these results reinforce the fi ndings of the static regional program-ming model. Although the system is dynamic, the time rate of salt buildup in the aquifer from reuse activities is very slow. This is due to the relatively small rate of salt mass imported into the basin relative to the existing size of the aquifer and the associated salt mass. Thus the management strategy identifi ed earlier relying heavily on reuse should be viable for several de-cades, thus allowing development of a long-run sustainable solution to the salinity/drainage problem.
Both groundwater extractions and salt emissions generate externalities. Groundwater fl ows from an individual user affect hydraulic head and hence pumping and/or drainage disposal costs for all, while salt affects water
suitability for production. Clearly salt emissions to the aquifer generate a negative externality. Groundwater withdrawals generate negative exter-nalities in the classic case analyzed in the literature, but can also be a positive externality here, either by helping to reduce a high water table and thereby reducing drainage problems, or by reducing aquifer salt mass via pond disposal. In general there are a variety of policy instruments for alleviating nonpoint pollution. Quantity regula-tion and/or market establishment policies are reasonably straightforward from the proceeding results. The anal-ysis concentrates on pricing policy.
Price rules for extractions, deep percolation quantity and salt concen-tration are derived via comparison of optimal decisions under common property and effi ciency. The price formulas make explicit the water table and aquifer salt concentration effects. Under classic conditions growers are charged for extractions and compen-sated for deep percolation, with the reverse under drainage conditions. Charges are always positive for salt emissions while compensation is paid for pond salt disposal.
Figure 4 plots state-dependent regulatory groundwater and salt emis-sion prices. The extraction price is generally increasing in water table elevation, and increases with aquifer salt concentration up to a point, after which it is decreasing. The explana-tion for this pattern is largely driven by the associated level of effi cient groundwater extractions. In particular, as extractions increase then either a unit reduction in pumping lift or a unit decrease in aquifer salt concentration translates into larger cost savings so the regulatory price is also higher. A fi nal consideration is that these results apply for unconstrained drainage. As the aquifer approaches a saline, high water table condition, then extraction prices decrease in elevation, eventu-ally turning negative. This refl ects the fact that the high water table is now a liability and hence it is necessary to charge deep percolation fl ows and sub-sidize extractions.
Figure 3. Aquifer dynamics: common property vs economic effi ciency.
2.5 5 7.5 10 12.5 15 17.5 20t yr
362.5
365
367.5
370
372.5
375
377.5
380
h ttf
evobaL
SM
Water
Table
2.5 5 7.5 10 12.5 15 17.5 20t yr
10
10.1
10.2
10.3
10.4
10.5
10.6
c 2t
Sdm
Groundwater Salt Concentration
2.5 5 7.5 10 12.5 15 17.5 20t yr
480
490
500
510
520
530
540
550
t$
noillim
ry1
Annual Net
Benefits
CP
PV-opt
K. Schwabe and K. KnappIntegrated Drainwater Management in the Central Valley: A Regional Analysis of Irrigated Agriculture
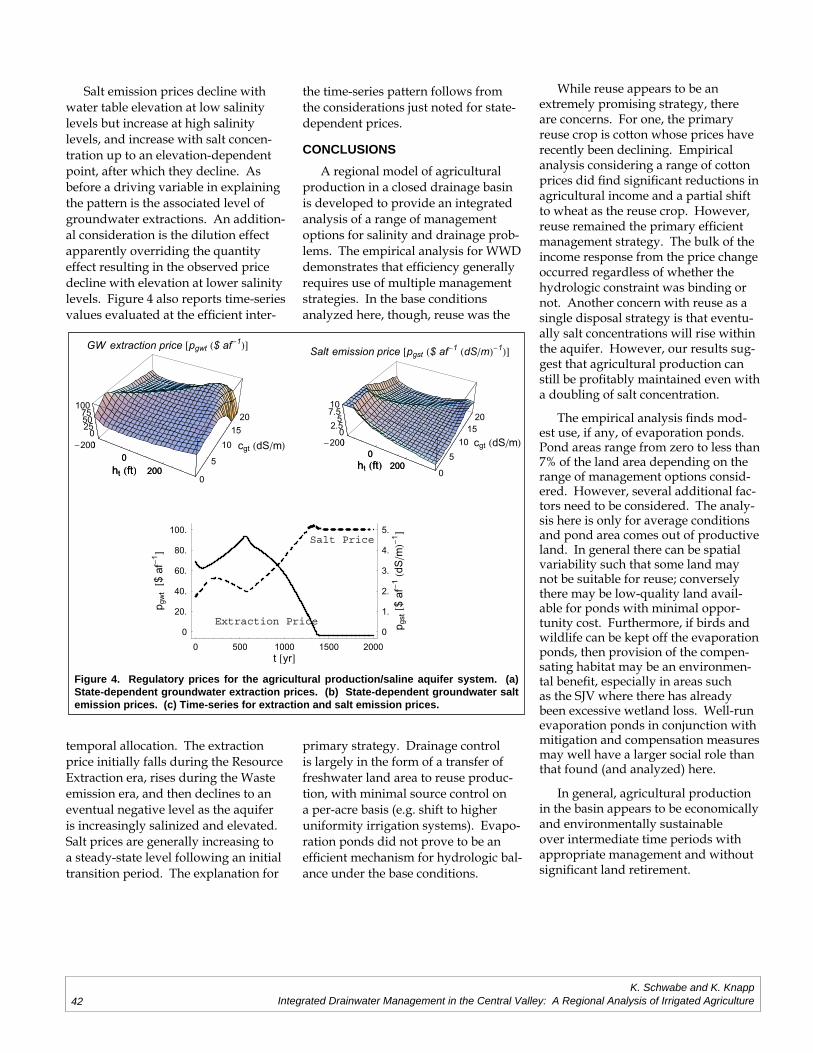
42
Salt emission prices decline with water table elevation at low salinity levels but increase at high salinity levels, and increase with salt concen-tration up to an elevation-dependent point, after which they decline. As before a driving variable in explaining the pattern is the associated level of groundwater extractions. An addition-al consideration is the dilution effect apparently overriding the quantity effect resulting in the observed price decline with elevation at lower salinity levels. Figure 4 also reports time-series values evaluated at the effi cient inter-
temporal allocation. The extraction price initially falls during the Resource Extraction era, rises during the Waste emission era, and then declines to an eventual negative level as the aquifer is increasingly salinized and elevated. Salt prices are generally increasing to a steady-state level following an initial transition period. The explanation for
the time-series pattern follows from the considerations just noted for state-dependent prices.
CONCLUSIONSA regional model of agricultural
production in a closed drainage basin is developed to provide an integrated analysis of a range of management options for salinity and drainage prob-lems. The empirical analysis for WWD demonstrates that effi ciency generally requires use of multiple management strategies. In the base conditions analyzed here, though, reuse was the
primary strategy. Drainage control is largely in the form of a transfer of freshwater land area to reuse produc-tion, with minimal source control on a per-acre basis (e.g. shift to higher uniformity irrigation systems). Evapo-ration ponds did not prove to be an effi cient mechanism for hydrologic bal-ance under the base conditions.
While reuse appears to be an extremely promising strategy, there are concerns. For one, the primary reuse crop is cotton whose prices have recently been declining. Empirical analysis considering a range of cotton prices did fi nd signifi cant reductions in agricultural income and a partial shift to wheat as the reuse crop. However, reuse remained the primary effi cient management strategy. The bulk of the income response from the price change occurred regardless of whether the hydrologic constraint was binding or not. Another concern with reuse as a single disposal strategy is that eventu-ally salt concentrations will rise within the aquifer. However, our results sug-gest that agricultural production can still be profi tably maintained even with a doubling of salt concentration.
The empirical analysis fi nds mod-est use, if any, of evaporation ponds. Pond areas range from zero to less than 7% of the land area depending on the range of management options consid-ered. However, several additional fac-tors need to be considered. The analy-sis here is only for average conditions and pond area comes out of productive land. In general there can be spatial variability such that some land may not be suitable for reuse; conversely there may be low-quality land avail-able for ponds with minimal oppor-tunity cost. Furthermore, if birds and wildlife can be kept off the evaporation ponds, then provision of the compen-sating habitat may be an environmen-tal benefi t, especially in areas such as the SJV where there has already been excessive wetland loss. Well-run evaporation ponds in conjunction with mitigation and compensation measures may well have a larger social role than that found (and analyzed) here.
In general, agricultural production in the basin appears to be economically and environmentally sustainable over intermediate time periods with appropriate management and without signifi cant land retirement.
GW extraction price pgwt $ af 1
2000
200ht ft0
5
10
15
20
cgt dS m0
255075
100
00
200ht ft
Salt emission price pgst $ af 1 dS m 1
2000
200ht ft0
5
10
1520
cgt dS m0
2.55
7.510
00
200ht ft
0 500 1000 1500 2000t yr
0
20.
40.
60.
80.
100.
pt
wg$
fa1
0
1.
2.
3.
4.
5.
ptsg
$fa
1Sd
m1
Extraction Price
Salt Price
Figure 4. Regulatory prices for the agricultural production/saline aquifer system. (a) State-dependent groundwater extraction prices. (b) State-dependent groundwater salt emission prices. (c) Time-series for extraction and salt emission prices.
K. Schwabe and K. KnappIntegrated Drainwater Management in the Central Valley: A Regional Analysis of Irrigated Agriculture
43
REFERENCESCalifornia Agricultural Statistics 2002.
Kan, I., K. Schwabe, K. Knapp. (2002). Microeconomics of irrigation with saline water. Journal of Agricultural and Resource Economics 27(1), pgs 16-39.
Knapp, K.C. 1997 and 1998. Economics of salinity and drainage management in the SJV. Salinity and Drainage Annual Report. UC Center for Water Resources.
Knapp, K.C. 2004. Groundwater quantity and quality management: agricultural production and aquifer salinization over long time-scales. Working paper. UC Riverside.
Maas, E. V., and G. J. Hoffman. 1977. Crop Salt Tolerance - Current Assessment. Journal of the Irrigation and Drainage Division, American Society of Civil Engineers 103:115-134.
Posnikoff, J. F., and K. C. Knapp. 1997. Farm-Level Management of Deep Percolation Emissions in Irrigated Agriculture. Journal of the American Water Resources Association 33(2), pgs 375-386.
Schwabe, K., K. C. Knapp. 2003. Integrated Drainwater Management in the Central Valley. Salinity and Drainage Annual Report. UC Center for Water Resources. Pp. 164-172.
Schwabe, K., K. C. Knapp, and I. Kan. 2004. Integrated Drainwater Management in Irrigated Agriculture. Working paper. UC Riverside.
Stockle, C.O. 2001. Environmental Impact of Irrigation: A Review. Washington eWater News Briefs. State of Washington Water Resources Center. Fall 4: pgs 1-15.
Tanji, K.K., and F.F. Karajeh. 1993. Saline Drain Water Reuse in Agroforestry Systems. Journal of Irrigation and Drainage Engineering 119, 1(1993): pgs. 170-80.
University of California Salinity and Drainage Program. Evaporation Ponds: Final Report. February 1999.
Westlands Water District. Proposed Land Retirement Project. Economic Impact Report. 2003. pg. 2-4.
www.westlands.org. Water Costs. 2002.
Westlands Water District. 1998. Westlands Subarea Report. Prepared for the San Joaquin Valley Drainage Implementation Program. October.
K. Schwabe and K. KnappIntegrated Drainwater Management in the Central Valley: A Regional Analysis of Irrigated Agriculture

44K. Schwabe and K. Knapp
Integrated Drainwater Management in the Central Valley: A Regional Analysis of Irrigated Agriculture
45
Phytoremediation of Selenium-ContaminatedDrainage Sediments with Different Transgenic
Lines of Indian Mustard (Brassica juncea)
Project Investigators:
Professor Norman Terry, Principal InvestigatorTelephone: (510) 642-3510, E-mail: [email protected]
Department of Plant and Microbial Biology University of California, Berkeley
Dr. Yi-Chieh Chang, Postdoctoral ResearcherTelephone: (510) 643-2153, E-mail: [email protected]
Department of Plant and Microbial Biology University of California, Berkeley
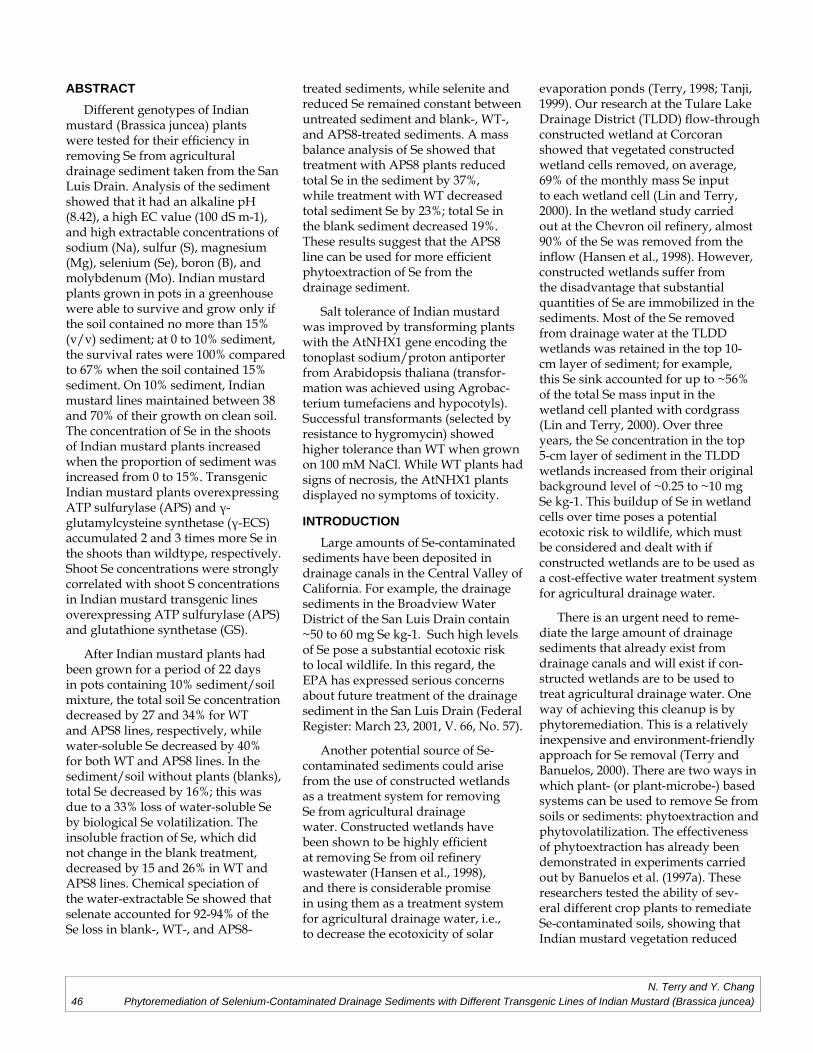
46N. Terry and Y. Chang
Phytoremediation of Selenium-Contaminated Drainage Sediments with Different Transgenic Lines of Indian Mustard (Brassica juncea)
ABSTRACTDifferent genotypes of Indian
mustard (Brassica juncea) plants were tested for their effi ciency in removing Se from agricultural drainage sediment taken from the San Luis Drain. Analysis of the sediment showed that it had an alkaline pH (8.42), a high EC value (100 dS m-1), and high extractable concentrations of sodium (Na), sulfur (S), magnesium (Mg), selenium (Se), boron (B), and molybdenum (Mo). Indian mustard plants grown in pots in a greenhouse were able to survive and grow only if the soil contained no more than 15% (v/v) sediment; at 0 to 10% sediment, the survival rates were 100% compared to 67% when the soil contained 15% sediment. On 10% sediment, Indian mustard lines maintained between 38 and 70% of their growth on clean soil. The concentration of Se in the shoots of Indian mustard plants increased when the proportion of sediment was increased from 0 to 15%. Transgenic Indian mustard plants overexpressing ATP sulfurylase (APS) and γ-glutamylcysteine synthetase (γ-ECS) accumulated 2 and 3 times more Se in the shoots than wildtype, respectively. Shoot Se concentrations were strongly correlated with shoot S concentrations in Indian mustard transgenic lines overexpressing ATP sulfurylase (APS) and glutathione synthetase (GS).
After Indian mustard plants had been grown for a period of 22 days in pots containing 10% sediment/soil mixture, the total soil Se concentration decreased by 27 and 34% for WT and APS8 lines, respectively, while water-soluble Se decreased by 40% for both WT and APS8 lines. In the sediment/soil without plants (blanks), total Se decreased by 16%; this was due to a 33% loss of water-soluble Se by biological Se volatilization. The insoluble fraction of Se, which did not change in the blank treatment, decreased by 15 and 26% in WT and APS8 lines. Chemical speciation of the water-extractable Se showed that selenate accounted for 92-94% of the Se loss in blank-, WT-, and APS8-
treated sediments, while selenite and reduced Se remained constant between untreated sediment and blank-, WT-, and APS8-treated sediments. A mass balance analysis of Se showed that treatment with APS8 plants reduced total Se in the sediment by 37%, while treatment with WT decreased total sediment Se by 23%; total Se in the blank sediment decreased 19%. These results suggest that the APS8 line can be used for more effi cient phytoextraction of Se from the drainage sediment.
Salt tolerance of Indian mustard was improved by transforming plants with the AtNHX1 gene encoding the tonoplast sodium/proton antiporter from Arabidopsis thaliana (transfor-mation was achieved using Agrobac-terium tumefaciens and hypocotyls). Successful transformants (selected by resistance to hygromycin) showed higher tolerance than WT when grown on 100 mM NaCl. While WT plants had signs of necrosis, the AtNHX1 plants displayed no symptoms of toxicity.
INTRODUCTION Large amounts of Se-contaminated
sediments have been deposited in drainage canals in the Central Valley of California. For example, the drainage sediments in the Broadview Water District of the San Luis Drain contain ~50 to 60 mg Se kg-1. Such high levels of Se pose a substantial ecotoxic risk to local wildlife. In this regard, the EPA has expressed serious concerns about future treatment of the drainage sediment in the San Luis Drain (Federal Register: March 23, 2001, V. 66, No. 57).
Another potential source of Se-contaminated sediments could arise from the use of constructed wetlands as a treatment system for removing Se from agricultural drainage water. Constructed wetlands have been shown to be highly effi cient at removing Se from oil refi nery wastewater (Hansen et al., 1998), and there is considerable promise in using them as a treatment system for agricultural drainage water, i.e., to decrease the ecotoxicity of solar
evaporation ponds (Terry, 1998; Tanji, 1999). Our research at the Tulare Lake Drainage District (TLDD) fl ow-through constructed wetland at Corcoran showed that vegetated constructed wetland cells removed, on average, 69% of the monthly mass Se input to each wetland cell (Lin and Terry, 2000). In the wetland study carried out at the Chevron oil refi nery, almost 90% of the Se was removed from the infl ow (Hansen et al., 1998). However, constructed wetlands suffer from the disadvantage that substantial quantities of Se are immobilized in the sediments. Most of the Se removed from drainage water at the TLDD wetlands was retained in the top 10-cm layer of sediment; for example, this Se sink accounted for up to ~56% of the total Se mass input in the wetland cell planted with cordgrass (Lin and Terry, 2000). Over three years, the Se concentration in the top 5-cm layer of sediment in the TLDD wetlands increased from their original background level of ~0.25 to ~10 mg Se kg-1. This buildup of Se in wetland cells over time poses a potential ecotoxic risk to wildlife, which must be considered and dealt with if constructed wetlands are to be used as a cost-effective water treatment system for agricultural drainage water.
There is an urgent need to reme-diate the large amount of drainage sediments that already exist from drainage canals and will exist if con-structed wetlands are to be used to treat agricultural drainage water. One way of achieving this cleanup is by phytoremediation. This is a relatively inexpensive and environment-friendly approach for Se removal (Terry and Banuelos, 2000). There are two ways in which plant- (or plant-microbe-) based systems can be used to remove Se from soils or sediments: phytoextraction and phytovolatilization. The effectiveness of phytoextraction has already been demonstrated in experiments carried out by Banuelos et al. (1997a). These researchers tested the ability of sev-eral different crop plants to remediate Se-contaminated soils, showing that Indian mustard vegetation reduced
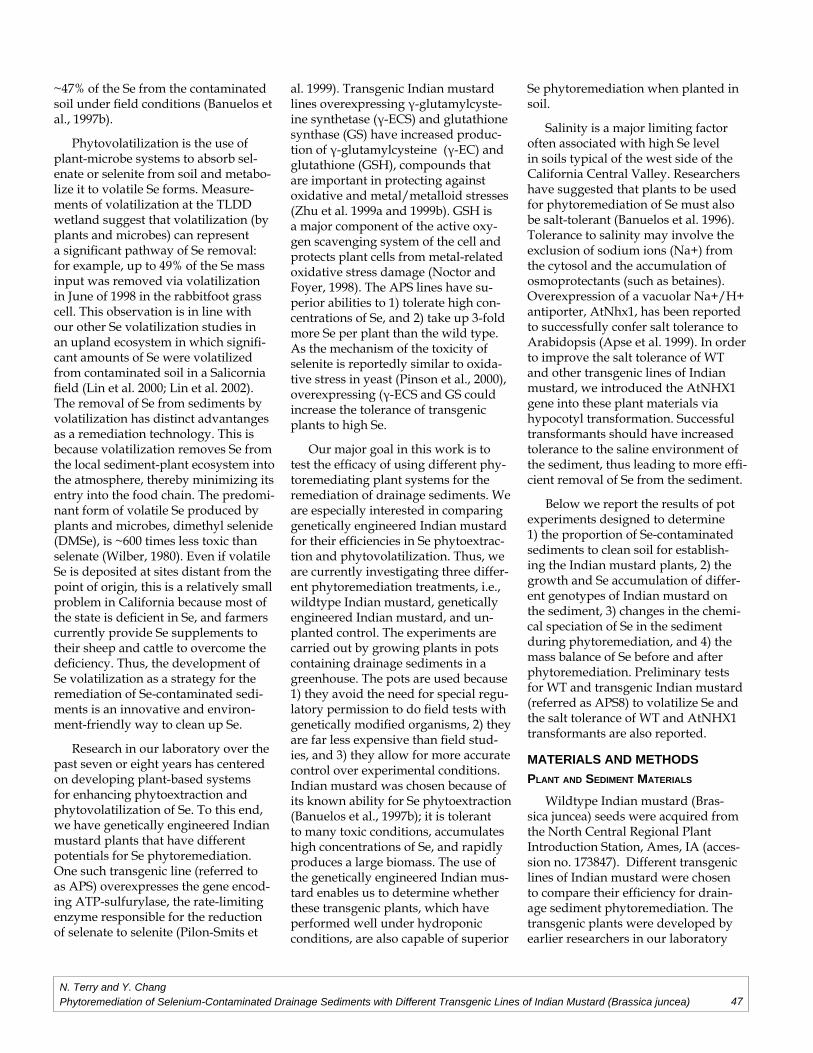
47N. Terry and Y. ChangPhytoremediation of Selenium-Contaminated Drainage Sediments with Different Transgenic Lines of Indian Mustard (Brassica juncea)
~47% of the Se from the contaminated soil under fi eld conditions (Banuelos et al., 1997b).
Phytovolatilization is the use of plant-microbe systems to absorb sel-enate or selenite from soil and metabo-lize it to volatile Se forms. Measure-ments of volatilization at the TLDD wetland suggest that volatilization (by plants and microbes) can represent a signifi cant pathway of Se removal: for example, up to 49% of the Se mass input was removed via volatilization in June of 1998 in the rabbitfoot grass cell. This observation is in line with our other Se volatilization studies in an upland ecosystem in which signifi -cant amounts of Se were volatilized from contaminated soil in a Salicornia fi eld (Lin et al. 2000; Lin et al. 2002). The removal of Se from sediments by volatilization has distinct advantanges as a remediation technology. This is because volatilization removes Se from the local sediment-plant ecosystem into the atmosphere, thereby minimizing its entry into the food chain. The predomi-nant form of volatile Se produced by plants and microbes, dimethyl selenide (DMSe), is ~600 times less toxic than selenate (Wilber, 1980). Even if volatile Se is deposited at sites distant from the point of origin, this is a relatively small problem in California because most of the state is defi cient in Se, and farmers currently provide Se supplements to their sheep and cattle to overcome the defi ciency. Thus, the development of Se volatilization as a strategy for the remediation of Se-contaminated sedi-ments is an innovative and environ-ment-friendly way to clean up Se.
Research in our laboratory over the past seven or eight years has centered on developing plant-based systems for enhancing phytoextraction and phytovolatilization of Se. To this end, we have genetically engineered Indian mustard plants that have different potentials for Se phytoremediation. One such transgenic line (referred to as APS) overexpresses the gene encod-ing ATP-sulfurylase, the rate-limiting enzyme responsible for the reduction of selenate to selenite (Pilon-Smits et
al. 1999). Transgenic Indian mustard lines overexpressing γ-glutamylcyste-ine synthetase (γ-ECS) and glutathione synthase (GS) have increased produc-tion of γ-glutamylcysteine (γ-EC) and glutathione (GSH), compounds that are important in protecting against oxidative and metal/metalloid stresses (Zhu et al. 1999a and 1999b). GSH is a major component of the active oxy-gen scavenging system of the cell and protects plant cells from metal-related oxidative stress damage (Noctor and Foyer, 1998). The APS lines have su-perior abilities to 1) tolerate high con-centrations of Se, and 2) take up 3-fold more Se per plant than the wild type. As the mechanism of the toxicity of selenite is reportedly similar to oxida-tive stress in yeast (Pinson et al., 2000), overexpressing (γ-ECS and GS could increase the tolerance of transgenic plants to high Se.
Our major goal in this work is to test the effi cacy of using different phy-toremediating plant systems for the remediation of drainage sediments. We are especially interested in comparing genetically engineered Indian mustard for their effi ciencies in Se phytoextrac-tion and phytovolatilization. Thus, we are currently investigating three differ-ent phytoremediation treatments, i.e., wildtype Indian mustard, genetically engineered Indian mustard, and un-planted control. The experiments are carried out by growing plants in pots containing drainage sediments in a greenhouse. The pots are used because 1) they avoid the need for special regu-latory permission to do fi eld tests with genetically modifi ed organisms, 2) they are far less expensive than fi eld stud-ies, and 3) they allow for more accurate control over experimental conditions. Indian mustard was chosen because of its known ability for Se phytoextraction (Banuelos et al., 1997b); it is tolerant to many toxic conditions, accumulates high concentrations of Se, and rapidly produces a large biomass. The use of the genetically engineered Indian mus-tard enables us to determine whether these transgenic plants, which have performed well under hydroponic conditions, are also capable of superior
Se phytoremediation when planted in soil.
Salinity is a major limiting factor often associated with high Se level in soils typical of the west side of the California Central Valley. Researchers have suggested that plants to be used for phytoremediation of Se must also be salt-tolerant (Banuelos et al. 1996). Tolerance to salinity may involve the exclusion of sodium ions (Na+) from the cytosol and the accumulation of osmoprotectants (such as betaines). Overexpression of a vacuolar Na+/H+ antiporter, AtNhx1, has been reported to successfully confer salt tolerance to Arabidopsis (Apse et al. 1999). In order to improve the salt tolerance of WT and other transgenic lines of Indian mustard, we introduced the AtNHX1 gene into these plant materials via hypocotyl transformation. Successful transformants should have increased tolerance to the saline environment of the sediment, thus leading to more effi -cient removal of Se from the sediment.
Below we report the results of pot experiments designed to determine 1) the proportion of Se-contaminated sediments to clean soil for establish-ing the Indian mustard plants, 2) the growth and Se accumulation of differ-ent genotypes of Indian mustard on the sediment, 3) changes in the chemi-cal speciation of Se in the sediment during phytoremediation, and 4) the mass balance of Se before and after phytoremediation. Preliminary tests for WT and transgenic Indian mustard (referred as APS8) to volatilize Se and the salt tolerance of WT and AtNHX1 transformants are also reported.
MATERIALS AND METHODSPLANT AND SEDIMENT MATERIALS
Wildtype Indian mustard (Bras-sica juncea) seeds were acquired from the North Central Regional Plant Introduction Station, Ames, IA (acces-sion no. 173847). Different transgenic lines of Indian mustard were chosen to compare their effi ciency for drain-age sediment phytoremediation. The transgenic plants were developed by earlier researchers in our laboratory
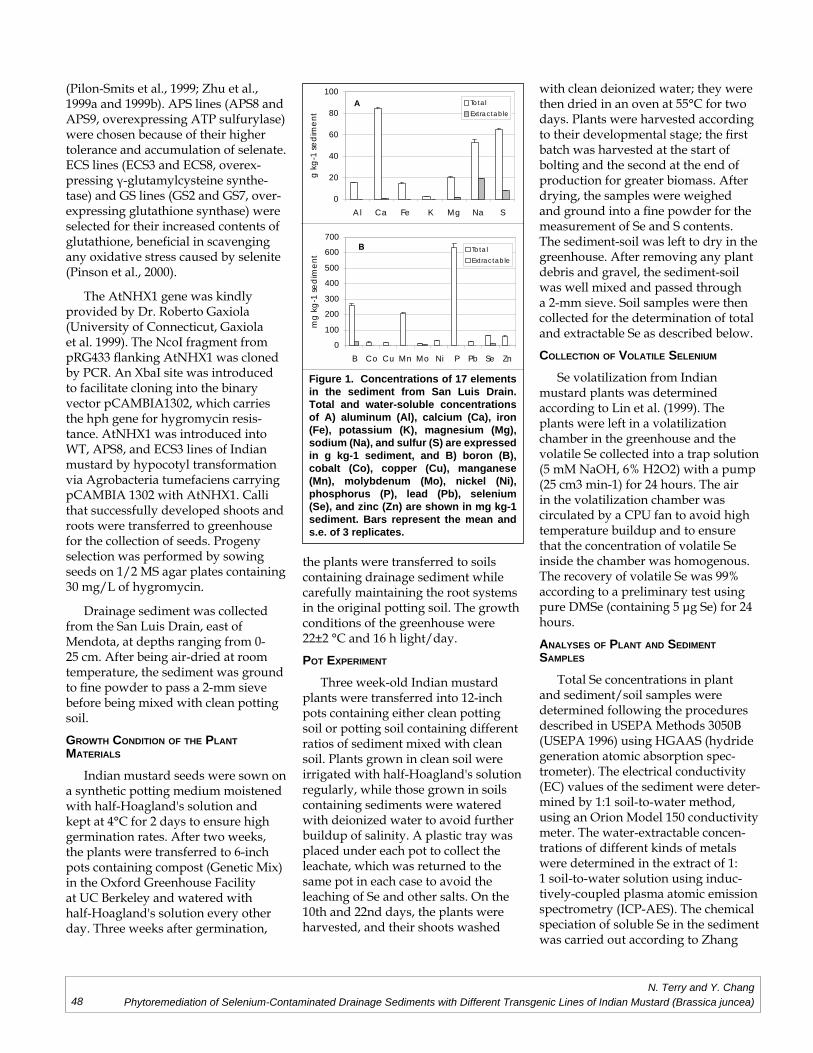
48
(Pilon-Smits et al., 1999; Zhu et al., 1999a and 1999b). APS lines (APS8 and APS9, overexpressing ATP sulfurylase) were chosen because of their higher tolerance and accumulation of selenate. ECS lines (ECS3 and ECS8, overex-pressing γ-glutamylcysteine synthe-tase) and GS lines (GS2 and GS7, over-expressing glutathione synthase) were selected for their increased contents of glutathione, benefi cial in scavenging any oxidative stress caused by selenite (Pinson et al., 2000).
The AtNHX1 gene was kindly provided by Dr. Roberto Gaxiola (University of Connecticut, Gaxiola et al. 1999). The NcoI fragment from pRG433 fl anking AtNHX1 was cloned by PCR. An XbaI site was introduced to facilitate cloning into the binary vector pCAMBIA1302, which carries the hph gene for hygro mycin resis-tance. AtNHX1 was introduced into WT, APS8, and ECS3 lines of Indian mustard by hypocotyl transformation via Agrobacteria tumefaciens carrying pCAMBIA 1302 with AtNHX1. Calli that successfully developed shoots and roots were transferred to greenhouse for the collection of seeds. Progeny selection was performed by sowing seeds on 1/2 MS agar plates containing 30 mg/L of hygromycin.
Drainage sediment was collected from the San Luis Drain, east of Mendota, at depths ranging from 0-25 cm. After being air-dried at room temperature, the sediment was ground to fi ne powder to pass a 2-mm sieve before being mixed with clean potting soil.
GROWTH CONDITION OF THE PLANT MATERIALS
Indian mustard seeds were sown on a synthetic potting medium moistened with half-Hoagland's solution and kept at 4°C for 2 days to ensure high germination rates. After two weeks, the plants were transferred to 6-inch pots containing compost (Genetic Mix) in the Oxford Greenhouse Facility at UC Berkeley and watered with half-Hoagland's solution every other day. Three weeks after germination,
the plants were transferred to soils containing drainage sediment while carefully maintaining the root systems in the original potting soil. The growth conditions of the greenhouse were 22±2 °C and 16 h light/day.
POT EXPERIMENT
Three week-old Indian mustard plants were transferred into 12-inch pots containing either clean potting soil or potting soil containing different ratios of sediment mixed with clean soil. Plants grown in clean soil were irrigated with half-Hoagland's solution regularly, while those grown in soils containing sediments were watered with deionized water to avoid further buildup of salinity. A plastic tray was placed under each pot to collect the leachate, which was returned to the same pot in each case to avoid the leaching of Se and other salts. On the 10th and 22nd days, the plants were harvested, and their shoots washed
with clean deionized water; they were then dried in an oven at 55°C for two days. Plants were harvested according to their developmental stage; the fi rst batch was harvested at the start of bolting and the second at the end of production for greater biomass. After drying, the samples were weighed and ground into a fi ne powder for the measurement of Se and S contents. The sediment-soil was left to dry in the greenhouse. After removing any plant debris and gravel, the sediment-soil was well mixed and passed through a 2-mm sieve. Soil samples were then collected for the determination of total and extractable Se as described below.
COLLECTION OF VOLATILE SELENIUM
Se volatilization from Indian mustard plants was determined according to Lin et al. (1999). The plants were left in a volatilization chamber in the greenhouse and the volatile Se collected into a trap solution (5 mM NaOH, 6% H2O2) with a pump (25 cm3 min-1) for 24 hours. The air in the volatilization chamber was circulated by a CPU fan to avoid high temperature buildup and to ensure that the concentration of volatile Se inside the chamber was homogenous. The recovery of volatile Se was 99% according to a preliminary test using pure DMSe (containing 5 µg Se) for 24 hours.
ANALYSES OF PLANT AND SEDIMENT SAMPLES
Total Se concentrations in plant and sediment/soil samples were determined following the procedures described in USEPA Methods 3050B (USEPA 1996) using HGAAS (hydride generation atomic absorption spec-trometer). The electrical conductivity (EC) values of the sediment were deter-mined by 1:1 soil-to-water method, using an Orion Model 150 conductivity meter. The water-extractable concen-trations of different kinds of metals were determined in the extract of 1:1 soil-to-water solution using induc-tively-coupled plasma atomic emission spectrometry (ICP-AES). The chemical speciation of soluble Se in the sediment was carried out according to Zhang
0
20
40
60
80
100
Al Ca Fe K Mg Na S
g k
g-1
se
dim
en
t
Total
Extractable
A
0
100
200
300
400
500
600
700
B Co Cu Mn Mo Ni P Pb Se Zn
mg
kg
-1 s
ed
ime
nt
Total
Extractable
B
Figure 1. Concentrations of 17 elements in the sediment from San Luis Drain. Total and water-soluble concentrations of A) aluminum (Al), calcium (Ca), iron (Fe), potassium (K), magnesium (Mg), sodium (Na), and sulfur (S) are expressed in g kg-1 sediment, and B) boron (B), cobalt (Co), copper (Cu), manganese (Mn), molybdenum (Mo), nickel (Ni), phosphorus (P), lead (Pb), selenium (Se), and zinc (Zn) are shown in mg kg-1 sediment. Bars represent the mean and s.e. of 3 replicates.
N. Terry and Y. ChangPhytoremediation of Selenium-Contaminated Drainage Sediments with Different Transgenic Lines of Indian Mustard (Brassica juncea)
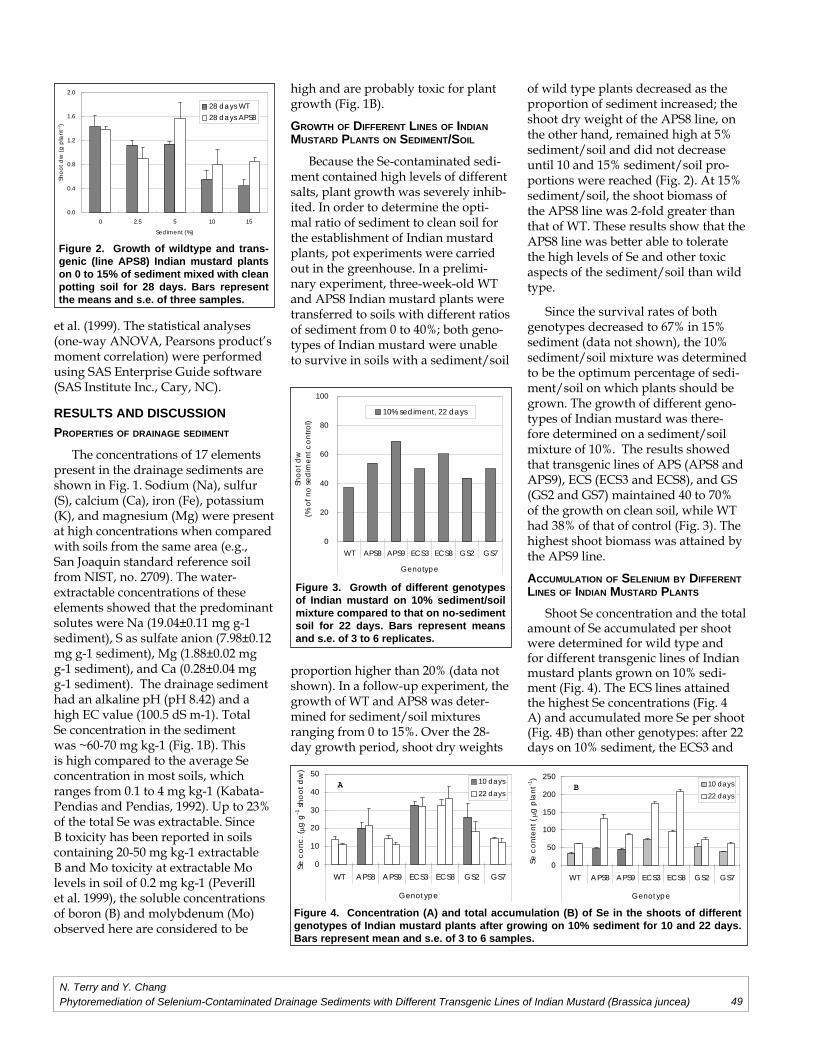
49
et al. (1999). The statistical analyses (one-way ANOVA, Pearsons product’s moment correlation) were performed using SAS Enterprise Guide software (SAS Institute Inc., Cary, NC).
RESULTS AND DISCUSSION PROPERTIES OF DRAINAGE SEDIMENT
The concentrations of 17 elements present in the drainage sediments are shown in Fig. 1. Sodium (Na), sulfur (S), calcium (Ca), iron (Fe), potassium (K), and magnesium (Mg) were present at high concentrations when compared with soils from the same area (e.g., San Joaquin standard reference soil from NIST, no. 2709). The water-extractable concentrations of these elements showed that the predominant solutes were Na (19.04±0.11 mg g-1 sediment), S as sulfate anion (7.98±0.12 mg g-1 sediment), Mg (1.88±0.02 mg g-1 sediment), and Ca (0.28±0.04 mg g-1 sediment). The drainage sediment had an alkaline pH (pH 8.42) and a high EC value (100.5 dS m-1). Total Se concentration in the sediment was ~60-70 mg kg-1 (Fig. 1B). This is high compared to the average Se concentration in most soils, which ranges from 0.1 to 4 mg kg-1 (Kabata-Pendias and Pendias, 1992). Up to 23% of the total Se was extractable. Since B toxicity has been reported in soils containing 20-50 mg kg-1 extractable B and Mo toxicity at extractable Mo levels in soil of 0.2 mg kg-1 (Peverill et al. 1999), the soluble concentrations of boron (B) and molybdenum (Mo) observed here are considered to be
high and are probably toxic for plant growth (Fig. 1B).
GROWTH OF DIFFERENT LINES OF INDIAN MUSTARD PLANTS ON SEDIMENT/SOIL
Because the Se-contaminated sedi-ment contained high levels of different salts, plant growth was severely inhib-ited. In order to determine the opti-mal ratio of sediment to clean soil for the establishment of Indian mustard plants, pot experiments were carried out in the greenhouse. In a prelimi-nary experiment, three-week-old WT and APS8 Indian mustard plants were transferred to soils with different ratios of sediment from 0 to 40%; both geno-types of Indian mustard were unable to survive in soils with a sediment/soil
proportion higher than 20% (data not shown). In a follow-up experiment, the growth of WT and APS8 was deter-mined for sediment/soil mixtures ranging from 0 to 15%. Over the 28-day growth period, shoot dry weights
of wild type plants decreased as the proportion of sediment increased; the shoot dry weight of the APS8 line, on the other hand, remained high at 5% sediment/soil and did not decrease until 10 and 15% sediment/soil pro-portions were reached (Fig. 2). At 15% sediment/soil, the shoot biomass of the APS8 line was 2-fold greater than that of WT. These results show that the APS8 line was better able to tolerate the high levels of Se and other toxic aspects of the sediment/soil than wild type.
Since the survival rates of both genotypes decreased to 67% in 15% sediment (data not shown), the 10% sediment/soil mixture was determined to be the optimum percentage of sedi-ment/soil on which plants should be grown. The growth of different geno-types of Indian mustard was there-fore determined on a sediment/soil mixture of 10%. The results showed that transgenic lines of APS (APS8 and APS9), ECS (ECS3 and ECS8), and GS (GS2 and GS7) maintained 40 to 70% of the growth on clean soil, while WT had 38% of that of control (Fig. 3). The highest shoot biomass was attained by the APS9 line.
ACCUMULATION OF SELENIUM BY DIFFERENT LINES OF INDIAN MUSTARD PLANTS
Shoot Se concentration and the total amount of Se accumulated per shoot were determined for wild type and for different transgenic lines of Indian mustard plants grown on 10% sedi-ment (Fig. 4). The ECS lines attained the highest Se concentrations (Fig. 4 A) and accumulated more Se per shoot (Fig. 4B) than other genotypes: after 22 days on 10% sediment, the ECS3 and
0.0
0.4
0.8
1.2
1.6
2.0
0 2.5 5 10 15
Sediment (%)
Sh
oo
t d
w (
g p
lan
t-1)
28 days WT
28 days APS8
Figure 2. Growth of wildtype and trans-genic (line APS8) Indian mustard plants on 0 to 15% of sediment mixed with clean potting soil for 28 days. Bars represent the means and s.e. of three samples.
0
20
40
60
80
100
WT APS8 APS9 ECS3 ECS8 GS2 GS7
Genotype
Sh
oo
t d
w
(% o
f n
o s
ed
ime
nt
co
ntr
ol)
10% sediment, 22 days
Figure 3. Growth of different genotypes of Indian mustard on 10% sediment/soil mixture compared to that on no-sediment soil for 22 days. Bars represent means and s.e. of 3 to 6 replicates.
0
10
20
30
40
50
WT APS8 APS9 ECS3 ECS8 GS2 GS7
Genotype
Se
co
nc
. (
g g
-1 s
ho
ot
dw
)
10 days
22 daysA
0
50
100
150
200
250
WT APS8 APS9 ECS3 ECS8 GS2 GS7
Genotype
Se
co
nte
nt
(g
pla
nt-1
)
10 days
22 daysB
Figure 4. Concentration (A) and total accumulation (B) of Se in the shoots of different genotypes of Indian mustard plants after growing on 10% sediment for 10 and 22 days. Bars represent mean and s.e. of 3 to 6 samples.
N. Terry and Y. ChangPhytoremediation of Selenium-Contaminated Drainage Sediments with Different Transgenic Lines of Indian Mustard (Brassica juncea)
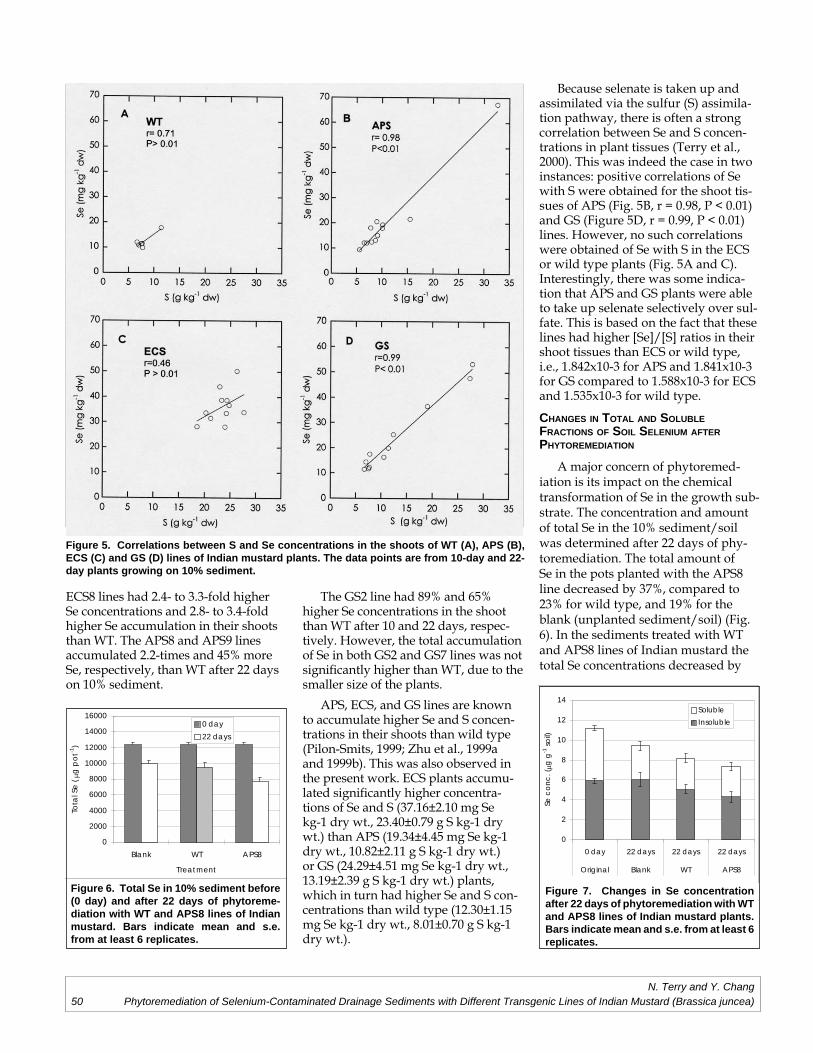
50
ECS8 lines had 2.4- to 3.3-fold higher Se concentrations and 2.8- to 3.4-fold higher Se accumulation in their shoots than WT. The APS8 and APS9 lines accumulated 2.2-times and 45% more Se, respectively, than WT after 22 days on 10% sediment.
Because selenate is taken up and assimilated via the sulfur (S) assimila-tion pathway, there is often a strong correlation between Se and S concen-trations in plant tissues (Terry et al., 2000). This was indeed the case in two instances: positive correlations of Se with S were obtained for the shoot tis-sues of APS (Fig. 5B, r = 0.98, P < 0.01) and GS (Figure 5D, r = 0.99, P < 0.01) lines. However, no such correlations were obtained of Se with S in the ECS or wild type plants (Fig. 5A and C). Interestingly, there was some indica-tion that APS and GS plants were able to take up selenate selectively over sul-fate. This is based on the fact that these lines had higher [Se]/[S] ratios in their shoot tissues than ECS or wild type, i.e., 1.842x10⁻³ for APS and 1.841x10⁻³ for GS compared to 1.588x10⁻³ for ECS and 1.535x10⁻³ for wild type.
CHANGES IN TOTAL AND SOLUBLE FRACTIONS OF SOIL SELENIUM AFTER PHYTOREMEDIATION
A major concern of phytoremed-ia tion is its impact on the chemical transformation of Se in the growth sub-strate. The concentration and amount of total Se in the 10% sediment/soil was determined after 22 days of phy-toremediation. The total amount of Se in the pots planted with the APS8 line decreased by 37%, compared to 23% for wild type, and 19% for the blank (unplanted sediment/soil) (Fig. 6). In the sediments treated with WT and APS8 lines of Indian mustard the total Se concentrations decreased by
The GS2 line had 89% and 65% higher Se concentrations in the shoot than WT after 10 and 22 days, respec-tively. However, the total accumulation of Se in both GS2 and GS7 lines was not signifi cantly higher than WT, due to the smaller size of the plants.
APS, ECS, and GS lines are known to accumulate higher Se and S concen-trations in their shoots than wild type (Pilon-Smits, 1999; Zhu et al., 1999a and 1999b). This was also observed in the present work. ECS plants accumu-lated signifi cantly higher concentra-tions of Se and S (37.16±2.10 mg Se kg-1 dry wt., 23.40±0.79 g S kg-1 dry wt.) than APS (19.34±4.45 mg Se kg-1 dry wt., 10.82±2.11 g S kg-1 dry wt.) or GS (24.29±4.51 mg Se kg-1 dry wt., 13.19±2.39 g S kg-1 dry wt.) plants, which in turn had higher Se and S con-centrations than wild type (12.30±1.15 mg Se kg-1 dry wt., 8.01±0.70 g S kg-1 dry wt.).
Figure 5. Correlations between S and Se concentrations in the shoots of WT (A), APS (B), ECS (C) and GS (D) lines of Indian mustard plants. The data points are from 10-day and 22-day plants growing on 10% sediment.
0
2000
4000
6000
8000
10000
12000
14000
16000
Blank WT APS8
Treatment
Tota
l Se
(g
po
t-1)
0 day
22 days
Figure 6. Total Se in 10% sediment before (0 day) and after 22 days of phytoreme-diation with WT and APS8 lines of Indian mustard. Bars indicate mean and s.e. from at least 6 replicates.
0
2
4
6
8
10
12
14
0 day 22 days 22 days 22 days
Original Blank WT APS8
Se
co
nc
. (
g g
-1 s
oil)
Soluble
Insoluble
Figure 7. Changes in Se concentration after 22 days of phytoremediation with WT and APS8 lines of Indian mustard plants. Bars indicate mean and s.e. from at least 6 replicates.
N. Terry and Y. ChangPhytoremediation of Selenium-Contaminated Drainage Sediments with Different Transgenic Lines of Indian Mustard (Brassica juncea)
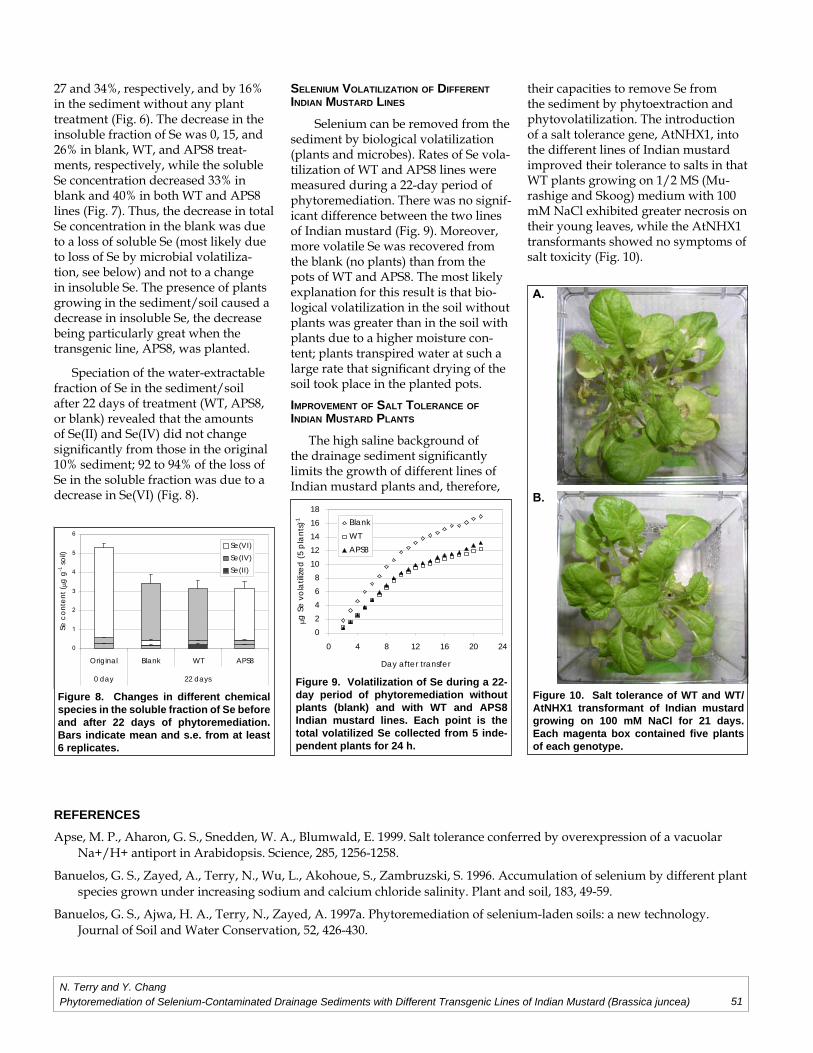
51
27 and 34%, respectively, and by 16% in the sediment without any plant treatment (Fig. 6). The decrease in the insoluble fraction of Se was 0, 15, and 26% in blank, WT, and APS8 treat-ments, respectively, while the soluble Se concentration decreased 33% in blank and 40% in both WT and APS8 lines (Fig. 7). Thus, the decrease in total Se concentration in the blank was due to a loss of soluble Se (most likely due to loss of Se by microbial volatiliza-tion, see below) and not to a change in insoluble Se. The presence of plants growing in the sediment/soil caused a decrease in insoluble Se, the decrease being particularly great when the transgenic line, APS8, was planted.
Speciation of the water-extractable fraction of Se in the sediment/soil after 22 days of treatment (WT, APS8, or blank) revealed that the amounts of Se(II) and Se(IV) did not change signifi cantly from those in the original 10% sediment; 92 to 94% of the loss of Se in the soluble fraction was due to a decrease in Se(VI) (Fig. 8).
SELENIUM VOLATILIZATION OF DIFFERENT INDIAN MUSTARD LINES
Selenium can be removed from the sediment by biological volatilization (plants and microbes). Rates of Se vola-tilization of WT and APS8 lines were measured during a 22-day period of phytoremediation. There was no signif-icant difference between the two lines of Indian mustard (Fig. 9). Moreover, more volatile Se was recovered from the blank (no plants) than from the pots of WT and APS8. The most likely explanation for this result is that bio-logical volatilization in the soil without plants was greater than in the soil with plants due to a higher moisture con-tent; plants transpired water at such a large rate that signifi cant drying of the soil took place in the planted pots.
IMPROVEMENT OF SALT TOLERANCE OF INDIAN MUSTARD PLANTS
The high saline background of the drainage sediment signifi cantly limits the growth of different lines of Indian mustard plants and, therefore,
their capacities to remove Se from the sediment by phytoextraction and phytovolatilization. The introduction of a salt tolerance gene, AtNHX1, into the different lines of Indian mustard improved their tolerance to salts in that WT plants growing on 1/2 MS (Mu-rashige and Skoog) medium with 100 mM NaCl exhibited greater necrosis on their young leaves, while the AtNHX1 transformants showed no symptoms of salt toxicity (Fig. 10).
0
2
4
6
8
10
12
14
16
18
0 4 8 12 16 20 24
Day after transfer
g S
e v
ola
tiliz
ed
(5
pla
nts
)-1 Blank
WT
APS8
Figure 9. Volatilization of Se during a 22-day period of phytoremediation without plants (blank) and with WT and APS8 Indian mustard lines. Each point is the total volatilized Se collected from 5 inde-pendent plants for 24 h.
0
1
2
3
4
5
6
Original Blank WT APS8
0 day 22 days
Se
co
nte
nt
(g
g-1
so
il)
Se(VI)
Se(IV)
Se(I I )
Figure 8. Changes in different chemical species in the soluble fraction of Se before and after 22 days of phytoremediation. Bars indicate mean and s.e. from at least 6 replicates.
REFERENCES
Apse, M. P., Aharon, G. S., Snedden, W. A., Blumwald, E. 1999. Salt tolerance conferred by overexpression of a vacuolar Na+/H+ antiport in Arabidopsis. Science, 285, 1256-1258.
Banuelos, G. S., Zayed, A., Terry, N., Wu, L., Akohoue, S., Zambruzski, S. 1996. Accumulation of selenium by different plant species grown under increasing sodium and calcium chloride salinity. Plant and soil, 183, 49-59.
Banuelos, G. S., Ajwa, H. A., Terry, N., Zayed, A. 1997a. Phytoremediation of selenium-laden soils: a new technology. Journal of Soil and Water Conservation, 52, 426-430.
A.
B.
Figure 10. Salt tolerance of WT and WT/AtNHX1 transformant of Indian mustard growing on 100 mM NaCl for 21 days. Each magenta box contained fi ve plants of each genotype.
N. Terry and Y. ChangPhytoremediation of Selenium-Contaminated Drainage Sediments with Different Transgenic Lines of Indian Mustard (Brassica juncea)
52
Banuelos, G. S., Ajwa, H. A., Mackey, B., Wu, L., Cook, C., Akohoue, C., Zambruzski, S. 1997b. Evaluation of different plant species used for phytoremediation of high soil selenium. Journal of Environmental Science, 26, 639-646.
de Souza, M. P., Chu, D., Zhao, M., Zayed, A. M., Ruzin, S. E., Schichnes, D., Terry, N. 1999. Rhizosphere bacteria enhance selenium accumulation and volatilization by Indian mustard. Plant Physiology, 119, 565-573.
Gaxiola, R. A., Rao, R., Sherman, A., Grisafi, P., Alper, S. L., Fink, G. R. 1999. The Arabidopsis thaliana proton transporters, AtNhx1 and Avp1, can function in cation detoxification in yeast. Proceedings of National Academy of Sciences, 96, 1480-1485.
Hansen, D., Duda, P., Zayed, A., Terry, N. 1998. Selenium removal by constructed wetlands: role of biological volatilization. Environmental Science and Technology, 32, 592-597.
Kabata-Pendias, A., Pendias, H. 1992. Trace elements in soils and plants. 2nd Ed. CRC Press. ISBN 0849366437.
Lin, Z.-Q. and Terry, N. 2000. Use of flow-through constructed wetlands for the remediation of selenium in agricultural tile-drainage water. Salinity/Drainage Program, Report 96-7. Center for Water Resources, University of California, Riverside, CA. pp 192-227.
Lin, Z.-Q., Schemenauer, R. S., Cervinka, V., Zayed, A., Lee, A., Terry, N. 2000. Selenium volatilization from a soil-plant system for the remediation of contaminated water and soil in the San Joaquin Valley. Journal of Environmental Quality, 29, 1048-1056.
Lin, Z.-Q., Cervinka, V., Pickering, I. J., Zayed, A., Terry, N. 2002. Managing selenium-contaminated agricultural drainage water by the integrated on-farm drainage management system: role of selenium volatilization. Water Research, 36, 3150-3160.
Noctor, G. and Foyer, C. H. 1998. Ascorbate and glutathione: keeping active oxygen under control. Annual Review of Plant Physiology and Plant Molecular Biology, 49, 249-279.
Peverill, K. I., Sparrow, L. A., Reuter, D. J. 1999. Soil Analysis, an interpretation manual. CSIRO Publishing. ISBN 0643063765.
Pilon-Smits, E. A. H., Hwang, S., Lytle, C. M., Zhu, Y., Tai, J. C., Bravo, R. C., Chen, Y., Leustek, T., Terry, N. Overexpression of ATP sulfurylase in Indian mustard leads to increased selenate uptake, reduction, and tolerance. Plant Physiology, 119, 123-132.
Pinson, B., Sagot, I., Daignan-Fornier, B. 2000. Identification of genes affecting selenite toxicity and resistance in Saccharomyces cerevisiae. Molecular Microbiology, 36(3), 679-687.
Richards, L. E., Ed. 1954. Diagnosis and improvement of saline and alkali soils. U.S. Salinity Labortory, U.S. Department of Agriculture Handbook 60.
Tanji, K. 1999. TLDD flow-through wetland system: inflows and outflows of water and total Se as well as water Se speciation and sediment Se fractionation. Report in the UC Salinity/Drainage Program’s Annual Report. Division of Agricultural and Natural Resources, University of California, pp 227-252.
Terry, N. 1998. Use of flow-through constructed wetlands for the removal of selenium in agricultural tile-drainage water. In: UC Salinity/Drainage Task Force, Division of Agricultural and Natural Resources, University of California (Annual Report for 1997-1998).
Terry, N. and Banuelos, G. S. (eds.) 2000. Phytoremediation of contaminated soil and water. Lewis Publishers, New York.
Wilber, C. G. 1980. Toxicology of selenium: a review. Clinical Toxicology, 17, 171-230.
Zhang, Y., Moore, J. N., Frankenberger, W. T. 1999. Speciation of soluble selenium in agricultural drainage water s and aqueous soil-sediment extracts using hydride generation atomic absorption spectrometry. Environmental Science and Technology, 33, 1652-1656.
Zhu, Y. L., Pilon-Smits, E. A. H., Jouanin, L., Terry, N. 1999a. Overexpression of glutathione synthase in Indian mustard enhances cadmium accumulation and tolerance. Plant Physiology, 119, 73-79.
Zhu, Y. L., Pilon-Smits, E. A. H., Tarun, A. S., Wber, S. U., Jouanin, L., Terry, N. 1999b. Cadium tolerance and accumulation in Indian mustard is enhanced by overexpressing γ-glutamylcysteine synthetase. Plant Physiology, 121, 1169-1177.
N. Terry and Y. ChangPhytoremediation of Selenium-Contaminated Drainage Sediments with Different Transgenic Lines of Indian Mustard (Brassica juncea)