Embed Size (px)
Citation preview
1
2009 – 2012 Triennium Work Report
June 2012
WORKING COMMITTEE 1: EXPLORATION AND PRODUCTION
Chair: Dr Amine Mazouzi
Algeria
2
Table of Contents
ABSTRACT ........................................................................................................................................................... 5
EXECUTIVE SUMMARY ................................................................................................................................... 7
ACKNOWLEDGEMENTS ................................................................................................................................ 11
REPORT OF STUDY GROUP 1 ....................................................................................................................... 12
1. RESOURCES & RESERVES ASSESSMENTS ..................................................................................... 13
1.1. INTRODUCTION ................................................................................................................................... 13 1.2. MAIN DEFINITIONS FOR RESERVES AND RESOURCES.......................................................................... 13
1.2.1. Reserves ........................................................................................................................................ 13 1.2.2. Resources ...................................................................................................................................... 13 1.2.3. Unconventional Gas ...................................................................................................................... 14 1.2.4. Resource Triangle Concept ........................................................................................................... 15 1.2.5. Worldwide Gas Resources ............................................................................................................ 15
1.3. RESERVES ........................................................................................................................................... 20
2. EXPLORATION AND DISCOVERIES TRENDS ................................................................................ 25
2.1. SETTING THE SCENE ........................................................................................................................... 25 2.2. THE ROLE OF EXPLORATION ............................................................................................................... 25 2.3. VALUE DRIVERS AND CHALLENGES ................................................................................................... 26 2.4. THE PORTFOLIO APPROACH ................................................................................................................ 26 2.5. GAS DISCOVERY TRENDS ................................................................................................................... 26
3. NEW FRONTIER & EXPLORATION AREAS .................................................................................... 29
3.1. INTRODUCTION ................................................................................................................................... 29 3.2. NEW OR FRONTIER EXPLORATION ...................................................................................................... 29 3.3. THE ARCTIC CIRCLE AREAS ................................................................................................................ 31
3.2.1. Norway .......................................................................................................................................... 31 3.2.2. Russia ............................................................................................................................................ 32 3.2.3. USA and Canada ........................................................................................................................... 33 3.2.4. Greenland (Denmark) ................................................................................................................... 33
3.4. LEVANTINE BASIN .............................................................................................................................. 34 3.5. MIDDLE EAST AREAS .......................................................................................................................... 35 3.6. AUSTRALIAN OFFSHORE ..................................................................................................................... 36 3.7. EAST AFRICA ...................................................................................................................................... 37 3.8. CENTRAL ASIA ................................................................................................................................... 38 3.9. DISCUSSION ........................................................................................................................................ 40
4. RECENT TECHNOLOGIES AND GAS DEVELOPMENT STANDARDS ....................................... 42
4.1. BRAZILIAN PRE-SALT ......................................................................................................................... 42 4.1.1 Introduction ................................................................................................................................... 42 4.1.2 Reservoirs ...................................................................................................................................... 42 4.1.3 CO2 ............................................................................................................................................... 43 4.1.4 Subsea systems .............................................................................................................................. 44 4.1.5 Alternatives for the Subsea System ................................................................................................ 46 4.1.6 Gas Treatment and Compression Plant ........................................................................................ 49 4.1.7 Carbon dioxide removal technologies ........................................................................................... 50 4.1.8 Hydrogen sulfide removal technologies ........................................................................................ 51 4.1.9 Water and Hydrocarbon dew point control technologies.............................................................. 52 4.1.10 Design of the compression units ............................................................................................... 54 4.1.11 Gas Pipeline ............................................................................................................................. 56
4.2. ARCTIC SHELF IN RUSSIA ................................................................................................................... 57 4.2.1. Introduction ................................................................................................................................... 57 4.2.2. Challenges ..................................................................................................................................... 57 4.2.3. Main Projects ................................................................................................................................ 59
4.3. ADVANCES IN UNCONVENTIONAL GAS TECHNOLOGIES ..................................................................... 62
3
4.3.1. Introduction ................................................................................................................................... 62 4.3.2. Reservoir Characterization Technologies ..................................................................................... 63 4.3.3. Drilling and Completion Technologies ......................................................................................... 66 4.3.4. Well Production and Performance Prediction Technologies ........................................................ 69
4.4. TIGHT GAS IN CHINA .......................................................................................................................... 72 4.4.1 Introduction ................................................................................................................................... 72 4.4.2 Challenges ..................................................................................................................................... 73 4.4.3 Technology and Innovation ........................................................................................................... 74
4.5. CO2 IN MALAYSIA .............................................................................................................................. 79 4.5.1 Introduction ................................................................................................................................... 79 4.5.2 Challenges ..................................................................................................................................... 79 4.5.3 The Game Play .............................................................................................................................. 79
REPORT OF STUDY GROUP 2 ....................................................................................................................... 82
1. INTRODUCTION, OBJECTIVES AND RECOMMENDATIONS ..................................................... 83
1.1 2003-2006 TRIENNIUM ............................................................................................................................ 83 1.2 2006-2009 TRIENNIUM ............................................................................................................................ 83 1.3 FLAGSHIP DEVELOPMENTS ...................................................................................................................... 87
2. SECTION I – CONVENTIONAL AND COMPLEX PROJECTS ....................................................... 89
2.1 HARSH ENVIRONMENT AND/OR REMOTE AREAS ...................................................................................... 89 2.1.1 Offshore ......................................................................................................................................... 90 2.1.2 Deserts .......................................................................................................................................... 90 2.1.3 Rainforests .................................................................................................................................... 90
2.2 FLAGSHIP DEVELOPMENTS ...................................................................................................................... 91 2.2.1 Arctic ............................................................................................................................................. 91 2.2.2 Arctic onshore ............................................................................................................................... 91 2.2.3 Arctic offshore ............................................................................................................................... 91 2.2.4 Offshore - Deepwater .................................................................................................................... 92
2.3 TECHNICAL CHALLENGES (DEEP GAS, HP/HT, SOUR GAS) ....................................................................... 93 2.3.1 Deep gas ........................................................................................................................................ 93 2.3.2 HP – HT (High Pressure – High Temperature) ............................................................................ 95 2.3.3 Sour gas ......................................................................................................................................... 95
2.4 SCALE THAT REQUIRES AD-HOC SOLUTIONS ............................................................................................ 97
3. SECTION II – UNCONVENTIONAL GAS DEVELOPMENTS ....................................................... 100
3.1 BASICS .................................................................................................................................................. 100 3.1.1 Tight Sands Gas .......................................................................................................................... 101 3.1.2 Shale Gas .................................................................................................................................... 101 3.1.3 Coalbed Methane ........................................................................................................................ 102 3.1.4 Methane Hydrates ....................................................................................................................... 102
3.2 REGULATION – GENERAL FRAMEWORK ................................................................................................ 103 3.2.1 Access to resources ..................................................................................................................... 103 3.2.2 Declaration of Commerciality, Entitlement and Quantification of reserves ............................... 104 3.2.3 Prices and Economics ................................................................................................................. 104 3.2.4 Infrastructure to market .............................................................................................................. 105
3.3 ENVIRONMENTAL ISSUES ...................................................................................................................... 105 3.3.1 Land Use ..................................................................................................................................... 105 3.3.2 Drilling and Fracturing approvals, Frac fluids disclosure ......................................................... 106 3.3.3 Well Integrity ............................................................................................................................... 107 3.3.4 Water Management ..................................................................................................................... 107 3.3.5 Methane Emissions ...................................................................................................................... 107
3.4 RISK ASSESSMENT ................................................................................................................................. 108 3.4.1 Phases ......................................................................................................................................... 108 3.4.2 Economic Evaluation Techniques ............................................................................................... 109
3.5 REGIONAL OVERVIEW ........................................................................................................................... 111 3.5.1 United States ............................................................................................................................... 111 3.5.2 Beyond United States .................................................................................................................. 111

4
3.5.3 America ....................................................................................................................................... 113 3.5.4 Europe ......................................................................................................................................... 114 3.5.5 North Africa ................................................................................................................................ 116 3.5.6 Asia.............................................................................................................................................. 116 3.5.7 Australia ...................................................................................................................................... 116
REFERENCES .................................................................................................................................................. 118
APPENDIX 1: LIST OF FIGURES ................................................................................................................ 124
APPENDIX 2: NAMES OF MEMBERS AND COUNTRIES ...................................................................... 126
5
Abstract The comprehensive report, made by two study groups, has covered two topics, the Recent Advances in Exploration & Production of NG and the Current and Future Developments of Gas Production. The main results delivered by the first study stated that: Price, technology and accessibility of supplies make the total natural gas reserves highly uncertain, although resources appear not to be an issue. According to the International Energy Agency (IEA), the world may have twice as much natural gas than previously thought. The role of exploration as a resource capture option for the companies is at a high level but slightly decreasing through the last three years. Wood Mackenzie’s survey shows that beside the main drivers for exploration, which are value creation and reserves replacement, the most significant challenges for the E&P producers crystallize on portfolio strengthening, competition and risk management, over the past 3 years. Although global exploration expenditures (oil and gas) are balanced between frontier exploration, emerging and mature exploration (one third each). Unconventional exploration is still low, (<20%) but within a clear increasing trend. The hottest gas exploration areas are not necessarily coinciding with the areas of largest existing gas reserves, indicating that there are still new gas areas dawning to develop and providing future gas supply above and beyond the existing gas reserves areas. The success of Frontier exploration is dependent on new technological innovations that allow facing these challenges by drilling deeper and safer, and by designing creative production facilities. It is also largely dependent on the political support of the countries, which should be establishing the necessary incentives to take risks. In Brazil, Petrobras’ efforts in terms of highest 3-D world seismic program, drilling at a depth range from 5000 to 7,600 meters from the water line, has enabled to discover a giant gas accumulation in Pre Salt Brazilian off shore basin. The membrane permeation is the chosen technology for CO2 removal as well as H2S adsorption with metallic oxides seems to be the preferred technology for gas pipeline transportation. In Russia, the arctic shelf (Yamal & Shtokman) currently experiences a number of novel technologies and technological solutions such as application of heat-insulated pipes, reduction in the number of monitoring wells , the first instance of applying high-resistant steel as well as new welding technologies and materials and application of brand new energy saving equipment. The Shtokman gas and condensate field development project has a strategic significance because its implementation will become a pivotal point to form a new gas producing region on the Russian Arctic shelf. In China, because of complicated geologic conditions and low-grade resources, Sulige tight
Gas Field is required to seek technical innovation and low-cost solutions for economical and effective development. Six core technologies are playing important roles in this context: Well Location Optimization, Fast Drilling, Inter-well Concatenation, Separate Layer Fracturing and Commingled Production, Downhole Choking and Remote Control.
6
And In Malaysia, technologies across the carbon management chain, are developed and tested to achieve economic production of gas fields with more than 70% CO2 content. In particular, it involves separation (physical and membrane), transport and sequestration innovative technologies. The main objective of the second study, is to substantiate the outlook of the E&P Conventional Gas Projects and Unconventional Developments on a worldwide basis up to 2020 Given the most important conclusions from the two precedent Reports released by IGU – WOC 1: 2003-2006 Triennium and. 2006-2009 Triennium, gas developments presented us cost challenges associated with increasingly tight reservoirs, complex structures or environmental concerns. Unconventional natural gas resources are widespread… Therefore, the key issue is not discovering these resources, but identifying areas where the commercial drivers enable their economic development while ensuring safe and environmentally friendly operations. Nowadays, the supply dynamics are deeply intertwined with demand factors –volumes and prices- and with policy. Adequacy of demand and of policies has been driving supply response, and is expected to continue being so. Price mechanisms are currently under review; in particular; the link of gas prices to oil prices. The implications that the newly adopted mechanisms will have in the absolute level of prices will be a fundamental element for future developments. The world’s resource endowment is massive, easily adequate to sustain such a supply increase up to 2020 and well beyond. However, the future of gas production will be far more complex than in the past due to the challenges of exploiting new resources and the diversification of alternatives. Complexity and diversification will call for best practices and best management along the entire chain of the project cycle, while the commercial viability of individual projects will remain subject to risk and uncertainty. Technical complexity is not only due to the increasing challenges of each hurdle (e.g. drilling deeper), but also to the fact that complex projects typically involve a combination of more than one challenge (e.g. drilling deeper HP/HT sour gas wells), which increases the overall risk associated with the project.
7
Executive Summary The IGU 2009 - 2012 triennium takes place within a unique economic framework that can be characterised by significant slowing in global growth and a constant increase in world natural gas consumption. This increase in demand requires new gas resources in the form of conventional and unconventional discoveries; the development of which must adhere to rigorous processes in order to provide suitable supplies at an appropriate market price.
The exploration and development of these new gas resources is capital-intensive and time-consuming, but has the potential to significantly increase reserves and production once resources have been identified.
The report focuses on how significant advances in natural gas exploration and production for both conventional and unconventional gas are aimed at securing a sustainable supply for global development.
Two study groups have been assigned to deal with specific aspects related to:
1. Recent Advances in Exploration and Production of Natural Gas;
2. Current and Future Developments of Gas Production
Study group 1.1 (SG 1.1) pursued the work initiated during the 2006 – 2009 triennium. Resource and Reserve estimations of both conventional and unconventional natural gas have been updated according to IGU regional distribution using published data. Variances have been assessed and their driving factors identified. Analysis of global and regional exploration key statistical indicators, in terms of efforts (investments, wells drilled), results (success ratios, volumes discovered) and updated creaming curves for significant gas provinces has been undertaken. Global trends for areas that will significantly contribute to mid/long term gas supply have also been highlighted.
The study focuses on E&P activity for assessing, developing and producing new gas resources from deep horizons (beneath already producing ones) as well as frontier areas. New hotspots and indirect exploration techniques are described using case studies.
Current exploration hotspots and the likely future E&P trends in new plays have been identified. A review of recent development technologies and standards linked to gas development using typical examples for both conventional and unconventional gas are included.
Technology trials on real fields have been highlighted as well as techniques having important implications for sustainable development and environmental preservation.
Natural gas resource assessments have recently increased as a result of technologies that can produce gas economically from source rock such as shale gas in ways previously not considered feasible (the so-called ―shale gas revolution‖).
Almost three-quarters of the world's natural gas reserves are located in the Middle East and Eurasia. Russia, Iran, and Qatar together account for about 53.2 percent of the world's natural gas reserves, as of end 2010.
A combined approach of overcoming technical challenges and reassessing increasingly harsh fiscal terms will result in more attractive economics and consequently higher reserves
8
figures. It will also encourage dynamic gas exploration efforts in many promising basins across all continents.
There is potential remaining in many locations and those major discoveries announced in recent years highlight that reserve replacement can be sustained by exploration for some time yet.
Exploring in new areas may be exciting and valuable and may change the face of a company or even a country. However, the success of frontier exploration relies on the capacity to bring discoveries to the market and is therefore dependent on technological innovation. Recent Technologies and Gas Development Standards have been applied to Brazilian Pre-Salt and the Arctic shelf in Russia. One of the main challenges for pre-salt developments is related to the management of carbon dioxide (CO2) which is found in some wells. Petrobras and its co-venturer‘s are looking at different options for managing the CO2 in order that it is not released into the atmosphere.
Russia‘s Arctic shelf is estimated to hold a huge amount of natural gas but it faces colossal technological challenges in order that these reserves can be successfully and responsibly exploited. These challenges require solutions to a myriad of new problems, and some will require the development of completely new and ultra-efficient technologies, as well as better ways to minimize any impact on the environment and the fragile ecosystem as a whole.
Over the past decade advances in unconventional gas technologies have seen a huge shift towards the production of natural gas from unconventional reservoirs. These reservoirs are commonly defined as having low-permeability and requiring hydraulic fracture stimulation to produce gas at economic rates. Unconventional reservoirs include coal seam gas (CSG), sandstones and carbonates (tight gas), and shale gas.
Perhaps the most important technological advances in this respect are horizontal drilling and hydraulic fracture stimulation. Both are key to creating drainage flow paths in these tight reservoirs.
The study on Current and Future Developments of Gas Production, conducted by Study Group 1.2 (SG 1.2), aimed to assess the outlook for E&P conventional gas projects and unconventional developments on a worldwide basis up to 2020. The drivers, economic criteria, enabling factors and hurdles that determine how gas resources become economically and environmentally viable production have been identified.
By 2020, the need to develop new projects in terms of additions to worldwide production capacity is estimated to be in the range of 1.3 to 2.1 TCM/y. This is 0.5 TCM/y higher than the estimated volume added by those projects that were developed between 2001 and 2010.
The resources are massive; easily adequate to sustain the expected worldwide supply increase up to 2020 and well beyond, by the development of both, conventional and complex projects and unconventional resources.
Although the study is focused on E&P developments and their impact on supply potential the supply dynamics are deeply intertwined with demand factors – volumes and prices - and policy. Adequacy of demand and policy has and will drive supply responses.
Price mechanisms are currently under review; in particular; the link between gas and oil prices. For the purpose of this report, the implications of the newly adopted mechanisms on the absolute level of prices will be fundamental for future developments.
9
The main global trends in conventional and complex projects, have been analyzed by identifying the technological advances that have and will continue to enable these kind of developments; geologically conventional targets in harsh environments or remote areas, those that face new technical challenges, and/or those requiring ad-hoc solutions.
There is no agreed definition of unconventional gas, though it now usually refers to gas resources which unlike classical reservoirs are not confined by geological discrete boundaries, are regional in extent, not buoyant upon water, and subject to abnormal pressures.
Exploration, appraisal and production techniques including horizontal drilling, pad drilling, and fracking using water and chemical additives are conventional and have been used across the oil and gas industry for many decades. What has changed is that these techniques have become progressively more technologically advanced and cost efficient; together with the rapid pace of adopting and integrating innovative features in all of them.
During the last decades of the twentieth century, the Oil & Gas industry has focused on finding remaining traps of conventional hydrocarbons. Since the beginning of the 2000s and due to the massive volumes of unconventional resources and their distribution over very large areas; the focus has been shifting from ―finding reservoirs‖ towards ―finding proper conditions to produce‖.
Even when the undertakings are characterised by low finding risk, the high degree of the many other uncertainties through all stages of development call for the application of risk management tools usually utilised for exploration risk assessment.
Unconventional plays are statistical in nature due to the heterogeneous geological characteristics of the different plays and within each play itself. This is a fundamental fact for estimating economic value and production potential of the plays, as the production performance of the wells show wide variations from well to well, even for wells within narrow distances in the same play.
About Regional undertakings:
United States natural gas production increased by almost 20% between 2006 and 2010. Unconventional natural gas production up to 2020 will increase mainly due to the shale plays.
Canada has significant unconventional resources of natural gas with nearly 50% currently defined as potential.
For Argentina, unconventional gas prospects are of particular interest due to better market prices. The most advanced shale plays in Argentina are in the Neuquén Basin.
In Europe, the biggest untapped potential is believed to be in Poland, France, Romania, Germany, UK and Sweden, where the geological components appear to be present, but simple extrapolations from US plays are difficult.
In Algeria NOC´s and IOC‘s signed this year a Memorandum of Understanding with Sonatrach to better assess the shale gas resources and developments, including drilling a pilot well.
For China, shale gas developments have been included in China´s 12th five-year plan; for which, it is expected that 30 areas will be identified; proving reserves for around 1 TCM and

10
producing around 30 BCM/y.
India is a country of interest for unconventional gas developments. A total of 33 CBM blocks are due to be awarded in four Bidding Rounds. India is expected to launch the first bid round of shale gas blocks by the end of 2013.
In Australia unconventional gas is dominated by coal seam gas which currently represents around 25% of Australian gas production.
In Oman BP is considering an investment of 15 billion USD over a 10-year period for the full-field development of its Block 61 tight gas fields.
11
Acknowledgements We wish to acknowledge members of the Working Committee 1 for their engagement, advice, review of various materials and those, who provided information, reviewed and wrote reports. This report was prepared under the supervision of Denis K. Dinelli , WOC1 Vice Chair, Petrobras , Brazil and Flavia Di Cino, leader of Study Group 2, Tenaris, Argentina. The report benefited from participants in WOC1 meetings in: Oran- Algeria in September 2010 & February 2012,
Buenos Aires – Argentina, November 2010
Rio de Janeiro– Brazil, March 2011
Paris- France, October 2011
The following chapters of the SG 1 report were written by: Resources & Reserves Assessments – Ilhane Dib, Sonatrach, Algeria ,
Exploration and Discoveries Trends - Gregor Hollmann, E.ON Ruhrgas E&P, Germany
and Anthony Lewis, BG Group, UK. Thanks are given to Wood Mackenzie for providing
the opportunity to base this chapter on Wood Mackenzie‘s confidential report ―The Future
of Exploration Survey‖, issued in February 2011. Thanks are given to David Parkinson,
Wood Mackenzie, Singapore for valuable support.
New Frontier & Exploration Areas – Vincent Trocme, GDFSUEZ, France.
Recent Technologies and Gas Development Standards - Ana Maria Teixeira de Andrade,
Vitor de Souza Lima & Denis Krambeck Dinelli, from Petrobras, Brazil, Sergey Leonov,
Boris Sharipov and Ekaterina Litvinova, from Gazprom, Russia, Yang Dong, from
Petrochina, China, Adif Zulkifli and Nasir B. Darman, from Petronas. Thanks are given to
Creties Jenkins from DeGolyer and MacNaughton, US, to have contributed to this
chapter.
The chapters of SG 2 report were written by Flavia Di Cino & Fernando J. Bado from Tenaris, Argentina.
12
2009 – 2012 Triennium Work Report
June 2012
Report of Study Group 1
Recent Advances in Exploration & Production of Natural Gas
Leader: Denis Krambeck Dinelli
Brazil
13
1. Resources & Reserves Assessments 1.1. Introduction
Natural gas resource assessments have seen an increase recently, thanks to new technologies that can economically produce gas from source rock not previously considered feasible (the so-called ‗shale gas revolution‘). The application of technologies such as horizontal drilling and hydraulic fracturing has enabled resource assessments to include much higher volumes of gas in the technically recoverable categories. This change has transformed in particular the outlook for natural gas supply in North America, from one of declining domestic supply and increasing imports to one of abundant supply from within the region for decades to come, most likely at moderate cost. According to the International Energy Agency (IEA), the world may have twice as much natural gas as previously thought; approximately 250 years of gas usage at current levels from unconventional gas, shale and coal beds. However, the total is uncertain, and highly dependent on price, technology and the accessibility of supplies. The US achieved this change through a technological breakthrough in which firms found a way of using tiny explosions to free gas previously trapped in a common rock - shale. Other nations are now rushing to replicate the US success by exploiting the gas trapped in various types of rock previously thought to be impossible to access. The IEA estimates that we probably have 920 trillion cubic meters - that is more than 300 times the current annual demand for gas. 1.2. Main Definitions for Reserves and Resources
1.2.1. Reserves Reserves are those quantities of petroleum anticipated to be commercially recoverable through development of known accumulations, from a given date forward, under defined conditions (such as prevailing economic conditions, operating practices, and government regulations). Reserves must satisfy four criteria: they must be discovered, recoverable, commercial, and producible based on current development plans. Depending on the level of certainty associated with the estimates and their development and production status, reserves are categorized as Proved, Probable, or Possible (also commonly referred to as P1, P2, or P3, respectively). 1.2.2. Resources Resources are those quantities of petroleum estimated, as of a given date, to be potentially (or technically) recoverable from known or undiscovered accumulations, (exclusive of Reserves). Such resources are classified as Contingent or Prospective Resources depending on whether the accumulation is known or undiscovered, respectively. The resources in known or yet to be discovered accumulations represent, for a give point in time, the technically recoverable portion of the in-place gas volume. Developments in technology as well as geologic understanding of a reservoir or commodity can make previously uneconomic resources commercially viable.
14
Undiscovered Resources are those which are thought to exist outside of known accumulations on the basis of geological knowledge and theory. The usual method of assessment for conventional, undiscovered resources is to analyse the size, characteristics and number of known accumulations is order to estimate numbers and sizes of those which may remain to be discovered. Often, when there is little or no data for the basin or region under study, analogues to known petroleum regions, including their characteristics and properties, are used to estimate resources. The predicted volumes in undrilled potential accumulations reflect estimated undiscovered resources. These estimates must take into account the average prospecting success rate, number of undrilled remaining prospects, and the predicted size characteristics for the future discoveries. The results of such analyses carry a much greater uncertainty (wider range of volumetric outcomes) than that associated with remaining reserves in existing fields because there is less data on which to base the estimate. It is worth remembering that resource estimates are merely snapshots in time. Since there is a finite resource of liquid hydrocarbons, from which more is produced each year, the logical conclusion would be that resource estimates for what remains should be going down. This is not the case. In fact, an organization‘s resource estimates tend to increase over time due to the combined effect of more and better data, new acreage that was previously inaccessible or considered non-prospective, and new play types made feasible by technological progress (e.g. shale gas, subsalt oil). 1.2.3. Unconventional Gas
In the l970s, the United States Government declared that tight sands, coal beds, and shales were to be considered as unconventional gas reservoirs and would be eligible for higher gas prices or tax credits (Section 29 tax credit). The government defined a tight gas sand formation as a reservoir where the expected permeability would be less than 0.1md. In fact, the definition of a ―tight gas‖ reservoir is a function of several physical and economic factors, and applies to many types of reservoirs. The best way to define a tight gas reservoir is that ―the reservoir cannot be produced at economic flow rates or recover economic volumes of natural gas unless the well is stimulated by a large hydraulic fracture treatment, horizontal wellbore, or by using multilateral wellbores‖ (Holditch, 2006).
According to Holditch, 2006 there are no ―typical‖ unconventional gas reservoirs. An
unconventional gas reservoir may be deep or shallow, high pressure or low pressure, high temperature or low temperature, blanket or lenticular geometry; homogeneous or heterogeneous, naturally fractured or not, single layered or multilayered, water productive or not and it may contain thermogenic or biogenic gas. It is this complexity that requires the continual development of new exploration philosophies and technologies to facilitate discovery and economic resource development.
The U.S. Geological Survey (USGS) uses the term ‗continuous accumulation‘ to define
unconventional gas resources such as coalbed gas, tight gas sands and shale gas, that are economically produced but are not found in conventional reservoirs.
Continuous accumulations are hydrocarbon accumulations (oil or gas) that have large
spatial dimensions and indistinctly defined boundaries, and which exist more or less independently of the subsurface water column. Another key difference between conventional and unconventional accumulations is that some of these (shales and coals) are both source rock and reservoir rock.
15
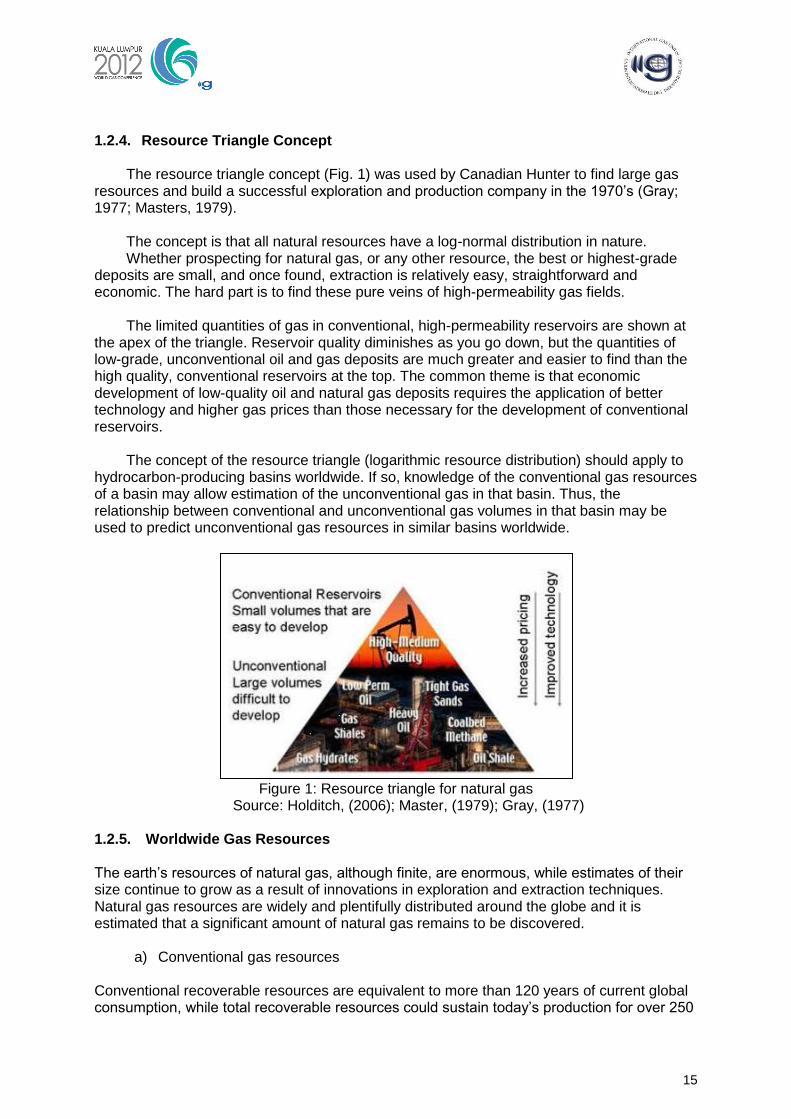
1.2.4. Resource Triangle Concept
The resource triangle concept (Fig. 1) was used by Canadian Hunter to find large gas resources and build a successful exploration and production company in the 1970‘s (Gray; 1977; Masters, 1979).
The concept is that all natural resources have a log-normal distribution in nature. Whether prospecting for natural gas, or any other resource, the best or highest-grade
deposits are small, and once found, extraction is relatively easy, straightforward and economic. The hard part is to find these pure veins of high-permeability gas fields.
The limited quantities of gas in conventional, high-permeability reservoirs are shown at
the apex of the triangle. Reservoir quality diminishes as you go down, but the quantities of low-grade, unconventional oil and gas deposits are much greater and easier to find than the high quality, conventional reservoirs at the top. The common theme is that economic development of low-quality oil and natural gas deposits requires the application of better technology and higher gas prices than those necessary for the development of conventional reservoirs.
The concept of the resource triangle (logarithmic resource distribution) should apply to
hydrocarbon-producing basins worldwide. If so, knowledge of the conventional gas resources of a basin may allow estimation of the unconventional gas in that basin. Thus, the relationship between conventional and unconventional gas volumes in that basin may be used to predict unconventional gas resources in similar basins worldwide.
Figure 1: Resource triangle for natural gas
Source: Holditch, (2006); Master, (1979); Gray, (1977)
1.2.5. Worldwide Gas Resources The earth‘s resources of natural gas, although finite, are enormous, while estimates of their size continue to grow as a result of innovations in exploration and extraction techniques. Natural gas resources are widely and plentifully distributed around the globe and it is estimated that a significant amount of natural gas remains to be discovered.
a) Conventional gas resources
Conventional recoverable resources are equivalent to more than 120 years of current global consumption, while total recoverable resources could sustain today‘s production for over 250
16
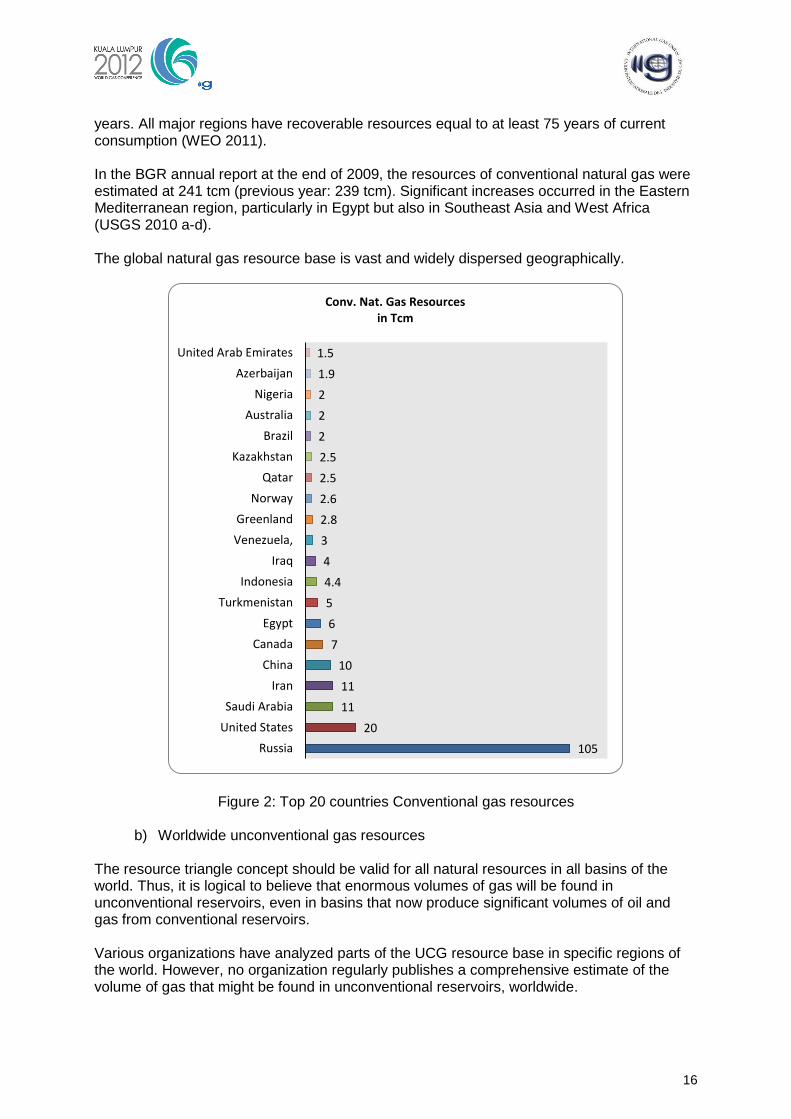
years. All major regions have recoverable resources equal to at least 75 years of current consumption (WEO 2011). In the BGR annual report at the end of 2009, the resources of conventional natural gas were estimated at 241 tcm (previous year: 239 tcm). Significant increases occurred in the Eastern Mediterranean region, particularly in Egypt but also in Southeast Asia and West Africa (USGS 2010 a-d). The global natural gas resource base is vast and widely dispersed geographically.
Figure 2: Top 20 countries Conventional gas resources
b) Worldwide unconventional gas resources
The resource triangle concept should be valid for all natural resources in all basins of the world. Thus, it is logical to believe that enormous volumes of gas will be found in unconventional reservoirs, even in basins that now produce significant volumes of oil and gas from conventional reservoirs. Various organizations have analyzed parts of the UCG resource base in specific regions of the world. However, no organization regularly publishes a comprehensive estimate of the volume of gas that might be found in unconventional reservoirs, worldwide.
105
20
11
11
10
7
6
5
4.4
4
3
2.8
2.6
2.5
2.5
2
2
2
1.9
1.5
Russia
United States
Saudi Arabia
Iran
China
Canada
Egypt
Turkmenistan
Indonesia
Iraq
Venezuela,
Greenland
Norway
Qatar
Kazakhstan
Brazil
Australia
Nigeria
Azerbaijan
United Arab Emirates
Conv. Nat. Gas Resources in Tcm
17
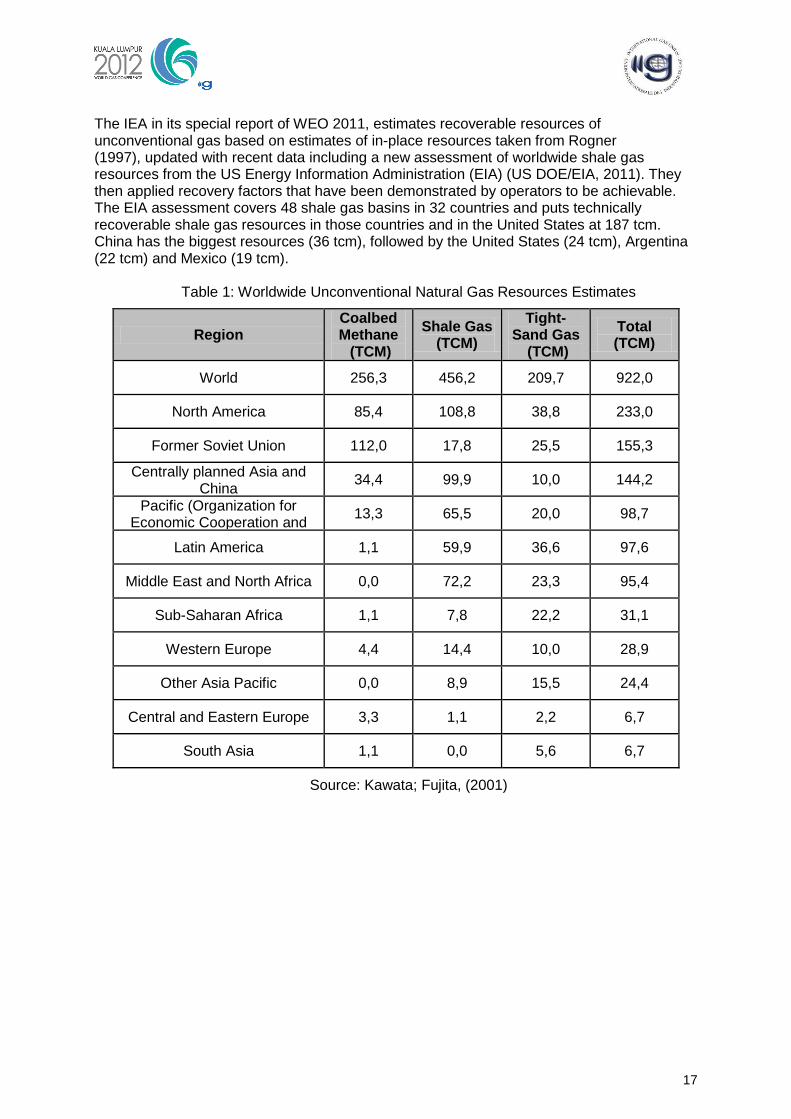
The IEA in its special report of WEO 2011, estimates recoverable resources of unconventional gas based on estimates of in-place resources taken from Rogner (1997), updated with recent data including a new assessment of worldwide shale gas resources from the US Energy Information Administration (EIA) (US DOE/EIA, 2011). They then applied recovery factors that have been demonstrated by operators to be achievable. The EIA assessment covers 48 shale gas basins in 32 countries and puts technically recoverable shale gas resources in those countries and in the United States at 187 tcm. China has the biggest resources (36 tcm), followed by the United States (24 tcm), Argentina (22 tcm) and Mexico (19 tcm).
Table 1: Worldwide Unconventional Natural Gas Resources Estimates
Region Coalbed Methane (TCM)
Shale Gas (TCM)
Tight-Sand Gas
(TCM)
Total (TCM)
World 256,3 456,2 209,7 922,0
North America 85,4 108,8 38,8 233,0
Former Soviet Union 112,0 17,8 25,5 155,3
Centrally planned Asia and China
34,4 99,9 10,0 144,2
Pacific (Organization for Economic Cooperation and
Development)
13,3 65,5 20,0 98,7
Latin America 1,1 59,9 36,6 97,6
Middle East and North Africa 0,0 72,2 23,3 95,4
Sub-Saharan Africa 1,1 7,8 22,2 31,1
Western Europe 4,4 14,4 10,0 28,9
Other Asia Pacific 0,0 8,9 15,5 24,4
Central and Eastern Europe 3,3 1,1 2,2 6,7
South Asia 1,1 0,0 5,6 6,7
Source: Kawata; Fujita, (2001)
18
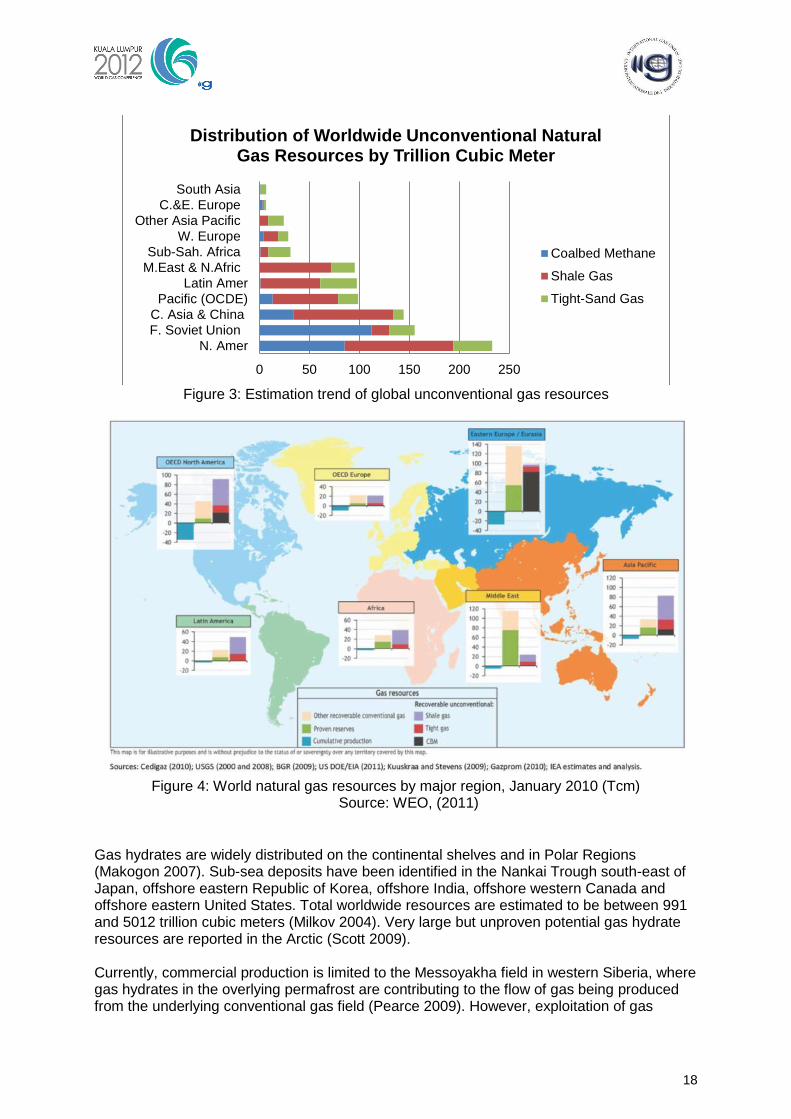
Figure 3: Estimation trend of global unconventional gas resources
Figure 4: World natural gas resources by major region, January 2010 (Tcm)
Source: WEO, (2011)
Gas hydrates are widely distributed on the continental shelves and in Polar Regions (Makogon 2007). Sub-sea deposits have been identified in the Nankai Trough south-east of Japan, offshore eastern Republic of Korea, offshore India, offshore western Canada and offshore eastern United States. Total worldwide resources are estimated to be between 991 and 5012 trillion cubic meters (Milkov 2004). Very large but unproven potential gas hydrate resources are reported in the Arctic (Scott 2009). Currently, commercial production is limited to the Messoyakha field in western Siberia, where gas hydrates in the overlying permafrost are contributing to the flow of gas being produced from the underlying conventional gas field (Pearce 2009). However, exploitation of gas
0 50 100 150 200 250
N. Amer
F. Soviet Union
C. Asia & China
Pacific (OCDE)
Latin Amer
M.East & N.Afric
Sub-Sah. Africa
W. Europe
Other Asia Pacific
C.&E. Europe
South Asia
Distribution of Worldwide Unconventional Natural Gas Resources by Trillion Cubic Meter
Coalbed Methane
Shale Gas
Tight-Sand Gas
19
hydrates is a rapidly evolving field. There are active research programs or experimental production in Canada, Japan, the Republic of Korea and the United States (see WOC1 report for WGC 2009), but gas hydrates are not expected to contribute appreciably to supply in the next two decades (IEA 2009c).
c) North America as an analogue to worldwide UCG resources
A recent study suggested that one should be able to estimate the volumes of gas contained in low-quality reservoirs in a specific basin by understanding the relationship between the volumes of conventional and unconventional resources (Old, 2008; Old et al., 2008). To test the resource triangle concept (logarithmic distribution of resources), Old (2008) used published resource data to compare the volumes in conventional oil and gas reservoirs to the volumes of technically recoverable gas in unconventional reservoirs for eight North American basins that have resources estimates for most conventional and unconventional reservoirs. The conventional oil resource value was converted to gas equivalent and was added to conventional gas for combined volumes of conventional hydrocarbon resources in each basin. Then, the volumes of gas in coal beds, tight sands, and shales were summed for the combined volumes of unconventional resources. Conventional and unconventional resources were summed for the basin-wide total recoverable resources. All total recoverable resources values are considered technically recoverable, but not necessarily economic. More complete details of the methodology used are in Old (2008) and Old et al. (2008). In the 2009 study conducted by Steven Holditch and Ayers, ―How Technology Transfer Will Expand the Development of Unconventional Gas Worldwide,‖ the evaluations of hydrocarbon production and resource data from North American basins that have produced large volumes of unconventional gas confirms the concept of the resource triangle. Natural gas resources are distributed log-normally in nature and can be thought of in terms of a resource triangle. As gas prices increase and technology improves, more natural gas can be developed and produced. Thus far, Holditch and Ayers‘s evaluations of North American basins indicates that the technically recoverable resource of unconventional gas in any basin will be approximately 5-10 times greater than the ultimate recovery (cumulative production plus proved reserves) from all conventional oil and gas reservoirs in the same basin. Unconventional gas production, reserves, and resources are increasing rapidly; unconventional gas, led by shale gas, is expected to provide the majority of the U.S. gas supply growth in coming decades. Unconventional gas resources in North America have been underestimated, and most likely, the worldwide volumes of unconventional gas are much greater than reported. To develop unconventional gas resources worldwide, it will be necessary to transfer the technology developed in North America in the past few decades to international oil and gas basins. The application of industry best practices in every phase of unconventional gas reservoir development will be critical to success.
20
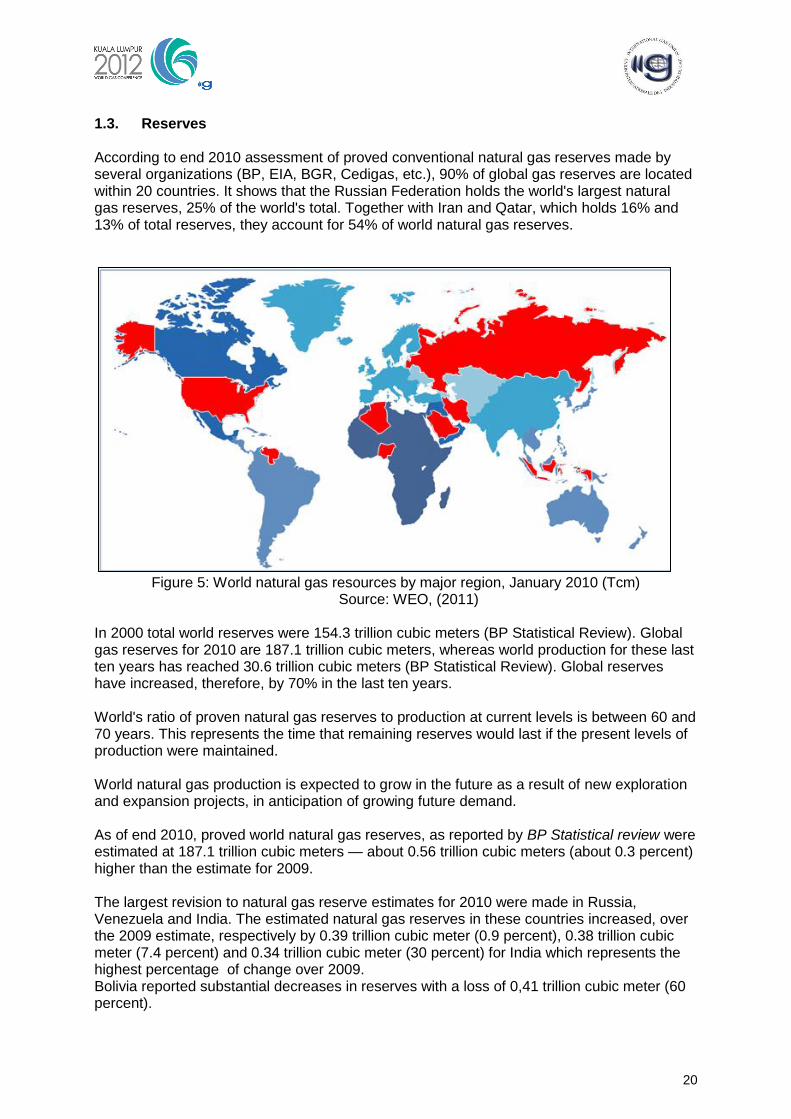
1.3. Reserves According to end 2010 assessment of proved conventional natural gas reserves made by several organizations (BP, EIA, BGR, Cedigas, etc.), 90% of global gas reserves are located within 20 countries. It shows that the Russian Federation holds the world's largest natural gas reserves, 25% of the world's total. Together with Iran and Qatar, which holds 16% and 13% of total reserves, they account for 54% of world natural gas reserves.
Figure 5: World natural gas resources by major region, January 2010 (Tcm)
Source: WEO, (2011)
In 2000 total world reserves were 154.3 trillion cubic meters (BP Statistical Review). Global gas reserves for 2010 are 187.1 trillion cubic meters, whereas world production for these last ten years has reached 30.6 trillion cubic meters (BP Statistical Review). Global reserves have increased, therefore, by 70% in the last ten years. World's ratio of proven natural gas reserves to production at current levels is between 60 and 70 years. This represents the time that remaining reserves would last if the present levels of production were maintained. World natural gas production is expected to grow in the future as a result of new exploration and expansion projects, in anticipation of growing future demand. As of end 2010, proved world natural gas reserves, as reported by BP Statistical review were estimated at 187.1 trillion cubic meters — about 0.56 trillion cubic meters (about 0.3 percent) higher than the estimate for 2009. The largest revision to natural gas reserve estimates for 2010 were made in Russia, Venezuela and India. The estimated natural gas reserves in these countries increased, over the 2009 estimate, respectively by 0.39 trillion cubic meter (0.9 percent), 0.38 trillion cubic meter (7.4 percent) and 0.34 trillion cubic meter (30 percent) for India which represents the highest percentage of change over 2009. Bolivia reported substantial decreases in reserves with a loss of 0,41 trillion cubic meter (60 percent).
21
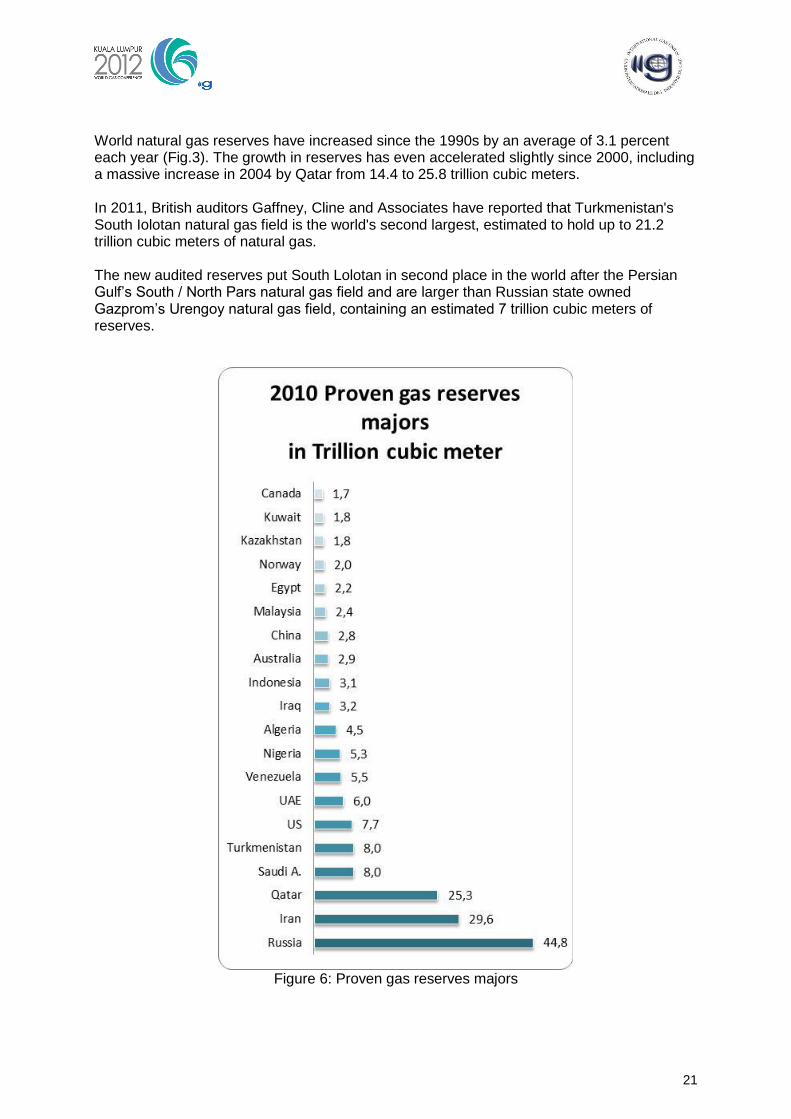
World natural gas reserves have increased since the 1990s by an average of 3.1 percent each year (Fig.3). The growth in reserves has even accelerated slightly since 2000, including a massive increase in 2004 by Qatar from 14.4 to 25.8 trillion cubic meters. In 2011, British auditors Gaffney, Cline and Associates have reported that Turkmenistan's South Iolotan natural gas field is the world's second largest, estimated to hold up to 21.2 trillion cubic meters of natural gas. The new audited reserves put South Lolotan in second place in the world after the Persian Gulf‘s South / North Pars natural gas field and are larger than Russian state owned Gazprom‘s Urengoy natural gas field, containing an estimated 7 trillion cubic meters of reserves.
Figure 6: Proven gas reserves majors
22
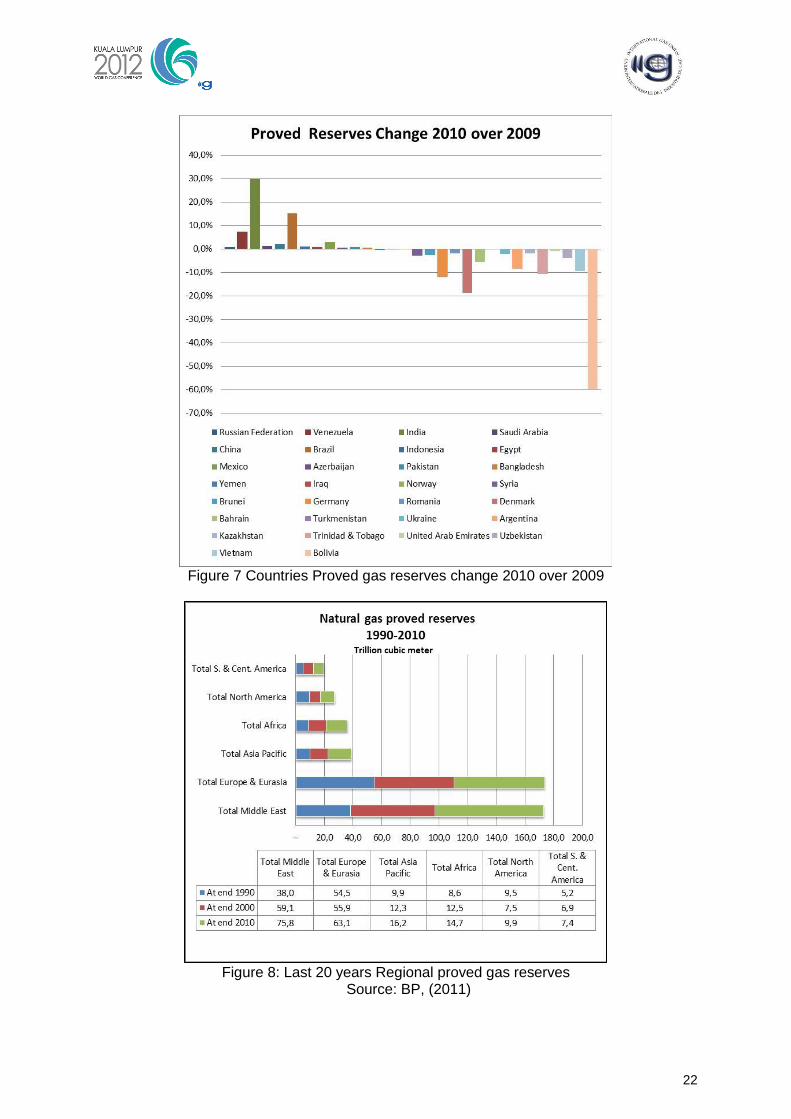
Figure 7 Countries Proved gas reserves change 2010 over 2009
Figure 8: Last 20 years Regional proved gas reserves
Source: BP, (2011)
23
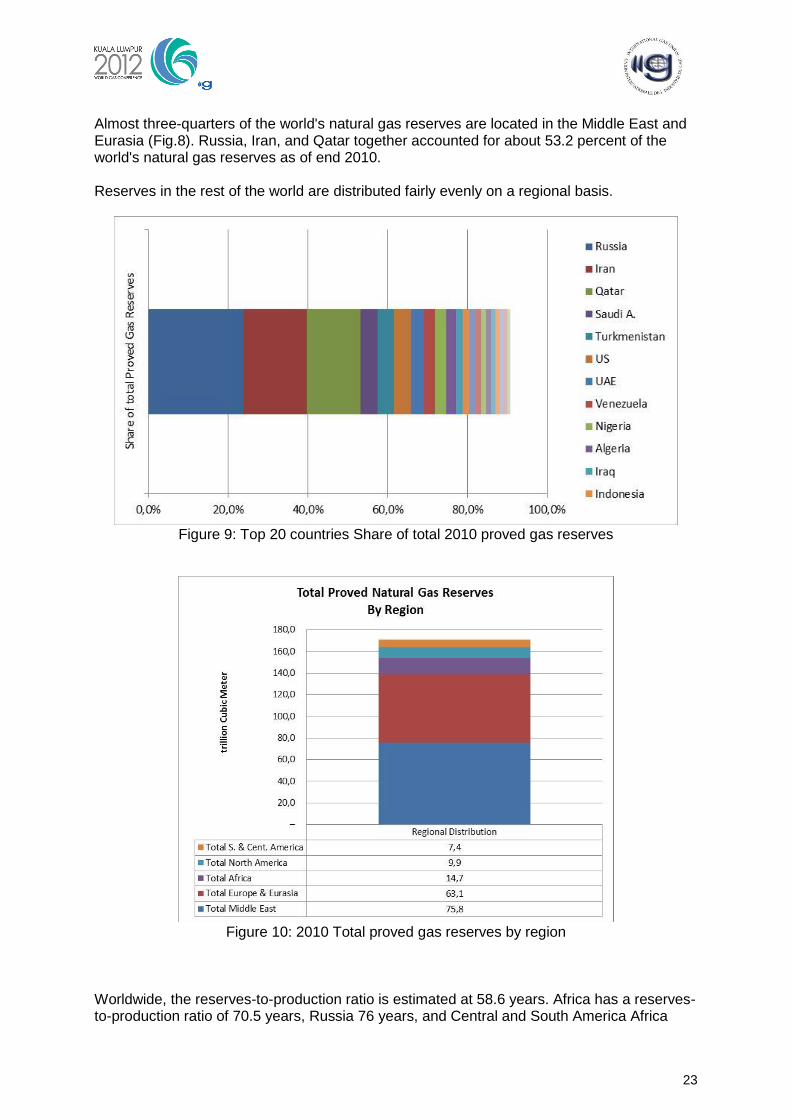
Almost three-quarters of the world's natural gas reserves are located in the Middle East and Eurasia (Fig.8). Russia, Iran, and Qatar together accounted for about 53.2 percent of the world's natural gas reserves as of end 2010. Reserves in the rest of the world are distributed fairly evenly on a regional basis.
Figure 9: Top 20 countries Share of total 2010 proved gas reserves
Figure 10: 2010 Total proved gas reserves by region
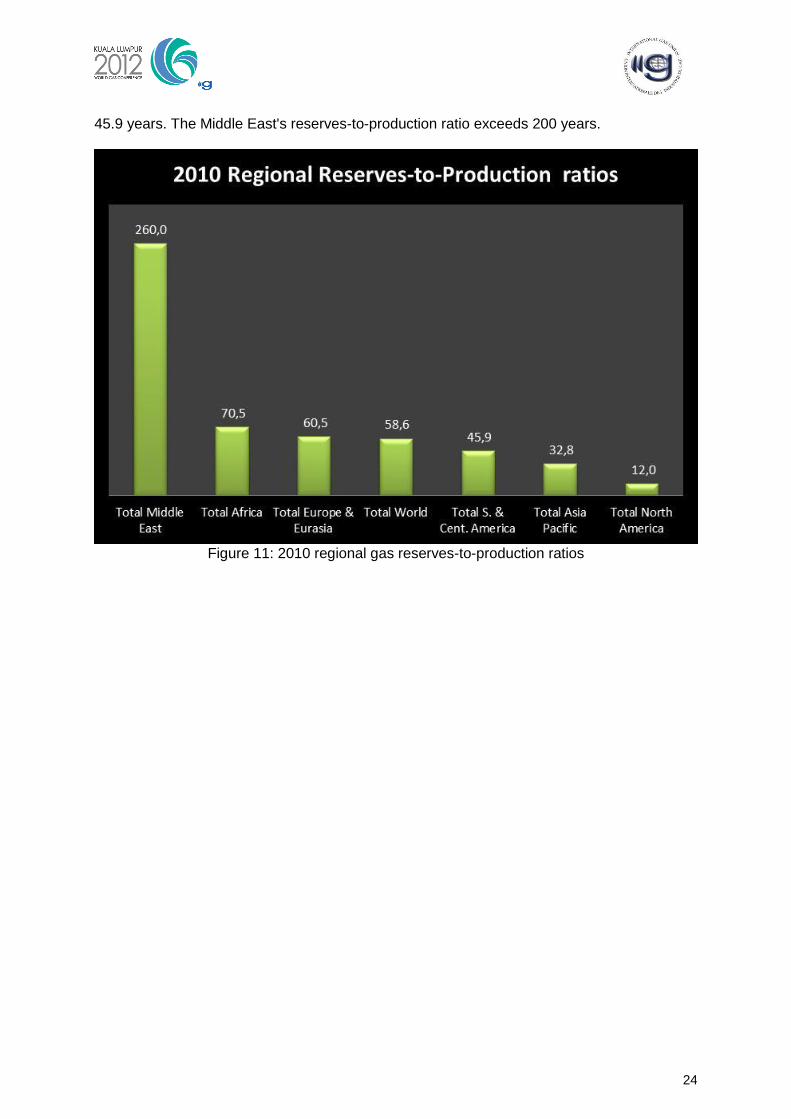
Worldwide, the reserves-to-production ratio is estimated at 58.6 years. Africa has a reserves-to-production ratio of 70.5 years, Russia 76 years, and Central and South America Africa
24
45.9 years. The Middle East's reserves-to-production ratio exceeds 200 years.
Figure 11: 2010 regional gas reserves-to-production ratios
25
2. Exploration and Discoveries Trends 2.1. Setting the Scene At the exploration stage the link between oil and gas is closest. Oil and gas exploration rely on the same resources, such as seismic vessels or onshore crews, G+G brainpower and drilling rigs. Therefore – on a global scale - there is no specific gas exploration trend but it follows the lines of the global E&P industry. However, the increasing divergence between oil and gas prices has resulted in a greater weighting to liquid exploration: since oil and gas exploration are generally funded from the same exploration budgets gas exploration has started to suffer from – in the short term - more promising liquids exploration. Global exploration trends are the objects of studies and research with very different approaches applied. IGU WOC-1 has selected Wood Mackenzie‘s yearly ―The Future of Exploration Survey‖, issued in February 2011, as best reflecting the changing views, habits and preferences of companies of all sizes and kinds with regards to exploration, and is therefore grateful to Wood Mackenzie to be allowed to primarily use the results of their survey. The report states: ―By conducting these surveys annually they will provide useful benchmarks to recognise the changing nature of exploration and predominant trends in the sector”. The survey is based on input from 76 respondents from key decision makers in the exploration business, such as board members and executive levels from major, large, middle and small IOCs as well as utilities and NOCs.
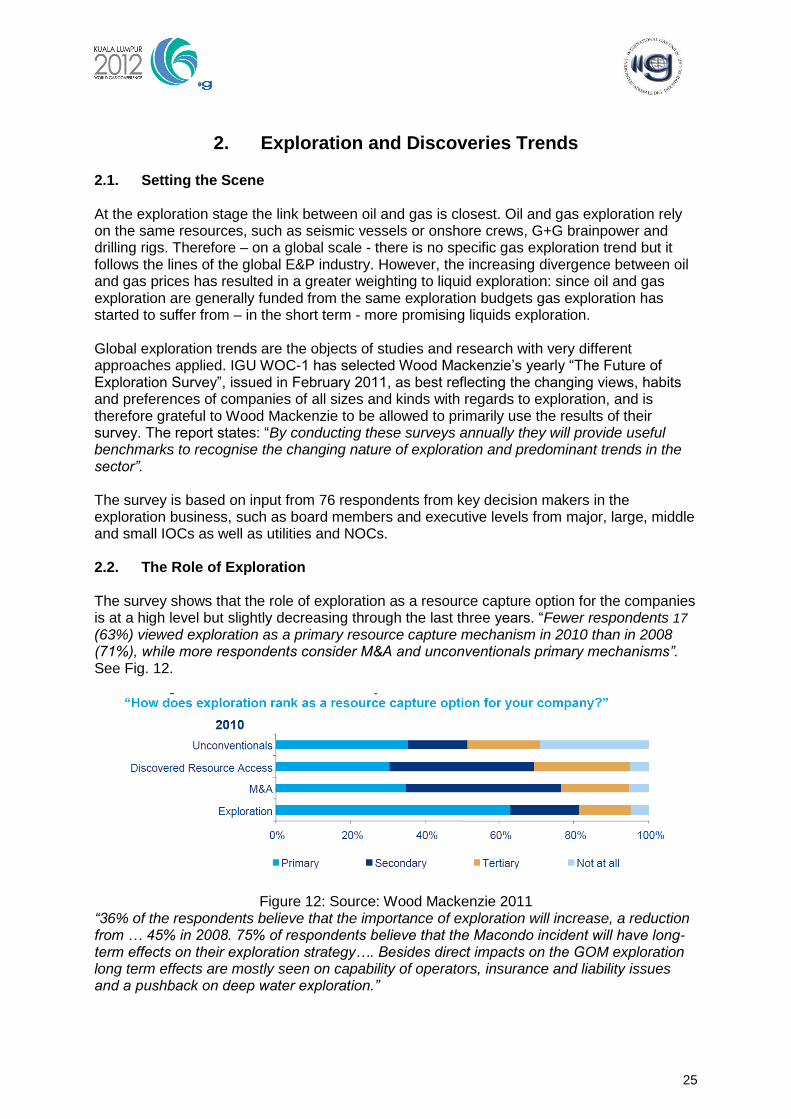
2.2. The Role of Exploration The survey shows that the role of exploration as a resource capture option for the companies is at a high level but slightly decreasing through the last three years. ―Fewer respondents 17
(63%) viewed exploration as a primary resource capture mechanism in 2010 than in 2008 (71%), while more respondents consider M&A and unconventionals primary mechanisms”. See Fig. 12.
Figure 12: Source: Wood Mackenzie 2011
“36% of the respondents believe that the importance of exploration will increase, a reduction from … 45% in 2008. 75% of respondents believe that the Macondo incident will have long-term effects on their exploration strategy…. Besides direct impacts on the GOM exploration long term effects are mostly seen on capability of operators, insurance and liability issues and a pushback on deep water exploration.”
26
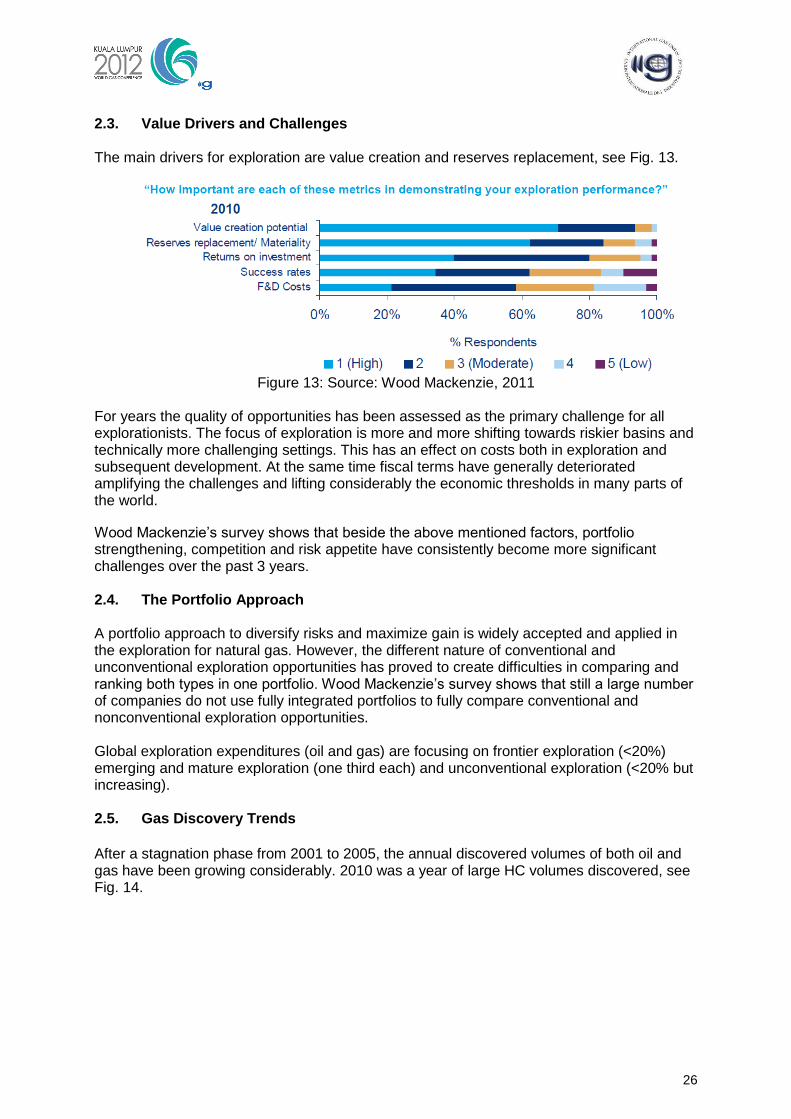
2.3. Value Drivers and Challenges The main drivers for exploration are value creation and reserves replacement, see Fig. 13.
Figure 13: Source: Wood Mackenzie, 2011
For years the quality of opportunities has been assessed as the primary challenge for all explorationists. The focus of exploration is more and more shifting towards riskier basins and technically more challenging settings. This has an effect on costs both in exploration and subsequent development. At the same time fiscal terms have generally deteriorated amplifying the challenges and lifting considerably the economic thresholds in many parts of the world.
Wood Mackenzie‘s survey shows that beside the above mentioned factors, portfolio strengthening, competition and risk appetite have consistently become more significant challenges over the past 3 years.
2.4. The Portfolio Approach A portfolio approach to diversify risks and maximize gain is widely accepted and applied in the exploration for natural gas. However, the different nature of conventional and unconventional exploration opportunities has proved to create difficulties in comparing and ranking both types in one portfolio. Wood Mackenzie‘s survey shows that still a large number of companies do not use fully integrated portfolios to fully compare conventional and nonconventional exploration opportunities. Global exploration expenditures (oil and gas) are focusing on frontier exploration (<20%) emerging and mature exploration (one third each) and unconventional exploration (<20% but increasing).
2.5. Gas Discovery Trends
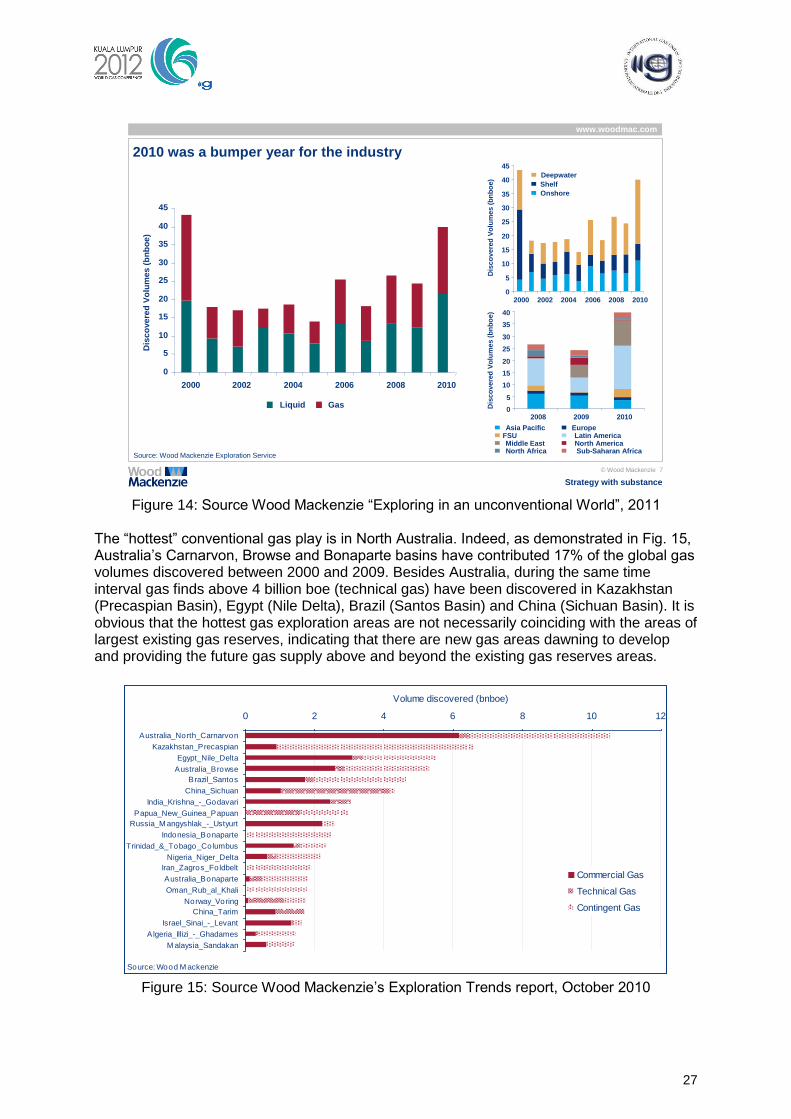
After a stagnation phase from 2001 to 2005, the annual discovered volumes of both oil and gas have been growing considerably. 2010 was a year of large HC volumes discovered, see Fig. 14.
27
Figure 14: Source Wood Mackenzie ―Exploring in an unconventional World‖, 2011
The ―hottest‖ conventional gas play is in North Australia. Indeed, as demonstrated in Fig. 15, Australia‘s Carnarvon, Browse and Bonaparte basins have contributed 17% of the global gas volumes discovered between 2000 and 2009. Besides Australia, during the same time interval gas finds above 4 billion boe (technical gas) have been discovered in Kazakhstan (Precaspian Basin), Egypt (Nile Delta), Brazil (Santos Basin) and China (Sichuan Basin). It is obvious that the hottest gas exploration areas are not necessarily coinciding with the areas of largest existing gas reserves, indicating that there are new gas areas dawning to develop and providing the future gas supply above and beyond the existing gas reserves areas.
Figure 15: Source Wood Mackenzie‘s Exploration Trends report, October 2010
© Wood Mackenzie 7
www.woodmac.com
Strategy with substance
2010 was a bumper year for the industry
Source: Wood Mackenzie Exploration Service
0
5
10
15
20
25
30
35
40
2008 2009 2010
Dis
co
vere
d V
olu
mes (
bn
bo
e)
Asia Pacific EuropeFSU Latin AmericaMiddle East North AmericaNorth Africa Sub-Saharan Africa
0
5
10
15
20
25
30
35
40
45
2000 2002 2004 2006 2008 2010
Dis
co
ve
red
Vo
lum
es
(b
nb
oe
)
Liquid Gas
0
5
10
15
20
25
30
35
40
45
2000 2002 2004 2006 2008 2010
Dis
co
vere
d V
olu
mes (
bn
bo
e)
Deepwater
Shelf
Onshore
0 2 4 6 8 10 12
Australia_North_Carnarvon
Kazakhstan_Precaspian
Egypt_Nile_Delta
Australia_Browse
Brazil_Santos
China_Sichuan
India_Krishna_-_Godavari
Papua_New_Guinea_Papuan
Russia_M angyshlak_-_Ustyurt
Indonesia_Bonaparte
Trinidad_&_Tobago_Columbus
Nigeria_Niger_Delta
Iran_Zagros_Foldbelt
Australia_Bonaparte
Oman_Rub_al_Khali
Norway_Voring
China_Tarim
Israel_Sinai_-_Levant
Algeria_Illizi_-_Ghadames
M alaysia_Sandakan
Volume discovered (bnboe)
Commercial Gas
Technical Gas
Contingent Gas
Source: Wood M ackenzie

28
Figure 15 also shows the increasing challenge that companies have in deriving value from gas discoveries. Only a portion of the gas discovered can be qualified as commercial gas, i.e. reserves so far. A combined approach of overcoming technical challenges and reassessing increasingly harsh fiscal terms will result in more attractive economics and consequently higher reserves figures. It will also enhance very dynamic gas exploration efforts in many promising basins across all continents.
29
3. New Frontier & Exploration Areas 3.1. Introduction The main objective of this chapter is to make a rapid review of the areas that are likely to be concentrating conventional new exploration in the following ten years. The unconventional exploration and developments are covered in the IGU 2012 WOC 1.2 report. In this chapter, only conventional frontier and new exploration areas have been reviewed, although it is considered that a significant part of the yet to find hydrocarbons are still present in mature basins. An interesting part of the remaining potential is therefore linked to the infill drilling and production of small but also numerous fields, next to declining or older production. It is therefore important for countries to establish conditions to explore and develop not only the large structures but also the small ones, that may sustain the production of a basin for a long time. 3.2. New or Frontier Exploration A Frontier Basin or Play is a basin or a play where the exploration activities have not been carried out sufficiently, and where it is considered that there is a significant part of hydrocarbon that could be categorized as undiscovered volume. As a result, New or Frontier exploration is an activity on basins or plays that, in the past, were either unexplored, underexplored or explored with techniques that were not adequate (either from low data acquisition or poor production tests). It resulted in poor knowledge of the concept. Frontier exploration is linked with geological risk and uncertainty, that may also be difficult to be determined accurately. This uncertainty reflects in low Probabilities of successes, that impair the economic return evaluations. The economic analysis on Frontier areas is often not easy as it relies heavily on first successes to unlock the areas, which are difficult unpredictable. In that category we can put:
- Areas that are remote or difficult to reach - Areas that are difficult to operate due to the environmental conditions - Areas where there is a lack of export infrastructure - Areas/plays for which evaluation techniques allowed to gather new valuable
data. - Areas/plays for which application of new production techniques allowed to
produce hydrocarbon for previously non producible considered areas. - Areas that were not considered as of prime interest, either because they were
in the shadow of easier to produce plays or basins or because they were not considered as rich
- Areas that are locked by regulatory authorities For the large majority of the cases, frontier or new exploration is generally linked and sustained by innovative technology, as there are areas for which the potential is known to exist but for which industry is waiting for the sufficient breakthrough in technology. Breakthrough in technologies specially developed for identified exploration zones are likely to unlock potential in other basins that have similarities. For example, the progress in imaging techniques of the pre-salt, object of extensive developments for Gulf of Mexico or Offshore Brazil, played a role in underlying potential in Eastern Mediterranean region. Similarly,
30
progression of deep water drilling, sustained by the investment made for Offshore Brazil are most likely responsible for the offshore exploration progress recently made in East Africa. Of course, although gas and oil exploration is applying high level technologies, the progression in exploration, and the opening of new areas are mainly attributable to the analysis and experience of the geoscientist community. Finally, as exploring for new plays is a challenging and risky business, we can remark that the opening of new plays is often led by entrepreneurial independent companies having the guts to chase new concept. This approach might be a company maker in case of success, but can also lead to disappointment. In the recent past, we can mention Apache Company for gas exploration in Egypt, but also Tullow for Oil exploration in Ghana. At present Anadarko in Mozambique as well as Noble in East Mediterranean area, are proving that it is possible to open new plays. Nevertheless, the best promoters for new exploration are the regulatory authorities and states. The support of governments is key for risky exploration, by setting incentive fiscal regimes that promote enough reward in case of success of new, therefore risky, exploration. According to Oil and Gas in Africa, 2009 study, higher exploration and production costs and risks associated with limited reserves or deepwater offshore exploration often require flexible fiscal terms for exploration companies. Coherent principles, structures, and, above all, due diligence in enforcement, are key factors in increasing benefits and sustainability for all countries, and in particular attract investment for new exploration. In addition, in order to attract investment to the oil and gas sector, laws, regulations, and policies governing the industry should be clear, complete, transparent, accessible, flexible, and practical. Also, a consultative process should be institutionalized to ensure periodic dialog with operators to ensure that regulations are technically feasible and cost-effective. All these elements have a major impact on the promotion of new zones, and may attract or divert investment on exploration, especially as non discovered resources in gas are still considered as high. As a matter of fact, there is a general consensus that there are still numerous areas to explore for gas as, in the past, gas was underexplored compared to oil. The recent success in new areas is confirming this consensus. The USGS assessment of undiscovered conventional gas considers that around 34% of the endowment is still to be discovered. The quantities still to be discovered are therefore quite significant, representing a mean value of around 5200tcf (530 tcf for the US and 4670 tcf for the rest of the world). We identified some areas that are most likely to be the areas for gas exploration for the next ten years. These areas are amongst many other:
- The Artic Circle, concentrating most of the undiscovered potential - The underexplored areas of the Middle East for gas, (Western Irak Basin,
Saudi Arabia, Iranian Zagros) - The Levantive basin, recently emerging as one unexpected province - Australian Offshore North West Shelf - Eastern Africa
31
Atlantic subsalt areas (especially Santos and Campos Basins) although clearly focus of exploration, are not covered in this chapter as they are already widely addressed in other parts of the report. As mentioned previously, exploration of unconventional gas is also not addressed in this chapter, although it will be the focus of a lot of attention in the next years, especially in China, Australia, South America and Northern Africa. The present chapter has been using amongst other sources the International Oil letters from IHS Company and Upstream services, and Upstream Insight letter from Wood Mackenzie Company. 3.3. The Arctic circle areas The Area North of Arctic Circle is huge. This area covers an extent of more than 21 Million Km²: 6 % of the Earth‘s surface) and the Arctic ocean has the most extensive continental shelves of any ocean basin (Shelf area under 500m is over 7 millions Km2), and most of it is in water depths of less than 50 m (mainly in Russian part). The area belongs to 5 countries, and 13 main basins have been outlined:
- Norway: the Norwegian Sea and the West Barents basins - Russia: the East Barents, Kara Sea, Laptev Sea, East Siberian Sea and South
Chukchi Sea basins - USA: the North Chukchi Sea and the North Slope basins - Canada: the Mackenzie, Beaufort and Sverdrup basins - Denmark: the Northwest and Northeast Greenland basins
The Arctic basins range from the proven offshore basins (West & East Barents and Sverdrup) to the offshore extensions of the proven onshore plays (Alaskan North Slope, Beaufort, Mackenzie & Yamal Peninsula) to the entirely unexplored seas of offshore Eastern Siberia, and Eastern & Western Greenland. The Arctic area is already an important global gas producing region, with the presence of the biggest clastics gas fields in the world of the Western Siberian area. The area has already been explored to some extent, in Canada, Russia, US (Alaska) and recently in the Norvegian sector of the Barents sea. USGS study report over 400 Oil and Gas fields discovered north of the Arctic circle already, containing about 10% of the conventional Oil and Gas resources (~240 bboe). In addition to the already discovered volumes, USGS considers that it contains 22% of the yet-to-find potential (USGS study, 2008). These vast undiscovered volumes make it one of the few remaining frontier area to explore for natural gas. However, depending on the basins, first production may be expected in the near future (or already happening, e.g. Russian Yamal sector, Norvegian Barents Sea or Alaska) or deferred until 2030+. The status of the exploration in these areas depends on the potential and on the difficulties of the operating under harsh conditions, and also on the national incentives to explore for new discoveries. The situation of the different countries holding acreage is different:
3.2.1. Norway Norway is expected to counterbalance the fall of production happening after 2011, and set a
32
pro-exploration hydrocarbon law. The exploration of the Norwegian sector is already underway, following the development of Snohvit. Presently about 60 % of the offshore area is opened for exploration, and about 25 % of the opened area is currently licensed. Exploration efforts in Norwegian waters currently focus on new targets in areas such as the Finnmark Platform, the Nordkapp Basin, the Western Margin, and the area up to the Spitsbergen. Some areas, like the Lofoten area, in the northern part of the Norwegian Sea are believed to be prospective, but being in an environmentally sensitive area, it has not yet been opened for exploration. Norway recently launched an Integrated Management Plan (IMP) for the Norwegian Sea. In this plan, Norway‘s authorities have introduced a series of recommendations to allow the hydrocarbon industry to grow without a long-term environmental impact on the most ecologically sensitive areas of the Norwegian Continental Shelf. In addition, Norway stated that the Government will present a white paper on the Norwegian High North and Arctic policy for mid 2011, focusing on ensuring sustainable management and development of natural resources and on international cooperation to meet common challenges in the Arctic. Recent discoveries, like the recent announcements of discoveries from Total north of Melkoya, could be an anchor for further exploration in this under explored area, as confirming the positives indicators of the potential of the Norwegian Barents sea, and providing good expectations of the development of export infrastructures in the area.
3.2.2. Russia Within its boundary, Russia already has existing discovered reserves in the offshore Arctic of 3.4 billion barrels of oil and 254 TCF of gas. These existing reserves are situated in 3 main areas: The South Barents Sea, the Pechora Sea, and the Yamal-Nenets & Kara Sea area. Although the exploration potential of Russia is clearly huge, Russia is currently focusing on the development of already discovered fields, either in the Yamal peninsula area or in the Barents sea. The development of some major projects is still to concretize due to the operating difficulties of the environment. It is currently expected that these areas may be developed from now (Barents sea) to 2020‘s. Schtokman alone has gas reserves in the order of 100/130 TCF of gas, and official timings are for piped gas production to begin in 2013, followed by LNG in 2014. however, due to natural gas oversupply and the economic crisis, the shareholders decided on 5 February 2010 to postpone the project another 3 years; the pipeline gas production might start in 2016 and LNG production in 2017. The final investment decision will be made in early 2012. In addition, Gazprom cites the Yamal Peninsula‘s 26 fields as holding 550 Tcf of ABC1 and C2 gas reserves and a further 770 TCf of resources (categories C3 and D). Furthermore, South Kara Sea (Offshore Yamal) is largely under explored, with already mapped but undrilled structure around the two giant gas discoveries of Leningradskoye and Rusanovskoye (considered at potentially over 280 TCF each ). The development of these mega projects will act as an anchor to develop the resources in the nearby areas. Additional resources are already identified in undrilled ―smaller‖ structures around these projects.
33
Apart from these high grade exploration areas, there are other basins, that also have a large interest to explore, but that are likely to be developed in the 2030‘s rather than before. Laptev sea, East Siberian sea and Chuchi sea basins are located in poorly known areas, with no known offshore wells, only shallow wells onshore. The seismic is very limited or non existent. The exploration of these basins, further away from export routes and with harsh ice and climatic conditions, will require more time. Exploration of the Russian Arctic sector will be a major focus of the industry in the next 30 years. This is clearly indicated by strategic alliances like the Rosneft/ExxonMobil agreement to collaborate on Russian Arctic area. The expansion of this exploration depends mainly on the rate of development of the major projects in the area. Development of existing discoveries is clearly an advantage, as they will provide a steady learning curve for the operators and will give them time to develop innovative strategies of exploration and to build specific technical solutions in this highly challenging and harsh environment. The exploration might also be favored by the political decision to open this difficult acreage to non-Russian companies, which is currently not the case, being limited to ―strategic partnership‖. Lifting uncertainty in licensing plans and timing is crucial to promote the development of these areas.
3.2.3. USA and Canada So far in the USA, no export route exists for gas (35 TCF discovered, essentially in Prudhoe Bay) due to strong environmental constraints. There are however export routes for oil, set in place for major Alaskan projects (Prudhoe Bay, Burger…). Despite this lack of export route, the frontier Alaskan Chukchi sea attracted high interests from majors, with the Chukchi Sea Sale 193 (2008), with 667 bids on 488 licences (US$2.70 billion). The US offshore arctic area is rather poorly explored (only 5 wells have been drilled in the beginning of the 1990‘s, including the Burger discovery). For Canada, the exploration is not new, as there was an active policy of developing the national resources in the 1970‘s and 1980‘s, peaking at over 70 wells per year in these periods and resulting in 48 significant oil and gas discoveries in the Beaufort-Mackenzie Basin and 20 in the Sverdup. The exploration has revived since the beginning of the XXIth century, with great level of interest in the offshore Beaufort Sea, where there is already a discovery (Gas and oil discovery of Amauligak). The 2008 Beaufort sea license attribution was recently a success. For gas exploration, main areas are Mackenzie Delta area and in the Arctic islands (Sverdrup), which already proved successful in the past ‗Taglu (1971): 2.7 TCF, Parsons Lake (1972): 2.1 TCF and Niglintgak (1972): 0.8 TCF). The main restraint for the expansion of the exploration is the lack of a gas export route. The Mackenzie Valley Gas Pipeline proposed in 2008 did not further progress. It has been delayed since 2007 by concerns over how the pipeline would be run and regulated. Canadian government is expected to take a share of the risks in order to debottleneck this area.
3.2.4. Greenland (Denmark) In Greenland, there is no real discovery so far, but exploration activities are moving forward
34
with the opening of license areas. The opening of exploration in Greenland, provoked by the 2010 Northwest License calls that should be followed by the Northeast License calls in 2012, caused high excitement. One of the main reasons is the high expectations for this area, (estimated undiscovered volumes of 51 tcf for the West Greenland, and of 86 tcf for the East Greenland, according to USGS), linked to the perception that this area was nearly non-explored (limited seismic and 5 wells drilled in the 1970‘s and one in 2000). Cairn company is presently drilling ahead the first exploration wells following this call. Its first two wells in Baffin Bay encountered gas in thin sands and oil in volcanics, proving that there is a Petroleum system working, which was considered as one of the main risks in the area. However, the discovery was later announced as non commercial. Up to now, the following wells proved disappointing. The main uncertainty at the moment is to identify a proper reservoir. Due to the extent of the basin, the initial disappointing results should not be considered as definitive killers, and further exploration should be required in order to revise expectations. At the moment, high expectations are put on the East Greenland area, which will be opened after 2012. It is considered that this area is closely related from a geological point of view to the Norwegian sea & Barents sea basins. This is considered to be a clear focus on the Arctic exploration for the next 15 years. 3.4. Levantine Basin The Levantine Basin is situated in the eastern Mediterranean area. Its surface is approximately 83,000 km2, between the Tartus fault to the North, Cyprus and Eratosthe¬nes Seamount to the West and the Nile Delta system to the South West. Levantine basin as a prominent target emerged only in late 2000, concretized with the Tamar discovery. Previously, this basin had not been really explored, as imaging limitations only allowed to assess the shallower horizons. The only discoveries were consisting in biogenic gas in shallow Pliocene channel sand plays off Gaza and Southern Israel. The new assessment of the basin following recent seismic indicated strong structuration and potential for hydrocarbon traps at deeper levels. The main shift on exploration that revealed the strong potential of the area was linked to the decision to drill through the Messinian salt for potentially HP/HT Early Miocene/Oligocene deep basin floor turbidites targets, suggested by the good exploration results in Nile Delta area. Tamar discovery, announced as over 9 tcf, is the second biggest gas discovery in 2009. It was followed by Dalit smaller discovery (1.2 tcf) and overall Leviathan, estimated as 17 tcf, in 2010, that is considered to be one of the largest discovery of the last 10 years. These two large successes completely changed the perception of the prospectivity of the area, both from local authorities, IOC‘s and experts. The undiscovered potential jumped from being unassessed as too small to over 120 tcf in USGS evaluations. It was followed by preparation of licensing rounds in Syria, Lebanon and Cyprus. Success of exploration in the area will largely be dependent on the Political situation in the area, either internal or between the different countries. There are issues relating to the definition of the maritime borders, either between Lebanon and Israel, but also between Cyprus and Turkey. In addition, there are historical tensions between Israel and its neighbors
35
that may compromise involvement of majors companies in its waters. In addition to these political tensions, the development costs attached to these projects adds another challenge. The Tamar and Leviathan discoveries, despite their size, are quite costly to develop. The water depth is ranging from 1000m to over 1500m and requires deepwater HP/HT drilling rigs for the targets depths around 5000 m subsea. Development of a production and export infrastructure in this new area will also be required to explore for potential targets of lesser importance than those of Tamar and Leviathan. The tax environment which has been recently raised may add another risk on exploration, and delay the investments. However, it is largely considered that the Levantine basin will be one of the new exploration focuses in the next years. The success of exploration in this Eastern Mediterranean basin is also opening up new frontier exploration targets in other areas of Mediterranean sea, where similar sub salt play can be explored.
3.5. Middle East areas The Middle East area is still considered as being the second most important region for gas reserves (either already discovered or still to explore) after former soviet Union. According to the USGS evaluations, most of the gas undiscovered resources are situated in the deeper Paleozoic levels, which in total form account for more than 800tcf of undiscovered resources in this region. Obviously, the 1990‘s and the beginning of the XXIth century proved extremely successful for the gas exploration in Middle East, and in particular in Arabian peninsula and Iran. This period coincided with the extension of exploration, appreciation and production of the Permo-Triassic carbonates levels (Khuff and equivalent). This play, believed to be sourced by the prolific Silurian hot shales, is still proving to have significant potential and to be able to add large quantities of new reserves for exploration, especially due to the thickness of the reservoirs. As a matter of fact, discoveries were recently announced in the Iranian Zagros Foldbelt (Sefid Ba‘ghoun (4.4 tcf), and Halegan (8 tcf), in the Arabo-Persian gulf (Forouz (17.5tcf), Karan (9 tcf), Arabiyah), which are attributed to this target. Although it cannot be considered as a new exploration target, there is still a number of identified but undrilled prospects at this target, especially in the Iranian Zagros Foldbelt, in the Central Arabian uplifts and in salt related structures of the Arabo Persian Gulf. There are also large areas virtually unexplored in the Western Iraqi desert and in the Rub‘al Khali basin. In addition to this target, since the beginning of the century there has also been a move in the exploration of the Petroleum system in Arabian Peninsula to the deeper clastic reservoir of the Lower Paleozoic section. These deeper levels proved to add rich hydrocarbon resource, also sourced by the Silurian Qusaiba ―hot shale‖. It contained oil and gas in various reservoirs throughout Central, Northern, and Eastern Saudi Arabia, but also in Bahrain, Turkey, Jordan and Iraq. Recent discoveries from this Lower Paleozoic clastic interval include Sirayyan, Sanaman, Dirwazah or Nujayman (Lower Permian) or Kassab & Rabib (Devonian). Most of the discoveries are situated in the Greater Ghawar uplift area, but this play is also recognised to be present in the Arabo-Persian Gulf, offshore UAE, Saudi Arabia and in Bahrain. There are
36
most likely still quite a lot of discoveries to make in these layers, whether in already identified structures undrilled at these levels or in new targets. Finally, a significant effort was made towards the exploration and understanding of tighter Lower Palaeozoic succession. This was thought to be able to hold huge quantities of hydrocarbon (mainly gas), in this pile of thousand meters of still poorly known siliclastic succession. The nature of the clastics varies considerably across Arabian Peninsula, either in nature (depending on depositional settings and erosive events) or in properties (from conventional properties to unconventional tight properties). Near future exploration will likely be targeted to validate this expected potential. The discovery of new plays and large reserves will, however, be strongly linked to the local policies and international environment. In particular, the last exploration results in the Rub al Khali, opened to IOC‘s for exploration since 2003, proved largely disappointing for the four ventures, finding no new commercial quantities of gas. This raised concerns about the diminishing rate of increase of the gas reserves of Saudi Arabia. Although 3 of the 4 ventures decided to embark on new periods (exploration or appraisal), it is considered that without significant incentives, exploration won‘t be sustained, especially given the high exploration and development costs in this harsh environment. Exploration might only be spurred by raising the gas prices and return conditions to attract more investment. In other countries, the problem is different. In Iraq, there is a strong commitment to the acceleration of the production of the already discovered fields, and a primary focus on the oil-prone areas of the Zagros and Mesopotamian basin. Gas exploration, especially to the more desertic areas of the West is likely to be deferred for some time. In Iran, there is quite a lot of hurdles that are delaying any further projects. The present international sanctions prevent any major investment in the country, and although there are already numerous giant gas discoveries identified, the country lacks the financial capacity to translate it into developments.
3.6. Australian Offshore Australia is proving from the last ten years to be one of the most prolific basin for gas worldwide. Year after year, new giant fields are discovered onshore, accounting for 50tcf of new reserves in the last decade. The main focus for exploration remains the western Australian sedimentary basins, in particular the Jurassic and Triassic sandstones of North Carnarvon Basin, the Jurassic and Permian targets in the Perth Basin, but attention is also currently concentrating on Cretaceous and Triassic formations in the Browse Basin and on the Permian formations in the Bonaparte Basin. Offshore exploration already identified more than 160 Tcf of gas in the Carnarvon, Browse and Bonaparte Basins. Major recent finds include Poseidon (7tcf), Acme, Alaric, Brederode, Kentish Knock, Greater Gorgon Area (11 fields, including the wildcat wells of Geryon-1 (1999), Orthrus-1 (1999), Urania-1 (2000), Maenad-1 (2000), Jansz-1 (2000), Io (2001), Chandon-1 (2006), and Achilles (2009), Satyr (2009)) estimated at more than 40tcf or Burnside (1.5tcf) discoveries in the Carnarvon basin but also Ichtys (12.8tcf) in the Browse basin. Western Australia will certainly continue to attract this high interest for the next 20 years. This interest is sustained by a concentration of favorable conditions.
37
The political risk of the country is considered as one of the lowest, providing high visibility on the investments. The authorities set in place a clear fiscal regime, designed to encourage exploration, in particular in frontier basins. In addition, there is a policy of transparency and sharing of information that promotes innovation and encourages new ideas for exploration. Finally, Western Australia‘s proximity to Asian markets places it in an ideal position to meet growing expected gas demand. This demand was forecasted because of the increasing developments and needs of the Asian countries (China being the first), but was lately reinforced by the probable consequences of the Fukushima accident, shifting energy policy away from Nuclear Power. To meet this future demand, last year‘s saw fierce competition between operators to launch LNG projects. In particular we can cite Gorgon, Pluto, Browse LNG, Wheatstone projects…. We can see these projects as opportunities for exploration in the area, as supply is following the increasing demand, still expected to be rising in following years. This situation is particularly exemplified by the latest major LNG gas purchase agreements signed by Sinopec and South Korea, of 85b$ each. The densification of these LNG projects will concur to unlock the vast stranded potential of Australia, as commercial developments were blocked by the lack of infrastructures and the distance to export solutions. Another favorable factor is the development of new Floating LNG technologies that are designed to produce gas fields that are either too small, or too far away from the shore to be economically viable to be developed by a classical onshore LNG facilities. Shell‘s Prelude/Concerto project and Santos‘s Bonaparte projects are currently under way. These new technologies will certainly allow to reconsider what is currently considered as stranded reserves (140 tcf according to CSIRO in Australia).
3.7. East Africa
East Africa has been emerging as a new frontier area for gas exploration in the very recent years. Previously, despite some early gas discoveries in the 1960‘s, onshore Mozambique and offshore Tanzania, the limited internal markets of the area, and the position of the countries away from the traditional export routes, explains the lack of interest of major companies in the area. Progresses of deep water drilling technologies enabled the operators to tackle basins that were considered too deep to be explored before. This extension of the exploration zone area created new opportunities. The East African prospectivity image changed as Anadarko, despite apparently looking for oil, encountered multi tcf of dry gas reserves in 2010, in its 1st wildcat offshore Rovuma basin (Windjammer) in Mozambique, at the border with Tanzania. It was followed by close Barquentine and Lagosta discoveries (total Windjamer complex announced as 15-30 tcf by Anadarko) and by the Tubarao discoveries in other Tertiary levels, that expands the prospective layers. This innovative exploration risk was supported by several years of studies and the identification of a sufficient lead portfolio that was worth de-risking. As a result Anadarko‘s senior vice president for Worldwide Exploration, described Windjammer as a ―true rank wildcat‖ that de-risked a substantial portion of approximately 50 leads and prospects that the company has identified across its 2.6-million-acre position in the basin. These significant reserves found enable Anadarko to concentrate on this new play and to award contracts for pre-FEED (front-end engineering and design) work for a prospective LNG plant according to KBR. The target for a final investment decision is 2013
38
These recent Mozambique discoveries, large enough to be commercial, created a regional acceleration of investment in exploration from already installed players (Dominion Petroleum, Artumas, Aminex, Origin Oil, Maurel & Prom, Ophir) and began to attract interest from other IOC. In particular, ENI and Statoil are preparing exploration campaigns in Mozambique blocks. The prospectivity of the basin also extends to the Northern area, in Tanzania, where BG and Ophir struck discoveries. Two discoveries (Pweza and Chewa) in block 4 appear ―soundly economic as a floating LNG development‖ according to BG. This was followed by Chasa discovery in April 2011, in Block1 extending the prospective acreage. Strategic moves are currently made, in particular Exxon Mobil in late March 2010 acquired a 35% interest in the Tanzanian deep-water Block 2, operated by oil company Statoil. Petrobras is also expected to launch an offshore exploration campaign end of 2011. The competition for acreage is expected to be fierce in the future round for offshore exploration, that it has been deferred to 2012 by Tanzanian authorities including deepwater blocks from 1200 to 3500 m water depths. Finally, the operators are positioning further north, in order to expand the exploration to the under-explored areas of the Kenyan waters. Anadarko already positioned in 2010. BG and Dominion announced psc signatures in 2011 with Kenyan government for offshore area in 2011. Other companies are farming-in offshore areas (Total). After the initial moves from the operators, and according to a research note by Citigroup, the East Africa region is expected to experience a strategic pick-up in farm-ins and mergers and acquisitions to consolidate smaller players. It already began in 2011, but is expected to grow further (Apache, and Shell bid on Cove). It is likely that major exploration campaigns will be launched in the years to come following the consolidations, and increasing investment capacities, of the groups. Still, the main bottleneck is the lack of major export solutions, but as the gas discoveries begin to pile up in the different countries in the area, it is raising the expectation of possible solutions in the near future. Floating LNG concept currently developed for Australian assets might be finding another market for development. All this news and activity in the last two years has already changed the status of the area to a high growth and potential zone. Given the low present number of exploration in the area, this area should still be considered as a frontier zone, but the knowledge of the area will most likely evolve rapidly.
3.8. Central Asia
The Central Asian region, and in particular the Caspian Sea region, has been expected to become one of the most promising area for world gas exploration since the 1990‘s. Indeed, after a first period of declining exploration and production following the collapse of the Soviet Union, there was an upward trend of exploration and production in the area. Some countries managed successfully to attract foreign investment (in particular Azerbaidjan and Kazhkstan), which led to world class discoveries and major project developments. We can cite Karachaganak, Tengiz, Shah-Deniz as one of these world scale projects launched since the collapse of FSU. In support of the development of this zone, new export routes have already debottlenecked the Caspian Area. The Caspian Pipeline Consortium (CPC) capacity between Tengiz and black sea coast is planned to be doubled by 2015. However the area still needs further developments and expansion of direct export routes to Europe. Nabucco, ITGI, TAP pipeline
39
projects or AGRI (LNG) project via the black sea that are currently discussed, are such solutions, but they are still not fully concrete and require strong state support. Although the area is perceived as a fantastic area for exploration, the situation is quite contrasted in the countries of this region, depending on the maturity of the exploration area, and the opening to foreign investment. Prior to 1999, exploration in offshore Caspian area was very limited, with only a few activities close to the coast of southern Dagestan. First major exploration began in 1999, with discoveries of Khvalynskoye and Yuri Korchagin, rapidly followed by Rakushechnoye, Sarmatskoye and Filanovsky. Accurate reserve estimates are lacking in the area, but it is described as 'significant'. According to BP , proved reserves in the area are in the range of 450 tcf. Kazakhstan is one of the most promising countries in Central Asia, and considered as rather under explored. Although several giant oil discoveries were made in the Northern Caspian area, natural gas exploration has clearly lagged behind oil due to the lack of domestic pipeline infrastructure, linking the western gas producing regions to the eastern consuming (industrial) regions. Gas potential in this country should be considered as promising, presently sustained by key partnerships with Russia and China. Major undiscovered resources should be considered to be offshore, and dedicated to major companies due to the development scale, but onshore exploration and appraisal activities are benefiting from smaller players involvement (BNBn Tethys Petroleum, Max Petroleum…p) and are still adding significant resources. In Azerbaijan, historic exploration focused on onshore plays that are now thoroughly explored. The remaining undiscovered hydrocarbons should mostly be located offshore, in very challenging environments. In particular, the reservoirs from deltaic origin are highly overpressured due to the very quick deposition of the overlying sediments. In addition, the depths to reach are very important, requiring high technology drilling. The late exploration results were somewhat mixed. Of the 10 deep offshore wells drilled by foreign companies in the last 10 years, only one major discovery had been made (Shah Deniz estimated between 22.5 to 42 Tcf). In contrast, numerous structures were disappointing (Araz Deniz, Oguz, Lenkoran Talysh, Kurdashi, Inam,…). The conjunction of high costs and limited success explains the low number exploration in the area. The difficult geological environment necessitates state of the art drilling and completion technologies. Even with that, some of the targets could not be reached (eg. Inam, Yanan Tava and Zafar Mashal) and some of the structures remain yet to be properly tested. It has to be noted that the recent announcement on Absheron-2X might add another significant exploration success. In Turkmenistan, the latest decade results were less spectacular with 200 wells finding only 5.3 Tcf in 17 gas fields, until discovery and reassessment of the giant South Iolotan field (est. around 21 tcm (More than 700 tcf), although a lot of uncertainty still exists on the proper reserves). It allowed the country to jump as one of the world‘s new gas reserve holder. The S. Iolotan reserves, along with the developments of the reserves in the sub-salt Jurassic layers, allowed to consider major export project, directed to the East. The Turkmenistan-China gas pipeline progressed with first stages of construction of the Uzbek and Kazakh sections. There is a question as to whether other countries like Kyrgyzstan and Uzbekistan might become major players in the area. The reserves are presently considered as of a lesser extent of their neighbors. Uzbekistan is however having a good position, being the 3rd
40
largest producer of natural gas in the FSU after the Russian Federation and Turkmenistan. According to the BP Statistical Review of World Energy 2011, Uzbekistan‘s proven natural gas reserves at 55 tcf, mainly in the Amudarya basin and the Murabek area in the southwest of Uzbekistan. Recently exploration focused on the Aral sea region, with first announced successes. Kyrgyzstan is also seeking development of its gas reserves with involvement of foreign companies. Successes of the exploration in these two countries are, however, dependant from the local incentives, to open market, to promote private sector and to establish convertibility of currencies. 3.9. Discussion
The areas reviewed in the preceding pages are spanned all over the world. There is potential remaining in many locations and the recent major discoveries announced in the recent years highlight that reserve replacement can be sustained by exploration for some time. As frontier or recently identified areas may be capable of adding substantial reserve growth, it should however be clear that a large part of the potential is situated in existing proven plays, and for a large part situated in deepwater. Gulf of Mexico, West Africa (and in particular Nigeria and Angola), Egypt, Brazilian Santos and Campos basins will continue to be the key drivers for exploration performance, for Gas and Oil. Due to these areas, importance of deepwater E&P will likely to be increasing in the next twenty years (89% of Resources found in 2010 were offshore). Moreover, Frontier Exploration may create new opportunities, but many of the recent discoveries of significant size were made in areas that are already identified as well endowed with gas resources, as in Northern Western Siberian area, Australia, Iran or Norway. The challenge of Frontier Exploration is not only to be able to find new resources in difficult or poorly known locations, but then to be able to successfully translate those discoveries into production, while being in competition with historic areas. A regional abundance of gas reserves may be impacting negatively on the development of new areas, as competition for sales contracts is increasing with the expansion of LNG global market. In addition, Frontier areas may suffer from the time span to be able to set up a gas infrastructure to export the gas to the consuming areas. This will be an issue for the East African development, but may also be the case for some remote Australian projects. In addition, conventional frontier exploration is facing competition from unconventional sources, either shale gas, tight gas or Coal Bed Methane. These new gas supplies may impact locally the markets, as Shale gas in US, providing a variety of supply solutions. As a fact, according to Wood Mackenzie, a large part of the gas reserves that were discovered in the last ten years are yet to be concretized. And for example, less than 5tcf were already produced on the 170 tcf discovered in 2000. As a conclusion, Exploring in new areas may be both extremely exciting and valuable, being able to change completely the face of a company or even a country. However, the success of frontier exploration relies on the capacity to bring to the market the discoveries. It is therefore strongly linked to the capacity to gather rapidly a pool of enough reserves to be able to proceed to development. The projects in Frontier areas always face technical challenges, either due to lack of infrastructure, considerable water depths, high pressure / high temperature reservoirs or difficult targets. These impose economical threats to the operators

41
that are investing in these areas. The success of Frontier exploration is therefore dependent on new technological innovations, that allow to face these challenges by drilling deeper and safer, and by designing creative production facilities. It is also largely dependant on the political support of the countries, which should be establishing the necessary incentives to take risks.
42
4. Recent Technologies and Gas Development Standards 4.1. Brazilian Pre-Salt
4.1.1 Introduction The history of the pre-salt formation starts with the tectonic separation of South America and Africa at about 120 million years. As a consequence of the separation of the continents a large crack was formed, called a rift, whose direction was almost parallel to the present Brazilian coast. The rift in the pre-salt area was initially filled with sedimentary rocks as sand, clay and volcanic igneous rocks. Over time, the rift increased its width and formed large lakes, where the sandy and clayey sediments were replaced by carbonate rocks. The carbonates were generated by the trapping, binding and cementation of sedimentary grains by microorganisms, especially cyanobacteria (blue-green algae), creating structures known as stromatolites. The end of the formation of carbonate rocks is associated with the onset of deposition of salt, which consists of the sealing layer for the reservoirs formed. The exploration and production of the pre-salt in Brazil was the result of Petrobras‘ efforts to find new exploratory horizons in the Brazilian sedimentary basins. This process has begun in 2001, when Petrobras started one of the highest 3-D world seismic program, mapping 20 square kilometers in Santos Basin, an offshore basin, on the southeast region of Brazil. In 2004, as known sandy rocks were found in the region, deposited in deep waters above the salt level, a few wells were drilled by a consortia having Petrobras as the operator. Since oil and gas were discovered, the company decided to drill deeper until reaching the pre-salt, where technicians believed major reservoirs would be found. This way, in 2006, when drilling had already reached a depth of 7,600 meters from the water line, a giant gas accumulation and reservoirs of oil condensate, were found. That same year, in another drilling done in the Santos Basin, another discovery was made under the salt layer, in a depth of a little more than 5,000 meters from the water line, in the well called Lula. This discovery leads to the drilling of seven more wells, all of them being successful, what testified the potential of this region.
4.1.2 Reservoirs The pre-salt reservoirs are, as is characteristic of carbonate reservoirs, heterogeneous, with highly variable petrophysical properties. The natural gas produced in these reservoirs is basically associated with oil, in a gas-oil ratio between 200 and 300 m3/m3 and variable contents of CO2, ranging from 8 to 12%. The oil has API gravity between 28 and 30 and the reservoirs depths are between 5,000 and 6,000 meters below the sea level, under an extensive salt layer, which in some areas reaches thicknesses of up to 2,000 meters. The production systems (platforms and wells) had to be designed with flexibility in order to operate in different scenarios, which will only be revealed along the development of the projects. Extended Well Tests (EWTs) and Pilot systems were needed to anticipate dynamic information in order to allow optimizing the design of the production systems and the recovery strategies. In May 2009 the FPSO BW Cidade de São Vicente was installed in the Lula field, moored in 2,160 meters of water depth, around 280 km off the coast. The results since collected confirmed the adequacy of the strategy to install a EWT in the area before larger scale systems. Based on the data already obtained, it has been possible to propose technical modifications to optimize the Lula Pilot Project, installed by late 2010.
43
Among other relevant information, the EWT has indicated that the radius investigated by the well is very large and no flow barriers have been detected so far. Although the pre-salt reservoirs do not present obstacles for commercial exploitation, there are many challenges and opportunities to optimize the production development projects. Amongst them it can depicted: characterization and predictability of the non-conventional, heterogeneous microbial carbonate reservoirs; flow assurance in ultra-deep waters (1,900 to 2,400 meters); cost reduction in the well drilling and completion campaign through learning curve and improvements in operational procedures; supply of special materials and operation not only of complex gas processing plants in the production units, but also as a complex gas pipeline system in ultra-deep waters and far away from shore.
4.1.3 CO2 One of the main challenges for the pre-salt development is related to the management of the carbon dioxide (CO2) found in some wells, as there are no conclusive studies about the distribution of the concentration of CO2 along the reservoirs yet. Some wells showed high concentrations of it, above those found in the Campos Basin – an offshore basin, located on the southeast region of Brazil, near to Santos Basin and, nowadays, the main petroleum province of the country – while others showed concentrations close to zero. Nevertheless, as a high content of CO2 can be expected in many of the plays, the subsea and topside systems had to be developed taking it into account, as it will be detailed in the next subchapters. Petrobras and its co-ventures are looking at options to not releasing to the atmosphere the CO2 associated with the natural gas to be produced in the pre-salt. One of the options includes applying Carbon Capture and Geological Storage – CCGS1 technologies to capture and store the CO2, although there are issues to be overcome, whether in the capture of CO2 – the process of its separation from flue gases in the marine environment – either in defining the most appropriate option for the disposal of the CO2. The processes for CO2 capture can be divided into four categories: pre-combustion, post-combustion, oxy-fuel combustion and industrial processes as natural gas purification. All of these capture systems typically consume energy, impacting the overall efficiency of the unit, when compared with the same unit without the capture process. The most common technologies used today for capturing CO2 from natural gas streams produced from oil fields are based in absorption or membrane technologies. For onshore projects these processes can be considered mature, but innovative solutions are needed for offshore systems in order to reduce weight, space and energy consumption of the CO2 separation facilities installed in the Stationary Production Units. Except when the units are located on the geological storage site, the captured CO2 must be transported from the capture units to the point of storage. The transport may be accomplished by pipelines, ships, tanks, trucks or as solid dry ice. Due to the volumes involved, the pipeline transportation is the most commonly employed method considering its
1 CCGS is a set of processes consisting in:
separation of CO2 from industrial activities and / or stream of natural gas;
transportation to a site that contains a geological structure capable of providing storage and, in the isolation, for long term, of this structure to ensure that the CO2 will not return to the atmosphere.
These processes are understood by the IPCC - Intergovernmental Panel on Climate Change (organism established by the United Nations Environmental Program to provide scientific, technical and socio-economical information relevant to the understanding of climate change) - as an effective option for the stabilization of atmospheric concentrations of greenhouse gases.
44
low cost compared with the others, mainly through the application of large diameter pipelines. Moreover, pipelines are a well-established practice by the chemical and oil industries, and have procedures analogous to the transportation of natural gas. With respect to storage of CO2 in geological formations as a final destination of the separated CO2 from natural gas stream, an important consideration is related to the kind of geological formation that will be used. The current intention is to store the CO2 in porous geological formations, such as sedimentary basins, but injection into metamorphic and igneous rocks shows potential in the future due to its fractured nature. CO2 can be stored in geological formations such as oil and gas reservoirs for Enhanced Oil Recovery (EOR) or Enhanced Gas Recovery (EGR), in minable coal seams for Enhanced Coal Bed Methane recovery (ECBM), depleted oil and gas reservoirs and deep saline aquifers. The process of storage must be monitored to ensure that the injected volumes do not return to the atmosphere either by natural routes, through leaking faults, or by artificial routes, such as poorly cemented wells drilled into the seals of the reservoirs. The most widely used monitoring technique is the 4D seismic, but several other techniques can be used, for example, gravity or surface geochemistry. The disposal of the CO2 expected to be produced with the natural gas stream in the Santos Basin Pre-Salt Cluster (SBPSC) is being studied under a comprehensive perspective, and the following options are being technically and economically evaluated: Enhanced Oil Recovery (EOR) in the pre-salt areas; CO2 storage in saline aquifers; EOR in heavy oil fields, in the Santos Basin; CO2 storage in depleted gas fields; CO2 storage in salt caverns, to be constructed in the cluster area; CO2 transportation to shore and commercialization in industrial plants (non-geological option). Although all the six alternatives are being equally appraised, some of them show more promising for the SBPSC scenario. The preferred option for the disposal of the CO2 rich stream to be separated from the production gas seems to be the reinjection in the hydrocarbon reservoir where it came from, as there is a twofold benefit in this strategy: providing some enhancement in the oil and gas recovery and ascertaining that the produced CO2 will be effectively stored.
4.1.4 Subsea systems The main goal of the subsea systems designed for the Pre-Salt fields is to provide solutions that comply with the design and flow assurance requirements. Special focus is given to the integrity management philosophy for the subsea equipments, risers and pipelines. The list below presents some of the challenges faced in the development of a subsea production system for the Pre-Salt area:
a) Sour service and high CO2 contents
The presence of H2S and CO2 in high concentrations, considering that water may be present, even in minor amounts, raises different failure modes and mechanisms not usually triggered by low-CO2, sweet service applications. Some of these are as follows:
High CO2 contents account for much higher corrosion rates when compared to low or no CO2 applications;
Stress-corrosion cracking and hydrogen induced cracking assisted by the presence of H2S and CO2 forces the systems to employ low-resistance, sour service ready, equipment. Thus, more material and heavier components are
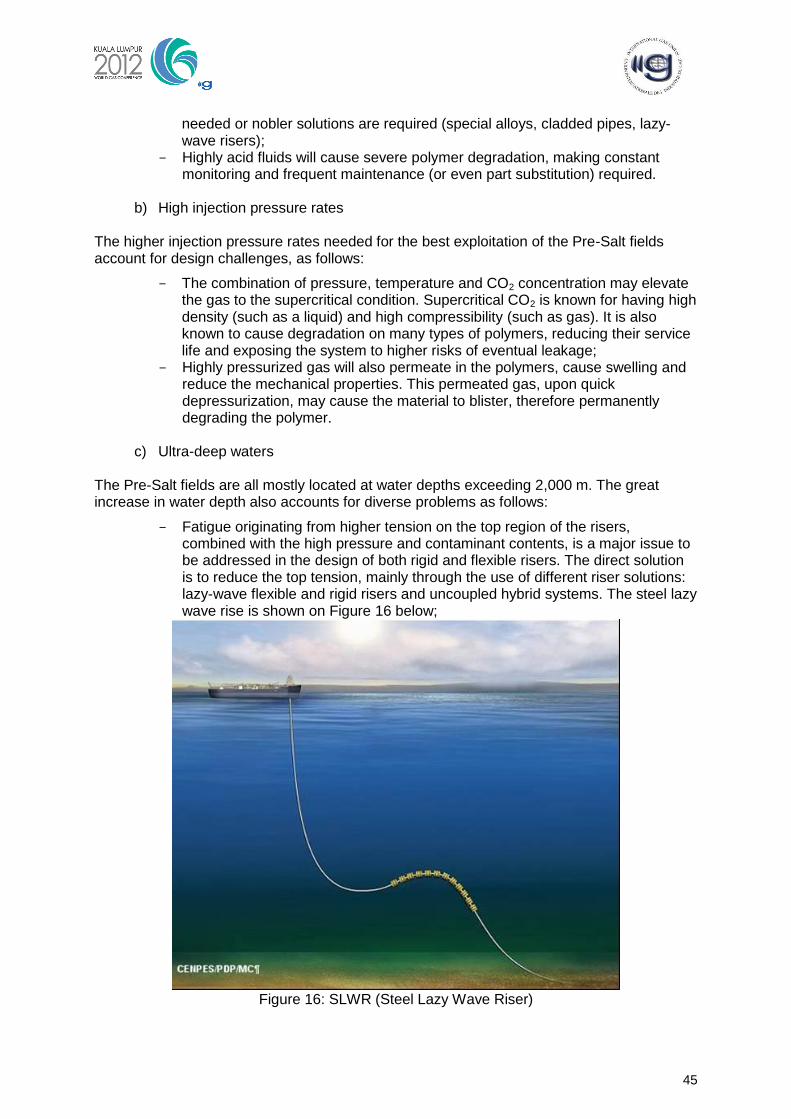
45
needed or nobler solutions are required (special alloys, cladded pipes, lazy-wave risers);
Highly acid fluids will cause severe polymer degradation, making constant monitoring and frequent maintenance (or even part substitution) required.
b) High injection pressure rates
The higher injection pressure rates needed for the best exploitation of the Pre-Salt fields account for design challenges, as follows:
The combination of pressure, temperature and CO2 concentration may elevate the gas to the supercritical condition. Supercritical CO2 is known for having high density (such as a liquid) and high compressibility (such as gas). It is also known to cause degradation on many types of polymers, reducing their service life and exposing the system to higher risks of eventual leakage;
Highly pressurized gas will also permeate in the polymers, cause swelling and reduce the mechanical properties. This permeated gas, upon quick depressurization, may cause the material to blister, therefore permanently degrading the polymer.
c) Ultra-deep waters
The Pre-Salt fields are all mostly located at water depths exceeding 2,000 m. The great increase in water depth also accounts for diverse problems as follows:
Fatigue originating from higher tension on the top region of the risers, combined with the high pressure and contaminant contents, is a major issue to be addressed in the design of both rigid and flexible risers. The direct solution is to reduce the top tension, mainly through the use of different riser solutions: lazy-wave flexible and rigid risers and uncoupled hybrid systems. The steel lazy wave rise is shown on Figure 16 below;
Figure 16: SLWR (Steel Lazy Wave Riser)
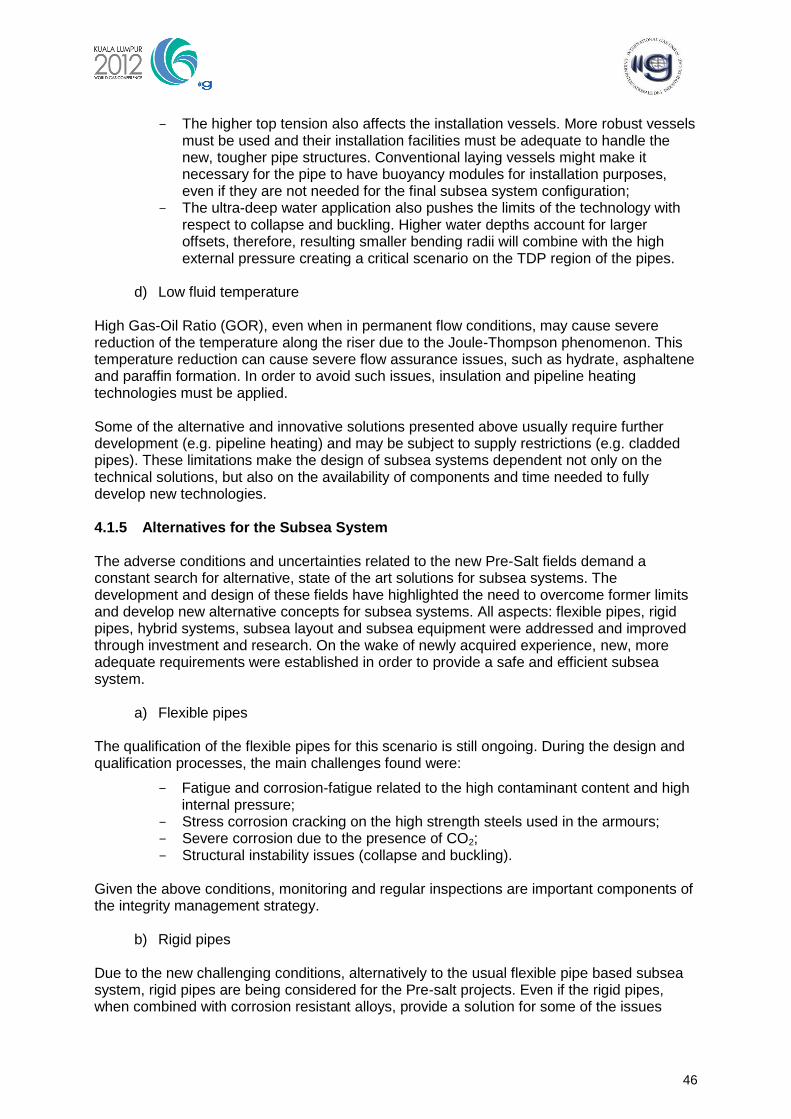
46
The higher top tension also affects the installation vessels. More robust vessels must be used and their installation facilities must be adequate to handle the new, tougher pipe structures. Conventional laying vessels might make it necessary for the pipe to have buoyancy modules for installation purposes, even if they are not needed for the final subsea system configuration;
The ultra-deep water application also pushes the limits of the technology with respect to collapse and buckling. Higher water depths account for larger offsets, therefore, resulting smaller bending radii will combine with the high external pressure creating a critical scenario on the TDP region of the pipes.
d) Low fluid temperature
High Gas-Oil Ratio (GOR), even when in permanent flow conditions, may cause severe reduction of the temperature along the riser due to the Joule-Thompson phenomenon. This temperature reduction can cause severe flow assurance issues, such as hydrate, asphaltene and paraffin formation. In order to avoid such issues, insulation and pipeline heating technologies must be applied. Some of the alternative and innovative solutions presented above usually require further development (e.g. pipeline heating) and may be subject to supply restrictions (e.g. cladded pipes). These limitations make the design of subsea systems dependent not only on the technical solutions, but also on the availability of components and time needed to fully develop new technologies. 4.1.5 Alternatives for the Subsea System The adverse conditions and uncertainties related to the new Pre-Salt fields demand a constant search for alternative, state of the art solutions for subsea systems. The development and design of these fields have highlighted the need to overcome former limits and develop new alternative concepts for subsea systems. All aspects: flexible pipes, rigid pipes, hybrid systems, subsea layout and subsea equipment were addressed and improved through investment and research. On the wake of newly acquired experience, new, more adequate requirements were established in order to provide a safe and efficient subsea system.
a) Flexible pipes
The qualification of the flexible pipes for this scenario is still ongoing. During the design and qualification processes, the main challenges found were:
Fatigue and corrosion-fatigue related to the high contaminant content and high internal pressure;
Stress corrosion cracking on the high strength steels used in the armours; Severe corrosion due to the presence of CO2; Structural instability issues (collapse and buckling).
Given the above conditions, monitoring and regular inspections are important components of the integrity management strategy.
b) Rigid pipes
Due to the new challenging conditions, alternatively to the usual flexible pipe based subsea system, rigid pipes are being considered for the Pre-salt projects. Even if the rigid pipes, when combined with corrosion resistant alloys, provide a solution for some of the issues
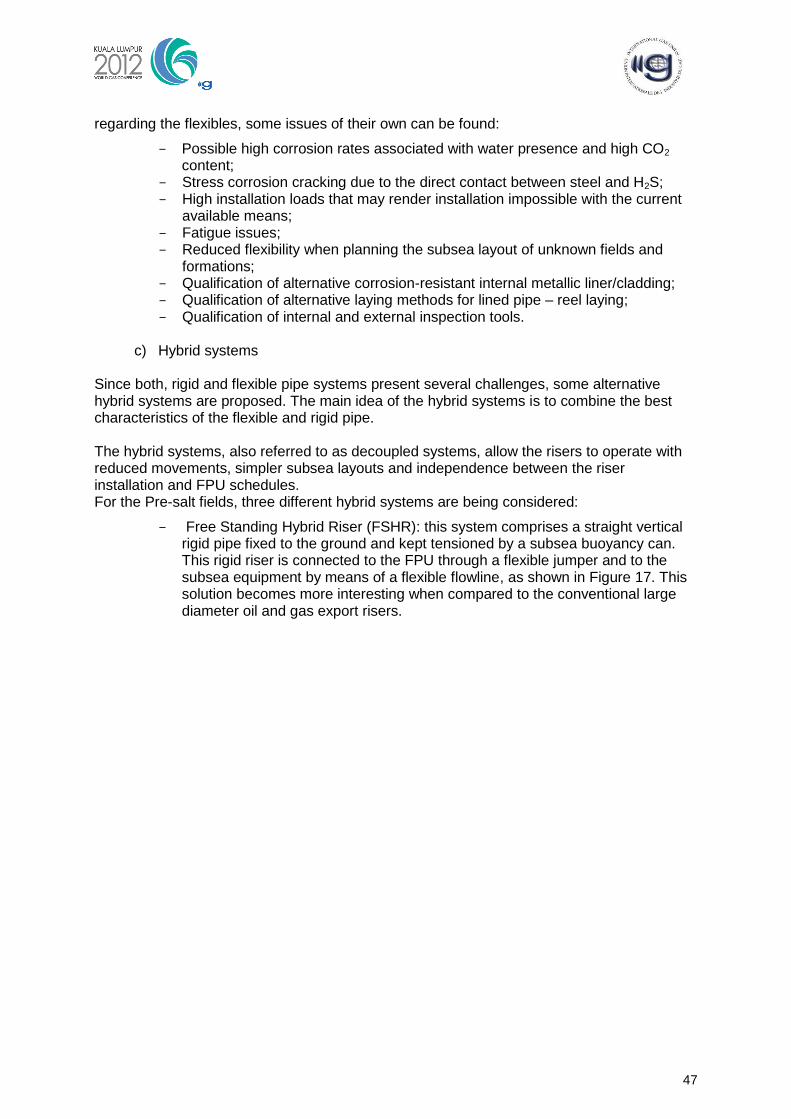
47
regarding the flexibles, some issues of their own can be found:
Possible high corrosion rates associated with water presence and high CO2 content;
Stress corrosion cracking due to the direct contact between steel and H2S; High installation loads that may render installation impossible with the current
available means; Fatigue issues; Reduced flexibility when planning the subsea layout of unknown fields and
formations; Qualification of alternative corrosion-resistant internal metallic liner/cladding; Qualification of alternative laying methods for lined pipe – reel laying; Qualification of internal and external inspection tools.
c) Hybrid systems
Since both, rigid and flexible pipe systems present several challenges, some alternative hybrid systems are proposed. The main idea of the hybrid systems is to combine the best characteristics of the flexible and rigid pipe. The hybrid systems, also referred to as decoupled systems, allow the risers to operate with reduced movements, simpler subsea layouts and independence between the riser installation and FPU schedules. For the Pre-salt fields, three different hybrid systems are being considered:
Free Standing Hybrid Riser (FSHR): this system comprises a straight vertical rigid pipe fixed to the ground and kept tensioned by a subsea buoyancy can. This rigid riser is connected to the FPU through a flexible jumper and to the subsea equipment by means of a flexible flowline, as shown in Figure 17. This solution becomes more interesting when compared to the conventional large diameter oil and gas export risers.
48
Figure 17: FSHR (Free Standing Hybrid Riser)
Riser Tower: similar to the FSHR, this system consists of a vertical rigid bundle
of risers tensioned by a subsea buoyancy can, as seen in Figure 18. This system allows for the connection of more than one well per tower, this provides better thermal insulation since it concentrates several risers within a protective outer pipe. The possibility to connect more than one well in one riser tower turns makes system into an attractive option for the production gathering system.
Figure 18: Riser Tower
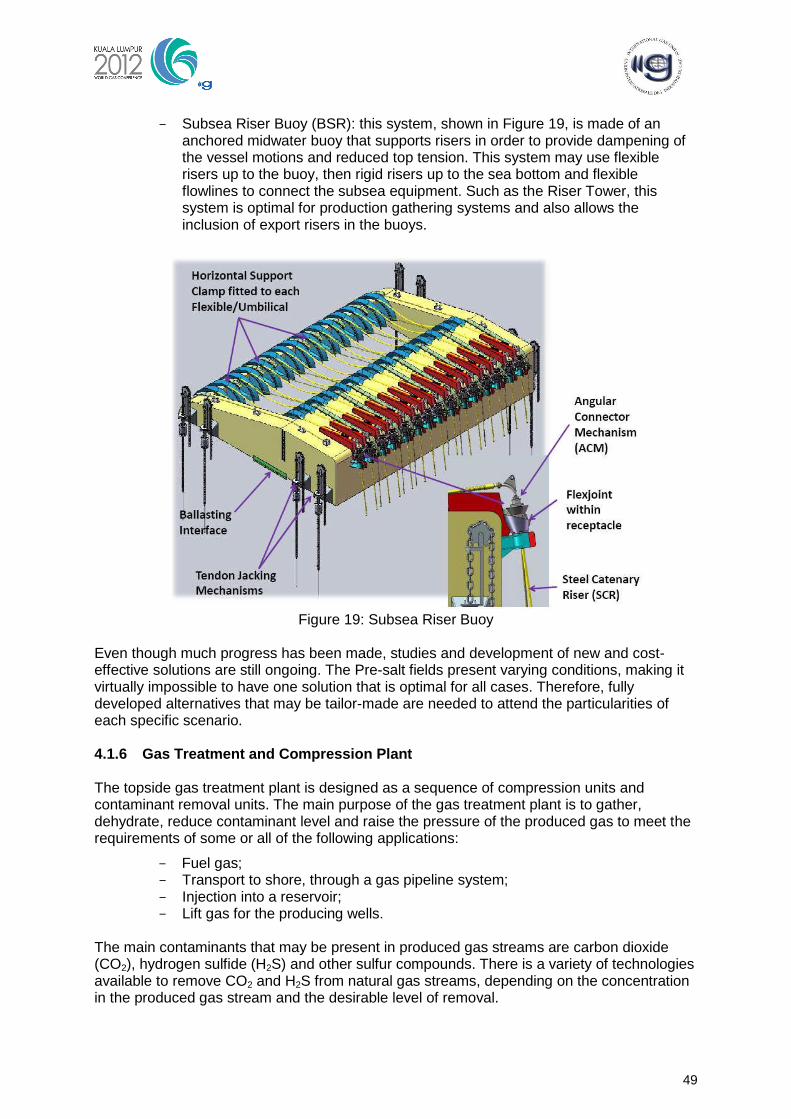
49
Subsea Riser Buoy (BSR): this system, shown in Figure 19, is made of an anchored midwater buoy that supports risers in order to provide dampening of the vessel motions and reduced top tension. This system may use flexible risers up to the buoy, then rigid risers up to the sea bottom and flexible flowlines to connect the subsea equipment. Such as the Riser Tower, this system is optimal for production gathering systems and also allows the inclusion of export risers in the buoys.
Figure 19: Subsea Riser Buoy
Even though much progress has been made, studies and development of new and cost-effective solutions are still ongoing. The Pre-salt fields present varying conditions, making it virtually impossible to have one solution that is optimal for all cases. Therefore, fully developed alternatives that may be tailor-made are needed to attend the particularities of each specific scenario. 4.1.6 Gas Treatment and Compression Plant The topside gas treatment plant is designed as a sequence of compression units and contaminant removal units. The main purpose of the gas treatment plant is to gather, dehydrate, reduce contaminant level and raise the pressure of the produced gas to meet the requirements of some or all of the following applications:
Fuel gas; Transport to shore, through a gas pipeline system; Injection into a reservoir; Lift gas for the producing wells.
The main contaminants that may be present in produced gas streams are carbon dioxide (CO2), hydrogen sulfide (H2S) and other sulfur compounds. There is a variety of technologies available to remove CO2 and H2S from natural gas streams, depending on the concentration in the produced gas stream and the desirable level of removal.
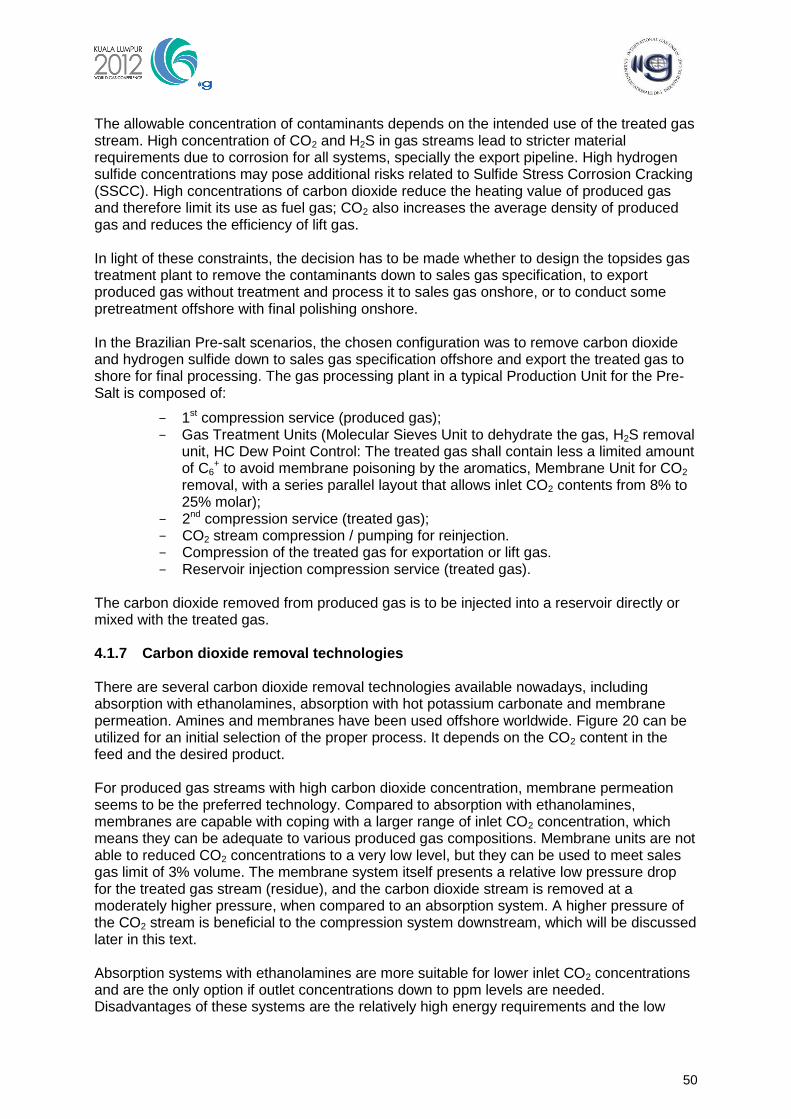
50
The allowable concentration of contaminants depends on the intended use of the treated gas stream. High concentration of CO2 and H2S in gas streams lead to stricter material requirements due to corrosion for all systems, specially the export pipeline. High hydrogen sulfide concentrations may pose additional risks related to Sulfide Stress Corrosion Cracking (SSCC). High concentrations of carbon dioxide reduce the heating value of produced gas and therefore limit its use as fuel gas; CO2 also increases the average density of produced gas and reduces the efficiency of lift gas. In light of these constraints, the decision has to be made whether to design the topsides gas treatment plant to remove the contaminants down to sales gas specification, to export produced gas without treatment and process it to sales gas onshore, or to conduct some pretreatment offshore with final polishing onshore. In the Brazilian Pre-salt scenarios, the chosen configuration was to remove carbon dioxide and hydrogen sulfide down to sales gas specification offshore and export the treated gas to shore for final processing. The gas processing plant in a typical Production Unit for the Pre-Salt is composed of:
1st compression service (produced gas); Gas Treatment Units (Molecular Sieves Unit to dehydrate the gas, H2S removal
unit, HC Dew Point Control: The treated gas shall contain less a limited amount of C6
+ to avoid membrane poisoning by the aromatics, Membrane Unit for CO2 removal, with a series parallel layout that allows inlet CO2 contents from 8% to 25% molar);
2nd compression service (treated gas); CO2 stream compression / pumping for reinjection. Compression of the treated gas for exportation or lift gas. Reservoir injection compression service (treated gas).
The carbon dioxide removed from produced gas is to be injected into a reservoir directly or mixed with the treated gas. 4.1.7 Carbon dioxide removal technologies There are several carbon dioxide removal technologies available nowadays, including absorption with ethanolamines, absorption with hot potassium carbonate and membrane permeation. Amines and membranes have been used offshore worldwide. Figure 20 can be utilized for an initial selection of the proper process. It depends on the CO2 content in the feed and the desired product. For produced gas streams with high carbon dioxide concentration, membrane permeation seems to be the preferred technology. Compared to absorption with ethanolamines, membranes are capable with coping with a larger range of inlet CO2 concentration, which means they can be adequate to various produced gas compositions. Membrane units are not able to reduced CO2 concentrations to a very low level, but they can be used to meet sales gas limit of 3% volume. The membrane system itself presents a relative low pressure drop for the treated gas stream (residue), and the carbon dioxide stream is removed at a moderately higher pressure, when compared to an absorption system. A higher pressure of the CO2 stream is beneficial to the compression system downstream, which will be discussed later in this text. Absorption systems with ethanolamines are more suitable for lower inlet CO2 concentrations and are the only option if outlet concentrations down to ppm levels are needed. Disadvantages of these systems are the relatively high energy requirements and the low
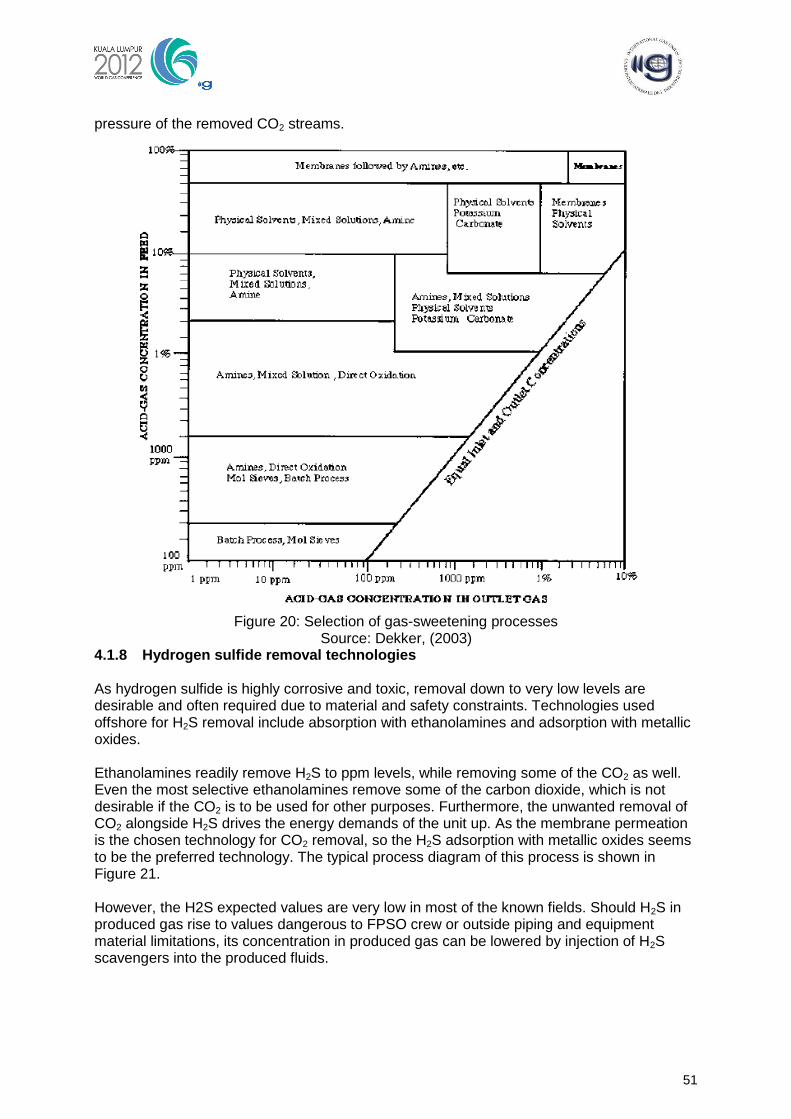
51
pressure of the removed CO2 streams.
Figure 20: Selection of gas-sweetening processes
Source: Dekker, (2003) 4.1.8 Hydrogen sulfide removal technologies As hydrogen sulfide is highly corrosive and toxic, removal down to very low levels are desirable and often required due to material and safety constraints. Technologies used offshore for H2S removal include absorption with ethanolamines and adsorption with metallic oxides. Ethanolamines readily remove H2S to ppm levels, while removing some of the CO2 as well. Even the most selective ethanolamines remove some of the carbon dioxide, which is not desirable if the CO2 is to be used for other purposes. Furthermore, the unwanted removal of CO2 alongside H2S drives the energy demands of the unit up. As the membrane permeation is the chosen technology for CO2 removal, so the H2S adsorption with metallic oxides seems to be the preferred technology. The typical process diagram of this process is shown in Figure 21. However, the H2S expected values are very low in most of the known fields. Should H2S in produced gas rise to values dangerous to FPSO crew or outside piping and equipment material limitations, its concentration in produced gas can be lowered by injection of H2S scavengers into the produced fluids.
52
Figure 21: Typical adsorption process diagram
4.1.9 Water and Hydrocarbon dew point control technologies Water must be removed from produced gas streams for three main reasons: to avoid membrane damage, to prevent hydrate formation in injection lines or gas pipelines, and to reduce corrosion potential, allowing for the use of less expansive materials in piping and equipment. There is a variety of gas dehydration process technologies, the main ones being absorption with triethylene glycol and adsorption with molecular sieves. Due to riser and pipeline very low water dew point requirements, adsorption of molecular sieves was selected for the Standard FPSO. The diagram of a typical molecular sieve adsorption unit is shown in Figure 22.
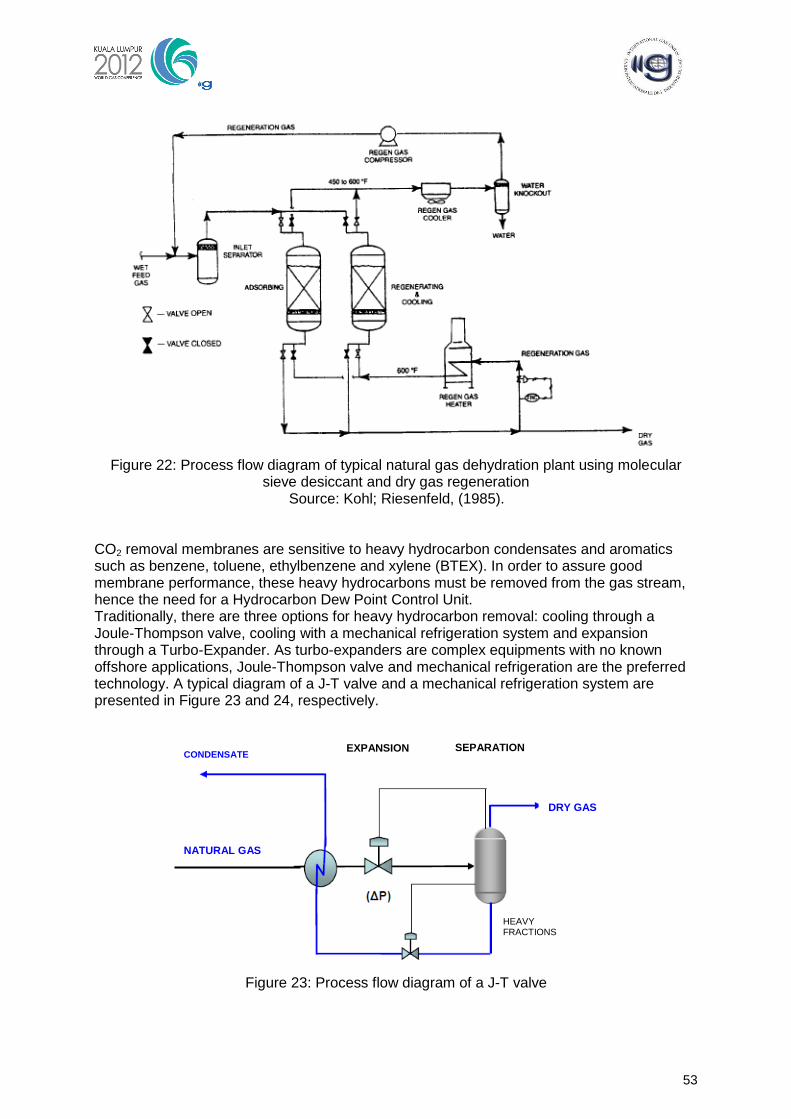
53
Figure 22: Process flow diagram of typical natural gas dehydration plant using molecular
sieve desiccant and dry gas regeneration Source: Kohl; Riesenfeld, (1985).
CO2 removal membranes are sensitive to heavy hydrocarbon condensates and aromatics such as benzene, toluene, ethylbenzene and xylene (BTEX). In order to assure good membrane performance, these heavy hydrocarbons must be removed from the gas stream, hence the need for a Hydrocarbon Dew Point Control Unit. Traditionally, there are three options for heavy hydrocarbon removal: cooling through a Joule-Thompson valve, cooling with a mechanical refrigeration system and expansion through a Turbo-Expander. As turbo-expanders are complex equipments with no known offshore applications, Joule-Thompson valve and mechanical refrigeration are the preferred technology. A typical diagram of a J-T valve and a mechanical refrigeration system are presented in Figure 23 and 24, respectively.
Figure 23: Process flow diagram of a J-T valve
EXPANSION SEPARATION
HEAVY FRACTIONS
CONDENSATE
NATURAL GAS
DRY GAS
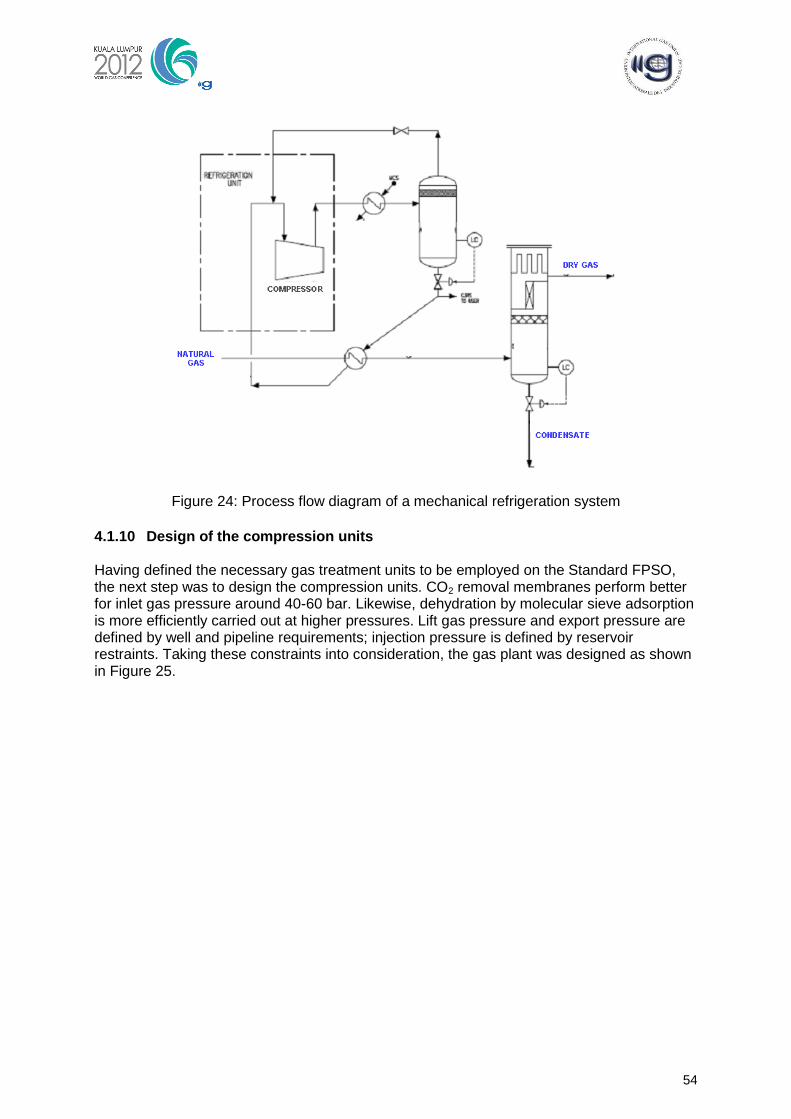
54
Figure 24: Process flow diagram of a mechanical refrigeration system
4.1.10 Design of the compression units Having defined the necessary gas treatment units to be employed on the Standard FPSO, the next step was to design the compression units. CO2 removal membranes perform better for inlet gas pressure around 40-60 bar. Likewise, dehydration by molecular sieve adsorption is more efficiently carried out at higher pressures. Lift gas pressure and export pressure are defined by well and pipeline requirements; injection pressure is defined by reservoir restraints. Taking these constraints into consideration, the gas plant was designed as shown in Figure 25.
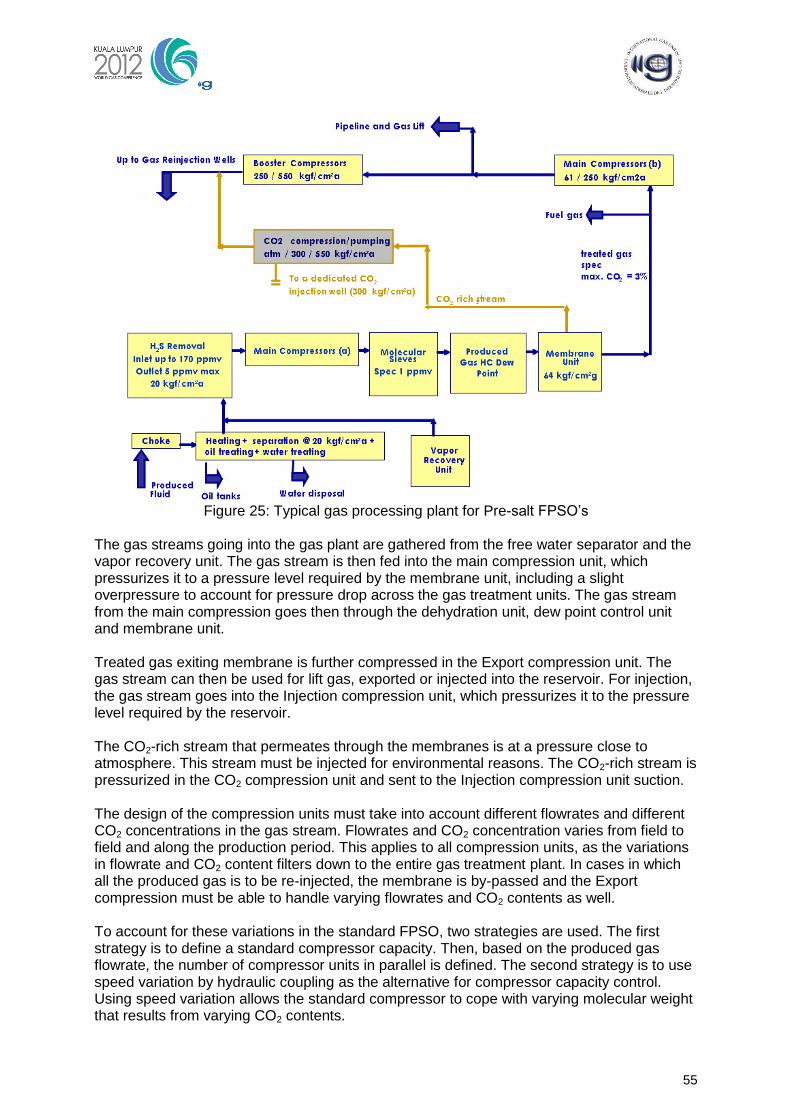
55
Figure 25: Typical gas processing plant for Pre-salt FPSO‘s
The gas streams going into the gas plant are gathered from the free water separator and the vapor recovery unit. The gas stream is then fed into the main compression unit, which pressurizes it to a pressure level required by the membrane unit, including a slight overpressure to account for pressure drop across the gas treatment units. The gas stream from the main compression goes then through the dehydration unit, dew point control unit and membrane unit. Treated gas exiting membrane is further compressed in the Export compression unit. The gas stream can then be used for lift gas, exported or injected into the reservoir. For injection, the gas stream goes into the Injection compression unit, which pressurizes it to the pressure level required by the reservoir. The CO2-rich stream that permeates through the membranes is at a pressure close to atmosphere. This stream must be injected for environmental reasons. The CO2-rich stream is pressurized in the CO2 compression unit and sent to the Injection compression unit suction. The design of the compression units must take into account different flowrates and different CO2 concentrations in the gas stream. Flowrates and CO2 concentration varies from field to field and along the production period. This applies to all compression units, as the variations in flowrate and CO2 content filters down to the entire gas treatment plant. In cases in which all the produced gas is to be re-injected, the membrane is by-passed and the Export compression must be able to handle varying flowrates and CO2 contents as well. To account for these variations in the standard FPSO, two strategies are used. The first strategy is to define a standard compressor capacity. Then, based on the produced gas flowrate, the number of compressor units in parallel is defined. The second strategy is to use speed variation by hydraulic coupling as the alternative for compressor capacity control. Using speed variation allows the standard compressor to cope with varying molecular weight that results from varying CO2 contents.
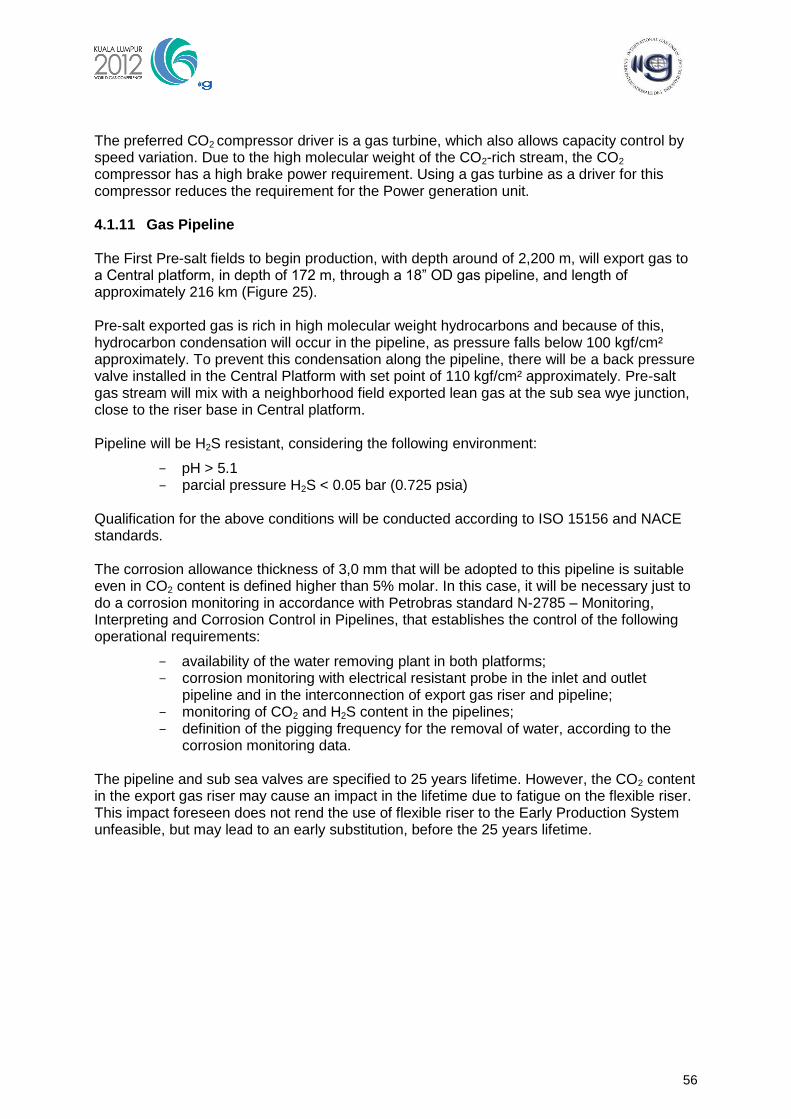
56
The preferred CO2 compressor driver is a gas turbine, which also allows capacity control by speed variation. Due to the high molecular weight of the CO2-rich stream, the CO2 compressor has a high brake power requirement. Using a gas turbine as a driver for this compressor reduces the requirement for the Power generation unit. 4.1.11 Gas Pipeline The First Pre-salt fields to begin production, with depth around of 2,200 m, will export gas to a Central platform, in depth of 172 m, through a 18‖ OD gas pipeline, and length of approximately 216 km (Figure 25). Pre-salt exported gas is rich in high molecular weight hydrocarbons and because of this, hydrocarbon condensation will occur in the pipeline, as pressure falls below 100 kgf/cm² approximately. To prevent this condensation along the pipeline, there will be a back pressure valve installed in the Central Platform with set point of 110 kgf/cm² approximately. Pre-salt gas stream will mix with a neighborhood field exported lean gas at the sub sea wye junction, close to the riser base in Central platform. Pipeline will be H2S resistant, considering the following environment:
pH > 5.1 parcial pressure H2S < 0.05 bar (0.725 psia)
Qualification for the above conditions will be conducted according to ISO 15156 and NACE standards. The corrosion allowance thickness of 3,0 mm that will be adopted to this pipeline is suitable even in CO2 content is defined higher than 5% molar. In this case, it will be necessary just to do a corrosion monitoring in accordance with Petrobras standard N-2785 – Monitoring, Interpreting and Corrosion Control in Pipelines, that establishes the control of the following operational requirements:
availability of the water removing plant in both platforms; corrosion monitoring with electrical resistant probe in the inlet and outlet
pipeline and in the interconnection of export gas riser and pipeline; monitoring of CO2 and H2S content in the pipelines; definition of the pigging frequency for the removal of water, according to the
corrosion monitoring data. The pipeline and sub sea valves are specified to 25 years lifetime. However, the CO2 content in the export gas riser may cause an impact in the lifetime due to fatigue on the flexible riser. This impact foreseen does not rend the use of flexible riser to the Early Production System unfeasible, but may lead to an early substitution, before the 25 years lifetime.
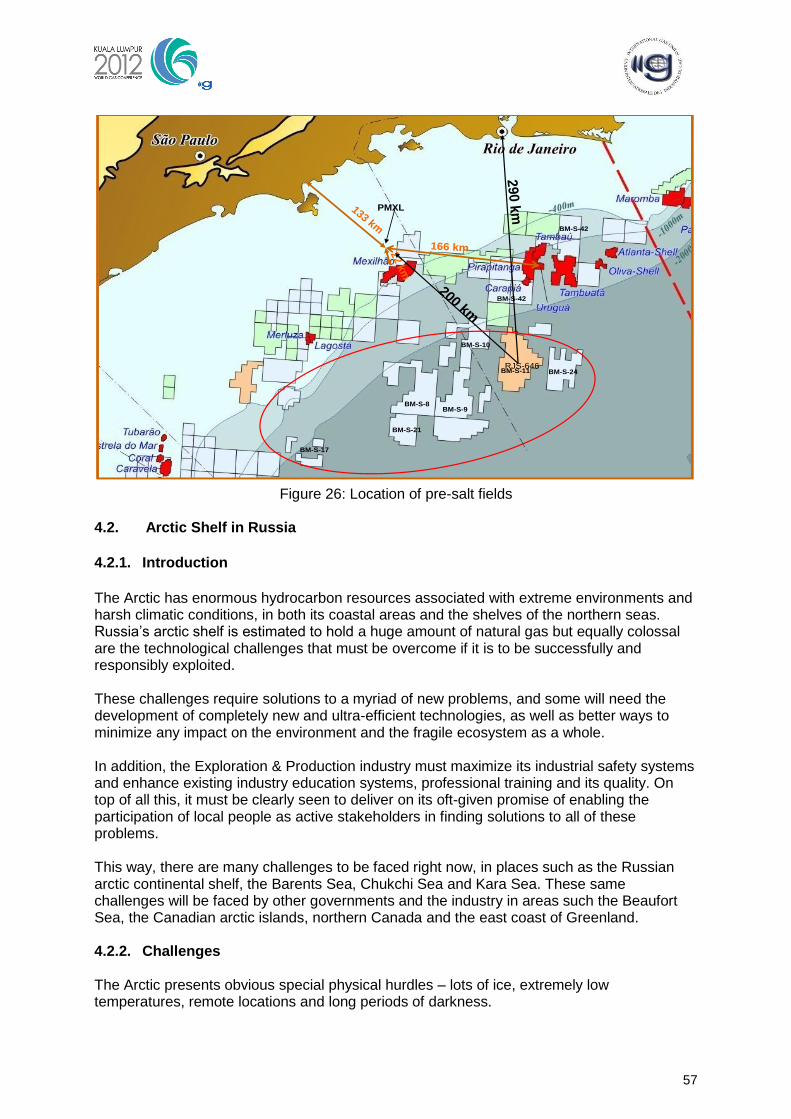
57
Figure 26: Location of pre-salt fields
4.2. Arctic Shelf in Russia
4.2.1. Introduction
The Arctic has enormous hydrocarbon resources associated with extreme environments and harsh climatic conditions, in both its coastal areas and the shelves of the northern seas. Russia‘s arctic shelf is estimated to hold a huge amount of natural gas but equally colossal are the technological challenges that must be overcome if it is to be successfully and responsibly exploited. These challenges require solutions to a myriad of new problems, and some will need the development of completely new and ultra-efficient technologies, as well as better ways to minimize any impact on the environment and the fragile ecosystem as a whole. In addition, the Exploration & Production industry must maximize its industrial safety systems and enhance existing industry education systems, professional training and its quality. On top of all this, it must be clearly seen to deliver on its oft-given promise of enabling the participation of local people as active stakeholders in finding solutions to all of these problems. This way, there are many challenges to be faced right now, in places such as the Russian arctic continental shelf, the Barents Sea, Chukchi Sea and Kara Sea. These same challenges will be faced by other governments and the industry in areas such the Beaufort Sea, the Canadian arctic islands, northern Canada and the east coast of Greenland.
4.2.2. Challenges The Arctic presents obvious special physical hurdles – lots of ice, extremely low temperatures, remote locations and long periods of darkness.
BM-S-21
BM-S-24
BM-S-8BM-S-9
BM-S-10
BM-S-11
BM-S-17
BM-S-42
BM-S-42
133 km
166 km
PMXL
22 k
m
200 km
290 k
m
RJS-646
BM-S-21
BM-S-24
BM-S-8BM-S-9
BM-S-10
BM-S-11
BM-S-17
BM-S-42
BM-S-42
133 km
166 km
PMXL
22 k
m
BM-S-21
BM-S-24
BM-S-8BM-S-9
BM-S-10
BM-S-11
BM-S-17
BM-S-42
BM-S-42
133 km
166 km
BM-S-21
BM-S-24
BM-S-8BM-S-9
BM-S-10
BM-S-11
BM-S-17
BM-S-42
BM-S-42
133 km
166 km
PMXL
22 k
m
200 km
290 k
m
RJS-646
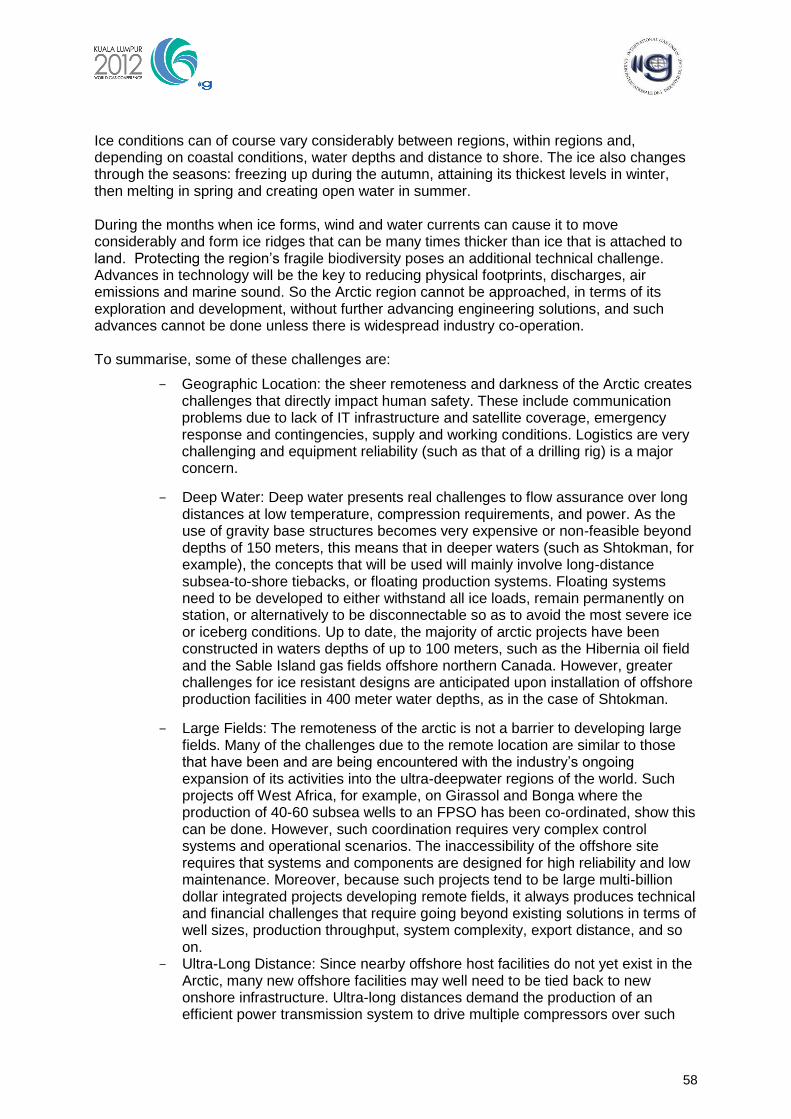
58
Ice conditions can of course vary considerably between regions, within regions and, depending on coastal conditions, water depths and distance to shore. The ice also changes through the seasons: freezing up during the autumn, attaining its thickest levels in winter, then melting in spring and creating open water in summer. During the months when ice forms, wind and water currents can cause it to move considerably and form ice ridges that can be many times thicker than ice that is attached to land. Protecting the region‘s fragile biodiversity poses an additional technical challenge. Advances in technology will be the key to reducing physical footprints, discharges, air emissions and marine sound. So the Arctic region cannot be approached, in terms of its exploration and development, without further advancing engineering solutions, and such advances cannot be done unless there is widespread industry co-operation. To summarise, some of these challenges are:
Geographic Location: the sheer remoteness and darkness of the Arctic creates challenges that directly impact human safety. These include communication problems due to lack of IT infrastructure and satellite coverage, emergency response and contingencies, supply and working conditions. Logistics are very challenging and equipment reliability (such as that of a drilling rig) is a major concern.
Deep Water: Deep water presents real challenges to flow assurance over long distances at low temperature, compression requirements, and power. As the use of gravity base structures becomes very expensive or non-feasible beyond depths of 150 meters, this means that in deeper waters (such as Shtokman, for example), the concepts that will be used will mainly involve long-distance subsea-to-shore tiebacks, or floating production systems. Floating systems need to be developed to either withstand all ice loads, remain permanently on station, or alternatively to be disconnectable so as to avoid the most severe ice or iceberg conditions. Up to date, the majority of arctic projects have been constructed in waters depths of up to 100 meters, such as the Hibernia oil field and the Sable Island gas fields offshore northern Canada. However, greater challenges for ice resistant designs are anticipated upon installation of offshore production facilities in 400 meter water depths, as in the case of Shtokman.
Large Fields: The remoteness of the arctic is not a barrier to developing large fields. Many of the challenges due to the remote location are similar to those that have been and are being encountered with the industry‘s ongoing expansion of its activities into the ultra-deepwater regions of the world. Such projects off West Africa, for example, on Girassol and Bonga where the production of 40-60 subsea wells to an FPSO has been co-ordinated, show this can be done. However, such coordination requires very complex control systems and operational scenarios. The inaccessibility of the offshore site requires that systems and components are designed for high reliability and low maintenance. Moreover, because such projects tend to be large multi-billion dollar integrated projects developing remote fields, it always produces technical and financial challenges that require going beyond existing solutions in terms of well sizes, production throughput, system complexity, export distance, and so on.
Ultra-Long Distance: Since nearby offshore host facilities do not yet exist in the Arctic, many new offshore facilities may well need to be tied back to new onshore infrastructure. Ultra-long distances demand the production of an efficient power transmission system to drive multiple compressors over such
59
long distances without significant losses, and thus require uncommon power cable design. Again, the Shtokman development located about 600 km from the shore line is an example of what is being faced by the industry right now.
Gas Transportation: unless Gas-to-Liquid or Floating Liquefied Natural Gas
solutions are employed on a project, gas and condensate will have to be transported over long distances and this will normally generate significant slugging problems as liquid accumulates in low sections of the pipeline. Gas/liquid separation and boosting stations can be place at strategic locations to limit the size of slug arriving at the receiving facility, after which the liquid is pumped through a separate gathering line to the shore. Such pumps place another demand on electric power. Moreover, electric power is also needed for boosting system of injected chemicals to be delivered at suitable injection pressure.
Construction & Installation: Since the arctic is a largely frontier area for oil and
gas development, construction and installation experience is still minimal. Construction is a major challenge because of the limited weather windows when ice conditions are favorable. Based on the location of a project, construction may be able to be carried out either in winter or summer. The probability of success, logistics, equipment, cost and schedule are usually evaluated before the selection of the construction season. In winter, the ice sheets are stable and almost stationary, and there is minimal ice movement. In summer, the open waterways allow the use of floating vessels for trenching and pipeline installation. More challenges come from the trenching equipment limitations to water depth and trench depth, as well as from storms and blizzards that cause delays and interruptions in transportation, which lead to cost overruns.
Leak Detection and Pipe Repair: this is a critical aspect. Leaks in pipelines
must be detected rapidly due to their environmental cost, and public opinion will not tolerate anything less than zero discharge targets. Thus the further development of advanced and sensitive sensor technology is necessary for the detection of leaks, especially where the sea is frozen over for most of the year. These sea ice conditions render the execution of pipeline repairs due to leaks more complicated, and the logistics for repair more challenging still.
The above list is daunting but not unachievable. The E&P industry has overcome equally tough challenges before, and will continue to do so. Much of this will be done through continual gradual advances in existing technologies, along with careful combination with new enabling technologies developed specifically to overcome the Arctic challenge. Much will rely upon the sharing of Arctic and sub-Arctic operational experience gained from projects in Alaska, Sakhalin and the North Caspian Sea, as well as from pioneering deepwater remote projects such as Norway‘s Ormen Lange development. This will also need to be converted into shared standards, as well as solutions, especially in the areas of safety and environmental protection (THOMAS, 2011). 4.2.3. Main Projects
a) Yamal
The Yamal Peninsula is a strategic oil and gas bearing region of Russia. Commercial
60
development of fields onshore and offshore Yamal is crucial for securing Russia's gas production. During the development of the Yamal Peninsula fields infrastructure and the creation of a new gas transportation system, the application of domestically developed advanced experience and a number of novel technologies and technological solutions is planned, of which the most significant ones are:
utilization of integrated production infrastructure for gas extraction from the Cenomanian-Aptian deposits;
application of heat-insulated pipes for wells construction and operation with a view to preventing the permafrost rocks thawing;
reduction in the number of monitoring wells through combined monitoring over development of various deposits in a well;
the first instance of applying high-resistant 1,420 mm pipes of K65 (X80) steel and with smooth interior coating designed for 11.8 MPa (120 Ata) of working pressure, as well as new welding technologies and materials;
application of brand new energy saving equipment with an efficiency coefficient equal to 36–40 per cent.
For over 30 years of operation in the Arctic, Gazprom Group has managed to gain valuable experience and to develop, in these harsh environmental conditions, gas production and transportation technologies that will be used for the Yamal field development, and that can be successfully applied for the implementation of various projects in countries with a subarctic climate, specifically, in Alaska and North America.
b) Shtokman
The Shtokman gas and condensate field development project has a strategic significance because its implementation will become a pivotal point to form a new gas producing region on the Russian Arctic shelf, besides becoming a resource base for building up Russian pipeline gas and liquefied natural gas (LNG) supplies to the domestic and foreign markets.
Figure 27: Location of Shtokman field
The scale and complexity of the operations, harsh climate in the areas where the gas is produced and transported, and the need to apply fundamentally new engineering and process solutions during the course of development all demonstrate the unique nature of the Shtokman project.
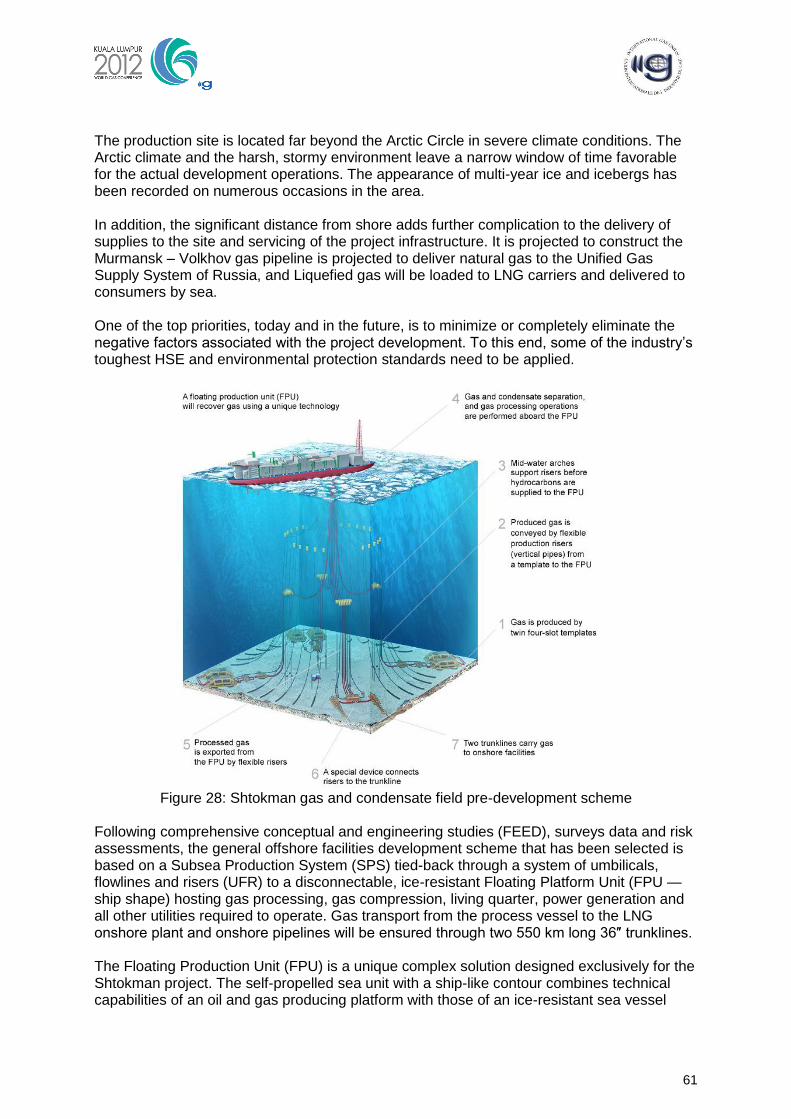
61
The production site is located far beyond the Arctic Circle in severe climate conditions. The Arctic climate and the harsh, stormy environment leave a narrow window of time favorable for the actual development operations. The appearance of multi-year ice and icebergs has been recorded on numerous occasions in the area. In addition, the significant distance from shore adds further complication to the delivery of supplies to the site and servicing of the project infrastructure. It is projected to construct the Murmansk – Volkhov gas pipeline is projected to deliver natural gas to the Unified Gas Supply System of Russia, and Liquefied gas will be loaded to LNG carriers and delivered to consumers by sea. One of the top priorities, today and in the future, is to minimize or completely eliminate the negative factors associated with the project development. To this end, some of the industry‘s toughest HSE and environmental protection standards need to be applied.
Figure 28: Shtokman gas and condensate field pre-development scheme
Following comprehensive conceptual and engineering studies (FEED), surveys data and risk assessments, the general offshore facilities development scheme that has been selected is based on a Subsea Production System (SPS) tied-back through a system of umbilicals, flowlines and risers (UFR) to a disconnectable, ice-resistant Floating Platform Unit (FPU — ship shape) hosting gas processing, gas compression, living quarter, power generation and all other utilities required to operate. Gas transport from the process vessel to the LNG onshore plant and onshore pipelines will be ensured through two 550 km long 36″ trunklines. The Floating Production Unit (FPU) is a unique complex solution designed exclusively for the Shtokman project. The self-propelled sea unit with a ship-like contour combines technical capabilities of an oil and gas producing platform with those of an ice-resistant sea vessel
62
The FPU Hull is about 300 meter long. Designers have always tried to optimize the size of the platform to the minimum. Such significant dimensions of this ship are mainly driven by the need for large autonomy due to remote location and harsh environment (3 weeks autonomy with redundancy in design for inspection and repair) and size of the topsides. Is has been designed as ice resistant production unit able to withstand most of the ice and iceberg actions but able to disconnect in case of extreme ice conditions. It is moored on a ―single point‖ - that is what Turret is responsible for. The FPU is vaning around its mooring to minimize the environmental load. Before it disconnects, the production is stopped, the risers are isolated and disconnected. The Mooring Riser Buoy is then disconnected, floating at 120m below sea level. The dis-connection operation can be performed in 3 minutes. In order to manage the technological risk of the Project, the main driver is to use the best available proven technology rather than to go for fully innovative systems. However, due to particularity of Shtokman project, innovations are often used. For example, some components of the Turret structure were designed with innovative technologies. The Turret‘s weight is about 15 000 t. The project ensures high operability of the FPU even in severe ice conditions and has reduced to the minimum the amount of disconnection due to sea ice and iceberg threats (i.e. estimated about 1 to 3 disconnections over 50 years). This is achieved by using enhanced capability of the Hull, Mooring and Disconnection Systems as well as by implementing ice management. Ice management consists of surveillance and physical management activities using dedicated vessels. In case of extreme waves or very low temperature the production rate may reduce but will not stop. Operator will use the thrusters to keep the FPU to the most favorable heading to the environment.
4.3. Advances in Unconventional Gas Technologies
4.3.1. Introduction Over the past decade, there has been a huge shift towards the production of natural gas from unconventional reservoirs. These reservoirs are commonly defined as having low-permeability and requiring hydraulic fracture stimulation to produce gas at economic rates. Unconventional reservoirs include coalseam gas (CSG), sandstones and carbonates (tight gas), and shale gas. In CSG reservoirs, gas is adsorbed to the organic matter and water contained in the closely-spaced natural fractures must be produced to lower the pressure and liberate the gas. Commercial CSG reservoirs have permeabilities of at least a few millidarcies. Tight gas reservoirs contain free gas in the pore space of the rock and can exist as either conventionally-trapped or basin-centered accumulations. Commercial tight gas reservoirs have average permeabilities in the microdarcy range. Commercial shale gas reservoirs contain both free and adsorbed gas, produce little or no formation water, and have average permeabilities in the nanodarcy range. The shift to unconventional gas has been accompanied by rapid technological advances in a number of areas. The most important of these are horizontal drilling and hydraulic fracture
63
stimulation which are keys for creating drainage flow paths in these tight reservoirs. This represents a dramatic change from ten years ago when 3-D seismic was ranked as the most leveraging technology by operators given its value in identifying gas-charged conventional traps. New technologies will play a vital role in appraising and developing future unconventional reservoirs. These improvements and innovations will be especially critical for commercializing opportunities outside of North America. Investment incentives, partnerships between government-industry-academia, reasonable regulatory policies, and technology transfer protocols will all be needed to identify, grow, and implement these new leveraging technologies.
4.3.2. Reservoir Characterization Technologies Reservoir characterization technologies are critical for (i) recognizing ―sweet-spots‖ containing large quantities of moveable gas; (ii) quantifying the volume of gas that is present and how it is stored and; (iii) identifying pathways such as open natural fractures through which the gas can be produced. Three such technologies are described below. Depositional models and paleogeographic reconstructions are critical to identifying those areas mostly likely to contain thick unconventional accumulations. For CSG, geologists look for long-lived peat swamps of regional extent in coastal plain settings, such as those responsible for the Fruitland Coal in the San Juan Basin. For tight gas sands, fairways with high sand accumulation rates may result in 1000 meters or more of gas charged sandstones in places like the Piceance Basin. The ability to accurately reconstruct the depositional history depends on the careful integration of regional tectonics, core description, mineralogy, biostratigraphy, thermal maturity data, and basin history modeling to identify those areas most likely to contain thick accumulations of reservoir-quality rock. A good example is the work done to reconstruct the depositional setting of the Haynesville Shale as shown in Figure 29 (MARTIN; EWING, 2009). This shale was deposited in a marine embayment protected from clastic input (which would reduce the organic richness). A paleocurrent providing nutrient-rich waters fueled the growth of algal blooms which provided the organic material. Reconstructions like these are currently being performed all over the world to identify unconventional drilling targets.
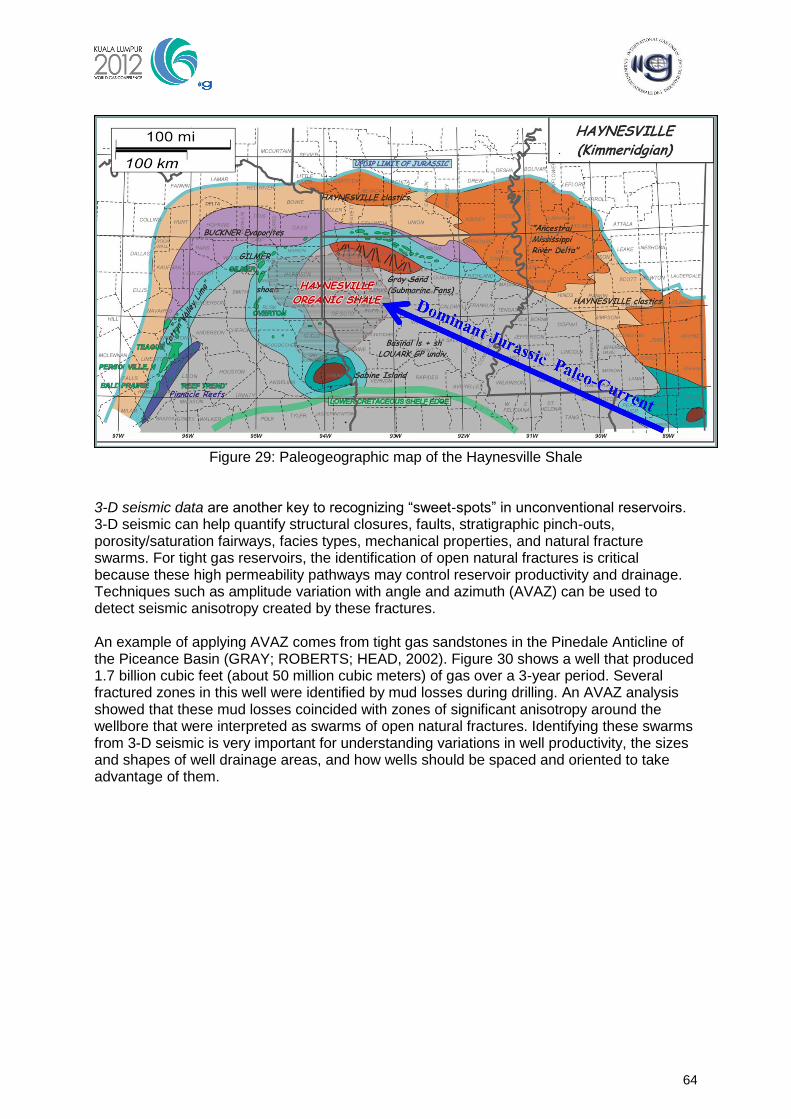
64
Figure 29: Paleogeographic map of the Haynesville Shale
3-D seismic data are another key to recognizing ―sweet-spots‖ in unconventional reservoirs. 3-D seismic can help quantify structural closures, faults, stratigraphic pinch-outs, porosity/saturation fairways, facies types, mechanical properties, and natural fracture swarms. For tight gas reservoirs, the identification of open natural fractures is critical because these high permeability pathways may control reservoir productivity and drainage. Techniques such as amplitude variation with angle and azimuth (AVAZ) can be used to detect seismic anisotropy created by these fractures. An example of applying AVAZ comes from tight gas sandstones in the Pinedale Anticline of the Piceance Basin (GRAY; ROBERTS; HEAD, 2002). Figure 30 shows a well that produced 1.7 billion cubic feet (about 50 million cubic meters) of gas over a 3-year period. Several fractured zones in this well were identified by mud losses during drilling. An AVAZ analysis showed that these mud losses coincided with zones of significant anisotropy around the wellbore that were interpreted as swarms of open natural fractures. Identifying these swarms from 3-D seismic is very important for understanding variations in well productivity, the sizes and shapes of well drainage areas, and how wells should be spaced and oriented to take advantage of them.
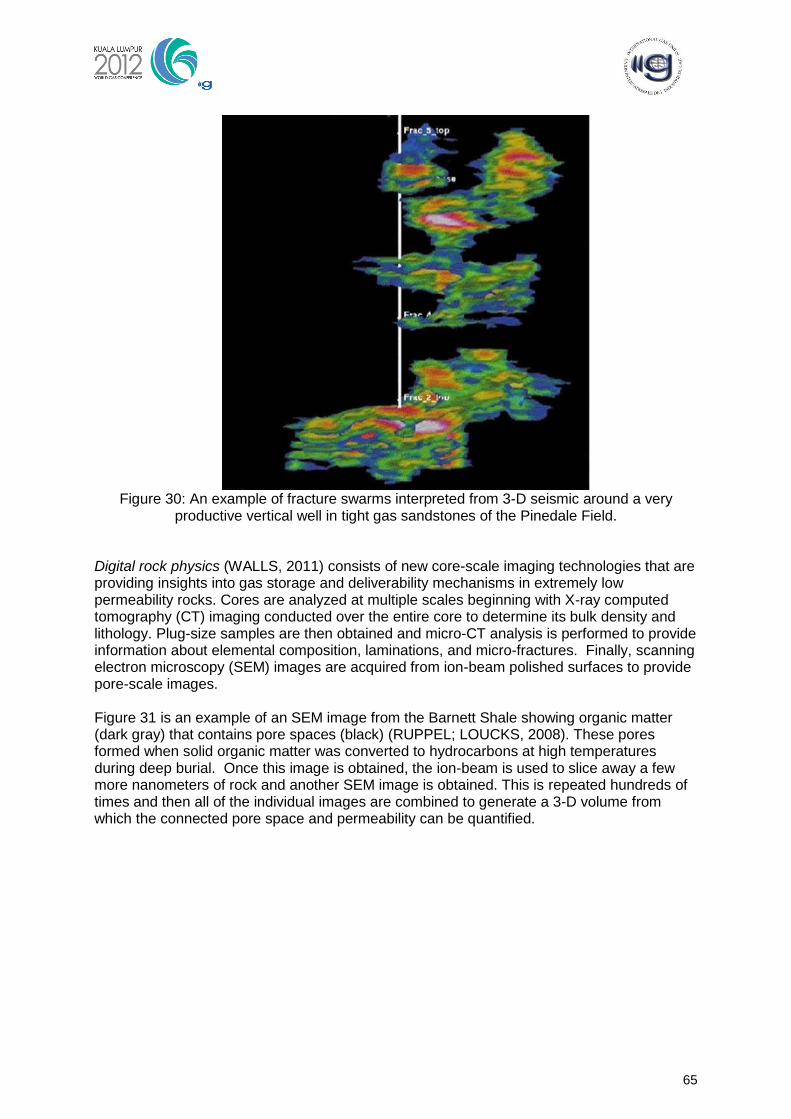
65
Figure 30: An example of fracture swarms interpreted from 3-D seismic around a very
productive vertical well in tight gas sandstones of the Pinedale Field. Digital rock physics (WALLS, 2011) consists of new core-scale imaging technologies that are providing insights into gas storage and deliverability mechanisms in extremely low permeability rocks. Cores are analyzed at multiple scales beginning with X-ray computed tomography (CT) imaging conducted over the entire core to determine its bulk density and lithology. Plug-size samples are then obtained and micro-CT analysis is performed to provide information about elemental composition, laminations, and micro-fractures. Finally, scanning electron microscopy (SEM) images are acquired from ion-beam polished surfaces to provide pore-scale images. Figure 31 is an example of an SEM image from the Barnett Shale showing organic matter (dark gray) that contains pore spaces (black) (RUPPEL; LOUCKS, 2008). These pores formed when solid organic matter was converted to hydrocarbons at high temperatures during deep burial. Once this image is obtained, the ion-beam is used to slice away a few more nanometers of rock and another SEM image is obtained. This is repeated hundreds of times and then all of the individual images are combined to generate a 3-D volume from which the connected pore space and permeability can be quantified.
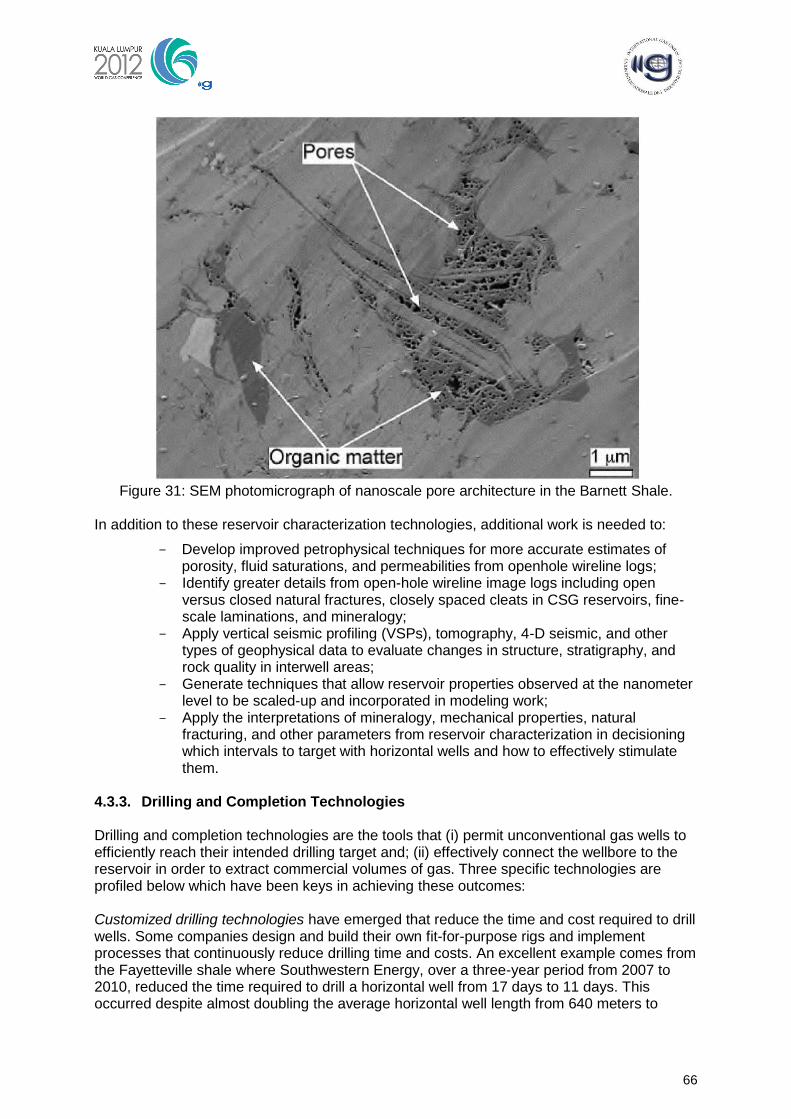
66
Figure 31: SEM photomicrograph of nanoscale pore architecture in the Barnett Shale.
In addition to these reservoir characterization technologies, additional work is needed to:
Develop improved petrophysical techniques for more accurate estimates of porosity, fluid saturations, and permeabilities from openhole wireline logs;
Identify greater details from open-hole wireline image logs including open versus closed natural fractures, closely spaced cleats in CSG reservoirs, fine-scale laminations, and mineralogy;
Apply vertical seismic profiling (VSPs), tomography, 4-D seismic, and other types of geophysical data to evaluate changes in structure, stratigraphy, and rock quality in interwell areas;
Generate techniques that allow reservoir properties observed at the nanometer level to be scaled-up and incorporated in modeling work;
Apply the interpretations of mineralogy, mechanical properties, natural fracturing, and other parameters from reservoir characterization in decisioning which intervals to target with horizontal wells and how to effectively stimulate them.
4.3.3. Drilling and Completion Technologies Drilling and completion technologies are the tools that (i) permit unconventional gas wells to efficiently reach their intended drilling target and; (ii) effectively connect the wellbore to the reservoir in order to extract commercial volumes of gas. Three specific technologies are profiled below which have been keys in achieving these outcomes: Customized drilling technologies have emerged that reduce the time and cost required to drill wells. Some companies design and build their own fit-for-purpose rigs and implement processes that continuously reduce drilling time and costs. An excellent example comes from the Fayetteville shale where Southwestern Energy, over a three-year period from 2007 to 2010, reduced the time required to drill a horizontal well from 17 days to 11 days. This occurred despite almost doubling the average horizontal well length from 640 meters to
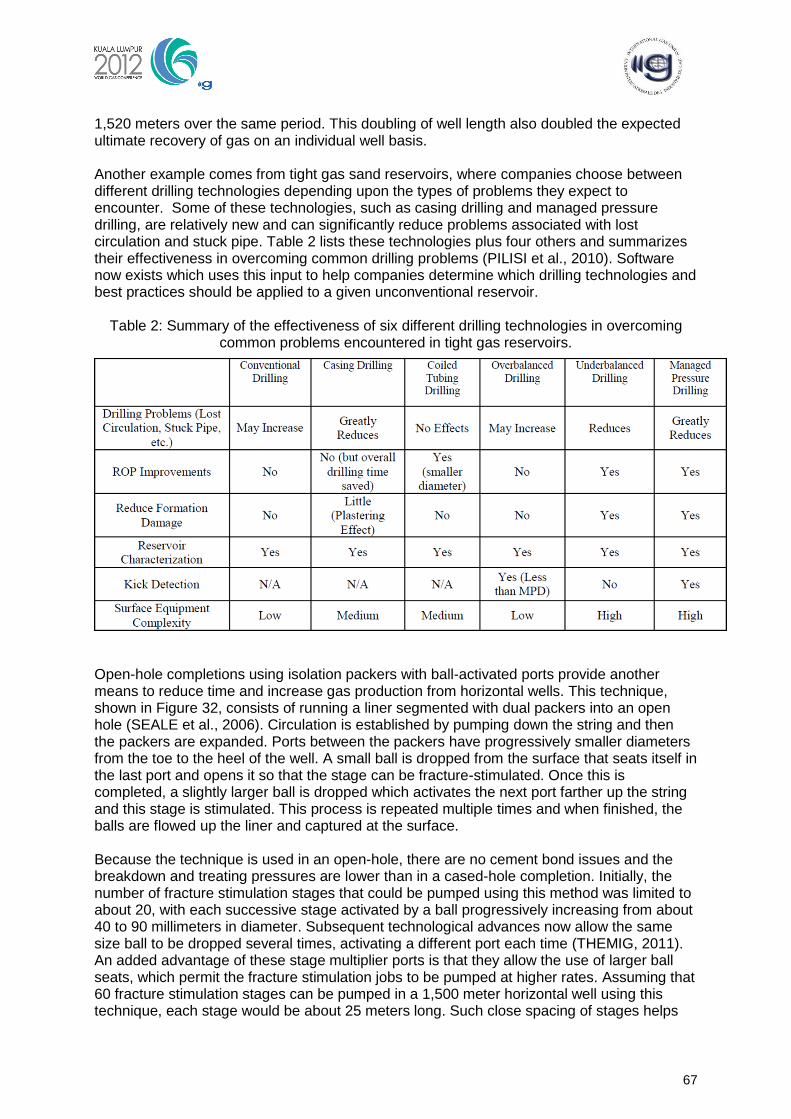
67
1,520 meters over the same period. This doubling of well length also doubled the expected ultimate recovery of gas on an individual well basis. Another example comes from tight gas sand reservoirs, where companies choose between different drilling technologies depending upon the types of problems they expect to encounter. Some of these technologies, such as casing drilling and managed pressure drilling, are relatively new and can significantly reduce problems associated with lost circulation and stuck pipe. Table 2 lists these technologies plus four others and summarizes their effectiveness in overcoming common drilling problems (PILISI et al., 2010). Software now exists which uses this input to help companies determine which drilling technologies and best practices should be applied to a given unconventional reservoir.
Table 2: Summary of the effectiveness of six different drilling technologies in overcoming
common problems encountered in tight gas reservoirs.
Open-hole completions using isolation packers with ball-activated ports provide another means to reduce time and increase gas production from horizontal wells. This technique, shown in Figure 32, consists of running a liner segmented with dual packers into an open hole (SEALE et al., 2006). Circulation is established by pumping down the string and then the packers are expanded. Ports between the packers have progressively smaller diameters from the toe to the heel of the well. A small ball is dropped from the surface that seats itself in the last port and opens it so that the stage can be fracture-stimulated. Once this is completed, a slightly larger ball is dropped which activates the next port farther up the string and this stage is stimulated. This process is repeated multiple times and when finished, the balls are flowed up the liner and captured at the surface. Because the technique is used in an open-hole, there are no cement bond issues and the breakdown and treating pressures are lower than in a cased-hole completion. Initially, the number of fracture stimulation stages that could be pumped using this method was limited to about 20, with each successive stage activated by a ball progressively increasing from about 40 to 90 millimeters in diameter. Subsequent technological advances now allow the same size ball to be dropped several times, activating a different port each time (THEMIG, 2011). An added advantage of these stage multiplier ports is that they allow the use of larger ball seats, which permit the fracture stimulation jobs to be pumped at higher rates. Assuming that 60 fracture stimulation stages can be pumped in a 1,500 meter horizontal well using this technique, each stage would be about 25 meters long. Such close spacing of stages helps
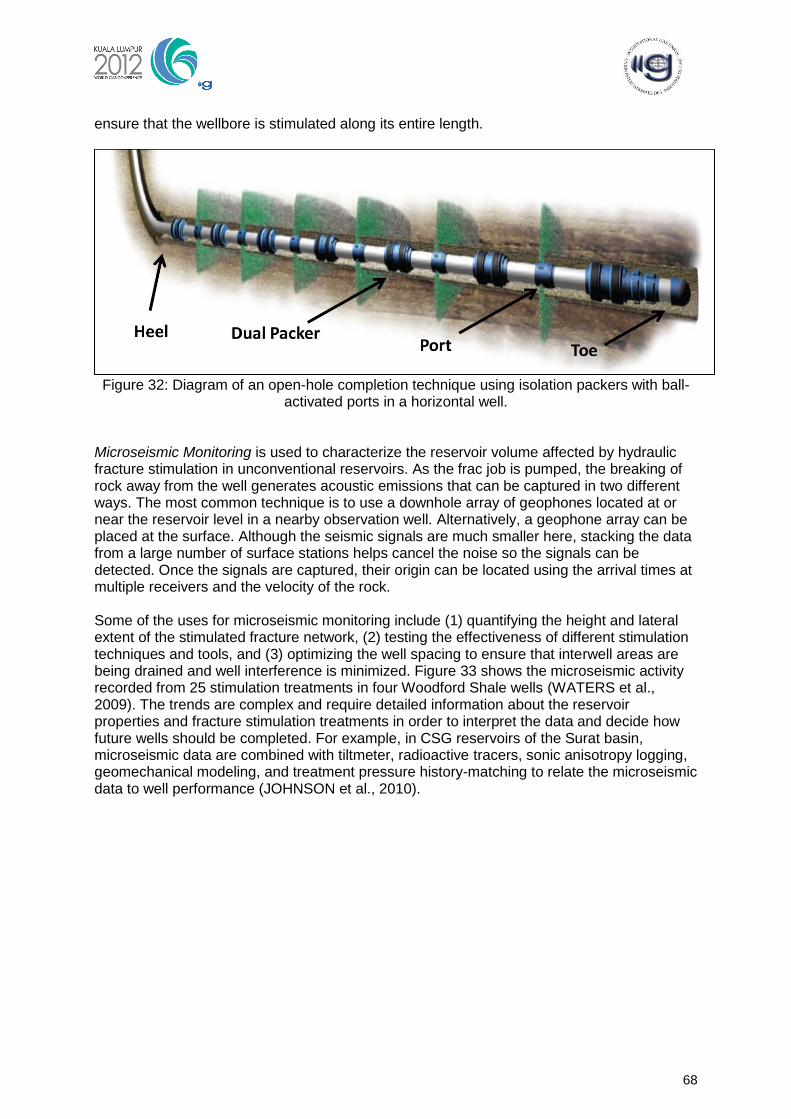
68
ensure that the wellbore is stimulated along its entire length.
Figure 32: Diagram of an open-hole completion technique using isolation packers with ball-
activated ports in a horizontal well.
Microseismic Monitoring is used to characterize the reservoir volume affected by hydraulic fracture stimulation in unconventional reservoirs. As the frac job is pumped, the breaking of rock away from the well generates acoustic emissions that can be captured in two different ways. The most common technique is to use a downhole array of geophones located at or near the reservoir level in a nearby observation well. Alternatively, a geophone array can be placed at the surface. Although the seismic signals are much smaller here, stacking the data from a large number of surface stations helps cancel the noise so the signals can be detected. Once the signals are captured, their origin can be located using the arrival times at multiple receivers and the velocity of the rock. Some of the uses for microseismic monitoring include (1) quantifying the height and lateral extent of the stimulated fracture network, (2) testing the effectiveness of different stimulation techniques and tools, and (3) optimizing the well spacing to ensure that interwell areas are being drained and well interference is minimized. Figure 33 shows the microseismic activity recorded from 25 stimulation treatments in four Woodford Shale wells (WATERS et al., 2009). The trends are complex and require detailed information about the reservoir properties and fracture stimulation treatments in order to interpret the data and decide how future wells should be completed. For example, in CSG reservoirs of the Surat basin, microseismic data are combined with tiltmeter, radioactive tracers, sonic anisotropy logging, geomechanical modeling, and treatment pressure history-matching to relate the microseismic data to well performance (JOHNSON et al., 2010).
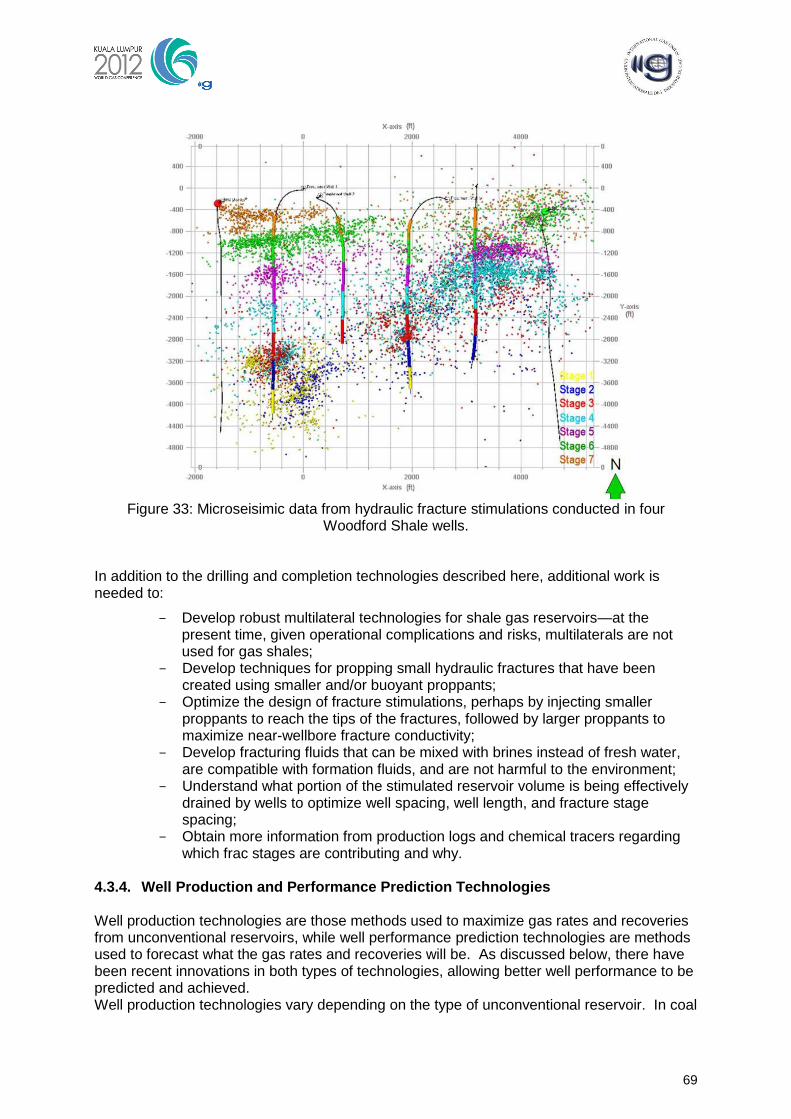
69
Figure 33: Microseisimic data from hydraulic fracture stimulations conducted in four
Woodford Shale wells.
In addition to the drilling and completion technologies described here, additional work is needed to:
Develop robust multilateral technologies for shale gas reservoirs—at the present time, given operational complications and risks, multilaterals are not used for gas shales;
Develop techniques for propping small hydraulic fractures that have been created using smaller and/or buoyant proppants;
Optimize the design of fracture stimulations, perhaps by injecting smaller proppants to reach the tips of the fractures, followed by larger proppants to maximize near-wellbore fracture conductivity;
Develop fracturing fluids that can be mixed with brines instead of fresh water, are compatible with formation fluids, and are not harmful to the environment;
Understand what portion of the stimulated reservoir volume is being effectively drained by wells to optimize well spacing, well length, and fracture stage spacing;
Obtain more information from production logs and chemical tracers regarding which frac stages are contributing and why.
4.3.4. Well Production and Performance Prediction Technologies Well production technologies are those methods used to maximize gas rates and recoveries from unconventional reservoirs, while well performance prediction technologies are methods used to forecast what the gas rates and recoveries will be. As discussed below, there have been recent innovations in both types of technologies, allowing better well performance to be predicted and achieved. Well production technologies vary depending on the type of unconventional reservoir. In coal
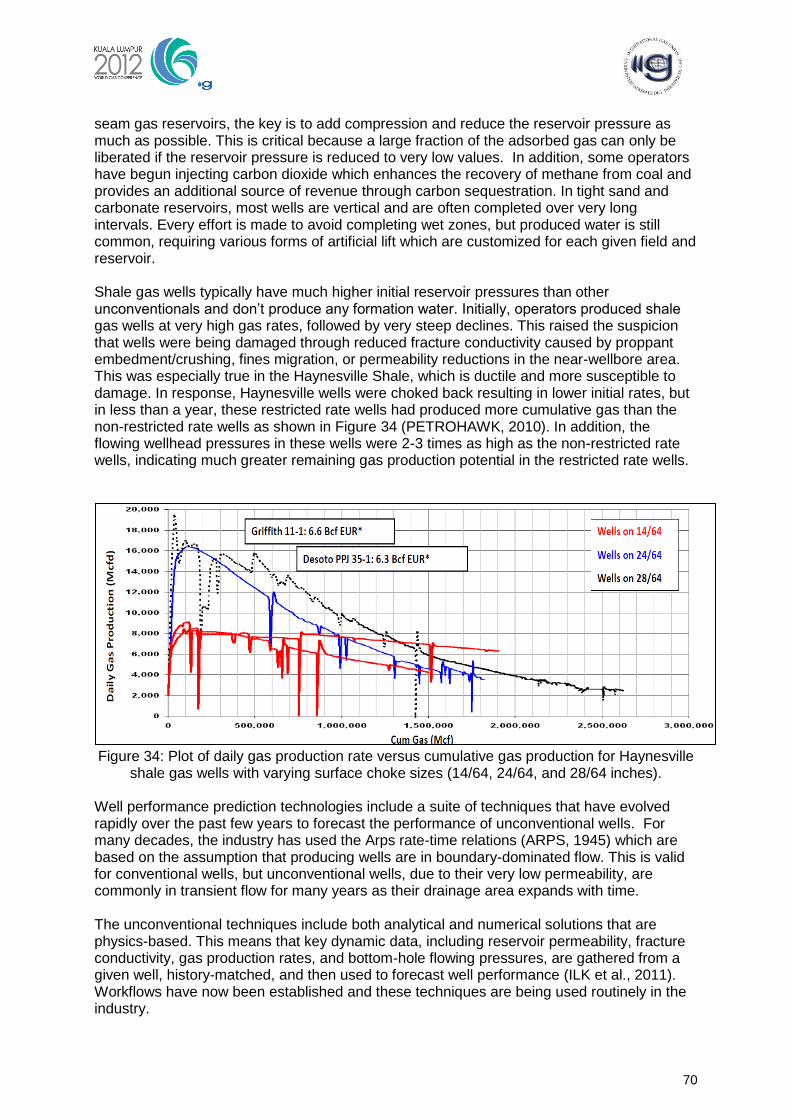
70
seam gas reservoirs, the key is to add compression and reduce the reservoir pressure as much as possible. This is critical because a large fraction of the adsorbed gas can only be liberated if the reservoir pressure is reduced to very low values. In addition, some operators have begun injecting carbon dioxide which enhances the recovery of methane from coal and provides an additional source of revenue through carbon sequestration. In tight sand and carbonate reservoirs, most wells are vertical and are often completed over very long intervals. Every effort is made to avoid completing wet zones, but produced water is still common, requiring various forms of artificial lift which are customized for each given field and reservoir. Shale gas wells typically have much higher initial reservoir pressures than other unconventionals and don‘t produce any formation water. Initially, operators produced shale gas wells at very high gas rates, followed by very steep declines. This raised the suspicion that wells were being damaged through reduced fracture conductivity caused by proppant embedment/crushing, fines migration, or permeability reductions in the near-wellbore area. This was especially true in the Haynesville Shale, which is ductile and more susceptible to damage. In response, Haynesville wells were choked back resulting in lower initial rates, but in less than a year, these restricted rate wells had produced more cumulative gas than the non-restricted rate wells as shown in Figure 34 (PETROHAWK, 2010). In addition, the flowing wellhead pressures in these wells were 2-3 times as high as the non-restricted rate wells, indicating much greater remaining gas production potential in the restricted rate wells.
Figure 34: Plot of daily gas production rate versus cumulative gas production for Haynesville
shale gas wells with varying surface choke sizes (14/64, 24/64, and 28/64 inches).
Well performance prediction technologies include a suite of techniques that have evolved rapidly over the past few years to forecast the performance of unconventional wells. For many decades, the industry has used the Arps rate-time relations (ARPS, 1945) which are based on the assumption that producing wells are in boundary-dominated flow. This is valid for conventional wells, but unconventional wells, due to their very low permeability, are commonly in transient flow for many years as their drainage area expands with time. The unconventional techniques include both analytical and numerical solutions that are physics-based. This means that key dynamic data, including reservoir permeability, fracture conductivity, gas production rates, and bottom-hole flowing pressures, are gathered from a given well, history-matched, and then used to forecast well performance (ILK et al., 2011). Workflows have now been established and these techniques are being used routinely in the industry.
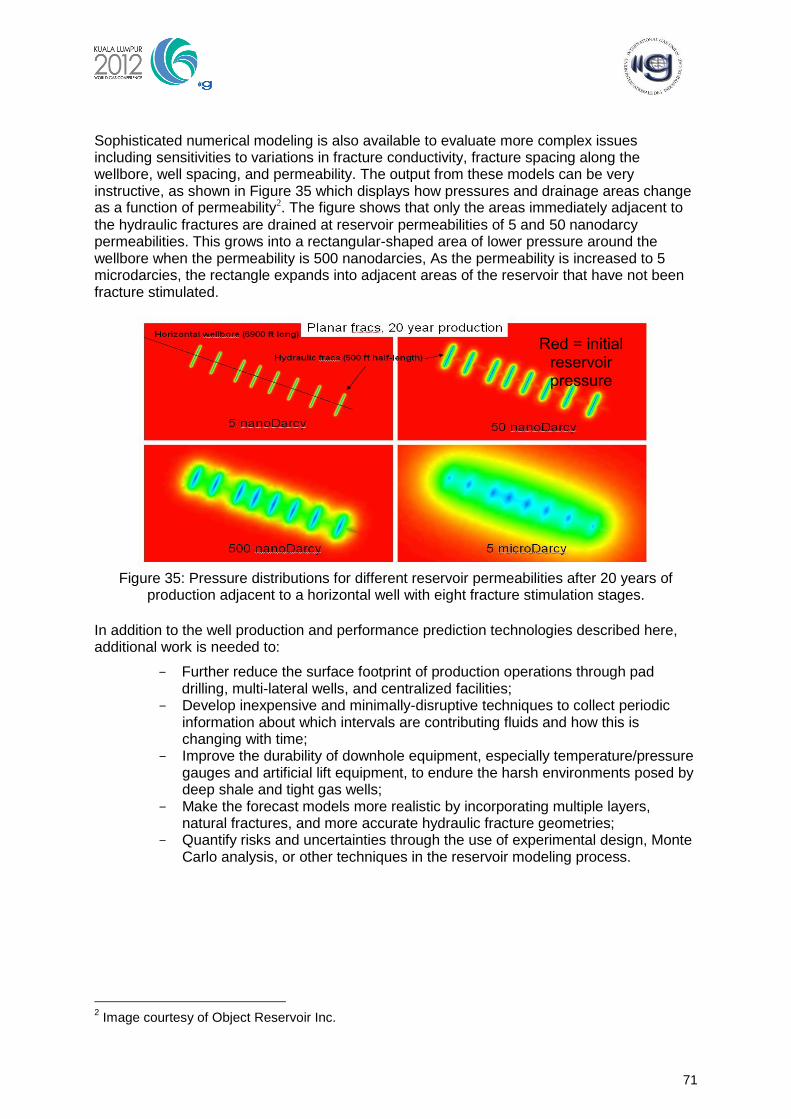
71
Sophisticated numerical modeling is also available to evaluate more complex issues including sensitivities to variations in fracture conductivity, fracture spacing along the wellbore, well spacing, and permeability. The output from these models can be very instructive, as shown in Figure 35 which displays how pressures and drainage areas change as a function of permeability2. The figure shows that only the areas immediately adjacent to
the hydraulic fractures are drained at reservoir permeabilities of 5 and 50 nanodarcy permeabilities. This grows into a rectangular-shaped area of lower pressure around the wellbore when the permeability is 500 nanodarcies, As the permeability is increased to 5 microdarcies, the rectangle expands into adjacent areas of the reservoir that have not been fracture stimulated.
Figure 35: Pressure distributions for different reservoir permeabilities after 20 years of
production adjacent to a horizontal well with eight fracture stimulation stages.
In addition to the well production and performance prediction technologies described here, additional work is needed to:
Further reduce the surface footprint of production operations through pad drilling, multi-lateral wells, and centralized facilities;
Develop inexpensive and minimally-disruptive techniques to collect periodic information about which intervals are contributing fluids and how this is changing with time;
Improve the durability of downhole equipment, especially temperature/pressure gauges and artificial lift equipment, to endure the harsh environments posed by deep shale and tight gas wells;
Make the forecast models more realistic by incorporating multiple layers, natural fractures, and more accurate hydraulic fracture geometries;
Quantify risks and uncertainties through the use of experimental design, Monte Carlo analysis, or other techniques in the reservoir modeling process.
2 Image courtesy of Object Reservoir Inc.
Red = initial reservoir pressure
72
4.4. Tight Gas in China
4.4.1 Introduction China has a wide area for exploration of tight gas reservoirs. There are more than 10 basins such as Odors basin, Sichuan basin, Songliao basin, Bohai bay basin, Qaidam Basin, Tarim Basin, Junggar Basin and so on, which possess favorable geological conditions to form tight gas reservoirs. It is estimated that the prospective gas resource is more than 12tcm in China and above 20% of the natural gas resources (KANG; LUO, 2007).
The tight sand rock gas resources in Sichuan basin are abundant, which proves a high potential for development. According to the latest resources‘ evaluation data, the natural gas resources are 1.8-2.5tcm in Chuanxi depression in Jurassic and upper Triassic. The current proved reserves are 594bcm by the end of 2010, which is merely 24% of the resources (TANG, 2007). Many gas fields were found such as Zhongba, Pingluoba, Jiulongshan, Hexingchang, Xinchang, Luodai, Xindu, Qiongxi, Mapeng gas field and so on. But there are still a lot of resources which need to be found. Tight gas can be produced commercially in the Xujiahe formation of Suinan, Nanchong, Bajiaochang gas field in Central Sichuan Basin. The tight gas resources are more abundant in the North of Ordos basin, in which gas fields such as Sulige, Yulin, Changbei, Daniudi were found. The Sulige gas field is the largest gas field found in China and has tremendous development potential (MA, 2005). It is located in the north central area of the Ordos basin, with a potential area of 40,000 square kilometers and cumulative proven gas in place of 1.1tcm by the end of 2010. So far, it is China‘s largest onshore gas field, characterized by low permeability, low pressure and low abundance. On August 26, 2000, a commercial open gas flow was obtained from well Su-6 with a daily output of 1.202 million cubic meters, marking the discovery of the Sulige Gas Field. Proven recoverable reserves of 163.278 billion cubic meters in the central part of the field were reported for the first time in 2001. In 2002, a pilot development area was built. In November 2006, a development program was prepared for the central part of the Sulige Gas Field to reach an annual production capacity of 5 billion cubic meters. In December 2006, the first gas processing plant was put into operation with a processing capacity of 3 billion m3/a. On October 2007, daily output of Sulige Gas Field exceeded 10 million cubic meters, which means that it has a production capacity of 4 billion m3/a. In June 2008, the second gas processing plant was put into operation with a processing capacity of 5 billion m3/a. In July 2009, the third gas processing plant was put into operation with a processing capacity of 5 billion m3/a. With progress in exploration, the gas reserves Sulige Gas Field are increasing. The estimates are that Sulige will have proven gas reserves of 2.5tcm and a development scale up to 23bcm.
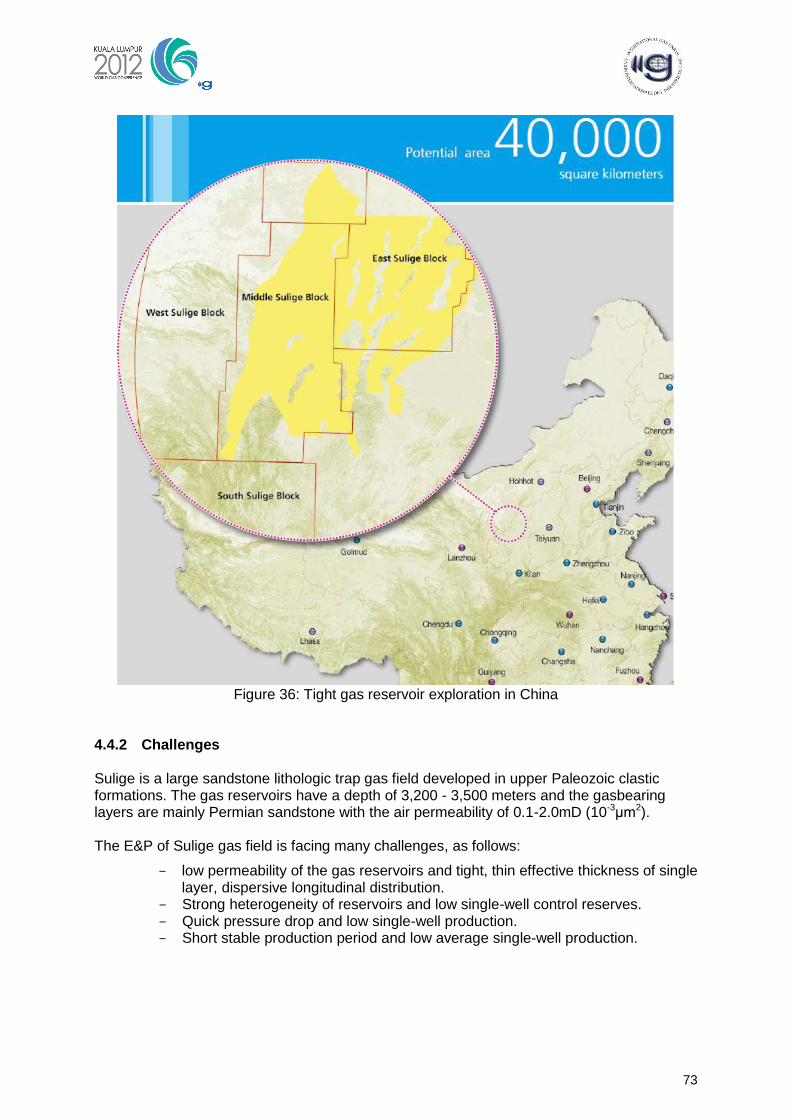
73
Figure 36: Tight gas reservoir exploration in China
4.4.2 Challenges Sulige is a large sandstone lithologic trap gas field developed in upper Paleozoic clastic formations. The gas reservoirs have a depth of 3,200 - 3,500 meters and the gasbearing layers are mainly Permian sandstone with the air permeability of 0.1-2.0mD (10-3μm2). The E&P of Sulige gas field is facing many challenges, as follows:
low permeability of the gas reservoirs and tight, thin effective thickness of single layer, dispersive longitudinal distribution.
Strong heterogeneity of reservoirs and low single-well control reserves. Quick pressure drop and low single-well production. Short stable production period and low average single-well production.
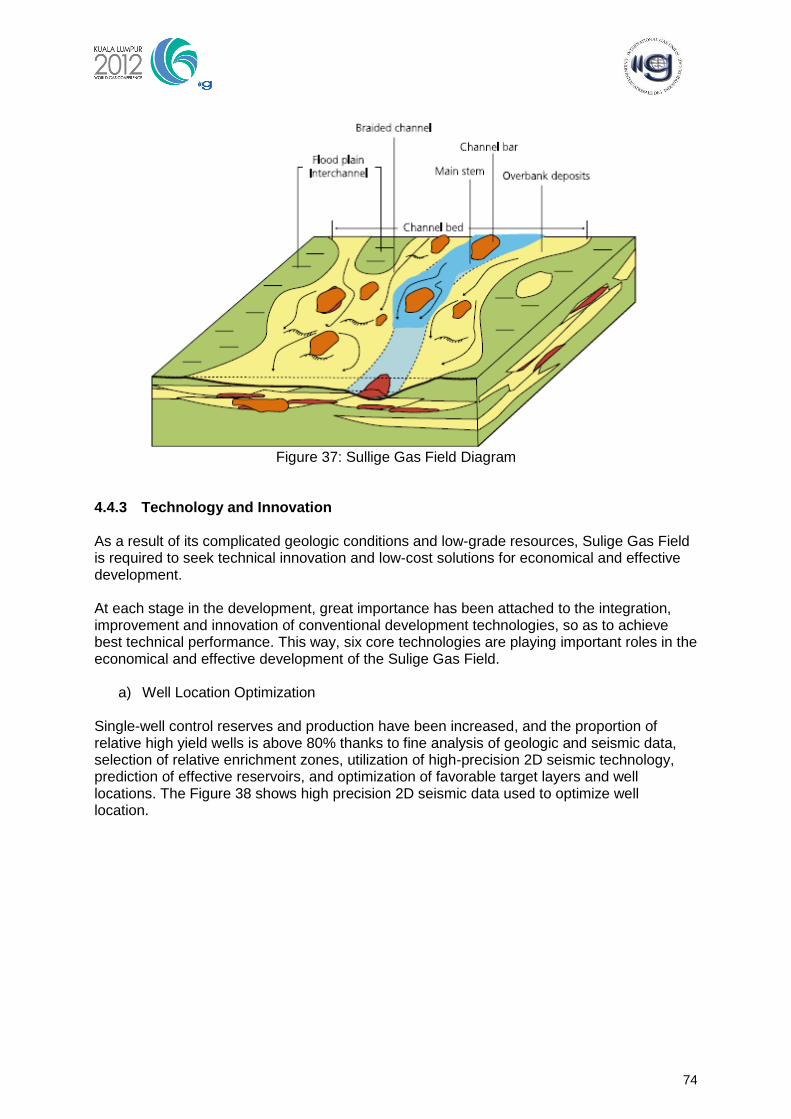
74
Figure 37: Sullige Gas Field Diagram
4.4.3 Technology and Innovation As a result of its complicated geologic conditions and low-grade resources, Sulige Gas Field is required to seek technical innovation and low-cost solutions for economical and effective development. At each stage in the development, great importance has been attached to the integration, improvement and innovation of conventional development technologies, so as to achieve best technical performance. This way, six core technologies are playing important roles in the economical and effective development of the Sulige Gas Field.
a) Well Location Optimization
Single-well control reserves and production have been increased, and the proportion of relative high yield wells is above 80% thanks to fine analysis of geologic and seismic data, selection of relative enrichment zones, utilization of high-precision 2D seismic technology, prediction of effective reservoirs, and optimization of favorable target layers and well locations. The Figure 38 shows high precision 2D seismic data used to optimize well location.
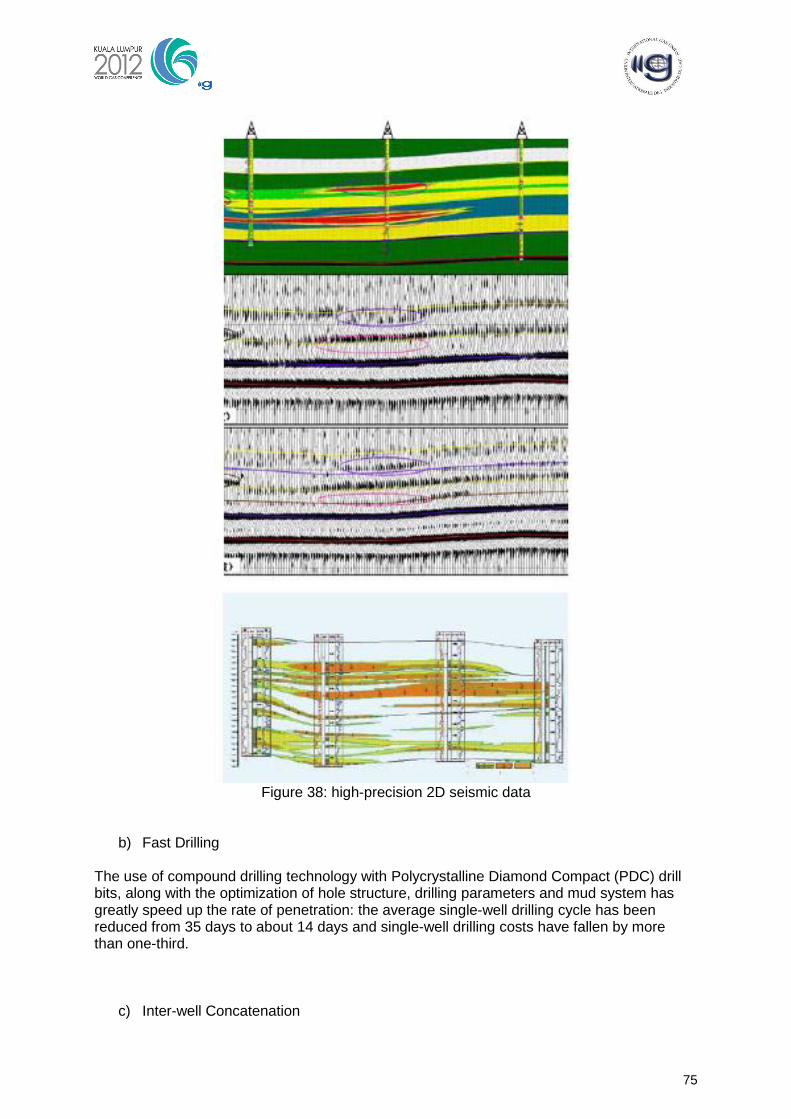
75
Figure 38: high-precision 2D seismic data
b) Fast Drilling The use of compound drilling technology with Polycrystalline Diamond Compact (PDC) drill bits, along with the optimization of hole structure, drilling parameters and mud system has greatly speed up the rate of penetration: the average single-well drilling cycle has been reduced from 35 days to about 14 days and single-well drilling costs have fallen by more than one-third.
c) Inter-well Concatenation
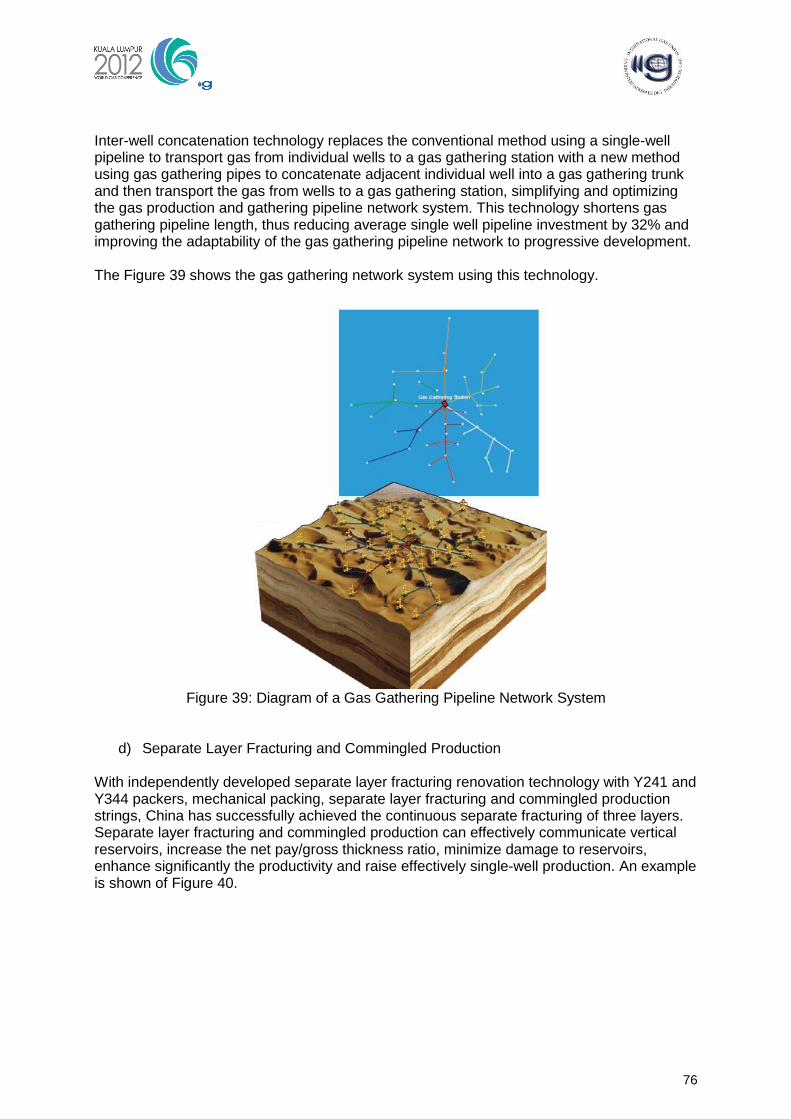
76
Inter-well concatenation technology replaces the conventional method using a single-well pipeline to transport gas from individual wells to a gas gathering station with a new method using gas gathering pipes to concatenate adjacent individual well into a gas gathering trunk and then transport the gas from wells to a gas gathering station, simplifying and optimizing the gas production and gathering pipeline network system. This technology shortens gas gathering pipeline length, thus reducing average single well pipeline investment by 32% and improving the adaptability of the gas gathering pipeline network to progressive development. The Figure 39 shows the gas gathering network system using this technology.
Figure 39: Diagram of a Gas Gathering Pipeline Network System
d) Separate Layer Fracturing and Commingled Production With independently developed separate layer fracturing renovation technology with Y241 and Y344 packers, mechanical packing, separate layer fracturing and commingled production strings, China has successfully achieved the continuous separate fracturing of three layers. Separate layer fracturing and commingled production can effectively communicate vertical reservoirs, increase the net pay/gross thickness ratio, minimize damage to reservoirs, enhance significantly the productivity and raise effectively single-well production. An example is shown of Figure 40.
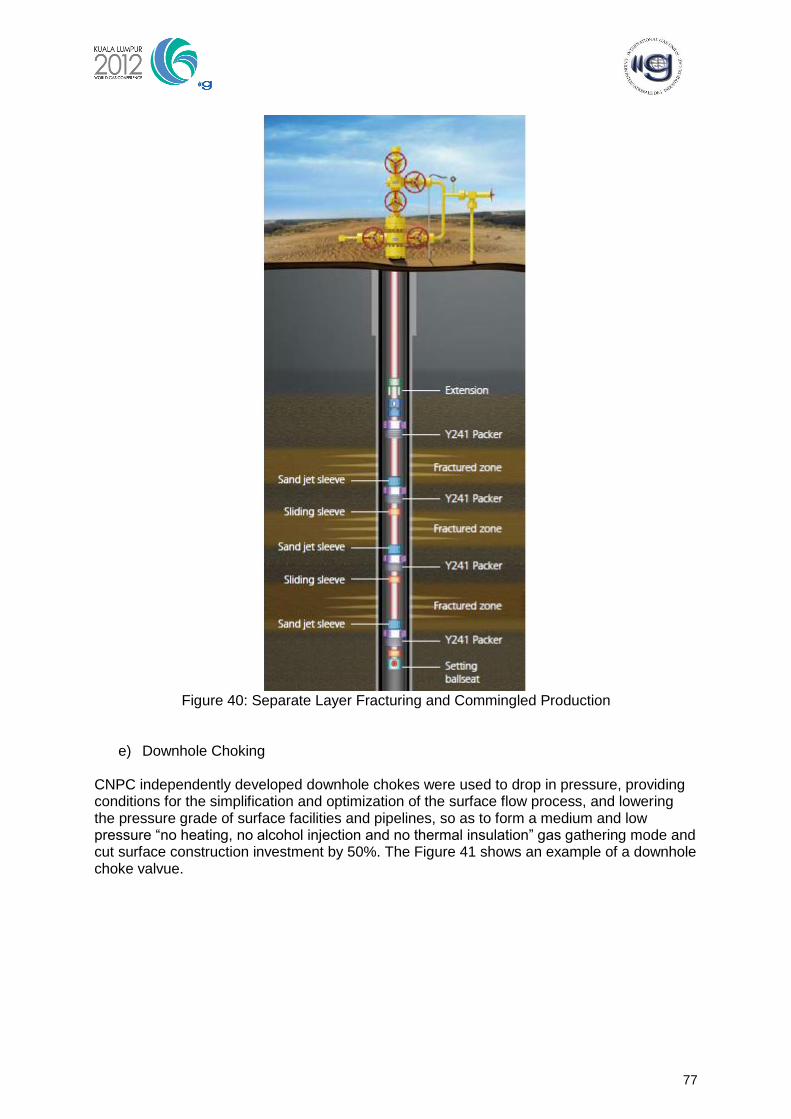
77
Figure 40: Separate Layer Fracturing and Commingled Production
e) Downhole Choking CNPC independently developed downhole chokes were used to drop in pressure, providing conditions for the simplification and optimization of the surface flow process, and lowering the pressure grade of surface facilities and pipelines, so as to form a medium and low pressure ―no heating, no alcohol injection and no thermal insulation‖ gas gathering mode and cut surface construction investment by 50%. The Figure 41 shows an example of a downhole choke valvue.
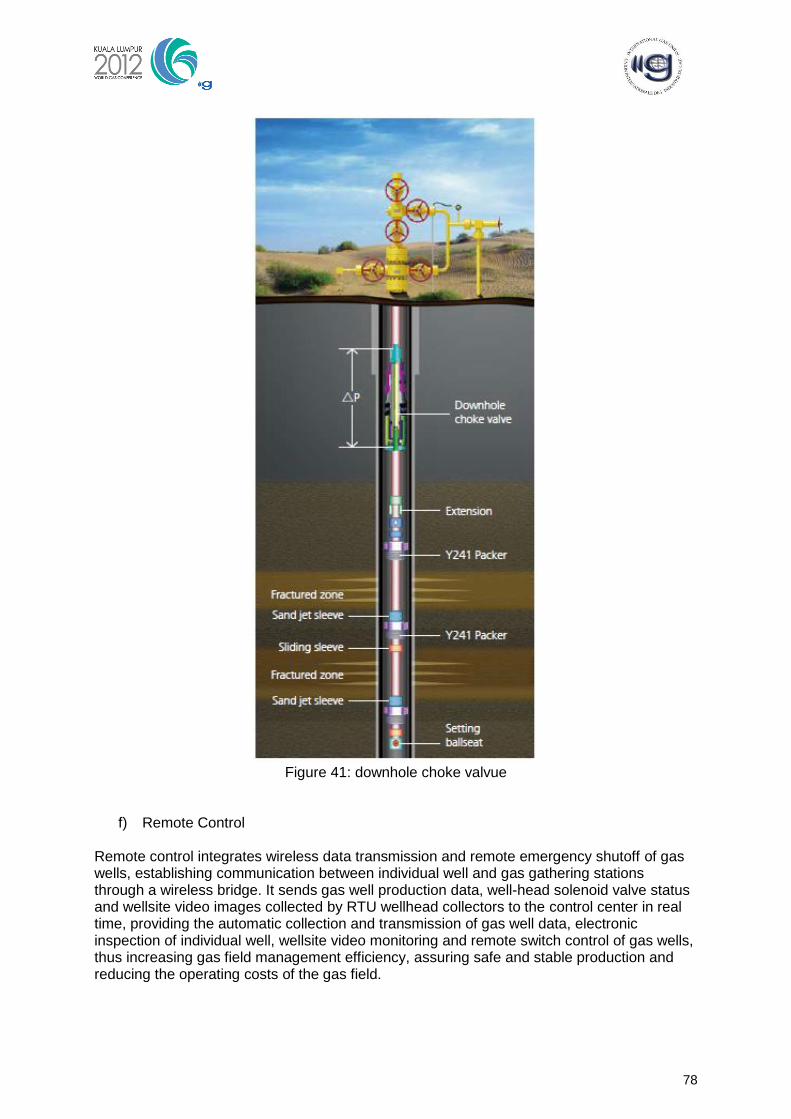
78
Figure 41: downhole choke valvue
f) Remote Control Remote control integrates wireless data transmission and remote emergency shutoff of gas wells, establishing communication between individual well and gas gathering stations through a wireless bridge. It sends gas well production data, well-head solenoid valve status and wellsite video images collected by RTU wellhead collectors to the control center in real time, providing the automatic collection and transmission of gas well data, electronic inspection of individual well, wellsite video monitoring and remote switch control of gas wells, thus increasing gas field management efficiency, assuring safe and stable production and reducing the operating costs of the gas field.
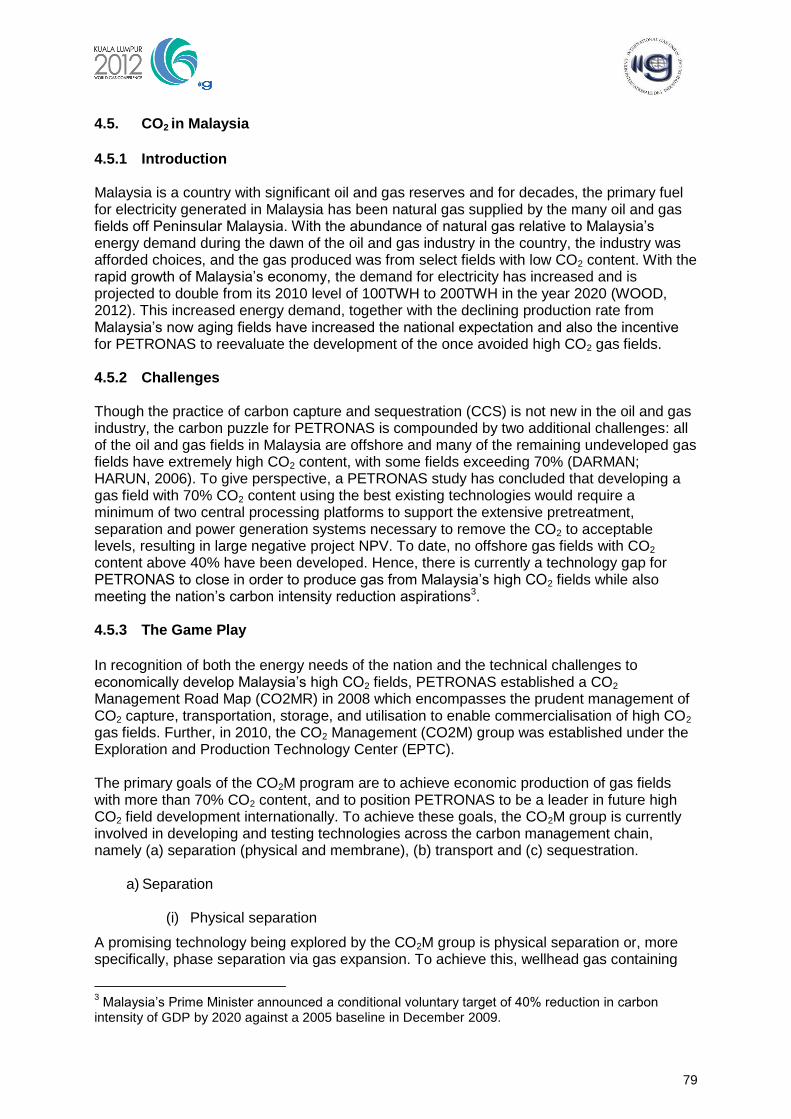
79
4.5. CO2 in Malaysia
4.5.1 Introduction Malaysia is a country with significant oil and gas reserves and for decades, the primary fuel for electricity generated in Malaysia has been natural gas supplied by the many oil and gas fields off Peninsular Malaysia. With the abundance of natural gas relative to Malaysia‘s energy demand during the dawn of the oil and gas industry in the country, the industry was afforded choices, and the gas produced was from select fields with low CO2 content. With the rapid growth of Malaysia‘s economy, the demand for electricity has increased and is projected to double from its 2010 level of 100TWH to 200TWH in the year 2020 (WOOD, 2012). This increased energy demand, together with the declining production rate from Malaysia‘s now aging fields have increased the national expectation and also the incentive for PETRONAS to reevaluate the development of the once avoided high CO2 gas fields. 4.5.2 Challenges Though the practice of carbon capture and sequestration (CCS) is not new in the oil and gas industry, the carbon puzzle for PETRONAS is compounded by two additional challenges: all of the oil and gas fields in Malaysia are offshore and many of the remaining undeveloped gas fields have extremely high CO2 content, with some fields exceeding 70% (DARMAN; HARUN, 2006). To give perspective, a PETRONAS study has concluded that developing a gas field with 70% CO2 content using the best existing technologies would require a minimum of two central processing platforms to support the extensive pretreatment, separation and power generation systems necessary to remove the CO2 to acceptable levels, resulting in large negative project NPV. To date, no offshore gas fields with CO2 content above 40% have been developed. Hence, there is currently a technology gap for PETRONAS to close in order to produce gas from Malaysia‘s high CO2 fields while also meeting the nation‘s carbon intensity reduction aspirations3. 4.5.3 The Game Play
In recognition of both the energy needs of the nation and the technical challenges to economically develop Malaysia‘s high CO2 fields, PETRONAS established a CO2 Management Road Map (CO2MR) in 2008 which encompasses the prudent management of CO2 capture, transportation, storage, and utilisation to enable commercialisation of high CO2 gas fields. Further, in 2010, the CO2 Management (CO2M) group was established under the Exploration and Production Technology Center (EPTC). The primary goals of the CO2M program are to achieve economic production of gas fields with more than 70% CO2 content, and to position PETRONAS to be a leader in future high CO2 field development internationally. To achieve these goals, the CO2M group is currently involved in developing and testing technologies across the carbon management chain, namely (a) separation (physical and membrane), (b) transport and (c) sequestration.
a) Separation
(i) Physical separation
A promising technology being explored by the CO2M group is physical separation or, more specifically, phase separation via gas expansion. To achieve this, wellhead gas containing
3 Malaysia‘s Prime Minister announced a conditional voluntary target of 40% reduction in carbon
intensity of GDP by 2020 against a 2005 baseline in December 2009.
80
hydrocarbons gas and CO2 is forced through a venturi and allowed to expand. The expansion of the hydrocarbon and CO2 gas mixture causes the gas mixture to cool to a design temperature point where only the CO2 liquefies. This allows for the physical removal of the liquid CO2 and significantly reduces downstream compression and processing requirements, leading to smaller equipment footprint and ultimately less CAPEX requirement. In addition, an expansion turbine may be used to harness reservoir pressure, capturing the kinetic energy to produce shaft power for use on the CPP. Figure 42 shows the phase curve of CO2.
Figure 42: Phase curve of CO2
(ii) Membrane separation
PETRONAS currently has significant experience with membrane separation and the deployment of this technology offshore. These systems have advantages due to their relatively small footprint; however in a high CO2 environment (>40%), increased methane slip or higher compression requirements make current technology uneconomical. CO2M is currently focused on the development of new advanced membranes, including mixed matrix and advanced transport membranes, which has significant cost improvement potential.
b) Transport
Moving down the carbon management chain, PETRONAS‘ CO2M also focuses on delivering cost effective solutions for the transport of gasses from the production well, platforms facilities, and finally the transportation of CO2 to the injection wells for sequestration. To recall, the industry has yet to produce from an offshore field with a CO2 content exceeding 40%. Hence, the pipeline and piping design tools required to optimize the use of carbon steel for use in facilities in extremely high CO2 fields do not yet exist. CO2M believes that further CAPEX reductions are possible with the development of design tools which are customized for high CO2 fields. These design tools will not only optimize the carbon steel used in pipelines, piping and vessels, but will also enable further optimization of corrosion inhibitor usage.
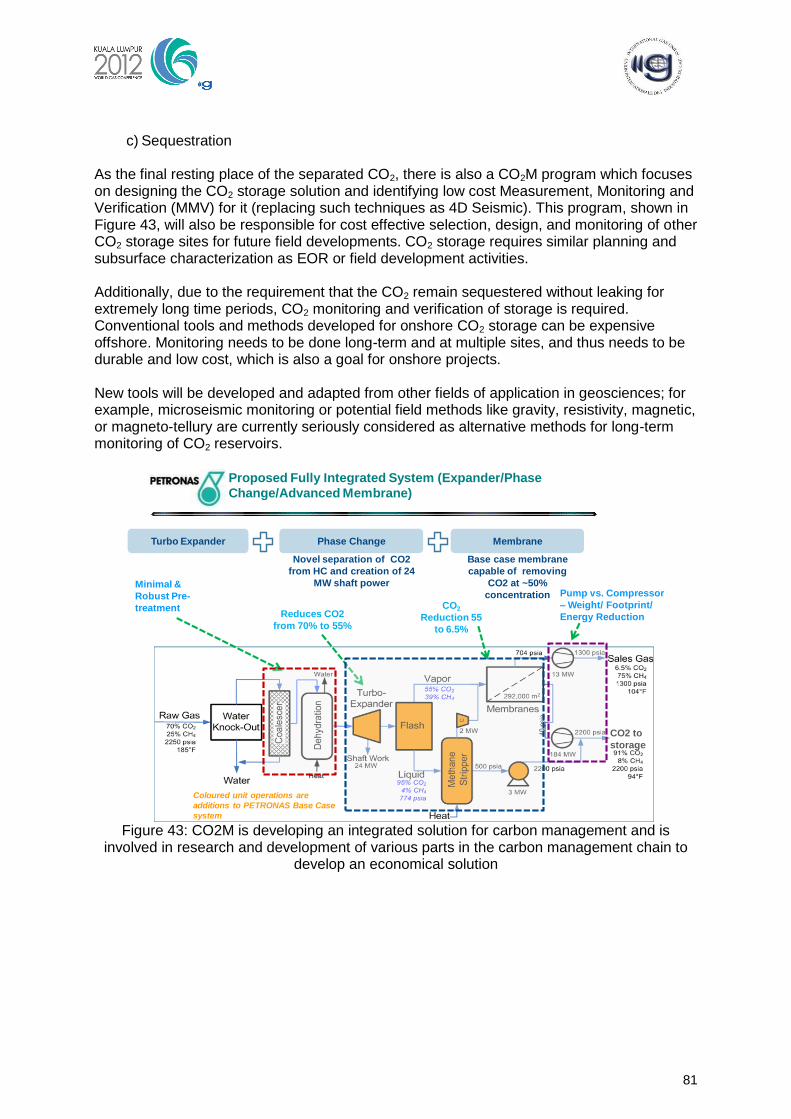
81
c) Sequestration
As the final resting place of the separated CO2, there is also a CO2M program which focuses on designing the CO2 storage solution and identifying low cost Measurement, Monitoring and Verification (MMV) for it (replacing such techniques as 4D Seismic). This program, shown in Figure 43, will also be responsible for cost effective selection, design, and monitoring of other CO2 storage sites for future field developments. CO2 storage requires similar planning and subsurface characterization as EOR or field development activities. Additionally, due to the requirement that the CO2 remain sequestered without leaking for extremely long time periods, CO2 monitoring and verification of storage is required. Conventional tools and methods developed for onshore CO2 storage can be expensive offshore. Monitoring needs to be done long-term and at multiple sites, and thus needs to be durable and low cost, which is also a goal for onshore projects. New tools will be developed and adapted from other fields of application in geosciences; for example, microseismic monitoring or potential field methods like gravity, resistivity, magnetic, or magneto-tellury are currently seriously considered as alternative methods for long-term monitoring of CO2 reservoirs.
4
Phase Change
Novel separation of CO2
from HC and creation of 24
MW shaft power
Membrane
Base case membrane
capable of removing
CO2 at ~50%
concentration
CO2 to
storage
Minimal &
Robust Pre-
treatment
Pump vs. Compressor
– Weight/ Footprint/
Energy Reduction
Turbo Expander
Proposed Fully Integrated System (Expander/Phase
Change/Advanced Membrane)
CO2
Reduction 55
to 6.5%
Reduces CO2
from 70% to 55%
Coloured unit operations are
additions to PETRONAS Base Case
system Figure 43: CO2M is developing an integrated solution for carbon management and is
involved in research and development of various parts in the carbon management chain to develop an economical solution
82
2009 – 2012 Triennium Work Report
June 2012
Report of Study Group 2
Current and Future Developments of Gas Production
Leader: Flavia Di Cino
Argentina
83
1. Introduction, Objectives and Recommendations Given the main conclusions from the two precedent Reports released by IGU – WOC 1:
1.1 2003-2006 Triennium
―Throughout the last three decades of the 20th century the world R/P ratio for natural gas grew steadily as increasing quantities of natural gas were discovered and proven to be technically and economically recoverable… Looking forward, the upstream industry will continue to add to the quantity of proven reserves more quickly than it is depleted by consumption;
―Arctic challenges include how to deal with construction and year-round drilling and production operations, offshore ice management, impact on facilities and infrastructures (permafrost) and establishing remote operation with minimum intervention‖;
―New gas developments will present us with serious cost challenges associated with increasingly tight reservoirs, complex structures or difficult environments such as deep water (e.g. riser systems, flow assurance, subsea compression, floating facilities in water depths over 500m, etc.). Other challenges include the need to minimize the surface footprint of on-shore developments for environmental reasons and establishing confidence in reliable HPHT technology offshore‖;
―Technological developments will improve the prospects for successful exploration as well as improved economics, leading to improved recovery from mature fields as well. Improved seismic, hydraulic fracturing, formation treatment, reservoir modeling, water conformance etc…all continue to make an impact on upstream gas industry performance‖;
―Developing physical pipeline or LNG links between upstream gas reserves and downstream markets will remain a fundamental feature of the global gas market‖;
1.2 2006-2009 Triennium
―Worldwide gas endowment, both conventional and unconventional, is now deemed to be massive‖;
―The key consideration for all energy sources is converting the resource endowment to economically and environmentally viable production‖;
―Unconventional natural gas resources are widespread… Therefore, the key issue is not discovering these resources, but identifying areas where the commercial drivers enable their economic development while ensuring safe and environmentally friendly operations.‖
―Economical criterion is the key factor to characterize gas developments, even if there is unconventionality from geological or technological point of view;
The main objective of the present Report is to substantiate the outlook of the E&P Conventional Gas Projects and Unconventional Developments on a worldwide basis up to 2020; by identifying the drivers, economic criteria, enabling factors and hurdles to overcome
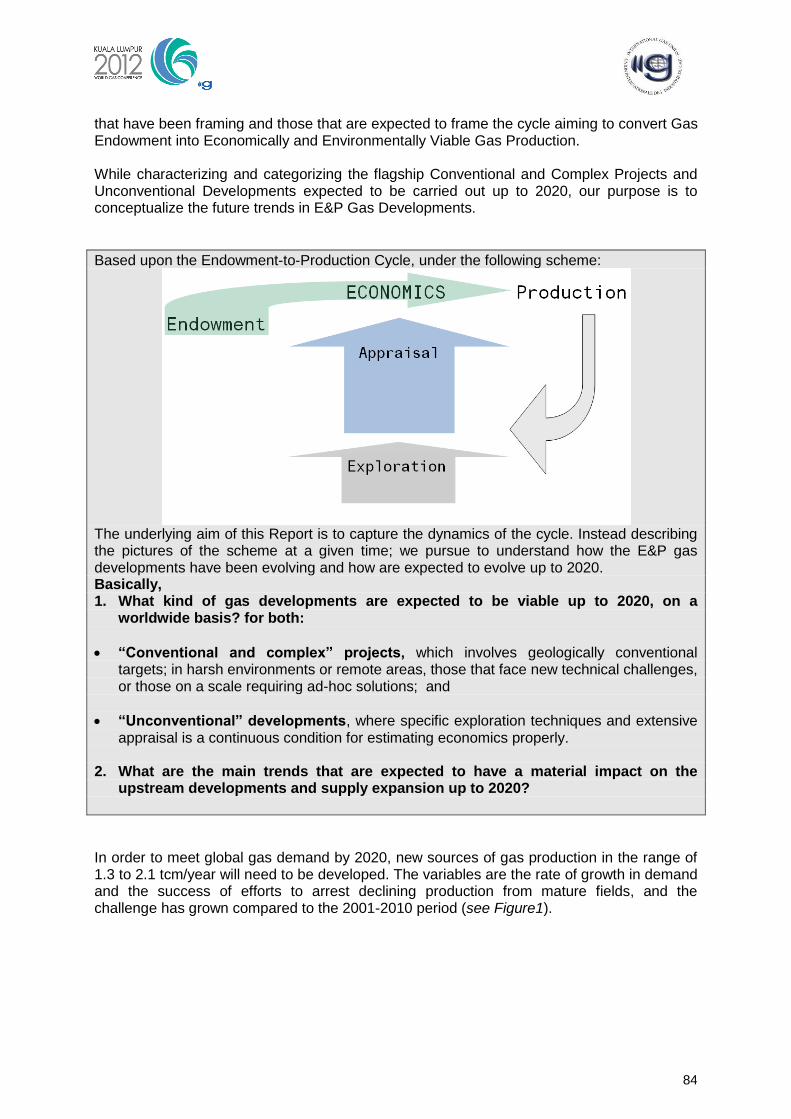
84
that have been framing and those that are expected to frame the cycle aiming to convert Gas Endowment into Economically and Environmentally Viable Gas Production. While characterizing and categorizing the flagship Conventional and Complex Projects and Unconventional Developments expected to be carried out up to 2020, our purpose is to conceptualize the future trends in E&P Gas Developments.
Based upon the Endowment-to-Production Cycle, under the following scheme:
The underlying aim of this Report is to capture the dynamics of the cycle. Instead describing the pictures of the scheme at a given time; we pursue to understand how the E&P gas developments have been evolving and how are expected to evolve up to 2020. Basically, 1. What kind of gas developments are expected to be viable up to 2020, on a
worldwide basis? for both:
“Conventional and complex” projects, which involves geologically conventional targets; in harsh environments or remote areas, those that face new technical challenges, or those on a scale requiring ad-hoc solutions; and
“Unconventional” developments, where specific exploration techniques and extensive appraisal is a continuous condition for estimating economics properly.
2. What are the main trends that are expected to have a material impact on the
upstream developments and supply expansion up to 2020?
In order to meet global gas demand by 2020, new sources of gas production in the range of 1.3 to 2.1 tcm/year will need to be developed. The variables are the rate of growth in demand and the success of efforts to arrest declining production from mature fields, and the challenge has grown compared to the 2001-2010 period (see Figure1).
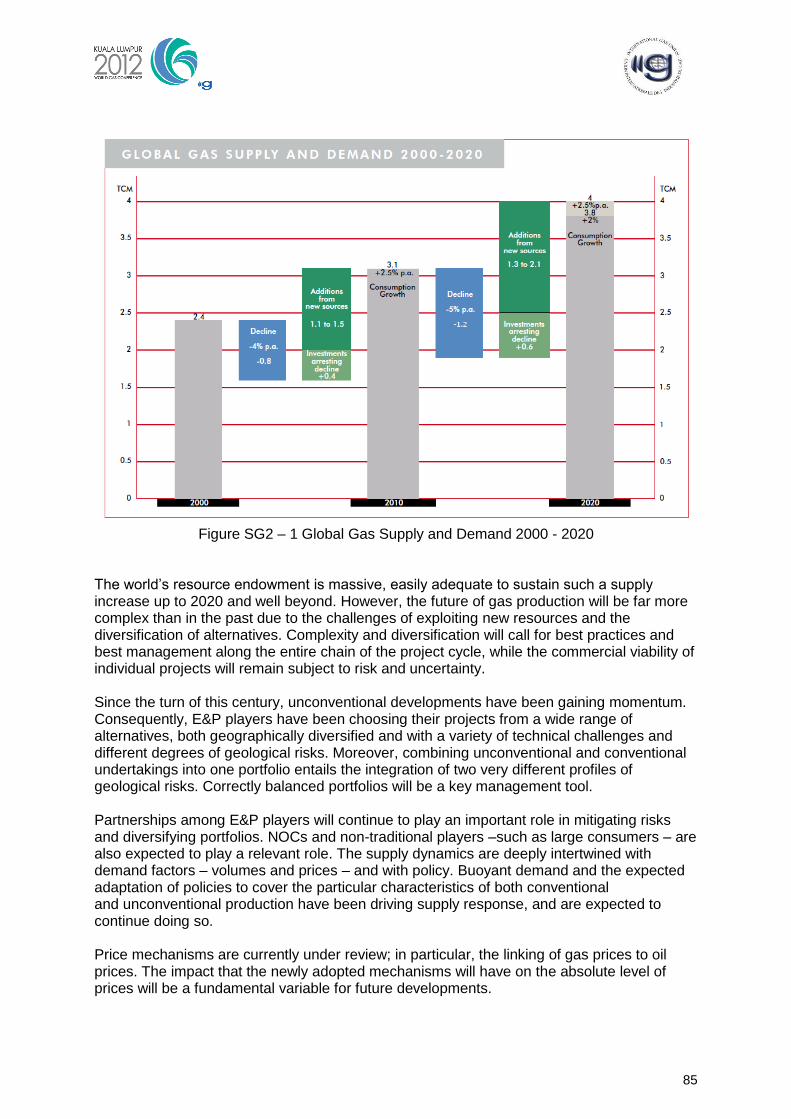
85
Figure SG2 – 1 Global Gas Supply and Demand 2000 - 2020
The world‘s resource endowment is massive, easily adequate to sustain such a supply increase up to 2020 and well beyond. However, the future of gas production will be far more complex than in the past due to the challenges of exploiting new resources and the diversification of alternatives. Complexity and diversification will call for best practices and best management along the entire chain of the project cycle, while the commercial viability of individual projects will remain subject to risk and uncertainty. Since the turn of this century, unconventional developments have been gaining momentum. Consequently, E&P players have been choosing their projects from a wide range of alternatives, both geographically diversified and with a variety of technical challenges and different degrees of geological risks. Moreover, combining unconventional and conventional undertakings into one portfolio entails the integration of two very different profiles of geological risks. Correctly balanced portfolios will be a key management tool. Partnerships among E&P players will continue to play an important role in mitigating risks and diversifying portfolios. NOCs and non-traditional players –such as large consumers – are also expected to play a relevant role. The supply dynamics are deeply intertwined with demand factors – volumes and prices – and with policy. Buoyant demand and the expected adaptation of policies to cover the particular characteristics of both conventional and unconventional production have been driving supply response, and are expected to continue doing so. Price mechanisms are currently under review; in particular, the linking of gas prices to oil prices. The impact that the newly adopted mechanisms will have on the absolute level of prices will be a fundamental variable for future developments.
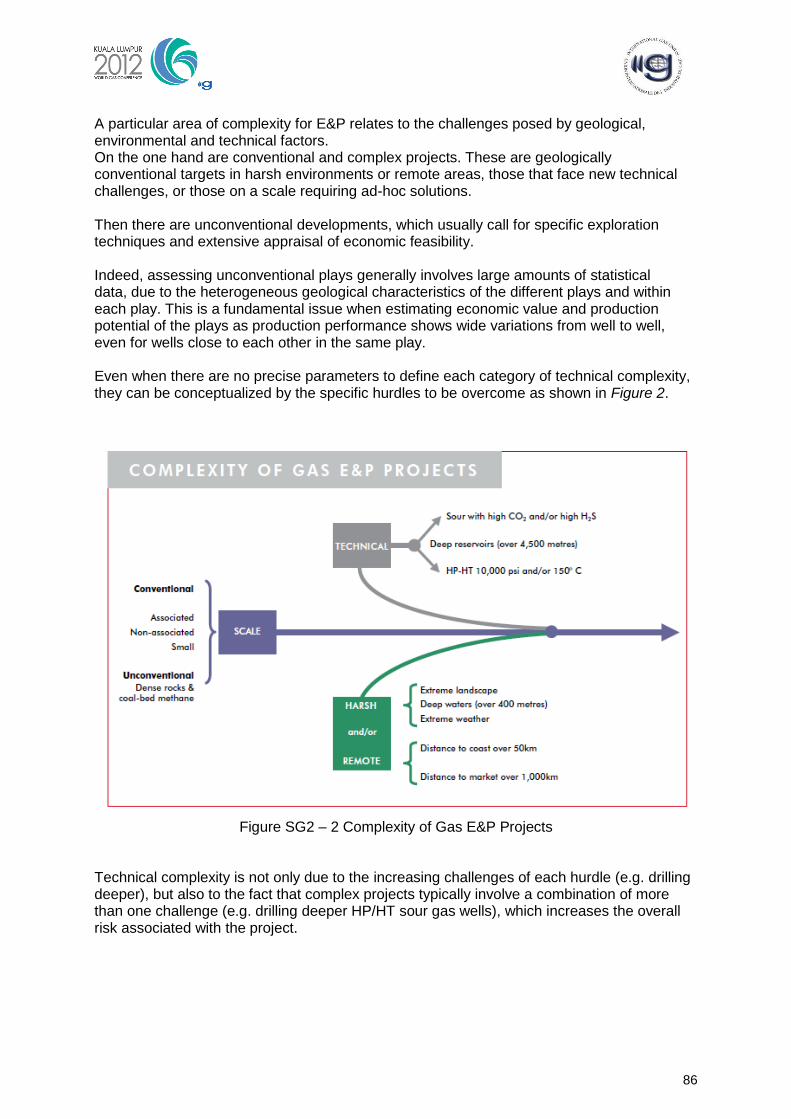
86
A particular area of complexity for E&P relates to the challenges posed by geological, environmental and technical factors. On the one hand are conventional and complex projects. These are geologically conventional targets in harsh environments or remote areas, those that face new technical challenges, or those on a scale requiring ad-hoc solutions. Then there are unconventional developments, which usually call for specific exploration techniques and extensive appraisal of economic feasibility. Indeed, assessing unconventional plays generally involves large amounts of statistical data, due to the heterogeneous geological characteristics of the different plays and within each play. This is a fundamental issue when estimating economic value and production potential of the plays as production performance shows wide variations from well to well, even for wells close to each other in the same play. Even when there are no precise parameters to define each category of technical complexity, they can be conceptualized by the specific hurdles to be overcome as shown in Figure 2.
Figure SG2 – 2 Complexity of Gas E&P Projects
Technical complexity is not only due to the increasing challenges of each hurdle (e.g. drilling deeper), but also to the fact that complex projects typically involve a combination of more than one challenge (e.g. drilling deeper HP/HT sour gas wells), which increases the overall risk associated with the project.
87
1.3 Flagship developments During the current triennium, WOC 1 Study Group 2 has been evaluating trends in complexity by reviewing flagship developments. According to present research, all categories of complexity will be represented in the sources of new gas production expected to be developed around the world up to 2020. Some examples are given below. Australia is home to several flagship projects with massive additions of production capacity, both offshore and onshore, conventional and unconventional. Offshore, they include the Gorgon project which will add 20 bcm/year and includes a large CO2 sequestration project, and the Prelude project of 5 bcm/year which will use floating LNG technology. Onshore, additions from unconventional CBM to LNG projects already sanctioned are expected to add 30 bcm/year. In North America, the trend towards shale gas developments is expected to continue. In the United States, the production of gas from the Marcellus shale – which is the flagship case for the decade – is estimated to be around 100 bcm/year by 2020, with a potential high case of 180 bcm/ year. In Canada, the emergent plays Horn River (shale) and Montney (shale and tight gas) are estimated to have a combined production potential of around 80 bcm/year. However, both sources should be considered ―stranded‖ due to the fact that they are farther in the north-west of the country compared to conventional sources and due to the current development of several plays in the US, which make the North American market self sufficient for the next decade. For this reason, together with sustained gas price differentials in favour of Asian and European markets versus North America, several LNG export projects are under consideration in the US and Canada. The Russian sector of the Barents Sea is expected to become an entirely new gas and oil production province, with the Shtokman field set to be developed in three phases of 24 bcm/year each. Shtokman was discovered in 1988 and is located 600km offshore. After more than two decades, and despite the challenges, the absence of transit countries on the way to markets was the key factor in deciding to prioritise this project. A final investment decision is awaited with start-up expected by 2017. In the Gulf, the Permian gas reservoir is commonly known as the Khuff Formation and contains sour gas. Production from the Karan field, which is the first non-associated offshore development in Saudi Arabia, started in July 2011 and is expected to reach full capacity of 18 bcm/ year by 2013; while Abu Dhabi´s Shah field is expected to add 10 bcm/year. In China, the Sulige tight gas field is ramping up production to reach 23 bcm/year by 2015. Sulige is a low permeability, low pressure gas field with a reservoir depth of 3,200 to 3,500 metres. In India, the Krishna Godavari offshore basin is likely to become a world-class area of gas production. The KG-DWN-98/2 block, which sits adjacent to the producing KG-DWN-98/3 block, has a targeted production of 7 bcm/year. However, discoveries are scattered across the basin in both deepwater and shallow-water areas. In Africa, Angola LNG is about to start operations and is monetising 7 bcm/year of non-associated and associated gas from a series of deepwater and shallow-water blocks. In Israeli waters of the Mediterranean Sea, several recent discoveries have increased the estimated volumes of resources of the Levant basin to 980 bcm. The Tamar field is expected to start production of 3 bcm/year by 2013.
88
In the Section I of this Report, we address the main global trends in Conventional and Complex projects, by identifying the technological advances that have been enabling and will continue to allow this kind of developments; including:
Harsh environments and/or Remote areas
Technical challenges:
Deep gas
HP/HT
Sour gas
Scale that requires ad-hoc solutions
In the Section II of this Report, we address unconventional developments, by identifying their inherit characteristics and particular issues; including:
Regulation
Access to resources
Declaration of commerciality
Prices & Economics
Infrastructure to market
Environmental issues
Land use
Drilling and fracturing
Well integrity
Water management
Risk Assessment
Introduction
Development phases
Economic evaluation
Regional Undertakings
IMPORTANT NOTE: The information and the data contained in this draft of the Report of the IGU WOC 1 STUDY GROUP 2. 2012 are publicly available and they were collected from several reliable sources - such as E&P companies, national energy governmental offices, international energy institutions and recognized energy researchers-. Third parties publicly available analysis was also considered. However: The focus, organization, interpretation, prevailing judgments and conclusions included in this draft and those expected to be included in the Report are based upon the discussions and debates among the members of the WOC 1 SG 1.2. - Triennium 2009-2012.
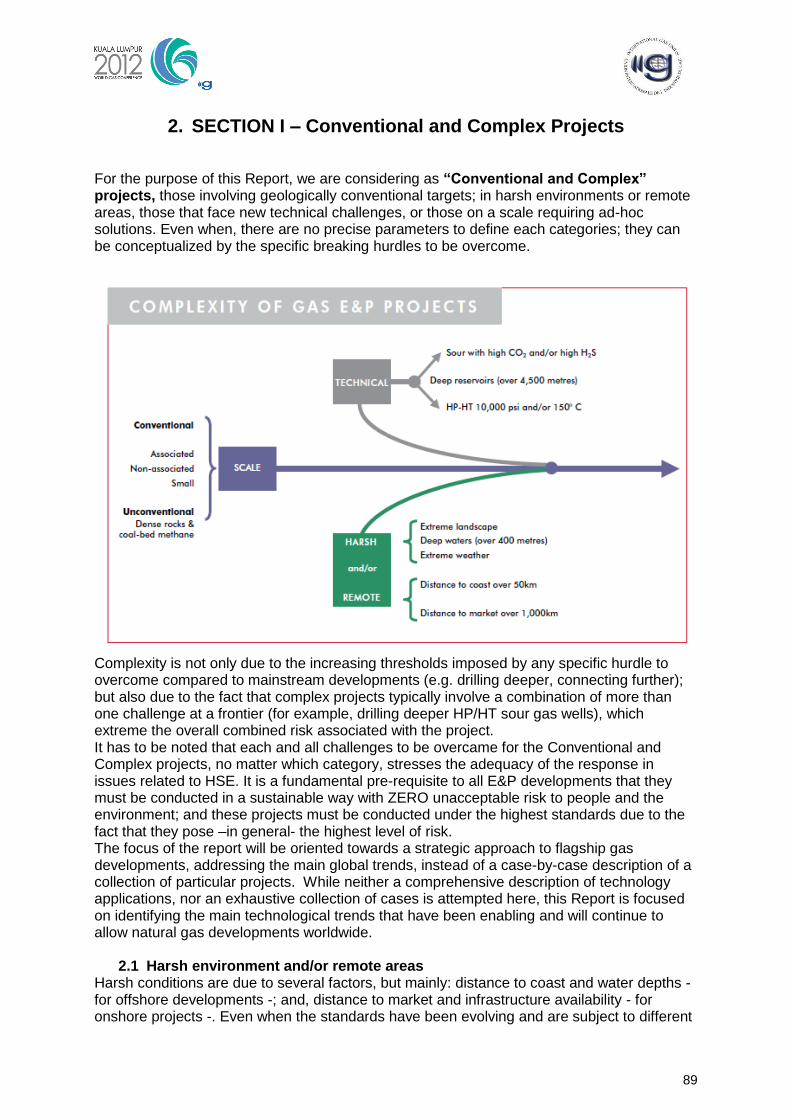
89
2. SECTION I – Conventional and Complex Projects For the purpose of this Report, we are considering as “Conventional and Complex” projects, those involving geologically conventional targets; in harsh environments or remote areas, those that face new technical challenges, or those on a scale requiring ad-hoc solutions. Even when, there are no precise parameters to define each categories; they can be conceptualized by the specific breaking hurdles to be overcome.
Complexity is not only due to the increasing thresholds imposed by any specific hurdle to overcome compared to mainstream developments (e.g. drilling deeper, connecting further); but also due to the fact that complex projects typically involve a combination of more than one challenge at a frontier (for example, drilling deeper HP/HT sour gas wells), which extreme the overall combined risk associated with the project. It has to be noted that each and all challenges to be overcame for the Conventional and Complex projects, no matter which category, stresses the adequacy of the response in issues related to HSE. It is a fundamental pre-requisite to all E&P developments that they must be conducted in a sustainable way with ZERO unacceptable risk to people and the environment; and these projects must be conducted under the highest standards due to the fact that they pose –in general- the highest level of risk. The focus of the report will be oriented towards a strategic approach to flagship gas developments, addressing the main global trends, instead of a case-by-case description of a collection of particular projects. While neither a comprehensive description of technology applications, nor an exhaustive collection of cases is attempted here, this Report is focused on identifying the main technological trends that have been enabling and will continue to allow natural gas developments worldwide.
2.1 Harsh environment and/or remote areas Harsh conditions are due to several factors, but mainly: distance to coast and water depths - for offshore developments -; and, distance to market and infrastructure availability - for onshore projects -. Even when the standards have been evolving and are subject to different
90
grades of maturity from region to region; typical distances to consider a project into this category are: distance to coast longer than 50 km, water depths deeper than 400 m; and, distance to market longer than 1000 km. for onshore undertakings. Extreme weather or landscapes, as well as the presence of fragile ecosystems (such as Arctic, deserts and rainforests) are also factors for this category. Altogether, they pose several hurdles to overcome above-the-wellhead, mainly related to the logistics and to the deployment of the needed infrastructure to connect the point of production, to a point of processing or to the market. For deep-waters and Arctic environments, flow assurance becomes a key factor. Assuring continuous flow of production fluids is particularly acute in cold, and/or high pressure conditions; being the first concern the processing and transport of liquids (water and/or condensates), and the second concern that involving thermal issues to avoid hydrate formation. Ice prone areas are characterized by very long exploration, appraisal and development timescales due to the limited seasonal window for drilling and installation. Industry has been pursuing to enable year-round drilling operations.
2.1.1 Offshore In Russia, to reduce environmental footprint, since the first Sakhalin-1 well was drilled in 2003, six of the world´s top 10 extended reach wells were drilled for the Sakhalin field; being Odoptu 11 well, drilled by the beginning of 2011, the world´s longest extended-reach well, reaching a total measured extension of 12300 m, of which 11400 m where horizontal, in only 60 days.
2.1.2 Deserts In Algeria, In Salah is a flagship development carried out in the Sahara desert where temperatures over 45 º C, sandstorms and scorching winds are common. More than 100 discoveries had been made in the region since the 1950s but the gas was too remote from any sizeable market until advances in technology made the project economically feasible. The producing fields were connected by about 400km of gas pipeline. The project involved a cluster of fields which are very large in area. The gas deposits comprise two tight, thin reservoirs at depths of between 2000 to 4000 meters. They have generally low porosity and low permeability, but the appraisal program indicated excellent lateral continuity in the reservoirs, so large areas could be produced by relatively few wells, with long-reach horizontal-drilling being an important factor. The CO2 content –which varies from field to field from 1% to 9%- was also a factor to overcome. The project included the separation of the CO2 and its storage into the gas formation.
2.1.3 Rainforests In Peru, the Camisea natural gas fields - Pagoreni, San Martin and Cashiriari-. were discovered by Shell in 1986; but development started by mid nineties. The Camisea gas project is one of the largest energy projects in Peru and is central to the country‘s economy, with investments around 2.7 us$ billion. Camisea gas fields are located in a fragile biodiversity in Peru‘s south-eastern Amazon jungle basin and hold natural gas reserves of 0.4 TCM. The project is operated by Pluspetrol, with partners Hunt Oil, SK Corporation, Tecpetrol and Sonatrach. To maintain the overall Camisea plateau production of 16 BCM/y, the contributions made by the three streams is balanced to optimize the drainage of the reservoirs. Natural gas produced by Camisea natural gas fields is sold domestically and it is also exported via LNG.
91
2.2 Flagship developments
2.2.1 Arctic
The Arctic Circle (c. 66.5 A North Latitude) encompasses an area of more than 21 million km2, or about 6% of the earth‘s surface. The primary factors that make activities in the Arctic unique is the general presence of ice in different forms (excluding some sub-regions such as the Norwegian Shelf due to the Gulf Stream) and the long periods with limited or no access. Wind and wave height pose less of a challenge in Arctic waters than in many other locations. Despite of the hurdles, the Arctic share of global gas production is today significant, around 20%, as the region includes many massive Russian fields of Western Siberia. In terms of exploratory potential; although massive, few onshore Arctic areas have been demonstrated to be important petroleum provinces so far. Almost one third of the Arctic consists of shallow continental shelves, which remain largely untested for natural gas and oil.
2.2.2 Arctic onshore In Russia; since the 1960s, 26 inland and 5 offshore fields have been discovered on Yamal peninsula, with estimated resources of 22 TCM, and production potential of around 300 BCM/y (30 Bcf/d) by 2030. Among the most promising fields of the Yamal peninsula; Bovanenkovo was prioritized for development due to the fact that it holds the largest amount of reserves in the area, 5 TCM. Gas production from the field is projected to peak at 140 BCM/y (14 Bcf/d). In the United States, Alaska's North Slope –placed within the Artic circle- holds about 1 TCM of proven conventional natural gas reserves –and more than 5.5 TCM of resource potential- without market access, of which: 0.7 TCM proven associated gas are within the Prudhoe Bay developed and declining oil field, and 0.3 TCM proven are within Point Thomson under the first stage of development. Prudhoe Bay is considered the anchor field for a potential pipeline to lower 48 states due to its low production costs; as c. 60 - 80 BCM/y (6-8 Bcf/d) of natural gas is currently produced and cycled into the reservoir to pressurize, increase and accelerate the oil production. Prudhoe Bay has long since become a gas field with associated liquids rather than an oil field with associated gas, as it was initially. After NGLs, carbon dioxide and gas for local use are extracted, gas is re-injected into the field and carbon dioxide also goes for enhanced oil recovery. By the end of the decade, the oil production is expected to be low enough to free natural gas to markets and production costs are expected to remain low as production wells and facilities are already in place. Consequently, it is expected that Alaskan gas could reach North American or Asian markets.
2.2.3 Arctic offshore In Norway, Norwegian authorities opened the Barents Sea in the Arctic for exploration in 1981 and the same year, Statoil discovered the huge Snøhvit gas field. Up to 2010, around 100 exploration wells were drilled in the area. The Snøhvit development is a milestone as complex project, not only because of its Arctic location; but also because of a combination of hurdles: it is situated 150 km from land, and the gas has a high carbon dioxide content. Among the application of technologies to carry-out this project, multi-phases pipeline transportation was key to cost savings as offshore separation and multi pipe-laying were deemed too expensive. With 145 km to shore, it was the largest multiphase transport system by the time the project was completed.
92
Phase II of Snøhvit is awaiting a decision on whether or not to add compression to increase production. The development in subsea compression technology is expected to be a crucial factor for the realization of remote projects; particularly, in Arctic areas below the ice or in areas where icebergs are prevalent. Sub-sea or even down-hole separation of water with associated direct injection back into the field will also be essential in handling production both below and above ice. Strong technological development in multiphase transport of mixtures of oil, gas and water is expected to further increase the distances over which transport can be carried out; while electrification and remote-operation from land will be mandatory. In Russia, total estimated hydrocarbon resources of the Arctic shelf of Russia amount to approximately 18% of the total resource volume of the world ocean shelves. Among fields for potential development in the area, including Prirazlomnoe, Severo-Kamennomysskoe and Kirinskoe, the largest and the most promising field for working out the strategy of Russia in the area is Shtokman. Shtokman was discovered in 1988. After more than two decades, and despite of the challenges, the absence of transit countries on the way to markets was the key factor for deciding to prioritize this project. The region is expected to become an entirely new gas and oil production province. The project was affected by the economic crisis and startup is now planned by 2016. LNG supply and demand balances and price dynamics will be key factors in defining the proper timing for its sanctioning. Gazprom, Total and Statoil are taking part in the development of the Shtokman gas field, located 650 km from shore in the Barents Sea, North-east of Murmansk. The water depth of the sea in the field‘s area is about 350 m. Pay zones are deposited at depth around 1800 – 2300 m, and proved reserves are estimated at 4 TCM. Due to its large scale the field is planned to be developed in three phases of 24 BCM/y each. Gas will be sent to distribution by the gas-pipeline supply system and to an LNG plant up to 30 MMton/y (41 BCM/y). The generic challenges of the offshore Arctic that were previously introduced are all present for this project, which will require the application of state-of-the-art technology for subsea completion high pressure wells, offshore ice-resistant platforms, very large subsea multi-phased pipelines and large scale LNG plants.
2.2.4 Offshore - Deepwater First developed by Shell in the early 1960s, subsea technology –where the wellhead is located on the ocean floor rather than on a production platform at the water surface- were increasingly used in the shallow North Sea, and also came of age in the Gulf of Mexico deepwater section at Auger field. However, it began to make economic sense only with the discovery of fields with high flow rates in deepwater sections, especially for smaller fields that could not justify a large platform. Subsea completions became important as a component of an early production system or as a remote subsea development. In the United States, the Independence Hub in the GOM completed by mid 2007 was a remarkable milestone. With a production capacity of 10 BCM/y (1 Bcf/d) the project set numerous world records during its construction and installation, including: the world deepest subsea production tree in 2700 m of water, the deepest catenary riser installation and the deepest export pipeline originated in 2400 m of water, with 215 km in length. In Norway, Ormen Lange was completed in 2007, in water depths of the Norwegian Sea ranging from 850 to 1100 m and facing extreme technological challenges; including, uneven and rugged seabed for sub-sea completions and pipeline designs, main production in an extensive avalanche sliding area, flow assurance in temperatures of minus 1.2 ºC at seabed, challenging waves and winds; and the longest sub-sea development with 120 km multiphase transportation to shore, and a 1200 km gas-pipeline for exporting gas to the UK.
93
In India, the KG-basin is likely to become a world-class area of gas production. So far ONGC's ten discoveries at KG-DWN-98/2 and three in nearby blocks are estimated to hold 0,2 TCM of gas while a further discovery in deep waters (2850 m) known as UD-1 is certified by the Directorate General of Hydrocarbons (DGH) to hold 0.1 TCM. Discoveries are scattered across the basin in both deep-water and shallow-water areas and to date. ONGC plans to invest 8 us$ billion to develop its gas fields in the KG basin and plans to pump 11 BCM/y (1 Bcf/d) of gas from the blocks by 2016/17. In China, Husky has agreed to operate the deep water portion of Liwan 3-1 with estimated resources of around 2 TCM, involving development drilling and completions, subsea equipment and controls, and subsea tie-backs to a shallow water platform; while its domestic partner CNOOC, has agreed to operate the shallow water portion of the project including a platform, approximately 270 km subsea pipeline to shore, and the onshore processing plant. In Australia, Shell announced in May 2011 Final Investment Decision on Prelude FLNG, the world‘s first Floating LNG facility, whit investments of around 10 us$ billion. The FLNG facility will tap around 1 TCM of resources contained in the Prelude and Concerto gas fields, and first LNG from the project is expected to be shipped out in 2016. The FLNG facility will stay permanently moored at the Prelude gas field for 25 years, and in later development phases should produce from other fields in the area. Shell has announced that in Australian waters alone there is an estimated 4 TCM of ―stranded‖ gas to be extracted. Shell‘s Prelude FLNG project would open up development of gas fields that previously were too small or too remote; yet future FLNG applications are unlikely to be universal: marine conditions, hefty investments and commercial issues are likely to constrain deployment to companies large enough to manage the risk. In Malaysia, Shell is also leading the development of the 1 TCM Kebabangan cluster and the 0.5 TCM Kamunsu East deepwater gas fields, as well as the 670 MMboe Gumust-Kakap project, all of which are expected to come on stream over the next years. In Indonesia, the Abadi gas field, located in the Masela Block in the Arafura Sea, lies in water depths ranging from 300 to 1,000 meters. Discovered in 2000 by the Abadi-1 well (making it the first discovery of hydrocarbons in the Indonesian Arafura Sea), Abadi was further appraised by six wells, confirming the sufficient volumes of gas reserves for an LNG development project. Abadi is believed to contain more than 3 TCM of natural gas reserves. Stranded gas In Russia, the Kovykta field holds an estimated volume of 2 TCM in recoverable reserves. Gazprom is negotiating a long term sales agreement and the financing of a dedicated pipeline to China. The current outlook is for the pipeline to become operational by the end of 2015, with deliveries to reach 30 BCM/y (3 Bcf/d) during the project‘s plateau phase.
2.3 Technical challenges (deep gas, HP/HT, sour gas)
2.3.1 Deep gas Deep natural gas resources generally are defined as occurring in reservoirs below 4,500m (15,000 feet), whereas ultra-deep gas occurs below 7,500m (25,000 feet). In terms of wells, true vertical depth has to be considered. As a large number of basins are characterized by very thick sediments, deep gas resources are widespread and occur in diverse geological environments. There is a historical trend to progress into deeper horizons as time goes by. This trend has been reinforced recently by results that contradict the hypothesis of bad preservation of reservoir quality with depth.
94
Technologic problems related to drilling are among the greatest challenges not only due to the depth. Indeed; while deep gas targets are usually characterized by high pressure and high temperature conditions, the presence of CO2 and H2S is also common. Problems associated with overcoming hostile drilling environments for successful well completion, present the greatest obstacles to drilling, evaluating, and developing gas fields. In some cases, the presence of salt is also a factor. The presence of salt has a cooling effect on the surrounding sediments, causing areas with salt intrusion to have lower temperatures. However exploring and drilling around and trough salt presents other problems, such as poor seismic definition and lost circulation of drilling mud systems. Deep Gas – Flagship developments In the United States; after the first deep well was drilled in 1920, a real interest in deep exploration started in the 1940s and first major production came on stream during the 1960s. Deep gas wells are distributed over all the basins of the US, however the Mid-Continent, the Permian Basin, the Rocky Mountains and Gulf of Mexico contain the largest number of producing wells. Deep gas in US GOM is mainly concentrated in shallow waters; and generically the reservoirs are extensions of the areas on-shore that were previously discovered. By the end of 1979, at the apex of the second oil crisis, Mobil discovered the Norphlet play at 6,400 m offshore Mobile Bay, Alabama, following 9 years of permitting delays, derived from the concerns about how to protect the fragile environment of Mobile Bay and the Mississippi Sound. The Norphlet discovery (subsequently named as Lower Mobile Bay-Mary Ann field) was the first offshore Jurassic discovery in the northern GOM, extending the area of known onshore production. The US GOM has been rigorously explored, especially the shallow-water area. However, sediments located at depths greater than 4500 m below sea level in the Outer Continental Shelf (OCS) are relatively unexplored. It is estimated that more than 0.3 TCM of deep gas recoverable resources could be found. Under the prevailing price environment, these targets are deemed not feasible to be produced due to the uncertainties around reservoir porosity and permeability at these depths and issues associated with extreme HP/HT (20,000 Psi, 250 º C). However, the expected potential for higher flow rates could justify investments when prices recover. In the FSU, deep sedimentary basins comprise a total area of around 4 million km2. Some of the basins are amongst the deepest in the world. The basins are both onshore and offshore, from the Arctic in the North, to the Sea of Okhotsk and the Kamchatka Peninsula in the East, and the Caspian in the south. They are situated in very variable geological contexts. In Russia; brown field developments, including new smaller satellite fields and deep pools in cooperation with foreign partners are planned. Currently Wintershall and Gazprom are developing the deeper and complex structure of Achimov of the Urengoy fields. In China, Dina-2 gas field located in the Tarim Basin at 5200 m, with a cumulative proven gas in place volume of 0.2 TCM started production in 2009; while Ivanhoe is pursuing a deep gas exploration program in the Zitong block at 4300 m depth located in the Sichuan basin. In Azerbaijan, Shah Deniz II is expected to begin producing 16 BCM/y (1.6 Bcf/d) of gas in 2017, of which 10 BCM/y is expected to be marketed in the EU through a new gas export project. Associated investments are in the order of 20 us$ billion.
95
In Bolivia, a four multi-lateral intelligent well system was recently installed in San Alberto; becoming the deepest (4300 m), highest pressure, highest temperature four-multilateral system installed in a well on a worldwide basis. In Australia, the recent discoveries in the Western Carnarvon Basin: Martell, Noblige and Larsen are located in deep-waters. In particular the Larsen deep play will be developed with a final depth of 4,850 m in deep-water depths of 1200 m. It is envisaged that these discoveries will support the projected second train of Pluto LNG. In Egypt, BP has recently signed a new agreement to develop North Alexandria and West Mediterranean Deepwater concessions. The first phase will cover an estimated 0.2 TCM of gas and associated condensate through sub-sea development of five offshore fields into a new purpose-built onshore gas plant on Egypt‘s Mediterranean coast. First gas is expected in late 2014. In Israel, Leviathan field may hold 0.5 TCM of gas. Leviathan would be the largest gas field in Israeli waters, almost double the size of the Tamar field discovered in 2009. Gas in the Leviathan field may be exported as well as Tamar and Dalit, both estimated to begin producing at the end of 2012, with an investment of 7.5 us$ billion.
2.3.2 HP – HT (High Pressure – High Temperature) Even when the combined conditions of high pressure and high temperature for a reservoir is dictated by several geological factors; empirically, the concept of high pressure, high temperature and deep wells are intertwined; as generically, pressure and temperature increase with depth. A priori, pressure increases with depth because of the overburden of sediments above and the amount of water trapped within the sediments. Temperature also increases with depth and can be even higher in areas with less salt intrusion into the sediments. While there is no one definition as developments have moved into deeper horizons; wells requiring control equipment with a rated working pressure in excess of 10,000 Psi and/or having temperatures in excess of 150 ºC are considered high pressure / temperature (HP/HT) wells. HP/HT fields occur onshore and offshore and for oil and gas fields. HP/HT wells present difficulties to well engineers, both to drill and to choose the adequate completion, being the most relevant the higher cost of the appropriate equipments, the difficulties in predicting the production plateau potential, and the more demanding conditions to preserve well integrity.
2.3.3 Sour gas Sour gas is natural gas that contains not only methane and some long-chain hydrocarbons, but also hydrogen sulfide (H2S) and/or carbon dioxide (CO2); while mercaptans and organic sulfur compounds are also present. These compounds have to be removed before the gas can be transported to markets; wells and production facilities must be able to produce and process the fluids, since H2S, CO2 and mercaptans are corrosive. In general, the maximum content to be considered a source of gas as sour, is the maximum content specified to be transported and/or marketed; and could be as low as 0.3% for CO2 and 10 ppm for H2S. On a worldwide basis, excluding North America, it is estimated that around 75 TCM of proven gas reserves are contained in sour reservoirs. Such reservoirs are found on a worldwide basis, but the Middle East with 45 TCM holds the largest volumes. The challenges involved in managing increasing amounts of sour gas include the development of safe drilling and production technologies and processes that ensure well and facility integrity, while minimizing the project‘s environmental footprint. Steady progress in
96
the field of amines, have allowed robust, reliant, efficient and cost effective solutions to sour gas processing, which have been and are applied in numerous applications. Acid gas is a gas that is only composed of H2S and CO2, this being the residue after all hydrocarbons have been extracted. Acid gas can be further processed to produce sulphur. Sour Gas - Flagship developments Primarily all of the high pressure sour gas experience in the world up to the 1990s was concentrated in Alberta, Canada. Sour gas production started in 1920s, while producing fields with up to 35% of H2S content in the gas flow have been operating safely since the 1960s. By the early 1980s, large plants were being built with sulfur recovery factors greater than 98%. H2S tends to be a problem more often for gas producers than for their oil counterparts, but it is also an issue for heavy sour oil developments. Indeed, one of the wells containing the highest concentrations ever reported -76%-, the Smackover, was drilled by a joint-venture integrated by a sulfur company owned by an oil company. In the United States, the 6100 m deep and high H2S reservoir Norphlet play called at the time of development (the 80s) for frontier engineering and technological designs, including new metallurgy to avoid corrosion. The frontier nature of Norphlet production was due to the characteristics of the hydrocarbon fluid: hot, high pressure mixture of methane, hydrogen sulfide, carbon dioxide and free water. In China, H2S and CO2 is removed from 13 BCM/y (1.3 Bcf/d) feed gas produced from Puguang field. The processing plant removes virtually all the H2S , which comprises nearly 15% of the raw gas, and converts it to elemental sulfur. It also reduces CO2 to 3% from 10%. The giant gas field, with proven original gas in place of around 0.5 TCM, was discovered in 2003 in the eastern Sichuan basin. In the Persian Gulf zone, the Permian gas reservoir is commonly known as the Khuff Formation. This sequence is composed mainly of carbonate rocks and exists in many countries; including Qatar, Iran, Abu Dhabi and Saudi Arabia. In Saudi Arabia, Hawiyah gas plant was brought on-stream in December 2001 as part of the Master Gas System plan. The facility can process up to 16 BCM/y (1.6 Bcf/d) of raw gas (sweet and sour) and produces 14 BCM/y (1.4 Bcf/d) of gas, 170 kbbl/d of condensate, and 1,000 ton/d of sulfur. Production from the Karan field, which is the first non-associated offshore development in Saudi Arabia, started in July 2011 and is expected to reach full capacity of 18 bcm/ year by 2013; while Abu Dhabi´s Shah field is expected to add 10 bcm/year. In Tunisia, two BG lead projects - Miskar and Hasdrubal - are being carried out. Both consist of multiple complex carbonate reservoirs which are trapped in combination structural and stratigraphic traps with wide variations in non hydrocarbon components such as CO2, H2S and nitrogen as well as dry gas and, in the case of Hasdrubal, an oil rim. First gas from this joint project was achieved in 2009. Hasdrubal is a 1.2 us$ billion project and has turned BG into the largest producer of gas, LPG and liquids in Tunisia. The Hasdrubal plant is a 50/50 joint venture of BG Tunisia and Tunisian state-owned oil and gas E&P company. The plant train encompasses gas separation, mercury removal, gas dehydration with molecular sieve, H2S and CO2 removal, export gas compression, condensate stabilization, condensate storage, and export. The industry has considerable enlarged its portfolio of tools to address sour gas. For high H2S content and when liquid H2S can be re-injected, cryogenic processes for upstream removal in combination with downstream treatment with conventional amine process are applicable. Also under improvement is the process of membrane separation in conjunction with amine techniques.
97
Sour Gas – CO2 Storage Geological storage is considered one of the most promising approaches to large scale CO2
sequestration as the technical aspects of geological CO2 storage appear less challenging than that posed by either cost-effective CO2 capture or cost-effective CO2 transportation. Although there are several projects under evaluation which are addressing various alternatives of CO2 Storage, the number of those developments associated with E&P commercial operations remains limited, mainly due to poor economics and the associated operational risks and high level of regulatory uncertainty. On the positive side, after c. five years of heated debates and controversial views, agreement was reached during the UN Climate Change Conference in Cancun during December 2010, that CCS could be eligible under the Clean Development Mechanism, allowing developers to earn carbon credits from the CCS projects in developing countries, as long as issues over leakage, liability and environmental impacts are addressed. A number of challenges have to be addressed, including:
Geologic and Engineered Systems: site assessment based on 3D structural-stratigraphic framework and fluid migration, especially for saline aquifers and well stability in the presence of carbonated water.
Process Optimization: Flood performance is controlled by reservoir and fluid properties but may be optimized through innovative well configurations that maximize injectivity whilst moderating buoyant flow of CO2. Economic offsets in the form of hydrocarbon recovery entail assessment of economics limits for production versus storage in the case of EOR operations.
Monitoring and Verification: A variety of monitoring tools are currently applicable, being the preferred option the time lapse 3D seismic. Observation wells equipped with sampling capabilities or sensors are also a tool, but expensive and adding conduits for CO2 migration.
The nature of surface and subsurface property rights varies around the world, and the
ownership to store CO2 will need to be based on various models. As an example, the
subsoil in the US is mainly privately owned, while in Europe belongs to the States and
is operated under license.
In Australia, it is estimated that about 3.4 MMton/y of CO2 will be injected underground at Gorgon and more than 120 MMton over the life of the project, involving the injection of more than three times as much CO2 than any other greenhouse gas storage project worldwide. Gas from the offshore fields supplying the Gorgon Project contains on average about 14% of CO2. The Gorgon Joint Venture will capture the CO2, compresses, transport and inject it via multiple deviated injection wells into the Dupuy Saline Formation sands 2000 m deep under the Barrow Island‘s central eastern coast. The project also sets some precedents being the world‘s first to be subject to specific greenhouse gas storage legislation. It is also the first to undergo detailed environmental impact assessment including public review and comment, and will set new standards in the public availability of monitoring data. The nature of surface and subsurface property rights varies around the world, and the ownership to store CO2 will need to be based o various models. As an example, the subsoil in the US is mainly privately owned, while in Europe belongs to the States and is operated under license.
2.4 Scale that requires ad-hoc solutions
98
The industry has been seeking to first develop single large and good quality4 reservoirs in a close proximity to existing infrastructure. However, scale has always been an issue to address while planning new gas developments. Moreover, large scale of several already developed associated gas fields was also a condition due to the lack of flexibility as production volumes were tied to oil dynamics. As long as the finding of those fields has become more difficult, the industry has been also addressing a wide spectrum of reservoirs, within a variety of scales. The clustering of several small scale fields and the segmentation of the development of massive fields were the general approach followed by the industry. Flexible or modular designs are key elements to address the challenges posed by scale, both in the investment and operational phases. Even when, the need of technical ad-hoc solutions is generally related to small scale projects due to the need to find a minimum size to justify investments; transportation and marketing conditions also pose challenges to large scale projects, especially for those which their final size is uncertain. It is a common feature for large scale projects, the long period of time elapsing from discovery to production. About 12 super-giants fields (> 1 TCM) out of 20 were developed worldwide. For most of them, more than 10 years elapsed from discovery to production. Only few, Groningen and Hassi R‘Mel, started producing only about 4 years after they were discovered. In the Netherlands, Groningen field has an extension of 900 km2 and a massive 3 TCM of recoverable reserves. Since its discovery in 1959 it has been instrumental in teaching how to rationally exploit such a vast resource. The huge size of the discovery led the developers to concentrate production through clusters of closely spaced wells, each cluster with a single treatment plant and control centre. Production started in 1963 with a few clusters of about six wells each. There are now about 300 wells spread over 30 clusters and producing 34 BCM/y (3.4 Bcf/y). The use of extended reach wells from cluster points was pioneered at Groningen and the identification of the many faults within the complex, was key to delineate the drilling pattern, in order to dedicate specific wells to low pressure zones. By the late 1980s, about 50% of the recoverable reserves of the field had been produced, using natural depletion mechanisms. By then, a compression-driven system was applied to assist production. In the future, extra compression systems may be needed in order to effectively deplete as much as possible of the resources in place. The world‘s largest non-associated gas field (North Field/South Pars complex) with estimated 38 TCM of proven reserves is being developed by segments. North Field is planned to have 16 phases and South Pars, 30. By 2015, total planned production is expected to reach 500 BCM/y (50 Bcf/d), of which around 50% will be devoted to LNG exports. On a worldwide basis; LNG is the main technological break-trough enabling the access to market for large scale remote fields. As of today, it is the solution of choice for the marketing of natural gas for large distances, representing around 10% of total natural gas consumption. First established in 1964 in Algeria by Sonatrach; LNG had a sizable start after the oil crisis of the seventies. While most of the peaks of the cycles were synchronized with high oil
4 Basically, high porosity and permeability reservoirs with low o zero contaminants within methane.
99
prices, technology also played a role, as since the 1990s there were advances that allowed for the increases in efficiency and costs reductions along the whole chain. Worldwide, LNG is expected to remain as a key enabling factor for very large scale projects and clusters of smaller fields in remote areas; adding value by the diversification of sources of gas for global markets and new options. For example, FLNG vessels are expected to provide flexibility for operators, as it can be refurbished and redeployed if reserves at a gas field turn out to be lower than expected, or a second floater can be brought if reserves are expected to be higher or other fields are discovered in the area. Under the concept of gas-to-markets, other technologies are also adopted or proposed, including Compressed Natural Gas (CNG). Other methods involve the transformation of methane in liquid fuels or liquid chemicals. Gas to liquid fuels (GTL) global production is around 300 kbd (with the gas needed counting for around 1% of global natural gas market), including Shell‘s Qatar Pearl project. GTL is now under consideration as a potential alternative in the North American market, for which oil to gas price spreads are expected to remain wider for longer. Traditional gas pipelines are also a mean for both, already developed areas and new areas under development. For the latter, the shaping of the gas industry in eastern Russia is currently conceived as a system of gas trunk lines in the Krasnoyarsk Krai, Irkutsk, Yakutia, and Kamchatka.
100
3. SECTION II – Unconventional Gas Developments
3.1 Basics There is no agreed definition of unconventional gas, though it now usually refers to gas resources which unlikely classical reservoirs are not confined by geological discrete boundaries, are regional in extent, not buoyant upon water, and subject to abnormal pressures. In terms of endowment, unconventional natural gas is usually classified into natural gas from dense rocks (tight-sands5 and shale gas), coal bed methane and methane hydrates6. Conventional resources exist in discrete reservoirs, with variable geological characteristics, among which, permeability values. By contrast, unconventional resources are found in large accumulations –including large sandstone formations-. In particular, those large accumulations in dense rocks (tight-sands and shale gas) are characterized by very low permeability and recovery factors; below 0.1 mD and ranging 15% to 30%, respectively. Exploration, appraisal and production techniques, including horizontal drilling, pad drilling, and fracs using water and chemical additives are conventional and have been used across the oil and gas industry for many decades. What has changed is that these techniques have become progressively more advanced and cost efficient; together with the rapid pace of adopting and integrating innovative features in all of them. Indeed, it is estimated that in less than 10 years the industry combined and improved all the different needed technology. This is a very rapid cycle compared with the usual longer lead times for the adoption of new technology by the O&G industry. Shale gas gained global attention due to its rapid developments by the second half of the last decade in the United States, which certainly granted the transformation of the U. S. gas market from scarcity to abundance; however, it should be regarded as one among the range of unconventional types of accumulations. In the United States; tight gas, CBM and shale gas have developed differently. Historically, tight gas has been the most significant source of unconventional gas production in the United States. Tight gas have been producing for about 40 years while CBM for about 30 years – with substantial growth during the 90s-, representing around 38% and 8% of the United States gas production in 2010, respectively. Even when, both can continue be developed economically; their developments have been displaced during the second half of the last decade by those undertaken in shale plays.
5 Tight gas resources are started to be deemed as part of the conventional category, particularly in the United States. The actual production volumes from tight gas are not differentiated from that produced from conventional reservoirs in many countries. 6 Among unconventional natural gas sources, methane hydrates ranks below gas from dense rocks and coal-bed methane, mainly due to incomplete assessment, immature technology and expected poor economics. So far, it is expected that its supply potential will not be realized in a meaningful size before 2020. The fact that the alternative unconventional sources are also deemed to be massive as those of gas hydrates but easily accessible and producible are contributing to downgrade and postpone the potential impact on supply of the gas hydrates before 2020.
101
Prior to 2005 US shale gas constituted only 4% of natural gas production in the country. The incredibly large and widespread geologic base and the pace of massive drilling are the main reasons for the continuous growth in production, which became 23% in 2010. Most shale gas systems have an associate shale oil system which are most common in marine systems; consequently, shale oil are increasingly recognized and subject to be appraised and developed even before gas sections, due to the usual better economics that oil renders compared to natural gas. According to the experience in the United States, the shale oil rocks are precursor to the best shale gas rocks. Basic criteria to identify prospective unconventional gas targets, is as follow:
3.1.1 Tight Sands Gas The tight reservoir rocks tend to be much older –many were originally deposited during the Paleozoic era more than 250 million years ago- and typically lack the thick layers of porous and permeable sands that characterize the reservoirs in younger Tertiary basins. In practical terms, tight gas formations are characterized by low permeability, with a maximum usually at 0.1 mD7. Generically, they are found in two groups: basin-centered continuous gas accumulations and low permeability reservoirs in conventional traps. Tight sands are complex and usually discontinuous an compartmentalized. Very subtle differences in properties can result in large changes in production potential among intervals. The so called sweet spots are areas having better reservoir properties which translate into better production potential. Differently than in shales; in tight sands reservoirs, gas is found exclusively in the pore space, the initial gas in place can be calculated and recovery can be estimated upon the geometry of fractures. Basic Criteria:
Tight sands formations having a thickness exceeding 100 meters within a large area with low density of population.
Thermal maturity over 0.8% Ro.
Over-pressured.
3.1.2 Shale Gas Gas in shale rocks is present in matrix storage, adsorbed onto organic particles, or within fractures. The geological model addresses thickness, depth and structural complexity on both a basin and a localized scale. High quality seismic greatly improves the lateral placement, avoiding hazards such as faults. Shale gas plays cover thousands of square miles but have better intervals inside, the so-called sweet spots. Although shale dry holes are almost nonexistent, commercial success depends on finding the right rock and applying the right technology. Basic Criteria:
Thickness exceeding 50 meters within a large area with low density of population.
Structural settings: extensional settings exhibit better conditions than compressional ones. Faulting must be avoided. Offshore areas are so far excluded.
7 The limit could be commonly accepted due to the fact that the U.S. Gas Policy Act of 1978 required in-situ gas permeability to be equal or less than 0.1 mD for a reservoir to qualify as a tight gas.
102
Petrography: high composition of non-clay minerals. Marine shales tend to have a higher content of brittle material, such as carbonates, feldspars and quartz. Shales deposited in non-marine settings tend to be higher in clay more ductile and less responsive to hydraulic stimulation.
High TOC contain (more than 2% wt).
Thermal maturity over 1.1 % Ro. Higher thermal maturity settings also lead to the presence of nanopores.
Deeper shale gas is harder to access but provides better flow rates due to higher pressure.
Legacy wells having logs to assess characteristics.
Areas with overpressure and with higher than average temperature gradients, which enable higher concentration of gas, are also relevant factors. ·
Natural fracture intensity aids the fracing process, which works most effectively when artificial fractures created intersect with existing natural fractures in the shale.
3.1.3 Coalbed Methane
Coal bed formations are very large in surface and have huge potential to serve as permanent sites for storage of CO2. Injection of CO2 to displace methane gas from the coal seams has been tested as mean of enhancing gas production. Basic Criteria:
Thickness exceeding 10 meters.
Depth lower than 2000 meters.
Evidence of gas in coal by desorption data.
Variable permeability
Able to de-water coals for production.
EUR‘S of thermogenic gas CBM wells are better than those of biogenic gas.
3.1.4 Methane Hydrates Gas hydrates are found within and under permafrost in arctic regions. They are also found within a few hundred meters of the seafloor on continental slopes and in deep seas and lakes. The reservoir architecture, technology needs, an economic viability will be different from marine environment compared to Arctic. So far, Arctic gas hydrate reservoirs are deemed to be of higher quality than those in marine environment, as some important Arctic accumulations have good porosity and good gas saturation, and are predominantly found in coarse sands that have high intrinsic permeability. Overlying permafrost may provide a low permeability barrier to gas leakage during extraction. These factors are favorable for production. Even when, there is a hypothesis that some fields in West Siberia had produced methane coming from hydrates (v. g. Messoyakha), there are no commercial developments so far on a worldwide basis. There are different technologies of gas production from hydrates under development based on three methods and their combinations: depressurization of reservoirs, heat injection and chemical inhibition. The resources in Alaska North Slope were assessed under the depressurization technique, which appears to be the most promising method, according to the USGS. The cost of natural
103
gas production from hydrates is strongly dependent on production/well which is ultimate dependent on the geological structure and hydrate content of the reservoir.
3.2 Regulation – General Framework The success of unconventional gas developments in the U. S. -with positive impact on both, activity and production- has generated interest to assimilate the enabling factors and to remove stumbling blocks on a worldwide basis. Many companies are acquiring acreage internationally to position themselves, even under uncertain regulatory and low price environments. Much of the current regulatory regimes –on a worldwide basis- were designed for conventional oil and gas developments and did not fully contemplate the unique nature of unconventional geology and its implications on development phases. Unconventional plays are gas accumulations, covering very large continuous areas, with massive volumes of gas in place, but much lower recovery factors compared to conventional reservoirs. Depths of prospective unconventional gas range from relatively shallow (around 500 m) to very deep (around 5000 m). While regulators are looking to tap the unconventional potential for their jurisdictions; they are following two broad approaches to set a proper framework:
1) to draft entirely a new tailored set of rules; or 2) to adapt existing regulations covering conventional developments.
In any case; certainty and completeness of the framework should be granted. Due to the different frameworks already in-place, the different approaches followed, and the current evolving status for the many jurisdictions on a worldwide scope; in this section we do not provide neither a complete and exhaustive coverage of the different legislations in-place, nor a theoretical model of reference; but we are aiming at identifying and discussing the critical issues to be considered.
3.2.1 Access to resources Basically, it refers to granting the rights to explore, to appraise and to develop the potential volumes of hydrocarbons contained in unconventional plays of certain acreage under a new licensing process; or by providing an ad-hoc framework for unconventional tracks inside already assigned licenses for conventional developments. Unconventional developments compared to conventional ones are based on a larger acreage and a longer production profile. The large number of wells needed to develop certain acreage requires a longer period of licensing. This longer period of licensing should be granted by the authority subject to investment commitments. Due to the heterogeneous potential of the plays, investment commitments should be set upon physical units and the total license length could be divided in sub-periods, with the option of entering in the successive phases granted to the license holder according to the results of precedent investments. Due to the different expected success factors per well among the same play, partnership with governments and large consumers such as large public utilities in order to diversify geological risk and to mitigate market uncertainty should also be contemplated. Even considering that sustained investments in drilling are needed along the entire period of the license in order to arrest steep decline rates of initial production per well and to develop the entire acreage as well, the sanctity of contractual terms and market prices and volumes should be granted. This is also motivated by the fact that the recovery of the investments are
104
subject to the diversification of acreage among several prospective plays, rather than on a single development.
3.2.2 Declaration of Commerciality, Entitlement and Quantification of reserves As for conventional licensing, the rights to entitle the reserves should be clearly set contractually, basically upon the declaration of commerciality. The particular issue for unconventional is the need to apply probabilistic methods to quantify proved reserves and to evaluate the technical and economic feasibility of the undertakings. While typical current mandates to collect data aiming at estimate material balances of gas in place are impractical –for most of the unconventional cases-; probabilistic methods should be applied based on the results of the wells drilled, but difficulties remain. Upon encountering a prospect for an accumulation sequence of hydrocarbons in place, the exploration licensee should communicate the results and the appraisal plan to the regulatory body for approval. Preliminary, type well EUR multiplied by number of wells planned to be drilled to produce the hydrocarbons hold in the acreage could be the initial approach; estimating the EUR of the type well based on statistical analysis of empirical large samples of the previous analogous wells. However, the main difficulty is to set the analog requirements as EUR mainly depends on drilling, completion and operating conditions, which could evolve according to previous results. In other words, the volume of recoverable gas per wells and per fracture stages is the more relevant metric in evaluating future applicable well spacing and completion techniques that could be different from previous wells and will determine ultimate recovery volumes –which, ex post are the actual reserves-. If the appraisal program proves successful, commerciality should be declared in order to clear the development phase according to a development plan to be agreed and revised periodically following drilling results.
3.2.3 Prices and Economics Return on investments in unconventional developments, are more uncertain than conventional ones, due to their statistical component; rendering commodity price mechanisms and, in particular, the absolute level of prices; together with fiscal incentives (royalties and taxes), key enabling factors to encourage continues flow of new investments along the entire cycle of development –which is also a difference compared to conventional cases where investments are more intensive in the initial phases of the project. This is particularly important for jurisdictions where prices are regulated below costs; in any form of subsidies to consumers, set on a political or social basis or addressing the need to cap increasing energy costs. Regarding fiscal incentives, a sensible approach should be to regard unconventional developments as any large green-field investment, as per its geological nature of being large continuous accumulations with heterogeneous petro-chemical and physical composition. In this sense, charging lower royalties and taxes at the initial phases and increasing them once producers enter developing phases could prove effective. It is worth noting that fiscal incentives are considered to have been one key enabler for the massive unconventional drilling in the United States. Indeed; producers, especially the smaller ones, are being benefited with tax exemptions where, among other benefits; typically
105
c. 70% of the well cost is considered intangible and 100% tax deductible trough depreciation, and lease purchases amounts and their associated expenses are also 100% deductible trough cost depletion. Moreover, in order to encourage the companies to fast track development and increase production volumes, an incremental scale of prices and better fiscal regime could also be applicable. When needed; regulatory authorities should consider fiscal incentives to attract service companies and equipment providers, especially for the initial phases.
3.2.4 Infrastructure to market Access to existing infrastructure –for both, processing and transportation- should be granted at regulated tariffs, when applicable. The need to develop new infrastructure will call for proper enablers such as: a) the allowance of infrastructure investments to be offset against royalties and other taxes, or b) the acceleration of amortization in order to reduce the income tax base at the beginning of the project. However, fiscal incentives could prove not enough to justify both, upstream and logistics investments, rendering gas price level the ultimate factor to realize developments.
3.3 Environmental Issues The oil and gas production is a highly regulated sector for all jurisdiction, worldwide. In the United States where unconventional massive developments started; drilling, including fracking, has been regulated by States; while water issues are regulated by the Environmental Protection Agency (EPA). Generically, drilling and completion operations for unconventional gas wells may be considerably more disruptive to environment than conventional oil and gas drilling. Extended periods of virtually continuous activity at a site will be necessary, moving equipment and several services. Growing public concerns about environmental risks of unconventional operations and their impact on local communities is one of the biggest threats to developments and hence, to production growth from unconventional gas accumulations. Clear and uniform environmental regulation should be the better way to identify and manage the real risks to environment. Even when the issues involved –being the most important: land use, drilling and fracking approvals, well integrity, frac fluids disclosure, water management - sourcing and disposal or water-, methane emissions- are conceptually diverse and heterogeneous in terms of applicable procedures; a single window environmental regulatory agency will be convenient as it better organize all the topics around each undertaking, reduces bureaucracy and oversight costs; for both the regulator and the companies involved.
3.3.1 Land Use Mainly refers to well spacing. In the conventional sphere, for some jurisdictions – particularly in North America-, wells are drilled in a defined spacing area. The areas vary subtly between jurisdictions, but generally is 1 square mile (640 acres).
106
Generally accepted practice is to allow one well per spacing area. In particular, in order to reduce surface impact, it is now typical to drill from multiwall pads. Some pads have included 35 wells, extending horizontally sometimes more than 1800 meters from the wellhead. These wells have been multiple fractured with a propagation length around 100+ meters / fracture, being the result a complex-fractured formation with thousands of drainage paths. Fixed spacing rules developed for conventional gas do not fit for unconventional developments, but optimal well spacing is required to efficiently develop unconventional gas, as it has implications on environment and efficiently and orderly development. However, there is no a-priori approach to determine the optimal well spacing, neither by operators nor by regulators as fracture effectiveness is unknown due to the unknown rock characteristics and it is believed that there is a minimal or no production from outside the area of influence of each fracture stage. Consequently; regulation should contemplate flexible spacing to accommodate technological advances in drilling or to increase recovery factors by infill drilling. For instance, already determined boundaries; should be subject to revision upon application of a production development plan by the operator of certain acreage.
3.3.2 Drilling and Fracturing approvals, Frac fluids disclosure Contamination of drinking water is a key concern, focused on the hydraulic fracturing process and its potential to contaminate aquifers. The fracturing process entails the pumping of fracture fluids or slickwater; which is compounded primarily –around 99.5%- by water plus sand proppant with a small proportion –around 0.5%- by chemical additives. Additives vary as a function of the rock to be fractured. While there has been concern about the transparency of information on the composition of chemicals, progress has been made on disclosing the components8 although the precise formulae remain proprietary. The fractures occur thousands of feet below freshwater aquifers and extend no more about 400 feet upwards; making unlikely to reach the aquifers. In the United States, the Congress is examining several bill proposals aiming at increasing control over fraccing operations. A ban on fracturing should imply a ban on drilling since this technique today is used in close to 90% of all wells drilled in the country; consequently, a federal ban imposition will be unlikely. The Environmental Protection Agency (EPA) with oversight on water matters is conducting a study on the issue, with preliminary conclusions expected in late 2012 and a final report due in 2014. Even when a federal ban is unlikely, it is expected that best practices to be endorsed by both regulators and the industry will increase environmental and compliance costs.
8 V.g. See ―FracFocus‖ www.fracfocus.org . The website is a joint project of the Ground Water Protection Council and the
Interstate Oil and Gas Compact Commission of the United States. The intention is to provide the public with objective information on hydraulic fracturing by including updated information of the regulation in each State. The public information portion of the website interfaces directly with the well fracturing information uploaded by the operators. This allows the public to see what chemicals are being used in well sites near their property.
107
On the other side, France was the first country in the world to outlaw hydraulic fracturing in shale drilling on June 21, 2011.
3.3.3 Well Integrity Although there are geological differences between the various shale gas plays, and drilling practices vary among operators, there are commonalities in shale gas well designs; especially to eliminate the risk of the contamination of drinking water due to the hydraulic fracturing process and its potential to contaminate aquifers. In the United States, the surface casing depth is dictated by local regulation and is intended to case off and isolate fresh water sands. In the United States, the surface casing depth is dictated by local regulation and is intended to case off and isolate aquifers. Shale gas formation targets are generally located several thousand feet –ranging 6000 to 10000 feet- below the deepest potential aquifer. The intermediate casing is then frequently set above the kick-off point in the cap rock above the shale interval. When possible, this casing string is sometimes omitted as operators gain experience and when there are more stable formations located above the shale interval. A horizontal lateral is then drilled through the target shale interval and the production casing run and cemented trough the total deviated length. The lateral is perforated and fractured in multiple consecutive stages.
3.3.4 Water Management The storage and disposal of produced water and the water and chemicals used during the well development are potential sources of water contamination. Proper management of the entire cycle of the use and disposal of water and other material at the surface –including chemicals and mud- are critical to address the public concerns. More than 100000 barrels of water may be pumped into a single typical well with c. 10 fracture stages during the completion process, as each fracturing stage can involve around 10000 barrels (1600 cubic meters). Shale gas wells could have more than 20 fracture stages and some wells were drilled with more than 50 stages. Due to the large quantities needed; the availability of water and its disposal after the use are critical issues. For this reason, recycling is a two-purpose solution; however it is not applicable entirely. Pad drilling is better suit for recycling due to logistics. Slick-water used in new wells can be composed of about 20% recycled flow-back water, since the mixture needs to be diluted in fresh water to reduce salinity. Typically, around 50% of the fracture fluids is returned, this fluid together with formation water must be disposed. While direct discharge is usually ban, waste water that is not recycled is currently trucked to temporary water treatment in order to be disposed, usually by injected the volumes into a deep saline aquifer through disposal wells.
3.3.5 Methane Emissions As the fracturing process is completed, fluids used and small fractions of gas return to the surface as initial flow-back. In general, the production facilities design for early development phases are not able to capture the gas from the initial flow-back. While the development of the play matures, the operators usually evolve to ―green completions‖ to capture the natural gas released during the flow-back phase by using portable equipment.
108
3.4 Risk Assessment During the last decades of the 20s century, the O&G industry has focused on finding remaining traps of conventional hydrocarbons. Since the beginning of this century and due to the massive volumes of unconventional resources and their distribution on very large areas; there is another focus towards ―finding proper conditions to produce‖. The common basic trait of unconventional developments is that risk to find is almost nil -indeed, unconventional plays have minimal to non existence ―dry hole‖ risk-. However; in certain cases, pilot projects were not followed by developments; due to suboptimal expected economics. When development is decided, there is the need of very extensive and massive drilling due to the heterogeneous production profile per well, even in the same play. This is especially applicable for shale gas plays. Indeed commercial production of shale gas requires numerous wells to intersect the gas bearing formation with multiple fracturing works to opening the natural fractures of the matrix or to creating new ones as pathways by which the natural gas can flow to the wellbore. Complex characteristics of the rocks introduce difficulties in predicting gas in place (GIP), flow regimes per well and recovery factors; rendering conventional reservoir modeling not applicable for unconventional gas plays, in particular shale gas plays. Consequently, a decision to proceed with commercial developments is the result of specific exploration and appraisal activity which could last, in theory, around 1.5 to 3 years. Full scale commercial production, if pursued, would commence at the end of this time-line; and could take another 2 years, depending on the area. However, the actual pace of developments present wide variations and is largely dependent on rock complexity and technical success; together with local circumstances and market conditions. Even when the undertakings are characterized by low finding risk, the high degree of the many uncertainties at all stages of developments call for the application of management tools usually developed under the concept of risk assessment.
3.4.1 Phases A. Exploration phase, which is conducted to mitigate geological uncertainties. Early exploration involves activities to identify the gas resources; mainly including, land acquisition and land use agreements, permitting; and the initial geophysical, geochemical and seismic surveys to map the extent of the formations and its geological features, such as faults or discontinuities that may impact the potential of the reservoir. The second stage of exploration involves activities to investigate the rock properties, mainly involving interpretation of data collected via initial vertical wells. B. Appraisal phase, which is conducted to mitigate risks associated with production potential volumes and development costs. Early appraisal usually involves drilling of initial horizontal wells to characterize the matrix the rock as a reservoir- to plan both the proper horizontal lengths and the fracturing geometry of the wells. The second stage of appraisal involves the activities to demonstrate commercial parameters by drilling of multiple horizontal wells as part of pilot producing tests to optimize completion
109
techniques. Effectiveness of hydraulic fracturing determines production rates, drainage, and ultimate recovery per well. C. Development phase still bears risks associated to both, below ground and above ground factors. The below ground uncertainties, which are much more complex compared to conventional plays are related to the ramp-up and the leveling of production at the targeted plateau –by addressing decline in already drilled wells and factoring-in the production curve of new wells which could differ from the previous ones-. The above ground uncertainties relates to the need of adequate infrastructure for treatment and transport of both, produced dry gas and NGLs; and also relates to market factors, prices and volumes. Considering that sweet-spots have not been predicted yet before multiple pilots and some development drilling, establishing economic feasibility will demand the drilling of additional wells to plan full scale commercial developments and to optimize costs and volume recoveries. During commercial development; some companies often adopt a ―manufacturing‖ style of development in order to achieve cost savings with efficiency gains by the modularization and standardization of the simultaneous operations, particularly, via pad completions bearing an increasing number of wells per pads and an increasing number of fractures per wells. In any case, the most important objectives for maximizing production –which only comes from the fracs are the proper placement of the well and the proper azimuth and length of the lateral to place the fracs jobs within its mechanical and economic limits. Productions results per well are extremely variable. On the other hand; in order to improve capital discipline, other companies operate more selectively, by setting a pre-drilling optimal development plan -in terms of sweet-spots identification, well location, and completion techniques selection-. In both cases, applying a learning curve approach with the objective of maximizing overall gas production while minimizing the cost per frac, is the main purpose of detecting the reasons of poor results and modifying future drilling plans accordingly. Every shale play has its own learning curve and each phase of development go through their own learning curve for each play: Geology & geophysics, drilling & completion and logistics & infrastructure. To illustrate, IT TOOK MORE THAN 20 YEARS TO REACH PRODUCTION LEVEL OF 0.5 BCF/D IN BARNETT; COMPARED TO FAYETTEVILLE, FOR WHICH LESS THAN 3 YEARS WERE NECESSARY. MORE DRAMATICALLY, IN ONLY ONE YEAR, GAS PRODUCTION IN HAYNESVILLE SHALE INCREASED FROM 0.25 TO 2.75 BCFD.
3.4.2 Economic Evaluation Techniques Unconventional plays are statistical in nature due to the heterogeneous geological characteristics of the different plays and within each play itself. This is a fundamental fact for estimating economic value and production potential of the plays as the production performance of the wells show wide variations from well to well, even for wells within narrow distances in the same play.
110
Indeed, the average number of wells required to drain 1 TCF (30 BCM) in mature shale gas plays show large variations among the different rocks: from 1200 wells/TCF in Barnett to 100 wells/TCF in Horn River; and around 200 wells/TCF in Marcellus. The comparison is partially limited due to improvement of completion techniques with the passing of time that favored Horn River and Marcellus, but still valid, due to the wide variation among results. So far, shale gas developments has been approached as statistical plays, for which the economic evaluation is preliminary simplified by estimating the production curve for the type well of the play –for which, initial production and first year decline are the key parameters-; and, expecting that the average of the actual curve is better than the estimated type well. The current practice is to analyze historical records in developed areas and to derive production curves by assuming analogical performance in terms of: 1) rock characteristics, for both the matrix and the natural fractures, and 2) drilling and completion techniques, for induced fracture complexity. However, the type curve estimates are challenged by the oversimplification in the estimates of the initial production and first year decline, the rough estimate of the typical late performance and due to the fact that advanced techniques were only introduced during the last decade and have been improving dramatically since 2005. Shale plays are statistical in nature and a single well result does not make or break the play. The potential to overcome initial bad results is also valid. Higher variability of results, often leads to higher risking of the play. In practice, the challenge is to go through the initial steps, for which investments –initial wells, logistics and infrastructure- are relatively higher than in future phases. Learning curve approach should be applied to improve overall results, dealing with poor individual results as an opportunity to innovate. For this reason, building a statistically representative sample of results and creating repeatability by testing one variable at a time, is the base for the better placing of wells and fracs in successive campaigns. Efficiency gains had a key role for reducing supply costs. Indeed, gas production in the United States increased even since the beginning of 2009, compared with the abrupt decline of rigs drilling for gas from about 1500 to 700 recorded by the time. Efficiency gains come from many fronts; in particular, the number of feet drilled/well, the longer laterals evolving from 1800 to 4000 feet from 2006 to today and the fracture stages per well evolving from 4 to 10 from 2006 to today in representative cases. In addition, operators have shortened total drilling times drastically from around 3 to 6 weeks in early phases to 15 days today. Many E&P companies in the United States are now shifting their exploration focus from shale dry gas plays to shale and tight oil plays and shale and tight liquid reach gas plays; in particular, since 2009. Replicating the story beyond North America will not be rapid as shale lean gas plays require the identification of the right rocks; together with available infrastructure, services and favorable prices to spur developments. Moreover, beyond the United States, there is a need to drill a much higher number of wells in each prospective play to properly assess the potential success and to set a ranking of preferences among the many plays which are identified on a global basis, and from country to country.
111
3.5 Regional Overview
3.5.1 United States
After a decade of stagnation, natural gas production in the United States increased by almost 20% between 2006 and 2010, reaching 760 BCM/y in 2010, the highest level since 1973. Production has continued to increase despite a significant and sustained decline in natural gas prices since mid-2008. The growth is largely the result of increases in production from shale gas formations, which reached 140 BCM/y in 2010 (or 20% of domestic production). In 2010 prices at Henry Hub averaged 4.4 us$/MMbtu, close to the level a decade earlier after adjustment for inflation. On an energy-equivalent basis, natural gas has traded at a deep discount to oil over the last several years with oil prices more than 3 times higher than natural gas prices. According to the United States Energy Information Administration U.S. DOE, unconventional natural gas production up to 2020 will increase mainly due to the shale plays. Indeed, tight sand and coal bed methane, are expected to keep production plateau of around 200 BCM/y, while shale gas potential could vary from a low estimate of 140 BCM/y to a highest case of 420 BCM/y. There are several uncertainties around shale developments, being the most relevant those related to the geological parameters. Indeed, two key determinants of the estimated technically recoverable shale gas resource base are the estimated ultimate recover (EUR) per well and the recovery factor that is used to estimate how much of the acreage of the plays contain recoverable natural gas.
3.5.2 Beyond United States The U. S. DOE released the Initial Assessment of 48 shale gas basins in 32 selected countries, containing 70 shale gas formations; covering the most prospective shale gas resources that demonstrate a minimum level of near-term promise and for basins that have a sufficient amount of geologic data for resource assessment. The map 1 shows the location of these basins and the regions analyzed. The map legend indicates four different that correspond to the geographic scope of this initial assessment:
Red colored areas represent the location of assessed shale gas basins for which estimates of the ‗risked‘ gas-in-place and technically recoverable resources were provided.
Yellow colored area represents the location of shale gas basins that were reviewed, but for which estimates were not provided, mainly due to the lack of data necessary to conduct the assessment.
White colored countries are those for which at least one shale gas basin was considered for this report.
Gray colored countries are those for which no shale gas basins were considered for this report.
For the 70 shale formations, the initial estimate of risked technically recoverable resources is 5760 TCF. Adding the estimate of shale gas resources in U. S., a total resource base of 6600 TCF is assessed. To put this shale gas resource estimate in perspective, world proven reserves of natural gas as of January 1, 2010 are about 6,609 TCF.
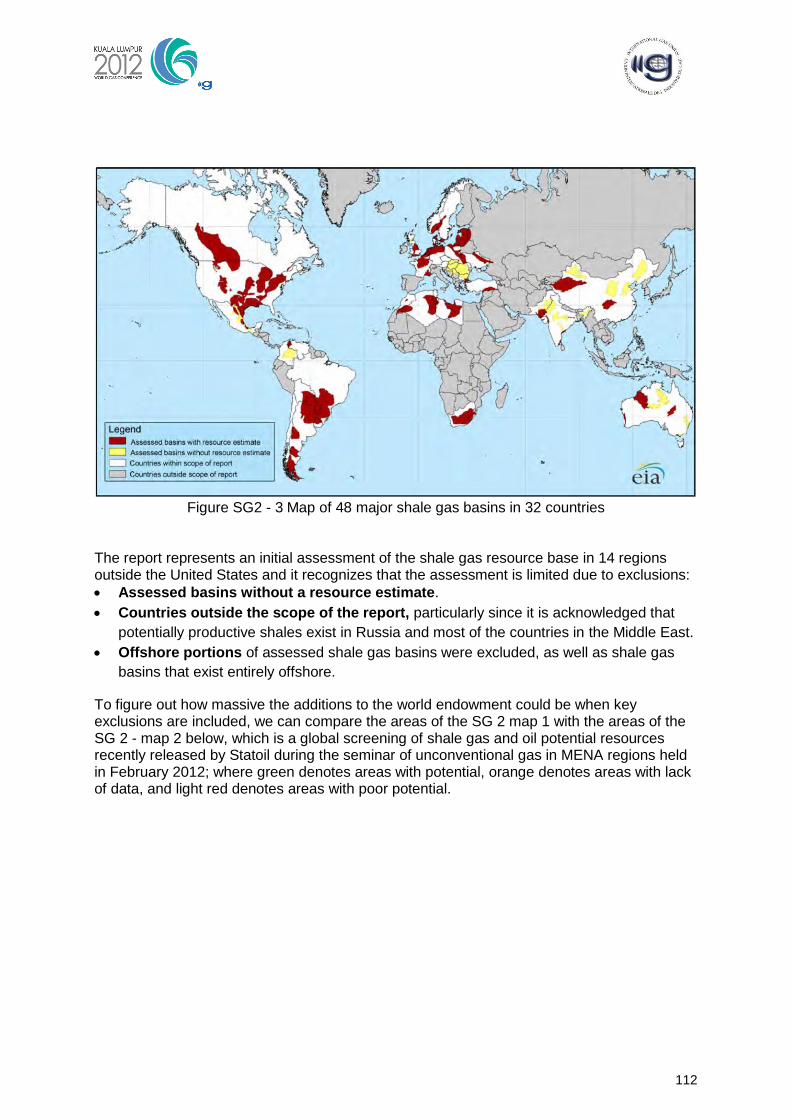
112
Figure SG2 - 3 Map of 48 major shale gas basins in 32 countries
The report represents an initial assessment of the shale gas resource base in 14 regions outside the United States and it recognizes that the assessment is limited due to exclusions:
Assessed basins without a resource estimate.
Countries outside the scope of the report, particularly since it is acknowledged that
potentially productive shales exist in Russia and most of the countries in the Middle East.
Offshore portions of assessed shale gas basins were excluded, as well as shale gas
basins that exist entirely offshore.
To figure out how massive the additions to the world endowment could be when key exclusions are included, we can compare the areas of the SG 2 map 1 with the areas of the SG 2 - map 2 below, which is a global screening of shale gas and oil potential resources recently released by Statoil during the seminar of unconventional gas in MENA regions held in February 2012; where green denotes areas with potential, orange denotes areas with lack of data, and light red denotes areas with poor potential.
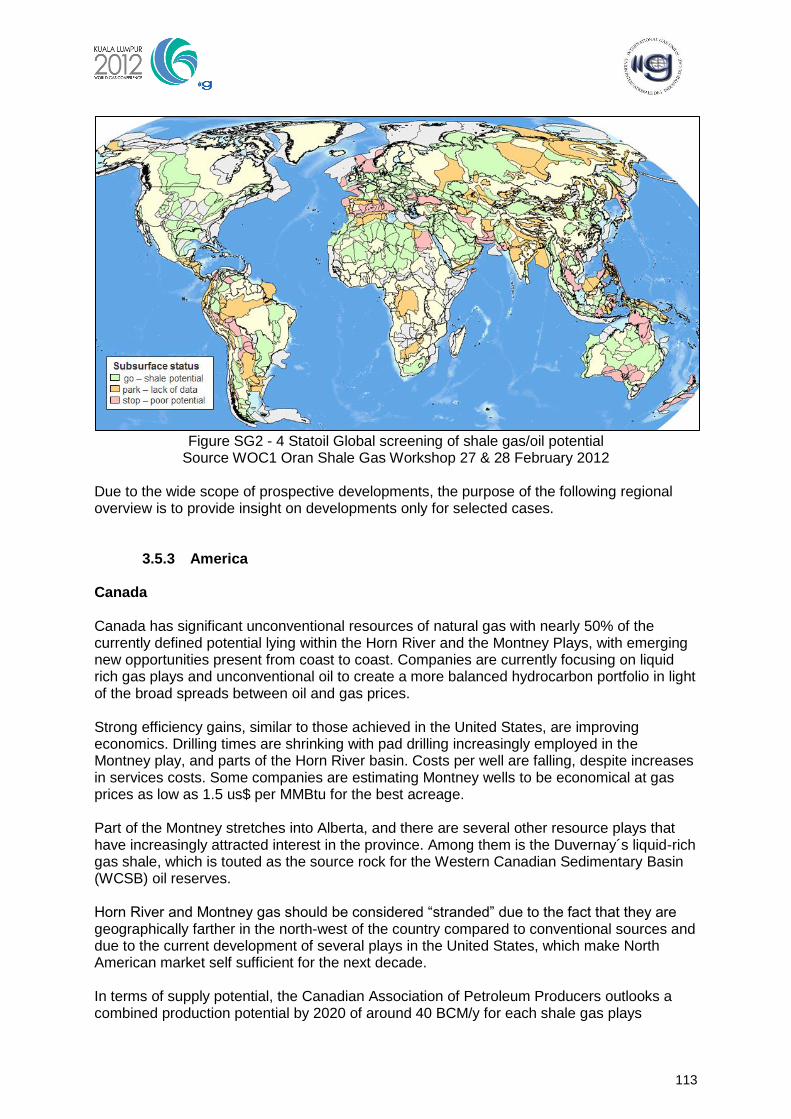
113
Figure SG2 - 4 Statoil Global screening of shale gas/oil potential
Source WOC1 Oran Shale Gas Workshop 27 & 28 February 2012 Due to the wide scope of prospective developments, the purpose of the following regional overview is to provide insight on developments only for selected cases.
3.5.3 America Canada Canada has significant unconventional resources of natural gas with nearly 50% of the currently defined potential lying within the Horn River and the Montney Plays, with emerging new opportunities present from coast to coast. Companies are currently focusing on liquid rich gas plays and unconventional oil to create a more balanced hydrocarbon portfolio in light of the broad spreads between oil and gas prices. Strong efficiency gains, similar to those achieved in the United States, are improving economics. Drilling times are shrinking with pad drilling increasingly employed in the Montney play, and parts of the Horn River basin. Costs per well are falling, despite increases in services costs. Some companies are estimating Montney wells to be economical at gas prices as low as 1.5 us$ per MMBtu for the best acreage. Part of the Montney stretches into Alberta, and there are several other resource plays that have increasingly attracted interest in the province. Among them is the Duvernay´s liquid-rich gas shale, which is touted as the source rock for the Western Canadian Sedimentary Basin (WCSB) oil reserves. Horn River and Montney gas should be considered ―stranded‖ due to the fact that they are geographically farther in the north-west of the country compared to conventional sources and due to the current development of several plays in the United States, which make North American market self sufficient for the next decade. In terms of supply potential, the Canadian Association of Petroleum Producers outlooks a combined production potential by 2020 of around 40 BCM/y for each shale gas plays
114
Montney and Horn River-; which more than compensates the expected decline of the domestic conventional production. Argentina A decade long price caps makes the country a gas importer. Domestic wellhead gas prices are regulated according market segments, being around 1 us$/MMbtu for residential. While exploratory upside potential remains for both, oil and gas; the prospects for unconventional gas face the challenge of higher thresholds than regulated prices. Since late 2008, around 50 projects have already been approved to receive price exceptions, most of them for deep drilling and tight sands. During 2010 they accounted for around 5% of total gas production in the country. The most advanced shale projects in Argentina are in the Neuquén Basin, at the center west of the country, but even these plays remain at the early phase. Two formations have the better potential:
Vaca Muerta: which is an overpressured Siliceous Marl; and has excellent conditions including, TOC between 3% to 5%, over 30000 km2 of extension and net thickness over 300 meters. Repsol/YPF estimates that 1500 million barrels of oil equivalent resources could be recovered from an appraised acreage of 1100 km2.
Los Molles: which is deemed to have been the second most prolific source rock in the Basin, also presents favorable conditions for developments with an average thickness of between 150 and 200 meters.
3.5.4 Europe Around fifty companies are involved in exploration activities in Europe; however, there is consensus that unconventional developments in Europe are unlikely to render a significant contribution to gas supply until 2020 at the earliest; whit an indicative estimate of high supply potential limited to around 10 BCM/y. Production phases will also be challenged by the following factors:
Limited access to land: mainly due to population density, which is 100 to 200 hab. /km2 in Europe compared to 30 hab./km2 in the United States.
Geology: the combined favourable characteristics of the plays in the United States, are not easily found in Europe. In particular, the large continuous unstructured accumulations of the United States compares with smaller and more complex European plays. There is often also a high level of heterogeneity within plays –on a small scale basis-. These challenges are limiting factors as drive research and data gathering to be addressed.
Water management: mainly due the inadequate infrastructure to transport water to the drilling sites, disposing of waste water and competition with other uses. This factor could be overcome with recent trends towards the using of saline water and recycling.
Limited equipment especially rigs, and service providers: mainly affecting initial developments.
Infrastructure to market: due to the fact that the grid density vary considerably, from the European maximum of 45 km of pipeline / 1000 km2 in UK to the European minimum of 1 km of pipeline / 1000 km2 in Sweden, which compare with 62 km of pipeline / 1000 km2 in the United States.
115
Substantial gas shale resources are likely to be placed in the North Sea, offshore; for which many constraint that apply to onshore developments do not apply. However, threshold prices to justify investments are estimated to be much higher than those onshore and below current market prices. Poland is at the center of gas shales developments in Europe, with around 60 thousand sq. km of licensed acreage for unconventional developments. A dozen of companies have committed to explore the resources and to drill around 120 test wells in the coming years. It is estimated that potential shale gas plays are present at depths of 1200 to 2500 meters in the northern part of the Baltic Sea basin, and at depths of 2500 to 4500 meters in the southern part. Due to the depth, costs of wells would be over 6 million us$. Contrary to other European countries which restricted fracking as France and Germany, Poland is expected to clear the way towards its acceptance. Poland is considered the leading case in Europe particularly attractive due to the need to move out from gas import dependence and to move away from coal-based power generation; however and despite the potential, first works started very recently by mid-2010 and full developments are expected to mature not before the next decade.
116
3.5.5 North Africa
Ghadames (Berkine) is a large extensional basin underlying eastern Algeria, southern Tunisia and western Libya; in which, recent conventional oil field discoveries have helped boost oil and natural gas production in Algeria and Tunisia. The basin contains two major organic-rich shale formations that were mapped to establish prospective areas. Exploration activity is underway; particularly, Cygam Energy has acquired 3 million acres and IOCS signed cooperation deals with Sonatrach to look at shale developments, including drilling of pilot well.
3.5.6 Asia China Resources of unconventional gas in China are deemed to be huge, at around 80 TCM. Tight gas sands (12 TCM): Tight gas sands developments are focused in Ordos and Sichuan basins. Sulige gas field, located in the north central area of the Ordos Basin, with gas resources in place of around 2.5 TCM is the largest onshore gas field in China. It was discovered in 2000 and was developed to a capacity of 5 BCM/y and it has a production potential of around 23 BCM/y by 2015. Shale gas (31 TCM): Shale gas developments have been included in the China´s 12th five year plan; for which, it is expected that 30 areas will be identified, proving reserves for around 1 TCM and production potential of around 30 BCM/y by 2015. India India is a country of interest for unconventional gas developments, due to its rapidly growing gas markets and due to its increasing dependency on LNG imports. CBM gas resources are estimated to be 3.4 TCM. Current production levels are very low (0.05 BCM/y); but potential for increase is high as a total of 33 CBM Blocks are due to be awarded in 4 Rounds. The target is to reach around 2 BCM/y by 2015. Several basins in India –including: Cambay, Gondwana, Cauvery, Damodhar, Assam-Arakan, Bengal- are known to hold shale gas resources. However, the country faces hurdles related to dense population, land acquisition, availability of water and pollution of lands.
3.5.7 Australia Unconventional gas is dominated by coal seams gas, which currently represents around 25% of Australian gas production. By the end of 2010 and early 2011, the two first world coal seam gas to LNG projects have been sanctioned and are under construction in the east coast, where the industry is relatively more mature than in the rest of the country. Even when CSG to LNG has never been done before, the prospects look appealing as technology is proven. However, the scale is unprecedented: BG approved a 15 billion us$

117
8.5 million ton/y to be developed by its subsidiary Queensland Gas Company and Santos led consortium gave the go ahead for a 16 billion us$ project. With recovery expected to average 2 – 5 bcf/well, BG estimates to drill more than 2000 wells by start-up in 2014 and around 6000 wells in aggregate for the two trains. Logistics and services coordination will be the key challenge for success. Tight sands and, specially, shale gas is today frontier exploration, for which concepts have yet to be proven. The shale gas potential is enormous, as much as 400 TCF of recoverable resources. The focus during the next 2 years will be to understand whether any of this gas can technically be produced. Cooper and Perth basins are best understood and there is existing production infrastructure.
118
References AFDB; AU. Oil and Gas in Africa – Supplement to the African development report. African Development Bank and the African Union. Oxford University Press, Oxford, 2009. AFRICA Investment Review. Petrobras to start exploration offshore Tanzania in September. AIR, July 2011. Available at: <http://www.africainvestmentreview.com/2011/07/petrobras-to-start-exploration-offshore-tanzania-in-september/ >. 2011 AHLBRANDT, Thomas S.; CHARPENTIER, Ronald R.; KLETT, T.R., SCHMOKER, James W.; SCHENK Christopher J. Analysis of assessment results: US Geological Surveyworld Petroleum assessment – Description and Results. U.S. Geological Survey Digital Data Series 60, 2000. ANADARKO Petroleum Corporation. Anadarko announces another major appraisal success offshore Mozambique. Anadarko News Releases. January, 2012. Available at: < http://www.anadarko.com/Investor/Pages/NewsReleases/NewsReleases.aspx?release-id=1648484 >. 2012. ANADARKO Petroleum Corporation. Anadarko Announces Discovery Offshore Mozambique. Anadarko News Releases. February, 2011. Available at: <http://www.anadarko.com/Investor/Pages/NewsReleases/NewsReleases.aspx?release-id=1525180>. 2011. ANADARKO Petroleum Corporation. Anadarko Announces First Deepwater Discovery Offshore Mozambique. Anadarko News Releases. February, 2010. Available at: <http://www.anadarko.com/Investor/Pages/NewsReleases/NewsReleases.aspx?release-id=1525180>. 2010. ARABIANBUSINESS.COM. Saudis celebrate new gas field. Arabianbusiness.com, January 2007. Available at: <http://m.arabianbusiness.com/saudis-celebrate-new-gas-field-214795.html>. 2007 ASTAKHOVA, Olesya; MAITRE, Marie. Shtokman's gas final investment decision delayed. Reuters. 2011 2011/12/29, (Reuters.com) ARPS, J. J. Analysis of decline curves. Trans. AIME, [S.l.], v. 160, p 228-247, 1945. Arthur H. Johnson, Global Resource Potential of Gas Hydrate, Search and Discovery Article #80183 (2011) August 31, 2011 BIRD, Kenneth J. et al. Circum-Arctic Resource Appraisal: Estimates of Undiscovered Oil and Gas North of the Arctic Circle. U.S. Department of the Interior, U.S. Geological Survey, 2008. Federal Institute for Geosciences and Natural Resources (BGR): Reserves, Resources and Availability of Energy Resources 2010 BRITISH PETROLEUM. BP statistical Review of World Energy 2011. London, UK. June 2011. Available at: < www.bp.com/statisticalreview>. 2011 BURTON, Edward. Saudi Arabia aims to bolster offshore oil and gas program. Offshore; September 1, 2009. Available at: <http://www.offshore-mag.com/articles/print/volume-69/issue-9/middle-east/saudi-arabia-aims.html>. 2009
119
CHEVRON CORPORATION. Caspian Pipeline Consortium Marks the Groundbreaking for its $5.4 Billion Expansion. Chevron Press Release, July 2011. Available at: <http://www.chevron.com/chevron/pressreleases/article/06302011_caspianpipelineconsortiummarksthegroundbreakingforits54billionexpansion.news>. 2011 DARMAN, Nasir Haji; HARUN, Abd Rahman B. Technical challenges and solutions on natural gas development in Malaysia, Beijing. In: WORKSHOP OF THE CHINA – SICHUAN BASIN, 4., 2006, Beijing, China. Proceedings… Beijing: PETRONAS, 2006. DRUMMOND, K. J. Northern Canada Distribution of Ultimate Oil and Gas Resources, prepared for Northern Oil and Gas Branch, Indian and Northern Affairs Canada. Drummond Consulting, 2009. ECONFIN. Kenya: feu vert pour Total et pour Tullow. Agency Ecofin,October 2011. Available at : <http://www.agenceecofin.com/hydrocarbures/1010-1672-kenya-feu-vert-pour-total-et-pour-tullow>. 2011 EUROGAS STATISTICAL REPORT 2010 EXXON MOBIL CORPORATION. Gorgon. Available at: <http://www.exxonmobil.com/Australia-English/PA/about_what_wa_gorgon.aspx>. FONTEVECCHIA, Agustino. Shell's East African Natural Gas Bet: $1.6B Bid For Cove Energy. Forbes, February 2012. Available at: <http://www.forbes.com/sites/afontevecchia/2012/02/22/shells-east-african-natural-gas-bet-bids-1-6b-for-cove-energy/>. 2012 GAUTIER, Donald L. et. al. Assessment of Undiscovered Oil and Gas in the Arctic. Science, May 29, 2009, Volume 324, page 1175 - 1179. GAZPROM. Yamal Mega Project Brochure. Available at: <http://www.gazprom.com/f/posts/25/697739/book_my_eng_1.pdf>. 2011. GOVERNMENT of Western Australia. LNG in Western Australia. Factsheet. Department of State Development. Updated March, 2011 – DMPFEB11_1144. 2011. Available at: < http://www.dsd.wa.gov.au/documents/100790_DSD_LNG_Fact_Sheet_(2).pdf > GRAY, David; ROBERTS, Graham; HEAD, Kim. Recent advances in determination of fracture strike and crack density from P-wave seismic data. The Leading Edge, [S.l.], p. 280-285, Mar. 2002. DOEJEIA-0484(20ll); International Energy Outlook 2011, September 2011 IHS. IHS Annual Supplement 2010 Discoveries & Highlights. IHS International Oil letter, January 2011 H-H. Rogner, AN ASSESSMENT OF WORLD HYDROCARBON RESOURCES, 1997
Holditch & Ayers, How Technology Will Expand the Development of Unconventional Gas, Worlwide, 2010 ILK, D. et al. Production analysis in unconventional reservoirs: diagnostics, challenges, and methodologies. In: NORTH AMERICAN UNCONVENTIONAL GAS CONFERENCE AND
120
EXHIBITION, 2011, The Woodlands, USA. Proceedings… The Woodlands: SPE, 2011. SPE 144376. INPEX. The world-class Ichthys Project. Available at: <http://www.inpex.com.au/projects/ichthys-project.aspx>. JOHNSON, Ray et al. Evaluating hydraulic fracture effectiveness in a coal seam gas reservoir from surface tiltmeter and microseismic monitoring. In: SPE ANNUAL TECHNICAL CONFERENCE AND EXHIBITION, 2010, Florence, Italy. Proceedings… Florence: SPE, 2010. SPE 133063. KANG Yi-li; LUO Ping-ya. Current status and prospect of key techniques for exploration and production of tight sandstone gas reservoirs in China. Petroleum Exploration and Development, [S.l.], v. 34, n. 2, p. 239-244, 2007. KAWATA, Y.; FUJITA, K. Some predictions of possible unconventional hydrocarbons availability until 2100. In: SPE ASIA PACIFIC OIL AND GAS CONFERENCE AND EXHIBITION, 2001, Jakarta, Indonesia. Proceedings… Jakarta: SPE, 2001. SPE 68755. KOHL, Arthur L.; RIESENFELD, Fred. Gas purification. Houston: Gulf, 1985 KRAMER, Andrew E. Exxon Reaches Arctic Oil Deal With Russians‖, The New York Times Company. Available at: <http://www.nytimes.com/2011/08/31/business/global/exxon-and-rosneft-partner-in-russian-oil-deal.html>. 2011. MAHDI, Wael. Saudi Aramco Ventures Continue Gas Exploration in Saudi Desert, Bloomberg news, 2011-06-06. Available at: <http://www.bloomberg.com>. 2011 MAJOR, Jason. ENERGY: Researchers unveil plans to rescue 'stranded' gas fields. CSIRO, Solve Magazine, June, 2008. Available at: <http://www.solve.csiro.au/0608/article5.htm>. 2008. MA Xin-hua. Natural gas exploration and development situation in Ordos Basin, NW China. Petroleum Exploration and Development, [S.l.], v. 32, no. 4, p. 50-53, 2005. MARTIN, B. J.; EWING, T.E. Ancestral basin architecture: a possible key to the Jurassic Haynesville Trend. Gulf Coast Association of Geological Societies Transactions, [S.l.], v. 59, p. 511-515, 2009. MINERALS Management Service. MMS Chukchi Sea Lease Sale 193 Breaks Energy Records With $2.6 Billion in High Bids. MMS Press Release. Available at: <http://www.mms.gov/ooc/press/2008/press0206.htm>. 2008 NPC Resource Study: Crude Oil and Natural Gas Resources and Supply, September 15, 2011 NOBLE Energy. Noble energy fact sheet, 2012. Available at: <http://www.nobleenergyinc.com>. 2012 OBULUTSA, George. Dominion says signs PSC deal for Kenya oil block. Reuters, May 2011, Available at: < http://uk.reuters.com/article/2011/05/17/kenya-exploration-idUKWEA185820110517>. 2011.
121
OGL Editors. Aramco discovers gas with Kassab-1 well‖, Oil and Gas journal, September 2006. Available at: < http://www.ogj.com/articles/2006/09/aramco-discovers-gas-with-kassab-1-well.html >. 2006 OIL and Gas Eurasia. SOCAR Raises Shah Deniz Gas Reserve Estimate to 1.2 Trln BCM. Oil and Gas Eurasia, September 2007. Available at: <http://www.oilandgaseurasia.com/news/p/0/news/1146>. 2007 OIL and Gas Journal. Shtokman partners delay production start. Available at: <http://www.ogj.com/articles/2010/02/shtokman-partners.html>. 2010. OILVOICE. Statoil Consider New LNG Plant at Melkøya, OilVoice. Available at: <www.oilvoice.com>. 2011 ORIGIN Energy. Origin and Apache complete agreement for offshore Kenya exploration. Origin Media release, June 2011. Available at: <http://www.originenergy.com.au/news/article/asxmedia-releases/1309>. 2011 OFFSHORE Technology.com. Poseidon gas field Australia. 2011. Available at: <http://www.offshore-technology.com/projects/poseidon-gas-field/>. 2011. PETROHAWK. Operations: Haynesville and Bossier Shale. Louisiana, May 2010. PILISI, N. et al. Selecting drilling technologies and methods for tight gas sand reservoirs. In: IADC/SPE DRILLING CONFERENCE, 2010, New Orleans, USA. Proceedings… New Orleans: IADC/SPE, 2010. IADC/SPE, 128191. RUPPEL, Stephen C.; LOUCKS, Robert G. Black Mudrocks: lessons and questions from the Mississippian Barnett Shale in the Southern Midcontinent. The Sedimentary Record, [S.l.], p. 4-8, June 2008. SAUDI Aramco. Saudi Aramco Annual review, 2010. SAUDI Aramco News. Gas, Oil Discoveries Announced. Aramco expats, January 2009. Available at: <http://www.aramcoexpats.com/articles/2009/01/gas-oil-discoveries-announced/>. 2009 SEALE, R. et al. Multistage fracturing system: improving operational efficiency and production. In: SPE EASTERN REGIONAL MEETING, 2006, Canton, USA. Proceedings…Canton: SPE, 2006. SPE 104557. STOCKMARKETWIRE. Cairn reveals disappointing results offshore Greenland. Available at: <http://www.stockmarketwire.com/article/4220004/Cairn-reveals-disappointing-results-offshore-Greenland.html/>. 2011. STRATFOR.COM's Global Intelligence Update. The tip of the iceberg: energy from the Arctic. Available at: <http://atimes.com/c-asia/BG21Ag02.html>. 2000. S. Old, Chevron USA Inc.; S.A. Holditch, SPE; W.B. Ayers, SPE; D.A. McVay, SPE, Texas A&M University , PRISE: Petroleum Resource Investigation Summary and Evaluation, SPE 117703, 2008
122
TANG Lizhang. Oil and gas potential in West Sichuan Basin. Natural Gas Industry, [S.l.], v. 24, no. 7, p. 5-8, 2004. THEMIG, Dan. New technologies enhance efficiency of horizontal: multistage fracturing. Journal of Petroleum Technology, [S.l.], p. 26-31, Apr. 2011. THOMAS, Charles P.; NORTH, Walter B.; DOUGHTY, Tom C.; HITE, David M. Alaska North Slope Oil and Gas: A promising Future or an Area in Decline? Addendum Report, DOE / NETL 2009 / 1385. National Energy Technology Laboratory. 2009 THOMAS, Mark. Unlocking the Arctic: E&P industry warms to the challenge. ROGTEC Magazine, [S.l.], Sept. 5, 2011. THOMAS, Mark. Fast Track Frontiers. EPmag, May 2011. Available at: <http://www.epmag.com/Production-Drilling/Fast-Track-Frontiers_83042>. 2011 TOTAL S.A. Azerbaijan: Total makes a major gas discovery in the Caspian Sea. Total news, September 2011. Available at: <http://www.total.com/en/about-total/news/news-940500.html&idActu=2636>. 2011 WALLS, Joel D. Digital rock physics provides new insight into shale reservoir quality. EPmag.com, Houston, Aug. 1, 2011. WATERS, George et al. Simultaneous hydraulic fracturing of adjacent horizontal wells in the Woodford Shale. In: SPE HYDRAULIC FRACTURING TECHNOLOGY CONFERENCE, 2009, The Woodlands, USA. Proceedings… The Woodlands: SPE, 2009. SPE 119635. WATKINS, Eric. Aramco makes oil discovery with Dirwazah well. Oil and Gas journal, February, 2007. Available at: < http://www.ogj.com/articles/2007/02/aramco-makes-oil-discovery-with-dirwazah-well.html >. 2007 WATKINS, Eric. GCA: Turkmenistan's Iolotan gas field is world's second-largest. Oil and Gas Journal, October 2011. Available at: <http://www.ogj.com/articles/2011/10/gca-turkmenistans-iolotan-gas-field-is-worlds-second-largest.html>. 2011 WOOD Mackenzie. The global span of gas discoveries in 2009. Wood Mackensie Upstream Insight, March 2010. WOOD Mackenzie. 2010 - A vintage year for oil and gas exploration. Wood Mackensie Upstream Insight, May 2011. WOOD Mackenzie. The global span of gas discoveries in 2009. Wood Mackenzie Upstream Insight, May 2011. WOOD Mackenzie. Energy Markets Service: analysis covering global energy supply and demand across all fuels. [S.l.], 2012. World Energy Outlook 2011 Special Report: Are we entering a golden age of Gas?, ZHDANNIKOV, Dmitry; Mosolova, Tanya. Russia's Gazprom ups Shtokman reserves to 3.8 tcm. Reuters. 2007.

123
124
Appendix 1: List of Figures
Figure 1: Resource triangle for natural gas ...........................................................................15 Figure 2: Top 20 countries Conventional gas resources .......................................................16 Figure 3: Estimation trend of global unconventional gas resources ......................................18 Figure 4: World natural gas resources by major region, January 2010 (Tcm) .......................18 Figure 5: World natural gas resources by major region, January 2010 (Tcm) .......................20 Figure 6: Proven gas reserves majors ..................................................................................21 Figure 7 Countries Proved gas reserves change 2010 over 2009 ........................................22 Figure 8: Last 20 years Regional proved gas reserves .........................................................22 Figure 9: Top 20 countries Share of total 2010 proved gas reserves ....................................23 Figure 10: 2010 Total proved gas reserves by region ...........................................................23 Figure 11: 2010 regional gas reserves-to-production ratios ..................................................24 Figure 12: Source: Wood Mackenzie 2011 ...........................................................................25 Figure 13: Source: Wood Mackenzie, 2011 ..........................................................................26 Figure 14: Source Wood Mackenzie ―Exploring in an unconventional World‖, 2011 .............27 Figure 15: Source Wood Mackenzie‘s Exploration Trends report, October 2010 ..................27 Figure 16: SLWR (Steel Lazy Wave Riser) ...........................................................................45 Figure 17: FSHR (Free Standing Hybrid Riser) ....................................................................48 Figure 18: Riser Tower .........................................................................................................48 Figure 19: Subsea Riser Buoy ..............................................................................................49 Figure 20: Selection of gas-sweetening processes ...............................................................51 Figure 21: Typical adsorption process diagram ....................................................................52 Figure 22: Process flow diagram of typical natural gas dehydration plant using molecular sieve desiccant and dry gas regeneration.............................................................................53 Figure 24: Process flow diagram of a mechanical refrigeration system .................................54 Figure 25: Typical gas processing plant for Pre-salt FPSO‘s ................................................55 Figure 26: Location of pre-salt fields .....................................................................................57 Figure 27: Location of Shtokman field ..................................................................................60 Figure 28: Shtokman gas and condensate field pre-development scheme ...........................61 Figure 29: Paleogeographic map of the Haynesville Shale ...................................................64 Figure 30: An example of fracture swarms interpreted from 3-D seismic around a very productive vertical well in tight gas sandstones of the Pinedale Field. ..................................65 Figure 31: SEM photomicrograph of nanoscale pore architecture in the Barnett Shale.........66 Figure 32: Diagram of an open-hole completion technique using isolation packers with ball-activated ports in a horizontal well. .......................................................................................68 Figure 33: Microseisimic data from hydraulic fracture stimulations conducted in four Woodford Shale wells. ..........................................................................................................69 Figure 34: Plot of daily gas production rate versus cumulative gas production for Haynesville shale gas wells with varying surface choke sizes (14/64, 24/64, and 28/64 inches). .............70 Figure 35: Pressure distributions for different reservoir permeabilities after 20 years of production adjacent to a horizontal well with eight fracture stimulation stages. .....................71 Figure 36: Tight gas reservoir exploration in China ...............................................................73 Figure 37: Sullige Gas Field Diagram ...................................................................................74 Figure 38: high-precision 2D seismic data ............................................................................75 Figure 39: Diagram of a Gas Gathering Pipeline Network System ........................................76 Figure 40: Separate Layer Fracturing and Commingled Production .....................................77 Figure 41: downhole choke valvue .......................................................................................78 Figure 42: Phase curve of CO2 ............................................................................................80 Figure 43: CO2M is developing an integrated solution for carbon management and is involved in research and development of various parts in the carbon management chain to develop an economical solution ............................................................................................81

125
Figure SG2 – 1 Global Gas Supply and Demand 2000 - 2020 ..............................................85 Figure SG2 – 2 Complexity of Gas E&P Projects .................................................................86 Figure SG2 - 3 Map of 48 major shale gas basins in 32 countries ...................................... 112 Figure SG2 - 4 Statoil Global screening of shale gas/oil potential ....................................... 113
126
Appendix 2: Names of members and countries Amine Mazouzi Algeria Ilhane Dib Algeria Kamel Eddine Chikhi Algeria Flavia Di Cino Argentina Fernando Jorge Bado Argentina Nigel Worsnop Argentina Armando Teruo Hashimote Brazil Bezerra Márcio Félix C. Brazil Celso Silva Brazil Denis Krambeck Dinelli Brazil Eduardo Rizkallah Abdounur Brazil Vitor de Souza Lima Brazil Jiang Tingxue China Yang Dong China Zhang Fudong China Djurekovic Miroslav Croatia Trason Tomas Czech Republic Vincent Trocmé France Gregor Hollmann Germany Jane Curtis Germany Tam Stephen Hong Kong Ir. AT. Budi Prabowo Indonesia Abdul MutalibMasdar Indonesia Ban Iran Hasani Iran Lee Jeong Hwan South Korea Lee Seung Ho South Korea Kyungsick Park South Korea Adif Zulkifli Malaysia Ali Ridzuan Malaysia Jusoh Zamri Malaysia Nasir B. Darman Malaysia Morten Rye-Larsen Norway Steinar Eikaas Norway Rychlicki Stanisław Poland Jagosiak Paweł Poland Laurentiu lonescu Romania Artem Khegay Russia Boris Sharipov Russia Ekaterina Litvinova Russia Elena Drozdova Russia Nikolay Storonsky Russia Oleg Ermilov Russia Sergey Leonov Russia Jozef Levoca Slovak Ortega Dona Luis Spain Fuentes-Cantillana Pablo Spain Ramírez Galán Spain Lewis Anthony UK