Embed Size (px)
DESCRIPTION
2009 Annual Report
Citation preview

Well Positioned for Growth 2009 Annual Report
VISIONSMSC’s vision is to be a leading, global designer of Smart Mixed-Signal ConnectivityTM
solutions that Connect, Control & Create.
MISSIONOur mission is to design market-differentiating mixed-signal connectivity solutions
that enable our customers to be successful while generating attractive returns for
our shareholders and employees.
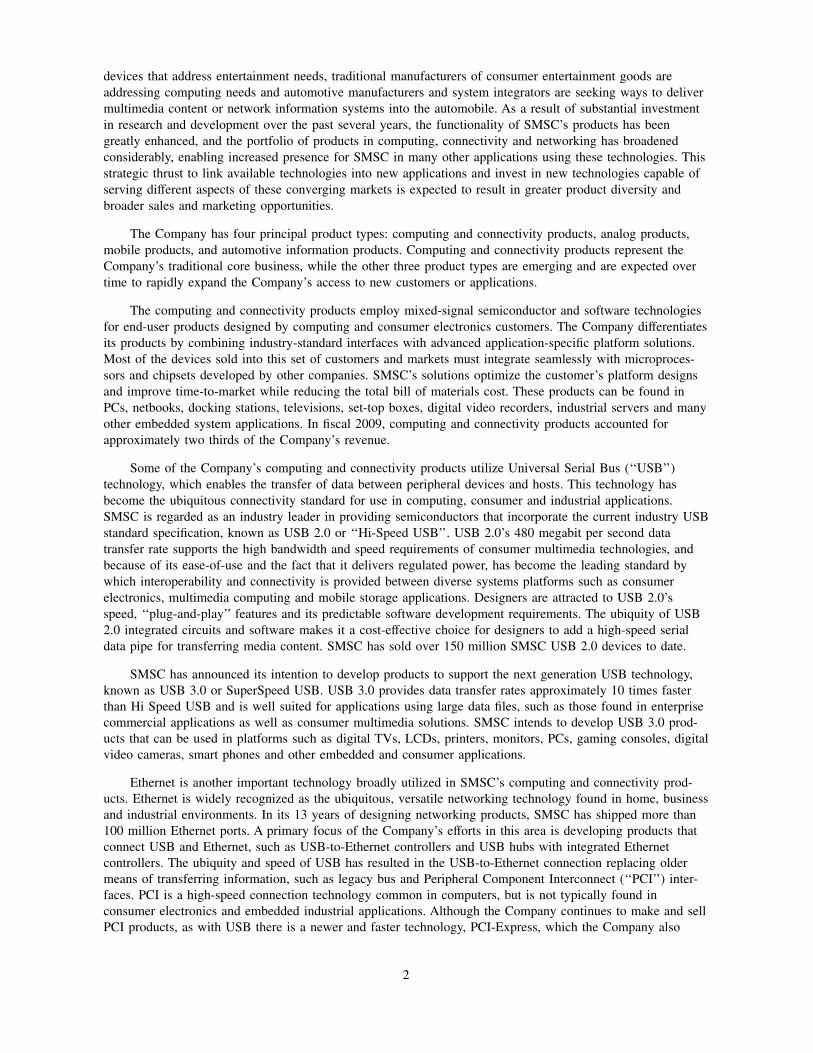
Annual Product Sales* Percentage of Total Revenues
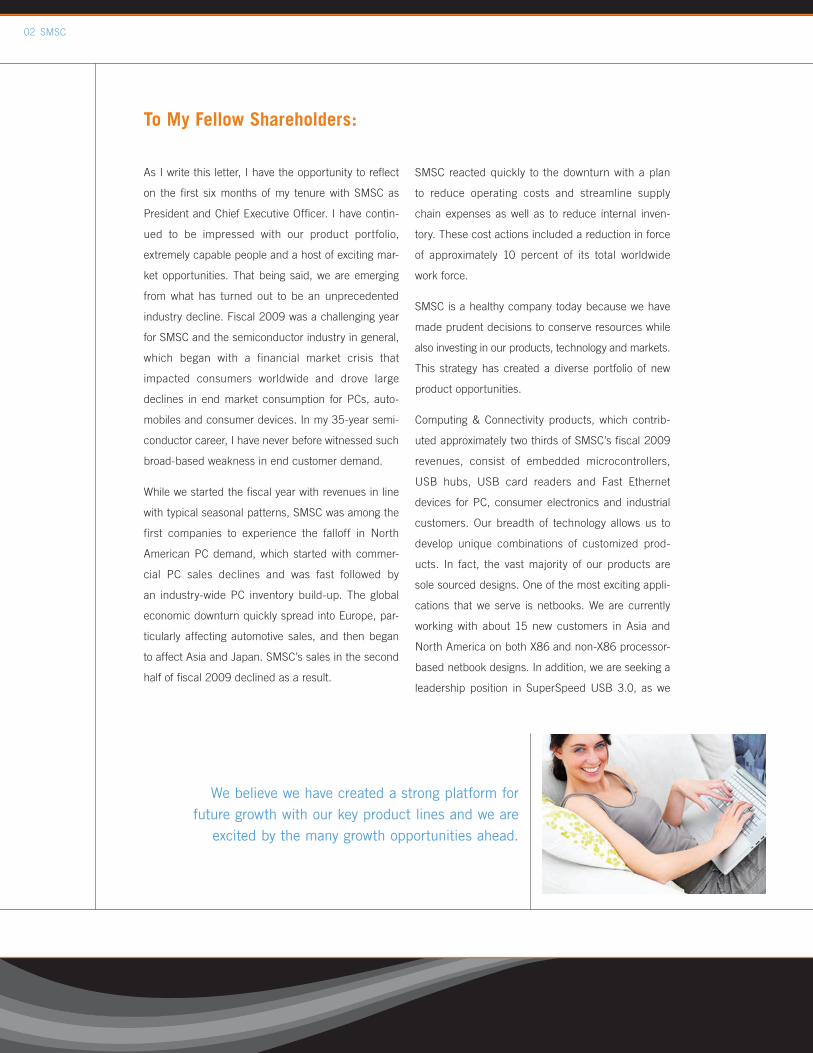
24%
12%
26%
17%
21%
Fiscal 2009
Computing &ConnectivityProducts67% Portable
Products4%
Analog Products10%
Fiscal 2008
Automotive Products16%
Computing &ConnectivityProducts72%
PortableProducts
1%
Analog Products7%
Automotive Products17%
Mobile PCs(Notebooks, Netbooks, etc.)
Desktop PCs(PCs, Work Stations, etc.)
Consumer Electronics(Smart Phones, Digital TVs, etc.)
Automotive(Networking of DVD, Radio,Portable Electronics, etc.)
Industrial & Other(Factory Automation, Servers, etc.)
*Unaudited data; excludes intellectual property revenues

2009 Annual Report 01
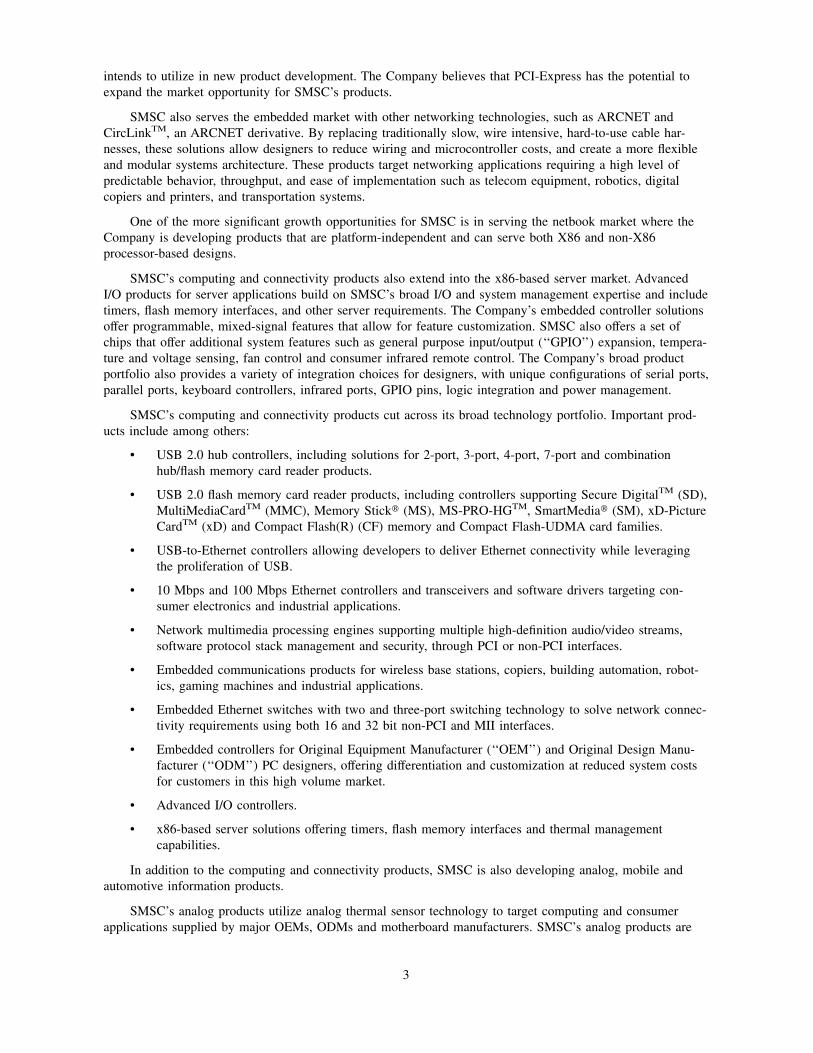
Growth Opportunities
1 Computing & Connectivity Products • X86 and non-X86 netbooks
• New Asian customer opportunities
• USB 2.0 related content
• SuperSpeed USB 3.0
2 Automotive Products • Next generation MOST150
• Video applications
• Broader global penetration
• New TrueAuto™ products
3 Analog Products • High accuracy sensors
• Capacitive sensor products
• Low power thermal management
4 Portable Products • USB subsystems integrating additional functions
• Industry’s smallest footprint ultra low power transceiver
• Reference designs with industry leading processors
02 SMSC
As I write this letter, I have the opportunity to reflect
on the first six months of my tenure with SMSC as
President and Chief Executive Officer. I have contin-
ued to be impressed with our product portfolio,
extremely capable people and a host of exciting mar-
ket opportunities. That being said, we are emerging
from what has turned out to be an unprecedented
industry decline. Fiscal 2009 was a challenging year
for SMSC and the semiconductor industry in general,
which began with a financial market crisis that
impacted consumers worldwide and drove large
declines in end market consumption for PCs, auto-
mobiles and consumer devices. In my 35-year semi-
conductor career, I have never before witnessed such
broad-based weakness in end customer demand.
While we started the fiscal year with revenues in line
with typical seasonal patterns, SMSC was among the
first companies to experience the falloff in North
American PC demand, which started with commer-
cial PC sales declines and was fast followed by
an industry-wide PC inventory build-up. The global
economic downturn quickly spread into Europe, par-
ticularly affecting automotive sales, and then began
to affect Asia and Japan. SMSC’s sales in the second
half of fiscal 2009 declined as a result.
SMSC reacted quickly to the downturn with a plan
to reduce operating costs and streamline supply
chain expenses as well as to reduce internal inven-
tory. These cost actions included a reduction in force
of approximately 10 percent of its total worldwide
work force.
SMSC is a healthy company today because we have
made prudent decisions to conserve resources while
also investing in our products, technology and markets.
This strategy has created a diverse portfolio of new
product opportunities.
Computing & Connectivity products, which contrib-
uted approximately two thirds of SMSC’s fiscal 2009
revenues, consist of embedded microcontrollers,
USB hubs, USB card readers and Fast Ethernet
devices for PC, consumer electronics and industrial
customers. Our breadth of technology allows us to
develop unique combinations of customized prod-
ucts. In fact, the vast majority of our products are
sole sourced designs. One of the most exciting appli-
cations that we serve is netbooks. We are currently
working with about 15 new customers in Asia and
North America on both X86 and non-X86 processor-
based netbook designs. In addition, we are seeking a
leadership position in SuperSpeed USB 3.0, as we
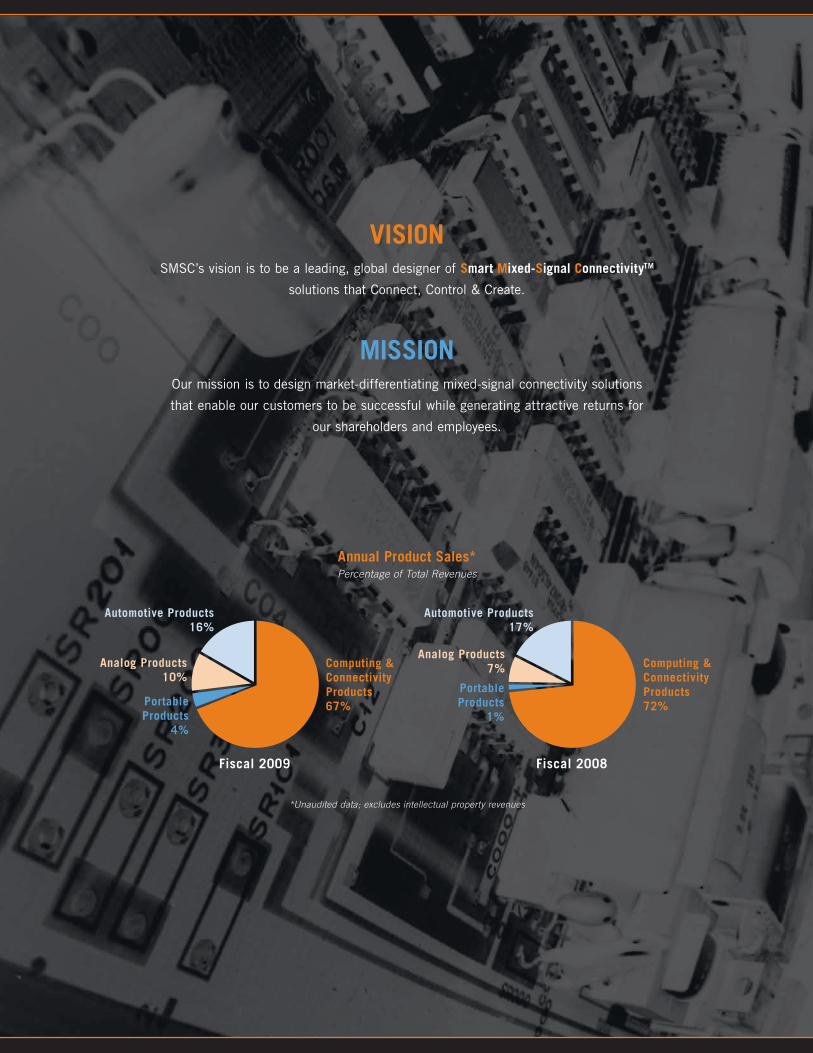
To My Fellow Shareholders:
We believe we have created a strong platform for future growth with our key product lines and we are
excited by the many growth opportunities ahead.
2009 Annual Report 03
have for each of the USB predecessors. We are hard
at work on USB 3.0 and expect to deliver our first
product next calendar year as the technology begins
to be deployed.
SMSC’s Automotive products contributed approxi-
mately 16% of total sales in fiscal 2009 and include
networking technology to enable the transport of
high-bandwidth digital audio, video packet-based
data and control information. This flagship, industry-
leading technology, known as Media Oriented
Systems Transport (MOST®), bridges the gap between
a growing need to introduce more multimedia content
in the car and the means to distribute it among pas-
sengers. Despite the poor health of the automotive
industry, we are seeing strong activity among global
OEMs to upgrade to network approaches and faster
speed grades. Our MOST engineers are very busy
with next generation designs. In particular, MOST150,
our fastest speed grade, is seeing accelerated inter-
est from additional car makers following the initial
adopters of the technology. We are making progress
in all geographies with our MOST technology and
expect to continue to win designs with new OEMs
resulting in broader global penetration.
Our Analog products, which totaled approximately
10% of fiscal 2009 revenues, consist of highly accu-
rate and reliable thermal management solutions that
are primarily designed to support leading PC
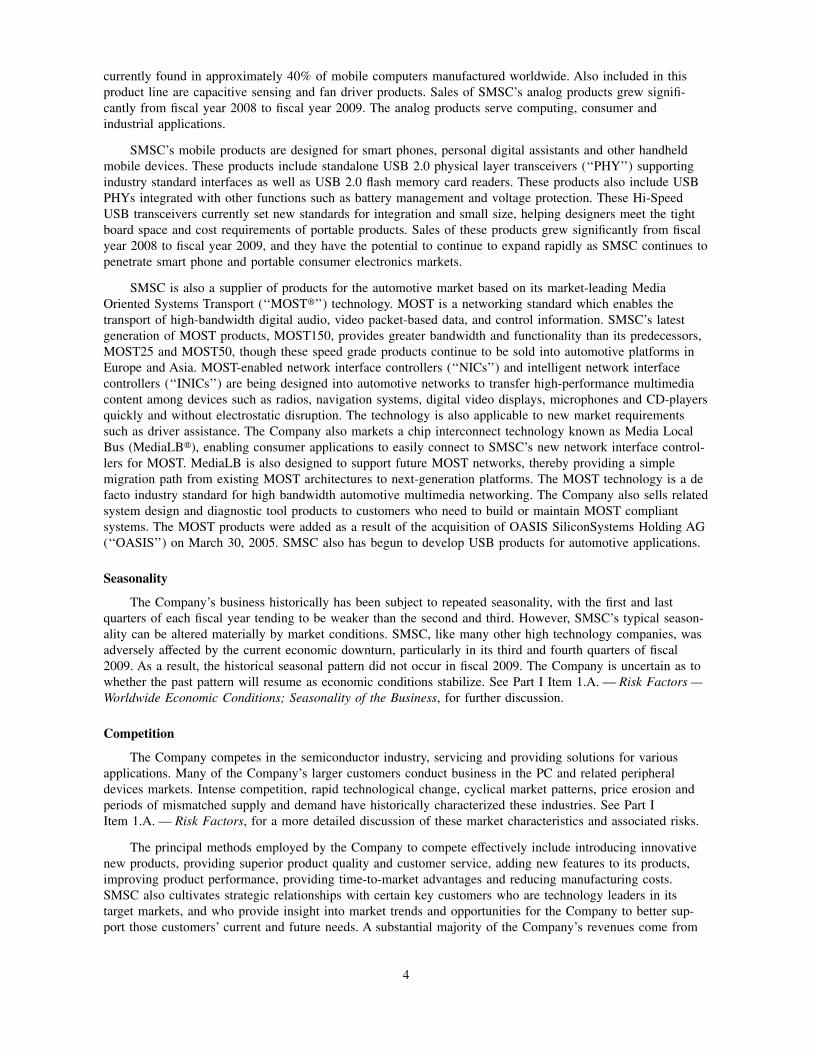
24%
12%
26%
17%
21%
Fiscal 2009
Computing &ConnectivityProducts67% Portable
Products4%
Analog Products10%
Fiscal 2008
Automotive Products16%
Computing &ConnectivityProducts72%
PortableProducts
1%
Analog Products7%
Automotive Products17%
Mobile PCs(Notebooks, Netbooks, etc.)
Desktop PCs(PCs, Work Stations, etc.)
Consumer Electronics(Smart Phones, Digital TVs, etc.)
Automotive(Networking of DVD, Radio,Portable Electronics, etc.)
Industrial & Other(Factory Automation, Servers, etc.)
Fiscal 2009 Vertical Market Revenues* Percentage of Total Revenues
*Unaudited Data
04 SMSC
architectures at advanced process geometries but
also serve industrial and consumer applications. We
expect to see continued improvements in sales for
Analog Products, particularly from notebook and
netbook demand coming largely from Asia. Some
of the products we are most excited about include
our first capacitive sensor solutions, which will start
production in the first quarter of fiscal 2010 and will
initially target mobile PC designs. We will also sample
these sensor products for other vertical markets in
coming quarters.
Finally, SMSC markets a line of Portable products
designed for smart phones, personal digital assistants
and other handheld mobile devices. These products
represented approximately 4% of total sales and this is
expected to be our fastest growing product line in fiscal
2010. Our USB products support a broad range of
standard interfaces. We offer the industry’s smallest
footprint USB transceiver with a vast array of critical
features such as extreme electrostatic discharge, over
voltage protection and battery conservation that allow
customers to design more feature-rich technology into
smaller devices. Today, SMSC’s devices are designed
into approximately 40 different portable designs,
including the Blackberry® Storm™, T-Mobile G-1™
and Sony Ericsson XPERIA™ X1 as well as other por-
table consumer products, including personal naviga-
tion devices and personal media players.
From a financial perspective, we are currently seeing
some signs of business improvement. PC inventories
have returned to healthy levels and some improvement
in end customer demand, particularly for notebooks
and low end PCs, has contributed to healthier ordering
patterns. Activity is currently strong in Asia, particu-
larly in China where the economic stimulus program
is driving greater consumption of products that incor-
porate our solutions. As we kick off fiscal 2010, we
presently expect continued sales improvements com-
pared to our recent low point. These improvements
will be contingent on positive global business trends
continuing as well as some improvement in automo-
tive inventory levels. We are committed to driving an
efficient cost structure and providing increasing value
to our customers through feature integration and
platform differentiation.
At the end of fiscal 2009, SMSC had a strong capital
position with $166.4 million in cash and investments.
The company had no debt and generated $36 million
in cash flow from operations and $18 million in free
cash flow at the end of the fiscal year.
In another key development this past year, Kris
Sennesael joined SMSC as Vice President and Chief
Financial Officer, rounding out our strong and experi-
enced executive team.
In closing, I want to thank our talented and dedicated
employees, our loyal customers, and our supportive
shareholders. I would also like to reiterate that man-
agement is committed to returning the Company to
profitability. Though we had to make some tough
decisions in this past year to reduce cost and insure
the health of our business, we remain committed to
investing in R&D for our future success. We believe
we have created a strong platform for future growth
with our key product lines and we are excited by the
many growth opportunities ahead.
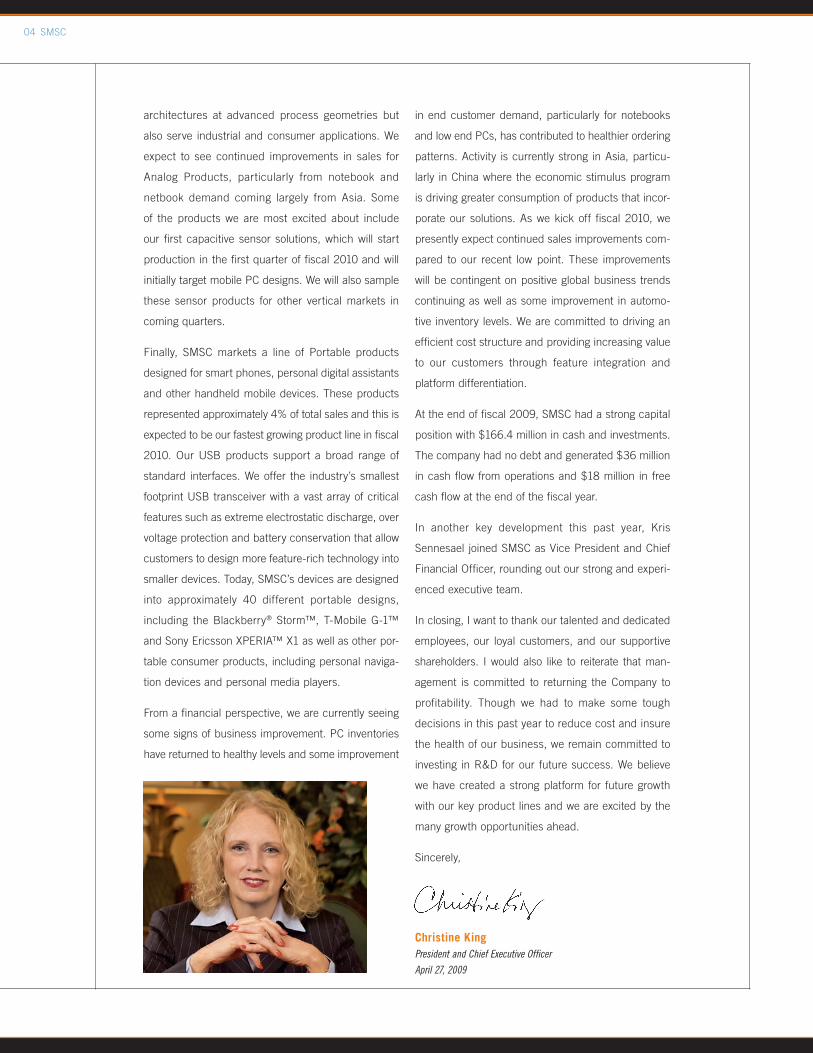
Sincerely,
Christine KingPresident and Chief Executive Officer
April 27, 2009
Financial Information and Form 10-K

UNITED STATESSECURITIES AND EXCHANGE COMMISSION
Washington, D.C. 20549
FORM 10-K
(Mark One)
� ANNUAL REPORT PURSUANT TO SECTION 13 OR 15(d)OF THE SECURITIES EXCHANGE ACT OF 1934
For the fiscal year ended February 28, 2009OR
□ TRANSITION REPORT PURSUANT TO SECTION 13 OR 15(d)OF THE SECURITIES EXCHANGE ACT OF 1934
For the transition period from toCommission file number: 0-7422
STANDARD MICROSYSTEMS CORPORATION(Exact Name of Registrant as Specified in Its Charter)
Delaware 11-2234952(State of Incorporation) (I.R.S. Employer
Identification Number)
80 Arkay DriveHauppauge, New York 11788-3728
(Address of Principal Executive Offices) (Zip Code)
(631) 435-6000(Registrant’s Telephone Number, Including Area Code)
Securities registered pursuant to Section 12(b) of the Act:
Title of Each Class Name of Each Exchange on Which Registered
Common Stock, $.10 par value The NASDAQ Global Select Market*
Securities registered pursuant to Section 12(g) of the Act: None
Indicate by check mark if the registrant is a well-known seasoned issuer, as defined in Rule 405 of the Securities Act.
Yes� No�
Indicate by check mark if the registrant is not required to file reports pursuant to Section 13 or Section 15(d) of the Act.
Yes� No�
Indicate by check mark whether the registrant (1) has filed all reports required to be filed by Section 13 or 15(d) of the
Securities Exchange Act of 1934 during the preceding 12 months (or for such shorter period that the registrant was required to file
such reports), and (2) has been subject to such filing requirements for the past 90 days. Yes� No�
Indicate by check mark if disclosure of delinquent filers pursuant to Item 405 of Regulation S-K (§ 229.405 of this chapter) is
not contained herein, and will not be contained, to the best of the registrant’s knowledge, in definitive proxy or information
statements incorporated by reference in Part III of this Form 10-K or any amendment to this Form 10-K.�
Indicate by check mark whether the registrant is a large accelerated filer, an accelerated filer, a non-accelerated filer, or a smaller
reporting company. See the definitions of ‘‘large accelerated filer,’’ ‘‘accelerated filer’’ and ‘‘smaller reporting company’’ in
Rule 12b-2 of the Exchange Act. (Check one):
Large accelerated filer � Accelerated filer □ Non-accelerated filer □(Do not check if a
smaller reporting company)
Smaller reporting company □
Indicate by check mark whether the registrant is a shell company (as defined in Rule 12b-2 of the Act). Yes� No�
Aggregate market value of voting stock held by non-affiliates of the registrant as of August 31, 2008, based upon the closing
price of the common stock as reported by The NASDAQ Global Select Market* on such date, was approximately $634,161,777
Number of shares of common stock outstanding as of March 31, 2009 21,921,109
DOCUMENTS INCORPORATED BY REFERENCEPortions of the registrant’s Proxy Statement for the 2009 Annual Meeting of Shareholders are incorporated by reference into
Part II and Part III of this report on Form 10-K.

TABLE OF CONTENTS
PART I
Item 1. Business . . . . . . . . . . . . . . . . . . . . . . . . . . . . . . . . . . . . . . . . . . . . . . . . . . . . . . . 1
General Description of the Business . . . . . . . . . . . . . . . . . . . . . . . . . . . . . . . . . . . . 1
Available Information . . . . . . . . . . . . . . . . . . . . . . . . . . . . . . . . . . . . . . . . . . . . . . 1
Principal Products and Markets . . . . . . . . . . . . . . . . . . . . . . . . . . . . . . . . . . . . . . . 1
Seasonality . . . . . . . . . . . . . . . . . . . . . . . . . . . . . . . . . . . . . . . . . . . . . . . . . . . . . 4
Competition . . . . . . . . . . . . . . . . . . . . . . . . . . . . . . . . . . . . . . . . . . . . . . . . . . . . 4
Research and Development . . . . . . . . . . . . . . . . . . . . . . . . . . . . . . . . . . . . . . . . . . 5
Manufacturing . . . . . . . . . . . . . . . . . . . . . . . . . . . . . . . . . . . . . . . . . . . . . . . . . . . 5
Raw Materials . . . . . . . . . . . . . . . . . . . . . . . . . . . . . . . . . . . . . . . . . . . . . . . . . . . 6
Sales, Marketing and Customer Service . . . . . . . . . . . . . . . . . . . . . . . . . . . . . . . . . . 7
Markets and Strategy . . . . . . . . . . . . . . . . . . . . . . . . . . . . . . . . . . . . . . . . . . . . . . 8
Acquisitions . . . . . . . . . . . . . . . . . . . . . . . . . . . . . . . . . . . . . . . . . . . . . . . . . . . . 9
Geographic Information . . . . . . . . . . . . . . . . . . . . . . . . . . . . . . . . . . . . . . . . . . . . 10
Intellectual Property . . . . . . . . . . . . . . . . . . . . . . . . . . . . . . . . . . . . . . . . . . . . . . . 10
Backlog and Customers. . . . . . . . . . . . . . . . . . . . . . . . . . . . . . . . . . . . . . . . . . . . . 10
Employees . . . . . . . . . . . . . . . . . . . . . . . . . . . . . . . . . . . . . . . . . . . . . . . . . . . . . 11
Item 1A. Risk Factors . . . . . . . . . . . . . . . . . . . . . . . . . . . . . . . . . . . . . . . . . . . . . . . . . . . . 12
Item 1B. Unresolved Staff Comments. . . . . . . . . . . . . . . . . . . . . . . . . . . . . . . . . . . . . . . . . . 21
Item 2. Properties . . . . . . . . . . . . . . . . . . . . . . . . . . . . . . . . . . . . . . . . . . . . . . . . . . . . . . 21
Item 3. Legal Proceedings . . . . . . . . . . . . . . . . . . . . . . . . . . . . . . . . . . . . . . . . . . . . . . . . 22
Item 4. Submission of Matters to a Vote of Security Holders . . . . . . . . . . . . . . . . . . . . . . . . . 22
PART II
Item 5. Market for the Registrant’s Common Equity, Related Stockholder Matters and Issuer
Purchases of Equity Securities . . . . . . . . . . . . . . . . . . . . . . . . . . . . . . . . . . . . . . . . 23
Item 6. Selected Financial Data. . . . . . . . . . . . . . . . . . . . . . . . . . . . . . . . . . . . . . . . . . . . . 25
Item 7. Management’s Discussion and Analysis of Financial Condition and Results of
Operations . . . . . . . . . . . . . . . . . . . . . . . . . . . . . . . . . . . . . . . . . . . . . . . . . . . . . 27
Item 7A. Quantitative and Qualitative Disclosures about Market Risk . . . . . . . . . . . . . . . . . . . . 41
Item 8. Financial Statements and Supplementary Data . . . . . . . . . . . . . . . . . . . . . . . . . . . . . 43
Item 9. Changes in and Disagreements with Accountants on Accounting and Financial
Disclosure. . . . . . . . . . . . . . . . . . . . . . . . . . . . . . . . . . . . . . . . . . . . . . . . . . . . . . 43
Item 9A. Controls and Procedures . . . . . . . . . . . . . . . . . . . . . . . . . . . . . . . . . . . . . . . . . . . . 43
Item 9B. Other Information . . . . . . . . . . . . . . . . . . . . . . . . . . . . . . . . . . . . . . . . . . . . . . . . 44
PART III
Item 10. Directors, Executive Officers and Corporate Governance . . . . . . . . . . . . . . . . . . . . . . 45
Item 11. Executive Compensation . . . . . . . . . . . . . . . . . . . . . . . . . . . . . . . . . . . . . . . . . . . . 45
Item 12. Security Ownership of Certain Beneficial Owners and Management and Related
Stockholder Matters . . . . . . . . . . . . . . . . . . . . . . . . . . . . . . . . . . . . . . . . . . . . . . . 45
i

Item 13. Certain Relationships, Related Transactions and Director Independence . . . . . . . . . . . . 45
Item 14. Principal Accountant Fees and Services . . . . . . . . . . . . . . . . . . . . . . . . . . . . . . . . . . 45
SIGNATURES . . . . . . . . . . . . . . . . . . . . . . . . . . . . . . . . . . . . . . . . . . . . . . . . . . . . . . . . . . . 46
PART IV
Item 15. Exhibits and Financial Statement Schedules . . . . . . . . . . . . . . . . . . . . . . . . . . . . . . . 47
ii
PART I
Item 1. — Business
General Description of the Business
Standard Microsystems Corporation (the ‘‘Company’’ or ‘‘SMSC’’), a Delaware corporation founded in
1971, is a leading global designer of Smart Mixed-Signal ConnectivityTM solutions. Its expertise in analog and
mixed-signal processing is applied across a broad set of connection and control technologies including USB,
Ethernet and Media Oriented Systems Transport (MOST�) as well as embedded control and thermal manage-
ment. SMSC’s silicon-based integrated circuits and systems software are incorporated by a globally diverse
customer base in end products in the Consumer Electronics, Automotive, Mobile PC, Desktop PC and Indus-
trial markets. The Company’s expertise in developing application-specific technologies, each designed to
connect, network or monitor systems, allows SMSC to design multi-functional products that address market
requirements for on-the-go and embedded consumer and business applications. SMSC has a long history of
designing products to meet the stringent quality requirements of the market’s leading PC and Automotive
customers. Most of the Company’s products are proprietary designs that serve industry leaders across the
globe, tailoring what are often complex, highly integrated solutions to each of our customer’s exacting
requirements.
SMSC’s business is based on substantial intangible intellectual property assets consisting of patented
technology, access to market technology, extensive experience in integrating designs into systems, the ability
to work closely with customers to solve technology application challenges and develop products that satisfy
market needs, and the ability to efficiently manage its global network of suppliers. These attributes allow
SMSC to provide technical performance, cost, size or time-to-market advantages to its customers and to
develop leadership positions in several technologies and markets.
SMSC has operations in the United States, Germany, Japan, China, Korea, Singapore, and Taiwan. Major
engineering design centers are located in Arizona, New York, Texas and Germany.
Available Information
SMSC’s website address is www.smsc.com. Through the Investor Relations section of our website we
make available, free of charge, our Annual Report on Form 10-K, Quarterly Reports on Form 10-Q, Current
Reports on Form 8-K and any amendments to those reports filed or furnished pursuant to Section 13(a) or
15(d) of the Securities and Exchange Act of 1934 (the ‘‘Exchange Act’’), as well as any filings made pursuant
to Section 16 of the Exchange Act, as soon as reasonably practicable after we electronically file such material
with, or furnish it to, the U.S. Securities and Exchange Commission (the ‘‘SEC’’). Our Internet website and
the information contained therein or incorporated therein are not incorporated into this Annual Report on
Form 10-K.
You may also read and copy materials that we have filed with the SEC at its Public Reference Room
located at 450 Fifth Street, N.E., Washington, D.C. 20549. Please call the Commission at 1-800-SEC-0330 for
further information on the Public Reference Room. In addition, the Commission maintains an Internet site that
contains reports, proxy and information statements, and other information regarding issuers that file electroni-
cally at www.sec.gov.
Principal Products and Markets
SMSC develops its products to serve applications in several vertical markets including Consumer Elec-
tronics, Automotive, Mobile PC, Desktop PC and Industrial markets. Most of the Company’s technologies are
sold into multiple end markets, and its product technologies, intellectual property and proprietary processes are
increasingly being reapplied and may be combined into new solutions that can be sold into these markets. Its
products are manufactured using industry standard processes and all are sold through a unified direct sales
force that also manages global relationships with independent, third party sales representatives and
distributors.
The flexibility of SMSC’s products to address multiple end market applications and the convergence of
multimedia technologies is creating new market opportunities. For example, computer makers are supplying
1
devices that address entertainment needs, traditional manufacturers of consumer entertainment goods are
addressing computing needs and automotive manufacturers and system integrators are seeking ways to deliver
multimedia content or network information systems into the automobile. As a result of substantial investment
in research and development over the past several years, the functionality of SMSC’s products has been
greatly enhanced, and the portfolio of products in computing, connectivity and networking has broadened
considerably, enabling increased presence for SMSC in many other applications using these technologies. This
strategic thrust to link available technologies into new applications and invest in new technologies capable of
serving different aspects of these converging markets is expected to result in greater product diversity and
broader sales and marketing opportunities.
The Company has four principal product types: computing and connectivity products, analog products,
mobile products, and automotive information products. Computing and connectivity products represent the
Company’s traditional core business, while the other three product types are emerging and are expected over
time to rapidly expand the Company’s access to new customers or applications.
The computing and connectivity products employ mixed-signal semiconductor and software technologies
for end-user products designed by computing and consumer electronics customers. The Company differentiates
its products by combining industry-standard interfaces with advanced application-specific platform solutions.
Most of the devices sold into this set of customers and markets must integrate seamlessly with microproces-
sors and chipsets developed by other companies. SMSC’s solutions optimize the customer’s platform designs
and improve time-to-market while reducing the total bill of materials cost. These products can be found in
PCs, netbooks, docking stations, televisions, set-top boxes, digital video recorders, industrial servers and many
other embedded system applications. In fiscal 2009, computing and connectivity products accounted for
approximately two thirds of the Company’s revenue.
Some of the Company’s computing and connectivity products utilize Universal Serial Bus (‘‘USB’’)
technology, which enables the transfer of data between peripheral devices and hosts. This technology has
become the ubiquitous connectivity standard for use in computing, consumer and industrial applications.
SMSC is regarded as an industry leader in providing semiconductors that incorporate the current industry USB
standard specification, known as USB 2.0 or ‘‘Hi-Speed USB’’. USB 2.0’s 480 megabit per second data
transfer rate supports the high bandwidth and speed requirements of consumer multimedia technologies, and
because of its ease-of-use and the fact that it delivers regulated power, has become the leading standard by
which interoperability and connectivity is provided between diverse systems platforms such as consumer
electronics, multimedia computing and mobile storage applications. Designers are attracted to USB 2.0’s
speed, ‘‘plug-and-play’’ features and its predictable software development requirements. The ubiquity of USB
2.0 integrated circuits and software makes it a cost-effective choice for designers to add a high-speed serial
data pipe for transferring media content. SMSC has sold over 150 million SMSC USB 2.0 devices to date.
SMSC has announced its intention to develop products to support the next generation USB technology,
known as USB 3.0 or SuperSpeed USB. USB 3.0 provides data transfer rates approximately 10 times faster
than Hi Speed USB and is well suited for applications using large data files, such as those found in enterprise
commercial applications as well as consumer multimedia solutions. SMSC intends to develop USB 3.0 prod-
ucts that can be used in platforms such as digital TVs, LCDs, printers, monitors, PCs, gaming consoles, digital
video cameras, smart phones and other embedded and consumer applications.
Ethernet is another important technology broadly utilized in SMSC’s computing and connectivity prod-
ucts. Ethernet is widely recognized as the ubiquitous, versatile networking technology found in home, business
and industrial environments. In its 13 years of designing networking products, SMSC has shipped more than
100 million Ethernet ports. A primary focus of the Company’s efforts in this area is developing products that
connect USB and Ethernet, such as USB-to-Ethernet controllers and USB hubs with integrated Ethernet
controllers. The ubiquity and speed of USB has resulted in the USB-to-Ethernet connection replacing older
means of transferring information, such as legacy bus and Peripheral Component Interconnect (‘‘PCI’’) inter-
faces. PCI is a high-speed connection technology common in computers, but is not typically found in
consumer electronics and embedded industrial applications. Although the Company continues to make and sell
PCI products, as with USB there is a newer and faster technology, PCI-Express, which the Company also
2
intends to utilize in new product development. The Company believes that PCI-Express has the potential to
expand the market opportunity for SMSC’s products.
SMSC also serves the embedded market with other networking technologies, such as ARCNET and
CircLinkTM, an ARCNET derivative. By replacing traditionally slow, wire intensive, hard-to-use cable har-
nesses, these solutions allow designers to reduce wiring and microcontroller costs, and create a more flexible
and modular systems architecture. These products target networking applications requiring a high level of
predictable behavior, throughput, and ease of implementation such as telecom equipment, robotics, digital
copiers and printers, and transportation systems.
One of the more significant growth opportunities for SMSC is in serving the netbook market where the
Company is developing products that are platform-independent and can serve both X86 and non-X86
processor-based designs.
SMSC’s computing and connectivity products also extend into the x86-based server market. Advanced
I/O products for server applications build on SMSC’s broad I/O and system management expertise and include
timers, flash memory interfaces, and other server requirements. The Company’s embedded controller solutions
offer programmable, mixed-signal features that allow for feature customization. SMSC also offers a set of
chips that offer additional system features such as general purpose input/output (‘‘GPIO’’) expansion, tempera-
ture and voltage sensing, fan control and consumer infrared remote control. The Company’s broad product
portfolio also provides a variety of integration choices for designers, with unique configurations of serial ports,
parallel ports, keyboard controllers, infrared ports, GPIO pins, logic integration and power management.
SMSC’s computing and connectivity products cut across its broad technology portfolio. Important prod-
ucts include among others:
• USB 2.0 hub controllers, including solutions for 2-port, 3-port, 4-port, 7-port and combination
hub/flash memory card reader products.
• USB 2.0 flash memory card reader products, including controllers supporting Secure DigitalTM (SD),
MultiMediaCardTM (MMC), Memory Stick� (MS), MS-PRO-HGTM, SmartMedia� (SM), xD-Picture
CardTM (xD) and Compact Flash(R) (CF) memory and Compact Flash-UDMA card families.
• USB-to-Ethernet controllers allowing developers to deliver Ethernet connectivity while leveraging
the proliferation of USB.
• 10 Mbps and 100 Mbps Ethernet controllers and transceivers and software drivers targeting con-
sumer electronics and industrial applications.
• Network multimedia processing engines supporting multiple high-definition audio/video streams,
software protocol stack management and security, through PCI or non-PCI interfaces.
• Embedded communications products for wireless base stations, copiers, building automation, robot-
ics, gaming machines and industrial applications.
• Embedded Ethernet switches with two and three-port switching technology to solve network connec-
tivity requirements using both 16 and 32 bit non-PCI and MII interfaces.
• Embedded controllers for Original Equipment Manufacturer (‘‘OEM’’) and Original Design Manu-
facturer (‘‘ODM’’) PC designers, offering differentiation and customization at reduced system costs
for customers in this high volume market.
• Advanced I/O controllers.
• x86-based server solutions offering timers, flash memory interfaces and thermal management
capabilities.
In addition to the computing and connectivity products, SMSC is also developing analog, mobile and
automotive information products.
SMSC’s analog products utilize analog thermal sensor technology to target computing and consumer
applications supplied by major OEMs, ODMs and motherboard manufacturers. SMSC’s analog products are
3
currently found in approximately 40% of mobile computers manufactured worldwide. Also included in this
product line are capacitive sensing and fan driver products. Sales of SMSC’s analog products grew signifi-
cantly from fiscal year 2008 to fiscal year 2009. The analog products serve computing, consumer and
industrial applications.
SMSC’s mobile products are designed for smart phones, personal digital assistants and other handheld
mobile devices. These products include standalone USB 2.0 physical layer transceivers (‘‘PHY’’) supporting
industry standard interfaces as well as USB 2.0 flash memory card readers. These products also include USB
PHYs integrated with other functions such as battery management and voltage protection. These Hi-Speed
USB transceivers currently set new standards for integration and small size, helping designers meet the tight
board space and cost requirements of portable products. Sales of these products grew significantly from fiscal
year 2008 to fiscal year 2009, and they have the potential to continue to expand rapidly as SMSC continues to
penetrate smart phone and portable consumer electronics markets.
SMSC is also a supplier of products for the automotive market based on its market-leading Media
Oriented Systems Transport (‘‘MOST�’’) technology. MOST is a networking standard which enables the
transport of high-bandwidth digital audio, video packet-based data, and control information. SMSC’s latest
generation of MOST products, MOST150, provides greater bandwidth and functionality than its predecessors,
MOST25 and MOST50, though these speed grade products continue to be sold into automotive platforms in
Europe and Asia. MOST-enabled network interface controllers (‘‘NICs’’) and intelligent network interface
controllers (‘‘INICs’’) are being designed into automotive networks to transfer high-performance multimedia
content among devices such as radios, navigation systems, digital video displays, microphones and CD-players
quickly and without electrostatic disruption. The technology is also applicable to new market requirements
such as driver assistance. The Company also markets a chip interconnect technology known as Media Local
Bus (MediaLB�), enabling consumer applications to easily connect to SMSC’s new network interface control-
lers for MOST. MediaLB is also designed to support future MOST networks, thereby providing a simple
migration path from existing MOST architectures to next-generation platforms. The MOST technology is a de
facto industry standard for high bandwidth automotive multimedia networking. The Company also sells related
system design and diagnostic tool products to customers who need to build or maintain MOST compliant
systems. The MOST products were added as a result of the acquisition of OASIS SiliconSystems Holding AG
(‘‘OASIS’’) on March 30, 2005. SMSC also has begun to develop USB products for automotive applications.
Seasonality
The Company’s business historically has been subject to repeated seasonality, with the first and last
quarters of each fiscal year tending to be weaker than the second and third. However, SMSC’s typical season-
ality can be altered materially by market conditions. SMSC, like many other high technology companies, was
adversely affected by the current economic downturn, particularly in its third and fourth quarters of fiscal
2009. As a result, the historical seasonal pattern did not occur in fiscal 2009. The Company is uncertain as to
whether the past pattern will resume as economic conditions stabilize. See Part I Item 1.A. — Risk Factors —Worldwide Economic Conditions; Seasonality of the Business, for further discussion.
Competition
The Company competes in the semiconductor industry, servicing and providing solutions for various
applications. Many of the Company’s larger customers conduct business in the PC and related peripheral
devices markets. Intense competition, rapid technological change, cyclical market patterns, price erosion and
periods of mismatched supply and demand have historically characterized these industries. See Part I
Item 1.A. — Risk Factors, for a more detailed discussion of these market characteristics and associated risks.
The principal methods employed by the Company to compete effectively include introducing innovative
new products, providing superior product quality and customer service, adding new features to its products,
improving product performance, providing time-to-market advantages and reducing manufacturing costs.
SMSC also cultivates strategic relationships with certain key customers who are technology leaders in its
target markets, and who provide insight into market trends and opportunities for the Company to better sup-
port those customers’ current and future needs. A substantial majority of the Company’s revenues come from
4
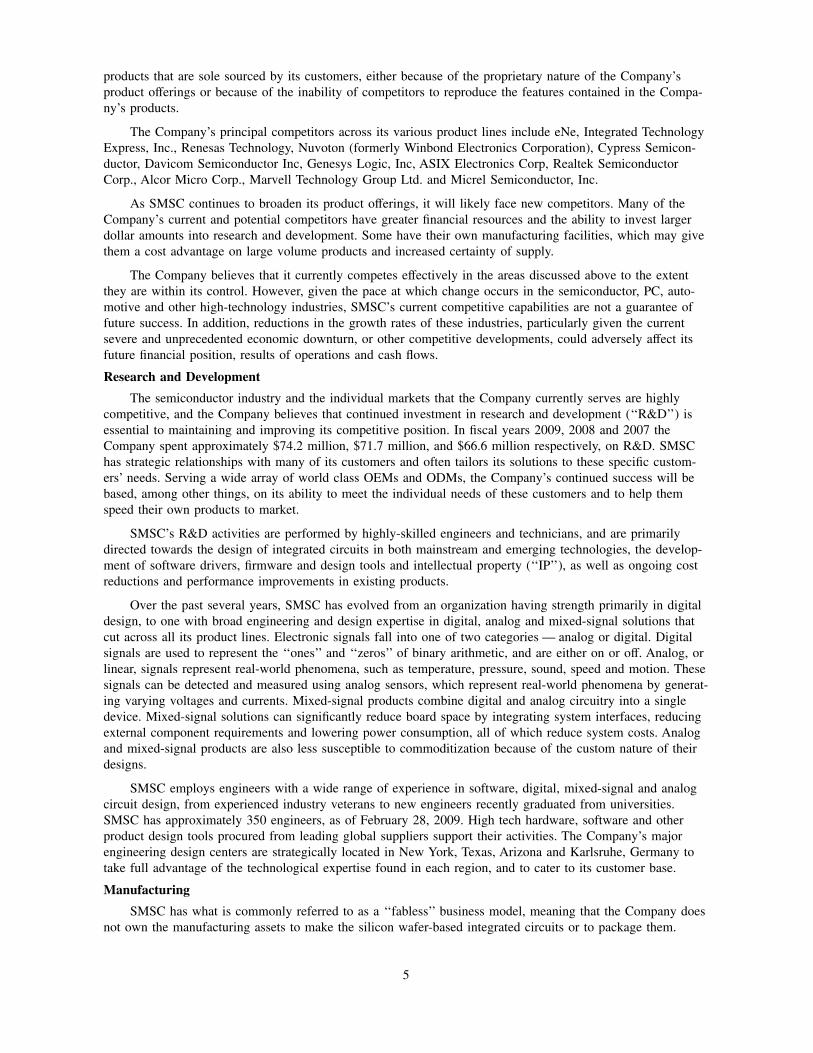
products that are sole sourced by its customers, either because of the proprietary nature of the Company’s
product offerings or because of the inability of competitors to reproduce the features contained in the Compa-
ny’s products.
The Company’s principal competitors across its various product lines include eNe, Integrated Technology
Express, Inc., Renesas Technology, Nuvoton (formerly Winbond Electronics Corporation), Cypress Semicon-
ductor, Davicom Semiconductor Inc, Genesys Logic, Inc, ASIX Electronics Corp, Realtek Semiconductor
Corp., Alcor Micro Corp., Marvell Technology Group Ltd. and Micrel Semiconductor, Inc.
As SMSC continues to broaden its product offerings, it will likely face new competitors. Many of the
Company’s current and potential competitors have greater financial resources and the ability to invest larger
dollar amounts into research and development. Some have their own manufacturing facilities, which may give
them a cost advantage on large volume products and increased certainty of supply.
The Company believes that it currently competes effectively in the areas discussed above to the extent
they are within its control. However, given the pace at which change occurs in the semiconductor, PC, auto-
motive and other high-technology industries, SMSC’s current competitive capabilities are not a guarantee of
future success. In addition, reductions in the growth rates of these industries, particularly given the current
severe and unprecedented economic downturn, or other competitive developments, could adversely affect its
future financial position, results of operations and cash flows.
Research and Development
The semiconductor industry and the individual markets that the Company currently serves are highly
competitive, and the Company believes that continued investment in research and development (‘‘R&D’’) is
essential to maintaining and improving its competitive position. In fiscal years 2009, 2008 and 2007 the
Company spent approximately $74.2 million, $71.7 million, and $66.6 million respectively, on R&D. SMSC
has strategic relationships with many of its customers and often tailors its solutions to these specific custom-
ers’ needs. Serving a wide array of world class OEMs and ODMs, the Company’s continued success will be
based, among other things, on its ability to meet the individual needs of these customers and to help them
speed their own products to market.
SMSC’s R&D activities are performed by highly-skilled engineers and technicians, and are primarily
directed towards the design of integrated circuits in both mainstream and emerging technologies, the develop-
ment of software drivers, firmware and design tools and intellectual property (‘‘IP’’), as well as ongoing cost
reductions and performance improvements in existing products.
Over the past several years, SMSC has evolved from an organization having strength primarily in digital
design, to one with broad engineering and design expertise in digital, analog and mixed-signal solutions that
cut across all its product lines. Electronic signals fall into one of two categories — analog or digital. Digital
signals are used to represent the ‘‘ones’’ and ‘‘zeros’’ of binary arithmetic, and are either on or off. Analog, or
linear, signals represent real-world phenomena, such as temperature, pressure, sound, speed and motion. These
signals can be detected and measured using analog sensors, which represent real-world phenomena by generat-
ing varying voltages and currents. Mixed-signal products combine digital and analog circuitry into a single
device. Mixed-signal solutions can significantly reduce board space by integrating system interfaces, reducing
external component requirements and lowering power consumption, all of which reduce system costs. Analog
and mixed-signal products are also less susceptible to commoditization because of the custom nature of their
designs.
SMSC employs engineers with a wide range of experience in software, digital, mixed-signal and analog
circuit design, from experienced industry veterans to new engineers recently graduated from universities.
SMSC has approximately 350 engineers, as of February 28, 2009. High tech hardware, software and other
product design tools procured from leading global suppliers support their activities. The Company’s major
engineering design centers are strategically located in New York, Texas, Arizona and Karlsruhe, Germany to
take full advantage of the technological expertise found in each region, and to cater to its customer base.
Manufacturing
SMSC has what is commonly referred to as a ‘‘fabless’’ business model, meaning that the Company does
not own the manufacturing assets to make the silicon wafer-based integrated circuits or to package them.
5
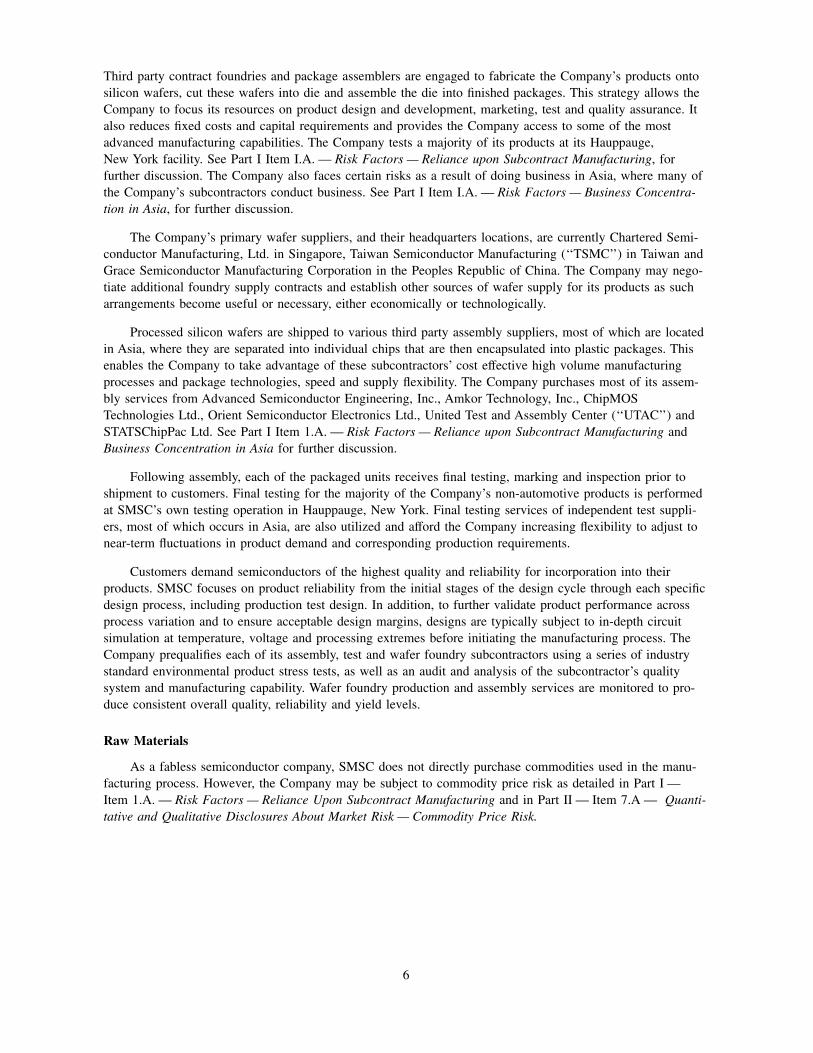
Third party contract foundries and package assemblers are engaged to fabricate the Company’s products onto
silicon wafers, cut these wafers into die and assemble the die into finished packages. This strategy allows the
Company to focus its resources on product design and development, marketing, test and quality assurance. It
also reduces fixed costs and capital requirements and provides the Company access to some of the most
advanced manufacturing capabilities. The Company tests a majority of its products at its Hauppauge,
New York facility. See Part I Item I.A. — Risk Factors — Reliance upon Subcontract Manufacturing, forfurther discussion. The Company also faces certain risks as a result of doing business in Asia, where many of
the Company’s subcontractors conduct business. See Part I Item I.A. — Risk Factors — Business Concentra-tion in Asia, for further discussion.
The Company’s primary wafer suppliers, and their headquarters locations, are currently Chartered Semi-
conductor Manufacturing, Ltd. in Singapore, Taiwan Semiconductor Manufacturing (‘‘TSMC’’) in Taiwan and
Grace Semiconductor Manufacturing Corporation in the Peoples Republic of China. The Company may nego-
tiate additional foundry supply contracts and establish other sources of wafer supply for its products as such
arrangements become useful or necessary, either economically or technologically.
Processed silicon wafers are shipped to various third party assembly suppliers, most of which are located
in Asia, where they are separated into individual chips that are then encapsulated into plastic packages. This
enables the Company to take advantage of these subcontractors’ cost effective high volume manufacturing
processes and package technologies, speed and supply flexibility. The Company purchases most of its assem-
bly services from Advanced Semiconductor Engineering, Inc., Amkor Technology, Inc., ChipMOS
Technologies Ltd., Orient Semiconductor Electronics Ltd., United Test and Assembly Center (‘‘UTAC’’) and
STATSChipPac Ltd. See Part I Item 1.A. — Risk Factors — Reliance upon Subcontract Manufacturing and
Business Concentration in Asia for further discussion.
Following assembly, each of the packaged units receives final testing, marking and inspection prior to
shipment to customers. Final testing for the majority of the Company’s non-automotive products is performed
at SMSC’s own testing operation in Hauppauge, New York. Final testing services of independent test suppli-
ers, most of which occurs in Asia, are also utilized and afford the Company increasing flexibility to adjust to
near-term fluctuations in product demand and corresponding production requirements.
Customers demand semiconductors of the highest quality and reliability for incorporation into their
products. SMSC focuses on product reliability from the initial stages of the design cycle through each specific
design process, including production test design. In addition, to further validate product performance across
process variation and to ensure acceptable design margins, designs are typically subject to in-depth circuit
simulation at temperature, voltage and processing extremes before initiating the manufacturing process. The
Company prequalifies each of its assembly, test and wafer foundry subcontractors using a series of industry
standard environmental product stress tests, as well as an audit and analysis of the subcontractor’s quality
system and manufacturing capability. Wafer foundry production and assembly services are monitored to pro-
duce consistent overall quality, reliability and yield levels.
Raw Materials
As a fabless semiconductor company, SMSC does not directly purchase commodities used in the manu-
facturing process. However, the Company may be subject to commodity price risk as detailed in Part I —
Item 1.A. — Risk Factors — Reliance Upon Subcontract Manufacturing and in Part II — Item 7.A — Quanti-tative and Qualitative Disclosures About Market Risk — Commodity Price Risk.
6
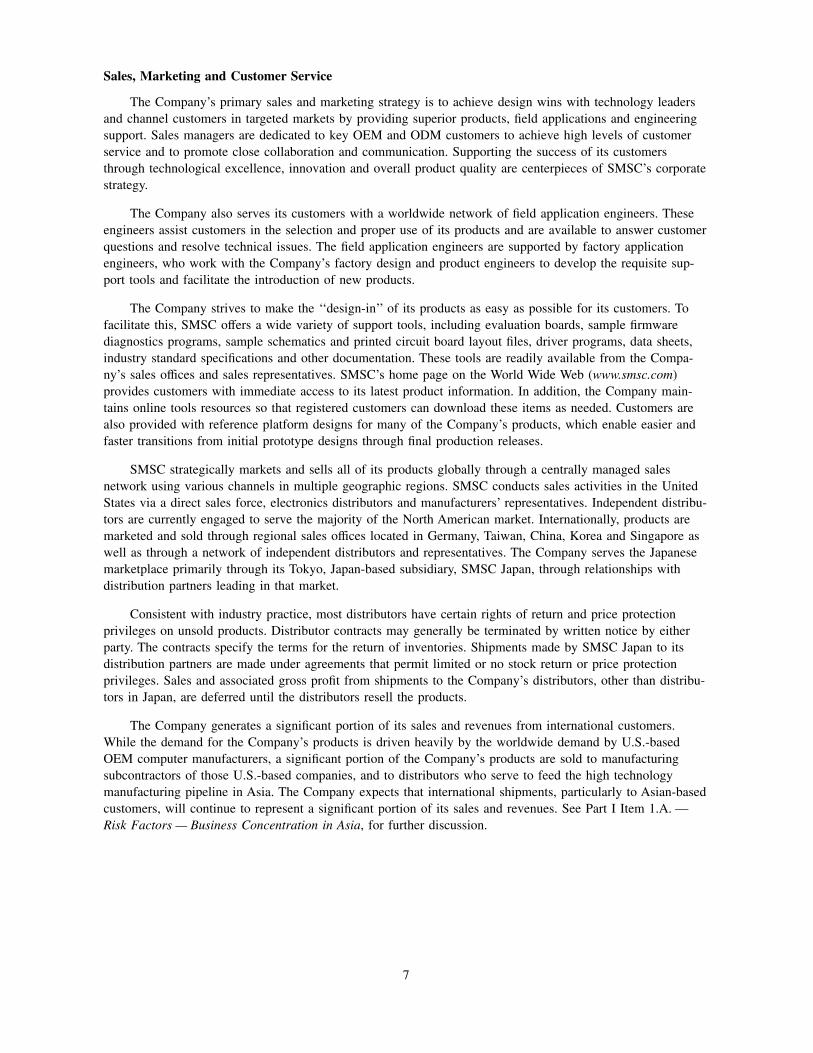
Sales, Marketing and Customer Service
The Company’s primary sales and marketing strategy is to achieve design wins with technology leaders
and channel customers in targeted markets by providing superior products, field applications and engineering
support. Sales managers are dedicated to key OEM and ODM customers to achieve high levels of customer
service and to promote close collaboration and communication. Supporting the success of its customers
through technological excellence, innovation and overall product quality are centerpieces of SMSC’s corporate
strategy.
The Company also serves its customers with a worldwide network of field application engineers. These
engineers assist customers in the selection and proper use of its products and are available to answer customer
questions and resolve technical issues. The field application engineers are supported by factory application
engineers, who work with the Company’s factory design and product engineers to develop the requisite sup-
port tools and facilitate the introduction of new products.
The Company strives to make the ‘‘design-in’’ of its products as easy as possible for its customers. To
facilitate this, SMSC offers a wide variety of support tools, including evaluation boards, sample firmware
diagnostics programs, sample schematics and printed circuit board layout files, driver programs, data sheets,
industry standard specifications and other documentation. These tools are readily available from the Compa-
ny’s sales offices and sales representatives. SMSC’s home page on the World Wide Web (www.smsc.com)provides customers with immediate access to its latest product information. In addition, the Company main-
tains online tools resources so that registered customers can download these items as needed. Customers are
also provided with reference platform designs for many of the Company’s products, which enable easier and
faster transitions from initial prototype designs through final production releases.
SMSC strategically markets and sells all of its products globally through a centrally managed sales
network using various channels in multiple geographic regions. SMSC conducts sales activities in the United
States via a direct sales force, electronics distributors and manufacturers’ representatives. Independent distribu-
tors are currently engaged to serve the majority of the North American market. Internationally, products are
marketed and sold through regional sales offices located in Germany, Taiwan, China, Korea and Singapore as
well as through a network of independent distributors and representatives. The Company serves the Japanese
marketplace primarily through its Tokyo, Japan-based subsidiary, SMSC Japan, through relationships with
distribution partners leading in that market.
Consistent with industry practice, most distributors have certain rights of return and price protection
privileges on unsold products. Distributor contracts may generally be terminated by written notice by either
party. The contracts specify the terms for the return of inventories. Shipments made by SMSC Japan to its
distribution partners are made under agreements that permit limited or no stock return or price protection
privileges. Sales and associated gross profit from shipments to the Company’s distributors, other than distribu-
tors in Japan, are deferred until the distributors resell the products.
The Company generates a significant portion of its sales and revenues from international customers.
While the demand for the Company’s products is driven heavily by the worldwide demand by U.S.-based
OEM computer manufacturers, a significant portion of the Company’s products are sold to manufacturing
subcontractors of those U.S.-based companies, and to distributors who serve to feed the high technology
manufacturing pipeline in Asia. The Company expects that international shipments, particularly to Asian-based
customers, will continue to represent a significant portion of its sales and revenues. See Part I Item 1.A. —
Risk Factors — Business Concentration in Asia, for further discussion.
7
Markets and Strategy
As previously outlined, the Company designs products that address specific applications for end products
sold in several ‘‘vertical’’ markets.
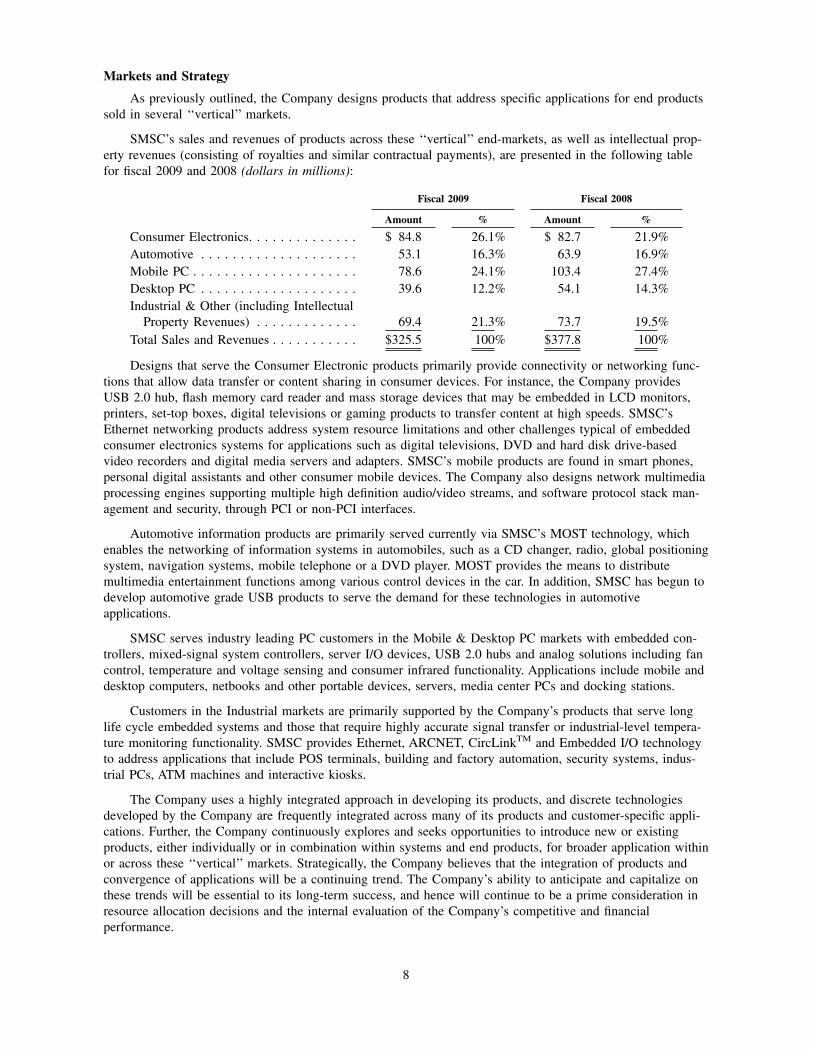
SMSC’s sales and revenues of products across these ‘‘vertical’’ end-markets, as well as intellectual prop-
erty revenues (consisting of royalties and similar contractual payments), are presented in the following table
for fiscal 2009 and 2008 (dollars in millions):
Fiscal 2009 Fiscal 2008
Amount % Amount %
Consumer Electronics. . . . . . . . . . . . . . $ 84.8 26.1% $ 82.7 21.9%
Automotive . . . . . . . . . . . . . . . . . . . . 53.1 16.3% 63.9 16.9%
Mobile PC . . . . . . . . . . . . . . . . . . . . . 78.6 24.1% 103.4 27.4%
Desktop PC . . . . . . . . . . . . . . . . . . . . 39.6 12.2% 54.1 14.3%
Industrial & Other (including Intellectual
Property Revenues) . . . . . . . . . . . . . 69.4 21.3% 73.7 19.5%
Total Sales and Revenues . . . . . . . . . . . $325.5 100% $377.8 100%
Designs that serve the Consumer Electronic products primarily provide connectivity or networking func-
tions that allow data transfer or content sharing in consumer devices. For instance, the Company provides
USB 2.0 hub, flash memory card reader and mass storage devices that may be embedded in LCD monitors,
printers, set-top boxes, digital televisions or gaming products to transfer content at high speeds. SMSC’s
Ethernet networking products address system resource limitations and other challenges typical of embedded
consumer electronics systems for applications such as digital televisions, DVD and hard disk drive-based
video recorders and digital media servers and adapters. SMSC’s mobile products are found in smart phones,
personal digital assistants and other consumer mobile devices. The Company also designs network multimedia
processing engines supporting multiple high definition audio/video streams, and software protocol stack man-
agement and security, through PCI or non-PCI interfaces.
Automotive information products are primarily served currently via SMSC’s MOST technology, which
enables the networking of information systems in automobiles, such as a CD changer, radio, global positioning
system, navigation systems, mobile telephone or a DVD player. MOST provides the means to distribute
multimedia entertainment functions among various control devices in the car. In addition, SMSC has begun to
develop automotive grade USB products to serve the demand for these technologies in automotive
applications.
SMSC serves industry leading PC customers in the Mobile & Desktop PC markets with embedded con-
trollers, mixed-signal system controllers, server I/O devices, USB 2.0 hubs and analog solutions including fan
control, temperature and voltage sensing and consumer infrared functionality. Applications include mobile and
desktop computers, netbooks and other portable devices, servers, media center PCs and docking stations.
Customers in the Industrial markets are primarily supported by the Company’s products that serve long
life cycle embedded systems and those that require highly accurate signal transfer or industrial-level tempera-
ture monitoring functionality. SMSC provides Ethernet, ARCNET, CircLinkTM and Embedded I/O technology
to address applications that include POS terminals, building and factory automation, security systems, indus-
trial PCs, ATM machines and interactive kiosks.
The Company uses a highly integrated approach in developing its products, and discrete technologies
developed by the Company are frequently integrated across many of its products and customer-specific appli-
cations. Further, the Company continuously explores and seeks opportunities to introduce new or existing
products, either individually or in combination within systems and end products, for broader application within
or across these ‘‘vertical’’ markets. Strategically, the Company believes that the integration of products and
convergence of applications will be a continuing trend. The Company’s ability to anticipate and capitalize on
these trends will be essential to its long-term success, and hence will continue to be a prime consideration in
resource allocation decisions and the internal evaluation of the Company’s competitive and financial
performance.
8
In executing this strategic approach, the Company is managed in a highly integrated manner, and internal
resources are allocated and corresponding investments are made in a manner that the Company believes will
maximize total returns from product sales both individually (with respect to individual products or product
families) and in the aggregate (a ‘‘portfolio’’ approach). Such returns are measured at the ‘‘project’’ level. As
used by the Company, the concept of ‘‘returns’’ encompasses both ‘‘turns’’ (i.e. pay-back multiple) and net
present value metrics, as well as strategic considerations. Projects consist of either a single product offering
(as would be the case for a new product launch) or a product family, consisting of multiple product variants
stemming from an original design. Such variants can consist of relatively simple modifications to an original
design, introduction of ‘‘next generation’’ capabilities and features and/or strategic integration(s) of new
technologies into existing products.
Projected results for each project are evaluated independently for the impact on returns to SMSC as a
whole, and the allocation of resources (particularly engineering and R&D investment) are based on the indi-
vidual project economics. While the Company’s internal resources may be augmented or tempered depending
on the business environment, product pipeline and other factors, such decisions are predicated on expected
overall project returns and the corresponding impact on consolidated financial performance.
We believe that the Company’s expertise in multiple technologies that can be deployed in numerous
applications is a competitive advantage and a central part of the Company’s strategy. Given the proliferation
of customer demand for products based on convergent technologies, especially among the Company’s current
product offerings and core competencies, the opportunities available to the Company are expected to increase.
In addition, we believe that the continuous focus on such products and opportunities are integral to the future
success of the Company.
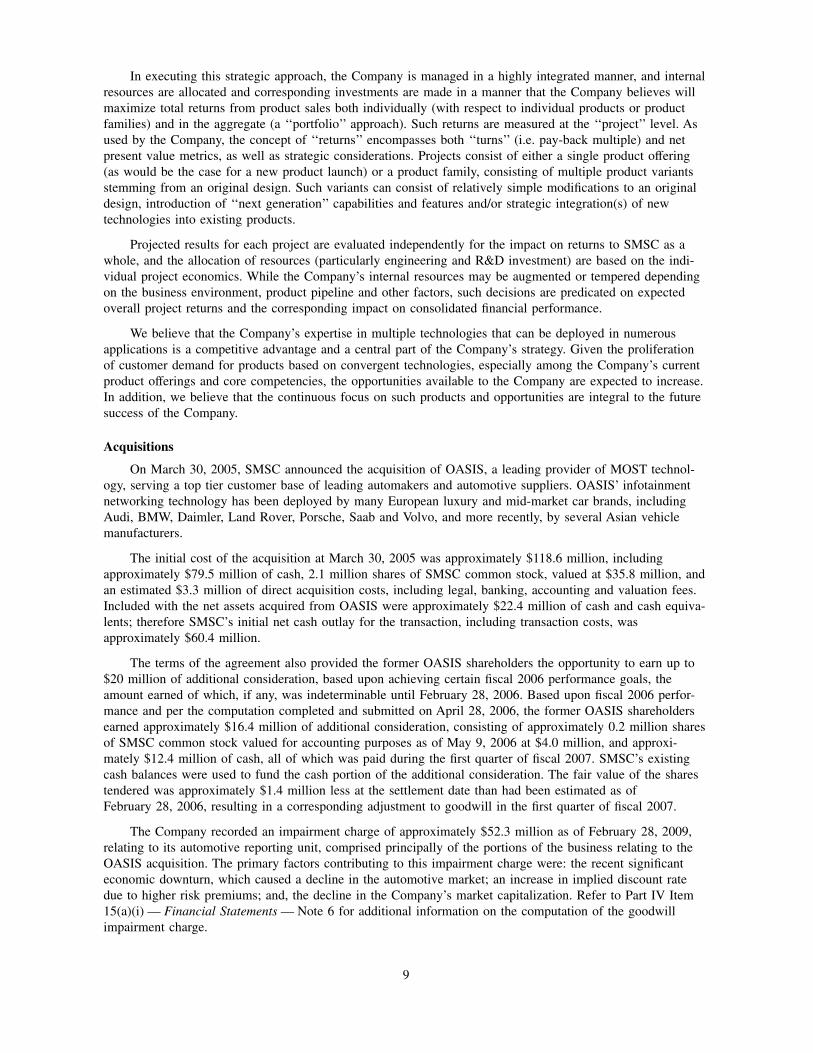
Acquisitions
On March 30, 2005, SMSC announced the acquisition of OASIS, a leading provider of MOST technol-
ogy, serving a top tier customer base of leading automakers and automotive suppliers. OASIS’ infotainment
networking technology has been deployed by many European luxury and mid-market car brands, including
Audi, BMW, Daimler, Land Rover, Porsche, Saab and Volvo, and more recently, by several Asian vehicle
manufacturers.
The initial cost of the acquisition at March 30, 2005 was approximately $118.6 million, including
approximately $79.5 million of cash, 2.1 million shares of SMSC common stock, valued at $35.8 million, and
an estimated $3.3 million of direct acquisition costs, including legal, banking, accounting and valuation fees.
Included with the net assets acquired from OASIS were approximately $22.4 million of cash and cash equiva-
lents; therefore SMSC’s initial net cash outlay for the transaction, including transaction costs, was
approximately $60.4 million.
The terms of the agreement also provided the former OASIS shareholders the opportunity to earn up to
$20 million of additional consideration, based upon achieving certain fiscal 2006 performance goals, the
amount earned of which, if any, was indeterminable until February 28, 2006. Based upon fiscal 2006 perfor-
mance and per the computation completed and submitted on April 28, 2006, the former OASIS shareholders
earned approximately $16.4 million of additional consideration, consisting of approximately 0.2 million shares
of SMSC common stock valued for accounting purposes as of May 9, 2006 at $4.0 million, and approxi-
mately $12.4 million of cash, all of which was paid during the first quarter of fiscal 2007. SMSC’s existing
cash balances were used to fund the cash portion of the additional consideration. The fair value of the shares
tendered was approximately $1.4 million less at the settlement date than had been estimated as of
February 28, 2006, resulting in a corresponding adjustment to goodwill in the first quarter of fiscal 2007.
The Company recorded an impairment charge of approximately $52.3 million as of February 28, 2009,
relating to its automotive reporting unit, comprised principally of the portions of the business relating to the
OASIS acquisition. The primary factors contributing to this impairment charge were: the recent significant
economic downturn, which caused a decline in the automotive market; an increase in implied discount rate
due to higher risk premiums; and, the decline in the Company’s market capitalization. Refer to Part IV Item
15(a)(i) — Financial Statements —Note 6 for additional information on the computation of the goodwill
impairment charge.
9
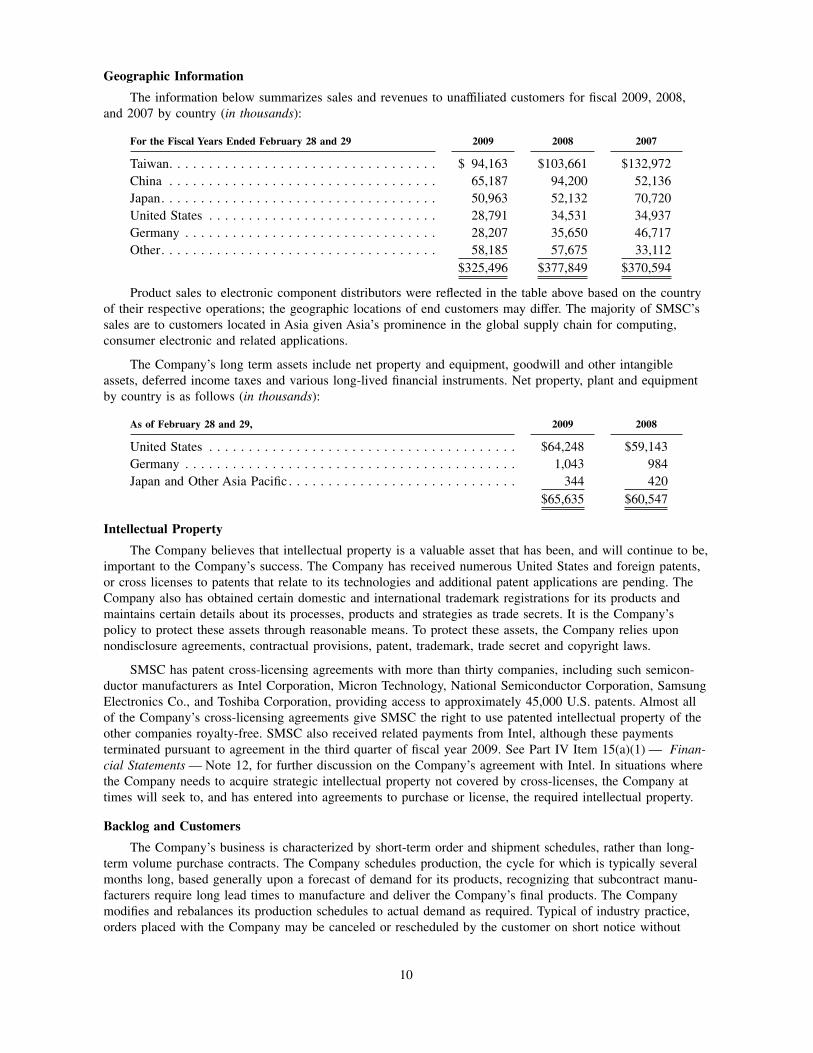
Geographic Information
The information below summarizes sales and revenues to unaffiliated customers for fiscal 2009, 2008,
and 2007 by country (in thousands):
For the Fiscal Years Ended February 28 and 29 2009 2008 2007
Taiwan. . . . . . . . . . . . . . . . . . . . . . . . . . . . . . . . . . $ 94,163 $103,661 $132,972
China . . . . . . . . . . . . . . . . . . . . . . . . . . . . . . . . . . 65,187 94,200 52,136
Japan. . . . . . . . . . . . . . . . . . . . . . . . . . . . . . . . . . . 50,963 52,132 70,720
United States . . . . . . . . . . . . . . . . . . . . . . . . . . . . . 28,791 34,531 34,937
Germany . . . . . . . . . . . . . . . . . . . . . . . . . . . . . . . . 28,207 35,650 46,717
Other. . . . . . . . . . . . . . . . . . . . . . . . . . . . . . . . . . . 58,185 57,675 33,112
$325,496 $377,849 $370,594
Product sales to electronic component distributors were reflected in the table above based on the country
of their respective operations; the geographic locations of end customers may differ. The majority of SMSC’s
sales are to customers located in Asia given Asia’s prominence in the global supply chain for computing,
consumer electronic and related applications.
The Company’s long term assets include net property and equipment, goodwill and other intangible
assets, deferred income taxes and various long-lived financial instruments. Net property, plant and equipment
by country is as follows (in thousands):
As of February 28 and 29, 2009 2008
United States . . . . . . . . . . . . . . . . . . . . . . . . . . . . . . . . . . . . . . . $64,248 $59,143
Germany . . . . . . . . . . . . . . . . . . . . . . . . . . . . . . . . . . . . . . . . . . 1,043 984
Japan and Other Asia Pacific . . . . . . . . . . . . . . . . . . . . . . . . . . . . . 344 420
$65,635 $60,547
Intellectual Property
The Company believes that intellectual property is a valuable asset that has been, and will continue to be,
important to the Company’s success. The Company has received numerous United States and foreign patents,
or cross licenses to patents that relate to its technologies and additional patent applications are pending. The
Company also has obtained certain domestic and international trademark registrations for its products and
maintains certain details about its processes, products and strategies as trade secrets. It is the Company’s
policy to protect these assets through reasonable means. To protect these assets, the Company relies upon
nondisclosure agreements, contractual provisions, patent, trademark, trade secret and copyright laws.
SMSC has patent cross-licensing agreements with more than thirty companies, including such semicon-
ductor manufacturers as Intel Corporation, Micron Technology, National Semiconductor Corporation, Samsung
Electronics Co., and Toshiba Corporation, providing access to approximately 45,000 U.S. patents. Almost all
of the Company’s cross-licensing agreements give SMSC the right to use patented intellectual property of the
other companies royalty-free. SMSC also received related payments from Intel, although these payments
terminated pursuant to agreement in the third quarter of fiscal year 2009. See Part IV Item 15(a)(1) — Finan-cial Statements—Note 12, for further discussion on the Company’s agreement with Intel. In situations where
the Company needs to acquire strategic intellectual property not covered by cross-licenses, the Company at
times will seek to, and has entered into agreements to purchase or license, the required intellectual property.
Backlog and Customers
The Company’s business is characterized by short-term order and shipment schedules, rather than long-
term volume purchase contracts. The Company schedules production, the cycle for which is typically several
months long, based generally upon a forecast of demand for its products, recognizing that subcontract manu-
facturers require long lead times to manufacture and deliver the Company’s final products. The Company
modifies and rebalances its production schedules to actual demand as required. Typical of industry practice,
orders placed with the Company may be canceled or rescheduled by the customer on short notice without
10
significant penalty. In addition, incoming orders and resulting backlog can fluctuate considerably during peri-
ods of perceived or actual semiconductor supply shortages or overages. As a result, the Company’s backlog
may not be a reliable indicator of future sales and can fluctuate considerably.
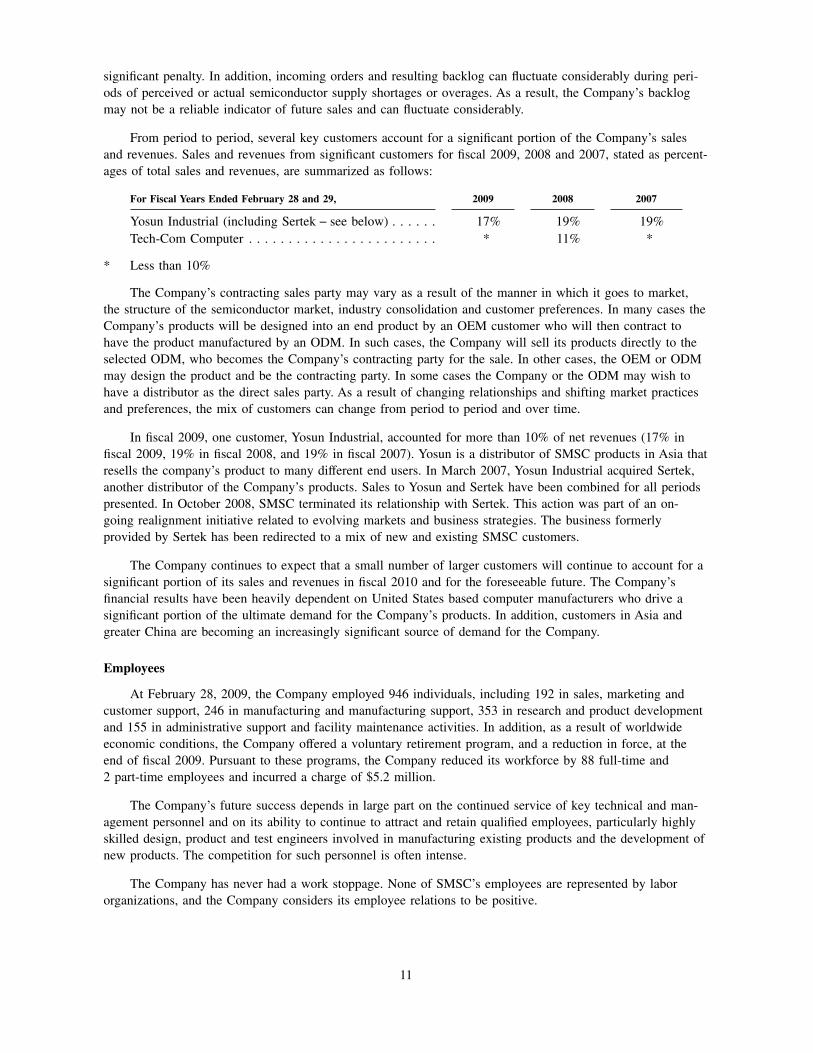
From period to period, several key customers account for a significant portion of the Company’s sales
and revenues. Sales and revenues from significant customers for fiscal 2009, 2008 and 2007, stated as percent-
ages of total sales and revenues, are summarized as follows:
For Fiscal Years Ended February 28 and 29, 2009 2008 2007
Yosun Industrial (including Sertek − see below) . . . . . . 17% 19% 19%
Tech-Com Computer . . . . . . . . . . . . . . . . . . . . . . . . * 11% *
* Less than 10%
The Company’s contracting sales party may vary as a result of the manner in which it goes to market,
the structure of the semiconductor market, industry consolidation and customer preferences. In many cases the
Company’s products will be designed into an end product by an OEM customer who will then contract to
have the product manufactured by an ODM. In such cases, the Company will sell its products directly to the
selected ODM, who becomes the Company’s contracting party for the sale. In other cases, the OEM or ODM
may design the product and be the contracting party. In some cases the Company or the ODM may wish to
have a distributor as the direct sales party. As a result of changing relationships and shifting market practices
and preferences, the mix of customers can change from period to period and over time.
In fiscal 2009, one customer, Yosun Industrial, accounted for more than 10% of net revenues (17% in
fiscal 2009, 19% in fiscal 2008, and 19% in fiscal 2007). Yosun is a distributor of SMSC products in Asia that
resells the company’s product to many different end users. In March 2007, Yosun Industrial acquired Sertek,
another distributor of the Company’s products. Sales to Yosun and Sertek have been combined for all periods
presented. In October 2008, SMSC terminated its relationship with Sertek. This action was part of an on-
going realignment initiative related to evolving markets and business strategies. The business formerly
provided by Sertek has been redirected to a mix of new and existing SMSC customers.
The Company continues to expect that a small number of larger customers will continue to account for a
significant portion of its sales and revenues in fiscal 2010 and for the foreseeable future. The Company’s
financial results have been heavily dependent on United States based computer manufacturers who drive a
significant portion of the ultimate demand for the Company’s products. In addition, customers in Asia and
greater China are becoming an increasingly significant source of demand for the Company.
Employees
At February 28, 2009, the Company employed 946 individuals, including 192 in sales, marketing and
customer support, 246 in manufacturing and manufacturing support, 353 in research and product development
and 155 in administrative support and facility maintenance activities. In addition, as a result of worldwide
economic conditions, the Company offered a voluntary retirement program, and a reduction in force, at the
end of fiscal 2009. Pursuant to these programs, the Company reduced its workforce by 88 full-time and
2 part-time employees and incurred a charge of $5.2 million.
The Company’s future success depends in large part on the continued service of key technical and man-
agement personnel and on its ability to continue to attract and retain qualified employees, particularly highly
skilled design, product and test engineers involved in manufacturing existing products and the development of
new products. The competition for such personnel is often intense.
The Company has never had a work stoppage. None of SMSC’s employees are represented by labor
organizations, and the Company considers its employee relations to be positive.
11
Item 1.A. — Risk Factors
Readers of this Annual Report on Form 10-K (‘‘Report’’) should carefully consider the risks described
below, in addition to the other information contained in this Report and in the Company’s other reports filed
or furnished with the SEC, including the Company’s prior and subsequent reports on Forms 10-Q and 8-K, in
connection with any evaluation of the Company’s financial position, results of operations and cash flows.
The risks and uncertainties described below are not the only ones facing the Company. Additional risks
and uncertainties not presently known or those that are currently deemed immaterial may also affect the
Company’s operations. Any of the risks, uncertainties, events or circumstances described below could cause
the Company’s financial condition or results of operations to be adversely affected.
WORLDWIDE ECONOMIC CONDITIONS HAVE DRAMATICALLY DECREASED DEMAND FOR
THE COMPANY’S PRODUCTS AND IT IS UNCERTAIN IF OR WHEN THIS SITUATION MAY
IMPROVE
Worldwide Economic Conditions — The global economy has been experiencing a severe decline. As a
result of the extraordinary decrease in global economic activity, the Company’s revenues and profitability were
significantly less in fiscal year 2009 than in fiscal year 2008. Although the pace of decline in economic activ-
ity appears to have lessened, economic activity and demand for the Company’s products may not recover to
the levels of the first half of fiscal 2009. The Company’s revenue and profitability will be materially affected
if global economic conditions and demand for the Company’s products do not improve. The automotive
industry has been particularly impacted by the decline in global economic activity. Declining automotive sales
threaten the viability of several major automotive companies and have reduced demand for the Company’s
automotive products. The Company’s future revenues and profitability may be materially affected adversely if
the automotive industry does not recover significantly.
The decline in global economic activity includes the failure of the auction rate securities market. As a
result of the market conditions affecting auction rate securities, the Company reclassified its investments in
auction rate securities from short-term to long-term, and has taken temporary impairments to their value on its
balance sheet. If the issuers of the Company’s auction rate securities suffer a material decline in their credit-
worthiness, or if market conditions for auction rate securities do not recover sufficiently, the value of the
Company’s auction rate securities could be other than temporarily impaired, which would affect the Compa-
ny’s profit and loss statement for the relevant period. Further, the Company may be required to recognize
additional temporary impairments in future periods.
The decline in revenues and profitability of the Company has reduced the Company’s ability to fund new
projects. The Company may miss the window of opportunity for certain projects due to its inability to fund
them now.
THE COMPANY COMPETES IN COMPETITIVE INDUSTRIES; AND HAS EXPERIENCED
SIGNIFICANT VOLATILITY IN ITS STOCK PRICE
The Semiconductor Industry— The Company competes in the semiconductor industry, which has histori-
cally been characterized by intense competition, rapid technological change, cyclical market patterns, price
erosion, periods of mismatched supply and demand and high volatility of results. The semiconductor industry
has experienced significant economic downturns at various times in the past, characterized by diminished
product demand and accelerated erosion of selling prices. In addition, many of the Company’s competitors in
the semiconductor industry are larger and have significantly greater financial and other resources than the
Company. General conditions in the semiconductor industry, and actions of specific competitors, could
adversely affect the Company’s results. Declining sales and demand could result in aggressive pricing from
competitors to maintain market share, which the Company might have to match to maintain its customer base.
Such actions could result in decreases in the Company’s selling prices, which could materially affect its rev-
enues and profitability.
The semiconductor industry, including its supply chain, is maturing, and has been undergoing consolida-
tion through mergers and acquisitions. In addition, there have been a number of ownership changes through
the purchase of previously public companies, in part due to an influx of capital led by private equity firms.
Purchases funded by debt have been under severe financial pressure to service their debt as a result of the
12
decline in global economic conditions and general lack of liquidity. As a result of these factors the Company
may experience changes in its relationships in the supply chain and may have fewer sources of supply for
wafer production, assembly services, or other products or services it needs to procure. This could impair
sourcing flexibility or increase costs. The Company may also face fewer and larger, more capable, better
financed competitors. Consolidation and ownership changes within the semiconductor industry could adversely
affect the Company’s results.
The Personal Computer (‘‘PC’’) Industry—Demand for many of the Company’s products depends
largely on sales of personal computers and peripheral devices. There was a dramatic reduction in demand for
the Company’s personal consumer products during fiscal year 2009 as a result of global economic conditions.
Decreases or reductions in the rate of growth of the PC market could adversely affect the Company’s operat-
ing results. In addition, as a component supplier to PC manufacturers, the Company may experience greater
demand fluctuation than its customers themselves experience.
The PC industry is characterized by ongoing product changes and improvements, much of which is
driven by several large companies whose own business strategies play significant roles in determining PC
architectures. Future shifts in PC architectures may not always be anticipated or be consistent with the Com-
pany’s product design ‘‘roadmaps’’.
The Company has a business strategy that involves marketing and selling new products and technologies
directly to market-leading companies (although resultant sales are often made to third-party intermediaries
such as ODMs). The Company’s results are also heavily dependent on demand driven by North American
computer makers to whom the Company markets directly. If the market performance of any of these compa-
nies declines materially, as occurred during fiscal year 2009, or if they require fewer products from the
Company than forecasted, the Company’s revenues and profitability could be adversely affected. These large
companies also possess significant leverage in negotiating the terms and conditions of supply as a result of
their market power. The Company may be forced in certain circumstances to accept potential liability exceed-
ing the purchase price of the products sold by the Company, or various forms of potential consequential
damages to avoid losing business to competitors. Such terms and conditions could adversely impact the rev-
enues and margins earned by the Company.
Volatility of Stock Price— The volatility of the semiconductor industry has also been reflected histori-
cally in the market price of the Company’s common stock. The market price of the Company’s common stock
may fluctuate significantly on the basis of such factors as the Company’s or its competitors’ introductions of
new products, quarterly fluctuations in the Company’s financial results, announcements by the Company or its
competitors of significant technical innovations, acquisitions, strategic partnerships, joint ventures or capital
commitments; introduction of technologies or product enhancements that reduce the need for the Company’s
products; the loss of, or decrease in sales to, one or more key customers; a large sale of stock by a significant
shareholder; dilution from the issuance of the Company’s stock in connection with acquisitions; the addition
or removal of our stock to or from a stock index fund; departures of key personnel; the required expensing of
stock options or Stock Appreciation Rights (‘‘SARs’’); quarterly fluctuations in the Company’s guidance or in
the financial results of other semiconductor companies or personal computer companies; changes in the expec-
tations of market analysts or investors, or general conditions in the semiconductor industry or financial
markets. In addition, stock markets in general have experienced extreme price and volume volatility in recent
years. This volatility has often had a significant impact on the stock prices of high technology companies, at
times for reasons that appear unrelated to business performance. The Company’s stock price experienced
significant volatility in fiscal year 2009, and the Company’s stock price may continue to experience significant
volatility in the future.
The volatility of the stock price itself can impact the Company’s earnings because volatility is one mea-
surement that is used in calculating the value of stock based compensation to employees. In particular,
changes in stock price can materially affect the periodic compensation expense associated with SARs, which
is remeasured quarterly.
THE COMPANY HAS LARGE CONCENTRATED CUSTOMERS AND MUST SATISFY DEMAND-
ING PRICE, TECHNOLOGY AND QUALITY REQUIREMENTS
13
Product Development, Quality and Technological Change— The Company’s growth is highly dependent
upon the successful development and timely introduction of new products at competitive prices and perfor-
mance levels, with acceptable margins. The success of new products depends on various factors, including
timely completion of product development programs, the availability of third party intellectual property on
reasonable terms and conditions, market acceptance of the Company’s and its customers’ new products,
achieving acceptable yields, securing sufficient capacity at a reasonable cost for the Company’s products and
the Company’s ability to offer these new products at competitive prices.
The Company’s products are generally designed into its customers’ products through a competitive pro-
cess that evaluates the Company’s product features, price, and many other considerations. In order to succeed
in having the Company’s products incorporated into new products being designed by its customers, the Com-
pany seeks to anticipate market trends and meet performance, quality and functionality requirements of such
customers and seeks to successfully develop and manufacture products that adhere to these requirements. In
addition, the Company is expected to meet the timing and price requirements of its customers and must make
such products available in sufficient quantities. There can be no assurance that the Company will be able to
identify market trends or new product opportunities, develop and market new products, achieve design wins or
respond effectively to new technological changes or product announcements by others.
Although the Company has significant processes and procedures in place in an attempt to guarantee the
quality of its products, there can also be no assurance that the Company will not suffer unexpected yield or
quality issues that could materially affect its operating results. The Company’s products are complex and may
contain errors, particularly when first introduced or as new versions are released. The Company relies prima-
rily on its in-house testing and quality personnel to design test operations and procedures to detect any errors
prior to delivery of its products to its customers. Should problems occur in the operation or performance of
the Company’s ICs, it may experience delays in meeting key introduction dates or scheduled delivery dates to
its customers. These errors also could cause the Company to incur significant re-engineering costs, divert the
attention of its engineering personnel from its product development efforts and cause significant customer
relations and business reputation problems. Furthermore, a supply interruption or quality issue could result in
claims by customers for recalls or rework of finished goods containing components supplied by the Company.
Such claims can far exceed the revenues received by the Company for the sale of such products. Although the
Company attempts to mitigate such risks via insurance, contractual terms, and maintaining buffer stocks of
inventory, there can be no assurance that the Company will not receive such claims in the future, or that the
Company will be able to maintain its customers if it refuses to be responsible for some portion of these
claims.
As part of its product development cycle, the Company often is required to make significant investments
well before it can expect to receive revenue from those investments. For example, investments to produce
semiconductors for automotive companies, even if successful, may not result in a product appearing in an
automobile and associated revenue until many years later. The long lead-time between investment and revenue
may increase the risk associated with such investments. The Company’s operating results may be adversely
affected if the product development cycle is delayed, or if the Company chooses the wrong products to invest
in, or if product development costs exceed budgets.
The Company’s future growth will depend, among other things, upon its ability to continue to expand its
products into new markets. To the extent that the Company attempts to compete in new markets, it may face
competition from suppliers that have well-established market positions and products that have already been
proven to be technologically and economically competitive. There can be no assurance that the Company will
be successful in displacing these suppliers in the targeted applications.
Price Erosion— The semiconductor industry is characterized by intense competition. Historically, aver-
age selling prices in the semiconductor industry generally, and for the Company’s products in particular, have
declined significantly over the life of each product. While the Company expects to reduce the average prices
of its products over time as it achieves manufacturing cost reductions, competitive and other pressures may
require the reduction of selling prices more quickly than such cost reductions can be achieved. If not offset by
reductions in manufacturing costs or by a shift in the mix of products sold toward higher-margin products,
declines in the average selling prices could reduce profit margins.
14
Strategic Relationships with Customers— The Company’s future success depends in significant part on
strategic relationships with certain of its customers. If these relationships are not maintained, or if these cus-
tomers develop their own solutions, adopt a competitor’s solution, or choose to discontinue their relationships
with SMSC, the Company’s operating results could be adversely affected.
In the past, the Company has relied on its strategic relationships with certain customers who are technol-
ogy leaders in its target markets. The Company intends to pursue and continue to form these strategic
relationships in the future. These relationships often require the Company to develop new products that typi-
cally involve significant technological challenges. These customers frequently place considerable pressure on
the Company to meet their tight development schedules. Accordingly, the Company may have to devote a
substantial portion of its resources to these strategic relationships, which could detract from or delay comple-
tion of other important development projects.
Some of the Company’s important end user customers are relying more heavily on original design manu-
facturers (‘‘ODMs’’) to make decisions as to which components are incorporated into their products. The
Company’s results may be adversely affected if it fails to maintain effective relationships with these ODMs.
Customer Concentration and Shipments to Distributors—A limited number of customers account for a
significant portion of the Company’s sales and revenues. The Company’s sales and revenues from any one
customer can fluctuate from period to period depending upon market demand for that customer’s products, the
customer’s inventory management of the Company’s products and the overall financial condition of the cus-
tomer. Loss of an important customer, or deteriorating results from an important customer, such as North
American computer makers, could adversely impact the Company’s operating results.
A significant portion of the Company’s product sales are made through distributors. The Company’s
distributors generally offer products from several different suppliers, including products that may be competi-
tive with the Company’s products. Accordingly, there is risk that these distributors may give higher priority to
products of other suppliers, thus reducing their efforts to sell the Company’s products. In addition, the Compa-
ny’s agreements with its distributors are generally terminable at the distributor’s option. No assurance can be
given that future sales by distributors will continue at current levels or that the Company will be able to retain
its current distributors on acceptable terms. A reduction in sales efforts by one or more of the Company’s
current distributors or a termination of any distributor’s relationship with the Company could have an adverse
effect on the Company’s operating results.
The Company does not have long-term purchase contracts or commitments from its customers, and
substantially all of the Company’s sales are made on a purchase order basis. Therefore, customers may decide
to significantly alter their purchasing patterns without penalty and with little advance notice. Also, we do not
generally obtain letters of credit, credit insurance, or other security for payment from customers or distribu-
tors. Accordingly, we are typically not protected against accounts receivable default or bankruptcy by these
entities. Our ten largest customers or distributors represent a substantial majority of our accounts receivable. If
any such customer or distributor were to become insolvent or otherwise not satisfy its obligations to us, we
could be materially harmed.
Product sales and associated gross profit from shipments to the Company’s distributors, other than to
distributors in Japan, are deferred until the distributors resell the products. Shipments to distributors, other
than to distributors in Japan, are made under agreements allowing price protection and limited rights to return
unsold merchandise. The Company’s revenue recognition is therefore highly dependent upon receiving perti-
nent, accurate and timely data from its distributors. Distributors routinely provide the Company with product,
price, quantity and end customer data when products are resold, as well as report the quantities of the Compa-
ny’s products that are still in their inventories. In determining the appropriate amount of revenue to recognize,
the Company uses this data and applies judgment in reconciling any differences between the distributors’
reported inventories and shipment activities. Although this information is reviewed and verified for accuracy,
any errors or omissions made by the Company’s distributors and not detected by the Company, if material,
could affect reported operating results.
15
Shipments to ODMs and Other Integrators—As part of its strategy, the Company is attempting to sell
more products directly to certain significant ODMs. Some of these ODMs previously purchased the Compa-
ny’s products through distributors. The Company is making this change because it believes it can better
service its customers, and more efficiently manage its business, as a result. The Company’s sales and margins
may be adversely affected if the Company does not properly execute the transition from indirect to direct sales
for the designated ODMs. It is also possible that the Company’s sales via its distributors may suffer as a result
of this strategy.
As a component manufacturer, the overwhelming majority of products made by the Company are shipped
to third parties for integration with or into other products. The third parties then sell their product, containing
the Company’s components, to other integrators or to the ultimate commercial customer. If these third party
integrators experience delays in developing or manufacturing their products, quality problems, or are unable to
satisfy their customer’s demand for any reason, demand for the Company’s products will be adversely
affected. Shortages of other components used along with the Company’s products could also delay purchases
of the Company’s products. These matters could materially affect the Company’s revenues and profitability.
Seasonality of the Business— The Company’s business historically has been subject to repeated seasonal-
ity, with the first and last quarters of each fiscal year tending to be weaker than the second and third quarters.
The seasonality of the Company’s business may adversely impact the Company’s stock price and result in
additional volatility in its results of operations. Because the Company expects a certain degree of seasonality
in its results, it may fail to recognize an actual downturn in its business, and continue to make investments or
other business decisions that adversely affect its business in the future.
Credit Issues— The Company attempts to mitigate its credit risk by doing business only with creditwor-
thy entities and by managing the amount of credit extended to its customers. However, the Company may
choose to extend credit to certain entities because it is necessary to support the requirements of an important
customer or for other reasons. In the past the Company has had to take certain charges against earnings as a
result of the inability of certain of its customers to pay for goods received. There can be no assurance that the
Company will not incur similar charges in the future.
THE COMPANY’S ‘FABLESS’ BUSINESS MODEL IS HEAVILY CONCENTRATED IN ASIA AND
DEPENDENT ON A SMALL NUMBER OF WAFER AND ASSEMBLY COMPANIES WHO POSSESS
NEGOTIATING LEVERAGE. THE COMPANY IS OFTEN REQUIRED TO COMMIT TO CERTAIN PUR-
CHASE QUANTITIES TO SECURE CAPACITY, AND IS SUBJECT TO FLUCTUATIONS IN
COMMODITY PRICES AND AVAILABILITY
Business Concentration in Asia—A significant number of the Company’s foundries and subcontractors
are located in Asia. Many of the Company’s customers also manufacture in Asia or subcontract to Asian
companies. A significant portion of the world’s personal computer component and circuit board manufacturing,
as well as personal computer assembly, occurs in Asia, and many of the Company’s suppliers and customers
are based in, or do significant business in, Taiwan. In addition, many companies are expanding their opera-
tions in Asia in an attempt to reduce their costs, and the Company is also exploring relationships with
companies in Asia as part of its ongoing efforts to make its supply chain more efficient. This concentration of
manufacturing and selling activity in Asia, and in Taiwan in particular, poses risks that could affect the supply
and cost of the Company’s products, including currency exchange rate fluctuations, economic and trade poli-
cies and the political environment in Taiwan, China and other Asian countries. For example, legislation in the
United States restricting or adding tariffs to imported goods could adversely affect the Company’s operating
results.
The risk of earthquakes in Taiwan and the Pacific Rim region is significant due to the proximity of major
earthquake fault lines in the area. We are not currently covered by insurance against business disruption
caused by earthquakes as such insurance is not currently available on terms that we believe are commercially
reasonable. Earthquakes, fire, flooding, lack of water or other natural disasters in Taiwan or the Pacific Rim
region, or an epidemic, political unrest, war, labor strike or work stoppage in countries where our semiconduc-
tor manufacturers, assemblers and test subcontractors are located, likely would result in the disruption of our
foundry, assembly or test capacity. There can be no assurance that alternate capacity could be obtained on
commercially reasonable terms, if at all.
16
Reliance upon Subcontract Manufacturing— The vast majority of the Company’s products are manufac-
tured and assembled by independent foundries and subcontract manufacturers under a ‘‘fabless’’ model. This
reliance upon foundries and subcontractors involves certain risks, including potential lack of manufacturing
availability, reduced control over delivery schedules, the availability of advanced process technologies,
changes in manufacturing yields, dislocation, expense and delay caused by decisions to relocate manufacturing
facilities or processes, and potential cost fluctuations. During downturns in the semiconductor economic cycle,
such as the current global economic recession, reduction in overall demand for semiconductor products could
financially stress certain of the Company’s subcontractors. If the financial resources of such independent
subcontractors are stressed, the Company may experience future product shortages, quality assurance prob-
lems, increased manufacturing costs or other supply chain disruptions.
During upturns in the semiconductor cycle, it is not always possible to respond adequately to unexpected
increases in customer demand due to capacity constraints. The Company may be unable to obtain adequate
foundry, assembly or test capacity from third-party subcontractors to meet customers’ delivery requirements
even if the Company adequately forecasts customer demand. Alternatively, the Company may have to incur
unexpected costs to expedite orders in order to meet unforecasted customer demand. The Company typically
does not have supply contracts with its third-party vendors that obligate the vendor to perform services and
supply products for a specific period, in specific quantities, and at specific prices. The Company’s third-party
foundry, assembly and test subcontractors typically do not guarantee that adequate capacity will be available
within the time required to meet customer demand for products. In the event that these vendors fail to meet
required demand for whatever reason, the Company expects that it would take up to twelve months to transi-
tion performance of these services to new providers. Such a transition may also require qualification of the
new providers by the Company’s customers or their end customers, which would take additional time. The
requalification process for the entire supply chain including the end customer could take several years for
certain of the Company’s products.
As a result of a manufacturer closing the only plant at which wafers for a particular product are being
made, the Company has made a significant investment in certain automotive inventory before the plant closes
in order to assure continuity of supply for this product. The Company’s results may be adversely affected if it
purchases insufficient inventory to assure continuity of supply, or if it purchases too much inventory and is
forced to write off some portion of its investment.
In the past, the Company received several unexpected price increases from several entities that assemble
or package products. In the past there have been periods of shortage of capacity among companies that supply
assembly services. The Company’s contracts also generally do not protect it from price increases in certain
base commodities used in the semiconductor manufacturing process. Although the Company resists attempts
by suppliers to increase prices, there can be no assurance that the Company’s margins will not be impacted in
fiscal year 2010 or other future periods as a result of a shortage of capacity, changes in commodity prices, or
price increases in assembly or other services. Because at various times the capacity of either wafer producers
or assemblers can been limited, the Company may be unable to satisfy the demand of its customers, or may
have to accept price increases or other compensation arrangements that increase its operating expenses and
erode its margins.
Forecasts of Product Demand— The Company generally must order inventory to be built by its found-
ries and subcontract manufacturers well in advance of product shipments. Production is often based upon
either internal or customer-supplied forecasts of demand, which can be highly unpredictable and subject to
substantial fluctuations. Because of the volatility in the Company’s markets, there is risk that the Company
may forecast incorrectly and produce excess or insufficient inventories. In addition, the Company is sometimes
the only supplier of a particular part to a customer. The value of the product line using the Company’s prod-
uct may far exceed the value of the particular product sold by the Company to its customer. The Company
may be forced to carry additional inventory of certain products to insure that its customers avoid production
interruptions and to avoid claims being made by its customers for supply shortages. The Company’s revenue
and profitability may be adversely affected if it fails to execute properly on this strategy, and causes supply
chain problems for its customers due to insufficient inventory.
17
Prior to purchasing the Company’s products, customers require that products undergo an extensive quali-
fication process, which involves testing of the products in the customer’s system as well as rigorous reliability
testing. This qualification process may continue for six months or longer. However, qualification of a product
by a customer does not ensure any sales of the product to that customer. Even after successful qualification
and sales of a product to a customer, a subsequent revision to the integrated circuit or software, changes in the
integrated circuit’s manufacturing process or the selection of a new supplier by us may require a new qualifi-
cation process, which may result in delays and in us holding excess or obsolete inventory. After products are
qualified, it can take an additional six months or more before the customer commences volume production of
components or devices that incorporate these products. Despite these uncertainties, the Company devotes
substantial resources, including design, engineering, sales, marketing and management efforts, toward qualify-
ing its products with customers in anticipation of sales. If the Company is unsuccessful or delayed in
qualifying any products with a customer, such failure or delay would preclude or delay sales of such product
to the customer, which may impede the Company’s growth and cause its business to suffer.
The Company also invested significantly in fiscal year 2007 and 2008 in new test equipment to reduce
costs. If production volumes are insufficient to utilize this available test capacity, then production related
expenses included in costs of goods sold may be higher than planned. As a result, the Company could be less
competitive than anticipated, which could adversely affect return on investment and profitability.
THE COMPANY HAS GLOBAL OPERATIONS THAT SUBJECT US TO RISKS THAT MAY HARM
OUR RESULTS OF OPERATIONS AND FINANCIAL CONDITION
Global Operations Risks — The Company has sales, R&D, and operations facilities in many countries,
and as a result, we are subject to risks associated with doing business globally. Our global operations may be
subject to risks that may limit our ability to build product, design, develop, or sell products in particular
countries, which could, in turn, harm our results of operations and financial condition, including;
• Security concerns, such as armed conflict and civil or military unrest, crime, political instability, and
terrorist activity;
• Acts of nature, such as typhoons, tsunamis or earthquakes;
• Infrastructure disruptions, such as large-scale outages or interruptions of service from utilities or
telecommunications providers, could in turn cause supply chain interruptions;
• Regulatory requirements and prohibitions that differ between jurisdictions; and
• Restrictions on our operations by governments seeking to support local industries, nationalization of
our operations, and restrictions on our ability to repatriate earnings.
In addition, although most of our products are priced and paid for in U.S. dollars, a significant amount of
certain types of expenses, such as payroll, utilities, tax, and marketing expenses, are paid in local currencies,
and therefore fluctuations in exchange rates could harm our business operating results and financial condition.
In addition, changes in tariff, export and import regulations, and U.S. and non-U.S. monetary policies, may
harm our operating results and financial condition by increasing our expenses and reducing our revenue.
Varying tax rates in different jurisdictions could harm our operating results and financial condition by increas-
ing our overall tax rate.
THE COMPANY’S SUCCESS DEPENDS ON THE EFFECTIVENESS OF ITS ACQUISITIONS,
RETAINING AND INTEGRATING KEY PERSONNEL, AND MANAGING INTELLECTUAL PROPERTY
RISKS AND GROWTH
Strategic Business Acquisitions — The Company has made strategic acquisitions of complementary
businesses, products and technologies in the past, including the OASIS acquisition in 2005, and may continue
to pursue such acquisitions in the future as business conditions warrant. Business acquisitions can involve
numerous risks, including: unanticipated costs and expenses; risks associated with entering new markets in
which the Company has little or no prior experience; diversion of management’s attention from its existing
businesses; potential loss of key employees, particularly those of the acquired business; differences between
the culture of the acquired company and the Company, difficulties in integrating the new business into the
18
Company’s existing businesses, potential dilution of future earnings; and future impairment and write-offs of
purchased goodwill, other intangible assets and fixed assets due to unforeseen events and circumstances. The
company wrote off approximately $52 million worth of goodwill in connection with the OASIS acquisition in
fiscal year 2009. Although the Company believes it has managed the OASIS acquisition well to date, there is
no guarantee that the OASIS or other acquisitions in the future will produce the benefits intended. Future
acquisitions also could cause the Company to incur debt or contingent liabilities or cause the Company to
issue equity securities that could negatively impact the ownership percentages of existing shareholders.
Protection of Intellectual Property— The Company has historically devoted significant resources to
research and development activities and believes that the intellectual property derived from such research and
development is a valuable asset that has been, and will continue to be, important to the Company’s success.
The Company relies upon nondisclosure agreements, contractual provisions and patent and copyright laws to
protect its proprietary rights. No assurance can be given that the steps taken by the Company will adequately
protect its proprietary rights, or that competitors will be prevented from using the Company’s intellectual
property. During its history, the Company has executed patent cross-licensing agreements with many of the
world’s largest semiconductor suppliers, under which the Company receives and conveys various intellectual
property rights. Many of these agreements are still effective. The Company could be adversely affected should
circumstances arise that result in the early termination of these agreements. In addition, the Company also
frequently licenses intellectual property from third parties to meet specific needs as it develops its product
portfolio. The Company’s competitive position and its results could be adversely affected if it is unable to
license desired intellectual property at all, or on commercially reasonable terms.
Infringement and Other Claims —Companies in the semiconductor industry often aggressively protect
and pursue their intellectual property rights. From time to time, the Company has received, and expects to
continue to receive notices claiming that the Company has infringed upon or misused other parties’ proprietary
rights, or claims from its customers for indemnification for intellectual property matters. The Company has
also in the past received, and may again in the future receive, notices of claims related to business transac-
tions conducted with third parties, including asset sales and other divestitures.
If it is determined that the Company’s or its customer’s products or processes were to infringe on other
parties’ intellectual property rights, a court might enjoin the Company or its customer from further manufac-
ture and/or sale of the affected products. The Company would then need to obtain a license from the holders
of the rights and/or reengineer its products or processes in such a way as to avoid the alleged infringement.
There can be no assurance that the Company would be able to obtain any necessary license on commercially
reasonable terms acceptable to the Company or that the Company would be able to reengineer its products or
processes to avoid infringement. An adverse result in litigation arising from such a claim could involve the
assessment of a substantial monetary award for damages related to past product sales that could have a mate-
rial adverse effect on the Company’s results of operations and financial condition. In addition, even if claims
against the Company are not valid or successfully asserted, defense against the claims could result in signifi-
cant costs and a diversion of management and resources. The Company might also be forced to settle such a
claim even if not valid as a result of pressure from its customers, because of the expense of defense, or
because the risk of contesting such a claim is simply too great. Such settlements could adversely affect the
Company’s profitability.
Dependence on Key Personnel— The success of the Company is dependent in large part on the contin-
ued service of its key management, engineering, marketing, sales and support employees. Competition for
qualified personnel is intense in the semiconductor industry, and the loss of current key employees, or the
inability of the Company to attract other qualified personnel, including the inability to offer competitive stock-
based and other compensation, could hinder the Company’s product development and ability to manufacture,
market and sell its products. We believe that our future success will be dependent on retaining the services of
our key personnel, developing their successors and certain internal processes to reduce our reliance on specific
individuals, and on properly managing the transition of key roles when they occur.
THE COMPANY’S RESULTS COULD BE ADVERSELY AFFECTED FROM FAILURE TO COMPLY
WITH LEGAL AND REGULATORY REQUIREMENTS
19
Internal Controls Over Financial Reporting— Section 404 of the Sarbanes-Oxley Act of 2002 requires
the Company to evaluate the effectiveness of its system of internal controls over financial reporting as of the
end of each fiscal year, beginning with fiscal 2005, and to include a report by management assessing the
effectiveness of its system of internal controls over financial reporting within its annual report.
The Company’s management does not expect that its system of internal controls over financial reporting
will prevent all error and all fraud. A control system, no matter how well designed and operated, can provide
only reasonable, not absolute, assurance that the control system’s objectives will be met. Further, the design of
a control system must recognize that there are resource constraints, and the benefits of controls must be
considered relative to their costs. Because of the inherent limitations in all control systems, no evaluation of
controls can provide absolute assurance that all control issues and instances of fraud, if any, involving the
Company have been, or will be, detected. These inherent limitations include faulty judgments in decision-
making and breakdowns that may occur because of simple error or mistake. Controls can also be
circumvented by individual acts, by collusion of two or more people, or by management override of the
controls. The design of any system of controls is based in part on certain assumptions about the likelihood of
future events, and the Company cannot provide assurance that any design will succeed in achieving its stated
goals under all potential future conditions. Over time, controls may become inadequate because of changes in
conditions or deterioration in the degree of compliance with policies or procedures. In addition, because of the
Company’s revenue recognition policies, the accuracy of the Company’s financial statements is dependent on
data received from third party distributors (refer to Part I Item 7. —Management’s Discussion and Analysis ofFinancial Condition and Results of Operations, for further discussion). Because of the inherent limitations in a
cost-effective control system, misstatements due to error or fraud may occur and not be detected.
Although the Company’s management has concluded that its system of internal controls over financial
reporting was effective as of February 28, 2009, there can be no assurance that the Company or its indepen-
dent registered public accounting firm will not identify a material weakness in the system of internal controls
over financial reporting in the future. A material weakness in the Company’s system of internal controls over
financial reporting would require management and/or the Company’s independent registered public accounting
firm to evaluate the Company’s system of internal controls as ineffective. This in turn could lead to a loss of
public confidence, which could adversely affect the Company’s business and the price of its common stock.
Corporate Governance— In recent years, the NASDAQ Global Select Market, on which the Company’s
common stock is listed, has adopted comprehensive rules and regulations relating to corporate governance.
These laws, rules and regulations have increased, and may continue to increase, the scope, complexity and
cost of the Company’s corporate governance, reporting and disclosure practices. Failure to comply with these
rules and regulations could adversely affect the Company, and in a worst case, result in the delisting of its
stock. As a result of these rules, the Company’s board members, Chief Executive Officer, Chief Financial
Officer and other corporate officers could also face increased risks of personal liability in connection with the
performance of their duties. As a result, the Company may have difficulty attracting and retaining qualified
board members and officers, which would adversely affect its business. Further, these developments could
affect the Company’s ability to secure desired levels of directors’ and officers’ liability insurance, requiring the
Company to accept reduced insurance coverage or to incur substantially higher costs to obtain coverage.
Changes in Accounting for Equity Compensation— The Company has historically used stock options and
SARs as a key component of employee compensation in order to align employees’ interests with the interests
of its stockholders, encourage employee retention, and provide competitive compensation packages. The
Financial Accounting Standards Board (‘‘FASB’’) adopted changes to generally accepted accounting principles
known as Statement of Financial Accounting Standards (‘‘SFAS’’) No. 123(R), Share-Based Payment (revised2004) (‘‘SFAS 123(R)’’) requiring a charge to earnings for employee stock option grants and other equity
incentives which became effective beginning in the first quarter of fiscal 2007. To the extent that this or other
new regulations make it more difficult or expensive to grant options to employees, the Company may consider
changes to its equity compensation strategy. To the extent that such changes might limit the Company’s use of
equity-based compensation, it might become more difficult to attract, retain and motivate employees. Any of
these results could materially and adversely affect the Company’s business.
20
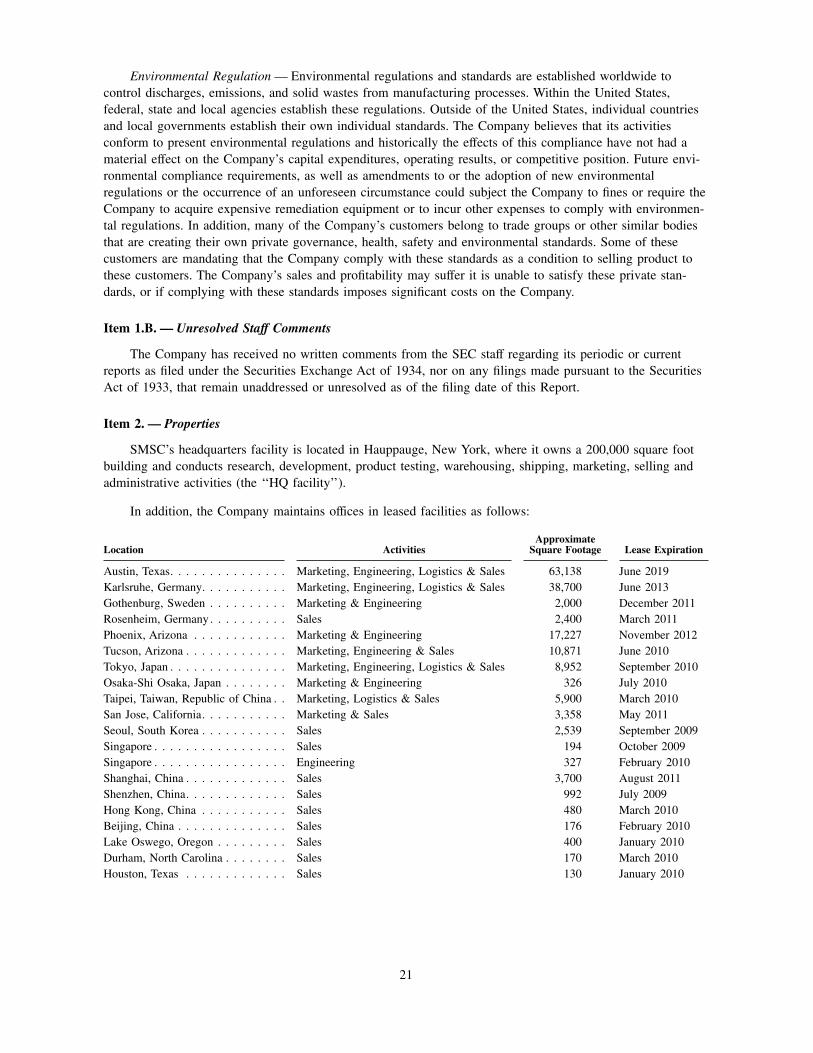
Environmental Regulation — Environmental regulations and standards are established worldwide to
control discharges, emissions, and solid wastes from manufacturing processes. Within the United States,
federal, state and local agencies establish these regulations. Outside of the United States, individual countries
and local governments establish their own individual standards. The Company believes that its activities
conform to present environmental regulations and historically the effects of this compliance have not had a
material effect on the Company’s capital expenditures, operating results, or competitive position. Future envi-
ronmental compliance requirements, as well as amendments to or the adoption of new environmental
regulations or the occurrence of an unforeseen circumstance could subject the Company to fines or require the
Company to acquire expensive remediation equipment or to incur other expenses to comply with environmen-
tal regulations. In addition, many of the Company’s customers belong to trade groups or other similar bodies
that are creating their own private governance, health, safety and environmental standards. Some of these
customers are mandating that the Company comply with these standards as a condition to selling product to
these customers. The Company’s sales and profitability may suffer it is unable to satisfy these private stan-
dards, or if complying with these standards imposes significant costs on the Company.
Item 1.B. — Unresolved Staff Comments
The Company has received no written comments from the SEC staff regarding its periodic or current
reports as filed under the Securities Exchange Act of 1934, nor on any filings made pursuant to the Securities
Act of 1933, that remain unaddressed or unresolved as of the filing date of this Report.
Item 2. — Properties
SMSC’s headquarters facility is located in Hauppauge, New York, where it owns a 200,000 square foot
building and conducts research, development, product testing, warehousing, shipping, marketing, selling and
administrative activities (the ‘‘HQ facility’’).
In addition, the Company maintains offices in leased facilities as follows:
Location ActivitiesApproximate
Square Footage Lease Expiration
Austin, Texas. . . . . . . . . . . . . . . Marketing, Engineering, Logistics & Sales 63,138 June 2019
Karlsruhe, Germany. . . . . . . . . . . Marketing, Engineering, Logistics & Sales 38,700 June 2013
Gothenburg, Sweden . . . . . . . . . . Marketing & Engineering 2,000 December 2011
Rosenheim, Germany . . . . . . . . . . Sales 2,400 March 2011
Phoenix, Arizona . . . . . . . . . . . . Marketing & Engineering 17,227 November 2012
Tucson, Arizona . . . . . . . . . . . . . Marketing, Engineering & Sales 10,871 June 2010
Tokyo, Japan . . . . . . . . . . . . . . . Marketing, Engineering, Logistics & Sales 8,952 September 2010
Osaka-Shi Osaka, Japan . . . . . . . . Marketing & Engineering 326 July 2010
Taipei, Taiwan, Republic of China . . Marketing, Logistics & Sales 5,900 March 2010
San Jose, California. . . . . . . . . . . Marketing & Sales 3,358 May 2011
Seoul, South Korea . . . . . . . . . . . Sales 2,539 September 2009
Singapore . . . . . . . . . . . . . . . . . Sales 194 October 2009
Singapore . . . . . . . . . . . . . . . . . Engineering 327 February 2010
Shanghai, China . . . . . . . . . . . . . Sales 3,700 August 2011
Shenzhen, China. . . . . . . . . . . . . Sales 992 July 2009
Hong Kong, China . . . . . . . . . . . Sales 480 March 2010
Beijing, China . . . . . . . . . . . . . . Sales 176 February 2010
Lake Oswego, Oregon . . . . . . . . . Sales 400 January 2010
Durham, North Carolina . . . . . . . . Sales 170 March 2010
Houston, Texas . . . . . . . . . . . . . Sales 130 January 2010
21
The Company believes that all of its facilities are in good condition, adequate for intended use and
sufficient for its immediate needs. In January 2009, the Company consolidated operations at two previously
leased facilities in Austin, Texas and has taken occupancy of a new 63,138 square foot facility in northern
Austin, Texas. The lease agreement has a term of one hundred and twenty five (125) months, expiring in
June 2019.
The Company currently expects to either renew existing leases or identify suitable alternative leased
space for all leases expiring in fiscal 2010. It is not certain whether the Company will negotiate new leases on
its other facilities as such leases expire in fiscal 2011 and beyond. Such determinations will be made as those
leases approach expiration and will be based on an assessment of requirements and market conditions at that
time. Further, management believes that additional space can be readily obtained, if necessary, based on prior
experience and current and expected real estate market conditions.
Item 3. — Legal Proceedings
From time to time as a normal consequence of doing business, various claims and litigation may be
asserted or commenced against the Company. In particular, the Company in the ordinary course of business
may receive claims that its products infringe the intellectual property of third parties, or that customers have
suffered damage as a result of defective products allegedly supplied by the Company. Due to uncertainties
inherent in litigation and other claims, the Company can give no assurance that it will prevail in any such
matters, which could subject the Company to significant liability for damages and/or invalidate its proprietary
rights. Any lawsuits, regardless of their success, would likely be time-consuming and expensive to resolve and
would divert management’s time and attention, and an adverse outcome of any significant matter could have a
material adverse effect on the Company’s consolidated results of operations or cash flows in the quarter or
annual period in which one or more of these matters are resolved.
On July 3, 2007, OPTi, Inc. (‘‘OPTi’’) filed a lawsuit in the United States District Court for the Eastern
District of Texas against the Company, Advanced Micro Devices, Inc., Atmel Corporation, Broadcom Corpora-
tion, Renesas Technology America, Inc., Silicon Storage Technology, Inc., STMicroelectronics, Inc., and Via
Technology, Inc. OPTi’s Complaint alleges that the Company’s Low Pin Count products infringe two patents
and seeks unspecified damages (including treble damages for willful infringement), attorneys fees and injunc-
tive relief. On September 5, 2007, the Company answered the Complaint, denying OPTi’s allegations and
asserting counterclaims for declaratory judgments of invalidity, unenforceability and noninfringement of the
two patents-in-suit. The Court has set a claim construction hearing for July 30, 2009. On April 13, 2009, the
Court granted OPTi’s unopposed motion to postpone the trial date, which had been previously set for Novem-
ber 2, 2009. The Court has not set a new trial date. The Company intends to vigorously defend against the
allegations of OPTi’s Complaint.
Item 4. — Submission of Matters to a Vote of Security Holders
No matters were submitted to a vote of security holders during the fourth quarter of the fiscal year ended
February 28, 2009.
22
PART II
Item 5. —Market for Registrant’s Common Equity, Related Stockholder Matters and Issuer Purchases ofEquity Securities
Market Information and Holders
The Company’s common stock is traded in the over-the-counter market under the NASDAQ symbol
SMSC. Trading is reported in the NASDAQ Global Select Market. There were approximately 1,069 holders of
record of the Company’s common stock at February 28, 2009.
The following table sets forth the high and low trading prices, for the periods indicated, for SMSC’s
common stock as reported by the NASDAQ Global Select Market:
Fiscal 2009 Fiscal 2008
High Low High Low
First Quarter . . . . . . . . . . . . . . . . . . . . . . . . . . . . $33.09 $26.50 $35.25 $27.31
Second Quarter . . . . . . . . . . . . . . . . . . . . . . . . . . $32.60 $24.47 $37.95 $30.37
Third Quarter . . . . . . . . . . . . . . . . . . . . . . . . . . . $29.68 $12.07 $39.95 $33.13
Fourth Quarter . . . . . . . . . . . . . . . . . . . . . . . . . . $17.79 $13.00 $39.60 $28.22
Dividend Policy
The present policy of the Company is to retain earnings to provide funds for the operation and expansion
of its business. The Company has never paid a cash dividend and does not currently expect to pay cash divi-
dends in the foreseeable future.
Securities Authorized for Issuance Under Equity Compensation Plans
The information under the caption ‘‘Equity Compensation Plan Information,’’ appearing in the 2009
Proxy Statement related to the 2009 Annual Meeting of Stockholders (the ‘‘2009 Proxy Statement’’), is hereby
incorporated by reference. For additional information on the Company’s stock-based compensation plans, refer
to Part IV Item 15(a)(1) — Financial Statements—Note 14.
Common Stock Repurchase Program
In October 1998, the Company’s Board of Directors approved a common stock repurchase program,
allowing the Company to repurchase up to one million shares of its common stock on the open market or in
private transactions. The Board of Directors authorized the repurchase of additional shares in one million
share increments in July 2000, July 2002, November 2007 and April 2008, bringing the total authorized
repurchases to five million shares as of February 28, 2009.
As of February 28, 2009, the Company has repurchased approximately 4.5 million shares of its common
stock at a cost of $101.2 million under this program, including 1,084,089 shares repurchased at a cost of
$28.5 million in fiscal 2009, 1,165,911 shares repurchased at a cost of $40.6 million in fiscal 2008 and
253,300 shares repurchased at a cost of $6.1 million in fiscal 2007.
There was no share repurchase activity for the fourth quarter of fiscal 2009.
23
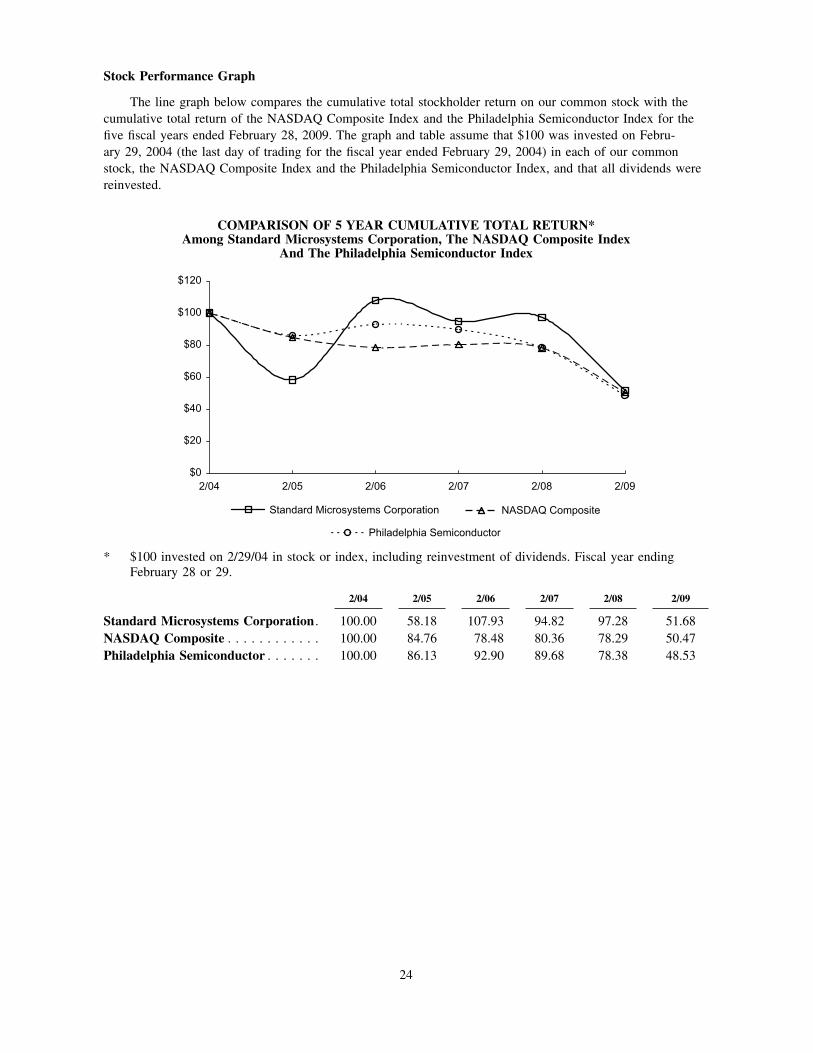
Stock Performance Graph
The line graph below compares the cumulative total stockholder return on our common stock with the
cumulative total return of the NASDAQ Composite Index and the Philadelphia Semiconductor Index for the
five fiscal years ended February 28, 2009. The graph and table assume that $100 was invested on Febru-
ary 29, 2004 (the last day of trading for the fiscal year ended February 29, 2004) in each of our common
stock, the NASDAQ Composite Index and the Philadelphia Semiconductor Index, and that all dividends were
reinvested.
COMPARISON OF 5 YEAR CUMULATIVE TOTAL RETURN*Among Standard Microsystems Corporation, The NASDAQ Composite Index
And The Philadelphia Semiconductor Index
$0
$20
$40
$60
$80
$100
$120
2/04 2/05 2/06 2/07 2/08 2/09
Standard Microsystems Corporation NASDAQ Composite
Philadelphia Semiconductor
* $100 invested on 2/29/04 in stock or index, including reinvestment of dividends. Fiscal year ending
February 28 or 29.
2/04 2/05 2/06 2/07 2/08 2/09
Standard Microsystems Corporation . 100.00 58.18 107.93 94.82 97.28 51.68
NASDAQ Composite . . . . . . . . . . . . 100.00 84.76 78.48 80.36 78.29 50.47
Philadelphia Semiconductor . . . . . . . 100.00 86.13 92.90 89.68 78.38 48.53
24
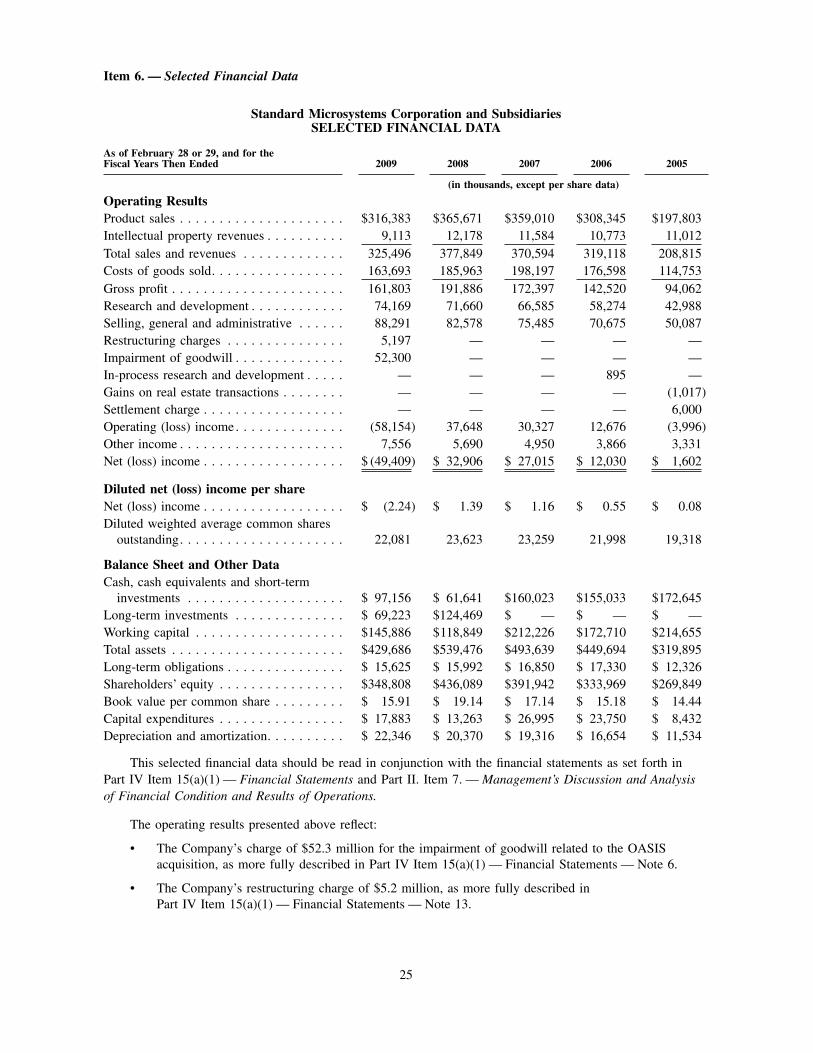
Item 6. — Selected Financial Data
Standard Microsystems Corporation and SubsidiariesSELECTED FINANCIAL DATA
As of February 28 or 29, and for theFiscal Years Then Ended 2009 2008 2007 2006 2005
(in thousands, except per share data)
Operating ResultsProduct sales . . . . . . . . . . . . . . . . . . . . . $316,383 $365,671 $359,010 $308,345 $197,803
Intellectual property revenues . . . . . . . . . . 9,113 12,178 11,584 10,773 11,012
Total sales and revenues . . . . . . . . . . . . . 325,496 377,849 370,594 319,118 208,815
Costs of goods sold. . . . . . . . . . . . . . . . . 163,693 185,963 198,197 176,598 114,753
Gross profit . . . . . . . . . . . . . . . . . . . . . . 161,803 191,886 172,397 142,520 94,062
Research and development . . . . . . . . . . . . 74,169 71,660 66,585 58,274 42,988
Selling, general and administrative . . . . . . 88,291 82,578 75,485 70,675 50,087
Restructuring charges . . . . . . . . . . . . . . . 5,197 — — — —
Impairment of goodwill . . . . . . . . . . . . . . 52,300 — — — —
In-process research and development . . . . . — — — 895 —
Gains on real estate transactions . . . . . . . . — — — — (1,017)
Settlement charge . . . . . . . . . . . . . . . . . . — — — — 6,000
Operating (loss) income . . . . . . . . . . . . . . (58,154) 37,648 30,327 12,676 (3,996)
Other income . . . . . . . . . . . . . . . . . . . . . 7,556 5,690 4,950 3,866 3,331
Net (loss) income . . . . . . . . . . . . . . . . . . $ (49,409) $ 32,906 $ 27,015 $ 12,030 $ 1,602
Diluted net (loss) income per shareNet (loss) income . . . . . . . . . . . . . . . . . . $ (2.24) $ 1.39 $ 1.16 $ 0.55 $ 0.08
Diluted weighted average common shares
outstanding. . . . . . . . . . . . . . . . . . . . . 22,081 23,623 23,259 21,998 19,318
Balance Sheet and Other DataCash, cash equivalents and short-term
investments . . . . . . . . . . . . . . . . . . . . $ 97,156 $ 61,641 $160,023 $155,033 $172,645
Long-term investments . . . . . . . . . . . . . . $ 69,223 $124,469 $ — $ — $ —
Working capital . . . . . . . . . . . . . . . . . . . $145,886 $118,849 $212,226 $172,710 $214,655
Total assets . . . . . . . . . . . . . . . . . . . . . . $429,686 $539,476 $493,639 $449,694 $319,895
Long-term obligations . . . . . . . . . . . . . . . $ 15,625 $ 15,992 $ 16,850 $ 17,330 $ 12,326
Shareholders’ equity . . . . . . . . . . . . . . . . $348,808 $436,089 $391,942 $333,969 $269,849
Book value per common share . . . . . . . . . $ 15.91 $ 19.14 $ 17.14 $ 15.18 $ 14.44
Capital expenditures . . . . . . . . . . . . . . . . $ 17,883 $ 13,263 $ 26,995 $ 23,750 $ 8,432
Depreciation and amortization. . . . . . . . . . $ 22,346 $ 20,370 $ 19,316 $ 16,654 $ 11,534
This selected financial data should be read in conjunction with the financial statements as set forth in
Part IV Item 15(a)(1) — Financial Statements and Part II. Item 7. — Management’s Discussion and Analysisof Financial Condition and Results of Operations.
The operating results presented above reflect:
• The Company’s charge of $52.3 million for the impairment of goodwill related to the OASIS
acquisition, as more fully described in Part IV Item 15(a)(1) — Financial Statements — Note 6.
• The Company’s restructuring charge of $5.2 million, as more fully described in
Part IV Item 15(a)(1) — Financial Statements — Note 13.
25
• The receipts of $9.0 million, $12.0 million, $11.3 million, $10.3 million and $10.0 million of certain
intellectual property payments in fiscal 2009, 2008, 2007, 2006 and 2005, respectively, as more fully
described in Part IV Item 15(a)(1) — Financial Statements — Note 12.
• Sales of real estate in fiscal 2005 as more fully described in Part IV Item 15(a)(1) — Financial
Statements — Note 10 of the Company’s Annual Report on Form 10-K for the fiscal year ended
February 28, 2007, as filed with the SEC on April 30, 2007 (the ‘‘FY2007 Form 10-K’’).
• A litigation settlement charge of $6.0 million in fiscal 2005, as more fully described in Part IV
Item 15(a)(1) — Financial Statements — Note 14 of the Company’s FY2007 Form 10-K.
• The write-off of $2.7 million of inventory held by one of the Company’s distributors during fiscal
2005, as more fully described in Part IV Item 15(a)(1) — Financial Statements — Note 2 of the
Company’s FY2007 Form 10-K.
• The Company’s acquisition of OASIS SiliconSystems Holding AG on March 30, 2005, as more fully
described in Part IV Item 15(a)(1) — Financial Statements — Note 5 of the Company’s FY2008
Form 10-K.
26
Item 7. —Management’s Discussion and Analysis of Financial Conditions and Results of Operations
GENERAL
The following discussion should be read in conjunction with the Company’s consolidated financial state-
ments and accompanying notes, included in Part IV Item 15(a)(1) — Financial Statements, of this Report.
Forward-Looking Statements
Portions of this Report may contain forward-looking statements, within the meaning of Section 27A of
the Securities Act of 1933, as amended, and Section 21E of the Securities Exchange Act of 1934, as amended,
that are based on management’s beliefs and assumptions, current expectations, estimates and projections. Such
statements, including statements relating to the Company’s expectations for future financial performance, are
not considered historical facts and are considered forward-looking statements under the federal securities laws.
Words such as ‘‘believe,’’ ‘‘expect,’’ ‘‘anticipate’’ and similar expressions identify forward-looking statements.
These risks and related uncertainties may cause the Company’s actual future results to be materially different
from those discussed in forward-looking statements. The Company’s risks and uncertainties include the timely
development and market acceptance of new products; the impact of competitive products and pricing; the
Company’s ability to procure capacity from suppliers and the timely performance of their obligations, com-
modity prices, interest rates and foreign exchange, potential investment losses as a result of market liquidity
conditions, the effects of changing economic conditions domestically and internationally and on its customers;
relationships with and dependence on customers and growth rates in the personal computer, consumer elec-
tronics and embedded and automotive markets and within the Company’s sales channel; changes in customer
order patterns, including order cancellations or reduced bookings; the effects of tariff, import and currency
regulation; potential or actual litigation; and excess or obsolete inventory and variations in inventory valua-
tion, among others. In addition, SMSC competes in the semiconductor industry, which has historically been
characterized by intense competition, rapid technological change, cyclical market patterns, price erosion and
periods of mismatched supply and demand.
The Company’s forward looking statements are qualified in their entirety by the inherent risks and uncer-
tainties surrounding future expectations and may not reflect the potential impact of any future acquisitions,
mergers or divestitures. All forward-looking statements speak only as of the date hereof and are based upon
the information available to SMSC at this time. Such statements are subject to change, and the Company does
not undertake to update such statements, except to the extent required under applicable law and regulation.
These and other risks and uncertainties, including potential liability resulting from pending or future litigation,
are detailed from time to time in the Company’s periodic and current reports as filed with the SEC. Readers
are advised to review other sections of this Report, including Part I Item 1.A. — Risk Factors, for a more
complete discussion of these and other risks and uncertainties. Other cautionary statements and risks and
uncertainties may also appear elsewhere in this Report.
Description of Business
SMSC designs and sells a wide range of silicon-based integrated circuits that utilize analog and mixed-
signal technologies. The Company’s integrated circuits and systems provide a wide variety of signal
processing attributes that are incorporated by its globally diverse customers into numerous end products in the
Consumer Electronics, Automotive, Mobile PC, Desktop PC and Industrial markets. These products generally
provide connectivity, networking, or input/output control solutions for a variety of high-speed communication,
computer and related peripheral, consumer electronics, industrial control systems or automotive information
applications. The market for these solutions is increasingly diverse, and the Company’s technologies are
increasingly used in various combinations and in alternative applications.
CRITICAL ACCOUNTING POLICIES & ESTIMATES
The preparation of financial statements in conformity with accounting principles generally accepted in the
United States (‘‘U.S. GAAP’’) requires management to make estimates and assumptions that affect the
reported amount of assets and liabilities and disclosure of contingent assets and liabilities at the date of the
financial statements and the reported amount of sales and revenues and expenses during the reporting period.
SMSC believes the following critical accounting policies and estimates are important to the portrayal of
the Company’s financial condition, results of operations and cash flows, and require critical management
27
judgments and estimates about matters that are inherently uncertain. Although management believes that its
judgments and estimates are appropriate and reasonable, actual future results may differ from these estimates,
and to the extent that such differences are material, future reported operating results may be affected.
Revenue Recognition
Sales and associated gross profit from shipments to the Company’s distributors, other than to distributors
in Japan, are deferred until the distributors resell the products. Shipments to distributors, other than to dis-
tributors in Japan, are made under agreements allowing price protection and limited rights to return unsold
merchandise. In addition, SMSC’s shipments to its distributors may be subject from time to time to short-term
fluctuations as distributors manage their inventories to current levels of end-user demand. Therefore, SMSC
considers the policy of deferring revenue on shipments to distributors to be a more meaningful presentation of
the Company’s operating results, as reported sales are more representative of end-user demand. This policy is
a common practice within the semiconductor industry. The Company’s revenue recognition is therefore highly
dependent upon receiving pertinent, accurate and timely data from its distributors. Distributors routinely
provide the Company with product, price, quantity and end customer data when products are resold, as well as
periodic inventory data. In determining the appropriate amount of revenue to recognize, the Company uses
this data in reconciling any differences between the distributors’ reported inventories and shipment activities.
Although this information is reviewed and verified for accuracy, any errors or omissions made by the Compa-
ny’s distributors and not detected by the Company, if material, could affect reported operating results.
Shipments made by the Company’s Japanese subsidiary to distributors in Japan are made under agree-
ments that permit limited or no stock return or price protection privileges. SMSC recognizes revenue from
product sales to distributors in Japan, and to original equipment manufacturers (OEMs), as title passes upon
delivery, net of appropriate reserves for product returns and allowances.
Inventories
The Company’s inventories are comprised of complex, high technology products that may be subject to
rapid technological obsolescence and which are sold in a highly competitive industry. Inventories are valued at
the lower of standard cost (which approximates first-in, first-out cost) or market, and are reviewed at least
quarterly for product obsolescence, excess balances and other indications of impairment in value, based upon
assumptions of future demand and market conditions. When it is determined that specific inventory is stated at
a higher value than that which can be recovered, the Company writes this inventory down to its estimated
realizable value with a charge to costs of goods sold. While the Company endeavors to appropriately forecast
customer demand and stock commensurate levels of inventory, unanticipated inventory write-downs may be
required in future periods relating to inventory on hand as of any reported balance sheet date.
Fair Value Measurements
Effective March 1, 2008, the Company adopted Financial Accounting Standards Board (‘‘FASB’’) State-
ment of Financial Accounting Standards (‘‘SFAS’’) No. 157 ‘‘Fair Value Measurements’’ (‘‘SFAS 157’’), except
as it applies to the non-financial assets and non-financial liabilities subject to FSP SFAS 157-2. SFAS 157
clarifies the definition of fair value, establishes a framework for measurement of fair value and expands disclo-
sure about fair value measurements. SFAS 157 is effective for fiscal years beginning after November 15, 2007
(the Company’s current fiscal year ended February 28, 2009), except as amended by FASB Staff Position
(‘‘FSP’’) SFAS 157-1, which was effective upon adoption during the Company’s current fiscal year ended
February 28, 2009, FSP SFAS 157-2, which is effective for fiscal years beginning after November 15, 2008
(SMSC’s fiscal year beginning March 1, 2009, or fiscal 2010) and FSP SFAS No. 157-3, which was effective
upon adoption during the Company’s current fiscal year ended February 28, 2009. FSP SFAS 157-1 and FSP
SFAS 157-2 allow partial adoption relating to fair value measurements for non-financial assets and liabilities
that are not measured at fair value on a recurring basis. FSP SFAS No. 157-3 clarifies the application of SFAS
No. 157 in a market that is not active and provides an example to illustrate key considerations in determining
the fair value of a financial asset when the market for that financial asset is not active. The Company will
adopt the remaining provisions of SFAS 157 in the first quarter of fiscal 2010, and does not anticipate that its
adoption will have a material impact on its consolidated financial statements.
28
SFAS 157 requires disclosure regarding the manner in which fair value is determined for assets and
liabilities and establishes a three-tiered value hierarchy into which these assets and liabilities must be grouped,
based upon significant levels of inputs as follows:
• Level 1—Quoted prices in active markets for identical assets or liabilities.
• Level 2—Observable inputs, other than Level 1 prices, such as quoted prices in active markets for
similar assets and liabilities, quoted prices for identical or similar assets and liabilities in markets
that are not active, or other inputs that are observable or can be corroborated by observable market
data.
• Level 3—Unobservable inputs that are supported by little or no market activity and that are signifi-
cant to the fair value of the assets or liabilities. This includes certain pricing models, discounted
cash flow methodologies and similar techniques that use significant unobservable inputs.
The lowest level of significant input determines the placement of the entire fair value measurement in the
hierarchy.
Level 3 assets consist primarily of auction rate securities. The Company estimates the fair value of these
investments based on a trinomial discount model. This model considers the probability of three potential
occurrences for each auction event through the maturity date of the security. The three potential outcomes for
each auction are (i) successful auction/early redemption, (ii) failed auction and (iii) issuer default. Inputs in
determining the probabilities of the potential outcomes include, but are not limited to, the security’s collateral,
credit rating, insurance, issuer’s financial standing, contractual restrictions on disposition and the liquidity in
the market. The fair value of each security is determined by summing the present value of the probability
weighted future principal and interest payments determined by the model. The discount rate was determined
using a proxy based upon the current market rates for successful auctions within the AAA-rated auction rate
securities market. The expected term was based on management’s estimate of future liquidity. The illiquidity
discount was based on the levels of federal insurance or FFELP backing for each security as well as consider-
ing similar preferred stock securities ratings and asset backed ratio requirements for each security.
Stock-Based Compensation
The Company has several stock-based compensation plans in effect under which incentive stock options,
non-qualified stock options, restricted stock awards (‘‘RSAs’’) and stock appreciation rights (‘‘SARs’’) are
granted to employees and directors. Stock options and SARs are granted with exercise prices equal to the fair
value of the underlying shares on the date of grant. New shares of common stock are issued in settling stock
option exercises and restricted stock awards.
Effective March 1, 2006 the Company adopted SFAS No. 123 (revised 2004), Share-Based Payment(‘‘SFAS 123R’’). SFAS 123R supersedes Accounting Principles Board Opinion No. 25, Accounting for StockIssued to Employees (‘‘APB 25’’) and related interpretations and amends SFAS No. 95, Statement of CashFlows. SFAS 123R requires all share-based payments to employees, including grants of employee stock
options, restricted stock units and employee stock purchase rights, to be recognized in the financial statements
based on their respective grant date fair values and does not allow the previously permitted pro forma
disclosure-only method as an alternative to financial statement recognition. SFAS 123R also requires the
benefits of tax deductions in excess of recognized compensation cost be reported as a financing cash flow,
rather than as an operating cash flow as required under previous literature. In March 2005 the SEC issued
Staff Accounting Bulletin No. 107 (‘‘SAB 107’’), which provides guidance regarding the interaction of
SFAS 123R and certain SEC rules and regulations. The Company considered the provisions of SAB 107 in its
adoption of SFAS 123R.
The Company elected the modified prospective transition method as permitted by SFAS 123R. Accord-
ingly, prior periods were not revised to reflect the impact of SFAS 123R. Under this transition method,
compensation cost recognized includes: (i) compensation cost for all stock-based payments granted prior to,
but not yet vested as of, February 28, 2006 (based on the grant-date fair value estimated in accordance with
the original provisions of SFAS No. 123, Accounting for Stock-Based Compensation (‘‘SFAS 123’’), and
previously presented in the pro forma footnote disclosures); and (ii) compensation cost for all stock-based
29
payments granted or modified subsequent to February 28, 2006 (based on fair values estimated in accordance
with the new provisions of SFAS No. 123R).
In connection with the implementation of SFAS No. 123R, the Company elected the long form method in
determining our additional paid-in capital pool of windfall benefits and the graded vesting method to amortize
compensation expense over the service period. The estimated value of the Company’s stock-based awards
(including stock options, restricted stock awards and stock appreciation rights), less expected forfeitures, is
amortized over the awards’ respective requisite service period, which is generally the vesting period, on a
straight-line basis.
Subsequent to the adoption of SFAS No. 123(R), the Black-Scholes option pricing model is used for
estimating the fair value of options and SARs granted and corresponding compensation expense to be recog-
nized. The Black-Scholes model requires certain assumptions, judgements and estimates by the Company to
determine fair value, including expected stock price volatility, risk-free interest rate and expected life. The
Company based the expected volatility on historical volatility. Beginning in the first quarter of fiscal 2009, the
Company based the expected term of options granted using the midpoint scenario, which combines historical
exercise data with hypothetical exercise data. Prior to that, the Company based expected term of options on an
actuarial model. The expected term of each individual SARs award is currently assumed to be the midpoint of
the remaining term through expiration as of any remeasurement date. Share-based compensation amounts
related to RSAs is calculated based on the market price of the Company’s common stock on the date of grant.
There were no dividends expected to be paid on the Company’s common stock over the expected lives esti-
mated.
Allowance for Doubtful Accounts
The Company maintains allowances for doubtful accounts for estimated losses resulting from the inability
of its customers to make required payments. These estimated losses are based upon historical bad debts,
specific customer creditworthiness and current economic trends. The Company regularly performs credit
evaluations consisting primarily of reviews of its customers’ financial condition, using information provided
by the customers as well as publicly available information, if any. If the financial condition of an individual
customer or group of customers deteriorates, resulting in such customers’ inability to make payments within
approved credit terms, additional allowances may be required.
Valuation of Long-Lived Assets
Long-lived assets, including property, plant and equipment, and definite-lived intangible assets, are moni-
tored and reviewed for impairment in value whenever events or changes in circumstances indicate that the
carrying amount of any such asset may not be recoverable. The determination of recoverability is based on an
estimate of undiscounted cash flows expected to result from the use of the related asset and its eventual
disposition. The estimated cash flows are based upon, among other things, certain assumptions about expected
future operating performance, growth rates and other factors. Estimates of undiscounted cash flows may differ
from actual cash flows due to factors such as technological changes, economic conditions, and changes in the
Company’s business model or operating performance. If at the time of such evaluation the sum of expected
undiscounted cash flows (excluding interest) is below the carrying value, an impairment loss is recognized,
which is measured as the amount by which the carrying value exceeds the fair value of the asset.
30
Indefinite-lived intangible assets are also reviewed annually for potential impairment. As of February 28,
2009, the Company had $5.4 million of trademarks associated with its automotive reporting unit, which was
evaluated and deemed recoverable as part of the assessment of related goodwill.
Goodwill is tested for impairment in value annually, as well as when events or circumstances indicate
possible impairment in value. The Company performs an annual goodwill impairment review during the fourth
quarter of each fiscal year. The Company completed its most recent annual goodwill impairment review
during the fourth quarter of fiscal 2009. In accordance with SFAS 142, we compared the carrying value of
each of our reporting units that existed at those times to their estimated fair value. For purposes of SFAS 142
testing, the Company has two reporting units: the automotive reporting unit and the analog/mixed signal
reporting unit. The automotive unit consists of those portions of the business that were acquired in the
March 30, 2005 acquisition of OASIS including the infotainment networking technology known as Media
Oriented Systems Transport (‘‘MOST’’). The analog/mixed signal reporting unit is comprised of most other
portions of the business.
The Company considered both the market and income approaches in determining the estimated fair value
of the reporting units, specifically the market multiple methodology and discounted cash flow methodology.
The market multiple methodology involved the utilization of various revenue and cash flow measures at
appropriate risk-adjusted multiples. Multiples were determined through an analysis of certain publicly traded
companies that were selected on the basis of operational and economic similarity with the business operations.
Provided these companies meet these criteria, they can be considered comparable from an investment stand-
point even if the exact business operations and/or characteristics of the entities are not the same. Revenue and
EBITDA multiples were calculated for the comparable companies based on market data and published finan-
cial reports. A comparative analysis between the Company and the public companies deemed to be
comparable formed the basis for the selection of appropriate risk-adjusted multiples for the Company. The
comparative analysis incorporates both quantitative and qualitative risk factors which relate to, among other
things, the nature of the industry in which the Company and other comparable companies are engaged. In the
discounted cash flow methodology, long-term projections prepared by the Company were utilized, which were
recently revised in light of the current economic environment. The cash flows projected were analyzed on a
‘‘debt-free’’ basis (before cash payments to equity and interest bearing debt investors) in order to develop an
enterprise value. A provision, based on these projections, for the value of the Company at the end of the
forecast period, or terminal value, was also made. The present value of the cash flows and the terminal value
were determined using a risk-adjusted rate of return, or ‘‘discount rate.’’
Upon completion of the fiscal 2009 assessment, it was determined that the carrying value of our automo-
tive reporting unit exceeded its estimated fair value. The estimated fair value of the analog/mixed signal
reporting unit exceeded carrying value. Because indicators of impairment existed for the goodwill associated
with the automotive reporting unit, we performed the second step of the test required under SFAS 142 to
determine the fair value of the related goodwill.
In accordance with SFAS 142, the implied fair value of goodwill was determined in the same manner as
utilized to estimate the amount of goodwill recognized in a business combination. To determine the implied
value of goodwill, fair values were allocated to the assets and liabilities of the reporting unit as of Febru-
ary 28, 2009. As part of the second step of the impairment test performed, the Company determined the
implied fair value of certain long-lived intangible assets, including developed technology, customer relation-
ships and trademarks. Current implied fair values of these long-lived intangibles were determined to be in
excess of net book values as of February 28, 2009. The implied fair value of goodwill was measured as the
excess of the fair value of the reporting unit over the fair value amounts assigned to its assets and liabilities.
The impairment loss for the reporting unit was measured by the amount the carrying value of goodwill
exceeded the fair value of the goodwill. Based on this assessment, we recorded a charge of $52.3 million as
of February 29, 2009. Refer to Part IV Item 15(a)(i) — Financial Statements—Note 6, for additional infor-
mation.
31
Income Taxes
Accounting for income tax obligations requires the recognition of deferred tax assets and liabilities for
the tax effects of differences between the book and tax bases of recorded assets and liabilities as well as tax
attributes such as net operating loss and tax credit carryforwards. Deferred tax assets resulting from these
differences must be reduced by a valuation allowance if it is more likely than not that some or all of the
deferred tax assets will not be realized.
The Company regularly evaluates the realizability of its deferred tax assets by assessing its forecasts of
future taxable income and reviewing available tax planning strategies that could be implemented to realize the
deferred tax assets. At February 28, 2009, the Company had $41.1 million of deferred tax assets net of a
valuation allowance of $5.8 million and $12.9 million of deferred tax liabilities. The Company’s ability to
utilize its deferred tax assets and the continuing need for related valuation allowances are monitored on an
ongoing basis.
In July 2006, the FASB issued FASB Interpretation (‘‘FIN’’) No. 48, Accounting for Uncertainty inIncome Taxes — an interpretation of FASB Statement No. 109 (‘‘FIN 48’’), which for SMSC, became effective
as of March 1, 2007. FIN 48 clarifies the accounting for uncertainty in income taxes recognized in an enter-
prise’s financial statements in accordance with SFAS No. 109, Accounting for Income Taxes (‘‘SFAS 109’’).FIN 48 requires that all tax positions be evaluated using a recognition threshold and measurement attribute for
the financial statement recognition and measurement of a tax position taken or expected to be taken in a tax
return. Differences between tax positions taken in a tax return and amounts recognized in the financial state-
ments are recorded as adjustments to income taxes payable or receivable, or adjustments to deferred taxes, or
both. The Company adopted FIN 48 on March 1, 2007. As a result of the adoption of this accounting pro-
nouncement, the Company recognized $1.5 million of previously unrecognized tax benefits, which was
accounted for as an increase to the opening balance of retained earnings. At adoption the company’s total
unrecognized tax benefits was stated at $3.3 million which included $0.6 million of interest.
Legal Contingencies
From time to time, the Company is subject to legal proceedings and claims, including claims of alleged
infringement of patents and other intellectual property rights and other claims arising in the ordinary course of
business. These contingencies require management to assess the likelihood and possible cost of adverse judg-
ments or outcomes. Liabilities for legal contingencies are accrued when it is probable that a liability has been
incurred and the amount of the liability can be reasonably estimated. There can be no assurance that any
third-party assertions against the Company will be resolved without costly litigation, in a manner that is not
adverse to its financial position, results of operations or cash flows. In addition, the resolution of any future
intellectual property litigation may subject the Company to royalty obligations, product redesigns or discon-
tinuance of products, any of which could adversely impact future profitability.
Recent Accounting Pronouncements
In April 2009, the FASB issued three related Staff Positions: (i) FSP 157-4, ‘‘Determining Fair ValueWhen the Volume and Level of Activity for the Asset or Liability have Significantly Decreased and IdentifyingTransactions That Are Not Orderly’’ (‘‘FSP 157-4’’); (ii) SFAS 115-2 and SFAS 124-2, ‘‘Recognition andPresentation of Other-Than-Temporary Impairments’’ (‘‘FSP 115-2 and FSP 124-2’’); and (iii) SFAS 107-1
and APB 28-1, ‘‘Interim Disclosures about Fair Value of Financial Instruments’’ (‘‘FSP 107 and APB 28-1’’),
which will be effective for interim and annual periods ending after June 15, 2009 (SMSC’s fiscal quarter
ending August 31, 2009). FSP 157-4 provides guidance on how to determine the fair value of assets and
liabilities under SFAS 157 in the current economic environment and reemphasizes that the objective of a fair
value measurement remains an exit price. If it were concluded that there has been a significant decrease in the
volume and level of activity of the asset or liability in relation to normal market activities, quoted market
values may not be representative of fair value. In such instances, changes in valuation techniques or the use of
multiple valuation techniques may be appropriate. FSP 115-2 and FSP 124-2 modify the requirements for
recognizing other-than-temporarily impaired debt securities and revise the existing impairment model for such
securities, by modifying the current intent and ability indicator in determining whether a debt security is
other-than-temporarily impaired. FSP 107 and APB 28-1 enhance the disclosure of instruments under the
32
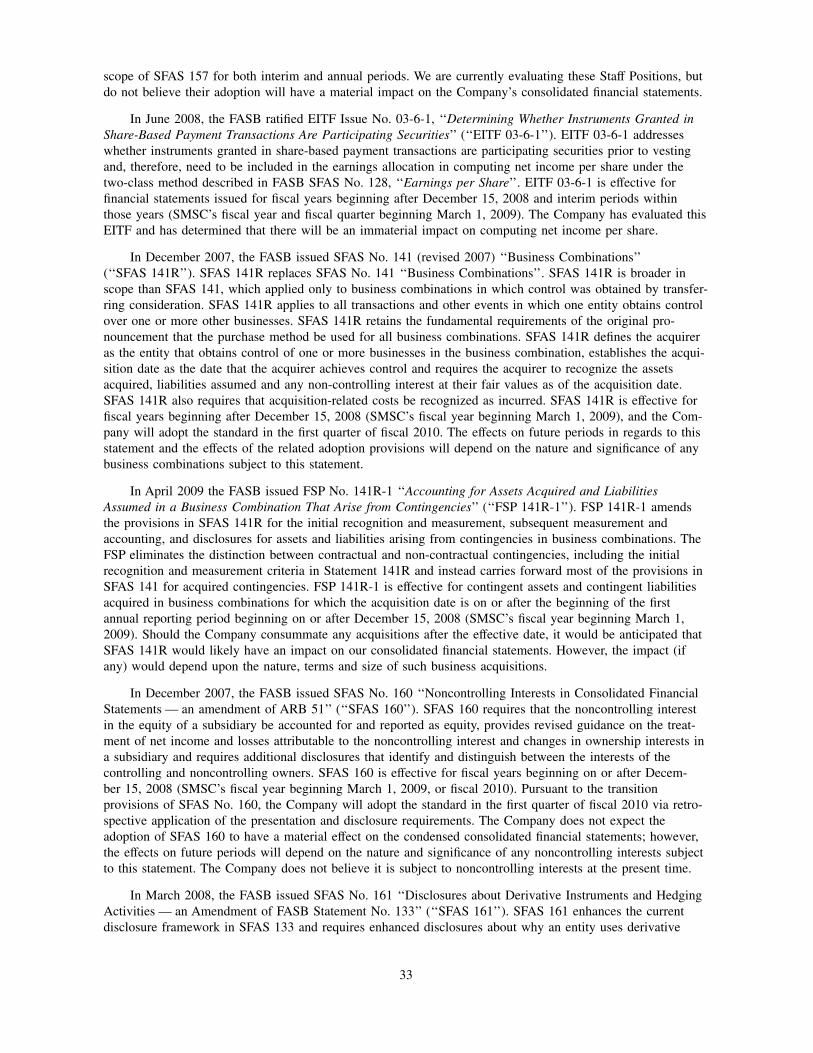
scope of SFAS 157 for both interim and annual periods. We are currently evaluating these Staff Positions, but
do not believe their adoption will have a material impact on the Company’s consolidated financial statements.
In June 2008, the FASB ratified EITF Issue No. 03-6-1, ‘‘Determining Whether Instruments Granted inShare-Based Payment Transactions Are Participating Securities’’ (‘‘EITF 03-6-1’’). EITF 03-6-1 addresses
whether instruments granted in share-based payment transactions are participating securities prior to vesting
and, therefore, need to be included in the earnings allocation in computing net income per share under the
two-class method described in FASB SFAS No. 128, ‘‘Earnings per Share’’. EITF 03-6-1 is effective for
financial statements issued for fiscal years beginning after December 15, 2008 and interim periods within
those years (SMSC’s fiscal year and fiscal quarter beginning March 1, 2009). The Company has evaluated this
EITF and has determined that there will be an immaterial impact on computing net income per share.
In December 2007, the FASB issued SFAS No. 141 (revised 2007) ‘‘Business Combinations’’
(‘‘SFAS 141R’’). SFAS 141R replaces SFAS No. 141 ‘‘Business Combinations’’. SFAS 141R is broader in
scope than SFAS 141, which applied only to business combinations in which control was obtained by transfer-
ring consideration. SFAS 141R applies to all transactions and other events in which one entity obtains control
over one or more other businesses. SFAS 141R retains the fundamental requirements of the original pro-
nouncement that the purchase method be used for all business combinations. SFAS 141R defines the acquirer
as the entity that obtains control of one or more businesses in the business combination, establishes the acqui-
sition date as the date that the acquirer achieves control and requires the acquirer to recognize the assets
acquired, liabilities assumed and any non-controlling interest at their fair values as of the acquisition date.
SFAS 141R also requires that acquisition-related costs be recognized as incurred. SFAS 141R is effective for
fiscal years beginning after December 15, 2008 (SMSC’s fiscal year beginning March 1, 2009), and the Com-
pany will adopt the standard in the first quarter of fiscal 2010. The effects on future periods in regards to this
statement and the effects of the related adoption provisions will depend on the nature and significance of any
business combinations subject to this statement.
In April 2009 the FASB issued FSP No. 141R-1 ‘‘Accounting for Assets Acquired and LiabilitiesAssumed in a Business Combination That Arise from Contingencies’’ (‘‘FSP 141R-1’’). FSP 141R-1 amends
the provisions in SFAS 141R for the initial recognition and measurement, subsequent measurement and
accounting, and disclosures for assets and liabilities arising from contingencies in business combinations. The
FSP eliminates the distinction between contractual and non-contractual contingencies, including the initial
recognition and measurement criteria in Statement 141R and instead carries forward most of the provisions in
SFAS 141 for acquired contingencies. FSP 141R-1 is effective for contingent assets and contingent liabilities
acquired in business combinations for which the acquisition date is on or after the beginning of the first
annual reporting period beginning on or after December 15, 2008 (SMSC’s fiscal year beginning March 1,
2009). Should the Company consummate any acquisitions after the effective date, it would be anticipated that
SFAS 141R would likely have an impact on our consolidated financial statements. However, the impact (if
any) would depend upon the nature, terms and size of such business acquisitions.
In December 2007, the FASB issued SFAS No. 160 ‘‘Noncontrolling Interests in Consolidated Financial
Statements — an amendment of ARB 51’’ (‘‘SFAS 160’’). SFAS 160 requires that the noncontrolling interest
in the equity of a subsidiary be accounted for and reported as equity, provides revised guidance on the treat-
ment of net income and losses attributable to the noncontrolling interest and changes in ownership interests in
a subsidiary and requires additional disclosures that identify and distinguish between the interests of the
controlling and noncontrolling owners. SFAS 160 is effective for fiscal years beginning on or after Decem-
ber 15, 2008 (SMSC’s fiscal year beginning March 1, 2009, or fiscal 2010). Pursuant to the transition
provisions of SFAS No. 160, the Company will adopt the standard in the first quarter of fiscal 2010 via retro-
spective application of the presentation and disclosure requirements. The Company does not expect the
adoption of SFAS 160 to have a material effect on the condensed consolidated financial statements; however,
the effects on future periods will depend on the nature and significance of any noncontrolling interests subject
to this statement. The Company does not believe it is subject to noncontrolling interests at the present time.
In March 2008, the FASB issued SFAS No. 161 ‘‘Disclosures about Derivative Instruments and Hedging
Activities — an Amendment of FASB Statement No. 133’’ (‘‘SFAS 161’’). SFAS 161 enhances the current
disclosure framework in SFAS 133 and requires enhanced disclosures about why an entity uses derivative
33
instruments, how derivative instruments are accounted for under SFAS 133 and how derivative instruments
and related hedged items affect an entity’s financial position, financial performance and cash flows. SFAS 161
is effective for fiscal years beginning after November 15, 2008 and the Company is required to adopt the
standard in the first quarter of fiscal 2010 (SMSC’s fiscal year beginning March 1, 2009). The Company is
currently evaluating the impact the adoption of SFAS 161 would have on its consolidated financial statements
and required disclosures.
RESULTS OF OPERATIONS
Business Outlook
Our future results of operations and other matters comprising the subject of forward-looking statements
contained in this Form 10-K, including within this MD&A, involve a number of risks and uncertainties — in
particular, current economic uncertainty, including the tightening of credit markets, as well as future economic
conditions; our goals and strategies; new product introductions; plans to cultivate new businesses; divestitures
or investments; revenue; pricing; gross margin and costs; capital spending; depreciation; R&D expense levels;
selling, general and administrative expense levels; potential impairment of investments; our effective tax rate;
pending legal proceedings; and other operating parameters. The current uncertainty in global economic condi-
tions has made it particularly difficult to predict product demand and other related matters, and has made it
more likely that our actual results could differ materially from our expectations. In addition to the various
important factors discussed above, a number of other important factors could cause actual results to differ
materially from our expectations. See the risks described in Part I — Item 1.A. — Risk Factors.
Fiscal Year Ended February 28, 2009 Compared to Fiscal Year Ended February 29, 2008
Overview
Net revenue, gross profit, operating (loss) income, and net (loss) income for fiscal 2009 and 2008 were as
follows (in thousands):
2009 2008
Sales and revenues . . . . . . . . . . . . . . . . . . . . . . . . . . . . . . . . . . . $325,496 $377,849
Gross profit . . . . . . . . . . . . . . . . . . . . . . . . . . . . . . . . . . . . . . . . $161,803 $191,886
Operating (loss) income . . . . . . . . . . . . . . . . . . . . . . . . . . . . . . . . $ (58,154) $ 37,648
Net (loss) income . . . . . . . . . . . . . . . . . . . . . . . . . . . . . . . . . . . . $ (49,409) $ 32,906
Sales and revenues for fiscal 2009 were $325.5 million, a decrease of $52.4 million or 13.9% from sales
and revenues of $377.8 million in the prior fiscal year. Revenue was down due to global economic conditions
and a significant industry-wide correction in PC and automotive market inventories. The revenue decline in
the fourth quarter was dramatic and resulted from sharply reduced demand and inventory contraction across
the supply chain. Further, the 13.3% sequential decline from the second quarter of fiscal 2009 to the third
quarter of fiscal 2009 was the first time in recent years that our third-quarter revenue fell below our second-
quarter revenue, breaking our normal seasonal pattern. While demand for our products seems to have
stabilized somewhat to date, uncertainty around demand remains, particularly in the automotive market.
The Company reported a gross profit of $161.8 million or 49.7% of sales and revenues in fiscal 2009, a
decrease of $30.1 million, compared to gross profit of $191.9 million, or 50.8% of sales and revenues in fiscal
2008. The decrease in gross profit as a percentage of sales and revenues in the current fiscal year compared to
the prior fiscal year was primarily due to a significant increase in unabsorbed manufacturing costs.
An operating loss of $58.2 million was generated in fiscal 2009 compared to operating income of
$37.6 million in the prior fiscal year. The significant decline in operating income (loss) was primarily attribut-
able to the goodwill impairment charge of $52.3 million, restructuring charges of $5.2 million and a decrease
in product sales volume, particularly in the fourth quarter.
Net loss for fiscal 2009 was $49.4 million, compared to net income of $32.9 million for the prior fiscal
year. This significant decline was primarily due to the factors mentioned above, partially offset by favorable
foreign exchange gains during the year.
34
Sales and Revenues
The Company’s sales and revenues for fiscal 2009 were $325.5 million, consisting of $316.4 million of
product sales and $9.1 million of intellectual property revenues, compared to fiscal 2008 sales and revenues of
$377.8 million, consisting of $365.7 million of product sales and $12.2 million of intellectual property rev-
enues. This 13.9% decrease for the Company as a whole came from substantial decreases in shipping volumes
of automotive and mobile and desktop computing products, particularly in the third and fourth quarters. This
was partially offset by higher revenues for certain USB products as well as new analog products designed for
mobile device applications such as smart phones. The overall revenue decrease compared to the prior year is a
reflection of recent and current economic conditions.
Intellectual property revenues include $9.0 million and $12.0 million in fiscal 2009 and 2008, respec-
tively, received from Intel Corporation pursuant to the terms of a September 2003 business agreement.
Intellectual property revenues for fiscal 2009 include payments under this agreement of $3.0 million in each
of the first three fiscal quarters. Fiscal 2008 results include the payments of $3.0 million in each fiscal quarter.
Payments pursuant to this agreement ceased with receipt of the final payment in the third quarter of fiscal
2009.
Sales and revenues by country for fiscal years 2009 and 2008 were as follows (in thousands):
Fiscal
2009 2008
Taiwan. . . . . . . . . . . . . . . . . . . . . . . . . . . . . . . . . . . . . . . . . . . . $ 94,163 $103,661
China . . . . . . . . . . . . . . . . . . . . . . . . . . . . . . . . . . . . . . . . . . . . 65,187 94,200
Japan. . . . . . . . . . . . . . . . . . . . . . . . . . . . . . . . . . . . . . . . . . . . . 50,963 52,132
United States . . . . . . . . . . . . . . . . . . . . . . . . . . . . . . . . . . . . . . . 28,791 34,531
Germany . . . . . . . . . . . . . . . . . . . . . . . . . . . . . . . . . . . . . . . . . . 28,215 35,650
Other. . . . . . . . . . . . . . . . . . . . . . . . . . . . . . . . . . . . . . . . . . . . . 58,177 57,675
$325,496 $377,849
Product sales to electronic component distributors and original design manufacturers (‘‘ODMs’’) were
reflected in the table above based on the country of their respective operations; the geographic locations of
end customers may differ.
Intellectual property revenues received from Intel are included within the United States.
The Company expects international shipments to Asia to continue to represent a significant portion of its
sales and revenues for the foreseeable future. A significant portion of the world’s high technology manufactur-
ing and assembly activity occurs in Asia, where many of the Company’s significant customers conduct
business.
Costs of Goods Sold
Costs of goods sold include: the purchase cost of finished silicon wafers manufactured by independent
foundries (including mask and tooling costs); costs of assembly, packaging and mechanical and electrical
testing; manufacturing overhead; quality assurance and other support overhead (including costs of personnel
and equipment associated with manufacturing support); royalties paid to developers of intellectual property
incorporated into the Company’s products; amortization of intangible assets relating to acquired technologies;
and adjustments for excess, slow-moving or obsolete inventories.
The Company reported a gross profit of $161.8 million or 49.7% of sales and revenues in fiscal 2009, a
decrease of $30.1 million, compared to gross profit of $191.9 million, or 50.8% of sales and revenues in fiscal
2008. The decrease in gross profit as a percentage of sales and revenues in the current fiscal year compared to
the prior fiscal year was primarily due to a significant increase in unabsorbed manufacturing overhead costs,
as the Company adjusted production levels downward in response to demand and to reduce its own inventory
levels. Additionally, gross profit was impacted by the decrease in intellectual property revenues of $3 million
in the fourth quarter of fiscal 2009, as Intel payments ceased with receipt of the final payment in the third
quarter.
35
The Company routinely assesses its stock positions and evaluates for potential defective, excess or obso-
lete inventory. Lower of cost or market adjustments are also made as required. In fiscal 2009, the Company
recorded approximately $3.5 million of net inventory provisions, as compared with $1.8 million in fiscal 2008.
The increase in net inventory provisions was primarily attributable to certain excess and obsolete inventory
positions, mostly associated with end of life products.
In addition, in fiscal 2009, the Company incurred an additional $2.1 million in surcharges from assembly
service providers to compensate for the rise in gold prices. Expenses of $1.2 million relating to stock-based
compensation pursuant to SFAS 123R are included in current year costs of goods sold, compared to
$1.4 million in the prior year.
Research and Development Expenses
Research and development (‘‘R&D’’) expenses consist primarily of salaries and related costs of employ-
ees engaged in research, design and development activities, costs related to engineering design tools and
computer hardware, subcontractor costs and device prototyping costs. The Company’s R&D activities are
performed by highly-skilled and experienced engineers and technicians, and are primarily directed towards the
design of new integrated circuits; the development of new software drivers, firmware and design tools and
blocks of logic; and investment in new product offerings based on converging technology trends, as well as
ongoing cost reductions and performance improvements in existing products.
The Company intends to continue its efforts to develop innovative new products and technologies, and
believes that an ongoing commitment to R&D is essential in order to maintain product leadership and compete
effectively. Therefore, the Company expects to continue to make significant R&D investments in the future.
R&D expenses were $74.2 million and $71.7 million in fiscal 2009 and fiscal 2008, respectively, growing
from approximately 19.0% to 22.8% of sales and revenues. Expenses rose $2.5 million, due to increased
investment in new product development and employee costs partially offset by a reduction in stock-based
compensation pursuant to SFAS 123R, which decreased from $6.7 million in fiscal 2008 to $3.6 million in
fiscal 2009.
Selling, General and Administrative Expenses
Selling, general and administrative (‘‘SG&A’’) expenses consist primarily of sales, marketing, finance
(including compliance costs), information technology, legal, human resources management and other executive
and administrative costs. SG&A expenses were $88.3 million, or approximately 27.1% of sales and revenues,
for fiscal 2009, compared to $82.6 million, or approximately 21.9% of sales and revenues, for fiscal 2008.
SG&A expenses increased $5.7 million, primarily due to increased headcount and other infrastructure costs
and executive transition costs related to the replacement of both the Chief Executive Officer and Chief Finan-
cial Officer. Net charges of $7.9 million relating to stock-based compensation pursuant to SFAS 123R are
included in the current year, compared to $7.0 million in charges related to stock-based compensation in the
prior year.
Restructuring Charges
In the fourth quarter of fiscal 2009, the Company announced a restructuring plan that included a supple-
mental voluntary retirement program and involuntary separations that would result in approximately a ten
percent reduction in employee headcount and expenses worldwide. This action resulted in a charge of
$5.2 million for severance and termination benefits for 88 full-time employees. An additional $0.1 million will
be recorded in the first quarter of fiscal 2010 for two full-time employees who elected to accept voluntary
retirement benefits subsequent to February 28, 2009.
Impairment of Goodwill
In accordance with the provisions of SFAS 142, goodwill is not amortized, but is tested for impairment
in value annually, as well as when events or circumstances might indicate possible impairment in value. The
Company performs an annual goodwill impairment test during the fourth quarter of each fiscal year, and
recently concluded that the carrying amount of goodwill associated with its automotive reporting unit was
impaired by approximately $52.3 million. The impairment charge was determined by comparing the carrying
value of goodwill assigned to the reporting unit with the fair value of the reporting unit. The Company con-
sidered both the market and income approaches in determining both the fair value of the reporting unit and
36
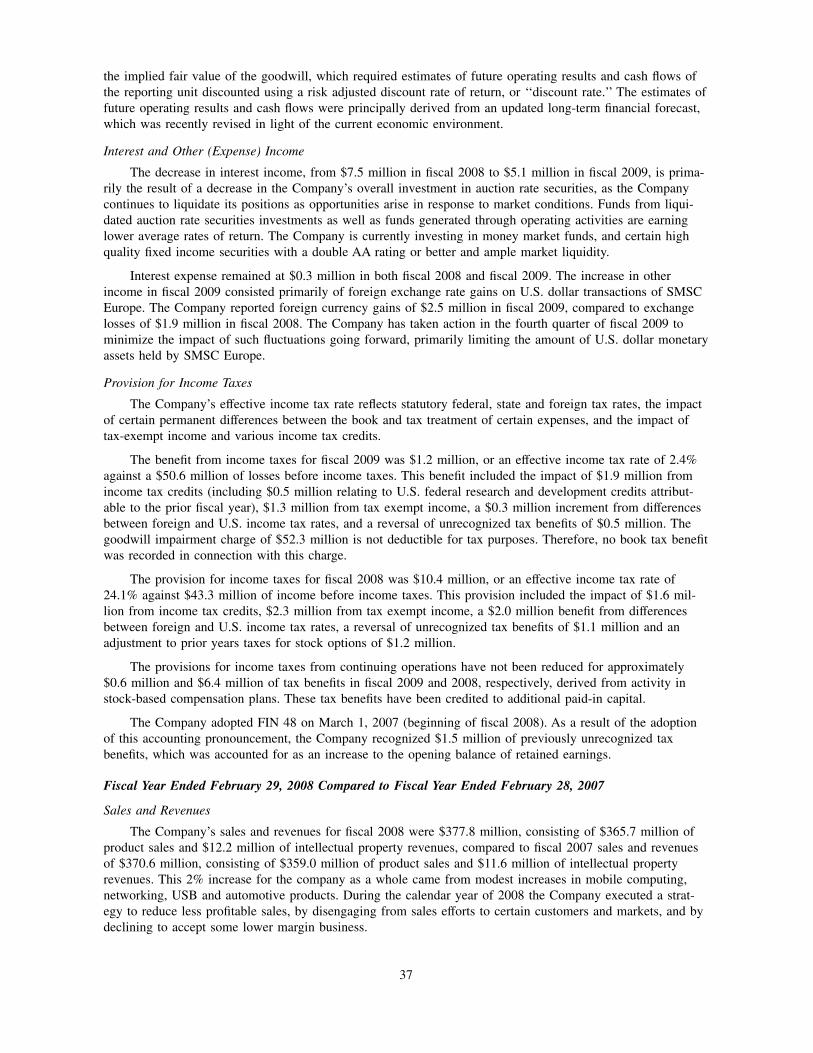
the implied fair value of the goodwill, which required estimates of future operating results and cash flows of
the reporting unit discounted using a risk adjusted discount rate of return, or ‘‘discount rate.’’ The estimates of
future operating results and cash flows were principally derived from an updated long-term financial forecast,
which was recently revised in light of the current economic environment.
Interest and Other (Expense) Income
The decrease in interest income, from $7.5 million in fiscal 2008 to $5.1 million in fiscal 2009, is prima-
rily the result of a decrease in the Company’s overall investment in auction rate securities, as the Company
continues to liquidate its positions as opportunities arise in response to market conditions. Funds from liqui-
dated auction rate securities investments as well as funds generated through operating activities are earning
lower average rates of return. The Company is currently investing in money market funds, and certain high
quality fixed income securities with a double AA rating or better and ample market liquidity.
Interest expense remained at $0.3 million in both fiscal 2008 and fiscal 2009. The increase in other
income in fiscal 2009 consisted primarily of foreign exchange rate gains on U.S. dollar transactions of SMSC
Europe. The Company reported foreign currency gains of $2.5 million in fiscal 2009, compared to exchange
losses of $1.9 million in fiscal 2008. The Company has taken action in the fourth quarter of fiscal 2009 to
minimize the impact of such fluctuations going forward, primarily limiting the amount of U.S. dollar monetary
assets held by SMSC Europe.
Provision for Income Taxes
The Company’s effective income tax rate reflects statutory federal, state and foreign tax rates, the impact
of certain permanent differences between the book and tax treatment of certain expenses, and the impact of
tax-exempt income and various income tax credits.
The benefit from income taxes for fiscal 2009 was $1.2 million, or an effective income tax rate of 2.4%
against a $50.6 million of losses before income taxes. This benefit included the impact of $1.9 million from
income tax credits (including $0.5 million relating to U.S. federal research and development credits attribut-
able to the prior fiscal year), $1.3 million from tax exempt income, a $0.3 million increment from differences
between foreign and U.S. income tax rates, and a reversal of unrecognized tax benefits of $0.5 million. The
goodwill impairment charge of $52.3 million is not deductible for tax purposes. Therefore, no book tax benefit
was recorded in connection with this charge.
The provision for income taxes for fiscal 2008 was $10.4 million, or an effective income tax rate of
24.1% against $43.3 million of income before income taxes. This provision included the impact of $1.6 mil-
lion from income tax credits, $2.3 million from tax exempt income, a $2.0 million benefit from differences
between foreign and U.S. income tax rates, a reversal of unrecognized tax benefits of $1.1 million and an
adjustment to prior years taxes for stock options of $1.2 million.
The provisions for income taxes from continuing operations have not been reduced for approximately
$0.6 million and $6.4 million of tax benefits in fiscal 2009 and 2008, respectively, derived from activity in
stock-based compensation plans. These tax benefits have been credited to additional paid-in capital.
The Company adopted FIN 48 on March 1, 2007 (beginning of fiscal 2008). As a result of the adoption
of this accounting pronouncement, the Company recognized $1.5 million of previously unrecognized tax
benefits, which was accounted for as an increase to the opening balance of retained earnings.
Fiscal Year Ended February 29, 2008 Compared to Fiscal Year Ended February 28, 2007
Sales and Revenues
The Company’s sales and revenues for fiscal 2008 were $377.8 million, consisting of $365.7 million of
product sales and $12.2 million of intellectual property revenues, compared to fiscal 2007 sales and revenues
of $370.6 million, consisting of $359.0 million of product sales and $11.6 million of intellectual property
revenues. This 2% increase for the company as a whole came from modest increases in mobile computing,
networking, USB and automotive products. During the calendar year of 2008 the Company executed a strat-
egy to reduce less profitable sales, by disengaging from sales efforts to certain customers and markets, and by
declining to accept some lower margin business.
37
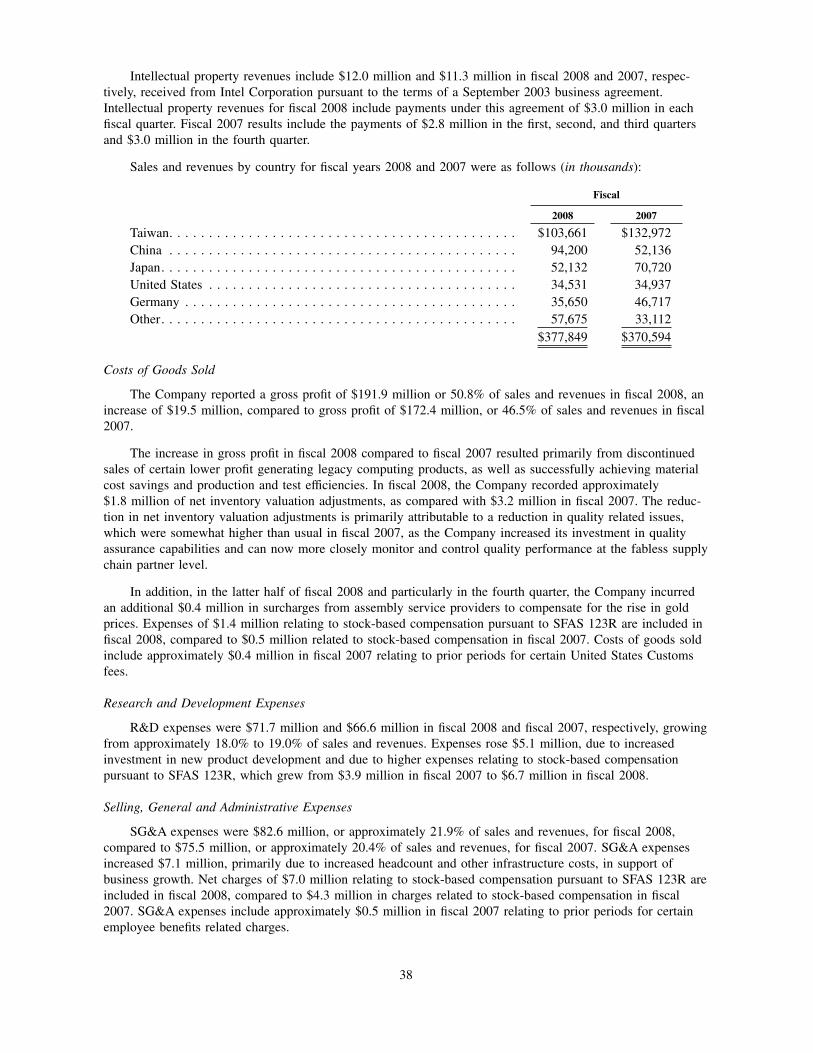
Intellectual property revenues include $12.0 million and $11.3 million in fiscal 2008 and 2007, respec-
tively, received from Intel Corporation pursuant to the terms of a September 2003 business agreement.
Intellectual property revenues for fiscal 2008 include payments under this agreement of $3.0 million in each
fiscal quarter. Fiscal 2007 results include the payments of $2.8 million in the first, second, and third quarters
and $3.0 million in the fourth quarter.
Sales and revenues by country for fiscal years 2008 and 2007 were as follows (in thousands):
Fiscal
2008 2007
Taiwan. . . . . . . . . . . . . . . . . . . . . . . . . . . . . . . . . . . . . . . . . . . . $103,661 $132,972
China . . . . . . . . . . . . . . . . . . . . . . . . . . . . . . . . . . . . . . . . . . . . 94,200 52,136
Japan. . . . . . . . . . . . . . . . . . . . . . . . . . . . . . . . . . . . . . . . . . . . . 52,132 70,720
United States . . . . . . . . . . . . . . . . . . . . . . . . . . . . . . . . . . . . . . . 34,531 34,937
Germany . . . . . . . . . . . . . . . . . . . . . . . . . . . . . . . . . . . . . . . . . . 35,650 46,717
Other. . . . . . . . . . . . . . . . . . . . . . . . . . . . . . . . . . . . . . . . . . . . . 57,675 33,112
$377,849 $370,594
Costs of Goods Sold
The Company reported a gross profit of $191.9 million or 50.8% of sales and revenues in fiscal 2008, an
increase of $19.5 million, compared to gross profit of $172.4 million, or 46.5% of sales and revenues in fiscal
2007.
The increase in gross profit in fiscal 2008 compared to fiscal 2007 resulted primarily from discontinued
sales of certain lower profit generating legacy computing products, as well as successfully achieving material
cost savings and production and test efficiencies. In fiscal 2008, the Company recorded approximately
$1.8 million of net inventory valuation adjustments, as compared with $3.2 million in fiscal 2007. The reduc-
tion in net inventory valuation adjustments is primarily attributable to a reduction in quality related issues,
which were somewhat higher than usual in fiscal 2007, as the Company increased its investment in quality
assurance capabilities and can now more closely monitor and control quality performance at the fabless supply
chain partner level.
In addition, in the latter half of fiscal 2008 and particularly in the fourth quarter, the Company incurred
an additional $0.4 million in surcharges from assembly service providers to compensate for the rise in gold
prices. Expenses of $1.4 million relating to stock-based compensation pursuant to SFAS 123R are included in
fiscal 2008, compared to $0.5 million related to stock-based compensation in fiscal 2007. Costs of goods sold
include approximately $0.4 million in fiscal 2007 relating to prior periods for certain United States Customs
fees.
Research and Development Expenses
R&D expenses were $71.7 million and $66.6 million in fiscal 2008 and fiscal 2007, respectively, growing
from approximately 18.0% to 19.0% of sales and revenues. Expenses rose $5.1 million, due to increased
investment in new product development and due to higher expenses relating to stock-based compensation
pursuant to SFAS 123R, which grew from $3.9 million in fiscal 2007 to $6.7 million in fiscal 2008.
Selling, General and Administrative Expenses
SG&A expenses were $82.6 million, or approximately 21.9% of sales and revenues, for fiscal 2008,
compared to $75.5 million, or approximately 20.4% of sales and revenues, for fiscal 2007. SG&A expenses
increased $7.1 million, primarily due to increased headcount and other infrastructure costs, in support of
business growth. Net charges of $7.0 million relating to stock-based compensation pursuant to SFAS 123R are
included in fiscal 2008, compared to $4.3 million in charges related to stock-based compensation in fiscal
2007. SG&A expenses include approximately $0.5 million in fiscal 2007 relating to prior periods for certain
employee benefits related charges.
38
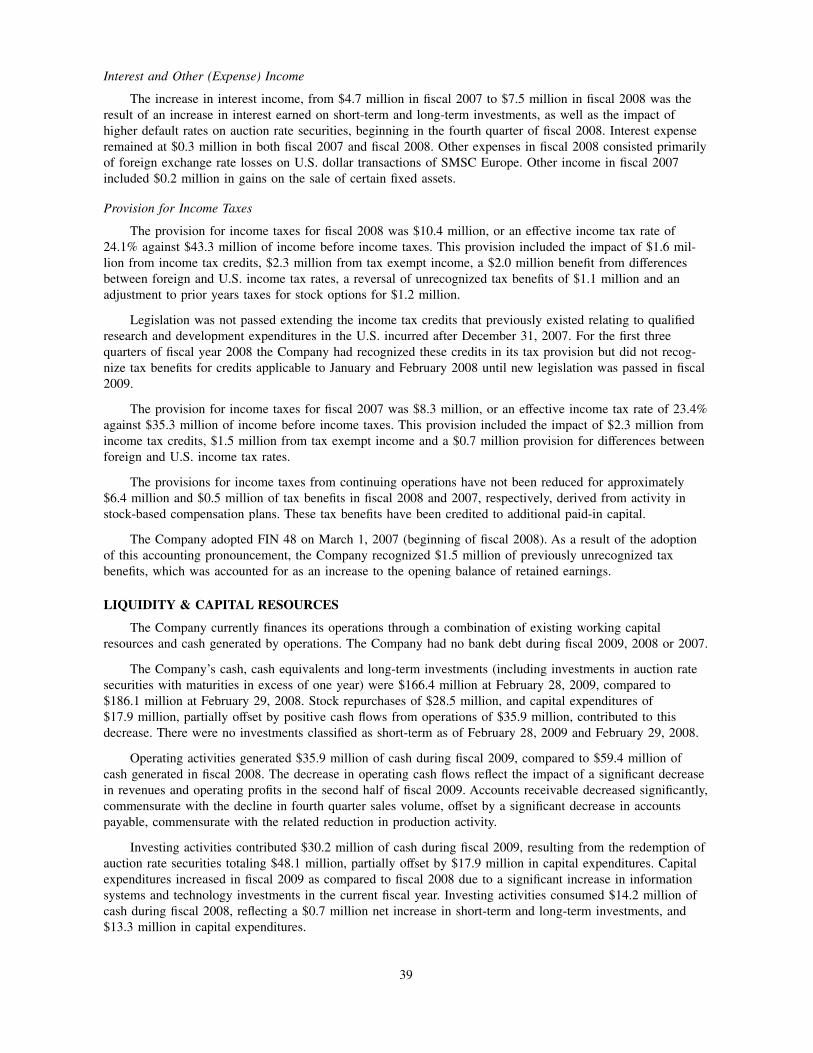
Interest and Other (Expense) Income
The increase in interest income, from $4.7 million in fiscal 2007 to $7.5 million in fiscal 2008 was the
result of an increase in interest earned on short-term and long-term investments, as well as the impact of
higher default rates on auction rate securities, beginning in the fourth quarter of fiscal 2008. Interest expense
remained at $0.3 million in both fiscal 2007 and fiscal 2008. Other expenses in fiscal 2008 consisted primarily
of foreign exchange rate losses on U.S. dollar transactions of SMSC Europe. Other income in fiscal 2007
included $0.2 million in gains on the sale of certain fixed assets.
Provision for Income Taxes
The provision for income taxes for fiscal 2008 was $10.4 million, or an effective income tax rate of
24.1% against $43.3 million of income before income taxes. This provision included the impact of $1.6 mil-
lion from income tax credits, $2.3 million from tax exempt income, a $2.0 million benefit from differences
between foreign and U.S. income tax rates, a reversal of unrecognized tax benefits of $1.1 million and an
adjustment to prior years taxes for stock options for $1.2 million.
Legislation was not passed extending the income tax credits that previously existed relating to qualified
research and development expenditures in the U.S. incurred after December 31, 2007. For the first three
quarters of fiscal year 2008 the Company had recognized these credits in its tax provision but did not recog-
nize tax benefits for credits applicable to January and February 2008 until new legislation was passed in fiscal
2009.
The provision for income taxes for fiscal 2007 was $8.3 million, or an effective income tax rate of 23.4%
against $35.3 million of income before income taxes. This provision included the impact of $2.3 million from
income tax credits, $1.5 million from tax exempt income and a $0.7 million provision for differences between
foreign and U.S. income tax rates.
The provisions for income taxes from continuing operations have not been reduced for approximately
$6.4 million and $0.5 million of tax benefits in fiscal 2008 and 2007, respectively, derived from activity in
stock-based compensation plans. These tax benefits have been credited to additional paid-in capital.
The Company adopted FIN 48 on March 1, 2007 (beginning of fiscal 2008). As a result of the adoption
of this accounting pronouncement, the Company recognized $1.5 million of previously unrecognized tax
benefits, which was accounted for as an increase to the opening balance of retained earnings.
LIQUIDITY & CAPITAL RESOURCES
The Company currently finances its operations through a combination of existing working capital
resources and cash generated by operations. The Company had no bank debt during fiscal 2009, 2008 or 2007.
The Company’s cash, cash equivalents and long-term investments (including investments in auction rate
securities with maturities in excess of one year) were $166.4 million at February 28, 2009, compared to
$186.1 million at February 29, 2008. Stock repurchases of $28.5 million, and capital expenditures of
$17.9 million, partially offset by positive cash flows from operations of $35.9 million, contributed to this
decrease. There were no investments classified as short-term as of February 28, 2009 and February 29, 2008.
Operating activities generated $35.9 million of cash during fiscal 2009, compared to $59.4 million of
cash generated in fiscal 2008. The decrease in operating cash flows reflect the impact of a significant decrease
in revenues and operating profits in the second half of fiscal 2009. Accounts receivable decreased significantly,
commensurate with the decline in fourth quarter sales volume, offset by a significant decrease in accounts
payable, commensurate with the related reduction in production activity.
Investing activities contributed $30.2 million of cash during fiscal 2009, resulting from the redemption of
auction rate securities totaling $48.1 million, partially offset by $17.9 million in capital expenditures. Capital
expenditures increased in fiscal 2009 as compared to fiscal 2008 due to a significant increase in information
systems and technology investments in the current fiscal year. Investing activities consumed $14.2 million of
cash during fiscal 2008, reflecting a $0.7 million net increase in short-term and long-term investments, and
$13.3 million in capital expenditures.
39
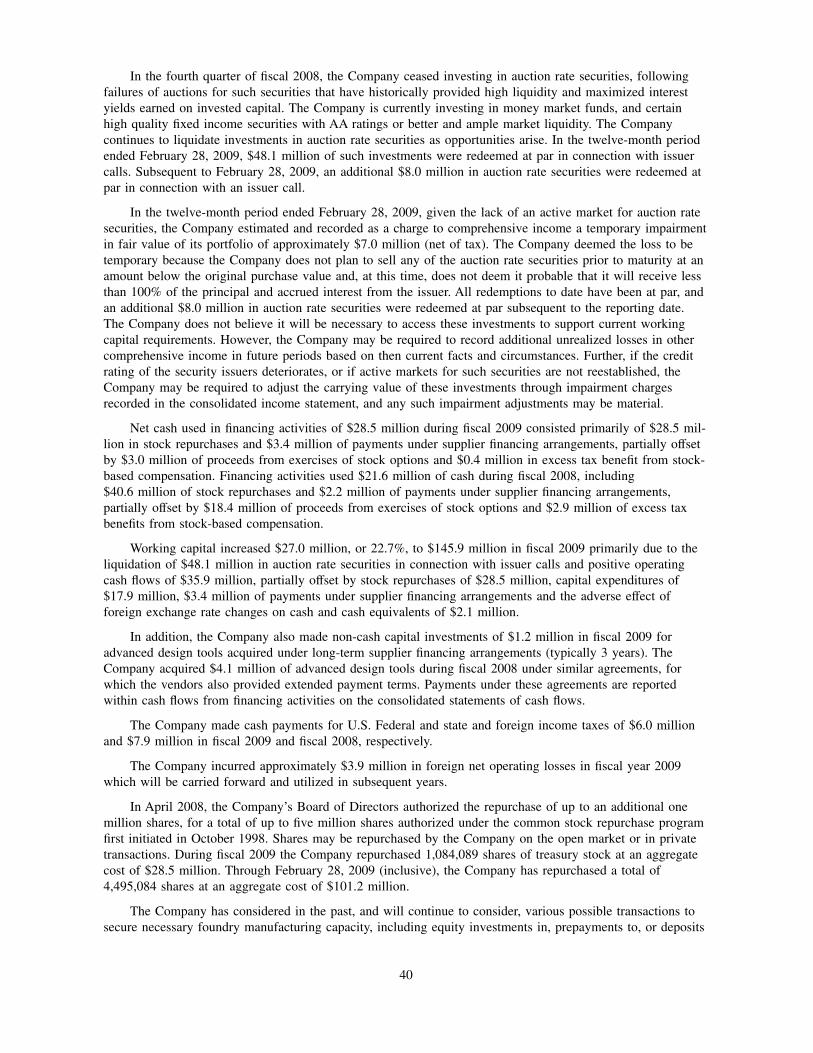
In the fourth quarter of fiscal 2008, the Company ceased investing in auction rate securities, following
failures of auctions for such securities that have historically provided high liquidity and maximized interest
yields earned on invested capital. The Company is currently investing in money market funds, and certain
high quality fixed income securities with AA ratings or better and ample market liquidity. The Company
continues to liquidate investments in auction rate securities as opportunities arise. In the twelve-month period
ended February 28, 2009, $48.1 million of such investments were redeemed at par in connection with issuer
calls. Subsequent to February 28, 2009, an additional $8.0 million in auction rate securities were redeemed at
par in connection with an issuer call.
In the twelve-month period ended February 28, 2009, given the lack of an active market for auction rate
securities, the Company estimated and recorded as a charge to comprehensive income a temporary impairment
in fair value of its portfolio of approximately $7.0 million (net of tax). The Company deemed the loss to be
temporary because the Company does not plan to sell any of the auction rate securities prior to maturity at an
amount below the original purchase value and, at this time, does not deem it probable that it will receive less
than 100% of the principal and accrued interest from the issuer. All redemptions to date have been at par, and
an additional $8.0 million in auction rate securities were redeemed at par subsequent to the reporting date.
The Company does not believe it will be necessary to access these investments to support current working
capital requirements. However, the Company may be required to record additional unrealized losses in other
comprehensive income in future periods based on then current facts and circumstances. Further, if the credit
rating of the security issuers deteriorates, or if active markets for such securities are not reestablished, the
Company may be required to adjust the carrying value of these investments through impairment charges
recorded in the consolidated income statement, and any such impairment adjustments may be material.
Net cash used in financing activities of $28.5 million during fiscal 2009 consisted primarily of $28.5 mil-
lion in stock repurchases and $3.4 million of payments under supplier financing arrangements, partially offset
by $3.0 million of proceeds from exercises of stock options and $0.4 million in excess tax benefit from stock-
based compensation. Financing activities used $21.6 million of cash during fiscal 2008, including
$40.6 million of stock repurchases and $2.2 million of payments under supplier financing arrangements,
partially offset by $18.4 million of proceeds from exercises of stock options and $2.9 million of excess tax
benefits from stock-based compensation.
Working capital increased $27.0 million, or 22.7%, to $145.9 million in fiscal 2009 primarily due to the
liquidation of $48.1 million in auction rate securities in connection with issuer calls and positive operating
cash flows of $35.9 million, partially offset by stock repurchases of $28.5 million, capital expenditures of
$17.9 million, $3.4 million of payments under supplier financing arrangements and the adverse effect of
foreign exchange rate changes on cash and cash equivalents of $2.1 million.
In addition, the Company also made non-cash capital investments of $1.2 million in fiscal 2009 for
advanced design tools acquired under long-term supplier financing arrangements (typically 3 years). The
Company acquired $4.1 million of advanced design tools during fiscal 2008 under similar agreements, for
which the vendors also provided extended payment terms. Payments under these agreements are reported
within cash flows from financing activities on the consolidated statements of cash flows.
The Company made cash payments for U.S. Federal and state and foreign income taxes of $6.0 million
and $7.9 million in fiscal 2009 and fiscal 2008, respectively.
The Company incurred approximately $3.9 million in foreign net operating losses in fiscal year 2009
which will be carried forward and utilized in subsequent years.
In April 2008, the Company’s Board of Directors authorized the repurchase of up to an additional one
million shares, for a total of up to five million shares authorized under the common stock repurchase program
first initiated in October 1998. Shares may be repurchased by the Company on the open market or in private
transactions. During fiscal 2009 the Company repurchased 1,084,089 shares of treasury stock at an aggregate
cost of $28.5 million. Through February 28, 2009 (inclusive), the Company has repurchased a total of
4,495,084 shares at an aggregate cost of $101.2 million.
The Company has considered in the past, and will continue to consider, various possible transactions to
secure necessary foundry manufacturing capacity, including equity investments in, prepayments to, or deposits
40
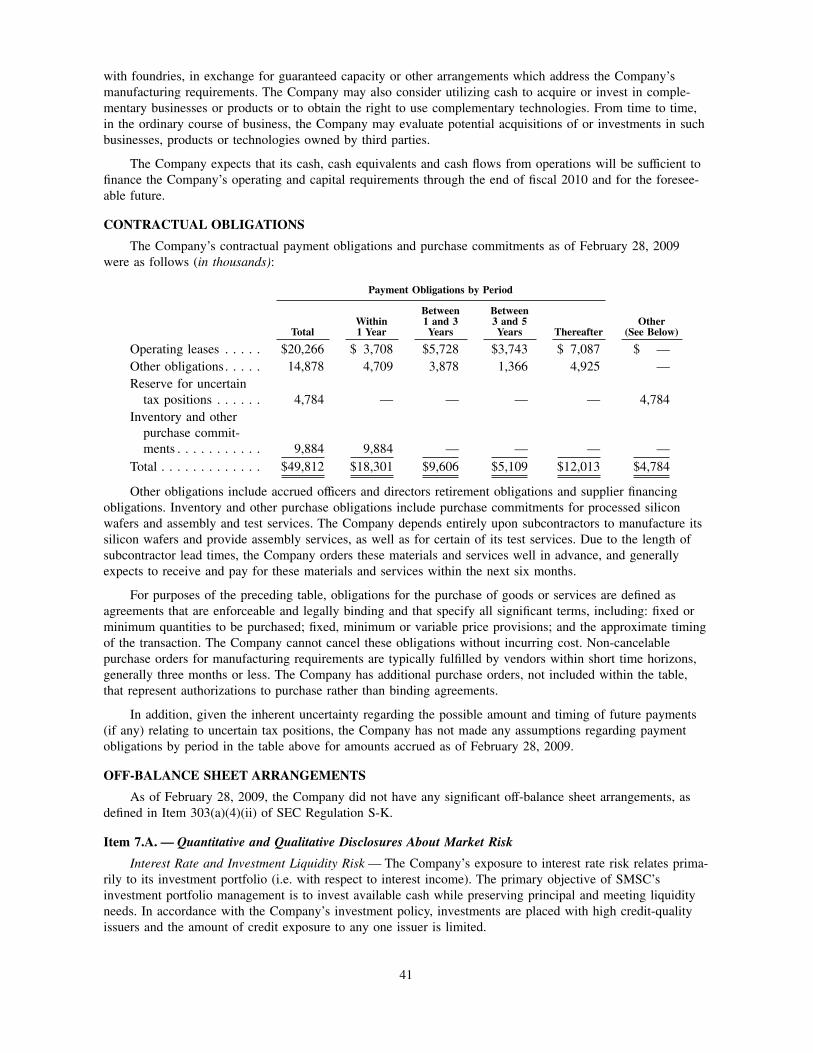
with foundries, in exchange for guaranteed capacity or other arrangements which address the Company’s
manufacturing requirements. The Company may also consider utilizing cash to acquire or invest in comple-
mentary businesses or products or to obtain the right to use complementary technologies. From time to time,
in the ordinary course of business, the Company may evaluate potential acquisitions of or investments in such
businesses, products or technologies owned by third parties.
The Company expects that its cash, cash equivalents and cash flows from operations will be sufficient to
finance the Company’s operating and capital requirements through the end of fiscal 2010 and for the foresee-
able future.
CONTRACTUAL OBLIGATIONS
The Company’s contractual payment obligations and purchase commitments as of February 28, 2009
were as follows (in thousands):
Payment Obligations by Period
TotalWithin1 Year
Between1 and 3Years
Between3 and 5Years Thereafter
Other(See Below)
Operating leases . . . . . $20,266 $ 3,708 $5,728 $3,743 $ 7,087 $ —
Other obligations. . . . . 14,878 4,709 3,878 1,366 4,925 —
Reserve for uncertain
tax positions . . . . . . 4,784 — — — — 4,784
Inventory and other
purchase commit-
ments . . . . . . . . . . . 9,884 9,884 — — — —
Total . . . . . . . . . . . . . $49,812 $18,301 $9,606 $5,109 $12,013 $4,784
Other obligations include accrued officers and directors retirement obligations and supplier financing
obligations. Inventory and other purchase obligations include purchase commitments for processed silicon
wafers and assembly and test services. The Company depends entirely upon subcontractors to manufacture its
silicon wafers and provide assembly services, as well as for certain of its test services. Due to the length of
subcontractor lead times, the Company orders these materials and services well in advance, and generally
expects to receive and pay for these materials and services within the next six months.
For purposes of the preceding table, obligations for the purchase of goods or services are defined as
agreements that are enforceable and legally binding and that specify all significant terms, including: fixed or
minimum quantities to be purchased; fixed, minimum or variable price provisions; and the approximate timing
of the transaction. The Company cannot cancel these obligations without incurring cost. Non-cancelable
purchase orders for manufacturing requirements are typically fulfilled by vendors within short time horizons,
generally three months or less. The Company has additional purchase orders, not included within the table,
that represent authorizations to purchase rather than binding agreements.
In addition, given the inherent uncertainty regarding the possible amount and timing of future payments
(if any) relating to uncertain tax positions, the Company has not made any assumptions regarding payment
obligations by period in the table above for amounts accrued as of February 28, 2009.
OFF-BALANCE SHEET ARRANGEMENTS
As of February 28, 2009, the Company did not have any significant off-balance sheet arrangements, as
defined in Item 303(a)(4)(ii) of SEC Regulation S-K.
Item 7.A. — Quantitative and Qualitative Disclosures About Market Risk
Interest Rate and Investment Liquidity Risk— The Company’s exposure to interest rate risk relates prima-
rily to its investment portfolio (i.e. with respect to interest income). The primary objective of SMSC’s
investment portfolio management is to invest available cash while preserving principal and meeting liquidity
needs. In accordance with the Company’s investment policy, investments are placed with high credit-quality
issuers and the amount of credit exposure to any one issuer is limited.
41
As of February 28, 2009, the Company’s $69.2 million of long-term investments consisted primarily of
investments in U.S. government agency backed AAA rated auction rate securities. From time to time, the
Company has also held investments in corporate, government and municipal obligations with maturities of
between three and twelve months at acquisition. Auction rate securities have long-term underlying maturities,
but have interest rates that until recently had been reset every 90 days or less at auction, at which time the
securities could also typically be repurchased or sold.
In February 2008, the Company began to experience failed auctions on some of its auction rate securities
Based on the failure rate of these auctions, the frequency and extent of the failures, and due to the lack of
liquidity in the current market for the auction rate securities, the Company determined that the estimated fair
value of the auction rate securities no longer approximates par value. The Company used a discounted cash
flow model to determine the estimated fair value of these investments as of February 28, 2009, and recorded
an unrealized loss of $7.0 million, (net of tax) related to the temporary impairment of the auction rate securi-
ties, which was included in accumulated other comprehensive income within shareholders’ equity on the
consolidated balance sheet.
Assuming all other assumptions disclosed in Part IV — Item 15(a)(1) — Financial Statements — Note 2
of this Report, being equal, an increase or decrease in the liquidity risk premium (i.e. the discount rate) of
100 basis points as used in the model would decrease or increase, respectively, the fair value of the auction
rate securities by approximately $1.9 million.
Equity Price Risk— The Company is not exposed to any equity significant price risks at February 28,
2009.
Foreign Currency Risk— The Company has international operations and is therefore subject to certain
foreign currency rate exposures, principally the euro and Japanese Yen. The Company conducts a significant
amount of its business in Asia. In order to reduce the risk from fluctuation in foreign exchange rates, most of
the Company’s product sales and all of its arrangements with its foundry, test and assembly vendors are
denominated in U.S. dollars.
The Company’s most significant foreign subsidiaries, SMSC Japan and SMSC Europe, purchase a signifi-
cant amount of their products for resale in U.S. dollars, and from time to time have entered into forward
exchange contracts to hedge against currency fluctuations associated with U.S. dollar liabilities arising from
these product purchases and related obligations. Gains or losses on these contracts are intended to offset the
gains or losses recorded for statutory and U.S. GAAP purposes from the remeasurement of certain assets and
liabilities from U.S. dollars into local currencies. In fiscal 2008, the Company’s wholly-owned subsidiary in
Japan initiated two forward contracts for the delivery of $1.4 million (in exchange for Yen), to cover sched-
uled payments on intercompany debt due the U.S. parent company. An additional forward contract for the
purchase of an additional $0.7 million (in exchange for Yen) was executed during the first quarter of fiscal
2009. Although these contracts were not formally designated as hedges, they were intended to lock in the
settlement rate on the underlying obligations and, as such, effectively mitigated the currency exposure on this
intercompany debt. As of February 28, 2009, these contracts were either settled or expired.
Operating activities in Europe include transactions conducted in both euros and U.S. dollars. The euro
has been designated as SMSC Europe’s functional currency for its European operations. From time to time,
SMSC Europe has entered into foreign currency contracts to minimize the exposure of its U.S. dollar denomi-
nated transactions, assets and liabilities to currency exchange rate risk. Gains or losses on these contracts are
intended to offset the gains or losses recorded from the remeasurement of certain assets and liabilities from
U.S. dollars into euros. No such contracts were executed during fiscal 2008 or during fiscal 2009, and there
are no obligations under any such contracts as of February, 28, 2009. Gains recorded from the remeasurement
of U.S. dollar denominated assets and liabilities into euros for fiscal 2009 were $2.3 million, compared with
losses of $2.0 million for fiscal 2008. Losses recorded from the remeasurement of U.S. dollar denominated
assets and liabilities into Yen for fiscal 2009 were $0.2 million, compared with gains of $0.1 million in fiscal
2008. The Company has taken action in the fourth quarter of fiscal 2009 to minimize the impact of such
fluctuations going forward, primarily by limiting the amount of U.S. dollar monetary assets held by SMSC
Europe.
42
Commodity Price Risk— The Company routinely uses precious metals in the manufacturing of its prod-
ucts. Supplies for such commodities may from time-to-time become restricted, or general market factors and
conditions may affect pricing of such commodities. In the latter part of fiscal 2008, particularly in the fourth
quarter, the price of gold increased precipitously, and certain of our supply chain partners began and continue
to assess surcharges to compensate for the resultant increase in manufacturing costs. While the Company
continues to attempt to mitigate the risk of similar increases in commodities-related costs, there can be no
assurance that the Company will be able to successfully safeguard against potential short-term and long-term
commodities price fluctuations.
Item 8. — Financial Statements and Supplementary Data
The financial statements and supplementary data required by this item are set forth in Part IV Item
15(a)(1)— Financial Statements, of this Report.
Item 9. — Changes in and Disagreements with Accountants on Accounting and Financial Disclosure
None.
Item 9.A. — Controls and Procedures
Disclosure Controls and Procedures
Under the supervision and with the participation of the Company’s management, including its Chief
Executive Officer and Chief Financial Officer, the Company conducted an evaluation of the effectiveness of its
disclosure controls and procedures (as defined in Rules 13a-15(e) and 15d-15(e) under the Exchange Act) as
of February 28, 2009. There are inherent limitations to the effectiveness of any system of disclosure controls
and procedures, including the possibility of human error and the circumvention or overriding of the controls
and procedures. Accordingly, even effective disclosure controls and procedures can only provide reasonable
assurance of achieving their control objectives. Disclosure controls and procedures include controls and proce-
dures designed to reasonably assure that information required to be disclosed in the Company’s reports filed
under the Exchange Act, such as this Form 10-K, are recorded, processed, summarized and reported within the
time periods specified in the U.S. Securities and Exchange Commission’s (SEC’s) rules and forms. Disclosure
controls and procedures are also designed to reasonably assure that such information is accumulated and
communicated to the Company’s management, including the Chief Executive Officer and the Chief Financial
Officer, as appropriate to allow timely decisions regarding required disclosure.
Based upon this evaluation, the Company’s Chief Executive Officer and Chief Financial Officer have
concluded that, as of February 28, 2009, the Company’s disclosure controls and procedures were effective to
provide reasonable assurance that information required to be disclosed in the Company’s Exchange Act reports
is recorded, processed, summarized and reported within the time periods specified by the SEC, and that mate-
rial information relating to SMSC and its consolidated subsidiaries is accumulated and communicated to the
Company’s management, including the Chief Executive Officer and the Chief Financial Officer, to allow
timely decisions regarding required disclosures.
Management’s Report on Internal Control Over Financial Reporting
The Company’s management is responsible for establishing and maintaining adequate internal controls
over financial reporting. Internal controls over financial reporting are defined in Rules 13a-15(f) and 15d-15(f)
under the Exchange Act as processes designed by, or under the supervision of, the Company’s principal execu-
tive and principal financial officers and effected by the Company’s board of directors, management and other
personnel, to provide reasonable assurance regarding the reliability of financial reporting and the preparation
of financial statements for external purposes in accordance with accounting principles generally accepted in
the United States of America, together with all applicable rules and regulations of the SEC governing financial
reporting requirements, and include those policies and procedures that:
(1) Pertain to the maintenance of records that in reasonable detail accurately and fairly reflect the
transactions and dispositions of the assets of the Company;
43
(2) Provide reasonable assurance that transactions are recorded as necessary to permit preparation of
financial statements in accordance with generally accepted accounting principles, and that receipts and
expenditures of the Company are being made only in accordance with authorizations of management and
directors of the Company; and
(3) Provide reasonable assurances regarding prevention or timely detection of unauthorized acquisi-
tion, use or disposition of the Company’s assets that could have a material effect on the financial
statements.
Because of inherent limitations, internal controls over financial reporting may not prevent or detect
misstatements. Also, projections of any evaluation of effectiveness to future periods are subject to the risk that
controls may become inadequate because of changes in conditions, or that the degree of compliance with the
policies or procedures may deteriorate.
The Company’s management assessed the effectiveness of its internal controls over financial reporting as
of February 28, 2009 based on the criteria set forth by the Committee of Sponsoring Organizations of the
Treadway Commission in its report entitled Internal Control — Integrated Framework. Based upon this assess-
ment, management has concluded that, as of February 28, 2009, the Company’s internal controls over financial
reporting are effective based on those criteria.
PricewaterhouseCoopers LLP, an independent registered public accounting firm that audited the consoli-
dated financial statements and financial statement schedule included in this annual report, has also audited the
effectiveness of the Company’s internal control over financial reporting as of February 28, 2009, as stated in
their report which appears herein.
Changes in Internal Control Over Financial Reporting
No change in the Company’s internal controls over financial reporting (as defined in Rules 13a-15(f) and
15d-15(f) under the Exchange Act) occurred during the fiscal quarter ended February 28, 2009 that has materi-
ally affected, or is reasonably likely to materially affect, the Company’s internal controls over financial
reporting.
Item 9.B. — Other Information
None.
44

PART III
The information required by Items 10, 11, 12, 13 and 14 of Part III of this Report, to the extent not set
forth herein, is incorporated herein by reference from the registrant’s 2009 Proxy Statement relating to the
annual meeting of stockholders to be held in 2009, which definitive proxy statement shall be filed with the
Securities and Exchange Commission within 120 days after the end of the fiscal year to which this Report
relates.
The information concerning the Company’s code of ethics as required by Part III of this Report is incor-
porated herein by reference to the section entitled ‘‘Code of Business Conduct and Ethics’’ appearing in the
2009 Proxy Statement.
45

SIGNATURES
Pursuant to the requirements of Section 13 or 15 (d) of the Securities Exchange Act of 1934, the regis-
trant has duly caused this report to be signed on its behalf by the undersigned, thereunto duly authorized.
STANDARD MICROSYSTEMS CORPORATION
(Registrant)
By: /s/ KRIS SENNESAEL
Kris Sennesael
Vice President and Chief Financial Offıcer(Principal Financial Offıcer)
Date: April 28, 2009
Pursuant to the requirements of the Securities Exchange Act of 1934, this report has been signed below
by the following persons on behalf of the registrant and in the capacities indicated.
Signature Title Date
/s/ CHRISTINE KING
Christine King
President and Chief Executive Officer
(Principal Executive Officer)
April 28, 2009
/s/ JOSEPH S. DURKO
Joseph S. Durko
Vice President, Corporate Controller and Chief
Accounting Officer
(Principal Accounting Officer)
April 28, 2009
/s/ STEVEN J. BILODEAU
Steven J. Bilodeau
Chairman of the Board of Directors April 28, 2009
/s/ ANDREW M. CAGGIA
Andrew M. Caggia
Director April 28, 2009
/s/ TIMOTHY P. CRAIG
Timothy P. Craig
Director April 28, 2009
/s/ JAMES A. DONAHUE
James A. Donahue
Director April 28, 2009
/s/ PETER F. DICKS
Peter F. Dicks
Director April 28, 2009
/s/ IVAN T. FRISCH
Ivan T. Frisch
Director April 28, 2009
/s/ KENNETH KIN
Kenneth Kin
Director April 28, 2009
/s/ STEPHEN C. MCCLUSKI
Stephen C. McCluski
Director April 28, 2009
46
PART IV
Item 15. Exhibits and Financial Statement Schedules.
(a)(1) Consolidated Financial Statements (See Item 8):
Report of Independent Registered Public Accounting Firm . . . . . . . . . . . . . . . . . . . . . . . . 48
Consolidated Balance Sheets as of February 28, 2009 and February 29, 2008 . . . . . . . . . . . 49
Consolidated Statements of Operations for the three years ended February 28, 2009 . . . . . . . 50
Consolidated Statements of Shareholders’ Equity for the three years ended
February 28, 2009 . . . . . . . . . . . . . . . . . . . . . . . . . . . . . . . . . . . . . . . . . . . . . . . . . . 51
Consolidated Statements of Cash Flows for the three years ended February 28, 2009 . . . . . . 52
Notes to Consolidated Financial Statements . . . . . . . . . . . . . . . . . . . . . . . . . . . . . . . . . . . . . . 53
(a)(2) Financial Statement Schedules:
Schedule II — Valuation and Qualifying Accounts . . . . . . . . . . . . . . . . . . . . . . . . . . . . . . 89
Schedules not listed above have been omitted because they are not applicable, not required or the infor-
mation required to be set forth therein is included in the Consolidated Financial Statements or notes thereto.
The consolidated financial statements and financial statement schedule listed in Section 1 and Section 2
of this Item 15, respectively, appear within this report immediately following the Index to Exhibits.
(a)(3) Exhibits:
Index to Exhibits . . . . . . . . . . . . . . . . . . . . . . . . . . . . . . . . . . . . . . . . . . . . . . . . . . . . 90
Exhibits, which are listed on the Index to Exhibits, are filed as part of this report and such Index to
Exhibits is incorporated by reference.
47
Report of Independent Registered Public Accounting Firm
To the Board of Directors and Shareholders of Standard Microsystems Corporation:
In our opinion, the accompanying consolidated balance sheets and the related consolidated statements of
operations, shareholders’ equity and cash flows present fairly, in all material respects, the financial position of
Standard Microsystems Corporation and its subsidiaries at February 28, 2009 and February 29, 2008, and the
results of their operations and their cash flows for each of the three years in the period ended February 28,
2009 in conformity with accounting principles generally accepted in the United States of America. In addition,
in our opinion, the accompanying financial statement schedule listed in the index appearing under Item
15(a)(2) presents fairly, in all material respects, the information set forth therein when read in conjunction
with the related consolidated financial statements. Also in our opinion, the Company maintained, in all mate-
rial respects, effective internal control over financial reporting as of February 28, 2009, based on criteria
established in Internal Control — Integrated Framework issued by the Committee of Sponsoring Organizations
of the Treadway Commission (COSO). The Company’s management is responsible for these financial state-
ments and financial statement schedule, for maintaining effective internal control over financial reporting and
for its assessment of the effectiveness of internal control over financial reporting, included in Management’s
Report on Internal Control over Financial Reporting appearing under Item 9A. Our responsibility is to express
opinions on these financial statements, on the financial statement schedule and on the Company’s internal
control over financial reporting based on our integrated audits. We conducted our audits in accordance with
the standards of the Public Company Accounting Oversight Board (United States). Those standards require
that we plan and perform the audits to obtain reasonable assurance about whether the financial statements are
free of material misstatement and whether effective internal control over financial reporting was maintained in
all material respects. Our audits of the financial statements included examining, on a test basis, evidence
supporting the amounts and disclosures in the financial statements, assessing the accounting principles used
and significant estimates made by management, and evaluating the overall financial statement presentation.
Our audit of internal control over financial reporting included obtaining an understanding of internal control
over financial reporting, assessing the risk that a material weakness exists, and testing and evaluating the
design and operating effectiveness of internal control based on the assessed risk. Our audits also included
performing such other procedures as we considered necessary in the circumstances. We believe that our audits
provide a reasonable basis for our opinions.
As discussed in Note 2 to the consolidated financial statements, the Company changed the manner in
which it accounts for uncertainty in income tax positions in fiscal 2008.
A company’s internal control over financial reporting is a process designed to provide reasonable assur-
ance regarding the reliability of financial reporting and the preparation of financial statements for external
purposes in accordance with generally accepted accounting principles. A company’s internal control over
financial reporting includes those policies and procedures that (i) pertain to the maintenance of records that, in
reasonable detail, accurately and fairly reflect the transactions and dispositions of the assets of the company;
(ii) provide reasonable assurance that transactions are recorded as necessary to permit preparation of financial
statements in accordance with generally accepted accounting principles, and that receipts and expenditures of
the company are being made only in accordance with authorizations of management and directors of the
company; and (iii) provide reasonable assurance regarding prevention or timely detection of unauthorized
acquisition, use, or disposition of the company’s assets that could have a material effect on the financial
statements.
Because of its inherent limitations, internal control over financial reporting may not prevent or detect
misstatements. Also, projections of any evaluation of effectiveness to future periods are subject to the risk that
controls may become inadequate because of changes in conditions, or that the degree of compliance with the
policies or procedures may deteriorate.
/s/ PricewaterhouseCoopers LLP
New York, New York
April 28, 2009
48
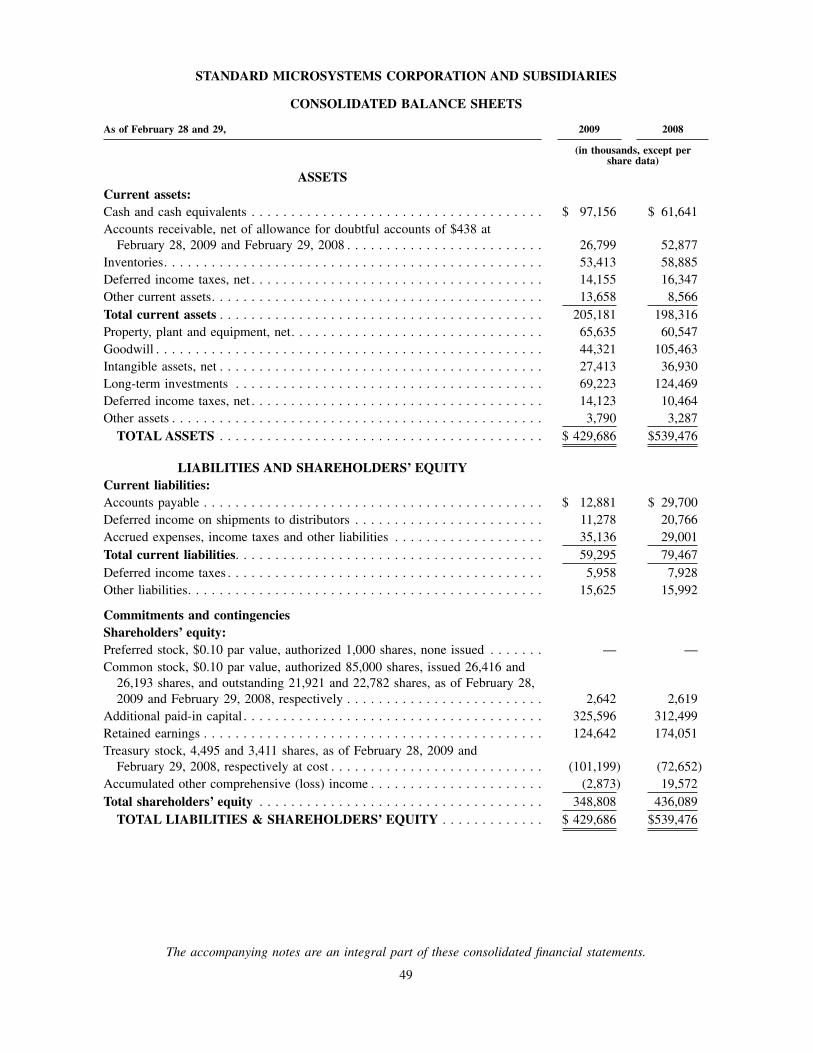
STANDARD MICROSYSTEMS CORPORATION AND SUBSIDIARIES
CONSOLIDATED BALANCE SHEETS
As of February 28 and 29, 2009 2008
(in thousands, except pershare data)
ASSETSCurrent assets:Cash and cash equivalents . . . . . . . . . . . . . . . . . . . . . . . . . . . . . . . . . . . . . $ 97,156 $ 61,641
Accounts receivable, net of allowance for doubtful accounts of $438 at
February 28, 2009 and February 29, 2008 . . . . . . . . . . . . . . . . . . . . . . . . . 26,799 52,877
Inventories. . . . . . . . . . . . . . . . . . . . . . . . . . . . . . . . . . . . . . . . . . . . . . . . 53,413 58,885
Deferred income taxes, net . . . . . . . . . . . . . . . . . . . . . . . . . . . . . . . . . . . . . 14,155 16,347
Other current assets. . . . . . . . . . . . . . . . . . . . . . . . . . . . . . . . . . . . . . . . . . 13,658 8,566
Total current assets . . . . . . . . . . . . . . . . . . . . . . . . . . . . . . . . . . . . . . . . . 205,181 198,316
Property, plant and equipment, net. . . . . . . . . . . . . . . . . . . . . . . . . . . . . . . . 65,635 60,547
Goodwill . . . . . . . . . . . . . . . . . . . . . . . . . . . . . . . . . . . . . . . . . . . . . . . . . 44,321 105,463
Intangible assets, net . . . . . . . . . . . . . . . . . . . . . . . . . . . . . . . . . . . . . . . . . 27,413 36,930
Long-term investments . . . . . . . . . . . . . . . . . . . . . . . . . . . . . . . . . . . . . . . 69,223 124,469
Deferred income taxes, net . . . . . . . . . . . . . . . . . . . . . . . . . . . . . . . . . . . . . 14,123 10,464
Other assets . . . . . . . . . . . . . . . . . . . . . . . . . . . . . . . . . . . . . . . . . . . . . . . 3,790 3,287
TOTAL ASSETS . . . . . . . . . . . . . . . . . . . . . . . . . . . . . . . . . . . . . . . . . $ 429,686 $539,476
LIABILITIES AND SHAREHOLDERS’ EQUITYCurrent liabilities:Accounts payable . . . . . . . . . . . . . . . . . . . . . . . . . . . . . . . . . . . . . . . . . . . $ 12,881 $ 29,700
Deferred income on shipments to distributors . . . . . . . . . . . . . . . . . . . . . . . . 11,278 20,766
Accrued expenses, income taxes and other liabilities . . . . . . . . . . . . . . . . . . . 35,136 29,001
Total current liabilities. . . . . . . . . . . . . . . . . . . . . . . . . . . . . . . . . . . . . . . 59,295 79,467
Deferred income taxes . . . . . . . . . . . . . . . . . . . . . . . . . . . . . . . . . . . . . . . . 5,958 7,928
Other liabilities. . . . . . . . . . . . . . . . . . . . . . . . . . . . . . . . . . . . . . . . . . . . . 15,625 15,992
Commitments and contingenciesShareholders’ equity:Preferred stock, $0.10 par value, authorized 1,000 shares, none issued . . . . . . . — —
Common stock, $0.10 par value, authorized 85,000 shares, issued 26,416 and
26,193 shares, and outstanding 21,921 and 22,782 shares, as of February 28,
2009 and February 29, 2008, respectively . . . . . . . . . . . . . . . . . . . . . . . . . 2,642 2,619
Additional paid-in capital . . . . . . . . . . . . . . . . . . . . . . . . . . . . . . . . . . . . . . 325,596 312,499
Retained earnings . . . . . . . . . . . . . . . . . . . . . . . . . . . . . . . . . . . . . . . . . . . 124,642 174,051
Treasury stock, 4,495 and 3,411 shares, as of February 28, 2009 and
February 29, 2008, respectively at cost . . . . . . . . . . . . . . . . . . . . . . . . . . . (101,199) (72,652)
Accumulated other comprehensive (loss) income . . . . . . . . . . . . . . . . . . . . . . (2,873) 19,572
Total shareholders’ equity . . . . . . . . . . . . . . . . . . . . . . . . . . . . . . . . . . . . 348,808 436,089
TOTAL LIABILITIES & SHAREHOLDERS’ EQUITY . . . . . . . . . . . . . $ 429,686 $539,476
The accompanying notes are an integral part of these consolidated financial statements.
49
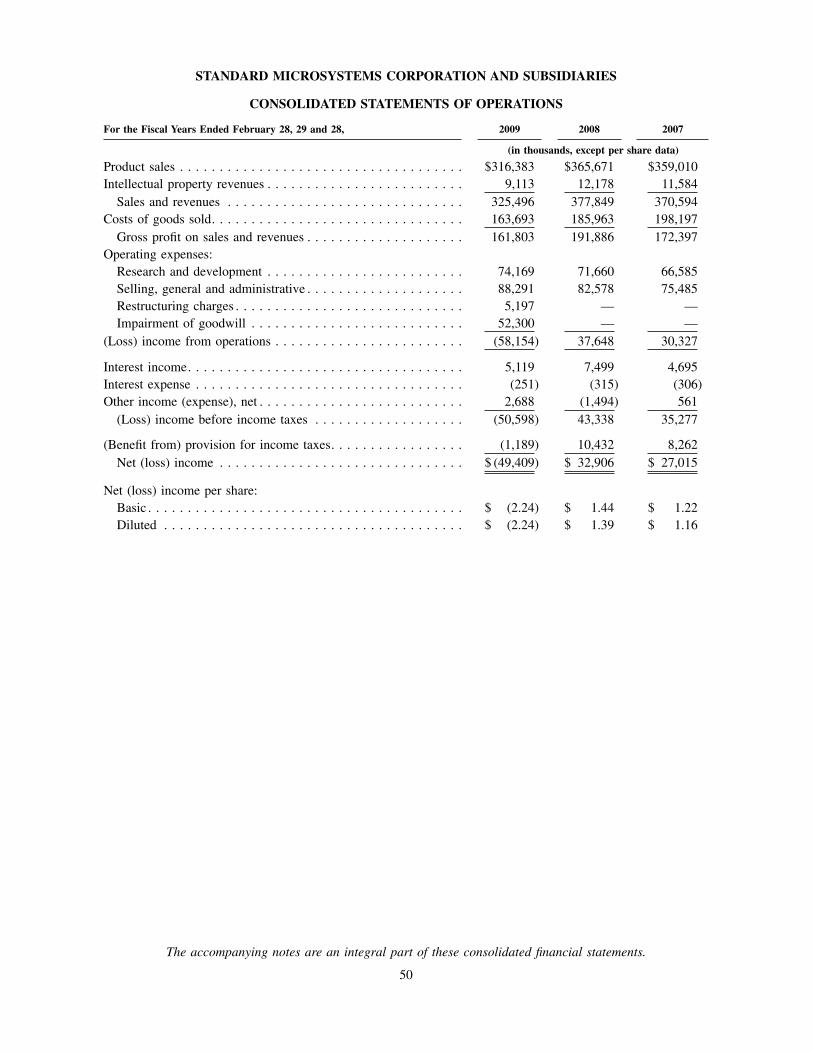
STANDARD MICROSYSTEMS CORPORATION AND SUBSIDIARIES
CONSOLIDATED STATEMENTS OF OPERATIONS
For the Fiscal Years Ended February 28, 29 and 28, 2009 2008 2007
(in thousands, except per share data)
Product sales . . . . . . . . . . . . . . . . . . . . . . . . . . . . . . . . . . . . $316,383 $365,671 $359,010
Intellectual property revenues . . . . . . . . . . . . . . . . . . . . . . . . . 9,113 12,178 11,584
Sales and revenues . . . . . . . . . . . . . . . . . . . . . . . . . . . . . . 325,496 377,849 370,594
Costs of goods sold. . . . . . . . . . . . . . . . . . . . . . . . . . . . . . . . 163,693 185,963 198,197
Gross profit on sales and revenues . . . . . . . . . . . . . . . . . . . . 161,803 191,886 172,397
Operating expenses:
Research and development . . . . . . . . . . . . . . . . . . . . . . . . . 74,169 71,660 66,585
Selling, general and administrative . . . . . . . . . . . . . . . . . . . . 88,291 82,578 75,485
Restructuring charges . . . . . . . . . . . . . . . . . . . . . . . . . . . . . 5,197 — —
Impairment of goodwill . . . . . . . . . . . . . . . . . . . . . . . . . . . 52,300 — —
(Loss) income from operations . . . . . . . . . . . . . . . . . . . . . . . . (58,154) 37,648 30,327
Interest income. . . . . . . . . . . . . . . . . . . . . . . . . . . . . . . . . . . 5,119 7,499 4,695
Interest expense . . . . . . . . . . . . . . . . . . . . . . . . . . . . . . . . . . (251) (315) (306)
Other income (expense), net . . . . . . . . . . . . . . . . . . . . . . . . . . 2,688 (1,494) 561
(Loss) income before income taxes . . . . . . . . . . . . . . . . . . . (50,598) 43,338 35,277
(Benefit from) provision for income taxes. . . . . . . . . . . . . . . . . (1,189) 10,432 8,262
Net (loss) income . . . . . . . . . . . . . . . . . . . . . . . . . . . . . . . $ (49,409) $ 32,906 $ 27,015
Net (loss) income per share:
Basic . . . . . . . . . . . . . . . . . . . . . . . . . . . . . . . . . . . . . . . . $ (2.24) $ 1.44 $ 1.22
Diluted . . . . . . . . . . . . . . . . . . . . . . . . . . . . . . . . . . . . . . $ (2.24) $ 1.39 $ 1.16
The accompanying notes are an integral part of these consolidated financial statements.
50
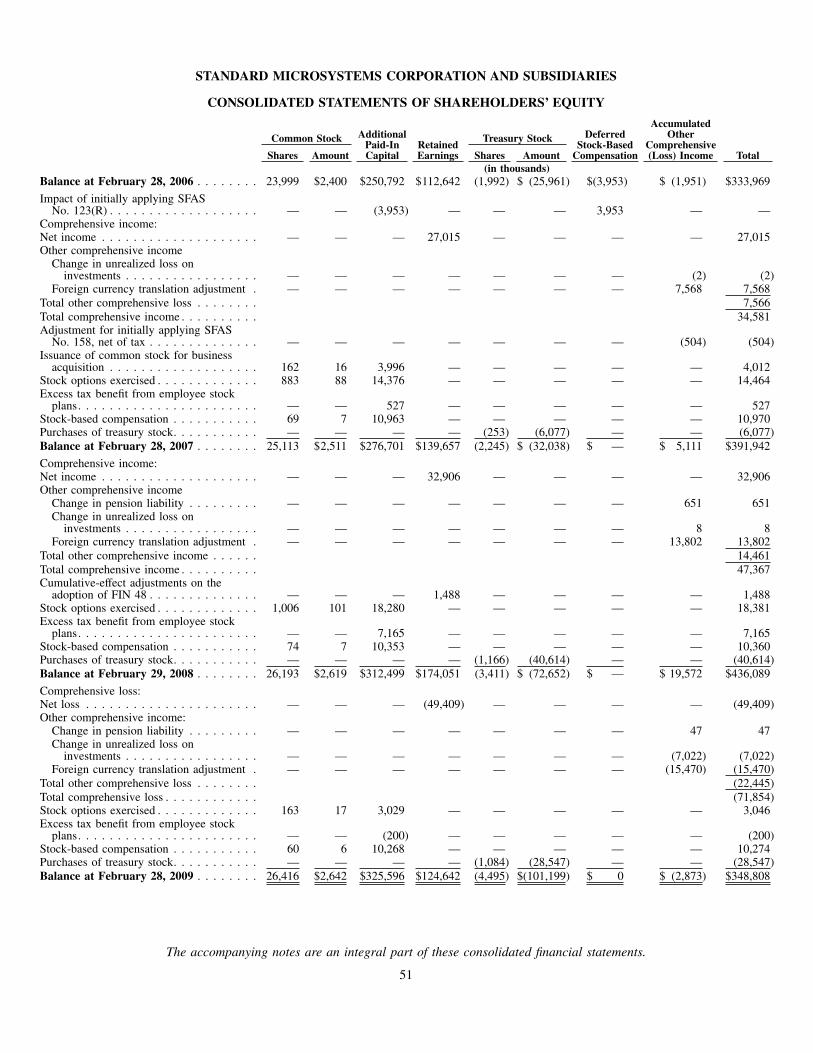
STANDARD MICROSYSTEMS CORPORATION AND SUBSIDIARIES
CONSOLIDATED STATEMENTS OF SHAREHOLDERS’ EQUITY
Common Stock AdditionalPaid-InCapital
RetainedEarnings
Treasury Stock DeferredStock-BasedCompensation
AccumulatedOther
Comprehensive(Loss) IncomeShares Amount Shares Amount Total
(in thousands)Balance at February 28, 2006 . . . . . . . . 23,999 $2,400 $250,792 $112,642 (1,992) $ (25,961) $(3,953) $ (1,951) $333,969
Impact of initially applying SFASNo. 123(R) . . . . . . . . . . . . . . . . . . . — — (3,953) — — — 3,953 — —
Comprehensive income:Net income . . . . . . . . . . . . . . . . . . . . — — — 27,015 — — — — 27,015Other comprehensive income
Change in unrealized loss oninvestments . . . . . . . . . . . . . . . . . — — — — — — — (2) (2)
Foreign currency translation adjustment . — — — — — — — 7,568 7,568
Total other comprehensive loss . . . . . . . . 7,566
Total comprehensive income . . . . . . . . . . 34,581Adjustment for initially applying SFAS
No. 158, net of tax . . . . . . . . . . . . . . — — — — — — — (504) (504)Issuance of common stock for business
acquisition . . . . . . . . . . . . . . . . . . . 162 16 3,996 — — — — — 4,012Stock options exercised . . . . . . . . . . . . . 883 88 14,376 — — — — — 14,464Excess tax benefit from employee stock
plans. . . . . . . . . . . . . . . . . . . . . . . — — 527 — — — — — 527Stock-based compensation . . . . . . . . . . . 69 7 10,963 — — — — — 10,970Purchases of treasury stock. . . . . . . . . . . — — — — (253) (6,077) — — (6,077)
Balance at February 28, 2007 . . . . . . . . 25,113 $2,511 $276,701 $139,657 (2,245) $ (32,038) $ — $ 5,111 $391,942
Comprehensive income:Net income . . . . . . . . . . . . . . . . . . . . — — — 32,906 — — — — 32,906Other comprehensive income
Change in pension liability . . . . . . . . . — — — — — — — 651 651Change in unrealized loss on
investments . . . . . . . . . . . . . . . . . — — — — — — — 8 8Foreign currency translation adjustment . — — — — — — — 13,802 13,802
Total other comprehensive income . . . . . . 14,461
Total comprehensive income . . . . . . . . . . 47,367Cumulative-effect adjustments on the
adoption of FIN 48 . . . . . . . . . . . . . . — — — 1,488 — — — — 1,488Stock options exercised . . . . . . . . . . . . . 1,006 101 18,280 — — — — — 18,381Excess tax benefit from employee stock
plans. . . . . . . . . . . . . . . . . . . . . . . — — 7,165 — — — — — 7,165Stock-based compensation . . . . . . . . . . . 74 7 10,353 — — — — — 10,360Purchases of treasury stock. . . . . . . . . . . — — — — (1,166) (40,614) — — (40,614)
Balance at February 29, 2008 . . . . . . . . 26,193 $2,619 $312,499 $174,051 (3,411) $ (72,652) $ — $ 19,572 $436,089
Comprehensive loss:Net loss . . . . . . . . . . . . . . . . . . . . . . — — — (49,409) — — — — (49,409)Other comprehensive income:
Change in pension liability . . . . . . . . . — — — — — — — 47 47Change in unrealized loss on
investments . . . . . . . . . . . . . . . . . — — — — — — — (7,022) (7,022)Foreign currency translation adjustment . — — — — — — — (15,470) (15,470)
Total other comprehensive loss . . . . . . . . (22,445)
Total comprehensive loss . . . . . . . . . . . . (71,854)Stock options exercised . . . . . . . . . . . . . 163 17 3,029 — — — — — 3,046Excess tax benefit from employee stock
plans. . . . . . . . . . . . . . . . . . . . . . . — — (200) — — — — — (200)Stock-based compensation . . . . . . . . . . . 60 6 10,268 — — — — — 10,274Purchases of treasury stock. . . . . . . . . . . — — — — (1,084) (28,547) — — (28,547)
Balance at February 28, 2009 . . . . . . . . 26,416 $2,642 $325,596 $124,642 (4,495) $(101,199) $ 0 $ (2,873) $348,808
The accompanying notes are an integral part of these consolidated financial statements.
51
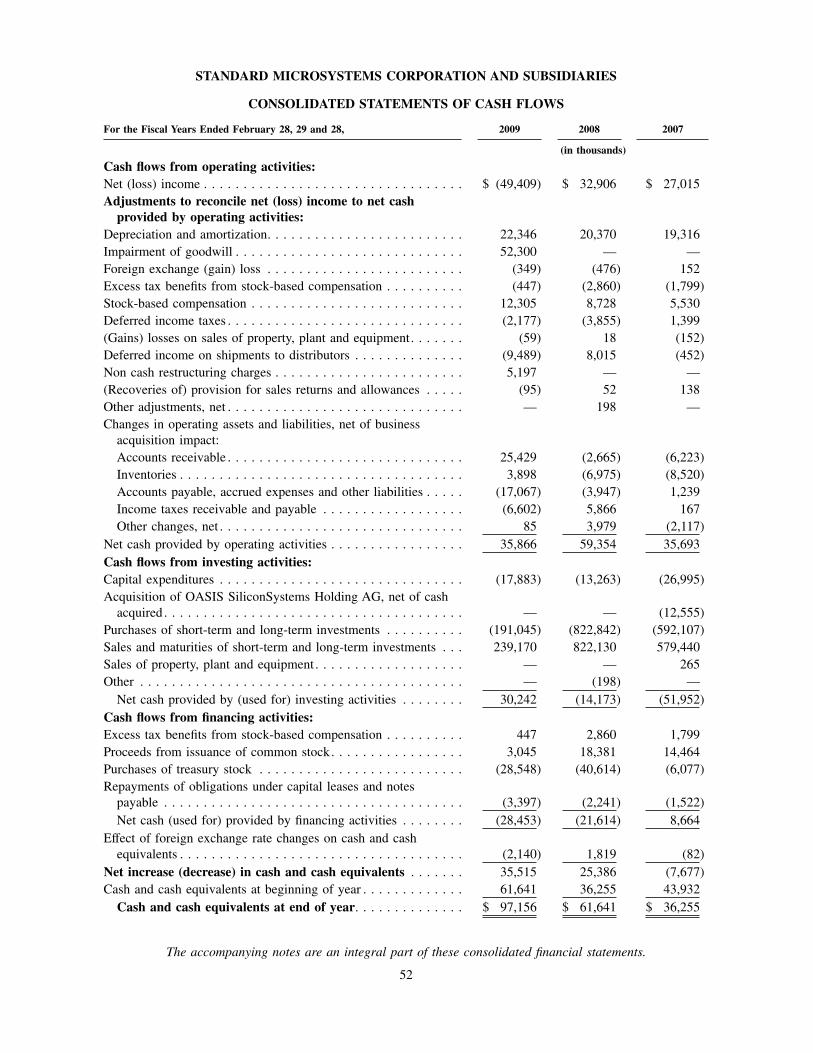
STANDARD MICROSYSTEMS CORPORATION AND SUBSIDIARIES
CONSOLIDATED STATEMENTS OF CASH FLOWS
For the Fiscal Years Ended February 28, 29 and 28, 2009 2008 2007
(in thousands)
Cash flows from operating activities:Net (loss) income . . . . . . . . . . . . . . . . . . . . . . . . . . . . . . . . . $ (49,409) $ 32,906 $ 27,015
Adjustments to reconcile net (loss) income to net cashprovided by operating activities:
Depreciation and amortization. . . . . . . . . . . . . . . . . . . . . . . . . 22,346 20,370 19,316
Impairment of goodwill . . . . . . . . . . . . . . . . . . . . . . . . . . . . . 52,300 — —
Foreign exchange (gain) loss . . . . . . . . . . . . . . . . . . . . . . . . . (349) (476) 152
Excess tax benefits from stock-based compensation . . . . . . . . . . (447) (2,860) (1,799)
Stock-based compensation . . . . . . . . . . . . . . . . . . . . . . . . . . . 12,305 8,728 5,530
Deferred income taxes . . . . . . . . . . . . . . . . . . . . . . . . . . . . . . (2,177) (3,855) 1,399
(Gains) losses on sales of property, plant and equipment. . . . . . . (59) 18 (152)
Deferred income on shipments to distributors . . . . . . . . . . . . . . (9,489) 8,015 (452)
Non cash restructuring charges . . . . . . . . . . . . . . . . . . . . . . . . 5,197 — —
(Recoveries of) provision for sales returns and allowances . . . . . (95) 52 138
Other adjustments, net . . . . . . . . . . . . . . . . . . . . . . . . . . . . . . — 198 —
Changes in operating assets and liabilities, net of business
acquisition impact:
Accounts receivable . . . . . . . . . . . . . . . . . . . . . . . . . . . . . . 25,429 (2,665) (6,223)
Inventories . . . . . . . . . . . . . . . . . . . . . . . . . . . . . . . . . . . . 3,898 (6,975) (8,520)
Accounts payable, accrued expenses and other liabilities . . . . . (17,067) (3,947) 1,239
Income taxes receivable and payable . . . . . . . . . . . . . . . . . . (6,602) 5,866 167
Other changes, net . . . . . . . . . . . . . . . . . . . . . . . . . . . . . . . 85 3,979 (2,117)
Net cash provided by operating activities . . . . . . . . . . . . . . . . . 35,866 59,354 35,693
Cash flows from investing activities:Capital expenditures . . . . . . . . . . . . . . . . . . . . . . . . . . . . . . . (17,883) (13,263) (26,995)
Acquisition of OASIS SiliconSystems Holding AG, net of cash
acquired . . . . . . . . . . . . . . . . . . . . . . . . . . . . . . . . . . . . . . — — (12,555)
Purchases of short-term and long-term investments . . . . . . . . . . (191,045) (822,842) (592,107)
Sales and maturities of short-term and long-term investments . . . 239,170 822,130 579,440
Sales of property, plant and equipment . . . . . . . . . . . . . . . . . . . — — 265
Other . . . . . . . . . . . . . . . . . . . . . . . . . . . . . . . . . . . . . . . . . — (198) —
Net cash provided by (used for) investing activities . . . . . . . . 30,242 (14,173) (51,952)
Cash flows from financing activities:Excess tax benefits from stock-based compensation . . . . . . . . . . 447 2,860 1,799
Proceeds from issuance of common stock. . . . . . . . . . . . . . . . . 3,045 18,381 14,464
Purchases of treasury stock . . . . . . . . . . . . . . . . . . . . . . . . . . (28,548) (40,614) (6,077)
Repayments of obligations under capital leases and notes
payable . . . . . . . . . . . . . . . . . . . . . . . . . . . . . . . . . . . . . . (3,397) (2,241) (1,522)
Net cash (used for) provided by financing activities . . . . . . . . (28,453) (21,614) 8,664
Effect of foreign exchange rate changes on cash and cash
equivalents . . . . . . . . . . . . . . . . . . . . . . . . . . . . . . . . . . . . (2,140) 1,819 (82)
Net increase (decrease) in cash and cash equivalents . . . . . . . 35,515 25,386 (7,677)
Cash and cash equivalents at beginning of year . . . . . . . . . . . . . 61,641 36,255 43,932
Cash and cash equivalents at end of year. . . . . . . . . . . . . . $ 97,156 $ 61,641 $ 36,255
The accompanying notes are an integral part of these consolidated financial statements.
52
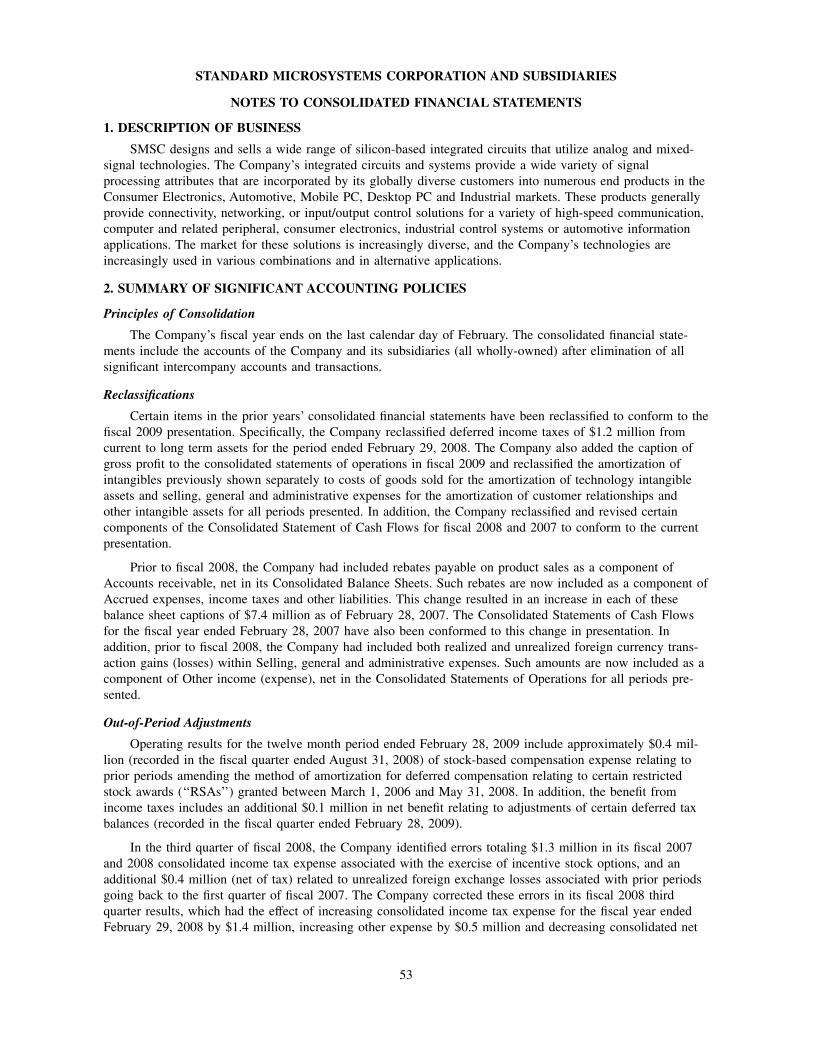
STANDARD MICROSYSTEMS CORPORATION AND SUBSIDIARIES
NOTES TO CONSOLIDATED FINANCIAL STATEMENTS
1. DESCRIPTION OF BUSINESS
SMSC designs and sells a wide range of silicon-based integrated circuits that utilize analog and mixed-
signal technologies. The Company’s integrated circuits and systems provide a wide variety of signal
processing attributes that are incorporated by its globally diverse customers into numerous end products in the
Consumer Electronics, Automotive, Mobile PC, Desktop PC and Industrial markets. These products generally
provide connectivity, networking, or input/output control solutions for a variety of high-speed communication,
computer and related peripheral, consumer electronics, industrial control systems or automotive information
applications. The market for these solutions is increasingly diverse, and the Company’s technologies are
increasingly used in various combinations and in alternative applications.
2. SUMMARY OF SIGNIFICANT ACCOUNTING POLICIES
Principles of Consolidation
The Company’s fiscal year ends on the last calendar day of February. The consolidated financial state-
ments include the accounts of the Company and its subsidiaries (all wholly-owned) after elimination of all
significant intercompany accounts and transactions.
Reclassifications
Certain items in the prior years’ consolidated financial statements have been reclassified to conform to the
fiscal 2009 presentation. Specifically, the Company reclassified deferred income taxes of $1.2 million from
current to long term assets for the period ended February 29, 2008. The Company also added the caption of
gross profit to the consolidated statements of operations in fiscal 2009 and reclassified the amortization of
intangibles previously shown separately to costs of goods sold for the amortization of technology intangible
assets and selling, general and administrative expenses for the amortization of customer relationships and
other intangible assets for all periods presented. In addition, the Company reclassified and revised certain
components of the Consolidated Statement of Cash Flows for fiscal 2008 and 2007 to conform to the current
presentation.
Prior to fiscal 2008, the Company had included rebates payable on product sales as a component of
Accounts receivable, net in its Consolidated Balance Sheets. Such rebates are now included as a component of
Accrued expenses, income taxes and other liabilities. This change resulted in an increase in each of these
balance sheet captions of $7.4 million as of February 28, 2007. The Consolidated Statements of Cash Flows
for the fiscal year ended February 28, 2007 have also been conformed to this change in presentation. In
addition, prior to fiscal 2008, the Company had included both realized and unrealized foreign currency trans-
action gains (losses) within Selling, general and administrative expenses. Such amounts are now included as a
component of Other income (expense), net in the Consolidated Statements of Operations for all periods pre-
sented.
Out-of-Period Adjustments
Operating results for the twelve month period ended February 28, 2009 include approximately $0.4 mil-
lion (recorded in the fiscal quarter ended August 31, 2008) of stock-based compensation expense relating to
prior periods amending the method of amortization for deferred compensation relating to certain restricted
stock awards (‘‘RSAs’’) granted between March 1, 2006 and May 31, 2008. In addition, the benefit from
income taxes includes an additional $0.1 million in net benefit relating to adjustments of certain deferred tax
balances (recorded in the fiscal quarter ended February 28, 2009).
In the third quarter of fiscal 2008, the Company identified errors totaling $1.3 million in its fiscal 2007
and 2008 consolidated income tax expense associated with the exercise of incentive stock options, and an
additional $0.4 million (net of tax) related to unrealized foreign exchange losses associated with prior periods
going back to the first quarter of fiscal 2007. The Company corrected these errors in its fiscal 2008 third
quarter results, which had the effect of increasing consolidated income tax expense for the fiscal year ended
February 29, 2008 by $1.4 million, increasing other expense by $0.5 million and decreasing consolidated net
53
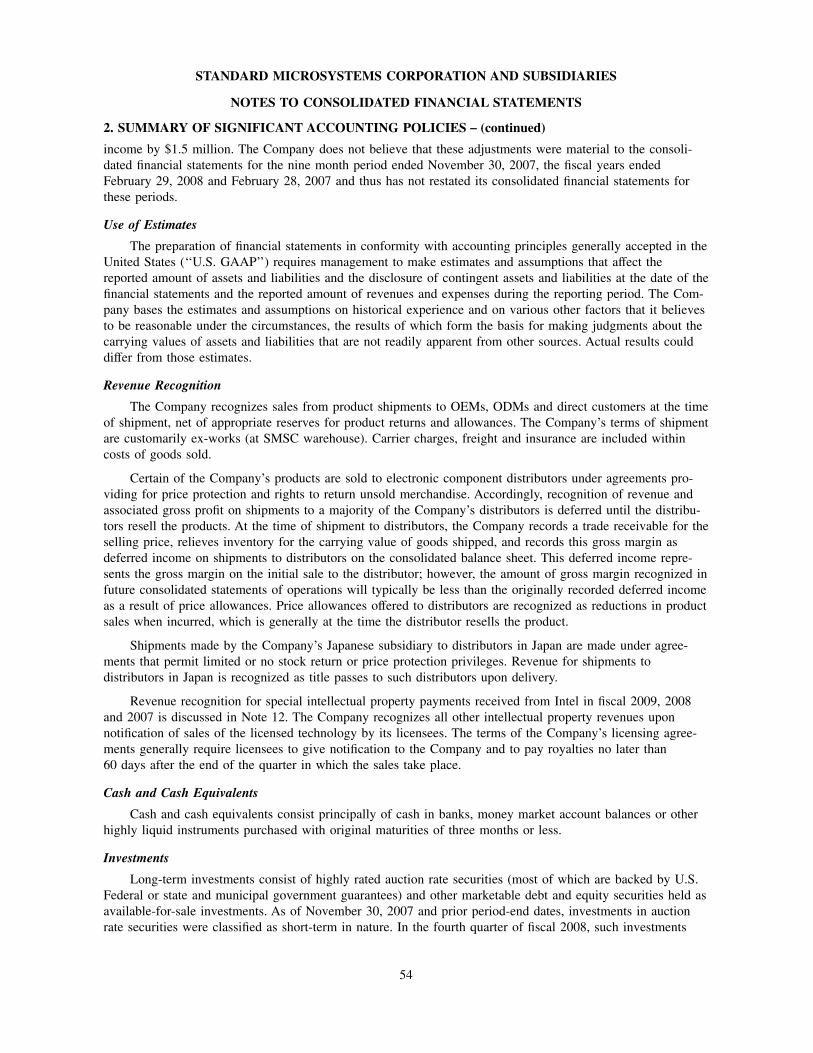
STANDARD MICROSYSTEMS CORPORATION AND SUBSIDIARIES
NOTES TO CONSOLIDATED FINANCIAL STATEMENTS
2. SUMMARY OF SIGNIFICANT ACCOUNTING POLICIES − (continued)
income by $1.5 million. The Company does not believe that these adjustments were material to the consoli-
dated financial statements for the nine month period ended November 30, 2007, the fiscal years ended
February 29, 2008 and February 28, 2007 and thus has not restated its consolidated financial statements for
these periods.
Use of Estimates
The preparation of financial statements in conformity with accounting principles generally accepted in the
United States (‘‘U.S. GAAP’’) requires management to make estimates and assumptions that affect the
reported amount of assets and liabilities and the disclosure of contingent assets and liabilities at the date of the
financial statements and the reported amount of revenues and expenses during the reporting period. The Com-
pany bases the estimates and assumptions on historical experience and on various other factors that it believes
to be reasonable under the circumstances, the results of which form the basis for making judgments about the
carrying values of assets and liabilities that are not readily apparent from other sources. Actual results could
differ from those estimates.
Revenue Recognition
The Company recognizes sales from product shipments to OEMs, ODMs and direct customers at the time
of shipment, net of appropriate reserves for product returns and allowances. The Company’s terms of shipment
are customarily ex-works (at SMSC warehouse). Carrier charges, freight and insurance are included within
costs of goods sold.
Certain of the Company’s products are sold to electronic component distributors under agreements pro-
viding for price protection and rights to return unsold merchandise. Accordingly, recognition of revenue and
associated gross profit on shipments to a majority of the Company’s distributors is deferred until the distribu-
tors resell the products. At the time of shipment to distributors, the Company records a trade receivable for the
selling price, relieves inventory for the carrying value of goods shipped, and records this gross margin as
deferred income on shipments to distributors on the consolidated balance sheet. This deferred income repre-
sents the gross margin on the initial sale to the distributor; however, the amount of gross margin recognized in
future consolidated statements of operations will typically be less than the originally recorded deferred income
as a result of price allowances. Price allowances offered to distributors are recognized as reductions in product
sales when incurred, which is generally at the time the distributor resells the product.
Shipments made by the Company’s Japanese subsidiary to distributors in Japan are made under agree-
ments that permit limited or no stock return or price protection privileges. Revenue for shipments to
distributors in Japan is recognized as title passes to such distributors upon delivery.
Revenue recognition for special intellectual property payments received from Intel in fiscal 2009, 2008
and 2007 is discussed in Note 12. The Company recognizes all other intellectual property revenues upon
notification of sales of the licensed technology by its licensees. The terms of the Company’s licensing agree-
ments generally require licensees to give notification to the Company and to pay royalties no later than
60 days after the end of the quarter in which the sales take place.
Cash and Cash Equivalents
Cash and cash equivalents consist principally of cash in banks, money market account balances or other
highly liquid instruments purchased with original maturities of three months or less.
Investments
Long-term investments consist of highly rated auction rate securities (most of which are backed by U.S.
Federal or state and municipal government guarantees) and other marketable debt and equity securities held as
available-for-sale investments. As of November 30, 2007 and prior period-end dates, investments in auction
rate securities were classified as short-term in nature. In the fourth quarter of fiscal 2008, such investments
54
STANDARD MICROSYSTEMS CORPORATION AND SUBSIDIARIES
NOTES TO CONSOLIDATED FINANCIAL STATEMENTS
2. SUMMARY OF SIGNIFICANT ACCOUNTING POLICIES − (continued)
became subject to adverse market conditions, and the liquidity typically associated with the financial markets
for such instruments became restricted as auctions began to fail. Given the underlying terms of these securi-
ties, in most cases where auctions fail, the investor is entitled to higher interest rates to compensate for the
lack of liquidity. At present, the Company is earning higher returns on these investments as a consequence of
such liquidity constraints. The Company expects such market conditions to be temporary, however has classi-
fied its investments in auction rate securities as long-term in the interim. Considering such determination on
market conditions, the high quality of these investments (and underlying guarantees) and given the Company
has adequate cash, working capital and cash flow from operations to meet current operating needs, manage-
ment has determined that impairment of these investments is not other than temporary at this time.
Management will continue to monitor market conditions, and may deem that impairment is other than tempo-
rary if market conditions do not improve in the foreseeable future or if the credit quality of the underlying
issuer deteriorates. The Company is currently liquidating such investments as opportunities arise. As of
April 27, 2009, the Company had further reduced its holdings in auction rate securities by $8.0 million to
$68.3 million at cost.
The Company classifies all marketable debt and equity securities with remaining maturities of greater
than one year as long-term investments. Most of the Company’s long-term investments had maturities greater
than five years. The Company held approximately $0.1 million of equity securities at February 28, 2009
which were classified as long-term investments. Investments in such readily marketable, publicly traded equity
securities are classified as available-for-sale and are carried at fair value on the Consolidated Balance Sheets.
Unrealized gains and temporary losses on such securities, net of taxes, are reported in accumulated other
comprehensive income within shareholders’ equity. The amount of net unrealized gains on such securities, net
of taxes, in fiscal 2009 were $24 thousand, compared to net unrealized losses of $8 thousand in 2008, and a
negligible amount in 2007. Impairment charges on these investments are recorded if declines in value are
deemed to be other than temporary.
The Company bases the cost of the investment sold on the specific identification method. Gross realized
gains of $25 thousand are included in earnings in fiscal 2009 compared to gross realized losses of $102 thou-
sand and $20 thousand in 2008 and 2007, respectively.
Fair Value of Financial Instruments
The carrying amounts reported in the consolidated balance sheets for cash and cash equivalents, short-
term investments, accounts receivable, accounts payable and accrued expenses approximate fair value due to
their short maturities.
Fair Value Measurements
Effective March 1, 2008, the Company adopted Financial Accounting Standards Board (‘‘FASB’’) State-
ment of Financial Accounting Standards (‘‘SFAS’’) No. 157, ‘‘Fair Value Measurements’’ (‘‘SFAS 157’’),
except as it applies to the non-financial assets and non-financial liabilities subject to FSP SFAS 157-2.
SFAS 157 clarifies the definition of fair value, establishes a framework for measurement of fair value and
expands disclosure about fair value measurements. SFAS 157 is effective for fiscal years beginning after
November 15, 2007 (the Company’s current fiscal year), except as amended by FASB Staff Position (‘‘FSP’’)
SFAS 157-1, which was effective upon adoption during the Company’s current fiscal year ended February 28,
2009, FSP SFAS 157-2, which is effective for fiscal years beginning after November 15, 2008 (SMSC’s fiscal
year beginning March 1, 2009, or fiscal 2010) and FSP SFAS No. 157-3, which was effective upon adoption
during the Company’s current fiscal year ended February 28, 2009. FSP SFAS 157-2 allows partial adoption
relating to fair value measurements for non-financial assets and liabilities that are not measured at fair value
on a recurring basis. FSP SFAS No. 157-3 clarifies the application of SFAS No. 157 in a market that is not
active and provides an example to illustrate key considerations in determining the fair value of a financial
asset when the market for that financial asset is not active. The Company will adopt the remaining provisions
55
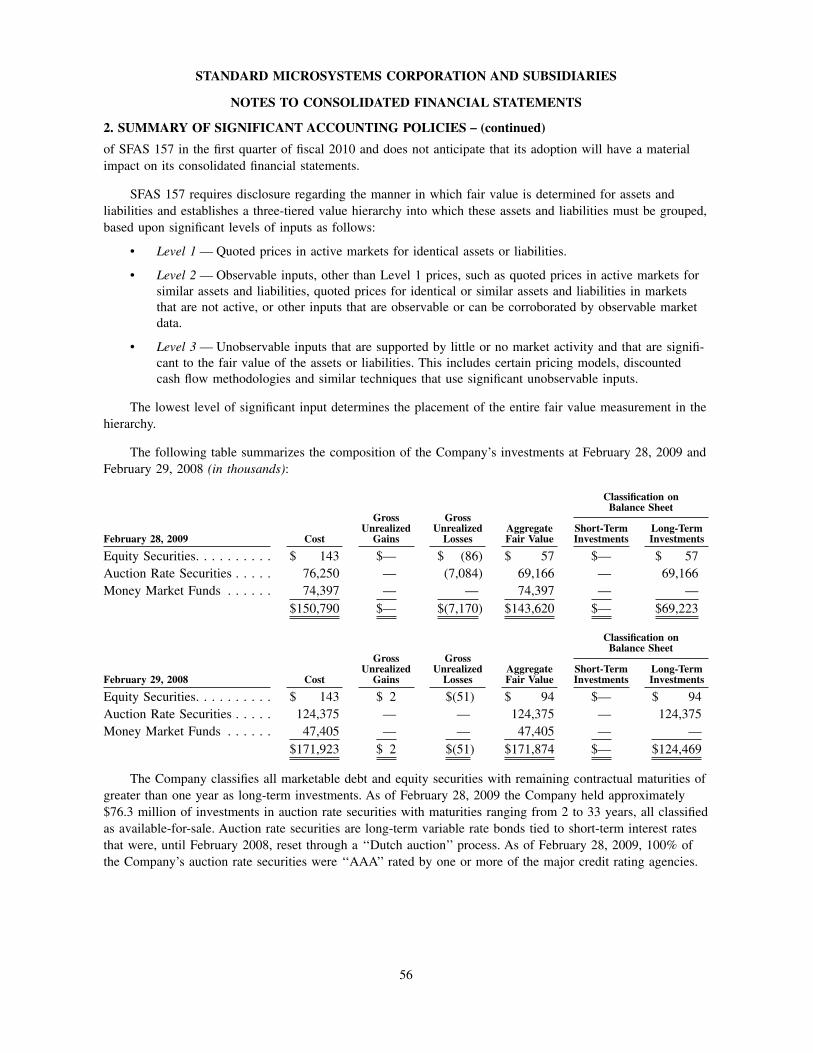
STANDARD MICROSYSTEMS CORPORATION AND SUBSIDIARIES
NOTES TO CONSOLIDATED FINANCIAL STATEMENTS
2. SUMMARY OF SIGNIFICANT ACCOUNTING POLICIES − (continued)
of SFAS 157 in the first quarter of fiscal 2010 and does not anticipate that its adoption will have a material
impact on its consolidated financial statements.
SFAS 157 requires disclosure regarding the manner in which fair value is determined for assets and
liabilities and establishes a three-tiered value hierarchy into which these assets and liabilities must be grouped,
based upon significant levels of inputs as follows:
• Level 1—Quoted prices in active markets for identical assets or liabilities.
• Level 2—Observable inputs, other than Level 1 prices, such as quoted prices in active markets for
similar assets and liabilities, quoted prices for identical or similar assets and liabilities in markets
that are not active, or other inputs that are observable or can be corroborated by observable market
data.
• Level 3—Unobservable inputs that are supported by little or no market activity and that are signifi-
cant to the fair value of the assets or liabilities. This includes certain pricing models, discounted
cash flow methodologies and similar techniques that use significant unobservable inputs.
The lowest level of significant input determines the placement of the entire fair value measurement in the
hierarchy.
The following table summarizes the composition of the Company’s investments at February 28, 2009 and
February 29, 2008 (in thousands):
Cost
GrossUnrealized
Gains
GrossUnrealizedLosses
AggregateFair Value
Classification onBalance Sheet
February 28, 2009Short-TermInvestments
Long-TermInvestments
Equity Securities. . . . . . . . . . $ 143 $— $ (86) $ 57 $— $ 57
Auction Rate Securities . . . . . 76,250 — (7,084) 69,166 — 69,166
Money Market Funds . . . . . . 74,397 — — 74,397 — —
$150,790 $— $(7,170) $143,620 $— $69,223
Cost
GrossUnrealized
Gains
GrossUnrealizedLosses
AggregateFair Value
Classification onBalance Sheet
February 29, 2008Short-TermInvestments
Long-TermInvestments
Equity Securities. . . . . . . . . . $ 143 $ 2 $(51) $ 94 $— $ 94
Auction Rate Securities . . . . . 124,375 — — 124,375 — 124,375
Money Market Funds . . . . . . 47,405 — — 47,405 — —
$171,923 $ 2 $(51) $171,874 $— $124,469
The Company classifies all marketable debt and equity securities with remaining contractual maturities of
greater than one year as long-term investments. As of February 28, 2009 the Company held approximately
$76.3 million of investments in auction rate securities with maturities ranging from 2 to 33 years, all classified
as available-for-sale. Auction rate securities are long-term variable rate bonds tied to short-term interest rates
that were, until February 2008, reset through a ‘‘Dutch auction’’ process. As of February 28, 2009, 100% of
the Company’s auction rate securities were ‘‘AAA’’ rated by one or more of the major credit rating agencies.
56
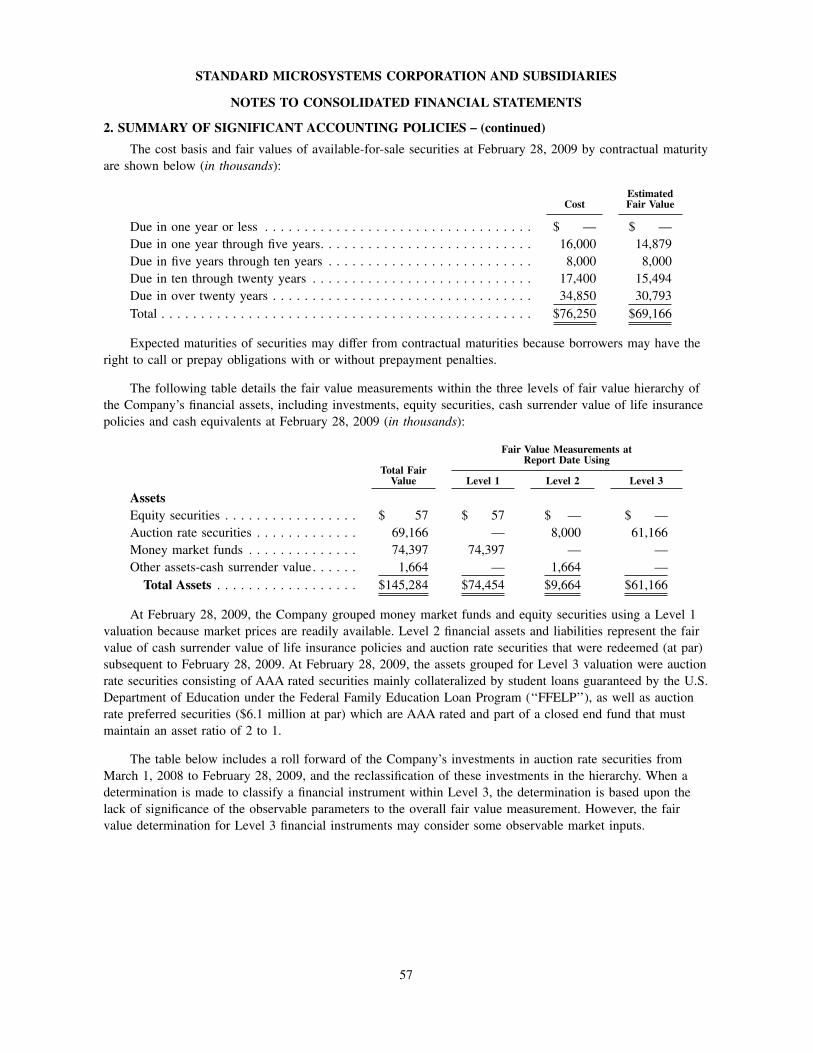
STANDARD MICROSYSTEMS CORPORATION AND SUBSIDIARIES
NOTES TO CONSOLIDATED FINANCIAL STATEMENTS
2. SUMMARY OF SIGNIFICANT ACCOUNTING POLICIES − (continued)
The cost basis and fair values of available-for-sale securities at February 28, 2009 by contractual maturity
are shown below (in thousands):
CostEstimatedFair Value
Due in one year or less . . . . . . . . . . . . . . . . . . . . . . . . . . . . . . . . . . $ — $ —
Due in one year through five years. . . . . . . . . . . . . . . . . . . . . . . . . . . 16,000 14,879
Due in five years through ten years . . . . . . . . . . . . . . . . . . . . . . . . . . 8,000 8,000
Due in ten through twenty years . . . . . . . . . . . . . . . . . . . . . . . . . . . . 17,400 15,494
Due in over twenty years . . . . . . . . . . . . . . . . . . . . . . . . . . . . . . . . . 34,850 30,793
Total . . . . . . . . . . . . . . . . . . . . . . . . . . . . . . . . . . . . . . . . . . . . . . . $76,250 $69,166
Expected maturities of securities may differ from contractual maturities because borrowers may have the
right to call or prepay obligations with or without prepayment penalties.
The following table details the fair value measurements within the three levels of fair value hierarchy of
the Company’s financial assets, including investments, equity securities, cash surrender value of life insurance
policies and cash equivalents at February 28, 2009 (in thousands):
Total FairValue
Fair Value Measurements atReport Date Using
Level 1 Level 2 Level 3
AssetsEquity securities . . . . . . . . . . . . . . . . . $ 57 $ 57 $ — $ —
Auction rate securities . . . . . . . . . . . . . 69,166 — 8,000 61,166
Money market funds . . . . . . . . . . . . . . 74,397 74,397 — —
Other assets-cash surrender value. . . . . . 1,664 — 1,664 —
Total Assets . . . . . . . . . . . . . . . . . . $145,284 $74,454 $9,664 $61,166
At February 28, 2009, the Company grouped money market funds and equity securities using a Level 1
valuation because market prices are readily available. Level 2 financial assets and liabilities represent the fair
value of cash surrender value of life insurance policies and auction rate securities that were redeemed (at par)
subsequent to February 28, 2009. At February 28, 2009, the assets grouped for Level 3 valuation were auction
rate securities consisting of AAA rated securities mainly collateralized by student loans guaranteed by the U.S.
Department of Education under the Federal Family Education Loan Program (‘‘FFELP’’), as well as auction
rate preferred securities ($6.1 million at par) which are AAA rated and part of a closed end fund that must
maintain an asset ratio of 2 to 1.
The table below includes a roll forward of the Company’s investments in auction rate securities from
March 1, 2008 to February 28, 2009, and the reclassification of these investments in the hierarchy. When a
determination is made to classify a financial instrument within Level 3, the determination is based upon the
lack of significance of the observable parameters to the overall fair value measurement. However, the fair
value determination for Level 3 financial instruments may consider some observable market inputs.
57
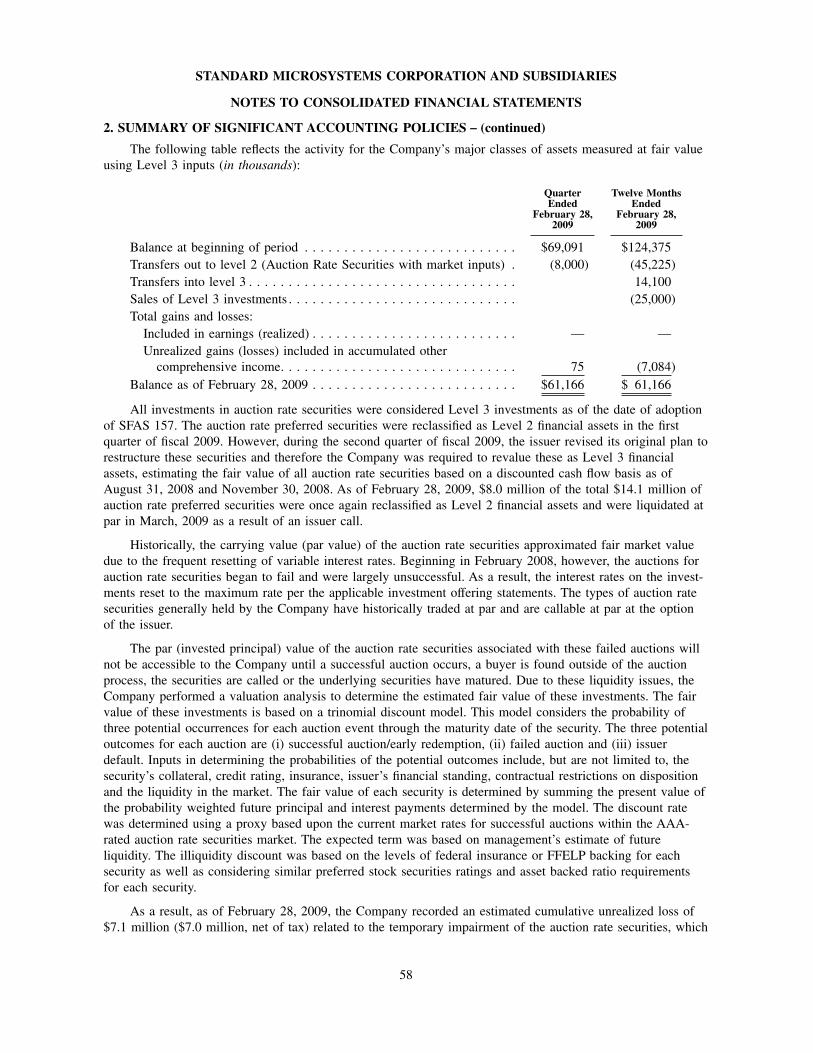
STANDARD MICROSYSTEMS CORPORATION AND SUBSIDIARIES
NOTES TO CONSOLIDATED FINANCIAL STATEMENTS
2. SUMMARY OF SIGNIFICANT ACCOUNTING POLICIES − (continued)
The following table reflects the activity for the Company’s major classes of assets measured at fair value
using Level 3 inputs (in thousands):
QuarterEnded
February 28,2009
Twelve MonthsEnded
February 28,2009
Balance at beginning of period . . . . . . . . . . . . . . . . . . . . . . . . . . . $69,091 $124,375
Transfers out to level 2 (Auction Rate Securities with market inputs) . (8,000) (45,225)
Transfers into level 3 . . . . . . . . . . . . . . . . . . . . . . . . . . . . . . . . . . 14,100
Sales of Level 3 investments . . . . . . . . . . . . . . . . . . . . . . . . . . . . . (25,000)
Total gains and losses:
Included in earnings (realized) . . . . . . . . . . . . . . . . . . . . . . . . . . — —
Unrealized gains (losses) included in accumulated other
comprehensive income. . . . . . . . . . . . . . . . . . . . . . . . . . . . . . 75 (7,084)
Balance as of February 28, 2009 . . . . . . . . . . . . . . . . . . . . . . . . . . $61,166 $ 61,166
All investments in auction rate securities were considered Level 3 investments as of the date of adoption
of SFAS 157. The auction rate preferred securities were reclassified as Level 2 financial assets in the first
quarter of fiscal 2009. However, during the second quarter of fiscal 2009, the issuer revised its original plan to
restructure these securities and therefore the Company was required to revalue these as Level 3 financial
assets, estimating the fair value of all auction rate securities based on a discounted cash flow basis as of
August 31, 2008 and November 30, 2008. As of February 28, 2009, $8.0 million of the total $14.1 million of
auction rate preferred securities were once again reclassified as Level 2 financial assets and were liquidated at
par in March, 2009 as a result of an issuer call.
Historically, the carrying value (par value) of the auction rate securities approximated fair market value
due to the frequent resetting of variable interest rates. Beginning in February 2008, however, the auctions for
auction rate securities began to fail and were largely unsuccessful. As a result, the interest rates on the invest-
ments reset to the maximum rate per the applicable investment offering statements. The types of auction rate
securities generally held by the Company have historically traded at par and are callable at par at the option
of the issuer.
The par (invested principal) value of the auction rate securities associated with these failed auctions will
not be accessible to the Company until a successful auction occurs, a buyer is found outside of the auction
process, the securities are called or the underlying securities have matured. Due to these liquidity issues, the
Company performed a valuation analysis to determine the estimated fair value of these investments. The fair
value of these investments is based on a trinomial discount model. This model considers the probability of
three potential occurrences for each auction event through the maturity date of the security. The three potential
outcomes for each auction are (i) successful auction/early redemption, (ii) failed auction and (iii) issuer
default. Inputs in determining the probabilities of the potential outcomes include, but are not limited to, the
security’s collateral, credit rating, insurance, issuer’s financial standing, contractual restrictions on disposition
and the liquidity in the market. The fair value of each security is determined by summing the present value of
the probability weighted future principal and interest payments determined by the model. The discount rate
was determined using a proxy based upon the current market rates for successful auctions within the AAA-
rated auction rate securities market. The expected term was based on management’s estimate of future
liquidity. The illiquidity discount was based on the levels of federal insurance or FFELP backing for each
security as well as considering similar preferred stock securities ratings and asset backed ratio requirements
for each security.
As a result, as of February 28, 2009, the Company recorded an estimated cumulative unrealized loss of
$7.1 million ($7.0 million, net of tax) related to the temporary impairment of the auction rate securities, which
58
STANDARD MICROSYSTEMS CORPORATION AND SUBSIDIARIES
NOTES TO CONSOLIDATED FINANCIAL STATEMENTS
2. SUMMARY OF SIGNIFICANT ACCOUNTING POLICIES − (continued)
was included in accumulated other comprehensive income within shareholders’ equity. The Company deemed
the loss to be temporary because the Company does not plan to sell any of the auction rate securities prior to
maturity at an amount below the original purchase value and, at this time, does not deem it probable that it
will receive less than 100% of the principal and accrued interest from the issuer. Further, the credit ratings of
auction rate securities held by the Company remain at AAA levels. The Company continues to liquidate
investments in auction rate securities as opportunities arise. In the twelve-months ended February 28, 2009,
$48.2 million of such investments were liquidated at par in connection with issuer calls and redemptions.
Subsequent to February 28, 2009, an additional $8.0 million in auction rate securities were liquidated at par in
connection with issuer calls.
The Company does not believe it will be necessary to access these investments to support current work-
ing capital requirements. However, the Company may be required to record additional unrealized losses in
other comprehensive income in future periods based on then current facts and circumstances. Further, if the
credit rating of the security issuers deteriorates, or if active markets for such securities are not reestablished,
the Company may be required to adjust the carrying value of these investments through impairment charges
recorded in the consolidated statements of operations, and any such impairment adjustments may be material.
Concentrations of Credit Risk
Financial instruments that potentially subject the Company to concentrations of credit risk consist of
cash, cash equivalents, short-term and long-term investments (including auction rate securities) and accounts
receivable. The Company invests its cash in bank accounts and money market accounts with major financial
institutions, in U.S. Treasury and agency obligations, and in debt securities of corporations and agencies with
high credit quality. By policy, the Company seeks to limit credit exposure on investments through diversifica-
tion and by restricting its investments to highly rated securities.
The Company’s accounts receivable result from trade credit extended on shipments to original equipment
manufacturers, original design manufacturers and electronic component distributors. The Company can have
individually significant accounts receivable balances from its larger customers. At February 28, 2009, two
customers accounted for more than 10% of gross trade accounts receivable, with combined balances totaling
$7.8 million. At February 29, 2008, one customer accounted for more than 10% of gross trade accounts
receivable, with a balance of $17.2 million. The Company manages its concentration of credit risk on
accounts receivable by performing ongoing credit evaluations of its customers’ financial condition and limiting
the extension of credit when deemed necessary. In addition, although the Company generally does not request
collateral in advance of shipment, prepayments or standby letters of credit may be required and have been
obtained in certain circumstances, and the Company has bought third-party credit insurance policies with
respect to certain customers to reduce credit concentration exposure. The Company maintains an allowance for
potential credit losses, taking into consideration the overall quality and aging of the accounts receivable
portfolio and specifically identified customer risks.
Inventories and Costs of Goods Sold
Inventories are valued at the lower of standard cost (which closely approximates values on a first-in,
first-out basis) or market. The Company establishes inventory allowances for estimated obsolescence or
unmarketable inventory for the difference between the cost of inventory and estimated realizable value based
upon assumptions about future demand and market conditions.
Costs of goods sold includes the cost of inventory, shipping and handling costs borne by the Company in
connection with shipments to customers, royalties associated with certain products and depreciation on pro-
ductive assets (principally, test equipment and facilities). Costs of goods sold also includes amortization of
acquired product technologies. Such amortization totaled $4.5 million, $4.9 million and $4.7 million for fiscal
2009, 2008 and 2007, respectively.
59
STANDARD MICROSYSTEMS CORPORATION AND SUBSIDIARIES
NOTES TO CONSOLIDATED FINANCIAL STATEMENTS
2. SUMMARY OF SIGNIFICANT ACCOUNTING POLICIES − (continued)
Warranty Costs
The Company generally warrants its products against defects in materials and workmanship and non-
conformance to specifications for varying lengths of time, typically twelve to twenty four months. The
majority of the Company’s product warranty claims are settled through the return of the defective product and
shipment of replacement product. Warranty returns are included within the Company’s allowance for returns,
which is based on historical return rates. Actual future returns could differ from the allowance established. In
addition, the Company accrues a liability for specific warranty costs expected to be settled other than through
product return and replacement, if a loss is probable and can be reasonably estimated. Product warranty
expenses during fiscal 2009, 2008 and 2007 were not material.
Property, Plant and Equipment
Property, plant and equipment are carried at cost and depreciated on a straight-line basis over the esti-
mated useful lives of buildings and leasehold improvements (2 to 25 years), machinery and equipment (3 to
7 years) and computer systems and software (2 to 7 years). Upon sale or retirement of property, plant and
equipment, the related cost and accumulated depreciation are removed from the accounts, and any resulting
gain or loss is reflected currently in the Company’s consolidated statements of operations.
Depreciation expense related to property, plant and equipment was $16.0 million, $13.7 million and
$13.0 million, for the fiscal years ended February 28, 2009, February 29, 2008 and February 28, 2007,
respectively.
Cost-Basis Investments
Equity investments representing an ownership interest of less than 20% in non-publicly traded companies
are carried at cost. Changes in the values of these investments are not recognized unless they are sold, or an
impairment in value is deemed to be other than temporary.
Long-Lived Assets
The Company assesses the recoverability of long-lived assets, including property, plant and equipment
and definite-lived intangible assets, whenever events or changes in circumstances indicate that future undis-
counted cash flows expected to be generated by an asset’s disposition or use may not be sufficient to support
its carrying value. If such cash flows are not sufficient to support the asset’s recorded value, an impairment
charge is recognized upon completion of such assessment to reduce the carrying value of the long-lived asset
to its estimated fair value.
Goodwill and Purchased Intangible Assets
Goodwill is recorded as the difference, if any, between the aggregate value of consideration exchanged
for an acquired business and the fair value (measured as of the acquisition date) of total net tangible and
identified intangible assets acquired. In accordance with SFAS No. 142, Goodwill and Other Intangible Assets(‘‘SFAS 142’’), goodwill and purchased intangibles with indefinite lives are not amortized but are tested for
impairment on an annual basis or whenever events or changes in circumstances indicate that the carrying
amount of these assets may not be recoverable. Purchased intangible assets with finite useful lives are amor-
tized over their estimated useful lives and are reviewed for impairment in value when indicators of
impairment, such as reductions in demand, are present. The Company conducts annual reviews for potential
impairment in the fourth quarter of each fiscal year.
Defined Benefit Plans
Effective for fiscal year 2007, the Company adopted the provisions of SFAS No. 158, Employers’Accounting for Defined Benefit Pension and Other Postretirement Plans — an amendment of FASB StatementsNo. 87, 88, 106, and 132(R) (‘‘SFAS 158’’). SFAS No. 158 requires that the funded status of defined-benefit
60
STANDARD MICROSYSTEMS CORPORATION AND SUBSIDIARIES
NOTES TO CONSOLIDATED FINANCIAL STATEMENTS
2. SUMMARY OF SIGNIFICANT ACCOUNTING POLICIES − (continued)
postretirement plans be recognized on the company’s consolidated balance sheets, and changes in the funded
status be reflected in comprehensive income. SFAS No. 158 also requires the measurement date of the plan’s
funded status to be the same as the company’s fiscal year-end. The initial impact of SFAS No. 158 due to
unrecognized prior service costs or credits and net actuarial gains or losses as well as subsequent changes in
the funded status was recognized as a component of accumulated comprehensive income in shareholders’
equity.
Contingencies
The Company regularly and routinely evaluates risks and exposures existing in the business, and either
discloses such matters or records liabilities for such exposures as warranted, following the guidance set forth
in SFAS No. 5, Accounting for Contingencies (‘‘SFAS 5’’). In connection with any such evaluation, the Com-
pany also considers estimated legal fees (if applicable) associated with such matters in determining amounts to
be accrued.
Research and Development
Expenditures for research and development activities are expensed in the period incurred.
Advertising Expense
Advertising costs are expensed in the period incurred and are not material to the results of operations in
any of the periods presented.
Stock-Based Compensation (Share-Based Payment)
The Company has several stock-based compensation plans in effect under which incentive stock options,
non-qualified stock options, restricted stock awards (‘‘RSAs’’) and stock appreciation rights (‘‘SARs’’) are
granted to employees and directors. Stock options and SARs are granted with exercise prices equal to the fair
value of the underlying shares on the date of grant. New shares are issued in settling stock option exercises
and restricted stock awards.
Effective March 1, 2006 the Company adopted SFAS No. 123 (revised 2004), Share-Based Payment(‘‘SFAS 123R’’). SFAS 123R supersedes Accounting Principles Board Opinion No. 25, Accounting for StockIssued to Employees (‘‘APB 25’’) and related interpretations and amends SFAS No. 95, Statement of CashFlows. SFAS 123R requires all share-based payments to employees, including grants of employee stock
options, restricted stock units and employee stock purchase rights, to be recognized in the financial statements
based on their respective grant date fair values and does not allow the previously permitted pro forma
disclosure-only method as an alternative to financial statement recognition. SFAS 123R also requires the
benefits of tax deductions in excess of recognized compensation cost be reported as a financing cash flow,
rather than as an operating cash flow as required under previous literature. In March 2005 the SEC issued
Staff Accounting Bulletin No. 107 (‘‘SAB 107’’), which provides guidance regarding the interaction of
SFAS 123R and certain SEC rules and regulations. The Company considered the provisions of SAB 107 in its
adoption of SFAS 123R.
The Company elected the modified prospective transition method as permitted by SFAS 123R. Accord-
ingly, periods prior to fiscal 2007 were not revised to reflect the impact of SFAS 123R. Under this transition
method, recognized compensation cost includes: (i) compensation cost for all stock-based payments granted
prior to, but not yet fully vested as of, February 28, 2006 (based on the grant date fair value estimated in
accordance with the original provisions of SFAS No. 123, Accounting for Stock-Based Compensation(‘‘SFAS 123’’), and previously presented in the pro forma footnote disclosures); and (ii) compensation cost for
all stock-based payments granted or modified subsequent to February 28, 2006 (based on fair values estimated
in accordance with the new provisions of SFAS No. 123R).
61
STANDARD MICROSYSTEMS CORPORATION AND SUBSIDIARIES
NOTES TO CONSOLIDATED FINANCIAL STATEMENTS
2. SUMMARY OF SIGNIFICANT ACCOUNTING POLICIES − (continued)
In connection with the implementation of SFAS 123R, the Company elected the ‘‘long form’’ method in
determining the additional paid-in capital pool of windfall benefits and generally uses the straight-line method
to amortize compensation expense over the service period. The estimated value of the Company’s stock-based
awards (including stock options, restricted stock awards and stock appreciation rights), less expected forfei-
tures, is amortized over the awards’ respective requisite service period, which is the vesting period. As a result
of adopting SFAS 123R, income from operations and income before income taxes for the twelve month period
ended February 28, 2007 decreased by $5.7 million over what would have been reported on the prior account-
ing basis. Net income for the twelve month period ended February 28, 2007 decreased by approximately
$3.7 million. Basic and diluted earnings per share decreased by $0.17 and $0.16, respectively. The implemen-
tation of SFAS 123R increased cash flows from financing activities by $1.8 million during fiscal 2007.
Subsequent to the adoption of SFAS No. 123(R), the Black-Scholes option pricing model is used for
estimating the fair value of options and SARs granted and corresponding compensation expense to be recog-
nized. The Black-Scholes model requires certain assumptions, judgements and estimates by the Company to
determine fair value, including expected stock price volatility, risk-free interest rate and expected life. The
Company based the expected volatility on historical volatility. Beginning in the first quarter of fiscal 2009, the
Company based the expected term of options granted using the midpoint scenario, which combines historical
exercise data with hypothetical exercise data. Prior to that, the Company based expected term of options on an
actuarial model. The expected term of each individual SARs award is assumed to be the midpoint of the
remaining term through expiration as of any remeasurement date. Share-based compensation related to RSAs
is calculated based on the market price of the Company’s common stock on the date of grant. There were no
dividends expected to be paid on the Company’s common stock over the expected lives estimated.
Income Taxes
Deferred income taxes are provided on temporary differences that arise in the recording of transactions
for financial and tax reporting purposes as well as net operating loss and tax credit carryfowards. Deferred tax
assets are reduced by an appropriate valuation allowance if, in management’s judgment, part of the deferred
tax asset will not be realized. Tax credits are accounted for as reductions of the current provision for income
taxes in the year in which they are earned.
In July 2006, the FASB issued FASB Interpretation (‘‘FIN’’) No. 48, Accounting for Uncertainty inIncome Taxes — an interpretation of FASB Statement No. 109 (‘‘FIN 48’’), which was adopted by the
Company as of March 1, 2007. FIN 48 clarifies the accounting for uncertainty in income taxes recognized in
an enterprise’s financial statements in accordance with SFAS No. 109, Accounting for Income Taxes(‘‘SFAS 109’’). FIN 48 requires that all tax positions be evaluated using a recognition threshold and measure-
ment attribute for the financial statement recognition and measurement of a tax position taken or expected to
be taken in a tax return. Differences between tax positions taken in a tax return and amounts recognized in the
financial statements are recorded as adjustments to income taxes payable or receivable, or adjustments to
deferred taxes, or both. Under FIN 48, benefits associated with uncertain tax positions are recognized in the
Company’s consolidated financial statements only when it is determined to be more likely than not that such
positions would be sustained upon examination, based on technical merits. FIN 48 outlines a two-step
approach to recognizing and measuring uncertain tax positions. If the weight of available evidence indicates
that it is more likely than not (more than 50% likely) that a tax position would be sustained on examination
(including resolution of related appeals or litigation processes, if any), the associated tax benefit is then mea-
sured as the largest amount that is more than 50% likely of being realized upon ultimate settlement. FIN 48
also requires expanded disclosure at the end of each reporting period including a reconciliation of unrecog-
nized tax benefits (see Note 11).
62
STANDARD MICROSYSTEMS CORPORATION AND SUBSIDIARIES
NOTES TO CONSOLIDATED FINANCIAL STATEMENTS
2. SUMMARY OF SIGNIFICANT ACCOUNTING POLICIES − (continued)
In May 2007, the FASB issued FASB Staff Position (FSP) FIN No. 48-1, Definition of Settlement inFASB Interpretation No. 48, which is effective retroactively to SMSC to March 1, 2007. FSP FIN No. 48-1
provides guidance on how to determine whether a tax position is effectively settled for the purpose of recog-
nizing previously unrecognized tax benefits. The adoption of FSP FIN No. 48-1 did not have any effect on the
Company’s consolidated financial statements.
Translation of Foreign Currencies
The functional currencies of the Company’s foreign subsidiaries are their respective local currencies.
Assets and liabilities of foreign subsidiaries are translated into U.S. dollars using the exchange rates in effect
at the balance sheet date. Beginning in the second quarter of fiscal 2009, results of operations are translated
using the daily spot rate on the date the transaction is posted. Prior to the first quarter of fiscal 2009, results of
operations were translated using the average exchange rates during the period. Resulting translation adjust-
ments are recorded as a component of accumulated other comprehensive income within shareholders’ equity.
Foreign Exchange Contracts
The majority of the Company’s revenues, expenses and capital expenditures are transacted in U.S. dol-
lars. However, the Company does transact business in other currencies, primarily the Japanese Yen and the
euro. From time to time, the Company has entered into forward currency exchange contracts to hedge against
the impact of currency fluctuations on transactions not denominated in the functional currency of the transact-
ing entity. The intent of these contracts is to offset foreign currency transaction gains and losses with gains
and losses on the forward contracts, so as to help mitigate the risks associated with currency exchange rate
fluctuations. The Company does not enter into forward currency exchange contracts solely for speculative or
trading purposes. Gains and losses on such contracts have not been significant. In fiscal 2008, the Company’s
wholly-owned subsidiary in Japan initiated two forward contracts for the delivery of $1.4 million (in exchange
for Yen), to cover scheduled payments on intercompany debt due the U.S. parent company. An additional
forward contract for the purchase of an additional $0.7 million (in exchange for Yen) was executed during the
first quarter of fiscal 2009. Although these contracts were not formally designated as hedges, they were
intended to lock in the settlement rate on the underlying obligations and, as such, effectively mitigated the
currency exposure on this intercompany debt. As of February 28, 2009, these contracts were either settled or
expired.
Net (Loss) Income per Share
Basic net (loss) income per share is calculated by dividing net (loss) income by the weighted average
number of common shares outstanding during the period. Diluted net (loss) income per share is computed by
dividing net (loss) income by the sum of the weighted average common shares outstanding during the period
plus the dilutive effect (if any) of unvested restricted stock awards and shares issuable through stock options
as estimated using the treasury stock method.
Recent Accounting Pronouncements
In April 2009, the FASB issued three related Staff Positions: (i) FSP 157-4, ‘‘Determining Fair ValueWhen the Volume and Level of Activity for the Asset or Liability have Significantly Decreased and IdentifyingTransactions That Are Not Orderly’’ (‘‘FSP 157-4’’); (ii) SFAS 115-2 and SFAS 124-2, ‘‘Recognition andPresentation of Other-Than-Temporary Impairments’’ (‘‘FSP 115-2 and FSP 124-2’’); and (iii) SFAS 107-1
and APB 28-1, ‘‘Interim Disclosures about Fair Value of Financial Instruments’’ (‘‘FSP 107 and APB 28-1’’),
which will be effective for interim and annual periods ending after June 15, 2009 (SMSC’s fiscal quarter
ending August 31, 2009). FSP 157-4 provides guidance on how to determine the fair value of assets and
liabilities under SFAS 157 in the current economic environment and reemphasizes that the objective of a fair
value measurement remains an exit price. If it were concluded that there has been a significant decrease in the
volume and level of activity of the asset or liability in relation to normal market activities, quoted market
63
STANDARD MICROSYSTEMS CORPORATION AND SUBSIDIARIES
NOTES TO CONSOLIDATED FINANCIAL STATEMENTS
2. SUMMARY OF SIGNIFICANT ACCOUNTING POLICIES − (continued)
values may not be representative of fair value. In such instances, changes in valuation techniques or the use of
multiple valuation techniques may be appropriate. FSP 115-2 and FSP 124-2 modify the requirements for
recognizing other-than-temporarily impaired debt securities and revise the existing impairment model for such
securities, by modifying the current intent and ability indicator in determining whether a debt security is
other-than-temporarily impaired. FSP 107 and APB 28-1 enhance the disclosure of instruments under the
scope of SFAS 157 for both interim and annual periods. We are currently evaluating these Staff Positions, but
do not believe their adoption will have a material impact on the Company’s consolidated financial statements.
In June 2008, the FASB ratified EITF Issue No. 03-6-1, ‘‘Determining Whether Instruments Granted inShare-Based Payment Transactions Are Participating Securities’’ (‘‘EITF 03-6-1’’). EITF 03-6-1 addresses
whether instruments granted in share-based payment transactions are participating securities prior to vesting
and, therefore, need to be included in the earnings allocation in computing net income per share under the
two-class method described in FASB SFAS No. 128, ‘‘Earnings per Share’’. EITF 03-6-1 is effective for
financial statements issued for fiscal years beginning after December 15, 2008 and interim periods within
those years (SMSC’s fiscal year and fiscal quarter beginning March 1, 2009). The Company has evaluated this
EITF and has determined that there will be an immaterial impact on computing net income per share.
In December 2007, the FASB issued SFAS No. 141 (revised 2007) ‘‘Business Combinations’’
(‘‘SFAS 141R’’). SFAS 141R replaces SFAS No. 141 ‘‘Business Combinations’’. SFAS 141R is broader in
scope than SFAS 141, which applied only to business combinations in which control was obtained by transfer-
ring consideration. SFAS 141R applies to all transactions and other events in which one entity obtains control
over one or more other businesses. SFAS 141R retains the fundamental requirements of the original pro-
nouncement that the purchase method be used for all business combinations. SFAS 141R defines the acquirer
as the entity that obtains control of one or more businesses in the business combination, establishes the acqui-
sition date as the date that the acquirer achieves control and requires the acquirer to recognize the assets
acquired, liabilities assumed and any non-controlling interest at their fair values as of the acquisition date.
SFAS 141R also requires that acquisition-related costs be recognized as incurred. SFAS 141R is effective for
fiscal years beginning after December 15, 2008 (SMSC’s fiscal year beginning March 1, 2009), and the
Company will adopt the standard in the first quarter of fiscal 2010. The effects on future periods in regards to
this statement and the effects of the related adoption provisions will depend on the nature and significance of
any business combinations subject to this statement.
In April 2009 the FASB issued FSP No. 141R-1 ‘‘Accounting for Assets Acquired and LiabilitiesAssumed in a Business Combination That Arise from Contingencies’’ (‘‘FSP 141R-1’’). FSP 141R-1 amends
the provisions in SFAS 141R for the initial recognition and measurement, subsequent measurement and
accounting, and disclosures for assets and liabilities arising from contingencies in business combinations. The
FSP eliminates the distinction between contractual and non-contractual contingencies, including the initial
recognition and measurement criteria in Statement 141R and instead carries forward most of the provisions in
SFAS 141 for acquired contingencies. FSP 141R-1 is effective for contingent assets and contingent liabilities
acquired in business combinations for which the acquisition date is on or after the beginning of the first
annual reporting period beginning on or after December 15, 2008 (SMSC’s fiscal year beginning March 1,
2009). Should the Company consummate any acquisitions after the effective date, it would be anticipated that
SFAS 141R would likely have an impact on our consolidated financial statements. However, the impact (if
any) would depend upon the nature, terms and size of such business acquisitions.
In December 2007, the FASB issued SFAS No. 160 ‘‘Noncontrolling Interests in Consolidated Financial
Statements — an amendment of ARB 51’’ (‘‘SFAS 160’’). SFAS 160 requires that the noncontrolling interest
in the equity of a subsidiary be accounted for and reported as equity, provides revised guidance on the treat-
ment of net income and losses attributable to the noncontrolling interest and changes in ownership interests in
a subsidiary and requires additional disclosures that identify and distinguish between the interests of the
64
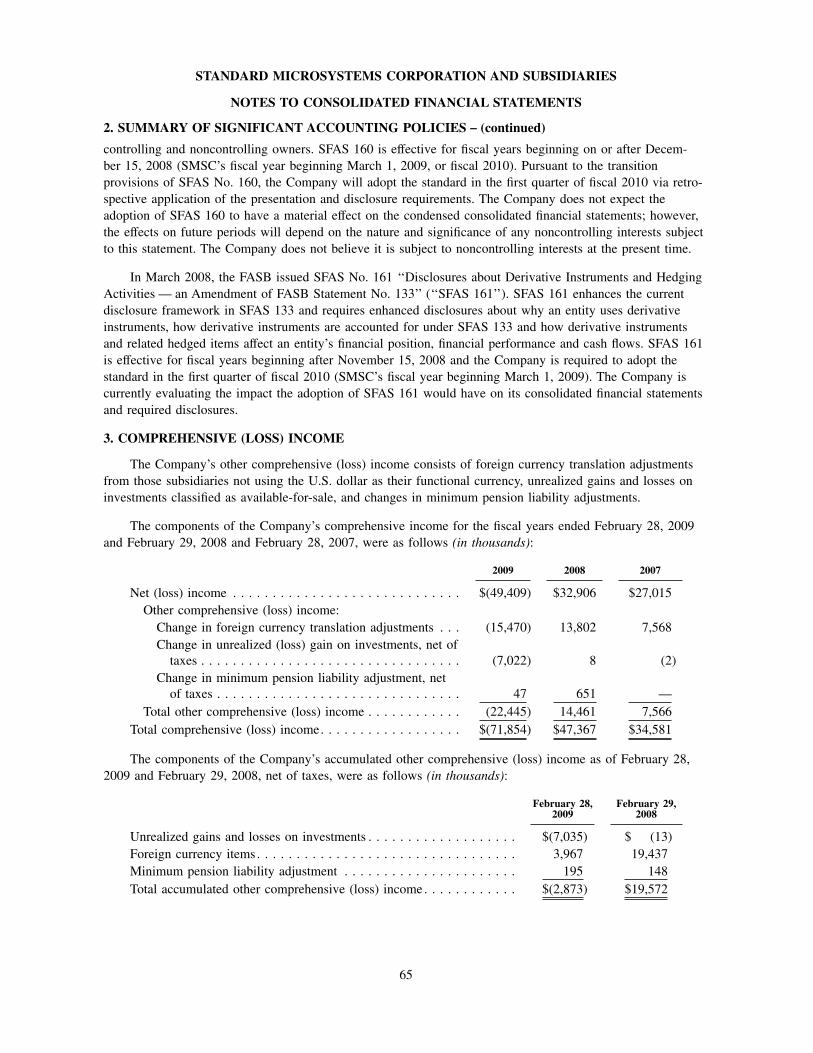
STANDARD MICROSYSTEMS CORPORATION AND SUBSIDIARIES
NOTES TO CONSOLIDATED FINANCIAL STATEMENTS
2. SUMMARY OF SIGNIFICANT ACCOUNTING POLICIES − (continued)
controlling and noncontrolling owners. SFAS 160 is effective for fiscal years beginning on or after Decem-
ber 15, 2008 (SMSC’s fiscal year beginning March 1, 2009, or fiscal 2010). Pursuant to the transition
provisions of SFAS No. 160, the Company will adopt the standard in the first quarter of fiscal 2010 via retro-
spective application of the presentation and disclosure requirements. The Company does not expect the
adoption of SFAS 160 to have a material effect on the condensed consolidated financial statements; however,
the effects on future periods will depend on the nature and significance of any noncontrolling interests subject
to this statement. The Company does not believe it is subject to noncontrolling interests at the present time.
In March 2008, the FASB issued SFAS No. 161 ‘‘Disclosures about Derivative Instruments and Hedging
Activities — an Amendment of FASB Statement No. 133’’ (‘‘SFAS 161’’). SFAS 161 enhances the current
disclosure framework in SFAS 133 and requires enhanced disclosures about why an entity uses derivative
instruments, how derivative instruments are accounted for under SFAS 133 and how derivative instruments
and related hedged items affect an entity’s financial position, financial performance and cash flows. SFAS 161
is effective for fiscal years beginning after November 15, 2008 and the Company is required to adopt the
standard in the first quarter of fiscal 2010 (SMSC’s fiscal year beginning March 1, 2009). The Company is
currently evaluating the impact the adoption of SFAS 161 would have on its consolidated financial statements
and required disclosures.
3. COMPREHENSIVE (LOSS) INCOME
The Company’s other comprehensive (loss) income consists of foreign currency translation adjustments
from those subsidiaries not using the U.S. dollar as their functional currency, unrealized gains and losses on
investments classified as available-for-sale, and changes in minimum pension liability adjustments.
The components of the Company’s comprehensive income for the fiscal years ended February 28, 2009
and February 29, 2008 and February 28, 2007, were as follows (in thousands):
2009 2008 2007
Net (loss) income . . . . . . . . . . . . . . . . . . . . . . . . . . . . . $(49,409) $32,906 $27,015
Other comprehensive (loss) income:
Change in foreign currency translation adjustments . . . (15,470) 13,802 7,568
Change in unrealized (loss) gain on investments, net of
taxes . . . . . . . . . . . . . . . . . . . . . . . . . . . . . . . . . (7,022) 8 (2)
Change in minimum pension liability adjustment, net
of taxes . . . . . . . . . . . . . . . . . . . . . . . . . . . . . . . 47 651 —
Total other comprehensive (loss) income . . . . . . . . . . . . (22,445) 14,461 7,566
Total comprehensive (loss) income. . . . . . . . . . . . . . . . . . $(71,854) $47,367 $34,581
The components of the Company’s accumulated other comprehensive (loss) income as of February 28,
2009 and February 29, 2008, net of taxes, were as follows (in thousands):
February 28,2009
February 29,2008
Unrealized gains and losses on investments . . . . . . . . . . . . . . . . . . . $(7,035) $ (13)
Foreign currency items. . . . . . . . . . . . . . . . . . . . . . . . . . . . . . . . . 3,967 19,437
Minimum pension liability adjustment . . . . . . . . . . . . . . . . . . . . . . 195 148
Total accumulated other comprehensive (loss) income. . . . . . . . . . . . $(2,873) $19,572
65
STANDARD MICROSYSTEMS CORPORATION AND SUBSIDIARIES
NOTES TO CONSOLIDATED FINANCIAL STATEMENTS
4. NET (LOSS) INCOME PER SHARE
Basic net (loss) income per share is calculated by dividing net (loss) income by the weighted average
number of common shares outstanding during the period. Diluted net (loss) income per share is computed by
dividing net (loss) income by the sum of the weighted average common shares outstanding during the period
plus the dilutive effect (if any) of unvested restricted stock awards and shares issuable through stock options
as estimated using the treasury stock method. Shares used in calculating basic and diluted net (loss) income
per share are reconciled as follows (in thousands):
For the Fiscal Years Ended February 28, 29 and 28, 2009 2008 2007
Average shares outstanding for basic net income per share. . 22,081 22,897 22,097
Dilutive effect of stock options and unvested restricted
stock awards . . . . . . . . . . . . . . . . . . . . . . . . . . . . . . . — 726 1,162
Average shares outstanding for diluted net income per
share . . . . . . . . . . . . . . . . . . . . . . . . . . . . . . . . . . . . 22,081 23,623 23,259
For fiscal 2009, 2008 and 2007, stock options covering approximately 3,442,000 212,000 and 682,000
common shares, respectively, were excluded from the computation of diluted net income per share, because
their effects were anti-dilutive. In addition, for fiscal 2009, approximately 167,000 shares issuable pursuant to
unvested restricted stock awards were also excluded, as the Company was in a net loss position and related
equivalent shares would also be anti-dilutive.
5. INVESTMENTS
Long-term investments consist of highly rated auction rate securities (most of which are backed by U.S.
Federal or state and municipal government guarantees — see Note 2) and other marketable debt and equity
securities held as available-for-sale investments. As of November 30, 2007 and prior period-end dates, invest-
ments in auction rate securities were classified as short-term in nature. In the fourth quarter of fiscal 2008,
such investments became subject to adverse market conditions, and the liquidity typically associated with the
financial markets for such instruments became restricted as auctions began to fail. Given the underlying terms
of these securities, in most cases where auctions fail, the investor is entitled to higher interest rates to com-
pensate for the lack of liquidity. At present, the Company is earning higher returns on these investments as a
consequence of such liquidity constraints.
6. GOODWILL AND INTANGIBLE ASSETS
The Company’s March 2005 acquisition of OASIS SiliconSystems Holding AG (‘‘OASIS’’) included the
purchase of $42.9 million of finite-lived intangible assets, an indefinite-lived trademark of $5.4 million, and
goodwill of $67.8 million. Some or portions of these intangible assets are denominated in currencies other
than the U.S. dollar, and these March 2005 values reflect foreign exchange rates in effect on the date of the
transaction. The Company’s June 2002 acquisition of Tucson, Arizona-based Gain Technology Corporation
included the acquisition of $7.1 million of finite-lived intangible assets and $29.4 million of goodwill, after
adjustments.
Goodwill is tested for impairment in value annually, as well as when events or circumstances indicate
possible impairment in value. The Company performs an annual goodwill impairment review during the fourth
quarter of each fiscal year. The Company completed its most recent annual goodwill impairment review
during the fourth quarter of fiscal 2009. In accordance with SFAS 142, we compared the carrying value of
each of our reporting units that existed at those times to their estimated fair value. For purposes of SFAS 142
testing, the Company has two reporting units: the automotive reporting unit and the analog / mixed signal
reporting unit. The automotive unit consists of those portions of the business that were acquired in the
March 30, 2005 acquisition of OASIS including the infotainment networking technology known as Media
Oriented Systems Transport (‘‘MOST’’). The analog / mixed signal reporting unit is comprised of most other
portions of the business.
66
STANDARD MICROSYSTEMS CORPORATION AND SUBSIDIARIES
NOTES TO CONSOLIDATED FINANCIAL STATEMENTS
6. GOODWILL AND INTANGIBLE ASSETS − (continued)
The Company considered both the market and income approaches in estimating the fair values of its
reporting units, specifically the market multiple methodology and discounted cash flow methodology. The
market multiple methodology involved the utilization of various revenue and cash flow measures at appropri-
ate risk-adjusted multiples. Multiples were determined through an analysis of certain publicly traded
companies that were selected on the basis of operational and economic similarity with the business operations.
Provided these companies meet these criteria, they can be considered comparable from an investment stand-
point even if the exact business operations and/or characteristics of the entities are not the same. Revenue and
EBITDA multiples were calculated for the comparable companies based on market data and published finan-
cial reports. A comparative analysis between the Company and the public companies deemed to be
comparable formed the basis for the selection of appropriate risk-adjusted multiples for the Company. The
comparative analysis incorporates both quantitative and qualitative risk factors which relate to, among other
things, the nature of the industry in which the Company and other comparable companies are engaged. In the
discounted cash flow methodology, projections prepared by the Company were utilized. The cash flows pro-
jected were analyzed on a ‘‘debt-free’’ basis (before cash payments to equity and interest bearing debt
investors) in order to develop an enterprise value. A provision, based on these projections, for the value of the
Company at the end of the forecast period, or terminal value, was also made. The present value of the cash
flows and the terminal value were determined using a risk-adjusted rate of return, or ‘‘discount rate.’’
Upon completion of the fiscal 2009 assessment, it was determined that the carrying value of our automo-
tive reporting unit exceeded its estimated fair value. Because indicators of impairment existed for the goodwill
associated with this reporting unit, we performed the second step of the test required under SFAS 142 to
determine the implied fair value of the goodwill.
In accordance with SFAS 142, the implied fair value of goodwill was determined in the same manner as
utilized to estimate the amount of goodwill recognized in a business combination. To determine the implied
value of goodwill, fair values were allocated to the assets and liabilities of the reporting unit as of Febru-
ary 28, 2009. As part of the second step of the impairment test performed, the Company determined the fair
value of certain long-lived intangible assets, including developed technology, customer relationships and trade
names. The implied fair value of goodwill was measured as the excess of the fair value of the reporting unit
over the fair value amounts assigned to its assets and liabilities. The impairment loss for the reporting unit
was measured by the amount the carrying value of goodwill exceeded the implied fair value of the goodwill.
Based on this assessment, we recorded a charge of $52.3 million as of February 28, 2009.
The primary factors contributing to this impairment charge were: the recent significant economic down-
turn, which caused a decline in the automotive market; an increase in implied discount rate due to higher risk
premiums; and, the decline in the Company’s market capitalization. Management adjusted the assumptions
used to assess the estimated fair value of the reporting unit to account for these macroeconomic changes.
All finite-lived intangible assets are being amortized on a straight-line basis, which approximates the
pattern in which the estimated economic benefits of the assets are realized, over their estimated useful lives.
Existing technologies have been assigned estimated useful lives of between six and eight years, with a
weighted-average useful life of approximately eight years. Customer relationships and contracts have been
assigned useful lives of between one and ten years, with a weighted-average useful life of approximately eight
years. As noted previously, the Company assessed the fair value of certain purchased intangible assets, includ-
ing developed technologies, customer relationships and trademarks. Current fair values were determined to be
in excess of net book values as of February 28, 2009.
Intangible assets that are denominated in a functional currency other than the U.S. dollar have been
translated into U.S. dollars using the exchange rate in effect on the reporting date. As of February 28, 2009
and February 29, 2008, the Company’s identifiable intangible assets consisted of the following:
67
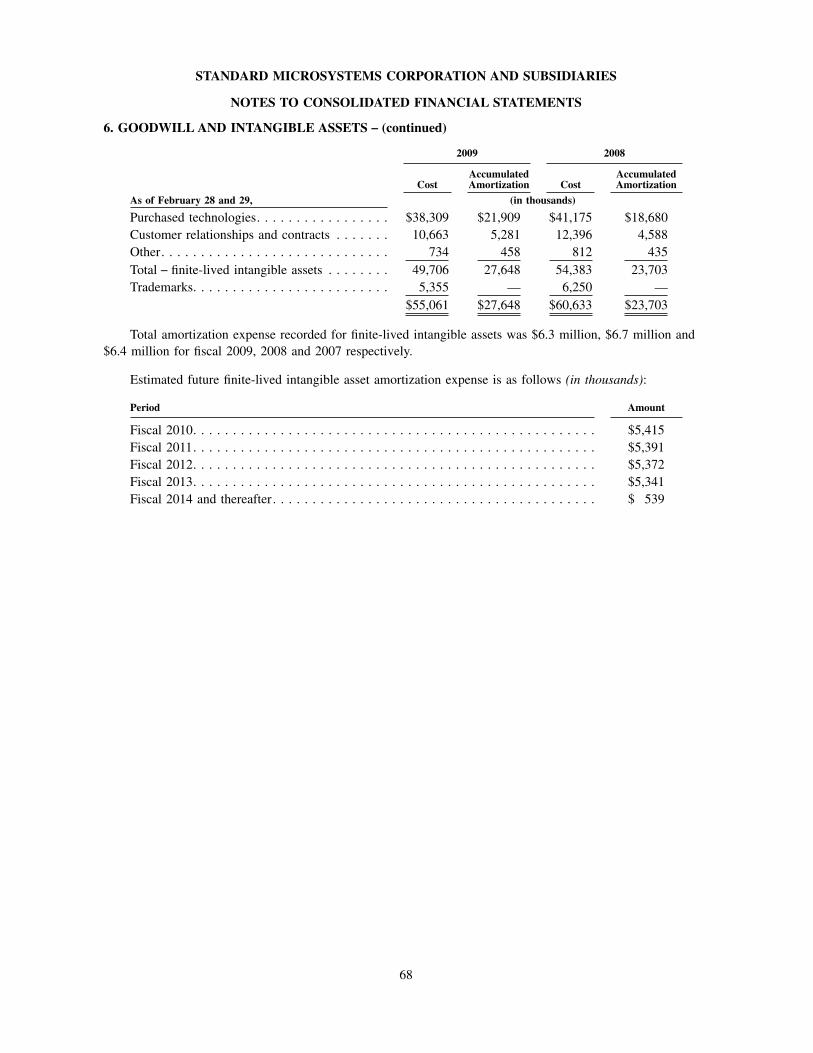
STANDARD MICROSYSTEMS CORPORATION AND SUBSIDIARIES
NOTES TO CONSOLIDATED FINANCIAL STATEMENTS
6. GOODWILL AND INTANGIBLE ASSETS − (continued)
2009 2008
CostAccumulatedAmortization Cost
AccumulatedAmortization
As of February 28 and 29, (in thousands)
Purchased technologies. . . . . . . . . . . . . . . . . $38,309 $21,909 $41,175 $18,680
Customer relationships and contracts . . . . . . . 10,663 5,281 12,396 4,588
Other. . . . . . . . . . . . . . . . . . . . . . . . . . . . . 734 458 812 435
Total − finite-lived intangible assets . . . . . . . . 49,706 27,648 54,383 23,703
Trademarks. . . . . . . . . . . . . . . . . . . . . . . . . 5,355 — 6,250 —
$55,061 $27,648 $60,633 $23,703
Total amortization expense recorded for finite-lived intangible assets was $6.3 million, $6.7 million and
$6.4 million for fiscal 2009, 2008 and 2007 respectively.
Estimated future finite-lived intangible asset amortization expense is as follows (in thousands):
Period Amount
Fiscal 2010. . . . . . . . . . . . . . . . . . . . . . . . . . . . . . . . . . . . . . . . . . . . . . . . . . . $5,415
Fiscal 2011. . . . . . . . . . . . . . . . . . . . . . . . . . . . . . . . . . . . . . . . . . . . . . . . . . . $5,391
Fiscal 2012. . . . . . . . . . . . . . . . . . . . . . . . . . . . . . . . . . . . . . . . . . . . . . . . . . . $5,372
Fiscal 2013. . . . . . . . . . . . . . . . . . . . . . . . . . . . . . . . . . . . . . . . . . . . . . . . . . . $5,341
Fiscal 2014 and thereafter. . . . . . . . . . . . . . . . . . . . . . . . . . . . . . . . . . . . . . . . . $ 539
68
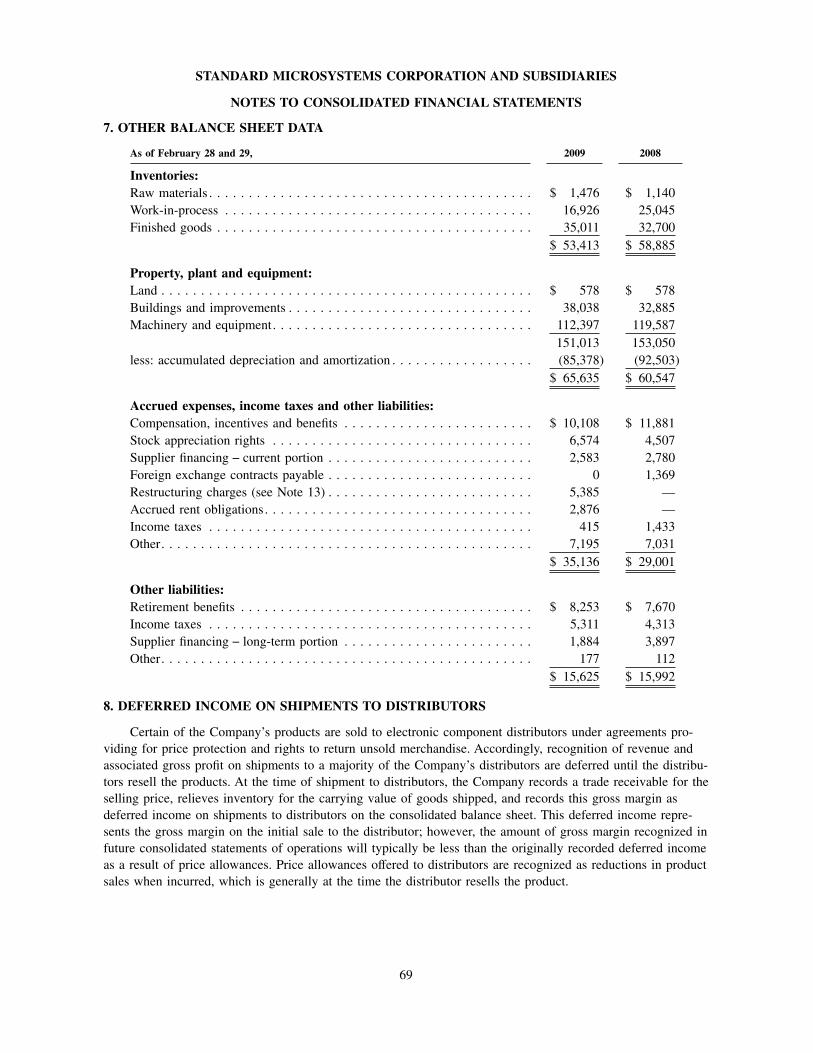
STANDARD MICROSYSTEMS CORPORATION AND SUBSIDIARIES
NOTES TO CONSOLIDATED FINANCIAL STATEMENTS
7. OTHER BALANCE SHEET DATA
As of February 28 and 29, 2009 2008
Inventories:Raw materials . . . . . . . . . . . . . . . . . . . . . . . . . . . . . . . . . . . . . . . . . $ 1,476 $ 1,140
Work-in-process . . . . . . . . . . . . . . . . . . . . . . . . . . . . . . . . . . . . . . . 16,926 25,045
Finished goods . . . . . . . . . . . . . . . . . . . . . . . . . . . . . . . . . . . . . . . . 35,011 32,700
$ 53,413 $ 58,885
Property, plant and equipment:Land . . . . . . . . . . . . . . . . . . . . . . . . . . . . . . . . . . . . . . . . . . . . . . . $ 578 $ 578
Buildings and improvements . . . . . . . . . . . . . . . . . . . . . . . . . . . . . . . 38,038 32,885
Machinery and equipment. . . . . . . . . . . . . . . . . . . . . . . . . . . . . . . . . 112,397 119,587
151,013 153,050
less: accumulated depreciation and amortization . . . . . . . . . . . . . . . . . . (85,378) (92,503)
$ 65,635 $ 60,547
Accrued expenses, income taxes and other liabilities:Compensation, incentives and benefits . . . . . . . . . . . . . . . . . . . . . . . . $ 10,108 $ 11,881
Stock appreciation rights . . . . . . . . . . . . . . . . . . . . . . . . . . . . . . . . . 6,574 4,507
Supplier financing − current portion . . . . . . . . . . . . . . . . . . . . . . . . . . 2,583 2,780
Foreign exchange contracts payable . . . . . . . . . . . . . . . . . . . . . . . . . . 0 1,369
Restructuring charges (see Note 13) . . . . . . . . . . . . . . . . . . . . . . . . . . 5,385 —
Accrued rent obligations. . . . . . . . . . . . . . . . . . . . . . . . . . . . . . . . . . 2,876 —
Income taxes . . . . . . . . . . . . . . . . . . . . . . . . . . . . . . . . . . . . . . . . . 415 1,433
Other. . . . . . . . . . . . . . . . . . . . . . . . . . . . . . . . . . . . . . . . . . . . . . . 7,195 7,031
$ 35,136 $ 29,001
Other liabilities:Retirement benefits . . . . . . . . . . . . . . . . . . . . . . . . . . . . . . . . . . . . . $ 8,253 $ 7,670
Income taxes . . . . . . . . . . . . . . . . . . . . . . . . . . . . . . . . . . . . . . . . . 5,311 4,313
Supplier financing − long-term portion . . . . . . . . . . . . . . . . . . . . . . . . 1,884 3,897
Other. . . . . . . . . . . . . . . . . . . . . . . . . . . . . . . . . . . . . . . . . . . . . . . 177 112
$ 15,625 $ 15,992
8. DEFERRED INCOME ON SHIPMENTS TO DISTRIBUTORS
Certain of the Company’s products are sold to electronic component distributors under agreements pro-
viding for price protection and rights to return unsold merchandise. Accordingly, recognition of revenue and
associated gross profit on shipments to a majority of the Company’s distributors are deferred until the distribu-
tors resell the products. At the time of shipment to distributors, the Company records a trade receivable for the
selling price, relieves inventory for the carrying value of goods shipped, and records this gross margin as
deferred income on shipments to distributors on the consolidated balance sheet. This deferred income repre-
sents the gross margin on the initial sale to the distributor; however, the amount of gross margin recognized in
future consolidated statements of operations will typically be less than the originally recorded deferred income
as a result of price allowances. Price allowances offered to distributors are recognized as reductions in product
sales when incurred, which is generally at the time the distributor resells the product.
69
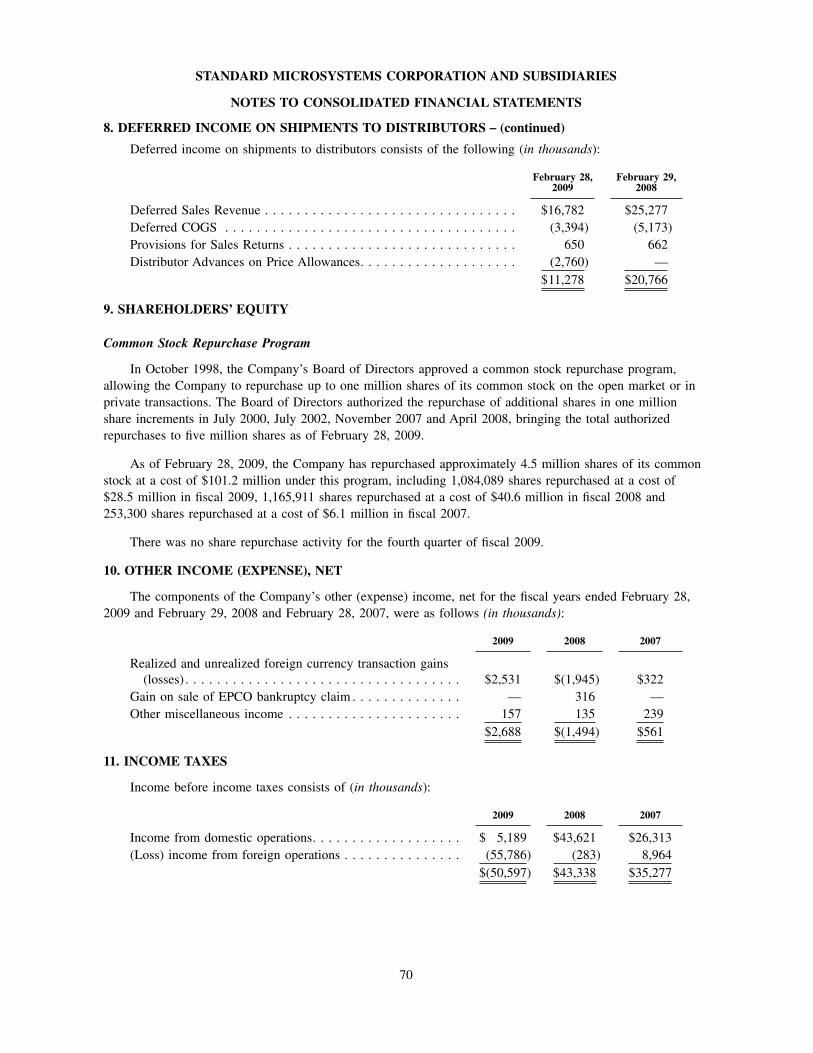
STANDARD MICROSYSTEMS CORPORATION AND SUBSIDIARIES
NOTES TO CONSOLIDATED FINANCIAL STATEMENTS
8. DEFERRED INCOME ON SHIPMENTS TO DISTRIBUTORS − (continued)
Deferred income on shipments to distributors consists of the following (in thousands):
February 28,2009
February 29,2008
Deferred Sales Revenue . . . . . . . . . . . . . . . . . . . . . . . . . . . . . . . . $16,782 $25,277
Deferred COGS . . . . . . . . . . . . . . . . . . . . . . . . . . . . . . . . . . . . . (3,394) (5,173)
Provisions for Sales Returns . . . . . . . . . . . . . . . . . . . . . . . . . . . . . 650 662
Distributor Advances on Price Allowances. . . . . . . . . . . . . . . . . . . . (2,760) —
$11,278 $20,766
9. SHAREHOLDERS’ EQUITY
Common Stock Repurchase Program
In October 1998, the Company’s Board of Directors approved a common stock repurchase program,
allowing the Company to repurchase up to one million shares of its common stock on the open market or in
private transactions. The Board of Directors authorized the repurchase of additional shares in one million
share increments in July 2000, July 2002, November 2007 and April 2008, bringing the total authorized
repurchases to five million shares as of February 28, 2009.
As of February 28, 2009, the Company has repurchased approximately 4.5 million shares of its common
stock at a cost of $101.2 million under this program, including 1,084,089 shares repurchased at a cost of
$28.5 million in fiscal 2009, 1,165,911 shares repurchased at a cost of $40.6 million in fiscal 2008 and
253,300 shares repurchased at a cost of $6.1 million in fiscal 2007.
There was no share repurchase activity for the fourth quarter of fiscal 2009.
10. OTHER INCOME (EXPENSE), NET
The components of the Company’s other (expense) income, net for the fiscal years ended February 28,
2009 and February 29, 2008 and February 28, 2007, were as follows (in thousands):
2009 2008 2007
Realized and unrealized foreign currency transaction gains
(losses) . . . . . . . . . . . . . . . . . . . . . . . . . . . . . . . . . . . $2,531 $(1,945) $322
Gain on sale of EPCO bankruptcy claim . . . . . . . . . . . . . . — 316 —
Other miscellaneous income . . . . . . . . . . . . . . . . . . . . . . 157 135 239
$2,688 $(1,494) $561
11. INCOME TAXES
Income before income taxes consists of (in thousands):
2009 2008 2007
Income from domestic operations. . . . . . . . . . . . . . . . . . . $ 5,189 $43,621 $26,313
(Loss) income from foreign operations . . . . . . . . . . . . . . . (55,786) (283) 8,964
$(50,597) $43,338 $35,277
70
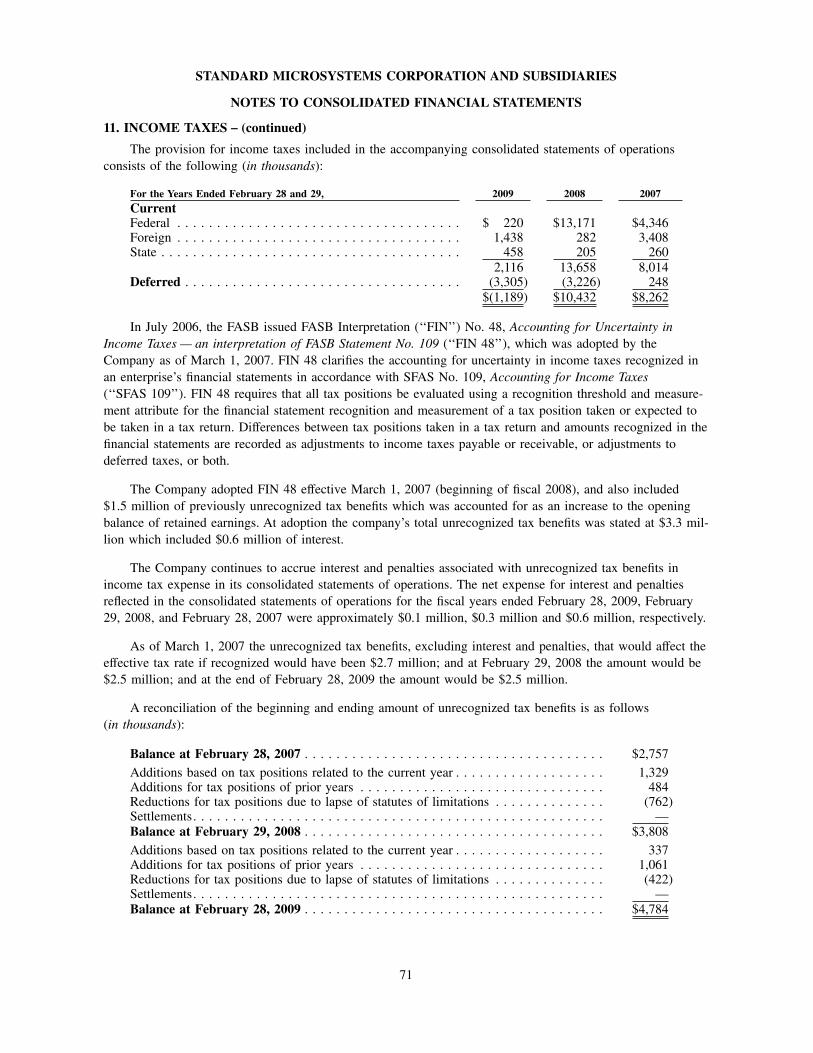
STANDARD MICROSYSTEMS CORPORATION AND SUBSIDIARIES
NOTES TO CONSOLIDATED FINANCIAL STATEMENTS
11. INCOME TAXES − (continued)
The provision for income taxes included in the accompanying consolidated statements of operations
consists of the following (in thousands):
For the Years Ended February 28 and 29, 2009 2008 2007CurrentFederal . . . . . . . . . . . . . . . . . . . . . . . . . . . . . . . . . . . . $ 220 $13,171 $4,346Foreign . . . . . . . . . . . . . . . . . . . . . . . . . . . . . . . . . . . . 1,438 282 3,408State . . . . . . . . . . . . . . . . . . . . . . . . . . . . . . . . . . . . . . 458 205 260
2,116 13,658 8,014Deferred . . . . . . . . . . . . . . . . . . . . . . . . . . . . . . . . . . . (3,305) (3,226) 248
$(1,189) $10,432 $8,262
In July 2006, the FASB issued FASB Interpretation (‘‘FIN’’) No. 48, Accounting for Uncertainty inIncome Taxes — an interpretation of FASB Statement No. 109 (‘‘FIN 48’’), which was adopted by the
Company as of March 1, 2007. FIN 48 clarifies the accounting for uncertainty in income taxes recognized in
an enterprise’s financial statements in accordance with SFAS No. 109, Accounting for Income Taxes(‘‘SFAS 109’’). FIN 48 requires that all tax positions be evaluated using a recognition threshold and measure-
ment attribute for the financial statement recognition and measurement of a tax position taken or expected to
be taken in a tax return. Differences between tax positions taken in a tax return and amounts recognized in the
financial statements are recorded as adjustments to income taxes payable or receivable, or adjustments to
deferred taxes, or both.
The Company adopted FIN 48 effective March 1, 2007 (beginning of fiscal 2008), and also included
$1.5 million of previously unrecognized tax benefits which was accounted for as an increase to the opening
balance of retained earnings. At adoption the company’s total unrecognized tax benefits was stated at $3.3 mil-
lion which included $0.6 million of interest.
The Company continues to accrue interest and penalties associated with unrecognized tax benefits in
income tax expense in its consolidated statements of operations. The net expense for interest and penalties
reflected in the consolidated statements of operations for the fiscal years ended February 28, 2009, February
29, 2008, and February 28, 2007 were approximately $0.1 million, $0.3 million and $0.6 million, respectively.
As of March 1, 2007 the unrecognized tax benefits, excluding interest and penalties, that would affect the
effective tax rate if recognized would have been $2.7 million; and at February 29, 2008 the amount would be
$2.5 million; and at the end of February 28, 2009 the amount would be $2.5 million.
A reconciliation of the beginning and ending amount of unrecognized tax benefits is as follows
(in thousands):
Balance at February 28, 2007 . . . . . . . . . . . . . . . . . . . . . . . . . . . . . . . . . . . . . . $2,757
Additions based on tax positions related to the current year . . . . . . . . . . . . . . . . . . . 1,329Additions for tax positions of prior years . . . . . . . . . . . . . . . . . . . . . . . . . . . . . . . 484Reductions for tax positions due to lapse of statutes of limitations . . . . . . . . . . . . . . (762)Settlements. . . . . . . . . . . . . . . . . . . . . . . . . . . . . . . . . . . . . . . . . . . . . . . . . . . . —
Balance at February 29, 2008 . . . . . . . . . . . . . . . . . . . . . . . . . . . . . . . . . . . . . . $3,808
Additions based on tax positions related to the current year . . . . . . . . . . . . . . . . . . . 337Additions for tax positions of prior years . . . . . . . . . . . . . . . . . . . . . . . . . . . . . . . 1,061Reductions for tax positions due to lapse of statutes of limitations . . . . . . . . . . . . . . (422)Settlements. . . . . . . . . . . . . . . . . . . . . . . . . . . . . . . . . . . . . . . . . . . . . . . . . . . . —
Balance at February 28, 2009 . . . . . . . . . . . . . . . . . . . . . . . . . . . . . . . . . . . . . . $4,784
71
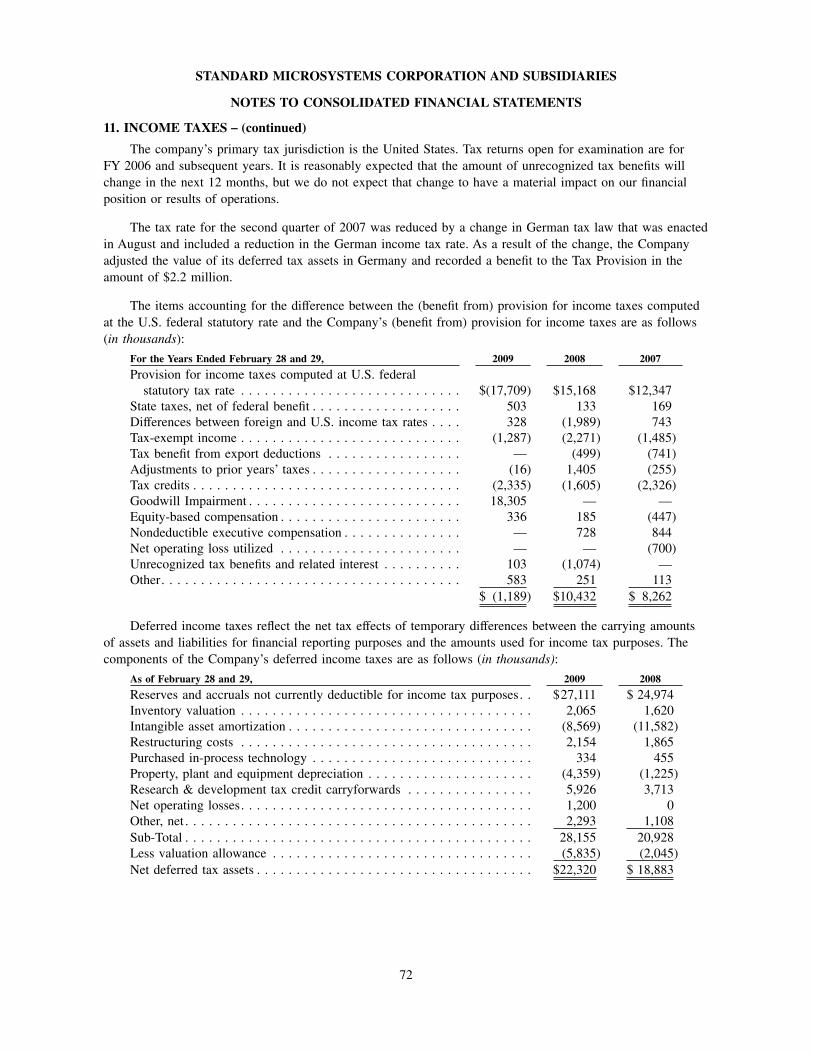
STANDARD MICROSYSTEMS CORPORATION AND SUBSIDIARIES
NOTES TO CONSOLIDATED FINANCIAL STATEMENTS
11. INCOME TAXES − (continued)
The company’s primary tax jurisdiction is the United States. Tax returns open for examination are for
FY 2006 and subsequent years. It is reasonably expected that the amount of unrecognized tax benefits will
change in the next 12 months, but we do not expect that change to have a material impact on our financial
position or results of operations.
The tax rate for the second quarter of 2007 was reduced by a change in German tax law that was enacted
in August and included a reduction in the German income tax rate. As a result of the change, the Company
adjusted the value of its deferred tax assets in Germany and recorded a benefit to the Tax Provision in the
amount of $2.2 million.
The items accounting for the difference between the (benefit from) provision for income taxes computed
at the U.S. federal statutory rate and the Company’s (benefit from) provision for income taxes are as follows
(in thousands):
For the Years Ended February 28 and 29, 2009 2008 2007
Provision for income taxes computed at U.S. federal
statutory tax rate . . . . . . . . . . . . . . . . . . . . . . . . . . . . $(17,709) $15,168 $12,347
State taxes, net of federal benefit . . . . . . . . . . . . . . . . . . . 503 133 169
Differences between foreign and U.S. income tax rates . . . . 328 (1,989) 743
Tax-exempt income . . . . . . . . . . . . . . . . . . . . . . . . . . . . (1,287) (2,271) (1,485)
Tax benefit from export deductions . . . . . . . . . . . . . . . . . — (499) (741)
Adjustments to prior years’ taxes . . . . . . . . . . . . . . . . . . . (16) 1,405 (255)
Tax credits . . . . . . . . . . . . . . . . . . . . . . . . . . . . . . . . . . (2,335) (1,605) (2,326)
Goodwill Impairment . . . . . . . . . . . . . . . . . . . . . . . . . . . 18,305 — —
Equity-based compensation . . . . . . . . . . . . . . . . . . . . . . . 336 185 (447)
Nondeductible executive compensation . . . . . . . . . . . . . . . — 728 844
Net operating loss utilized . . . . . . . . . . . . . . . . . . . . . . . — — (700)
Unrecognized tax benefits and related interest . . . . . . . . . . 103 (1,074) —
Other. . . . . . . . . . . . . . . . . . . . . . . . . . . . . . . . . . . . . . 583 251 113
$ (1,189) $10,432 $ 8,262
Deferred income taxes reflect the net tax effects of temporary differences between the carrying amounts
of assets and liabilities for financial reporting purposes and the amounts used for income tax purposes. The
components of the Company’s deferred income taxes are as follows (in thousands):
As of February 28 and 29, 2009 2008
Reserves and accruals not currently deductible for income tax purposes. . $27,111 $ 24,974
Inventory valuation . . . . . . . . . . . . . . . . . . . . . . . . . . . . . . . . . . . . . 2,065 1,620
Intangible asset amortization . . . . . . . . . . . . . . . . . . . . . . . . . . . . . . . (8,569) (11,582)
Restructuring costs . . . . . . . . . . . . . . . . . . . . . . . . . . . . . . . . . . . . . 2,154 1,865
Purchased in-process technology . . . . . . . . . . . . . . . . . . . . . . . . . . . . 334 455
Property, plant and equipment depreciation . . . . . . . . . . . . . . . . . . . . . (4,359) (1,225)
Research & development tax credit carryforwards . . . . . . . . . . . . . . . . 5,926 3,713
Net operating losses. . . . . . . . . . . . . . . . . . . . . . . . . . . . . . . . . . . . . 1,200 0
Other, net . . . . . . . . . . . . . . . . . . . . . . . . . . . . . . . . . . . . . . . . . . . . 2,293 1,108
Sub-Total . . . . . . . . . . . . . . . . . . . . . . . . . . . . . . . . . . . . . . . . . . . . 28,155 20,928
Less valuation allowance . . . . . . . . . . . . . . . . . . . . . . . . . . . . . . . . . (5,835) (2,045)
Net deferred tax assets . . . . . . . . . . . . . . . . . . . . . . . . . . . . . . . . . . . $22,320 $ 18,883
72
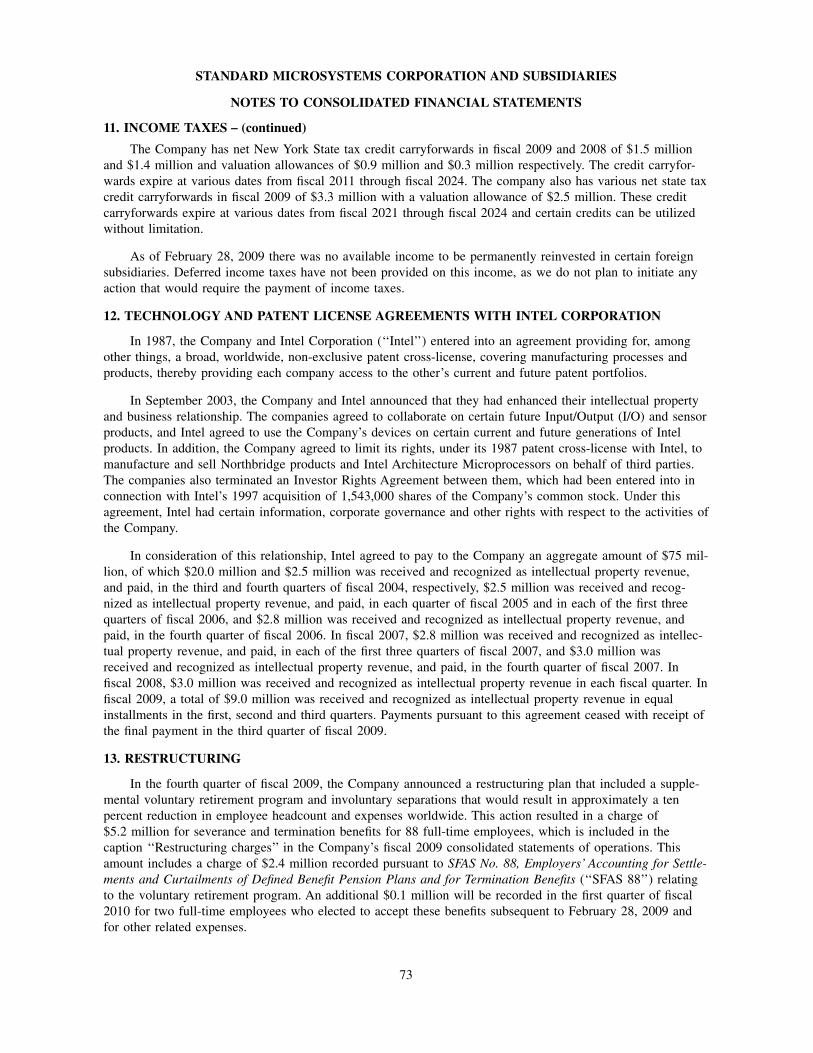
STANDARD MICROSYSTEMS CORPORATION AND SUBSIDIARIES
NOTES TO CONSOLIDATED FINANCIAL STATEMENTS
11. INCOME TAXES − (continued)
The Company has net New York State tax credit carryforwards in fiscal 2009 and 2008 of $1.5 million
and $1.4 million and valuation allowances of $0.9 million and $0.3 million respectively. The credit carryfor-
wards expire at various dates from fiscal 2011 through fiscal 2024. The company also has various net state tax
credit carryforwards in fiscal 2009 of $3.3 million with a valuation allowance of $2.5 million. These credit
carryforwards expire at various dates from fiscal 2021 through fiscal 2024 and certain credits can be utilized
without limitation.
As of February 28, 2009 there was no available income to be permanently reinvested in certain foreign
subsidiaries. Deferred income taxes have not been provided on this income, as we do not plan to initiate any
action that would require the payment of income taxes.
12. TECHNOLOGY AND PATENT LICENSE AGREEMENTS WITH INTEL CORPORATION
In 1987, the Company and Intel Corporation (‘‘Intel’’) entered into an agreement providing for, among
other things, a broad, worldwide, non-exclusive patent cross-license, covering manufacturing processes and
products, thereby providing each company access to the other’s current and future patent portfolios.
In September 2003, the Company and Intel announced that they had enhanced their intellectual property
and business relationship. The companies agreed to collaborate on certain future Input/Output (I/O) and sensor
products, and Intel agreed to use the Company’s devices on certain current and future generations of Intel
products. In addition, the Company agreed to limit its rights, under its 1987 patent cross-license with Intel, to
manufacture and sell Northbridge products and Intel Architecture Microprocessors on behalf of third parties.
The companies also terminated an Investor Rights Agreement between them, which had been entered into in
connection with Intel’s 1997 acquisition of 1,543,000 shares of the Company’s common stock. Under this
agreement, Intel had certain information, corporate governance and other rights with respect to the activities of
the Company.
In consideration of this relationship, Intel agreed to pay to the Company an aggregate amount of $75 mil-
lion, of which $20.0 million and $2.5 million was received and recognized as intellectual property revenue,
and paid, in the third and fourth quarters of fiscal 2004, respectively, $2.5 million was received and recog-
nized as intellectual property revenue, and paid, in each quarter of fiscal 2005 and in each of the first three
quarters of fiscal 2006, and $2.8 million was received and recognized as intellectual property revenue, and
paid, in the fourth quarter of fiscal 2006. In fiscal 2007, $2.8 million was received and recognized as intellec-
tual property revenue, and paid, in each of the first three quarters of fiscal 2007, and $3.0 million was
received and recognized as intellectual property revenue, and paid, in the fourth quarter of fiscal 2007. In
fiscal 2008, $3.0 million was received and recognized as intellectual property revenue in each fiscal quarter. In
fiscal 2009, a total of $9.0 million was received and recognized as intellectual property revenue in equal
installments in the first, second and third quarters. Payments pursuant to this agreement ceased with receipt of
the final payment in the third quarter of fiscal 2009.
13. RESTRUCTURING
In the fourth quarter of fiscal 2009, the Company announced a restructuring plan that included a supple-
mental voluntary retirement program and involuntary separations that would result in approximately a ten
percent reduction in employee headcount and expenses worldwide. This action resulted in a charge of
$5.2 million for severance and termination benefits for 88 full-time employees, which is included in the
caption ‘‘Restructuring charges’’ in the Company’s fiscal 2009 consolidated statements of operations. This
amount includes a charge of $2.4 million recorded pursuant to SFAS No. 88, Employers’ Accounting for Settle-ments and Curtailments of Defined Benefit Pension Plans and for Termination Benefits (‘‘SFAS 88’’) relating
to the voluntary retirement program. An additional $0.1 million will be recorded in the first quarter of fiscal
2010 for two full-time employees who elected to accept these benefits subsequent to February 28, 2009 and
for other related expenses.
73
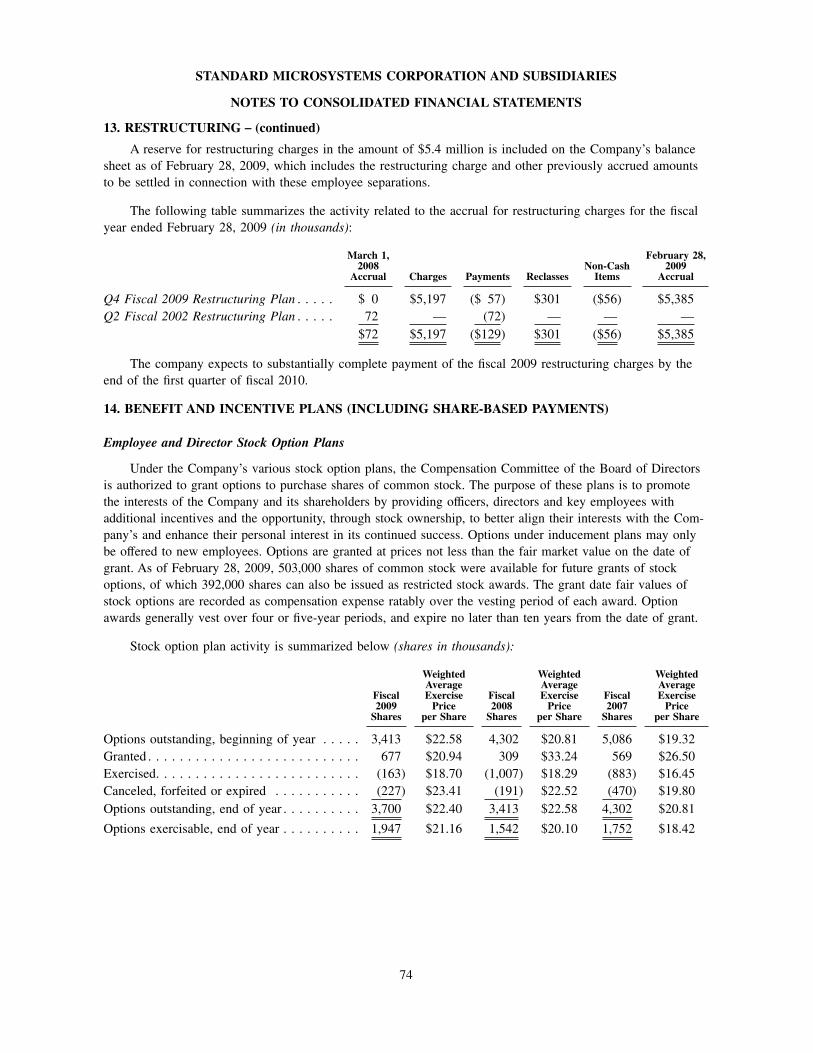
STANDARD MICROSYSTEMS CORPORATION AND SUBSIDIARIES
NOTES TO CONSOLIDATED FINANCIAL STATEMENTS
13. RESTRUCTURING − (continued)
A reserve for restructuring charges in the amount of $5.4 million is included on the Company’s balance
sheet as of February 28, 2009, which includes the restructuring charge and other previously accrued amounts
to be settled in connection with these employee separations.
The following table summarizes the activity related to the accrual for restructuring charges for the fiscal
year ended February 28, 2009 (in thousands):
March 1,2008
Accrual Charges Payments ReclassesNon-CashItems
February 28,2009
Accrual
Q4 Fiscal 2009 Restructuring Plan . . . . . $ 0 $5,197 ($ 57) $301 ($56) $5,385
Q2 Fiscal 2002 Restructuring Plan . . . . . 72 — (72) — — —
$72 $5,197 ($129) $301 ($56) $5,385
The company expects to substantially complete payment of the fiscal 2009 restructuring charges by the
end of the first quarter of fiscal 2010.
14. BENEFIT AND INCENTIVE PLANS (INCLUDING SHARE-BASED PAYMENTS)
Employee and Director Stock Option Plans
Under the Company’s various stock option plans, the Compensation Committee of the Board of Directors
is authorized to grant options to purchase shares of common stock. The purpose of these plans is to promote
the interests of the Company and its shareholders by providing officers, directors and key employees with
additional incentives and the opportunity, through stock ownership, to better align their interests with the Com-
pany’s and enhance their personal interest in its continued success. Options under inducement plans may only
be offered to new employees. Options are granted at prices not less than the fair market value on the date of
grant. As of February 28, 2009, 503,000 shares of common stock were available for future grants of stock
options, of which 392,000 shares can also be issued as restricted stock awards. The grant date fair values of
stock options are recorded as compensation expense ratably over the vesting period of each award. Option
awards generally vest over four or five-year periods, and expire no later than ten years from the date of grant.
Stock option plan activity is summarized below (shares in thousands):
Fiscal2009Shares
WeightedAverageExercisePrice
per Share
Fiscal2008Shares
WeightedAverageExercisePrice
per Share
Fiscal2007Shares
WeightedAverageExercisePrice
per Share
Options outstanding, beginning of year . . . . . 3,413 $22.58 4,302 $20.81 5,086 $19.32
Granted . . . . . . . . . . . . . . . . . . . . . . . . . . . 677 $20.94 309 $33.24 569 $26.50
Exercised. . . . . . . . . . . . . . . . . . . . . . . . . . (163) $18.70 (1,007) $18.29 (883) $16.45
Canceled, forfeited or expired . . . . . . . . . . . (227) $23.41 (191) $22.52 (470) $19.80
Options outstanding, end of year . . . . . . . . . . 3,700 $22.40 3,413 $22.58 4,302 $20.81
Options exercisable, end of year . . . . . . . . . . 1,947 $21.16 1,542 $20.10 1,752 $18.42
74
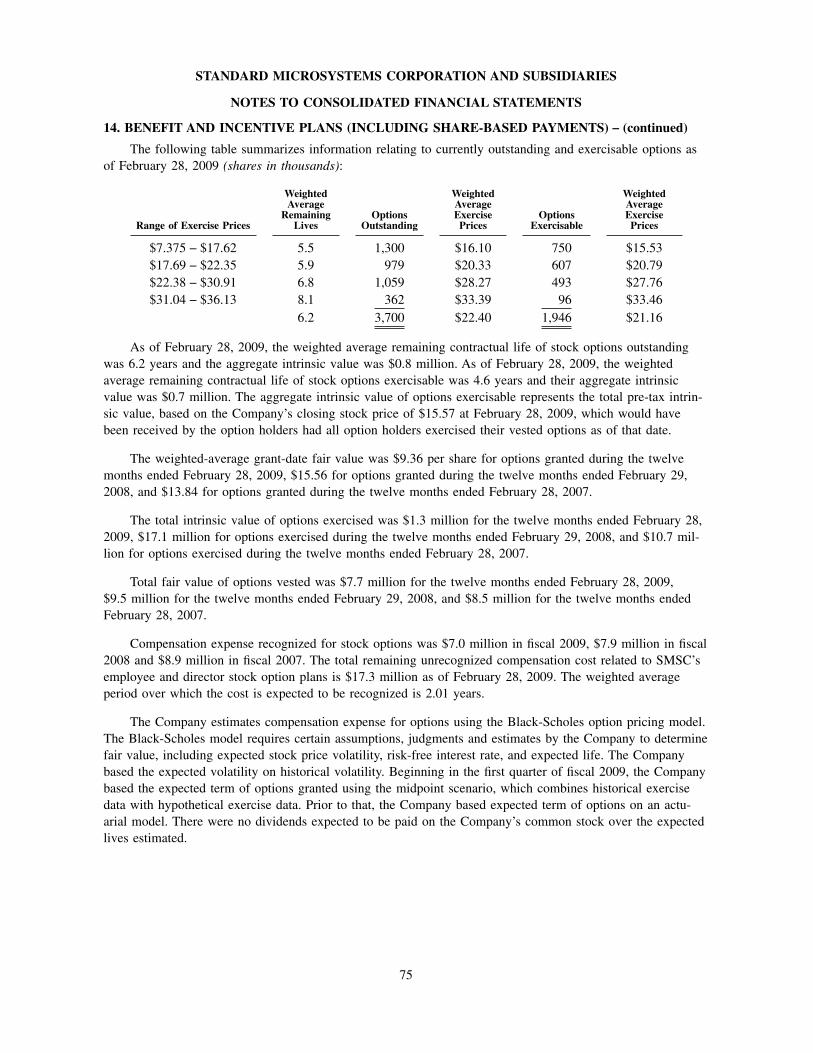
STANDARD MICROSYSTEMS CORPORATION AND SUBSIDIARIES
NOTES TO CONSOLIDATED FINANCIAL STATEMENTS
14. BENEFIT AND INCENTIVE PLANS (INCLUDING SHARE-BASED PAYMENTS) − (continued)
The following table summarizes information relating to currently outstanding and exercisable options as
of February 28, 2009 (shares in thousands):
Range of Exercise Prices
WeightedAverage
RemainingLives
OptionsOutstanding
WeightedAverageExercisePrices
OptionsExercisable
WeightedAverageExercisePrices
$7.375 − $17.62 5.5 1,300 $16.10 750 $15.53
$17.69 − $22.35 5.9 979 $20.33 607 $20.79
$22.38 − $30.91 6.8 1,059 $28.27 493 $27.76
$31.04 − $36.13 8.1 362 $33.39 96 $33.46
6.2 3,700 $22.40 1,946 $21.16
As of February 28, 2009, the weighted average remaining contractual life of stock options outstanding
was 6.2 years and the aggregate intrinsic value was $0.8 million. As of February 28, 2009, the weighted
average remaining contractual life of stock options exercisable was 4.6 years and their aggregate intrinsic
value was $0.7 million. The aggregate intrinsic value of options exercisable represents the total pre-tax intrin-
sic value, based on the Company’s closing stock price of $15.57 at February 28, 2009, which would have
been received by the option holders had all option holders exercised their vested options as of that date.
The weighted-average grant-date fair value was $9.36 per share for options granted during the twelve
months ended February 28, 2009, $15.56 for options granted during the twelve months ended February 29,
2008, and $13.84 for options granted during the twelve months ended February 28, 2007.
The total intrinsic value of options exercised was $1.3 million for the twelve months ended February 28,
2009, $17.1 million for options exercised during the twelve months ended February 29, 2008, and $10.7 mil-
lion for options exercised during the twelve months ended February 28, 2007.
Total fair value of options vested was $7.7 million for the twelve months ended February 28, 2009,
$9.5 million for the twelve months ended February 29, 2008, and $8.5 million for the twelve months ended
February 28, 2007.
Compensation expense recognized for stock options was $7.0 million in fiscal 2009, $7.9 million in fiscal
2008 and $8.9 million in fiscal 2007. The total remaining unrecognized compensation cost related to SMSC’s
employee and director stock option plans is $17.3 million as of February 28, 2009. The weighted average
period over which the cost is expected to be recognized is 2.01 years.
The Company estimates compensation expense for options using the Black-Scholes option pricing model.
The Black-Scholes model requires certain assumptions, judgments and estimates by the Company to determine
fair value, including expected stock price volatility, risk-free interest rate, and expected life. The Company
based the expected volatility on historical volatility. Beginning in the first quarter of fiscal 2009, the Company
based the expected term of options granted using the midpoint scenario, which combines historical exercise
data with hypothetical exercise data. Prior to that, the Company based expected term of options on an actu-
arial model. There were no dividends expected to be paid on the Company’s common stock over the expected
lives estimated.
75
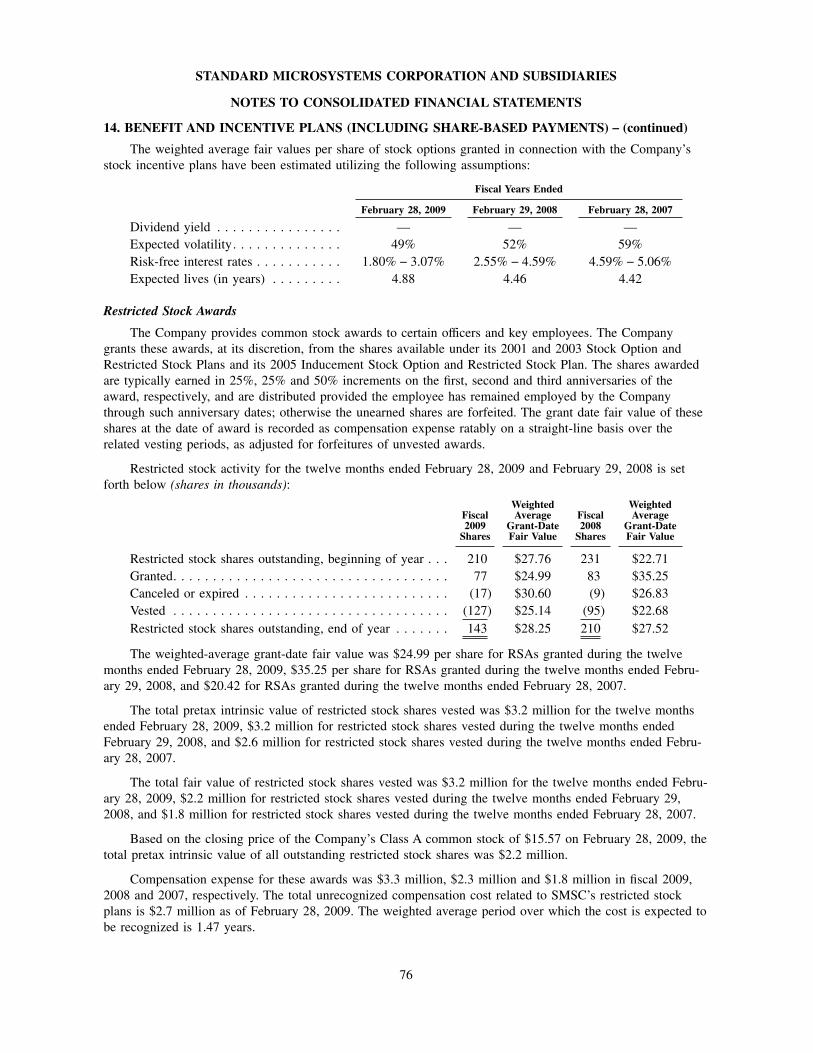
STANDARD MICROSYSTEMS CORPORATION AND SUBSIDIARIES
NOTES TO CONSOLIDATED FINANCIAL STATEMENTS
14. BENEFIT AND INCENTIVE PLANS (INCLUDING SHARE-BASED PAYMENTS) − (continued)
The weighted average fair values per share of stock options granted in connection with the Company’s
stock incentive plans have been estimated utilizing the following assumptions:
Fiscal Years Ended
February 28, 2009 February 29, 2008 February 28, 2007
Dividend yield . . . . . . . . . . . . . . . . — — —
Expected volatility. . . . . . . . . . . . . . 49% 52% 59%
Risk-free interest rates . . . . . . . . . . . 1.80% − 3.07% 2.55% − 4.59% 4.59% − 5.06%
Expected lives (in years) . . . . . . . . . 4.88 4.46 4.42
Restricted Stock Awards
The Company provides common stock awards to certain officers and key employees. The Company
grants these awards, at its discretion, from the shares available under its 2001 and 2003 Stock Option and
Restricted Stock Plans and its 2005 Inducement Stock Option and Restricted Stock Plan. The shares awarded
are typically earned in 25%, 25% and 50% increments on the first, second and third anniversaries of the
award, respectively, and are distributed provided the employee has remained employed by the Company
through such anniversary dates; otherwise the unearned shares are forfeited. The grant date fair value of these
shares at the date of award is recorded as compensation expense ratably on a straight-line basis over the
related vesting periods, as adjusted for forfeitures of unvested awards.
Restricted stock activity for the twelve months ended February 28, 2009 and February 29, 2008 is set
forth below (shares in thousands):
Fiscal2009Shares
WeightedAverage
Grant-DateFair Value
Fiscal2008Shares
WeightedAverage
Grant-DateFair Value
Restricted stock shares outstanding, beginning of year . . . 210 $27.76 231 $22.71
Granted. . . . . . . . . . . . . . . . . . . . . . . . . . . . . . . . . . . 77 $24.99 83 $35.25
Canceled or expired . . . . . . . . . . . . . . . . . . . . . . . . . . (17) $30.60 (9) $26.83
Vested . . . . . . . . . . . . . . . . . . . . . . . . . . . . . . . . . . . (127) $25.14 (95) $22.68
Restricted stock shares outstanding, end of year . . . . . . . 143 $28.25 210 $27.52
The weighted-average grant-date fair value was $24.99 per share for RSAs granted during the twelve
months ended February 28, 2009, $35.25 per share for RSAs granted during the twelve months ended Febru-
ary 29, 2008, and $20.42 for RSAs granted during the twelve months ended February 28, 2007.
The total pretax intrinsic value of restricted stock shares vested was $3.2 million for the twelve months
ended February 28, 2009, $3.2 million for restricted stock shares vested during the twelve months ended
February 29, 2008, and $2.6 million for restricted stock shares vested during the twelve months ended Febru-
ary 28, 2007.
The total fair value of restricted stock shares vested was $3.2 million for the twelve months ended Febru-
ary 28, 2009, $2.2 million for restricted stock shares vested during the twelve months ended February 29,
2008, and $1.8 million for restricted stock shares vested during the twelve months ended February 28, 2007.
Based on the closing price of the Company’s Class A common stock of $15.57 on February 28, 2009, the
total pretax intrinsic value of all outstanding restricted stock shares was $2.2 million.
Compensation expense for these awards was $3.3 million, $2.3 million and $1.8 million in fiscal 2009,
2008 and 2007, respectively. The total unrecognized compensation cost related to SMSC’s restricted stock
plans is $2.7 million as of February 28, 2009. The weighted average period over which the cost is expected to
be recognized is 1.47 years.
76
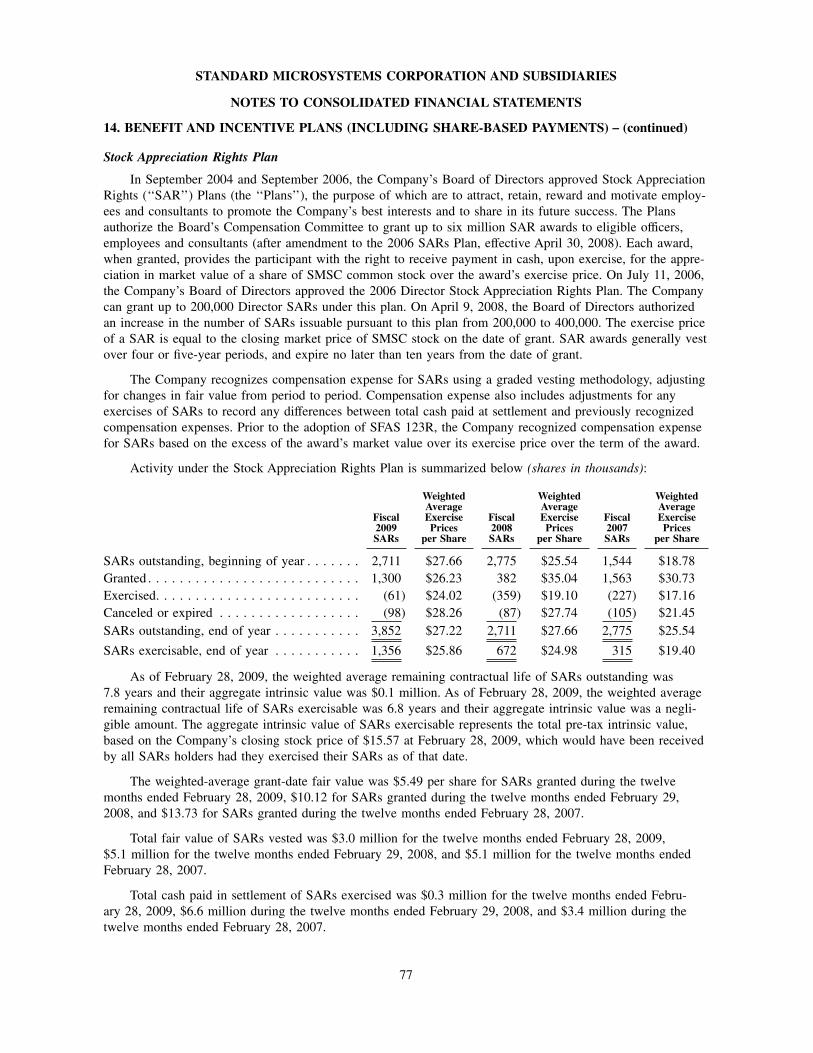
STANDARD MICROSYSTEMS CORPORATION AND SUBSIDIARIES
NOTES TO CONSOLIDATED FINANCIAL STATEMENTS
14. BENEFIT AND INCENTIVE PLANS (INCLUDING SHARE-BASED PAYMENTS) − (continued)
Stock Appreciation Rights Plan
In September 2004 and September 2006, the Company’s Board of Directors approved Stock Appreciation
Rights (‘‘SAR’’) Plans (the ‘‘Plans’’), the purpose of which are to attract, retain, reward and motivate employ-
ees and consultants to promote the Company’s best interests and to share in its future success. The Plans
authorize the Board’s Compensation Committee to grant up to six million SAR awards to eligible officers,
employees and consultants (after amendment to the 2006 SARs Plan, effective April 30, 2008). Each award,
when granted, provides the participant with the right to receive payment in cash, upon exercise, for the appre-
ciation in market value of a share of SMSC common stock over the award’s exercise price. On July 11, 2006,
the Company’s Board of Directors approved the 2006 Director Stock Appreciation Rights Plan. The Company
can grant up to 200,000 Director SARs under this plan. On April 9, 2008, the Board of Directors authorized
an increase in the number of SARs issuable pursuant to this plan from 200,000 to 400,000. The exercise price
of a SAR is equal to the closing market price of SMSC stock on the date of grant. SAR awards generally vest
over four or five-year periods, and expire no later than ten years from the date of grant.
The Company recognizes compensation expense for SARs using a graded vesting methodology, adjusting
for changes in fair value from period to period. Compensation expense also includes adjustments for any
exercises of SARs to record any differences between total cash paid at settlement and previously recognized
compensation expenses. Prior to the adoption of SFAS 123R, the Company recognized compensation expense
for SARs based on the excess of the award’s market value over its exercise price over the term of the award.
Activity under the Stock Appreciation Rights Plan is summarized below (shares in thousands):
Fiscal2009SARs
WeightedAverageExercisePrices
per Share
Fiscal2008SARs
WeightedAverageExercisePrices
per Share
Fiscal2007SARs
WeightedAverageExercisePrices
per Share
SARs outstanding, beginning of year . . . . . . . 2,711 $27.66 2,775 $25.54 1,544 $18.78
Granted . . . . . . . . . . . . . . . . . . . . . . . . . . . 1,300 $26.23 382 $35.04 1,563 $30.73
Exercised. . . . . . . . . . . . . . . . . . . . . . . . . . (61) $24.02 (359) $19.10 (227) $17.16
Canceled or expired . . . . . . . . . . . . . . . . . . (98) $28.26 (87) $27.74 (105) $21.45
SARs outstanding, end of year . . . . . . . . . . . 3,852 $27.22 2,711 $27.66 2,775 $25.54
SARs exercisable, end of year . . . . . . . . . . . 1,356 $25.86 672 $24.98 315 $19.40
As of February 28, 2009, the weighted average remaining contractual life of SARs outstanding was
7.8 years and their aggregate intrinsic value was $0.1 million. As of February 28, 2009, the weighted average
remaining contractual life of SARs exercisable was 6.8 years and their aggregate intrinsic value was a negli-
gible amount. The aggregate intrinsic value of SARs exercisable represents the total pre-tax intrinsic value,
based on the Company’s closing stock price of $15.57 at February 28, 2009, which would have been received
by all SARs holders had they exercised their SARs as of that date.
The weighted-average grant-date fair value was $5.49 per share for SARs granted during the twelve
months ended February 28, 2009, $10.12 for SARs granted during the twelve months ended February 29,
2008, and $13.73 for SARs granted during the twelve months ended February 28, 2007.
Total fair value of SARs vested was $3.0 million for the twelve months ended February 28, 2009,
$5.1 million for the twelve months ended February 29, 2008, and $5.1 million for the twelve months ended
February 28, 2007.
Total cash paid in settlement of SARs exercised was $0.3 million for the twelve months ended Febru-
ary 28, 2009, $6.6 million during the twelve months ended February 29, 2008, and $3.4 million during the
twelve months ended February 28, 2007.
77
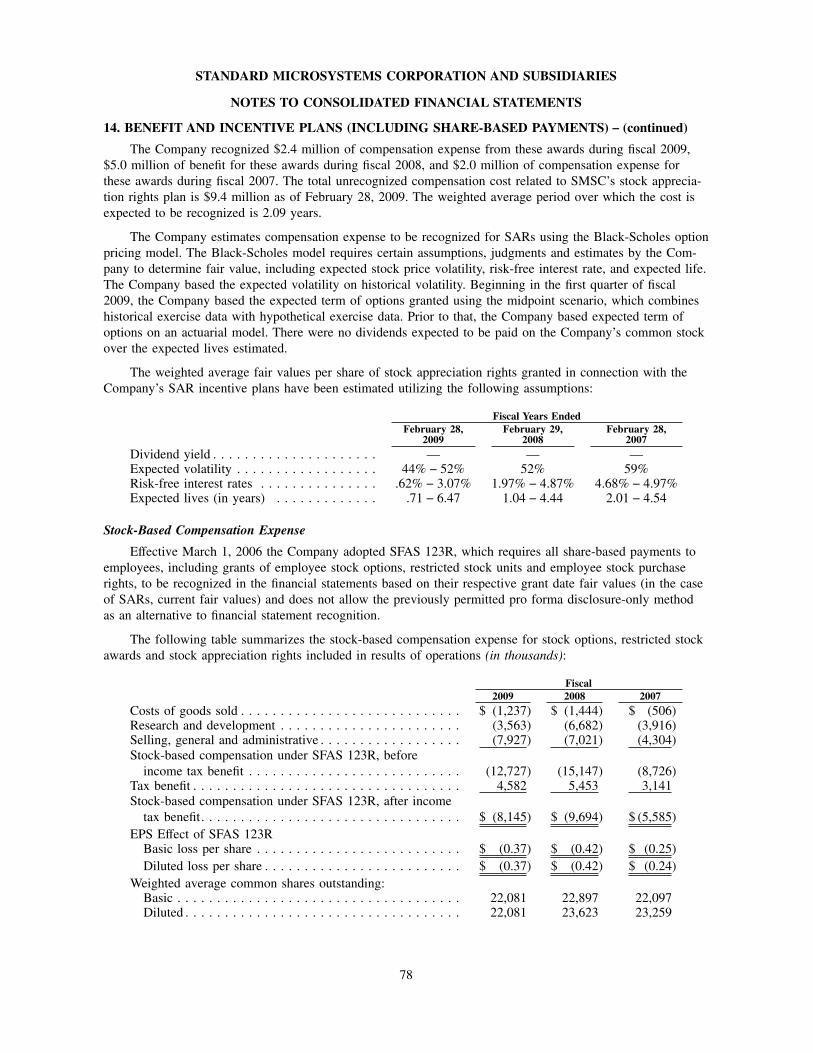
STANDARD MICROSYSTEMS CORPORATION AND SUBSIDIARIES
NOTES TO CONSOLIDATED FINANCIAL STATEMENTS
14. BENEFIT AND INCENTIVE PLANS (INCLUDING SHARE-BASED PAYMENTS) − (continued)
The Company recognized $2.4 million of compensation expense from these awards during fiscal 2009,
$5.0 million of benefit for these awards during fiscal 2008, and $2.0 million of compensation expense for
these awards during fiscal 2007. The total unrecognized compensation cost related to SMSC’s stock apprecia-
tion rights plan is $9.4 million as of February 28, 2009. The weighted average period over which the cost is
expected to be recognized is 2.09 years.
The Company estimates compensation expense to be recognized for SARs using the Black-Scholes option
pricing model. The Black-Scholes model requires certain assumptions, judgments and estimates by the Com-
pany to determine fair value, including expected stock price volatility, risk-free interest rate, and expected life.
The Company based the expected volatility on historical volatility. Beginning in the first quarter of fiscal
2009, the Company based the expected term of options granted using the midpoint scenario, which combines
historical exercise data with hypothetical exercise data. Prior to that, the Company based expected term of
options on an actuarial model. There were no dividends expected to be paid on the Company’s common stock
over the expected lives estimated.
The weighted average fair values per share of stock appreciation rights granted in connection with the
Company’s SAR incentive plans have been estimated utilizing the following assumptions:
Fiscal Years EndedFebruary 28,
2009February 29,
2008February 28,
2007Dividend yield . . . . . . . . . . . . . . . . . . . . . — — —Expected volatility . . . . . . . . . . . . . . . . . . 44% − 52% 52% 59%Risk-free interest rates . . . . . . . . . . . . . . . .62% − 3.07% 1.97% − 4.87% 4.68% − 4.97%Expected lives (in years) . . . . . . . . . . . . . .71 − 6.47 1.04 − 4.44 2.01 − 4.54
Stock-Based Compensation Expense
Effective March 1, 2006 the Company adopted SFAS 123R, which requires all share-based payments to
employees, including grants of employee stock options, restricted stock units and employee stock purchase
rights, to be recognized in the financial statements based on their respective grant date fair values (in the case
of SARs, current fair values) and does not allow the previously permitted pro forma disclosure-only method
as an alternative to financial statement recognition.
The following table summarizes the stock-based compensation expense for stock options, restricted stock
awards and stock appreciation rights included in results of operations (in thousands):
Fiscal2009 2008 2007
Costs of goods sold . . . . . . . . . . . . . . . . . . . . . . . . . . . . $ (1,237) $ (1,444) $ (506)Research and development . . . . . . . . . . . . . . . . . . . . . . . (3,563) (6,682) (3,916)Selling, general and administrative . . . . . . . . . . . . . . . . . . (7,927) (7,021) (4,304)
Stock-based compensation under SFAS 123R, before
income tax benefit . . . . . . . . . . . . . . . . . . . . . . . . . . . (12,727) (15,147) (8,726)Tax benefit . . . . . . . . . . . . . . . . . . . . . . . . . . . . . . . . . . 4,582 5,453 3,141
Stock-based compensation under SFAS 123R, after income
tax benefit. . . . . . . . . . . . . . . . . . . . . . . . . . . . . . . . . $ (8,145) $ (9,694) $ (5,585)
EPS Effect of SFAS 123RBasic loss per share . . . . . . . . . . . . . . . . . . . . . . . . . . $ (0.37) $ (0.42) $ (0.25)
Diluted loss per share . . . . . . . . . . . . . . . . . . . . . . . . . $ (0.37) $ (0.42) $ (0.24)
Weighted average common shares outstanding:Basic . . . . . . . . . . . . . . . . . . . . . . . . . . . . . . . . . . . . 22,081 22,897 22,097Diluted . . . . . . . . . . . . . . . . . . . . . . . . . . . . . . . . . . . 22,081 23,623 23,259
78
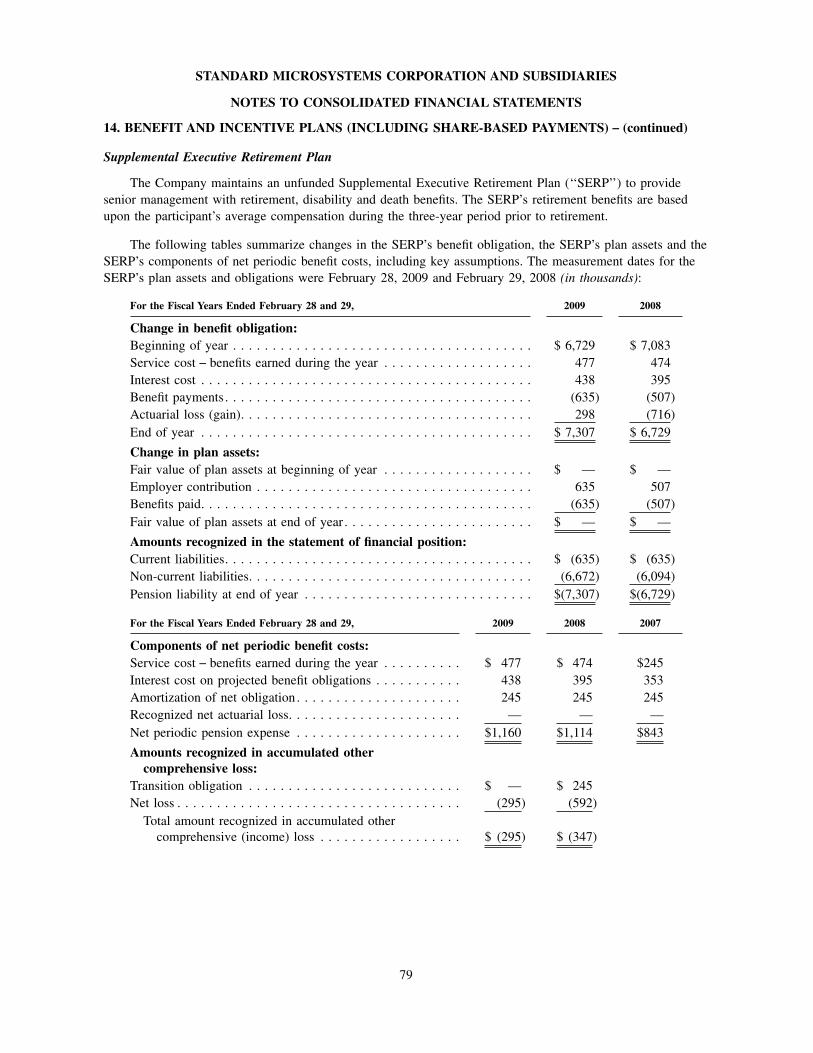
STANDARD MICROSYSTEMS CORPORATION AND SUBSIDIARIES
NOTES TO CONSOLIDATED FINANCIAL STATEMENTS
14. BENEFIT AND INCENTIVE PLANS (INCLUDING SHARE-BASED PAYMENTS) − (continued)
Supplemental Executive Retirement Plan
The Company maintains an unfunded Supplemental Executive Retirement Plan (‘‘SERP’’) to provide
senior management with retirement, disability and death benefits. The SERP’s retirement benefits are based
upon the participant’s average compensation during the three-year period prior to retirement.
The following tables summarize changes in the SERP’s benefit obligation, the SERP’s plan assets and the
SERP’s components of net periodic benefit costs, including key assumptions. The measurement dates for the
SERP’s plan assets and obligations were February 28, 2009 and February 29, 2008 (in thousands):
For the Fiscal Years Ended February 28 and 29, 2009 2008
Change in benefit obligation:Beginning of year . . . . . . . . . . . . . . . . . . . . . . . . . . . . . . . . . . . . . . $ 6,729 $ 7,083
Service cost − benefits earned during the year . . . . . . . . . . . . . . . . . . . 477 474
Interest cost . . . . . . . . . . . . . . . . . . . . . . . . . . . . . . . . . . . . . . . . . . 438 395
Benefit payments. . . . . . . . . . . . . . . . . . . . . . . . . . . . . . . . . . . . . . . (635) (507)
Actuarial loss (gain). . . . . . . . . . . . . . . . . . . . . . . . . . . . . . . . . . . . . 298 (716)
End of year . . . . . . . . . . . . . . . . . . . . . . . . . . . . . . . . . . . . . . . . . . $ 7,307 $ 6,729
Change in plan assets:Fair value of plan assets at beginning of year . . . . . . . . . . . . . . . . . . . $ — $ —
Employer contribution . . . . . . . . . . . . . . . . . . . . . . . . . . . . . . . . . . . 635 507
Benefits paid. . . . . . . . . . . . . . . . . . . . . . . . . . . . . . . . . . . . . . . . . . (635) (507)
Fair value of plan assets at end of year . . . . . . . . . . . . . . . . . . . . . . . . $ — $ —
Amounts recognized in the statement of financial position:Current liabilities. . . . . . . . . . . . . . . . . . . . . . . . . . . . . . . . . . . . . . . $ (635) $ (635)
Non-current liabilities. . . . . . . . . . . . . . . . . . . . . . . . . . . . . . . . . . . . (6,672) (6,094)
Pension liability at end of year . . . . . . . . . . . . . . . . . . . . . . . . . . . . . $(7,307) $(6,729)
For the Fiscal Years Ended February 28 and 29, 2009 2008 2007
Components of net periodic benefit costs:Service cost − benefits earned during the year . . . . . . . . . . $ 477 $ 474 $245
Interest cost on projected benefit obligations . . . . . . . . . . . 438 395 353
Amortization of net obligation . . . . . . . . . . . . . . . . . . . . . 245 245 245
Recognized net actuarial loss. . . . . . . . . . . . . . . . . . . . . . — — —
Net periodic pension expense . . . . . . . . . . . . . . . . . . . . . $1,160 $1,114 $843
Amounts recognized in accumulated othercomprehensive loss:
Transition obligation . . . . . . . . . . . . . . . . . . . . . . . . . . . $ — $ 245
Net loss . . . . . . . . . . . . . . . . . . . . . . . . . . . . . . . . . . . . (295) (592)
Total amount recognized in accumulated other
comprehensive (income) loss . . . . . . . . . . . . . . . . . . $ (295) $ (347)
79
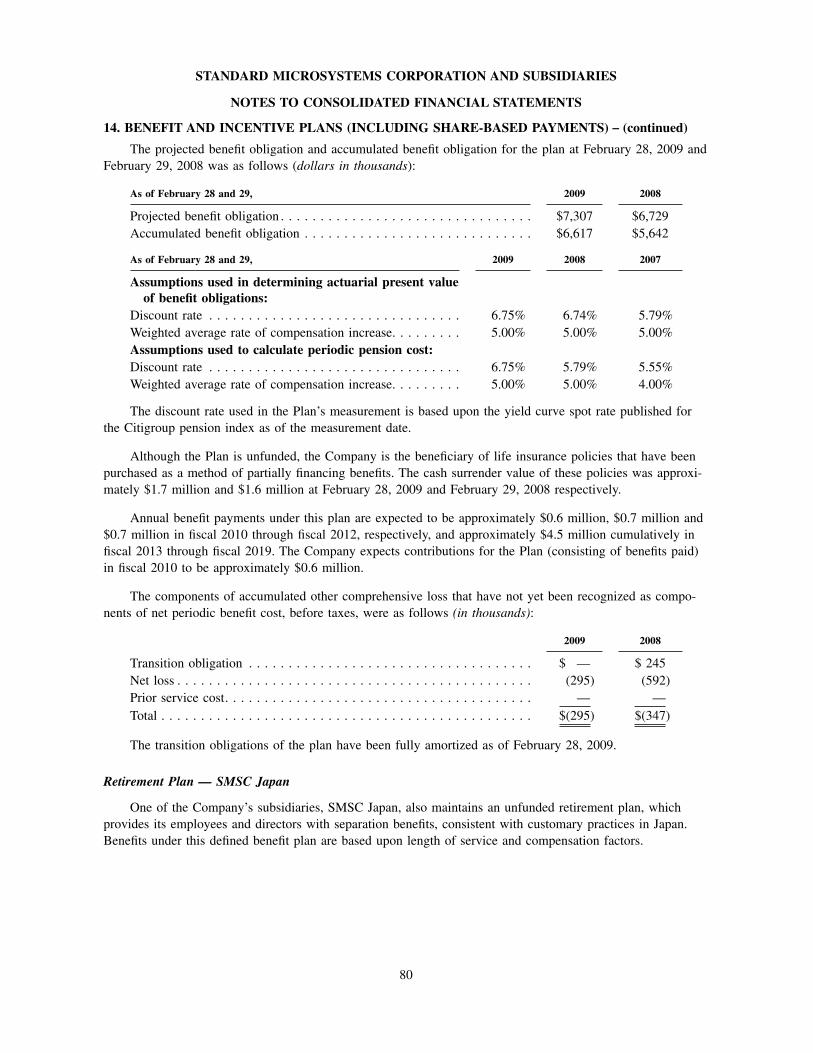
STANDARD MICROSYSTEMS CORPORATION AND SUBSIDIARIES
NOTES TO CONSOLIDATED FINANCIAL STATEMENTS
14. BENEFIT AND INCENTIVE PLANS (INCLUDING SHARE-BASED PAYMENTS) − (continued)
The projected benefit obligation and accumulated benefit obligation for the plan at February 28, 2009 and
February 29, 2008 was as follows (dollars in thousands):
As of February 28 and 29, 2009 2008
Projected benefit obligation . . . . . . . . . . . . . . . . . . . . . . . . . . . . . . . . $7,307 $6,729
Accumulated benefit obligation . . . . . . . . . . . . . . . . . . . . . . . . . . . . . $6,617 $5,642
As of February 28 and 29, 2009 2008 2007
Assumptions used in determining actuarial present valueof benefit obligations:
Discount rate . . . . . . . . . . . . . . . . . . . . . . . . . . . . . . . . 6.75% 6.74% 5.79%
Weighted average rate of compensation increase. . . . . . . . . 5.00% 5.00% 5.00%
Assumptions used to calculate periodic pension cost:Discount rate . . . . . . . . . . . . . . . . . . . . . . . . . . . . . . . . 6.75% 5.79% 5.55%
Weighted average rate of compensation increase. . . . . . . . . 5.00% 5.00% 4.00%
The discount rate used in the Plan’s measurement is based upon the yield curve spot rate published for
the Citigroup pension index as of the measurement date.
Although the Plan is unfunded, the Company is the beneficiary of life insurance policies that have been
purchased as a method of partially financing benefits. The cash surrender value of these policies was approxi-
mately $1.7 million and $1.6 million at February 28, 2009 and February 29, 2008 respectively.
Annual benefit payments under this plan are expected to be approximately $0.6 million, $0.7 million and
$0.7 million in fiscal 2010 through fiscal 2012, respectively, and approximately $4.5 million cumulatively in
fiscal 2013 through fiscal 2019. The Company expects contributions for the Plan (consisting of benefits paid)
in fiscal 2010 to be approximately $0.6 million.
The components of accumulated other comprehensive loss that have not yet been recognized as compo-
nents of net periodic benefit cost, before taxes, were as follows (in thousands):
2009 2008
Transition obligation . . . . . . . . . . . . . . . . . . . . . . . . . . . . . . . . . . . . $ — $ 245
Net loss . . . . . . . . . . . . . . . . . . . . . . . . . . . . . . . . . . . . . . . . . . . . . (295) (592)
Prior service cost. . . . . . . . . . . . . . . . . . . . . . . . . . . . . . . . . . . . . . . — —
Total . . . . . . . . . . . . . . . . . . . . . . . . . . . . . . . . . . . . . . . . . . . . . . . $(295) $(347)
The transition obligations of the plan have been fully amortized as of February 28, 2009.
Retirement Plan — SMSC Japan
One of the Company’s subsidiaries, SMSC Japan, also maintains an unfunded retirement plan, which
provides its employees and directors with separation benefits, consistent with customary practices in Japan.
Benefits under this defined benefit plan are based upon length of service and compensation factors.
80
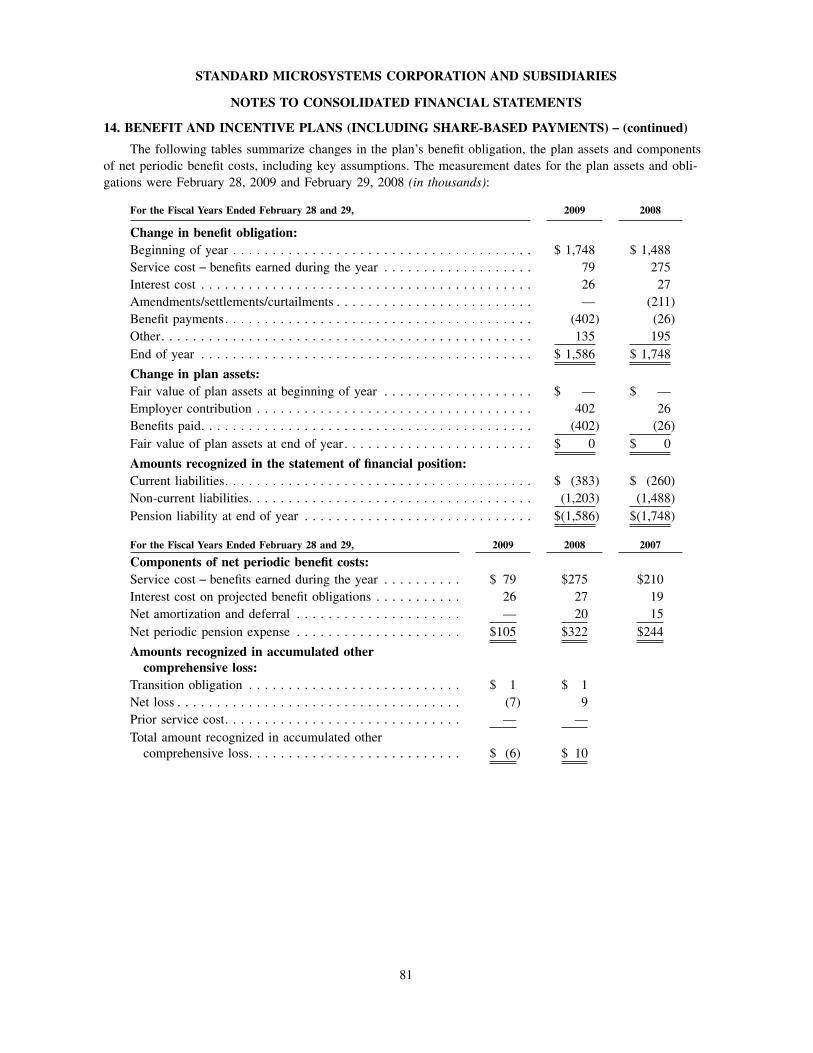
STANDARD MICROSYSTEMS CORPORATION AND SUBSIDIARIES
NOTES TO CONSOLIDATED FINANCIAL STATEMENTS
14. BENEFIT AND INCENTIVE PLANS (INCLUDING SHARE-BASED PAYMENTS) − (continued)
The following tables summarize changes in the plan’s benefit obligation, the plan assets and components
of net periodic benefit costs, including key assumptions. The measurement dates for the plan assets and obli-
gations were February 28, 2009 and February 29, 2008 (in thousands):
For the Fiscal Years Ended February 28 and 29, 2009 2008
Change in benefit obligation:Beginning of year . . . . . . . . . . . . . . . . . . . . . . . . . . . . . . . . . . . . . . $ 1,748 $ 1,488
Service cost − benefits earned during the year . . . . . . . . . . . . . . . . . . . 79 275
Interest cost . . . . . . . . . . . . . . . . . . . . . . . . . . . . . . . . . . . . . . . . . . 26 27
Amendments/settlements/curtailments . . . . . . . . . . . . . . . . . . . . . . . . . — (211)
Benefit payments. . . . . . . . . . . . . . . . . . . . . . . . . . . . . . . . . . . . . . . (402) (26)
Other. . . . . . . . . . . . . . . . . . . . . . . . . . . . . . . . . . . . . . . . . . . . . . . 135 195
End of year . . . . . . . . . . . . . . . . . . . . . . . . . . . . . . . . . . . . . . . . . . $ 1,586 $ 1,748
Change in plan assets:Fair value of plan assets at beginning of year . . . . . . . . . . . . . . . . . . . $ — $ —
Employer contribution . . . . . . . . . . . . . . . . . . . . . . . . . . . . . . . . . . . 402 26
Benefits paid. . . . . . . . . . . . . . . . . . . . . . . . . . . . . . . . . . . . . . . . . . (402) (26)
Fair value of plan assets at end of year . . . . . . . . . . . . . . . . . . . . . . . . $ 0 $ 0
Amounts recognized in the statement of financial position:Current liabilities. . . . . . . . . . . . . . . . . . . . . . . . . . . . . . . . . . . . . . . $ (383) $ (260)
Non-current liabilities. . . . . . . . . . . . . . . . . . . . . . . . . . . . . . . . . . . . (1,203) (1,488)
Pension liability at end of year . . . . . . . . . . . . . . . . . . . . . . . . . . . . . $(1,586) $(1,748)
For the Fiscal Years Ended February 28 and 29, 2009 2008 2007
Components of net periodic benefit costs:Service cost − benefits earned during the year . . . . . . . . . . $ 79 $275 $210
Interest cost on projected benefit obligations . . . . . . . . . . . 26 27 19
Net amortization and deferral . . . . . . . . . . . . . . . . . . . . . — 20 15
Net periodic pension expense . . . . . . . . . . . . . . . . . . . . . $105 $322 $244
Amounts recognized in accumulated othercomprehensive loss:
Transition obligation . . . . . . . . . . . . . . . . . . . . . . . . . . . $ 1 $ 1
Net loss . . . . . . . . . . . . . . . . . . . . . . . . . . . . . . . . . . . . (7) 9
Prior service cost. . . . . . . . . . . . . . . . . . . . . . . . . . . . . . — —
Total amount recognized in accumulated other
comprehensive loss. . . . . . . . . . . . . . . . . . . . . . . . . . . $ (6) $ 10
81
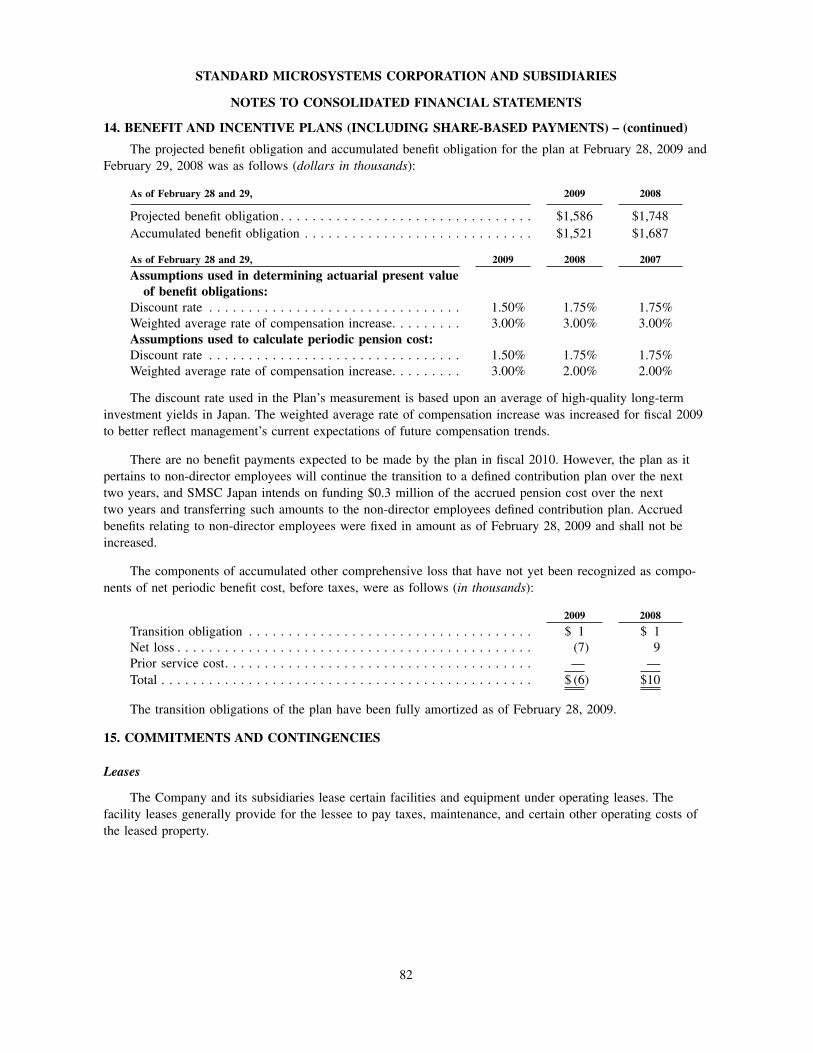
STANDARD MICROSYSTEMS CORPORATION AND SUBSIDIARIES
NOTES TO CONSOLIDATED FINANCIAL STATEMENTS
14. BENEFIT AND INCENTIVE PLANS (INCLUDING SHARE-BASED PAYMENTS) − (continued)
The projected benefit obligation and accumulated benefit obligation for the plan at February 28, 2009 and
February 29, 2008 was as follows (dollars in thousands):
As of February 28 and 29, 2009 2008
Projected benefit obligation . . . . . . . . . . . . . . . . . . . . . . . . . . . . . . . . $1,586 $1,748
Accumulated benefit obligation . . . . . . . . . . . . . . . . . . . . . . . . . . . . . $1,521 $1,687
As of February 28 and 29, 2009 2008 2007
Assumptions used in determining actuarial present valueof benefit obligations:
Discount rate . . . . . . . . . . . . . . . . . . . . . . . . . . . . . . . . 1.50% 1.75% 1.75%
Weighted average rate of compensation increase. . . . . . . . . 3.00% 3.00% 3.00%
Assumptions used to calculate periodic pension cost:Discount rate . . . . . . . . . . . . . . . . . . . . . . . . . . . . . . . . 1.50% 1.75% 1.75%
Weighted average rate of compensation increase. . . . . . . . . 3.00% 2.00% 2.00%
The discount rate used in the Plan’s measurement is based upon an average of high-quality long-term
investment yields in Japan. The weighted average rate of compensation increase was increased for fiscal 2009
to better reflect management’s current expectations of future compensation trends.
There are no benefit payments expected to be made by the plan in fiscal 2010. However, the plan as it
pertains to non-director employees will continue the transition to a defined contribution plan over the next
two years, and SMSC Japan intends on funding $0.3 million of the accrued pension cost over the next
two years and transferring such amounts to the non-director employees defined contribution plan. Accrued
benefits relating to non-director employees were fixed in amount as of February 28, 2009 and shall not be
increased.
The components of accumulated other comprehensive loss that have not yet been recognized as compo-
nents of net periodic benefit cost, before taxes, were as follows (in thousands):
2009 2008
Transition obligation . . . . . . . . . . . . . . . . . . . . . . . . . . . . . . . . . . . . $ 1 $ 1
Net loss . . . . . . . . . . . . . . . . . . . . . . . . . . . . . . . . . . . . . . . . . . . . . (7) 9
Prior service cost. . . . . . . . . . . . . . . . . . . . . . . . . . . . . . . . . . . . . . . — —
Total . . . . . . . . . . . . . . . . . . . . . . . . . . . . . . . . . . . . . . . . . . . . . . . $ (6) $10
The transition obligations of the plan have been fully amortized as of February 28, 2009.
15. COMMITMENTS AND CONTINGENCIES
Leases
The Company and its subsidiaries lease certain facilities and equipment under operating leases. The
facility leases generally provide for the lessee to pay taxes, maintenance, and certain other operating costs of
the leased property.
82
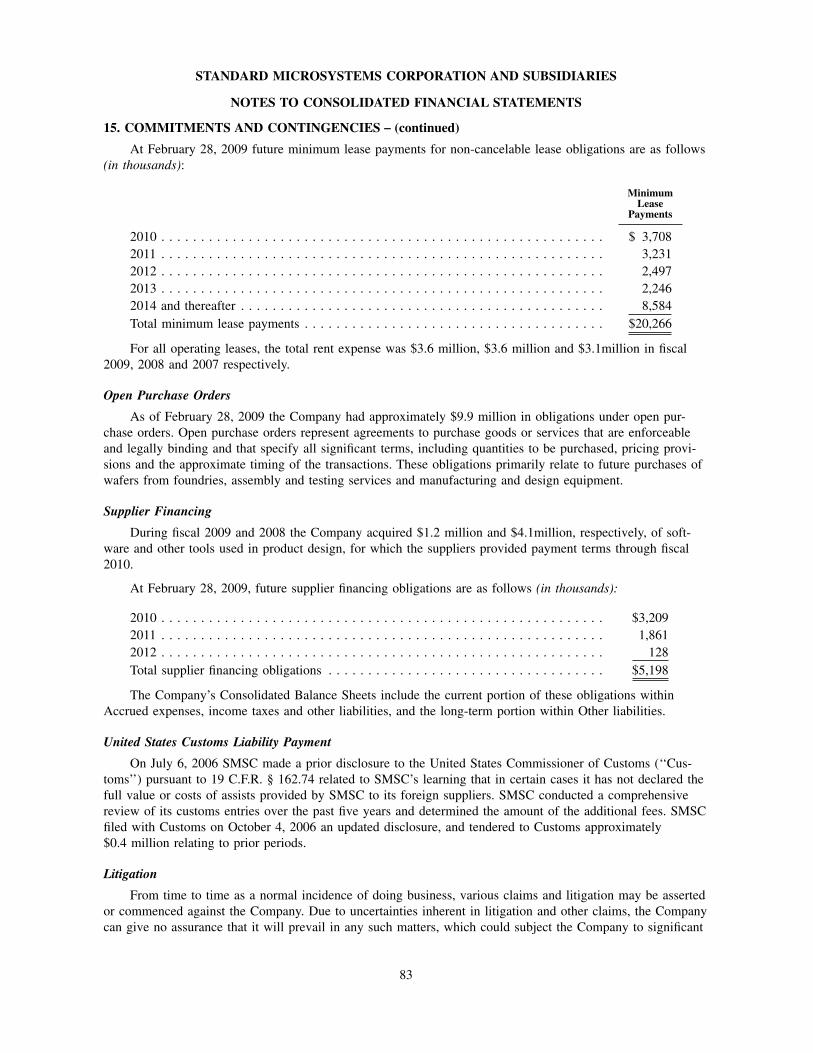
STANDARD MICROSYSTEMS CORPORATION AND SUBSIDIARIES
NOTES TO CONSOLIDATED FINANCIAL STATEMENTS
15. COMMITMENTS AND CONTINGENCIES − (continued)
At February 28, 2009 future minimum lease payments for non-cancelable lease obligations are as follows
(in thousands):
MinimumLease
Payments
2010 . . . . . . . . . . . . . . . . . . . . . . . . . . . . . . . . . . . . . . . . . . . . . . . . . . . . . . . . $ 3,708
2011 . . . . . . . . . . . . . . . . . . . . . . . . . . . . . . . . . . . . . . . . . . . . . . . . . . . . . . . . 3,231
2012 . . . . . . . . . . . . . . . . . . . . . . . . . . . . . . . . . . . . . . . . . . . . . . . . . . . . . . . . 2,497
2013 . . . . . . . . . . . . . . . . . . . . . . . . . . . . . . . . . . . . . . . . . . . . . . . . . . . . . . . . 2,246
2014 and thereafter . . . . . . . . . . . . . . . . . . . . . . . . . . . . . . . . . . . . . . . . . . . . . . 8,584
Total minimum lease payments . . . . . . . . . . . . . . . . . . . . . . . . . . . . . . . . . . . . . . $20,266
For all operating leases, the total rent expense was $3.6 million, $3.6 million and $3.1million in fiscal
2009, 2008 and 2007 respectively.
Open Purchase Orders
As of February 28, 2009 the Company had approximately $9.9 million in obligations under open pur-
chase orders. Open purchase orders represent agreements to purchase goods or services that are enforceable
and legally binding and that specify all significant terms, including quantities to be purchased, pricing provi-
sions and the approximate timing of the transactions. These obligations primarily relate to future purchases of
wafers from foundries, assembly and testing services and manufacturing and design equipment.
Supplier Financing
During fiscal 2009 and 2008 the Company acquired $1.2 million and $4.1million, respectively, of soft-
ware and other tools used in product design, for which the suppliers provided payment terms through fiscal
2010.
At February 28, 2009, future supplier financing obligations are as follows (in thousands):
2010 . . . . . . . . . . . . . . . . . . . . . . . . . . . . . . . . . . . . . . . . . . . . . . . . . . . . . . . . $3,209
2011 . . . . . . . . . . . . . . . . . . . . . . . . . . . . . . . . . . . . . . . . . . . . . . . . . . . . . . . . 1,861
2012 . . . . . . . . . . . . . . . . . . . . . . . . . . . . . . . . . . . . . . . . . . . . . . . . . . . . . . . . 128
Total supplier financing obligations . . . . . . . . . . . . . . . . . . . . . . . . . . . . . . . . . . . $5,198
The Company’s Consolidated Balance Sheets include the current portion of these obligations within
Accrued expenses, income taxes and other liabilities, and the long-term portion within Other liabilities.
United States Customs Liability Payment
On July 6, 2006 SMSC made a prior disclosure to the United States Commissioner of Customs (‘‘Cus-
toms’’) pursuant to 19 C.F.R. § 162.74 related to SMSC’s learning that in certain cases it has not declared the
full value or costs of assists provided by SMSC to its foreign suppliers. SMSC conducted a comprehensive
review of its customs entries over the past five years and determined the amount of the additional fees. SMSC
filed with Customs on October 4, 2006 an updated disclosure, and tendered to Customs approximately
$0.4 million relating to prior periods.
Litigation
From time to time as a normal incidence of doing business, various claims and litigation may be asserted
or commenced against the Company. Due to uncertainties inherent in litigation and other claims, the Company
can give no assurance that it will prevail in any such matters, which could subject the Company to significant
83
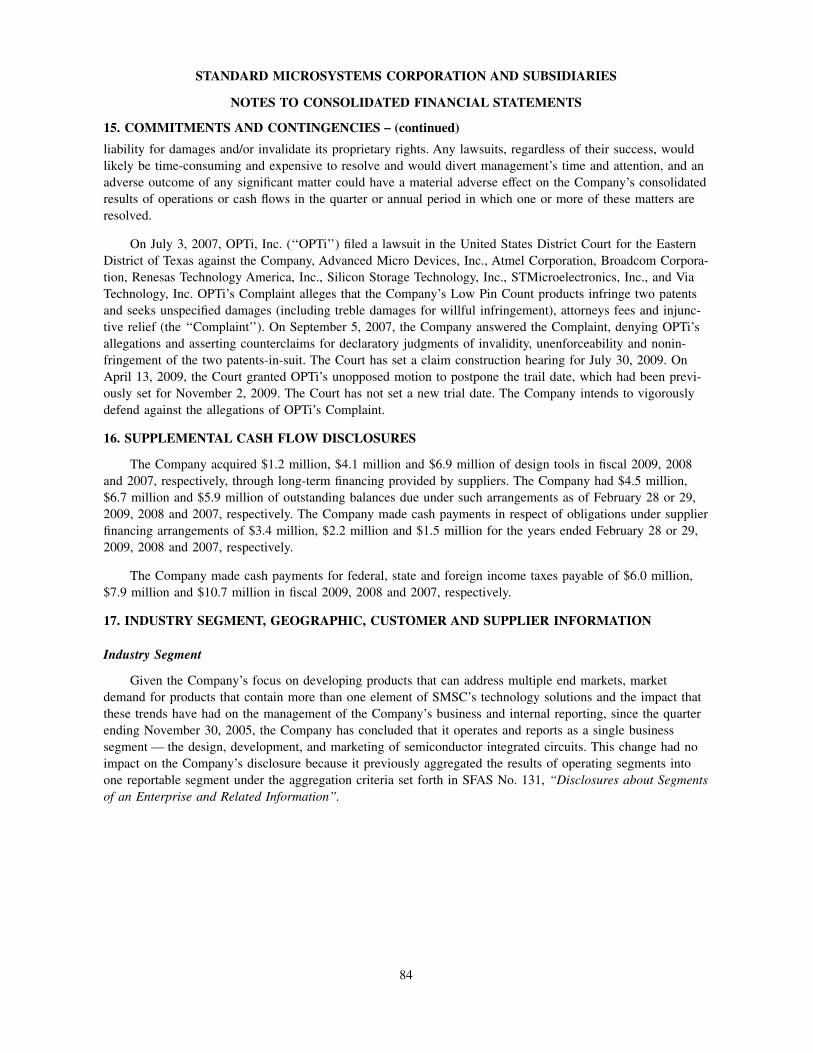
STANDARD MICROSYSTEMS CORPORATION AND SUBSIDIARIES
NOTES TO CONSOLIDATED FINANCIAL STATEMENTS
15. COMMITMENTS AND CONTINGENCIES − (continued)
liability for damages and/or invalidate its proprietary rights. Any lawsuits, regardless of their success, would
likely be time-consuming and expensive to resolve and would divert management’s time and attention, and an
adverse outcome of any significant matter could have a material adverse effect on the Company’s consolidated
results of operations or cash flows in the quarter or annual period in which one or more of these matters are
resolved.
On July 3, 2007, OPTi, Inc. (‘‘OPTi’’) filed a lawsuit in the United States District Court for the Eastern
District of Texas against the Company, Advanced Micro Devices, Inc., Atmel Corporation, Broadcom Corpora-
tion, Renesas Technology America, Inc., Silicon Storage Technology, Inc., STMicroelectronics, Inc., and Via
Technology, Inc. OPTi’s Complaint alleges that the Company’s Low Pin Count products infringe two patents
and seeks unspecified damages (including treble damages for willful infringement), attorneys fees and injunc-
tive relief (the ‘‘Complaint’’). On September 5, 2007, the Company answered the Complaint, denying OPTi’s
allegations and asserting counterclaims for declaratory judgments of invalidity, unenforceability and nonin-
fringement of the two patents-in-suit. The Court has set a claim construction hearing for July 30, 2009. On
April 13, 2009, the Court granted OPTi’s unopposed motion to postpone the trail date, which had been previ-
ously set for November 2, 2009. The Court has not set a new trial date. The Company intends to vigorously
defend against the allegations of OPTi’s Complaint.
16. SUPPLEMENTAL CASH FLOW DISCLOSURES
The Company acquired $1.2 million, $4.1 million and $6.9 million of design tools in fiscal 2009, 2008
and 2007, respectively, through long-term financing provided by suppliers. The Company had $4.5 million,
$6.7 million and $5.9 million of outstanding balances due under such arrangements as of February 28 or 29,
2009, 2008 and 2007, respectively. The Company made cash payments in respect of obligations under supplier
financing arrangements of $3.4 million, $2.2 million and $1.5 million for the years ended February 28 or 29,
2009, 2008 and 2007, respectively.
The Company made cash payments for federal, state and foreign income taxes payable of $6.0 million,
$7.9 million and $10.7 million in fiscal 2009, 2008 and 2007, respectively.
17. INDUSTRY SEGMENT, GEOGRAPHIC, CUSTOMER AND SUPPLIER INFORMATION
Industry Segment
Given the Company’s focus on developing products that can address multiple end markets, market
demand for products that contain more than one element of SMSC’s technology solutions and the impact that
these trends have had on the management of the Company’s business and internal reporting, since the quarter
ending November 30, 2005, the Company has concluded that it operates and reports as a single business
segment — the design, development, and marketing of semiconductor integrated circuits. This change had no
impact on the Company’s disclosure because it previously aggregated the results of operating segments into
one reportable segment under the aggregation criteria set forth in SFAS No. 131, ‘‘Disclosures about Segmentsof an Enterprise and Related Information’’.
84
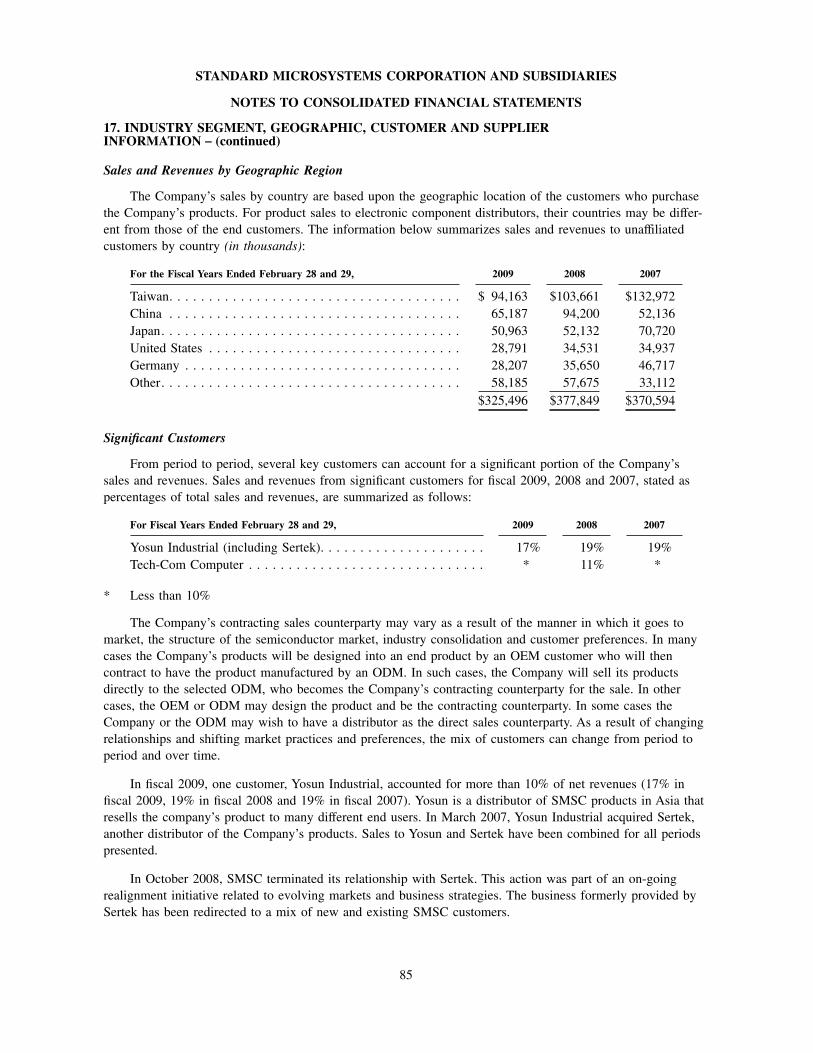
STANDARD MICROSYSTEMS CORPORATION AND SUBSIDIARIES
NOTES TO CONSOLIDATED FINANCIAL STATEMENTS
17. INDUSTRY SEGMENT, GEOGRAPHIC, CUSTOMER AND SUPPLIERINFORMATION − (continued)
Sales and Revenues by Geographic Region
The Company’s sales by country are based upon the geographic location of the customers who purchase
the Company’s products. For product sales to electronic component distributors, their countries may be differ-
ent from those of the end customers. The information below summarizes sales and revenues to unaffiliated
customers by country (in thousands):
For the Fiscal Years Ended February 28 and 29, 2009 2008 2007
Taiwan. . . . . . . . . . . . . . . . . . . . . . . . . . . . . . . . . . . . . $ 94,163 $103,661 $132,972
China . . . . . . . . . . . . . . . . . . . . . . . . . . . . . . . . . . . . . 65,187 94,200 52,136
Japan. . . . . . . . . . . . . . . . . . . . . . . . . . . . . . . . . . . . . . 50,963 52,132 70,720
United States . . . . . . . . . . . . . . . . . . . . . . . . . . . . . . . . 28,791 34,531 34,937
Germany . . . . . . . . . . . . . . . . . . . . . . . . . . . . . . . . . . . 28,207 35,650 46,717
Other. . . . . . . . . . . . . . . . . . . . . . . . . . . . . . . . . . . . . . 58,185 57,675 33,112
$325,496 $377,849 $370,594
Significant Customers
From period to period, several key customers can account for a significant portion of the Company’s
sales and revenues. Sales and revenues from significant customers for fiscal 2009, 2008 and 2007, stated as
percentages of total sales and revenues, are summarized as follows:
For Fiscal Years Ended February 28 and 29, 2009 2008 2007
Yosun Industrial (including Sertek). . . . . . . . . . . . . . . . . . . . . 17% 19% 19%
Tech-Com Computer . . . . . . . . . . . . . . . . . . . . . . . . . . . . . . * 11% *
* Less than 10%
The Company’s contracting sales counterparty may vary as a result of the manner in which it goes to
market, the structure of the semiconductor market, industry consolidation and customer preferences. In many
cases the Company’s products will be designed into an end product by an OEM customer who will then
contract to have the product manufactured by an ODM. In such cases, the Company will sell its products
directly to the selected ODM, who becomes the Company’s contracting counterparty for the sale. In other
cases, the OEM or ODM may design the product and be the contracting counterparty. In some cases the
Company or the ODM may wish to have a distributor as the direct sales counterparty. As a result of changing
relationships and shifting market practices and preferences, the mix of customers can change from period to
period and over time.
In fiscal 2009, one customer, Yosun Industrial, accounted for more than 10% of net revenues (17% in
fiscal 2009, 19% in fiscal 2008 and 19% in fiscal 2007). Yosun is a distributor of SMSC products in Asia that
resells the company’s product to many different end users. In March 2007, Yosun Industrial acquired Sertek,
another distributor of the Company’s products. Sales to Yosun and Sertek have been combined for all periods
presented.
In October 2008, SMSC terminated its relationship with Sertek. This action was part of an on-going
realignment initiative related to evolving markets and business strategies. The business formerly provided by
Sertek has been redirected to a mix of new and existing SMSC customers.
85
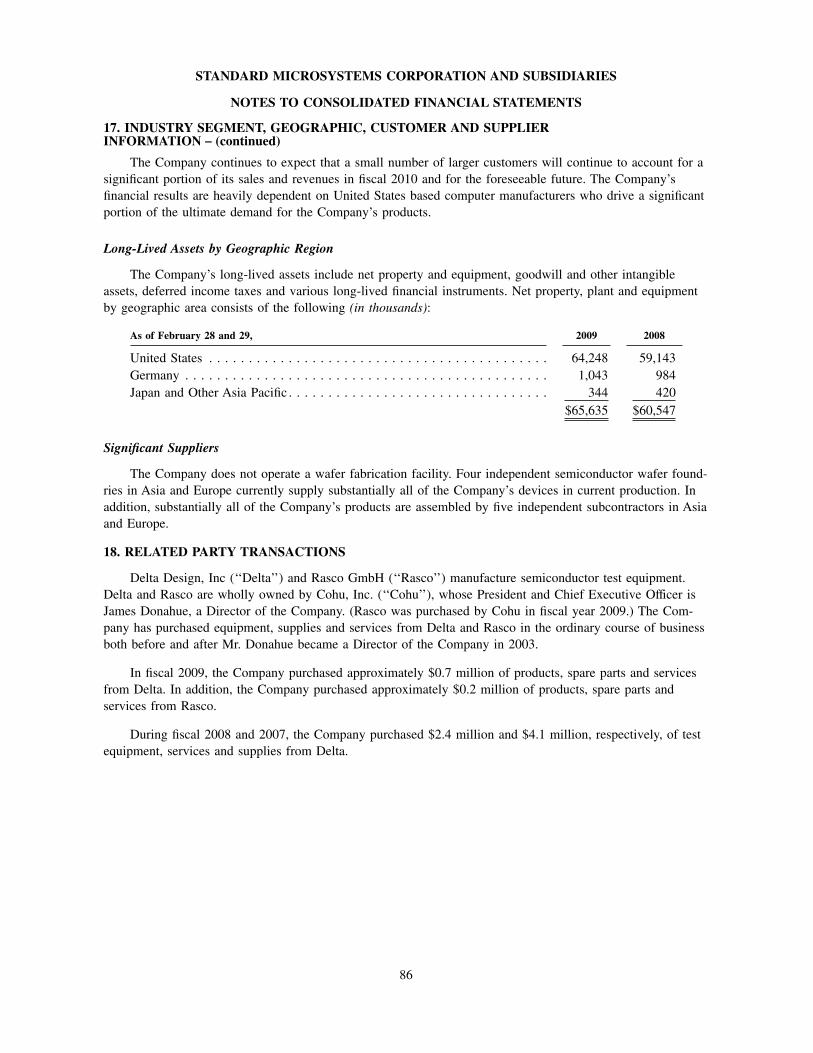
STANDARD MICROSYSTEMS CORPORATION AND SUBSIDIARIES
NOTES TO CONSOLIDATED FINANCIAL STATEMENTS
17. INDUSTRY SEGMENT, GEOGRAPHIC, CUSTOMER AND SUPPLIERINFORMATION − (continued)
The Company continues to expect that a small number of larger customers will continue to account for a
significant portion of its sales and revenues in fiscal 2010 and for the foreseeable future. The Company’s
financial results are heavily dependent on United States based computer manufacturers who drive a significant
portion of the ultimate demand for the Company’s products.
Long-Lived Assets by Geographic Region
The Company’s long-lived assets include net property and equipment, goodwill and other intangible
assets, deferred income taxes and various long-lived financial instruments. Net property, plant and equipment
by geographic area consists of the following (in thousands):
As of February 28 and 29, 2009 2008
United States . . . . . . . . . . . . . . . . . . . . . . . . . . . . . . . . . . . . . . . . . . . 64,248 59,143
Germany . . . . . . . . . . . . . . . . . . . . . . . . . . . . . . . . . . . . . . . . . . . . . . 1,043 984
Japan and Other Asia Pacific . . . . . . . . . . . . . . . . . . . . . . . . . . . . . . . . . 344 420
$65,635 $60,547
Significant Suppliers
The Company does not operate a wafer fabrication facility. Four independent semiconductor wafer found-
ries in Asia and Europe currently supply substantially all of the Company’s devices in current production. In
addition, substantially all of the Company’s products are assembled by five independent subcontractors in Asia
and Europe.
18. RELATED PARTY TRANSACTIONS
Delta Design, Inc (‘‘Delta’’) and Rasco GmbH (‘‘Rasco’’) manufacture semiconductor test equipment.
Delta and Rasco are wholly owned by Cohu, Inc. (‘‘Cohu’’), whose President and Chief Executive Officer is
James Donahue, a Director of the Company. (Rasco was purchased by Cohu in fiscal year 2009.) The Com-
pany has purchased equipment, supplies and services from Delta and Rasco in the ordinary course of business
both before and after Mr. Donahue became a Director of the Company in 2003.
In fiscal 2009, the Company purchased approximately $0.7 million of products, spare parts and services
from Delta. In addition, the Company purchased approximately $0.2 million of products, spare parts and
services from Rasco.
During fiscal 2008 and 2007, the Company purchased $2.4 million and $4.1 million, respectively, of test
equipment, services and supplies from Delta.
86
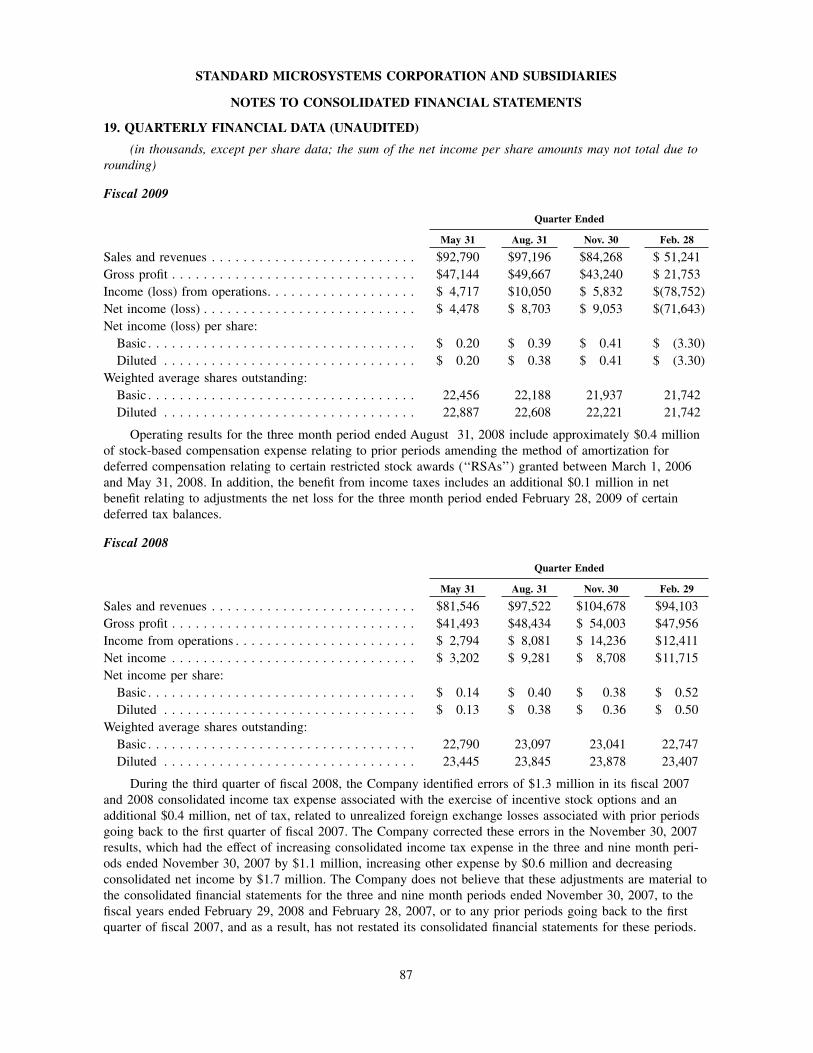
STANDARD MICROSYSTEMS CORPORATION AND SUBSIDIARIES
NOTES TO CONSOLIDATED FINANCIAL STATEMENTS
19. QUARTERLY FINANCIAL DATA (UNAUDITED)
(in thousands, except per share data; the sum of the net income per share amounts may not total due torounding)
Fiscal 2009
Quarter Ended
May 31 Aug. 31 Nov. 30 Feb. 28
Sales and revenues . . . . . . . . . . . . . . . . . . . . . . . . . . $92,790 $97,196 $84,268 $ 51,241
Gross profit . . . . . . . . . . . . . . . . . . . . . . . . . . . . . . . $47,144 $49,667 $43,240 $ 21,753
Income (loss) from operations. . . . . . . . . . . . . . . . . . . $ 4,717 $10,050 $ 5,832 $(78,752)
Net income (loss) . . . . . . . . . . . . . . . . . . . . . . . . . . . $ 4,478 $ 8,703 $ 9,053 $(71,643)
Net income (loss) per share:
Basic . . . . . . . . . . . . . . . . . . . . . . . . . . . . . . . . . . $ 0.20 $ 0.39 $ 0.41 $ (3.30)
Diluted . . . . . . . . . . . . . . . . . . . . . . . . . . . . . . . . $ 0.20 $ 0.38 $ 0.41 $ (3.30)
Weighted average shares outstanding:
Basic . . . . . . . . . . . . . . . . . . . . . . . . . . . . . . . . . . 22,456 22,188 21,937 21,742
Diluted . . . . . . . . . . . . . . . . . . . . . . . . . . . . . . . . 22,887 22,608 22,221 21,742
Operating results for the three month period ended August 31, 2008 include approximately $0.4 million
of stock-based compensation expense relating to prior periods amending the method of amortization for
deferred compensation relating to certain restricted stock awards (‘‘RSAs’’) granted between March 1, 2006
and May 31, 2008. In addition, the benefit from income taxes includes an additional $0.1 million in net
benefit relating to adjustments the net loss for the three month period ended February 28, 2009 of certain
deferred tax balances.
Fiscal 2008
Quarter Ended
May 31 Aug. 31 Nov. 30 Feb. 29
Sales and revenues . . . . . . . . . . . . . . . . . . . . . . . . . . $81,546 $97,522 $104,678 $94,103
Gross profit . . . . . . . . . . . . . . . . . . . . . . . . . . . . . . . $41,493 $48,434 $ 54,003 $47,956
Income from operations . . . . . . . . . . . . . . . . . . . . . . . $ 2,794 $ 8,081 $ 14,236 $12,411
Net income . . . . . . . . . . . . . . . . . . . . . . . . . . . . . . . $ 3,202 $ 9,281 $ 8,708 $11,715
Net income per share:
Basic . . . . . . . . . . . . . . . . . . . . . . . . . . . . . . . . . . $ 0.14 $ 0.40 $ 0.38 $ 0.52
Diluted . . . . . . . . . . . . . . . . . . . . . . . . . . . . . . . . $ 0.13 $ 0.38 $ 0.36 $ 0.50
Weighted average shares outstanding:
Basic . . . . . . . . . . . . . . . . . . . . . . . . . . . . . . . . . . 22,790 23,097 23,041 22,747
Diluted . . . . . . . . . . . . . . . . . . . . . . . . . . . . . . . . 23,445 23,845 23,878 23,407
During the third quarter of fiscal 2008, the Company identified errors of $1.3 million in its fiscal 2007
and 2008 consolidated income tax expense associated with the exercise of incentive stock options and an
additional $0.4 million, net of tax, related to unrealized foreign exchange losses associated with prior periods
going back to the first quarter of fiscal 2007. The Company corrected these errors in the November 30, 2007
results, which had the effect of increasing consolidated income tax expense in the three and nine month peri-
ods ended November 30, 2007 by $1.1 million, increasing other expense by $0.6 million and decreasing
consolidated net income by $1.7 million. The Company does not believe that these adjustments are material to
the consolidated financial statements for the three and nine month periods ended November 30, 2007, to the
fiscal years ended February 29, 2008 and February 28, 2007, or to any prior periods going back to the first
quarter of fiscal 2007, and as a result, has not restated its consolidated financial statements for these periods.
87
STANDARD MICROSYSTEMS CORPORATION AND SUBSIDIARIES
NOTES TO CONSOLIDATED FINANCIAL STATEMENTS
19. QUARTERLY FINANCIAL DATA (UNAUDITED) − (continued)
In the fourth quarter of fiscal 2008, the Company determined that its application of the treasury method
to compute common stock equivalents for diluted net income per share purposes had not been properly calcu-
lated following the adoption of SFAS 123R on March 1, 2006 (first quarter of fiscal 2007). Specifically, the
computation did not include unamortized compensation costs relating to stock options and incorrectly calcu-
lated the tax benefits on outstanding options as assumed proceeds. The effect was to understate the computed
net income per diluted share. The Company deemed the impact on quarterly and annual net income per
diluted share for all reported periods in fiscal 2008 and 2007 to be immaterial. In order to present accurate
data for each of the quarterly periods in fiscal 2008, weighted average diluted shares outstanding and corre-
sponding net income per diluted share have been revised for all quarterly periods in fiscal 2008, as shown in
the table above.
88
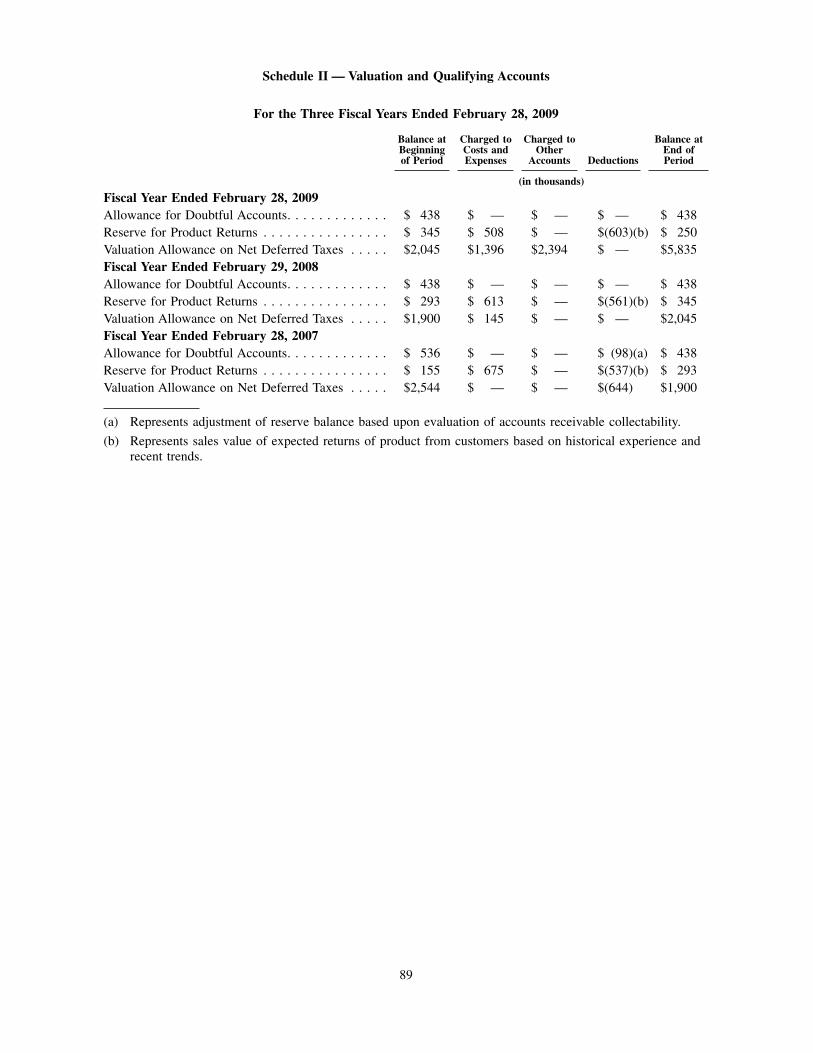
Schedule II — Valuation and Qualifying Accounts
For the Three Fiscal Years Ended February 28, 2009
Balance atBeginningof Period
Charged toCosts andExpenses
Charged toOther
Accounts Deductions
Balance atEnd ofPeriod
(in thousands)
Fiscal Year Ended February 28, 2009Allowance for Doubtful Accounts. . . . . . . . . . . . . $ 438 $ — $ — $ — $ 438
Reserve for Product Returns . . . . . . . . . . . . . . . . $ 345 $ 508 $ — $(603)(b) $ 250
Valuation Allowance on Net Deferred Taxes . . . . . $2,045 $1,396 $2,394 $ — $5,835
Fiscal Year Ended February 29, 2008Allowance for Doubtful Accounts. . . . . . . . . . . . . $ 438 $ — $ — $ — $ 438
Reserve for Product Returns . . . . . . . . . . . . . . . . $ 293 $ 613 $ — $(561)(b) $ 345
Valuation Allowance on Net Deferred Taxes . . . . . $1,900 $ 145 $ — $ — $2,045
Fiscal Year Ended February 28, 2007Allowance for Doubtful Accounts. . . . . . . . . . . . . $ 536 $ — $ — $ (98)(a) $ 438
Reserve for Product Returns . . . . . . . . . . . . . . . . $ 155 $ 675 $ — $(537)(b) $ 293
Valuation Allowance on Net Deferred Taxes . . . . . $2,544 $ — $ — $(644) $1,900
(a) Represents adjustment of reserve balance based upon evaluation of accounts receivable collectability.
(b) Represents sales value of expected returns of product from customers based on historical experience and
recent trends.
89
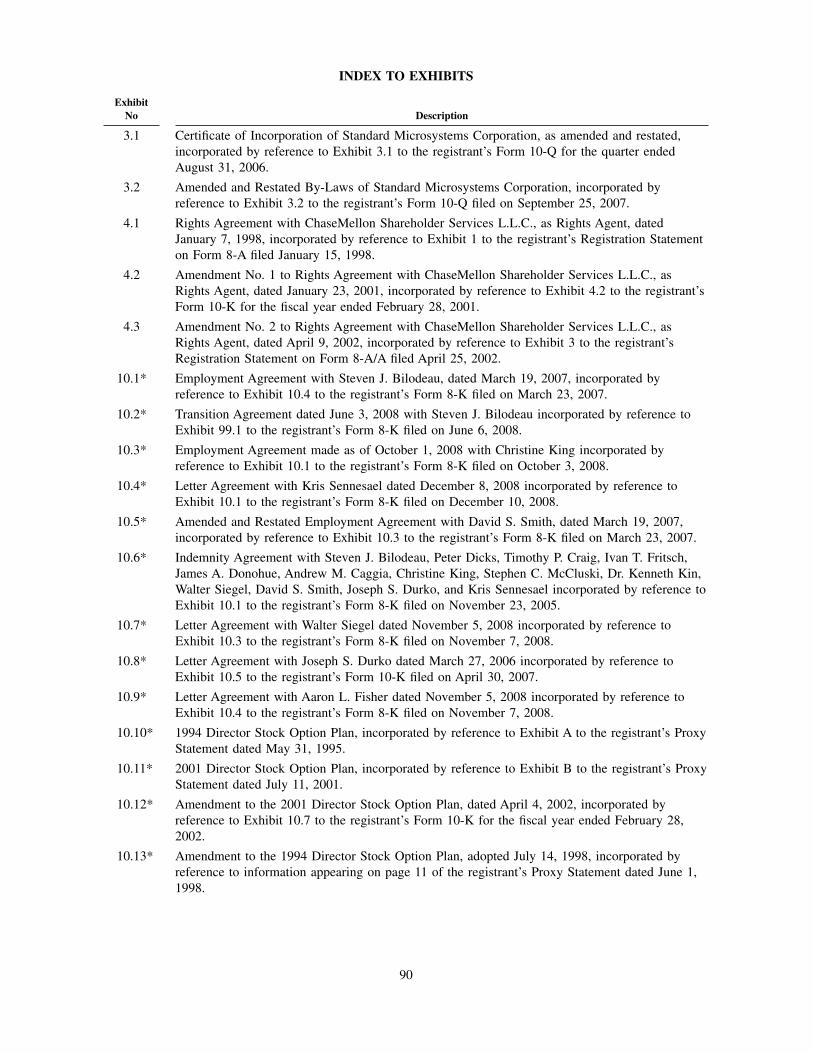
INDEX TO EXHIBITS
ExhibitNo Description
3.1 Certificate of Incorporation of Standard Microsystems Corporation, as amended and restated,
incorporated by reference to Exhibit 3.1 to the registrant’s Form 10-Q for the quarter ended
August 31, 2006.
3.2 Amended and Restated By-Laws of Standard Microsystems Corporation, incorporated by
reference to Exhibit 3.2 to the registrant’s Form 10-Q filed on September 25, 2007.
4.1 Rights Agreement with ChaseMellon Shareholder Services L.L.C., as Rights Agent, dated
January 7, 1998, incorporated by reference to Exhibit 1 to the registrant’s Registration Statement
on Form 8-A filed January 15, 1998.
4.2 Amendment No. 1 to Rights Agreement with ChaseMellon Shareholder Services L.L.C., as
Rights Agent, dated January 23, 2001, incorporated by reference to Exhibit 4.2 to the registrant’s
Form 10-K for the fiscal year ended February 28, 2001.
4.3 Amendment No. 2 to Rights Agreement with ChaseMellon Shareholder Services L.L.C., as
Rights Agent, dated April 9, 2002, incorporated by reference to Exhibit 3 to the registrant’s
Registration Statement on Form 8-A/A filed April 25, 2002.
10.1* Employment Agreement with Steven J. Bilodeau, dated March 19, 2007, incorporated by
reference to Exhibit 10.4 to the registrant’s Form 8-K filed on March 23, 2007.
10.2* Transition Agreement dated June 3, 2008 with Steven J. Bilodeau incorporated by reference to
Exhibit 99.1 to the registrant’s Form 8-K filed on June 6, 2008.
10.3* Employment Agreement made as of October 1, 2008 with Christine King incorporated by
reference to Exhibit 10.1 to the registrant’s Form 8-K filed on October 3, 2008.
10.4* Letter Agreement with Kris Sennesael dated December 8, 2008 incorporated by reference to
Exhibit 10.1 to the registrant’s Form 8-K filed on December 10, 2008.
10.5* Amended and Restated Employment Agreement with David S. Smith, dated March 19, 2007,
incorporated by reference to Exhibit 10.3 to the registrant’s Form 8-K filed on March 23, 2007.
10.6* Indemnity Agreement with Steven J. Bilodeau, Peter Dicks, Timothy P. Craig, Ivan T. Fritsch,
James A. Donohue, Andrew M. Caggia, Christine King, Stephen C. McCluski, Dr. Kenneth Kin,
Walter Siegel, David S. Smith, Joseph S. Durko, and Kris Sennesael incorporated by reference to
Exhibit 10.1 to the registrant’s Form 8-K filed on November 23, 2005.
10.7* Letter Agreement with Walter Siegel dated November 5, 2008 incorporated by reference to
Exhibit 10.3 to the registrant’s Form 8-K filed on November 7, 2008.
10.8* Letter Agreement with Joseph S. Durko dated March 27, 2006 incorporated by reference to
Exhibit 10.5 to the registrant’s Form 10-K filed on April 30, 2007.
10.9* Letter Agreement with Aaron L. Fisher dated November 5, 2008 incorporated by reference to
Exhibit 10.4 to the registrant’s Form 8-K filed on November 7, 2008.
10.10* 1994 Director Stock Option Plan, incorporated by reference to Exhibit A to the registrant’s Proxy
Statement dated May 31, 1995.
10.11* 2001 Director Stock Option Plan, incorporated by reference to Exhibit B to the registrant’s Proxy
Statement dated July 11, 2001.
10.12* Amendment to the 2001 Director Stock Option Plan, dated April 4, 2002, incorporated by
reference to Exhibit 10.7 to the registrant’s Form 10-K for the fiscal year ended February 28,
2002.
10.13* Amendment to the 1994 Director Stock Option Plan, adopted July 14, 1998, incorporated by
reference to information appearing on page 11 of the registrant’s Proxy Statement dated June 1,
1998.
90
ExhibitNo Description
10.14* Retirement Plan for Directors, incorporated by reference to Exhibit 10.14 to the registrant’s
Form 10-K for the fiscal year ended February 28, 1995.
10.15* Amendment to the Retirement Plan for Directors, incorporated by reference to Exhibit 10.11 to
the registrant’s Form 10-K for the fiscal year ended February 28, 2002.
10.16* 1993 Stock Option Plan for Officers and Key Employees, incorporated by reference to Exhibit A
to the registrant’s Proxy Statement dated May 25, 1993.
10.17* 2005 Supplemental Executive Retirement Plan, amended and restated as of January 1, 2008
incorporated by reference to Exhibit 10.1 to the registrants’ Form 8-K filed on November 7,
2008.
10.18* Standard Microsystems Corporation Severance Plan amended and restated as of January 14, 2009
filed herewith.
10.19* Resolutions adopted October 31, 1994, amending the Retirement Plan for Directors and the
Executive Retirement Plan, incorporated by reference to Exhibit 10.18 to the registrant’s
Form 10-K for the fiscal year ended February 28, 1995.
10.20* 1994 Stock Option Plan for Officers and Key Employees, incorporated by reference to Exhibit A
to the registrant’s Proxy Statement dated May 26, 1994.
10.21* Resolutions adopted January 3, 1995, amending the 1994, 1993 and 1989 Stock Option Plans and
the 1991 Restricted Stock Plan, incorporated by reference to Exhibit 10.19 to the registrant’s
Form 10-K for the fiscal year ended February 28, 1995.
10.22* 1996 Stock Option Plan for Officers and Key Employees, incorporated by reference to Exhibit A
to the registrant’s proxy statement dated June 21, 1996 for Officers and Key Employees.
10.23* 1998 Stock Option Plan for Officers and Key Employees, incorporated by reference to Exhibit A
to the registrant’s Proxy Statement dated June 1, 1998.
10.24* 1999 Stock Option Plan for Officers and Key Employees, incorporated by reference to Exhibit A
to the registrant’s Proxy Statement dated June 9, 1999.
10.25* 2000 Stock Option Plan for Officers and Key Employees, incorporated by reference to Exhibit A
to the registrant’s Proxy Statement dated June 6, 2000.
10.26* 2001 Stock Option and Restricted Stock Plan for Officers and Key Employees, incorporated by
reference to Exhibit C to the registrant’s Proxy Statement dated June 11, 2001.
10.27* Resolutions adopted April 7, 2004, amending the 1999 and 2000 Stock Option Plans and the
2001 and 2003 Stock Option and Restricted Stock Plans, incorporated by reference to Exhibit
10.1 to the registrant’s Form 10-Q for the quarterly period ended August 31, 2004.
10.28* Standard Microsystems Corporation plan for Deferred Compensation in Common Stock for
outside Directors as amended on September 11, 2008 incorporated by reference to Exhibit 10.4
to the registrant’s Form 10-Q filed on October 3, 2008.
10.29* 2002 Inducement Stock Option Plan, incorporated by reference to Exhibit 10.26 to the
registrant’s Form 10-K for the fiscal year ended February 28, 2003.
10.30* 2003 Director Stock Option Plan, incorporated by reference to Exhibit C to the registrant’s Proxy
Statement dated July 9, 2003.
10.31* 2003 Stock Option and Restricted Stock Plan, incorporated by reference to Exhibit B to the
registrant’s Proxy Statement dated July 9, 2003.
10.32* 2003 Inducement Stock Option Plan, incorporated by reference to Exhibit 4.3 to the registrant’s
Form S-8 filed September 15, 2003.
10.33* 2004 Employee Stock Appreciation Rights Plan, incorporated by reference to Exhibit 10.1 to the
registrant’s Form 8-K filed on October 1, 2004.
91
ExhibitNo Description
10.34* 2004 Inducement Stock Option Plan, incorporated by reference to Exhibit 4.1 to the registrant’s
Form S-8 filed on July 17, 2005.
10.35* 2005 Director Stock Appreciation Rights Plan, incorporated by reference to Exhibit 10.1 to the
registrant’s Form 10-Q filed on October 11, 2005.
10.36* 2005 Inducement Stock Option and Restricted Stock Plan of Standard Microsystems Corporation,
as amended on September 9, 2005, incorporated by reference to Exhibit 10.2 to the registrant’s
Form 8-K filed on October 26, 2005.
10.37* The amendment of the 1993 Stock Option Plan for Officers and Key Employees, 1994 Stock
Option Plan for Officers and Key Employees, 1996 Stock Option Plan for Officers and Key
Employees, 1998 Stock Option Plan for Officers and Key Employees, 1999 Stock Option Plan
for Officers and Key Employees, 2000 Stock Option Plan for Officers and Key Employees, 2001
Stock Option and Restricted Stock Plan of Standard Microsystems Corporation, 2003 Stock
Option and Restricted Stock Plan and 2005 Inducement Stock Option and Restricted Stock Plan
of Standard Microsystems Corporation incorporated by reference to Exhibit 10.1 to the
registrant’s Form 10-Q filed on December 21, 2007.
10.38* Standard Microsystems Corporation 2006 Directors Stock Appreciation Rights Plan, as adopted
on July 11, 2006, incorporated by reference to Exhibit 10.1 to the Registrant’s 8-K filed on
July 14, 2006.
10.39* Amendment to Standard Microsystems Corporation 2006 Directors Stock Appreciation Rights
Plan, dated April 9, 2008, incorporated by reference to Exhibit 10.39 to the registrant’s
Form 10-K filed on April 29, 2008.
10.40* 2006 Employee Stock Appreciation Rights Plan, as adopted on September 1, 2006, incorporated
by reference to Exhibit 10.1 to the registrant’s Form 8-K filed on September 1, 2006.
10.41* Amendment to Standard Microsystems Corporation 2006 Employee Stock Appreciation Rights
Plan, incorporated by reference to Exhibit 10.2 to the registrant’s Form 8-K filed on April 30,
2008.
10.42* April 9, 2007 Amendment to the 2005 Inducement Stock Option and Restricted Stock Plan of
Standard Microsystems Corporation incorporated by reference to Exhibit 10.38 to the registrant’s
Form 10-K filed on April 30, 2007.
10.43* Amendment to 2005 Inducement Stock Option Plan and Restricted Stock Plan of Standard
Microsystems Corporation, incorporated by reference to Exhibit 10.3 to the registrant’s Form 8-K
filed on April 30, 2008.
10.44* Resolution adopted to modify compensation provided to non-employee directors, dated Decem-
ber 21, 2004, incorporated by reference to Item 1.01 in the registrant’s Form 8-K filed on
December 23, 2004.
10.45* Form of fiscal year 2009 Management Incentive Plan, incorporated by reference to Exhibit 10.1
to the registrant’s Form 8-K filed on April 30, 2008.
10.46* Standard Microsystems Corporation Management Incentive Plan, incorporated by reference to
Exhibit 10.1 to the registrant’s Form 8-K filed on April 15, 2009.
10.47 Agreement and Plan of Merger among Standard Microsystems Corporation, SMSC Sub, Inc., and
Gain Technology Corporation, dated April 29, 2002, incorporated by reference to Exhibit 2.1 to
the registrant’s Form 8-K filed on June 19, 2002.
10.48 Share Purchase Agreement by and among Standard Microsystems Corporation, SMSC GmbH and
the Shareholders of OASIS Silicon Systems Holding AG, dated March 30, 2005, incorporated by
reference to Exhibit 2.1 to the registrant’s Form 8-K filed on April 5, 2005.
21. Subsidiaries of the Registrant incorporated by reference to Exhibit 21 to the registrant’s
Form 10-K filed on April 30, 2007.
92
ExhibitNo Description
23.1 Consent of PricewaterhouseCoopers LLP, filed herewith.
31.1 Certification of Chief Executive Officer Pursuant to Rule 13a-14(a) of the Securities Exchange
Act, filed herewith.
31.2 Certification of Chief Financial Officer Pursuant to Rule 13a-14(a) of the Securities Exchange
Act, filed herewith.
32.1 Certification of Chief Executive Officer and Chief Financial Officer Pursuant to 18 U.S.C.
Section 1350, as adopted pursuant to Section 906 of the Sarbanes-Oxley Act of 2002, filed
herewith.
* Indicates a management or compensatory plan or arrangement.
93

[This page intentionally left blank.]
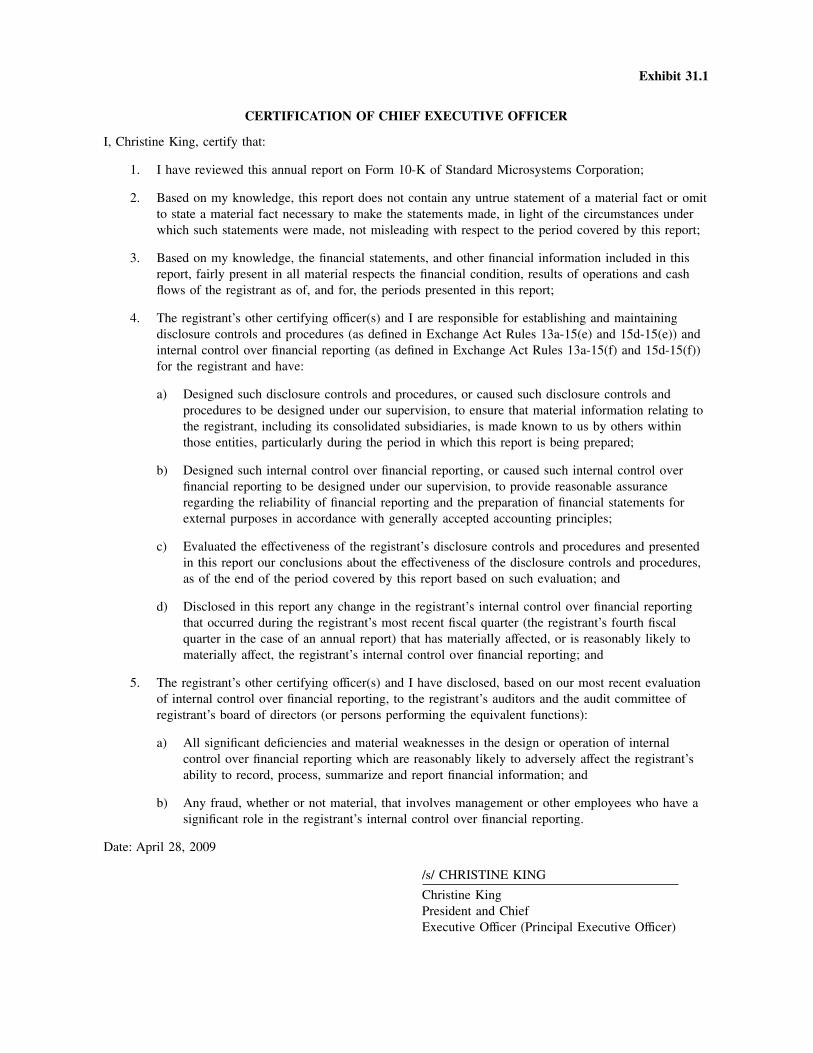
Exhibit 31.1
CERTIFICATION OF CHIEF EXECUTIVE OFFICER
I, Christine King, certify that:
1. I have reviewed this annual report on Form 10-K of Standard Microsystems Corporation;
2. Based on my knowledge, this report does not contain any untrue statement of a material fact or omit
to state a material fact necessary to make the statements made, in light of the circumstances under
which such statements were made, not misleading with respect to the period covered by this report;
3. Based on my knowledge, the financial statements, and other financial information included in this
report, fairly present in all material respects the financial condition, results of operations and cash
flows of the registrant as of, and for, the periods presented in this report;
4. The registrant’s other certifying officer(s) and I are responsible for establishing and maintaining
disclosure controls and procedures (as defined in Exchange Act Rules 13a-15(e) and 15d-15(e)) and
internal control over financial reporting (as defined in Exchange Act Rules 13a-15(f) and 15d-15(f))
for the registrant and have:
a) Designed such disclosure controls and procedures, or caused such disclosure controls and
procedures to be designed under our supervision, to ensure that material information relating to
the registrant, including its consolidated subsidiaries, is made known to us by others within
those entities, particularly during the period in which this report is being prepared;
b) Designed such internal control over financial reporting, or caused such internal control over
financial reporting to be designed under our supervision, to provide reasonable assurance
regarding the reliability of financial reporting and the preparation of financial statements for
external purposes in accordance with generally accepted accounting principles;
c) Evaluated the effectiveness of the registrant’s disclosure controls and procedures and presented
in this report our conclusions about the effectiveness of the disclosure controls and procedures,
as of the end of the period covered by this report based on such evaluation; and
d) Disclosed in this report any change in the registrant’s internal control over financial reporting
that occurred during the registrant’s most recent fiscal quarter (the registrant’s fourth fiscal
quarter in the case of an annual report) that has materially affected, or is reasonably likely to
materially affect, the registrant’s internal control over financial reporting; and
5. The registrant’s other certifying officer(s) and I have disclosed, based on our most recent evaluation
of internal control over financial reporting, to the registrant’s auditors and the audit committee of
registrant’s board of directors (or persons performing the equivalent functions):
a) All significant deficiencies and material weaknesses in the design or operation of internal
control over financial reporting which are reasonably likely to adversely affect the registrant’s
ability to record, process, summarize and report financial information; and
b) Any fraud, whether or not material, that involves management or other employees who have a
significant role in the registrant’s internal control over financial reporting.
Date: April 28, 2009
/s/ CHRISTINE KING
Christine King
President and Chief
Executive Officer (Principal Executive Officer)
Exhibit 31.2
CERTIFICATION OF CHIEF FINANCIAL OFFICER
I, Kris Sennesael, certify that:
1. I have reviewed this annual report on Form 10-K of Standard Microsystems Corporation;
2. Based on my knowledge, this report does not contain any untrue statement of a material fact or omit
to state a material fact necessary to make the statements made, in light of the circumstances under
which such statements were made, not misleading with respect to the period covered by this report;
3. Based on my knowledge, the financial statements, and other financial information included in this
report, fairly present in all material respects the financial condition, results of operations and cash
flows of the registrant as of, and for, the periods presented in this report;
4. The registrant’s other certifying officer(s) and I are responsible for establishing and maintaining
disclosure controls and procedures (as defined in Exchange Act Rules 13a-15(e) and 15d-15(e)) and
internal control over financial reporting (as defined in Exchange Act Rules 13a-15(f) and 15d-15(f))
for the registrant and have:
a) Designed such disclosure controls and procedures, or caused such disclosure controls and
procedures to be designed under our supervision, to ensure that material information relating to
the registrant, including its consolidated subsidiaries, is made known to us by others within
those entities, particularly during the period in which this report is being prepared;
b) Designed such internal control over financial reporting, or caused such internal control over
financial reporting to be designed under our supervision, to provide reasonable assurance
regarding the reliability of financial reporting and the preparation of financial statements for
external purposes in accordance with generally accepted accounting principles;
c) Evaluated the effectiveness of the registrant’s disclosure controls and procedures and presented
in this report our conclusions about the effectiveness of the disclosure controls and procedures,
as of the end of the period covered by this report based on such evaluation; and
d) Disclosed in this report any change in the registrant’s internal control over financial reporting
that occurred during the registrant’s most recent fiscal quarter (the registrant’s fourth fiscal
quarter in the case of an annual report) that has materially affected, or is reasonably likely to
materially affect, the registrant’s internal control over financial reporting; and
5. The registrant’s other certifying officer(s) and I have disclosed, based on our most recent evaluation
of internal control over financial reporting, to the registrant’s auditors and the audit committee of
registrant’s board of directors (or persons performing the equivalent functions):
a) All significant deficiencies and material weaknesses in the design or operation of internal
control over financial reporting which are reasonably likely to adversely affect the registrant’s
ability to record, process, summarize and report financial information; and
b) Any fraud, whether or not material, that involves management or other employees who have a
significant role in the registrant’s internal control over financial reporting.
DATE: April 28, 2009
By: /s/ KRIS SENNESAEL
(Signature)
Kris Sennesael
Vice President and Chief Financial Officer
(Principal Financial Officer)
Exhibit 32.1
CERTIFICATION
Pursuant to Section 906 of the Sarbanes-Oxley Act of 2002 (subsections (a) and (b) of Section 1350,
Chapter 63 of Title 18, United States Code), each of the undersigned officers of Standard Microsystems Cor-
poration (the Company), does hereby certify, to such officer’s knowledge, that:
(a) the Annual Report on Form 10-K for the fiscal year ended February 28, 2009 of the Company fully
complies, in all material respects, with the requirements of section 13(a) or 15(d) of the Securities
Exchange Act of 1934, and
(b) information contained in the Form 10-K fairly presents, in all material respects, the financial condi-
tion and results of operations of the Company.
Dated: April 28, 2009
By: /s/ CHRISTINE KING
(Signature)
Christine King
President and Chief Executive Officer
(Principal Executive Officer)
By: /s/ KRIS SENNESAEL
(Signature)
Kris Sennesael
Vice President and Chief Financial Officer
(Principal Financial Officer)

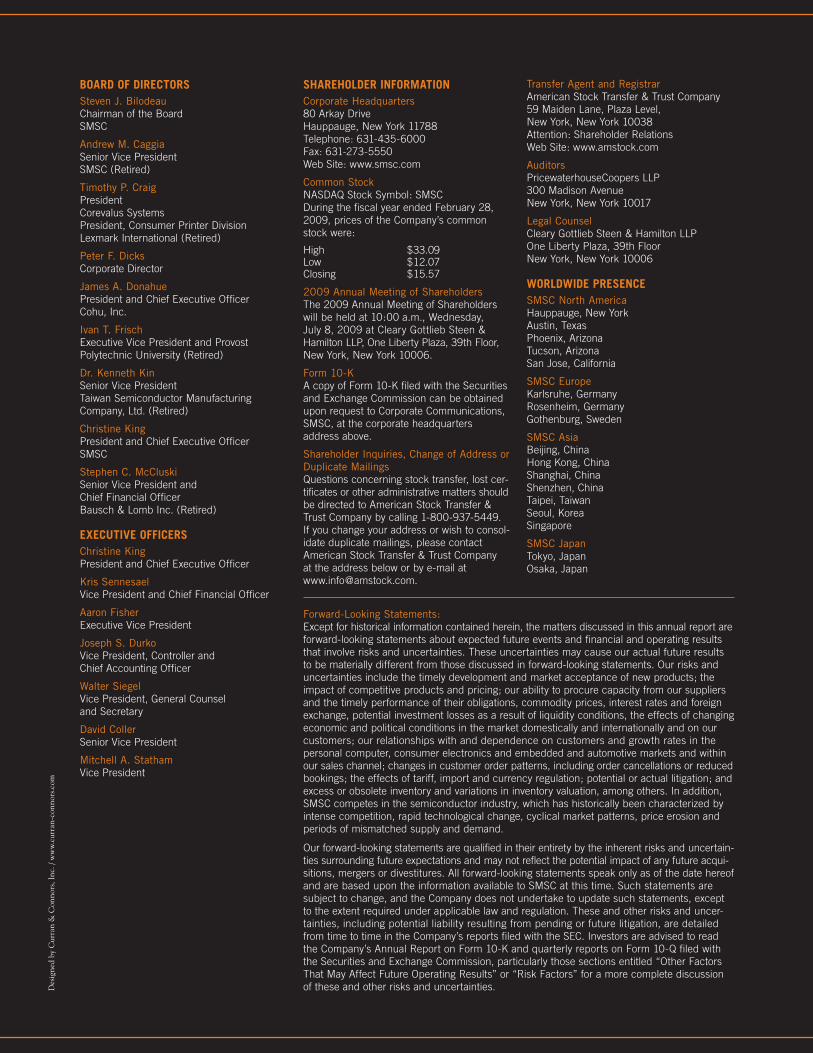
BOArd Of dIreCTOrSSteven J. BilodeauChairman of the BoardSMSC
Andrew M. CaggiaSenior Vice PresidentSMSC (Retired)
Timothy P. CraigPresidentCorevalus SystemsPresident, Consumer Printer DivisionLexmark International (Retired)
Peter F. DicksCorporate Director
James A. DonahuePresident and Chief Executive OfficerCohu, Inc.
Ivan T. FrischExecutive Vice President and ProvostPolytechnic University (Retired)
Dr. Kenneth KinSenior Vice PresidentTaiwan Semiconductor Manufacturing Company, Ltd. (Retired)
Christine KingPresident and Chief Executive OfficerSMSC
Stephen C. McCluskiSenior Vice President and Chief Financial Officer Bausch & Lomb Inc. (Retired)
eXeCUTIVe OffICerSChristine KingPresident and Chief Executive Officer
Kris SennesaelVice President and Chief Financial Officer
Aaron FisherExecutive Vice President
Joseph S. DurkoVice President, Controller andChief Accounting Officer
Walter SiegelVice President, General Counsel and Secretary
David CollerSenior Vice President
Mitchell A. StathamVice President
SHAreHOLder INfOrMATIONCorporate Headquarters80 Arkay DriveHauppauge, New York 11788Telephone: 631-435-6000Fax: 631-273-5550Web Site: www.smsc.com
Common StockNASDAQ Stock Symbol: SMSCDuring the fiscal year ended February 28, 2009, prices of the Company’s common stock were:
High $ 33.09Low $ 12.07Closing $ 15.57
2009 Annual Meeting of ShareholdersThe 2009 Annual Meeting of Shareholders will be held at 10:00 a.m., Wednesday, July 8, 2009 at Cleary Gottlieb Steen & Hamilton LLP, One Liberty Plaza, 39th Floor, New York, New York 10006.
Form 10-KA copy of Form 10-K filed with the Securities and Exchange Commission can be obtained upon request to Corporate Communications, SMSC, at the corporate headquarters address above.
Shareholder Inquiries, Change of Address or Duplicate Mailings Questions concerning stock transfer, lost cer-tificates or other administrative matters should be directed to American Stock Transfer & Trust Company by calling 1-800-937-5449. If you change your address or wish to consol-idate duplicate mailings, please contact American Stock Transfer & Trust Company at the address below or by e-mail at [email protected].
Transfer Agent and RegistrarAmerican Stock Transfer & Trust Company59 Maiden Lane, Plaza Level, New York, New York 10038Attention: Shareholder RelationsWeb Site: www.amstock.com
AuditorsPricewaterhouseCoopers LLP300 Madison Avenue New York, New York 10017
Legal CounselCleary Gottlieb Steen & Hamilton LLPOne Liberty Plaza, 39th Floor New York, New York 10006
WOrLdWIde PreSeNCeSMSC North AmericaHauppauge, New YorkAustin, TexasPhoenix, ArizonaTucson, ArizonaSan Jose, California
SMSC EuropeKarlsruhe, GermanyRosenheim, GermanyGothenburg, Sweden
SMSC AsiaBeijing, ChinaHong Kong, ChinaShanghai, ChinaShenzhen, ChinaTaipei, TaiwanSeoul, KoreaSingapore
SMSC JapanTokyo, JapanOsaka, Japan
Des
igne
d by
Cur
ran
& C
onno
rs, I
nc. /
ww
w.c
urra
n-co
nnor
s.com
Forward-Looking Statements:Except for historical information contained herein, the matters discussed in this annual report are forward-looking statements about expected future events and financial and operating results that involve risks and uncertainties. These uncertainties may cause our actual future results to be materially different from those discussed in forward-looking statements. Our risks and uncertainties include the timely development and market acceptance of new products; the impact of competitive products and pricing; our ability to procure capacity from our suppliers and the timely performance of their obligations, commodity prices, interest rates and foreign exchange, potential investment losses as a result of liquidity conditions, the effects of changing economic and political conditions in the market domestically and internationally and on our customers; our relationships with and dependence on customers and growth rates in the personal computer, consumer electronics and embedded and automotive markets and within our sales channel; changes in customer order patterns, including order cancellations or reduced bookings; the effects of tariff, import and currency regulation; potential or actual litigation; and excess or obsolete inventory and variations in inventory valuation, among others. In addition, SMSC competes in the semiconductor industry, which has historically been characterized by intense competition, rapid technological change, cyclical market patterns, price erosion and periods of mismatched supply and demand.
Our forward-looking statements are qualified in their entirety by the inherent risks and uncertain-ties surrounding future expectations and may not reflect the potential impact of any future acqui-sitions, mergers or divestitures. All forward-looking statements speak only as of the date hereof and are based upon the information available to SMSC at this time. Such statements are subject to change, and the Company does not undertake to update such statements, except to the extent required under applicable law and regulation. These and other risks and uncer-tainties, including potential liability resulting from pending or future litigation, are detailed from time to time in the Company’s reports filed with the SEC. Investors are advised to read the Company’s Annual Report on Form 10-K and quarterly reports on Form 10-Q filed with the Securities and Exchange Commission, particularly those sections entitled “Other Factors That May Affect Future Operating Results” or “Risk Factors” for a more complete discussion of these and other risks and uncertainties.
80 Arkay Drive Hauppauge, New York 11788 Phone: 631-435-6000 Fax: 631-273-5550 www.smsc.com