Embed Size (px)
Citation preview
the association for medicalimaging management
20092009 StaffStaffUtilization SurveyUtilization Survey
the association for medical imaging management
2009 Staff Utilization Survey
This survey was made possible through funding from AGFA HealthCare.
© 2009 AHRA The Association for Medical Imaging Management

Table of Contents
i
Findings
About This Research ...................................................................... 1
Facility and Procedures Profile....................................................... 3
Technologies Utilized................................................................... 11
Mobile Services and Transportation............................................. 18
Staffing Profile ............................................................................. 21
Trends........................................................................................... 32
FTE Staffing Tables
Administration.............................................................................S-1
General Radiography...................................................................S-2
CT................................................................................................S-3
PET..............................................................................................S-4
Ultrasound and/or Vascular Ultrasound ......................................S-5
Nuclear Medicine ........................................................................S-6
MRI .............................................................................................S-7
Radiation Therapy .......................................................................S-8
Mammography ............................................................................S-9
Interventional/Angiography.......................................................S-10
Cardiac Cath Radiology.............................................................S-11
Hours of Operations Tables
General Radiography.................................................................. H-1
CT............................................................................................... H-4
PET............................................................................................. H-7
Ultrasound and/or Vascular Ultrasound ................................... H-10
Nuclear Medicine - Imaging..................................................... H-13
Nuclear Medicine - In-Vitro ..................................................... H-16
Nuclear Medicine - Radioassay ................................................ H-19
MRI .......................................................................................... H-22
Radiation Therapy - Treatments ............................................... H-25
Radiation Therapy - Simulation ............................................... H-28
Mammography ......................................................................... H-31
Interventional/Angiography...................................................... H-34
Cardiac Cath Radiology............................................................ H-37
Procedure Volume Tables
General Radiography...................................................................P-1
CT................................................................................................P-5
PET..............................................................................................P-9
Ultrasound and/or Vascular Ultrasound ....................................P-13
Nuclear Medicine - Imaging......................................................P-17
Nuclear Medicine - In-Vitro ......................................................P-21
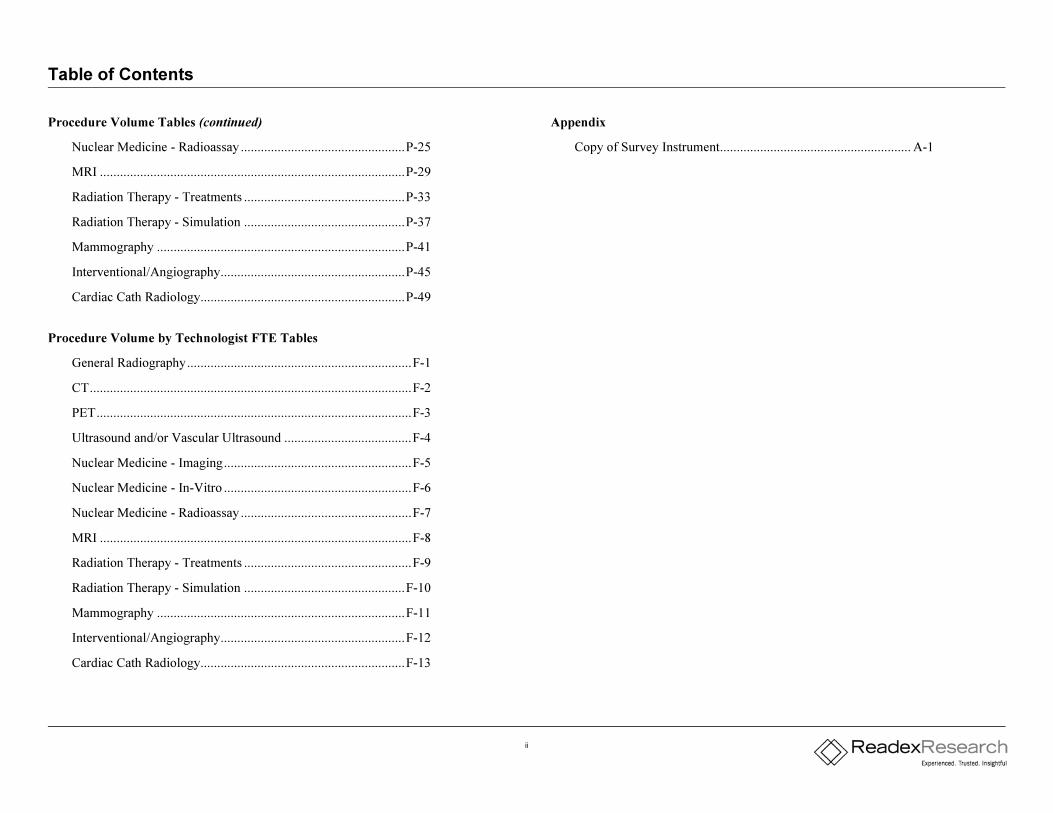
Table of Contents
ii
Procedure Volume Tables (continued)
Nuclear Medicine - Radioassay .................................................P-25
MRI ...........................................................................................P-29
Radiation Therapy - Treatments ................................................P-33
Radiation Therapy - Simulation ................................................P-37
Mammography ..........................................................................P-41
Interventional/Angiography.......................................................P-45
Cardiac Cath Radiology.............................................................P-49
Procedure Volume by Technologist FTE Tables
General Radiography...................................................................F-1
CT................................................................................................F-2
PET..............................................................................................F-3
Ultrasound and/or Vascular Ultrasound ......................................F-4
Nuclear Medicine - Imaging........................................................F-5
Nuclear Medicine - In-Vitro ........................................................F-6
Nuclear Medicine - Radioassay ...................................................F-7
MRI .............................................................................................F-8
Radiation Therapy - Treatments ..................................................F-9
Radiation Therapy - Simulation ................................................F-10
Mammography ..........................................................................F-11
Interventional/Angiography.......................................................F-12
Cardiac Cath Radiology.............................................................F-13
Appendix
Copy of Survey Instrument......................................................... A-1
FINDINGS
FINDINGS: About This Research
AHRA 2009 Staff Utilization Survey 1
About This Study
This Internet survey of emailable imaging professionals was conducted on behalf of
AHRA: The Association of Medical Imaging Management to develop a profile of
the staffing and capabilities at facilities engaged in the imaging professions. It was
conducted by Readex Research, an independent research firm.
The survey was designed jointly by AHRA and Readex, building on a similar effort
undertaken by AHRA in 2006. The invitation to participate was emailed to all 9384
sample members (including both AHRA members and nonmembers). Data was
collected via the Internet between April 8 and April 30, 2009.
A total of 328 sample members responded (4% response rate, based on the net
effective mail out). Because a significant fraction of those invited to participate
chose not to do so, the possible effects of nonresponse bias on these results should be
considered. Percentages based on all 328 responses are subject to a margin of error
of ±5.3% at the 95% confidence level. Percentages calculated on smaller tabulation
bases are subject to more statistical variability.
About This Report
This initial Findings section provides a graphical summary of key survey results.
The Tables section of the report presents 4 sets of survey results, broken out by a
number of variables.
The Appendix provides a copy of the survey instrument itself.
For the purposes of this survey, the term procedure indicates imaging exams
performed by a facility during the most recently completed fiscal year. Survey
participants were asked to answer for the number of procedures, not the number of
patients. For example, if a total of 300 procedures were performed during the
treatment of 100 patients, the answer would be 300.
The term full time equivalent (FTE) was considered to work 40 or more hours per
week, or at least 2080 hours per year.
This report was prepared for AHRA by Readex in accordance with accepted research
standards and practices. This report contains all survey results that were provided to
AHRA.
FINDINGS: About This Research
AHRA 2009 Staff Utilization Survey 2
Data Interpretation
In addition to percentages, 3 summary statistics may be presented in this report for
numeric variables.
A mean is the arithmetic average of a distribution (ie, a set of values). Because it is
arithmetically calculated, it can be multiplied by the population represented to
present a total volume estimate. For example, if 100 survey respondents
(representing 10,000 people in the population) reported mean expenditures of $100
each, total expenditures for that population are estimated as 10,000 x $100 =
$1,000,000. Means are very much influenced by extremely large or extremely small
values in the distribution (eg, one millionaire can substantially raise an estimate of
average income).
Means for grouped data are calculated using the midpoint of each range. The lowest
valued group is represented by its largest value; the highest valued group by its
lowest.
The standard error measures the variability associated with the survey's estimate of a
population mean. The standard error is analogous to the margin of error associated
with percentages: that is, 95% of the time we expect the true (unknown) population
mean to be within plus-or-minus 2 standard errors of the mean calculated from the
sample. A standard error that is large in proportion to the mean indicates a high level
of statistical instability; trending and projections against such estimates should be
undertaken cautiously.
A median is the value which lies at the middle of a distribution: that is, 50% of the
values are above it and 50% are below. It represents the “typical” response, and is
not influenced by extreme values. For most distributions, the median will be either
roughly equal to or significantly smaller than the mean.
Medians for grouped data are calculated by locating the group which contains the
50th percentile, then interpolating between the lower and upper bounds to estimate
the precise value.
About Readex Research
Readex Research is a nationally recognized independent research company located
in Stillwater, MN. Its roots are in survey research for the magazine publishing
industry, but specialization in conducting high-quality survey research (by mail
and/or the Internet) has brought clients from many other markets, including
associations, corporate marketers and communicators, and government agencies.
Since its founding in 1947, Readex has completed thousands of surveys for a lengthy
and diverse list of clients.
As a full-service survey research supplier, Readex provides in-house processing of
all phases of each project (traditional mailing, broadcast emailing, and data
processing) to ensure complete control over project quality and schedule. Analytical
capabilities include a range of multivariate statistics and modeling techniques, in
addition to the more traditional stub-and-banner tabulations.
This survey was conducted and this report was prepared by Readex in accordance
with accepted research standards and practices. A complete report containing all
survey results was provided to AHRA.
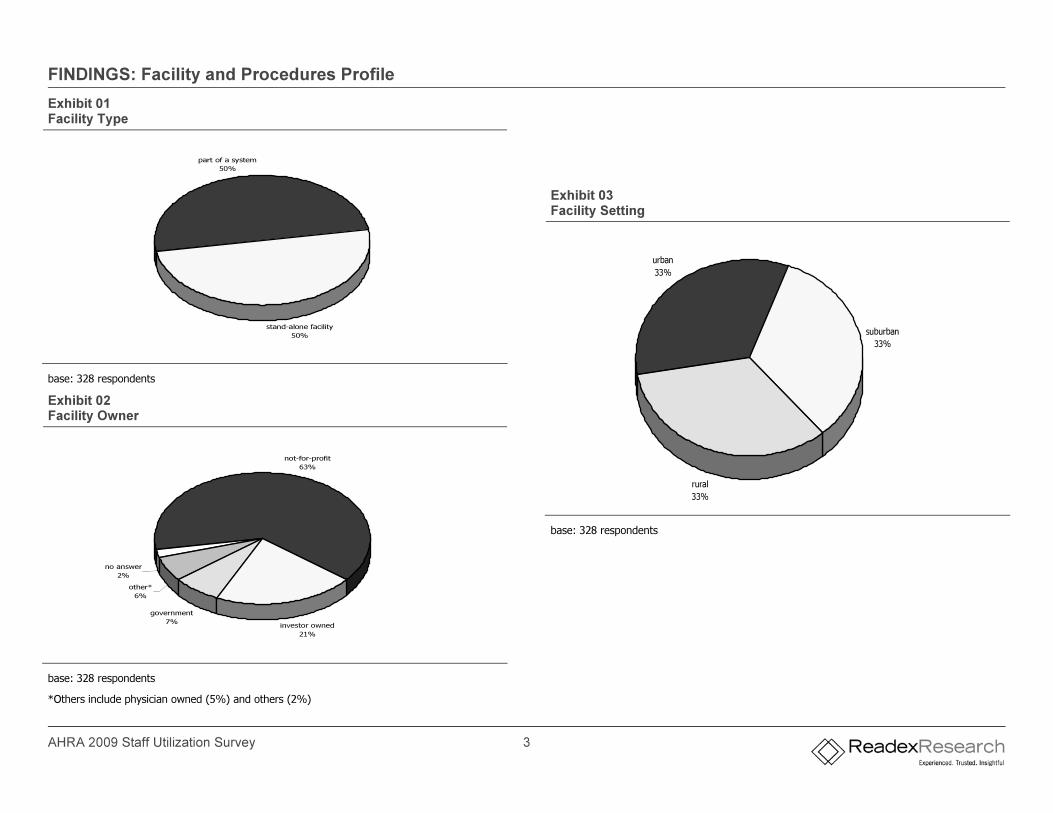
FINDINGS: Facility and Procedures Profile
AHRA 2009 Staff Utilization Survey 3
Exhibit 01 Facility Type
part of a system
50%
stand-alone facility
50%
base: 328 respondents
Exhibit 02 Facility Owner
not-for-profit
63%
investor owned
21%
government
7%
other*
6%
no answer
2%
base: 328 respondents
*Others include physician owned (5%) and others (2%)
Exhibit 03 Facility Setting
urban
33%
suburban
33%
rural
33%
base: 328 respondents
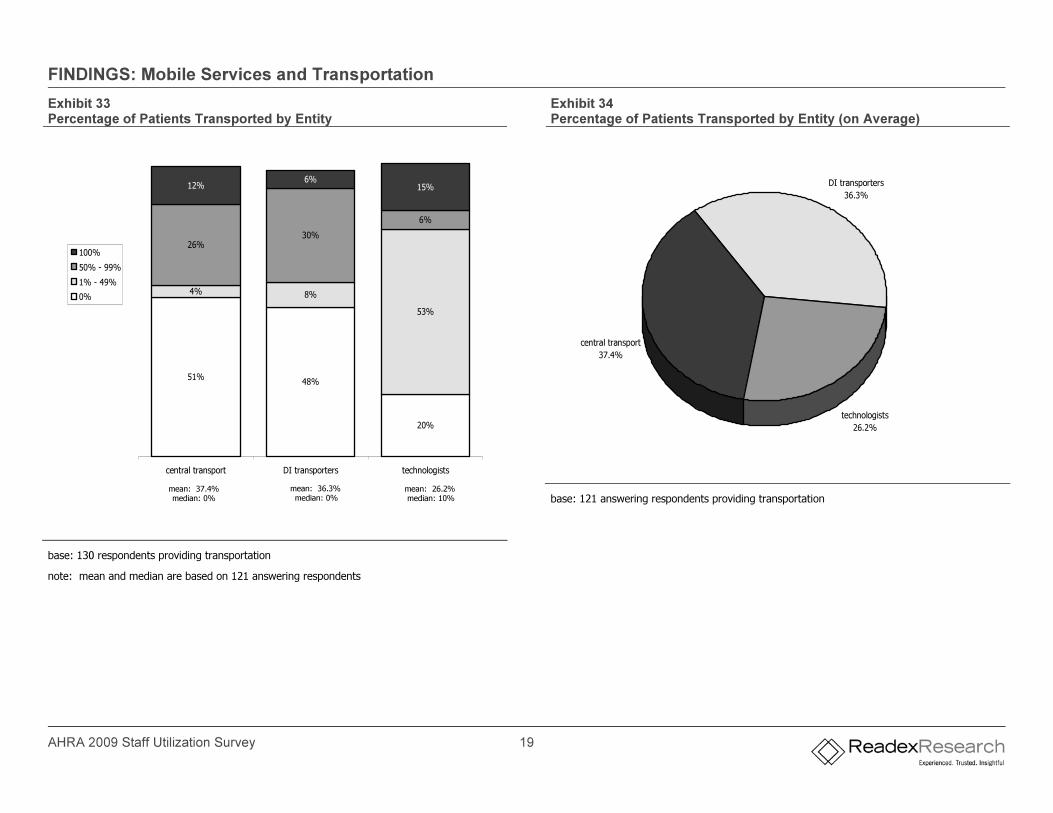
FINDINGS: Mobile Services and Transportation
AHRA 2009 Staff Utilization Survey 19
Exhibit 33 Percentage of Patients Transported by Entity
51%48%
20%
4% 8%
53%
26%30%
6%
15%6%
12%
central transport DI transporters technologists
100%
50% - 99%
1% - 49%
0%
base: 130 respondents providing transportation
note: mean and median are based on 121 answering respondents
Exhibit 34 Percentage of Patients Transported by Entity (on Average)
central transport
37.4%
DI transporters
36.3%
technologists
26.2%
base: 121 answering respondents providing transportation
mean: 37.4% median: 0%
mean: 36.3% median: 0%
mean: 26.2% median: 10%
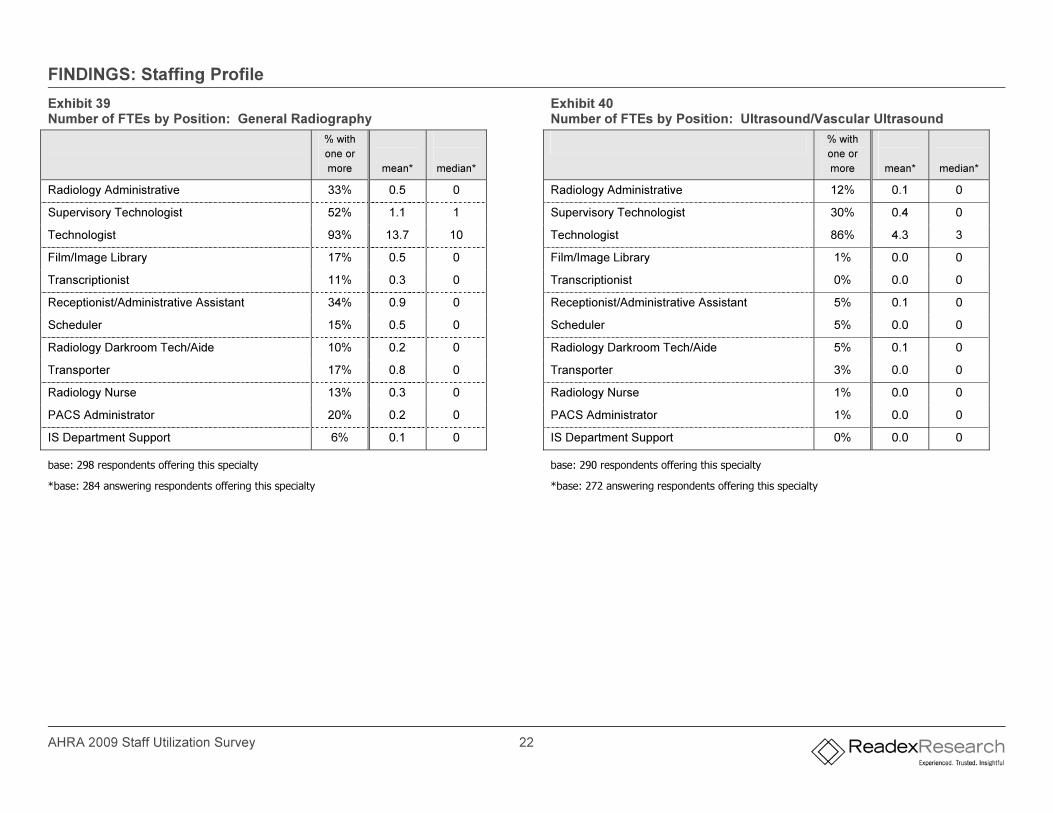
FINDINGS: Staffing Profile
AHRA 2009 Staff Utilization Survey 22
Exhibit 39 Number of FTEs by Position: General Radiography
% with
one or
more
mean*
median*
Radiology Administrative 33% 0.5 0
Supervisory Technologist 52% 1.1 1
Technologist 93% 13.7 10
Film/Image Library 17% 0.5 0
Transcriptionist 11% 0.3 0
Receptionist/Administrative Assistant 34% 0.9 0
Scheduler 15% 0.5 0
Radiology Darkroom Tech/Aide 10% 0.2 0
Transporter 17% 0.8 0
Radiology Nurse 13% 0.3 0
PACS Administrator 20% 0.2 0
IS Department Support 6% 0.1 0
base: 298 respondents offering this specialty
*base: 284 answering respondents offering this specialty
Exhibit 40 Number of FTEs by Position: Ultrasound/Vascular Ultrasound
% with
one or
more
mean*
median*
Radiology Administrative 12% 0.1 0
Supervisory Technologist 30% 0.4 0
Technologist 86% 4.3 3
Film/Image Library 1% 0.0 0
Transcriptionist 0% 0.0 0
Receptionist/Administrative Assistant 5% 0.1 0
Scheduler 5% 0.0 0
Radiology Darkroom Tech/Aide 5% 0.1 0
Transporter 3% 0.0 0
Radiology Nurse 1% 0.0 0
PACS Administrator 1% 0.0 0
IS Department Support 0% 0.0 0
base: 290 respondents offering this specialty
*base: 272 answering respondents offering this specialty
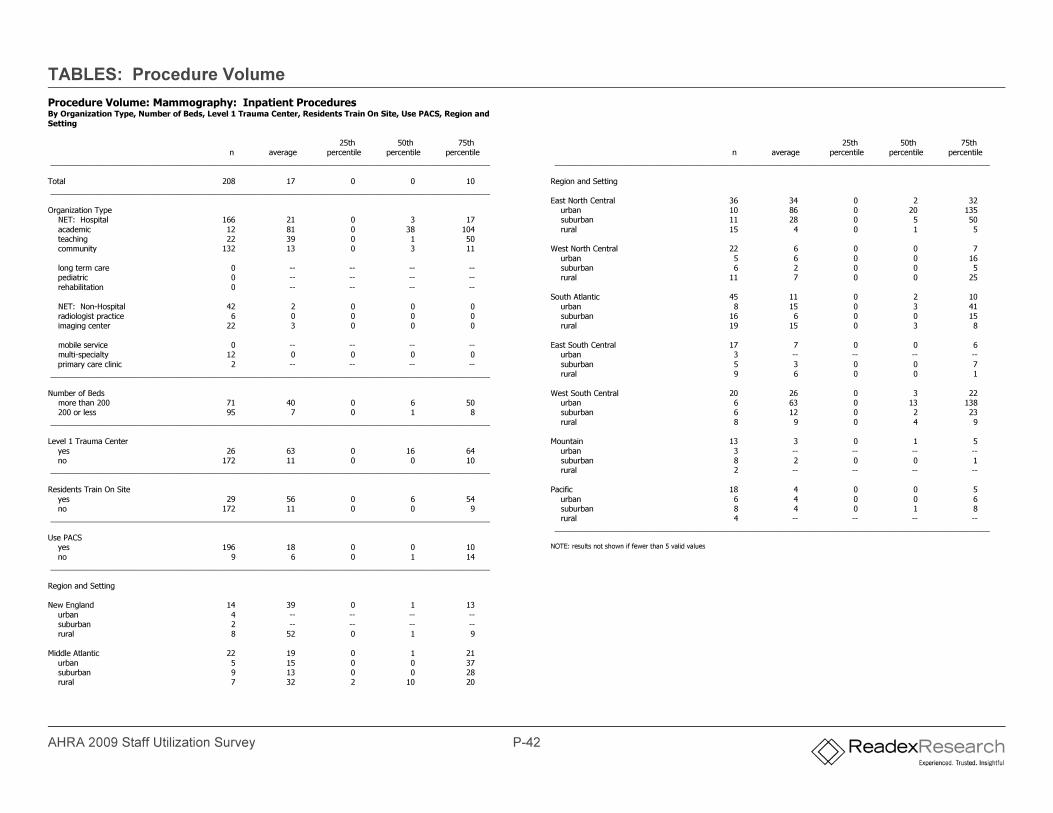
TABLES: Procedure Volume
AHRA 2009 Staff Utilization Survey P-42
Procedure Volume: Mammography: Inpatient Procedures By Organization Type, Number of Beds, Level 1 Trauma Center, Residents Train On Site, Use PACS, Region and
Setting
25th 50th 75th
n average percentile percentile percentile ______________________________________________________________________________________________________
Total 208 17 0 0 10
______________________________________________________________________________________________________
Organization Type NET: Hospital 166 21 0 3 17
academic 12 81 0 38 104 teaching 22 39 0 1 50
community 132 13 0 3 11
long term care 0 -- -- -- -- pediatric 0 -- -- -- --
rehabilitation 0 -- -- -- --
NET: Non-Hospital 42 2 0 0 0
radiologist practice 6 0 0 0 0
imaging center 22 3 0 0 0
mobile service 0 -- -- -- --
multi-specialty 12 0 0 0 0
primary care clinic 2 -- -- -- --
______________________________________________________________________________________________________
Number of Beds
more than 200 71 40 0 6 50
200 or less 95 7 0 1 8
______________________________________________________________________________________________________
Level 1 Trauma Center
yes 26 63 0 16 64
no 172 11 0 0 10
______________________________________________________________________________________________________
Residents Train On Site
yes 29 56 0 6 54
no 172 11 0 0 9
______________________________________________________________________________________________________
Use PACS
yes 196 18 0 0 10
no 9 6 0 1 14
______________________________________________________________________________________________________
Region and Setting
New England 14 39 0 1 13
urban 4 -- -- -- --
suburban 2 -- -- -- --
rural 8 52 0 1 9
Middle Atlantic 22 19 0 1 21
urban 5 15 0 0 37
suburban 9 13 0 0 28 rural 7 32 2 10 20
25th 50th 75th
n average percentile percentile percentile _____________________________________________________________________________________________________
Region and Setting
East North Central 36 34 0 2 32
urban 10 86 0 20 135 suburban 11 28 0 5 50
rural 15 4 0 1 5
West North Central 22 6 0 0 7
urban 5 6 0 0 16
suburban 6 2 0 0 5 rural 11 7 0 0 25
South Atlantic 45 11 0 2 10
urban 8 15 0 3 41
suburban 16 6 0 0 15
rural 19 15 0 3 8
East South Central 17 7 0 0 6
urban 3 -- -- -- --
suburban 5 3 0 0 7
rural 9 6 0 0 1
West South Central 20 26 0 3 22
urban 6 63 0 13 138
suburban 6 12 0 2 23
rural 8 9 0 4 9
Mountain 13 3 0 1 5
urban 3 -- -- -- --
suburban 8 2 0 0 1
rural 2 -- -- -- --
Pacific 18 4 0 0 5
urban 6 4 0 0 6
suburban 8 4 0 1 8
rural 4 -- -- -- --
_____________________________________________________________________________________________________
NOTE: results not shown if fewer than 5 valid values

APPENDIX
APPENDIX
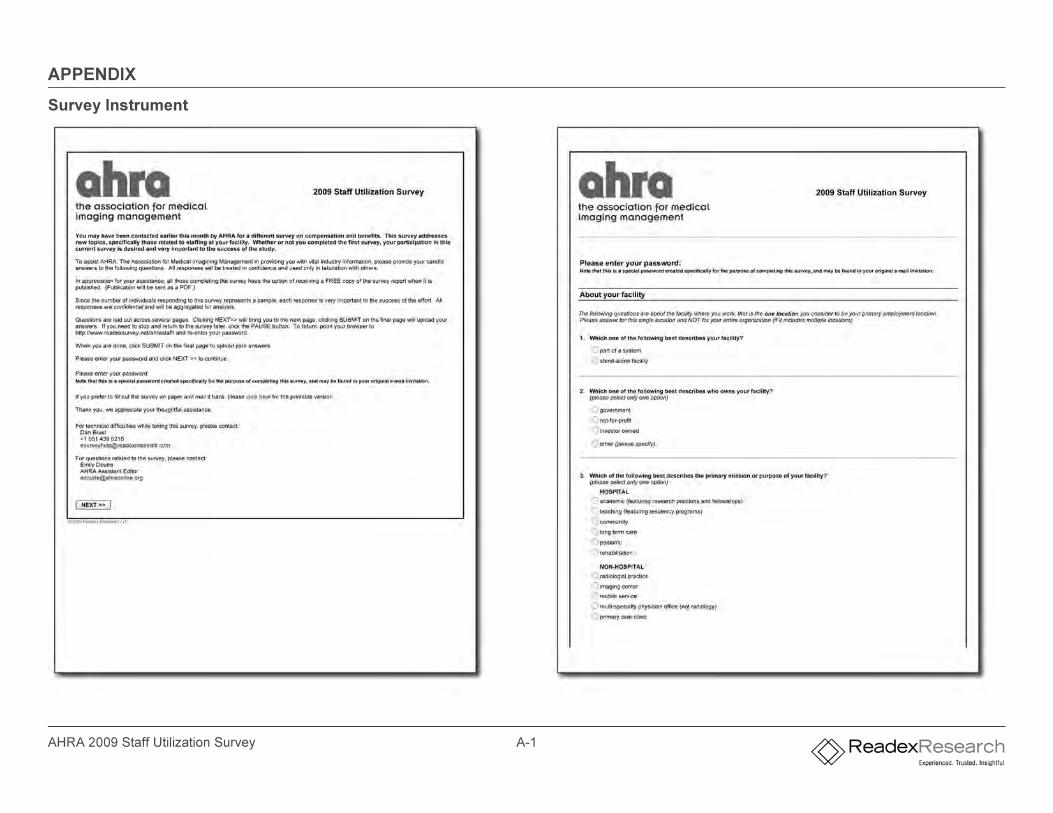
AHRA 2009 Staff Utilization Survey A-1
Survey Instrument
APPENDIX
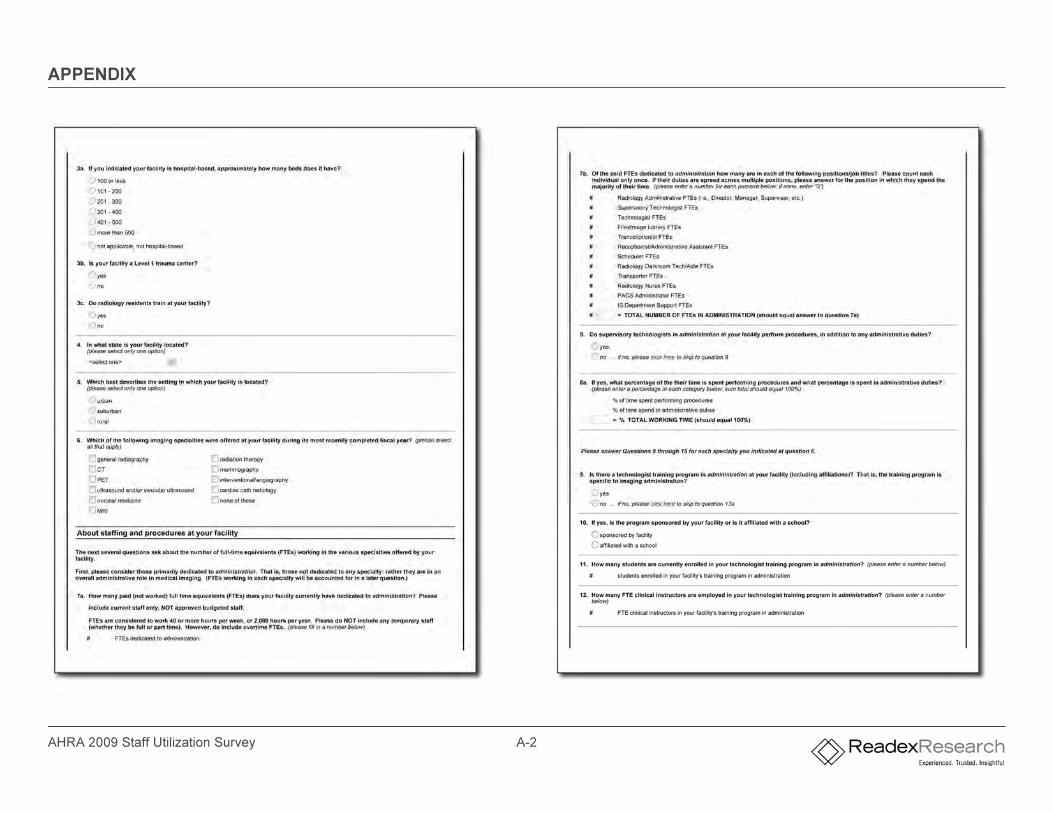
AHRA 2009 Staff Utilization Survey A-2
APPENDIX
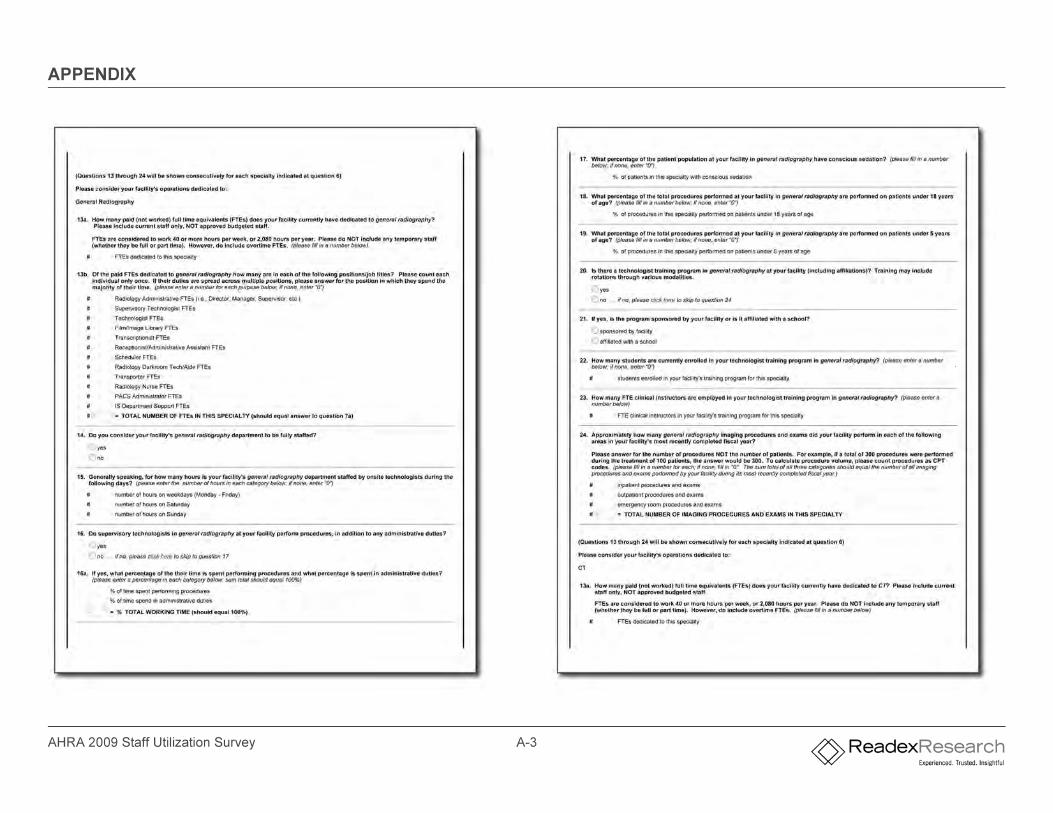
AHRA 2009 Staff Utilization Survey A-3
APPENDIX
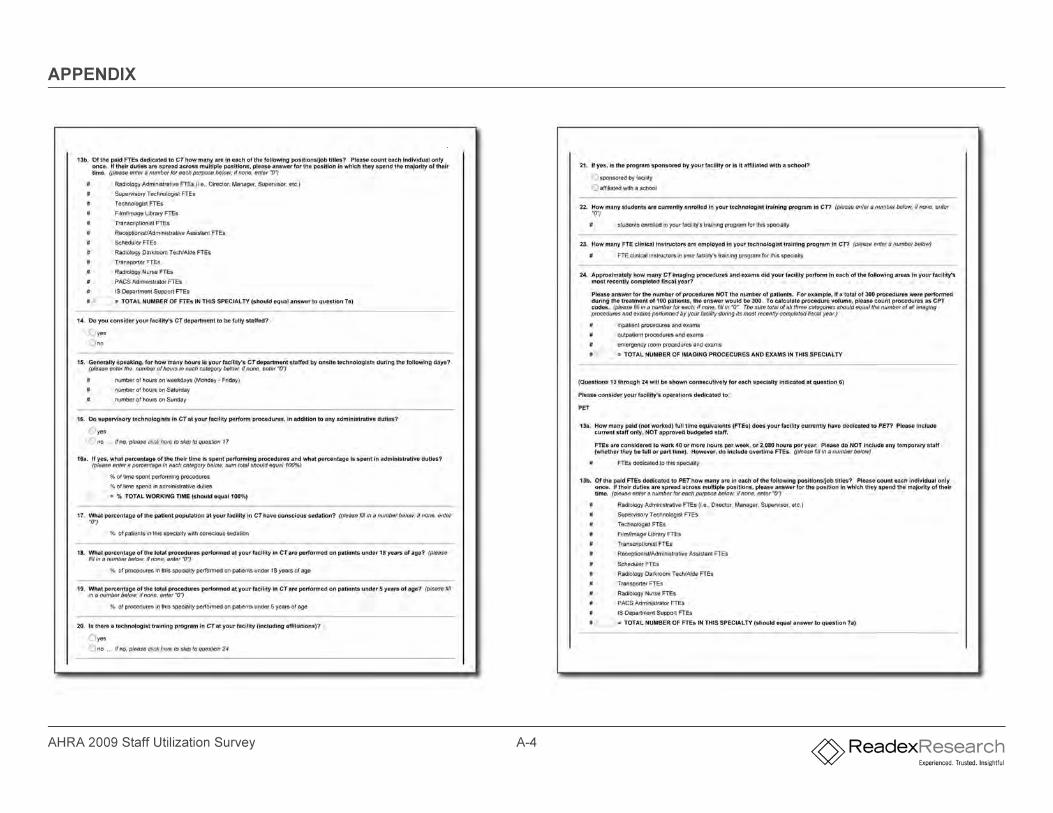
AHRA 2009 Staff Utilization Survey A-4
APPENDIX
AHRA 2009 Staff Utilization Survey A-5
APPENDIX
AHRA 2009 Staff Utilization Survey A-6
APPENDIX
AHRA 2009 Staff Utilization Survey A-7
APPENDIX
AHRA 2009 Staff Utilization Survey A-8
APPENDIX
AHRA 2009 Staff Utilization Survey A-9
APPENDIX
AHRA 2009 Staff Utilization Survey A-10
APPENDIX
AHRA 2009 Staff Utilization Survey A-11
APPENDIX
AHRA 2009 Staff Utilization Survey A-12
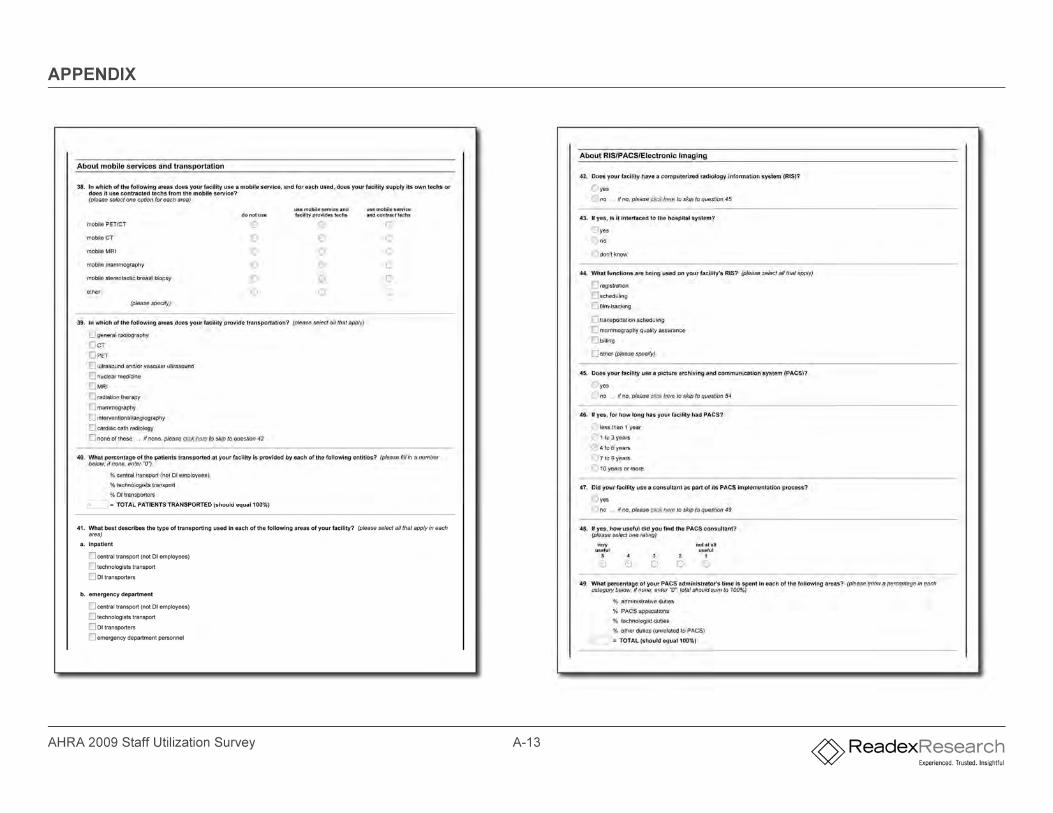
APPENDIX
AHRA 2009 Staff Utilization Survey A-13
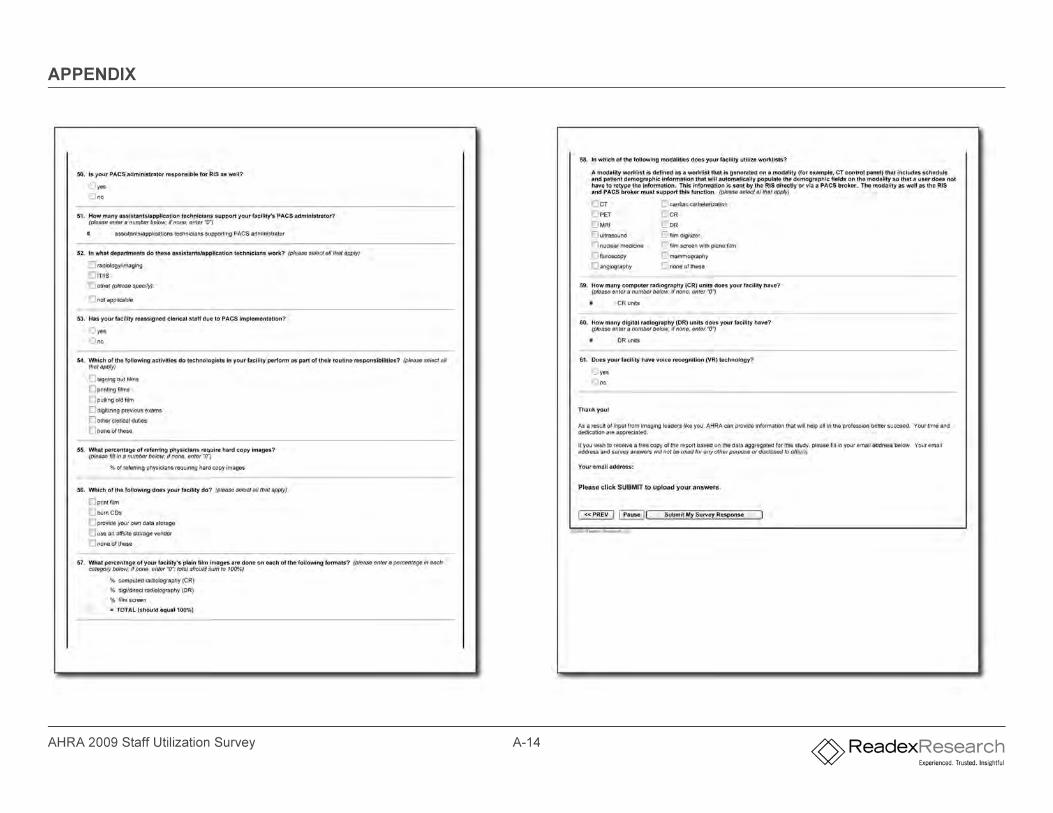
APPENDIX
AHRA 2009 Staff Utilization Survey A-14
2009 AHRA: The Association for Medical Imaging Management490-B Boston Post Road, Suite 200, Sudbury, MA 01776
Phone: 978-443-7591Toll Free: 800-334-AHRA
Fax: 978-443-8046www.ahraonline.org