Embed Size (px)
Citation preview
2010 Canadian Aviation Industry Report on Greenhouse Gas Emissions Reductions March 2012
Foreword This is the fifth annual report prepared under the Voluntary Memorandum of Understanding (MOU) on the Reduction of Aviation Greenhouse Gas Emissions, signed in June 2005 between Transport Canada and the Air Transport Association of Canada (ATAC).1 Under the Terms and Conditions of the MOU, ATAC prepared and published annual reports for the first two calendar years, 2006 and 2007. 2,3 Subsequently, in 2008, the four largest passenger air carriers – Air Canada, Air Transat, Jazz Air LP, and WestJet – elected to leave ATAC, and formed a new trade association, the National Airlines Council of Canada (NACC). While no longer covered by the MOU, those carriers affirmed their continuing support of the agreement and its goals, and assumed their responsibilities as set out in the agreement. For calendar year 2008, NACC prepared a report containing aggregated data for its 4 member carriers,4 and ATAC provided a report on the activities in 2008 of six remaining member carriers. A Consolidated Report for the two associations was then prepared and published by Transport Canada.5 For calendar year 2009, NACC again prepared a report covering its 4 members,6 and ATAC provided a report on activities of three of its largest member carriers, and the consolidated report was prepared and published by Transport Canada.7 For the current volume, the same procedures have been followed by the two associations to report on activities in calendar year 2010.
1
Executive Summary The purpose of this Report is to outline the efforts and achievements of Canadian aviation industry in greenhouse gas emissions reductions during 2010 under the voluntary Memorandum of Understanding established between the Air Transport Association of Canada and Transport Canada in 2005. That agreement’s quantitative goal is to reduce the industry’s greenhouse gas emissions rate per unit of output (e.g. per revenue tonne-kilometre) by an average of 1.1 percent per year, with a cumulative reduction goal of 24 percent in 2012, compared to the 1990 baseline. Information on activities during calendar year 2010, including relevant statistics describing operations and fuel use, have been reported by both ATAC and NACC, and consolidated in the present report. Highlights of the report’s findings are as follows:
• In 2010 aviation demand rebounded from the reductions in 2009 that accompanied the worldwide downturn in economic activity. Passenger traffic rose by 9.5 percent from 2009, to 129 billion revenue-passenger-km (RPK).
• Reported cargo traffic rose by over 40 percent from its extraordinarily low level in 2009, to 1.93 billion revenue-tonne-km (though the trends are somewhat uncertain due to incomplete reporting).
• Total fuel consumption by the reporting air carriers in 2010 rebounded to 5.66 billion litres, an increase of 11.5 percent from the 5.08 billion litres reported for 2009, and slightly above the 5.58 billion litres reported for 2008. Total greenhouse gas (GHG) emissions in 2010 were 14.47 Mt of CO2-equivalent, also an 11.5 percent increase over 2009 and slightly above the level in 2008.
• The fuel consumption rate reported for 2010 was 0.379 litres per revenue-tonne-km
(RTK), combining both passenger and cargo traffic, and the emissions rate was 969 grams CO2e per RTK. Both rates were 1.9 percent below those reported for 2009.
• The long-term annual average fuel efficiency improvement in litres per total RTK
(combining passenger and cargo operations) was 1.9 percent between 1990 and 2010, surpassing the MOU-established target of 1.1 percent per year.
• Combined passenger and cargo RTK grew by 77 percent between 1990 and 2010. Total
fuel consumption rose by 23 percent during the same period. Fuel intensity per RTK fell by 31 percent over the entire period, surpassing the long-term objective of the MOU of a cumulative improvement of 24 percent between 1990 and 2012.
2
1. Background Aviation emissions goals of ICAO and IATA In October 2010, the International Civil Aviation Organization (ICAO) adopted a new Assembly Resolution on climate change, Resolution A37-19. It set several voluntary goals for international aviation emissions, including:
• A global annual average fuel efficiency improvement of 2 percent until 2020; • A medium-term aspirational goal of keeping the global net carbon emissions from
international aviation from 2020 at the same level; and • A global aspirational goal of 2 percent annual fuel efficiency improvement from 2021 to
2050. To help ICAO track progress towards reaching these goals, the resolution encourages Member States to submit action plans detailing specific measures to address GHG emissions related to international aviation to ICAO by June 2012. ICAO’s environmental activities are largely undertaken through the Committee on Aviation Environmental Protection (CAEP). Through CAEP, ICAO issued in 2004 a “Template and Guidance on Voluntary Measures”, providing guidance to assist interested countries in establishing voluntary agreements to address emissions.8 The guidance material lends support to ICAO’s objective of harmonized efforts and underscores the importance of voluntary initiatives in addressing the problem of aviation emissions. The Template proposed that quantified goals be established for emissions reductions, expressed as fuel consumption per unit of aviation activity, suggesting that “the Partnership Goal is a specified percent annual improvement in fuel per revenue tonne-kilometre over a 12-year period from 1998-2010.”9
In September 2009, the International Air Transport Association (IATA) announced its four-pillar Climate Change Strategy of technology investment, efficient infrastructure, effective operations and positive economic measures.10 The Strategy also outlined the Association’s commitment to three sequential targets:
• 1.5 percent average annual improvements in fuel efficiency to 2020, • stabilizing emissions with carbon-neutral growth from 2020, and • 50 percent absolute cut in emissions by 2050 compared to 2005.
Memorandum of Understanding (MOU) - Voluntary Agreement for the Reduction of Greenhouse Gas (GHG) Emissions On June 29, 2005 ATAC and Transport Canada signed the first voluntary agreement in the world that is based on ICAO’s Template. Canada’s air service providers became the first air carriers to have reached a voluntary agreement with their government to reduce the growth of GHG emissions, including both domestic and international operations. Under the MOU, ATAC undertakes to encourage its members to improve their fuel efficiency, with a quantitative goal to:
3
“reduce collective ATAC member fleet greenhouse gas emissions on a per unit basis (through fuel efficiency improvements, e.g. reduction in litres of fuel/Revenue Tonne Kilometre) by an average of 1.1 percent per annum, reaching a cumulative improvement of 24 percent in 2012 compared to the 1990 base case scenario.”
The MOU also addresses the principles governing the Agreement, the responsibilities of the parties, and provisions for its management and administration. A key provision is that ATAC would obtain the necessary data from its members, and report annually on progress, including statistics illustrating performance relative to the goal. The association therefore accepted a more ambitious target than the one that ICAO suggested at the time. At the time of the signing of the MOU, the 1.1 percent reduction target was consistent with the approach undertaken by IATA, of which some of the ATAC/NACC carriers are members. The IATA carriers had committed to achieving a fuel efficiency goal of 41.50 litres of fuel per 100 revenue tonne-kilometres by 2012. IATA goals were subsequently extended to 2020 and 2050, as noted above. The first annual report under the MOU covered calendar year 2006, and was published by ATAC in February 2008. The subsequent report for 2007 was published in 2009. For the annual report covering 2008, ATAC and NACC provided reports on their respective members’ activities which were consolidated by Transport Canada, approved by the MOU Management Committee on which both Associations are represented, and published early in 2010.11 That procedure was repeated for the 2009 report published in October 2010 (ref. 7), and has again been repeated for this report for calendar 2010. Audit of the MOU As part of the management procedures for the agreement, the MOU also calls for their periodic audits, as follows:
“In order to allow the Parties to have continued confidence in the reliability of the reports, a qualified auditor will be given access, each year or periodically but not more frequently than once a year, to audit the reports, processes and supporting documentation residing with ATAC pertaining to the Agreement. Transport Canada and ATAC will select the appropriate auditor capable of independently verifying the reports. Transport Canada will cover all audit costs.”
The audit was undertaken during 2010. After examining the processes and reporting for the 2008 report, the independent auditor concluded that:
“The data collection, modification, aggregation and normalization processes used by ATAC and NACC meet the requirements of the MOU in all material respects.”
The auditor made some recommendations for improvement, to which ATAC and NACC provided a consolidated Management Response, attached as an Annex to the 2009 report.
4
2. Reporting of Activity and GHG Emissions 2.1 ATAC Reporting Data from the ATAC air carriers is reported through the “ATAC GHG Emissions Reporting System”, referred to as AGERS. Annual Data Requested Each year, ATAC requested the following data from its membership in order to populate the AGERS database:
• Litres of fuel burned; • Available seat-kilometres or miles (ASK or ASM); • Available tonne-kilometres or ton-miles (ATK or ATM) (cargo only); • Revenue passenger-kilometres or -miles (RPK or RPM); • Revenue tonne-kilometres or ton-miles (RTK or RTM) (cargo only); • Total available tonne-kilometres or ton-miles (total ATK or total ATM) (total of
passengers weight at 220lbs each plus cargo weight); • Total revenue tonne-kilometres or ton-miles (total RTK or total RTM) (total of
passengers weight at 220lbs each plus cargo weight). AGERS Output Once data are collected, de-identified and aggregated, the AGERS database produces the following:
• Current and annual air sector GHG total emission summary reports; • Annual air sector GHG emissions intensity trend reports; • Individual company emissions reports, on request by company affected; • Air sector reports using aggregate data.
AGERS Units The measurement units used by AGERS are industry-wide recognized and accepted, including:
• Litres of fuels/available tonne-kilometre (and ton-mile); • Litres of fuel/revenue tonne-kilometre (and ton-mile); • Litres of fuel/available seat-kilometre (and mile); • Litres of fuel/revenue seat-kilometre (and mile); • Greenhouse gas emissions in megatonnes CO2-equivalent (abbreviated to CO2e),
combining emissions of Carbon Dioxide (CO2), Methane (CH4) and Nitrous Oxide (N2O) weighted by their radiative-forcing coefficients;
• grams CO2e/passenger-kilometre; • grams CO2e/tonne-kilometre.
Industry Participation The information contained in the AGERS database relates to aircraft fuel use and does not include fuel used in ground equipment and facilities. It includes domestic, transborder and international operations.
5
The ATAC member carriers who contributed data to the AGERS database in 2010 were:
• Air North • Canadian North • Cargojet • First Air • Flair • Kelowna Flightcraft • Porter Airlines • Sunwing.
This has expanded coverage of ATAC members’ operations compared to the reports for 2008 and 2009, notably with inclusion for the first time of Porter Airlines and Kelowna Flightcraft. Adding data for Porter only for 2010, and not for previous years, will inflate slightly the apparent increase in fuel use and passenger activity between 2010 and 2009, but give a more correct comparison between 2010 and 2001 or 1990. Kelowna Flightcraft has provided data for all years from 2001 to 2010, all of which have now been incorporated, improving the accuracy of cargo figures and cargo fuel consumption rates compared to earlier reports. In general, it must be borne in mind that the number of carriers and extent of coverage of ATAC members’ operations have varied over the period of the MOU, and the carrier reports have differed somewhat in the completeness of their activity statistics. It is also the case that reports by NACC members have been revised from time to time, including a substantial revision in cargo statistics for 2008 and 2009 in this year’s report. The consolidated statistics presented in this report include all the latest figures reported by ATAC and NACC carriers, including all such revisions. Furthermore, to deal with incomplete activity records, the ratios of fuel use to activity have been adjusted to include only the carriers that reported the relevant activity. In summary, it should be noted that the statistics are not entirely comparable between years; and that the information in this report supersedes that in the earlier annual reports under the MOU. 2.2 NACC Reporting For the reporting of the statistics under the MOU, NACC adopted the reporting system of one of its member carriers, standardized to fulfill the reporting requirements under the MOU. The use of this system ensured that the other member carriers reported their data in a consistent and standardized manner. NACC contracted an independent third party to collect and maintain all carrier data. The information has been compiled and reported in a consolidated manner in order to ensure that no carrier can be identified. The GHG emissions reported in the NACC database pertain to aircraft fuel use and do not include fuel used in ground equipment or facilities. The reporting includes domestic, trans-border and international operations. All the members of NACC, that is, Air Canada, Air Transat, Jazz Air LP, and WestJet, contributed 2010 data.
6
As noted above, this report revises data contained in the 2008 and 2009 reports. The revisions were the result of revised cargo available ton-mile (ATM) and cargo revenue ton-mile (RTM) data from one of the carriers for the years 2005 through 2009 inclusive. All of the rates of emissions per tonne-kilometre for those years are consequently slightly modified from those contained in the report for calendar year 2009. The member carriers of NACC provided the following 2010 statistics:
• Cargo available ton-miles (ATM) • Cargo revenue ton-miles (RTM) • Available seat-miles (ASM) • Revenue passenger-miles (RPM) • Litres of fuel burned per year
Output NACC aggregated the data provided by members and performed the necessary calculations to provide the following output statistics:
• Cargo revenue tonne-kilometres (RTK) • Revenue passenger-kilometres (RPK) • Total revenue tonne-kilometres (Total RTK) (100 kg per passenger) • Litres of fuel burned per year • Litres per 100 revenue tonne-kilometres (L/100 RTK) • Litres per revenue tonne-kilometre (L/RTK) • Cargo available tonne-kilometres (ATK) • Passenger available tonne-kilometres (ATK) (100 kg per passenger) • Total available tonne-kilometres • Litres per 100 available tonne-kilometres (L/100 ATK) • Tonnes of CO2e emissions • CO2e emissions per revenue tonne-kilometre • CO2e emissions per available tonne-kilometre.
2.3 Calculations The following factors and formulas were applied in Transport Canada’s preparation of the consolidated industry Report. Note that industry statistics are customarily maintained in imperial units, including miles and tons, which are converted to International System (SI) units (kilometres and tonnes) for the present Report. Note also that the emissions factors for all calendar years are the latest factors used by Environment Canada in Canada's National Greenhouse Gas Inventory since 2009.12
Aviation Jet Fuel emission factors: 2534 grams CO2 per litre 2557 grams CO2e per litre
7
Conversion miles to kilometres:
1 m = 1.609344 km
Conversion tons to tonnes: 1 ton = 0.907185 tonnes
Formulae for CO2-equivalents: CO2e (grams)/RPK = (Fuel Used x 2557) / (RPM x 1.609344) CO2e (grams)/Cargo RTK = (Fuel Used x 2557) / (Cargo RTM x 1.609344 x 0.907185) CO2e (grams)/Total RTK = (Fuel Used x 2557) / {(RPM x 1.609344 x 0.907185)+(Cargo RTM x 1.609344 x 0.907185)}
3. Results for 2010 The combined results for ATAC and NACC air carriers in 2010 are shown in Table 1, in comparison to each of the years from 2001, and also to 1990. The table includes the same quantities and rates reported in the previous annual reports, though for brevity omits those in imperial units. The reported annual emission statistics do not account for 100 percent of Canadian aviation operations, and therefore will not be directly comparable to the National Greenhouse Gas Emissions Inventory, issued annually by Environment Canada. The MOU, and therefore this report, does not cover private aviation, military and other government operations, nor operations in Canada of foreign carriers. Nor does it cover those carriers (mostly small) which are not members of either ATAC or NACC. Further, the extent of reporting of activities by members of the Associations has varied year to year. ATAC estimated in earlier annual reports that coverage by reporting members was in excess of 97 percent of domestic passenger and cargo traffic in 2001, in excess of 92 percent in 2002, then in excess of 95 percent in each of the years from 2003 to 2007. Reporting for 2010 is at least as complete as in those years. Since its formation in 2007, NACC has obtained more complete coverage of activities by its members, and has revised reports of cargo statistics back to 2005. It is clear that the reports cover most operations, and seems safe to conclude that inclusion of the remainder would not substantially affect the ratios and longer-term trends computed for fuel use and emissions per unit of traffic. A minor qualification must also be made to the comparisons to 1990: the figures for 1990 in Table 1 are not from the Associations, but are those officially reported by Statistics Canada in its publication entitled ‘Aviation in Canada’ 13 (as compiled for this report by Transport Canada), which cover strictly only carriers of Levels I and II (i.e. transporting at least 50,000 passengers or 10,000 tonnes of cargo in that year). Table 1 shows trends in fuel consumption and its conversion to GHG emissions, expressed in CO2-equivalent. Table 1 also provides the relevant traffic statistics namely:
8
9
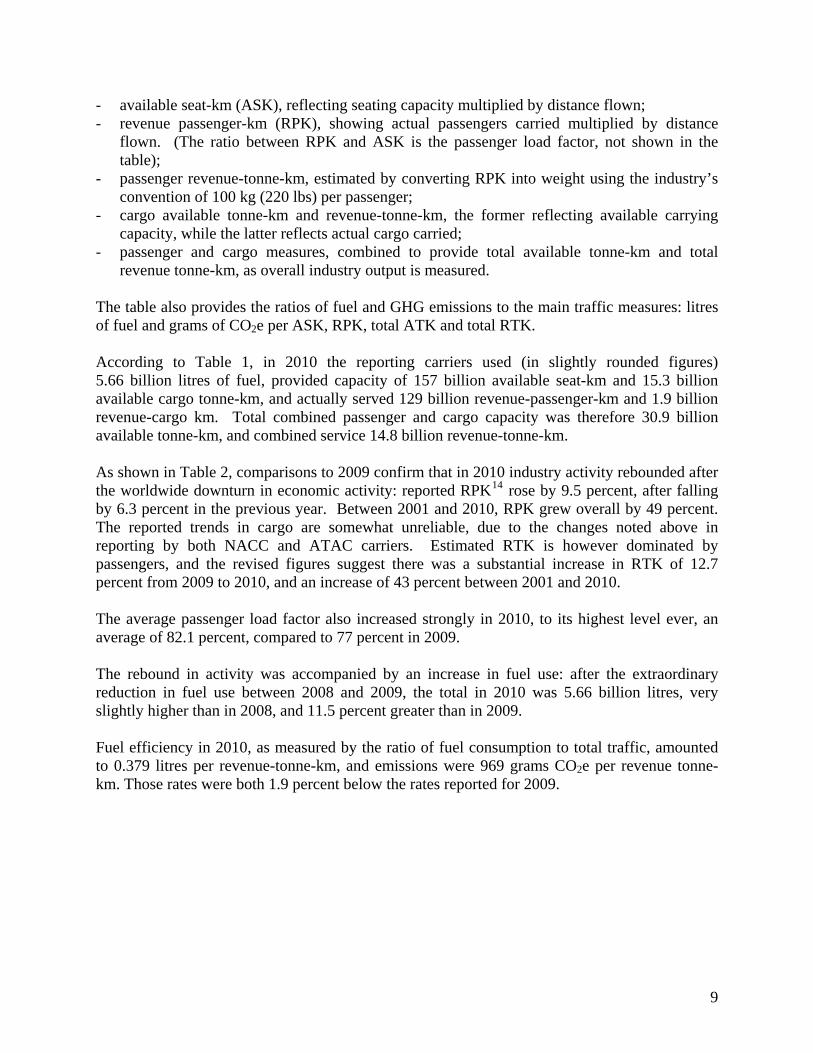
- available seat-km (ASK), reflecting seating capacity multiplied by distance flown; - revenue passenger-km (RPK), showing actual passengers carried multiplied by distance
flown. (The ratio between RPK and ASK is the passenger load factor, not shown in the table);
- passenger revenue-tonne-km, estimated by converting RPK into weight using the industry’s convention of 100 kg (220 lbs) per passenger;
- cargo available tonne-km and revenue-tonne-km, the former reflecting available carrying capacity, while the latter reflects actual cargo carried;
- passenger and cargo measures, combined to provide total available tonne-km and total revenue tonne-km, as overall industry output is measured.
The table also provides the ratios of fuel and GHG emissions to the main traffic measures: litres of fuel and grams of CO2e per ASK, RPK, total ATK and total RTK. According to Table 1, in 2010 the reporting carriers used (in slightly rounded figures) 5.66 billion litres of fuel, provided capacity of 157 billion available seat-km and 15.3 billion available cargo tonne-km, and actually served 129 billion revenue-passenger-km and 1.9 billion revenue-cargo km. Total combined passenger and cargo capacity was therefore 30.9 billion available tonne-km, and combined service 14.8 billion revenue-tonne-km. As shown in Table 2, comparisons to 2009 confirm that in 2010 industry activity rebounded after the worldwide downturn in economic activity: reported RPK14 rose by 9.5 percent, after falling by 6.3 percent in the previous year. Between 2001 and 2010, RPK grew overall by 49 percent. The reported trends in cargo are somewhat unreliable, due to the changes noted above in reporting by both NACC and ATAC carriers. Estimated RTK is however dominated by passengers, and the revised figures suggest there was a substantial increase in RTK of 12.7 percent from 2009 to 2010, and an increase of 43 percent between 2001 and 2010. The average passenger load factor also increased strongly in 2010, to its highest level ever, an average of 82.1 percent, compared to 77 percent in 2009. The rebound in activity was accompanied by an increase in fuel use: after the extraordinary reduction in fuel use between 2008 and 2009, the total in 2010 was 5.66 billion litres, very slightly higher than in 2008, and 11.5 percent greater than in 2009. Fuel efficiency in 2010, as measured by the ratio of fuel consumption to total traffic, amounted to 0.379 litres per revenue-tonne-km, and emissions were 969 grams CO2e per revenue tonne-km. Those rates were both 1.9 percent below the rates reported for 2009.
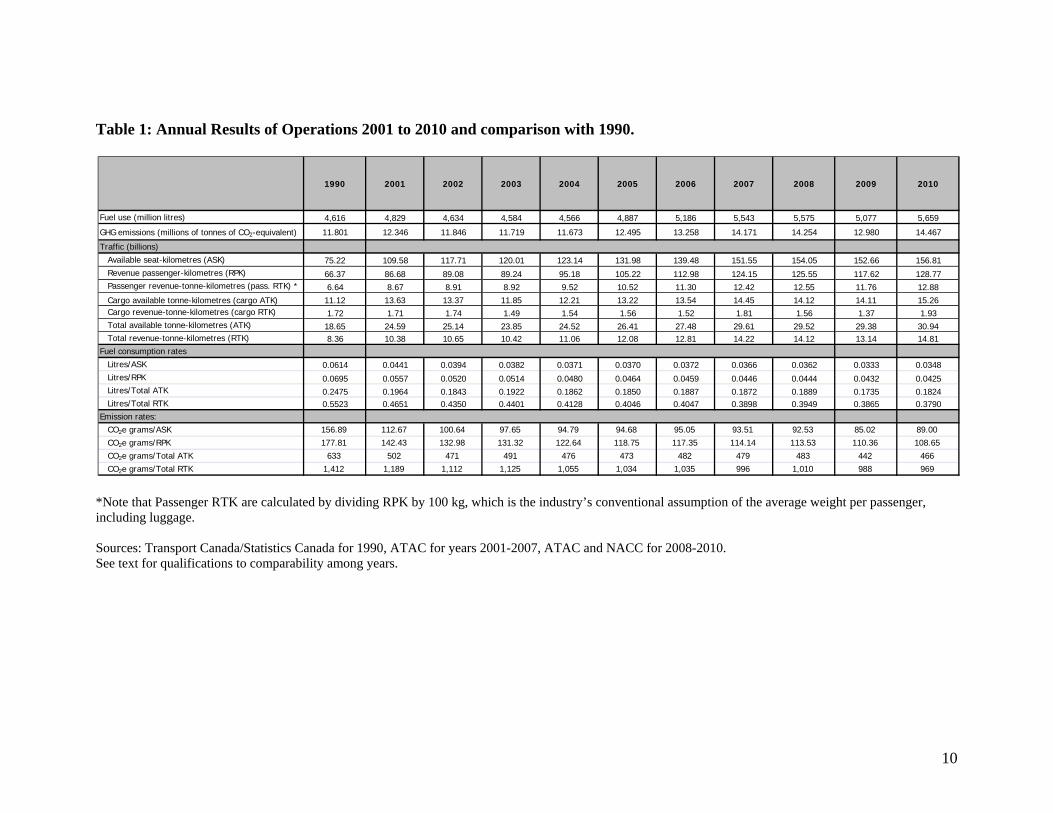
Table 1: Annual Results of Operations 2001 to 2010 and comparison with 1990.
1990 2001 2002 2003 2004 2005 2006 2007 2008 2009 2010
Fuel use (million litres) 4,616 4,829 4,634 4,584 4,566 4,887 5,186 5,543 5,575 5,077 5,659
GHG emissions (millions of tonnes of CO2-equivalent) 11.801 12.346 11.846 11.719 11.673 12.495 13.258 14.171 14.254 12.980 14.467
Traffic (billions)Available seat-kilometres (ASK) 75.22 109.58 117.71 120.01 123.14 131.98 139.48 151.55 154.05 152.66 156.81Revenue passenger-kilometres (RPK) 66.37 86.68 89.08 89.24 95.18 105.22 112.98 124.15 125.55 117.62 128.77Passenger revenue-tonne-kilometres (pass. RTK) * 6.64 8.67 8.91 8.92 9.52 10.52 11.30 12.42 12.55 11.76 12.88Cargo available tonne-kilometres (cargo ATK) 11.12 13.63 13.37 11.85 12.21 13.22 13.54 14.45 14.12 14.11 15.26Cargo revenue-tonne-kilometres (cargo RTK) 1.72 1.71 1.74 1.49 1.54 1.56 1.52 1.81 1.56 1.37 1.93Total available tonne-kilometres (ATK) 18.65 24.59 25.14 23.85 24.52 26.41 27.48 29.61 29.52 29.38 30.94Total revenue-tonne-kilometres (RTK) 8.36 10.38 10.65 10.42 11.06 12.08 12.81 14.22 14.12 13.14 14.81
Fuel consumption ratesLitres/ASK 0.0614 0.0441 0.0394 0.0382 0.0371 0.0370 0.0372 0.0366 0.0362 0.0333 0.0348Litres/RPK 0.0695 0.0557 0.0520 0.0514 0.0480 0.0464 0.0459 0.0446 0.0444 0.0432 0.0425Litres/Total ATK 0.2475 0.1964 0.1843 0.1922 0.1862 0.1850 0.1887 0.1872 0.1889 0.1735 0.1824Litres/Total RTK 0.5523 0.4651 0.4350 0.4401 0.4128 0.4046 0.4047 0.3898 0.3949 0.3865 0.3790
Emission rates:CO2e grams/ASK 156.89 112.67 100.64 97.65 94.79 94.68 95.05 93.51 92.53 85.02 89.00CO2e grams/RPK 177.81 142.43 132.98 131.32 122.64 118.75 117.35 114.14 113.53 110.36 108.65CO2e grams/Total ATK 633 502 471 491 476 473 482 479 483 442 466CO2e grams/Total RTK 1,412 1,189 1,112 1,125 1,055 1,034 1,035 996 1,010 988 969
*Note that Passenger RTK are calculated by dividing RPK by 100 kg, which is the industry’s conventional assumption of the average weight per passenger, including luggage. Sources: Transport Canada/Statistics Canada for 1990, ATAC for years 2001-2007, ATAC and NACC for 2008-2010. See text for qualifications to comparability among years.
10
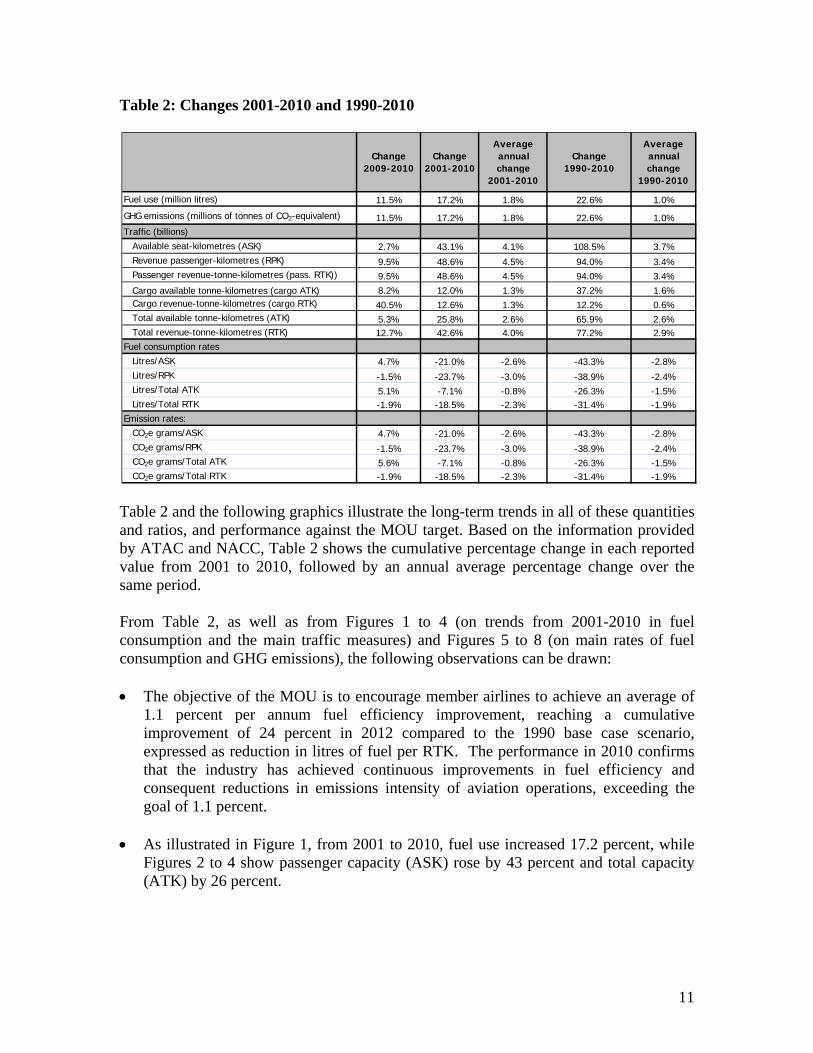
Table 2: Changes 2001-2010 and 1990-2010
Change 2009-2010
Change 2001-2010
Average annual change
2001-2010
Change 1990-2010
Average annual change
1990-2010
Fuel use (million litres) 11.5% 17.2% 1.8% 22.6% 1.0%
GHG emissions (millions of tonnes of CO2-equivalent) 11.5% 17.2% 1.8% 22.6% 1.0%Traffic (billions)
Available seat-kilometres (ASK) 2.7% 43.1% 4.1% 108.5% 3.7%Revenue passenger-kilometres (RPK) 9.5% 48.6% 4.5% 94.0% 3.4%Passenger revenue-tonne-kilometres (pass. RTK)) 9.5% 48.6% 4.5% 94.0% 3.4%Cargo available tonne-kilometres (cargo ATK) 8.2% 12.0% 1.3% 37.2% 1.6%Cargo revenue-tonne-kilometres (cargo RTK) 40.5% 12.6% 1.3% 12.2% 0.6%Total available tonne-kilometres (ATK) 5.3% 25.8% 2.6% 65.9% 2.6%Total revenue-tonne-kilometres (RTK) 12.7% 42.6% 4.0% 77.2% 2.9%
Fuel consumption ratesLitres/ASK 4.7% -21.0% -2.6% -43.3% -2.8%Litres/RPK -1.5% -23.7% -3.0% -38.9% -2.4%Litres/Total ATK 5.1% -7.1% -0.8% -26.3% -1.5%Litres/Total RTK -1.9% -18.5% -2.3% -31.4% -1.9%
Emission rates:CO2e grams/ASK 4.7% -21.0% -2.6% -43.3% -2.8%CO2e grams/RPK -1.5% -23.7% -3.0% -38.9% -2.4%CO2e grams/Total ATK 5.6% -7.1% -0.8% -26.3% -1.5%CO2e grams/Total RTK -1.9% -18.5% -2.3% -31.4% -1.9%
Table 2 and the following graphics illustrate the long-term trends in all of these quantities and ratios, and performance against the MOU target. Based on the information provided by ATAC and NACC, Table 2 shows the cumulative percentage change in each reported value from 2001 to 2010, followed by an annual average percentage change over the same period. From Table 2, as well as from Figures 1 to 4 (on trends from 2001-2010 in fuel consumption and the main traffic measures) and Figures 5 to 8 (on main rates of fuel consumption and GHG emissions), the following observations can be drawn: • The objective of the MOU is to encourage member airlines to achieve an average of
1.1 percent per annum fuel efficiency improvement, reaching a cumulative improvement of 24 percent in 2012 compared to the 1990 base case scenario, expressed as reduction in litres of fuel per RTK. The performance in 2010 confirms that the industry has achieved continuous improvements in fuel efficiency and consequent reductions in emissions intensity of aviation operations, exceeding the goal of 1.1 percent.
• As illustrated in Figure 1, from 2001 to 2010, fuel use increased 17.2 percent, while Figures 2 to 4 show passenger capacity (ASK) rose by 43 percent and total capacity (ATK) by 26 percent.
11
12
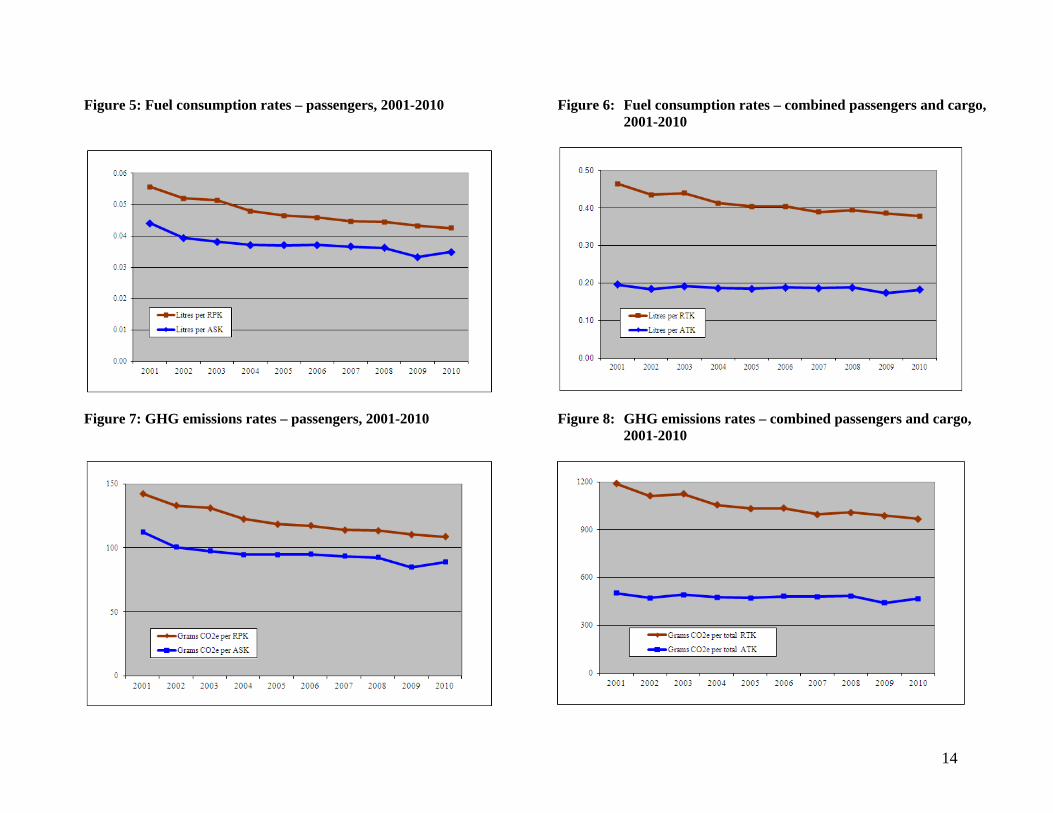
• As presented in Figure 5, the fuel consumption rate and consequent GHG emission rate per RTK both fell by 18.5 percent between 2001 and 2010, an average annual improvement of 2.3 percent.
• Over the entire period from 1990 to 2010, passenger and cargo traffic grew by 66
percent, as expressed by total available tonne-kilometres, while fuel consumption rose by only 22.6 percent. Fuel consumption trends for combined passenger and cargo operations for the period 2001-2010 are illustrated in Figure 6.
• Consequently from 1990 to 2010 fuel use and emissions intensity per ATK fell by
26 percent, or an average of 1.5 percent per year.
• Over that entire period, the key indicator for the MOU of fuel intensity and GHG emissions per RTK fell by 31 percent, an average of 1.9 percent per year.
• Clearly those annual and cumulative reductions continue to surpass substantially
the MOU goals of 1.1 percent annual reduction and 24 percent cumulative reduction between 1990 and 2012.
• It can also be noted that the fuel consumption rate per RTK in 2010 of 37.7 litres
per 100 RTK also surpassed the IATA goal for 2012 of 41.5 litres per 100 RTK.
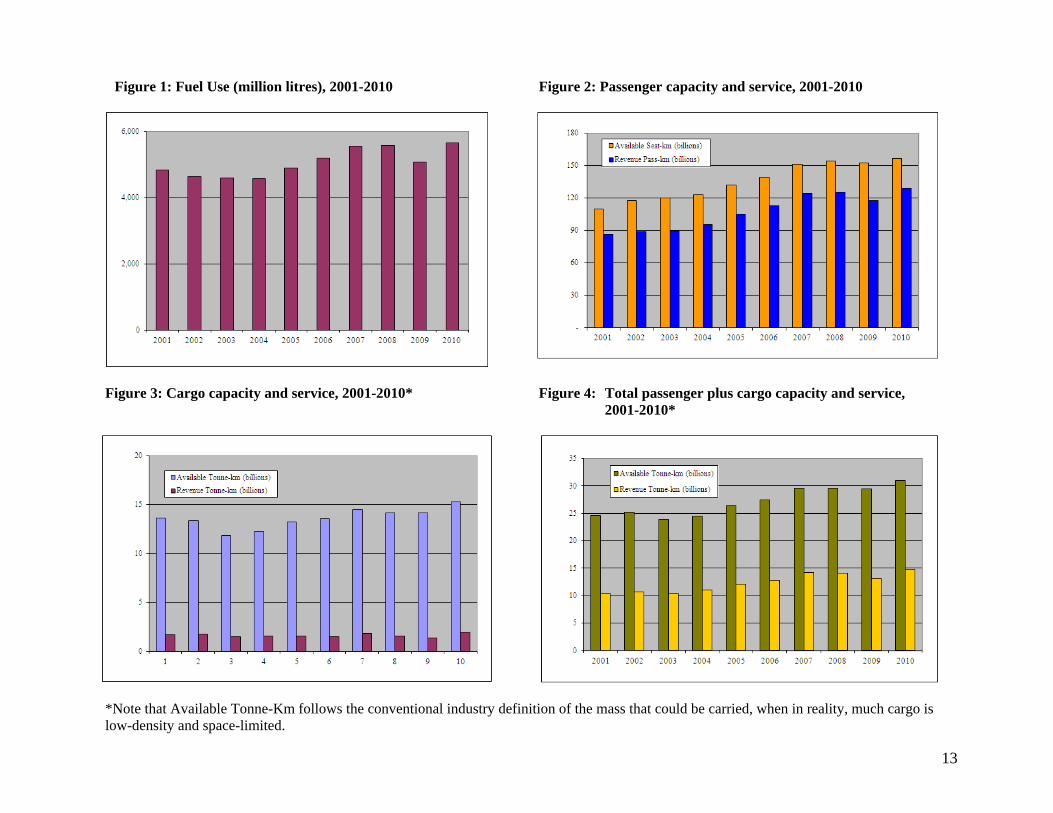
Figure 1: Fuel Use (million litres), 2001-2010
Figure 2: Passenger capacity and service, 2001-2010
Figure 3: Cargo capacity and service, 2001-2010*
Figure 4: Total passenger plus cargo capacity and service,
2001-2010*
*Note that Available Tonne-Km follows the conventional industry definition of the mass that could be carried, when in reality, much cargo is low-density and space-limited.
13
14
Figure 5: Fuel consumption rates – passengers, 2001-2010
Figure 6: Fuel consumption rates – combined passengers and cargo, 2001-2010
Figure 7: GHG emissions rates – passengers, 2001-2010
Figure 8: GHG emissions rates – combined passengers and cargo,
2001-2010
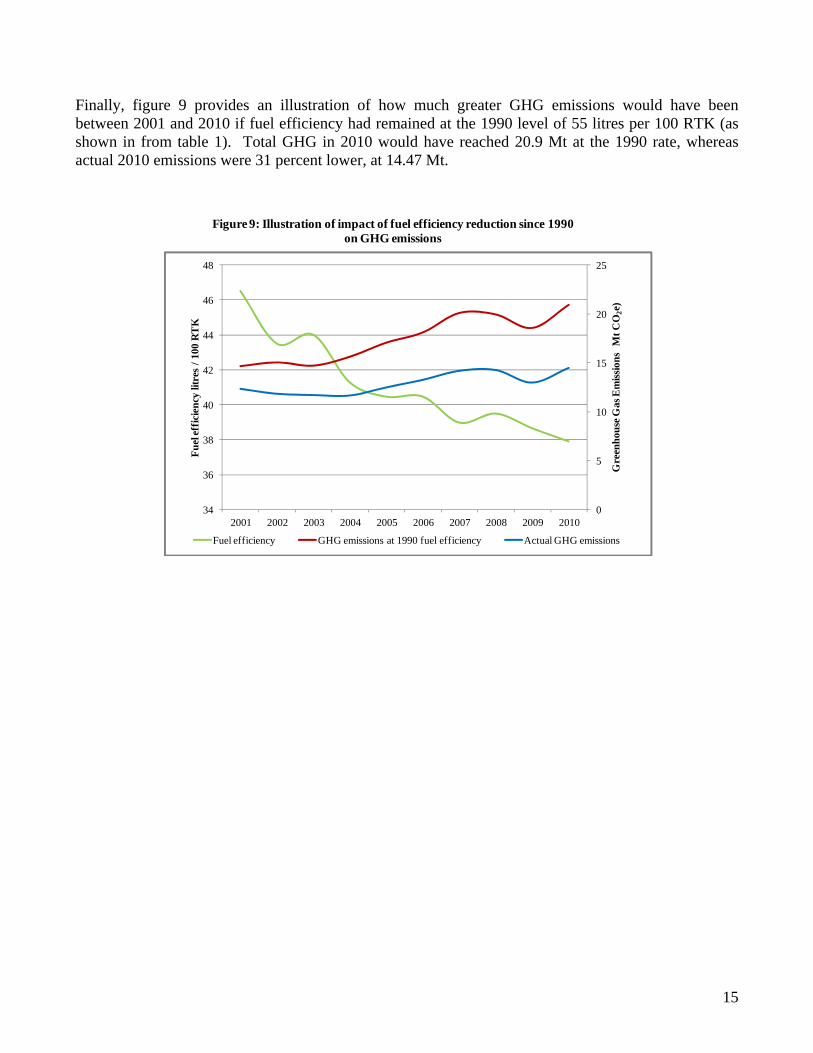
Finally, figure 9 provides an illustration of how much greater GHG emissions would have been between 2001 and 2010 if fuel efficiency had remained at the 1990 level of 55 litres per 100 RTK (as shown in from table 1). Total GHG in 2010 would have reached 20.9 Mt at the 1990 rate, whereas actual 2010 emissions were 31 percent lower, at 14.47 Mt.
Figure 9: Illustration of impact of fuel efficiency reduction since 1990 on GHG emissions
0
5
10
15
20
25
34
36
38
40
42
44
46
48
2001 2002 2003 2004 2005 2006 2007 2008 2009 2010
Gre
enho
use G
as E
miss
ions
Mt C
O2e
)
Fuel
effic
ienc
y lit
res
/ 100
RT
K
Fuel efficiency GHG emissions at 1990 fuel efficiency Actual GHG emissions
15
4. Activities Supporting the MOU 4.1 ATAC Activities Activities Undertaken by ATAC In addition to initial development and subsequent maintenance of the AGERS database, ATAC has continuously encouraged its member companies to submit data for AGERS under the auspices of the MOU. This has taken place through regular emails and articles in Flightplan, ATAC’s magazine. Presentations have also been given directly to member companies and at the annual Airline Operations Environmental Affairs Committee meeting. As a result of these efforts, ATAC has been able to capture data covering Canadian domestic passenger and cargo traffic. ATAC continues to promote participation in this system and in the objectives of the MOU to its membership. ATAC was actively involved and also encouraged its members to participate in ICAO meetings and conferences providing valuable input into discussions of the international emissions reductions initiatives. Activities Undertaken by ATAC Members In addition to the data collected in the AGERS system, the MOU sets out an action plan for the reduction of GHGs from the aviation sector. Various methods for improving operational efficiencies and reducing emissions are set out in the MOU and its appendices. ATAC members have instituted new procedures to limit fuel burn and make their operations more efficient and respectful of the environment. ATAC members have taken very seriously the goals set out in the voluntary agreement, and have achieved better than projected efficiency improvements. ATAC members implemented operational changes, modifications and renewal of aircraft fleets that contributed to a reduction of the amount of fuel consumed and improvements in fuel efficiency in the aviation sector. 4.2 Activities by NACC and its Members NACC and its member carriers are committed to delivering environmentally responsible air travel and working to continually reduce the industry’s environmental impact and aggressively curtail its emissions. To demonstrate to Canadians that the NACC airlines are committed to finding cost-effective solutions for better environmental performance, the association has a standing Environment Subcommittee. Through this committee, the member carriers are working towards:
• developing a principled industry position on environmental issues;
16
• informing governments and the public on significant environmental improvements made by the airlines;
• demonstrating the airline industry’s commitment to the environment. The committee also ensures that its carriers have a forum to jointly address mutually applicable issues. One important issue was the commitment, support and participation of its member airlines with regard to the MOU. NACC made available the resources to facilitate the generation of this report and ensured that all of its members participated in the data gathering. It also ensures the Environmental Subcommittee has engaged in dialogue with Transport Canada and Environment Canada. In 2009, NACC launched its association web site, which outlines its commitment to reducing its environmental impact. The latest MOU report is posted on the web site. NACC continues to promote to its members’ participation in the MOU. Activities Undertaken by NACC Members
NACC’s member companies continue to develop and implement new aircraft operating procedures to limit fuel burn and improve the efficiency of their operations. Because of the collective nature of the reporting, these activities are listed below but are not attributed to specific airlines. Certain members of NACC are also members of other industry associations such as the International Air Transportation Association (IATA), the Airlines for America (A4A, formerly Air Transport Association of America), and the Regional Airline Association (RAA). Participation in the environmental committees of these other industry associations allows respective NACC carriers to keep abreast of environmental issues internationally and in the United States of America. It also allows them to participate in international forums such as those for alternative fuels and in the ICAO Committee for Aviation Environmental Protection (CAEP) and its various working groups and task groups. Activities under the Freight Sustainability Demonstration Program (FSDP) and the Freight Efficiency Program (FEP) In 2010, no new activities were undertaken by NACC member companies in either the FSDP or the FEP. Other Activities Undertaken by NACC Members NACC members continue to invest in their respective fleet renewal programs, which will continue to introduce new, more efficient aircraft into their fleets. The carriers also continue to institute policies, procedures, programs and projects that impact their operations by either improving efficiency or reducing fuel burn and hence reducing CO2 emissions. The ongoing benefits fall into the following categories:
• Aircraft modifications and maintenance • Aircraft operation • Cargo and Baggage Operations
17
• In flight/catering • Ground equipment operations
A list of activities undertaken in the above areas has been included in previous MOU reports for the years 2008 and 2009.
Conclusion on NACC Activities The 2010 data and the historical data for the years 2005 through 2009 inclusive demonstrate the commitment of NACC members to achieving the targets of the June 29, 2005 MOU. For the period 2005 through 2010, the carriers achieved an efficiency improvement in Litres/RTK of 6.6 percent or an average 1.3 percent per year. In 2010 they achieved a 31 percent improvement compared to the 1990 baseline for an average improvement of 1.6 percent per year and they exceeded the MOU target for 2012 by 9.3 percent. 4.3 Looking Ahead To ensure the continuous improvement of their operating efficiency, the NACC and ATAC member carriers continue to participate in discussions with Transport Canada to revise the existing MOU or enter into a new agreement. Key areas of interest for NACC and ATAC members include:
1. Development and implementation of more efficient ATC procedures to allow operators to fully utilize the capabilities of their aircraft and operate them in the most efficient manner possible;
2. Engagement of stakeholders to ensure that emission reduction initiatives can be achieved while still minimizing the impact of noise on affected communities; and
3. Advancement of the development and production of sustainable alternative aviation fuels for use by the Canadian airline industry.
5. Conclusions The expressed goal of the MOU was to:
“… reduce collective ATAC member fleet greenhouse gas emissions on a per unit basis (through fuel efficiency improvements, e.g. reduction in litres of fuel/Revenue Tonne Kilometre) by an average of 1.1 percent per annum, reaching a cumulative improvement of 24 percent in 2012 compared to the 1990 base case scenario.”
Statistics of passenger and cargo operations and associated fuel use provided by ATAC and NACC for 2010 show that the combined performance of their reporting members continues to exceed that goal. In 2010 industry activity rebounded after the worldwide downturn in economic activity: reported RPK rose by 9.5 percent, after falling by 6.3 percent in the previous year. This is reflected in an increase of 11.5 percent in total fuel consumption by the reporting air carriers from the 5.08 billion litres reported for 2009 to 5.66 billion litres in 2010. Consequently, the total GHG emissions in 2010 were also 11.5 percent greater than in 2009, at 14.47 Mt, compared to the (revised) total of 13.0 Mt reported for 2009. The fuel consumption rate reported for 2010 was 0.379 litres per RTK (combining both
18
passenger and cargo traffic), and the emissions rate was 969 grams CO2e per RTK. Both rates were 1.9 percent below those reported for 2009. From 1990 to 2010, an average annual reduction in fuel consumption and GHG emissions per RTK of 1.9 percent was achieved, compared to the target of 1.1 percent per year under the MOU. To 2010, the industry had achieved a 31 percent cumulative reduction between 1990 and 2010, compared to the target of 24 percent in 2012.
19
Contact Information For comments on this report or further information, please contact the following:
Air Transport Association of Canada 255 Albert Street, Suite 700 Ottawa, Ontario K1P 6A9 Telephone: (613) 233-7727 Facsimile: (613) 230-8648 Email: [email protected]
National Airlines Council of Canada 116 Lisgar Street, Suite 600 Ottawa, Ontario K2P 0C2 Tel.: 613-231-7223 Fax: 613-248-4566 Email: [email protected].
20
21
Glossary of Acronyms APU: Auxiliary Power Unit ASK: Available Seat Kilometres ASM: Available Seat Miles ATAC: Air Transport Association of Canada ATK: Available Tonne Kilometres ATM: Available Ton Miles CH4: Methane CAEP: Committee on Aviation Environmental Protection CG: Center of Gravity CO2: Carbon Dioxide CO2e: Carbon Dioxide equivalent, which for aviation jet fuel includes CO2, CH4, and N2O Fuel Used: Aviation Jet Fuel measured in litres GHG: Greenhouse Gases IATA: International Air Transport Association ICAO: International Civil Aviation Organization IFR: Instrument Flight Rules MOU: Memorandum of Understanding NACC: National Airlines Council of Canada NADP2: Noise Abatement Departure Procedure 2 N2O: Nitrous Oxide RNP: Required Navigation Performance RPK: Revenue Passenger Kilometres RPM: Revenue Passenger Miles RTK: Revenue Tonne Kilometres SI: Système international d’unités – International System of Units TC: Transport Canada
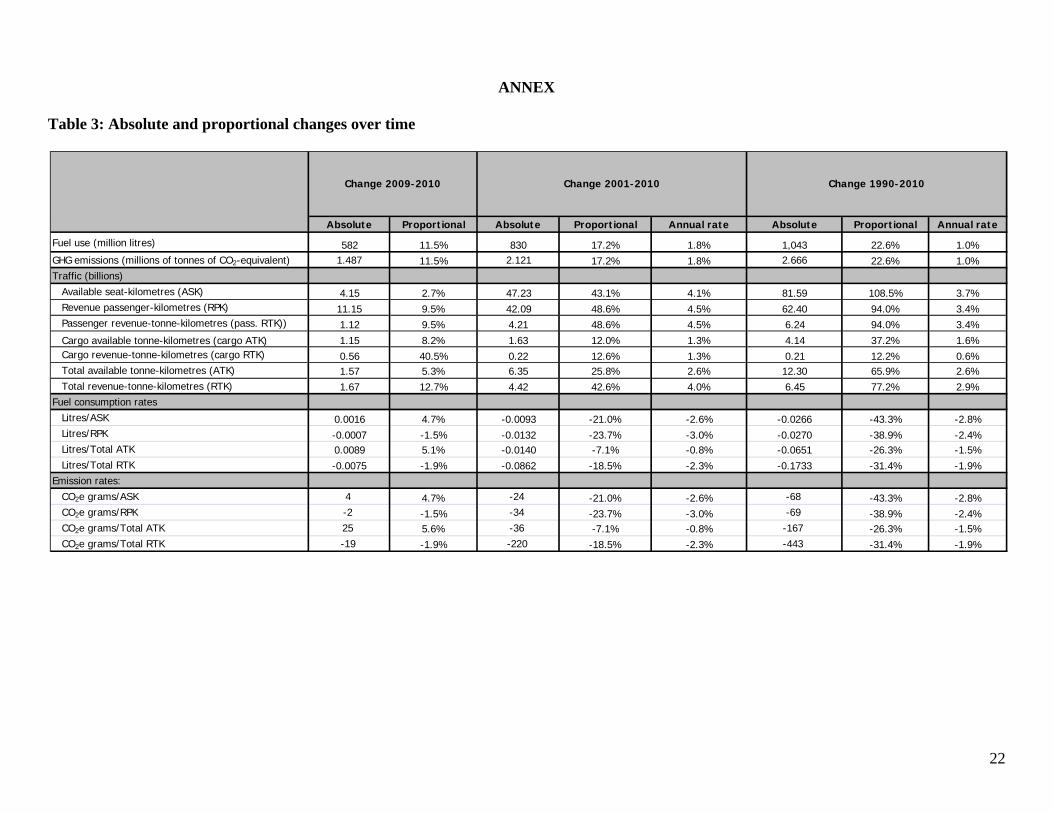
ANNEX Table 3: Absolute and proportional changes over time
Absolute Proportional Absolute Proportional Annual rate Absolute Proportional Annual rate
Fuel use (million litres) 582 11.5% 830 17.2% 1.8% 1,043 22.6% 1.0%GHG emissions (millions of tonnes of CO2-equivalent) 1.487 11.5% 2.121 17.2% 1.8% 2.666 22.6% 1.0%Traffic (billions)
Available seat-kilometres (ASK) 4.15 2.7% 47.23 43.1% 4.1% 81.59 108.5% 3.7%Revenue passenger-kilometres (RPK) 11.15 9.5% 42.09 48.6% 4.5% 62.40 94.0% 3.4%Passenger revenue-tonne-kilometres (pass. RTK)) 1.12 9.5% 4.21 48.6% 4.5% 6.24 94.0% 3.4%Cargo available tonne-kilometres (cargo ATK) 1.15 8.2% 1.63 12.0% 1.3% 4.14 37.2% 1.6%Cargo revenue-tonne-kilometres (cargo RTK) 0.56 40.5% 0.22 12.6% 1.3% 0.21 12.2% 0.6%Total available tonne-kilometres (ATK) 1.57 5.3% 6.35 25.8% 2.6% 12.30 65.9% 2.6%Total revenue-tonne-kilometres (RTK) 1.67 12.7% 4.42 42.6% 4.0% 6.45 77.2% 2.9%
Fuel consumption ratesLitres/ASK 0.0016 4.7% -0.0093 -21.0% -2.6% -0.0266 -43.3% -2.8%Litres/RPK -0.0007 -1.5% -0.0132 -23.7% -3.0% -0.0270 -38.9% -2.4%Litres/Total ATK 0.0089 5.1% -0.0140 -7.1% -0.8% -0.0651 -26.3% -1.5%Litres/Total RTK -0.0075 -1.9% -0.0862 -18.5% -2.3% -0.1733 -31.4% -1.9%
Emission rates:CO2e grams/ASK 4 4.7% -24 -21.0% -2.6% -68 -43.3% -2.8%CO2e grams/RPK -2 -1.5% -34 -23.7% -3.0% -69 -38.9% -2.4%CO2e grams/Total ATK 25 5.6% -36 -7.1% -0.8% -167 -26.3% -1.5%CO2e grams/Total RTK -19 -1.9% -220 -18.5% -2.3% -443 -31.4% -1.9%
Change 2009-2010 Change 2001-2010 Change 1990-2010
22
23
ENDNOTES 1. Memorandum of Understanding Between Transport Canada and the Air Transport Association of Canada, signed June 29, 2005, available from Transport Canada Environmental Policy Directorate. 2. Air Transport Association of Canada: “Voluntary Agreement on the Reduction of Greenhouse Gas Emissions 2006 Annual Report,” February 2008. 3. “Voluntary Agreement of the Reduction of Greenhouse Gas Emissions, 2007Annual Report”. 4. National Airlines Council of Canada: “Voluntary Agreement for the Reduction Of Greenhouse Gas Emissions Annual Report 2008”. 5. “2008 Canadian Aviation Industry Report on Emissions Reductions”, January 2010. 6. National Airlines Council of Canada: “Voluntary Agreement for the Reduction of Greenhouse Gas Emissions, Annual Report 2009”. 7. “2009 Canadian Aviation Industry Report on Emissions Reductions”, October 2010. 8. ICAO, Committee on Aviation Environmental Protection: “Template and Guidance on Voluntary Measures”, available at http://legacy.icao.int/env/measures/Caep_Template.pdf. 9. “Template and Guidance…”, p.1. 10. See IATA statement at http://www.iata.org/SiteCollectionDocuments/Documents/Global_Approach_Reducing_Emissions_251109web.pdf. 11. “2008 Canadian Aviation Industry Report on Emissions Reductions”, January 2010. 12. The emission factors remain the same in the latest version of the Inventory, for 2009, available from Environment Canada through: http://www.ec.gc.ca/Publications/default.asp?lang=En&xml=A07097EF-8EE1-4FF0-9AFB-6C392078D1A9 13. Statistics Canada: Aviation in Canada, Catalogue no. 51-206. 14. Note that comparison of 2010 to 2009 is slightly exaggerated due to the inclusion of Porter Airlines in 2010 only.