Embed Size (px)
Citation preview
2010 FinancialStatements
ConsolidatedFinancialStatements ofthe Nestlé Group
144th FinancialStatements ofNestlé S.A.

41Consolidated Financial Statements of the Nestlé Group 2010
Consolidated Financial Statements of the Nestlé Group
42 Consolidated Financial Statements of the Nestlé Group 2010
Principal exchange rates
Consolidated income statement for the year ended 31 December 2010
Consolidated statement of comprehensive income for the year ended 31 December 2010
Consolidated balance sheet as at 31 December 2010
Consolidated cash fl ow statement for the year ended 31 December 2010
Consolidated statement of changes in equity for the year ended 31 December 2010
Notes
1. Accounting policies
2. Acquisitions, disposals and discontinued operations
3. Analyses by segment
4. Net other income/(expenses)
5. Inventories
6. Trade and other receivables
7. Property, plant and equipment
8. Goodwill
9. Intangible assets
10. Employee benefi ts
11. Equity compensation plans
12. Provisions and contingencies
13. Net fi nancing cost and fi nancial instruments
14. Taxes
15. Associates
16. Earnings per share
17. Cash fl ow statement
18. Equity
19. Lease commitments
20. Transactions with related parties
21. Joint ventures
22. Guarantees
23. Group risk management
24. Events after the balance sheet date
25. Group companies
Report of the Statutory Auditor on the Consolidated Financial Statements
Financial information – 5 year review
Companies of the Nestlé Group
43
44
45
46
48
49
50
50626670717172747880858890
102104105105107109110111111112113113
114
116
118
43Consolidated Financial Statements of the Nestlé Group 2010
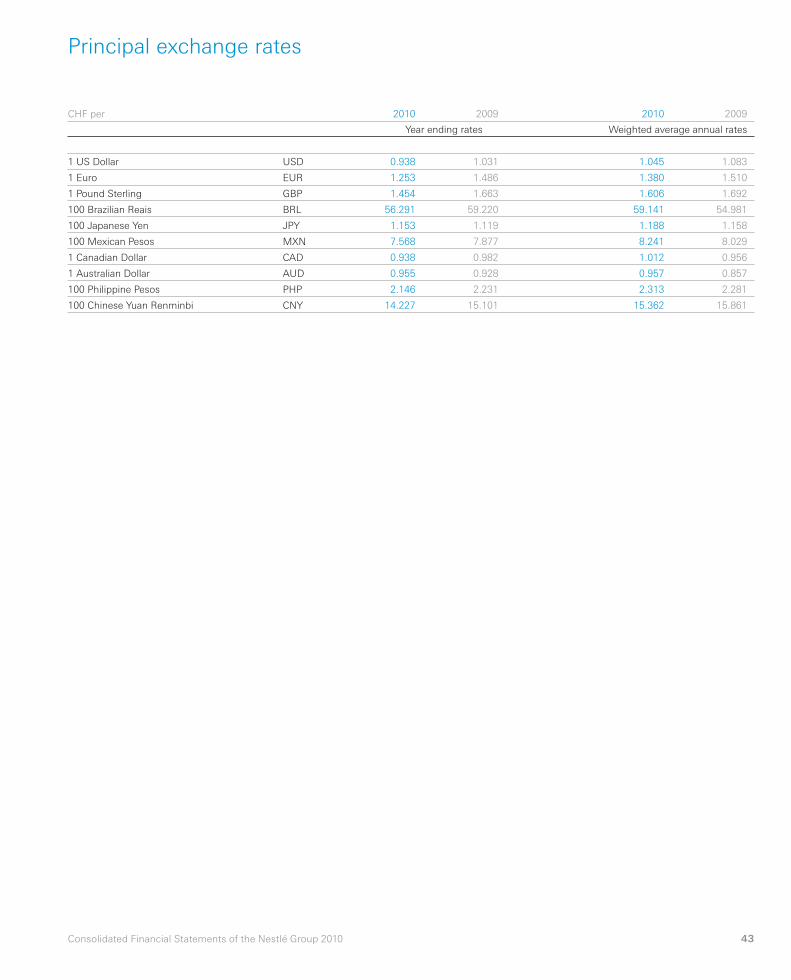
Principal exchange rates
CHF per 2010 2009 2010 2009
Year ending rates Weighted average annual rates
1 US Dollar USD 0.938 1.031 1.045 1.083
1 Euro EUR 1.253 1.486 1.380 1.510
1 Pound Sterling GBP 1.454 1.663 1.606 1.692
100 Brazilian Reais BRL 56.291 59.220 59.141 54.981
100 Japanese Yen JPY 1.153 1.119 1.188 1.158
100 Mexican Pesos MXN 7.568 7.877 8.241 8.029
1 Canadian Dollar CAD 0.938 0.982 1.012 0.956
1 Australian Dollar AUD 0.955 0.928 0.957 0.857
100 Philippine Pesos PHP 2.146 2.231 2.313 2.281
100 Chinese Yuan Renminbi CNY 14.227 15.101 15.362 15.861
44 Consolidated Financial Statements of the Nestlé Group 2010
Consolidated income statementfor the year ended 31 December 2010
In millions of CHF Notes 2010 2009
Co
ntin
uin
g
op
era
tio
ns
Dis
co
ntin
ued
op
era
tio
ns
(a)
Tota
l
Co
ntin
uin
g
op
era
tio
ns
Dis
co
ntin
ued
op
era
tio
ns
(a)
Tota
l
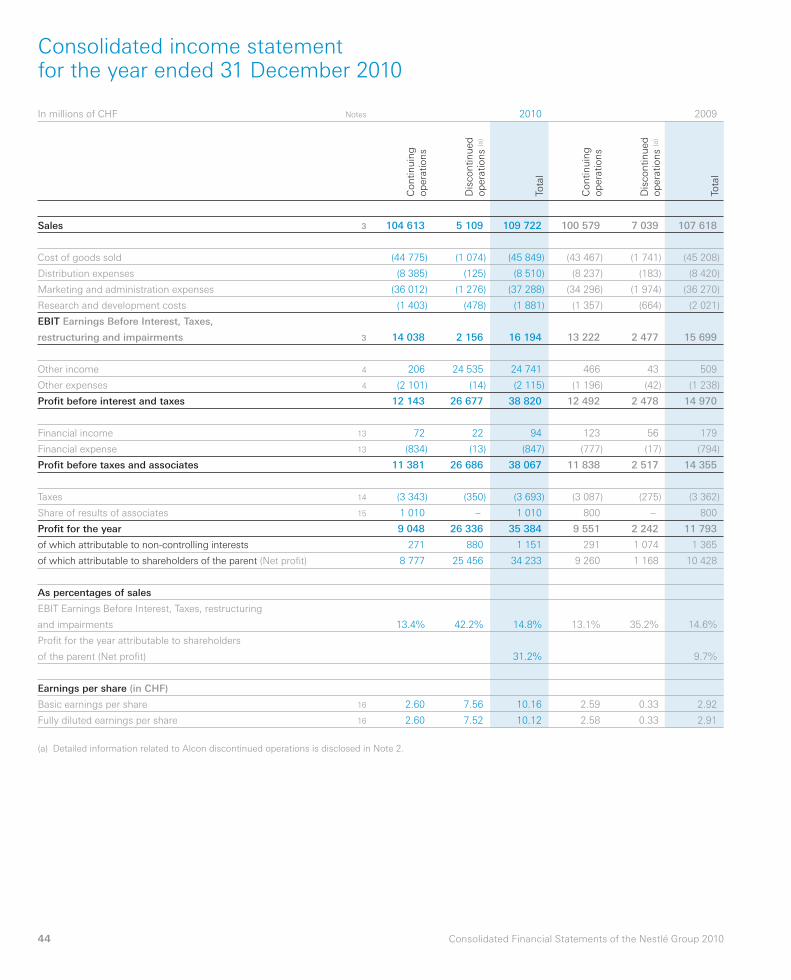
Sales 3 104 613 5 109 109 722 100 579 7 039 107 618
Cost of goods sold (44 775) (1 074) (45 849) (43 467) (1 741) (45 208)
Distribution expenses (8 385) (125) (8 510) (8 237) (183) (8 420)
Marketing and administration expenses (36 012) (1 276) (37 288) (34 296) (1 974) (36 270)
Research and development costs (1 403) (478) (1 881) (1 357) (664) (2 021)
EBIT Earnings Before Interest, Taxes,
restructuring and impairments 3 14 038 2 156 16 194 13 222 2 477 15 699
Other income 4 206 24 535 24 741 466 43 509
Other expenses 4 (2 101) (14) (2 115) (1 196) (42) (1 238)
Profi t before interest and taxes 12 143 26 677 38 820 12 492 2 478 14 970
Financial income 13 72 22 94 123 56 179
Financial expense 13 (834) (13) (847) (777) (17) (794)
Profi t before taxes and associates 11 381 26 686 38 067 11 838 2 517 14 355
Taxes 14 (3 343) (350) (3 693) (3 087) (275) (3 362)
Share of results of associates 15 1 010 – 1 010 800 – 800
Profi t for the year 9 048 26 336 35 384 9 551 2 242 11 793
of which attributable to non-controlling interests 271 880 1 151 291 1 074 1 365
of which attributable to shareholders of the parent (Net profi t) 8 777 25 456 34 233 9 260 1 168 10 428
As percentages of sales
EBIT Earnings Before Interest, Taxes, restructuring
and impairments 13.4% 42.2% 14.8% 13.1% 35.2% 14.6%
Profi t for the year attributable to shareholders
of the parent (Net profi t) 31.2% 9.7%
Earnings per share (in CHF)
Basic earnings per share 16 2.60 7.56 10.16 2.59 0.33 2.92
Fully diluted earnings per share 16 2.60 7.52 10.12 2.58 0.33 2.91
(a) Detailed information related to Alcon discontinued operations is disclosed in Note 2.
45Consolidated Financial Statements of the Nestlé Group 2010
Consolidated statement of comprehensive incomefor the year ended 31 December 2010
In millions of CHF 2010 2009
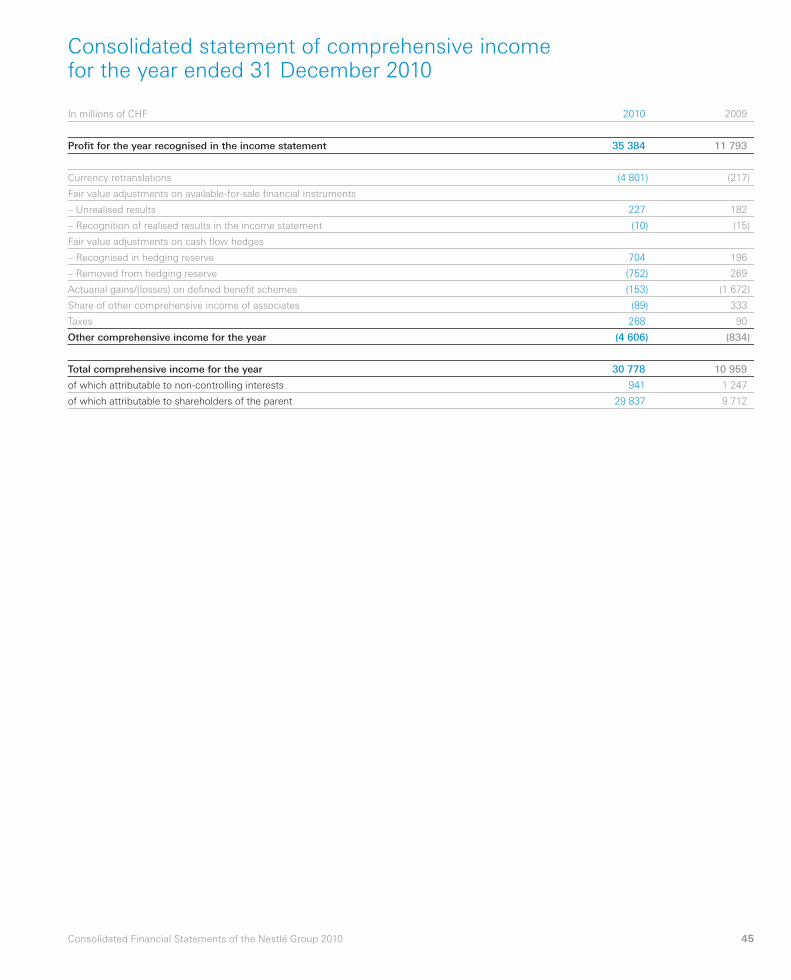
Profi t for the year recognised in the income statement 35 384 11 793
Currency retranslations (4 801) (217)
Fair value adjustments on available-for-sale fi nancial instruments
– Unrealised results 227 182
– Recognition of realised results in the income statement (10) (15)
Fair value adjustments on cash fl ow hedges
– Recognised in hedging reserve 704 196
– Removed from hedging reserve (752) 269
Actuarial gains/(losses) on defi ned benefi t schemes (153) (1 672)
Share of other comprehensive income of associates (89) 333
Taxes 268 90
Other comprehensive income for the year (4 606) (834)
Total comprehensive income for the year 30 778 10 959
of which attributable to non-controlling interests 941 1 247
of which attributable to shareholders of the parent 29 837 9 712
46 Consolidated Financial Statements of the Nestlé Group 2010
Consolidated balance sheet as at 31 December 2010before appropriations
In millions of CHF Notes 2010 2009
Assets
Current assets
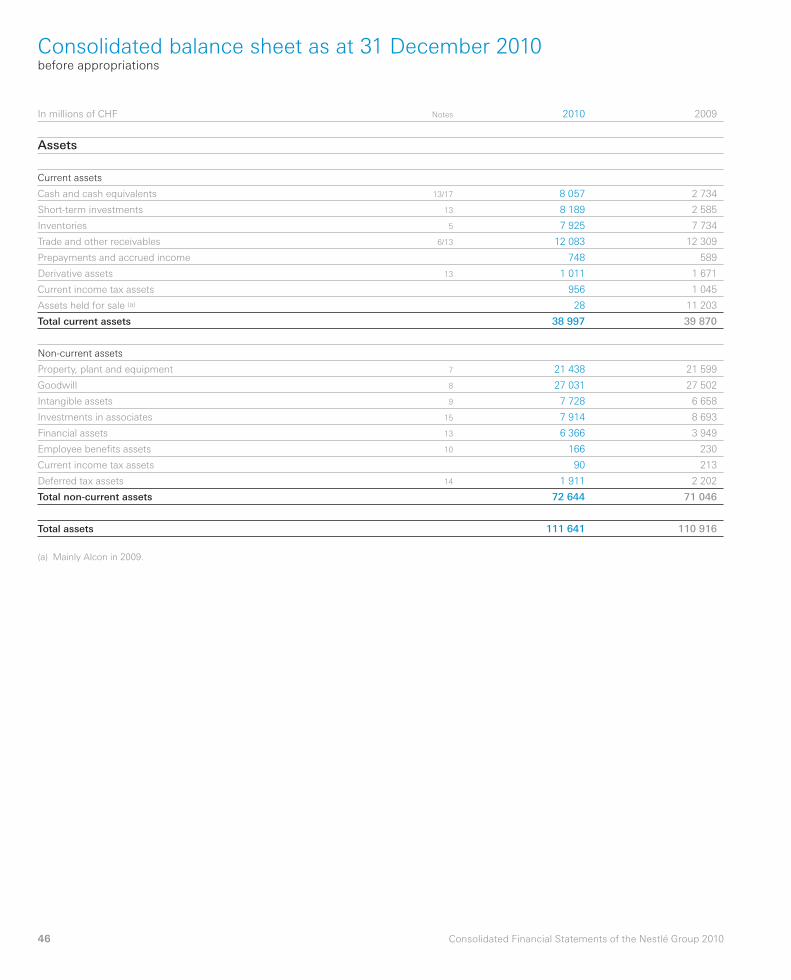
Cash and cash equivalents 13/17 8 057 2 734
Short-term investments 13 8 189 2 585
Inventories 5 7 925 7 734
Trade and other receivables 6/13 12 083 12 309
Prepayments and accrued income 748 589
Derivative assets 13 1 011 1 671
Current income tax assets 956 1 045
Assets held for sale (a) 28 11 203
Total current assets 38 997 39 870
Non-current assets
Property, plant and equipment 7 21 438 21 599
Goodwill 8 27 031 27 502
Intangible assets 9 7 728 6 658
Investments in associates 15 7 914 8 693
Financial assets 13 6 366 3 949
Employee benefi ts assets 10 166 230
Current income tax assets 90 213
Deferred tax assets 14 1 911 2 202
Total non-current assets 72 644 71 046
Total assets 111 641 110 916
(a) Mainly Alcon in 2009.
47Consolidated Financial Statements of the Nestlé Group 2010
Consolidated balance sheet as at 31 December 2010 (continued)
In millions of CHF Notes 2010 2009
Liabilities and equity
Current liabilities
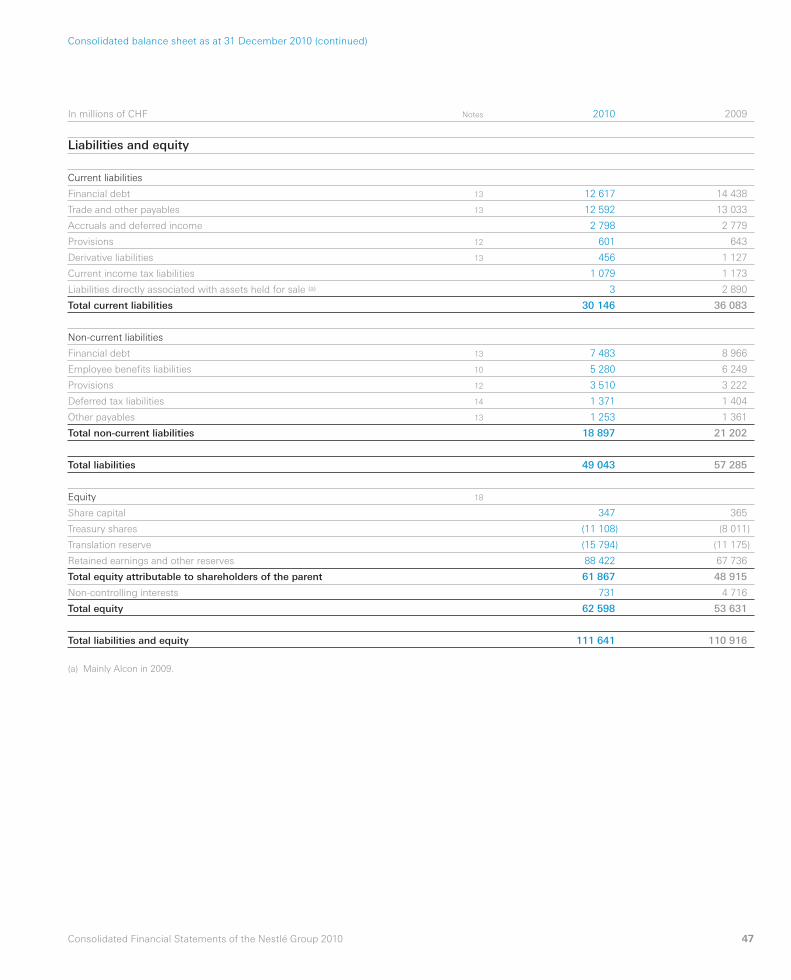
Financial debt 13 12 617 14 438
Trade and other payables 13 12 592 13 033
Accruals and deferred income 2 798 2 779
Provisions 12 601 643
Derivative liabilities 13 456 1 127
Current income tax liabilities 1 079 1 173
Liabilities directly associated with assets held for sale (a) 3 2 890
Total current liabilities 30 146 36 083
Non-current liabilities
Financial debt 13 7 483 8 966
Employee benefi ts liabilities 10 5 280 6 249
Provisions 12 3 510 3 222
Deferred tax liabilities 14 1 371 1 404
Other payables 13 1 253 1 361
Total non-current liabilities 18 897 21 202
Total liabilities 49 043 57 285
Equity 18
Share capital 347 365
Treasury shares (11 108) (8 011)
Translation reserve (15 794) (11 175)
Retained earnings and other reserves 88 422 67 736
Total equity attributable to shareholders of the parent 61 867 48 915
Non-controlling interests 731 4 716
Total equity 62 598 53 631
Total liabilities and equity 111 641 110 916
(a) Mainly Alcon in 2009.
48 Consolidated Financial Statements of the Nestlé Group 2010
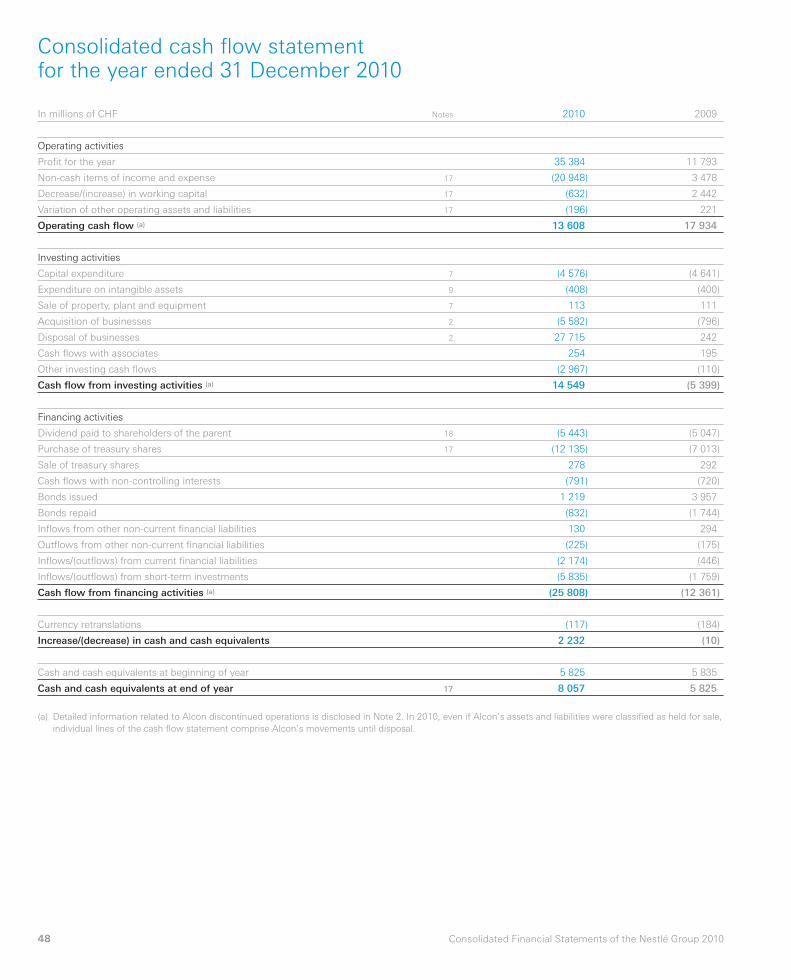
Consolidated cash fl ow statementfor the year ended 31 December 2010
In millions of CHF Notes 2010 2009
Operating activities
Profi t for the year 35 384 11 793
Non-cash items of income and expense 17 (20 948) 3 478
Decrease/(increase) in working capital 17 (632) 2 442
Variation of other operating assets and liabilities 17 (196) 221
Operating cash fl ow (a) 13 608 17 934
Investing activities
Capital expenditure 7 (4 576) (4 641)
Expenditure on intangible assets 9 (408) (400)
Sale of property, plant and equipment 7 113 111
Acquisition of businesses 2 (5 582) (796)
Disposal of businesses 2 27 715 242
Cash fl ows with associates 254 195
Other investing cash fl ows (2 967) (110)
Cash fl ow from investing activities (a) 14 549 (5 399)
Financing activities
Dividend paid to shareholders of the parent 18 (5 443) (5 047)
Purchase of treasury shares 17 (12 135) (7 013)
Sale of treasury shares 278 292
Cash fl ows with non-controlling interests (791) (720)
Bonds issued 1 219 3 957
Bonds repaid (832) (1 744)
Infl ows from other non-current fi nancial liabilities 130 294
Outfl ows from other non-current fi nancial liabilities (225) (175)
Infl ows/(outfl ows) from current fi nancial liabilities (2 174) (446)
Infl ows/(outfl ows) from short-term investments (5 835) (1 759)
Cash fl ow from fi nancing activities (a) (25 808) (12 361)
Currency retranslations (117) (184)
Increase/(decrease) in cash and cash equivalents 2 232 (10)
Cash and cash equivalents at beginning of year 5 825 5 835
Cash and cash equivalents at end of year 17 8 057 5 825
(a) Detailed information related to Alcon discontinued operations is disclosed in Note 2. In 2010, even if Alcon’s assets and liabilities were classifi ed as held for sale,
individual lines of the cash fl ow statement comprise Alcon’s movements until disposal.
49Consolidated Financial Statements of the Nestlé Group 2010
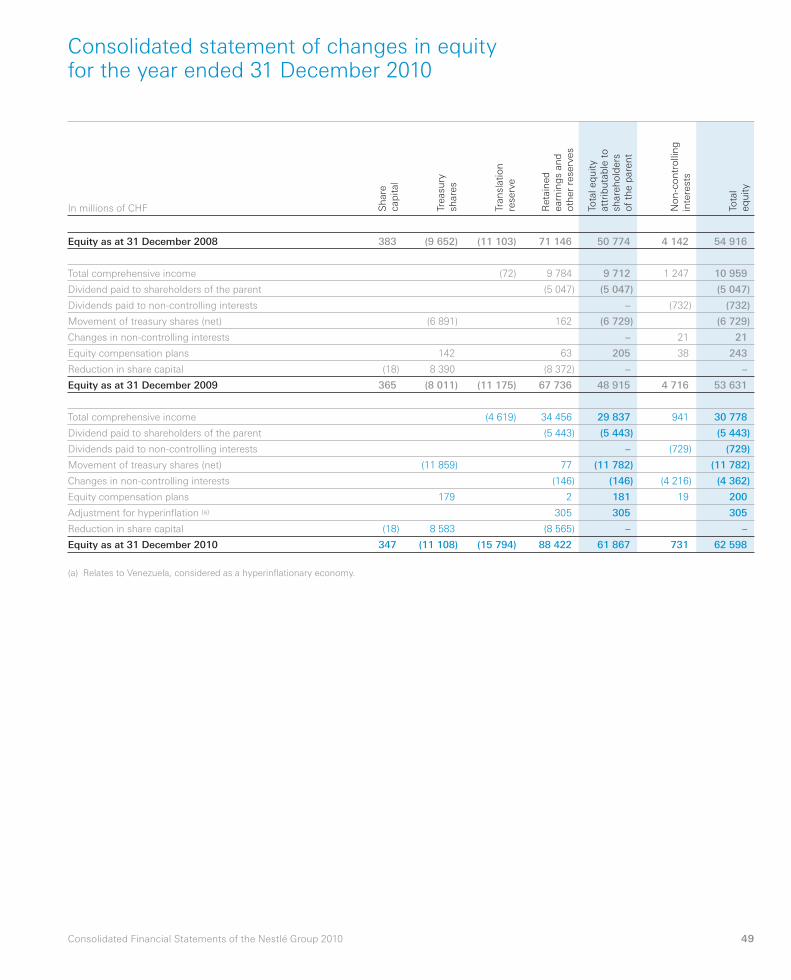
Consolidated statement of changes in equity for the year ended 31 December 2010
In millions of CHF Sh
are
cap
ital
Treasu
ry
share
s
Tran
slatio
n
rese
rve
Reta
ined
earn
ing
s an
d
oth
er
rese
rves
Tota
l eq
uity
att
rib
uta
ble
to
share
ho
lders
of
the p
are
nt
No
n-c
on
tro
llin
g
inte
rest
s
Tota
l
eq
uity
Equity as at 31 December 2008 383 (9 652) (11 103) 71 146 50 774 4 142 54 916
Total comprehensive income (72) 9 784 9 712 1 247 10 959
Dividend paid to shareholders of the parent (5 047) (5 047) (5 047)
Dividends paid to non-controlling interests – (732) (732)
Movement of treasury shares (net) (6 891) 162 (6 729) (6 729)
Changes in non-controlling interests – 21 21
Equity compensation plans 142 63 205 38 243
Reduction in share capital (18) 8 390 (8 372) – –
Equity as at 31 December 2009 365 (8 011) (11 175) 67 736 48 915 4 716 53 631
Total comprehensive income (4 619) 34 456 29 837 941 30 778
Dividend paid to shareholders of the parent (5 443) (5 443) (5 443)
Dividends paid to non-controlling interests – (729) (729)
Movement of treasury shares (net) (11 859) 77 (11 782) (11 782)
Changes in non-controlling interests (146) (146) (4 216) (4 362)
Equity compensation plans 179 2 181 19 200
Adjustment for hyperinfl ation (a) 305 305 305
Reduction in share capital (18) 8 583 (8 565) – –
Equity as at 31 December 2010 347 (11 108) (15 794) 88 422 61 867 731 62 598
(a) Relates to Venezuela, considered as a hyperinfl ationary economy.
50 Consolidated Financial Statements of the Nestlé Group 2010
Notes
1. Accounting policies
Accounting convention and accounting standardsThe Consolidated Financial Statements comply with
International Financial Reporting Standards (IFRS) issued
by the International Accounting Standards Board (IASB)
and with the Interpretations issued by the International
Financial Reporting Interpretations Committee (IFRIC).
The Consolidated Financial Statements have been
prepared on an accrual basis and under the historical cost
convention, unless stated otherwise. All signifi cant
consolidated companies and associates have a 31 December
accounting year-end.
The preparation of the Consolidated Financial Statements
requires Group Management to exercise judgement and to
make estimates and assumptions that affect the application
of policies, reported amounts of revenues, expenses, assets
and liabilities and disclosures. These estimates and
associated assumptions are based on historical experience
and various other factors that are believed to be reasonable
under the circumstances. Actual results may differ from
these estimates.
The estimates and underlying assumptions are reviewed
on an ongoing basis. Revisions to accounting estimates are
recognised in the period in which the estimate is revised if
the revision affects only that period, or in the period of the
revision and future periods if the revision affects both
current and future periods. Those areas affect mainly
provisions, goodwill impairment tests, employee benefi ts,
allowance for doubtful receivables, share-based payments
and taxes, and key assumptions are detailed in the related
notes.
Scope of consolidationThe Consolidated Financial Statements comprise those
of Nestlé S.A. and of its affi liated companies, including
joint ventures and associates (the Group). The list of the
principal companies is provided in the section “Companies
of the Nestlé Group.”
Consolidated companiesCompanies, in which the Group has the power to exercise
control, are fully consolidated. This applies irrespective of
the percentage of interest in the share capital. Control refers
to the power to govern the fi nancial and operating policies
of a company so as to obtain the benefi ts from its activities.
Non-controlling interests are shown as a component of equity
in the balance sheet and the share of the profi t attribu table
to non-controlling interests is shown as a component of
profi t for the year in the income statement.
Proportionate consolidation is applied for companies
over which the Group exercises joint control with partners.
The individual assets, liabilities, income and expenses are
consolidated in proportion to the Nestlé participation in
their equity (usually 50%).
Newly acquired companies are consolidated from the
effective date of control, using the purchase method.
AssociatesCompanies where the Group has the power to exercise
a signifi cant infl uence but does not exercise control are
accounted for using the equity method. The net assets
and results are adjusted to comply with the Group’s
accounting policies. The carrying amount of goodwill
arising from the acquisition of associates is included in the
carrying amount of investments in associates.
Venture fundsInvestments in venture funds are recognised in accordance
with the consolidation methods described above,
depending on the level of control or signifi cant infl uence
exercised.
Foreign currenciesThe functional currency of the Group’s entities is the
currency of their primary economic environment.
In individual companies, transactions in foreign currencies
are recorded at the rate of exchange at the date of the
transaction. Monetary assets and liabilities in foreign
currencies are translated at year-end rates. Any resulting
exchange differences are taken to the income statement.
On consolidation, assets and liabilities of Group entities
reported in their functional currencies are translated into
Swiss Francs, the Group’s presentation currency, at year-
end exchange rates. Income and expense items are
translated into Swiss Francs at the annual weighted average
rates of exchange or at the rate on the date of the
transaction for signifi cant items.
Differences arising from the retranslation of opening net
assets of Group entities, together with differences arising
from the restatement of the net results for the year of Group
entities, are recognised in other comprehensive income.
51Consolidated Financial Statements of the Nestlé Group 2010
The balance sheet and net results of Group entities
operating in hyperinfl ationary economies are restated for
the changes in the general purchasing power of the local
currency, using offi cial indices at the balance sheet date,
before translation into Swiss Francs at year-end rates.
Segment reportingOperating segments refl ect the Group’s management
structure and the way fi nancial information is regularly
reviewed by the Group’s chief operating decision maker
(CODM), which is defi ned as the Executive Board.
The Group is focused in two areas of activity, Food and
Beverages, and Pharmaceuticals. The Group’s Food and
Beverages business is managed through three geographic
Zones and several Globally Managed Businesses (GMB).
Zones and GMB, that meet the quantitative threshold of
10% of sales, EBIT or assets, are presented on a
standalone basis as reportable segments. Other GMB
that do not meet the threshold, like Nestlé Professional,
Nespresso, and the food and beverages Joint Ventures,
are aggregated and presented in Other Food and
Beverages. The Group’s pharmaceutical activities are also
managed, and presented, sepa ra tely. Therefore, the
Group’s reportable operating segments are:
– Zone Europe;
– Zone Americas;
– Zone Asia, Oceania and Africa;
– Nestlé Waters;
– Nestlé Nutrition;
– Other Food and Beverages; and
– Pharma.
As some operating segments represent geographic zones,
information by product is also disclosed. The eight product
groups that are disclosed represent the highest categories
of products that are followed internally.
Finally, the Group provides information attributed to the
country of domicile of the Group’s parent company (Nestlé S.A.
– Switzerland) and to the ten most important countries in
terms of sales.
Segment results represent the contribution of the different
segments to central overheads, research and development
costs and the profi t of the Group. Specifi c corporate
expenses as well as specifi c research and development
costs are allocated to the corresponding segments.
Segment assets and liabilities are aligned with internal
repor ted information to the CODM. Segment assets comprise
property, plant and equipment, intangible assets, goodwill,
trade and other receivables, assets held for sale, inventories,
prepayments and accrued income as well as specifi c
fi nancial assets associated to the reportable segments.
Segment liabilities comprise trade and other pay ables,
liabilities directly associated with assets held for sale,
some other payables as well as accruals and deferred
income. Eliminations represent inter-company balances
between the different segments.
Segment assets by operating segment represent the
situa tion at the end of the year. Assets and liabilities by
product repre sent the annual average, as this provides
a better indication of the level of invested capital for
management purposes.
Capital additions represent the total cost incurred to
acquire property, plant and equipment, intangible assets
and goodwill, including those arising from business
combinations. Capital expenditure represents the
investment in property, plant and equipment only.
Depreciation of segment assets includes depreciation
of property, plant and equipment and amortisation of
intangible assets. Impairment of assets includes impairment
related to property, plant and equipment, intangible assets
and goodwill.
Unallocated items represent non-specifi c items whose
allocation to a segment would be arbitrary. They mainly
comprise:
– corporate expenses and related assets/liabilities;
– research and development costs and related assets/
liabilities; and
– some goodwill and intangible assets.
Non-current assets by geography include property,
plant and equipment, intangible assets and goodwill that
are attributable to the ten most important countries and
the country of domicile of Nestlé S.A.
Valuation methods, presentation and defi nitionsRevenueRevenue represents amounts received and receivable from
third parties for goods supplied to the customers and for
services rendered. Revenue from the sales of goods is
recognised in the income statement at the moment when
the signifi cant risks and rewards of ownership of the goods
1. Accounting policies (continued)
52 Consolidated Financial Statements of the Nestlé Group 2010
have been transferred to the buyer, which is mainly upon
shipment. It is measured at the list price applicable to
a given distribution channel after deduction of returns,
sales taxes, pricing allowances and similar trade discounts.
Payments made to the customers for commercial services
received are expensed.
ExpensesCost of goods sold is determined on the basis of the cost
of production or of purchase, adjusted for the variation of
inventories. All other expenses, including those in respect
of advertising and promotions, are recognised when the
Group receives the risks and rewards of ownership of the
goods or when it receives the services.
Net other income/(expenses)These comprise all exit costs including but not limited
to profi t and loss on disposal of property, plant and
equipment, profi t and loss on disposal of businesses,
onerous contracts, restructuring costs, impairment of
property, plant and equip ment, intangibles and goodwill.
Restructuring costs are restricted to dismissal
indemnities and employee benefi ts paid to terminated
employees upon the reorganisation of a business.
Dismissal indemnities paid for normal attrition such as
poor performance, professional misconduct, etc. are part
of the expenses by functions.
Net fi nancing costNet fi nancing cost includes the fi nancial expense on
borrowings from third parties as well as the fi nancial
income earned on funds invested outside the Group.
Net fi nancing cost also includes other fi nancial income
and expense, such as exchange differences on loans and
borrowings, results on foreign currency and interest rate
hedging instruments that are recognised in the income
statement. Certain borrowing costs are capitalised as
explained under the section on Property, plant and equipment.
Others are expensed.
Unwind of discount on provisions is presented in net
fi nancing cost.
TaxesThe Group is subject to taxes in different countries all over
the world. Taxes and fi scal risks recognised in the
Consolidated Financial Statements refl ect Group
Management’s best estimate of the outcome based on the
facts known at the balance sheet date in each individual
country. These facts may include but are not limited to
change in tax laws and interpretation thereof in the
various jurisdictions where the Group operates. They may
have an impact on the income tax as well as the resulting
assets and liabilities. Any differences between tax
estimates and fi nal tax assessments are charged to the
income statement in the period in which they are in curred,
unless anticipated.
Taxes include current taxes on profi t and other taxes
such as taxes on capital. Also included are actual or
potential withholding taxes on current and expected
transfers of income from Group companies and tax
adjustments relating to prior years. Income tax is
recognised in the income statement, except to the extent
that it relates to items directly taken to equity or other
comprehensive income, in which case it is recognised
against equity or other comprehensive income.
Deferred taxation is the tax attributable to the
temporary differences that arise when taxation authorities
recognise and measure assets and liabilities with rules
that differ from the principles of the Consolidated
Financial Statements. It also arises on temporary
differences stemming from tax losses carried forward.
Deferred taxes are calculated under the liability method
at the rates of tax expected to prevail when the temporary
differences reverse subject to such rates being
substantially enacted at the balance sheet date. Any
changes of the tax rates are recognised in the income
statement unless related to items directly recognised
against equity or other compre hensive income. Deferred
tax liabilities are recognised on all taxable temporary
differences excluding non-deductible goodwill. Deferred
tax assets are recognised on all deductible tem po rary
differences provided that it is probable that future taxable
income will be available.
For share-based payments, a deferred tax asset is
recognised in the income statement over the vesting
period, pro vided that a future reduction of the tax expense
is both probable and can be reliably estimated. The
deferred tax asset for the future tax deductible amount
exceeding the total share-based payment cost is
recognised in equity.
1. Accounting policies (continued)
53Consolidated Financial Statements of the Nestlé Group 2010
Financial instrumentsClasses of fi nancial instrumentsThe Group aggregates its fi nancial instruments into classes
based on their nature and characteristics. The details of
fi nancial instruments by class are disclosed in the notes.
Financial assetsFinancial assets are initially recognised at fair value plus
directly attributable transaction costs. However when
a fi nancial asset at fair value through profi t or loss is
recognised, the transaction costs are expensed
immediately. Subsequent remeasurement of fi nancial
assets is determined by their classifi cation that is revisited
at each reporting date.
Derivatives embedded in other contracts are separated
and treated as stand-alone derivatives when their risks
and characteristics are not closely related to those of their
host contracts and the respective host contracts are not
carried at fair value.
In case of regular way purchase or sale (purchase or
sale under a contract whose terms require delivery within
the time frame established by regulation or convention in
the market place), the settlement date is used for both
initial recognition and subsequent derecognition.
At each balance sheet date, the Group assesses
whether its fi nancial assets are to be impaired. Impairment
losses are recognised in the income statement where
there is objective evidence of impairment, such as where
the issuer is in bankruptcy, default or other signifi cant
fi nancial diffi culty. In addition, for an investment in an
equity security, a signifi cant or prolonged decline in its fair
value below its cost is objective evidence of impairment.
Impairment losses are reversed when the reversal can be
objectively related to an event occurring after the
recognition of the impairment loss. For debt instruments
measured at amortised cost or fair value, the reversal is
recognised in the income statement. For equity
instruments classifi ed as available for sale, the reversal is
recognised in other comprehensive income. Impairment
losses on fi nancial assets carried at cost because their fair
value cannot be reliably measured are never reversed.
Financial assets are derecognised (in full or partly)
when substantially all the Group’s rights to cash fl ows
from the respective assets have expired or have been
transferred and the Group has neither exposure to
1. Accounting policies (continued)
substantially all the risks inherent in those assets nor
entitlement to rewards from them.
The Group classifi es its fi nancial assets into the following
categories: loans and receivables, held-for-trading assets
(fi nan cial assets at fair value through profi t and loss), held-
to-maturity investments and available-for-sale assets.
Loans and receivablesLoans and receivables are non-derivative fi nancial assets
with fi xed or determinable payments that are not quoted
in an active market. This category includes the following
classes of fi nancial assets: loans; trade and other
receivables and cash and cash equivalents (cash balances,
deposits at sight and other short-term highly liquid
investments with original maturities of three months or
less).
Subsequent to initial measurement, loans and
receivables are carried at amortised cost using the
effective interest rate method less appropriate allowances
for doubtful receivables.
Allowances for doubtful receivables represent the
Group’s estimates of losses that could arise from the failure
or inability of customers to make payments when due.
These estimates are based on the ageing of customers
balances, specifi c credit circumstances and the Group’s
historical bad receivables experience.
Loans and receivables are further classifi ed as current and
non-current depending whether these will be realised within
twelve months after the balance sheet date or beyond.
Held-for-trading assetsThe Group does not apply the fair value option. Held-for-
trading assets are marketable securities, derivative fi nancial
instruments and other fi xed income portfolios that are
managed with the aim of delivering performance over
agreed benchmarks and are therefore classifi ed as trading.
Subsequent to initial measurement, held-for-trading
assets are carried at fair value and all their gains and
losses, realised and unrealised, are recognised in the
income statement.
Held-to-maturity investmentsHeld-to-maturity investments are non-derivative fi nancial
assets with fi xed or determinable payments and fi xed
matu rities. The Group uses this category when it has an
54 Consolidated Financial Statements of the Nestlé Group 2010
1. Accounting policies (continued)
intention and ability to hold them until maturity and when
the re-sale of such investments is prohibited.
Subsequent to initial recognition, held-to-maturity
investments are recognised at amortised cost less
impairment losses. They are further classifi ed as current
and non-current depending whether they will mature
within twelve months after the balance sheet date or
beyond.
Available-for-sale assetsAvailable-for-sale assets are those non-derivative fi nancial
assets that are either designated as such upon initial
recognition or are not classifi ed in any of the other
fi nancial assets categories. This category includes the
following classes of fi nancial assets: bonds, equities,
commercial paper and bills, time deposits and other
investments. They are split into:
– short-term investments, if their maturity is more than
three months at inception and if they are due within
a period of 12 months or less; or there is no maturity but
the assets are expected to be realised within 12 months
after the reporting period; and
– non-current fi nancial assets.
Subsequent to initial measurement, available-for-sale
assets are stated at fair value with all unrealised gains or
losses recognised against other comprehensive income
until their disposal when such gains or losses are
recognised in the income statement.
Interest earned on available-for-sale assets is calculated
using the effective interest rate method and is recognised
in the income statement as part of interest income under
net fi nancing cost. Accrued interest on available-for-sale
fi nancial assets is included in the balance sheet line
prepayments and accrued income.
Financial liabilities at amortised costFinancial liabilities are initially recognised at the fair value
of consideration received less directly attributable
transaction costs.
Subsequent to initial measurement, fi nancial liabilities
are recognised at amortised cost unless they are part of
a fair value hedge relationship (refer to fair value hedges).
The difference between the initial carrying amount of the
fi nancial liabilities and their redemption value is recognised
in the income statement over the contractual terms using
the effective interest rate method. This category includes
the following classes of fi nancial liabilities: trade and other
payables; commercial paper; bonds and other fi nancial
liabilities.
Financial liabilities at amortised cost are further
classifi ed as current and non-current depending whether
these will fall due within twelve months after the balance
sheet date or beyond.
Financial liabilities are derecognised (in full or partly)
when either the Group is discharged from its obligation,
it expires, is cancelled or replaced by a new liability with
substantially modifi ed terms.
Derivative fi nancial instrumentsA derivative is a fi nancial instrument that changes its
values in response to changes in the underlying variable,
requires no or little net initial investment and is settled at
a future date. Derivatives are mainly used to manage
exposures to foreign exchange, interest rate and
commodity price risk. Whilst some derivatives are also
acquired with the aim of managing the return of
marketable securities portfolios, these derivatives are only
acquired when there are underlying fi nancial assets.
Derivatives are initially recognised at fair value. These
are subsequently remeasured at fair value on a regular
basis and at each reporting date as a minimum. The fair
values of exchange-traded derivatives are based on market
prices, while the fair value of the over-the-counter
derivatives are determined using accepted mathematical
models based on market data.
Derivatives are carried as assets when their fair value is
positive and as liabilities when their fair value is negative.
The Group’s derivatives mainly consist of currency
forwards, futures, options and swaps; commodity futures
and options; interest rate forwards, futures, options and
swaps.
The use of derivatives is governed by the Group’s
policies approved by the Board of Directors, which provide
written principles on the use of derivatives consistent with
the Group’s overall risk management strategy.
Hedge accountingThe Group designates and documents certain derivatives
as hedging instruments against changes in fair values of
recognised assets and liabilities (fair value hedges), highly
55Consolidated Financial Statements of the Nestlé Group 2010
1. Accounting policies (continued)
probable forecast transactions (cash fl ow hedges) and
hedges of net investments in foreign operations (net
investment hedges). The effectiveness of such hedges is
assessed at inception and verifi ed at regular intervals and
at least on a quarterly basis, using prospective and
retrospective testing.
Fair value hedgesThe Group uses fair value hedges to mitigate foreign
currency and interest rate risks of its recognised assets
and liabilities.
The changes in fair values of hedging instruments are
recognised in the income statement. Hedged items are
also adjusted for the risk being hedged, with any gain or
loss being recognised in the income statement.
Cash fl ow hedgesThe Group uses cash fl ow hedges to mitigate a particular
risk associated with a recognised asset or liability or highly
probable forecast transactions, such as anticipated future
export sales, purchases of equipment and raw materials,
as well as the variability of expected interest payments
and receipts.
The effective part of the changes in fair value of
hedging instruments is recognised in other comprehensive
income, while any ineffective part is recognised
immediately in the income statement. When the hedged
item results in the recognition of a non-fi nancial asset or
liability, the gains or losses previously recognised in other
comprehensive income are included in the measurement
cost of the asset or of the liability. Otherwise the gains or
losses previously recognised in other comprehensive
income are removed and recognised in the income
statement at the same time as the hedged transaction.
Net investment hedgesThe Group uses net investment hedges to mitigate
translation exposure on its net investments in affi liated
companies.
The changes in fair values of hedging instruments are
taken directly to other comprehensive income together
with gains or losses on the foreign currency translation of
the hedged investments. All of these fair value gains or
losses are deferred in equity until the investments are sold
or otherwise disposed of.
Undesignated derivativesUndesignated derivatives are comprised of two
categories. The fi rst includes derivatives acquired in the
frame of risk management policies for which hedge
accounting is not applied. The second category relates
to derivatives that are acquired with the aim of delivering
performance over agreed benchmarks of marketable
securities portfolios.
Subsequent to initial measurement, undesignated
derivatives are carried at fair value and all their gains and
losses, realised and unrealised, are recognised in the
income statement.
Fair valueThe Group determines the fair value of its fi nancial
instruments on the basis of the following hierarchy.
i) The fair value of fi nancial instruments quoted in active
markets is based on their quoted closing price at the
balance sheet date. Examples include commodity
derivative assets and liabilities and other fi nancial assets
such as investments in equity and debt securities.
ii) The fair value of fi nancial instruments that are not
traded in an active market is determined by using
valuation techniques using observable market data.
Such valuation techniques include discounted cash
fl ows, standard valuation models based on market
parameters, dealer quotes for similar instruments and
use of comparable arm’s length transactions. For
example, the fair value of forward exchange contracts,
currency swaps and interest rate swaps is determined
by discounting estimated future cash fl ows using a risk-
free interest rate.
iii) The fair value of a small number of instruments are
deter mined on the basis of entity specifi c valuations
using inputs that are not based on observable market
data (unobservable inputs). When the fair value of
unquoted instruments cannot be measured with
suffi cient reliabi lity, the Group carries such instruments
at cost less impairment, if applicable.
InventoriesRaw materials and purchased fi nished goods are valued at
purchase cost. Work in progress and manufactured
fi nished goods are valued at production cost. Production
cost includes direct production costs and an appropriate
56 Consolidated Financial Statements of the Nestlé Group 2010
1. Accounting policies (continued)
proportion of production overheads and factory
depreciation.
Raw material inventories and purchased fi nished goods
are accounted for using the FIFO (fi rst in, fi rst out)
method. The weighted average cost method is used for
other inventories.
An allowance is established when the net realisable
value of any inventory item is lower than the value
calculated above.
Prepayments and accrued incomePrepayments and accrued income comprise payments
made in advance relating to the following year, and
income relating to the current year, which will not be
invoiced until after the balance sheet date.
Property, plant and equipmentProperty, plant and equipment are shown in the balance
sheet at their historical cost. Depreciation is provided on
components that have homogenous useful lives by using
the straight-line method so as to depreciate the initial cost
down to the residual value over the estimated useful lives.
The residual values are 30% on head offi ces and nil for all
other asset types. The useful lives are as follows:
Buildings 20 – 40 years
Machinery and equipment 10 – 25 years
Tools, furniture, information technology
and sundry equipment 3 – 10 years
Vehicles 3 – 8 years
Land is not depreciated.
Useful lives, components and residual amounts are
reviewed annually. Such a review takes into consideration
the nature of the assets, their intended use including but
not limited to the closure of facilities and the evolution of
the techno logy and competitive pressures that may lead to
technical obsolescence.
Depreciation of property, plant and equipment is
allocated to the appropriate headings of expenses by
function in the income statement.
Borrowing costs incurred during the course of
construction are capitalised if the assets under
construction are signifi cant and if their construction
requires a substantial period to complete (typically more
than one year). The capitalisation rate is determined on the
basis of the short term borrowing rate for the period of
construction. Premiums capitalised for leasehold land or
buildings are amortised over the length of the lease.
Government grants are recognised in accordance with the
deferral method, whereby the grant is set up as deferred
income which is released to the income statement over
the useful life of the related assets. Grants that are not
related to assets are credited to the income statement
when they are received.
Leased assetsAssets acquired under fi nance leases are capitalised and
depreciated in accordance with the Group’s policy on
property, plant and equipment unless the lease term is
shorter. Land and building leases are recognised
separately provided an allocation of the lease payments
between these categories is reliable. The associated
obligations are included under fi nancial liabilities.
Rentals payable under operating leases are expensed.
The costs of the agreements that do not take the legal
form of a lease but convey the right to use an asset are
separated into lease payments and other payments if the
entity has the control of the use or of the access to the
asset or takes essentially all the output of the asset. Then
the entity determines whether the lease component of the
agreement is a fi nance or an operating lease.
Business combinations and related goodwillAs from 1 January 1995, the excess of the cost of an
acquisition over the fair value of the net identifi able assets,
liabilities and contingent liabilities acquired is capitalised.
Previously these amounts had been written off through
equity.
Goodwill is not amortised but tested for impairment at
least annually and upon the occurrence of an indication of
impairment. The impairment testing process is described
in the appropriate section of these policies.
Goodwill is recorded in the functional currencies of the
acquired operations.
All assets, liabilities and contingent liabilities acquired in
a business combination are recognised at the acquisition
date and measured at their fair value.
57Consolidated Financial Statements of the Nestlé Group 2010
1. Accounting policies (continued)
Intangible assetsThis heading includes intangible assets that are internally
generated or acquired either separately or in a business
combination when they are identifi able and can be reliably
measured. Intangible assets are considered to be
identifi able if they arise from contractual or other rights,
or if they are separable (i.e. they can be disposed of either
individually or together with other assets). Intangible
assets comprise inde fi nite life intangible assets and fi nite
life intangible assets. Internally generated intangible assets
are capitalised, provided they generate future economic
benefi ts and their costs are clearly identifi able. Borrowing
costs incurred during the development of internally
generated intangible assets are capitalised if the assets
are signifi cant and if their develop ment requires a
substantial period to complete (typically more than one
year).
Indefi nite life intangible assets are those for which there
is no foreseeable limit to their useful economic life as they
arise from contractual or other legal rights that can be
renewed without signifi cant cost and are the subject of
continuous marketing support. They are not amortised but
tested for impairment annually or more frequently if an
impairment indicator is triggered. They mainly comprise
certain brands, trademarks and intellectual property
rights. The assessment of the classifi cation of intangible
assets as indefi nite is reviewed annually.
Finite life intangible assets are those for which there
is an expectation of obsolescence that limits their useful
economic life or where the useful life is limited by
contractual or other terms. They are amortised over the
shorter of their contractual or useful economic lives.
They comprise mainly management information systems,
patents and rights to carry on an activity (e. g. exclusive
rights to sell products or to perform a supply activity).
Finite life intan gible assets are amortised on a straight-line
basis assuming a zero resi d ual value: management
information systems over a period ranging from 3 to
5 years; and other fi nite life intangible assets over 5 to
20 years. Useful lives and residual values are reviewed
annually.
Amortisation of intangible assets is allocated to the
appropriate headings of expenses by function in the
income statement.
Research and development Research costs are charged to the income statement in
the year in which they are incurred.
Development costs relating to new products are not
capitalised because the expected future economic benefi ts
cannot be reliably determined. As long as the products
have not reached the market place, there is no reliable
evidence that positive future cash fl ows would be obtained.
Other development costs (essentially management
information system software) are capitalised provided
that there is an identifi able asset that will be useful in
generating future benefi ts in terms of savings, economies
of scale, etc.
Impairment of goodwill and indefi nite life intangible assetsGoodwill and indefi nite life intangible assets are tested for
impairment at least annually and upon the occurrence of
an indication of impairment.
The impairment tests are performed annually at the
same time each year and at the cash generating unit
(CGU) level. The Group defi nes its CGU based on the way
that it monitors and derives economic benefi ts from the
acquired goodwill and intangibles. The impairment tests
are performed by comparing the carrying value of the
assets of these CGU with their recoverable amount, based
on their future projected cash fl ows discounted at an
appropriate pre-tax rate of return. Usually, the cash fl ows
correspond to estimates made by Group Management in
fi nancial plans and business strategies covering a period
of fi ve years. They are then projected to 50 years using
a steady or declining growth rate given that the Group
businesses are of a long-term nature. The Group assesses
the uncertainty of these estimates by making sensitivity
analyses. The discount rate refl ects the current assessment
of the time value of money and the risks specifi c to the CGU
(essentially country risk). The business risk is included in
the determination of the cash fl ows. Both the cash fl ows
and the discount rates exclude infl ation.
An impairment loss in respect of goodwill is never
subsequently reversed.
58 Consolidated Financial Statements of the Nestlé Group 2010
1. Accounting policies (continued)
Impairment of property, plant and equipment and fi nite life intangible assets Consideration is given at each balance sheet date to
determine whether there is any indication of impairment
of the carrying amounts of the Group’s property, plant and
equip ment and fi nite life intangible assets. Indication could
be unfavourable development of a business under
competitive pressures or severe economic slowdown in
a given market as well as reorganisation of the operations
to leverage their scale. If any indication exists, an asset’s
recoverable amount is estimated. An impairment loss is
recognised when ever the carrying amount of an asset
exceeds its recoverable amount. The recoverable amount
is the greater of the fair value less cost to sell and value in
use. In asses sing value in use, the estimated future cash
fl ows are discounted to their present value, based on the
time value of money and the risks specifi c to the country
where the assets are located. The risks specifi c to the
asset are included in the determina tion of the cash fl ows.
Assets that suffered an impairment are tested for
possible reversal of the impairment at each reporting date
if indications exist that impairment losses recognised in
prior periods no longer exist or have decreased.
Assets held for sale and discontinued operationsNon-current assets held for sale (and disposal groups) are
presented separately in the current section of the balance
sheet. Immediately before the initial classifi cation of the
assets (and disposal groups) as held for sale, the carrying
amounts of the assets (or all the assets and liabilities in the
disposal groups) are measured in accordance with their
applicable accounting policy. Non-current assets held for
sale (and disposal groups) are subsequently measured at
the lower of their carrying amount and fair value less cost
to sell. Non-current assets held for sale (and disposal
groups) are no longer depreciated.
Upon occurrence of discontinued operations, the
income statement of the discontinued operations is
presented sepa ra tely in the consolidated income statement.
Comparative infor mation is restated accordingly. Balance
sheet and cash fl ow information related to discontinued
operations are disclosed separately in the notes.
ProvisionsProvisions comprise liabilities of uncertain timing or
amount that arise from restructuring plans, environmental,
litigation and other risks. Provisions are recognised when
there exists a legal or constructive obligation stemming
from a past event and when the future cash outfl ows can
be reliably estimated. Obligations arising from restructuring
plans are recognised when detailed formal plans have been
established and when there is a valid expectation that such
plans will be carried out by either starting to implement
them or announcing their main features. Obligations under
litigations refl ect Group Management’s best estimate of
the outcome based on the facts known at the balance
sheet date.
Contingent assets and liabilitiesContingent assets and liabilities are possible rights and
obligations that arise from past events and whose
existence will be confi rmed only by the occurrence or
non-occurrence of one or more uncertain future events
not fully within the control of the Group. They are
disclosed in the notes.
Post-employment benefi tsThe liabilities of the Group arising from defi ned benefi t
obligations, and the related current service cost, are
determined using the projected unit credit method.
Actuarial advice is provided both by external consultants
and by actuaries employed by the Group. The actuarial
assumptions used to calculate the defi ned benefi t
obligations vary according to the economic conditions of
the country in which the plan is located. Such plans are
either externally funded (in the form of independently
administered funds) or unfunded.
For the funded defi ned benefi t plans, the defi cit or
excess of the fair value of plan assets over the present value
of the defi ned benefi t obligation is recognised as a liability
or an asset in the balance sheet, taking into account any
unrecognised past service cost. However, an excess of
assets is recognised only to the extent that it represents
a future economic benefi t which is available in the form of
refunds from the plan or reductions in future contributions
to the plan. When these criteria are not met, it is not
recognised but is disclosed in the notes. Impacts of
minimum funding requirements in relation to past service
are considered when determining pension obligations.
59Consolidated Financial Statements of the Nestlé Group 2010
1. Accounting policies (continued)
Actuarial gains and losses arise mainly from changes in
actuarial assumptions and differences between actuarial
assumptions and what has actually occurred. They are
recognised in the period in which they occur in other
comprehensive income.
For defi ned benefi t plans, the pension cost charged to
the income statement consists of current service cost,
interest cost, expected return on plan assets, effects of
early retirements, curtailments or settlements, and past
service cost. The past service cost for the enhancement of
pension benefi ts is accounted for when such benefi ts vest
or become a constructive obligation.
Some benefi ts are also provided by defi ned contribution
plans. Contributions to such plans are charged to the
income statement as incurred.
Equity compensation plansThe Group has equity-settled and cash-settled share-
based payment transactions.
Equity-settled share-based payment transactions are
recognised in the income statement with a corresponding
increase in equity over the vesting period. They are fair
valued at grant date and measured using generally
accepted pricing models. The cost of equity-settled share-
based payment transactions is adjusted annually by the
expec ta tions of vesting, for the forfeitures of the
participants’ rights that no longer satisfy the plan
conditions, as well as for early vesting.
Liabilities arising from cash-settled share-based
payment transactions are recognised in the income
statement over the vesting period. They are fair valued at
each reporting date and measured using generally
accepted pricing models. The cost of cash-settled share-
based payment transactions is adjusted for the forfeitures
of the participants’ rights that no longer satisfy the plan
conditions, as well as for early vesting.
Accruals and deferred incomeAccruals and deferred income comprise expenses relating
to the current year, which will not be invoiced until after
the balance sheet date, and income received in advance
relating to the following year.
DividendIn accordance with Swiss law and the Company’s Articles
of Association, dividend is treated as an appropriation of
profi t in the year in which it is ratifi ed at the Annual General
Meeting and subsequently paid.
Events occurring after the balance sheet dateThe values of assets and liabilities at the balance sheet
date are adjusted if there is evidence that subsequent
adjusting events warrant a modifi cation of these values.
These adjustments are made up to the date of approval of
the Consolidated Financial Statements by the Board of
Directors. Other non-adjusting events are disclosed in the
notes.
Changes in accounting policies The Group has applied the following revised International
Financial Reporting Standard (IFRS) and International
Accounting Standard (IAS) as from 1 January 2010
onwards. These changes have been applied in accordance
with the specifi c transitional provisions of each standard,
and none of them had a material impact on the Group’s
fi nancial statements.
IFRS 3 Revised 2008 – Business combinationsThe revised standard has resulted in the following
changes, applicable to transactions occuring after
1 January 2010:
– acquisition-related costs are expensed as incurred;
– for a business combination in which the Group achieves
control without buying all of the equity of the acquiree,
the non-controlling interests are measured either at fair
value or at the non-controlling interests’ proportionate
share of the acquiree’s net identifi able assets;
– upon obtaining control in a business combination
achieved in stages, the Group remeasures its previously
held equity interest at fair value and recognises a gain
or a loss to the income statement; and
– contingent consideration of an acquisition is measured
at fair value. Changes are accounted for outside
goodwill, in the income statement.
60 Consolidated Financial Statements of the Nestlé Group 2010
IAS 27 Revised 2008 – Consolidated and separate fi nancial statementsChanges of non-controlling interests of an acquiree that
do not result in a change of control are accounted for as
transactions with equity holders.
Improvements and other amendments of IFRS/IASImprovements or other amendments effective in 2010 (for
example, the amendment to IAS 18 – Revenue recognition
on determining whether an entity is acting as a principal
or as an agent) have been incorporated in the Group
accounting policies and do not have a material effect on
the Consolidated Financial Statements.
Changes in presentationNotes to the Consolidated Financial Statements have been
re-ordered. In particular, all information related to net
fi nancing cost and fi nancial instruments has been grouped
in a single note and the content has been enhanced to
provide more information on fi nancial risks.
2009 comparatives have been restated to refl ect
reclassifi cation of cash and cash equivalents within the
category loans and receivables, and to exclude taxes from
the disclosures on fi nancial instruments. Moreover the
information on expenses by nature is now disclosed in the
notes related to the appropriate topic (e.g., salaries and
welfare expenses are disclosed in the employee benefi ts
note).
1. Accounting policies (continued)
Changes in IFRS that may affect the Group after 31 December 2010 The Group is currently assessing the potential impacts of
new standards, amendments to standards and
interpretations that are effective for annual periods
beginning after 1 January 2011, and which the Group has
not early adopted. None of these are expected to have a
material effect on the Group’s fi nancial statements, except
for IFRS 9 – Financial Instruments, which becomes
mandatory for the Group’s 2013 fi nancial statements and
could change the classifi cation and measurement of
fi nancial assets. The Group does not plan to adopt this
standard in anticipation.
Changes in presentation that will affect the Group after 31 December 2010 Certain allowances and discounts, granted to trade chains,
customers, retailers and consumers for trade and consumer
promotions, selling, distribution, advertising and other
services, rendered to the Group are currently treated as
expenses under marketing and administration expenses
as well as distribution expenses on grounds that they are
incurred to generate revenue. The Group will treat these
allowances and discounts as from 2011 as a deduction of
revenue in conformity with the practice generally admitted
by consumer goods companies. Based on 2010 fi gures,
the reclassifi cation from distribution expenses as well as
marketing and administration expenses to sales amounts
to CHF 16 707 million.
61Consolidated Financial Statements of the Nestlé Group 2010
62 Consolidated Financial Statements of the Nestlé Group 2010
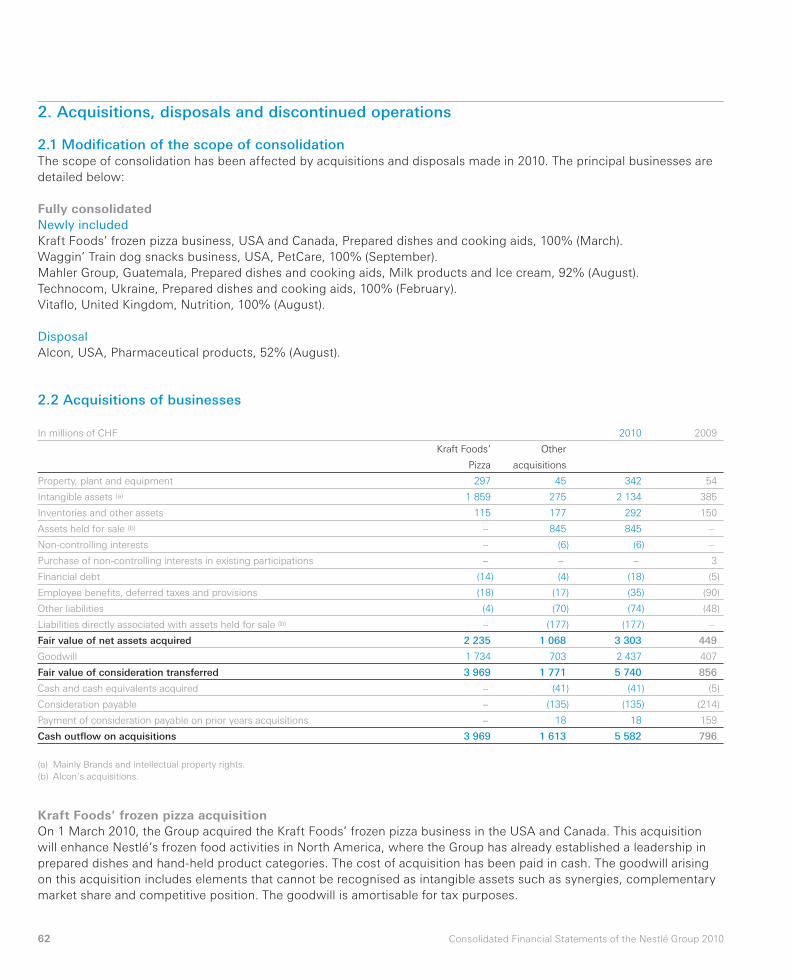
2. Acquisitions, disposals and discontinued operations
2.1 Modifi cation of the scope of consolidationThe scope of consolidation has been affected by acquisitions and disposals made in 2010. The principal businesses are
detailed below:
Fully consolidatedNewly includedKraft Foods’ frozen pizza business, USA and Canada, Prepared dishes and cooking aids, 100% (March).
Waggin’ Train dog snacks business, USA, PetCare, 100% (September).
Mahler Group, Guatemala, Prepared dishes and cooking aids, Milk products and Ice cream, 92% (August).
Technocom, Ukraine, Prepared dishes and cooking aids, 100% (February).
Vitafl o, United Kingdom, Nutrition, 100% (August).
DisposalAlcon, USA, Pharmaceutical products, 52% (August).
Kraft Foods’ frozen pizza acquisitionOn 1 March 2010, the Group acquired the Kraft Foods’ frozen pizza business in the USA and Canada. This acquisition
will enhance Nestlé’s frozen food activities in North America, where the Group has already established a leader ship in
prepared dishes and hand-held product categories. The cost of acquisition has been paid in cash. The goodwill arising
on this acquisition includes elements that cannot be recognised as intangible assets such as synergies, complementary
market share and competitive position. The goodwill is amortisable for tax purposes.
2.2 Acquisitions of businesses
In millions of CHF 2010 2009
Kraft Foods’
Pizza
Other
acquisitions
Property, plant and equipment 297 45 342 54
Intangible assets (a) 1 859 275 2 134 385
Inventories and other assets 115 177 292 150
Assets held for sale (b) – 845 845 –
Non-controlling interests – (6) (6) –
Purchase of non-controlling interests in existing participations – – – 3
Financial debt (14) (4) (18) (5)
Employee benefi ts, deferred taxes and provisions (18) (17) (35) (90)
Other liabilities (4) (70) (74) (48)
Liabilities directly associated with assets held for sale (b) – (177) (177) –
Fair value of net assets acquired 2 235 1 068 3 303 449
Goodwill 1 734 703 2 437 407
Fair value of consideration transferred 3 969 1 771 5 740 856
Cash and cash equivalents acquired – (41) (41) (5)
Consideration payable – (135) (135) (214)
Payment of consideration payable on prior years acquisitions – 18 18 159
Cash outfl ow on acquisitions 3 969 1 613 5 582 796
(a) Mainly Brands and intellectual property rights.
(b) Alcon’s acquisitions.
63Consolidated Financial Statements of the Nestlé Group 2010
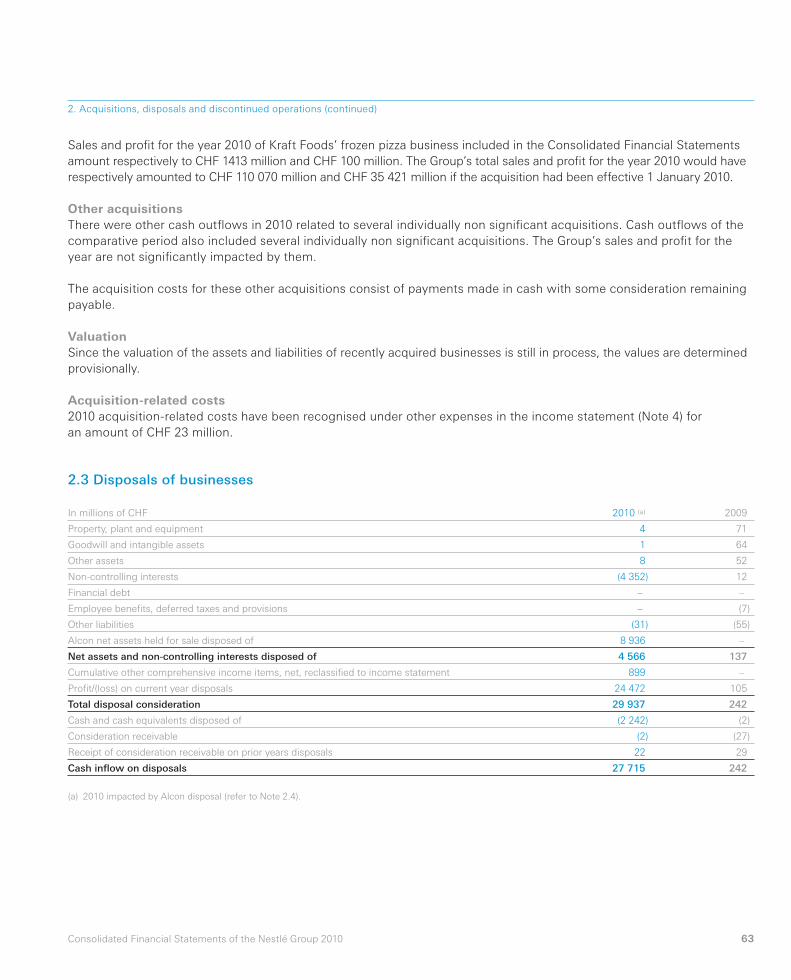
2.3 Disposals of businesses
In millions of CHF 2010 (a) 2009
Property, plant and equipment 4 71
Goodwill and intangible assets 1 64
Other assets 8 52
Non-controlling interests (4 352) 12
Financial debt – –
Employee benefi ts, deferred taxes and provisions – (7)
Other liabilities (31) (55)
Alcon net assets held for sale disposed of 8 936 –
Net assets and non-controlling interests disposed of 4 566 137
Cumulative other comprehensive income items, net, reclassifi ed to income statement 899 –
Profi t/(loss) on current year disposals 24 472 105
Total disposal consideration 29 937 242
Cash and cash equivalents disposed of (2 242) (2)
Consideration receivable (2) (27)
Receipt of consideration receivable on prior years disposals 22 29
Cash infl ow on disposals 27 715 242
(a) 2010 impacted by Alcon disposal (refer to Note 2.4).
2. Acquisitions, disposals and discontinued operations (continued)
Sales and profi t for the year 2010 of Kraft Foods’ frozen pizza business included in the Consolidated Financial Statements
amount respectively to CHF 1413 million and CHF 100 million. The Group’s total sales and profi t for the year 2010 would have
respectively amounted to CHF 110 070 million and CHF 35 421 million if the acquisition had been effective 1 January 2010.
Other acquisitionsThere were other cash outfl ows in 2010 related to several individually non signifi cant acquisitions. Cash outfl ows of the
comparative period also included several individually non signifi cant acquisitions. The Group’s sales and profi t for the
year are not signi fi cantly impacted by them.
The acquisition costs for these other acquisitions consist of payments made in cash with some consideration remaining
payable.
ValuationSince the valuation of the assets and liabilities of recently acquired businesses is still in process, the values are determined
provisionally.
Acquisition-related costs2010 acquisition-related costs have been recognised under other expenses in the income statement (Note 4) for
an amount of CHF 23 million.
64 Consolidated Financial Statements of the Nestlé Group 2010
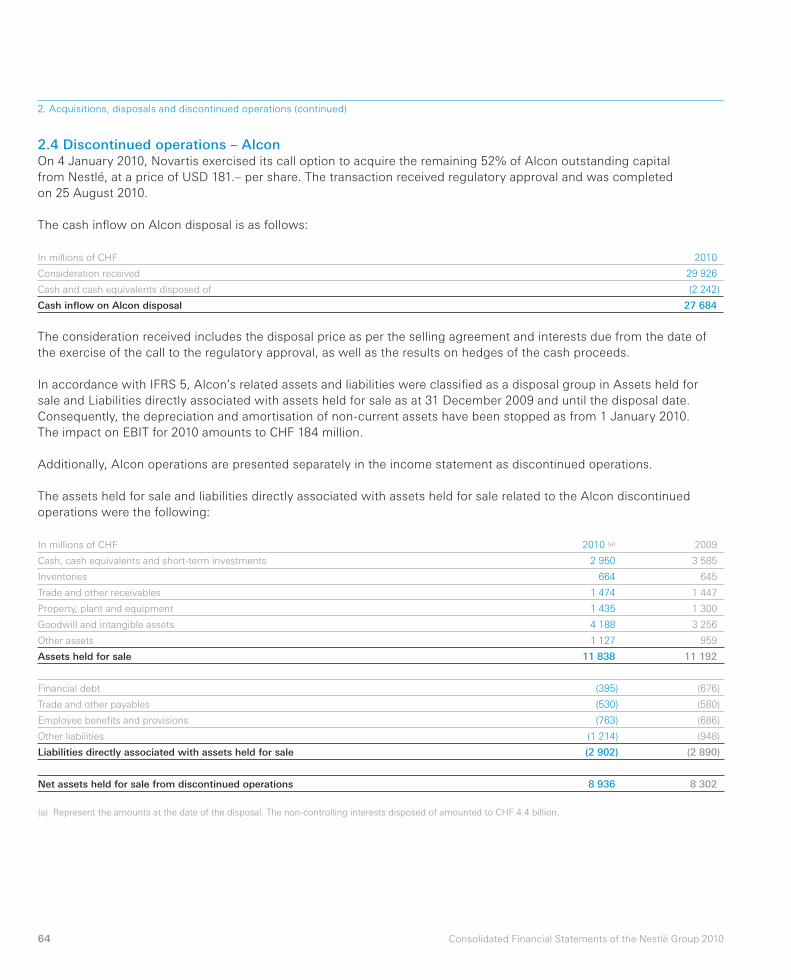
2.4 Discontinued operations – AlconOn 4 January 2010, Novartis exercised its call option to acquire the remaining 52% of Alcon outstanding capital
from Nestlé, at a price of USD 181.– per share. The transaction received regulatory approval and was completed
on 25 August 2010.
The cash infl ow on Alcon disposal is as follows:
In millions of CHF 2010
Consideration received 29 926
Cash and cash equivalents disposed of (2 242)
Cash infl ow on Alcon disposal 27 684
In millions of CHF 2010 (a) 2009
Cash, cash equivalents and short-term investments 2 950 3 585
Inventories 664 645
Trade and other receivables 1 474 1 447
Property, plant and equipment 1 435 1 300
Goodwill and intangible assets 4 188 3 256
Other assets 1 127 959
Assets held for sale 11 838 11 192
Financial debt (395) (676)
Trade and other payables (530) (580)
Employee benefi ts and provisions (763) (686)
Other liabilities (1 214) (948)
Liabilities directly associated with assets held for sale (2 902) (2 890)
Net assets held for sale from discontinued operations 8 936 8 302
(a) Represent the amounts at the date of the disposal. The non-controlling interests disposed of amounted to CHF 4.4 billion.
The consideration received includes the disposal price as per the selling agreement and interests due from the date of
the exercise of the call to the regulatory approval, as well as the results on hedges of the cash proceeds.
In accordance with IFRS 5, Alcon’s related assets and liabilities were classifi ed as a disposal group in Assets held for
sale and Liabilities directly associated with assets held for sale as at 31 December 2009 and until the disposal date.
Consequently, the depreciation and amortisation of non-current assets have been stopped as from 1 January 2010.
The impact on EBIT for 2010 amounts to CHF 184 million.
Additionally, Alcon operations are presented separately in the income statement as discontinued operations.
The assets held for sale and liabilities directly associated with assets held for sale related to the Alcon discontinued
operations were the following:
2. Acquisitions, disposals and discontinued operations (continued)
65Consolidated Financial Statements of the Nestlé Group 2010
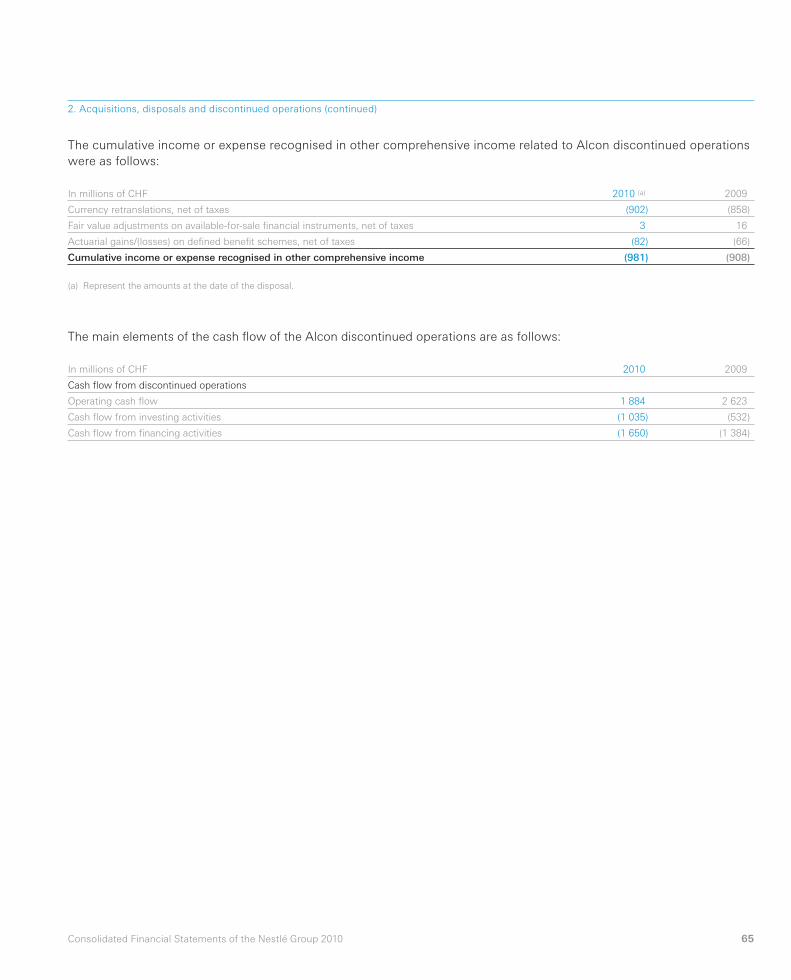
In millions of CHF 2010 (a) 2009
Currency retranslations, net of taxes (902) (858)
Fair value adjustments on available-for-sale fi nancial instruments, net of taxes 3 16
Actuarial gains/(losses) on defi ned benefi t schemes, net of taxes (82) (66)
Cumulative income or expense recognised in other comprehensive income (981) (908)
(a) Represent the amounts at the date of the disposal.
The cumulative income or expense recognised in other comprehensive income related to Alcon discontinued operations
were as follows:
The main elements of the cash fl ow of the Alcon discontinued operations are as follows:
In millions of CHF 2010 2009
Cash fl ow from discontinued operations
Operating cash fl ow 1 884 2 623
Cash fl ow from investing activities (1 035) (532)
Cash fl ow from fi nancing activities (1 650) (1 384)
2. Acquisitions, disposals and discontinued operations (continued)
66 Consolidated Financial Statements of the Nestlé Group 2010
20
09
2
010
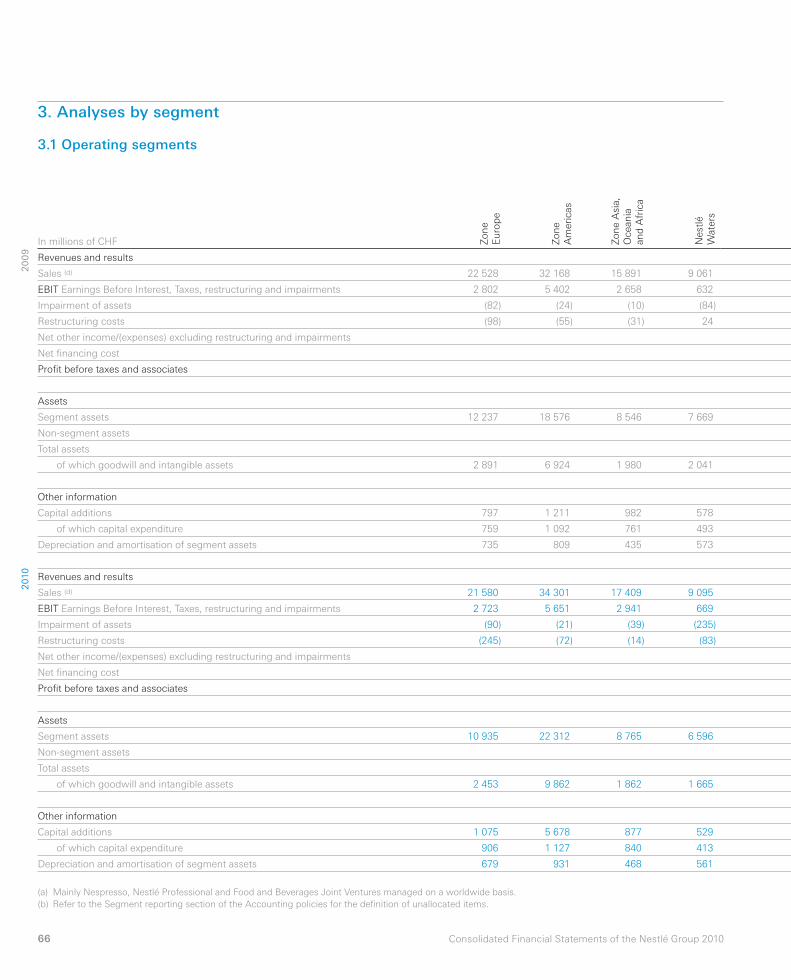
3. Analyses by segment
3.1 Operating segments
In millions of CHF Zo
ne
Eu
rop
e
Zo
ne
Am
eri
cas
Zo
ne A
sia,
Ocean
ia
an
d A
fric
a
Nest
lé
Wate
rs
Revenues and results
Sales (d) 22 528 32 168 15 891 9 061
EBIT Earnings Before Interest, Taxes, restructuring and impairments 2 802 5 402 2 658 632
Impairment of assets (82) (24) (10) (84)
Restructuring costs (98) (55) (31) 24
Net other income/(expenses) excluding restructuring and impairments
Net fi nancing cost
Profi t before taxes and associates
Assets
Segment assets 12 237 18 576 8 546 7 669
Non-segment assets
Total assets
of which goodwill and intangible assets 2 891 6 924 1 980 2 041
Other information
Capital additions 797 1 211 982 578
of which capital expenditure 759 1 092 761 493
Depreciation and amortisation of segment assets 735 809 435 573
Revenues and results
Sales (d) 21 580 34 301 17 409 9 095
EBIT Earnings Before Interest, Taxes, restructuring and impairments 2 723 5 651 2 941 669
Impairment of assets (90) (21) (39) (235)
Restructuring costs (245) (72) (14) (83)
Net other income/(expenses) excluding restructuring and impairments
Net fi nancing cost
Profi t before taxes and associates
Assets
Segment assets 10 935 22 312 8 765 6 596
Non-segment assets
Total assets
of which goodwill and intangible assets 2 453 9 862 1 862 1 665
Other information
Capital additions 1 075 5 678 877 529
of which capital expenditure 906 1 127 840 413
Depreciation and amortisation of segment assets 679 931 468 561
(a) Mainly Nespresso, Nestlé Professional and Food and Beverages Joint Ventures managed on a worldwide basis.
(b) Refer to the Segment reporting section of the Accounting policies for the defi nition of unallocated items.
67Consolidated Financial Statements of the Nestlé Group 2010
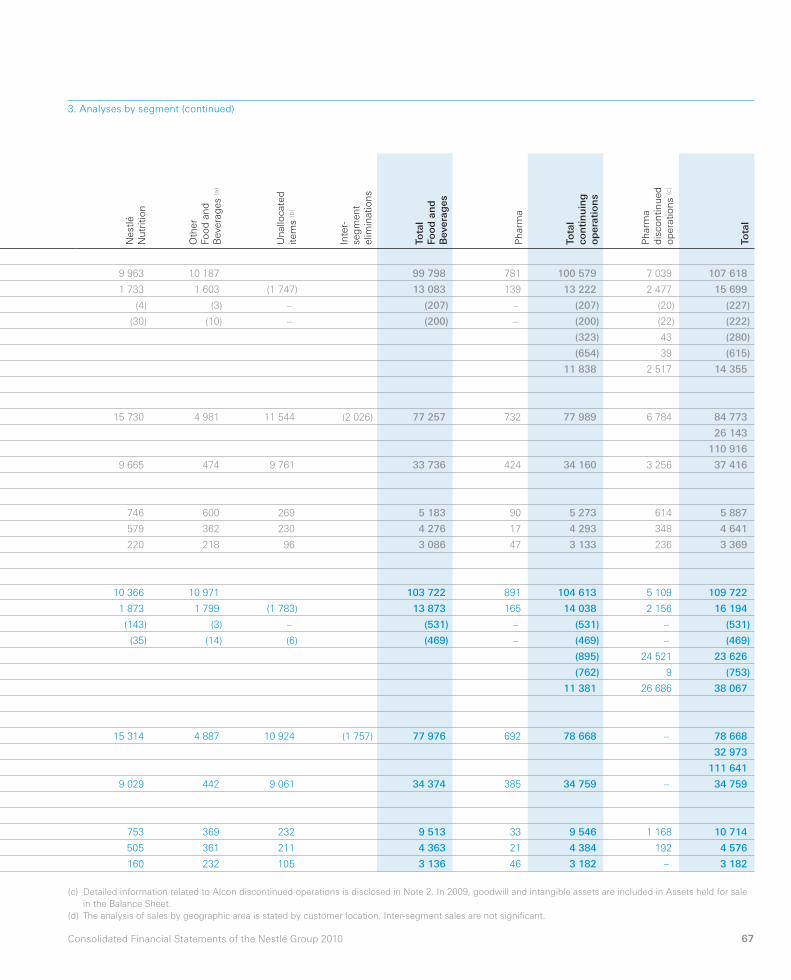
Nest
lé
Nu
tritio
n
Oth
er
Fo
od
an
d
Bevera
ges
(a)
Un
allo
cate
d
item
s (b
)
Inte
r-
seg
men
t
elim
inatio
ns
Tota
lFo
od
an
dB
eve
rag
es
Ph
arm
a
Tota
lco
nti
nu
ing
op
era
tio
ns
Ph
arm
a
dis
co
ntin
ued
op
era
tio
ns
(c)
Tota
l
9 963 10 187 99 798 781 100 579 7 039 107 618
1 733 1 603 (1 747) 13 083 139 13 222 2 477 15 699
(4) (3) – (207) – (207) (20) (227)
(30) (10) – (200) – (200) (22) (222)
(323) 43 (280)
(654) 39 (615)
11 838 2 517 14 355
15 730 4 981 11 544 (2 026) 77 257 732 77 989 6 784 84 773
26 143
110 916
9 665 474 9 761 33 736 424 34 160 3 256 37 416
746 600 269 5 183 90 5 273 614 5 887
579 362 230 4 276 17 4 293 348 4 641
220 218 96 3 086 47 3 133 236 3 369
10 366 10 971 103 722 891 104 613 5 109 109 722
1 873 1 799 (1 783) 13 873 165 14 038 2 156 16 194
(143) (3) – (531) – (531) – (531)
(35) (14) (6) (469) – (469) – (469)
(895) 24 521 23 626
(762) 9 (753)
11 381 26 686 38 067
15 314 4 887 10 924 (1 757) 77 976 692 78 668 – 78 668
32 973
111 641
9 029 442 9 061 34 374 385 34 759 – 34 759
753 369 232 9 513 33 9 546 1 168 10 714
505 361 211 4 363 21 4 384 192 4 576
160 232 105 3 136 46 3 182 – 3 182
3. Analyses by segment (continued)
(c) Detailed information related to Alcon discontinued operations is disclosed in Note 2. In 2009, goodwill and intangible assets are included in Assets held for sale
in the Balance Sheet.
(d) The analysis of sales by geographic area is stated by customer location. Inter-segment sales are not signifi cant.
68 Consolidated Financial Statements of the Nestlé Group 2010
20
09
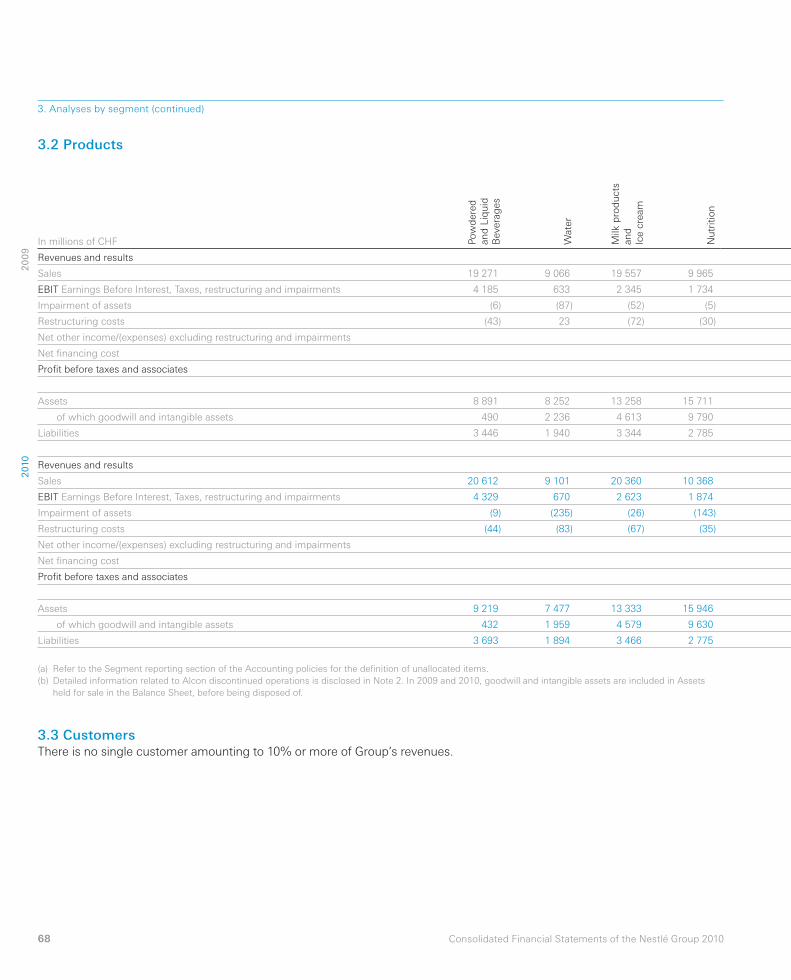
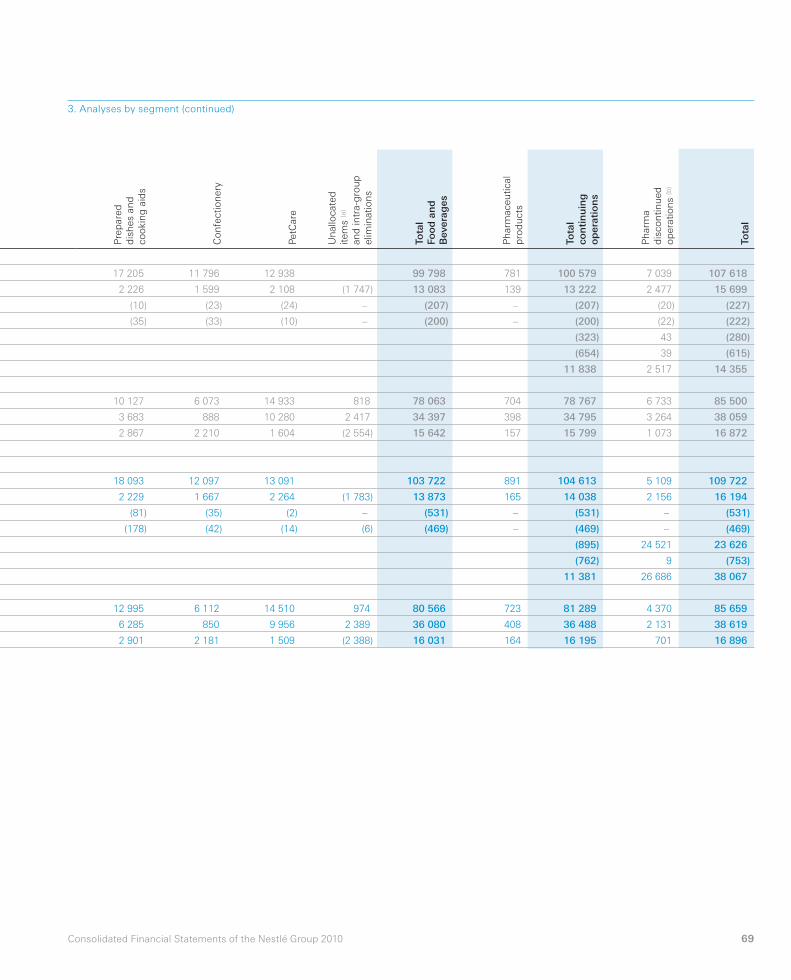
3.2 Products
In millions of CHF Pow
dere
d
an
d L
iqu
id
Bevera
ges
Wate
r
Milk
pro
du
cts
an
d
Ice c
ream
Nu
tritio
n
Revenues and results
Sales 19 271 9 066 19 557 9 965
EBIT Earnings Before Interest, Taxes, restructuring and impairments 4 185 633 2 345 1 734
Impairment of assets (6) (87) (52) (5)
Restructuring costs (43) 23 (72) (30)
Net other income/(expenses) excluding restructuring and impairments
Net fi nancing cost
Profi t before taxes and associates
Assets 8 891 8 252 13 258 15 711
of which goodwill and intangible assets 490 2 236 4 613 9 790
Liabilities 3 446 1 940 3 344 2 785
Revenues and results
Sales 20 612 9 101 20 360 10 368
EBIT Earnings Before Interest, Taxes, restructuring and impairments 4 329 670 2 623 1 874
Impairment of assets (9) (235) (26) (143)
Restructuring costs (44) (83) (67) (35)
Net other income/(expenses) excluding restructuring and impairments
Net fi nancing cost
Profi t before taxes and associates
Assets 9 219 7 477 13 333 15 946
of which goodwill and intangible assets 432 1 959 4 579 9 630
Liabilities 3 693 1 894 3 466 2 775
(a) Refer to the Segment reporting section of the Accounting policies for the defi nition of unallocated items.
(b) Detailed information related to Alcon discontinued operations is disclosed in Note 2. In 2009 and 2010, goodwill and intangible assets are included in Assets
held for sale in the Balance Sheet, before being disposed of.
2010
3.3 CustomersThere is no single customer amounting to 10% or more of Group’s revenues.
3. Analyses by segment (continued)
69Consolidated Financial Statements of the Nestlé Group 2010
Pre
pare
d
dis
hes
an
d
co
okin
g a
ids
Co
nfe
ctio
nery
PetC
are
Un
allo
cate
d
item
s (a
)
an
d in
tra-g
rou
p
elim
inatio
ns
Tota
lFo
od
an
dB
eve
rag
es
Ph
arm
aceu
tical
pro
du
cts
Tota
lco
nti
nu
ing
op
era
tio
ns
Ph
arm
a
dis
co
ntin
ued
op
era
tio
ns
(b)
Tota
l
17 205 11 796 12 938 99 798 781 100 579 7 039 107 618
2 226 1 599 2 108 (1 747) 13 083 139 13 222 2 477 15 699
(10) (23) (24) – (207) – (207) (20) (227)
(35) (33) (10) – (200) – (200) (22) (222)
(323) 43 (280)
(654) 39 (615)
11 838 2 517 14 355
10 127 6 073 14 933 818 78 063 704 78 767 6 733 85 500
3 683 888 10 280 2 417 34 397 398 34 795 3 264 38 059
2 867 2 210 1 604 (2 554) 15 642 157 15 799 1 073 16 872
18 093 12 097 13 091 103 722 891 104 613 5 109 109 722
2 229 1 667 2 264 (1 783) 13 873 165 14 038 2 156 16 194
(81) (35) (2) – (531) – (531) – (531)
(178) (42) (14) (6) (469) – (469) – (469)
(895) 24 521 23 626
(762) 9 (753)
11 381 26 686 38 067
12 995 6 112 14 510 974 80 566 723 81 289 4 370 85 659
6 285 850 9 956 2 389 36 080 408 36 488 2 131 38 619
2 901 2 181 1 509 (2 388) 16 031 164 16 195 701 16 896
3. Analyses by segment (continued)
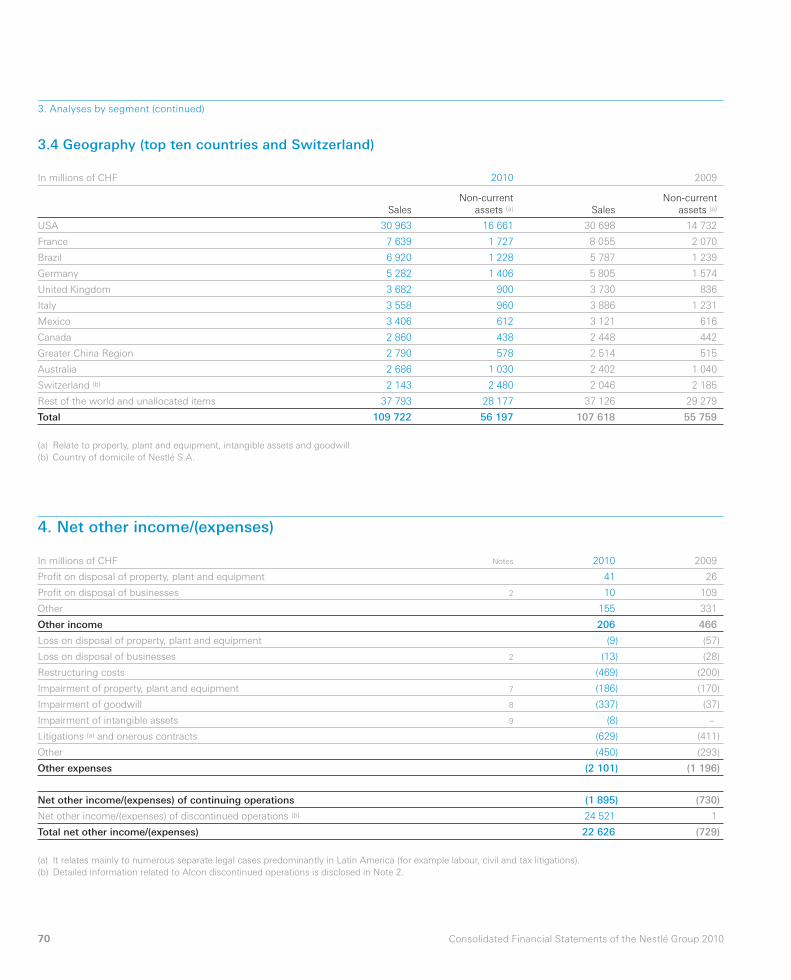
70 Consolidated Financial Statements of the Nestlé Group 2010
3.4 Geography (top ten countries and Switzerland)
In millions of CHF 2010 2009
Sales
Non-current
assets (a) Sales
Non-current
assets (a)
USA 30 963 16 661 30 698 14 732
France 7 639 1 727 8 055 2 070
Brazil 6 920 1 228 5 787 1 239
Germany 5 282 1 406 5 805 1 574
United Kingdom 3 682 900 3 730 836
Italy 3 558 960 3 886 1 231
Mexico 3 406 612 3 121 616
Canada 2 860 438 2 448 442
Greater China Region 2 790 578 2 514 515
Australia 2 686 1 030 2 402 1 040
Switzerland (b) 2 143 2 480 2 046 2 185
Rest of the world and unallocated items 37 793 28 177 37 126 29 279
Total 109 722 56 197 107 618 55 759
(a) Relate to property, plant and equipment, intangible assets and goodwill.
(b) Country of domicile of Nestlé S.A.
4. Net other income/(expenses)
In millions of CHF Notes 2010 2009
Profi t on disposal of property, plant and equipment 41 26
Profi t on disposal of businesses 2 10 109
Other 155 331
Other income 206 466
Loss on disposal of property, plant and equipment (9) (57)
Loss on disposal of businesses 2 (13) (28)
Restructuring costs (469) (200)
Impairment of property, plant and equipment 7 (186) (170)
Impairment of goodwill 8 (337) (37)
Impairment of intangible assets 9 (8) –
Litigations (a) and onerous contracts (629) (411)
Other (450) (293)
Other expenses (2 101) (1 196)
Net other income/(expenses) of continuing operations (1 895) (730)
Net other income/(expenses) of discontinued operations (b) 24 521 1
Total net other income/(expenses) 22 626 (729)
(a) It relates mainly to numerous separate legal cases predominantly in Latin America (for example labour, civil and tax litigations).
(b) Detailed information related to Alcon discontinued operations is disclosed in Note 2.
3. Analyses by segment (continued)
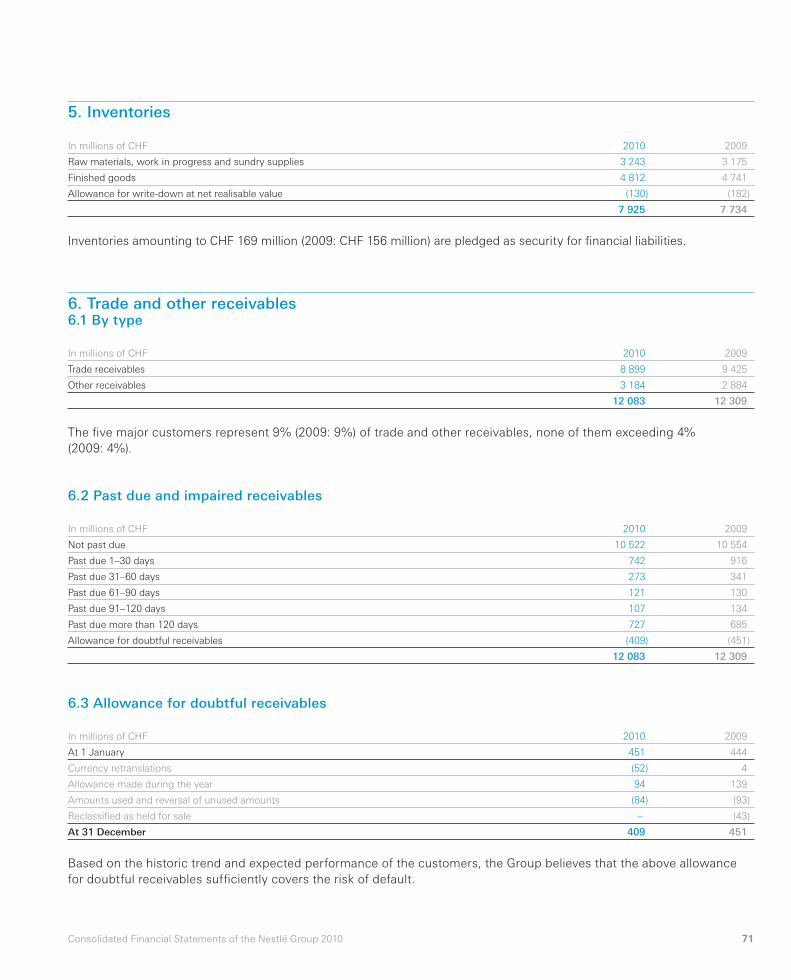
71Consolidated Financial Statements of the Nestlé Group 2010
6.3 Allowance for doubtful receivables
In millions of CHF 2010 2009
At 1 January 451 444
Currency retranslations (52) 4
Allowance made during the year 94 139
Amounts used and reversal of unused amounts (84) (93)
Reclassifi ed as held for sale – (43)
At 31 December 409 451
Based on the historic trend and expected performance of the customers, the Group believes that the above allowance
for doubtful receivables suffi ciently covers the risk of default.
6. Trade and other receivables6.1 By type
In millions of CHF 2010 2009
Trade receivables 8 899 9 425
Other receivables 3 184 2 884
12 083 12 309
The fi ve major customers represent 9% (2009: 9%) of trade and other receivables, none of them exceeding 4%
(2009: 4%).
6.2 Past due and impaired receivables
In millions of CHF 2010 2009
Not past due 10 522 10 554
Past due 1–30 days 742 916
Past due 31–60 days 273 341
Past due 61–90 days 121 130
Past due 91–120 days 107 134
Past due more than 120 days 727 685
Allowance for doubtful receivables (409) (451)
12 083 12 309
5. Inventories
In millions of CHF 2010 2009
Raw materials, work in progress and sundry supplies 3 243 3 175
Finished goods 4 812 4 741
Allowance for write-down at net realisable value (130) (182)
7 925 7 734
Inventories amounting to CHF 169 million (2009: CHF 156 million) are pledged as security for fi nancial liabilities.
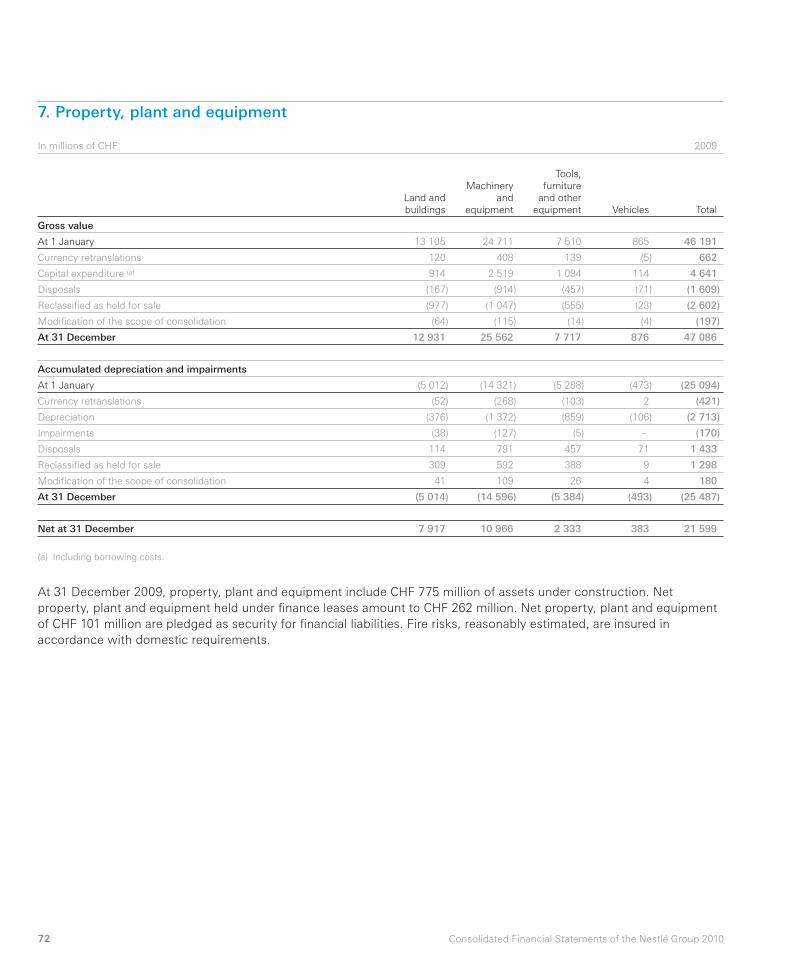
72 Consolidated Financial Statements of the Nestlé Group 2010
7. Property, plant and equipment
In millions of CHF 2009
Land and
buildings
Machinery
and
equipment
Tools,
furniture
and other
equipment Vehicles Total
Gross value
At 1 January 13 105 24 711 7 510 865 46 191
Currency retranslations 120 408 139 (5) 662
Capital expenditure (a) 914 2 519 1 094 114 4 641
Disposals (167) (914) (457) (71) (1 609)
Reclassifi ed as held for sale (977) (1 047) (555) (23) (2 602)
Modifi cation of the scope of consolidation (64) (115) (14) (4) (197)
At 31 December 12 931 25 562 7 717 876 47 086
Accumulated depreciation and impairments
At 1 January (5 012) (14 321) (5 288) (473) (25 094)
Currency retranslations (52) (268) (103) 2 (421)
Depreciation (376) (1 372) (859) (106) (2 713)
Impairments (38) (127) (5) – (170)
Disposals 114 791 457 71 1 433
Reclassifi ed as held for sale 309 592 388 9 1 298
Modifi cation of the scope of consolidation 41 109 26 4 180
At 31 December (5 014) (14 596) (5 384) (493) (25 487)
Net at 31 December 7 917 10 966 2 333 383 21 599
(a) Including borrowing costs.
At 31 December 2009, property, plant and equipment include CHF 775 million of assets under construction. Net
property, plant and equipment held under fi nance leases amount to CHF 262 million. Net property, plant and equipment
of CHF 101 million are pledged as security for fi nancial liabilities. Fire risks, reasonably estimated, are insured in
accordance with domestic requirements.
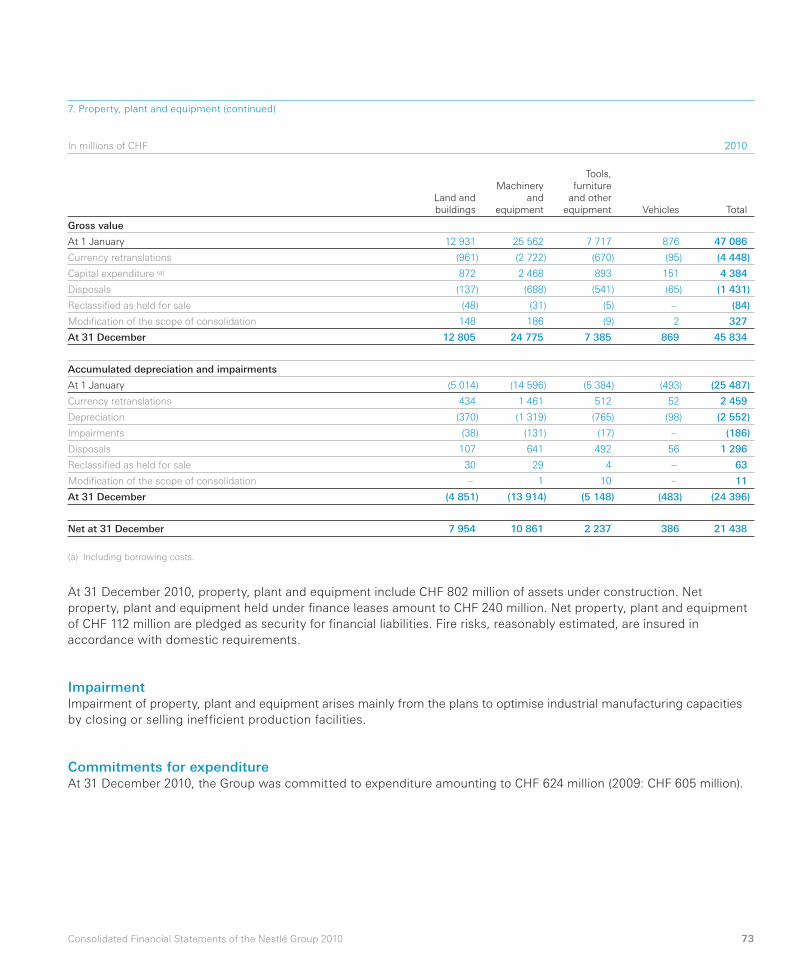
73Consolidated Financial Statements of the Nestlé Group 2010
In millions of CHF 2010
Land and
buildings
Machinery
and
equipment
Tools,
furniture
and other
equipment Vehicles Total
Gross value
At 1 January 12 931 25 562 7 717 876 47 086
Currency retranslations (961) (2 722) (670) (95) (4 448)
Capital expenditure (a) 872 2 468 893 151 4 384
Disposals (137) (688) (541) (65) (1 431)
Reclassifi ed as held for sale (48) (31) (5) – (84)
Modifi cation of the scope of consolidation 148 186 (9) 2 327
At 31 December 12 805 24 775 7 385 869 45 834
Accumulated depreciation and impairments
At 1 January (5 014) (14 596) (5 384) (493) (25 487)
Currency retranslations 434 1 461 512 52 2 459
Depreciation (370) (1 319) (765) (98) (2 552)
Impairments (38) (131) (17) – (186)
Disposals 107 641 492 56 1 296
Reclassifi ed as held for sale 30 29 4 – 63
Modifi cation of the scope of consolidation – 1 10 – 11
At 31 December (4 851) (13 914) (5 148) (483) (24 396)
Net at 31 December 7 954 10 861 2 237 386 21 438
(a) Including borrowing costs.
7. Property, plant and equipment (continued)
ImpairmentImpairment of property, plant and equipment arises mainly from the plans to optimise industrial manufacturing capacities
by closing or selling ineffi cient production facilities.
Commitments for expenditure At 31 December 2010, the Group was committed to expenditure amounting to CHF 624 million (2009: CHF 605 million).
At 31 December 2010, property, plant and equipment include CHF 802 million of assets under construction. Net
property, plant and equipment held under fi nance leases amount to CHF 240 million. Net property, plant and equipment
of CHF 112 million are pledged as security for fi nancial liabilities. Fire risks, reasonably estimated, are insured in
accordance with domestic requirements.
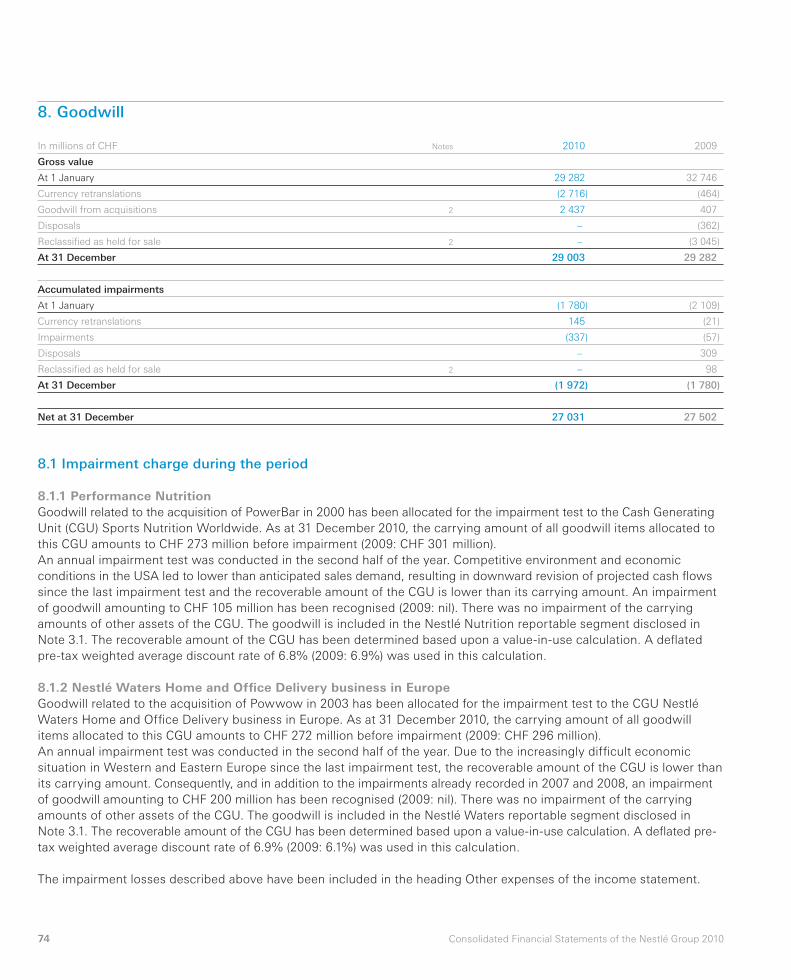
74 Consolidated Financial Statements of the Nestlé Group 2010
8.1 Impairment charge during the period
8.1.1 Performance NutritionGoodwill related to the acquisition of PowerBar in 2000 has been allocated for the impairment test to the Cash Generating
Unit (CGU) Sports Nutrition Worldwide. As at 31 December 2010, the carrying amount of all goodwill items allocated to
this CGU amounts to CHF 273 million before impairment (2009: CHF 301 million).
An annual impairment test was conducted in the second half of the year. Competitive environment and economic
conditions in the USA led to lower than anticipated sales demand, resulting in downward revision of projected cash fl ows
since the last impairment test and the recoverable amount of the CGU is lower than its carrying amount. An impairment
of goodwill amounting to CHF 105 million has been recognised (2009: nil). There was no impairment of the carrying
amounts of other assets of the CGU. The goodwill is included in the Nestlé Nutrition reportable segment disclosed in
Note 3.1. The recoverable amount of the CGU has been determined based upon a value-in-use calculation. A defl ated
pre-tax weighted average discount rate of 6.8% (2009: 6.9%) was used in this calculation.
8.1.2 Nestlé Waters Home and Offi ce Delivery business in EuropeGoodwill related to the acquisition of Powwow in 2003 has been allocated for the impairment test to the CGU Nestlé
Waters Home and Offi ce Delivery business in Europe. As at 31 December 2010, the carrying amount of all goodwill
items allocated to this CGU amounts to CHF 272 million before impairment (2009: CHF 296 million).
An annual impairment test was conducted in the second half of the year. Due to the increasingly diffi cult economic
situation in Western and Eastern Europe since the last impairment test, the recoverable amount of the CGU is lower than
its carrying amount. Consequently, and in addition to the impairments already recorded in 2007 and 2008, an impairment
of goodwill amounting to CHF 200 million has been recognised (2009: nil). There was no impairment of the carrying
amounts of other assets of the CGU. The goodwill is included in the Nestlé Waters reportable segment disclosed in
Note 3.1. The recoverable amount of the CGU has been determined based upon a value-in-use calculation. A defl ated pre-
tax weighted average discount rate of 6.9% (2009: 6.1%) was used in this calculation.
The impairment losses described above have been included in the heading Other expenses of the income statement.
8. Goodwill
In millions of CHF Notes 2010 2009
Gross value
At 1 January 29 282 32 746
Currency retranslations (2 716) (464)
Goodwill from acquisitions 2 2 437 407
Disposals – (362)
Reclassifi ed as held for sale 2 – (3 045)
At 31 December 29 003 29 282
Accumulated impairments
At 1 January (1 780) (2 109)
Currency retranslations 145 (21)
Impairments (337) (57)
Disposals – 309
Reclassifi ed as held for sale 2 – 98
At 31 December (1 972) (1 780)
Net at 31 December 27 031 27 502
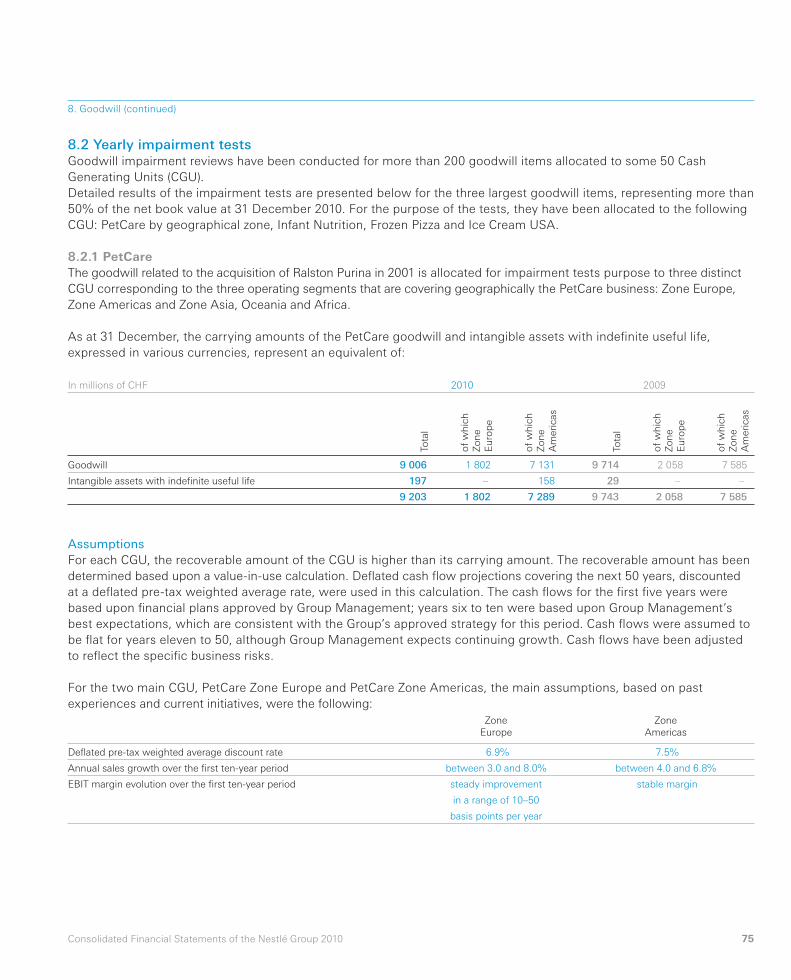
75Consolidated Financial Statements of the Nestlé Group 2010
In millions of CHF 2010 2009
Tota
l
of
wh
ich
Zo
ne
Eu
rop
e
of
wh
ich
Zo
ne
Am
eri
cas
Tota
l
of
wh
ich
Zo
ne
Eu
rop
e
of
wh
ich
Zo
ne
Am
eri
cas
Goodwill 9 006 1 802 7 131 9 714 2 058 7 585
Intangible assets with indefi nite useful life 197 – 158 29 – –
9 203 1 802 7 289 9 743 2 058 7 585
AssumptionsFor each CGU, the recoverable amount of the CGU is higher than its carrying amount. The recoverable amount has been
determined based upon a value-in-use calculation. Defl ated cash fl ow projections covering the next 50 years, discounted
at a defl ated pre-tax weighted average rate, were used in this calculation. The cash fl ows for the fi rst fi ve years were
based upon fi nancial plans approved by Group Management; years six to ten were based upon Group Management’s
best expectations, which are consis tent with the Group’s approved strategy for this period. Cash fl ows were assumed to
be fl at for years eleven to 50, although Group Management expects continuing growth. Cash fl ows have been adjusted
to refl ect the specifi c business risks.
For the two main CGU, PetCare Zone Europe and PetCare Zone Americas, the main assumptions, based on past
experiences and current initiatives, were the following:
8.2 Yearly impairment testsGoodwill impairment reviews have been conducted for more than 200 goodwill items allocated to some 50 Cash
Generating Units (CGU).
Detailed results of the impairment tests are presented below for the three largest goodwill items, representing more than
50% of the net book value at 31 December 2010. For the purpose of the tests, they have been allocated to the following
CGU: PetCare by geographical zone, Infant Nutrition, Frozen Pizza and Ice Cream USA.
8.2.1 PetCareThe goodwill related to the acquisition of Ralston Purina in 2001 is allocated for impairment tests purpose to three distinct
CGU correspon d ing to the three operating segments that are covering geogra phically the PetCare business: Zone Europe,
Zone Americas and Zone Asia, Oceania and Africa.
As at 31 December, the carrying amounts of the PetCare goodwill and intangible assets with indefi nite useful life,
expressed in various currencies, represent an equivalent of:
8. Goodwill (continued)
Zone
Europe
Zone
Americas
Defl ated pre-tax weighted average discount rate 6.9% 7.5%
Annual sales growth over the fi rst ten-year period between 3.0 and 8.0% between 4.0 and 6.8%
EBIT margin evolution over the fi rst ten-year period steady improvement
in a range of 10–50
basis points per year
stable margin
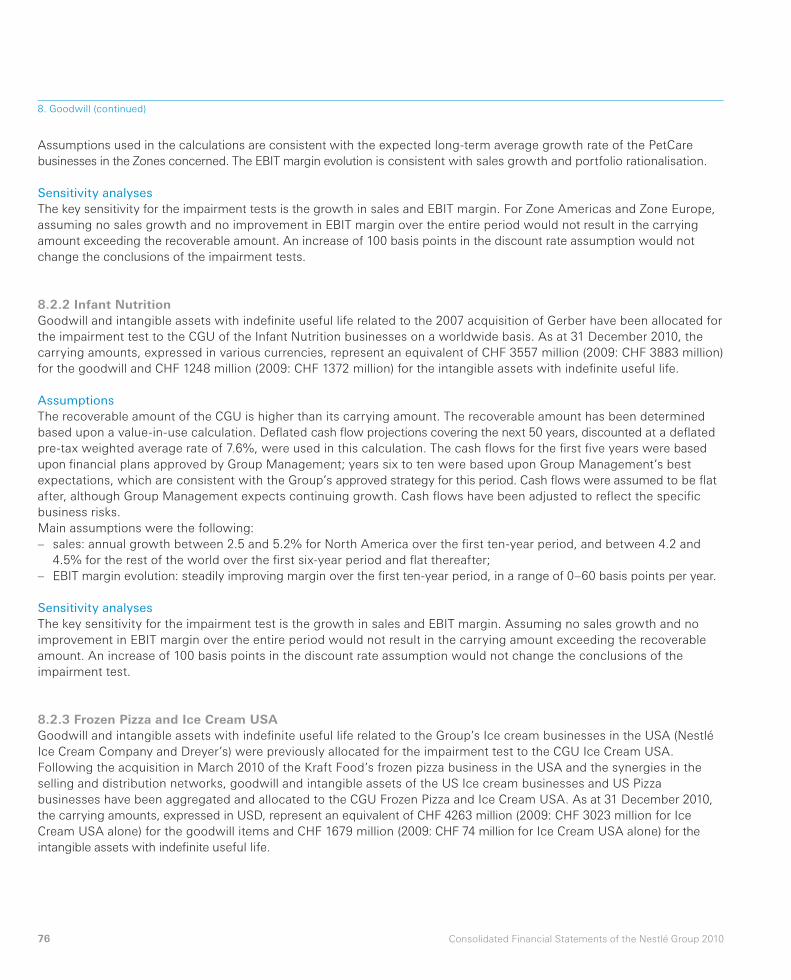
76 Consolidated Financial Statements of the Nestlé Group 2010
Assumptions used in the calculations are consistent with the expected long-term average growth rate of the PetCare
businesses in the Zones concerned. The EBIT margin evolu tion is consistent with sales growth and portfolio rationalisation.
Sensitivity analysesThe key sensitivity for the impairment tests is the growth in sales and EBIT margin. For Zone Americas and Zone Europe,
assuming no sales growth and no improvement in EBIT margin over the entire period would not result in the carrying
amount exceeding the recoverable amount. An increase of 100 basis points in the discount rate assump tion would not
change the conclusions of the impairment tests.
8.2.2 Infant NutritionGoodwill and intangible assets with indefi nite useful life related to the 2007 acquisition of Gerber have been allocated for
the impairment test to the CGU of the Infant Nutrition businesses on a worldwide basis. As at 31 December 2010, the
carrying amounts, expressed in various currencies, represent an equivalent of CHF 3557 million (2009: CHF 3883 million)
for the goodwill and CHF 1248 million (2009: CHF 1372 million) for the intangible assets with indefi nite useful life.
AssumptionsThe recoverable amount of the CGU is higher than its carrying amount. The recoverable amount has been determined
based upon a value-in-use calculation. Defl ated cash fl ow projections covering the next 50 years, discounted at a defl ated
pre-tax weighted average rate of 7.6%, were used in this calculation. The cash fl ows for the fi rst fi ve years were based
upon fi nancial plans approved by Group Management; years six to ten were based upon Group Management’s best
expectations, which are consistent with the Group’s approved strategy for this period. Cash fl ows were assumed to be fl at
after, although Group Management expects continuing growth. Cash fl ows have been adjusted to refl ect the specifi c
business risks.
Main assumptions were the following:
– sales: annual growth between 2.5 and 5.2% for North America over the fi rst ten-year period, and between 4.2 and
4.5% for the rest of the world over the fi rst six-year period and fl at thereafter;
– EBIT margin evolution: steadily improving margin over the fi rst ten-year period, in a range of 0–60 basis points per year.
Sensitivity analysesThe key sensitivity for the impairment test is the growth in sales and EBIT margin. Assuming no sales growth and no
improvement in EBIT margin over the entire period would not result in the carrying amount exceeding the recoverable
amount. An increase of 100 basis points in the discount rate assumption would not change the conclusions of the
impairment test.
8.2.3 Frozen Pizza and Ice Cream USAGoodwill and intangible assets with indefi nite useful life related to the Group’s Ice cream businesses in the USA (Nestlé
Ice Cream Company and Dreyer’s) were previously allocated for the impairment test to the CGU Ice Cream USA.
Following the acquisition in March 2010 of the Kraft Food’s frozen pizza business in the USA and the synergies in the
selling and distribution networks, goodwill and intangible assets of the US Ice cream businesses and US Pizza
businesses have been aggregated and allocated to the CGU Frozen Pizza and Ice Cream USA. As at 31 December 2010,
the carrying amounts, expressed in USD, represent an equivalent of CHF 4263 million (2009: CHF 3023 million for Ice
Cream USA alone) for the goodwill items and CHF 1679 million (2009: CHF 74 million for Ice Cream USA alone) for the
intangible assets with indefi nite useful life.
8. Goodwill (continued)
77Consolidated Financial Statements of the Nestlé Group 2010
AssumptionsThe recoverable amount of the CGU is higher than its carrying amount. The recoverable amount has been determined
based upon a value-in-use calculation. Defl ated cash fl ow projections covering the next 50 years, discounted at a defl ated
pre-tax weighted average rate of 7.2%, were used in this calculation. The cash fl ows for the fi rst fi ve years were based
upon fi nancial plans approved by Group Management; years six to ten were based upon Group Management’s best
expectations, which are consistent with the Group’s approved strategy for this period. Cash fl ows were assumed to be
fl at for years eleven to 50, although Group Management expects continuing growth. Cash fl ows have been adjusted to
refl ect the specifi c business risks.
Main assumptions, based on past experiences and current initiatives, were the following:
– sales: annual growth between 3.1 and 4.8% over the fi rst ten-year period;
– EBIT margin evolution: steadily improving margin over the period, in a range of 60–210 basis points per year, which is
consistent with enhanced cost management and effi ciency.
Sensitivity analysesThe key sensitivity for the impairment test is the growth in sales and EBIT margin. Assuming no sales growth and no
EBIT improvement after the fi rst fi ve-year period would not result in the carrying amount exceeding the recoverable
amount. An increase of 100 basis points in the discount rate assumption would not change the conclusions of the
impairment test.
8. Goodwill (continued)
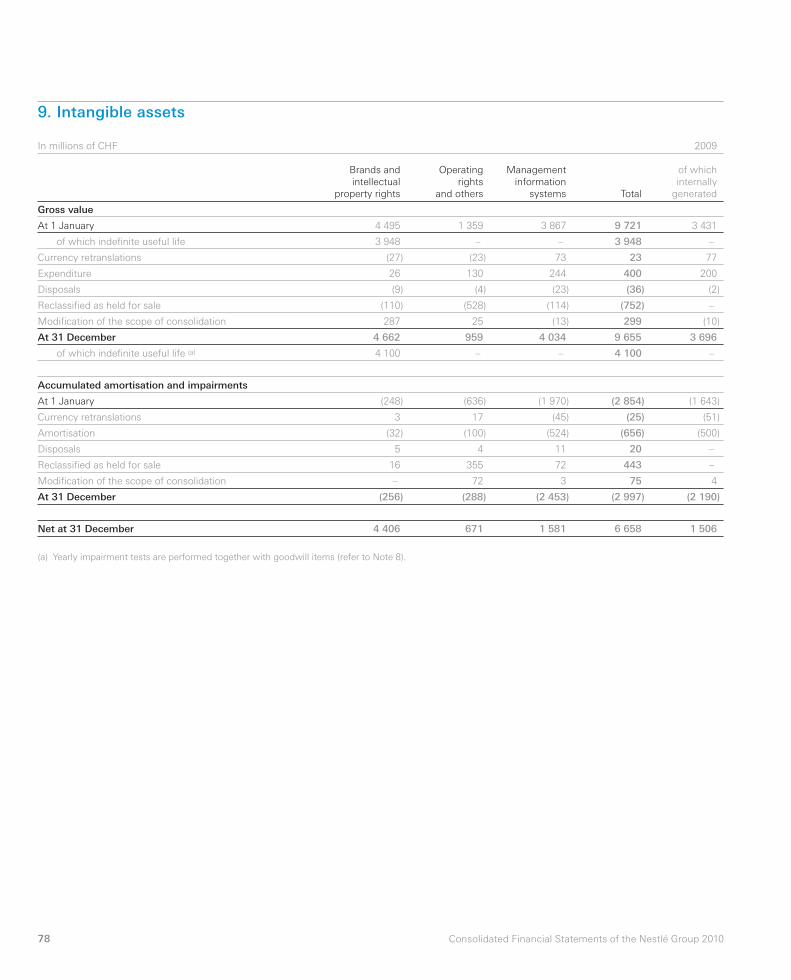
78 Consolidated Financial Statements of the Nestlé Group 2010
9. Intangible assets
In millions of CHF 2009
Brands and
intellectual
property rights
Operating
rights
and others
Management
information
systems Total
of which
internally
generated
Gross value
At 1 January 4 495 1 359 3 867 9 721 3 431
of which indefi nite useful life 3 948 – – 3 948 –
Currency retranslations (27) (23) 73 23 77
Expenditure 26 130 244 400 200
Disposals (9) (4) (23) (36) (2)
Reclassifi ed as held for sale (110) (528) (114) (752) –
Modifi cation of the scope of consolidation 287 25 (13) 299 (10)
At 31 December 4 662 959 4 034 9 655 3 696
of which indefi nite useful life (a) 4 100 – – 4 100 –
Accumulated amortisation and impairments
At 1 January (248) (636) (1 970) (2 854) (1 643)
Currency retranslations 3 17 (45) (25) (51)
Amortisation (32) (100) (524) (656) (500)
Disposals 5 4 11 20 –
Reclassifi ed as held for sale 16 355 72 443 –
Modifi cation of the scope of consolidation – 72 3 75 4
At 31 December (256) (288) (2 453) (2 997) (2 190)
Net at 31 December 4 406 671 1 581 6 658 1 506
(a) Yearly impairment tests are performed together with goodwill items (refer to Note 8).
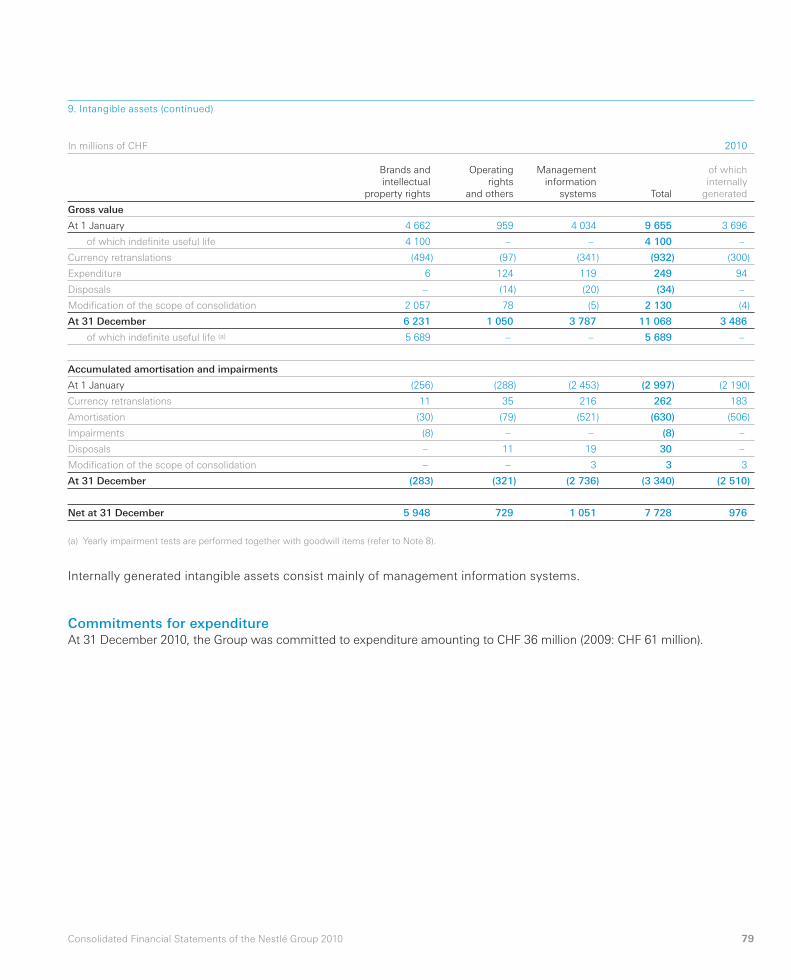
79Consolidated Financial Statements of the Nestlé Group 2010
In millions of CHF 2010
Brands and
intellectual
property rights
Operating
rights
and others
Management
information
systems Total
of which
internally
generated
Gross value
At 1 January 4 662 959 4 034 9 655 3 696
of which indefi nite useful life 4 100 – – 4 100 –
Currency retranslations (494) (97) (341) (932) (300)
Expenditure 6 124 119 249 94
Disposals – (14) (20) (34) –
Modifi cation of the scope of consolidation 2 057 78 (5) 2 130 (4)
At 31 December 6 231 1 050 3 787 11 068 3 486
of which indefi nite useful life (a) 5 689 – – 5 689 –
Accumulated amortisation and impairments
At 1 January (256) (288) (2 453) (2 997) (2 190)
Currency retranslations 11 35 216 262 183
Amortisation (30) (79) (521) (630) (506)
Impairments (8) – – (8) –
Disposals – 11 19 30 –
Modifi cation of the scope of consolidation – – 3 3 3
At 31 December (283) (321) (2 736) (3 340) (2 510)
Net at 31 December 5 948 729 1 051 7 728 976
(a) Yearly impairment tests are performed together with goodwill items (refer to Note 8).
Internally generated intangible assets consist mainly of management information systems.
Commitments for expenditureAt 31 December 2010, the Group was committed to expen diture amounting to CHF 36 million (2009: CHF 61 mil lion).
9. Intangible assets (continued)
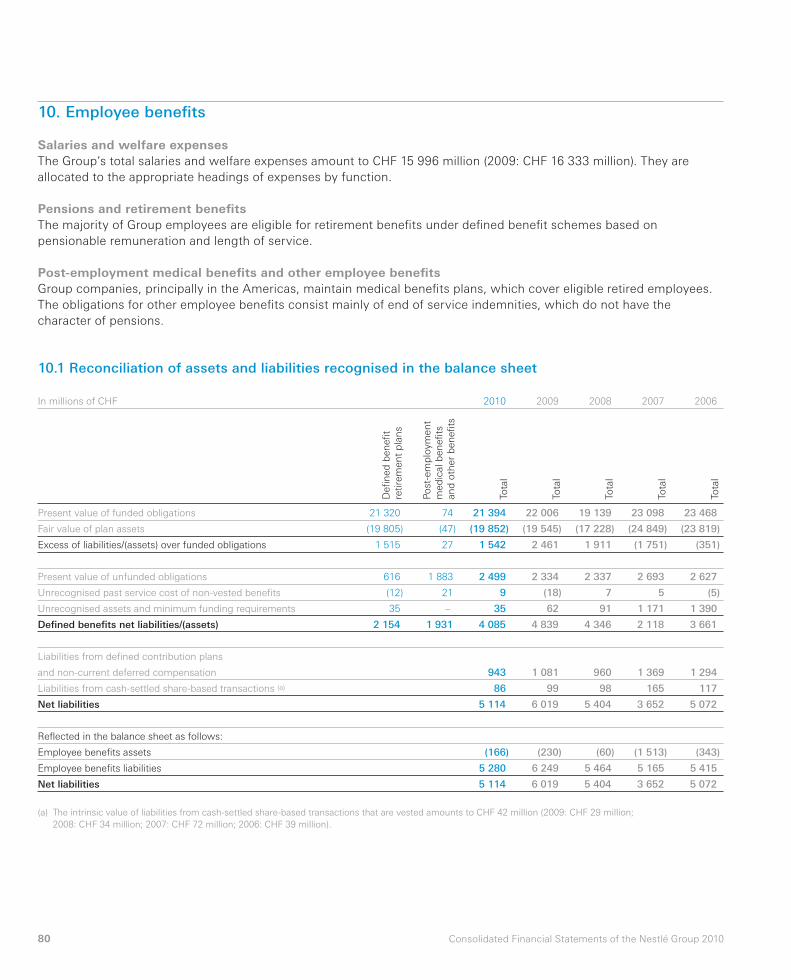
80 Consolidated Financial Statements of the Nestlé Group 2010
10.1 Reconciliation of assets and liabilities recognised in the balance sheet
In millions of CHF 2010 2009 2008 2007 2006
Defi n
ed
ben
efi t
retire
men
t p
lan
s
Po
st-e
mp
loym
en
t
med
ical b
en
efi ts
an
d o
ther
ben
efi ts
Tota
l
Tota
l
Tota
l
Tota
l
Tota
l
Present value of funded obligations 21 320 74 21 394 22 006 19 139 23 098 23 468
Fair value of plan assets (19 805) (47) (19 852) (19 545) (17 228) (24 849) (23 819)
Excess of liabilities/(assets) over funded obligations 1 515 27 1 542 2 461 1 911 (1 751) (351)
Present value of unfunded obligations 616 1 883 2 499 2 334 2 337 2 693 2 627
Unrecognised past service cost of non-vested benefi ts (12) 21 9 (18) 7 5 (5)
Unrecognised assets and minimum funding requirements 35 – 35 62 91 1 171 1 390
Defi ned benefi ts net liabilities/(assets) 2 154 1 931 4 085 4 839 4 346 2 118 3 661
Liabilities from defi ned contribution plans
and non-current deferred compensation 943 1 081 960 1 369 1 294
Liabilities from cash-settled share-based transactions (a) 86 99 98 165 117
Net liabilities 5 114 6 019 5 404 3 652 5 072
Refl ected in the balance sheet as follows:
Employee benefi ts assets (166) (230) (60) (1 513) (343)
Employee benefi ts liabilities 5 280 6 249 5 464 5 165 5 415
Net liabilities 5 114 6 019 5 404 3 652 5 072
(a) The intrinsic value of liabilities from cash-settled share-based transactions that are vested amounts to CHF 42 million (2009: CHF 29 million;
2008: CHF 34 million; 2007: CHF 72 million; 2006: CHF 39 million).
10. Employee benefi ts
Salaries and welfare expensesThe Group’s total salaries and welfare expenses amount to CHF 15 996 million (2009: CHF 16 333 million). They are
allocated to the appropriate headings of expenses by function.
Pensions and retirement benefi tsThe majority of Group employees are eligible for retirement benefi ts under defi ned benefi t schemes based on
pensionable remuneration and length of service.
Post-employment medical benefi ts and other employee benefi tsGroup companies, principally in the Americas, maintain medical benefi ts plans, which cover eligible retired employees.
The obligations for other employee benefi ts consist mainly of end of service indemnities, which do not have the
character of pensions.
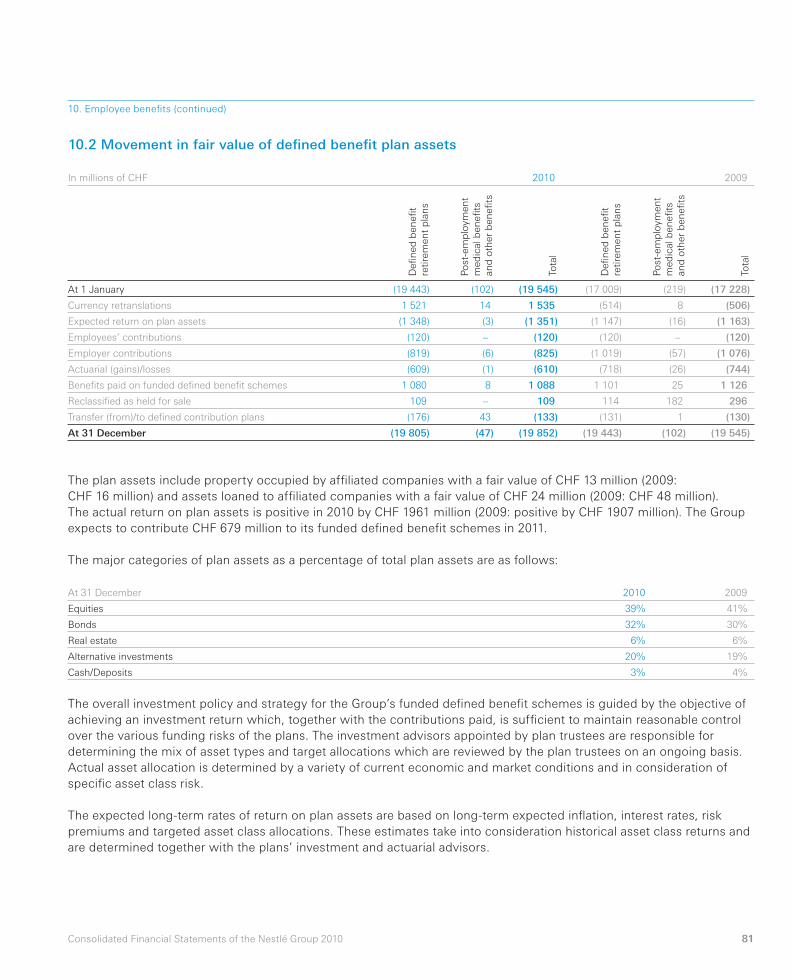
81Consolidated Financial Statements of the Nestlé Group 2010
The major categories of plan assets as a percentage of total plan assets are as follows:
10. Employee benefi ts (continued)
10.2 Movement in fair value of defi ned benefi t plan assets
In millions of CHF 2010 2009
Defi n
ed
ben
efi t
retire
men
t p
lan
s
Po
st-e
mp
loym
en
t
med
ical b
en
efi ts
an
d o
ther
ben
efi ts
Tota
l
Defi n
ed
ben
efi t
retire
men
t p
lan
s
Po
st-e
mp
loym
en
t
med
ical b
en
efi ts
an
d o
ther
ben
efi ts
Tota
l
At 1 January (19 443) (102) (19 545) (17 009) (219) (17 228)
Currency retranslations 1 521 14 1 535 (514) 8 (506)
Expected return on plan assets (1 348) (3) (1 351) (1 147) (16) (1 163)
Employees’ contributions (120) – (120) (120) – (120)
Employer contributions (819) (6) (825) (1 019) (57) (1 076)
Actuarial (gains)/losses (609) (1) (610) (718) (26) (744)
Benefi ts paid on funded defi ned benefi t schemes 1 080 8 1 088 1 101 25 1 126
Reclassifi ed as held for sale 109 – 109 114 182 296
Transfer (from)/to defi ned contribution plans (176) 43 (133) (131) 1 (130)
At 31 December (19 805) (47) (19 852) (19 443) (102) (19 545)
At 31 December 2010 2009
Equities 39% 41%
Bonds 32% 30%
Real estate 6% 6%
Alternative investments 20% 19%
Cash/Deposits 3% 4%
The overall investment policy and strategy for the Group’s funded defi ned benefi t schemes is guided by the objective of
achieving an investment return which, together with the contributions paid, is suffi cient to maintain reasonable control
over the various funding risks of the plans. The investment advisors appointed by plan trustees are responsible for
determining the mix of asset types and target allocations which are reviewed by the plan trustees on an ongoing basis.
Actual asset allocation is determined by a variety of current economic and market conditions and in consideration of
specifi c asset class risk.
The expected long-term rates of return on plan assets are based on long-term expected infl ation, interest rates, risk
premiums and targeted asset class allocations. These estimates take into consideration historical asset class returns and
are determined together with the plans’ investment and actuarial advisors.
The plan assets include property occupied by affi liated companies with a fair value of CHF 13 million (2009:
CHF 16 million) and assets loaned to affi liated companies with a fair value of CHF 24 million (2009: CHF 48 million).
The actual return on plan assets is positive in 2010 by CHF 1961 million (2009: positive by CHF 1907 million). The Group
expects to contribute CHF 679 million to its funded defi ned benefi t schemes in 2011.
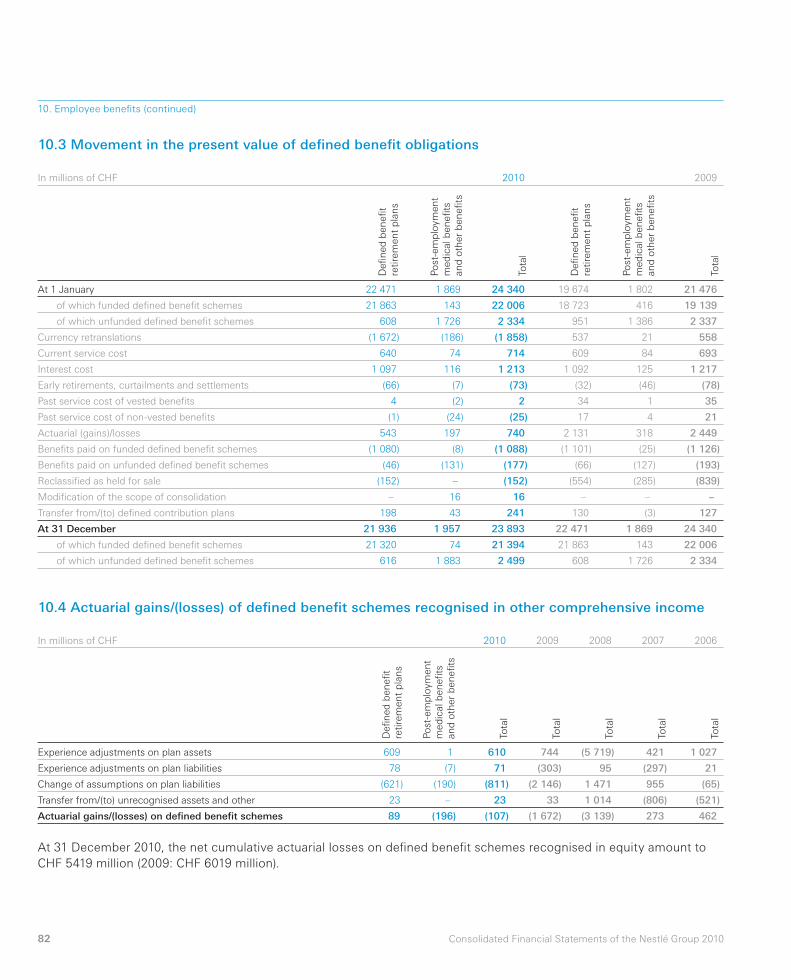
82 Consolidated Financial Statements of the Nestlé Group 2010
10. Employee benefi ts (continued)
10.3 Movement in the present value of defi ned benefi t obligations
In millions of CHF 2010 2009
Defi n
ed
ben
efi t
retire
men
t p
lan
s
Po
st-e
mp
loym
en
t
med
ical b
en
efi ts
an
d o
ther
ben
efi ts
Tota
l
Defi n
ed
ben
efi t
retire
men
t p
lan
s
Po
st-e
mp
loym
en
t
med
ical b
en
efi ts
an
d o
ther
ben
efi ts
Tota
l
At 1 January 22 471 1 869 24 340 19 674 1 802 21 476
of which funded defi ned benefi t schemes 21 863 143 22 006 18 723 416 19 139
of which unfunded defi ned benefi t schemes 608 1 726 2 334 951 1 386 2 337
Currency retranslations (1 672) (186) (1 858) 537 21 558
Current service cost 640 74 714 609 84 693
Interest cost 1 097 116 1 213 1 092 125 1 217
Early retirements, curtailments and settlements (66) (7) (73) (32) (46) (78)
Past service cost of vested benefi ts 4 (2) 2 34 1 35
Past service cost of non-vested benefi ts (1) (24) (25) 17 4 21
Actuarial (gains)/losses 543 197 740 2 131 318 2 449
Benefi ts paid on funded defi ned benefi t schemes (1 080) (8) (1 088) (1 101) (25) (1 126)
Benefi ts paid on unfunded defi ned benefi t schemes (46) (131) (177) (66) (127) (193)
Reclassifi ed as held for sale (152) – (152) (554) (285) (839)
Modifi cation of the scope of consolidation – 16 16 – – –
Transfer from/(to) defi ned contribution plans 198 43 241 130 (3) 127
At 31 December 21 936 1 957 23 893 22 471 1 869 24 340
of which funded defi ned benefi t schemes 21 320 74 21 394 21 863 143 22 006
of which unfunded defi ned benefi t schemes 616 1 883 2 499 608 1 726 2 334
10.4 Actuarial gains/(losses) of defi ned benefi t schemes recognised in other comprehensive income
In millions of CHF 2010 2009 2008 2007 2006
Defi n
ed
ben
efi t
retire
men
t p
lan
s
Po
st-e
mp
loym
en
t
med
ical b
en
efi ts
an
d o
ther
ben
efi ts
Tota
l
Tota
l
Tota
l
Tota
l
Tota
l
Experience adjustments on plan assets 609 1 610 744 (5 719) 421 1 027
Experience adjustments on plan liabilities 78 (7) 71 (303) 95 (297) 21
Change of assumptions on plan liabilities (621) (190) (811) (2 146) 1 471 955 (65)
Transfer from/(to) unrecognised assets and other 23 – 23 33 1 014 (806) (521)
Actuarial gains/(losses) on defi ned benefi t schemes 89 (196) (107) (1 672) (3 139) 273 462
At 31 December 2010, the net cumulative actuarial losses on defi ned benefi t schemes recognised in equity amount to
CHF 5419 million (2009: CHF 6019 million).
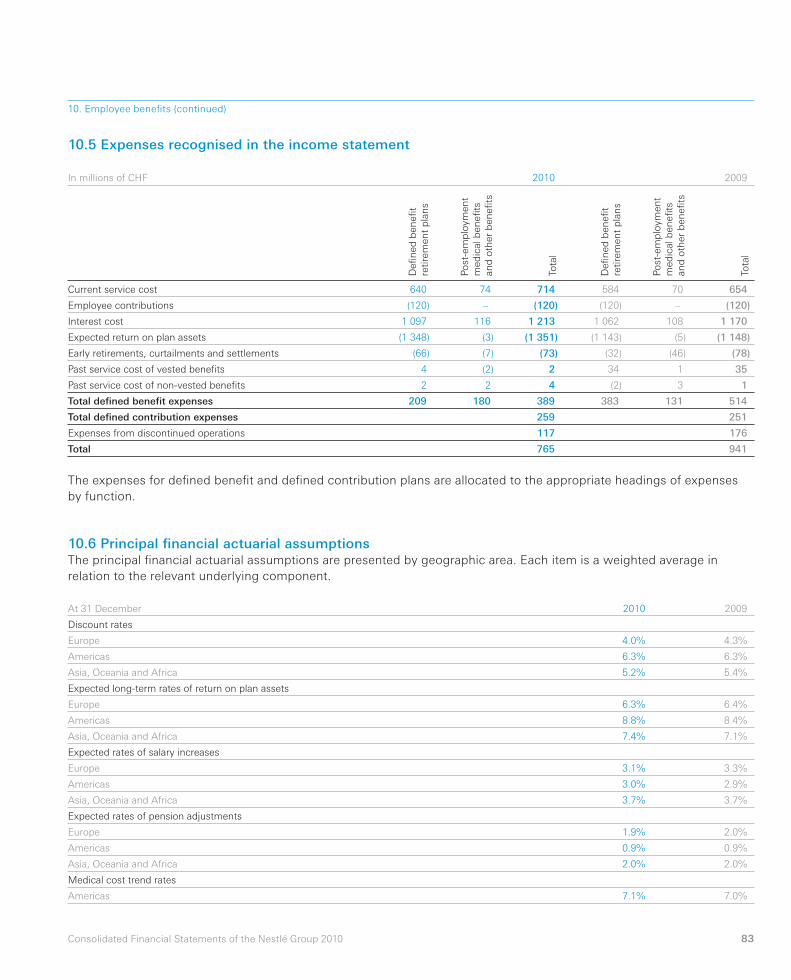
83Consolidated Financial Statements of the Nestlé Group 2010
10. Employee benefi ts (continued)
10.5 Expenses recognised in the income statement
In millions of CHF 2010 2009
Defi n
ed
ben
efi t
retire
men
t p
lan
s
Po
st-e
mp
loym
en
t
med
ical b
en
efi ts
an
d o
ther
ben
efi ts
Tota
l
Defi n
ed
ben
efi t
retire
men
t p
lan
s
Po
st-e
mp
loym
en
t
med
ical b
en
efi ts
an
d o
ther
ben
efi ts
Tota
l
Current service cost 640 74 714 584 70 654
Employee contributions (120) – (120) (120) – (120)
Interest cost 1 097 116 1 213 1 062 108 1 170
Expected return on plan assets (1 348) (3) (1 351) (1 143) (5) (1 148)
Early retirements, curtailments and settlements (66) (7) (73) (32) (46) (78)
Past service cost of vested benefi ts 4 (2) 2 34 1 35
Past service cost of non-vested benefi ts 2 2 4 (2) 3 1
Total defi ned benefi t expenses 209 180 389 383 131 514
Total defi ned contribution expenses 259 251
Expenses from discontinued operations 117 176
Total 765 941
The expenses for defi ned benefi t and defi ned contribution plans are allocated to the appropriate headings of expenses
by function.
10.6 Principal fi nancial actuarial assumptionsThe principal fi nancial actuarial assumptions are presented by geographic area. Each item is a weighted average in
relation to the relevant underlying component.
At 31 December 2010 2009
Discount rates
Europe 4.0% 4.3%
Americas 6.3% 6.3%
Asia, Oceania and Africa 5.2% 5.4%
Expected long-term rates of return on plan assets
Europe 6.3% 6.4%
Americas 8.8% 8.4%
Asia, Oceania and Africa 7.4% 7.1%
Expected rates of salary increases
Europe 3.1% 3.3%
Americas 3.0% 2.9%
Asia, Oceania and Africa 3.7% 3.7%
Expected rates of pension adjustments
Europe 1.9% 2.0%
Americas 0.9% 0.9%
Asia, Oceania and Africa 2.0% 2.0%
Medical cost trend rates
Americas 7.1% 7.0%
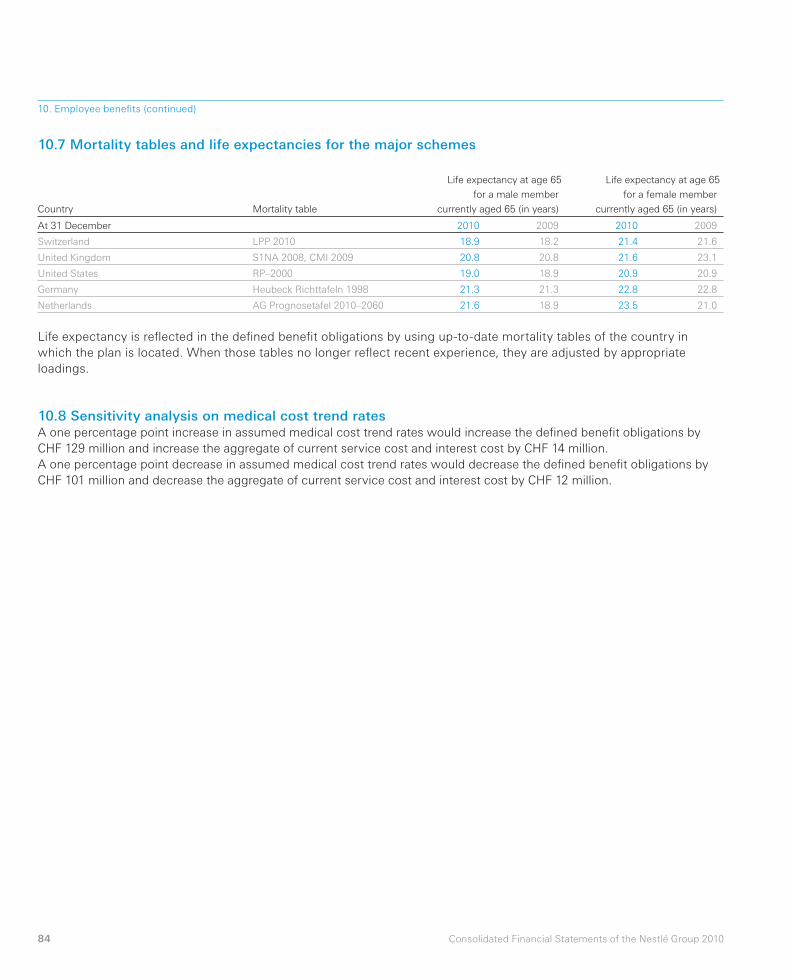
84 Consolidated Financial Statements of the Nestlé Group 2010
10. Employee benefi ts (continued)
10.7 Mortality tables and life expectancies for the major schemes
Country Mortality table
Life expectancy at age 65
for a male member
currently aged 65 (in years)
Life expectancy at age 65
for a female member
currently aged 65 (in years)
At 31 December 2010 2009 2010 2009
Switzerland LPP 2010 18.9 18.2 21.4 21.6
United Kingdom S1NA 2008, CMI 2009 20.8 20.8 21.6 23.1
United States RP–2000 19.0 18.9 20.9 20.9
Germany Heubeck Richttafeln 1998 21.3 21.3 22.8 22.8
Netherlands AG Prognosetafel 2010–2060 21.6 18.9 23.5 21.0
Life expectancy is refl ected in the defi ned benefi t obligations by using up-to-date mortality tables of the country in
which the plan is located. When those tables no longer refl ect recent experience, they are adjusted by appropriate
loadings.
10.8 Sensitivity analysis on medical cost trend ratesA one percentage point increase in assumed medical cost trend rates would increase the defi ned benefi t obligations by
CHF 129 million and increase the aggregate of current service cost and interest cost by CHF 14 million.
A one percentage point decrease in assumed medical cost trend rates would decrease the defi ned benefi t obligations by
CHF 101 million and decrease the aggregate of current service cost and interest cost by CHF 12 million.
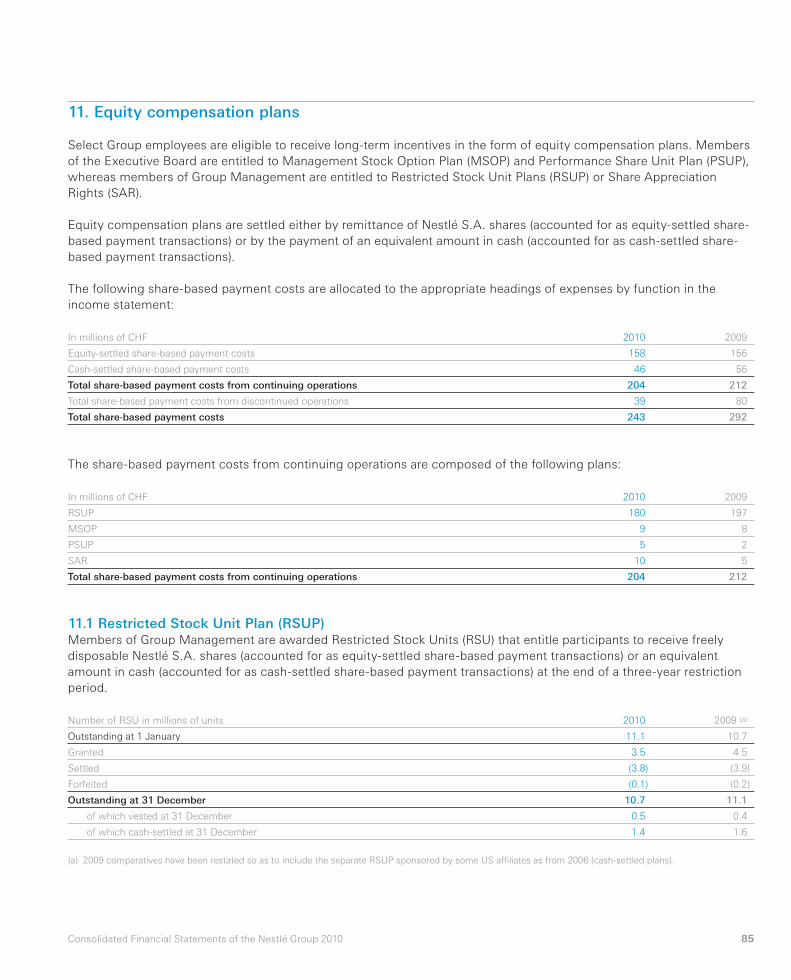
85Consolidated Financial Statements of the Nestlé Group 2010
11.1 Restricted Stock Unit Plan (RSUP)Members of Group Management are awarded Restricted Stock Units (RSU) that entitle participants to receive freely
disposable Nestlé S.A. shares (accounted for as equity-settled share-based payment transactions) or an equivalent
amount in cash (accounted for as cash-settled share-based payment transactions) at the end of a three-year restriction
period.
The share-based payment costs from continuing operations are composed of the following plans:
In millions of CHF 2010 2009
RSUP 180 197
MSOP 9 8
PSUP 5 2
SAR 10 5
Total share-based payment costs from continuing operations 204 212
Number of RSU in millions of units 2010 2009 (a)
Outstanding at 1 January 11.1 10.7
Granted 3.5 4.5
Settled (3.8) (3.9)
Forfeited (0.1) (0.2)
Outstanding at 31 December 10.7 11.1
of which vested at 31 December 0.5 0.4
of which cash-settled at 31 December 1.4 1.6
(a) 2009 comparatives have been restated so as to include the separate RSUP sponsored by some US affi liates as from 2006 (cash-settled plans).
In millions of CHF 2010 2009
Equity-settled share-based payment costs 158 156
Cash-settled share-based payment costs 46 56
Total share-based payment costs from continuing operations 204 212
Total share-based payment costs from discontinued operations 39 80
Total share-based payment costs 243 292
11. Equity compensation plans
Select Group employees are eligible to receive long-term incentives in the form of equity compensation plans. Members
of the Executive Board are entitled to Management Stock Option Plan (MSOP) and Performance Share Unit Plan (PSUP),
whereas members of Group Management are entitled to Restricted Stock Unit Plans (RSUP) or Share Appreciation
Rights (SAR).
Equity compensation plans are settled either by remittance of Nestlé S.A. shares (accounted for as equity-settled share-
based payment transactions) or by the payment of an equivalent amount in cash (accounted for as cash-settled share-
based payment transactions).
The following share-based payment costs are allocated to the appropriate headings of expenses by function in the
income statement:
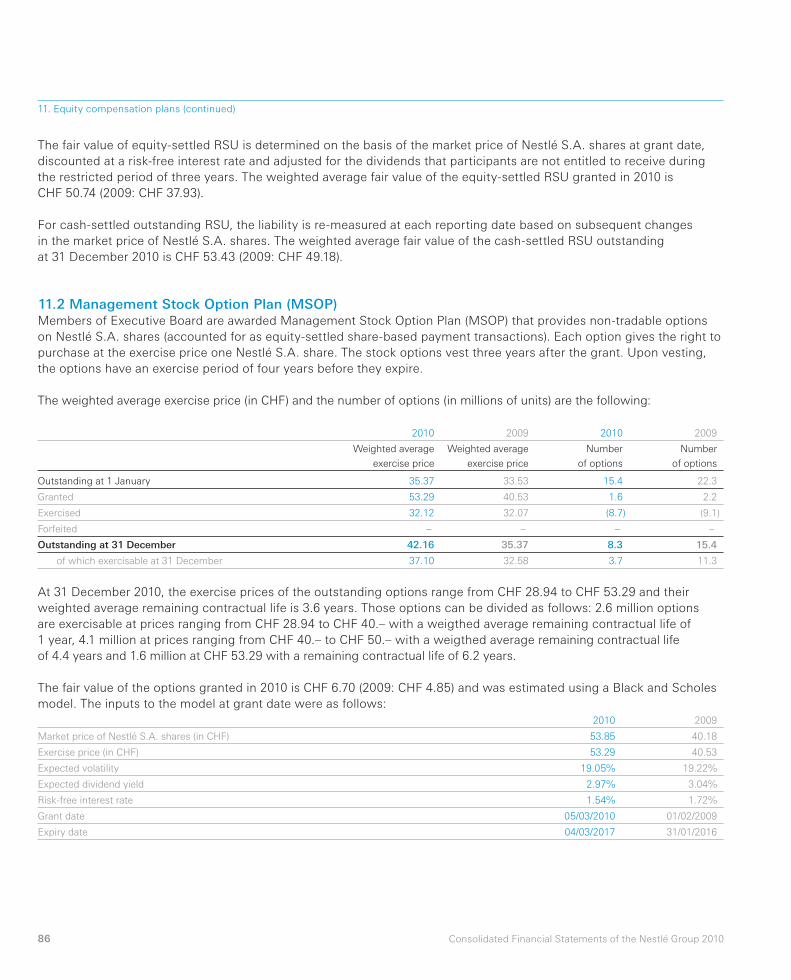
86 Consolidated Financial Statements of the Nestlé Group 2010
2010 2009 2010 2009
Weighted average
exercise price
Weighted average
exercise price
Number
of options
Number
of options
Outstanding at 1 January 35.37 33.53 15.4 22.3
Granted 53.29 40.53 1.6 2.2
Exercised 32.12 32.07 (8.7) (9.1)
Forfeited – – – –
Outstanding at 31 December 42.16 35.37 8.3 15.4
of which exercisable at 31 December 37.10 32.58 3.7 11.3
11.2 Management Stock Option Plan (MSOP)Members of Executive Board are awarded Management Stock Option Plan (MSOP) that provides non-tradable options
on Nestlé S.A. shares (accounted for as equity-settled share-based payment transactions). Each option gives the right to
purchase at the exercise price one Nestlé S.A. share. The stock options vest three years after the grant. Upon vesting,
the options have an exercise period of four years before they expire.
The weighted average exercise price (in CHF) and the number of options (in millions of units) are the following:
At 31 December 2010, the exercise prices of the outstanding options range from CHF 28.94 to CHF 53.29 and their
weighted average remaining contractual life is 3.6 years. Those options can be divided as follows: 2.6 million options
are exercisable at prices ranging from CHF 28.94 to CHF 40.– with a weigthed average remaining contractual life of
1 year, 4.1 million at prices ranging from CHF 40.– to CHF 50.– with a weigthed average remaining contractual life
of 4.4 years and 1.6 million at CHF 53.29 with a remaining contractual life of 6.2 years.
The fair value of the options granted in 2010 is CHF 6.70 (2009: CHF 4.85) and was estimated using a Black and Scholes
model. The inputs to the model at grant date were as follows:
2010 2009
Market price of Nestlé S.A. shares (in CHF) 53.85 40.18
Exercise price (in CHF) 53.29 40.53
Expected volatility 19.05% 19.22%
Expected dividend yield 2.97% 3.04%
Risk-free interest rate 1.54% 1.72%
Grant date 05/03/2010 01/02/2009
Expiry date 04/03/2017 31/01/2016
11. Equity compensation plans (continued)
The fair value of equity-settled RSU is determined on the basis of the market price of Nestlé S.A. shares at grant date,
discounted at a risk-free interest rate and adjusted for the dividends that participants are not entitled to receive during
the restricted period of three years. The weighted average fair value of the equity-settled RSU granted in 2010 is
CHF 50.74 (2009: CHF 37.93).
For cash-settled outstanding RSU, the liability is re-measured at each reporting date based on subsequent changes
in the market price of Nestlé S.A. shares. The weighted average fair value of the cash-settled RSU outstanding
at 31 December 2010 is CHF 53.43 (2009: CHF 49.18).
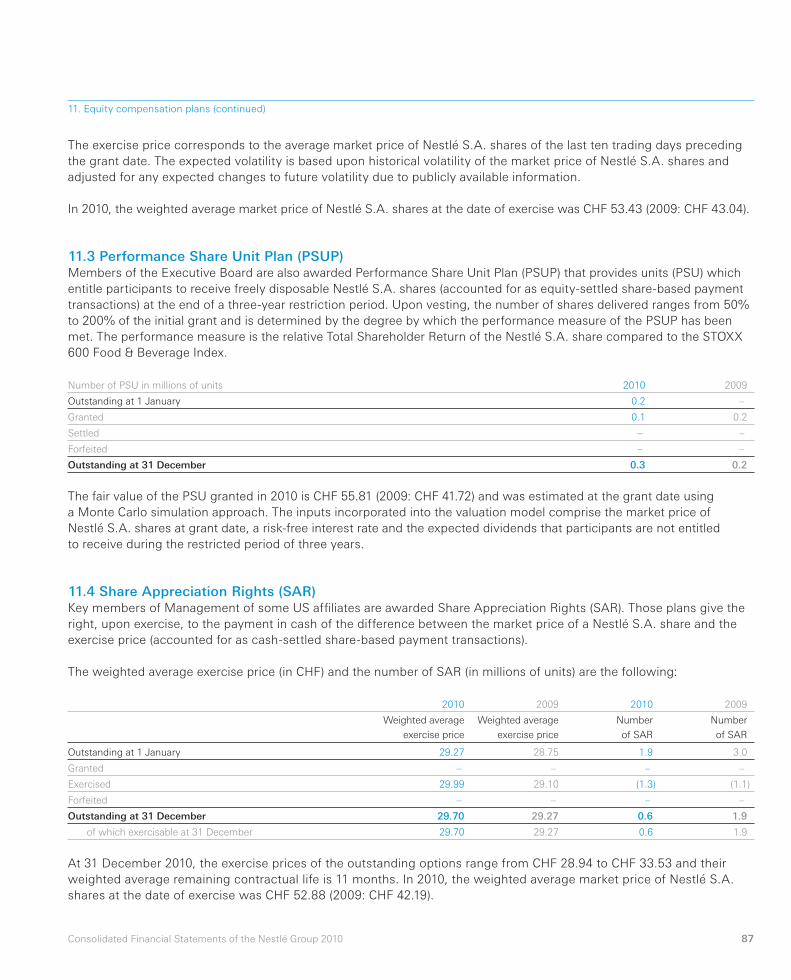
87Consolidated Financial Statements of the Nestlé Group 2010
11.3 Performance Share Unit Plan (PSUP)Members of the Executive Board are also awar d ed Performance Share Unit Plan (PSUP) that provides units (PSU) which
entitle participants to receive freely disposable Nestlé S.A. shares (accoun ted for as equity-settled share-based payment
transactions) at the end of a three-year restriction period. Upon vesting, the number of shares delivered ranges from 50%
to 200% of the initial grant and is determined by the degree by which the performance measure of the PSUP has been
met. The performance measure is the relative Total Shareholder Return of the Nestlé S.A. share compared to the STOXX
600 Food & Beverage Index.
11. Equity compensation plans (continued)
The exercise price corresponds to the average market price of Nestlé S.A. shares of the last ten trading days preceding
the grant date. The expected volatility is based upon historical volatility of the market price of Nestlé S.A. shares and
adjusted for any expected changes to future volatility due to publicly available information.
In 2010, the weighted average market price of Nestlé S.A. shares at the date of exercise was CHF 53.43 (2009: CHF 43.04).
The fair value of the PSU granted in 2010 is CHF 55.81 (2009: CHF 41.72) and was estimated at the grant date using
a Monte Carlo simulation approach. The inputs incorporated into the valuation model comprise the market price of
Nestlé S.A. shares at grant date, a risk-free interest rate and the expected dividends that participants are not entitled
to receive during the restricted period of three years.
11.4 Share Appreciation Rights (SAR)Key members of Management of some US affi liates are awarded Share Appreciation Rights (SAR). Those plans give the
right, upon exercise, to the payment in cash of the difference between the market price of a Nestlé S.A. share and the
exercise price (accounted for as cash-settled share-based payment transactions).
The weighted average exercise price (in CHF) and the number of SAR (in millions of units) are the following:
Number of PSU in millions of units 2010 2009
Outstanding at 1 January 0.2 –
Granted 0.1 0.2
Settled – –
Forfeited – –
Outstanding at 31 December 0.3 0.2
2010 2009 2010 2009
Weighted average
exercise price
Weighted average
exercise price
Number
of SAR
Number
of SAR
Outstanding at 1 January 29.27 28.75 1.9 3.0
Granted – – – –
Exercised 29.99 29.10 (1.3) (1.1)
Forfeited – – – –
Outstanding at 31 December 29.70 29.27 0.6 1.9
of which exercisable at 31 December 29.70 29.27 0.6 1.9
At 31 December 2010, the exercise prices of the outstanding options range from CHF 28.94 to CHF 33.53 and their
weighted average remaining contractual life is 11 months. In 2010, the weighted average market price of Nestlé S.A.
shares at the date of exercise was CHF 52.88 (2009: CHF 42.19).
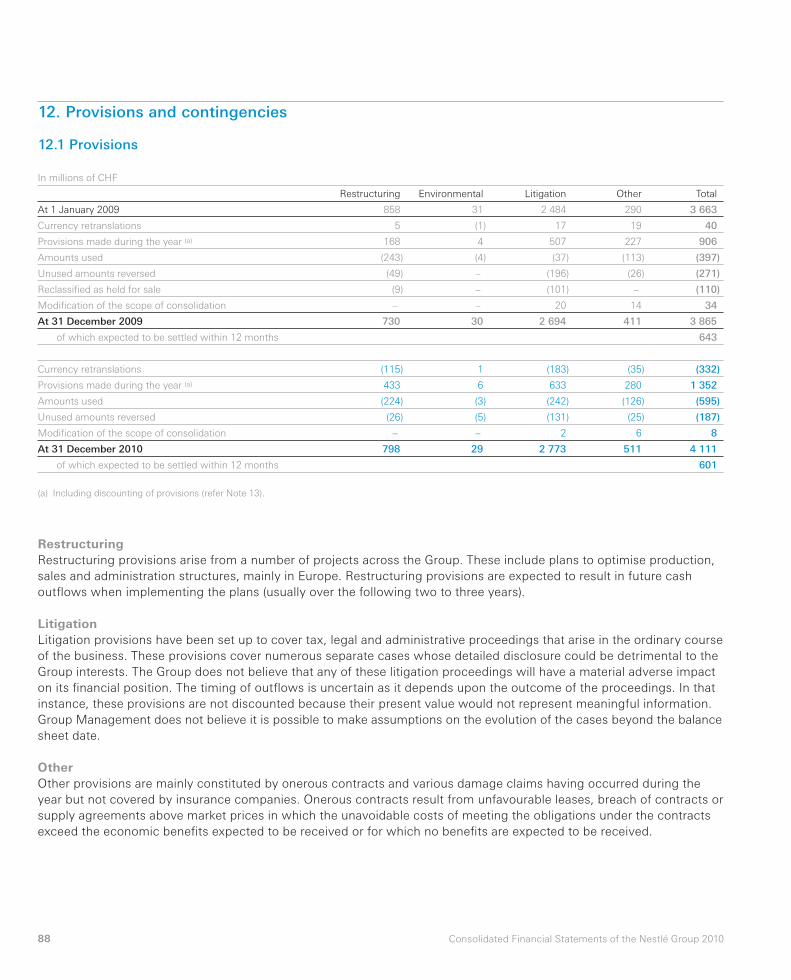
88 Consolidated Financial Statements of the Nestlé Group 2010
RestructuringRestructuring provisions arise from a number of projects across the Group. These include plans to optimise production,
sales and administration structures, mainly in Europe. Restructuring provisions are expected to result in future cash
outfl ows when implementing the plans (usually over the following two to three years).
Litigation Litigation provisions have been set up to cover tax, legal and administrative proceedings that arise in the ordinary course
of the business. These provisions cover numerous separate cases whose detailed disclosure could be detrimental to the
Group interests. The Group does not believe that any of these litigation proceedings will have a material adverse impact
on its fi nancial position. The timing of outfl ows is uncertain as it depends upon the outcome of the proceedings. In that
instance, these provisions are not discounted because their present value would not represent meaningful information.
Group Manage ment does not believe it is possible to make assumptions on the evolution of the cases beyond the balance
sheet date.
OtherOther provisions are mainly constituted by onerous contracts and various damage claims having occurred during the
year but not covered by insurance companies. Onerous contracts result from unfavourable leases, breach of contracts or
supply agreements above market prices in which the unavoidable costs of meeting the obligations under the contracts
exceed the economic benefi ts expected to be received or for which no bene fi ts are expected to be received.
12. Provisions and contingencies
12.1 Provisions
In millions of CHF
Restructuring Environmental Litigation Other Total
At 1 January 2009 858 31 2 484 290 3 663
Currency retranslations 5 (1) 17 19 40
Provisions made during the year (a) 168 4 507 227 906
Amounts used (243) (4) (37) (113) (397)
Unused amounts reversed (49) – (196) (26) (271)
Reclassifi ed as held for sale (9) – (101) – (110)
Modifi cation of the scope of consolidation – – 20 14 34
At 31 December 2009 730 30 2 694 411 3 865
of which expected to be settled within 12 months 643
Currency retranslations (115) 1 (183) (35) (332)
Provisions made during the year (a) 433 6 633 280 1 352
Amounts used (224) (3) (242) (126) (595)
Unused amounts reversed (26) (5) (131) (25) (187)
Modifi cation of the scope of consolidation – – 2 6 8
At 31 December 2010 798 29 2 773 511 4 111
of which expected to be settled within 12 months 601
(a) Including discounting of provisions (refer Note 13).
89Consolidated Financial Statements of the Nestlé Group 2010
12. Provisions and contingencies (continued)
12.2 ContingenciesThe Group is exposed to contingent liabilities amounting to a maximum potential payment of CHF 1121 million
(2009: CHF 1175 million) representing potential litigations of CHF 1110 million (2009: CHF 1138 million) and other items
of CHF 11 million (2009: CHF 37 million). Potential litigations relate mainly to labour, civil and tax litigations in Latin
America.
Contingent assets for litigation claims in favour of the Group amount to a maximum potential recoverable of
CHF 247 million (2009: CHF 234 million).
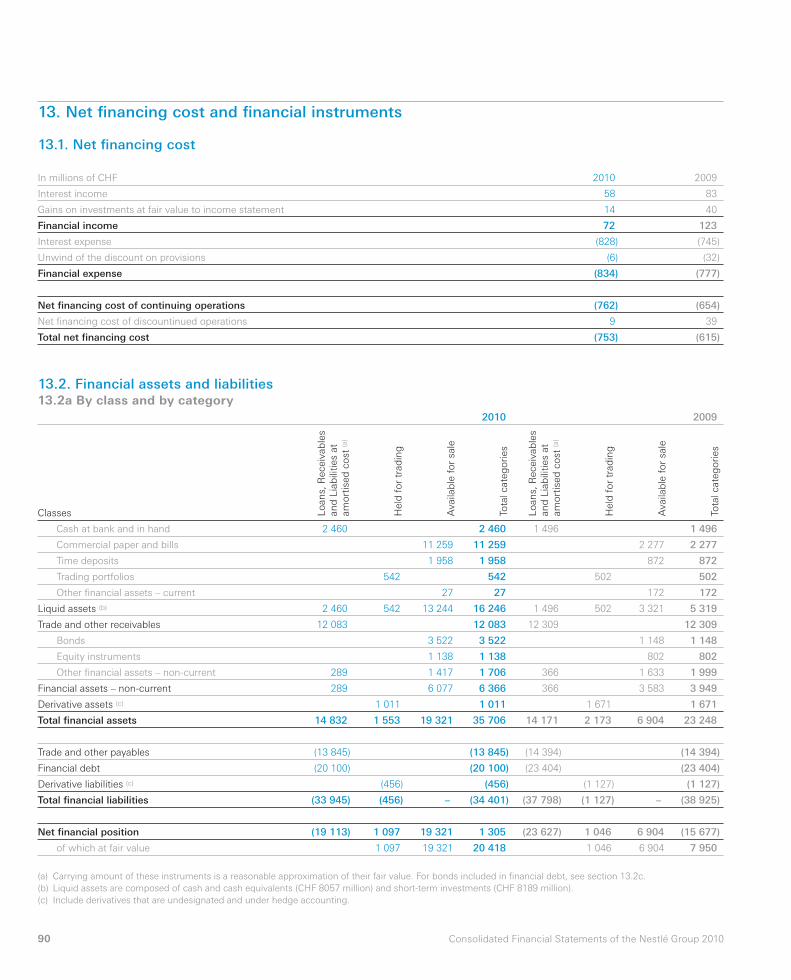
90 Consolidated Financial Statements of the Nestlé Group 2010
13. Net fi nancing cost and fi nancial instruments
13.1. Net fi nancing cost
In millions of CHF 2010 2009
Interest income 58 83
Gains on investments at fair value to income statement 14 40
Financial income 72 123
Interest expense (828) (745)
Unwind of the discount on provisions (6) (32)
Financial expense (834) (777)
Net fi nancing cost of continuing operations (762) (654)
Net fi nancing cost of discountinued operations 9 39
Total net fi nancing cost (753) (615)
13.2. Financial assets and liabilities13.2a By class and by category 2010 2009
Classes Lo
an
s, R
eceiv
ab
les
an
d L
iab
ilities
at
am
ort
ised
co
st (
a)
Held
fo
r tr
ad
ing
Availa
ble
fo
r sa
le
Tota
l cate
go
ries
Lo
an
s, R
eceiv
ab
les
an
d L
iab
ilities
at
am
ort
ised
co
st (
a)
Held
fo
r tr
ad
ing
Availa
ble
fo
r sa
le
Tota
l cate
go
ries
Cash at bank and in hand 2 460 2 460 1 496 1 496
Commercial paper and bills 11 259 11 259 2 277 2 277
Time deposits 1 958 1 958 872 872
Trading portfolios 542 542 502 502
Other fi nancial assets – current 27 27 172 172
Liquid assets (b) 2 460 542 13 244 16 246 1 496 502 3 321 5 319
Trade and other receivables 12 083 12 083 12 309 12 309
Bonds 3 522 3 522 1 148 1 148
Equity instruments 1 138 1 138 802 802
Other fi nancial assets – non-current 289 1 417 1 706 366 1 633 1 999
Financial assets – non-current 289 6 077 6 366 366 3 583 3 949
Derivative assets (c) 1 011 1 011 1 671 1 671
Total fi nancial assets 14 832 1 553 19 321 35 706 14 171 2 173 6 904 23 248
Trade and other payables (13 845) (13 845) (14 394) (14 394)
Financial debt (20 100) (20 100) (23 404) (23 404)
Derivative liabilities (c) (456) (456) (1 127) (1 127)
Total fi nancial liabilities (33 945) (456) – (34 401) (37 798) (1 127) – (38 925)
Net fi nancial position (19 113) 1 097 19 321 1 305 (23 627) 1 046 6 904 (15 677)
of which at fair value 1 097 19 321 20 418 1 046 6 904 7 950
(a) Carrying amount of these instruments is a reasonable approximation of their fair value. For bonds included in fi nancial debt, see section 13.2c.
(b) Liquid assets are composed of cash and cash equivalents (CHF 8057 million) and short-term investments (CHF 8189 million).
(c) Include derivatives that are undesignated and under hedge accounting.
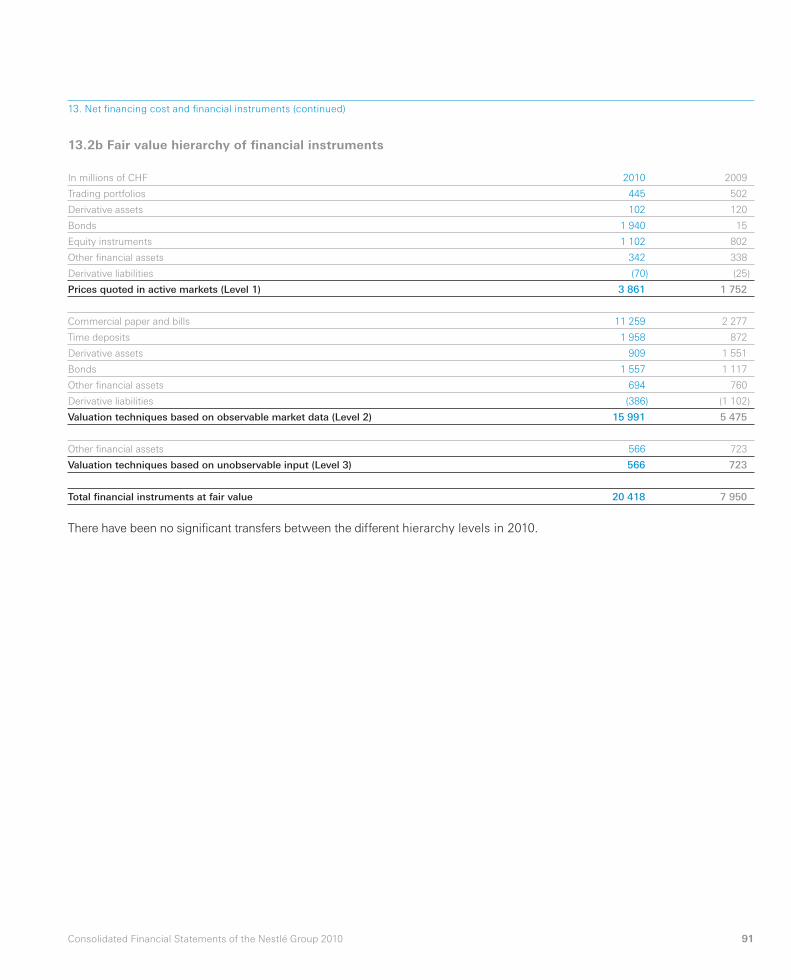
91Consolidated Financial Statements of the Nestlé Group 2010
There have been no signifi cant transfers between the different hierarchy levels in 2010.
13.2b Fair value hierarchy of fi nancial instruments
In millions of CHF 2010 2009
Trading portfolios 445 502
Derivative assets 102 120
Bonds 1 940 15
Equity instruments 1 102 802
Other fi nancial assets 342 338
Derivative liabilities (70) (25)
Prices quoted in active markets (Level 1) 3 861 1 752
Commercial paper and bills 11 259 2 277
Time deposits 1 958 872
Derivative assets 909 1 551
Bonds 1 557 1 117
Other fi nancial assets 694 760
Derivative liabilities (386) (1 102)
Valuation techniques based on observable market data (Level 2) 15 991 5 475
Other fi nancial assets 566 723
Valuation techniques based on unobservable input (Level 3) 566 723
Total fi nancial instruments at fair value 20 418 7 950
13. Net fi nancing cost and fi nancial instruments (continued)
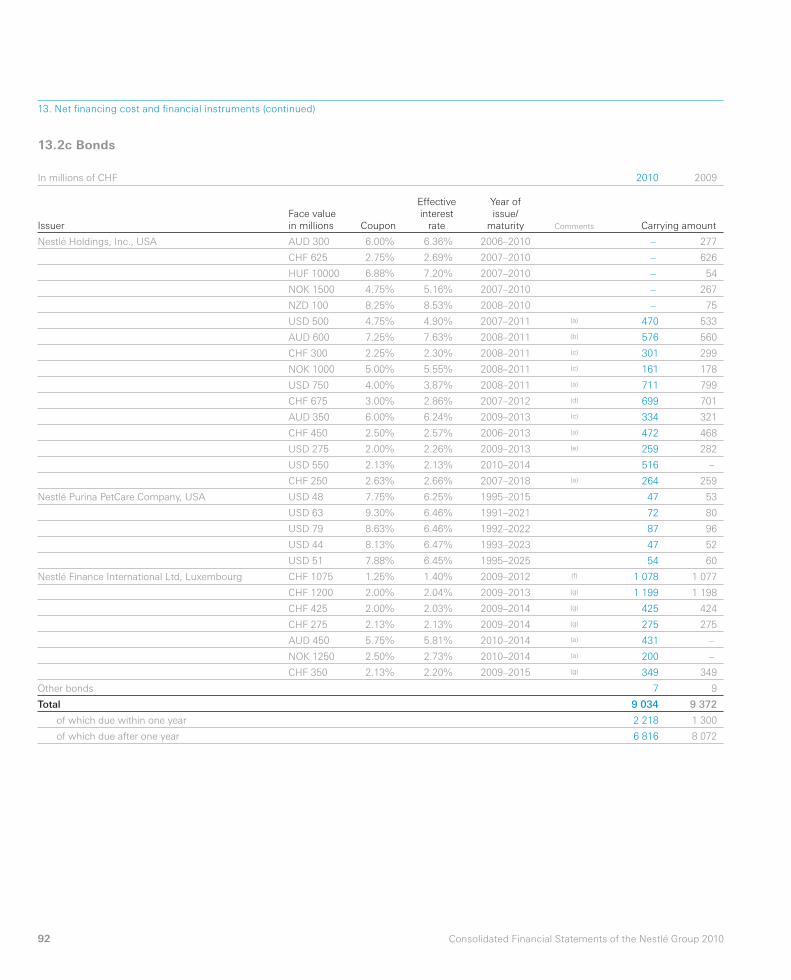
92 Consolidated Financial Statements of the Nestlé Group 2010
13.2c Bonds
In millions of CHF 2010 2009
Issuer
Face value
in millions Coupon
Effective
interest
rate
Year of
issue/
maturity Comments Carrying amount
Nestlé Holdings, Inc., USA AUD 300 6.00% 6.36% 2006–2010 – 277
CHF 625 2.75% 2.69% 2007–2010 – 626
HUF 10000 6.88% 7.20% 2007–2010 – 54
NOK 1500 4.75% 5.16% 2007–2010 – 267
NZD 100 8.25% 8.53% 2008–2010 – 75
USD 500 4.75% 4.90% 2007–2011 (a) 470 533
AUD 600 7.25% 7.63% 2008–2011 (b) 576 560
CHF 300 2.25% 2.30% 2008–2011 (c) 301 299
NOK 1000 5.00% 5.55% 2008–2011 (c) 161 178
USD 750 4.00% 3.87% 2008–2011 (a) 711 799
CHF 675 3.00% 2.86% 2007–2012 (d) 699 701
AUD 350 6.00% 6.24% 2009–2013 (c) 334 321
CHF 450 2.50% 2.57% 2006–2013 (a) 472 468
USD 275 2.00% 2.26% 2009–2013 (e) 259 282
USD 550 2.13% 2.13% 2010–2014 516 –
CHF 250 2.63% 2.66% 2007–2018 (a) 264 259
Nestlé Purina PetCare Company, USA USD 48 7.75% 6.25% 1995–2015 47 53
USD 63 9.30% 6.46% 1991–2021 72 80
USD 79 8.63% 6.46% 1992–2022 87 96
USD 44 8.13% 6.47% 1993–2023 47 52
USD 51 7.88% 6.45% 1995–2025 54 60
Nestlé Finance International Ltd, Luxembourg CHF 1075 1.25% 1.40% 2009–2012 (f) 1 078 1 077
CHF 1200 2.00% 2.04% 2009–2013 (g) 1 199 1 198
CHF 425 2.00% 2.03% 2009–2014 (g) 425 424
CHF 275 2.13% 2.13% 2009–2014 (g) 275 275
AUD 450 5.75% 5.81% 2010–2014 (a) 431 –
NOK 1250 2.50% 2.73% 2010–2014 (a) 200 –
CHF 350 2.13% 2.20% 2009–2015 (g) 349 349
Other bonds 7 9
Total 9 034 9 372
of which due within one year 2 218 1 300
of which due after one year 6 816 8 072
13. Net fi nancing cost and fi nancial instruments (continued)
93Consolidated Financial Statements of the Nestlé Group 2010
(a) Subject to an interest rate and/or currency swap that creates a liability at fl oating rates in the currency of the issuer.
(b) This bond is composed of:
– AUD 300 million issued in 2008 subject to an interest rate and currency swap that creates a liability at fi xed rates in the currency of the issuer; and
– AUD 300 million issued in 2008 subject to an interest rate and currency swap that creates a liability at fl oating rates in the currency of the issuer.
(c) Subject to an interest rate and currency swap that creates a liability at fi xed rates in the currency of the issuer.
(d) This bond is composed of:
– CHF 200 million issued in 2007 subject to an interest rate and currency swap that creates a liability at fl oating rates in the currency of the issuer;
– CHF 150 million issued in 2008 subject to an interest rate and currency swap that creates a liability at fi xed rates in the currency of the issuer; and
– CHF 325 million issued in 2008 subject to an interest rate and currency swap that creates a liability at fl oating rates in the currency of the issuer.
(e) This bond is composed of:
– USD 150 million issued in 2009; and
– USD 125 million issued in 2009 subject to an interest rate swap that creates a liability at fl oating rates in the currency of the issuer.
(f) This bond is composed of:
– CHF 525 million issued in 2009 subject to interest rate and currency swaps that create a liability at fl oating rates in the currency of the issuer; and
– CHF 550 million issued in 2009 subject to currency swaps that hedge the CHF face value exposure.
(g) Subject to currency swaps that hedge the CHF face value exposure.
The fair value of bonds amounts to CHF 9358 million (2009: CHF 9720 million). This value includes accrued interest of
CHF 153 million (2009: CHF 188 million).
Most of the bonds are hedged by currency and/or interest derivatives. The fair value of these derivatives is shown under
derivative assets for CHF 832 million (2009: CHF 603 million) and under derivative liabilities for CHF 11 million
(2009: CHF 28 million).
13. Net fi nancing cost and fi nancial instruments (continued)
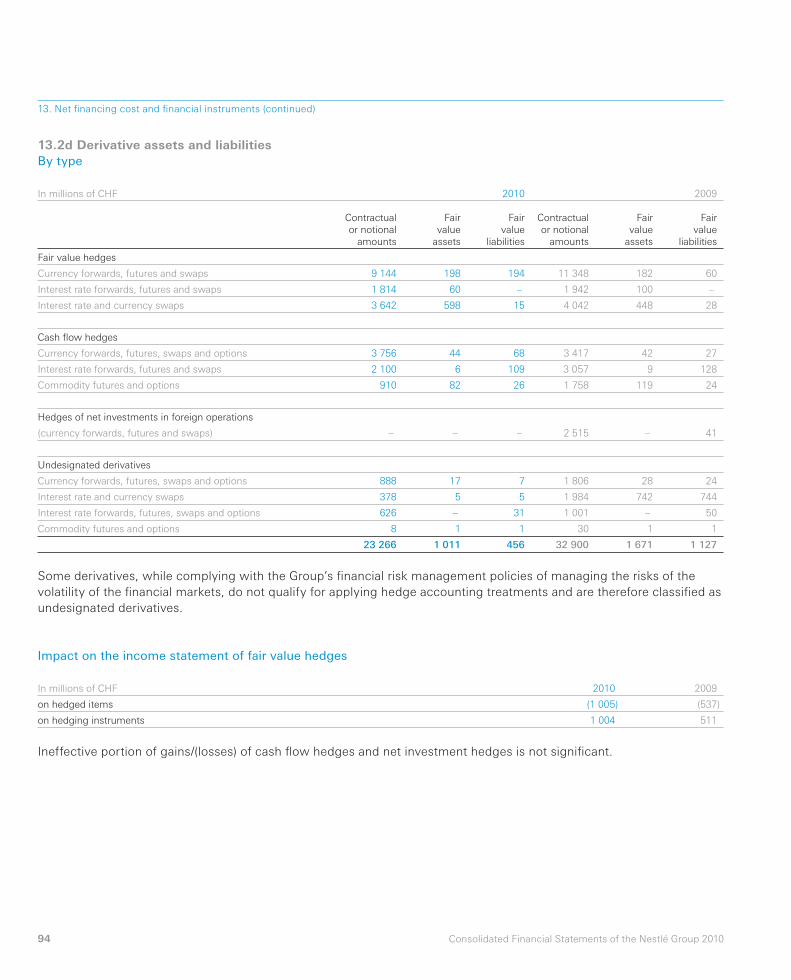
94 Consolidated Financial Statements of the Nestlé Group 2010
13.2d Derivative assets and liabilitiesBy type
In millions of CHF 2010 2009
Contractual
or notional
amounts
Fair
value
assets
Fair
value
liabilities
Contractual
or notional
amounts
Fair
value
assets
Fair
value
liabilities
Fair value hedges
Currency forwards, futures and swaps 9 144 198 194 11 348 182 60
Interest rate forwards, futures and swaps 1 814 60 – 1 942 100 –
Interest rate and currency swaps 3 642 598 15 4 042 448 28
Cash fl ow hedges
Currency forwards, futures, swaps and options 3 756 44 68 3 417 42 27
Interest rate forwards, futures and swaps 2 100 6 109 3 057 9 128
Commodity futures and options 910 82 26 1 758 119 24
Hedges of net investments in foreign operations
(currency forwards, futures and swaps) – – – 2 515 – 41
Undesignated derivatives
Currency forwards, futures, swaps and options 888 17 7 1 806 28 24
Interest rate and currency swaps 378 5 5 1 984 742 744
Interest rate forwards, futures, swaps and options 626 – 31 1 001 – 50
Commodity futures and options 8 1 1 30 1 1
23 266 1 011 456 32 900 1 671 1 127
Some derivatives, while complying with the Group’s fi nancial risk management policies of managing the risks of the
volatility of the fi nancial markets, do not qualify for applying hedge accounting treatments and are therefore classifi ed as
undesignated derivatives.
Impact on the income statement of fair value hedges
In millions of CHF 2010 2009
on hedged items (1 005) (537)
on hedging instruments 1 004 511
Ineffective portion of gains/(losses) of cash fl ow hedges and net investment hedges is not signifi cant.
13. Net fi nancing cost and fi nancial instruments (continued)
95Consolidated Financial Statements of the Nestlé Group 2010
13.3 Financial risksIn the course of its business, the Group is exposed to a number of fi nancial risks: credit risk, liquidity risk, market risk
(including foreign currency risk and interest rate risk), commodity price risk and other risks (including equity price risk
and settlement risk). This note presents the Group’s objectives, policies and processes for managing its fi nancial risk and
capital.
Financial risk management is an integral part of the way the Group is managed. The Board of Directors establishes the
Group’s fi nancial policies and the Chief Executive Offi cer establishes objectives in line with these policies. An Asset and
Liability Management Committee (ALMC), under the supervision of the Chief Financial Offi cer, is then responsible for
setting fi nancial strategies, which are executed by the Centre Treasury, the Regional Treasury Centres and, in speci fi c
local circumstances, by the affi liated companies. The activities of the Centre Treasury and of the various Regio nal
Treasury Centres are supervised by an independent Middle Offi ce, which verifi es the compliance of the strategies
proposed and/or operations executed within the approved guidelines and limits set by the ALMC. Approved Treasury
Management Guidelines defi ne and classify risks as well as determine, by category of transaction, specifi c approval,
limit and monitoring procedures. In accordance with the aforementioned policies, the Group only enters into derivative
transactions relating to assets, liabilities or anticipated future transactions.
13.3a Credit riskCredit risk managementCredit risk arises because a counterparty may fail to perform its obligations. The Group is exposed to credit risk on
fi nancial instruments such as liquid assets, derivative assets and trade receivable portfolios.
The Group sets credit limits based on a counterparty value computed with a probability of default. The methodology
used to set the list of counterparty limits includes Enterprise Value (EV), counterparty Credit Ratings (CR) and Credit
Default Swaps (CDS). Evolution of counterparties is monitored daily, taking into consideration EV, CR and CDS evolution.
As a result of this daily review, changes on investment limits and risk allocation are carried out. The Group avoids the
concentration of credit risk on its liquid assets by spreading them over several institutions and sectors.
Trade receivables are subject to credit limits, control and approval procedures in all the affi liated companies. Due to its
large geographic base and number of customers, the Group is not exposed to material concentrations of credit risk on
its trade receivables (refer to Note 6). Never theless global commercial counterparties are constantly monitored following
the same methodology used for fi nancial counterparties.
The maximum exposure to credit risk resulting from fi nancial activities, without considering netting agreements and
without taking into account any collateral held or other credit enhancements, is equal to the carrying amount of the
Group’s fi nancial assets.
13. Net fi nancing cost and fi nancial instruments (continued)
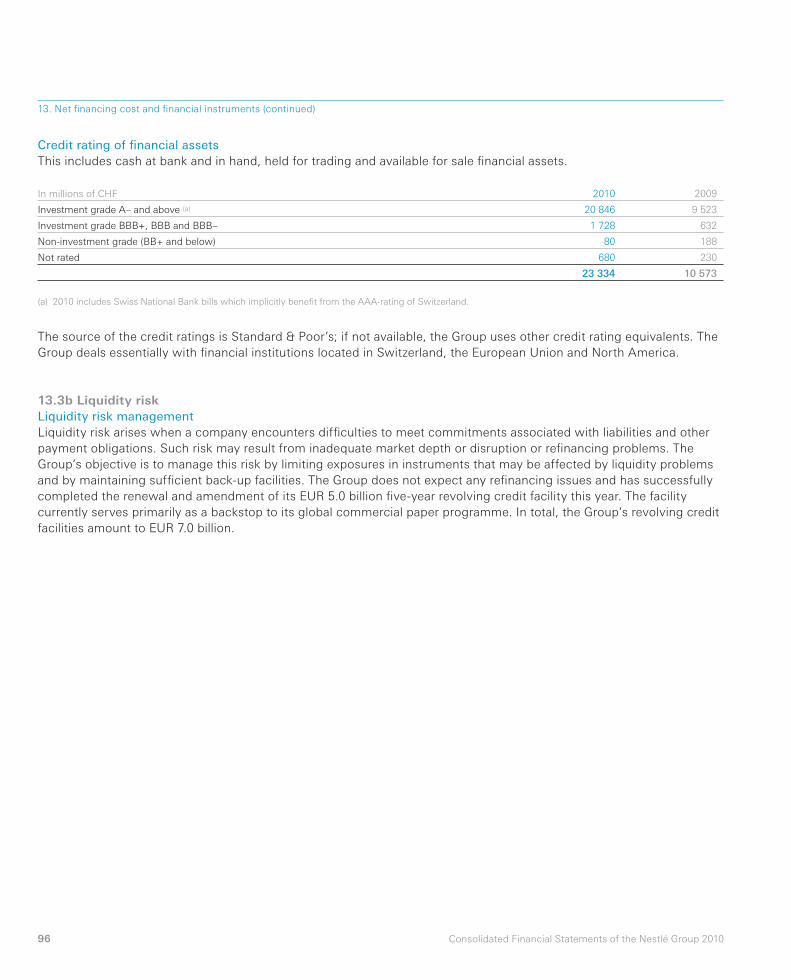
96 Consolidated Financial Statements of the Nestlé Group 2010
The source of the credit ratings is Standard & Poor’s; if not available, the Group uses other credit rating equivalents. The
Group deals essentially with fi nancial institutions located in Switzerland, the European Union and North America.
13.3b Liquidity riskLiquidity risk managementLiquidity risk arises when a company encounters diffi culties to meet commitments associated with liabilities and other
payment obligations. Such risk may result from inadequate market depth or disruption or refi nancing problems. The
Group’s objective is to manage this risk by limiting exposures in instruments that may be affected by liquidity problems
and by maintaining suffi cient back-up facilities. The Group does not expect any refi nancing issues and has successfully
completed the renewal and amendment of its EUR 5.0 billion fi ve-year revolving credit facility this year. The facility
currently serves primarily as a backstop to its global commercial paper programme. In total, the Group’s revolving credit
facilities amount to EUR 7.0 billion.
Credit rating of fi nancial assetsThis includes cash at bank and in hand, held for trading and available for sale fi nancial assets.
In millions of CHF 2010 2009
Investment grade A– and above (a) 20 846 9 523
Investment grade BBB+, BBB and BBB– 1 728 632
Non-investment grade (BB+ and below) 80 188
Not rated 680 230
23 334 10 573
(a) 2010 includes Swiss National Bank bills which implicitly benefi t from the AAA-rating of Switzerland.
13. Net fi nancing cost and fi nancial instruments (continued)
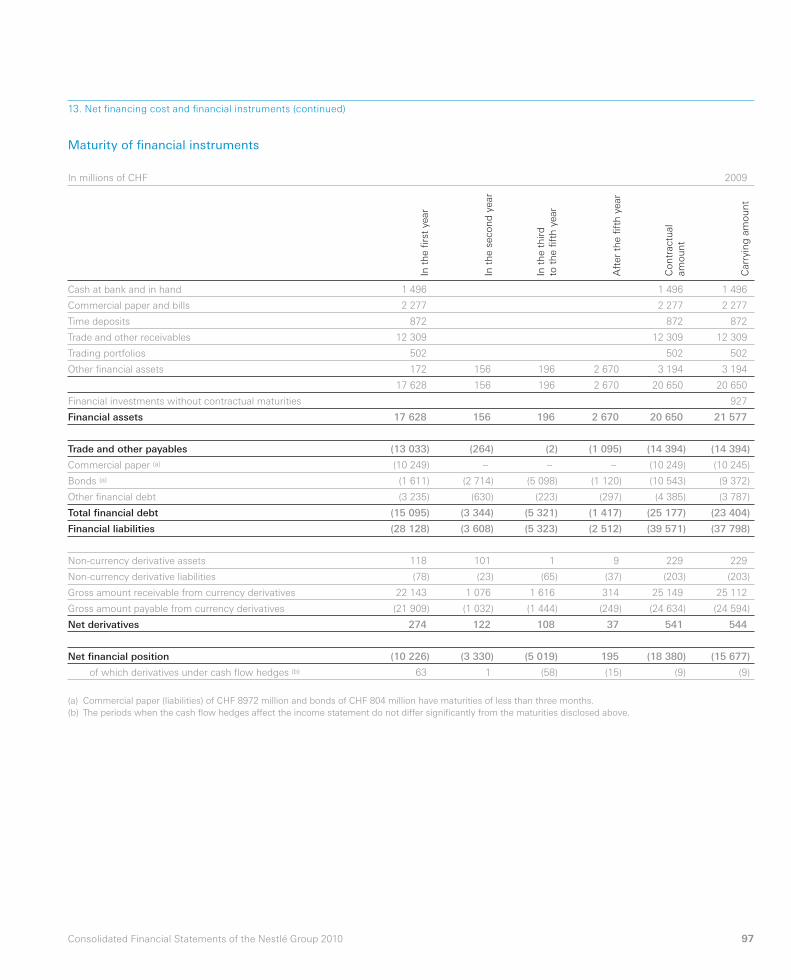
97Consolidated Financial Statements of the Nestlé Group 2010
Maturity of fi nancial instruments
In millions of CHF 2009
In t
he fi r
st y
ear
In t
he s
eco
nd
year
In t
he t
hir
d
to t
he fi f
th y
ear
Aft
er
the fi f
th y
ear
Co
ntr
actu
al
am
ou
nt
Carr
yin
g a
mo
un
t
Cash at bank and in hand 1 496 1 496 1 496
Commercial paper and bills 2 277 2 277 2 277
Time deposits 872 872 872
Trade and other receivables 12 309 12 309 12 309
Trading portfolios 502 502 502
Other fi nancial assets 172 156 196 2 670 3 194 3 194
17 628 156 196 2 670 20 650 20 650
Financial investments without contractual maturities 927
Financial assets 17 628 156 196 2 670 20 650 21 577
Trade and other payables (13 033) (264) (2) (1 095) (14 394) (14 394)
Commercial paper (a) (10 249) – – – (10 249) (10 245)
Bonds (a) (1 611) (2 714) (5 098) (1 120) (10 543) (9 372)
Other fi nancial debt (3 235) (630) (223) (297) (4 385) (3 787)
Total fi nancial debt (15 095) (3 344) (5 321) (1 417) (25 177) (23 404)
Financial liabilities (28 128) (3 608) (5 323) (2 512) (39 571) (37 798)
Non-currency derivative assets 118 101 1 9 229 229
Non-currency derivative liabilities (78) (23) (65) (37) (203) (203)
Gross amount receivable from currency derivatives 22 143 1 076 1 616 314 25 149 25 112
Gross amount payable from currency derivatives (21 909) (1 032) (1 444) (249) (24 634) (24 594)
Net derivatives 274 122 108 37 541 544
Net fi nancial position (10 226) (3 330) (5 019) 195 (18 380) (15 677)
of which derivatives under cash fl ow hedges (b) 63 1 (58) (15) (9) (9)
(a) Commercial paper (liabilities) of CHF 8972 million and bonds of CHF 804 million have maturities of less than three months.
(b) The periods when the cash fl ow hedges affect the income statement do not differ signifi cantly from the maturities disclosed above.
13. Net fi nancing cost and fi nancial instruments (continued)
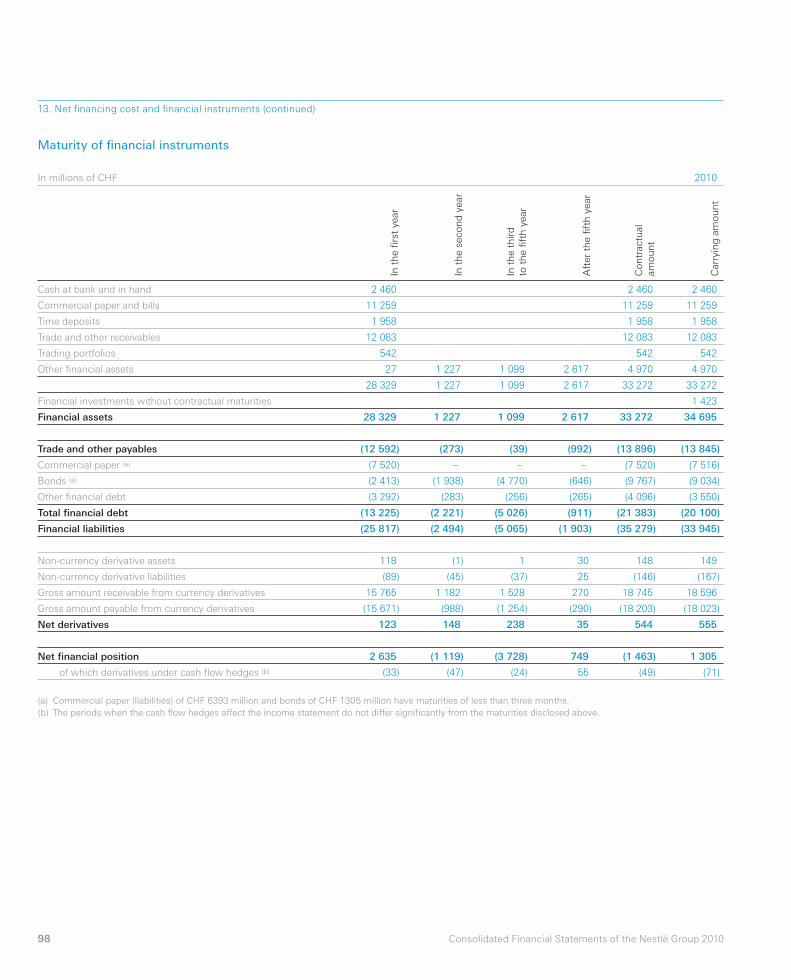
98 Consolidated Financial Statements of the Nestlé Group 2010
Maturity of fi nancial instruments
In millions of CHF 2010
In t
he fi r
st y
ear
In t
he s
eco
nd
year
In t
he t
hir
d
to t
he fi f
th y
ear
Aft
er
the fi f
th y
ear
Co
ntr
actu
al
am
ou
nt
Carr
yin
g a
mo
un
t
Cash at bank and in hand 2 460 2 460 2 460
Commercial paper and bills 11 259 11 259 11 259
Time deposits 1 958 1 958 1 958
Trade and other receivables 12 083 12 083 12 083
Trading portfolios 542 542 542
Other fi nancial assets 27 1 227 1 099 2 617 4 970 4 970
28 329 1 227 1 099 2 617 33 272 33 272
Financial investments without contractual maturities 1 423
Financial assets 28 329 1 227 1 099 2 617 33 272 34 695
Trade and other payables (12 592) (273) (39) (992) (13 896) (13 845)
Commercial paper (a) (7 520) – – – (7 520) (7 516)
Bonds (a) (2 413) (1 938) (4 770) (646) (9 767) (9 034)
Other fi nancial debt (3 292) (283) (256) (265) (4 096) (3 550)
Total fi nancial debt (13 225) (2 221) (5 026) (911) (21 383) (20 100)
Financial liabilities (25 817) (2 494) (5 065) (1 903) (35 279) (33 945)
Non-currency derivative assets 118 (1) 1 30 148 149
Non-currency derivative liabilities (89) (45) (37) 25 (146) (167)
Gross amount receivable from currency derivatives 15 765 1 182 1 528 270 18 745 18 596
Gross amount payable from currency derivatives (15 671) (988) (1 254) (290) (18 203) (18 023)
Net derivatives 123 148 238 35 544 555
Net fi nancial position 2 635 (1 119) (3 728) 749 (1 463) 1 305
of which derivatives under cash fl ow hedges (b) (33) (47) (24) 55 (49) (71)
(a) Commercial paper (liabilities) of CHF 6393 million and bonds of CHF 1305 million have maturities of less than three months.
(b) The periods when the cash fl ow hedges affect the income statement do not differ signifi cantly from the maturities disclosed above.
13. Net fi nancing cost and fi nancial instruments (continued)
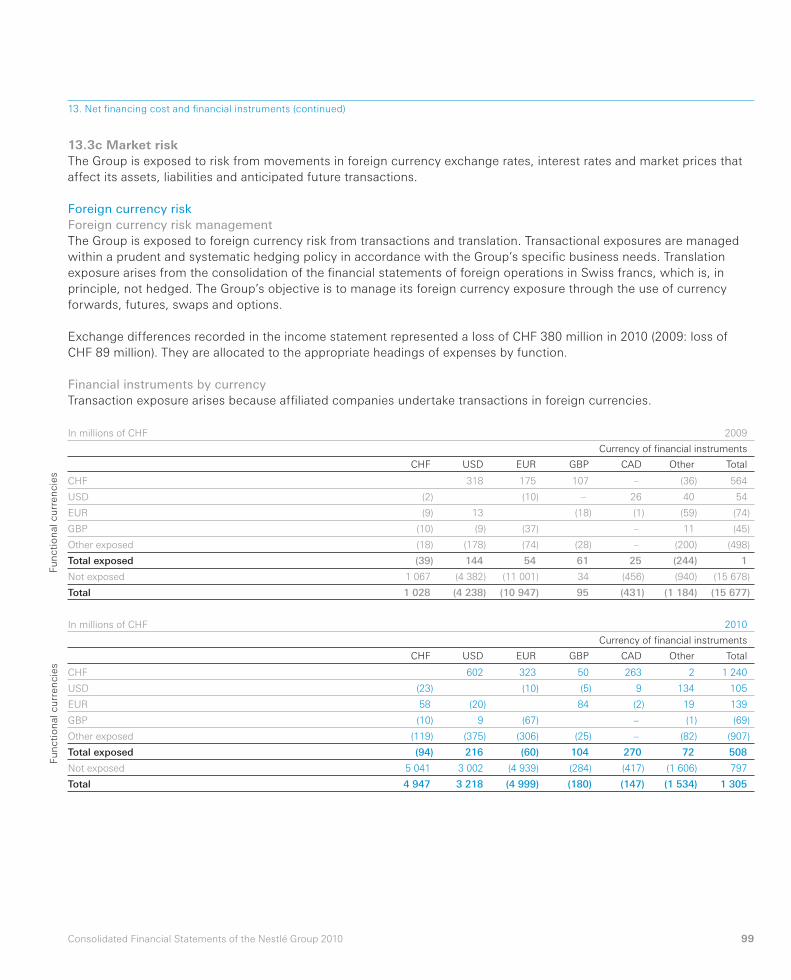
99Consolidated Financial Statements of the Nestlé Group 2010
13.3c Market riskThe Group is exposed to risk from movements in foreign currency exchange rates, interest rates and market prices that
affect its assets, liabilities and anticipated future transactions.
Foreign currency riskForeign currency risk managementThe Group is exposed to foreign currency risk from transactions and translation. Transac tional exposures are managed
within a prudent and systematic hedging policy in accordance with the Group’s specifi c business needs. Translation
exposure arises from the consolidation of the fi nancial statements of foreign operations in Swiss francs, which is, in
principle, not hedged. The Group’s objective is to manage its foreign currency exposure through the use of currency
forwards, futures, swaps and options.
Exchange differences recorded in the income statement represented a loss of CHF 380 million in 2010 (2009: loss of
CHF 89 million). They are allocated to the appropriate headings of expenses by function.
Financial instruments by currencyTransaction exposure arises because affi liated companies undertake transactions in foreign currencies.
In millions of CHF 2009
Currency of fi nancial instruments
CHF USD EUR GBP CAD Other Total
CHF 318 175 107 – (36) 564
USD (2) (10) – 26 40 54
EUR (9) 13 (18) (1) (59) (74)
GBP (10) (9) (37) – 11 (45)
Other exposed (18) (178) (74) (28) – (200) (498)
Total exposed (39) 144 54 61 25 (244) 1
Not exposed 1 067 (4 382) (11 001) 34 (456) (940) (15 678)
Total 1 028 (4 238) (10 947) 95 (431) (1 184) (15 677)
13. Net fi nancing cost and fi nancial instruments (continued)
In millions of CHF 2010
Currency of fi nancial instruments
CHF USD EUR GBP CAD Other Total
CHF 602 323 50 263 2 1 240
USD (23) (10) (5) 9 134 105
EUR 58 (20) 84 (2) 19 139
GBP (10) 9 (67) – (1) (69)
Other exposed (119) (375) (306) (25) – (82) (907)
Total exposed (94) 216 (60) 104 270 72 508
Not exposed 5 041 3 002 (4 939) (284) (417) (1 606) 797
Total 4 947 3 218 (4 999) (180) (147) (1 534) 1 305
Fu
ncti
on
al cu
rren
cie
sF
un
cti
on
al cu
rren
cie
s
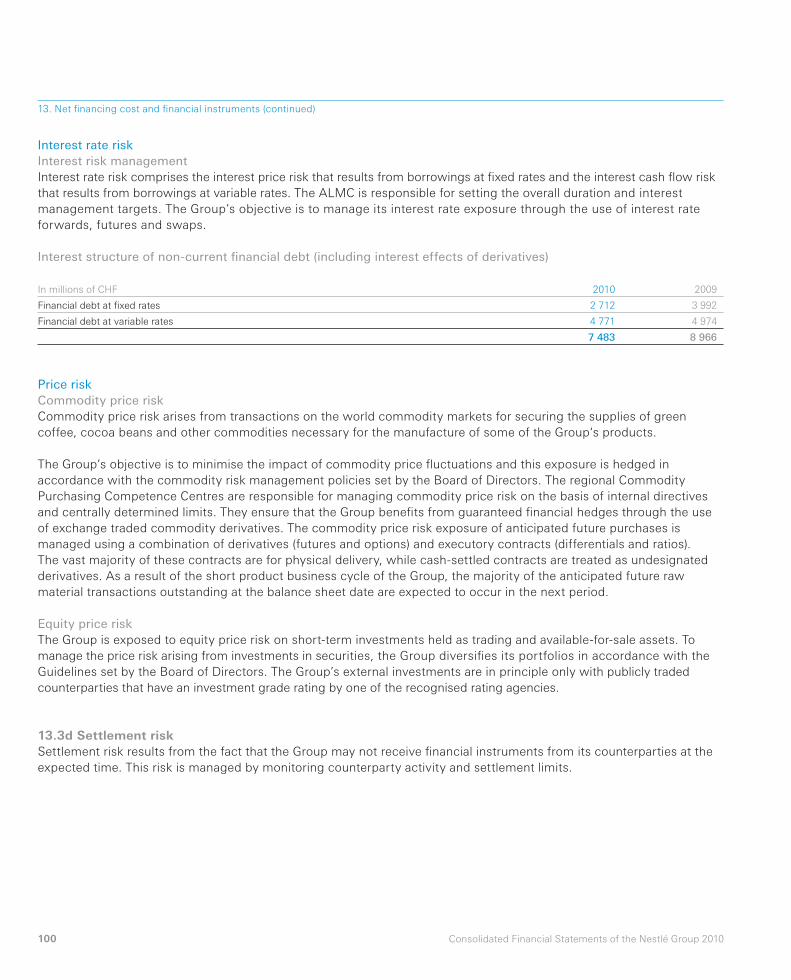
100 Consolidated Financial Statements of the Nestlé Group 2010
Price riskCommodity price riskCommodity price risk arises from transactions on the world commodity markets for securing the supplies of green
coffee, cocoa beans and other commodities necessary for the manufacture of some of the Group‘s products.
The Group’s objective is to minimise the impact of commo d ity price fl uctuations and this exposure is hedged in
accordance with the commodity risk management policies set by the Board of Directors. The regional Commodity
Purchasing Competence Centres are responsible for managing commodity price risk on the basis of internal directives
and centrally determined limits. They ensure that the Group benefi ts from guaranteed fi nan cial hedges through the use
of exchange traded commodity derivatives. The commodity price risk exposure of anticipated future purchases is
managed using a combination of derivatives (futures and options) and executory contracts (differentials and ratios).
The vast majority of these contracts are for phy sical delivery, while cash-settled contracts are treated as undesignated
derivatives. As a result of the short product business cycle of the Group, the majority of the anticipated future raw
material transactions outstanding at the balance sheet date are expected to occur in the next period.
Equity price riskThe Group is exposed to equity price risk on short-term investments held as trading and available-for-sale assets. To
manage the price risk arising from investments in secur ities, the Group diversifi es its portfolios in accordance with the
Guidelines set by the Board of Directors. The Group’s external investments are in principle only with publicly traded
counterparties that have an investment grade rating by one of the recognised rating agencies.
13.3d Settlement riskSettlement risk results from the fact that the Group may not receive fi nancial instruments from its counterparties at the
expected time. This risk is managed by monitoring counterparty activity and settlement limits.
Interest rate riskInterest risk managementInterest rate risk comprises the interest price risk that results from borrowings at fi xed rates and the interest cash fl ow risk
that results from borrowings at variable rates. The ALMC is responsible for setting the overall duration and interest
management targets. The Group’s objective is to manage its interest rate exposure through the use of interest rate
forwards, futures and swaps.
Interest structure of non-current fi nancial debt (including interest effects of derivatives)
13. Net fi nancing cost and fi nancial instruments (continued)
In millions of CHF 2010 2009
Financial debt at fi xed rates 2 712 3 992
Financial debt at variable rates 4 771 4 974
7 483 8 966
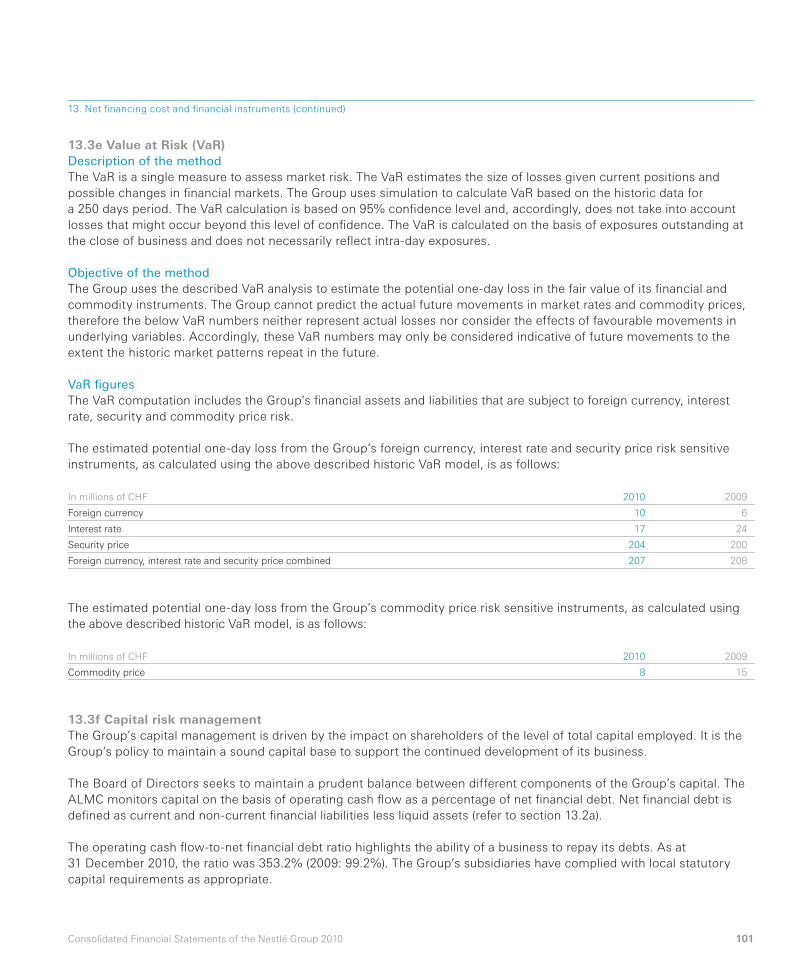
101Consolidated Financial Statements of the Nestlé Group 2010
13.3e Value at Risk (VaR)Description of the methodThe VaR is a single measure to assess market risk. The VaR estimates the size of losses given current positions and
possible changes in fi nancial markets. The Group uses simulation to calculate VaR based on the historic data for
a 250 days period. The VaR calculation is based on 95% confi dence level and, accordingly, does not take into account
losses that might occur beyond this level of confi dence. The VaR is calculated on the basis of exposures outstanding at
the close of business and does not necessarily refl ect intra-day exposures.
Objective of the methodThe Group uses the described VaR analysis to estimate the potential one-day loss in the fair value of its fi nancial and
commodity instruments. The Group cannot predict the actual future movements in market rates and commodity prices,
therefore the below VaR numbers neither represent actual losses nor consider the effects of favourable movements in
underlying variables. Accordingly, these VaR numbers may only be considered indicative of future movements to the
extent the historic market patterns repeat in the future.
VaR fi guresThe VaR computation includes the Group’s fi nancial assets and liabilities that are subject to foreign currency, interest
rate, security and commodity price risk.
The estimated potential one-day loss from the Group’s foreign currency, interest rate and security price risk sensitive
instruments, as calculated using the above described historic VaR model, is as follows:
In millions of CHF 2010 2009
Foreign currency 10 6
Interest rate 17 24
Security price 204 200
Foreign currency, interest rate and security price combined 207 208
13. Net fi nancing cost and fi nancial instruments (continued)
The estimated potential one-day loss from the Group’s commodity price risk sensitive instruments, as calculated using
the above described historic VaR model, is as follows:
In millions of CHF 2010 2009
Commodity price 8 15
13.3f Capital risk managementThe Group’s capital management is driven by the impact on shareholders of the level of total capital employed. It is the
Group’s policy to maintain a sound capital base to support the continued development of its business.
The Board of Directors seeks to maintain a prudent balance between different components of the Group’s capital. The
ALMC monitors capital on the basis of operating cash fl ow as a percentage of net fi nancial debt. Net fi nancial debt is
defi ned as current and non-current fi nancial liabilities less liquid assets (refer to section 13.2a).
The operating cash fl ow-to-net fi nancial debt ratio highlights the ability of a business to repay its debts. As at
31 December 2010, the ratio was 353.2% (2009: 99.2%). The Group’s subsidiaries have complied with local statu tory
capital requirements as appropriate.
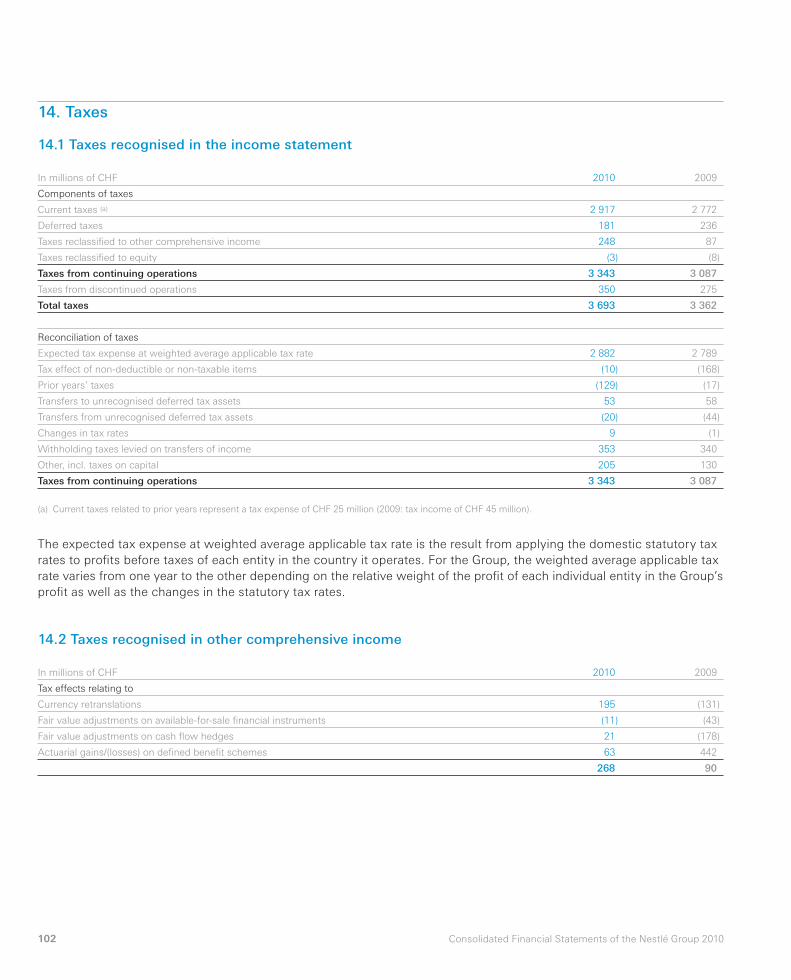
102 Consolidated Financial Statements of the Nestlé Group 2010
14. Taxes
14.1 Taxes recognised in the income statement
In millions of CHF 2010 2009
Components of taxes
Current taxes (a) 2 917 2 772
Deferred taxes 181 236
Taxes reclassifi ed to other comprehensive income 248 87
Taxes reclassifi ed to equity (3) (8)
Taxes from continuing operations 3 343 3 087
Taxes from discontinued operations 350 275
Total taxes 3 693 3 362
Reconciliation of taxes
Expected tax expense at weighted average applicable tax rate 2 882 2 789
Tax effect of non-deductible or non-taxable items (10) (168)
Prior years’ taxes (129) (17)
Transfers to unrecognised deferred tax assets 53 58
Transfers from unrecognised deferred tax assets (20) (44)
Changes in tax rates 9 (1)
Withholding taxes levied on transfers of income 353 340
Other, incl. taxes on capital 205 130
Taxes from continuing operations 3 343 3 087
(a) Current taxes related to prior years represent a tax expense of CHF 25 million (2009: tax income of CHF 45 million).
The expected tax expense at weighted average applicable tax rate is the result from applying the domestic statutory tax
rates to profi ts before taxes of each entity in the country it operates. For the Group, the weighted average applicable tax
rate varies from one year to the other depending on the relative weight of the profi t of each individual entity in the Group’s
profi t as well as the changes in the statutory tax rates.
14.2 Taxes recognised in other comprehensive income
In millions of CHF 2010 2009
Tax effects relating to
Currency retranslations 195 (131)
Fair value adjustments on available-for-sale fi nancial instruments (11) (43)
Fair value adjustments on cash fl ow hedges 21 (178)
Actuarial gains/(losses) on defi ned benefi t schemes 63 442
268 90
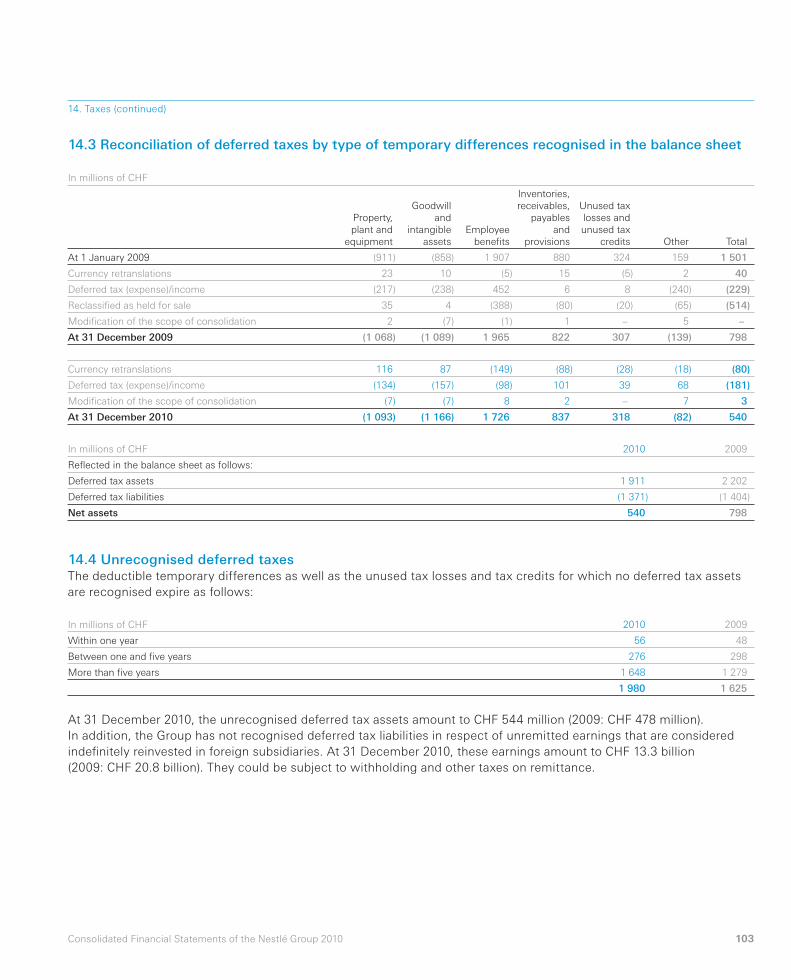
103Consolidated Financial Statements of the Nestlé Group 2010
14. Taxes (continued)
14.3 Reconciliation of deferred taxes by type of temporary differences recognised in the balance sheet
In millions of CHF
Property,
plant and
equipment
Goodwill
and
intangible
assets
Employee
benefi ts
Inventories,
receivables,
payables
and
provisions
Unused tax
losses and
unused tax
credits Other Total
At 1 January 2009 (911) (858) 1 907 880 324 159 1 501
Currency retranslations 23 10 (5) 15 (5) 2 40
Deferred tax (expense)/income (217) (238) 452 6 8 (240) (229)
Reclassifi ed as held for sale 35 4 (388) (80) (20) (65) (514)
Modifi cation of the scope of consolidation 2 (7) (1) 1 – 5 –
At 31 December 2009 (1 068) (1 089) 1 965 822 307 (139) 798
Currency retranslations 116 87 (149) (88) (28) (18) (80)
Deferred tax (expense)/income (134) (157) (98) 101 39 68 (181)
Modifi cation of the scope of consolidation (7) (7) 8 2 – 7 3
At 31 December 2010 (1 093) (1 166) 1 726 837 318 (82) 540
In millions of CHF 2010 2009
Refl ected in the balance sheet as follows:
Deferred tax assets 1 911 2 202
Deferred tax liabilities (1 371) (1 404)
Net assets 540 798
14.4 Unrecognised deferred taxesThe deductible temporary differences as well as the unused tax losses and tax credits for which no deferred tax assets
are recognised expire as follows:
In millions of CHF 2010 2009
Within one year 56 48
Between one and fi ve years 276 298
More than fi ve years 1 648 1 279
1 980 1 625
At 31 December 2010, the unrecognised deferred tax assets amount to CHF 544 million (2009: CHF 478 million).
In addition, the Group has not recognised deferred tax liabilities in respect of unremitted earnings that are consi dered
indefi nitely reinvested in foreign subsidiaries. At 31 December 2010, these earnings amount to CHF 13.3 bil lion
(2009: CHF 20.8 billion). They could be subject to withholding and other taxes on remittance.
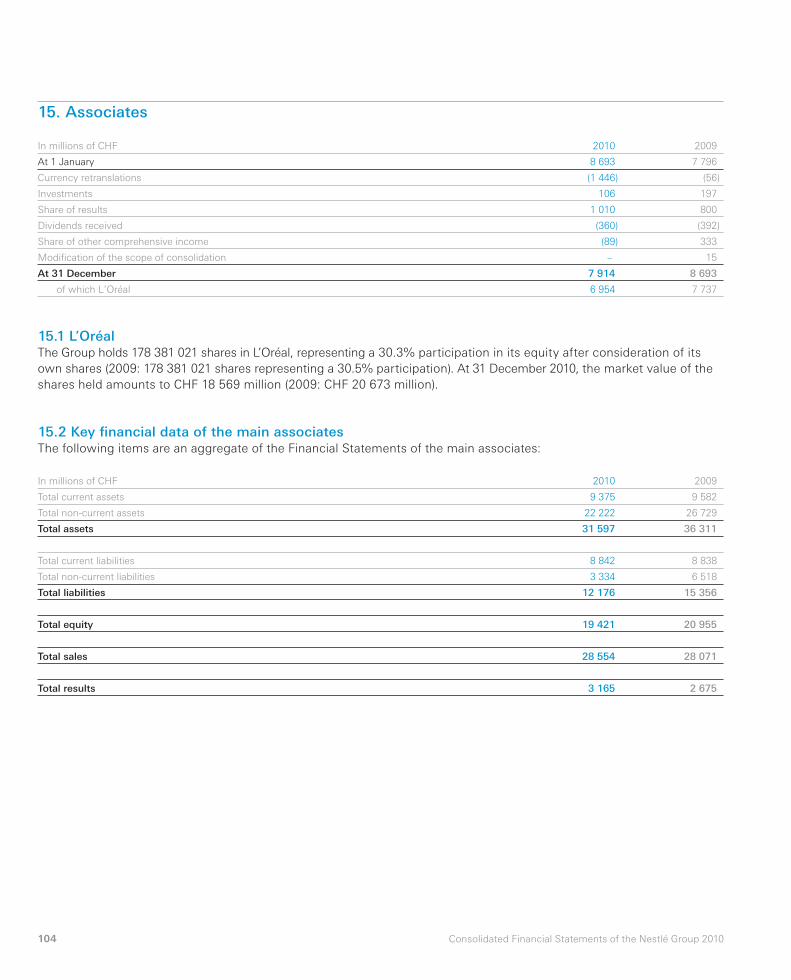
104 Consolidated Financial Statements of the Nestlé Group 2010
15. Associates
In millions of CHF 2010 2009
At 1 January 8 693 7 796
Currency retranslations (1 446) (56)
Investments 106 197
Share of results 1 010 800
Dividends received (360) (392)
Share of other comprehensive income (89) 333
Modifi cation of the scope of consolidation – 15
At 31 December 7 914 8 693
of which L’Oréal 6 954 7 737
15.1 L’OréalThe Group holds 178 381 021 shares in L’Oréal, representing a 30.3% participation in its equity after consideration of its
own shares (2009: 178 381 021 shares representing a 30.5% participation). At 31 December 2010, the market value of the
shares held amounts to CHF 18 569 million (2009: CHF 20 673 million).
15.2 Key fi nancial data of the main associatesThe following items are an aggregate of the Financial Statements of the main associates:
In millions of CHF 2010 2009
Total current assets 9 375 9 582
Total non-current assets 22 222 26 729
Total assets 31 597 36 311
Total current liabilities 8 842 8 838
Total non-current liabilities 3 334 6 518
Total liabilities 12 176 15 356
Total equity 19 421 20 955
Total sales 28 554 28 071
Total results 3 165 2 675
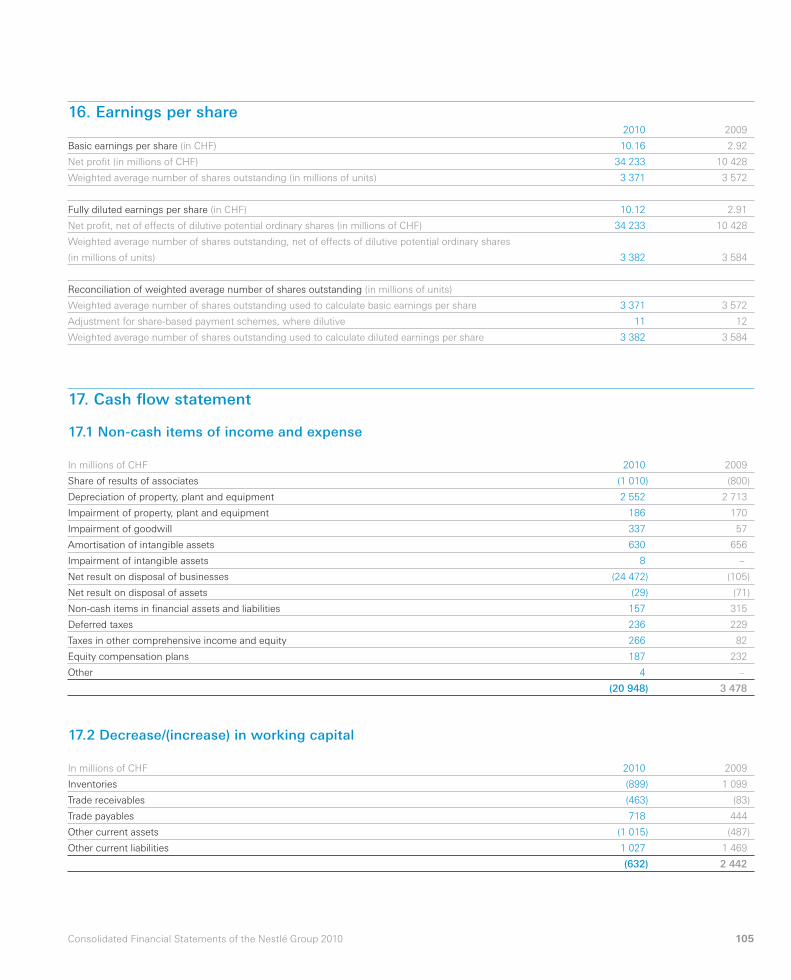
105Consolidated Financial Statements of the Nestlé Group 2010
16. Earnings per share 2010 2009
Basic earnings per share (in CHF) 10.16 2.92
Net profi t (in millions of CHF) 34 233 10 428
Weighted average number of shares outstanding (in millions of units) 3 371 3 572
Fully diluted earnings per share (in CHF) 10.12 2.91
Net profi t, net of effects of dilutive potential ordinary shares (in millions of CHF) 34 233 10 428
Weighted average number of shares outstanding, net of effects of dilutive potential ordinary shares
(in millions of units) 3 382 3 584
Reconciliation of weighted average number of shares outstanding (in millions of units)
Weighted average number of shares outstanding used to calculate basic earnings per share 3 371 3 572
Adjustment for share-based payment schemes, where dilutive 11 12
Weighted average number of shares outstanding used to calculate diluted earnings per share 3 382 3 584
17. Cash fl ow statement
17.1 Non-cash items of income and expense
In millions of CHF 2010 2009
Share of results of associates (1 010) (800)
Depreciation of property, plant and equipment 2 552 2 713
Impairment of property, plant and equipment 186 170
Impairment of goodwill 337 57
Amortisation of intangible assets 630 656
Impairment of intangible assets 8 –
Net result on disposal of businesses (24 472) (105)
Net result on disposal of assets (29) (71)
Non-cash items in fi nancial assets and liabilities 157 315
Deferred taxes 236 229
Taxes in other comprehensive income and equity 266 82
Equity compensation plans 187 232
Other 4 –
(20 948) 3 478
17.2 Decrease/(increase) in working capital
In millions of CHF 2010 2009
Inventories (899) 1 099
Trade receivables (463) (83)
Trade payables 718 444
Other current assets (1 015) (487)
Other current liabilities 1 027 1 469
(632) 2 442
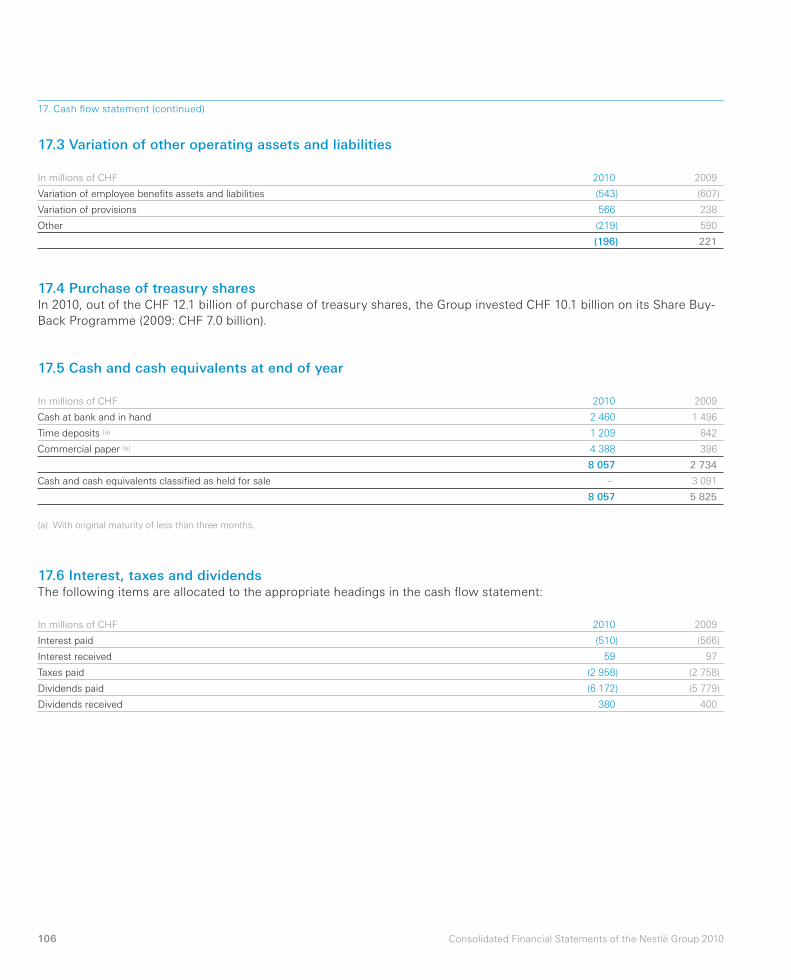
106 Consolidated Financial Statements of the Nestlé Group 2010
17. Cash fl ow statement (continued)
17.3 Variation of other operating assets and liabilities
In millions of CHF 2010 2009
Variation of employee benefi ts assets and liabilities (543) (607)
Variation of provisions 566 238
Other (219) 590
(196) 221
17.5 Cash and cash equivalents at end of year
In millions of CHF 2010 2009
Cash at bank and in hand 2 460 1 496
Time deposits (a) 1 209 842
Commercial paper (a) 4 388 396
8 057 2 734
Cash and cash equivalents classifi ed as held for sale – 3 091
8 057 5 825
(a) With original maturity of less than three months.
17.4 Purchase of treasury sharesIn 2010, out of the CHF 12.1 billion of purchase of treasury shares, the Group invested CHF 10.1 billion on its Share Buy-
Back Programme (2009: CHF 7.0 billion).
17.6 Interest, taxes and dividendsThe following items are allocated to the appropriate headings in the cash fl ow statement:
In millions of CHF 2010 2009
Interest paid (510) (566)
Interest received 59 97
Taxes paid (2 958) (2 758)
Dividends paid (6 172) (5 779)
Dividends received 380 400
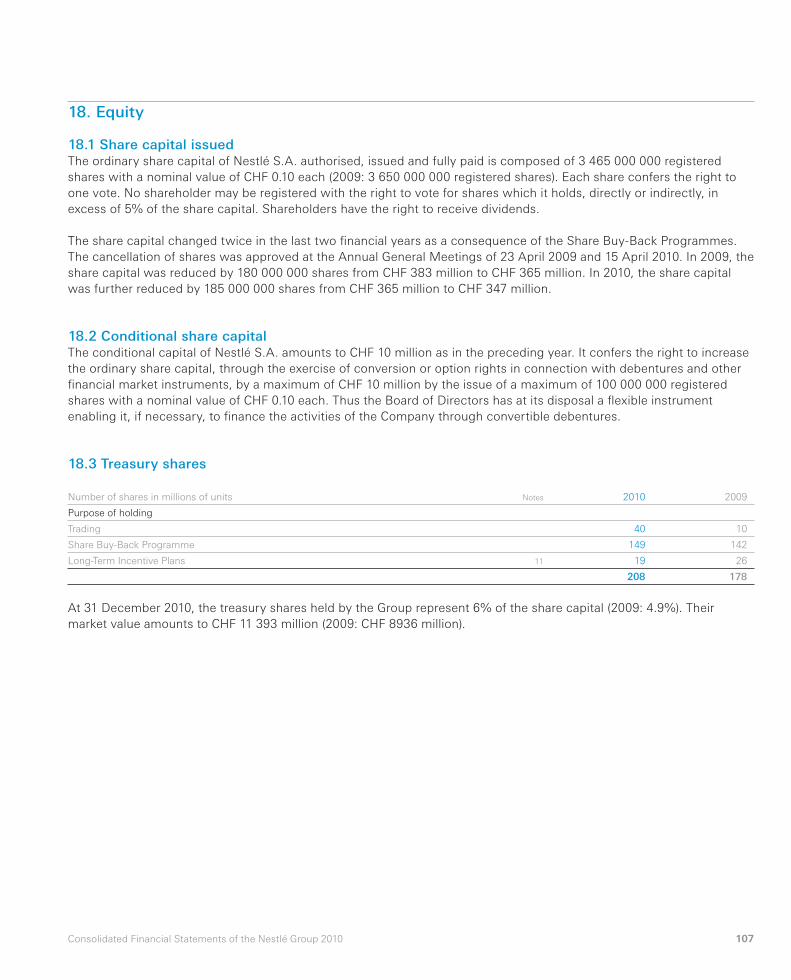
107Consolidated Financial Statements of the Nestlé Group 2010
18. Equity
18.1 Share capital issuedThe ordinary share capital of Nestlé S.A. authorised, issued and fully paid is composed of 3 465 000 000 registered
shares with a nominal value of CHF 0.10 each (2009: 3 650 000 000 registered shares). Each share confers the right to
one vote. No shareholder may be registered with the right to vote for shares which it holds, directly or indirectly, in
excess of 5% of the share capital. Shareholders have the right to receive dividends.
The share capital changed twice in the last two fi nancial years as a consequence of the Share Buy-Back Programmes.
The cancellation of shares was approved at the Annual General Meetings of 23 April 2009 and 15 April 2010. In 2009, the
share capital was reduced by 180 000 000 shares from CHF 383 million to CHF 365 mil lion. In 2010, the share capital
was further reduced by 185 000 000 shares from CHF 365 million to CHF 347 million.
18.2 Conditional share capitalThe conditional capital of Nestlé S.A. amounts to CHF 10 mil lion as in the preceding year. It confers the right to increase
the ordinary share capital, through the exercise of conversion or option rights in connection with debentures and other
fi nancial market instruments, by a maximum of CHF 10 mil lion by the issue of a maximum of 100 000 000 registered
shares with a nominal value of CHF 0.10 each. Thus the Board of Directors has at its disposal a fl exible instrument
enabling it, if necessary, to fi nance the activities of the Company through convertible debentures.
18.3 Treasury shares
Number of shares in millions of units Notes 2010 2009
Purpose of holding
Trading 40 10
Share Buy-Back Programme 149 142
Long-Term Incentive Plans 11 19 26
208 178
At 31 December 2010, the treasury shares held by the Group represent 6% of the share capital (2009: 4.9%). Their
market value amounts to CHF 11 393 million (2009: CHF 8936 million).
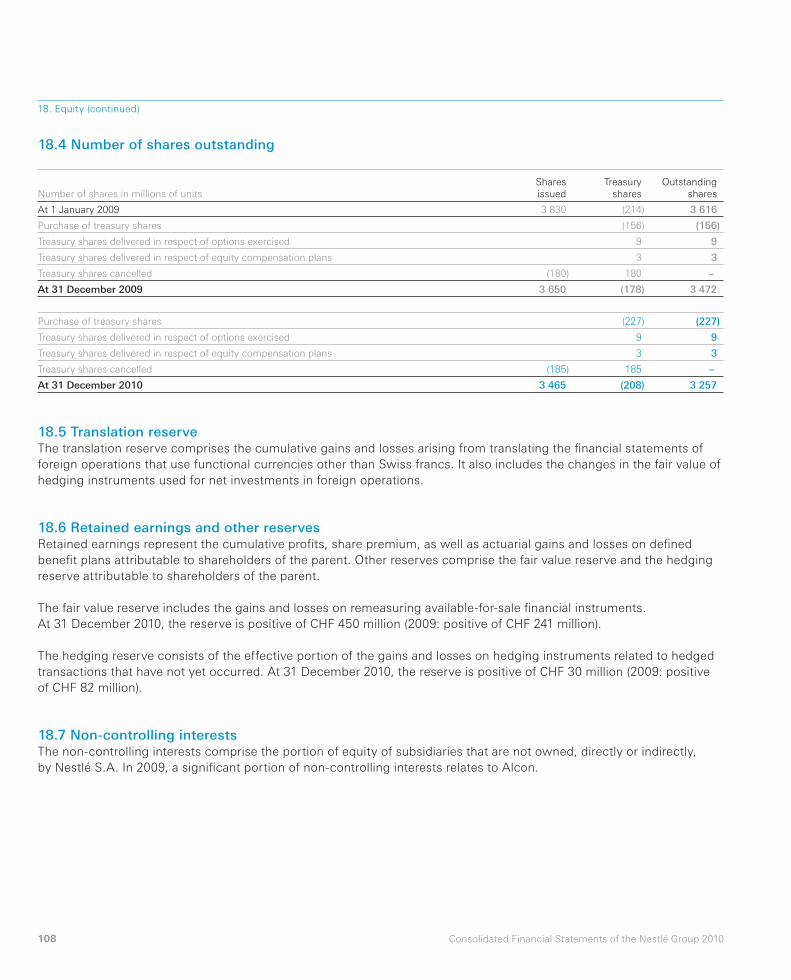
108 Consolidated Financial Statements of the Nestlé Group 2010
18.5 Translation reserveThe translation reserve comprises the cumulative gains and losses arising from translating the fi nancial statements of
foreign operations that use functional currencies other than Swiss francs. It also includes the changes in the fair value of
hedging instruments used for net investments in foreign operations.
18.6 Retained earnings and other reservesRetained earnings represent the cumulative profi ts, share premium, as well as actuarial gains and losses on defi ned
benefi t plans attributable to shareholders of the parent. Other reserves comprise the fair value reserve and the hedging
reserve attributable to shareholders of the parent.
The fair value reserve includes the gains and losses on remeasuring available-for-sale fi nancial instruments.
At 31 December 2010, the reserve is positive of CHF 450 million (2009: positive of CHF 241 million).
The hedging reserve consists of the effective portion of the gains and losses on hedging instruments related to hedged
transactions that have not yet occurred. At 31 December 2010, the reserve is positive of CHF 30 million (2009: positive
of CHF 82 million).
18.7 Non-controlling interestsThe non-controlling interests comprise the portion of equity of subsidiaries that are not owned, directly or indirectly,
by Nestlé S.A. In 2009, a signifi cant portion of non-controlling interests relates to Alcon.
18. Equity (continued)
18.4 Number of shares outstanding
Purchase of treasury shares (227) (227)
Treasury shares delivered in respect of options exercised 9 9
Treasury shares delivered in respect of equity compensation plans 3 3
Treasury shares cancelled (185) 185 –
At 31 December 2010 3 465 (208) 3 257
Number of shares in millions of units
Shares
issued
Treasury
shares
Outstanding
shares
At 1 January 2009 3 830 (214) 3 616
Purchase of treasury shares (156) (156)
Treasury shares delivered in respect of options exercised 9 9
Treasury shares delivered in respect of equity compensation plans 3 3
Treasury shares cancelled (180) 180 –
At 31 December 2009 3 650 (178) 3 472
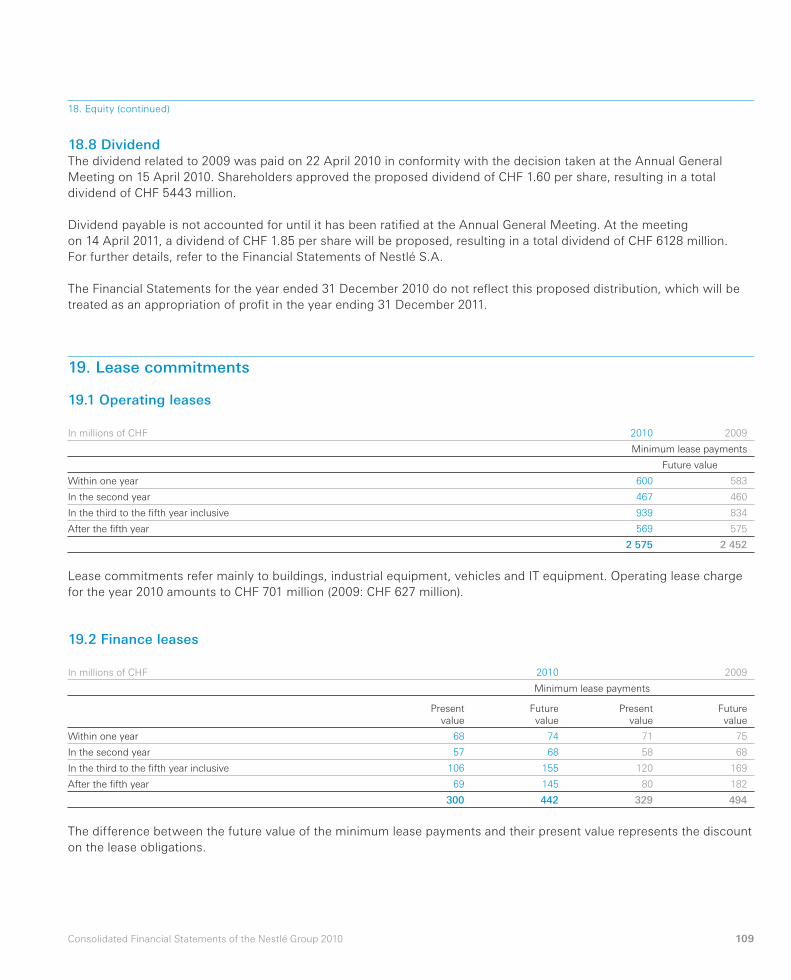
109Consolidated Financial Statements of the Nestlé Group 2010
18.8 DividendThe dividend related to 2009 was paid on 22 April 2010 in conformity with the decision taken at the Annual General
Meeting on 15 April 2010. Shareholders approved the proposed dividend of CHF 1.60 per share, resulting in a total
dividend of CHF 5443 million.
Dividend payable is not accounted for until it has been ratifi ed at the Annual General Meeting. At the meeting
on 14 April 2011, a dividend of CHF 1.85 per share will be proposed, resulting in a total dividend of CHF 6128 million.
For further details, refer to the Financial Statements of Nestlé S.A.
The Financial Statements for the year ended 31 Decem ber 2010 do not refl ect this proposed distribution, which will be
treated as an appropriation of profi t in the year ending 31 December 2011.
18. Equity (continued)
19. Lease commitments
19.1 Operating leases
In millions of CHF 2010 2009
Minimum lease payments
Future value
Within one year 600 583
In the second year 467 460
In the third to the fi fth year inclusive 939 834
After the fi fth year 569 575
2 575 2 452
Lease commitments refer mainly to buildings, industrial equipment, vehicles and IT equipment. Operating lease charge
for the year 2010 amounts to CHF 701 million (2009: CHF 627 mil lion).
19.2 Finance leases
In millions of CHF 2010 2009
Minimum lease payments
Present
value
Future
value
Present
value
Future
value
Within one year 68 74 71 75
In the second year 57 68 58 68
In the third to the fi fth year inclusive 106 155 120 169
After the fi fth year 69 145 80 182
300 442 329 494
The difference between the future value of the minimum lease payments and their present value represents the discount
on the lease obligations.
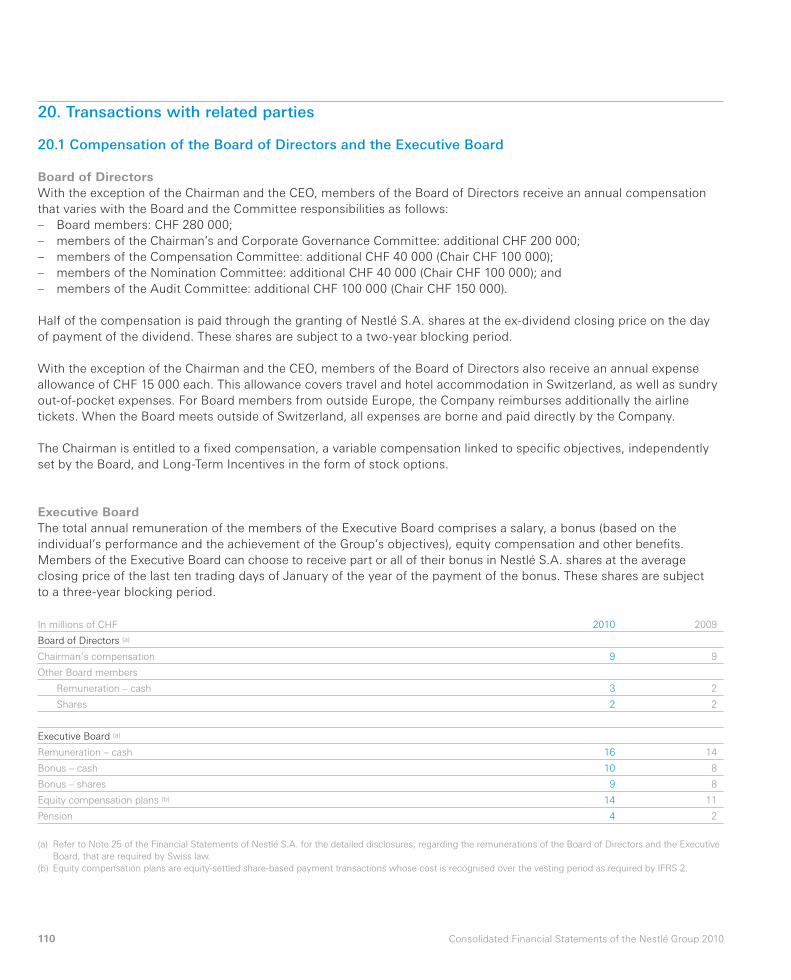
110 Consolidated Financial Statements of the Nestlé Group 2010
20. Transactions with related parties
20.1 Compensation of the Board of Directors and the Executive Board
Board of Directors With the exception of the Chairman and the CEO, members of the Board of Directors receive an annual compensation
that varies with the Board and the Committee responsibilities as follows:
– Board members: CHF 280 000;
– members of the Chairman’s and Corporate Governance Committee: additional CHF 200 000;
– members of the Compensation Committee: additional CHF 40 000 (Chair CHF 100 000);
– members of the Nomination Committee: additional CHF 40 000 (Chair CHF 100 000); and
– members of the Audit Committee: additional CHF 100 000 (Chair CHF 150 000).
Half of the compensation is paid through the granting of Nestlé S.A. shares at the ex-dividend closing price on the day
of payment of the dividend. These shares are subject to a two-year blocking period.
With the exception of the Chairman and the CEO, members of the Board of Directors also receive an annual expense
allowance of CHF 15 000 each. This allowance covers travel and hotel accommodation in Switzerland, as well as sundry
out-of-pocket expenses. For Board members from outside Europe, the Company reimburses additionally the airline
tickets. When the Board meets outside of Switzerland, all expenses are borne and paid directly by the Company.
The Chairman is entitled to a fi xed compensation, a variable compensation linked to specifi c objectives, independently
set by the Board, and Long-Term Incentives in the form of stock options.
Executive BoardThe total annual remuneration of the members of the Executive Board comprises a salary, a bonus (based on the
individual‘s performance and the achievement of the Group‘s objectives), equity compensation and other benefi ts.
Members of the Executive Board can choose to receive part or all of their bonus in Nestlé S.A. shares at the average
closing price of the last ten trading days of January of the year of the payment of the bonus. These shares are subject
to a three-year blocking period.
In millions of CHF 2010 2009
Board of Directors (a)
Chairman’s compensation 9 9
Other Board members
Remuneration – cash 3 2
Shares 2 2
Executive Board (a)
Remuneration – cash 16 14
Bonus – cash 10 8
Bonus – shares 9 8
Equity compensation plans (b) 14 11
Pension 4 2
(a) Refer to Note 25 of the Financial Statements of Nestlé S.A. for the detailed disclosures, regarding the remunerations of the Board of Directors and the Executive
Board, that are required by Swiss law.
(b) Equity compensation plans are equity-settled share-based payment transactions whose cost is recognised over the vesting period as required by IFRS 2.
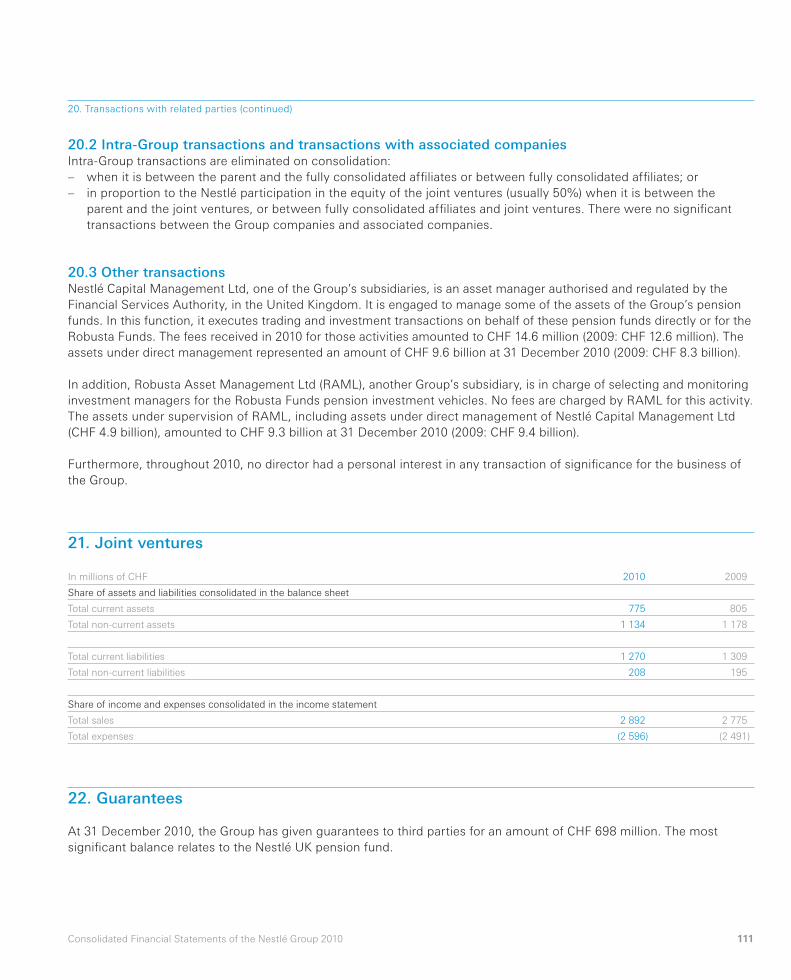
111Consolidated Financial Statements of the Nestlé Group 2010
20.2 Intra-Group transactions and transactions with associated companiesIntra-Group transactions are eliminated on consolidation:
– when it is between the parent and the fully consolidated affi liates or between fully consolidated affi liates; or
– in proportion to the Nestlé participation in the equity of the joint ventures (usually 50%) when it is between the
parent and the joint ventures, or between fully consolidated affi liates and joint ventures. There were no signifi cant
transactions between the Group companies and associated companies.
20.3 Other transactionsNestlé Capital Management Ltd, one of the Group’s sub sidiaries, is an asset manager authorised and regulated by the
Financial Services Authority, in the United Kingdom. It is engaged to manage some of the assets of the Group’s pension
funds. In this function, it executes trading and investment transactions on behalf of these pension funds directly or for the
Robusta Funds. The fees received in 2010 for those activities amounted to CHF 14.6 mil lion (2009: CHF 12.6 million). The
assets under direct management represented an amount of CHF 9.6 billion at 31 December 2010 (2009: CHF 8.3 billion).
In addition, Robusta Asset Management Ltd (RAML), another Group’s subsidiary, is in charge of selecting and monitoring
investment managers for the Robusta Funds pension investment vehicles. No fees are charged by RAML for this activity.
The assets under supervision of RAML, including assets under direct management of Nestlé Capital Management Ltd
(CHF 4.9 billion), amounted to CHF 9.3 billion at 31 December 2010 (2009: CHF 9.4 billion).
Furthermore, throughout 2010, no director had a personal interest in any transaction of signifi cance for the business of
the Group.
20. Transactions with related parties (continued)
21. Joint ventures
In millions of CHF 2010 2009
Share of assets and liabilities consolidated in the balance sheet
Total current assets 775 805
Total non-current assets 1 134 1 178
Total current liabilities 1 270 1 309
Total non-current liabilities 208 195
Share of income and expenses consolidated in the income statement
Total sales 2 892 2 775
Total expenses (2 596) (2 491)
22. Guarantees
At 31 December 2010, the Group has given guarantees to third parties for an amount of CHF 698 million. The most
signifi cant balance relates to the Nestlé UK pension fund.
112 Consolidated Financial Statements of the Nestlé Group 2010
23. Group risk management
The Nestlé Group Enterprise Risk Management (ERM) is a process applied across the enterprise, designed to identify
potential events that may affect the Company, to manage risk to be within its risk appetite, and to provide reasonable
assurance regarding the achievement of objectives. Risk management is an integral element of the Governance, Risk
management and Compliance (GRC) model.
GRC is an integrated, holistic approach ensuring that the organisation acts in accordance with its risk appetite, internal
policies and guidelines, and external regulations. GRC is thereby promoting a proactive risk management and the
effectiveness of internal controls.
ERM enables Nestlé’s management to raise risk awareness, to anticipate risks early and to make sound business
decisions throughout the Group by understanding relative business impact of different types of risks, root causes and
correlations among interdependent risks or major impact of the Company on its social and physical environment.
A global risk appetite is defi ned by the Executive Board and reviewed and validated on an annual basis by the Board of
Directors.
The complexity of the Nestlé Group requires a two-tiered (centralised and decentralised) approach to the evaluation of
risk. To allow for this complexity, the ERM has been developed using both “Top-Down” and “Bottom-Up” assessments.
Implementation of this Framework has allowed the Group to achieve the following objectives:
– identifi cation and quantifi cation of tangible (fi nancial, operational, physical, human assets, etc.) and intangible
(reputation, brand image, intellectual property, etc.) risks in a transparent manner;
– development of a common language for communicating and consolidating risk; and
– prioritisation and identifi cation of where to focus management resources and activity.
The “Top-Down” assessment occurs annually and focuses on the Group’s global risk portfolio. It involves the aggregation
of individual “Top-Down” assessments of Zones, Globally Managed Businesses, and all markets. It is intended to provide
a high-level mapping of Group risk and allow Group Management to make sound decisions on the future operations of
the Company. Risk assessments are the responsibility of line management; this applies equally to a business, a market or
a function, and any mitigating actions identifi ed in the assessments are the responsibility of the individual line management.
If a Group-level intervention is required, responsibility for mitigating actions will generally be determined by the Executive
Board.
The “Bottom-Up” process includes assessments performed at an individual component level (business unit, function,
department or project). The reason for performing these component level risk assessments is to highlight localised
issues where risks can be mitigated quickly and effi ciently. The timing of these assessments varies, and any mitigating
actions required are the responsibility of the line management of the individual component unit.
Overall Group ERM reporting combines the total results of the “Top-Down” assessment and the compilations of the
individual “Bottom-Up” assessments. The results of the Group ERM are presented to the Executive Board and Audit
Committee annually. In the case of an individual risk assessment identifying a risk which requires action at Group level, an
ad hoc presentation is made to the Executive Board.
Financial risks management is described in more details in Note 13.
113Consolidated Financial Statements of the Nestlé Group 2010
24. Events after the balance sheet date
On 13 December 2010, Galderma Pharma S.A., a company held at 50% by Nestlé, announced that one of its fully owned
subsidiaries will make a public offer for Q-Med AB shares, listed in the Mid Cap segment of the NASDAQ OMX Nordic
(Stockholm). The period of the public offer was initially from 4 January 2011 to 7 February 2011 and has been extended
until 24 February 2011. The cost of the acquisition would amount to approximately CHF 1 billion, of which about
CHF 500 million would be Nestlé’s share. Q-Med is a medical device Group. Its current products portfolio is composed
of, amongst others, Restylane, a wrinkle smoother, and of Macrolane, used for soft tissue augmentation, to create
volume and smooth out defects on the body. In 2010, Q-Med realised sales of SEK 1.5 billion and an operating income
of SEK 287 million.
At 16 February 2011, date of approval of the Financial Statements by the Board of Directors, the Group had no other
subsequent events that warrant a modifi cation of the value of the assets and liabilities or an additional disclosure.
25. Group companies
The list of companies appears in the section Companies of the Nestlé Group.
114 Consolidated Financial Statements of the Nestlé Group 2010
As statutory auditor, we have audited the consolidated fi nancial statements (income statement, statement of
comprehensive income, balance sheet, cash fl ow statement, statement of changes in equity and notes on pages 44 to
113) of the Nestlé Group for the year ended 31 December 2010.
Board of Directors’ responsibilityThe Board of Directors is responsible for the preparation and fair presentation of the consolidated fi nancial statements
in accordance with International Financial Reporting Standards (IFRS) and the requirements of Swiss law. This
responsibility includes designing, implementing and maintaining an internal control system relevant to the preparation
and fair presentation of consolidated fi nancial statements that are free from material misstatement, whether due to fraud
or error. The Board of Directors is further responsible for selecting and applying appropriate accounting policies and
making accounting estimates that are reasonable in the circumstances.
Auditor’s responsibilityOur responsibility is to express an opinion on these consoli dated fi nancial statements based on our audit. We conducted
our audit in accordance with Swiss law and Swiss Auditing Standards as well as International Standards on Auditing.
Those standards require that we plan and perform the audit to obtain reasonable assurance whether the consolidated
fi nancial statements are free from material misstatement.
An audit involves performing procedures to obtain audit evidence about the amounts and disclosures in the consolidated
fi nancial statements. The procedures selected depend on the auditor’s judgment, including the assessment of the risks
of material misstatement of the consolidated fi nancial statements, whether due to fraud or error. In making those risk
assessments, the auditor considers the internal control system relevant to the entity’s preparation and fair presentation
of the consolidated fi nancial statements in order to design audit procedures that are appropriate in the circumstances,
but not for the purpose of expressing an opinion on the effectiveness of the entity’s internal control system. An audit
also includes evaluating the appropriateness of the accounting policies used and the reasonableness of accounting
estimates made, as well as evaluating the overall presentation of the consolidated fi nancial statements. We believe that
the audit evidence we have obtained is suffi cient and appropriate to provide a basis for our audit opinion.
OpinionIn our opinion, the consolidated fi nancial statements for the year ended 31 December 2010 give a true and fair view of
the fi nancial position, the results of operations and the cash fl ows in accordance with International Financial Reporting
Standards (IFRS) and comply with Swiss law.
Report of the Statutory Auditoron the Consolidated Financial Statementsto the General Meeting of Nestlé S.A.
115Consolidated Financial Statements of the Nestlé Group 2010
Mark Baillache Stéphane Gard
Licensed Audit Expert Licensed Audit Expert
Auditor in charge
Geneva, 16 February 2011
KPMG S.A.
Report on other legal requirementsWe confi rm that we meet the legal requirements on licensing according to the Auditor Oversight Act (AOA) and
independence (article 728 CO and article 11 AOA) and that there are no circumstances incompatible with our
independence.
In accordance with article 728a paragraph 1 item 3 CO and Swiss Auditing Standard 890, we confi rm that an internal
control system exists, which has been designed for the preparation of consolidated fi nancial statements according to
the instructions of the Board of Directors.
We recommend that the consolidated fi nancial statements submitted to you be approved.
Report of the Statutory auditor on the Consolidated Financial Statements (continued)
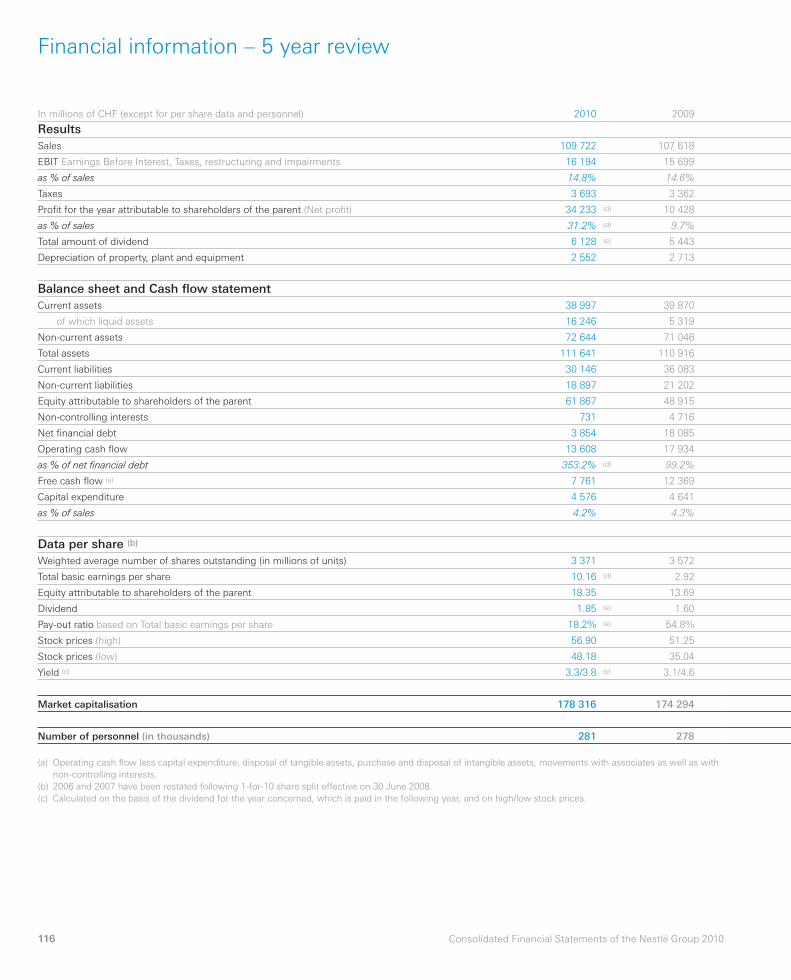
116 Consolidated Financial Statements of the Nestlé Group 2010
Financial information – 5 year review
In millions of CHF (except for per share data and personnel) 2010 2009
Results Sales 109 722 107 618
EBIT Earnings Before Interest, Taxes, restructuring and impairments 16 194 15 699
as % of sales 14.8% 14.6%
Taxes 3 693 3 362
Profi t for the year attributable to shareholders of the parent (Net profi t) 34 233 (d) 10 428
as % of sales 31.2% (d) 9.7%
Total amount of dividend 6 128 (e) 5 443
Depreciation of property, plant and equipment 2 552 2 713
Balance sheet and Cash fl ow statement Current assets 38 997 39 870
of which liquid assets 16 246 5 319
Non-current assets 72 644 71 046
Total assets 111 641 110 916
Current liabilities 30 146 36 083
Non-current liabilities 18 897 21 202
Equity attributable to shareholders of the parent 61 867 48 915
Non-controlling interests 731 4 716
Net fi nancial debt 3 854 18 085
Operating cash fl ow 13 608 17 934
as % of net fi nancial debt 353.2% (d) 99.2%
Free cash fl ow (a) 7 761 12 369
Capital expenditure 4 576 4 641
as % of sales 4.2% 4.3%
Data per share (b) Weighted average number of shares outstanding (in millions of units) 3 371 3 572
Total basic earnings per share 10.16 (d) 2.92
Equity attributable to shareholders of the parent 18.35 13.69
Dividend 1.85 (e) 1.60
Pay-out ratio based on Total basic earnings per share 18.2% (e) 54.8%
Stock prices (high) 56.90 51.25
Stock prices (low) 48.18 35.04
Yield (c) 3.3/3.8 (e) 3.1/4.6
Market capitalisation 178 316 174 294
Number of personnel (in thousands) 281 278
(a) Operating cash fl ow less capital expenditure, disposal of tangible assets, purchase and disposal of intangible assets, movements with associates as well as with
non-controlling interests.
(b) 2006 and 2007 have been restated following 1-for-10 share split effective on 30 June 2008.
(c) Calculated on the basis of the dividend for the year concerned, which is paid in the following year, and on high/low stock prices.
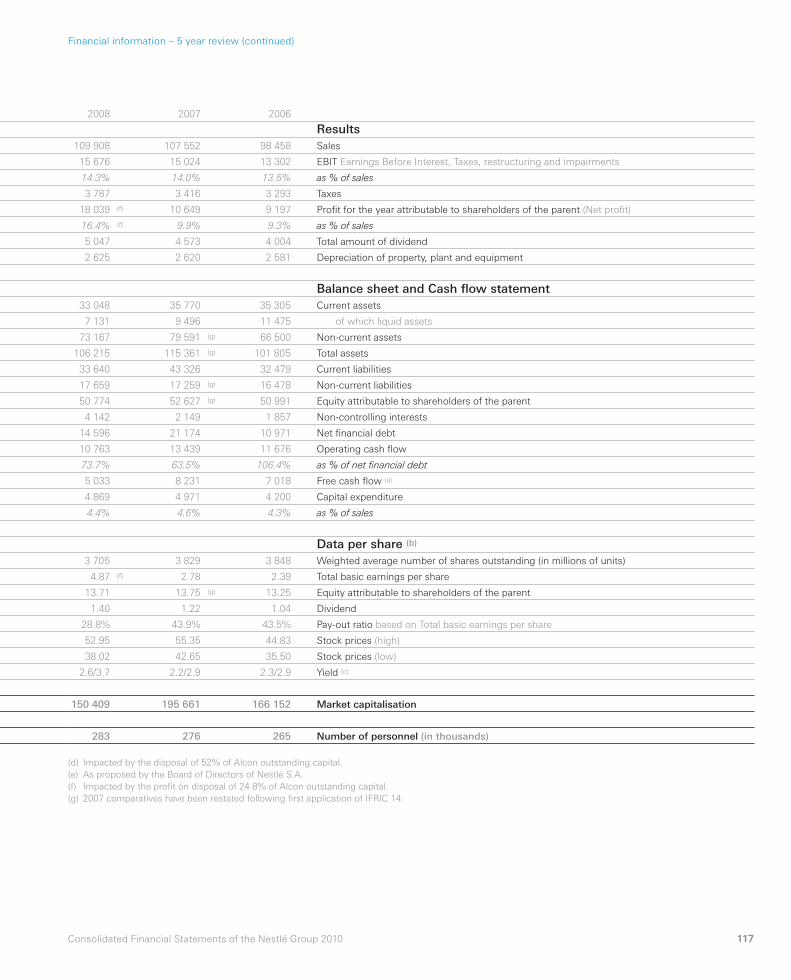
117Consolidated Financial Statements of the Nestlé Group 2010
Financial information – 5 year review (continued)
2008 2007 2006
Results 109 908 107 552 98 458 Sales
15 676 15 024 13 302 EBIT Earnings Before Interest, Taxes, restructuring and impairments
14.3% 14.0% 13.5% as % of sales
3 787 3 416 3 293 Taxes
18 039 (f) 10 649 9 197 Profi t for the year attributable to shareholders of the parent (Net profi t)
16.4% (f) 9.9% 9.3% as % of sales
5 047 4 573 4 004 Total amount of dividend
2 625 2 620 2 581 Depreciation of property, plant and equipment
Balance sheet and Cash fl ow statement 33 048 35 770 35 305 Current assets
7 131 9 496 11 475 of which liquid assets
73 167 79 591 (g) 66 500 Non-current assets
106 215 115 361 (g) 101 805 Total assets
33 640 43 326 32 479 Current liabilities
17 659 17 259 (g) 16 478 Non-current liabilities
50 774 52 627 (g) 50 991 Equity attributable to shareholders of the parent
4 142 2 149 1 857 Non-controlling interests
14 596 21 174 10 971 Net fi nancial debt
10 763 13 439 11 676 Operating cash fl ow
73.7% 63.5% 106.4% as % of net fi nancial debt
5 033 8 231 7 018 Free cash fl ow (a)
4 869 4 971 4 200 Capital expenditure
4.4% 4.6% 4.3% as % of sales
Data per share (b) 3 705 3 829 3 848 Weighted average number of shares outstanding (in millions of units)
4.87 (f) 2.78 2.39 Total basic earnings per share
13.71 13.75 (g) 13.25 Equity attributable to shareholders of the parent
1.40 1.22 1.04 Dividend
28.8% 43.9% 43.5% Pay-out ratio based on Total basic earnings per share
52.95 55.35 44.83 Stock prices (high)
38.02 42.65 35.50 Stock prices (low)
2.6/3.7 2.2/2.9 2.3/2.9 Yield (c)
150 409 195 661 166 152 Market capitalisation
283 276 265 Number of personnel (in thousands)
(d) Impacted by the disposal of 52% of Alcon outstanding capital.
(e) As proposed by the Board of Directors of Nestlé S.A.
(f) Impacted by the profi t on disposal of 24.8% of Alcon outstanding capital.
(g) 2007 comparatives have been restated following fi rst application of IFRIC 14.
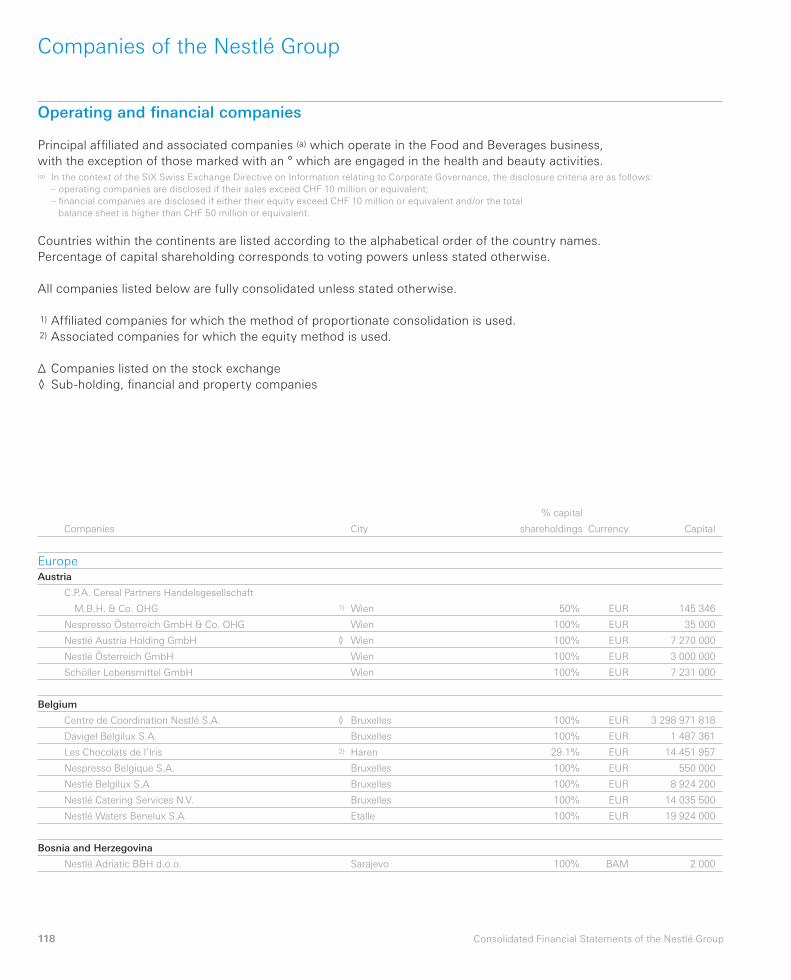
118 Consolidated Financial Statements of the Nestlé Group
Companies of the Nestlé Group
Companies City
% capital
shareholdings Currency Capital
Europe
Austria
C.P.A. Cereal Partners Handelsgesellschaft
M.B.H. & Co. OHG 1) Wien 50% EUR 145 346
Nespresso Österreich GmbH & Co. OHG Wien 100% EUR 35 000
Nestlé Austria Holding GmbH ◊ Wien 100% EUR 7 270 000
Nestlé Österreich GmbH Wien 100% EUR 3 000 000
Schöller Lebensmittel GmbH Wien 100% EUR 7 231 000
Belgium
Centre de Coordination Nestlé S.A. ◊ Bruxelles 100% EUR 3 298 971 818
Davigel Belgilux S.A. Bruxelles 100% EUR 1 487 361
Les Chocolats de l’Iris 2) Haren 29.1% EUR 14 451 957
Nespresso Belgique S.A. Bruxelles 100% EUR 550 000
Nestlé Belgilux S.A. Bruxelles 100% EUR 8 924 200
Nestlé Catering Services N.V. Bruxelles 100% EUR 14 035 500
Nestlé Waters Benelux S.A. Etalle 100% EUR 19 924 000
Bosnia and Herzegovina
Nestlé Adriatic B&H d.o.o. Sarajevo 100% BAM 2 000
Operating and fi nancial companies
Principal affi liated and associated companies (a) which operate in the Food and Beverages business,
with the exception of those marked with an ° which are engaged in the health and beauty activities.(a) In the context of the SIX Swiss Exchange Directive on Information relating to Corporate Governance, the disclosure criteria are as follows:
– operating companies are disclosed if their sales exceed CHF 10 million or equivalent;
– fi nancial companies are disclosed if either their equity exceed CHF 10 million or equivalent and/or the total
balance sheet is higher than CHF 50 million or equivalent.
Countries within the continents are listed according to the alphabetical order of the country names.
Percentage of capital shareholding corresponds to voting powers unless stated otherwise.
All companies listed below are fully consolidated unless stated otherwise.
1)
2)
Affi liated companies for which the method of proportionate consolidation is used.
Associated companies for which the equity method is used.
Δ
◊
Companies listed on the stock exchange
Sub-holding, fi nancial and property companies
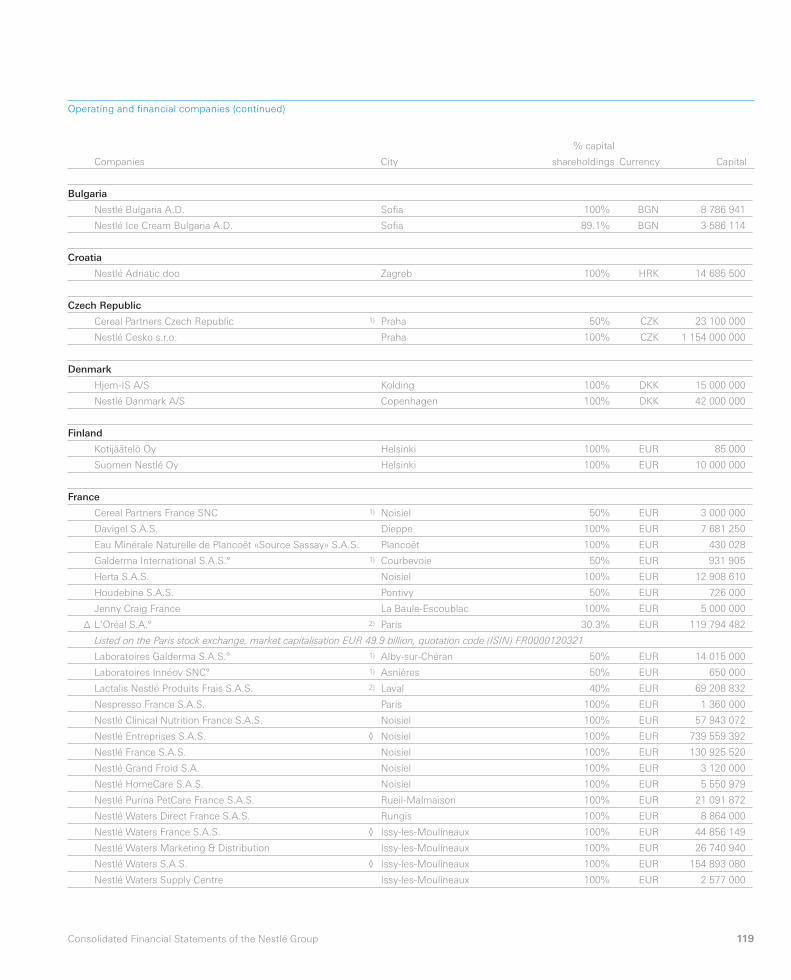
119Consolidated Financial Statements of the Nestlé Group
Companies
% capital
City shareholdings Currency Capital
Bulgaria
Nestlé Bulgaria A.D. Sofi a 100% BGN 8 786 941
Nestlé Ice Cream Bulgaria A.D. Sofi a 89.1% BGN 3 586 114
Croatia
Nestlé Adriatic doo Zagreb 100% HRK 14 685 500
Czech Republic
Cereal Partners Czech Republic 1) Praha 50% CZK 23 100 000
Nestlé Cesko s.r.o. Praha 100% CZK 1 154 000 000
Denmark
Hjem-IS A/S Kolding 100% DKK 15 000 000
Nestlé Danmark A/S Copenhagen 100% DKK 42 000 000
Finland
Kotijäätelö Oy Helsinki 100% EUR 85 000
Suomen Nestlé Oy Helsinki 100% EUR 10 000 000
France
Cereal Partners France SNC 1) Noisiel 50% EUR 3 000 000
Davigel S.A.S. Dieppe 100% EUR 7 681 250
Eau Minérale Naturelle de Plancoët «Source Sassay» S.A.S. Plancoët 100% EUR 430 028
Galderma International S.A.S.° 1) Courbevoie 50% EUR 931 905
Herta S.A.S. Noisiel 100% EUR 12 908 610
Houdebine S.A.S. Pontivy 50% EUR 726 000
Jenny Craig France La Baule-Escoublac 100% EUR 5 000 000
Δ L’Oréal S.A.° 2) Paris 30.3% EUR 119 794 482
Listed on the Paris stock exchange, market capitalisation EUR 49.9 billion, quotation code (ISIN) FR0000120321
Laboratoires Galderma S.A.S.° 1) Alby-sur-Chéran 50% EUR 14 015 000
Laboratoires Innéov SNC° 1) Asnières 50% EUR 650 000
Lactalis Nestlé Produits Frais S.A.S. 2) Laval 40% EUR 69 208 832
Nespresso France S.A.S. Paris 100% EUR 1 360 000
Nestlé Clinical Nutrition France S.A.S. Noisiel 100% EUR 57 943 072
Nestlé Entreprises S.A.S. ◊ Noisiel 100% EUR 739 559 392
Nestlé France S.A.S. Noisiel 100% EUR 130 925 520
Nestlé Grand Froid S.A. Noisiel 100% EUR 3 120 000
Nestlé HomeCare S.A.S. Noisiel 100% EUR 5 550 979
Nestlé Purina PetCare France S.A.S. Rueil-Malmaison 100% EUR 21 091 872
Nestlé Waters Direct France S.A.S. Rungis 100% EUR 8 864 000
Nestlé Waters France S.A.S. ◊ Issy-les-Moulineaux 100% EUR 44 856 149
Nestlé Waters Marketing & Distribution Issy-les-Moulineaux 100% EUR 26 740 940
Nestlé Waters S.A.S. ◊ Issy-les-Moulineaux 100% EUR 154 893 080
Nestlé Waters Supply Centre Issy-les-Moulineaux 100% EUR 2 577 000
Operating and fi nancial companies (continued)
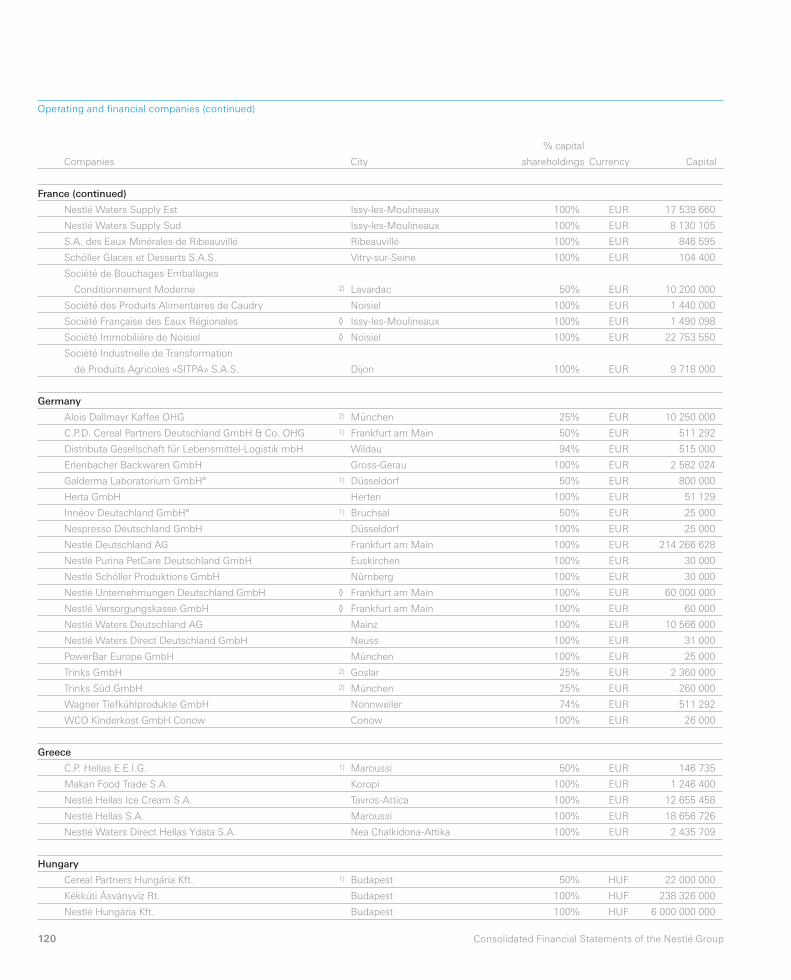
120 Consolidated Financial Statements of the Nestlé Group
Companies
% capital
City shareholdings Currency Capital
France (continued)
Nestlé Waters Supply Est Issy-les-Moulineaux 100% EUR 17 539 660
Nestlé Waters Supply Sud Issy-les-Moulineaux 100% EUR 8 130 105
S.A. des Eaux Minérales de Ribeauvillé Ribeauvillé 100% EUR 846 595
Schöller Glaces et Desserts S.A.S. Vitry-sur-Seine 100% EUR 104 400
Société de Bouchages Emballages
Conditionnement Moderne 2) Lavardac 50% EUR 10 200 000
Société des Produits Alimentaires de Caudry Noisiel 100% EUR 1 440 000
Société Française des Eaux Régionales ◊ Issy-les-Moulineaux 100% EUR 1 490 098
Société Immobilière de Noisiel ◊ Noisiel 100% EUR 22 753 550
Société Industrielle de Transformation
de Produits Agricoles «SITPA» S.A.S. Dijon 100% EUR 9 718 000
Germany
Alois Dallmayr Kaffee OHG 2) München 25% EUR 10 250 000
C.P.D. Cereal Partners Deutschland GmbH & Co. OHG 1) Frankfurt am Main 50% EUR 511 292
Distributa Gesellschaft für Lebensmittel-Logistik mbH Wildau 94% EUR 515 000
Erlenbacher Backwaren GmbH Gross-Gerau 100% EUR 2 582 024
Galderma Laboratorium GmbH° 1) Düsseldorf 50% EUR 800 000
Herta GmbH Herten 100% EUR 51 129
Innéov Deutschland GmbH° 1) Bruchsal 50% EUR 25 000
Nespresso Deutschland GmbH Düsseldorf 100% EUR 25 000
Nestlé Deutschland AG Frankfurt am Main 100% EUR 214 266 628
Nestlé Purina PetCare Deutschland GmbH Euskirchen 100% EUR 30 000
Nestlé Schöller Produktions GmbH Nürnberg 100% EUR 30 000
Nestlé Unternehmungen Deutschland GmbH ◊ Frankfurt am Main 100% EUR 60 000 000
Nestlé Versorgungskasse GmbH ◊ Frankfurt am Main 100% EUR 60 000
Nestlé Waters Deutschland AG Mainz 100% EUR 10 566 000
Nestlé Waters Direct Deutschland GmbH Neuss 100% EUR 31 000
PowerBar Europe GmbH München 100% EUR 25 000
Trinks GmbH 2) Goslar 25% EUR 2 360 000
Trinks Süd GmbH 2) München 25% EUR 260 000
Wagner Tiefkühlprodukte GmbH Nonnweiler 74% EUR 511 292
WCO Kinderkost GmbH Conow Conow 100% EUR 26 000
Greece
C.P. Hellas E.E.I.G. 1) Maroussi 50% EUR 146 735
Makan Food Trade S.A. Koropi 100% EUR 1 246 400
Nestlé Hellas Ice Cream S.A. Tavros-Attica 100% EUR 12 655 458
Nestlé Hellas S.A. Maroussi 100% EUR 18 656 726
Nestlé Waters Direct Hellas Ydata S.A. Nea Chalkidona-Attika 100% EUR 2 435 709
Hungary
Cereal Partners Hungária Kft. 1) Budapest 50% HUF 22 000 000
Kékkúti Ásvànyvíz Rt. Budapest 100% HUF 238 326 000
Nestlé Hungária Kft. Budapest 100% HUF 6 000 000 000
Operating and fi nancial companies (continued)
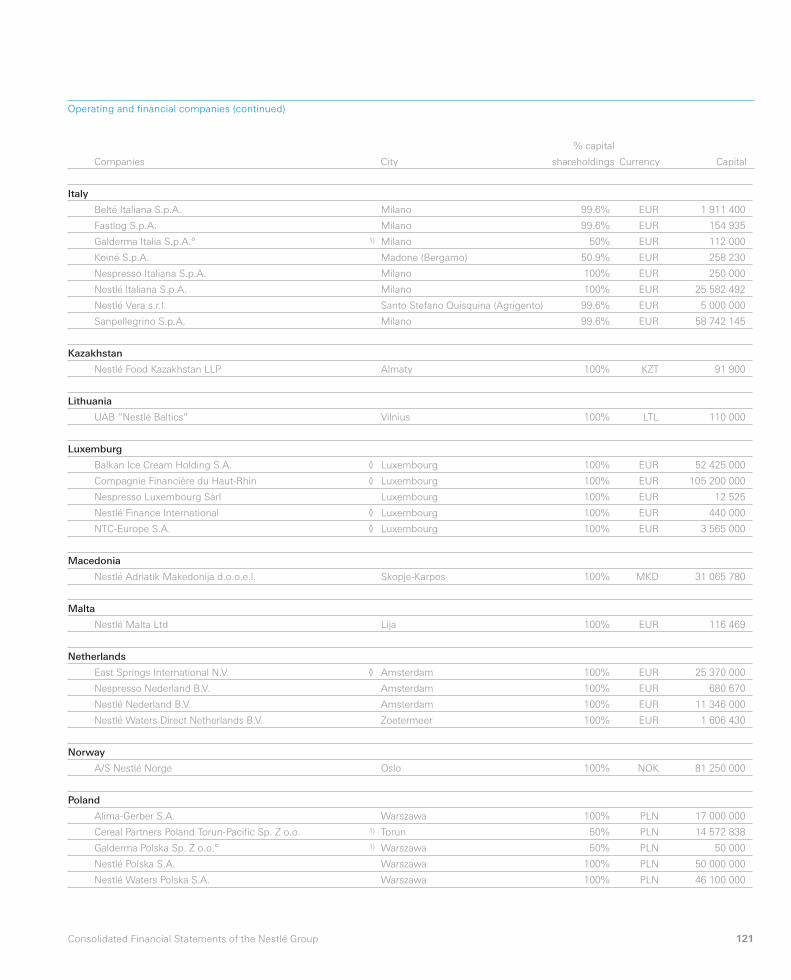
121Consolidated Financial Statements of the Nestlé Group
Companies
% capital
City shareholdings Currency Capital
Italy
Belté Italiana S.p.A. Milano 99.6% EUR 1 911 400
Fastlog S.p.A. Milano 99.6% EUR 154 935
Galderma Italia S.p.A.° 1) Milano 50% EUR 112 000
Koiné S.p.A. Madone (Bergamo) 50.9% EUR 258 230
Nespresso Italiana S.p.A. Milano 100% EUR 250 000
Nestlé ltaliana S.p.A. Milano 100% EUR 25 582 492
Nestlé Vera s.r.l. Santo Stefano Quisquina (Agrigento) 99.6% EUR 5 000 000
Sanpellegrino S.p.A. Milano 99.6% EUR 58 742 145
Kazakhstan
Nestlé Food Kazakhstan LLP Almaty 100% KZT 91 900
Lithuania
UAB “Nestlé Baltics” Vilnius 100% LTL 110 000
Luxemburg
Balkan Ice Cream Holding S.A. ◊ Luxembourg 100% EUR 52 425 000
Compagnie Financière du Haut-Rhin ◊ Luxembourg 100% EUR 105 200 000
Nespresso Luxembourg Sàrl Luxembourg 100% EUR 12 525
Nestlé Finance International ◊ Luxembourg 100% EUR 440 000
NTC-Europe S.A. ◊ Luxembourg 100% EUR 3 565 000
Macedonia
Nestlé Adriatik Makedonija d.o.o.e.l. Skopje-Karpos 100% MKD 31 065 780
Malta
Nestlé Malta Ltd Lija 100% EUR 116 469
Netherlands
East Springs International N.V. ◊ Amsterdam 100% EUR 25 370 000
Nespresso Nederland B.V. Amsterdam 100% EUR 680 670
Nestlé Nederland B.V. Amsterdam 100% EUR 11 346 000
Nestlé Waters Direct Netherlands B.V. Zoetermeer 100% EUR 1 606 430
Norway
A/S Nestlé Norge Oslo 100% NOK 81 250 000
Poland
Alima-Gerber S.A. Warszawa 100% PLN 17 000 000
Cereal Partners Poland Torun-Pacifi c Sp. Z o.o. 1) Torun 50% PLN 14 572 838
Galderma Polska Sp. Z o.o.° 1) Warszawa 50% PLN 50 000
Nestlé Polska S.A. Warszawa 100% PLN 50 000 000
Nestlé Waters Polska S.A. Warszawa 100% PLN 46 100 000
Operating and fi nancial companies (continued)
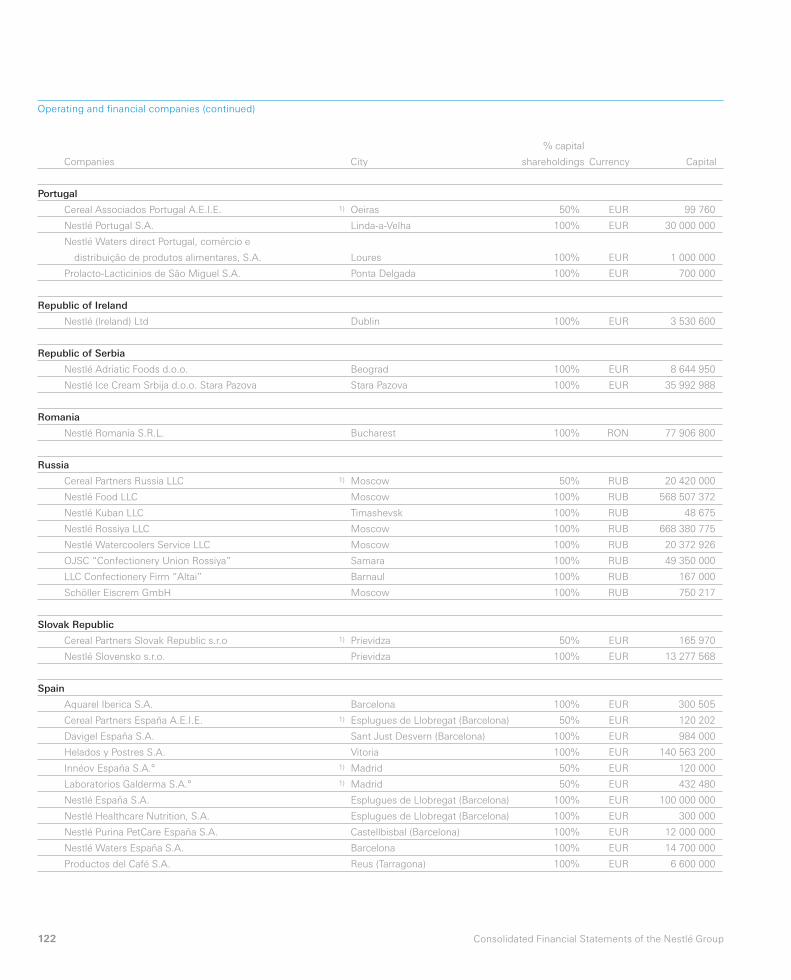
122 Consolidated Financial Statements of the Nestlé Group
Companies
% capital
City shareholdings Currency Capital
Portugal
Cereal Associados Portugal A.E.I.E. 1) Oeiras 50% EUR 99 760
Nestlé Portugal S.A. Linda-a-Velha 100% EUR 30 000 000
Nestlé Waters direct Portugal, comércio e
distribuição de produtos alimentares, S.A. Loures 100% EUR 1 000 000
Prolacto-Lacticinios de São Miguel S.A. Ponta Delgada 100% EUR 700 000
Republic of Ireland
Nestlé (lreland) Ltd Dublin 100% EUR 3 530 600
Republic of Serbia
Nestlé Adriatic Foods d.o.o. Beograd 100% EUR 8 644 950
Nestlé Ice Cream Srbija d.o.o. Stara Pazova Stara Pazova 100% EUR 35 992 988
Romania
Nestlé Romania S.R.L. Bucharest 100% RON 77 906 800
Russia
Cereal Partners Russia LLC 1) Moscow 50% RUB 20 420 000
Nestlé Food LLC Moscow 100% RUB 568 507 372
Nestlé Kuban LLC Timashevsk 100% RUB 48 675
Nestlé Rossiya LLC Moscow 100% RUB 668 380 775
Nestlé Watercoolers Service LLC Moscow 100% RUB 20 372 926
OJSC “Confectionery Union Rossiya” Samara 100% RUB 49 350 000
LLC Confectionery Firm “Altai” Barnaul 100% RUB 167 000
Schöller Eiscrem GmbH Moscow 100% RUB 750 217
Slovak Republic
Cereal Partners Slovak Republic s.r.o 1) Prievidza 50% EUR 165 970
Nestlé Slovensko s.r.o. Prievidza 100% EUR 13 277 568
Spain
Aquarel Iberica S.A. Barcelona 100% EUR 300 505
Cereal Partners España A.E.I.E. 1) Esplugues de Llobregat (Barcelona) 50% EUR 120 202
Davigel España S.A. Sant Just Desvern (Barcelona) 100% EUR 984 000
Helados y Postres S.A. Vitoria 100% EUR 140 563 200
Innéov España S.A.° 1) Madrid 50% EUR 120 000
Laboratorios Galderma S.A.° 1) Madrid 50% EUR 432 480
Nestlé España S.A. Esplugues de Llobregat (Barcelona) 100% EUR 100 000 000
Nestlé Healthcare Nutrition, S.A. Esplugues de Llobregat (Barcelona) 100% EUR 300 000
Nestlé Purina PetCare España S.A. Castellbisbal (Barcelona) 100% EUR 12 000 000
Nestlé Waters España S.A. Barcelona 100% EUR 14 700 000
Productos del Café S.A. Reus (Tarragona) 100% EUR 6 600 000
Operating and fi nancial companies (continued)
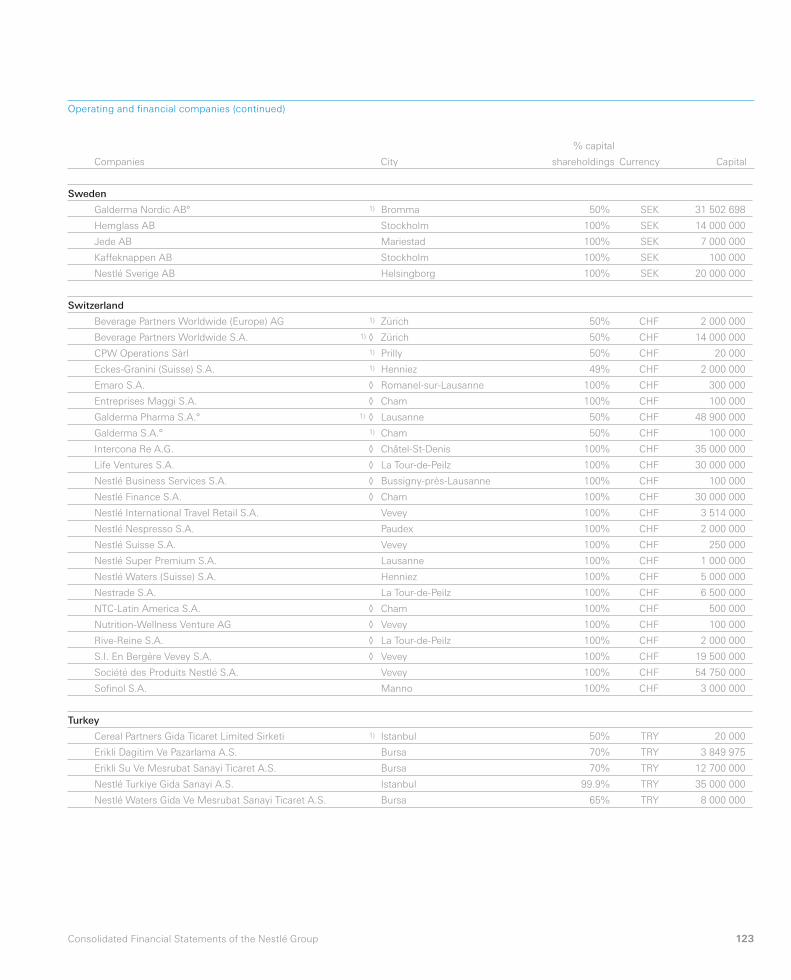
123Consolidated Financial Statements of the Nestlé Group
Companies
% capital
City shareholdings Currency Capital
Sweden
Galderma Nordic AB° 1) Bromma 50% SEK 31 502 698
Hemglass AB Stockholm 100% SEK 14 000 000
Jede AB Mariestad 100% SEK 7 000 000
Kaffeknappen AB Stockholm 100% SEK 100 000
Nestlé Sverige AB Helsingborg 100% SEK 20 000 000
Switzerland
Beverage Partners Worldwide (Europe) AG 1) Zürich 50% CHF 2 000 000
Beverage Partners Worldwide S.A. 1) ◊ Zürich 50% CHF 14 000 000
CPW Operations Sàrl 1) Prilly 50% CHF 20 000
Eckes-Granini (Suisse) S.A. 1) Henniez 49% CHF 2 000 000
Emaro S.A. ◊ Romanel-sur-Lausanne 100% CHF 300 000
Entreprises Maggi S.A. ◊ Cham 100% CHF 100 000
Galderma Pharma S.A.° 1) ◊ Lausanne 50% CHF 48 900 000
Galderma S.A.° 1) Cham 50% CHF 100 000
Intercona Re A.G. ◊ Châtel-St-Denis 100% CHF 35 000 000
Life Ventures S.A. ◊ La Tour-de-Peilz 100% CHF 30 000 000
Nestlé Business Services S.A. ◊ Bussigny-près-Lausanne 100% CHF 100 000
Nestlé Finance S.A. ◊ Cham 100% CHF 30 000 000
Nestlé International Travel Retail S.A. Vevey 100% CHF 3 514 000
Nestlé Nespresso S.A. Paudex 100% CHF 2 000 000
Nestlé Suisse S.A. Vevey 100% CHF 250 000
Nestlé Super Premium S.A. Lausanne 100% CHF 1 000 000
Nestlé Waters (Suisse) S.A. Henniez 100% CHF 5 000 000
Nestrade S.A. La Tour-de-Peilz 100% CHF 6 500 000
NTC-Latin America S.A. ◊ Cham 100% CHF 500 000
Nutrition-Wellness Venture AG ◊ Vevey 100% CHF 100 000
Rive-Reine S.A. ◊ La Tour-de-Peilz 100% CHF 2 000 000
S.I. En Bergère Vevey S.A. ◊ Vevey 100% CHF 19 500 000
Société des Produits Nestlé S.A. Vevey 100% CHF 54 750 000
Sofi nol S.A. Manno 100% CHF 3 000 000
Turkey
Cereal Partners Gida Ticaret Limited Sirketi 1) Istanbul 50% TRY 20 000
Erikli Dagitim Ve Pazarlama A.S. Bursa 70% TRY 3 849 975
Erikli Su Ve Mesrubat Sanayi Ticaret A.S. Bursa 70% TRY 12 700 000
Nestlé Turkiye Gida Sanayi A.S. Istanbul 99.9% TRY 35 000 000
Nestlé Waters Gida Ve Mesrubat Sanayi Ticaret A.S. Bursa 65% TRY 8 000 000
Operating and fi nancial companies (continued)
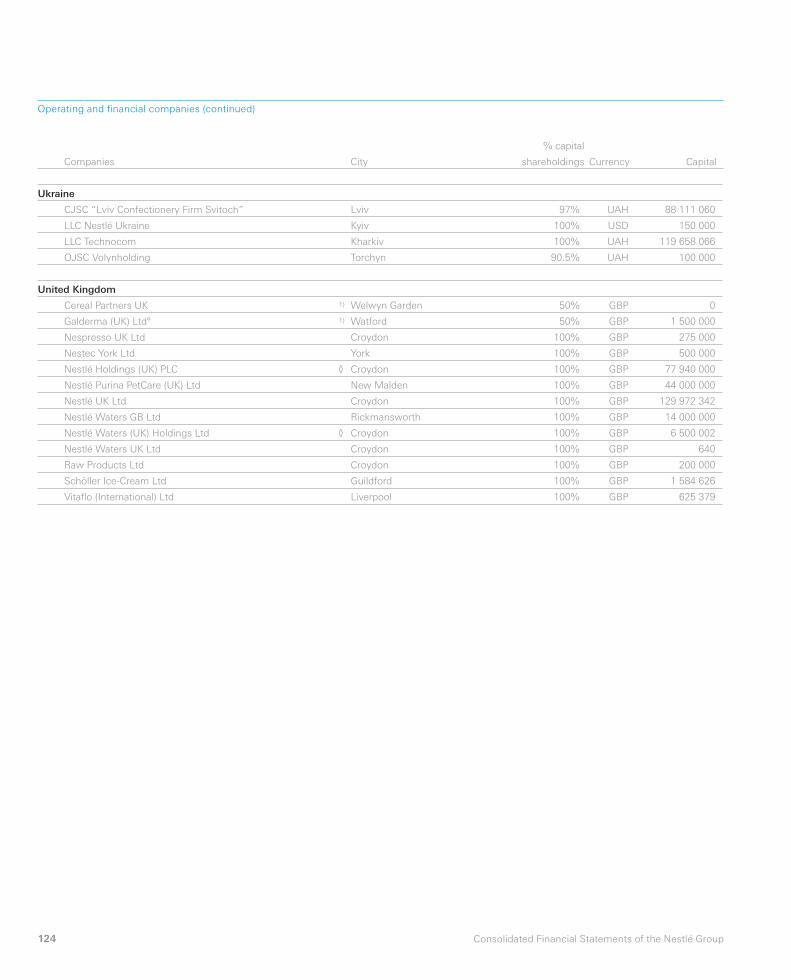
124 Consolidated Financial Statements of the Nestlé Group
Companies
% capital
City shareholdings Currency Capital
Ukraine
CJSC “Lviv Confectionery Firm Svitoch” Lviv 97% UAH 88 111 060
LLC Nestlé Ukraine Kyiv 100% USD 150 000
LLC Technocom Kharkiv 100% UAH 119 658 066
OJSC Volynholding Torchyn 90.5% UAH 100 000
United Kingdom
Cereal Partners UK 1) Welwyn Garden 50% GBP 0
Galderma (UK) Ltd° 1) Watford 50% GBP 1 500 000
Nespresso UK Ltd Croydon 100% GBP 275 000
Nestec York Ltd York 100% GBP 500 000
Nestlé Holdings (UK) PLC ◊ Croydon 100% GBP 77 940 000
Nestlé Purina PetCare (UK) Ltd New Malden 100% GBP 44 000 000
Nestlé UK Ltd Croydon 100% GBP 129 972 342
Nestlé Waters GB Ltd Rickmansworth 100% GBP 14 000 000
Nestlé Waters (UK) Holdings Ltd ◊ Croydon 100% GBP 6 500 002
Nestlé Waters UK Ltd Croydon 100% GBP 640
Raw Products Ltd Croydon 100% GBP 200 000
Schöller Ice-Cream Ltd Guildford 100% GBP 1 584 626
Vitafl o (International) Ltd Liverpool 100% GBP 625 379
Operating and fi nancial companies (continued)
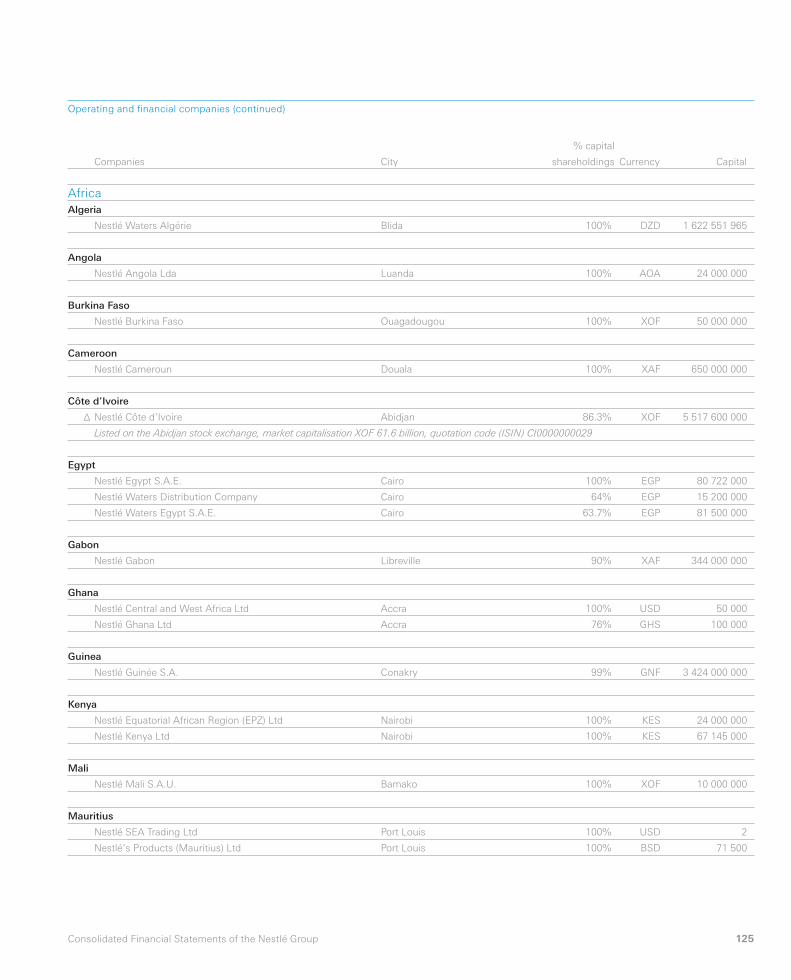
125Consolidated Financial Statements of the Nestlé Group
Companies
% capital
City shareholdings Currency Capital
Africa
Algeria
Nestlé Waters Algérie Blida 100% DZD 1 622 551 965
Angola
Nestlé Angola Lda Luanda 100% AOA 24 000 000
Burkina Faso
Nestlé Burkina Faso Ouagadougou 100% XOF 50 000 000
Cameroon
Nestlé Cameroun Douala 100% XAF 650 000 000
Côte d’Ivoire
Δ Nestlé Côte d’Ivoire Abidjan 86.3% XOF 5 517 600 000
Listed on the Abidjan stock exchange, market capitalisation XOF 61.6 billion, quotation code (ISIN) CI0000000029
Egypt
Nestlé Egypt S.A.E. Cairo 100% EGP 80 722 000
Nestlé Waters Distribution Company Cairo 64% EGP 15 200 000
Nestlé Waters Egypt S.A.E. Cairo 63.7% EGP 81 500 000
Gabon
Nestlé Gabon Libreville 90% XAF 344 000 000
Ghana
Nestlé Central and West Africa Ltd Accra 100% USD 50 000
Nestlé Ghana Ltd Accra 76% GHS 100 000
Guinea
Nestlé Guinée S.A. Conakry 99% GNF 3 424 000 000
Kenya
Nestlé Equatorial African Region (EPZ) Ltd Nairobi 100% KES 24 000 000
Nestlé Kenya Ltd Nairobi 100% KES 67 145 000
Mali
Nestlé Mali S.A.U. Bamako 100% XOF 10 000 000
Mauritius
Nestlé SEA Trading Ltd Port Louis 100% USD 2
Nestlé’s Products (Mauritius) Ltd Port Louis 100% BSD 71 500
Operating and fi nancial companies (continued)
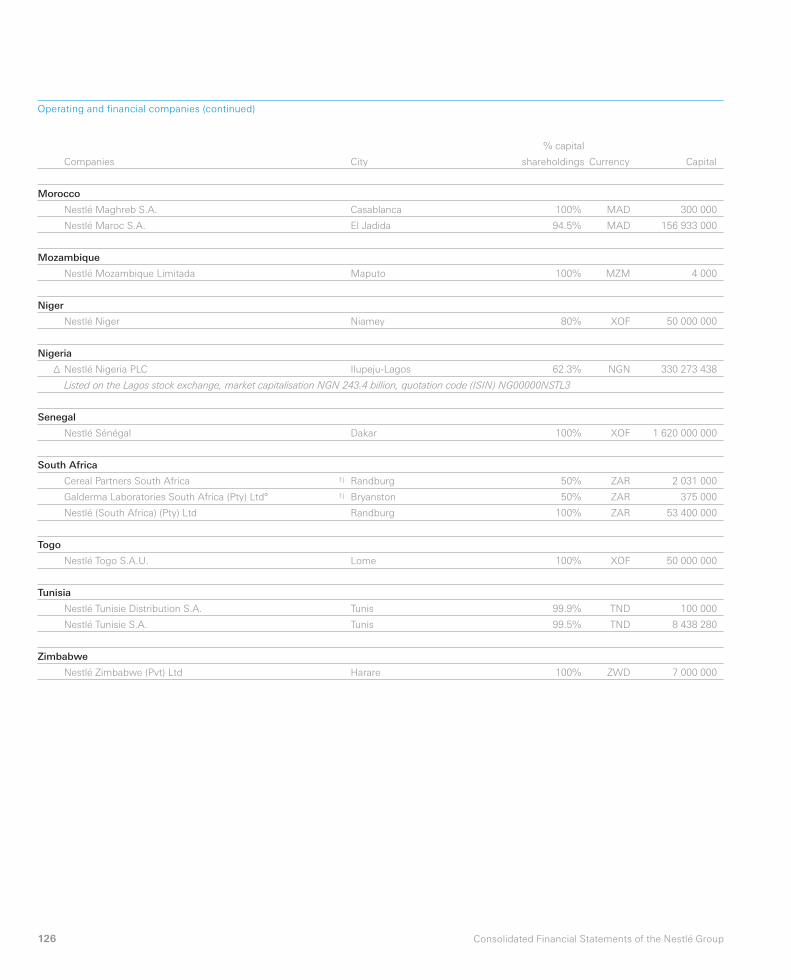
126 Consolidated Financial Statements of the Nestlé Group
Companies
% capital
City shareholdings Currency Capital
Morocco
Nestlé Maghreb S.A. Casablanca 100% MAD 300 000
Nestlé Maroc S.A. El Jadida 94.5% MAD 156 933 000
Mozambique
Nestlé Mozambique Limitada Maputo 100% MZM 4 000
Niger
Nestlé Niger Niamey 80% XOF 50 000 000
Nigeria
Δ Nestlé Nigeria PLC Ilupeju-Lagos 62.3% NGN 330 273 438
Listed on the Lagos stock exchange, market capitalisation NGN 243.4 billion, quotation code (ISIN) NG00000NSTL3
Senegal
Nestlé Sénégal Dakar 100% XOF 1 620 000 000
South Africa
Cereal Partners South Africa 1) Randburg 50% ZAR 2 031 000
Galderma Laboratories South Africa (Pty) Ltd° 1) Bryanston 50% ZAR 375 000
Nestlé (South Africa) (Pty) Ltd Randburg 100% ZAR 53 400 000
Togo
Nestlé Togo S.A.U. Lome 100% XOF 50 000 000
Tunisia
Nestlé Tunisie Distribution S.A. Tunis 99.9% TND 100 000
Nestlé Tunisie S.A. Tunis 99.5% TND 8 438 280
Zimbabwe
Nestlé Zimbabwe (Pvt) Ltd Harare 100% ZWD 7 000 000
Operating and fi nancial companies (continued)
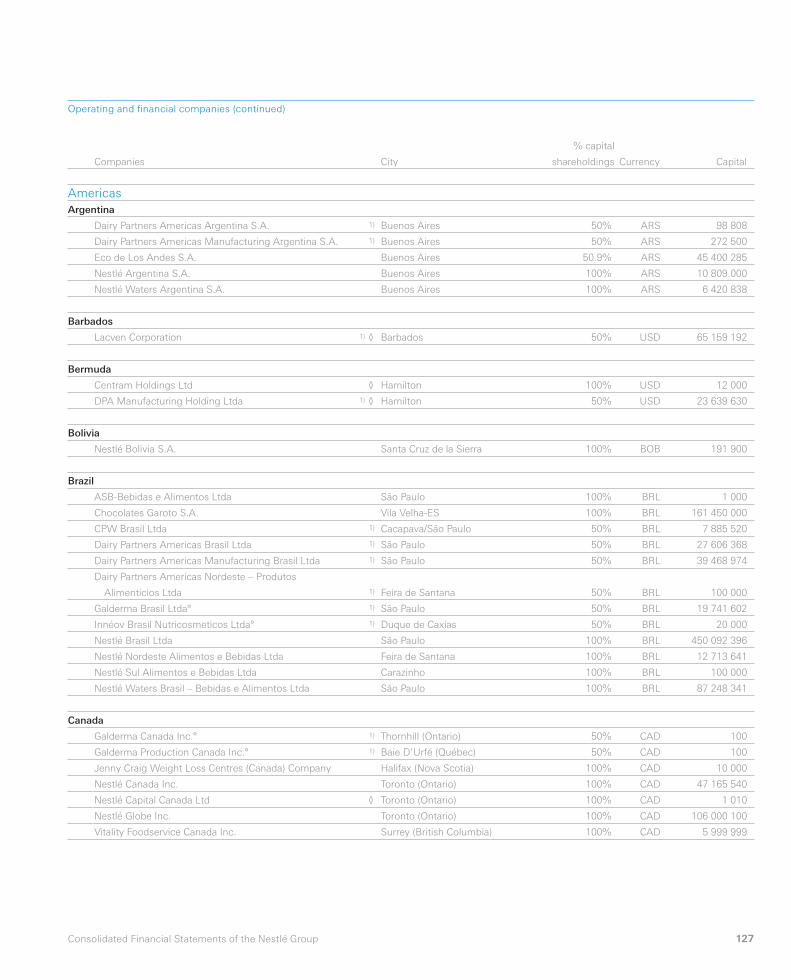
127Consolidated Financial Statements of the Nestlé Group
Companies
% capital
City shareholdings Currency Capital
Americas
Argentina
Dairy Partners Americas Argentina S.A. 1) Buenos Aires 50% ARS 98 808
Dairy Partners Americas Manufacturing Argentina S.A. 1) Buenos Aires 50% ARS 272 500
Eco de Los Andes S.A. Buenos Aires 50.9% ARS 45 400 285
Nestlé Argentina S.A. Buenos Aires 100% ARS 10 809 000
Nestlé Waters Argentina S.A. Buenos Aires 100% ARS 6 420 838
Barbados
Lacven Corporation 1) ◊ Barbados 50% USD 65 159 192
Bermuda
Centram Holdings Ltd ◊ Hamilton 100% USD 12 000
DPA Manufacturing Holding Ltda 1) ◊ Hamilton 50% USD 23 639 630
Bolivia
Nestlé Bolivia S.A. Santa Cruz de la Sierra 100% BOB 191 900
Brazil
ASB-Bebidas e Alimentos Ltda São Paulo 100% BRL 1 000
Chocolates Garoto S.A. Vila Velha-ES 100% BRL 161 450 000
CPW Brasil Ltda 1) Cacapava/São Paulo 50% BRL 7 885 520
Dairy Partners Americas Brasil Ltda 1) São Paulo 50% BRL 27 606 368
Dairy Partners Americas Manufacturing Brasil Ltda 1) São Paulo 50% BRL 39 468 974
Dairy Partners Americas Nordeste – Produtos
Alimentícios Ltda 1) Feira de Santana 50% BRL 100 000
Galderma Brasil Ltda° 1) São Paulo 50% BRL 19 741 602
Innéov Brasil Nutricosmeticos Ltda° 1) Duque de Caxias 50% BRL 20 000
Nestlé Brasil Ltda São Paulo 100% BRL 450 092 396
Nestlé Nordeste Alimentos e Bebidas Ltda Feira de Santana 100% BRL 12 713 641
Nestlé Sul Alimentos e Bebidas Ltda Carazinho 100% BRL 100 000
Nestlé Waters Brasil – Bebidas e Alimentos Ltda São Paulo 100% BRL 87 248 341
Canada
Galderma Canada Inc.° 1) Thornhill (Ontario) 50% CAD 100
Galderma Production Canada Inc.° 1) Baie D’Urfé (Québec) 50% CAD 100
Jenny Craig Weight Loss Centres (Canada) Company Halifax (Nova Scotia) 100% CAD 10 000
Nestlé Canada Inc. Toronto (Ontario) 100% CAD 47 165 540
Nestlé Capital Canada Ltd ◊ Toronto (Ontario) 100% CAD 1 010
Nestlé Globe Inc. Toronto (Ontario) 100% CAD 106 000 100
Vitality Foodservice Canada Inc. Surrey (British Columbia) 100% CAD 5 999 999
Operating and fi nancial companies (continued)
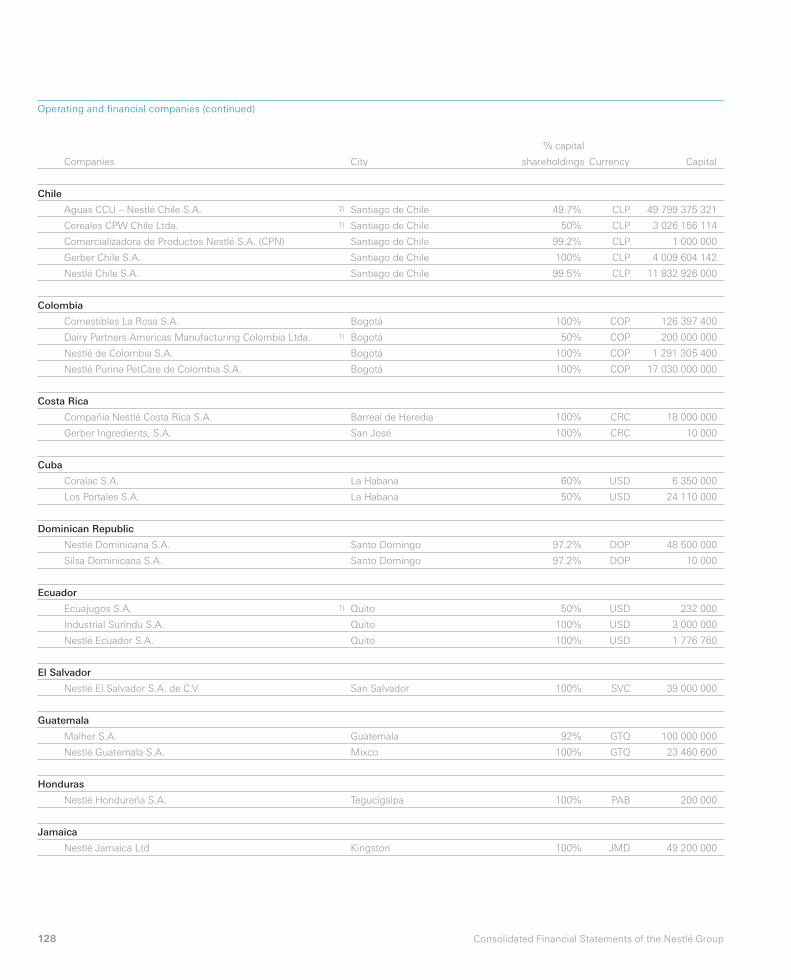
128 Consolidated Financial Statements of the Nestlé Group
Companies
% capital
City shareholdings Currency Capital
Chile
Aguas CCU – Nestlé Chile S.A. 2) Santiago de Chile 49.7% CLP 49 799 375 321
Cereales CPW Chile Ltda. 1) Santiago de Chile 50% CLP 3 026 156 114
Comercializadora de Productos Nestlé S.A. (CPN) Santiago de Chile 99.2% CLP 1 000 000
Gerber Chile S.A. Santiago de Chile 100% CLP 4 009 604 142
Nestlé Chile S.A. Santiago de Chile 99.5% CLP 11 832 926 000
Colombia
Comestibles La Rosa S.A. Bogotá 100% COP 126 397 400
Dairy Partners Americas Manufacturing Colombia Ltda. 1) Bogotá 50% COP 200 000 000
Nestlé de Colombia S.A. Bogotá 100% COP 1 291 305 400
Nestlé Purina PetCare de Colombia S.A. Bogotá 100% COP 17 030 000 000
Costa Rica
Compañía Nestlé Costa Rica S.A. Barreal de Heredia 100% CRC 18 000 000
Gerber Ingredients, S.A. San José 100% CRC 10 000
Cuba
Coralac S.A. La Habana 60% USD 6 350 000
Los Portales S.A. La Habana 50% USD 24 110 000
Dominican Republic
Nestlé Dominicana S.A. Santo Domingo 97.2% DOP 48 500 000
Silsa Dominicana S.A. Santo Domingo 97.2% DOP 10 000
Ecuador
Ecuajugos S.A. 1) Quito 50% USD 232 000
Industrial Surindu S.A. Quito 100% USD 3 000 000
Nestlé Ecuador S.A. Quito 100% USD 1 776 760
El Salvador
Nestlé El Salvador S.A. de C.V. San Salvador 100% SVC 39 000 000
Guatemala
Malher S.A. Guatemala 92% GTQ 100 000 000
Nestlé Guatemala S.A. Mixco 100% GTQ 23 460 600
Honduras
Nestlé Hondureña S.A. Tegucigalpa 100% PAB 200 000
Jamaica
Nestlé Jamaica Ltd Kingston 100% JMD 49 200 000
Operating and fi nancial companies (continued)
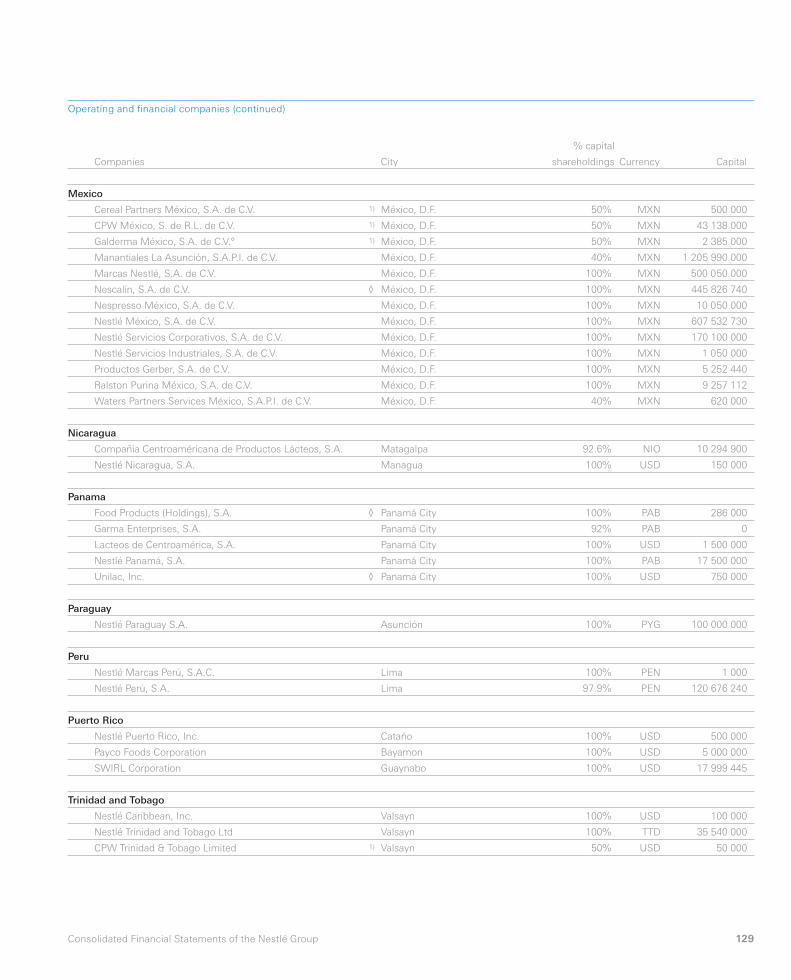
129Consolidated Financial Statements of the Nestlé Group
Companies
% capital
City shareholdings Currency Capital
Mexico
Cereal Partners México, S.A. de C.V. 1) México, D.F. 50% MXN 500 000
CPW México, S. de R.L. de C.V. 1) México, D.F. 50% MXN 43 138 000
Galderma México, S.A. de C.V.° 1) México, D.F. 50% MXN 2 385 000
Manantiales La Asunción, S.A.P.I. de C.V. México, D.F. 40% MXN 1 205 990 000
Marcas Nestlé, S.A. de C.V. México, D.F. 100% MXN 500 050 000
Nescalín, S.A. de C.V. ◊ México, D.F. 100% MXN 445 826 740
Nespresso México, S.A. de C.V. México, D.F. 100% MXN 10 050 000
Nestlé México, S.A. de C.V. México, D.F. 100% MXN 607 532 730
Nestlé Servicios Corporativos, S.A. de C.V. México, D.F. 100% MXN 170 100 000
Nestlé Servicios Industriales, S.A. de C.V. México, D.F. 100% MXN 1 050 000
Productos Gerber, S.A. de C.V. México, D.F. 100% MXN 5 252 440
Ralston Purina México, S.A. de C.V. México, D.F. 100% MXN 9 257 112
Waters Partners Services México, S.A.P.I. de C.V. México, D.F. 40% MXN 620 000
Nicaragua
Compañía Centroaméricana de Productos Lácteos, S.A. Matagalpa 92.6% NIO 10 294 900
Nestlé Nicaragua, S.A. Managua 100% USD 150 000
Panama
Food Products (Holdings), S.A. ◊ Panamá City 100% PAB 286 000
Garma Enterprises, S.A. Panamá City 92% PAB 0
Lacteos de Centroamérica, S.A. Panamá City 100% USD 1 500 000
Nestlé Panamá, S.A. Panamá City 100% PAB 17 500 000
Unilac, Inc. ◊ Panamá City 100% USD 750 000
Paraguay
Nestlé Paraguay S.A. Asunción 100% PYG 100 000 000
Peru
Nestlé Marcas Perú, S.A.C. Lima 100% PEN 1 000
Nestlé Perú, S.A. Lima 97.9% PEN 120 676 240
Puerto Rico
Nestlé Puerto Rico, Inc. Cataño 100% USD 500 000
Payco Foods Corporation Bayamon 100% USD 5 000 000
SWIRL Corporation Guaynabo 100% USD 17 999 445
Trinidad and Tobago
Nestlé Caribbean, Inc. Valsayn 100% USD 100 000
Nestlé Trinidad and Tobago Ltd Valsayn 100% TTD 35 540 000
CPW Trinidad & Tobago Limited 1) Valsayn 50% USD 50 000
Operating and fi nancial companies (continued)
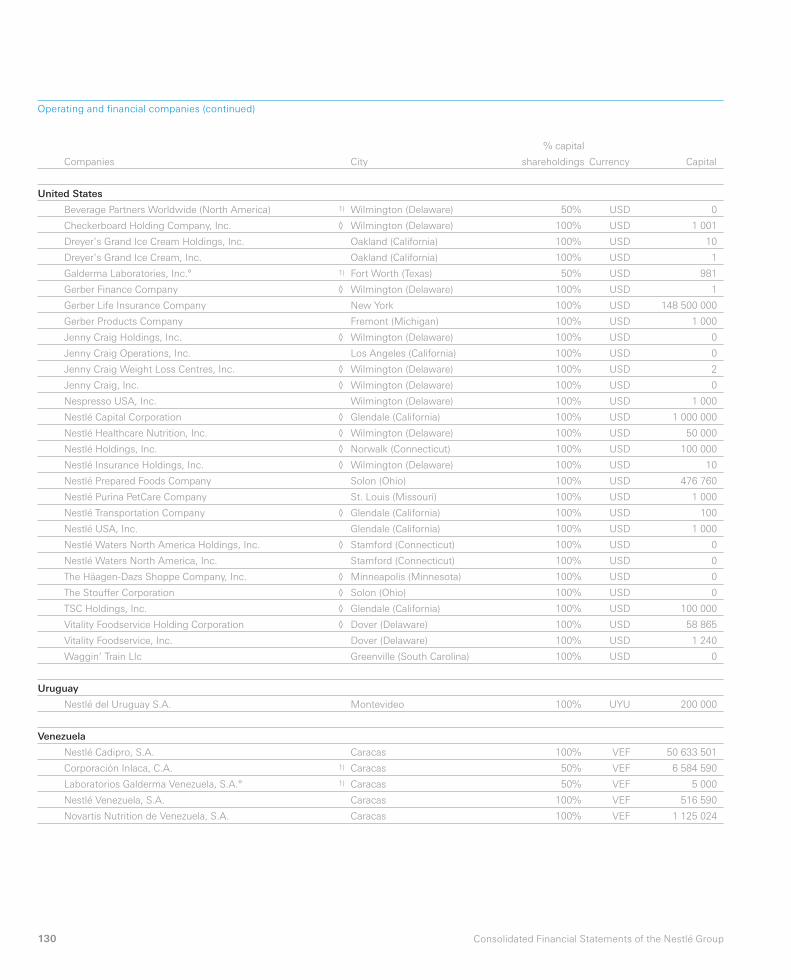
130 Consolidated Financial Statements of the Nestlé Group
Companies
% capital
City shareholdings Currency Capital
United States
Beverage Partners Worldwide (North America) 1) Wilmington (Delaware) 50% USD 0
Checkerboard Holding Company, Inc. ◊ Wilmington (Delaware) 100% USD 1 001
Dreyer’s Grand Ice Cream Holdings, Inc. Oakland (California) 100% USD 10
Dreyer’s Grand Ice Cream, Inc. Oakland (California) 100% USD 1
Galderma Laboratories, Inc.° 1) Fort Worth (Texas) 50% USD 981
Gerber Finance Company ◊ Wilmington (Delaware) 100% USD 1
Gerber Life Insurance Company New York 100% USD 148 500 000
Gerber Products Company Fremont (Michigan) 100% USD 1 000
Jenny Craig Holdings, Inc. ◊ Wilmington (Delaware) 100% USD 0
Jenny Craig Operations, Inc. Los Angeles (California) 100% USD 0
Jenny Craig Weight Loss Centres, Inc. ◊ Wilmington (Delaware) 100% USD 2
Jenny Craig, Inc. ◊ Wilmington (Delaware) 100% USD 0
Nespresso USA, Inc. Wilmington (Delaware) 100% USD 1 000
Nestlé Capital Corporation ◊ Glendale (California) 100% USD 1 000 000
Nestlé Healthcare Nutrition, Inc. ◊ Wilmington (Delaware) 100% USD 50 000
Nestlé Holdings, Inc. ◊ Norwalk (Connecticut) 100% USD 100 000
Nestlé Insurance Holdings, Inc. ◊ Wilmington (Delaware) 100% USD 10
Nestlé Prepared Foods Company Solon (Ohio) 100% USD 476 760
Nestlé Purina PetCare Company St. Louis (Missouri) 100% USD 1 000
Nestlé Transportation Company ◊ Glendale (California) 100% USD 100
Nestlé USA, Inc. Glendale (California) 100% USD 1 000
Nestlé Waters North America Holdings, Inc. ◊ Stamford (Connecticut) 100% USD 0
Nestlé Waters North America, Inc. Stamford (Connecticut) 100% USD 0
The Häagen-Dazs Shoppe Company, Inc. ◊ Minneapolis (Minnesota) 100% USD 0
The Stouffer Corporation ◊ Solon (Ohio) 100% USD 0
TSC Holdings, Inc. ◊ Glendale (California) 100% USD 100 000
Vitality Foodservice Holding Corporation ◊ Dover (Delaware) 100% USD 58 865
Vitality Foodservice, Inc. Dover (Delaware) 100% USD 1 240
Waggin’ Train Llc Greenville (South Carolina) 100% USD 0
Uruguay
Nestlé del Uruguay S.A. Montevideo 100% UYU 200 000
Venezuela
Nestlé Cadipro, S.A. Caracas 100% VEF 50 633 501
Corporación Inlaca, C.A. 1) Caracas 50% VEF 6 584 590
Laboratorios Galderma Venezuela, S.A.° 1) Caracas 50% VEF 5 000
Nestlé Venezuela, S.A. Caracas 100% VEF 516 590
Novartis Nutrition de Venezuela, S.A. Caracas 100% VEF 1 125 024
Operating and fi nancial companies (continued)
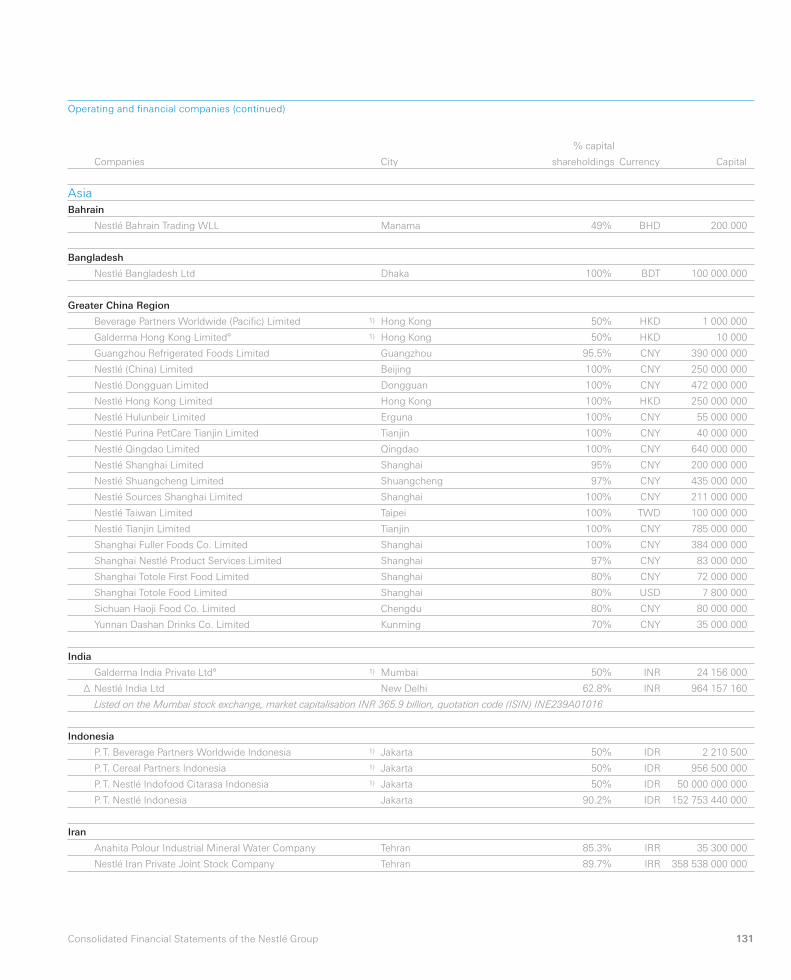
131Consolidated Financial Statements of the Nestlé Group
Companies
% capital
City shareholdings Currency Capital
Asia
Bahrain
Nestlé Bahrain Trading WLL Manama 49% BHD 200 000
Bangladesh
Nestlé Bangladesh Ltd Dhaka 100% BDT 100 000 000
Greater China Region
Beverage Partners Worldwide (Pacifi c) Limited 1) Hong Kong 50% HKD 1 000 000
Galderma Hong Kong Limited° 1) Hong Kong 50% HKD 10 000
Guangzhou Refrigerated Foods Limited Guangzhou 95.5% CNY 390 000 000
Nestlé (China) Limited Beijing 100% CNY 250 000 000
Nestlé Dongguan Limited Dongguan 100% CNY 472 000 000
Nestlé Hong Kong Limited Hong Kong 100% HKD 250 000 000
Nestlé Hulunbeir Limited Erguna 100% CNY 55 000 000
Nestlé Purina PetCare Tianjin Limited Tianjin 100% CNY 40 000 000
Nestlé Qingdao Limited Qingdao 100% CNY 640 000 000
Nestlé Shanghai Limited Shanghai 95% CNY 200 000 000
Nestlé Shuangcheng Limited Shuangcheng 97% CNY 435 000 000
Nestlé Sources Shanghai Limited Shanghai 100% CNY 211 000 000
Nestlé Taiwan Limited Taipei 100% TWD 100 000 000
Nestlé Tianjin Limited Tianjin 100% CNY 785 000 000
Shanghai Fuller Foods Co. Limited Shanghai 100% CNY 384 000 000
Shanghai Nestlé Product Services Limited Shanghai 97% CNY 83 000 000
Shanghai Totole First Food Limited Shanghai 80% CNY 72 000 000
Shanghai Totole Food Limited Shanghai 80% USD 7 800 000
Sichuan Haoji Food Co. Limited Chengdu 80% CNY 80 000 000
Yunnan Dashan Drinks Co. Limited Kunming 70% CNY 35 000 000
India
Galderma India Private Ltd° 1) Mumbai 50% INR 24 156 000
Δ Nestlé India Ltd New Delhi 62.8% INR 964 157 160
Listed on the Mumbai stock exchange, market capitalisation INR 365.9 billion, quotation code (ISIN) INE239A01016
Indonesia
P. T. Beverage Partners Worldwide Indonesia 1) Jakarta 50% IDR 2 210 500
P. T. Cereal Partners Indonesia 1) Jakarta 50% IDR 956 500 000
P. T. Nestlé Indofood Citarasa Indonesia 1) Jakarta 50% IDR 50 000 000 000
P. T. Nestlé Indonesia Jakarta 90.2% IDR 152 753 440 000
Iran
Anahita Polour Industrial Mineral Water Company Tehran 85.3% IRR 35 300 000
Nestlé Iran Private Joint Stock Company Tehran 89.7% IRR 358 538 000 000
Operating and fi nancial companies (continued)
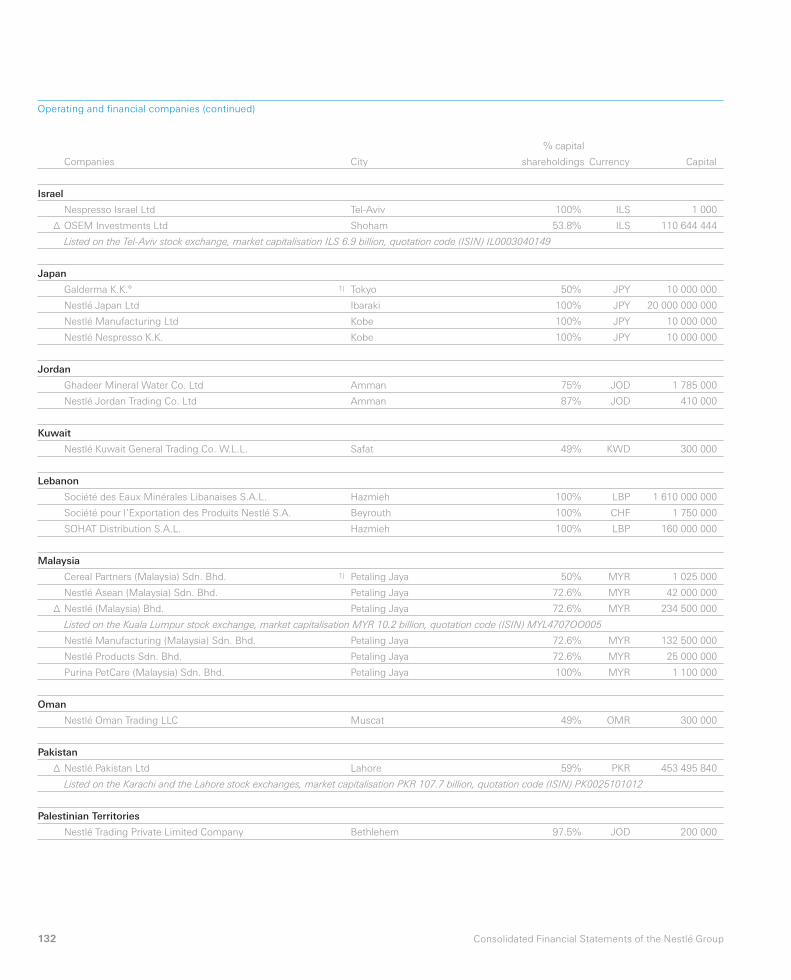
132 Consolidated Financial Statements of the Nestlé Group
Companies
% capital
City shareholdings Currency Capital
Israel
Nespresso Israel Ltd Tel-Aviv 100% ILS 1 000
Δ OSEM Investments Ltd Shoham 53.8% ILS 110 644 444
Listed on the Tel-Aviv stock exchange, market capitalisation ILS 6.9 billion, quotation code (ISIN) IL0003040149
Japan
Galderma K.K.° 1) Tokyo 50% JPY 10 000 000
Nestlé Japan Ltd Ibaraki 100% JPY 20 000 000 000
Nestlé Manufacturing Ltd Kobe 100% JPY 10 000 000
Nestlé Nespresso K.K. Kobe 100% JPY 10 000 000
Jordan
Ghadeer Mineral Water Co. Ltd Amman 75% JOD 1 785 000
Nestlé Jordan Trading Co. Ltd Amman 87% JOD 410 000
Kuwait
Nestlé Kuwait General Trading Co. W.L.L. Safat 49% KWD 300 000
Lebanon
Société des Eaux Minérales Libanaises S.A.L. Hazmieh 100% LBP 1 610 000 000
Société pour l’Exportation des Produits Nestlé S.A. Beyrouth 100% CHF 1 750 000
SOHAT Distribution S.A.L. Hazmieh 100% LBP 160 000 000
Malaysia
Cereal Partners (Malaysia) Sdn. Bhd. 1) Petaling Jaya 50% MYR 1 025 000
Nestlé Asean (Malaysia) Sdn. Bhd. Petaling Jaya 72.6% MYR 42 000 000
Δ Nestlé (Malaysia) Bhd. Petaling Jaya 72.6% MYR 234 500 000
Listed on the Kuala Lumpur stock exchange, market capitalisation MYR 10.2 billion, quotation code (ISIN) MYL4707OO005
Nestlé Manufacturing (Malaysia) Sdn. Bhd. Petaling Jaya 72.6% MYR 132 500 000
Nestlé Products Sdn. Bhd. Petaling Jaya 72.6% MYR 25 000 000
Purina PetCare (Malaysia) Sdn. Bhd. Petaling Jaya 100% MYR 1 100 000
Oman
Nestlé Oman Trading LLC Muscat 49% OMR 300 000
Pakistan
Δ Nestlé Pakistan Ltd Lahore 59% PKR 453 495 840
Listed on the Karachi and the Lahore stock exchanges, market capitalisation PKR 107.7 billion, quotation code (ISIN) PK0025101012
Palestinian Territories
Nestlé Trading Private Limited Company Bethlehem 97.5% JOD 200 000
Operating and fi nancial companies (continued)
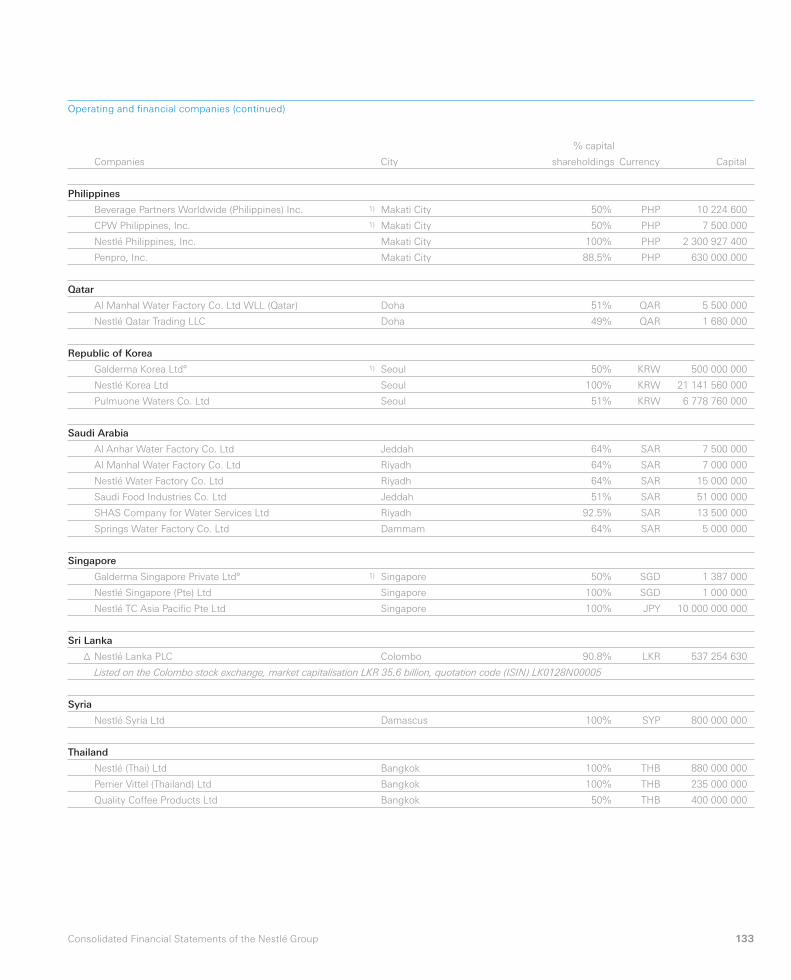
133Consolidated Financial Statements of the Nestlé Group
Companies
% capital
City shareholdings Currency Capital
Philippines
Beverage Partners Worldwide (Philippines) Inc. 1) Makati City 50% PHP 10 224 600
CPW Philippines, Inc. 1) Makati City 50% PHP 7 500 000
Nestlé Philippines, Inc. Makati City 100% PHP 2 300 927 400
Penpro, Inc. Makati City 88.5% PHP 630 000 000
Qatar
Al Manhal Water Factory Co. Ltd WLL (Qatar) Doha 51% QAR 5 500 000
Nestlé Qatar Trading LLC Doha 49% QAR 1 680 000
Republic of Korea
Galderma Korea Ltd° 1) Seoul 50% KRW 500 000 000
Nestlé Korea Ltd Seoul 100% KRW 21 141 560 000
Pulmuone Waters Co. Ltd Seoul 51% KRW 6 778 760 000
Saudi Arabia
Al Anhar Water Factory Co. Ltd Jeddah 64% SAR 7 500 000
Al Manhal Water Factory Co. Ltd Riyadh 64% SAR 7 000 000
Nestlé Water Factory Co. Ltd Riyadh 64% SAR 15 000 000
Saudi Food Industries Co. Ltd Jeddah 51% SAR 51 000 000
SHAS Company for Water Services Ltd Riyadh 92.5% SAR 13 500 000
Springs Water Factory Co. Ltd Dammam 64% SAR 5 000 000
Singapore
Galderma Singapore Private Ltd° 1) Singapore 50% SGD 1 387 000
Nestlé Singapore (Pte) Ltd Singapore 100% SGD 1 000 000
Nestlé TC Asia Pacifi c Pte Ltd Singapore 100% JPY 10 000 000 000
Sri Lanka
Δ Nestlé Lanka PLC Colombo 90.8% LKR 537 254 630
Listed on the Colombo stock exchange, market capitalisation LKR 35.6 billion, quotation code (ISIN) LK0128N00005
Syria
Nestlé Syria Ltd Damascus 100% SYP 800 000 000
Thailand
Nestlé (Thai) Ltd Bangkok 100% THB 880 000 000
Perrier Vittel (Thailand) Ltd Bangkok 100% THB 235 000 000
Quality Coffee Products Ltd Bangkok 50% THB 400 000 000
Operating and fi nancial companies (continued)
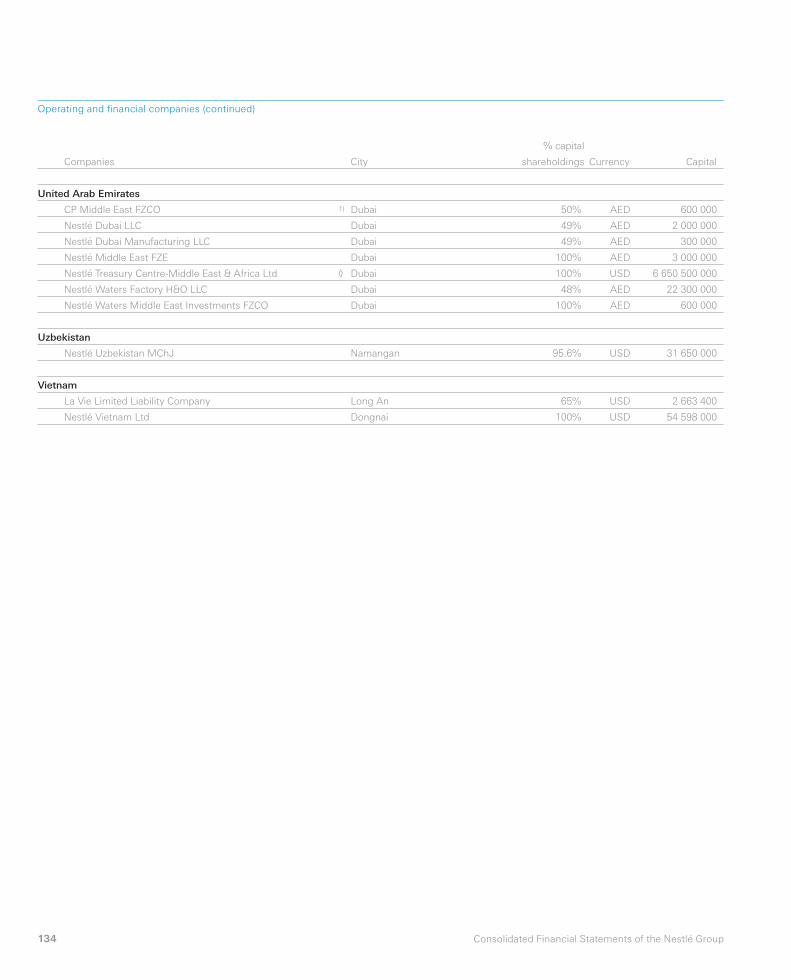
134 Consolidated Financial Statements of the Nestlé Group
Companies
% capital
City shareholdings Currency Capital
United Arab Emirates
CP Middle East FZCO 1) Dubai 50% AED 600 000
Nestlé Dubai LLC Dubai 49% AED 2 000 000
Nestlé Dubai Manufacturing LLC Dubai 49% AED 300 000
Nestlé Middle East FZE Dubai 100% AED 3 000 000
Nestlé Treasury Centre-Middle East & Africa Ltd ◊ Dubai 100% USD 6 650 500 000
Nestlé Waters Factory H&O LLC Dubai 48% AED 22 300 000
Nestlé Waters Middle East Investments FZCO Dubai 100% AED 600 000
Uzbekistan
Nestlé Uzbekistan MChJ Namangan 95.6% USD 31 650 000
Vietnam
La Vie Limited Liability Company Long An 65% USD 2 663 400
Nestlé Vietnam Ltd Dongnai 100% USD 54 598 000
Operating and fi nancial companies (continued)
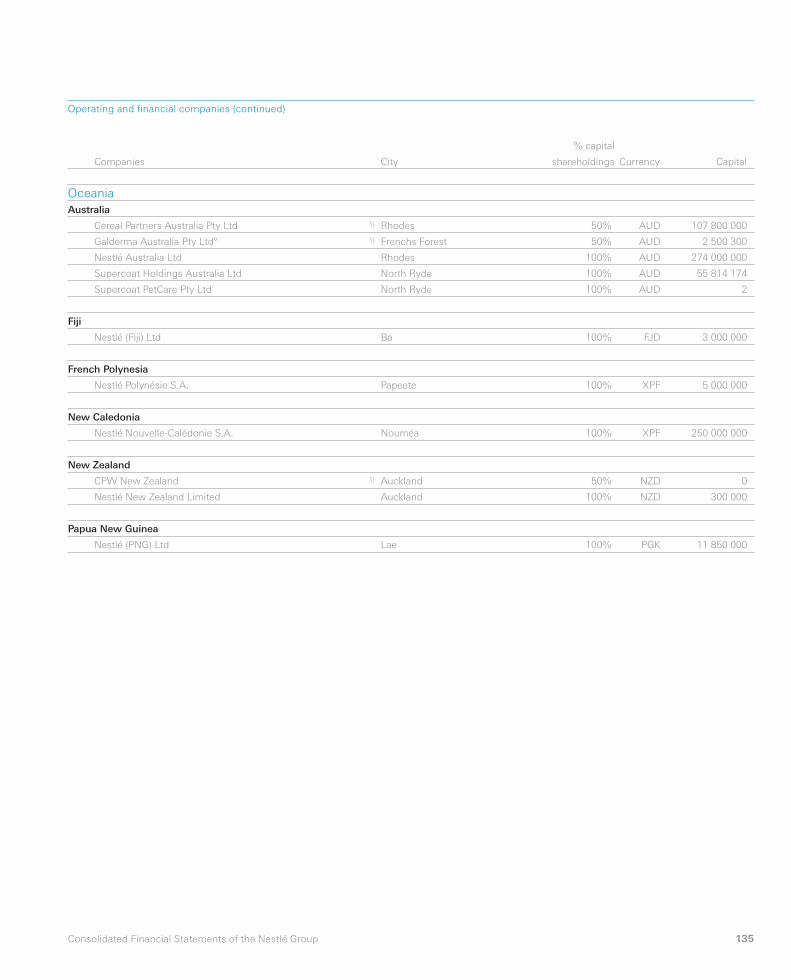
135Consolidated Financial Statements of the Nestlé Group
Companies
% capital
City shareholdings Currency Capital
Oceania
Australia
Cereal Partners Australia Pty Ltd 1) Rhodes 50% AUD 107 800 000
Galderma Australia Pty Ltd° 1) Frenchs Forest 50% AUD 2 500 300
Nestlé Australia Ltd Rhodes 100% AUD 274 000 000
Supercoat Holdings Australia Ltd North Ryde 100% AUD 55 814 174
Supercoat PetCare Pty Ltd North Ryde 100% AUD 2
Fiji
Nestlé (Fiji) Ltd Ba 100% FJD 3 000 000
French Polynesia
Nestlé Polynésie S.A. Papeete 100% XPF 5 000 000
New Caledonia
Nestlé Nouvelle-Calédonie S.A. Nouméa 100% XPF 250 000 000
New Zealand
CPW New Zealand 1) Auckland 50% NZD 0
Nestlé New Zealand Limited Auckland 100% NZD 300 000
Papua New Guinea
Nestlé (PNG) Ltd Lae 100% PGK 11 850 000
Operating and fi nancial companies (continued)
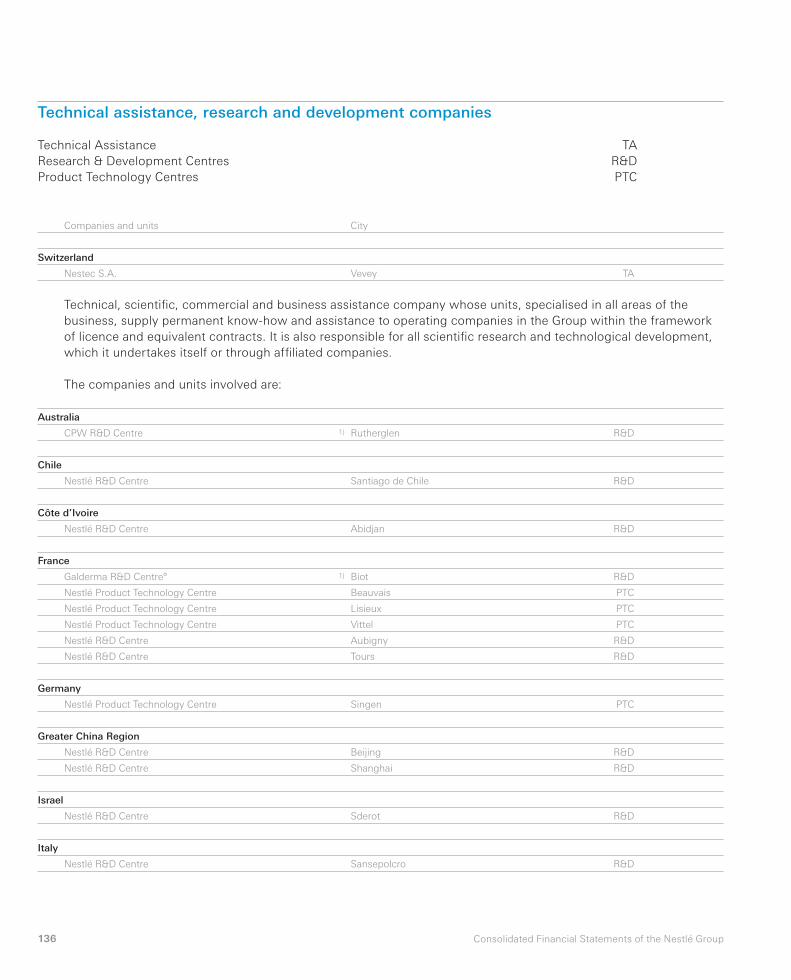
136 Consolidated Financial Statements of the Nestlé Group
Technical assistance, research and development companies
Technical Assistance
Research & Development Centres
Product Technology Centres
TA
R&D
PTC
Companies and units City
Switzerland
Nestec S.A. Vevey TA
Technical, scientifi c, commercial and business assistance company whose units, specialised in all areas of the
business, supply permanent know-how and assistance to operating companies in the Group within the framework
of licence and equivalent contracts. It is also responsible for all scientifi c research and technological development,
which it undertakes itself or through affi liated companies.
The companies and units involved are:
Australia
CPW R&D Centre 1) Rutherglen R&D
Chile
Nestlé R&D Centre Santiago de Chile R&D
Côte d’Ivoire
Nestlé R&D Centre Abidjan R&D
France
Galderma R&D Centre° 1) Biot R&D
Nestlé Product Technology Centre Beauvais PTC
Nestlé Product Technology Centre Lisieux PTC
Nestlé Product Technology Centre Vittel PTC
Nestlé R&D Centre Aubigny R&D
Nestlé R&D Centre Tours R&D
Germany
Nestlé Product Technology Centre Singen PTC
Greater China Region
Nestlé R&D Centre Beijing R&D
Nestlé R&D Centre Shanghai R&D
Israel
Nestlé R&D Centre Sderot R&D
Italy
Nestlé R&D Centre Sansepolcro R&D
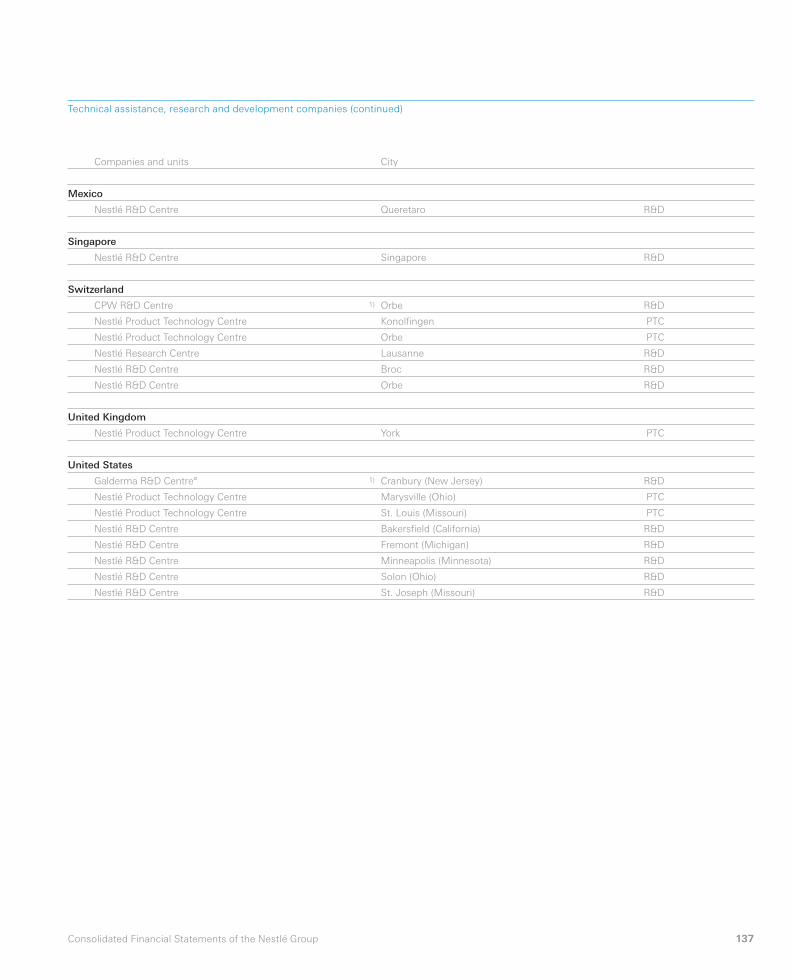
137Consolidated Financial Statements of the Nestlé Group
Companies and units City
Mexico
Nestlé R&D Centre Queretaro R&D
Singapore
Nestlé R&D Centre Singapore R&D
Switzerland
CPW R&D Centre 1) Orbe R&D
Nestlé Product Technology Centre Konolfi ngen PTC
Nestlé Product Technology Centre Orbe PTC
Nestlé Research Centre Lausanne R&D
Nestlé R&D Centre Broc R&D
Nestlé R&D Centre Orbe R&D
United Kingdom
Nestlé Product Technology Centre York PTC
United States
Galderma R&D Centre° 1) Cranbury (New Jersey) R&D
Nestlé Product Technology Centre Marysville (Ohio) PTC
Nestlé Product Technology Centre St. Louis (Missouri) PTC
Nestlé R&D Centre Bakersfi eld (California) R&D
Nestlé R&D Centre Fremont (Michigan) R&D
Nestlé R&D Centre Minneapolis (Minnesota) R&D
Nestlé R&D Centre Solon (Ohio) R&D
Nestlé R&D Centre St. Joseph (Missouri) R&D
Technical assistance, research and development companies (continued)
138 Consolidated Financial Statements of the Nestlé Group

144th Financial Statements of Nestlé S.A.
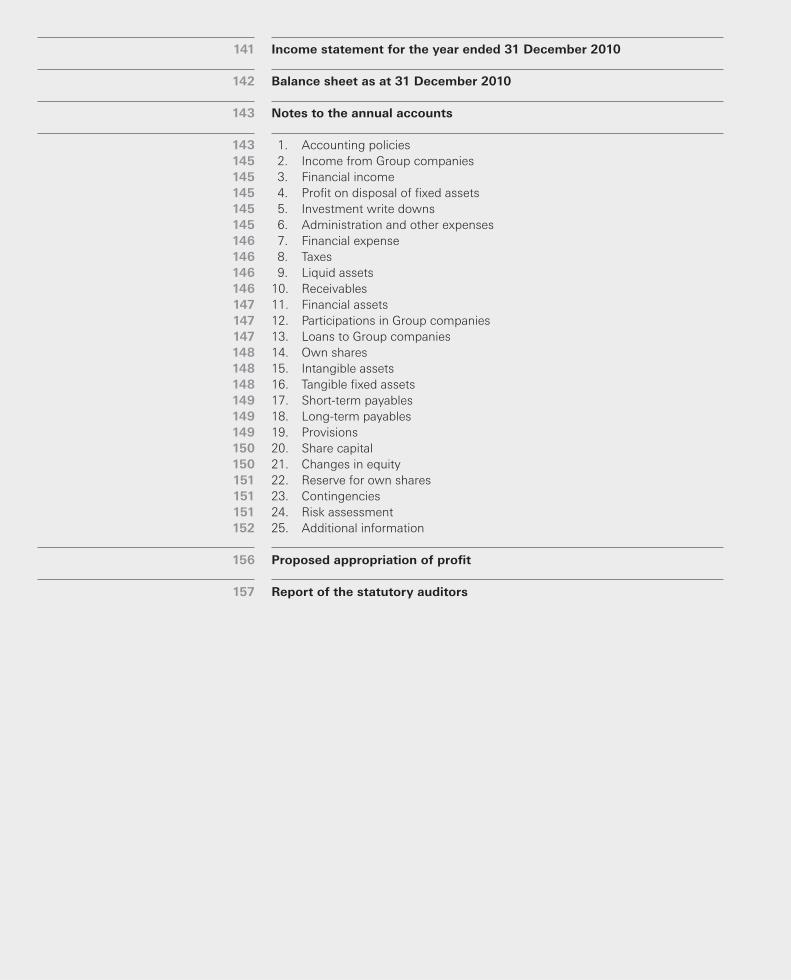
141
142
143
143145145145145145146146146146147147147148148148149149149150150151151151152
156
157
Income statement for the year ended 31 December 2010
Balance sheet as at 31 December 2010
Notes to the annual accounts
1. Accounting policies
2. Income from Group companies
3. Financial income
4. Profi t on disposal of fi xed assets
5. Investment write downs
6. Administration and other expenses
7. Financial expense
8. Taxes
9. Liquid assets
10. Receivables
11. Financial assets
12. Participations in Group companies
13. Loans to Group companies
14. Own shares
15. Intangible assets
16. Tangible fi xed assets
17. Short-term payables
18. Long-term payables
19. Provisions
20. Share capital
21. Changes in equity
22. Reserve for own shares
23. Contingencies
24. Risk assessment
25. Additional information
Proposed appropriation of profi t
Report of the statutory auditors
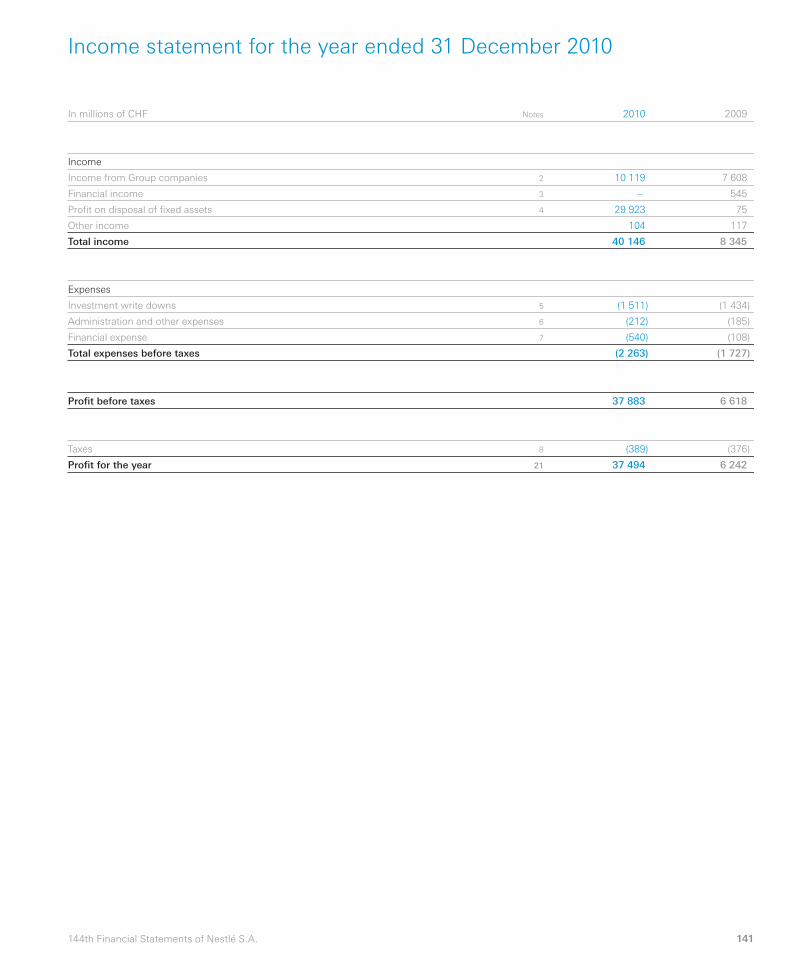
141144th Financial Statements of Nestlé S.A.
Income statement for the year ended 31 December 2010
In millions of CHF Notes 2010 2009
Income
Income from Group companies 2 10 119 7 608
Financial income 3 – 545
Profi t on disposal of fi xed assets 4 29 923 75
Other income 104 117
Total income 40 146 8 345
Expenses
Investment write downs 5 (1 511) (1 434)
Administration and other expenses 6 (212) (185)
Financial expense 7 (540) (108)
Total expenses before taxes (2 263) (1 727)
Profi t before taxes 37 883 6 618
Taxes 8 (389) (376)
Profi t for the year 21 37 494 6 242
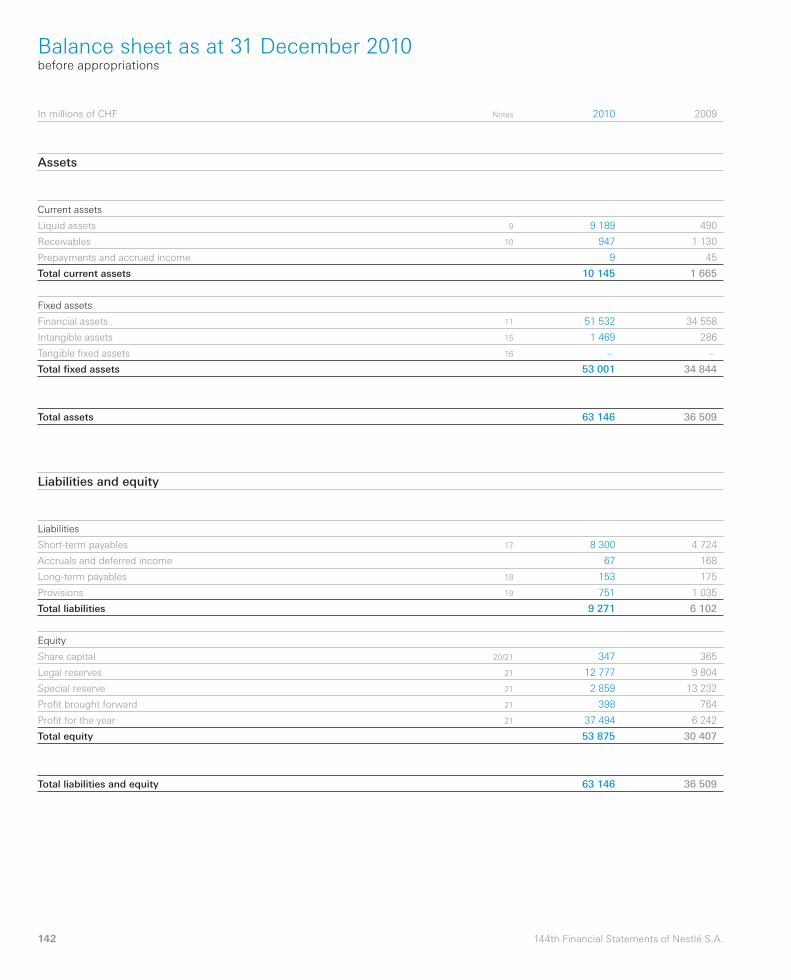
142 144th Financial Statements of Nestlé S.A.
Balance sheet as at 31 December 2010before appropriations
In millions of CHF Notes 2010 2009
Assets
Current assets
Liquid assets 9 9 189 490
Receivables 10 947 1 130
Prepayments and accrued income 9 45
Total current assets 10 145 1 665
Fixed assets
Financial assets 11 51 532 34 558
Intangible assets 15 1 469 286
Tangible fi xed assets 16 – –
Total fi xed assets 53 001 34 844
Total assets 63 146 36 509
Liabilities and equity
Liabilities
Short-term payables 17 8 300 4 724
Accruals and deferred income 67 168
Long-term payables 18 153 175
Provisions 19 751 1 035
Total liabilities 9 271 6 102
Equity
Share capital 20/21 347 365
Legal reserves 21 12 777 9 804
Special reserve 21 2 859 13 232
Profi t brought forward 21 398 764
Profi t for the year 21 37 494 6 242
Total equity 53 875 30 407
Total liabilities and equity 63 146 36 509
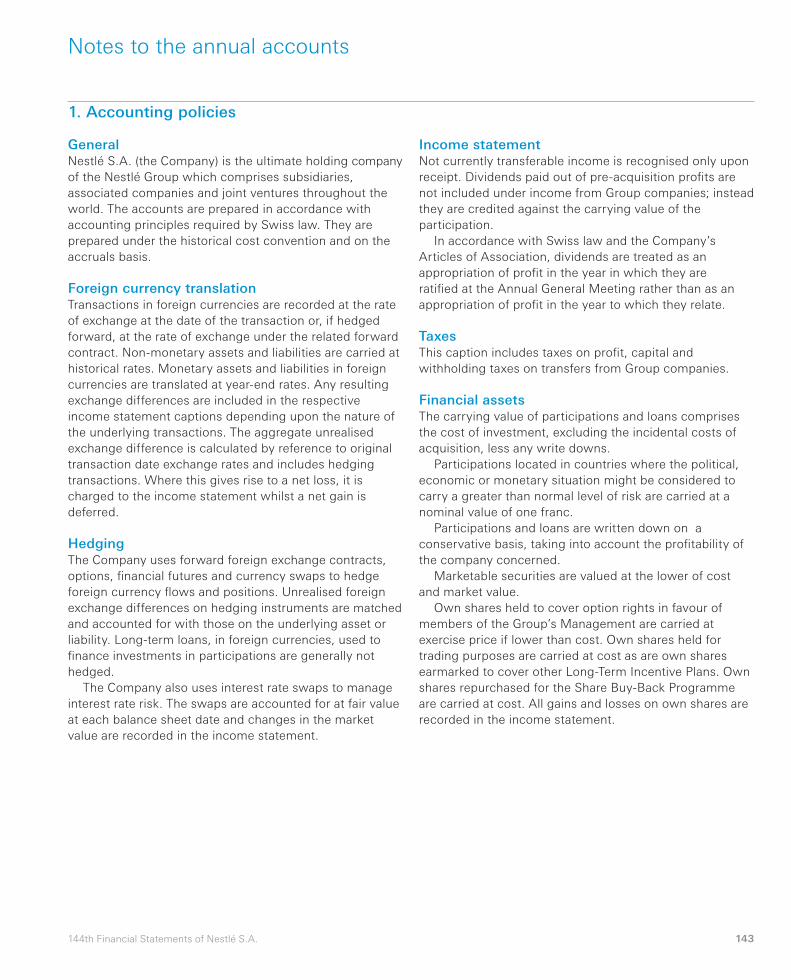
143144th Financial Statements of Nestlé S.A.
Notes to the annual accounts
1. Accounting policies
GeneralNestlé S.A. (the Company) is the ultimate holding company
of the Nestlé Group which comprises subsidiaries,
associated companies and joint ventures throughout the
world. The accounts are prepared in accordance with
accounting principles required by Swiss law. They are
prepared under the historical cost convention and on the
accruals basis.
Foreign currency translationTransactions in foreign currencies are recorded at the rate
of exchange at the date of the transaction or, if hedged
forward, at the rate of exchange under the related forward
contract. Non-monetary assets and liabilities are carried at
historical rates. Monetary assets and liabilities in foreign
currencies are translated at year-end rates. Any resulting
exchange differences are included in the respective
income statement captions depending upon the nature of
the underlying transactions. The aggregate unrealised
exchange difference is calculated by reference to original
transaction date exchange rates and includes hedging
transactions. Where this gives rise to a net loss, it is
charged to the income statement whilst a net gain is
deferred.
HedgingThe Company uses forward foreign exchange contracts,
options, fi nancial futures and currency swaps to hedge
foreign currency fl ows and positions. Unrealised foreign
exchange differences on hedging instruments are matched
and accounted for with those on the underlying asset or
liability. Long-term loans, in foreign currencies, used to
fi nance investments in participations are generally not
hedged.
The Company also uses interest rate swaps to manage
interest rate risk. The swaps are accounted for at fair value
at each balance sheet date and changes in the market
value are recorded in the income statement.
Income statementNot currently transferable income is recognised only upon
receipt. Dividends paid out of pre-acquisition profi ts are
not included under income from Group companies; instead
they are credited against the carrying value of the
participation.
In accordance with Swiss law and the Company’s
Articles of Association, dividends are treated as an
appropriation of profi t in the year in which they are
ratifi ed at the Annual General Meeting rather than as an
appropriation of profi t in the year to which they relate.
TaxesThis caption includes taxes on profi t, capital and
withholding taxes on transfers from Group companies.
Financial assetsThe carrying value of participations and loans comprises
the cost of investment, excluding the incidental costs of
acquisition, less any write downs.
Participations located in countries where the political,
economic or monetary situation might be considered to
carry a greater than normal level of risk are carried at a
nominal value of one franc.
Participations and loans are written down on a
conservative basis, taking into account the profi tability of
the company concerned.
Marketable securities are valued at the lower of cost
and market value.
Own shares held to cover option rights in favour of
members of the Group’s Management are carried at
exercise price if lower than cost. Own shares held for
trading purposes are carried at cost as are own shares
earmarked to cover other Long-Term Incentive Plans. Own
shares repurchased for the Share Buy-Back Programme
are carried at cost. All gains and losses on own shares are
recorded in the income statement.
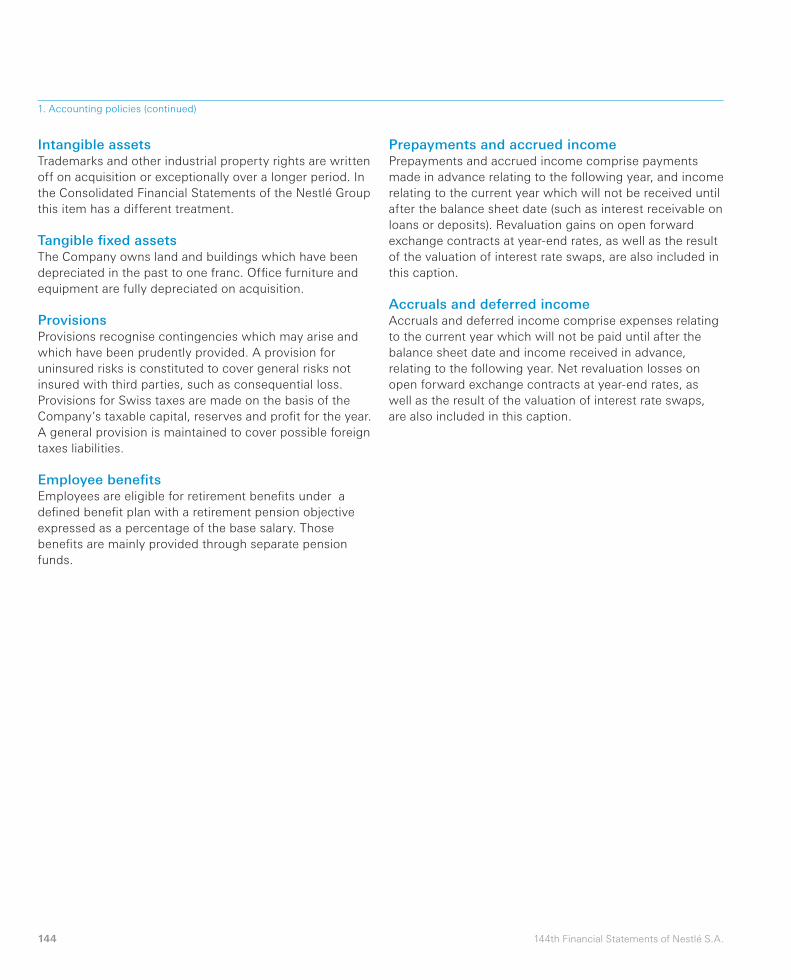
144 144th Financial Statements of Nestlé S.A.
Intangible assetsTrademarks and other industrial property rights are written
off on acquisition or exceptionally over a longer period. In
the Consolidated Financial Statements of the Nestlé Group
this item has a different treatment.
Tangible fi xed assetsThe Company owns land and buildings which have been
depreciated in the past to one franc. Offi ce furniture and
equipment are fully depreciated on acquisition.
ProvisionsProvisions recognise contingencies which may arise and
which have been prudently provided. A provision for
uninsured risks is constituted to cover general risks not
insured with third parties, such as consequential loss.
Provisions for Swiss taxes are made on the basis of the
Company’s taxable capital, reserves and profi t for the year.
A general provision is maintained to cover possible foreign
taxes liabilities.
Employee benefi tsEmployees are eligible for retirement benefi ts under a
defi ned benefi t plan with a retirement pension objective
expressed as a percentage of the base salary. Those
benefi ts are mainly provided through separate pension
funds.
Prepayments and accrued incomePrepayments and accrued income comprise payments
made in advance relating to the following year, and income
relating to the current year which will not be received until
after the balance sheet date (such as interest receivable on
loans or deposits). Revaluation gains on open forward
exchange contracts at year-end rates, as well as the result
of the valuation of interest rate swaps, are also included in
this caption.
Accruals and deferred incomeAccruals and deferred income comprise expenses relating
to the current year which will not be paid until after the
balance sheet date and income received in advance,
relating to the following year. Net revaluation losses on
open forward exchange contracts at year-end rates, as
well as the result of the valuation of interest rate swaps,
are also included in this caption.
1. Accounting policies (continued)
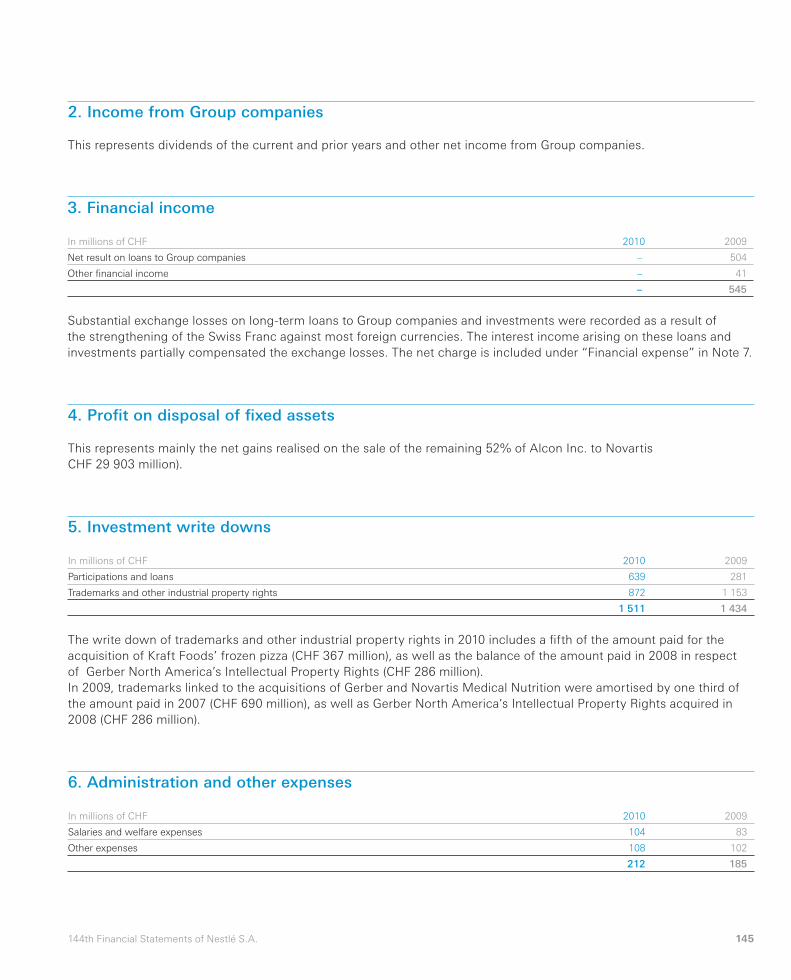
145144th Financial Statements of Nestlé S.A.
2. Income from Group companies
This represents dividends of the current and prior years and other net income from Group companies.
3. Financial income
In millions of CHF 2010 2009
Net result on loans to Group companies – 504
Other fi nancial income – 41
– 545
Substantial exchange losses on long-term loans to Group companies and investments were recorded as a result of
the strengthening of the Swiss Franc against most foreign currencies. The interest income arising on these loans and
investments partially compensated the exchange losses. The net charge is included under “Financial expense” in Note 7.
5. Investment write downs
In millions of CHF 2010 2009
Participations and loans 639 281
Trademarks and other industrial property rights 872 1 153
1 511 1 434
The write down of trademarks and other industrial property rights in 2010 includes a fi fth of the amount paid for the
acquisition of Kraft Foods’ frozen pizza (CHF 367 million), as well as the balance of the amount paid in 2008 in respect
of Gerber North America’s Intellectual Property Rights (CHF 286 million).
In 2009, trademarks linked to the acquisitions of Gerber and Novartis Medical Nutrition were amortised by one third of
the amount paid in 2007 (CHF 690 million), as well as Gerber North America’s Intellectual Property Rights acquired in
2008 (CHF 286 million).
6. Administration and other expenses
In millions of CHF 2010 2009
Salaries and welfare expenses 104 83
Other expenses 108 102
212 185
4. Profi t on disposal of fi xed assets
This represents mainly the net gains realised on the sale of the remaining 52% of Alcon Inc. to Novartis
CHF 29 903 million).
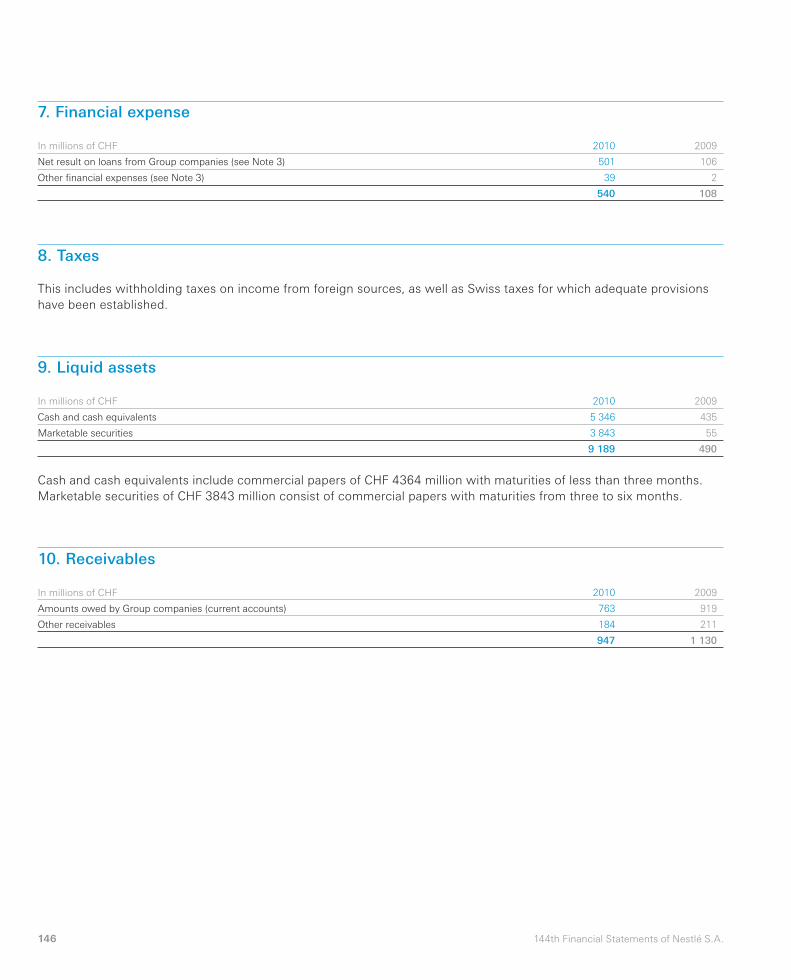
146 144th Financial Statements of Nestlé S.A.
7. Financial expense
In millions of CHF 2010 2009
Net result on loans from Group companies (see Note 3) 501 106
Other fi nancial expenses (see Note 3) 39 2
540 108
9. Liquid assets
In millions of CHF 2010 2009
Cash and cash equivalents 5 346 435
Marketable securities 3 843 55
9 189 490
Cash and cash equivalents include commercial papers of CHF 4364 million with maturities of less than three months.
Marketable securities of CHF 3843 million consist of commercial papers with maturities from three to six months.
10. Receivables
In millions of CHF 2010 2009
Amounts owed by Group companies (current accounts) 763 919
Other receivables 184 211
947 1 130
8. Taxes
This includes withholding taxes on income from foreign sources, as well as Swiss taxes for which adequate provisions
have been established.
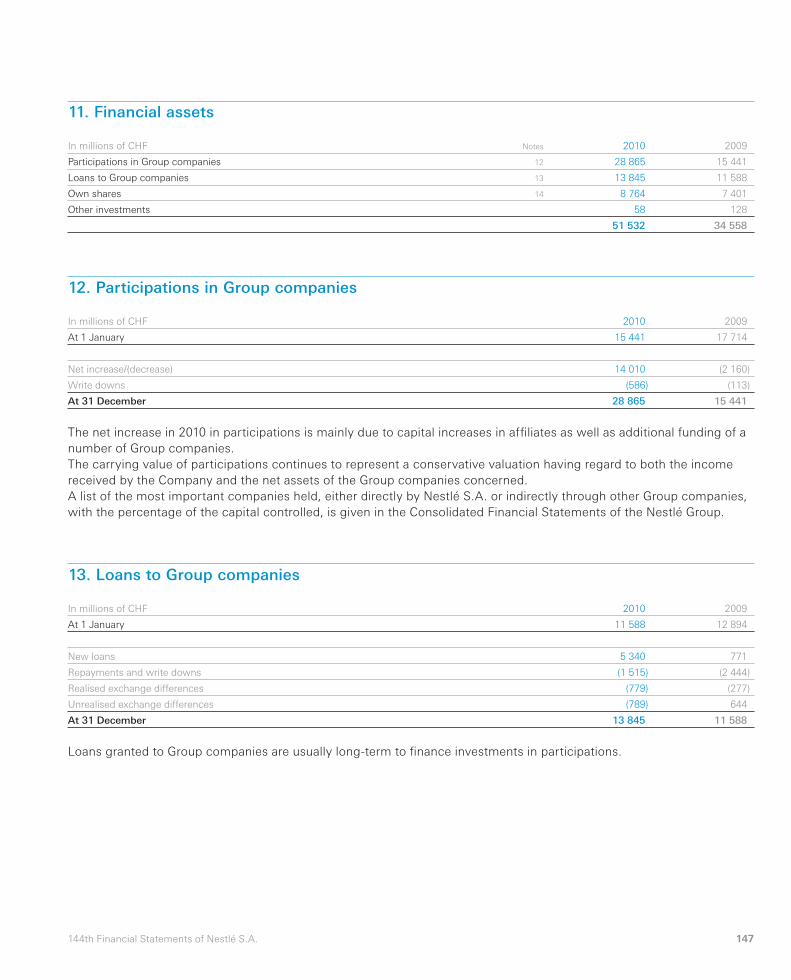
147144th Financial Statements of Nestlé S.A.
11. Financial assets
In millions of CHF Notes 2010 2009
Participations in Group companies 12 28 865 15 441
Loans to Group companies 13 13 845 11 588
Own shares 14 8 764 7 401
Other investments 58 128
51 532 34 558
12. Participations in Group companies
In millions of CHF 2010 2009
At 1 January 15 441 17 714
Net increase/(decrease) 14 010 (2 160)
Write downs (586) (113)
At 31 December 28 865 15 441
The net increase in 2010 in participations is mainly due to capital increases in affi liates as well as additional funding of a
number of Group companies.
The carrying value of participations continues to represent a conservative valuation having regard to both the income
received by the Company and the net assets of the Group companies concerned.
A list of the most important companies held, either directly by Nestlé S.A. or indirectly through other Group companies,
with the percentage of the capital controlled, is given in the Consolidated Financial Statements of the Nestlé Group.
13. Loans to Group companies
In millions of CHF 2010 2009
At 1 January 11 588 12 894
New loans 5 340 771
Repayments and write downs (1 515) (2 444)
Realised exchange differences (779) (277)
Unrealised exchange differences (789) 644
At 31 December 13 845 11 588
Loans granted to Group companies are usually long-term to fi nance investments in participations.
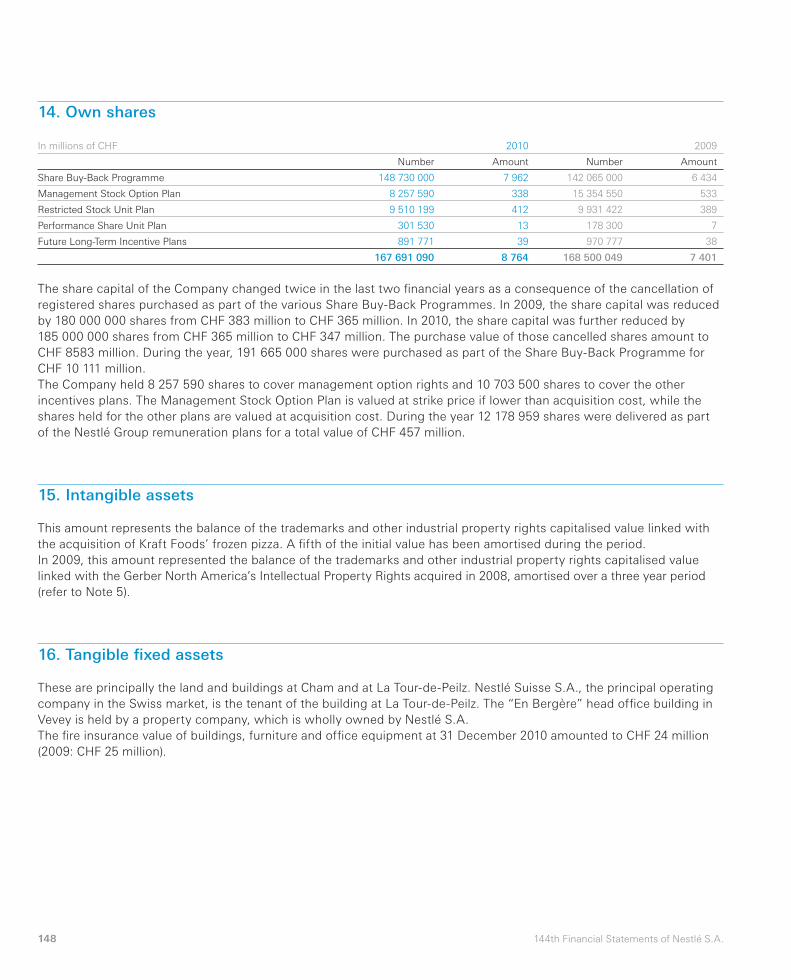
148 144th Financial Statements of Nestlé S.A.
15. Intangible assets
This amount represents the balance of the trademarks and other industrial property rights capitalised value linked with
the acquisition of Kraft Foods’ frozen pizza. A fi fth of the initial value has been amortised during the period.
In 2009, this amount represented the balance of the trademarks and other industrial property rights capitalised value
linked with the Gerber North America’s Intellectual Property Rights acquired in 2008, amortised over a three year period
(refer to Note 5).
16. Tangible fi xed assets
These are principally the land and buildings at Cham and at La Tour-de-Peilz. Nestlé Suisse S.A., the principal operating
company in the Swiss market, is the tenant of the building at La Tour-de-Peilz. The “En Bergère” head offi ce building in
Vevey is held by a property company, which is wholly owned by Nestlé S.A.
The fi re insurance value of buildings, furniture and offi ce equipment at 31 December 2010 amounted to CHF 24 million
(2009: CHF 25 million).
14. Own shares
In millions of CHF 2010 2009
Number Amount Number Amount
Share Buy-Back Programme 148 730 000 7 962 142 065 000 6 434
Management Stock Option Plan 8 257 590 338 15 354 550 533
Restricted Stock Unit Plan 9 510 199 412 9 931 422 389
Performance Share Unit Plan 301 530 13 178 300 7
Future Long-Term Incentive Plans 891 771 39 970 777 38
167 691 090 8 764 168 500 049 7 401
The share capital of the Company changed twice in the last two fi nancial years as a consequence of the cancellation of
registered shares purchased as part of the various Share Buy-Back Programmes. In 2009, the share capital was reduced
by 180 000 000 shares from CHF 383 million to CHF 365 million. In 2010, the share capital was further reduced by
185 000 000 shares from CHF 365 million to CHF 347 million. The purchase value of those cancelled shares amount to
CHF 8583 million. During the year, 191 665 000 shares were purchased as part of the Share Buy-Back Programme for
CHF 10 111 million.
The Company held 8 257 590 shares to cover management option rights and 10 703 500 shares to cover the other
incentives plans. The Management Stock Option Plan is valued at strike price if lower than acquisition cost, while the
shares held for the other plans are valued at acquisition cost. During the year 12 178 959 shares were delivered as part
of the Nestlé Group remuneration plans for a total value of CHF 457 million.
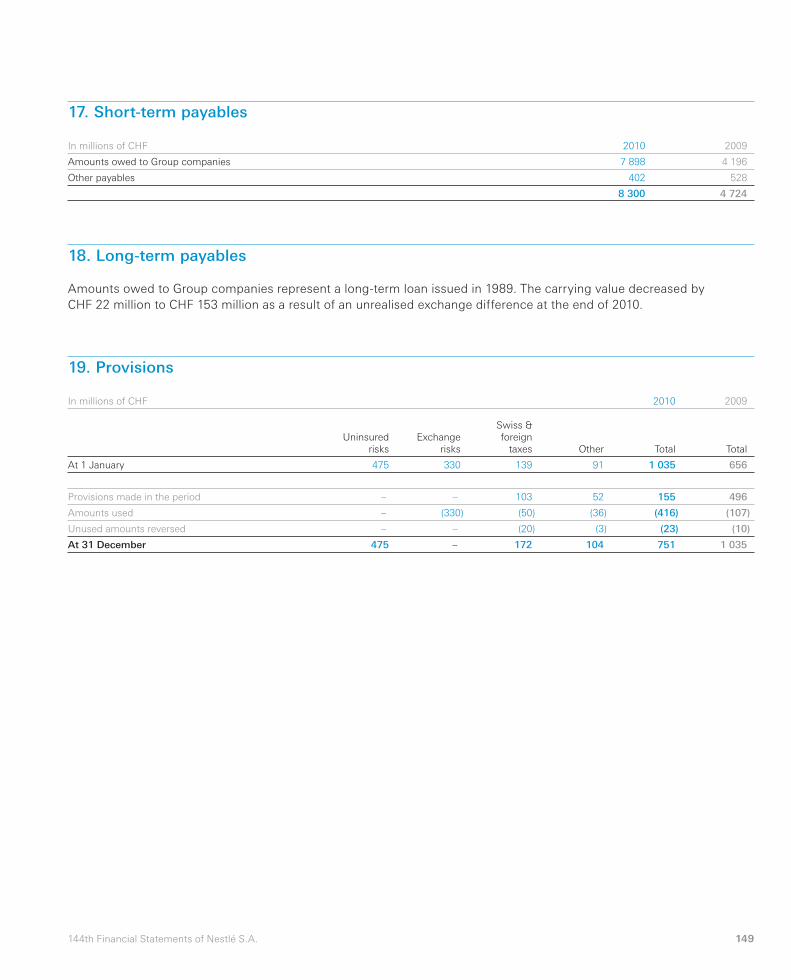
149144th Financial Statements of Nestlé S.A.
19. Provisions
In millions of CHF 2010 2009
Uninsured
risks
Exchange
risks
Swiss &
foreign
taxes Other Total Total
At 1 January 475 330 139 91 1 035 656
Provisions made in the period – – 103 52 155 496
Amounts used – (330) (50) (36) (416) (107)
Unused amounts reversed – – (20) (3) (23) (10)
At 31 December 475 – 172 104 751 1 035
17. Short-term payables
In millions of CHF 2010 2009
Amounts owed to Group companies 7 898 4 196
Other payables 402 528
8 300 4 724
18. Long-term payables
Amounts owed to Group companies represent a long-term loan issued in 1989. The carrying value decreased by
CHF 22 million to CHF 153 million as a result of an unrealised exchange difference at the end of 2010.
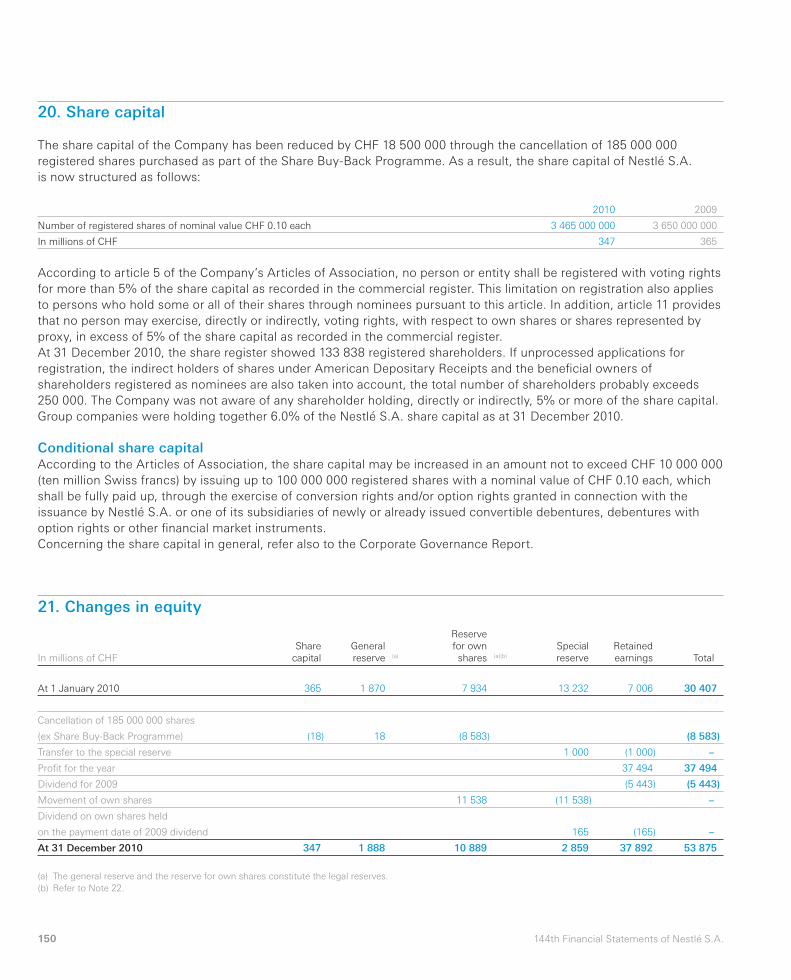
150 144th Financial Statements of Nestlé S.A.
20. Share capital
The share capital of the Company has been reduced by CHF 18 500 000 through the cancellation of 185 000 000
registered shares purchased as part of the Share Buy-Back Programme. As a result, the share capital of Nestlé S.A.
is now structured as follows:
2010 2009
Number of registered shares of nominal value CHF 0.10 each 3 465 000 000 3 650 000 000
In millions of CHF 347 365
According to article 5 of the Company’s Articles of Association, no person or entity shall be registered with voting rights
for more than 5% of the share capital as recorded in the commercial register. This limitation on registration also applies
to persons who hold some or all of their shares through nominees pursuant to this article. In addition, article 11 provides
that no person may exercise, directly or indirectly, voting rights, with respect to own shares or shares represented by
proxy, in excess of 5% of the share capital as recorded in the commercial register.
At 31 December 2010, the share register showed 133 838 registered shareholders. If unprocessed applications for
registration, the indirect holders of shares under American Depositary Receipts and the benefi cial owners of
shareholders registered as nominees are also taken into account, the total number of shareholders probably exceeds
250 000. The Company was not aware of any shareholder holding, directly or indirectly, 5% or more of the share capital.
Group companies were holding together 6.0% of the Nestlé S.A. share capital as at 31 December 2010.
Conditional share capitalAccording to the Articles of Association, the share capital may be increased in an amount not to exceed CHF 10 000 000
(ten million Swiss francs) by issuing up to 100 000 000 registered shares with a nominal value of CHF 0.10 each, which
shall be fully paid up, through the exercise of conversion rights and/or option rights granted in connection with the
issuance by Nestlé S.A. or one of its subsidiaries of newly or already issued convertible debentures, debentures with
option rights or other fi nancial market instruments.
Concerning the share capital in general, refer also to the Corporate Governance Report.
21. Changes in equity
In millions of CHF
Share
capital
General
reserve (a)
Reserve
for own
shares (a)(b)
Special
reserve
Retained
earnings Total
At 1 January 2010 365 1 870 7 934 13 232 7 006 30 407
Cancellation of 185 000 000 shares
(ex Share Buy-Back Programme) (18) 18 (8 583) (8 583)
Transfer to the special reserve 1 000 (1 000) –
Profi t for the year 37 494 37 494
Dividend for 2009 (5 443) (5 443)
Movement of own shares 11 538 (11 538) –
Dividend on own shares held
on the payment date of 2009 dividend 165 (165) –
At 31 December 2010 347 1 888 10 889 2 859 37 892 53 875
(a) The general reserve and the reserve for own shares constitute the legal reserves.
(b) Refer to Note 22.
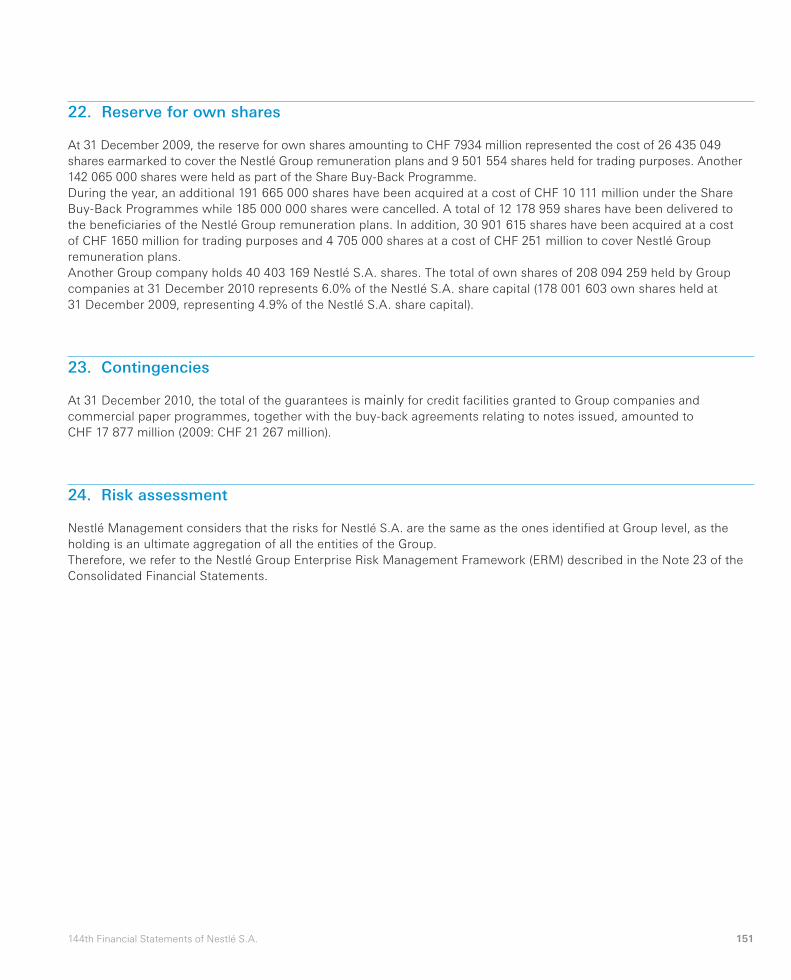
151144th Financial Statements of Nestlé S.A.
22. Reserve for own shares
At 31 December 2009, the reserve for own shares amounting to CHF 7934 million represented the cost of 26 435 049
shares earmarked to cover the Nestlé Group remuneration plans and 9 501 554 shares held for trading purposes. Another
142 065 000 shares were held as part of the Share Buy-Back Programme.
During the year, an additional 191 665 000 shares have been acquired at a cost of CHF 10 111 million under the Share
Buy-Back Programmes while 185 000 000 shares were cancelled. A total of 12 178 959 shares have been delivered to
the benefi ciaries of the Nestlé Group remuneration plans. In addition, 30 901 615 shares have been acquired at a cost
of CHF 1650 million for trading purposes and 4 705 000 shares at a cost of CHF 251 million to cover Nestlé Group
remuneration plans.
Another Group company holds 40 403 169 Nestlé S.A. shares. The total of own shares of 208 094 259 held by Group
companies at 31 December 2010 represents 6.0% of the Nestlé S.A. share capital (178 001 603 own shares held at
31 December 2009, representing 4.9% of the Nestlé S.A. share capital).
23. Contingencies
At 31 December 2010, the total of the guarantees is mainly for credit facilities granted to Group companies and
commercial paper programmes, together with the buy-back agreements relating to notes issued, amounted to
CHF 17 877 million (2009: CHF 21 267 million).
24. Risk assessment
Nestlé Management considers that the risks for Nestlé S.A. are the same as the ones identifi ed at Group level, as the
holding is an ultimate aggregation of all the entities of the Group.
Therefore, we refer to the Nestlé Group Enterprise Risk Management Framework (ERM) described in the Note 23 of the
Consolidated Financial Statements.
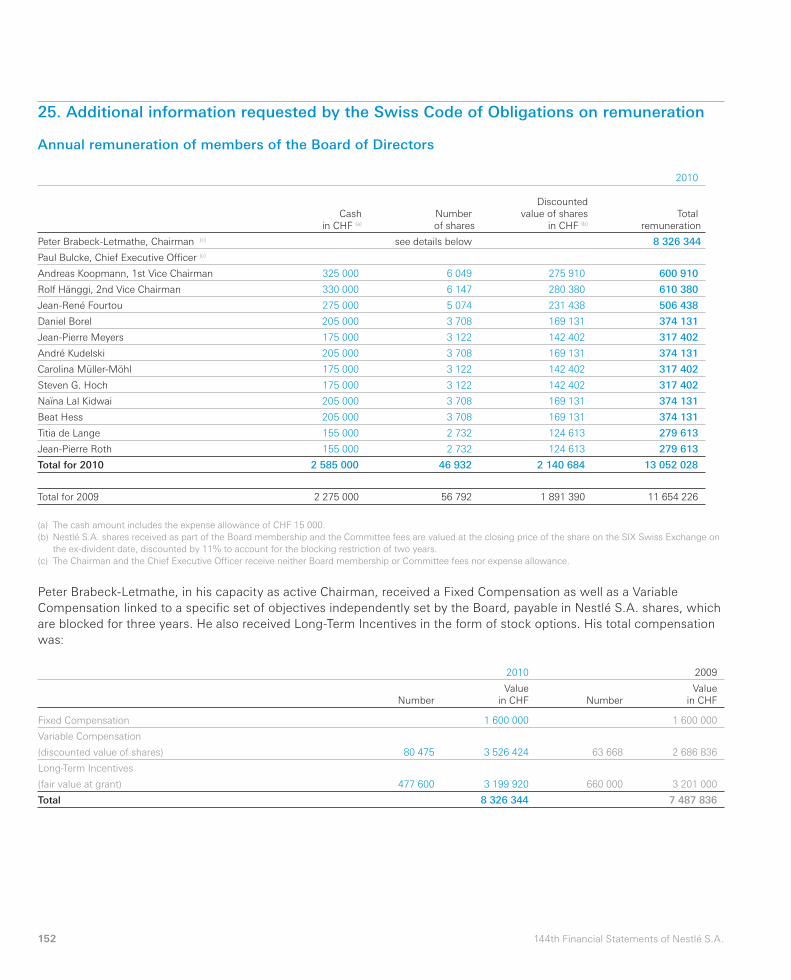
152 144th Financial Statements of Nestlé S.A.
25. Additional information requested by the Swiss Code of Obligations on remuneration
Annual remuneration of members of the Board of Directors
2010
Cash
in CHF (a)
Number
of shares
Discounted
value of shares
in CHF (b)
Total
remuneration
Peter Brabeck-Letmathe, Chairman (c) see details below 8 326 344
Paul Bulcke, Chief Executive Offi cer (c)
Andreas Koopmann, 1st Vice Chairman 325 000 6 049 275 910 600 910
Rolf Hänggi, 2nd Vice Chairman 330 000 6 147 280 380 610 380
Jean-René Fourtou 275 000 5 074 231 438 506 438
Daniel Borel 205 000 3 708 169 131 374 131
Jean-Pierre Meyers 175 000 3 122 142 402 317 402
André Kudelski 205 000 3 708 169 131 374 131
Carolina Müller-Möhl 175 000 3 122 142 402 317 402
Steven G. Hoch 175 000 3 122 142 402 317 402
Naïna Lal Kidwai 205 000 3 708 169 131 374 131
Beat Hess 205 000 3 708 169 131 374 131
Titia de Lange 155 000 2 732 124 613 279 613
Jean-Pierre Roth 155 000 2 732 124 613 279 613
Total for 2010 2 585 000 46 932 2 140 684 13 052 028
Total for 2009 2 275 000 56 792 1 891 390 11 654 226
(a) The cash amount includes the expense allowance of CHF 15 000.
(b) Nestlé S.A. shares received as part of the Board membership and the Committee fees are valued at the closing price of the share on the SIX Swiss Exchange on
the ex-divident date, discounted by 11% to account for the blocking restriction of two years.
(c) The Chairman and the Chief Executive Offi cer receive neither Board membership or Committee fees nor expense allowance.
Peter Brabeck-Letmathe, in his capacity as active Chairman, received a Fixed Compensation as well as a Variable
Compensation linked to a specifi c set of objectives independently set by the Board, payable in Nestlé S.A. shares, which
are blocked for three years. He also received Long-Term Incentives in the form of stock options. His total compensation
was:
2010 2009
Number
Value
in CHF Number
Value
in CHF
Fixed Compensation 1 600 000 1 600 000
Variable Compensation
(discounted value of shares) 80 475 3 526 424 63 668 2 686 836
Long-Term Incentives
(fair value at grant) 477 600 3 199 920 660 000 3 201 000
Total 8 326 344 7 487 836
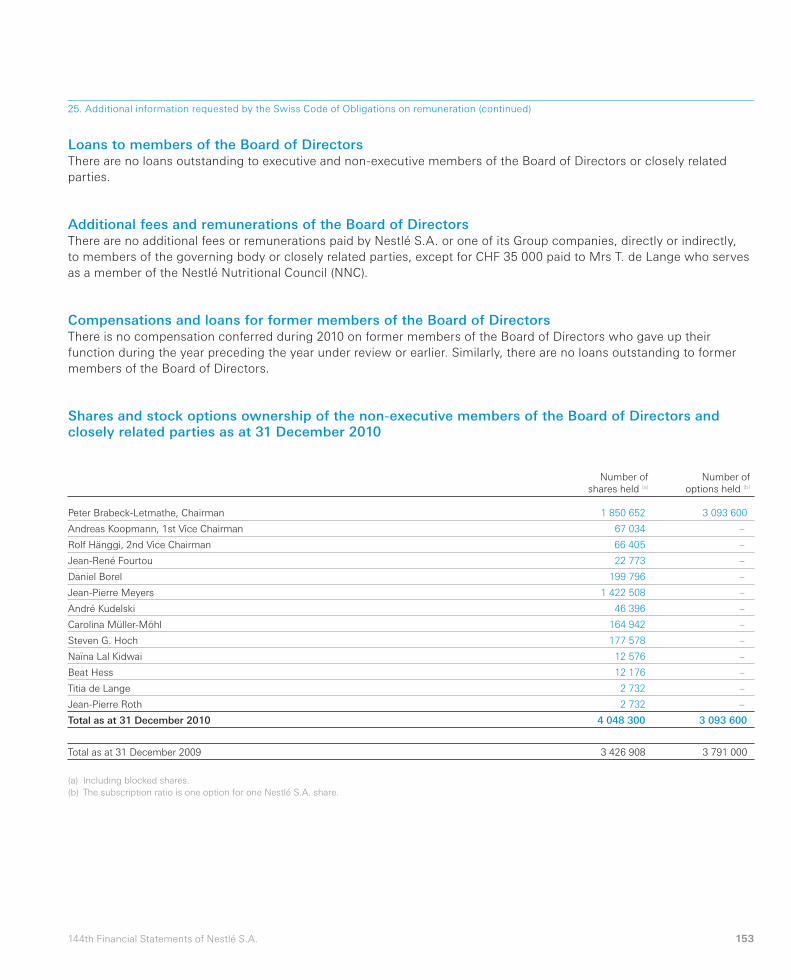
153144th Financial Statements of Nestlé S.A.
25. Additional information requested by the Swiss Code of Obligations on remuneration (continued)
Loans to members of the Board of DirectorsThere are no loans outstanding to executive and non-executive members of the Board of Directors or closely related
parties.
Additional fees and remunerations of the Board of DirectorsThere are no additional fees or remunerations paid by Nestlé S.A. or one of its Group companies, directly or indirectly,
to members of the governing body or closely related parties, except for CHF 35 000 paid to Mrs T. de Lange who serves
as a member of the Nestlé Nutritional Council (NNC).
Compensations and loans for former members of the Board of DirectorsThere is no compensation conferred during 2010 on former members of the Board of Directors who gave up their
function during the year preceding the year under review or earlier. Similarly, there are no loans outstanding to former
members of the Board of Directors.
Shares and stock options ownership of the non-executive members of the Board of Directors and closely related parties as at 31 December 2010
Number of
shares held (a)
Number of
options held (b)
Peter Brabeck-Letmathe, Chairman 1 850 652 3 093 600
Andreas Koopmann, 1st Vice Chairman 67 034 –
Rolf Hänggi, 2nd Vice Chairman 66 405 –
Jean-René Fourtou 22 773 –
Daniel Borel 199 796 –
Jean-Pierre Meyers 1 422 508 –
André Kudelski 46 396 –
Carolina Müller-Möhl 164 942 –
Steven G. Hoch 177 578 –
Naïna Lal Kidwai 12 576 –
Beat Hess 12 176 –
Titia de Lange 2 732 –
Jean-Pierre Roth 2 732 –
Total as at 31 December 2010 4 048 300 3 093 600
Total as at 31 December 2009 3 426 908 3 791 000
(a) Including blocked shares.
(b) The subscription ratio is one option for one Nestlé S.A. share.
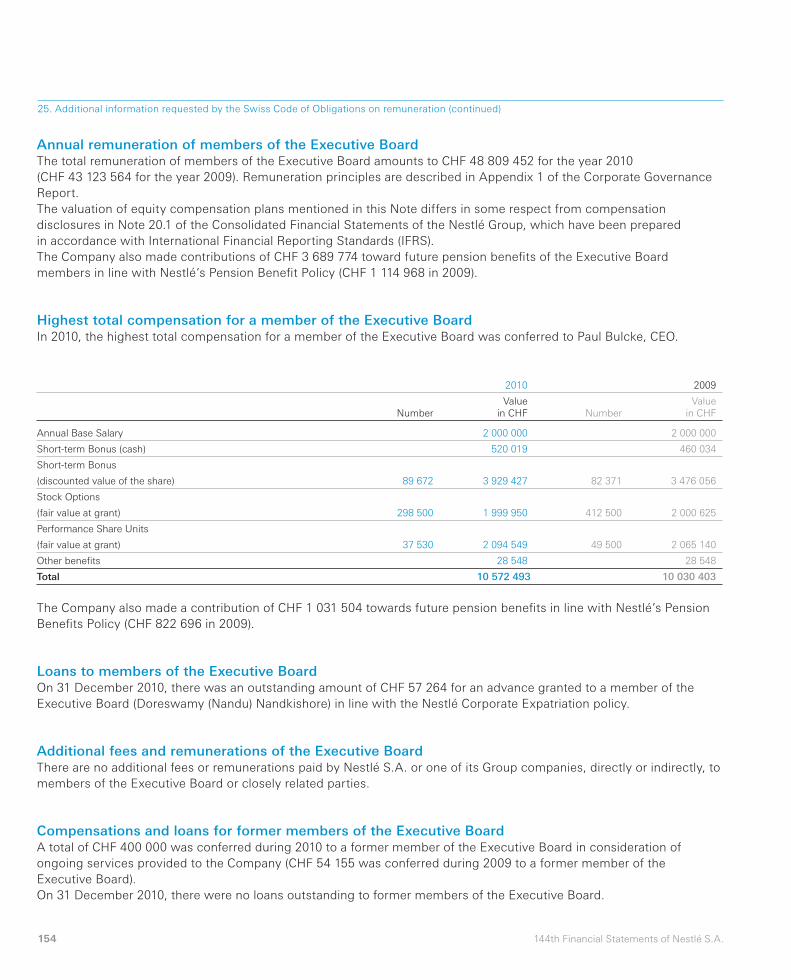
154 144th Financial Statements of Nestlé S.A.
25. Additional information requested by the Swiss Code of Obligations on remuneration (continued)
Annual remuneration of members of the Executive BoardThe total remuneration of members of the Executive Board amounts to CHF 48 809 452 for the year 2010
(CHF 43 123 564 for the year 2009). Remuneration principles are described in Appendix 1 of the Corporate Governance
Report.
The valuation of equity compensation plans mentioned in this Note differs in some respect from compensation
disclosures in Note 20.1 of the Consolidated Financial Statements of the Nestlé Group, which have been prepared
in accordance with International Financial Reporting Standards (IFRS).
The Company also made contributions of CHF 3 689 774 toward future pension benefi ts of the Executive Board
members in line with Nestlé’s Pension Benefi t Policy (CHF 1 114 968 in 2009).
Highest total compensation for a member of the Executive BoardIn 2010, the highest total compensation for a member of the Executive Board was conferred to Paul Bulcke, CEO.
2010 2009
Number
Value
in CHF Number
Value
in CHF
Annual Base Salary 2 000 000 2 000 000
Short-term Bonus (cash) 520 019 460 034
Short-term Bonus
(discounted value of the share) 89 672 3 929 427 82 371 3 476 056
Stock Options
(fair value at grant) 298 500 1 999 950 412 500 2 000 625
Performance Share Units
(fair value at grant) 37 530 2 094 549 49 500 2 065 140
Other benefi ts 28 548 28 548
Total 10 572 493 10 030 403
The Company also made a contribution of CHF 1 031 504 towards future pension benefi ts in line with Nestlé’s Pension
Benefi ts Policy (CHF 822 696 in 2009).
Loans to members of the Executive BoardOn 31 December 2010, there was an outstanding amount of CHF 57 264 for an advance granted to a member of the
Executive Board (Doreswamy (Nandu) Nandkishore) in line with the Nestlé Corporate Expatriation policy.
Additional fees and remunerations of the Executive BoardThere are no additional fees or remunerations paid by Nestlé S.A. or one of its Group companies, directly or indirectly, to
members of the Executive Board or closely related parties.
Compensations and loans for former members of the Executive BoardA total of CHF 400 000 was conferred during 2010 to a former member of the Executive Board in consideration of
ongoing services provided to the Company (CHF 54 155 was conferred during 2009 to a former member of the
Executive Board).
On 31 December 2010, there were no loans outstanding to former members of the Executive Board.
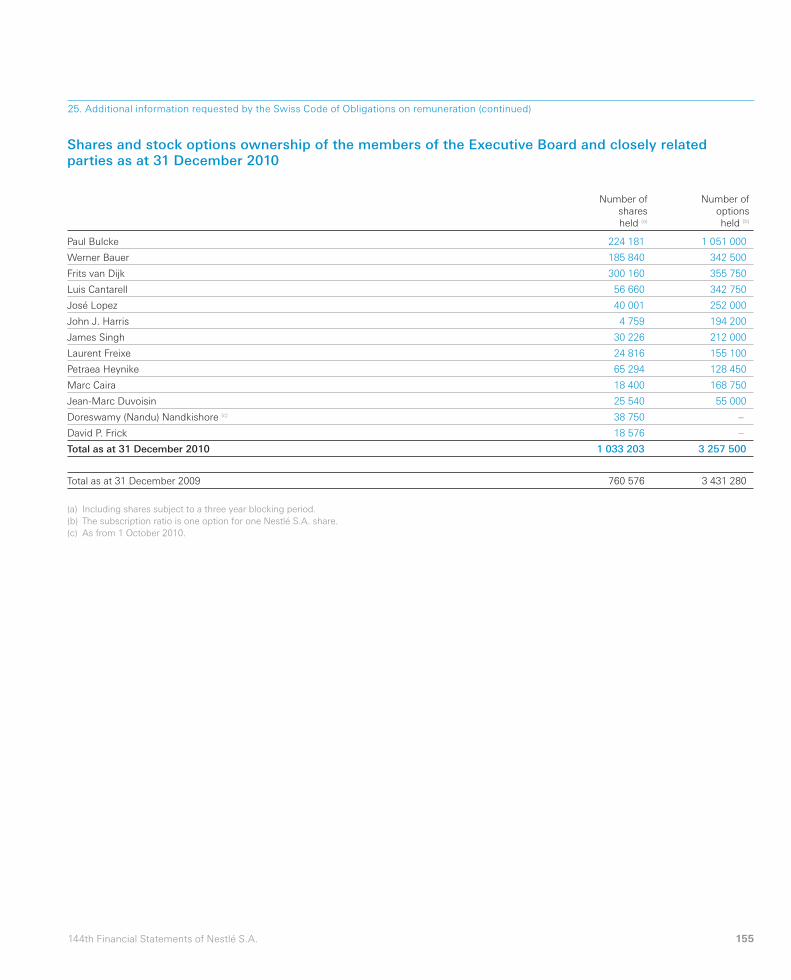
155144th Financial Statements of Nestlé S.A.
25. Additional information requested by the Swiss Code of Obligations on remuneration (continued)
Shares and stock options ownership of the members of the Executive Board and closely related parties as at 31 December 2010
Number of
shares
held (a)
Number of
options
held (b)
Paul Bulcke 224 181 1 051 000
Werner Bauer 185 840 342 500
Frits van Dijk 300 160 355 750
Luis Cantarell 56 660 342 750
José Lopez 40 001 252 000
John J. Harris 4 759 194 200
James Singh 30 226 212 000
Laurent Freixe 24 816 155 100
Petraea Heynike 65 294 128 450
Marc Caira 18 400 168 750
Jean-Marc Duvoisin 25 540 55 000
Doreswamy (Nandu) Nandkishore (c) 38 750 –
David P. Frick 18 576 –
Total as at 31 December 2010 1 033 203 3 257 500
Total as at 31 December 2009 760 576 3 431 280
(a) Including shares subject to a three year blocking period.
(b) The subscription ratio is one option for one Nestlé S.A. share.
(c) As from 1 October 2010.
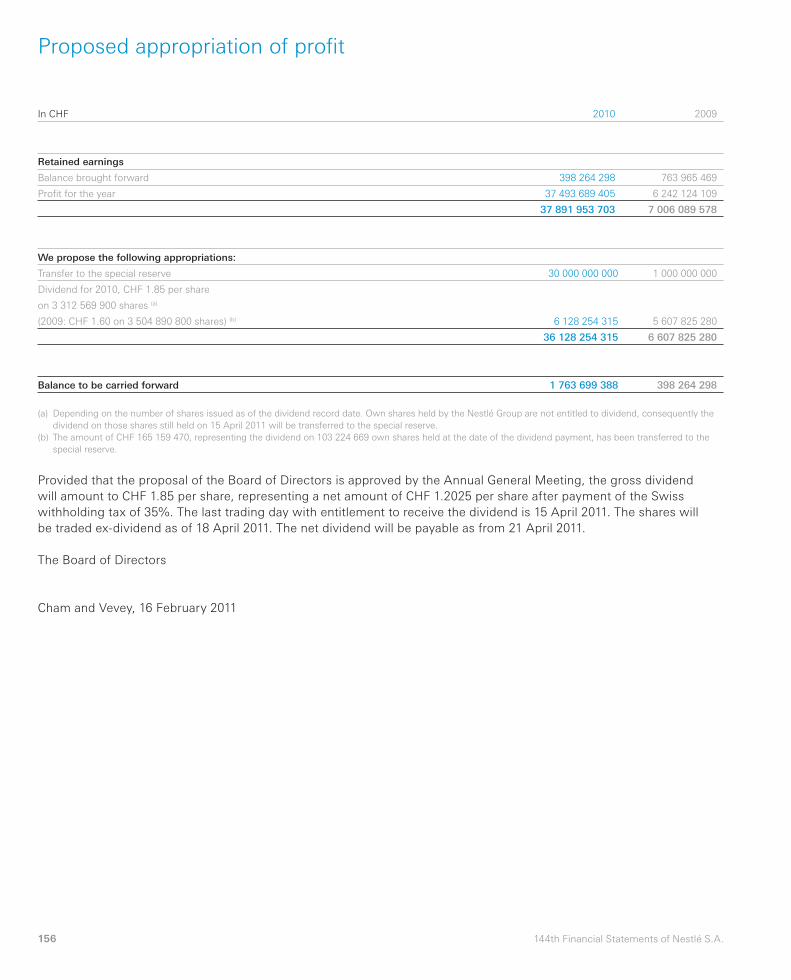
156 144th Financial Statements of Nestlé S.A.
In CHF 2010 2009
Retained earnings
Balance brought forward 398 264 298 763 965 469
Profi t for the year 37 493 689 405 6 242 124 109
37 891 953 703 7 006 089 578
We propose the following appropriations:
Transfer to the special reserve 30 000 000 000 1 000 000 000
Dividend for 2010, CHF 1.85 per share
on 3 312 569 900 shares (a)
(2009: CHF 1.60 on 3 504 890 800 shares) (b) 6 128 254 315 5 607 825 280
36 128 254 315 6 607 825 280
Balance to be carried forward 1 763 699 388 398 264 298
(a) Depending on the number of shares issued as of the dividend record date. Own shares held by the Nestlé Group are not entitled to dividend, consequently the
dividend on those shares still held on 15 April 2011 will be transferred to the special reserve.
(b) The amount of CHF 165 159 470, representing the dividend on 103 224 669 own shares held at the date of the dividend payment, has been transferred to the
special reserve.
Provided that the proposal of the Board of Directors is approved by the Annual General Meeting, the gross dividend
will amount to CHF 1.85 per share, representing a net amount of CHF 1.2025 per share after payment of the Swiss
withholding tax of 35%. The last trading day with entitlement to receive the dividend is 15 April 2011. The shares will
be traded ex-dividend as of 18 April 2011. The net dividend will be payable as from 21 April 2011.
The Board of Directors
Cham and Vevey, 16 February 2011
Proposed appropriation of profi t
157144th Financial Statements of Nestlé S.A.
As statutory auditor, we have audited the fi nancial statements (income statement, balance sheet and notes to the annual
accounts on pages 141 to 156) of Nestlé S.A. for the year ended 31 December 2010.
Board of Directors’ responsibilityThe Board of Directors is responsible for the preparation of the fi nancial statements in accordance with the requirements
of Swiss law and the Company’s Articles of Incorporation. This responsibility includes designing, implementing and
maintaining an internal control system relevant to the preparation of fi nancial statements that are free from material
misstatement, whether due to fraud or error. The Board of Directors is further responsible for selecting and applying
appropriate accounting policies and making accounting estimates that are reasonable in the circumstances.
Auditor’s responsibilityOur responsibility is to express an opinion on these fi nancial statements based on our audit. We conducted our audit in
accordance with Swiss law and Swiss Auditing Standards. Those standards require that we plan and perform the audit
to obtain reasonable assurance whether the fi nancial statements are free from material misstatement.
An audit involves performing procedures to obtain audit evidence about the amounts and disclosures in the fi nancial
statements. The procedures selected depend on the auditor’s judgment, including the assessment of the risks of
material misstatement of the fi nancial statements, whether due to fraud or error. In making those risk assessments, the
auditor considers the internal control system relevant to the entity’s preparation of the fi nancial statements in order to
design audit procedures that are appropriate in the circumstances, but not for the purpose of expressing an opinion on
the effectiveness of the entity’s internal control system. An audit also includes evaluating the appropriateness of the
accounting policies used and the reasonableness of accounting estimates made, as well as evaluating the overall
presentation of the fi nancial statements. We believe that the audit evidence we have obtained is suffi cient and
appropriate to provide a basis for our audit opinion.
OpinionIn our opinion, the fi nancial statements for the year ended 31 December 2010 comply with Swiss law and the Company’s
Articles of Incorporation.
Report on other legal requirementsWe confi rm that we meet the legal requirements on licensing according to the Auditor Oversight Act (AOA) and
independence (article 728 CO and article 11 AOA) and that there are no circumstances incompatible with our
independence.
In accordance with article 728a paragraph 1 item 3 CO and Swiss Auditing Standard 890, we confi rm that an internal
control system exists, which has been designed for the preparation of fi nancial statements according to the instructions
of the Board of Directors.
We further confi rm that the proposed appropriation of available earnings complies with Swiss law and the Company’s
Articles of Incorporation. We recommend that the fi nancial statements submitted to you be approved.
Report of the Statutory auditorto the General Meeting of Nestlé S.A.
Mark Baillache Stéphane Gard
Licensed Audit Expert Licensed Audit Expert
Auditor in Charge
Geneva, 16 February 2011
KPMG S.A.
158 144th Financial Statements of Nestlé S.A.
Notes