Embed Size (px)
Citation preview
INL/EXT-13-28021
2010 Ford Fusion VIN 4757 Hybrid Electric Vehicle Battery Test Results
Tyler Gray
Matthew Shirk
January 2013
The Idaho National Laboratory is a U.S. Department of Energy National Laboratory
Operated by Battelle Energy Alliance
INL/EXT-13-28021
2010 Ford Fusion VIN 4757 Hybrid Electric Vehicle Battery Test Results
Tyler Gray1 Matthew Shirk2
January 2013
Prepared for the U.S. Department of Energy
Assistant Secretary for Energy Efficiency and Renewable Energy Under DOE Idaho Operations Office
Contract DE-AC07-05ID14517
1 ECOtality North America 2 Idaho National Laboratory

DISCLAIMER This information was prepared as an account of work sponsored by an
agency of the U.S. Government. Neither the U.S. Government nor any agency thereof, nor any of their employees, makes any warranty, expressed or implied, or assumes any legal liability or responsibility for the accuracy, completeness, or usefulness, of any information, apparatus, product, or process disclosed, or represents that its use would not infringe privately owned rights. References herein to any specific commercial product, process, or service by trade name, trade mark, manufacturer, or otherwise, does not necessarily constitute or imply its endorsement, recommendation, or favoring by the U.S. Government or any agency thereof. The views and opinions of authors expressed herein do not necessarily state or reflect those of the U.S. Government or any agency thereof.
iii
ABSTRACT
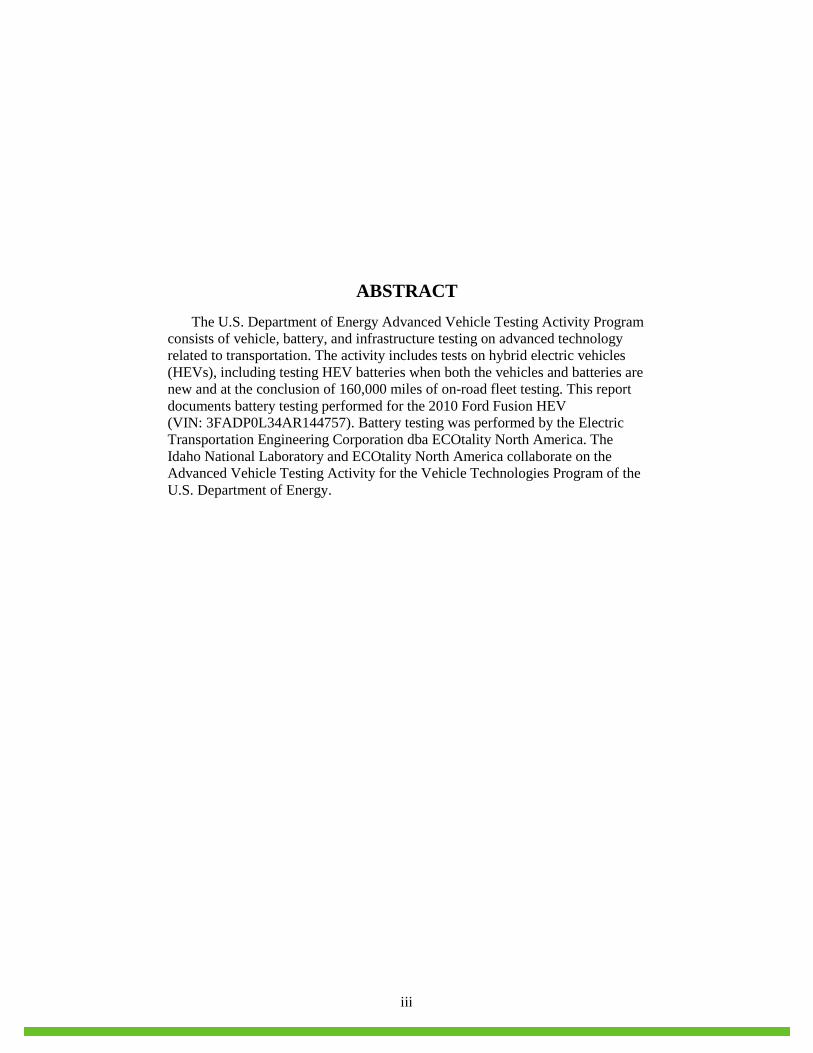
The U.S. Department of Energy Advanced Vehicle Testing Activity Program consists of vehicle, battery, and infrastructure testing on advanced technology related to transportation. The activity includes tests on hybrid electric vehicles (HEVs), including testing HEV batteries when both the vehicles and batteries are new and at the conclusion of 160,000 miles of on-road fleet testing. This report documents battery testing performed for the 2010 Ford Fusion HEV (VIN: 3FADP0L34AR144757). Battery testing was performed by the Electric Transportation Engineering Corporation dba ECOtality North America. The Idaho National Laboratory and ECOtality North America collaborate on the Advanced Vehicle Testing Activity for the Vehicle Technologies Program of the U.S. Department of Energy.
iv
CONTENTS
ABSTRACT ................................................................................................................................................. iii
FIGURES ..................................................................................................................................................... iv
TABLES ....................................................................................................................................................... v
ACRONYMS ............................................................................................................................................... vi
1. TEST RESULTS ................................................................................................................................ 1
1.1 Static Capacity Test Results ..................................................................................................... 1
1.2 Hybrid Pulse Power Characterization Test Results.................................................................. 1
1.3 Acceleration Test Results ......................................................................................................... 6
1.4 Fuel Economy Test Results ...................................................................................................... 8
1.5 Conclusion ............................................................................................................................. 12
Appendix A ................................................................................................................................................. 13
FIGURES
1. Voltage versus energy discharged during the static capacity test ................................................. 2
2. Ten-second charge pulse resistance versus energy discharged ..................................................... 3
3. Ten-second charge pulse power capability versus energy discharged .......................................... 3
4. Ten-second discharge pulse resistance versus energy discharged ................................................ 4
5. Ten-second discharge pulse power capability versus energy discharged ..................................... 4
6. Peak discharge and regenerative power versus energy discharged .............................................. 5
7. Useable energy versus power ....................................................................................................... 6
8. Battery power versus time from acceleration testing .................................................................... 7
9. Battery voltage versus time from acceleration testing .................................................................. 7
10. Battery current versus time from acceleration testing .................................................................. 8
11. Percentage of time at motive power level ..................................................................................... 9
12. Percentage of time at regenerative power level .......................................................................... 10
v
13 .Regenerative energy source comparison ................................................................................... 10
14. Regenerative energy efficiency .................................................................................................. 11
15. Monthly and cumulative fuel economy ...................................................................................... 12
TABLES
1. Static capacity test results ............................................................................................................. 1
2. Hybrid Pulse Power Characterization test results ......................................................................... 2
3. Acceleration test results for beginning-of-test and end-of-test on-track acceleration .................. 6
4. Battery performance results from the Urban Dynamometer Drive Schedule dynamometer drive-cycle testing .................................................................................................. 8
vi
ACRONYMS Ah amp-hour
BOT beginning of test
DOE Department of Energy
EOT end of test
HEV hybrid electric vehicle
HPPC Hybrid Pulse Power Characterization
kW kilowatt
V volt
VDC volt direct current
VIN vehicle identification number
Vpc volt per cell
Wh watt-hour
1
2010 Ford Fusion VIN 4757 Hybrid Battery Test Results
1. TEST RESULTS The U.S. Department of Energy (DOE) Advanced Vehicle Testing Activity Program consists of
vehicle, battery, and infrastructure testing on advanced technology related to transportation. The activity includes tests on hybrid electric vehicles (HEVs), including testing the HEV batteries when both the vehicles and batteries are new (i.e., beginning-of-test or BOT) and at the conclusion of 160,000 miles of on-road fleet testing (i.e., end-of-test or EOT). This report provides test results for BOT and EOT battery testing conducted on a 2010 Ford Fusion HEV, with VIN 4757 (full VIN: 3FADP0L34AR144757), from both laboratory and on-road test configurations. The battery laboratory test results include those from the static capacity test and the Hybrid Pulse Power Characterization (HPPC) Test.3 Vehicle test results include those from acceleration testing and fuel economy testing.4
The battery and vehicle testing was performed by the Electric Transportation Engineering Corporation dba ECOtality North America. The Idaho National Laboratory and ECOtality North America collaborate on the Advanced Vehicle Testing Activity for the Vehicle Technologies Program of DOE.
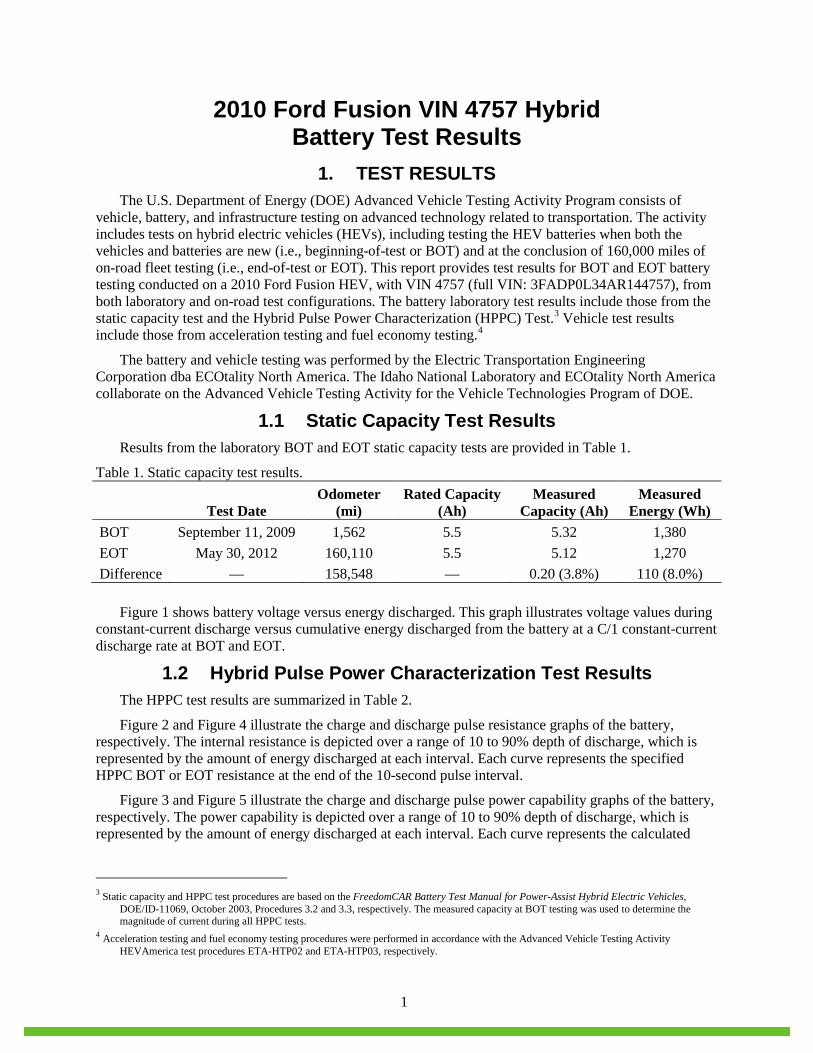
1.1 Static Capacity Test Results Results from the laboratory BOT and EOT static capacity tests are provided in Table 1.
Table 1. Static capacity test results.
Test Date Odometer
(mi) Rated Capacity
(Ah) Measured
Capacity (Ah) Measured
Energy (Wh) BOT September 11, 2009 1,562 5.5 5.32 1,380 EOT May 30, 2012 160,110 5.5 5.12 1,270 Difference — 158,548 — 0.20 (3.8%) 110 (8.0%)
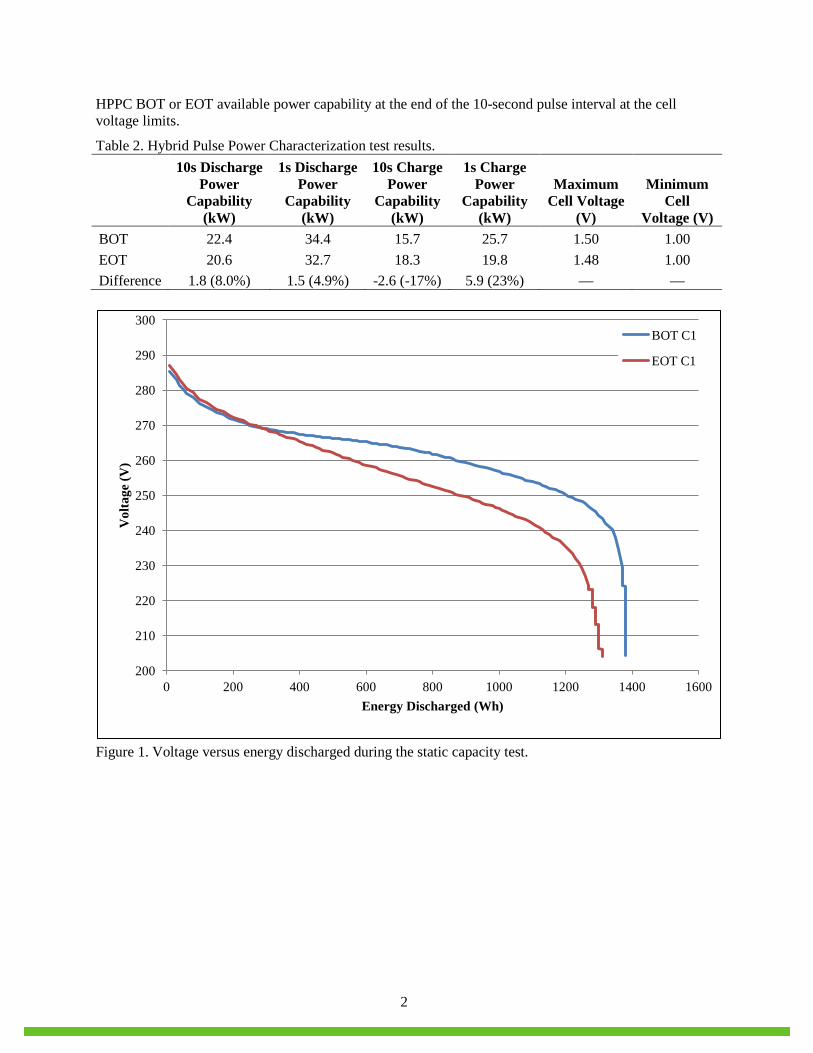
Figure 1 shows battery voltage versus energy discharged. This graph illustrates voltage values during
constant-current discharge versus cumulative energy discharged from the battery at a C/1 constant-current discharge rate at BOT and EOT.
1.2 Hybrid Pulse Power Characterization Test Results The HPPC test results are summarized in Table 2.
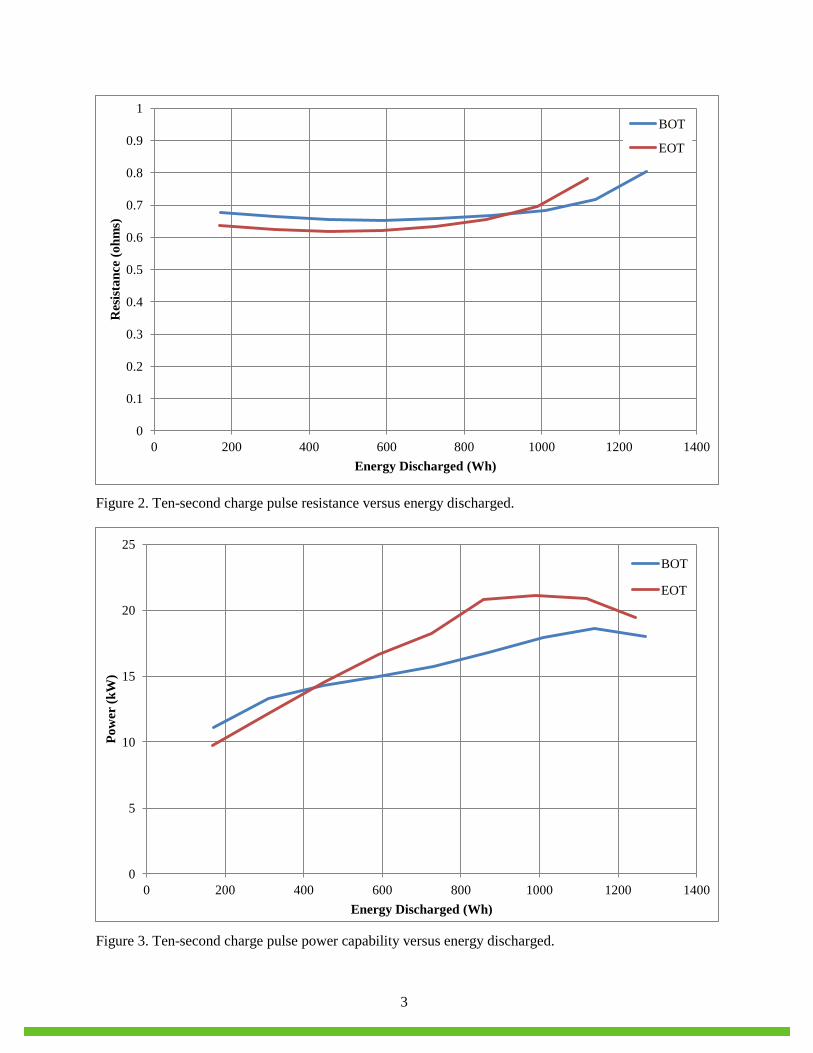
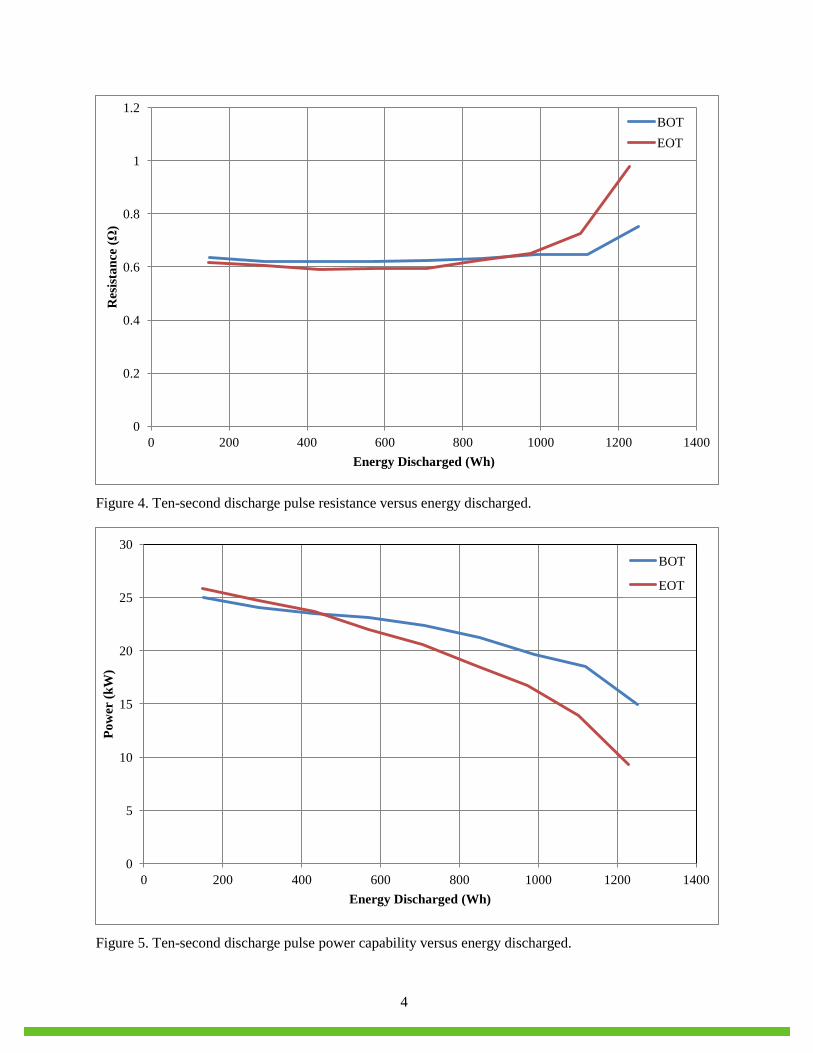
Figure 2 and Figure 4 illustrate the charge and discharge pulse resistance graphs of the battery, respectively. The internal resistance is depicted over a range of 10 to 90% depth of discharge, which is represented by the amount of energy discharged at each interval. Each curve represents the specified HPPC BOT or EOT resistance at the end of the 10-second pulse interval.
Figure 3 and Figure 5 illustrate the charge and discharge pulse power capability graphs of the battery, respectively. The power capability is depicted over a range of 10 to 90% depth of discharge, which is represented by the amount of energy discharged at each interval. Each curve represents the calculated
3 Static capacity and HPPC test procedures are based on the FreedomCAR Battery Test Manual for Power-Assist Hybrid Electric Vehicles,
DOE/ID-11069, October 2003, Procedures 3.2 and 3.3, respectively. The measured capacity at BOT testing was used to determine the magnitude of current during all HPPC tests.
4 Acceleration testing and fuel economy testing procedures were performed in accordance with the Advanced Vehicle Testing Activity HEVAmerica test procedures ETA-HTP02 and ETA-HTP03, respectively.
2
HPPC BOT or EOT available power capability at the end of the 10-second pulse interval at the cell voltage limits.
Table 2. Hybrid Pulse Power Characterization test results.
10s Discharge Power
Capability (kW)
1s Discharge Power
Capability (kW)
10s Charge Power
Capability (kW)
1s Charge Power
Capability (kW)
Maximum Cell Voltage
(V)
Minimum Cell
Voltage (V) BOT 22.4 34.4 15.7 25.7 1.50 1.00 EOT 20.6 32.7 18.3 19.8 1.48 1.00 Difference 1.8 (8.0%) 1.5 (4.9%) -2.6 (-17%) 5.9 (23%) — —
Figure 1. Voltage versus energy discharged during the static capacity test.
200
210
220
230
240
250
260
270
280
290
300
0 200 400 600 800 1000 1200 1400 1600
Vol
tage
(V)
Energy Discharged (Wh)
BOT C1
EOT C1
3
Figure 2. Ten-second charge pulse resistance versus energy discharged.
Figure 3. Ten-second charge pulse power capability versus energy discharged.
0
0.1
0.2
0.3
0.4
0.5
0.6
0.7
0.8
0.9
1
0 200 400 600 800 1000 1200 1400
Res
ista
nce
(ohm
s)
Energy Discharged (Wh)
BOT
EOT
0
5
10
15
20
25
0 200 400 600 800 1000 1200 1400
Pow
er (k
W)
Energy Discharged (Wh)
BOT
EOT
4
Figure 4. Ten-second discharge pulse resistance versus energy discharged.
Figure 5. Ten-second discharge pulse power capability versus energy discharged.
0
0.2
0.4
0.6
0.8
1
1.2
0 200 400 600 800 1000 1200 1400
Res
ista
nce
(Ω)
Energy Discharged (Wh)
BOT EOT
0
5
10
15
20
25
30
0 200 400 600 800 1000 1200 1400
Pow
er (k
W)
Energy Discharged (Wh)
BOT
EOT
5
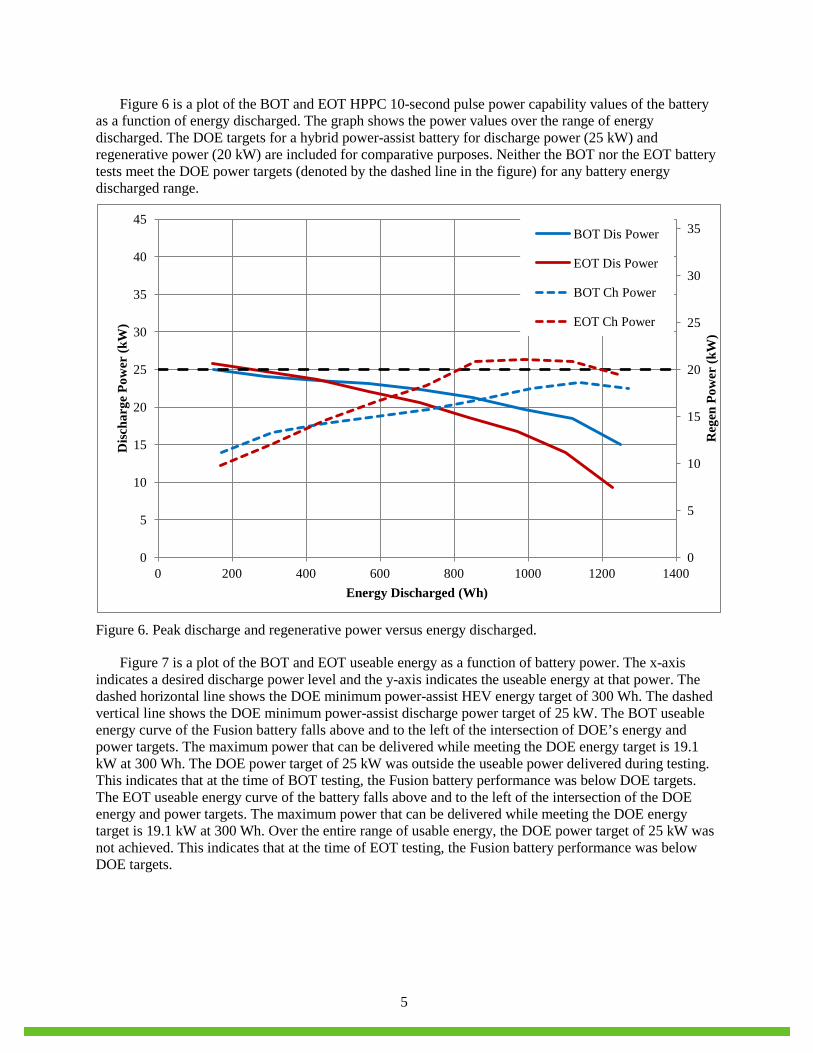
Figure 6 is a plot of the BOT and EOT HPPC 10-second pulse power capability values of the battery as a function of energy discharged. The graph shows the power values over the range of energy discharged. The DOE targets for a hybrid power-assist battery for discharge power (25 kW) and regenerative power (20 kW) are included for comparative purposes. Neither the BOT nor the EOT battery tests meet the DOE power targets (denoted by the dashed line in the figure) for any battery energy discharged range.
Figure 6. Peak discharge and regenerative power versus energy discharged.
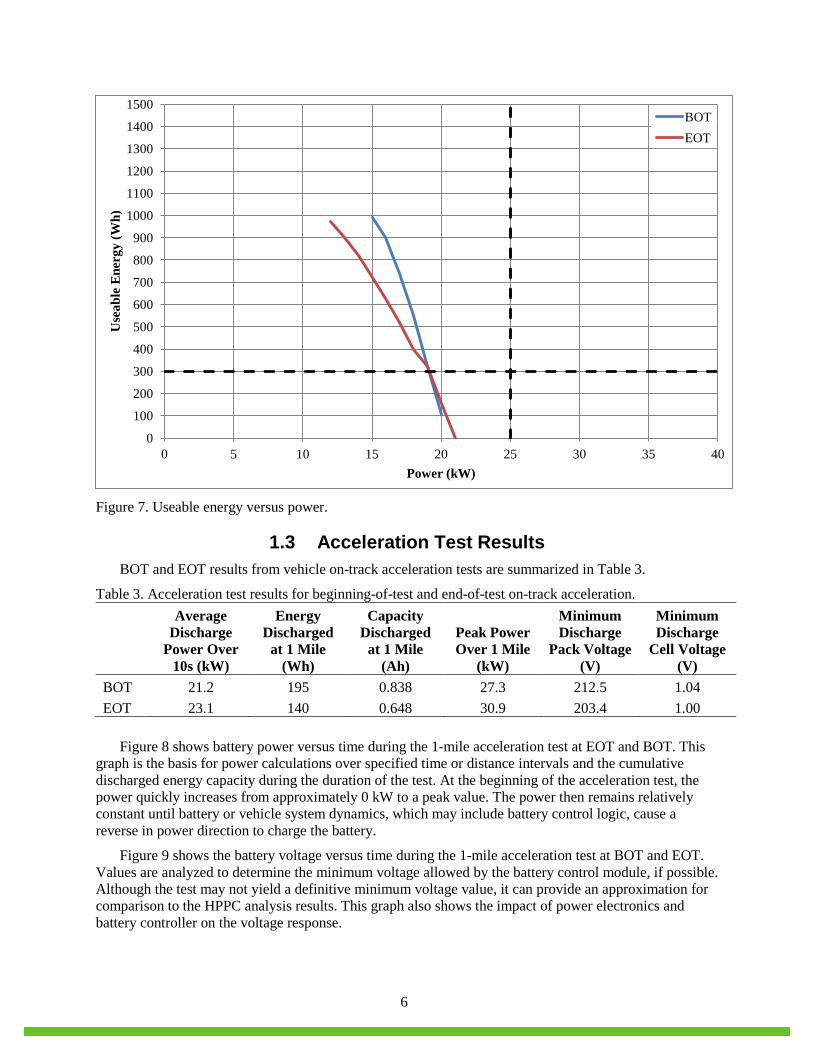
Figure 7 is a plot of the BOT and EOT useable energy as a function of battery power. The x-axis indicates a desired discharge power level and the y-axis indicates the useable energy at that power. The dashed horizontal line shows the DOE minimum power-assist HEV energy target of 300 Wh. The dashed vertical line shows the DOE minimum power-assist discharge power target of 25 kW. The BOT useable energy curve of the Fusion battery falls above and to the left of the intersection of DOE’s energy and power targets. The maximum power that can be delivered while meeting the DOE energy target is 19.1 kW at 300 Wh. The DOE power target of 25 kW was outside the useable power delivered during testing. This indicates that at the time of BOT testing, the Fusion battery performance was below DOE targets. The EOT useable energy curve of the battery falls above and to the left of the intersection of the DOE energy and power targets. The maximum power that can be delivered while meeting the DOE energy target is 19.1 kW at 300 Wh. Over the entire range of usable energy, the DOE power target of 25 kW was not achieved. This indicates that at the time of EOT testing, the Fusion battery performance was below DOE targets.
0
5
10
15
20
25
30
35
0
5
10
15
20
25
30
35
40
45
0 200 400 600 800 1000 1200 1400
Reg
en P
ower
(kW
)
Disc
harg
e Po
wer
(kW
)
Energy Discharged (Wh)
BOT Dis Power
EOT Dis Power
BOT Ch Power
EOT Ch Power
6
Figure 7. Useable energy versus power.
1.3 Acceleration Test Results BOT and EOT results from vehicle on-track acceleration tests are summarized in Table 3.
Table 3. Acceleration test results for beginning-of-test and end-of-test on-track acceleration.
Average Discharge
Power Over 10s (kW)
Energy Discharged
at 1 Mile (Wh)
Capacity Discharged
at 1 Mile (Ah)
Peak Power Over 1 Mile
(kW)
Minimum Discharge
Pack Voltage (V)
Minimum Discharge
Cell Voltage (V)
BOT 21.2 195 0.838 27.3 212.5 1.04 EOT 23.1 140 0.648 30.9 203.4 1.00
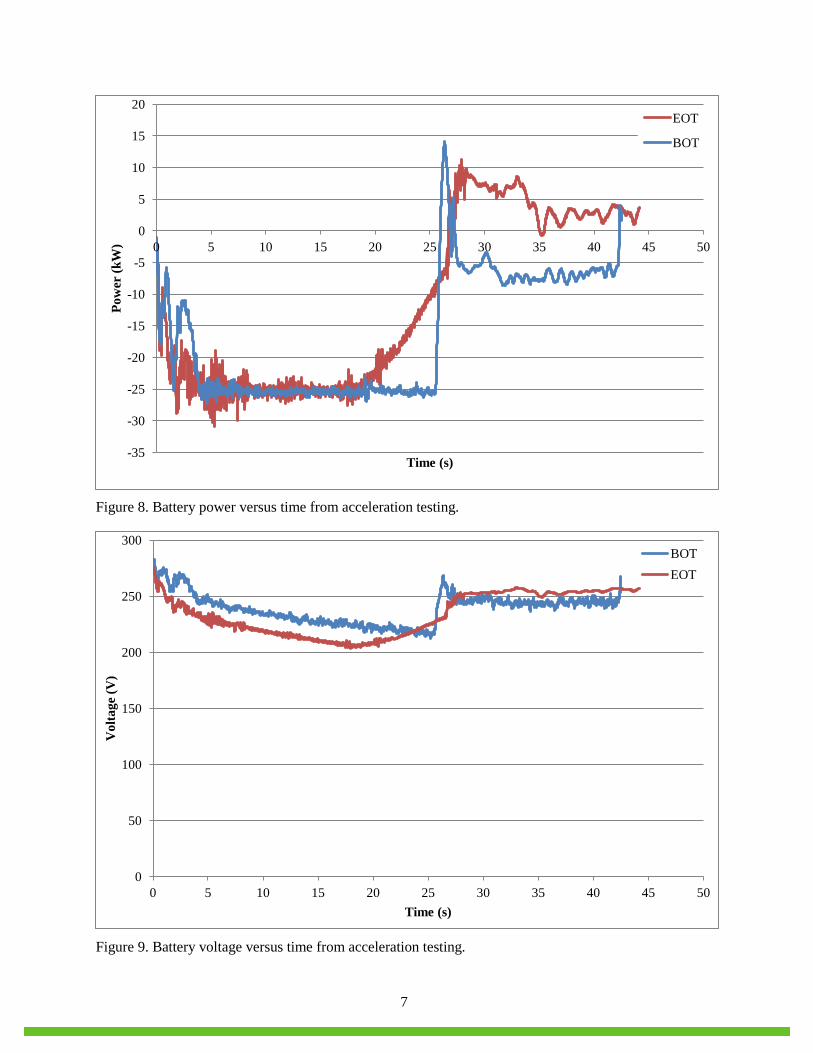
Figure 8 shows battery power versus time during the 1-mile acceleration test at EOT and BOT. This
graph is the basis for power calculations over specified time or distance intervals and the cumulative discharged energy capacity during the duration of the test. At the beginning of the acceleration test, the power quickly increases from approximately 0 kW to a peak value. The power then remains relatively constant until battery or vehicle system dynamics, which may include battery control logic, cause a reverse in power direction to charge the battery.
Figure 9 shows the battery voltage versus time during the 1-mile acceleration test at BOT and EOT. Values are analyzed to determine the minimum voltage allowed by the battery control module, if possible. Although the test may not yield a definitive minimum voltage value, it can provide an approximation for comparison to the HPPC analysis results. This graph also shows the impact of power electronics and battery controller on the voltage response.
0
100
200
300
400
500
600
700
800
900
1000
1100
1200
1300
1400
1500
0 5 10 15 20 25 30 35 40
Use
able
Ene
rgy
(Wh)
Power (kW)
BOT EOT
7
Figure 8. Battery power versus time from acceleration testing.
Figure 9. Battery voltage versus time from acceleration testing.
-35
-30
-25
-20
-15
-10
-5
0
5
10
15
20
0 5 10 15 20 25 30 35 40 45 50
Pow
er (k
W)
Time (s)
EOT
BOT
0
50
100
150
200
250
300
0 5 10 15 20 25 30 35 40 45 50
Vol
tage
(V)
Time (s)
BOT EOT
8
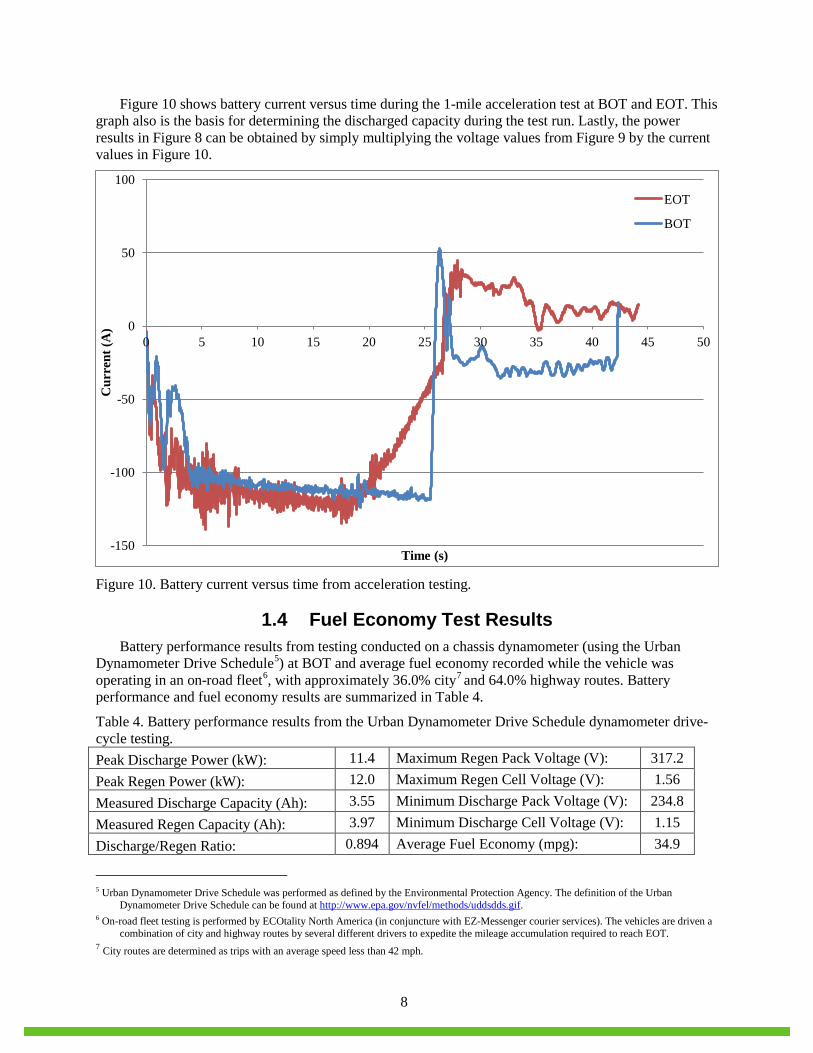
Figure 10 shows battery current versus time during the 1-mile acceleration test at BOT and EOT. This graph also is the basis for determining the discharged capacity during the test run. Lastly, the power results in Figure 8 can be obtained by simply multiplying the voltage values from Figure 9 by the current values in Figure 10.
Figure 10. Battery current versus time from acceleration testing.
1.4 Fuel Economy Test Results Battery performance results from testing conducted on a chassis dynamometer (using the Urban
Dynamometer Drive Schedule5) at BOT and average fuel economy recorded while the vehicle was operating in an on-road fleet6, with approximately 36.0% city7 and 64.0% highway routes. Battery performance and fuel economy results are summarized in Table 4.
Table 4. Battery performance results from the Urban Dynamometer Drive Schedule dynamometer drive-cycle testing. Peak Discharge Power (kW): 11.4 Maximum Regen Pack Voltage (V): 317.2 Peak Regen Power (kW): 12.0 Maximum Regen Cell Voltage (V): 1.56 Measured Discharge Capacity (Ah): 3.55 Minimum Discharge Pack Voltage (V): 234.8 Measured Regen Capacity (Ah): 3.97 Minimum Discharge Cell Voltage (V): 1.15 Discharge/Regen Ratio: 0.894 Average Fuel Economy (mpg): 34.9
5 Urban Dynamometer Drive Schedule was performed as defined by the Environmental Protection Agency. The definition of the Urban
Dynamometer Drive Schedule can be found at http://www.epa.gov/nvfel/methods/uddsdds.gif. 6 On-road fleet testing is performed by ECOtality North America (in conjuncture with EZ-Messenger courier services). The vehicles are driven a
combination of city and highway routes by several different drivers to expedite the mileage accumulation required to reach EOT. 7 City routes are determined as trips with an average speed less than 42 mph.
-150
-100
-50
0
50
100
0 5 10 15 20 25 30 35 40 45 50
Cur
rent
(A)
Time (s)
EOT
BOT
9
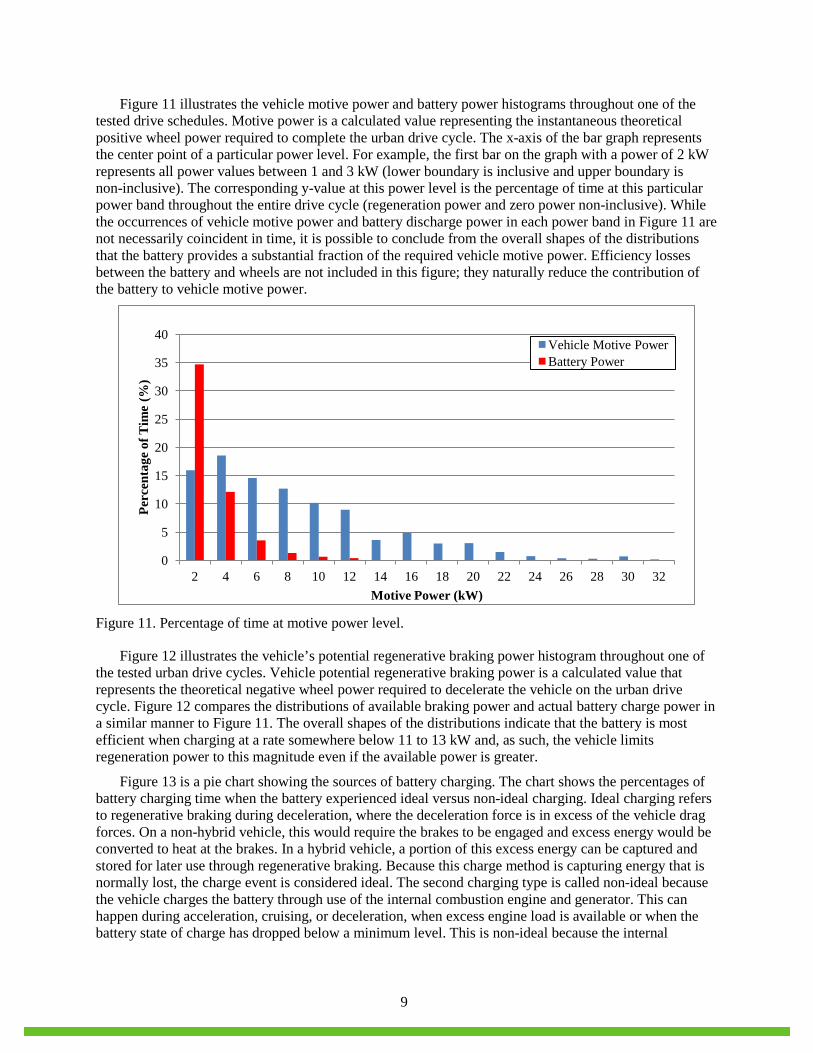
Figure 11 illustrates the vehicle motive power and battery power histograms throughout one of the tested drive schedules. Motive power is a calculated value representing the instantaneous theoretical positive wheel power required to complete the urban drive cycle. The x-axis of the bar graph represents the center point of a particular power level. For example, the first bar on the graph with a power of 2 kW represents all power values between 1 and 3 kW (lower boundary is inclusive and upper boundary is non-inclusive). The corresponding y-value at this power level is the percentage of time at this particular power band throughout the entire drive cycle (regeneration power and zero power non-inclusive). While the occurrences of vehicle motive power and battery discharge power in each power band in Figure 11 are not necessarily coincident in time, it is possible to conclude from the overall shapes of the distributions that the battery provides a substantial fraction of the required vehicle motive power. Efficiency losses between the battery and wheels are not included in this figure; they naturally reduce the contribution of the battery to vehicle motive power.
Figure 11. Percentage of time at motive power level.
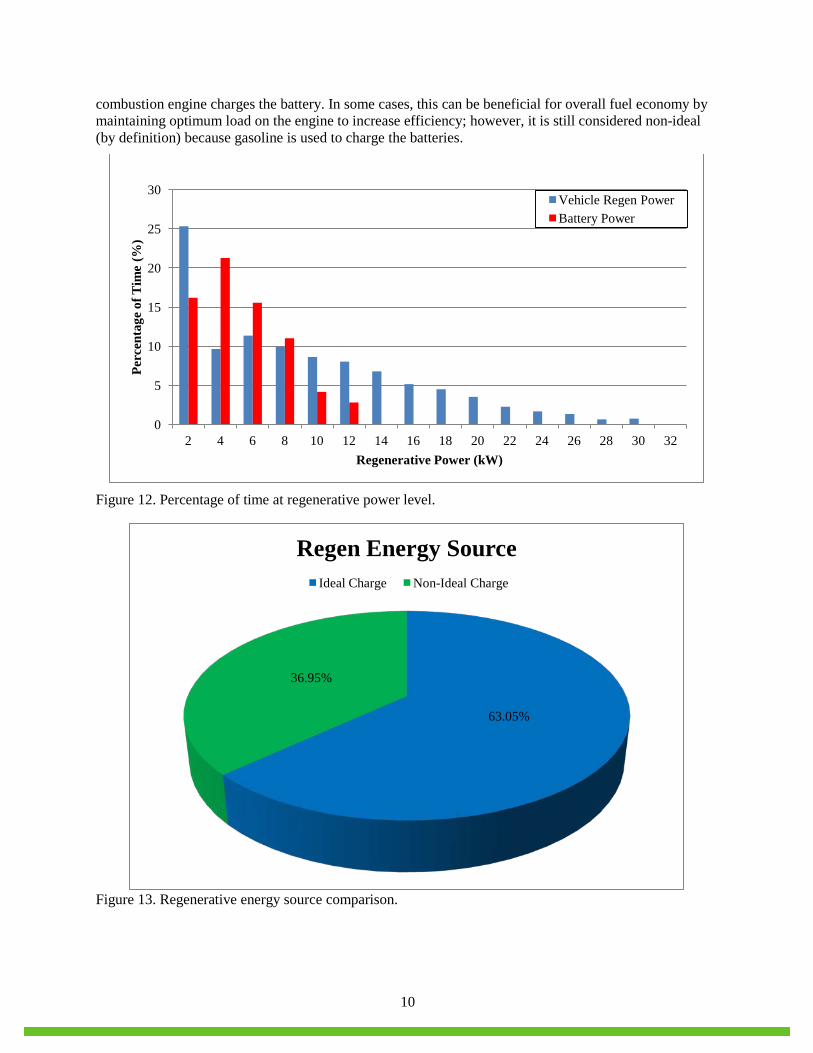
Figure 12 illustrates the vehicle’s potential regenerative braking power histogram throughout one of the tested urban drive cycles. Vehicle potential regenerative braking power is a calculated value that represents the theoretical negative wheel power required to decelerate the vehicle on the urban drive cycle. Figure 12 compares the distributions of available braking power and actual battery charge power in a similar manner to Figure 11. The overall shapes of the distributions indicate that the battery is most efficient when charging at a rate somewhere below 11 to 13 kW and, as such, the vehicle limits regeneration power to this magnitude even if the available power is greater.
Figure 13 is a pie chart showing the sources of battery charging. The chart shows the percentages of battery charging time when the battery experienced ideal versus non-ideal charging. Ideal charging refers to regenerative braking during deceleration, where the deceleration force is in excess of the vehicle drag forces. On a non-hybrid vehicle, this would require the brakes to be engaged and excess energy would be converted to heat at the brakes. In a hybrid vehicle, a portion of this excess energy can be captured and stored for later use through regenerative braking. Because this charge method is capturing energy that is normally lost, the charge event is considered ideal. The second charging type is called non-ideal because the vehicle charges the battery through use of the internal combustion engine and generator. This can happen during acceleration, cruising, or deceleration, when excess engine load is available or when the battery state of charge has dropped below a minimum level. This is non-ideal because the internal
0
5
10
15
20
25
30
35
40
2 4 6 8 10 12 14 16 18 20 22 24 26 28 30 32
Perc
enta
ge o
f Tim
e (%
)
Motive Power (kW)
Vehicle Motive Power Battery Power
10
combustion engine charges the battery. In some cases, this can be beneficial for overall fuel economy by maintaining optimum load on the engine to increase efficiency; however, it is still considered non-ideal (by definition) because gasoline is used to charge the batteries.
Figure 12. Percentage of time at regenerative power level.
Figure 13. Regenerative energy source comparison.
0
5
10
15
20
25
30
2 4 6 8 10 12 14 16 18 20 22 24 26 28 30 32
Perc
enta
ge o
f Tim
e (%
)
Regenerative Power (kW)
Vehicle Regen Power Battery Power
63.05%
36.95%
Regen Energy Source Ideal Charge Non-Ideal Charge
11
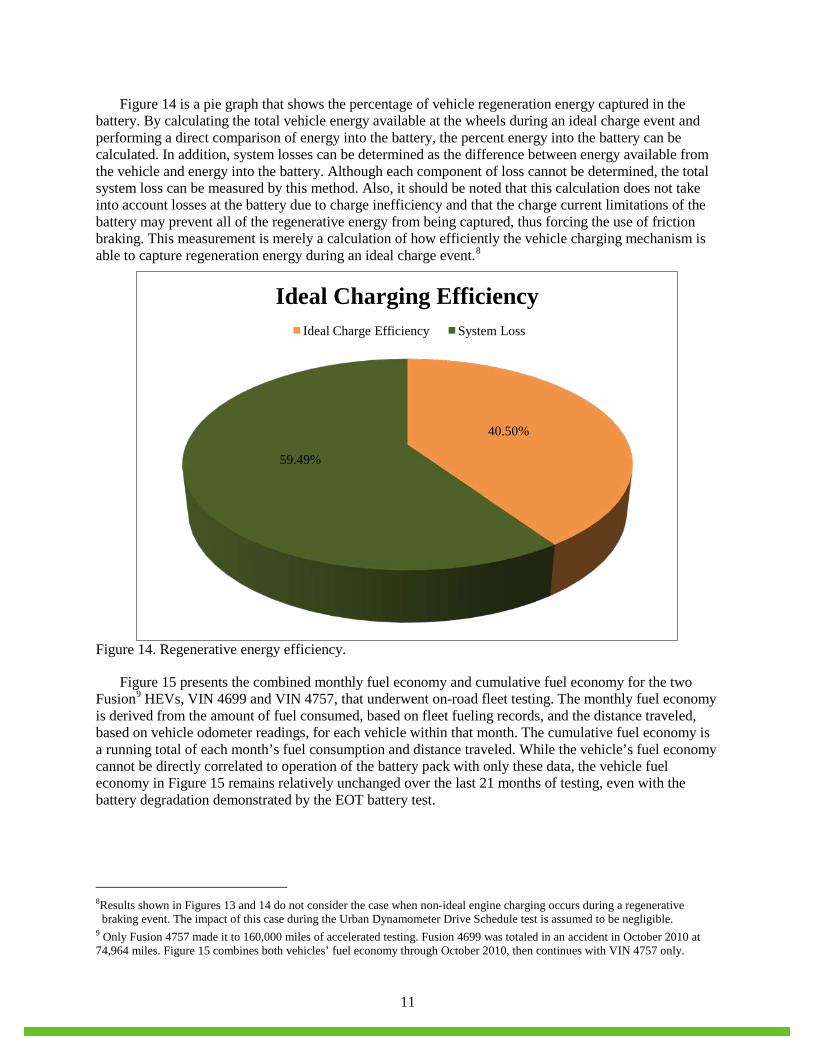
Figure 14 is a pie graph that shows the percentage of vehicle regeneration energy captured in the battery. By calculating the total vehicle energy available at the wheels during an ideal charge event and performing a direct comparison of energy into the battery, the percent energy into the battery can be calculated. In addition, system losses can be determined as the difference between energy available from the vehicle and energy into the battery. Although each component of loss cannot be determined, the total system loss can be measured by this method. Also, it should be noted that this calculation does not take into account losses at the battery due to charge inefficiency and that the charge current limitations of the battery may prevent all of the regenerative energy from being captured, thus forcing the use of friction braking. This measurement is merely a calculation of how efficiently the vehicle charging mechanism is able to capture regeneration energy during an ideal charge event.8
Figure 14. Regenerative energy efficiency.
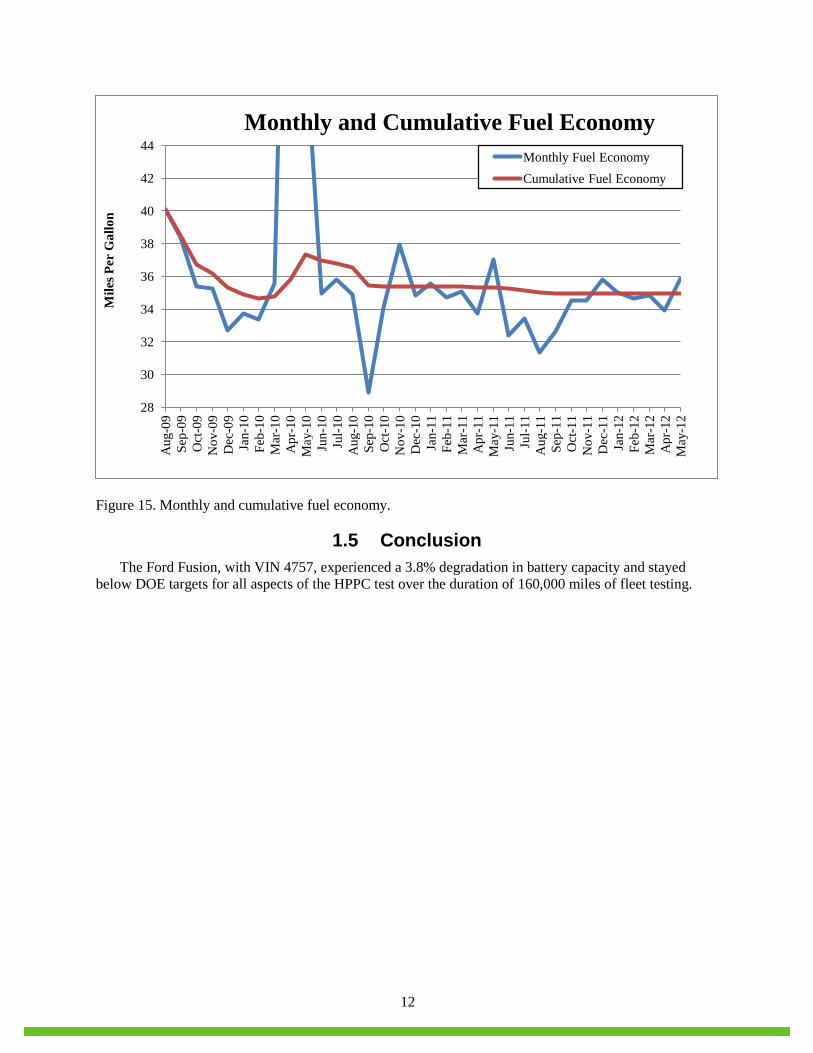
Figure 15 presents the combined monthly fuel economy and cumulative fuel economy for the two Fusion9 HEVs, VIN 4699 and VIN 4757, that underwent on-road fleet testing. The monthly fuel economy is derived from the amount of fuel consumed, based on fleet fueling records, and the distance traveled, based on vehicle odometer readings, for each vehicle within that month. The cumulative fuel economy is a running total of each month’s fuel consumption and distance traveled. While the vehicle’s fuel economy cannot be directly correlated to operation of the battery pack with only these data, the vehicle fuel economy in Figure 15 remains relatively unchanged over the last 21 months of testing, even with the battery degradation demonstrated by the EOT battery test.
8Results shown in Figures 13 and 14 do not consider the case when non-ideal engine charging occurs during a regenerative
braking event. The impact of this case during the Urban Dynamometer Drive Schedule test is assumed to be negligible. 9 Only Fusion 4757 made it to 160,000 miles of accelerated testing. Fusion 4699 was totaled in an accident in October 2010 at 74,964 miles. Figure 15 combines both vehicles’ fuel economy through October 2010, then continues with VIN 4757 only.
40.50%
59.49%
Ideal Charging Efficiency Ideal Charge Efficiency System Loss
12
Figure 15. Monthly and cumulative fuel economy.
1.5 Conclusion The Ford Fusion, with VIN 4757, experienced a 3.8% degradation in battery capacity and stayed
below DOE targets for all aspects of the HPPC test over the duration of 160,000 miles of fleet testing.
28
30
32
34
36
38
40
42
44 A
ug-0
9 Se
p-09
O
ct-0
9 N
ov-0
9 D
ec-0
9 Ja
n-10
Fe
b-10
M
ar-1
0 A
pr-1
0 M
ay-1
0 Ju
n-10
Ju
l-10
Aug
-10
Sep-
10
Oct
-10
Nov
-10
Dec
-10
Jan-
11
Feb-
11
Mar
-11
Apr
-11
May
-11
Jun-
11
Jul-1
1 A
ug-1
1 Se
p-11
O
ct-1
1 N
ov-1
1 D
ec-1
1 Ja
n-12
Fe
b-12
M
ar-1
2 A
pr-1
2 M
ay-1
2
Mile
s Per
Gal
lon
Monthly and Cumulative Fuel Economy Monthly Fuel Economy Cumulative Fuel Economy
13
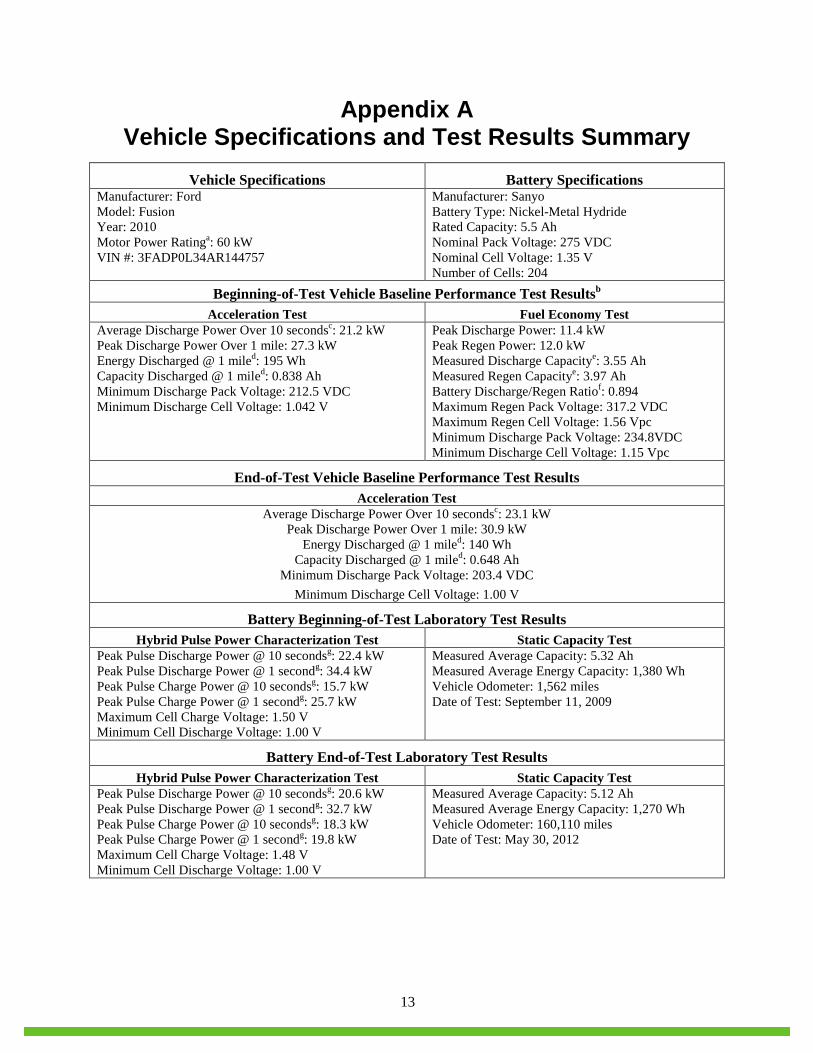
Appendix A Vehicle Specifications and Test Results Summary
Vehicle Specifications Battery Specifications Manufacturer: Ford Model: Fusion Year: 2010 Motor Power Ratinga: 60 kW VIN #: 3FADP0L34AR144757
Manufacturer: Sanyo Battery Type: Nickel-Metal Hydride Rated Capacity: 5.5 Ah Nominal Pack Voltage: 275 VDC Nominal Cell Voltage: 1.35 V Number of Cells: 204
Beginning-of-Test Vehicle Baseline Performance Test Resultsb
Acceleration Test Fuel Economy Test Average Discharge Power Over 10 secondsc: 21.2 kW Peak Discharge Power Over 1 mile: 27.3 kW Energy Discharged @ 1 miled: 195 Wh Capacity Discharged @ 1 miled: 0.838 Ah Minimum Discharge Pack Voltage: 212.5 VDC Minimum Discharge Cell Voltage: 1.042 V
Peak Discharge Power: 11.4 kW Peak Regen Power: 12.0 kW Measured Discharge Capacitye: 3.55 Ah Measured Regen Capacitye: 3.97 Ah Battery Discharge/Regen Ratiof: 0.894 Maximum Regen Pack Voltage: 317.2 VDC Maximum Regen Cell Voltage: 1.56 Vpc Minimum Discharge Pack Voltage: 234.8VDC Minimum Discharge Cell Voltage: 1.15 Vpc
End-of-Test Vehicle Baseline Performance Test Results Acceleration Test
Average Discharge Power Over 10 secondsc: 23.1 kW Peak Discharge Power Over 1 mile: 30.9 kW
Energy Discharged @ 1 miled: 140 Wh Capacity Discharged @ 1 miled: 0.648 Ah
Minimum Discharge Pack Voltage: 203.4 VDC Minimum Discharge Cell Voltage: 1.00 V
Battery Beginning-of-Test Laboratory Test Results Hybrid Pulse Power Characterization Test Static Capacity Test
Peak Pulse Discharge Power @ 10 secondsg: 22.4 kW Peak Pulse Discharge Power @ 1 secondg: 34.4 kW Peak Pulse Charge Power @ 10 secondsg: 15.7 kW Peak Pulse Charge Power @ 1 secondg: 25.7 kW Maximum Cell Charge Voltage: 1.50 V Minimum Cell Discharge Voltage: 1.00 V
Measured Average Capacity: 5.32 Ah Measured Average Energy Capacity: 1,380 Wh Vehicle Odometer: 1,562 miles Date of Test: September 11, 2009
Battery End-of-Test Laboratory Test Results Hybrid Pulse Power Characterization Test Static Capacity Test
Peak Pulse Discharge Power @ 10 secondsg: 20.6 kW Peak Pulse Discharge Power @ 1 secondg: 32.7 kW Peak Pulse Charge Power @ 10 secondsg: 18.3 kW Peak Pulse Charge Power @ 1 secondg: 19.8 kW Maximum Cell Charge Voltage: 1.48 V Minimum Cell Discharge Voltage: 1.00 V
Measured Average Capacity: 5.12 Ah Measured Average Energy Capacity: 1,270 Wh Vehicle Odometer: 160,110 miles Date of Test: May 30, 2012
14
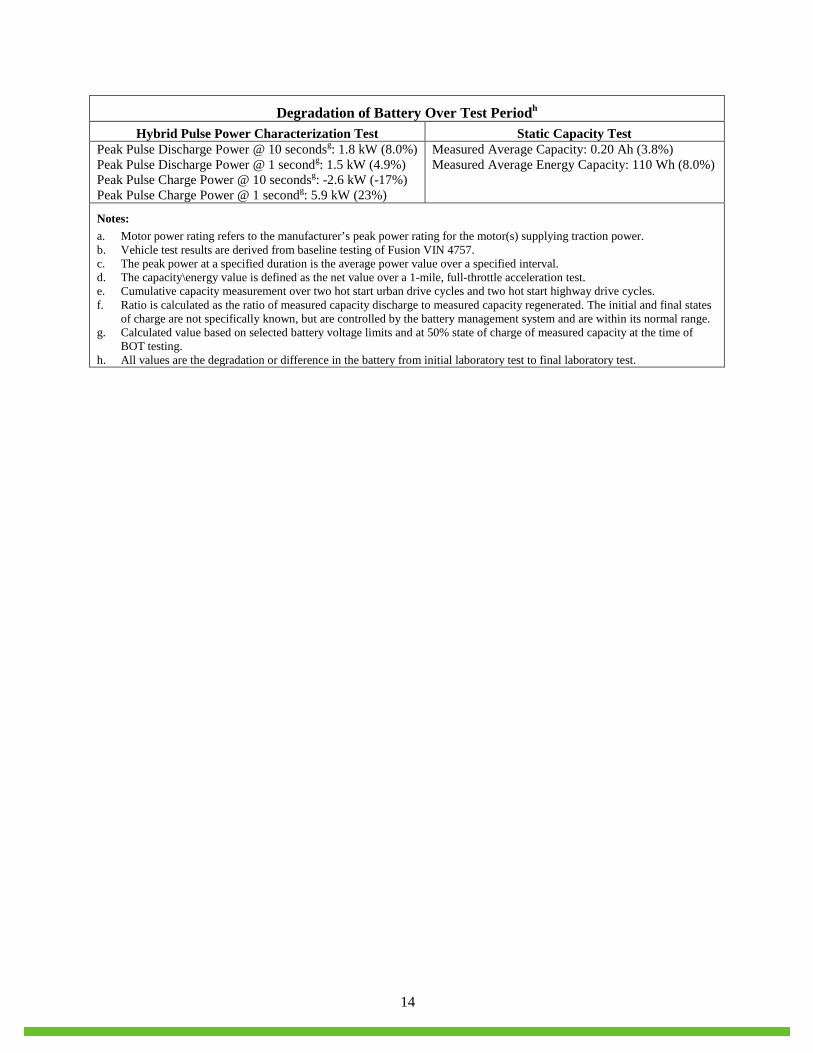
Degradation of Battery Over Test Periodh
Hybrid Pulse Power Characterization Test Static Capacity Test Peak Pulse Discharge Power @ 10 secondsg: 1.8 kW (8.0%) Peak Pulse Discharge Power @ 1 secondg: 1.5 kW (4.9%) Peak Pulse Charge Power @ 10 secondsg: -2.6 kW (-17%) Peak Pulse Charge Power @ 1 secondg: 5.9 kW (23%)
Measured Average Capacity: 0.20 Ah (3.8%) Measured Average Energy Capacity: 110 Wh (8.0%)
Notes: a. Motor power rating refers to the manufacturer’s peak power rating for the motor(s) supplying traction power. b. Vehicle test results are derived from baseline testing of Fusion VIN 4757. c. The peak power at a specified duration is the average power value over a specified interval. d. The capacity\energy value is defined as the net value over a 1-mile, full-throttle acceleration test. e. Cumulative capacity measurement over two hot start urban drive cycles and two hot start highway drive cycles. f. Ratio is calculated as the ratio of measured capacity discharge to measured capacity regenerated. The initial and final states
of charge are not specifically known, but are controlled by the battery management system and are within its normal range. g. Calculated value based on selected battery voltage limits and at 50% state of charge of measured capacity at the time of
BOT testing. h. All values are the degradation or difference in the battery from initial laboratory test to final laboratory test.