Embed Size (px)
Citation preview
GT-NC-10
UNIVERSITY OF CALIFORNIA - COOPERATIVE EXTENSION
2010
SAMPLE COSTS FOR A
GOATS FOR MEAT OPERATION
In Northern California
Josh S. Davy UC Cooperative Extension Livestock and Natural Resources Farm Advisor, Glenn, Colusa, & Tehama Counties
Larry C. Forero UC Cooperative Extension Livestock and Natural Resources Farm Advisor, Shasta-Trinity Counties
Roger S. Ingram UC Cooperative Extension Livestock and Natural Resources Farm Advisor, Placer-Nevada Counties
Glenn A. Nader UC Cooperative Extension Livestock and Natural Resources Farm Advisor, Sutter-Yuba Counties John M. Harper UC Cooperative Extension Livestock and Natural Resources Farm Advisor, Mendocino-Lake
Counties Holly A. George UC Cooperative Extension Livestock and Natural Resources Farm Advisor, Plumas-Sierra
Counties Morgan P. Doran UC Cooperative Extension Livestock and Natural Resources Farm Advisor, Solano, Napa, & Yolo
Counties Sheila Barry UC Cooperative Extension Livestock and Natural Resources Farm Advisor, Santa Clara, Contra
Costa, & Alameda Counties Stephanie Larsen UC Cooperative Extension Livestock and Natural Resources Farm Advisor, Sonoma-Marin
Counties Marion Stanley UC Cooperative Extension Livestock Farm Advisor, Emeritus Karen M. Klonsky UC Cooperative Extension Specialist, Department of Agricultural and Resource Economics,
UC Davis Pete Livingston UC Cooperative Extension Staff Research Associate, Department of Agricultural and Resource
Economics, UC Davis
2010 Meat Goat Cost and Returns Study Northern California UC Cooperative Extension 2
STUDY CONTENTS
INTRODUCTION ……………………………………...……………………………………………...……….…..….… 2 ASSUMPTIONS …………………………………………………………………………………………….…….….….. 3 MEAT GOAT HERD HUSBANDRY PRACTICES AND MATERIAL INPUTS …..………………………………....………....... 4 Table 1. MONTHS OF MAJOR OPERATIONS …………..………..………………………………………………….….….…... 4 TRANSPORTATION, SALES, RETURNS AND MARKETING ………..…………………………..………………………….……. 5 Table 2. MARKETING OF LIVESTOCK SOLD …………..……….………………………………………………….….….…... 5 Table 3. VALUE RECEIVED BY CLASS OF GOAT SOLD …………………………............…………………….….….….…... 6 CASH OVERHEAD ………………….………………………………………………….…………...….…...…….… 6 NON-CASH OVERHEAD ……....………….…………………………………………….………...…….…………… 7
REFERENCES ……………………………………………………………………………..……………………………. 9 Table 4. Cost Per Head to Maintain a Meat Goat Operation Without Labor Cash Costs ……..……...….….….. 11 Table 5. Monthly Summary of Cash Returns and Expenses to Maintain a Meat Goat Operation ………………. 12 Table 6. Investment Summary of Maintaining a Meat Goat Operation ….…………………....……….……….. 13 Table 7. Ranging Analysis for a Meat Goat Operation …………………………………………….………...….. 14 Appendix A. Ethnic Holidays for 2009 – 2013 ……………………………………………………..…….……….. . 15 Appendix B. Goat Sizes and Needs for Ethnic Markets …………………………………………………………...……… .. 15
INTRODUCTION
While the sample costs to raise goats for meat in Northern California are presented in this study, these costs will be useful for others interested in producing goats for meat in other areas. The ranch used in this study is for a meat goat herd that raises, produces, sells live animals, or slaughters, packages, and markets the final meat product during a 12 month cycle. This study is intended as a guide only, and can be used to make production decisions, determine potential returns, prepare budgets and evaluate production loans. Sample costs for labor, materials, equipment, and custom services are based on current local figures. Practices described are based on those production procedures considered necessary for goats in Northern California area, but may not apply in every situation. Some costs and practices presented in this study may not be applicable to your situation. A blank column, “Your Costs”, is provided in Table 1 to enter your costs. For an explanation of calculations used for the study refer to the Assumptions section. For more information call Pete Livingston at the Department of Agricultural and Resource Economics, Cooperative Extension, University of California, Davis, California, 530-752-2414 or call your local UC Cooperative Extension Livestock and Natural Resources Advisor.
The University of California does not discriminate in any of its policies, procedures or practices. The university is an affirmative action/equal opportunity employer.
2010 Meat Goat Cost and Returns Study Northern California UC Cooperative Extension 3
ASSUMPTIONS
The following assumptions pertain to sample costs to raise goats for meat in Northern California. Practices described are not necessarily recommendations by the University of California, but represent husbandry, production practices, and materials considered typical of the meat goat herds surveyed. Some costs, practices, and materials may not be applicable to your situation or used during every year. Additional husbandry practices not indicated may be needed. Husbandry practices vary by ranches and region with variations that can be significant. These costs are presented in several formats. The use of trade names in this report does not constitute an endorsement or recommendation by the University of California nor is any criticism implied by omission of other similar products. In this study, producers are raising goats to maximize weight gain for meat sales. Both live animals and packaged meat are sold. A myriad of marketing channels can be utilized and often are. A more detailed discussion of marketing occurs below in the Transportation, Sales, Returns, and Marketing sections. The ranch used in this example uses a majority of leased land and a small adjacent rented headquarters during the winter. Producers currently tend to use many different breeds of goats and while this study does not assume which specific breeds are raised, it assumes the herd will gain weight efficiently. It is important to realize changes in feed, environment, weather, is stressful to goats and can result in death and production loss. Depending on the situation, individual ranchers may offset feeding in confined areas with fees for grazing. These fees also may attempt to recover herding, pasture-to-pasture transport, labor, fencing, guard dogs and feed costs. They may also absorb the owner labor/management costs, which would boost income. Income (price per head) may be higher than the average prices reported in this study. This study does not consider any outside income sources or spreading the costs over multiple ranch enterprises. It also states what the higher labor rate would be for the producer if wages were paid as a monthly income. A comparison of cost studies from other states shows little or no labor included in operating costs. In tables 4, 5, and 7 labor is considered to be part of the Returns to Risk and Management. Land. The hypothetical ranch consists of 300 acres of dryland range that is leased, and 40 acres of contiguously unimproved headquarters dry land pasture that is leased for an annual rate of $4,800. This headquarters property includes dry land pasture, fencing, and facility maintenance. The headquarters includes all of the buildings, permanent corrals, and equipment for working and supplementary feeding of the goat herd. Private range leased in this region averages $16.50 per Animal Unit Month (AUM). It is assumed that a dry doe is 0.17 Animal Unit (AU) (September – November) and a lactating doe is 0.2 AU (March – September). The herd is run on the leased ground except for during the harsher winter months of December, January, and February when they are brought to the homestead, run on the headquarters pasture, and fed alfalfa hay during kidding (approximately 4.0 lbs/head/day).
GOAT HUSBANDRY PRACTICES AND MATERIAL INPUTS
Goat Breeds. There are several breeds of goats that are raised for meat production in Northern California. The most representative breeds are Boers, Kikos, and Boer and Kiko crosses. Other breeds that are used to a lesser degree or crossbreeds include La Mancha, Cashmere, Alpine, and Spanish goats. Other dairy goat breeds, especially male kids are also often used. Boers and Kikos, while normally are more expensive to purchase, will put weight on faster than many other breeds, are well muscled, do well
2010 Meat Goat Cost and Returns Study Northern California UC Cooperative Extension 4
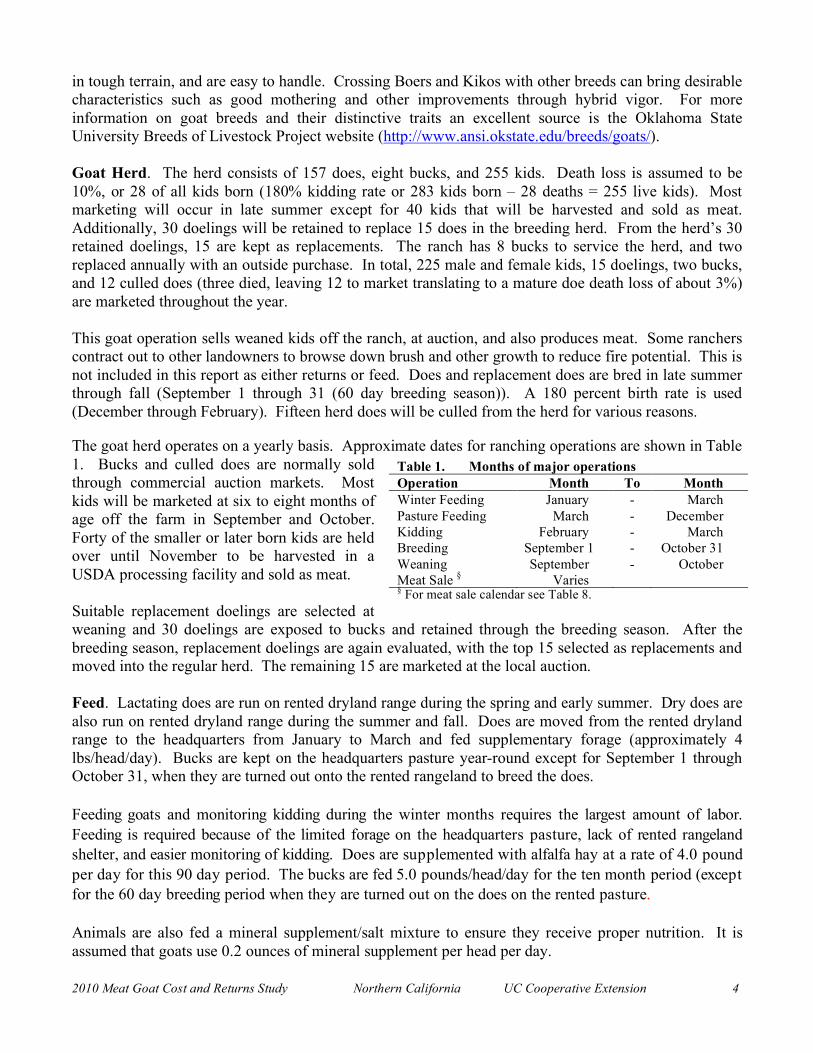
Table 1. Months of major operations Operation Month To Month Winter Feeding January - March Pasture Feeding March - December Kidding February - March Breeding September 1 - October 31 Weaning September - October Meat Sale § Varies § For meat sale calendar see Table 8.
in tough terrain, and are easy to handle. Crossing Boers and Kikos with other breeds can bring desirable characteristics such as good mothering and other improvements through hybrid vigor. For more information on goat breeds and their distinctive traits an excellent source is the Oklahoma State University Breeds of Livestock Project website (http://www.ansi.okstate.edu/breeds/goats/). Goat Herd. The herd consists of 157 does, eight bucks, and 255 kids. Death loss is assumed to be 10%, or 28 of all kids born (180% kidding rate or 283 kids born – 28 deaths = 255 live kids). Most marketing will occur in late summer except for 40 kids that will be harvested and sold as meat. Additionally, 30 doelings will be retained to replace 15 does in the breeding herd. From the herd’s 30 retained doelings, 15 are kept as replacements. The ranch has 8 bucks to service the herd, and two replaced annually with an outside purchase. In total, 225 male and female kids, 15 doelings, two bucks, and 12 culled does (three died, leaving 12 to market translating to a mature doe death loss of about 3%) are marketed throughout the year. This goat operation sells weaned kids off the ranch, at auction, and also produces meat. Some ranchers contract out to other landowners to browse down brush and other growth to reduce fire potential. This is not included in this report as either returns or feed. Does and replacement does are bred in late summer through fall (September 1 through 31 (60 day breeding season)). A 180 percent birth rate is used (December through February). Fifteen herd does will be culled from the herd for various reasons. The goat herd operates on a yearly basis. Approximate dates for ranching operations are shown in Table 1. Bucks and culled does are normally sold through commercial auction markets. Most kids will be marketed at six to eight months of age off the farm in September and October. Forty of the smaller or later born kids are held over until November to be harvested in a USDA processing facility and sold as meat. Suitable replacement doelings are selected at weaning and 30 doelings are exposed to bucks and retained through the breeding season. After the breeding season, replacement doelings are again evaluated, with the top 15 selected as replacements and moved into the regular herd. The remaining 15 are marketed at the local auction. Feed. Lactating does are run on rented dryland range during the spring and early summer. Dry does are also run on rented dryland range during the summer and fall. Does are moved from the rented dryland range to the headquarters from January to March and fed supplementary forage (approximately 4 lbs/head/day). Bucks are kept on the headquarters pasture year-round except for September 1 through October 31, when they are turned out onto the rented rangeland to breed the does. Feeding goats and monitoring kidding during the winter months requires the largest amount of labor. Feeding is required because of the limited forage on the headquarters pasture, lack of rented rangeland shelter, and easier monitoring of kidding. Does are supplemented with alfalfa hay at a rate of 4.0 pound per day for this 90 day period. The bucks are fed 5.0 pounds/head/day for the ten month period (except for the 60 day breeding period when they are turned out on the does on the rented pasture. Animals are also fed a mineral supplement/salt mixture to ensure they receive proper nutrition. It is assumed that goats use 0.2 ounces of mineral supplement per head per day.
2010 Meat Goat Cost and Returns Study Northern California UC Cooperative Extension 5
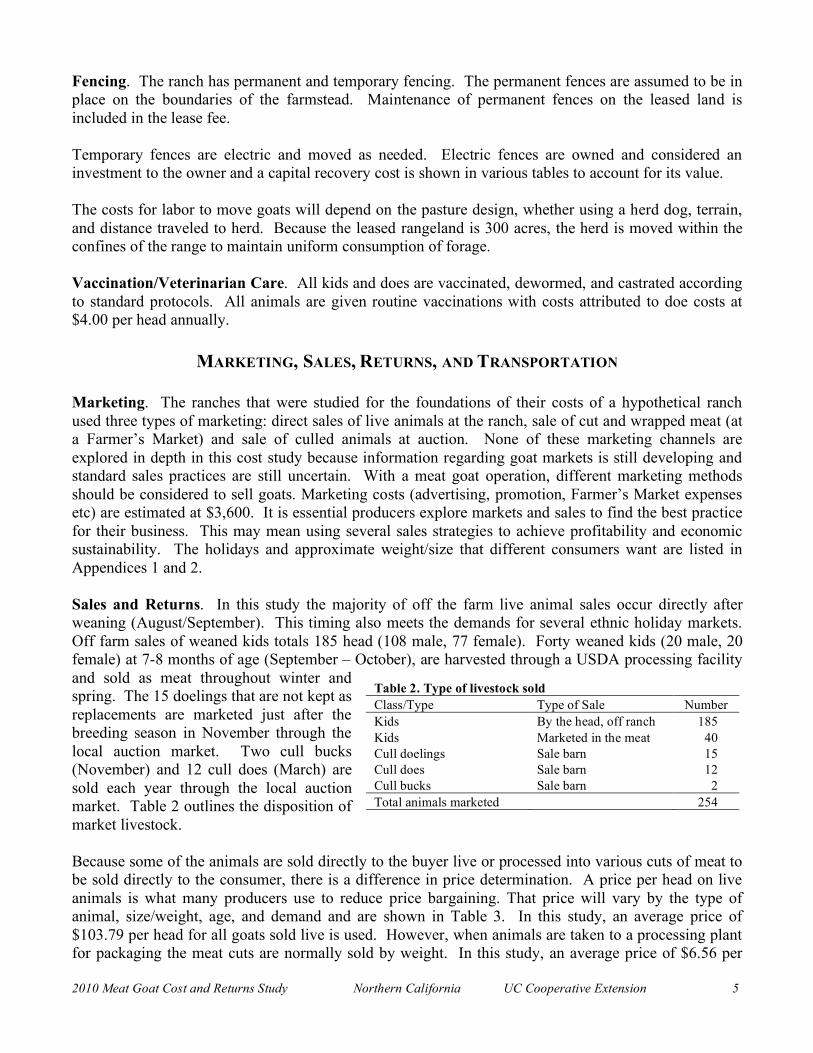
Table 2. Type of livestock sold Class/Type Type of Sale Number Kids By the head, off ranch 185 Kids Marketed in the meat 40 Cull doelings Sale barn 15 Cull does Sale barn 12 Cull bucks Sale barn 2 Total animals marketed 254
Fencing. The ranch has permanent and temporary fencing. The permanent fences are assumed to be in place on the boundaries of the farmstead. Maintenance of permanent fences on the leased land is included in the lease fee. Temporary fences are electric and moved as needed. Electric fences are owned and considered an investment to the owner and a capital recovery cost is shown in various tables to account for its value. The costs for labor to move goats will depend on the pasture design, whether using a herd dog, terrain, and distance traveled to herd. Because the leased rangeland is 300 acres, the herd is moved within the confines of the range to maintain uniform consumption of forage. Vaccination/Veterinarian Care. All kids and does are vaccinated, dewormed, and castrated according to standard protocols. All animals are given routine vaccinations with costs attributed to doe costs at $4.00 per head annually.
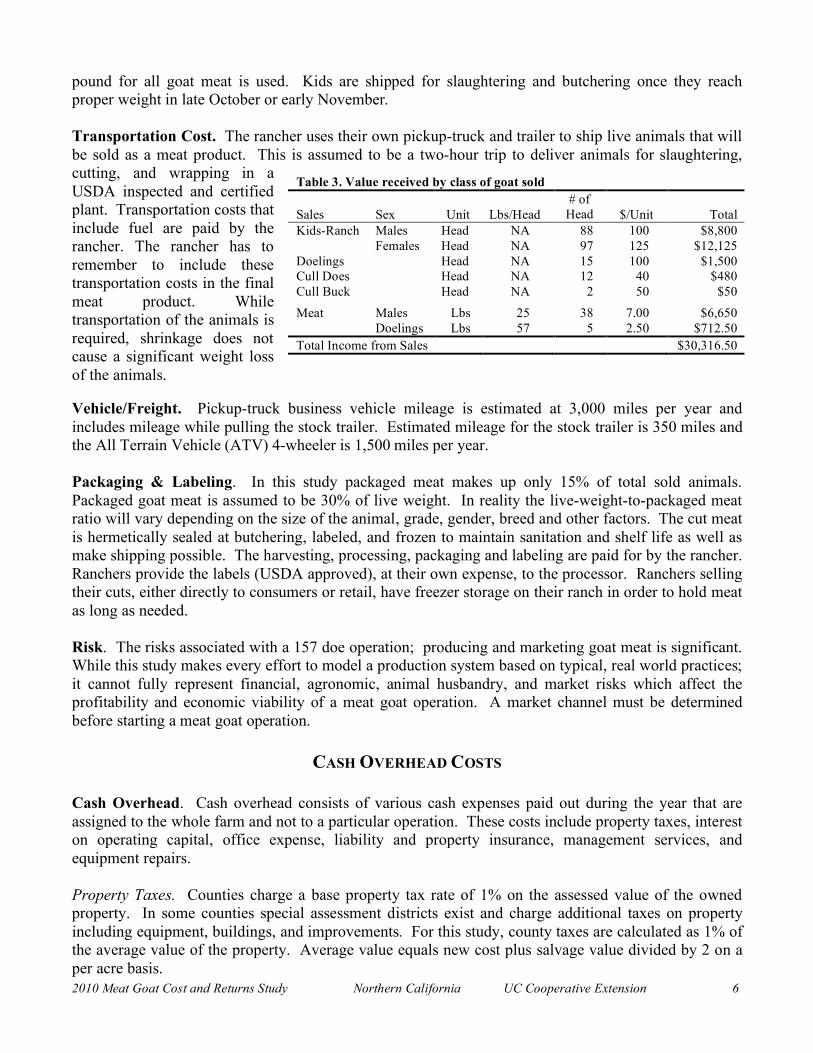
MARKETING, SALES, RETURNS, AND TRANSPORTATION Marketing. The ranches that were studied for the foundations of their costs of a hypothetical ranch used three types of marketing: direct sales of live animals at the ranch, sale of cut and wrapped meat (at a Farmer’s Market) and sale of culled animals at auction. None of these marketing channels are explored in depth in this cost study because information regarding goat markets is still developing and standard sales practices are still uncertain. With a meat goat operation, different marketing methods should be considered to sell goats. Marketing costs (advertising, promotion, Farmer’s Market expenses etc) are estimated at $3,600. It is essential producers explore markets and sales to find the best practice for their business. This may mean using several sales strategies to achieve profitability and economic sustainability. The holidays and approximate weight/size that different consumers want are listed in Appendices 1 and 2. Sales and Returns. In this study the majority of off the farm live animal sales occur directly after weaning (August/September). This timing also meets the demands for several ethnic holiday markets. Off farm sales of weaned kids totals 185 head (108 male, 77 female). Forty weaned kids (20 male, 20 female) at 7-8 months of age (September – October), are harvested through a USDA processing facility and sold as meat throughout winter and spring. The 15 doelings that are not kept as replacements are marketed just after the breeding season in November through the local auction market. Two cull bucks (November) and 12 cull does (March) are sold each year through the local auction market. Table 2 outlines the disposition of market livestock. Because some of the animals are sold directly to the buyer live or processed into various cuts of meat to be sold directly to the consumer, there is a difference in price determination. A price per head on live animals is what many producers use to reduce price bargaining. That price will vary by the type of animal, size/weight, age, and demand and are shown in Table 3. In this study, an average price of $103.79 per head for all goats sold live is used. However, when animals are taken to a processing plant for packaging the meat cuts are normally sold by weight. In this study, an average price of $6.56 per
2010 Meat Goat Cost and Returns Study Northern California UC Cooperative Extension 6
Table 3. Value received by class of goat sold
Sales Sex Unit Lbs/Head # of Head $/Unit Total
Kids-Ranch Males Head 1 NA 88 100 $8,800 Females Head NA 97 125 $12,125 Doelings Head NA 15 100 $1,500 Cull Does Head NA 12 40 $480 Cull Buck Head NA 2 50 $50
Meat Males Lbs 25 38 7.00 $6,650 Doelings Lbs 57 5 2.50 $712.50 Total Income from Sales $30,316.50
pound for all goat meat is used. Kids are shipped for slaughtering and butchering once they reach proper weight in late October or early November. Transportation Cost. The rancher uses their own pickup-truck and trailer to ship live animals that will be sold as a meat product. This is assumed to be a two-hour trip to deliver animals for slaughtering, cutting, and wrapping in a USDA inspected and certified plant. Transportation costs that include fuel are paid by the rancher. The rancher has to remember to include these transportation costs in the final meat product. While transportation of the animals is required, shrinkage does not cause a significant weight loss of the animals. Vehicle/Freight. Pickup-truck business vehicle mileage is estimated at 3,000 miles per year and includes mileage while pulling the stock trailer. Estimated mileage for the stock trailer is 350 miles and the All Terrain Vehicle (ATV) 4-wheeler is 1,500 miles per year. Packaging & Labeling. In this study packaged meat makes up only 15% of total sold animals. Packaged goat meat is assumed to be 30% of live weight. In reality the live-weight-to-packaged meat ratio will vary depending on the size of the animal, grade, gender, breed and other factors. The cut meat is hermetically sealed at butchering, labeled, and frozen to maintain sanitation and shelf life as well as make shipping possible. The harvesting, processing, packaging and labeling are paid for by the rancher. Ranchers provide the labels (USDA approved), at their own expense, to the processor. Ranchers selling their cuts, either directly to consumers or retail, have freezer storage on their ranch in order to hold meat as long as needed. Risk. The risks associated with a 157 doe operation; producing and marketing goat meat is significant. While this study makes every effort to model a production system based on typical, real world practices; it cannot fully represent financial, agronomic, animal husbandry, and market risks which affect the profitability and economic viability of a meat goat operation. A market channel must be determined before starting a meat goat operation.
CASH OVERHEAD COSTS Cash Overhead. Cash overhead consists of various cash expenses paid out during the year that are assigned to the whole farm and not to a particular operation. These costs include property taxes, interest on operating capital, office expense, liability and property insurance, management services, and equipment repairs. Property Taxes. Counties charge a base property tax rate of 1% on the assessed value of the owned property. In some counties special assessment districts exist and charge additional taxes on property including equipment, buildings, and improvements. For this study, county taxes are calculated as 1% of the average value of the property. Average value equals new cost plus salvage value divided by 2 on a per acre basis.
2010 Meat Goat Cost and Returns Study Northern California UC Cooperative Extension 7
Interest on Operating Capital. Interest on operating capital is based on cash operating costs and is calculated monthly until harvest at a nominal rate of 5.75% per year. A nominal interest rate is the typical rate for borrowed funds. Management. Wages for owner labor are not included in this study nor are earnings paid for monthly living expenses. No assumption is made about off-farm income. Any return above total costs is considered a return to management and risk. Insurance. Insurance for farm investments vary depending on the assets included and the amount of coverage. Property insurance provides coverage for property loss and is charged at 0.820% of the average value of the assets over their useful life. Liability insurance covers accidents on the farm. Business Expense. Office and business expenses are estimated at $1,000 annually. These expenses include office supplies, telephones, bookkeeping, accounting, legal fees, etc. Equipment Costs. Equipment costs are composed of three parts: non-cash overhead, cash overhead, and operating costs. Both of the overhead factors have been discussed in previous sections. The operating costs consist of fuel, lubrication, and repairs. Repairs, Fuel and Lube. Repair costs are based on purchase price, annual hours of use, total hours of life, and repair coefficients formulated by the American Society of Agricultural Engineers (ASAE). Fuel and lubrication costs are also determined by ASAE equations based on maximum PTO hp, and type of fuel used. Prices for on-farm delivery of diesel and gasoline are $2.04 and $2.67 per gallon, respectively.
NON-CASH OVERHEAD COSTS The cost calculations are based on economic principles that include all cash costs. This analysis uses a lease value based on the AUMs the rangeland can carry as a cost of operating. For this reason only the capital recovery costs for the owned land, machinery, equipment, fence, and building are considered in the non-cash overhead cost. Capital Recovery Costs. Although farm equipment on a stock farm in the region might be purchased new or used, this study shows the current purchase price for new equipment. The new purchase price is adjusted to 50% to indicate a mix of new and used equipment. Annual ownership costs for equipment and other investments are shown in the various tables. They represent the capital recovery cost for investments on an annual per acre basis. Capital recovery cost is the amount of money required each year to recover the difference between the purchase price and salvage value (unrecovered capital). Put another way, it is equivalent to the annual payment on a loan for the investment with the down payment equal to the discounted salvage value. This is a more complex method of calculating ownership costs than straight-line depreciation and opportunity costs, but accurately represents annual costs of ownership because it takes the time value of money into account (Boehlje and Eidman). Annual capital recovery costs are calculated as follows:
!!
"
#
$$
%
&'+
!!
"
#
$$
%
&
((
)
*
++
,
-'(((
)
*
+++
,
-.
RateValue
InterestSalvageerycovReCapital
FactorValuePrice
SalvagePurchase
2010 Meat Goat Cost and Returns Study Northern California UC Cooperative Extension 8
Salvage Value. Salvage value is an estimate of the remaining value of an investment at the end of its useful life. For farm machinery (e.g., tractors and implements) the remaining value is a percentage of the new cost of the investment (Boehlje and Eidman). The percent remaining value is calculated from equations developed by the ASAE based on equipment type and years of life. The life in years is estimated by dividing the wearout life, as given by ASAE by the annual hours of use in this operation. For other investments including irrigation systems, buildings, and miscellaneous equipment, the value at the end of its useful life is zero. Capital Recovery Factor. Capital recovery factor is the amortization factor or annual payment whose present value at compound interest is 1. The amortization factor is a table value that corresponds to the interest rate and the life of the equipment. Interest Rate. The interest rate of 4.75% is used to calculate capital recovery cost is the effective long term interest rate in January 2010. The interest rate is provided by a local farm lending agency and will vary according to risk and amount of loan. It is used to reflect the long-term realized rate of return to these specialized resources that can only be used effectively in the agricultural sector. In other words, the next best alternative use for these resources is in another agricultural enterprise.
Table Values. Due to rounding, the totals may be slightly different from the sum of the components.
Acknowledgment. Assistance provided by local producers was greatly appreciated.
2010 Meat Goat Cost and Returns Study Northern California UC Cooperative Extension 9
REFERENCES 1. Animal harvesting sites in California. Listed at Placer-Nevada Counties web site
http://ucce.ucdavis.edu/datastore/datareport.cfm?reportnumber=175. Internet access on February, 2009
2. Coffey, Linda. 2006. Meat Goats: Sustainable Production. ATTRA Publication #IP200.
http://attra.ncat.org/new_pubs/attra-pub/meatgoat.html?id=California. Internet accessed February, 2009.
3. Coffey, Linda., Margo Hale, and Ann Wells. 2004. Goats: Sustainable Production Overview.
ATTRA Publication #IP248. http://attra.ncat.org/new_pubs/attra-pub/goatoverview.html?id=California. Internet accessed February, 2009.
4. Grande Premium Meats. Meat Goat Menu. http://www.elkusa.com/Goat_meat.htm. Internet
accessed June, 2009. 5. Harris, Linda J., Hsu Ling Tan. 2004. Selling Meats and Meat Products. Pub. 8146. University of
California, Division of Agriculture and Natural Resources. Oakland, CA.
6. Louisiana State University Ag Center Research & Extension. Meat Goat Selection, Carcass Evaluation & Fabrication Guide. 2006. Ken McMillen and Frank Pinketon Eds. Pub. 2951. http://www.lsuagcenter.com/NR/rdonlyres/B8FE3706-64DC-417F-A592-B8DEC14B4D9F/43291/pub2951MeatGoatJanuary2008HIGHRES.pdf. Internet accessed June, 2009.
7. Machen, Rick, Warren Thigpen, and Eddie Holland. Meat Goat Carcass Fabrication for Case-
Ready Products. Texas A&M University. Texas Agricultural Extension Service. Results Demonstration Report. http://uvalde.tamu.edu/staff/Machen1.htm. Internet accessed June, 2009.
8. McGregor, Bruce. Meat, Carcass and Offal Yields of Goats. 2000. The State of Victoria, Australia.
Department of Primary Industries. http://www.acga.org.au/goatnotes/H007.php. Internet accessed June, 2009.
9. Oklahoma State University. 2007. Department of Animal Science. Breeds of Livestock Project
Stillwater, OK. http://www.ansi.okstate.edu/breeds/goats/. Internet accessed February, 2009.
10. Penn State University. Dairy and Animal Science. Ethnic Holiday Calendar. http://www.das.psu.edu/goats/marketing/ethnic-holiday-calendar. Internet accessed March, 2009.
11. Stanton, tatiana. 2007. SheepGoatMarketing.info. Ethnic Holiday Calendar.
http://sheepgoatmarketing.info/PageLoad.cfm?page=education/ethnicholidays.htm. Internet accessed February, 2009.
12. USDA-TX of Ag Market News. Weekly Sheep and Goat Auction. Producers Livestock Auction. 2009. San Angelo, TX. http://www.ams.usda.gov/mnreports/sa_ls320.txt. Internet accessed June, 2010.
2010 Meat Goat Cost and Returns Study Northern California UC Cooperative Extension 10
13. USDA-FSIS. 2005. Food Safety and Inspection Service internet home page. http://www.fsis.usda.gov/home/index.asp. Internet accessed January, 2009.
ADDITIONAL INFORMATION
1. American Society of Agricultural Engineers. 2002. American Society of Agricultural Engineers
Standards Yearbook. Russell H. Hahn and Evelyn E. Rosentreter (ed.) St. Joseph, MO. 41st edition. 2. Boehlje, Michael D., and Vernon R. Eidman. 1984. Farm Management. John Wiley and Sons. New
York, NY. 3. California Chapter of the American Society of Farm Managers and Rural Appraisers. 2009. Trends
in Agricultural Land and Lease Values. California Chapter of the American Society of Farm Managers and Rural Appraisers, Inc. Woodbridge, CA.
4. California State Automobile Association. 2010. Gas Price Averages 2010. AAA Press Room, San
Francisco, CA. http://www.csaa.com/portal/site/CSAA/menuitem.5313747aa611bd4e320cfad592278a0c/?vgnextoid=8d642ce6cda97010VgnVCM1000002872a8c0RCRD. Internet accessed March, 2010.
5. California State Board of equalization. Fuel Tax Division Tax Rates.
http://www.boe.ca.gov/sptaxprog/spftdrates.htm. Internet accessed April, 2010. 6. Energy Information Administration. 2010. Weekly Retail on Highway Diesel Prices.
http://tonto.eia.doe.gov/oog/info/gdu/gasdiesel.asp. Internet accessed March, 2010. 7. Federal Register. Vol. 73, No. 149. 2008. Rules and Regulations. 7 CFR Part 65. [Docket No.
AMS–LS–07–0081]. RIN 0581–AC26. Mandatory Country of Origin Labeling of Beef, Pork, Lamb, Chicken, Goat, Meat, Perishable Agricultural Commodities, Peanuts, Pecans, Ginseng, and Macadamia Nuts. http://www.ams.usda.gov/lsg/stand/ls0202.pdf. Internet accessed February, 2009.
8. USDA-ERS. 2010. Economic Indicators of the Farm Sector: National Financial Summary. Agriculture and Rural Economics Division, ERS. USDA. Washington, DC. http://usda.mannlib.cornell.edu/MannUsda/viewDocumentInfo.do?documentID=1002. Internet accessed March, 2010.
Sample Cost of Production Studies for many commodities can be downloaded at http://coststudies.ucdavis.edu, requested through the Department of Agricultural and Resource Economics, UC Davis, 530-752-6887, or obtained from the local county UC Cooperative Extension offices. Some archived studies are also available on the website.
__________________________________ For information concerning the above or other University of California publications, contact UC DANR Communications Services at 800-994-8849, online at http://anrcatalog.ucdavis.edu/InOrder/Shop/Shop.asp, or your local county UC Cooperative Extension office.
2010 Meat Goat Cost and Returns Study Northern California UC Cooperative Extension 11
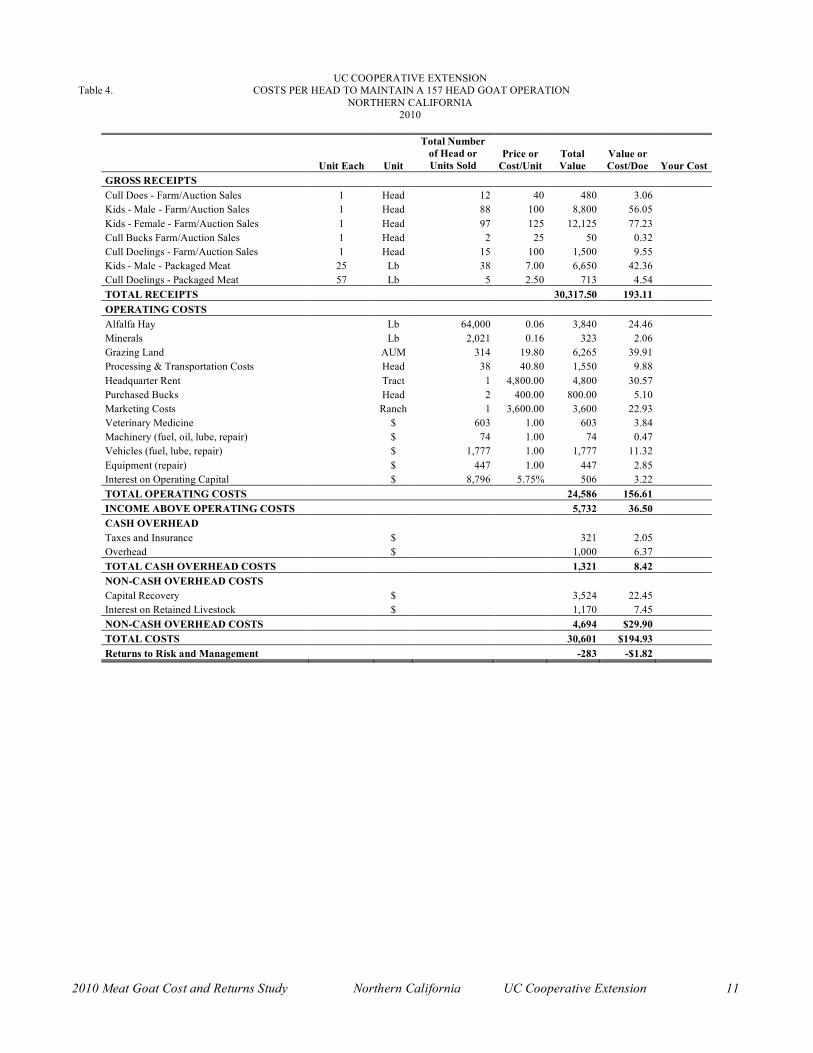
UC COOPERATIVE EXTENSION Table 4. COSTS PER HEAD TO MAINTAIN A 157 HEAD GOAT OPERATION
NORTHERN CALIFORNIA 2010
Unit Each Unit
Total Number of Head or Units Sold
Price or Cost/Unit
Total Value
Value or Cost/Doe Your Cost
GROSS RECEIPTS Cull Does - Farm/Auction Sales 1 Head 12 40 480 3.06 Kids - Male - Farm/Auction Sales 1 Head 88 100 8,800 56.05 Kids - Female - Farm/Auction Sales 1 Head 97 125 12,125 77.23 Cull Bucks Farm/Auction Sales 1 Head 2 25 50 0.32 Cull Doelings - Farm/Auction Sales 1 Head 15 100 1,500 9.55 Kids - Male - Packaged Meat 25 Lb 38 7.00 6,650 42.36 Cull Doelings - Packaged Meat 57 Lb 5 2.50 713 4.54 TOTAL RECEIPTS 30,317.50 193.11 OPERATING COSTS Alfalfa Hay Lb 64,000 0.06 3,840 24.46 Minerals Lb 2,021 0.16 323 2.06 Grazing Land AUM 314 19.80 6,265 39.91 Processing & Transportation Costs Head 38 40.80 1,550 9.88 Headquarter Rent Tract 1 4,800.00 4,800 30.57 Purchased Bucks Head 2 400.00 800.00 5.10 Marketing Costs Ranch 1 3,600.00 3,600 22.93 Veterinary Medicine $ 603 1.00 603 3.84 Machinery (fuel, oil, lube, repair) $ 74 1.00 74 0.47 Vehicles (fuel, lube, repair) $ 1,777 1.00 1,777 11.32 Equipment (repair) $ 447 1.00 447 2.85 Interest on Operating Capital $ 8,796 5.75% 506 3.22 TOTAL OPERATING COSTS 24,586 156.61 INCOME ABOVE OPERATING COSTS 5,732 36.50 CASH OVERHEAD Taxes and Insurance $ 321 2.05 Overhead $ 1,000 6.37 TOTAL CASH OVERHEAD COSTS 1,321 8.42 NON-CASH OVERHEAD COSTS Capital Recovery $ 3,524 22.45 Interest on Retained Livestock $ 1,170 7.45 NON-CASH OVERHEAD COSTS 4,694 $29.90 TOTAL COSTS 30,601 $194.93 Returns to Risk and Management -283 -$1.82
2010 Meat Goat Cost and Returns Study Northern California UC Cooperative Extension 12
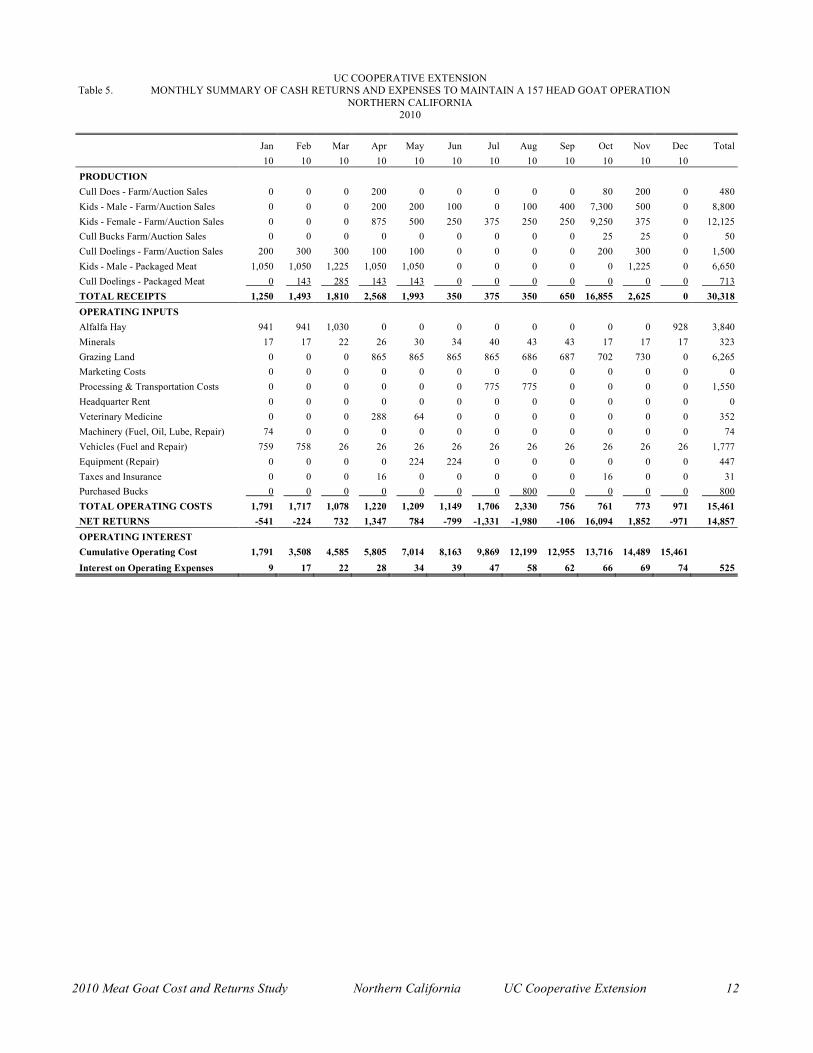
UC COOPERATIVE EXTENSION Table 5. MONTHLY SUMMARY OF CASH RETURNS AND EXPENSES TO MAINTAIN A 157 HEAD GOAT OPERATION
NORTHERN CALIFORNIA 2010
Jan Feb Mar Apr May Jun Jul Aug Sep Oct Nov Dec Total 10 10 10 10 10 10 10 10 10 10 10 10 PRODUCTION Cull Does - Farm/Auction Sales 0 0 0 200 0 0 0 0 0 80 200 0 480 Kids - Male - Farm/Auction Sales 0 0 0 200 200 100 0 100 400 7,300 500 0 8,800 Kids - Female - Farm/Auction Sales 0 0 0 875 500 250 375 250 250 9,250 375 0 12,125 Cull Bucks Farm/Auction Sales 0 0 0 0 0 0 0 0 0 25 25 0 50 Cull Doelings - Farm/Auction Sales 200 300 300 100 100 0 0 0 0 200 300 0 1,500 Kids - Male - Packaged Meat 1,050 1,050 1,225 1,050 1,050 0 0 0 0 0 1,225 0 6,650 Cull Doelings - Packaged Meat 0 143 285 143 143 0 0 0 0 0 0 0 713 TOTAL RECEIPTS 1,250 1,493 1,810 2,568 1,993 350 375 350 650 16,855 2,625 0 30,318 OPERATING INPUTS Alfalfa Hay 941 941 1,030 0 0 0 0 0 0 0 0 928 3,840 Minerals 17 17 22 26 30 34 40 43 43 17 17 17 323 Grazing Land 0 0 0 865 865 865 865 686 687 702 730 0 6,265 Marketing Costs 0 0 0 0 0 0 0 0 0 0 0 0 0 Processing & Transportation Costs 0 0 0 0 0 0 775 775 0 0 0 0 1,550 Headquarter Rent 0 0 0 0 0 0 0 0 0 0 0 0 0 Veterinary Medicine 0 0 0 288 64 0 0 0 0 0 0 0 352 Machinery (Fuel, Oil, Lube, Repair) 74 0 0 0 0 0 0 0 0 0 0 0 74 Vehicles (Fuel and Repair) 759 758 26 26 26 26 26 26 26 26 26 26 1,777 Equipment (Repair) 0 0 0 0 224 224 0 0 0 0 0 0 447 Taxes and Insurance 0 0 0 16 0 0 0 0 0 16 0 0 31 Purchased Bucks 0 0 0 0 0 0 0 800 0 0 0 0 800 TOTAL OPERATING COSTS 1,791 1,717 1,078 1,220 1,209 1,149 1,706 2,330 756 761 773 971 15,461 NET RETURNS -541 -224 732 1,347 784 -799 -1,331 -1,980 -106 16,094 1,852 -971 14,857 OPERATING INTEREST Cumulative Operating Cost 1,791 3,508 4,585 5,805 7,014 8,163 9,869 12,199 12,955 13,716 14,489 15,461 Interest on Operating Expenses 9 17 22 28 34 39 47 58 62 66 69 74 525
2010 Meat Goat Cost and Returns Study Northern California UC Cooperative Extension 13
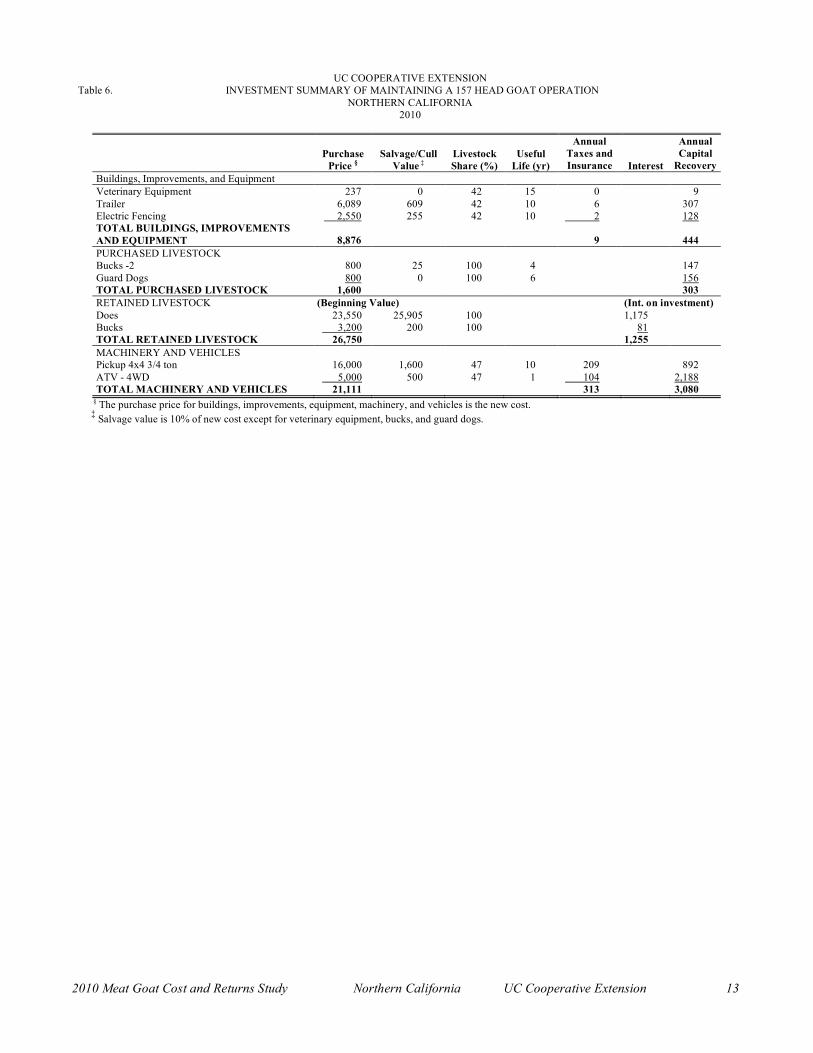
UC COOPERATIVE EXTENSION Table 6. INVESTMENT SUMMARY OF MAINTAINING A 157 HEAD GOAT OPERATION
NORTHERN CALIFORNIA 2010
Purchase
Price § Salvage/Cull
Value ‡ Livestock Share (%)
Useful Life (yr)
Annual Taxes and Insurance Interest
Annual Capital
Recovery Buildings, Improvements, and Equipment Veterinary Equipment 237 0 42 15 0 9 Trailer 6,089 609 42 10 6 307 Electric Fencing 2,550 255 42 10 2 128 TOTAL BUILDINGS, IMPROVEMENTS AND EQUIPMENT 8,876 9 444 PURCHASED LIVESTOCK Bucks -2 800 25 100 4 147 Guard Dogs 800 0 100 6 156 TOTAL PURCHASED LIVESTOCK 1,600 303 RETAINED LIVESTOCK (Beginning Value) (Int. on investment) Does 23,550 25,905 100 1,175 Bucks 3,200 200 100 81 TOTAL RETAINED LIVESTOCK 26,750 1,255 MACHINERY AND VEHICLES Pickup 4x4 3/4 ton 16,000 1,600 47 10 209 892 ATV - 4WD 5,000 500 47 1 104 2,188 TOTAL MACHINERY AND VEHICLES 21,111 313 3,080
§ The purchase price for buildings, improvements, equipment, machinery, and vehicles is the new cost. ‡ Salvage value is 10% of new cost except for veterinary equipment, bucks, and guard dogs.
2010 Meat Goat Cost and Returns Study Northern California UC Cooperative Extension 14
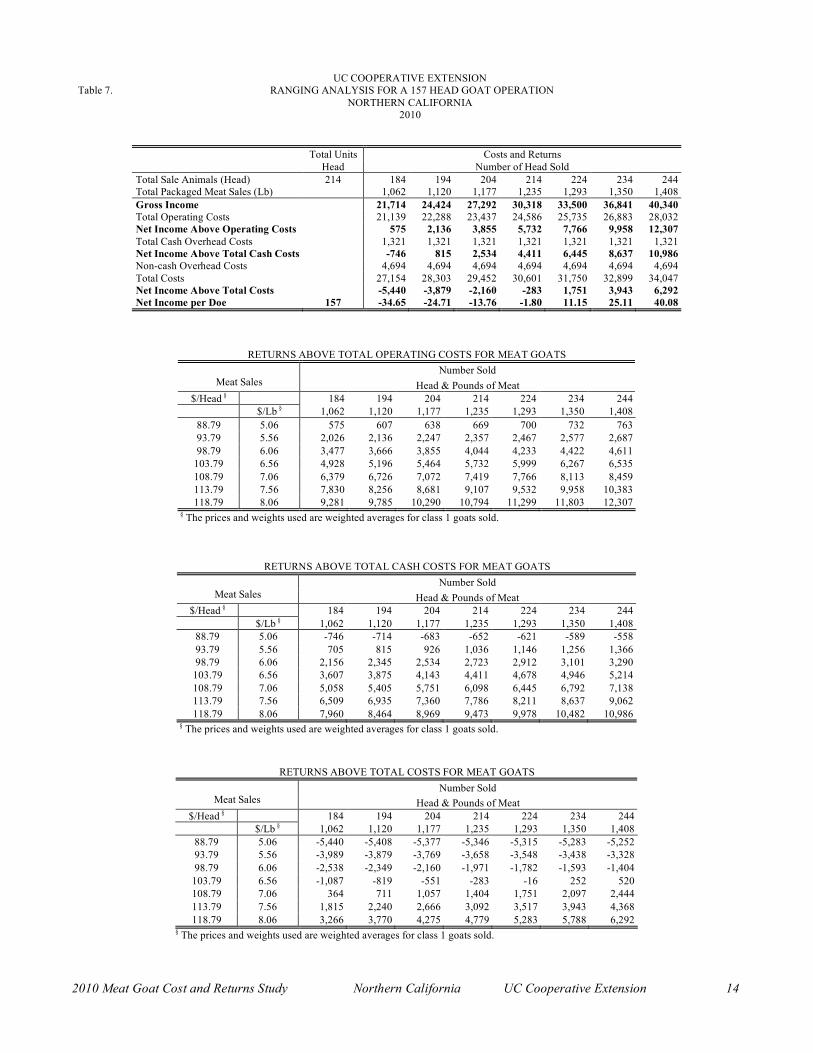
UC COOPERATIVE EXTENSION Table 7. RANGING ANALYSIS FOR A 157 HEAD GOAT OPERATION
NORTHERN CALIFORNIA 2010
Total Units Costs and Returns Head Number of Head Sold Total Sale Animals (Head) 214 184 194 204 214 224 234 244 Total Packaged Meat Sales (Lb) 1,062 1,120 1,177 1,235 1,293 1,350 1,408 Gross Income 21,714 24,424 27,292 30,318 33,500 36,841 40,340 Total Operating Costs 21,139 22,288 23,437 24,586 25,735 26,883 28,032 Net Income Above Operating Costs 575 2,136 3,855 5,732 7,766 9,958 12,307 Total Cash Overhead Costs 1,321 1,321 1,321 1,321 1,321 1,321 1,321 Net Income Above Total Cash Costs -746 815 2,534 4,411 6,445 8,637 10,986 Non-cash Overhead Costs 4,694 4,694 4,694 4,694 4,694 4,694 4,694 Total Costs 27,154 28,303 29,452 30,601 31,750 32,899 34,047 Net Income Above Total Costs -5,440 -3,879 -2,160 -283 1,751 3,943 6,292 Net Income per Doe 157 -34.65 -24.71 -13.76 -1.80 11.15 25.11 40.08
RETURNS ABOVE TOTAL OPERATING COSTS FOR MEAT GOATS Number Sold
Meat Sales Head & Pounds of Meat $/Head § 184 194 204 214 224 234 244
$/Lb § 1,062 1,120 1,177 1,235 1,293 1,350 1,408 88.79 5.06 575 607 638 669 700 732 763 93.79 5.56 2,026 2,136 2,247 2,357 2,467 2,577 2,687 98.79 6.06 3,477 3,666 3,855 4,044 4,233 4,422 4,611
103.79 6.56 4,928 5,196 5,464 5,732 5,999 6,267 6,535 108.79 7.06 6,379 6,726 7,072 7,419 7,766 8,113 8,459 113.79 7.56 7,830 8,256 8,681 9,107 9,532 9,958 10,383 118.79 8.06 9,281 9,785 10,290 10,794 11,299 11,803 12,307
§ The prices and weights used are weighted averages for class 1 goats sold.
RETURNS ABOVE TOTAL CASH COSTS FOR MEAT GOATS Number Sold
Meat Sales Head & Pounds of Meat $/Head § 184 194 204 214 224 234 244
$/Lb § 1,062 1,120 1,177 1,235 1,293 1,350 1,408 88.79 5.06 -746 -714 -683 -652 -621 -589 -558 93.79 5.56 705 815 926 1,036 1,146 1,256 1,366 98.79 6.06 2,156 2,345 2,534 2,723 2,912 3,101 3,290 103.79 6.56 3,607 3,875 4,143 4,411 4,678 4,946 5,214 108.79 7.06 5,058 5,405 5,751 6,098 6,445 6,792 7,138 113.79 7.56 6,509 6,935 7,360 7,786 8,211 8,637 9,062 118.79 8.06 7,960 8,464 8,969 9,473 9,978 10,482 10,986
§ The prices and weights used are weighted averages for class 1 goats sold.
RETURNS ABOVE TOTAL COSTS FOR MEAT GOATS Number Sold
Meat Sales Head & Pounds of Meat $/Head § 184 194 204 214 224 234 244
$/Lb § 1,062 1,120 1,177 1,235 1,293 1,350 1,408 88.79 5.06 -5,440 -5,408 -5,377 -5,346 -5,315 -5,283 -5,252 93.79 5.56 -3,989 -3,879 -3,769 -3,658 -3,548 -3,438 -3,328 98.79 6.06 -2,538 -2,349 -2,160 -1,971 -1,782 -1,593 -1,404 103.79 6.56 -1,087 -819 -551 -283 -16 252 520 108.79 7.06 364 711 1,057 1,404 1,751 2,097 2,444 113.79 7.56 1,815 2,240 2,666 3,092 3,517 3,943 4,368 118.79 8.06 3,266 3,770 4,275 4,779 5,283 5,788 6,292
§ The prices and weights used are weighted averages for class 1 goats sold.
2010 Meat Goat Cost and Returns Study Northern California UC Cooperative Extension 15
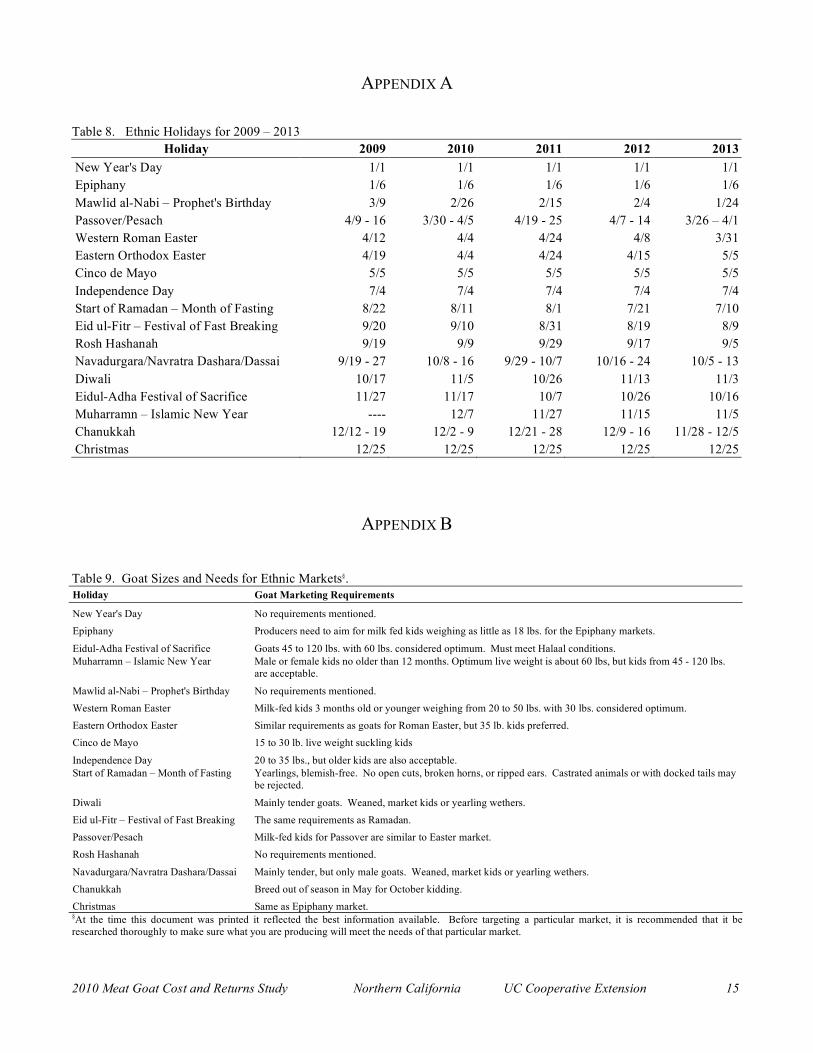
APPENDIX A Table 8. Ethnic Holidays for 2009 – 2013
Holiday 2009 2010 2011 2012 2013 New Year's Day 1/1 1/1 1/1 1/1 1/1 Epiphany 1/6 1/6 1/6 1/6 1/6 Mawlid al-Nabi – Prophet's Birthday 3/9 2/26 2/15 2/4 1/24 Passover/Pesach 4/9 - 16 3/30 - 4/5 4/19 - 25 4/7 - 14 3/26 – 4/1 Western Roman Easter 4/12 4/4 4/24 4/8 3/31 Eastern Orthodox Easter 4/19 4/4 4/24 4/15 5/5 Cinco de Mayo 5/5 5/5 5/5 5/5 5/5 Independence Day 7/4 7/4 7/4 7/4 7/4 Start of Ramadan – Month of Fasting 8/22 8/11 8/1 7/21 7/10 Eid ul-Fitr – Festival of Fast Breaking 9/20 9/10 8/31 8/19 8/9 Rosh Hashanah 9/19 9/9 9/29 9/17 9/5 Navadurgara/Navratra Dashara/Dassai 9/19 - 27 10/8 - 16 9/29 - 10/7 10/16 - 24 10/5 - 13 Diwali 10/17 11/5 10/26 11/13 11/3 Eidul-Adha Festival of Sacrifice 11/27 11/17 10/7 10/26 10/16 Muharramn – Islamic New Year ---- 12/7 11/27 11/15 11/5 Chanukkah 12/12 - 19 12/2 - 9 12/21 - 28 12/9 - 16 11/28 - 12/5 Christmas 12/25 12/25 12/25 12/25 12/25
APPENDIX B
Table 9. Goat Sizes and Needs for Ethnic Markets§. Holiday Goat Marketing Requirements
New Year's Day No requirements mentioned. Epiphany Producers need to aim for milk fed kids weighing as little as 18 lbs. for the Epiphany markets.
Eidul-Adha Festival of Sacrifice Goats 45 to 120 lbs. with 60 lbs. considered optimum. Must meet Halaal conditions. Muharramn – Islamic New Year Male or female kids no older than 12 months. Optimum live weight is about 60 lbs, but kids from 45 - 120 lbs.
are acceptable.
Mawlid al-Nabi – Prophet's Birthday No requirements mentioned. Western Roman Easter Milk-fed kids 3 months old or younger weighing from 20 to 50 lbs. with 30 lbs. considered optimum. Eastern Orthodox Easter Similar requirements as goats for Roman Easter, but 35 lb. kids preferred. Cinco de Mayo 15 to 30 lb. live weight suckling kids
Independence Day 20 to 35 lbs., but older kids are also acceptable. Start of Ramadan – Month of Fasting Yearlings, blemish-free. No open cuts, broken horns, or ripped ears. Castrated animals or with docked tails may
be rejected.
Diwali Mainly tender goats. Weaned, market kids or yearling wethers. Eid ul-Fitr – Festival of Fast Breaking The same requirements as Ramadan. Passover/Pesach Milk-fed kids for Passover are similar to Easter market. Rosh Hashanah No requirements mentioned.
Navadurgara/Navratra Dashara/Dassai Mainly tender, but only male goats. Weaned, market kids or yearling wethers. Chanukkah Breed out of season in May for October kidding. Christmas Same as Epiphany market. §At the time this document was printed it reflected the best information available. Before targeting a particular market, it is recommended that it be researched thoroughly to make sure what you are producing will meet the needs of that particular market.