Embed Size (px)
DESCRIPTION
This white paper, originally created for eyefortravel, examines the Facebook usage and adoption patterns in the Asian Travel Industry. The Report looks at the Top 20 Asia Travel brands in an attempt to glean intelligence relating to how those brands have deployed on Facebook and how they are faring with their efforts. Data in this Report includes: number of profiles maintained by each brand, number of fans, default tabs used and custom tabs used. The paper examines content strategies and investigates how the brands are using custom tabs and applications. The data for this white paper was gathered in April 2011. The Report contrasts the results of this year's research with that gathered in April 2010 as a means of providing trend analysis.
Citation preview
A Snapshot Of The Asia Travel
Industry’s Market Leaders
THE 2011FACEBOOKENGAGEMENTREPORT
Table of Contents
Execu&ve Summary 2
Preliminary Ma4ers 3
The Rise of the Big Brands 4
A Year of Spectacular Growth 5
Number of Fans 6
Fan Page Content Strategy 7
How Many Fan Pages? 7
Facebook Applica&ons Usage Pa4erns 8
Default Facebook Tab Usage 8
Custom Tab Usage Pa4erns 9
Leveraging Social Media 10
Use of Interac&ve Promo&ons 11
The Top 20 12
About the Publisher 13
About the Author 13
EXECUTIVE SUMMARY
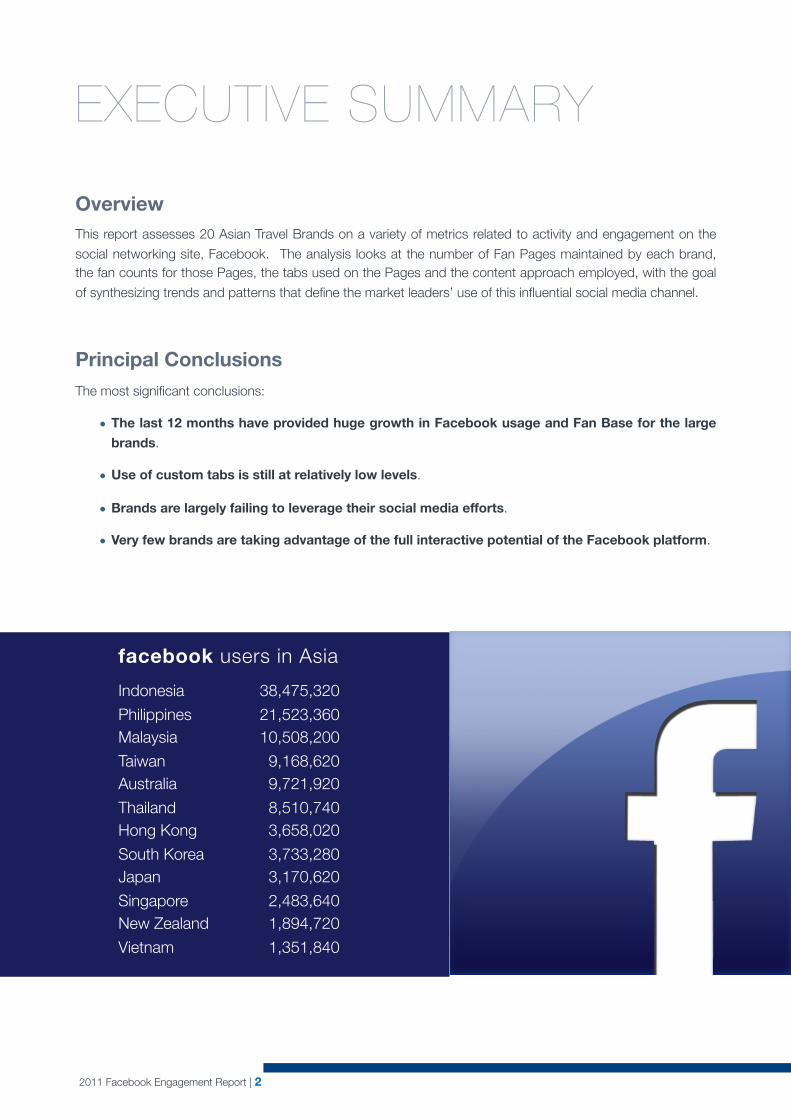
OverviewThis report assesses 20 Asian Travel Brands on a variety of metrics related to activity and engagement on the
social networking site, Facebook. The analysis looks at the number of Fan Pages maintained by each brand, the fan counts for those Pages, the tabs used on the Pages and the content approach employed, with the goal
of synthesizing trends and patterns that define the market leaders’ use of this influential social media channel.
Principal ConclusionsThe most significant conclusions:
• The last 12 months have provided huge growth in Facebook usage and Fan Base for the large
brands.
• Use of custom tabs is still at relatively low levels.
• Brands are largely failing to leverage their social media efforts.
• Very few brands are taking advantage of the full interactive potential of the Facebook platform.
Indonesia 38,475,320
Philippines 21,523,360Malaysia 10,508,200
Taiwan 9,168,620Australia 9,721,920
Thailand 8,510,740Hong Kong 3,658,020
South Korea 3,733,280Japan 3,170,620
Singapore 2,483,640New Zealand 1,894,720
Vietnam 1,351,840
2011 Facebook Engagement Report | 2
facebook users in Asia
PRELIMINARY MATTERS
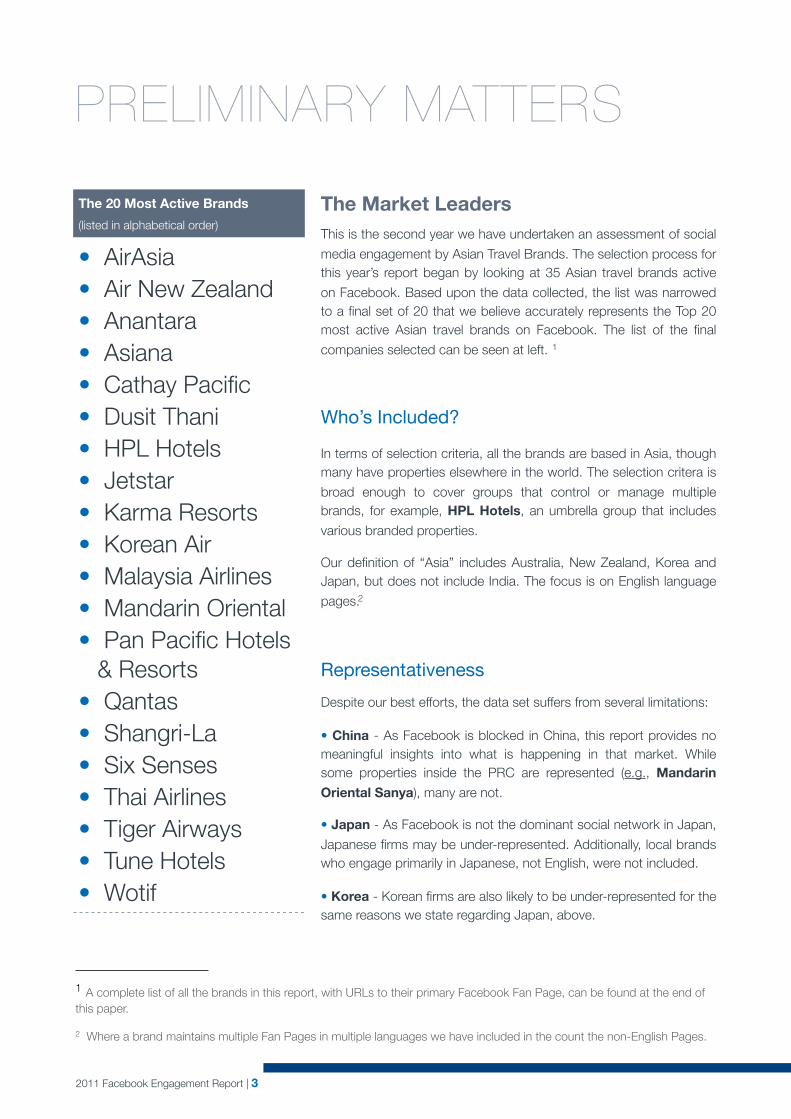
The Market LeadersThis is the second year we have undertaken an assessment of social
media engagement by Asian Travel Brands. The selection process for this year’s report began by looking at 35 Asian travel brands active
on Facebook. Based upon the data collected, the list was narrowed to a final set of 20 that we believe accurately represents the Top 20 most active Asian travel brands on Facebook. The list of the final
companies selected can be seen at left. 1
Who’s Included?
In terms of selection criteria, all the brands are based in Asia, though many have properties elsewhere in the world. The selection critera is
broad enough to cover groups that control or manage multiple brands, for example, HPL Hotels, an umbrella group that includes
various branded properties.
Our definition of “Asia” includes Australia, New Zealand, Korea and Japan, but does not include India. The focus is on English language
pages.2
Representativeness
Despite our best efforts, the data set suffers from several limitations:
• China - As Facebook is blocked in China, this report provides no meaningful insights into what is happening in that market. While some properties inside the PRC are represented (e.g., Mandarin
Oriental Sanya), many are not.
• Japan - As Facebook is not the dominant social network in Japan,
Japanese firms may be under-represented. Additionally, local brands who engage primarily in Japanese, not English, were not included.
• Korea - Korean firms are also likely to be under-represented for the same reasons we state regarding Japan, above.
1 A complete list of all the brands in this report, with URLs to their primary Facebook Fan Page, can be found at the end of this paper.
2 Where a brand maintains multiple Fan Pages in multiple languages we have included in the count the non-English Pages.
The 20 Most Active Brands
(listed in alphabetical order)
• AirAsia• Air New Zealand• Anantara• Asiana• Cathay Pacific• Dusit Thani• HPL Hotels• Jetstar• Karma Resorts• Korean Air• Malaysia Airlines• Mandarin Oriental• Pan Pacific Hotels
& Resorts• Qantas• Shangri-La• Six Senses• Thai Airlines• Tiger Airways• Tune Hotels• Wotif
2011 Facebook Engagement Report | 3
The Rise of the Big BrandsWhere last year’s survey of the market leaders included a number of smaller, single property firms, this year’s
Top 20 is dominated by the big brands. As we observed last year, it was still early days. This year the competitive landscape has shifted; the big brands have woken up and mobilized their significant resources and it shows in our results.
Among the properties listed last year that were not included this year:
• Alila
• Aman Resorts
• Angkor Palace
• Ayana Resort & Spa
• Bali Individual Tour & Travel
• Bali Safari & Marine Park
Of that group, many are smaller firms, or companies with only one property. The smaller firms, though more agile in developing their Facebook presence, were not able to keep pace with the larger brands in the long run.3
New to the leader board this year are:
• Asiana
• Korean Air
• Pan Pacific Hotels & Resorts
• Tune Hotels
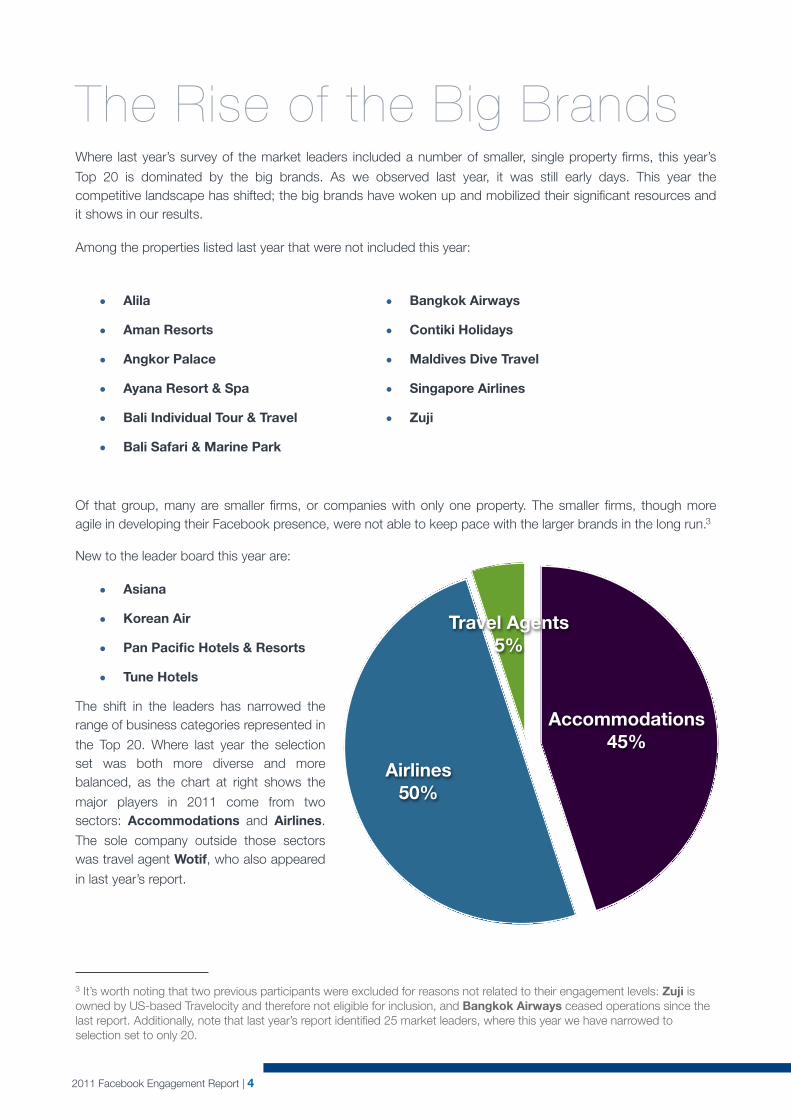
The shift in the leaders has narrowed the range of business categories represented in
the Top 20. Where last year the selection set was both more diverse and more balanced, as the chart at right shows the
major players in 2011 come from two sectors: Accommodations and Airlines.
The sole company outside those sectors was travel agent Wotif, who also appeared
in last year’s report.
3 It’s worth noting that two previous participants were excluded for reasons not related to their engagement levels: Zuji is owned by US-based Travelocity and therefore not eligible for inclusion, and Bangkok Airways ceased operations since the last report. Additionally, note that last year’s report identified 25 market leaders, where this year we have narrowed to selection set to only 20.
Travel Agents5%
Airlines50%
Accommodations45%
• Bangkok Airways
• Contiki Holidays
• Maldives Dive Travel
• Singapore Airlines
• Zuji
2011 Facebook Engagement Report | 4
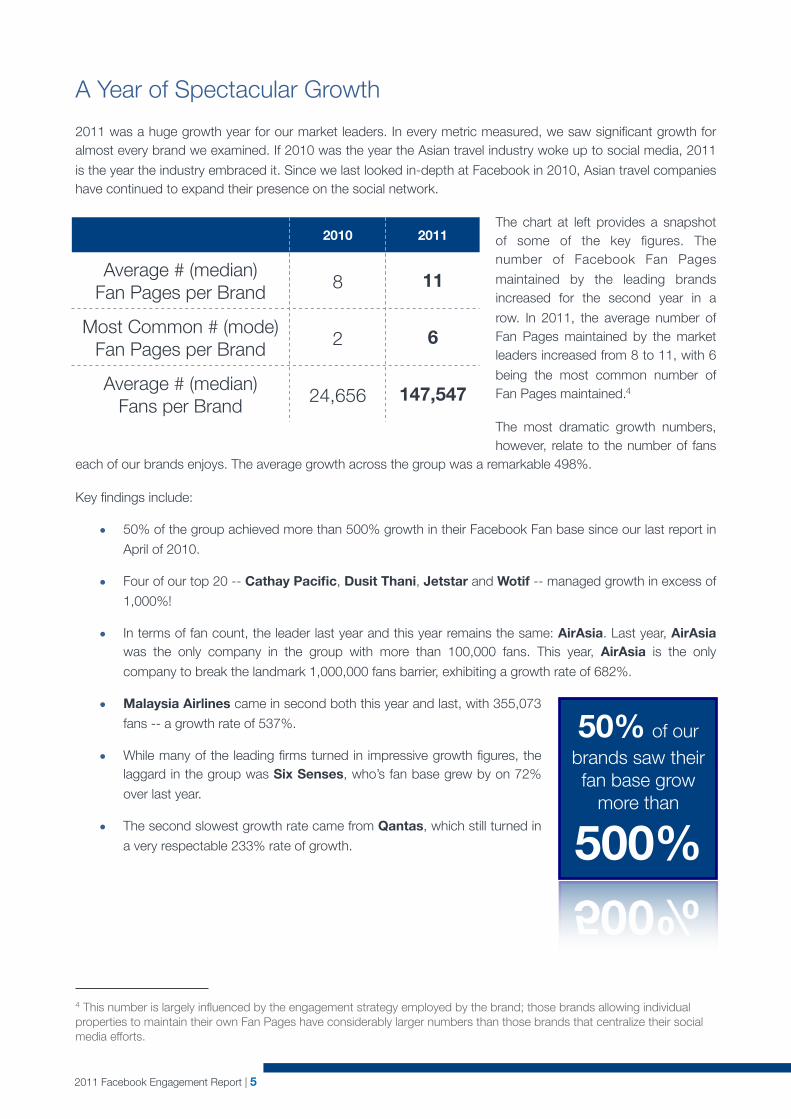
A Year of Spectacular Growth
2011 was a huge growth year for our market leaders. In every metric measured, we saw significant growth for almost every brand we examined. If 2010 was the year the Asian travel industry woke up to social media, 2011
is the year the industry embraced it. Since we last looked in-depth at Facebook in 2010, Asian travel companies have continued to expand their presence on the social network.
The chart at left provides a snapshot of some of the key figures. The number of Facebook Fan Pages
maintained by the leading brands increased for the second year in a
row. In 2011, the average number of Fan Pages maintained by the market leaders increased from 8 to 11, with 6
being the most common number of Fan Pages maintained.4
The most dramatic growth numbers, however, relate to the number of fans
each of our brands enjoys. The average growth across the group was a remarkable 498%.
Key findings include:
• 50% of the group achieved more than 500% growth in their Facebook Fan base since our last report in
April of 2010.
• Four of our top 20 -- Cathay Pacific, Dusit Thani, Jetstar and Wotif -- managed growth in excess of
1,000%!
• In terms of fan count, the leader last year and this year remains the same: AirAsia. Last year, AirAsia was the only company in the group with more than 100,000 fans. This year, AirAsia is the only
company to break the landmark 1,000,000 fans barrier, exhibiting a growth rate of 682%.
• Malaysia Airlines came in second both this year and last, with 355,073
fans -- a growth rate of 537%.
• While many of the leading firms turned in impressive growth figures, the laggard in the group was Six Senses, who’s fan base grew by on 72%
over last year.
• The second slowest growth rate came from Qantas, which still turned in
a very respectable 233% rate of growth.
4 This number is largely influenced by the engagement strategy employed by the brand; those brands allowing individual properties to maintain their own Fan Pages have considerably larger numbers than those brands that centralize their social media efforts.
2010 2011
Average # (median)Fan Pages per Brand 8 11
Most Common # (mode)Fan Pages per Brand 2 6
Average # (median)Fans per Brand 24,656 147,547
50% of our brands saw their fan base grow
more than
500%
2011 Facebook Engagement Report | 5
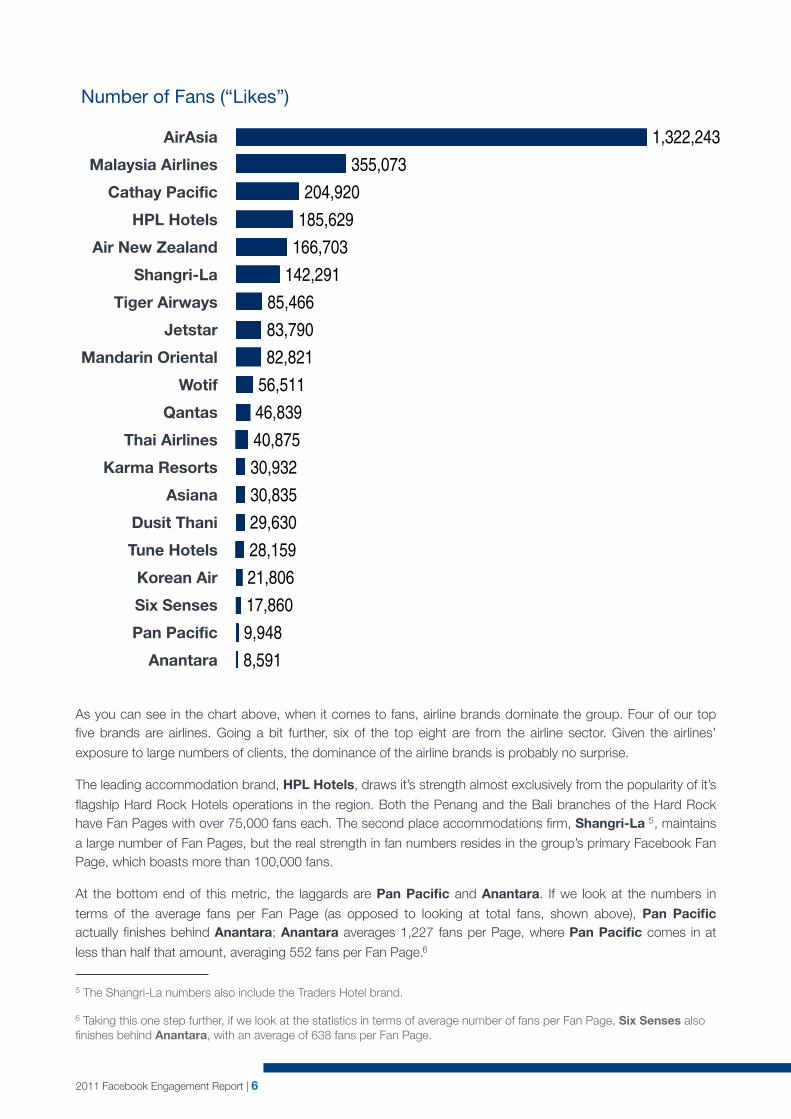
As you can see in the chart above, when it comes to fans, airline brands dominate the group. Four of our top five brands are airlines. Going a bit further, six of the top eight are from the airline sector. Given the airlines’
exposure to large numbers of clients, the dominance of the airline brands is probably no surprise.
The leading accommodation brand, HPL Hotels, draws it’s strength almost exclusively from the popularity of it’s
flagship Hard Rock Hotels operations in the region. Both the Penang and the Bali branches of the Hard Rock have Fan Pages with over 75,000 fans each. The second place accommodations firm, Shangri-La 5, maintains
a large number of Fan Pages, but the real strength in fan numbers resides in the group’s primary Facebook Fan Page, which boasts more than 100,000 fans.
At the bottom end of this metric, the laggards are Pan Pacific and Anantara. If we look at the numbers in
terms of the average fans per Fan Page (as opposed to looking at total fans, shown above), Pan Pacific actually finishes behind Anantara; Anantara averages 1,227 fans per Page, where Pan Pacific comes in at
less than half that amount, averaging 552 fans per Fan Page.6
5 The Shangri-La numbers also include the Traders Hotel brand.
6 Taking this one step further, if we look at the statistics in terms of average number of fans per Fan Page, Six Senses also finishes behind Anantara, with an average of 638 fans per Fan Page.
Number of Fans (“Likes”)
AirAsia
Malaysia Airlines
Cathay Pacific
HPL Hotels
Air New Zealand
Shangri-La
Tiger Airways
Jetstar
Mandarin Oriental
Wotif
Qantas
Thai Airlines
Karma Resorts
Asiana
Dusit Thani
Tune Hotels
Korean Air
Six Senses
Pan Pacific
Anantara 8,5919,94817,86021,80628,15929,63030,83530,93240,87546,83956,51182,82183,79085,466
142,291166,703185,629204,920
355,0731,322,243
2011 Facebook Engagement Report | 6
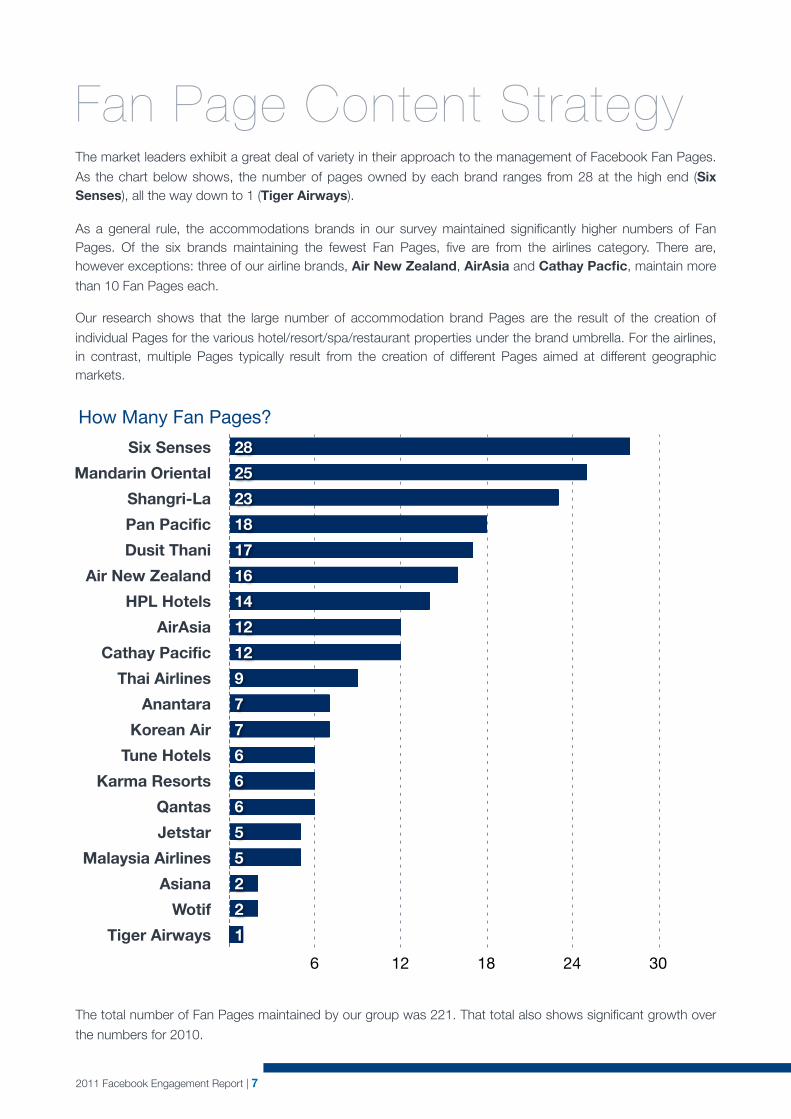
Fan Page Content StrategyThe market leaders exhibit a great deal of variety in their approach to the management of Facebook Fan Pages.
As the chart below shows, the number of pages owned by each brand ranges from 28 at the high end (Six Senses), all the way down to 1 (Tiger Airways).
As a general rule, the accommodations brands in our survey maintained significantly higher numbers of Fan Pages. Of the six brands maintaining the fewest Fan Pages, five are from the airlines category. There are, however exceptions: three of our airline brands, Air New Zealand, AirAsia and Cathay Pacfic, maintain more
than 10 Fan Pages each.
Our research shows that the large number of accommodation brand Pages are the result of the creation of
individual Pages for the various hotel/resort/spa/restaurant properties under the brand umbrella. For the airlines, in contrast, multiple Pages typically result from the creation of different Pages aimed at different geographic markets.
The total number of Fan Pages maintained by our group was 221. That total also shows significant growth over
the numbers for 2010.
Six Senses
Mandarin Oriental
Shangri-La
Pan Pacific
Dusit Thani
Air New Zealand
HPL Hotels
AirAsia
Cathay Pacific
Thai Airlines
Anantara
Korean Air
Tune Hotels
Karma Resorts
Qantas
Jetstar
Malaysia Airlines
Asiana
Wotif
Tiger Airways
6 12 18 24 30
1
2
2
5
5
6
6
6
7
7
9
12
12
14
16
17
18
23
25
28
How Many Fan Pages?
2011 Facebook Engagement Report | 7
Facebook Application Usage Patterns
We looked at all 221 Fan Pages maintained by the leading brands in an attempt to gain some insight into the tab usage patterns. The analysis revealed less variety than we expected. Not only were most brands using only
the default tab options, but also relatively few employed advanced interactive content applications. Moreover, almost no Fan Pages were exploiting fully the possibilities offered by the use of iFrames in Fan Pages.
The default Facebook Fan Page offers a stock set of tabs. The default set can include7:
• Info
• Photos
• Discussions
• Notes
• Events
• Video
• Reviews
• Links
Of the default tab options, only the Info tab is required and cannot be deleted or hidden. We found the Photos
tab to be nearly ubiquitous, with 98% of the pages employing the tab in some fashion; thereafter, however, we saw a great deal of diversity. The Discussions and Notes tabs were the only other tabs to be employed by at
7 The exact contents of the default set depends on when the Page was created, as Facebook has made changes to this functionality over time.
Photos
Discussions
Notes
Events
Video
Links
Polls/Questions
Reviews
10% 20% 30% 40% 50% 60% 70% 80% 90% 100%
12%
14%
20%
33%
47%
50%
57%
98%
Default Facebook Tab Usage
2011 Facebook Engagement Report | 8
least 50% of the pages8. The Events tab was also seen in nearly half of the cases (47%). The other default tabs were significantly less common, with the Polls, Questions and Reviews tabs being the least popular, as seen in
the chart, above.
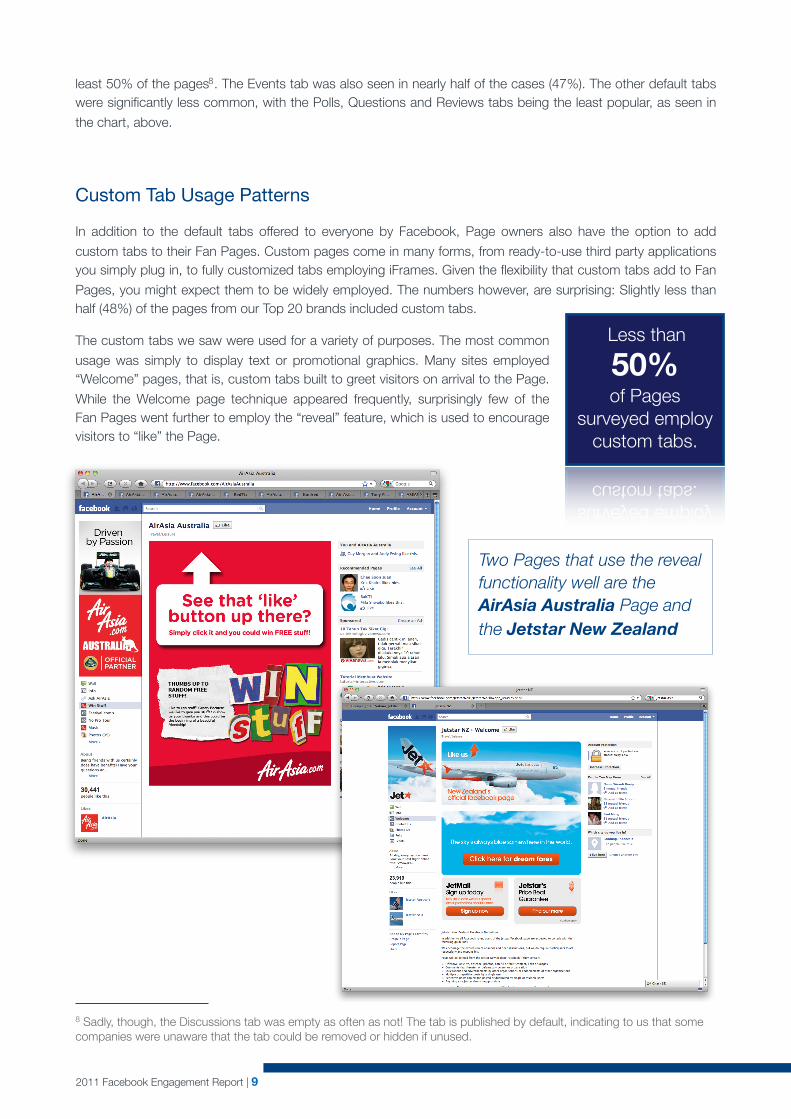
Custom Tab Usage Patterns
In addition to the default tabs offered to everyone by Facebook, Page owners also have the option to add
custom tabs to their Fan Pages. Custom pages come in many forms, from ready-to-use third party applications you simply plug in, to fully customized tabs employing iFrames. Given the flexibility that custom tabs add to Fan
Pages, you might expect them to be widely employed. The numbers however, are surprising: Slightly less than half (48%) of the pages from our Top 20 brands included custom tabs.
The custom tabs we saw were used for a variety of purposes. The most common
usage was simply to display text or promotional graphics. Many sites employed “Welcome” pages, that is, custom tabs built to greet visitors on arrival to the Page.
While the Welcome page technique appeared frequently, surprisingly few of the Fan Pages went further to employ the “reveal” feature, which is used to encourage visitors to “like” the Page.
8 Sadly, though, the Discussions tab was empty as often as not! The tab is published by default, indicating to us that some companies were unaware that the tab could be removed or hidden if unused.
Less than
50% of Pages
surveyed employ custom tabs.
Two Pages that use the reveal functionality well are the AirAsia Australia Page and the Jetstar New Zealand
2011 Facebook Engagement Report | 9
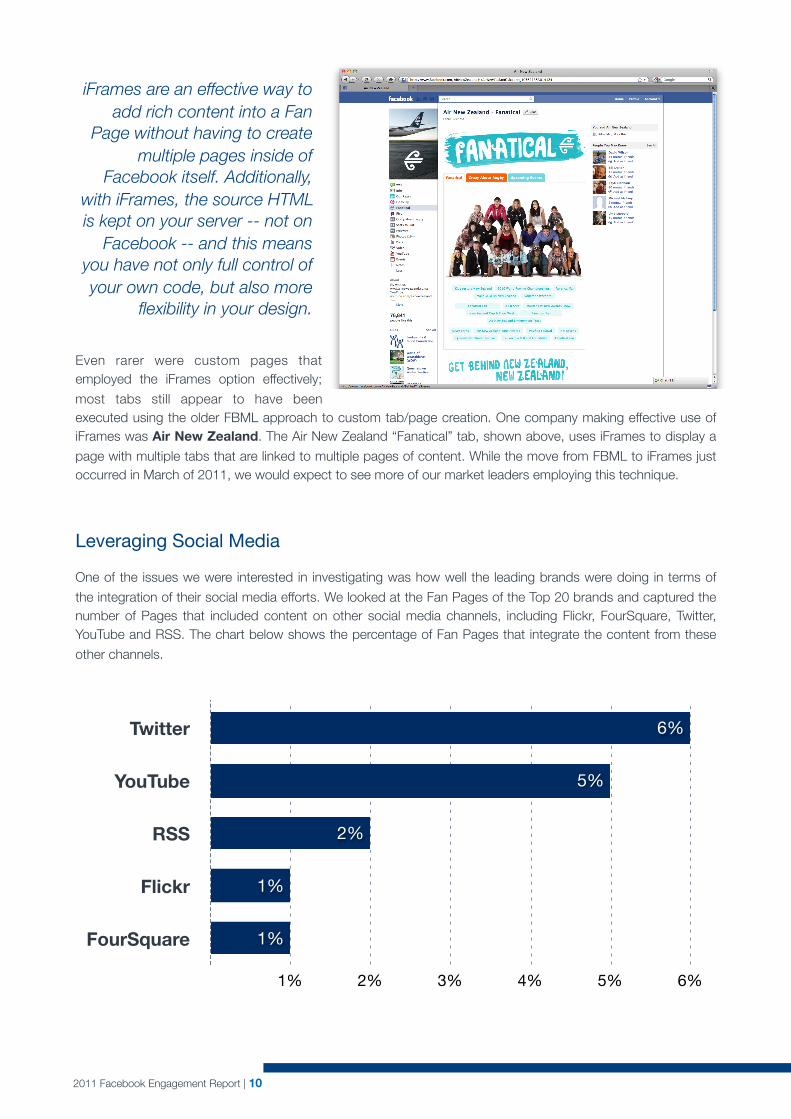
Even rarer were custom pages that employed the iFrames option effectively;
most tabs still appear to have been executed using the older FBML approach to custom tab/page creation. One company making effective use of iFrames was Air New Zealand. The Air New Zealand “Fanatical” tab, shown above, uses iFrames to display a
page with multiple tabs that are linked to multiple pages of content. While the move from FBML to iFrames just occurred in March of 2011, we would expect to see more of our market leaders employing this technique.
Leveraging Social Media
One of the issues we were interested in investigating was how well the leading brands were doing in terms of
the integration of their social media efforts. We looked at the Fan Pages of the Top 20 brands and captured the number of Pages that included content on other social media channels, including Flickr, FourSquare, Twitter, YouTube and RSS. The chart below shows the percentage of Fan Pages that integrate the content from these
other channels.
YouTube
RSS
Flickr
FourSquare
1% 2% 3% 4% 5% 6%
1%
1%
2%
5%
6%
iFrames are an effective way to add rich content into a Fan
Page without having to create multiple pages inside of
Facebook itself. Additionally, with iFrames, the source HTML is kept on your server -- not on
Facebook -- and this means you have not only full control of your own code, but also more
flexibility in your design.
2011 Facebook Engagement Report | 10
The numbers are surprisingly low. Perhaps the most obvious example is Twitter. All of the Top 20 brands maintain at least one9 Twitter profile, yet only 6% of the Fan Pages integrate the brand’s Twitter stream. The
numbers are even worse for other social media channels, from 5% for YouTube to a mere 1% for Flickr and FourSquare. Only one of our survey set incorporated a document sharing site (Scribd).
Despite their sophistication in other areas of Facebook usage, brands still seem to be treating their social media
channels as silos, as opposed to promoting engagement across channels. In this area at the very least, it seems many companies are missing clear opportunities for richer engagement with their fans.
Use of Interactive Promotions
Another area with surprisingly low numbers is the use of interactive promotions. As the chart below shows,
relatively few of the Fan Pages employ tabs that contain interactive applications intended to directly promote sales or build brand loyalty.
While there are a number of Fan Pages that employ content pages containing promotional information, the use of Facebook purely for display advertising fails to take full advantage of the rich media and interactive
possibilities of the Facebook platform. The Facebook Only Specials category, indicated in the chart above, typically took the form of content pages that employ the reveal functionality; a simple mechanism, but effective for this limited purpose.
• Of those Pages employing Contests or Games, the most common application provider was Wildfire10, though several Pages appear to be using proprietary gaming platforms.
• For those Fan Pages providing a Bookings and Reservations functionality, there does not yet appear to be a dominant provider.
• Room bookings functionality came from a number of providers, including FastBooking.11
• Restaurant reservations were dominated by OpenTable.12
• Airfares and other more specialized bookings appear to rely on proprietary systems.13
9 In most cases our Top 20 maintained multiple Twitter profiles. Five of our brands have more than 10 Twitter profiles. At the extreme top end of the scale, Mandarin Oriental has 19.
10 http://www.wildfiregames.com
11 http://www.fastbooking.com
12 http://www.opentable.com
13 The source of a number of the bookings systems was not reliably discernible from the code on the Page.
2011 Facebook Engagement Report | 11
Contests
Bookings
Facebook Only Specials
Games
1% 2% 3% 4% 5% 6% 7% 8%
1%
4%
8%
8%
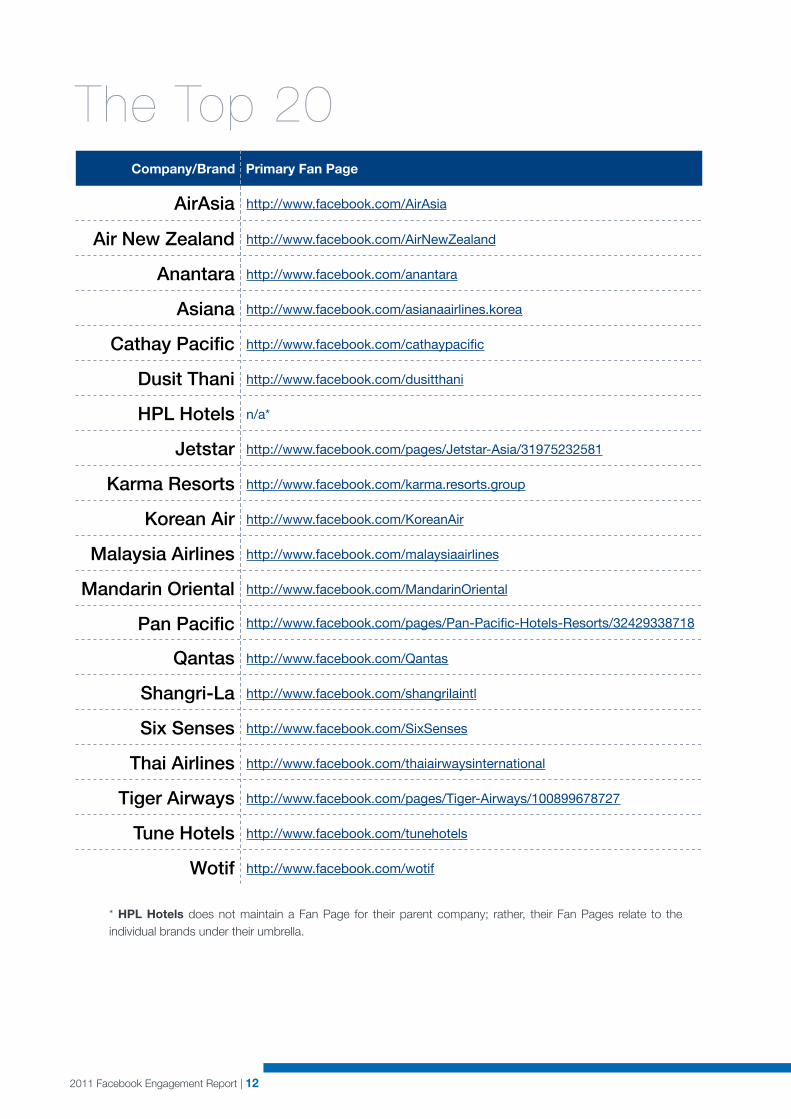
The Top 20Company/Brand Primary Fan Page
AirAsia http://www.facebook.com/AirAsia
Air New Zealand http://www.facebook.com/AirNewZealand
Anantara http://www.facebook.com/anantara
Asiana http://www.facebook.com/asianaairlines.korea
Cathay Pacific http://www.facebook.com/cathaypacific
Dusit Thani http://www.facebook.com/dusitthani
HPL Hotels n/a*
Jetstar http://www.facebook.com/pages/Jetstar-Asia/31975232581
Karma Resorts http://www.facebook.com/karma.resorts.group
Korean Air http://www.facebook.com/KoreanAir
Malaysia Airlines http://www.facebook.com/malaysiaairlines
Mandarin Oriental http://www.facebook.com/MandarinOriental
Pan Pacific http://www.facebook.com/pages/Pan-Pacific-Hotels-Resorts/32429338718
Qantas http://www.facebook.com/Qantas
Shangri-La http://www.facebook.com/shangrilaintl
Six Senses http://www.facebook.com/SixSenses
Thai Airlines http://www.facebook.com/thaiairwaysinternational
Tiger Airways http://www.facebook.com/pages/Tiger-Airways/100899678727
Tune Hotels http://www.facebook.com/tunehotels
Wotif http://www.facebook.com/wotif
* HPL Hotels does not maintain a Fan Page for their parent company; rather, their Fan Pages relate to the individual brands under their umbrella.
2011 Facebook Engagement Report | 12
About the Publisher
EyeforTravel is a media company specialising in business intelligence for the travel, hospitality and tourism
industry. For 14 years, we have been conducting industry research and producing major industry events around the
globe to unite the industry and share best-practices, trends and future forecasts.
EyeforTravel also provides some of the most in-depth
research into global online travel markets and trends. Our research site at http://events.eyefortravel.com/knowledgebox/ is the information hub for the global travel and
tourism industry and is an indispensable tool for anyone who is involved in online travel or travel distribution.
We have a highly detailed Social Media case-study report coming out this June which will focus on Global trends and best-practices from the most innovative and successful social media brands in travel. For more info
please email [email protected]
Contact Details
EyeforTravel Ltd7-9 Fashion StreetLondonE1 6PX
United Kingdom
About the Author
water&stone is a full service digital agency based in Bali, Indonesia. The firm provides
interactive design, online marketing strategy and research services for companies around the world, including a number of travel and tourism companies in Asia Pacific. With a background in open source technology and an extensive track record in helping clients realize value from new media, water&stone is one of only a handful of companies in Asia-Pac that is able to deliver cutting edge strategy and design with
world class quality.
This report references data and conclusions published in April 2010 in the Asia Travel Engagement Report. That Report can be downloaded free of charge from the water&stone website by visiting: http://www.waterandstone.com/book/white-papers
Contact Details
23a Jalan Raya Semer
Kerobokan, Kuta
Bali, Indonesia
80361
T 62 361 739 969
2011 Facebook Engagement Report | 13
Web: www.eyefortravel.com
Twitter: www.twitter.com/eyefortravel
LinkedIn: Asia Travel Executives
eMail: [email protected]
Web: www.waterandstone.com
Facebook: www.facebook.com/waterandstone
Twitter: www.twitter.com/waterandstone
eMail: [email protected]