Embed Size (px)
DESCRIPTION
This report is the result of area executives providing their time and feedback regarding business operations and the local economic environment. The data was collected during the first two quarters of 2011. All company specific information is held in strict confidence with only aggregated data being shared. ICAD Group works to maintain and improve our local business climate to help existing industry succeed and grow. Our efforts and programming in workforce, education and public policy are dictated by the results of this survey. Additionally, we are able to chart local trends and compare them to state and national data.
Citation preview
ICAD Group works to maintain and improve our local business climate to help existing industry succeed and grow. Our efforts and programming in workforce, education and public policy are dictated by the results of this survey. Additionally, we are able to chart local trends and compare them to state and national data.
This report is the result of area executives providing their time and feedback regarding business operations and the local economic environment. All company specific information is held in strict confidence with only aggregated data being shared.
EXISTING INDUSTRY REPORT RESULTS FROM THE 2011 ICAD GROUP SYNCHRONIST SURVEY
1 EXISTING INDUSTRY REPORT RESULTS FROM THE 2011 ICAD GROUP SYNCHRONIST SURVEY
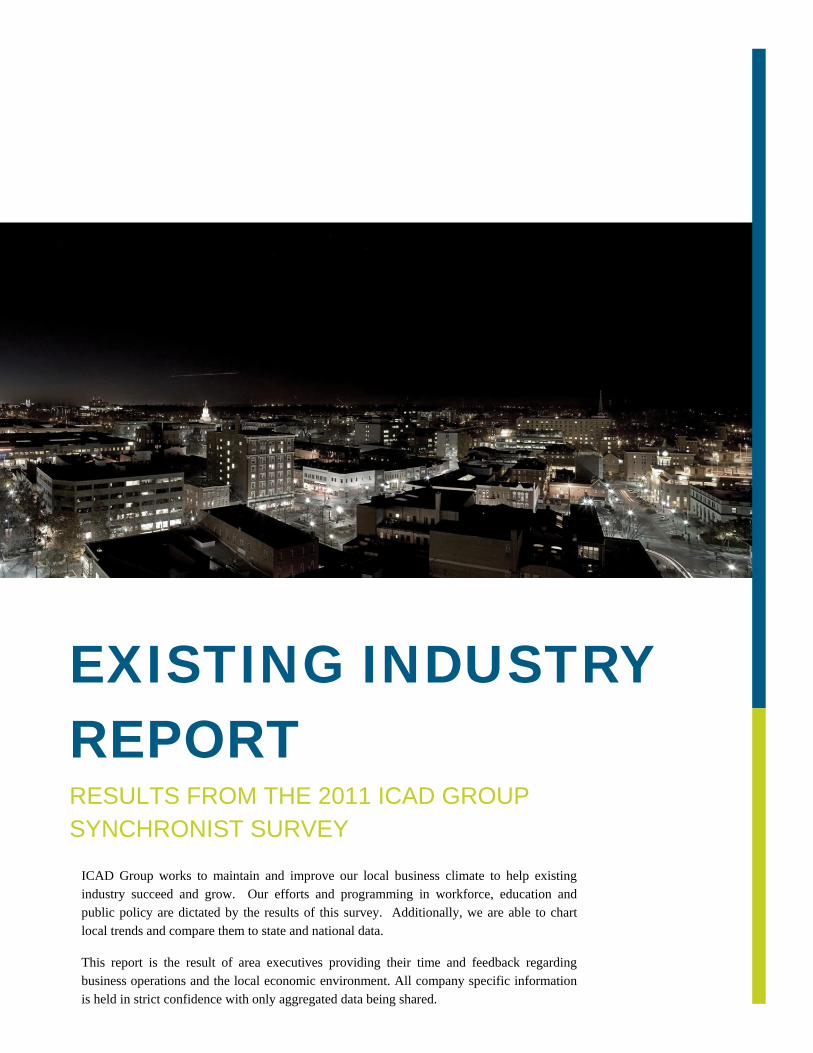
KEY PEFORMANCE INDICATORS
This chart shows how the portfolio of Iowa City area companies surveyed responded to key performance indicators compared to most recent national and state level data.
Local companies are considerably more optimistic about their ability to grow and create employment through their ability to continue offering new products and services to the markets they serve.
Of the companies
interviewed this year, 89%
have introduced a new
product or service in the
last 5 years.
The national average for
2010 was 67%.
70% of surveyed
companies in this most
recent cycle indicate they
have plans to expand in
terms of capital investment,
new jobs or additional
square footage.
2 2011 EXISTING INDUSTRY SNAPSHOT Companies surveyed: 65 Total employment of surveyed companies: 13,709 (2.1% increase from 2010) Total annual payroll of surveyed companies: $742M Projected net new jobs in next 3 years: 1,130 Current unfilled positions at time of interview: 388
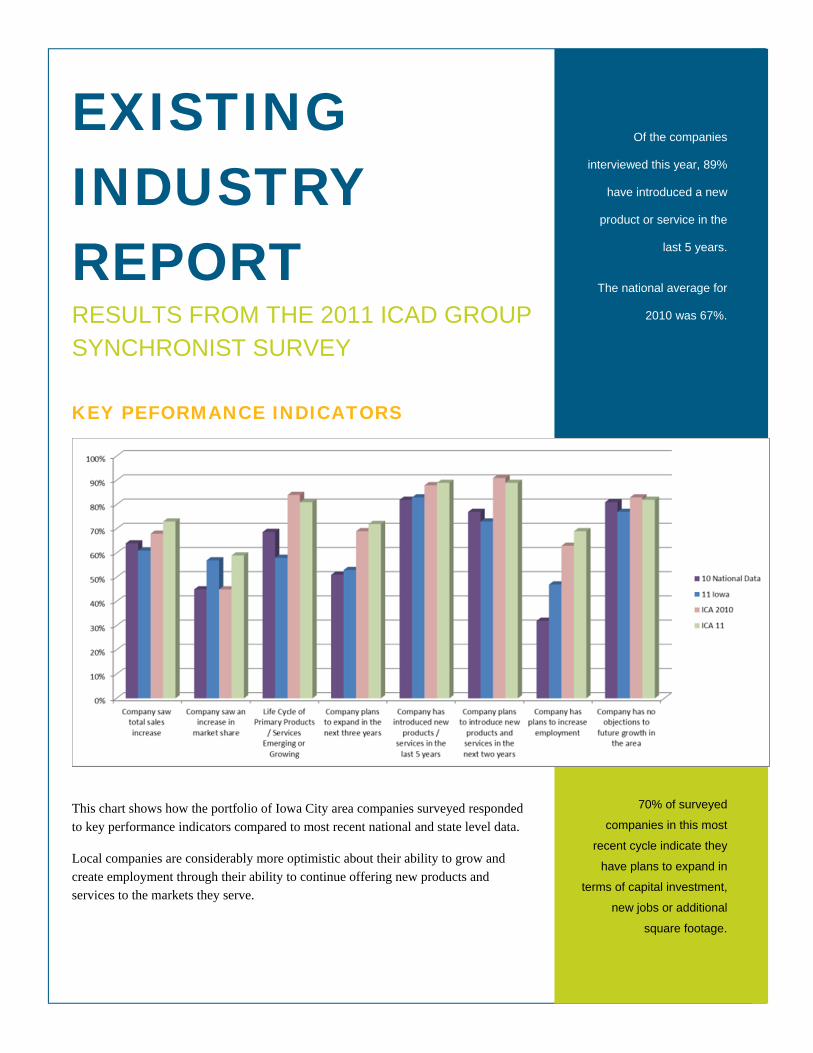
SATISFACTION WITH AREA LABOR FORCE
IOWA CITY AREA AVAILABILITY, QUALITY, STABILITY AND PRODUCTIVITY OVER TIME
This chart plots the opinions of local companies regarding four workforce characteristics since 2001-2003. Those interviewed are asked to provide rankings on a 1-7 scale, with 7 being the highest. As noted, the Availability of area workforce is equal to national data. Quality and Stability rate higher. Productivity is slightly lower for the first time since conducting this analysis.
68% of companies surveyed locally indicate they are having difficulty filling some positions. When asked if the hiring issues are more attributable to the community or the industry, respondents indicated it was more industry (56%) to community (44%). 58% of local firms surveyed indicated they were investing more in employee training.
2001-2003
2004-2005
2006 2007 2008 2009 2010 2011
Employee Availability 4.6 4.2 4.1 4.6 4.6 5.1 5.1 4.9
Quality of Local Workforce 6.1 5.6 5.2 5.8 5.6 5.6 5.6 5.4
Employee Stability 5.6 4.9 5 5.7 5.5 5.5 5.4 5.4
Productivity of Workforce 6.2 5.9 5.7 6 5.9 5.5 5.9 5.6
1
2
3
4
5
6
7
2011 National Data
Availability: 4.9Quality: 5.0Stability: 5.3Productivity: 5.7
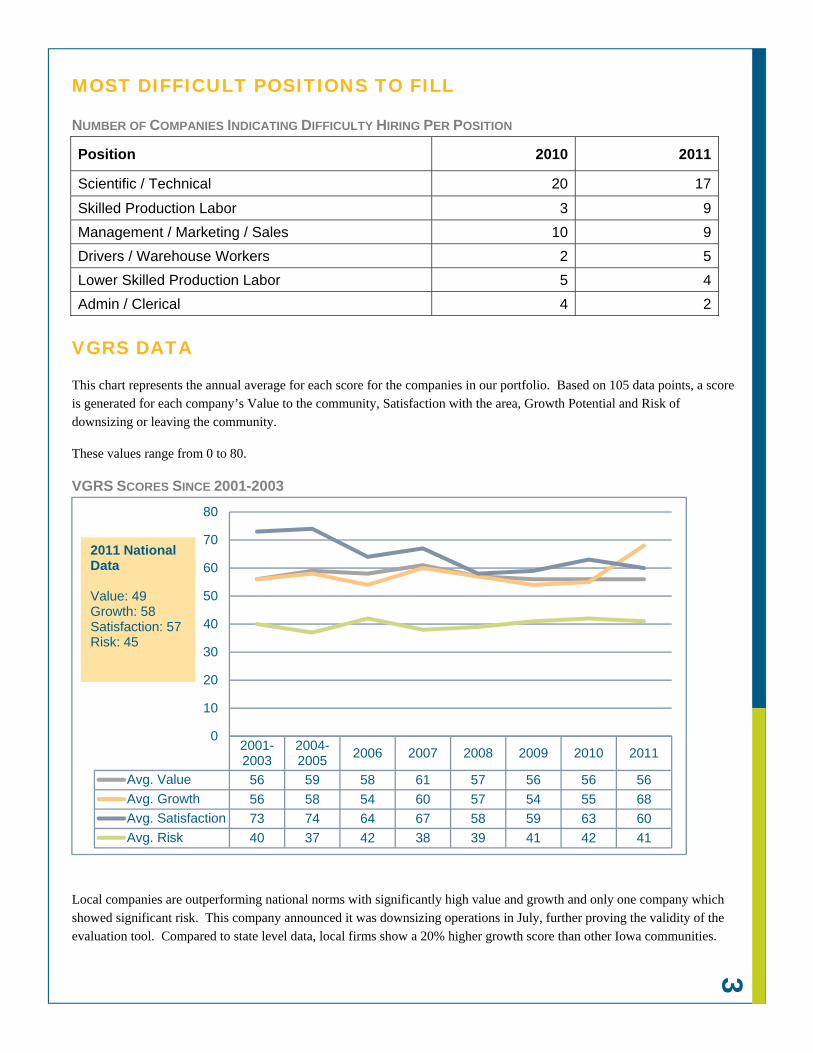
3 MOST DIFFICULT POSITIONS TO FILL
NUMBER OF COMPANIES INDICATING DIFFICULTY HIRING PER POSITION
Position 2010 2011
Scientific / Technical 20 17
Skilled Production Labor 3 9
Management / Marketing / Sales 10 9
Drivers / Warehouse Workers 2 5
Lower Skilled Production Labor 5 4
Admin / Clerical 4 2
VGRS DATA
This chart represents the annual average for each score for the companies in our portfolio. Based on 105 data points, a score is generated for each company’s Value to the community, Satisfaction with the area, Growth Potential and Risk of downsizing or leaving the community.
These values range from 0 to 80.
VGRS SCORES SINCE 2001-2003
Local companies are outperforming national norms with significantly high value and growth and only one company which showed significant risk. This company announced it was downsizing operations in July, further proving the validity of the evaluation tool. Compared to state level data, local firms show a 20% higher growth score than other Iowa communities.
2001-2003
2004-2005
2006 2007 2008 2009 2010 2011
Avg. Value 56 59 58 61 57 56 56 56
Avg. Growth 56 58 54 60 57 54 55 68
Avg. Satisfaction 73 74 64 67 58 59 63 60
Avg. Risk 40 37 42 38 39 41 42 41
0
10
20
30
40
50
60
70
80
2011 National Data
Value: 49Growth: 58Satisfaction: 57Risk: 45
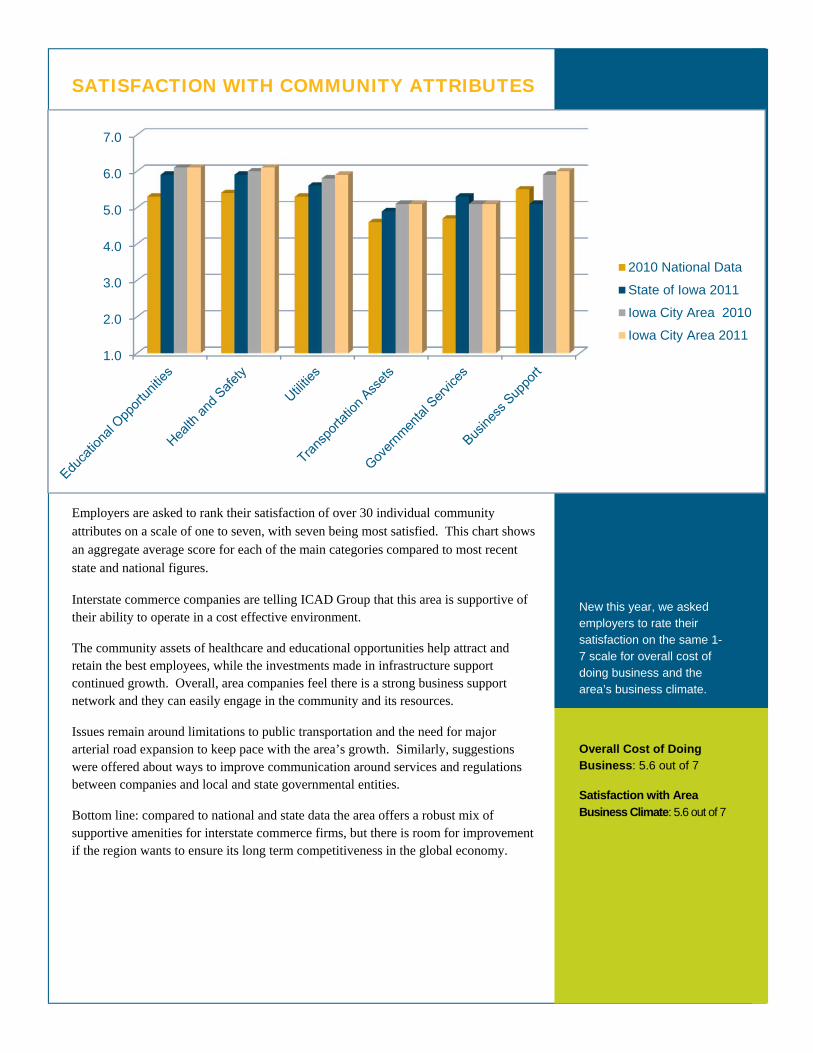
4 SATISFACTION WITH COMMUNITY ATTRIBUTES
Employers are asked to rank their satisfaction of over 30 individual community attributes on a scale of one to seven, with seven being most satisfied. This chart shows an aggregate average score for each of the main categories compared to most recent state and national figures.
Interstate commerce companies are telling ICAD Group that this area is supportive of their ability to operate in a cost effective environment.
The community assets of healthcare and educational opportunities help attract and retain the best employees, while the investments made in infrastructure support continued growth. Overall, area companies feel there is a strong business support network and they can easily engage in the community and its resources.
Issues remain around limitations to public transportation and the need for major arterial road expansion to keep pace with the area’s growth. Similarly, suggestions were offered about ways to improve communication around services and regulations between companies and local and state governmental entities.
Bottom line: compared to national and state data the area offers a robust mix of supportive amenities for interstate commerce firms, but there is room for improvement if the region wants to ensure its long term competitiveness in the global economy.
New this year, we asked employers to rate their satisfaction on the same 1-7 scale for overall cost of doing business and the area’s business climate.
Overall Cost of Doing Business: 5.6 out of 7
Satisfaction with Area
Business Climate: 5.6 out of 7
1.0
2.0
3.0
4.0
5.0
6.0
7.0
2010 National Data
State of Iowa 2011
Iowa City Area 2010
Iowa City Area 2011
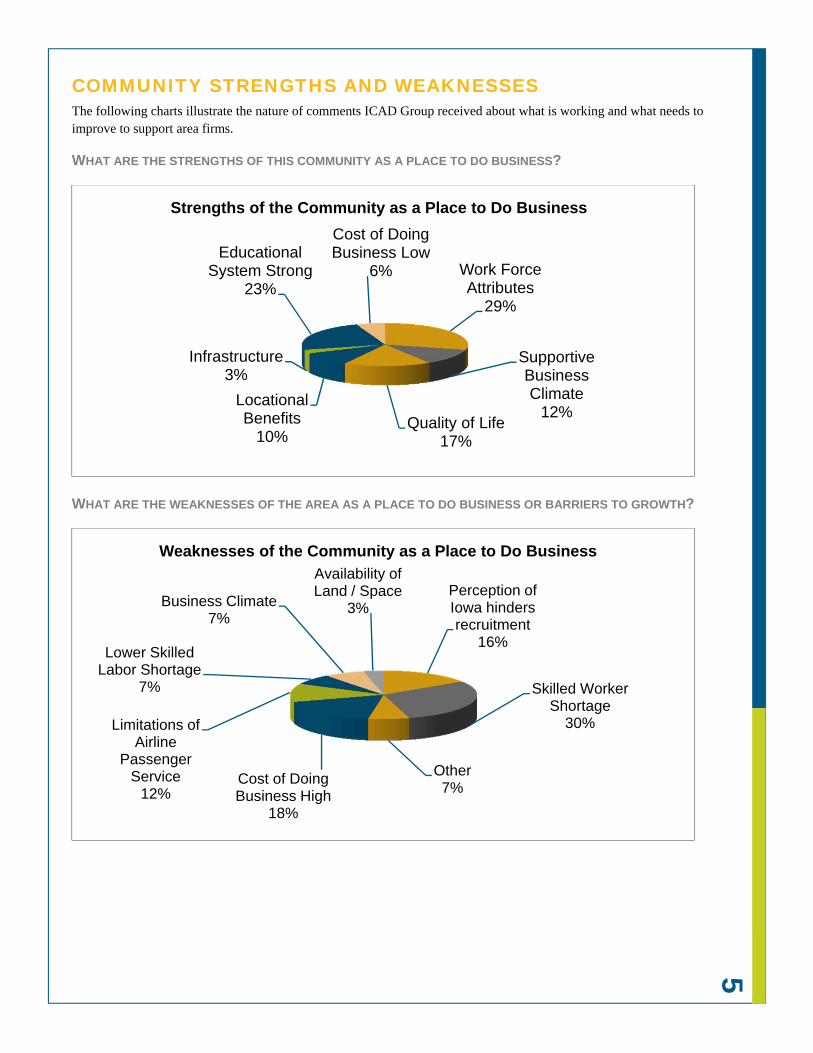
5 COMMUNITY STRENGTHS AND WEAKNESSES The following charts illustrate the nature of comments ICAD Group received about what is working and what needs to improve to support area firms.
WHAT ARE THE STRENGTHS OF THIS COMMUNITY AS A PLACE TO DO BUSINESS?
WHAT ARE THE WEAKNESSES OF THE AREA AS A PLACE TO DO BUSINESS OR BARRIERS TO GROWTH?
Work Force Attributes
29%
Supportive Business Climate
12%Quality of Life
17%
Locational Benefits
10%
Infrastructure3%
Educational System Strong
23%
Cost of Doing Business Low
6%
Strengths of the Community as a Place to Do Business
Perception of Iowa hinders recruitment
16%
Skilled Worker Shortage
30%
Other7%
Cost of Doing Business High
18%
Limitations of Airline
Passenger Service
12%
Lower Skilled Labor Shortage
7%
Business Climate7%
Availability of Land / Space
3%
Weaknesses of the Community as a Place to Do Business
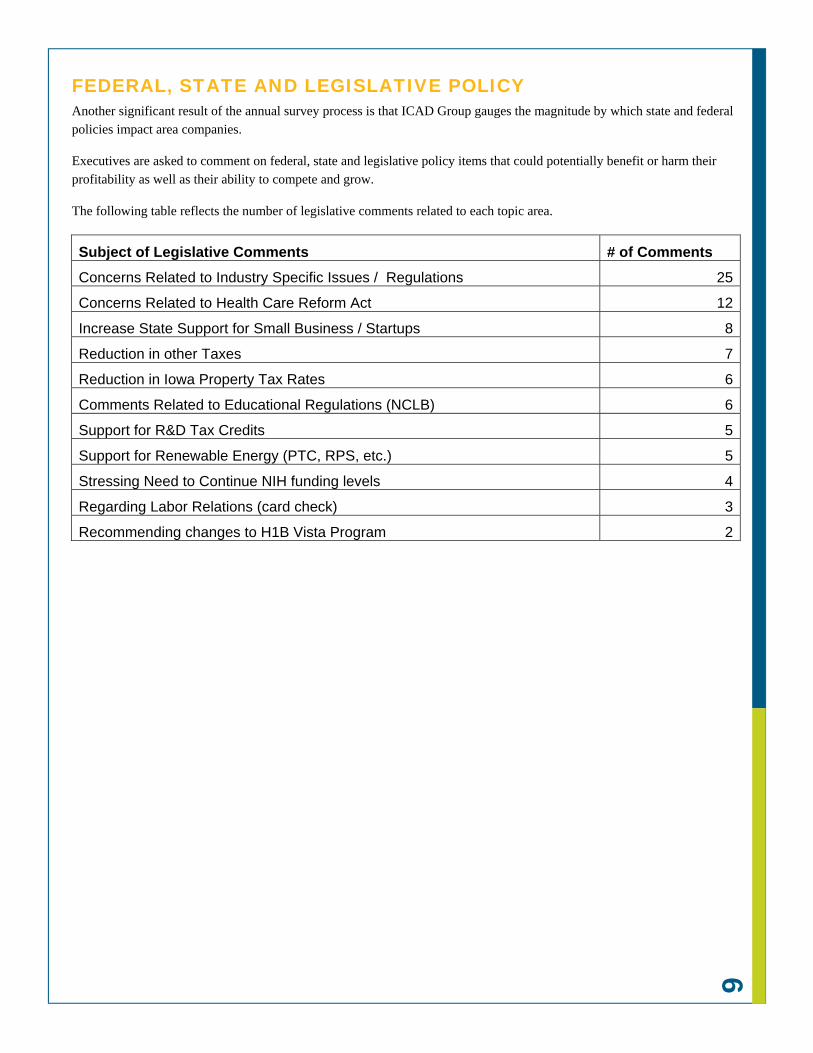
6 FEDERAL, STATE AND LEGISLATIVE POLICY Another significant result of the annual survey process is that ICAD Group gauges the magnitude by which state and federal policies impact area companies.
Executives are asked to comment on federal, state and legislative policy items that could potentially benefit or harm their profitability as well as their ability to compete and grow.
The following table reflects the number of legislative comments related to each topic area.
Subject of Legislative Comments # of Comments
Concerns Related to Industry Specific Issues / Regulations 25
Concerns Related to Health Care Reform Act 12
Increase State Support for Small Business / Startups 8
Reduction in other Taxes 7
Reduction in Iowa Property Tax Rates 6
Comments Related to Educational Regulations (NCLB) 6
Support for R&D Tax Credits 5
Support for Renewable Energy (PTC, RPS, etc.) 5
Stressing Need to Continue NIH funding levels 4
Regarding Labor Relations (card check) 3
Recommending changes to H1B Vista Program 2
7 CONCLUSIONS ICAD Group has internalized this feedback and is using the information as it rethinks its role in providing economic development services to the area. Among the key findings:
Uncertainty surrounding policy changes, primarily at the federal level are limiting new investment and growth potential for many industries.
The commitment to education in the area has created and attracted a talented workforce that employers believe provides significant value for the investment. Still, additional workforce is needed for firms to grow and compete. The perception of Iowa as an agricultural state with little diversity hinders the area’s ability to recruit outside talent.
Many employers are extremely complimentary about our regional airports yet still very concerned about limited direct flight options and the rising costs associated with airline passenger service.
Employers are realizing the way in which young people are educated needs to change with their evolving needs at a faster pace and interested with several executives asking how they can be more involved in K-12 and secondary education to share expertise and highlight the type of careers available in our region.
Executives shared how necessary innovation has become to their long term success. The ways in which they hire and train employees, develop products and refine company culture to become more competitive is in a constant state of flux.
Efforts such as www.pickyourpace.com and TEDx Iowa City are designed to help reshape national perception and educate people on the cultural vibrancy and opportunities presented in this area.
ICAD Group is also taking a more active role in driving the discussion of supportive policies, primarily at the state level, to benefit local companies and maintain a cost competitive environment for growth.
With long term benefit in mind, ICAD Group is also working to advance the entrepreneurial culture of the region with a determined goal of building a bridge to our existing companies such that they can find new ways to solve problems, attract talent and retain the best minds. The IQCoLab concept, for example, will provide a space for interstate commerce firms to network and explore new approaches and work styles which can be integrated into their companies.
Our success as a region will rely on our collective ability to be more proactive than reactive. The best source of job creation is from the companies who are already engaged in this market. It is this mindset that ICAD Group will carry into all of our efforts to assist existing, emerging and new primary sector companies in our region.