Embed Size (px)
Citation preview
2011 Accountability Progress Report (APR) Riverside County Office of Education
August 30, 2011
This information is embargoed until August 31, 2011 at 11:45 am.
i
2011 Accountability Progress Report (APR) Summary Riverside County Office of Education
This 2011 Riverside County Accountability Progress Report is comprised of the state Academic Performance Index (API), the federal Adequate Yearly Progress (AYP), the federal Program Improvement (PI), and the federal Title III Accountability Report. Both API and AYP are based on statewide assessment results, which include the Standardized Testing and Reporting (STAR) Program and the California High School Exit Examination (CAHSEE). The Title III Accountability Report is calculated using the annual results of students tested in the California English Language Development Test (CELDT), the Standardized Testing and Reporting (STAR) Program, and California High School Exit Examination (CAHSEE).
1. Academic Performance Index (API): Pages 1-8
• The 2011 average API score for all public schools within Riverside County was 777, the 8th highest of any California county with 80,000 or more students (see Page 1).
• Riverside County made a 8-point API gain in the 2010-2011 school year, the 4th largest increase of any California county with 80,000 or more students (see Page 2).
• When viewed over a twelve-year period a clear trend toward sustained improvement emerges. From 1999 to 2011, Riverside County average school API scores rose 186 points from 591 to 777, the 2nd largest increase of any California county with 80,000 or more students (see Pages 3-4).
• The 2010-2011 API results show that all student subgroups demonstrate improvement between 7 and 12 points. Hispanic students and English Learners increased their API this year by 12 points, while the API of African American students increased by 10 points, Socioeconomically Disadvantaged students increased by 9 points, White students and Students with Disabilities increased by 7 points (see Page 5).
• While more than two-thirds (68%) of schools made progress under 2010-2011 API, 55% (62% of elementary schools, 48% of middle schools and 32% high schools) of Riverside County schools also met all their growth targets in 2010-2011 (see Pages 6-7).
• In 2011, almost half (48%) of Riverside County schools exceeded or met the state’s performance target of 800, compared to only 1% in 1999 (see Page 8).
ii
2. Adequate Yearly Progress (AYP): Pages 9-19 • For the 2010-2011 school year, the AYP proficient rate in English Language Arts for all public schools within
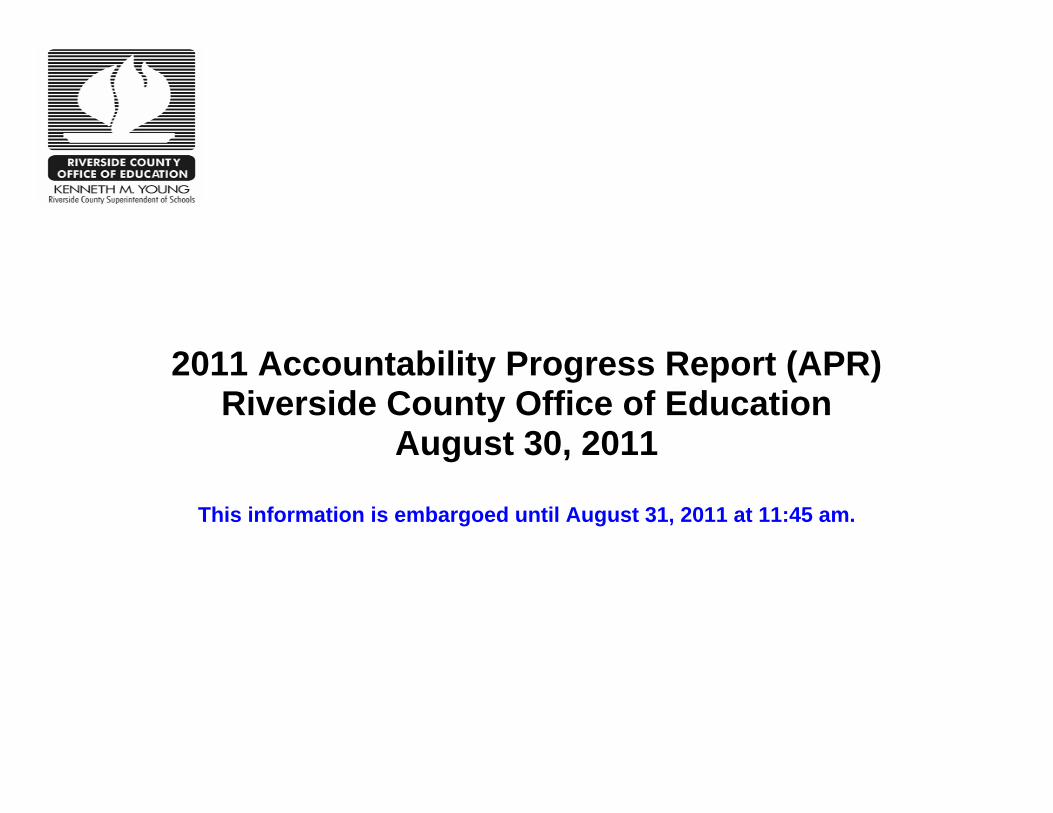
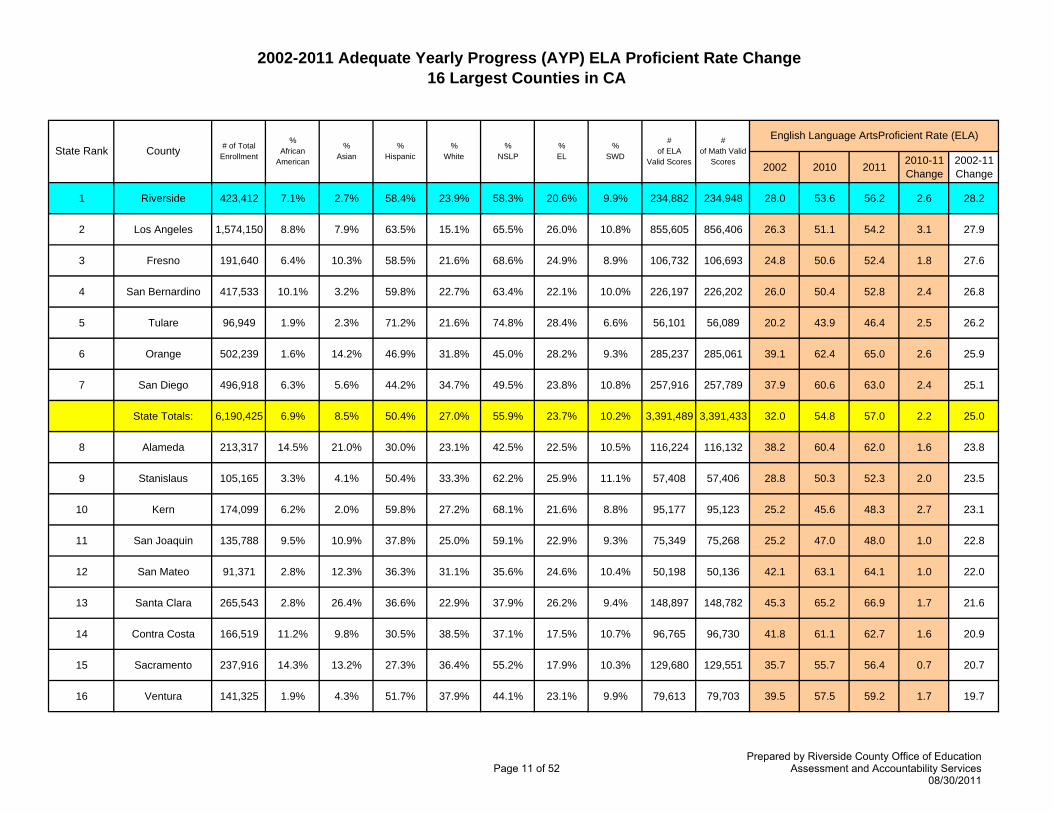
Riverside County was 56.2%, the 9th highest of any California county with 80,000 or more students. This is a 2.6% increase over the prior year, the 3rd largest increase of any California county with 80,000 or more students. From 2002 to 2011, the AYP proficient rate in English Language Arts for Riverside County has increased by 28.2%, the 1st highest of any California county with 80,000 or more students (see Pages 9-11).
• The percentages of students scoring at the proficient level or above between 2002 and 2011 have increased significantly for all students and all subgroups in English Language Arts (see Pages 12-13).
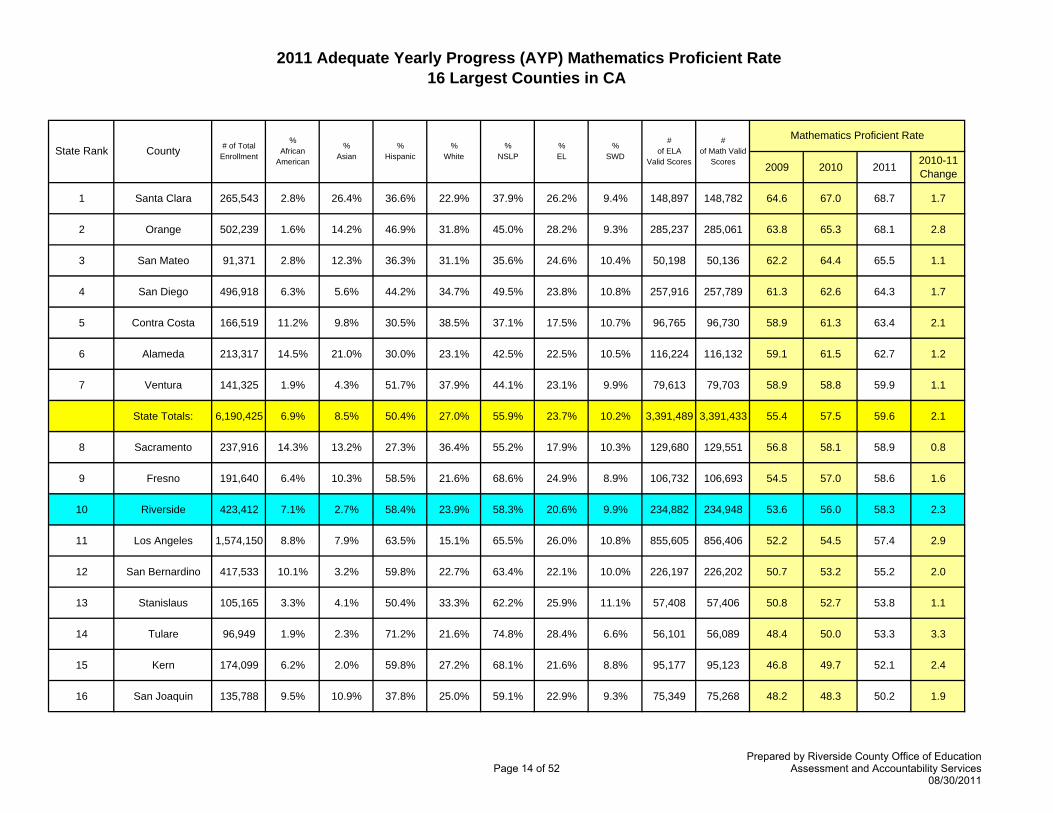
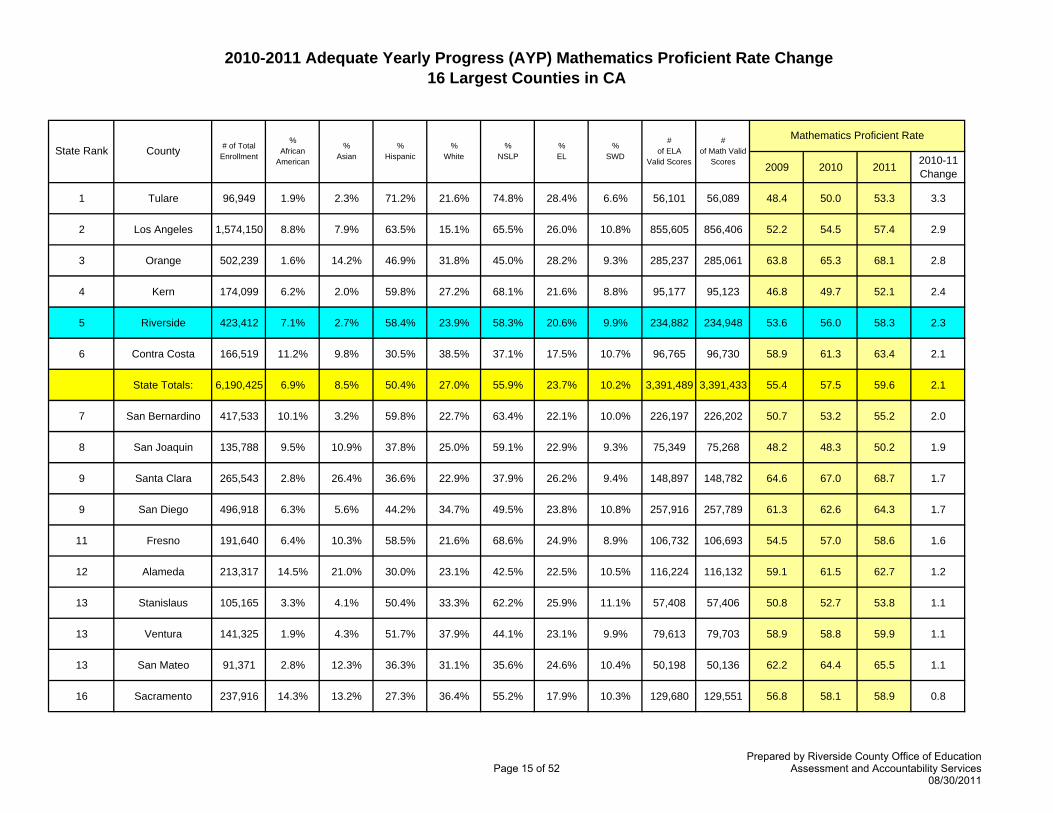
• For the 2010-2011 school year, the AYP proficient rate in Mathematics for all public schools within Riverside County was 58.3%, the 10th highest of any California county with 80,000 or more students. This is a 2.3% increased over the prior year, the 5th largest increase of any California county with 80,000 or more students. From 2002 to 2011, the AYP proficient rate in Mathematics for Riverside County has increased by 27.5%, the 4th highest of any California county with 80,000 or more students (see Pages 14-16).
• The percentages of students scoring at the proficient level or above between 2002 and 2011 have also increased significantly for all students and all subgroups in Mathematics (see Pages 17-18).
• In 2011, the AYP targets for the percentage of students expected to score at the proficient level or above on state assessments increased about 11 percentage points across the board from 2010. The AYP targets will continue to rise each year to meet current federal requirements of the Elementary and Secondary Education Act (ESEA). Fewer schools made AYP than in 2010. In 2011, 26% of Riverside County schools (28% of elementary schools; 7% middle schools; 33% high schools) made AYP (see Page 19).
3. List of Riverside County School Districts: Page 20
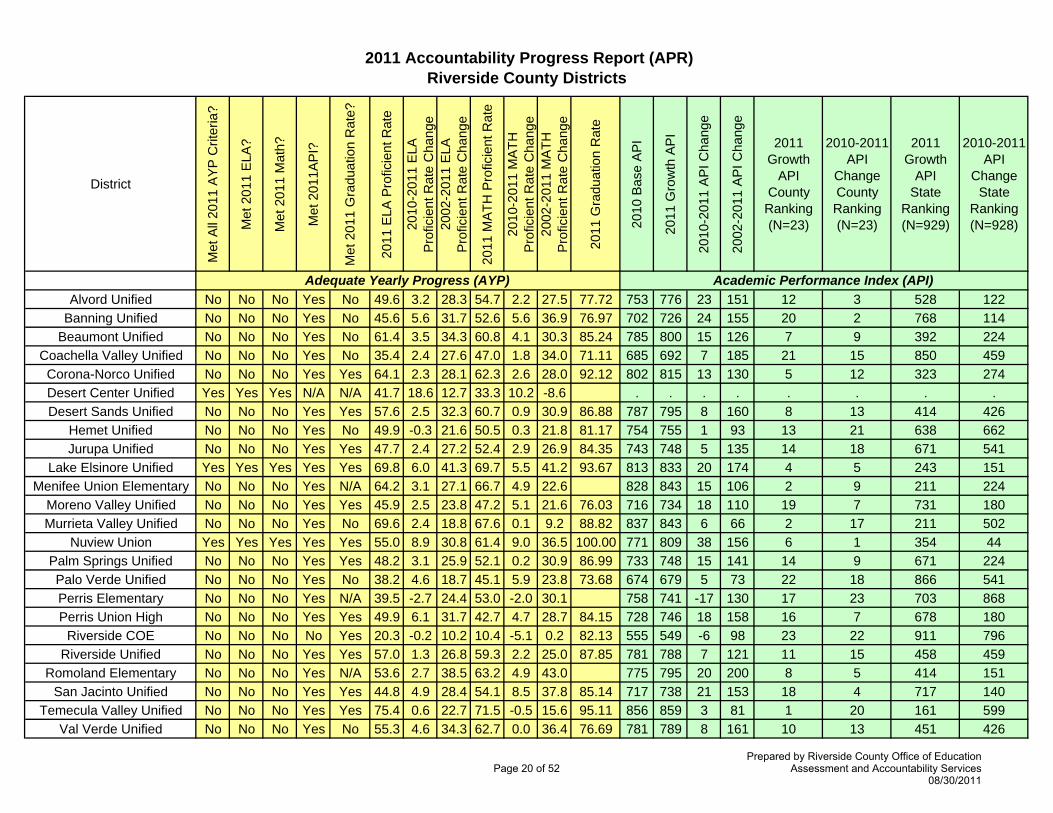
• In addition to the 2011 AYP and API data, countywide and statewide API district rankings (2011 Growth API and 2010-11 API Change rankings) are also included.
• Top 5 districts for 2011 API are: Temecula Valley Unified (859), Menifee Union Elementary (843), Murrieta Valley Unified (843), Lake Elsinore Unified (833), and Corona-Norco Unified (815).
• Top 5 districts for 2010-2011 API Change are: Nuview Union Elementary (38 points), Banning Unified (24 points), Alvord Unified (23 points), San Jacinto Unified (21 points), Lake Elsinore Unified (20 points), and Romoland Elementary (20 points).
iii
4. List of Riverside County Elementary Schools: Pages 21-32 • In addition to the 2011 AYP and API data, countywide and statewide API school rankings (2011 Growth API and 2010-2011 API Change rankings) are also included. • Top 5 elementary schools for 2011 API are: Tuscany Hills Elementary (959), Alamos Elementary (938), Earl Warren Elementary (932), Eastvale Elementary (925) and George Washington Charter (922). • Top 5 elementary schools for 2010-2011 API Change are: Cabazon Elementary (90 points), Valley View Elementary (80 points), Estudillo Elementary (58 points), Sunnymead Elementary (57 points), and De Anza Elementary (54 points). 5. List of Riverside County Middle Schools: Pages 33-36 • In addition to the 2011 AYP and API data, countywide and statewide API school rankings (2011 Growth API and 2010-2011 API Change rankings) are also included. • Top 5 middle schools for 2011 API are: Western Center Academy (922), Temecula Middle (878), Dorothy McElhinney Middle (873), Amelia Earhart Middle (872), and Palm Desert Charter Middle (870). • Top 5 middle schools for 2010-2011 API Change are: Sierra Middle (54 points), Monte Vista Middle (50 points), Elsinore Middle (45 points), Mountain View Middle (38 points), and Mountain Shadows Middle (38 points). 6. List of Riverside County High Schools: Pages 37-41 • In addition to the 2011 AYP and API data, countywide and statewide API school rankings (2011 Growth API and 2010-2011 API Change rankings) are also included. • Top 5 comprehensive high schools for 2011 API are: Great Oak High (854), Nuview Bridge Early College High (848), John F. Kennedy High (834), Murrieta Valley High (834), and La Quinta High (831). • Top 5 comprehensive high schools for 2010-2011 API Change are: John F. Kennedy High (47 points), West Shores High (39 points), Rubidoux High (35 points), Cathedral City High (34 points), and Shadow Hills High (33 points). 7. Program Improvement (PI): Pages 42-51 • Desert Center Unified, Lake Elsinore Unified and Nuview Union Elementary met all the AYP targets in 2010-2011. The total number of PI districts in Riverside County is 17 (71% of the 24 Title One districts in Riverside County). There were two districts newly identified for PI Year 1. One district is in PI Year 2 and 14 districts are in PI Year 3. Four districts are at-risk for PI in 2012-13 (see Page 42).
iv
• For the 2011-2012 school year, the total number of schools in PI is 158 (61% of Title One schools in Riverside County). Of the 158 schools in PI, 37 are in PI Year 1, 13 are in PI Year 2, 20 are in Year 3, 11 are in Year 4 and 77 are in Year 5 (see Page 43). • Three schools (Ramona Elementary, Bubbling Wells Elementary, and Felix J. Appleby Elementary) exited PI in 2010-11. There were 33 schools newly identified for PI in 2011-12. Fifty-nine schools are at-risk for PI in 2012-13 (see Pages 44-51). 8. Title III Accountability Report: Page 52 • Three districts, Lake Elsinore Unified, Menifee Union Elementary and Nuview Union Elemenatry, in Riverside County met all AMAO targets in 2010-11 (see Page 52). • In 2010-11, 1 district did not meet all AMAOs for one year, 4 districts did not meet all AMAOs for two consecutive years, 2 districts did not meet all AMAOs for three consecutive years, 7 districts did not meet all AMAOs for four consecutive years, 1 district did not meet all AMAOs for five consecutive years, 2 districts did not meet all AMAOs for seven consecutive years and 3 districts did not meet all AMAOs for eight consecutive years (see Page 52).
Academic Performance Index (API)
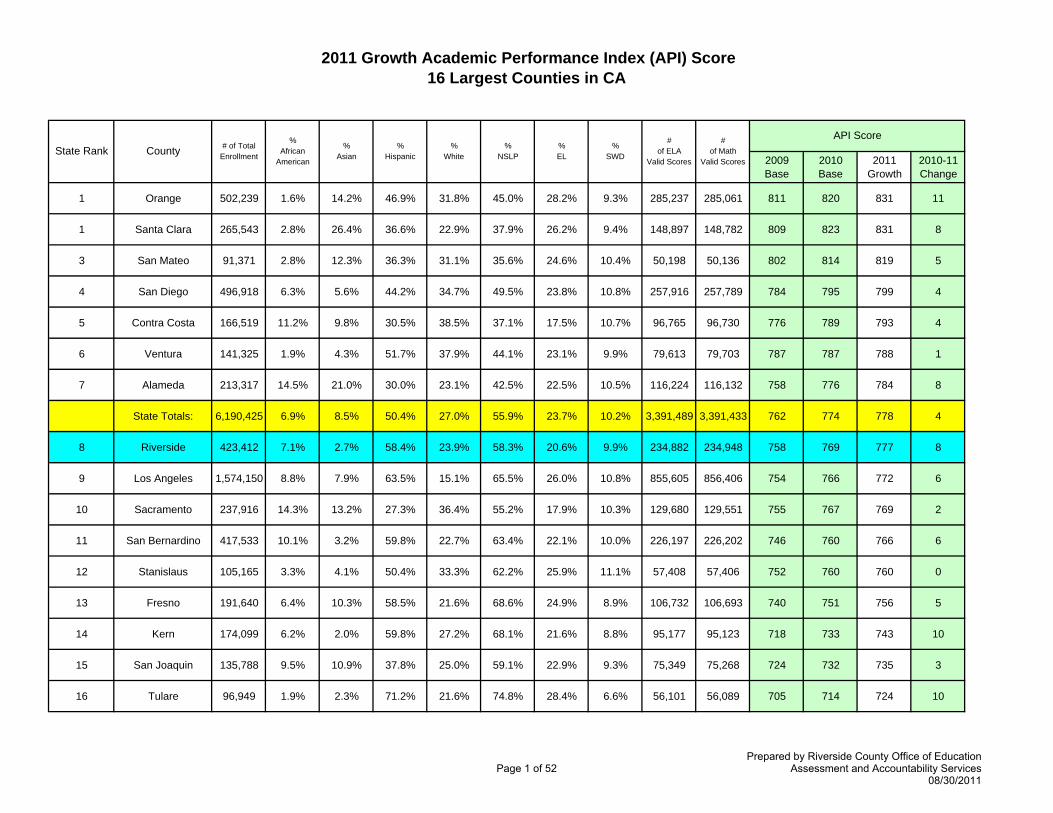
2011 Growth Academic Performance Index (API) Score16 Largest Counties in CA
2009 Base
2010 Base
2011 Growth
2010-11 Change
1 Orange 502,239 1.6% 14.2% 46.9% 31.8% 45.0% 28.2% 9.3% 285,237 285,061 811 820 831 11
1 Santa Clara 265,543 2.8% 26.4% 36.6% 22.9% 37.9% 26.2% 9.4% 148,897 148,782 809 823 831 8
3 San Mateo 91,371 2.8% 12.3% 36.3% 31.1% 35.6% 24.6% 10.4% 50,198 50,136 802 814 819 5
4 San Diego 496,918 6.3% 5.6% 44.2% 34.7% 49.5% 23.8% 10.8% 257,916 257,789 784 795 799 4
5 Contra Costa 166,519 11.2% 9.8% 30.5% 38.5% 37.1% 17.5% 10.7% 96,765 96,730 776 789 793 4
6 Ventura 141,325 1.9% 4.3% 51.7% 37.9% 44.1% 23.1% 9.9% 79,613 79,703 787 787 788 1
7 Alameda 213,317 14.5% 21.0% 30.0% 23.1% 42.5% 22.5% 10.5% 116,224 116,132 758 776 784 8
State Totals: 6,190,425 6.9% 8.5% 50.4% 27.0% 55.9% 23.7% 10.2% 3,391,489 3,391,433 762 774 778 4
8 Riverside 423,412 7.1% 2.7% 58.4% 23.9% 58.3% 20.6% 9.9% 234,882 234,948 758 769 777 8
9 Los Angeles 1,574,150 8.8% 7.9% 63.5% 15.1% 65.5% 26.0% 10.8% 855,605 856,406 754 766 772 6
10 Sacramento 237,916 14.3% 13.2% 27.3% 36.4% 55.2% 17.9% 10.3% 129,680 129,551 755 767 769 2
11 San Bernardino 417,533 10.1% 3.2% 59.8% 22.7% 63.4% 22.1% 10.0% 226,197 226,202 746 760 766 6
12 Stanislaus 105,165 3.3% 4.1% 50.4% 33.3% 62.2% 25.9% 11.1% 57,408 57,406 752 760 760 0
13 Fresno 191,640 6.4% 10.3% 58.5% 21.6% 68.6% 24.9% 8.9% 106,732 106,693 740 751 756 5
14 Kern 174,099 6.2% 2.0% 59.8% 27.2% 68.1% 21.6% 8.8% 95,177 95,123 718 733 743 10
15 San Joaquin 135,788 9.5% 10.9% 37.8% 25.0% 59.1% 22.9% 9.3% 75,349 75,268 724 732 735 3
16 Tulare 96,949 1.9% 2.3% 71.2% 21.6% 74.8% 28.4% 6.6% 56,101 56,089 705 714 724 10
API Score%
Hispanic%
White%
NSLP% ELState Rank %
SWD
# of ELA
Valid Scores
# of Math
Valid ScoresCounty # of Total
Enrollment
% African
American
% Asian
Page 1 of 52Prepared by Riverside County Office of Education
Assessment and Accountability Services08/30/2011
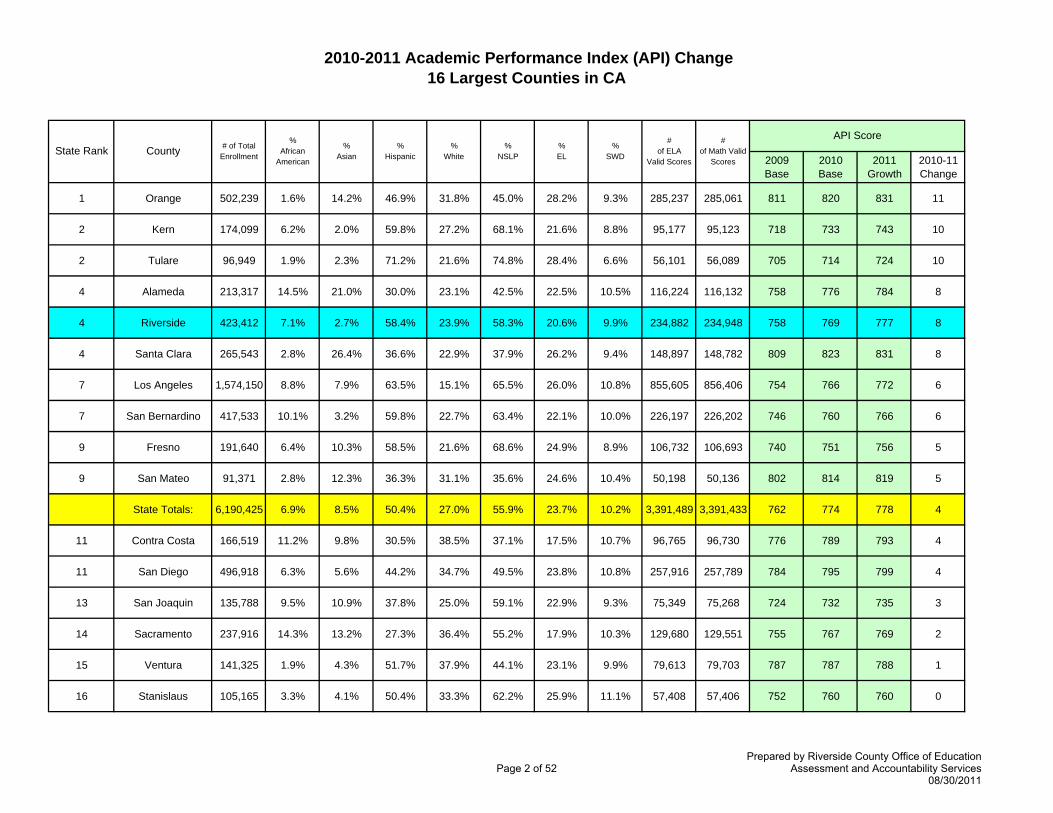
2010-2011 Academic Performance Index (API) Change16 Largest Counties in CA
2009 Base
2010 Base
2011 Growth
2010-11 Change
1 Orange 502,239 1.6% 14.2% 46.9% 31.8% 45.0% 28.2% 9.3% 285,237 285,061 811 820 831 11
2 Kern 174,099 6.2% 2.0% 59.8% 27.2% 68.1% 21.6% 8.8% 95,177 95,123 718 733 743 10
2 Tulare 96,949 1.9% 2.3% 71.2% 21.6% 74.8% 28.4% 6.6% 56,101 56,089 705 714 724 10
4 Alameda 213,317 14.5% 21.0% 30.0% 23.1% 42.5% 22.5% 10.5% 116,224 116,132 758 776 784 8
4 Riverside 423,412 7.1% 2.7% 58.4% 23.9% 58.3% 20.6% 9.9% 234,882 234,948 758 769 777 8
4 Santa Clara 265,543 2.8% 26.4% 36.6% 22.9% 37.9% 26.2% 9.4% 148,897 148,782 809 823 831 8
7 Los Angeles 1,574,150 8.8% 7.9% 63.5% 15.1% 65.5% 26.0% 10.8% 855,605 856,406 754 766 772 6
7 San Bernardino 417,533 10.1% 3.2% 59.8% 22.7% 63.4% 22.1% 10.0% 226,197 226,202 746 760 766 6
9 Fresno 191,640 6.4% 10.3% 58.5% 21.6% 68.6% 24.9% 8.9% 106,732 106,693 740 751 756 5
9 San Mateo 91,371 2.8% 12.3% 36.3% 31.1% 35.6% 24.6% 10.4% 50,198 50,136 802 814 819 5
State Totals: 6,190,425 6.9% 8.5% 50.4% 27.0% 55.9% 23.7% 10.2% 3,391,489 3,391,433 762 774 778 4
11 Contra Costa 166,519 11.2% 9.8% 30.5% 38.5% 37.1% 17.5% 10.7% 96,765 96,730 776 789 793 4
11 San Diego 496,918 6.3% 5.6% 44.2% 34.7% 49.5% 23.8% 10.8% 257,916 257,789 784 795 799 4
13 San Joaquin 135,788 9.5% 10.9% 37.8% 25.0% 59.1% 22.9% 9.3% 75,349 75,268 724 732 735 3
14 Sacramento 237,916 14.3% 13.2% 27.3% 36.4% 55.2% 17.9% 10.3% 129,680 129,551 755 767 769 2
15 Ventura 141,325 1.9% 4.3% 51.7% 37.9% 44.1% 23.1% 9.9% 79,613 79,703 787 787 788 1
16 Stanislaus 105,165 3.3% 4.1% 50.4% 33.3% 62.2% 25.9% 11.1% 57,408 57,406 752 760 760 0
State Rank % SWD
# of ELA
Valid Scores
# of Math Valid
ScoresCounty # of Total
Enrollment
% African
American
% Asian
API Score%
Hispanic%
White%
NSLP% EL
Page 2 of 52Prepared by Riverside County Office of Education
Assessment and Accountability Services08/30/2011
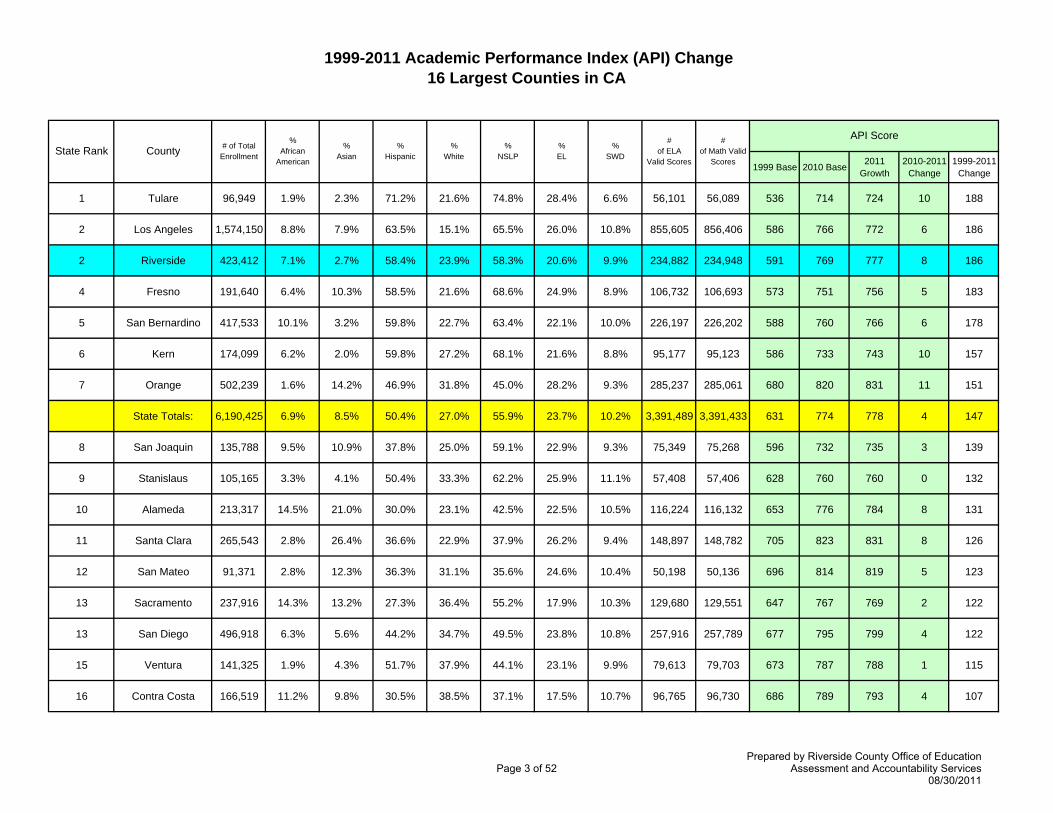
1999-2011 Academic Performance Index (API) Change16 Largest Counties in CA
1999 Base 2010 Base 2011 Growth
2010-2011 Change
1999-2011 Change
1 Tulare 96,949 1.9% 2.3% 71.2% 21.6% 74.8% 28.4% 6.6% 56,101 56,089 536 714 724 10 188
2 Los Angeles 1,574,150 8.8% 7.9% 63.5% 15.1% 65.5% 26.0% 10.8% 855,605 856,406 586 766 772 6 186
2 Riverside 423,412 7.1% 2.7% 58.4% 23.9% 58.3% 20.6% 9.9% 234,882 234,948 591 769 777 8 186
4 Fresno 191,640 6.4% 10.3% 58.5% 21.6% 68.6% 24.9% 8.9% 106,732 106,693 573 751 756 5 183
5 San Bernardino 417,533 10.1% 3.2% 59.8% 22.7% 63.4% 22.1% 10.0% 226,197 226,202 588 760 766 6 178
6 Kern 174,099 6.2% 2.0% 59.8% 27.2% 68.1% 21.6% 8.8% 95,177 95,123 586 733 743 10 157
7 Orange 502,239 1.6% 14.2% 46.9% 31.8% 45.0% 28.2% 9.3% 285,237 285,061 680 820 831 11 151
State Totals: 6,190,425 6.9% 8.5% 50.4% 27.0% 55.9% 23.7% 10.2% 3,391,489 3,391,433 631 774 778 4 147
8 San Joaquin 135,788 9.5% 10.9% 37.8% 25.0% 59.1% 22.9% 9.3% 75,349 75,268 596 732 735 3 139
9 Stanislaus 105,165 3.3% 4.1% 50.4% 33.3% 62.2% 25.9% 11.1% 57,408 57,406 628 760 760 0 132
10 Alameda 213,317 14.5% 21.0% 30.0% 23.1% 42.5% 22.5% 10.5% 116,224 116,132 653 776 784 8 131
11 Santa Clara 265,543 2.8% 26.4% 36.6% 22.9% 37.9% 26.2% 9.4% 148,897 148,782 705 823 831 8 126
12 San Mateo 91,371 2.8% 12.3% 36.3% 31.1% 35.6% 24.6% 10.4% 50,198 50,136 696 814 819 5 123
13 Sacramento 237,916 14.3% 13.2% 27.3% 36.4% 55.2% 17.9% 10.3% 129,680 129,551 647 767 769 2 122
13 San Diego 496,918 6.3% 5.6% 44.2% 34.7% 49.5% 23.8% 10.8% 257,916 257,789 677 795 799 4 122
15 Ventura 141,325 1.9% 4.3% 51.7% 37.9% 44.1% 23.1% 9.9% 79,613 79,703 673 787 788 1 115
16 Contra Costa 166,519 11.2% 9.8% 30.5% 38.5% 37.1% 17.5% 10.7% 96,765 96,730 686 789 793 4 107
% Hispanic
% White
% NSLP
% EL
API ScoreState Rank %
SWD
# of ELA
Valid Scores
# of Math Valid
ScoresCounty # of Total
Enrollment
% African
American
% Asian
Page 3 of 52Prepared by Riverside County Office of Education
Assessment and Accountability Services08/30/2011
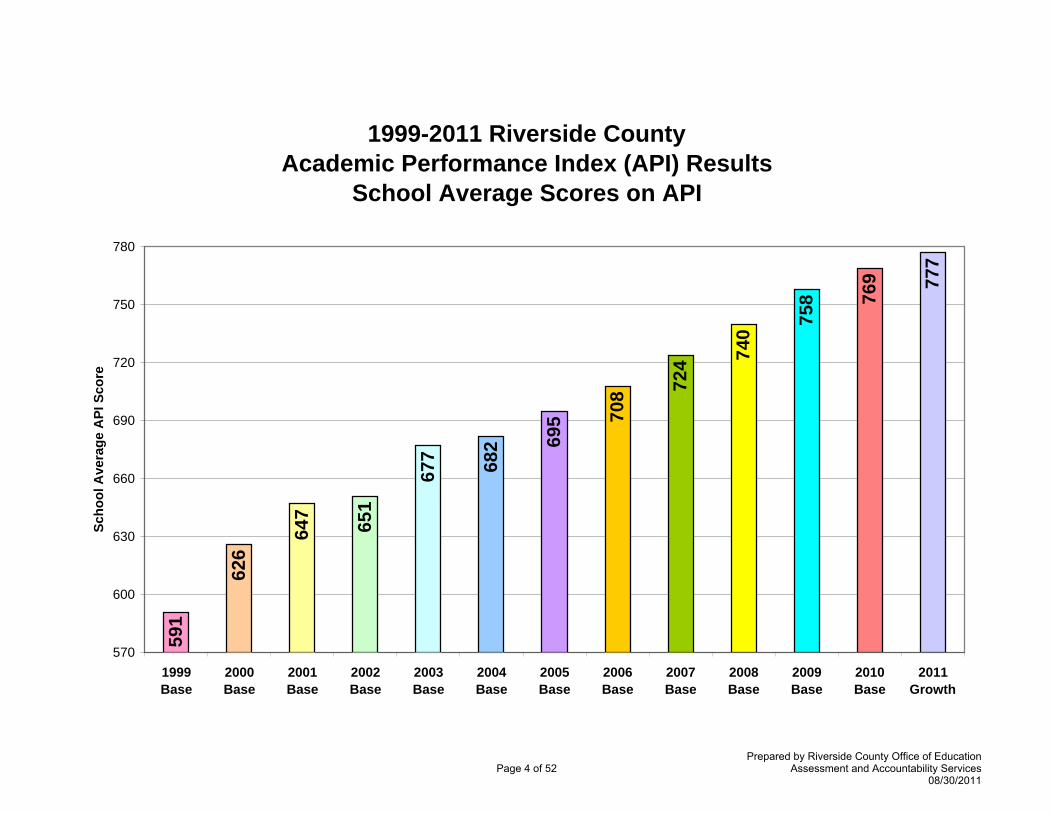
1999-2011 Riverside CountyAcademic Performance Index (API) Results
School Average Scores on API59
1
626
647
651
677 682 69
5 708 72
4 740
758 76
9 777
570
600
630
660
690
720
750
780
1999Base
2000Base
2001Base
2002Base
2003Base
2004Base
2005Base
2006Base
2007Base
2008Base
2009Base
2010Base
2011Growth
Scho
ol A
vera
ge A
PI S
core
Page 4 of 52Prepared by Riverside County Office of Education
Assessment and Accountability Services08/30/2011
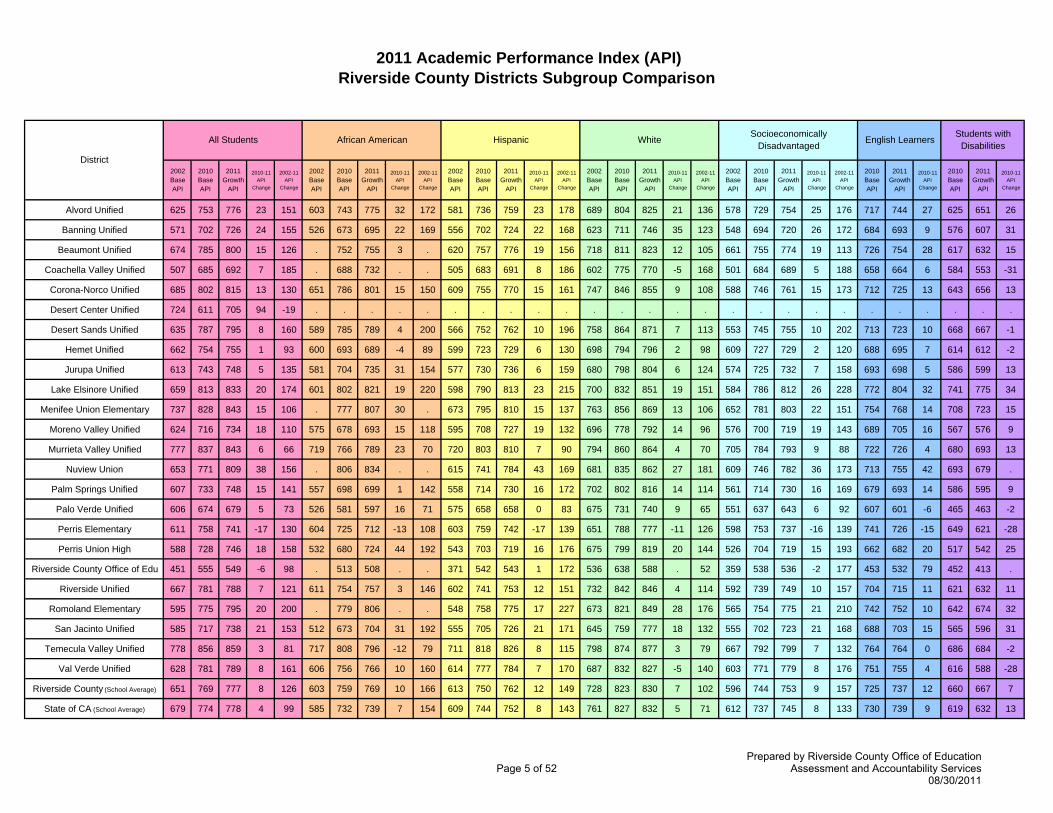
2011 Academic Performance Index (API)Riverside County Districts Subgroup Comparison
2002 Base API
2010 Base API
2011 Growth
API
2010-11 API
Change
2002-11 API
Change
2002 Base API
2010 Base API
2011 Growth
API
2010-11 API
Change
2002-11 API
Change
2002 Base API
2010 Base API
2011 Growth
API
2010-11 API
Change
2002-11 API
Change
2002 Base API
2010 Base API
2011 Growth
API
2010-11 API
Change
2002-11 API
Change
2002 Base API
2010 Base API
2011 Growth
API
2010-11 API
Change
2002-11 API
Change
2010 Base API
2011 Growth
API
2010-11 API
Change
2010 Base API
2011 Growth
API
2010-11 API
Change
Alvord Unified 625 753 776 23 151 603 743 775 32 172 581 736 759 23 178 689 804 825 21 136 578 729 754 25 176 717 744 27 625 651 26
Banning Unified 571 702 726 24 155 526 673 695 22 169 556 702 724 22 168 623 711 746 35 123 548 694 720 26 172 684 693 9 576 607 31
Beaumont Unified 674 785 800 15 126 . 752 755 3 . 620 757 776 19 156 718 811 823 12 105 661 755 774 19 113 726 754 28 617 632 15
Coachella Valley Unified 507 685 692 7 185 . 688 732 . . 505 683 691 8 186 602 775 770 -5 168 501 684 689 5 188 658 664 6 584 553 -31
Corona-Norco Unified 685 802 815 13 130 651 786 801 15 150 609 755 770 15 161 747 846 855 9 108 588 746 761 15 173 712 725 13 643 656 13
Desert Center Unified 724 611 705 94 -19 . . . . . . . . . . . . . . . . . . . . . . . . . .
Desert Sands Unified 635 787 795 8 160 589 785 789 4 200 566 752 762 10 196 758 864 871 7 113 553 745 755 10 202 713 723 10 668 667 -1
Hemet Unified 662 754 755 1 93 600 693 689 -4 89 599 723 729 6 130 698 794 796 2 98 609 727 729 2 120 688 695 7 614 612 -2
Jurupa Unified 613 743 748 5 135 581 704 735 31 154 577 730 736 6 159 680 798 804 6 124 574 725 732 7 158 693 698 5 586 599 13
Lake Elsinore Unified 659 813 833 20 174 601 802 821 19 220 598 790 813 23 215 700 832 851 19 151 584 786 812 26 228 772 804 32 741 775 34
Menifee Union Elementary 737 828 843 15 106 . 777 807 30 . 673 795 810 15 137 763 856 869 13 106 652 781 803 22 151 754 768 14 708 723 15
Moreno Valley Unified 624 716 734 18 110 575 678 693 15 118 595 708 727 19 132 696 778 792 14 96 576 700 719 19 143 689 705 16 567 576 9
Murrieta Valley Unified 777 837 843 6 66 719 766 789 23 70 720 803 810 7 90 794 860 864 4 70 705 784 793 9 88 722 726 4 680 693 13
Nuview Union 653 771 809 38 156 . 806 834 . . 615 741 784 43 169 681 835 862 27 181 609 746 782 36 173 713 755 42 693 679 .
Palm Springs Unified 607 733 748 15 141 557 698 699 1 142 558 714 730 16 172 702 802 816 14 114 561 714 730 16 169 679 693 14 586 595 9
Palo Verde Unified 606 674 679 5 73 526 581 597 16 71 575 658 658 0 83 675 731 740 9 65 551 637 643 6 92 607 601 -6 465 463 -2
Perris Elementary 611 758 741 -17 130 604 725 712 -13 108 603 759 742 -17 139 651 788 777 -11 126 598 753 737 -16 139 741 726 -15 649 621 -28
Perris Union High 588 728 746 18 158 532 680 724 44 192 543 703 719 16 176 675 799 819 20 144 526 704 719 15 193 662 682 20 517 542 25
Riverside County Office of Edu 451 555 549 -6 98 . 513 508 . . 371 542 543 1 172 536 638 588 . 52 359 538 536 -2 177 453 532 79 452 413 .
Riverside Unified 667 781 788 7 121 611 754 757 3 146 602 741 753 12 151 732 842 846 4 114 592 739 749 10 157 704 715 11 621 632 11
Romoland Elementary 595 775 795 20 200 . 779 806 . . 548 758 775 17 227 673 821 849 28 176 565 754 775 21 210 742 752 10 642 674 32
San Jacinto Unified 585 717 738 21 153 512 673 704 31 192 555 705 726 21 171 645 759 777 18 132 555 702 723 21 168 688 703 15 565 596 31
Temecula Valley Unified 778 856 859 3 81 717 808 796 -12 79 711 818 826 8 115 798 874 877 3 79 667 792 799 7 132 764 764 0 686 684 -2
Val Verde Unified 628 781 789 8 161 606 756 766 10 160 614 777 784 7 170 687 832 827 -5 140 603 771 779 8 176 751 755 4 616 588 -28
Riverside County (School Average) 651 769 777 8 126 603 759 769 10 166 613 750 762 12 149 728 823 830 7 102 596 744 753 9 157 725 737 12 660 667 7
State of CA (School Average) 679 774 778 4 99 585 732 739 7 154 609 744 752 8 143 761 827 832 5 71 612 737 745 8 133 730 739 9 619 632 13
District
All Students English Learners Students with DisabilitiesAfrican American Hispanic White Socioeconomically
Disadvantaged
Page 5 of 52Prepared by Riverside County Office of Education
Assessment and Accountability Services08/30/2011
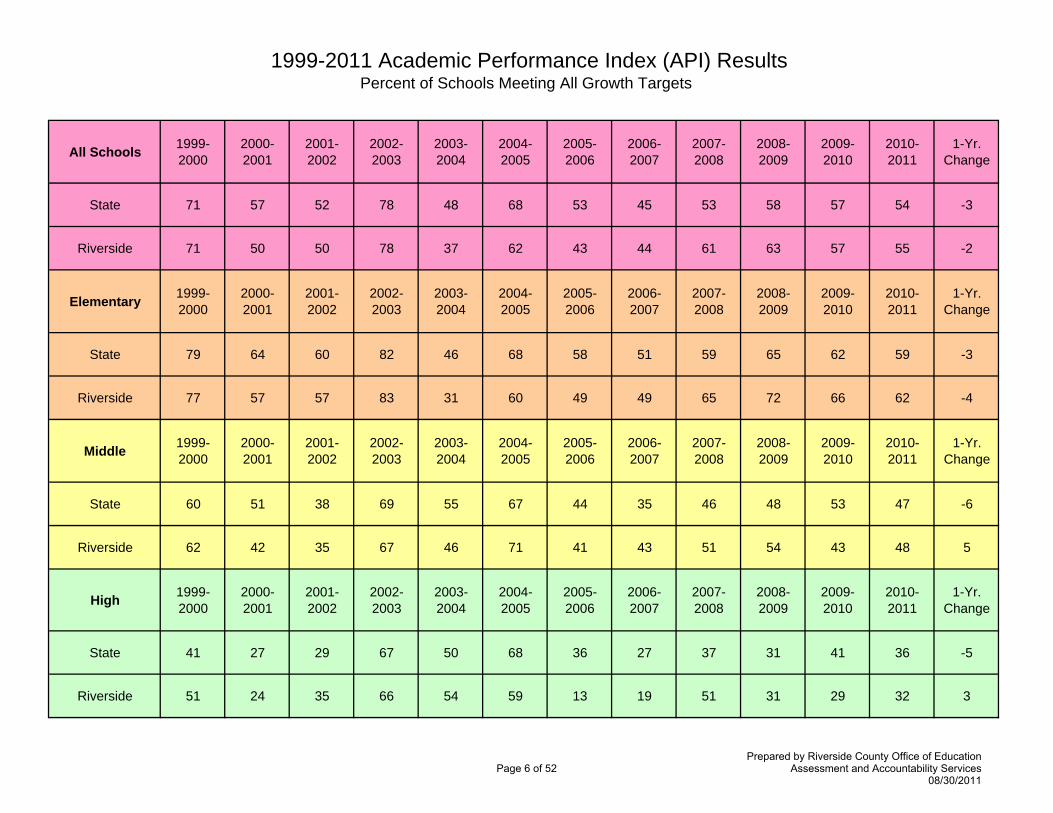
1999-2011 Academic Performance Index (API) ResultsPercent of Schools Meeting All Growth Targets
All Schools 1999-2000
2000-2001
2001-2002
2002-2003
2003-2004
2004-2005
2005-2006
2006-2007
2007-2008
2008-2009
2009-2010
2010-2011
1-Yr. Change
State 71 57 52 78 48 68 53 45 53 58 57 54 -3
Riverside 71 50 50 78 37 62 43 44 61 63 57 55 -2
Elementary 1999-2000
2000-2001
2001-2002
2002-2003
2003-2004
2004-2005
2005-2006
2006-2007
2007-2008
2008-2009
2009-2010
2010-2011
1-Yr. Change
State 79 64 60 82 46 68 58 51 59 65 62 59 -3
Riverside 77 57 57 83 31 60 49 49 65 72 66 62 -4
Middle 1999-2000
2000-2001
2001-2002
2002-2003
2003-2004
2004-2005
2005-2006
2006-2007
2007-2008
2008-2009
2009-2010
2010-2011
1-Yr. Change
State 60 51 38 69 55 67 44 35 46 48 53 47 -6
Riverside 62 42 35 67 46 71 41 43 51 54 43 48 5
High 1999-2000
2000-2001
2001-2002
2002-2003
2003-2004
2004-2005
2005-2006
2006-2007
2007-2008
2008-2009
2009-2010
2010-2011
1-Yr. Change
State 41 27 29 67 50 68 36 27 37 31 41 36 -5
Riverside 51 24 35 66 54 59 13 19 51 31 29 32 3
Page 6 of 52Prepared by Riverside County Office of Education
Assessment and Accountability Services08/30/2011
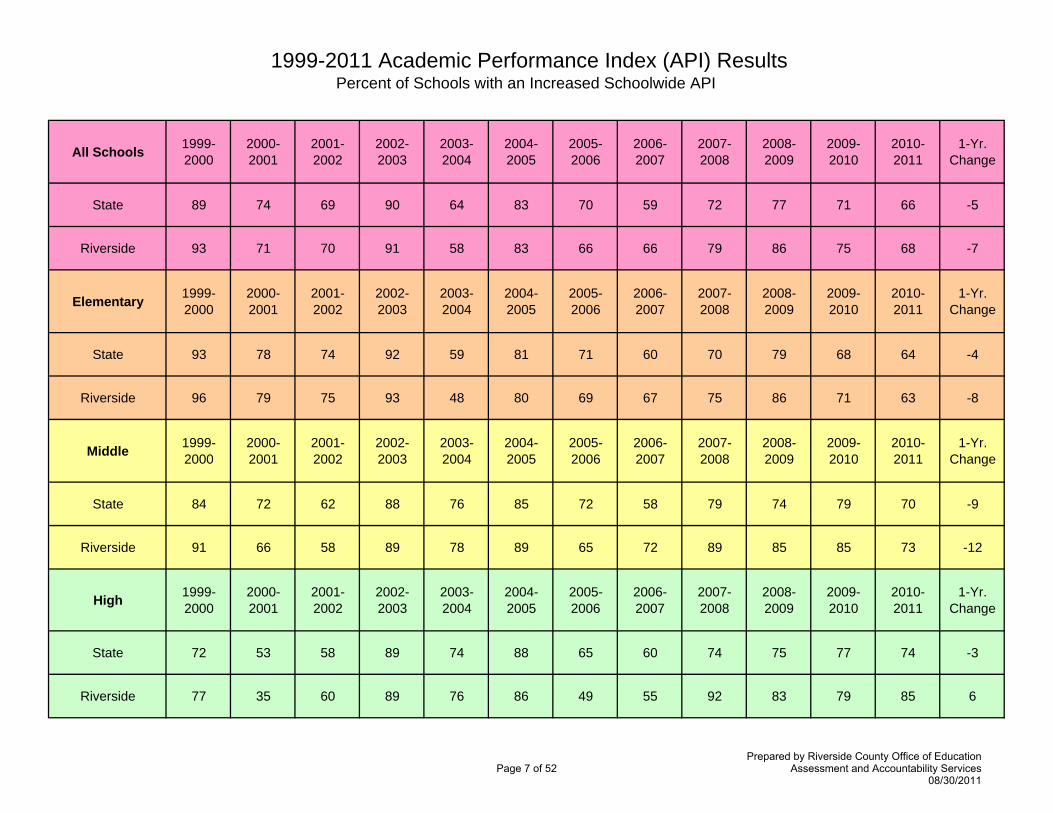
1999-2011 Academic Performance Index (API) ResultsPercent of Schools with an Increased Schoolwide API
All Schools 1999-2000
2000-2001
2001-2002
2002-2003
2003-2004
2004-2005
2005-2006
2006-2007
2007-2008
2008-2009
2009-2010
2010-2011
1-Yr. Change
State 89 74 69 90 64 83 70 59 72 77 71 66 -5
Riverside 93 71 70 91 58 83 66 66 79 86 75 68 -7
Elementary 1999-2000
2000-2001
2001-2002
2002-2003
2003-2004
2004-2005
2005-2006
2006-2007
2007-2008
2008-2009
2009-2010
2010-2011
1-Yr. Change
State 93 78 74 92 59 81 71 60 70 79 68 64 -4
Riverside 96 79 75 93 48 80 69 67 75 86 71 63 -8
Middle 1999-2000
2000-2001
2001-2002
2002-2003
2003-2004
2004-2005
2005-2006
2006-2007
2007-2008
2008-2009
2009-2010
2010-2011
1-Yr. Change
State 84 72 62 88 76 85 72 58 79 74 79 70 -9
Riverside 91 66 58 89 78 89 65 72 89 85 85 73 -12
High 1999-2000
2000-2001
2001-2002
2002-2003
2003-2004
2004-2005
2005-2006
2006-2007
2007-2008
2008-2009
2009-2010
2010-2011
1-Yr. Change
State 72 53 58 89 74 88 65 60 74 75 77 74 -3
Riverside 77 35 60 89 76 86 49 55 92 83 79 85 6
Page 7 of 52Prepared by Riverside County Office of Education
Assessment and Accountability Services08/30/2011
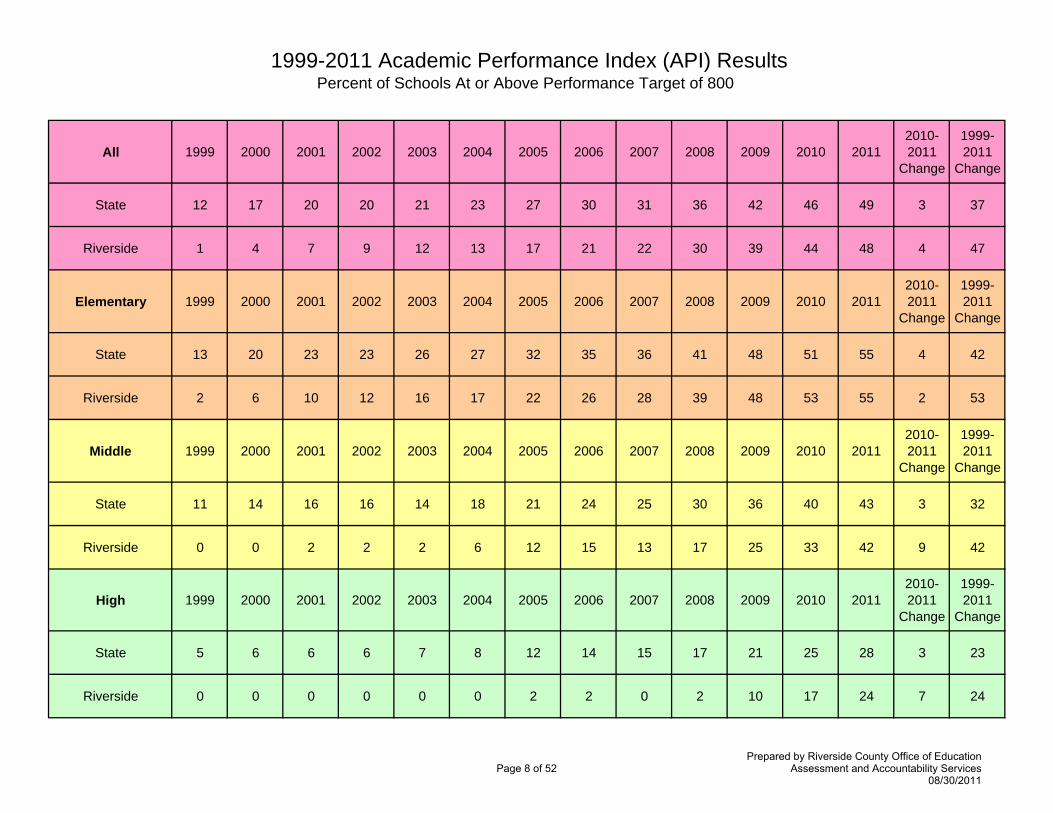
1999-2011 Academic Performance Index (API) ResultsPercent of Schools At or Above Performance Target of 800
All 1999 2000 2001 2002 2003 2004 2005 2006 2007 2008 2009 2010 20112010-2011
Change
1999-2011
Change
State 12 17 20 20 21 23 27 30 31 36 42 46 49 3 37
Riverside 1 4 7 9 12 13 17 21 22 30 39 44 48 4 47
Elementary 1999 2000 2001 2002 2003 2004 2005 2006 2007 2008 2009 2010 20112010-2011
Change
1999-2011
Change
State 13 20 23 23 26 27 32 35 36 41 48 51 55 4 42
Riverside 2 6 10 12 16 17 22 26 28 39 48 53 55 2 53
Middle 1999 2000 2001 2002 2003 2004 2005 2006 2007 2008 2009 2010 20112010-2011
Change
1999-2011
Change
State 11 14 16 16 14 18 21 24 25 30 36 40 43 3 32
Riverside 0 0 2 2 2 6 12 15 13 17 25 33 42 9 42
High 1999 2000 2001 2002 2003 2004 2005 2006 2007 2008 2009 2010 20112010-2011
Change
1999-2011
Change
State 5 6 6 6 7 8 12 14 15 17 21 25 28 3 23
Riverside 0 0 0 0 0 0 2 2 0 2 10 17 24 7 24
Page 8 of 52Prepared by Riverside County Office of Education
Assessment and Accountability Services08/30/2011
Adequate Yearly Progress (AYP)
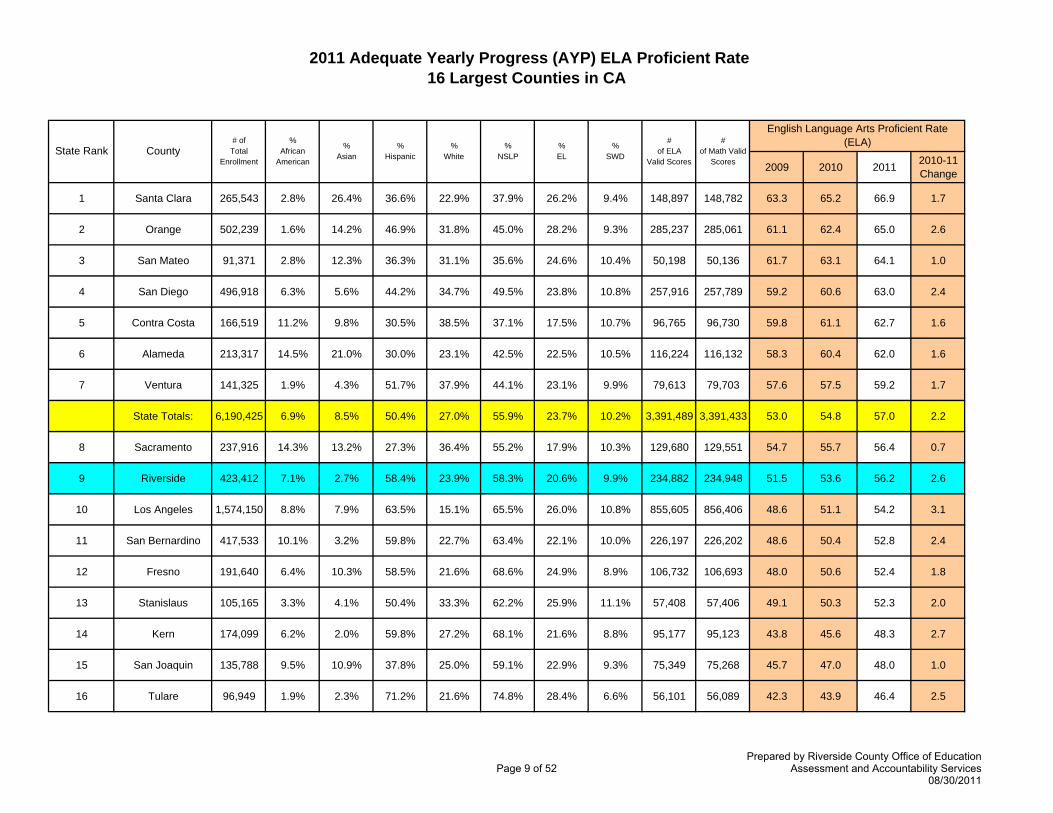
2011 Adequate Yearly Progress (AYP) ELA Proficient Rate16 Largest Counties in CA
2009 2010 2011 2010-11 Change
1 Santa Clara 265,543 2.8% 26.4% 36.6% 22.9% 37.9% 26.2% 9.4% 148,897 148,782 63.3 65.2 66.9 1.7
2 Orange 502,239 1.6% 14.2% 46.9% 31.8% 45.0% 28.2% 9.3% 285,237 285,061 61.1 62.4 65.0 2.6
3 San Mateo 91,371 2.8% 12.3% 36.3% 31.1% 35.6% 24.6% 10.4% 50,198 50,136 61.7 63.1 64.1 1.0
4 San Diego 496,918 6.3% 5.6% 44.2% 34.7% 49.5% 23.8% 10.8% 257,916 257,789 59.2 60.6 63.0 2.4
5 Contra Costa 166,519 11.2% 9.8% 30.5% 38.5% 37.1% 17.5% 10.7% 96,765 96,730 59.8 61.1 62.7 1.6
6 Alameda 213,317 14.5% 21.0% 30.0% 23.1% 42.5% 22.5% 10.5% 116,224 116,132 58.3 60.4 62.0 1.6
7 Ventura 141,325 1.9% 4.3% 51.7% 37.9% 44.1% 23.1% 9.9% 79,613 79,703 57.6 57.5 59.2 1.7
State Totals: 6,190,425 6.9% 8.5% 50.4% 27.0% 55.9% 23.7% 10.2% 3,391,489 3,391,433 53.0 54.8 57.0 2.2
8 Sacramento 237,916 14.3% 13.2% 27.3% 36.4% 55.2% 17.9% 10.3% 129,680 129,551 54.7 55.7 56.4 0.7
9 Riverside 423,412 7.1% 2.7% 58.4% 23.9% 58.3% 20.6% 9.9% 234,882 234,948 51.5 53.6 56.2 2.6
10 Los Angeles 1,574,150 8.8% 7.9% 63.5% 15.1% 65.5% 26.0% 10.8% 855,605 856,406 48.6 51.1 54.2 3.1
11 San Bernardino 417,533 10.1% 3.2% 59.8% 22.7% 63.4% 22.1% 10.0% 226,197 226,202 48.6 50.4 52.8 2.4
12 Fresno 191,640 6.4% 10.3% 58.5% 21.6% 68.6% 24.9% 8.9% 106,732 106,693 48.0 50.6 52.4 1.8
13 Stanislaus 105,165 3.3% 4.1% 50.4% 33.3% 62.2% 25.9% 11.1% 57,408 57,406 49.1 50.3 52.3 2.0
14 Kern 174,099 6.2% 2.0% 59.8% 27.2% 68.1% 21.6% 8.8% 95,177 95,123 43.8 45.6 48.3 2.7
15 San Joaquin 135,788 9.5% 10.9% 37.8% 25.0% 59.1% 22.9% 9.3% 75,349 75,268 45.7 47.0 48.0 1.0
16 Tulare 96,949 1.9% 2.3% 71.2% 21.6% 74.8% 28.4% 6.6% 56,101 56,089 42.3 43.9 46.4 2.5
State Rank % SWD
# of ELA
Valid Scores
# of Math Valid
ScoresCounty
# of Total
Enrollment
% African
American
% Asian
English Language Arts Proficient Rate (ELA)%
Hispanic%
White%
NSLP% EL
Page 9 of 52Prepared by Riverside County Office of Education
Assessment and Accountability Services08/30/2011
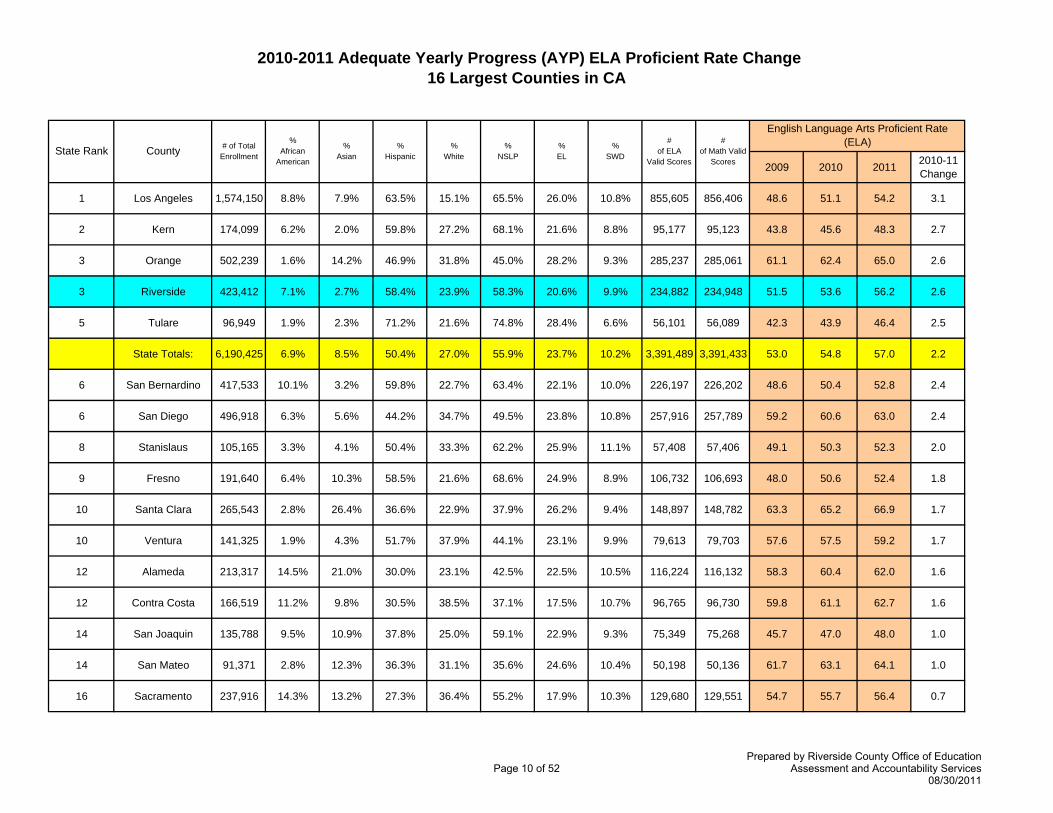
2010-2011 Adequate Yearly Progress (AYP) ELA Proficient Rate Change16 Largest Counties in CA
2009 2010 2011 2010-11 Change
1 Los Angeles 1,574,150 8.8% 7.9% 63.5% 15.1% 65.5% 26.0% 10.8% 855,605 856,406 48.6 51.1 54.2 3.1
2 Kern 174,099 6.2% 2.0% 59.8% 27.2% 68.1% 21.6% 8.8% 95,177 95,123 43.8 45.6 48.3 2.7
3 Orange 502,239 1.6% 14.2% 46.9% 31.8% 45.0% 28.2% 9.3% 285,237 285,061 61.1 62.4 65.0 2.6
3 Riverside 423,412 7.1% 2.7% 58.4% 23.9% 58.3% 20.6% 9.9% 234,882 234,948 51.5 53.6 56.2 2.6
5 Tulare 96,949 1.9% 2.3% 71.2% 21.6% 74.8% 28.4% 6.6% 56,101 56,089 42.3 43.9 46.4 2.5
State Totals: 6,190,425 6.9% 8.5% 50.4% 27.0% 55.9% 23.7% 10.2% 3,391,489 3,391,433 53.0 54.8 57.0 2.2
6 San Bernardino 417,533 10.1% 3.2% 59.8% 22.7% 63.4% 22.1% 10.0% 226,197 226,202 48.6 50.4 52.8 2.4
6 San Diego 496,918 6.3% 5.6% 44.2% 34.7% 49.5% 23.8% 10.8% 257,916 257,789 59.2 60.6 63.0 2.4
8 Stanislaus 105,165 3.3% 4.1% 50.4% 33.3% 62.2% 25.9% 11.1% 57,408 57,406 49.1 50.3 52.3 2.0
9 Fresno 191,640 6.4% 10.3% 58.5% 21.6% 68.6% 24.9% 8.9% 106,732 106,693 48.0 50.6 52.4 1.8
10 Santa Clara 265,543 2.8% 26.4% 36.6% 22.9% 37.9% 26.2% 9.4% 148,897 148,782 63.3 65.2 66.9 1.7
10 Ventura 141,325 1.9% 4.3% 51.7% 37.9% 44.1% 23.1% 9.9% 79,613 79,703 57.6 57.5 59.2 1.7
12 Alameda 213,317 14.5% 21.0% 30.0% 23.1% 42.5% 22.5% 10.5% 116,224 116,132 58.3 60.4 62.0 1.6
12 Contra Costa 166,519 11.2% 9.8% 30.5% 38.5% 37.1% 17.5% 10.7% 96,765 96,730 59.8 61.1 62.7 1.6
14 San Joaquin 135,788 9.5% 10.9% 37.8% 25.0% 59.1% 22.9% 9.3% 75,349 75,268 45.7 47.0 48.0 1.0
14 San Mateo 91,371 2.8% 12.3% 36.3% 31.1% 35.6% 24.6% 10.4% 50,198 50,136 61.7 63.1 64.1 1.0
16 Sacramento 237,916 14.3% 13.2% 27.3% 36.4% 55.2% 17.9% 10.3% 129,680 129,551 54.7 55.7 56.4 0.7
English Language Arts Proficient Rate (ELA)%
Hispanic%
White%
NSLP% ELState Rank %
SWD
# of ELA
Valid Scores
# of Math Valid
ScoresCounty # of Total
Enrollment
% African
American
% Asian
Page 10 of 52Prepared by Riverside County Office of Education
Assessment and Accountability Services08/30/2011
2002-2011 Adequate Yearly Progress (AYP) ELA Proficient Rate Change16 Largest Counties in CA
2002 2010 2011 2010-11 Change
2002-11 Change
1 Riverside 423,412 7.1% 2.7% 58.4% 23.9% 58.3% 20.6% 9.9% 234,882 234,948 28.0 53.6 56.2 2.6 28.2
2 Los Angeles 1,574,150 8.8% 7.9% 63.5% 15.1% 65.5% 26.0% 10.8% 855,605 856,406 26.3 51.1 54.2 3.1 27.9
3 Fresno 191,640 6.4% 10.3% 58.5% 21.6% 68.6% 24.9% 8.9% 106,732 106,693 24.8 50.6 52.4 1.8 27.6
4 San Bernardino 417,533 10.1% 3.2% 59.8% 22.7% 63.4% 22.1% 10.0% 226,197 226,202 26.0 50.4 52.8 2.4 26.8
5 Tulare 96,949 1.9% 2.3% 71.2% 21.6% 74.8% 28.4% 6.6% 56,101 56,089 20.2 43.9 46.4 2.5 26.2
6 Orange 502,239 1.6% 14.2% 46.9% 31.8% 45.0% 28.2% 9.3% 285,237 285,061 39.1 62.4 65.0 2.6 25.9
7 San Diego 496,918 6.3% 5.6% 44.2% 34.7% 49.5% 23.8% 10.8% 257,916 257,789 37.9 60.6 63.0 2.4 25.1
State Totals: 6,190,425 6.9% 8.5% 50.4% 27.0% 55.9% 23.7% 10.2% 3,391,489 3,391,433 32.0 54.8 57.0 2.2 25.0
8 Alameda 213,317 14.5% 21.0% 30.0% 23.1% 42.5% 22.5% 10.5% 116,224 116,132 38.2 60.4 62.0 1.6 23.8
9 Stanislaus 105,165 3.3% 4.1% 50.4% 33.3% 62.2% 25.9% 11.1% 57,408 57,406 28.8 50.3 52.3 2.0 23.5
10 Kern 174,099 6.2% 2.0% 59.8% 27.2% 68.1% 21.6% 8.8% 95,177 95,123 25.2 45.6 48.3 2.7 23.1
11 San Joaquin 135,788 9.5% 10.9% 37.8% 25.0% 59.1% 22.9% 9.3% 75,349 75,268 25.2 47.0 48.0 1.0 22.8
12 San Mateo 91,371 2.8% 12.3% 36.3% 31.1% 35.6% 24.6% 10.4% 50,198 50,136 42.1 63.1 64.1 1.0 22.0
13 Santa Clara 265,543 2.8% 26.4% 36.6% 22.9% 37.9% 26.2% 9.4% 148,897 148,782 45.3 65.2 66.9 1.7 21.6
14 Contra Costa 166,519 11.2% 9.8% 30.5% 38.5% 37.1% 17.5% 10.7% 96,765 96,730 41.8 61.1 62.7 1.6 20.9
15 Sacramento 237,916 14.3% 13.2% 27.3% 36.4% 55.2% 17.9% 10.3% 129,680 129,551 35.7 55.7 56.4 0.7 20.7
16 Ventura 141,325 1.9% 4.3% 51.7% 37.9% 44.1% 23.1% 9.9% 79,613 79,703 39.5 57.5 59.2 1.7 19.7
% NSLP
% EL
English Language ArtsProficient Rate (ELA)State Rank %
SWD
# of ELA
Valid Scores
# of Math Valid
ScoresCounty # of Total
Enrollment
% African
American
% Asian
% Hispanic
% White
Page 11 of 52Prepared by Riverside County Office of Education
Assessment and Accountability Services08/30/2011
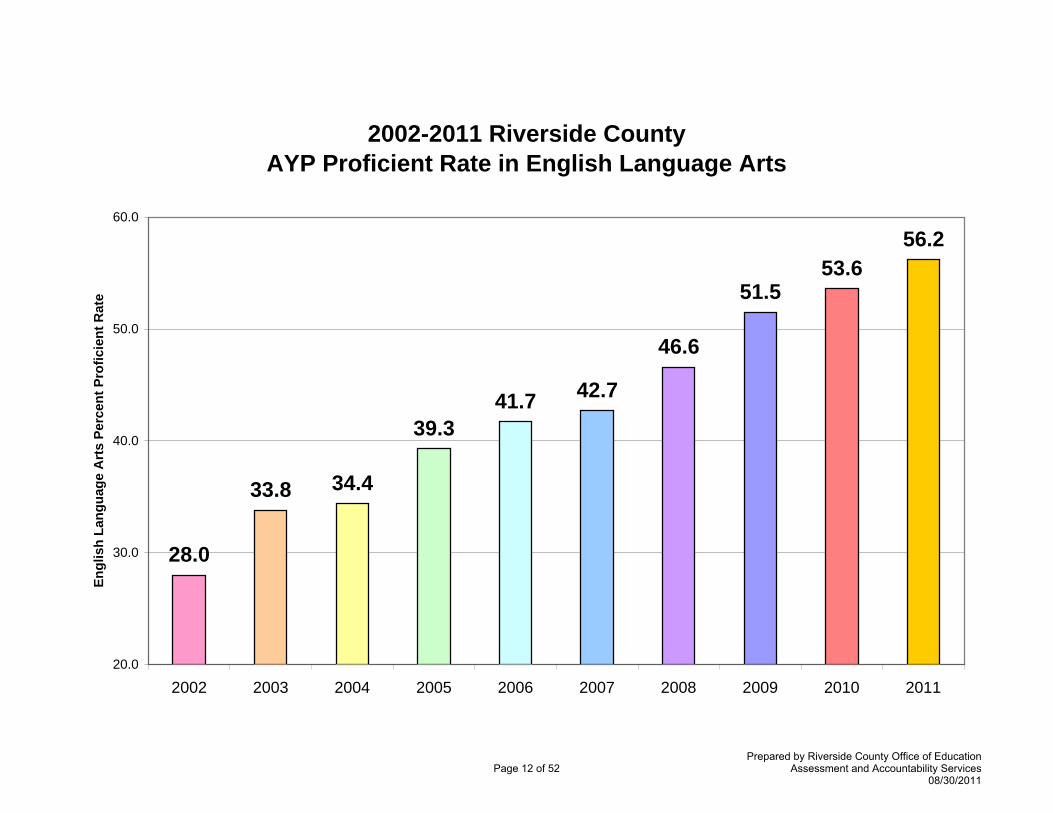
2002-2011 Riverside CountyAYP Proficient Rate in English Language Arts
28.0
33.8 34.4
39.341.7 42.7
46.6
51.553.6
56.2
20.0
30.0
40.0
50.0
60.0
2002 2003 2004 2005 2006 2007 2008 2009 2010 2011
Engl
ish
Lang
uage
Art
s Pe
rcen
t Pro
ficie
nt R
ate
Page 12 of 52Prepared by Riverside County Office of Education
Assessment and Accountability Services08/30/2011
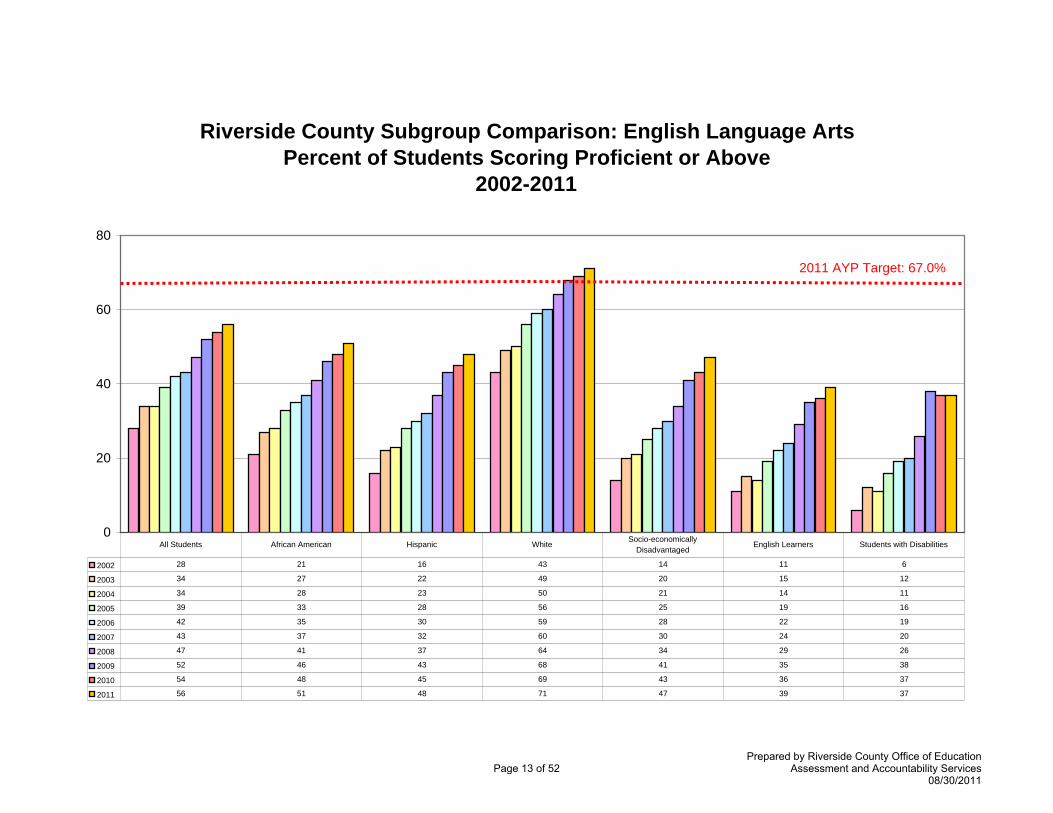
Riverside County Subgroup Comparison: English Language ArtsPercent of Students Scoring Proficient or Above
2002-2011
0
20
40
60
80
2002 28 21 16 43 14 11 6
2003 34 27 22 49 20 15 12
2004 34 28 23 50 21 14 11
2005 39 33 28 56 25 19 16
2006 42 35 30 59 28 22 19
2007 43 37 32 60 30 24 20
2008 47 41 37 64 34 29 26
2009 52 46 43 68 41 35 38
2010 54 48 45 69 43 36 37
2011 56 51 48 71 47 39 37
All Students African American Hispanic White Socio-economically Disadvantaged
English Learners Students with Disabilities
2011 AYP Target: 67.0%
Page 13 of 52Prepared by Riverside County Office of Education
Assessment and Accountability Services08/30/2011
2011 Adequate Yearly Progress (AYP) Mathematics Proficient Rate16 Largest Counties in CA
2009 2010 2011 2010-11 Change
1 Santa Clara 265,543 2.8% 26.4% 36.6% 22.9% 37.9% 26.2% 9.4% 148,897 148,782 64.6 67.0 68.7 1.7
2 Orange 502,239 1.6% 14.2% 46.9% 31.8% 45.0% 28.2% 9.3% 285,237 285,061 63.8 65.3 68.1 2.8
3 San Mateo 91,371 2.8% 12.3% 36.3% 31.1% 35.6% 24.6% 10.4% 50,198 50,136 62.2 64.4 65.5 1.1
4 San Diego 496,918 6.3% 5.6% 44.2% 34.7% 49.5% 23.8% 10.8% 257,916 257,789 61.3 62.6 64.3 1.7
5 Contra Costa 166,519 11.2% 9.8% 30.5% 38.5% 37.1% 17.5% 10.7% 96,765 96,730 58.9 61.3 63.4 2.1
6 Alameda 213,317 14.5% 21.0% 30.0% 23.1% 42.5% 22.5% 10.5% 116,224 116,132 59.1 61.5 62.7 1.2
7 Ventura 141,325 1.9% 4.3% 51.7% 37.9% 44.1% 23.1% 9.9% 79,613 79,703 58.9 58.8 59.9 1.1
State Totals: 6,190,425 6.9% 8.5% 50.4% 27.0% 55.9% 23.7% 10.2% 3,391,489 3,391,433 55.4 57.5 59.6 2.1
8 Sacramento 237,916 14.3% 13.2% 27.3% 36.4% 55.2% 17.9% 10.3% 129,680 129,551 56.8 58.1 58.9 0.8
9 Fresno 191,640 6.4% 10.3% 58.5% 21.6% 68.6% 24.9% 8.9% 106,732 106,693 54.5 57.0 58.6 1.6
10 Riverside 423,412 7.1% 2.7% 58.4% 23.9% 58.3% 20.6% 9.9% 234,882 234,948 53.6 56.0 58.3 2.3
11 Los Angeles 1,574,150 8.8% 7.9% 63.5% 15.1% 65.5% 26.0% 10.8% 855,605 856,406 52.2 54.5 57.4 2.9
12 San Bernardino 417,533 10.1% 3.2% 59.8% 22.7% 63.4% 22.1% 10.0% 226,197 226,202 50.7 53.2 55.2 2.0
13 Stanislaus 105,165 3.3% 4.1% 50.4% 33.3% 62.2% 25.9% 11.1% 57,408 57,406 50.8 52.7 53.8 1.1
14 Tulare 96,949 1.9% 2.3% 71.2% 21.6% 74.8% 28.4% 6.6% 56,101 56,089 48.4 50.0 53.3 3.3
15 Kern 174,099 6.2% 2.0% 59.8% 27.2% 68.1% 21.6% 8.8% 95,177 95,123 46.8 49.7 52.1 2.4
16 San Joaquin 135,788 9.5% 10.9% 37.8% 25.0% 59.1% 22.9% 9.3% 75,349 75,268 48.2 48.3 50.2 1.9
Mathematics Proficient Rate%
Hispanic%
White%
NSLP% ELState Rank %
SWD
# of ELA
Valid Scores
# of Math Valid
ScoresCounty # of Total
Enrollment
% African
American
% Asian
Page 14 of 52Prepared by Riverside County Office of Education
Assessment and Accountability Services08/30/2011
2010-2011 Adequate Yearly Progress (AYP) Mathematics Proficient Rate Change16 Largest Counties in CA
2009 2010 2011 2010-11 Change
1 Tulare 96,949 1.9% 2.3% 71.2% 21.6% 74.8% 28.4% 6.6% 56,101 56,089 48.4 50.0 53.3 3.3
2 Los Angeles 1,574,150 8.8% 7.9% 63.5% 15.1% 65.5% 26.0% 10.8% 855,605 856,406 52.2 54.5 57.4 2.9
3 Orange 502,239 1.6% 14.2% 46.9% 31.8% 45.0% 28.2% 9.3% 285,237 285,061 63.8 65.3 68.1 2.8
4 Kern 174,099 6.2% 2.0% 59.8% 27.2% 68.1% 21.6% 8.8% 95,177 95,123 46.8 49.7 52.1 2.4
5 Riverside 423,412 7.1% 2.7% 58.4% 23.9% 58.3% 20.6% 9.9% 234,882 234,948 53.6 56.0 58.3 2.3
6 Contra Costa 166,519 11.2% 9.8% 30.5% 38.5% 37.1% 17.5% 10.7% 96,765 96,730 58.9 61.3 63.4 2.1
State Totals: 6,190,425 6.9% 8.5% 50.4% 27.0% 55.9% 23.7% 10.2% 3,391,489 3,391,433 55.4 57.5 59.6 2.1
7 San Bernardino 417,533 10.1% 3.2% 59.8% 22.7% 63.4% 22.1% 10.0% 226,197 226,202 50.7 53.2 55.2 2.0
8 San Joaquin 135,788 9.5% 10.9% 37.8% 25.0% 59.1% 22.9% 9.3% 75,349 75,268 48.2 48.3 50.2 1.9
9 Santa Clara 265,543 2.8% 26.4% 36.6% 22.9% 37.9% 26.2% 9.4% 148,897 148,782 64.6 67.0 68.7 1.7
9 San Diego 496,918 6.3% 5.6% 44.2% 34.7% 49.5% 23.8% 10.8% 257,916 257,789 61.3 62.6 64.3 1.7
11 Fresno 191,640 6.4% 10.3% 58.5% 21.6% 68.6% 24.9% 8.9% 106,732 106,693 54.5 57.0 58.6 1.6
12 Alameda 213,317 14.5% 21.0% 30.0% 23.1% 42.5% 22.5% 10.5% 116,224 116,132 59.1 61.5 62.7 1.2
13 Stanislaus 105,165 3.3% 4.1% 50.4% 33.3% 62.2% 25.9% 11.1% 57,408 57,406 50.8 52.7 53.8 1.1
13 Ventura 141,325 1.9% 4.3% 51.7% 37.9% 44.1% 23.1% 9.9% 79,613 79,703 58.9 58.8 59.9 1.1
13 San Mateo 91,371 2.8% 12.3% 36.3% 31.1% 35.6% 24.6% 10.4% 50,198 50,136 62.2 64.4 65.5 1.1
16 Sacramento 237,916 14.3% 13.2% 27.3% 36.4% 55.2% 17.9% 10.3% 129,680 129,551 56.8 58.1 58.9 0.8
State Rank % SWD
# of ELA
Valid Scores
# of Math Valid
ScoresCounty # of Total
Enrollment
% African
American
% Asian
Mathematics Proficient Rate%
Hispanic%
White%
NSLP% EL
Page 15 of 52Prepared by Riverside County Office of Education
Assessment and Accountability Services08/30/2011
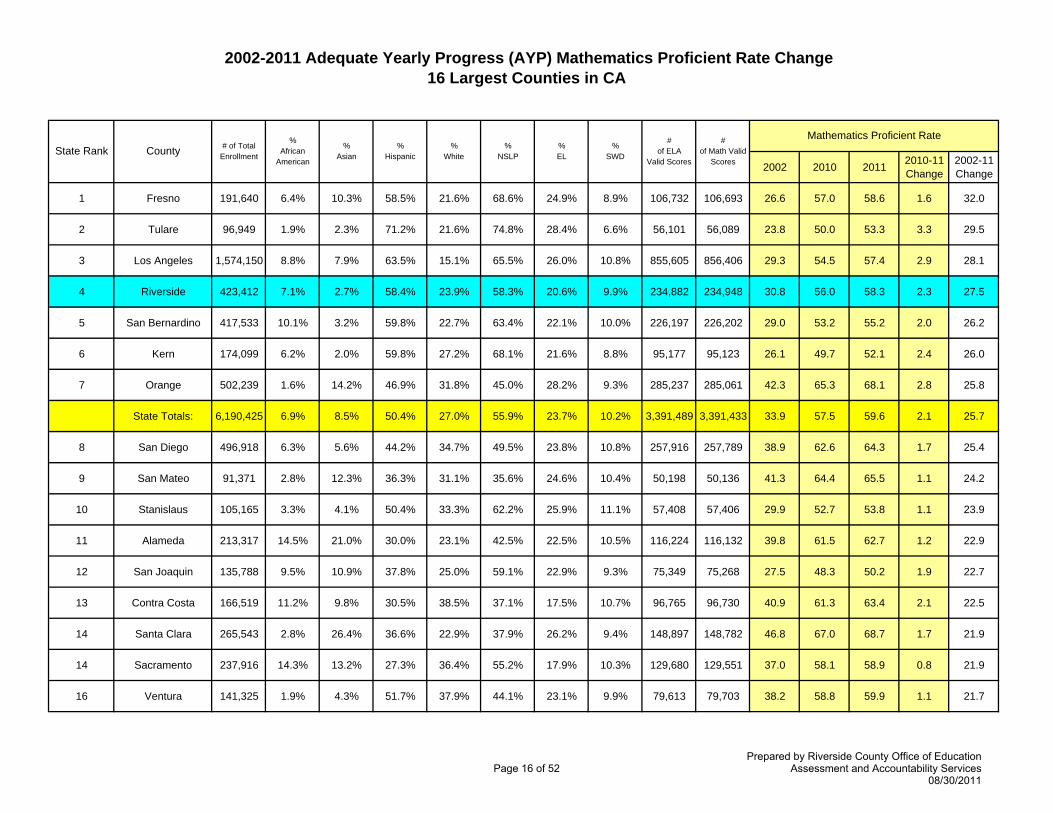
2002-2011 Adequate Yearly Progress (AYP) Mathematics Proficient Rate Change16 Largest Counties in CA
2002 2010 2011 2010-11 Change
2002-11 Change
1 Fresno 191,640 6.4% 10.3% 58.5% 21.6% 68.6% 24.9% 8.9% 106,732 106,693 26.6 57.0 58.6 1.6 32.0
2 Tulare 96,949 1.9% 2.3% 71.2% 21.6% 74.8% 28.4% 6.6% 56,101 56,089 23.8 50.0 53.3 3.3 29.5
3 Los Angeles 1,574,150 8.8% 7.9% 63.5% 15.1% 65.5% 26.0% 10.8% 855,605 856,406 29.3 54.5 57.4 2.9 28.1
4 Riverside 423,412 7.1% 2.7% 58.4% 23.9% 58.3% 20.6% 9.9% 234,882 234,948 30.8 56.0 58.3 2.3 27.5
5 San Bernardino 417,533 10.1% 3.2% 59.8% 22.7% 63.4% 22.1% 10.0% 226,197 226,202 29.0 53.2 55.2 2.0 26.2
6 Kern 174,099 6.2% 2.0% 59.8% 27.2% 68.1% 21.6% 8.8% 95,177 95,123 26.1 49.7 52.1 2.4 26.0
7 Orange 502,239 1.6% 14.2% 46.9% 31.8% 45.0% 28.2% 9.3% 285,237 285,061 42.3 65.3 68.1 2.8 25.8
State Totals: 6,190,425 6.9% 8.5% 50.4% 27.0% 55.9% 23.7% 10.2% 3,391,489 3,391,433 33.9 57.5 59.6 2.1 25.7
8 San Diego 496,918 6.3% 5.6% 44.2% 34.7% 49.5% 23.8% 10.8% 257,916 257,789 38.9 62.6 64.3 1.7 25.4
9 San Mateo 91,371 2.8% 12.3% 36.3% 31.1% 35.6% 24.6% 10.4% 50,198 50,136 41.3 64.4 65.5 1.1 24.2
10 Stanislaus 105,165 3.3% 4.1% 50.4% 33.3% 62.2% 25.9% 11.1% 57,408 57,406 29.9 52.7 53.8 1.1 23.9
11 Alameda 213,317 14.5% 21.0% 30.0% 23.1% 42.5% 22.5% 10.5% 116,224 116,132 39.8 61.5 62.7 1.2 22.9
12 San Joaquin 135,788 9.5% 10.9% 37.8% 25.0% 59.1% 22.9% 9.3% 75,349 75,268 27.5 48.3 50.2 1.9 22.7
13 Contra Costa 166,519 11.2% 9.8% 30.5% 38.5% 37.1% 17.5% 10.7% 96,765 96,730 40.9 61.3 63.4 2.1 22.5
14 Santa Clara 265,543 2.8% 26.4% 36.6% 22.9% 37.9% 26.2% 9.4% 148,897 148,782 46.8 67.0 68.7 1.7 21.9
14 Sacramento 237,916 14.3% 13.2% 27.3% 36.4% 55.2% 17.9% 10.3% 129,680 129,551 37.0 58.1 58.9 0.8 21.9
16 Ventura 141,325 1.9% 4.3% 51.7% 37.9% 44.1% 23.1% 9.9% 79,613 79,703 38.2 58.8 59.9 1.1 21.7
% Hispanic
% White
% NSLP
% EL
Mathematics Proficient RateState Rank %
SWD
# of ELA
Valid Scores
# of Math Valid
ScoresCounty # of Total
Enrollment
% African
American
% Asian
Page 16 of 52Prepared by Riverside County Office of Education
Assessment and Accountability Services08/30/2011
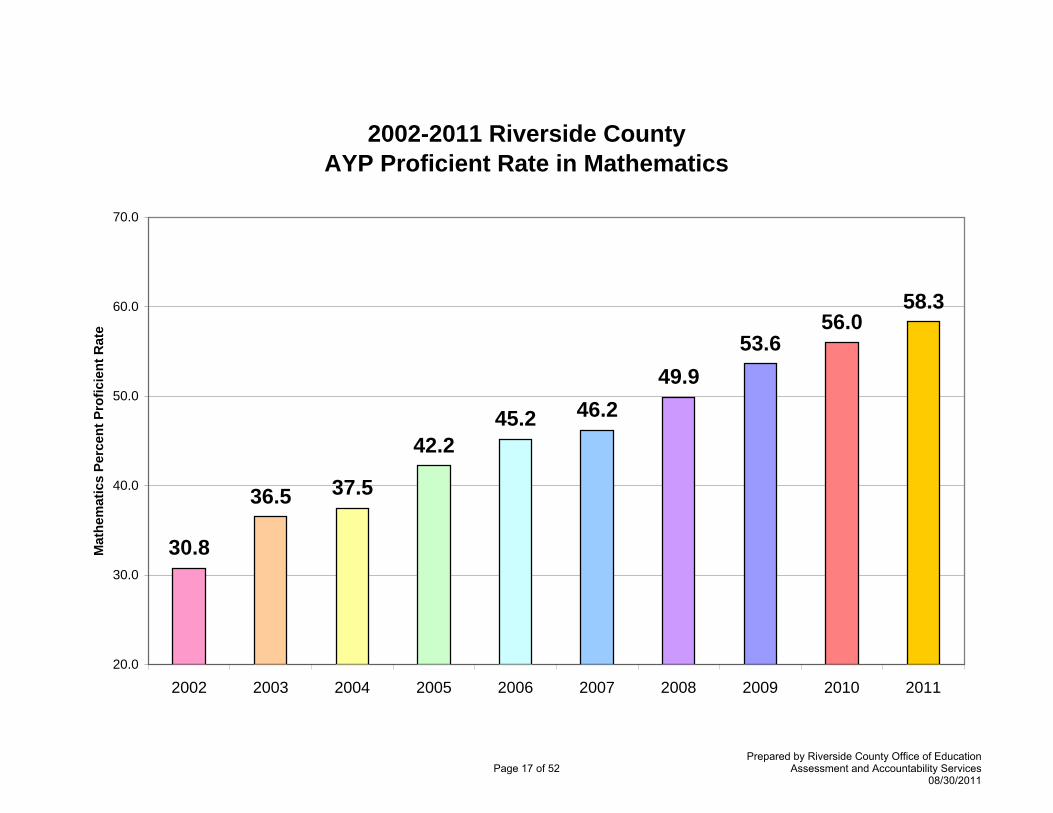
2002-2011 Riverside CountyAYP Proficient Rate in Mathematics
30.8
36.5 37.5
42.245.2 46.2
49.953.6
56.058.3
20.0
30.0
40.0
50.0
60.0
70.0
2002 2003 2004 2005 2006 2007 2008 2009 2010 2011
Mat
hem
atic
s Pe
rcen
t Pro
ficie
nt R
ate
Page 17 of 52Prepared by Riverside County Office of Education
Assessment and Accountability Services08/30/2011
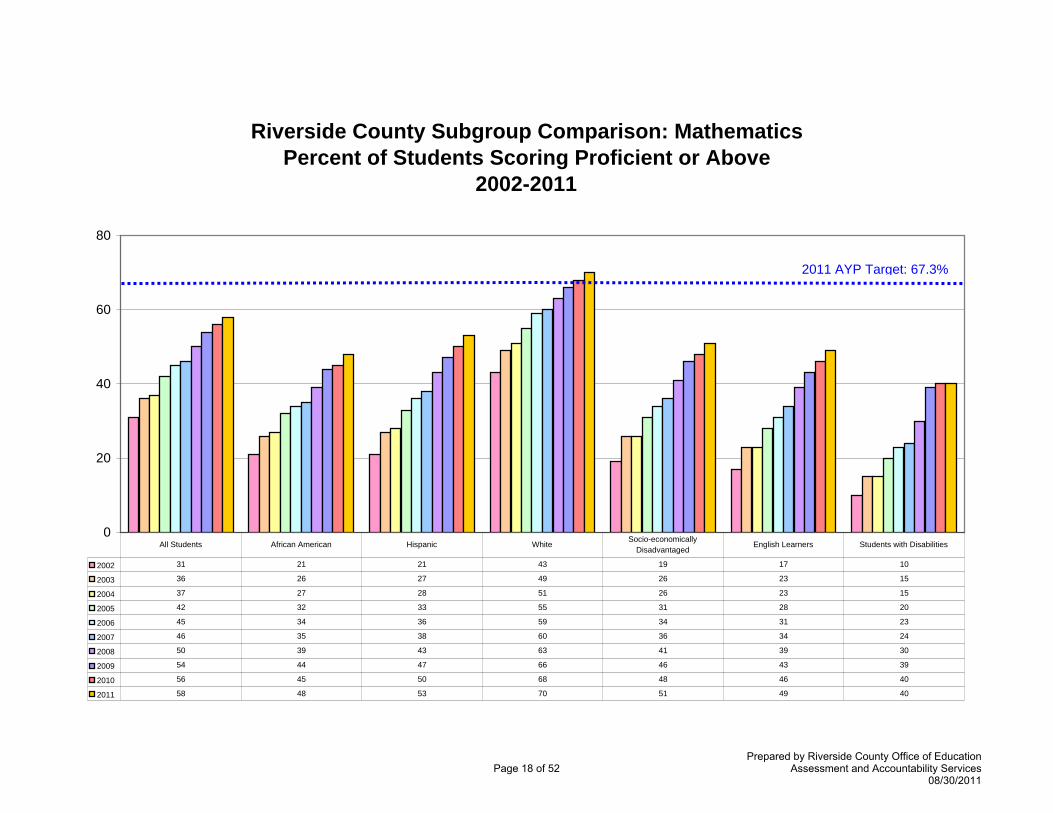
Riverside County Subgroup Comparison: MathematicsPercent of Students Scoring Proficient or Above
2002-2011
0
20
40
60
80
2002 31 21 21 43 19 17 10
2003 36 26 27 49 26 23 15
2004 37 27 28 51 26 23 15
2005 42 32 33 55 31 28 20
2006 45 34 36 59 34 31 23
2007 46 35 38 60 36 34 24
2008 50 39 43 63 41 39 30
2009 54 44 47 66 46 43 39
2010 56 45 50 68 48 46 40
2011 58 48 53 70 51 49 40
All Students African American Hispanic White Socio-economically Disadvantaged
English Learners Students with Disabilities
2011 AYP Target: 67.3%
Page 18 of 52Prepared by Riverside County Office of Education
Assessment and Accountability Services08/30/2011
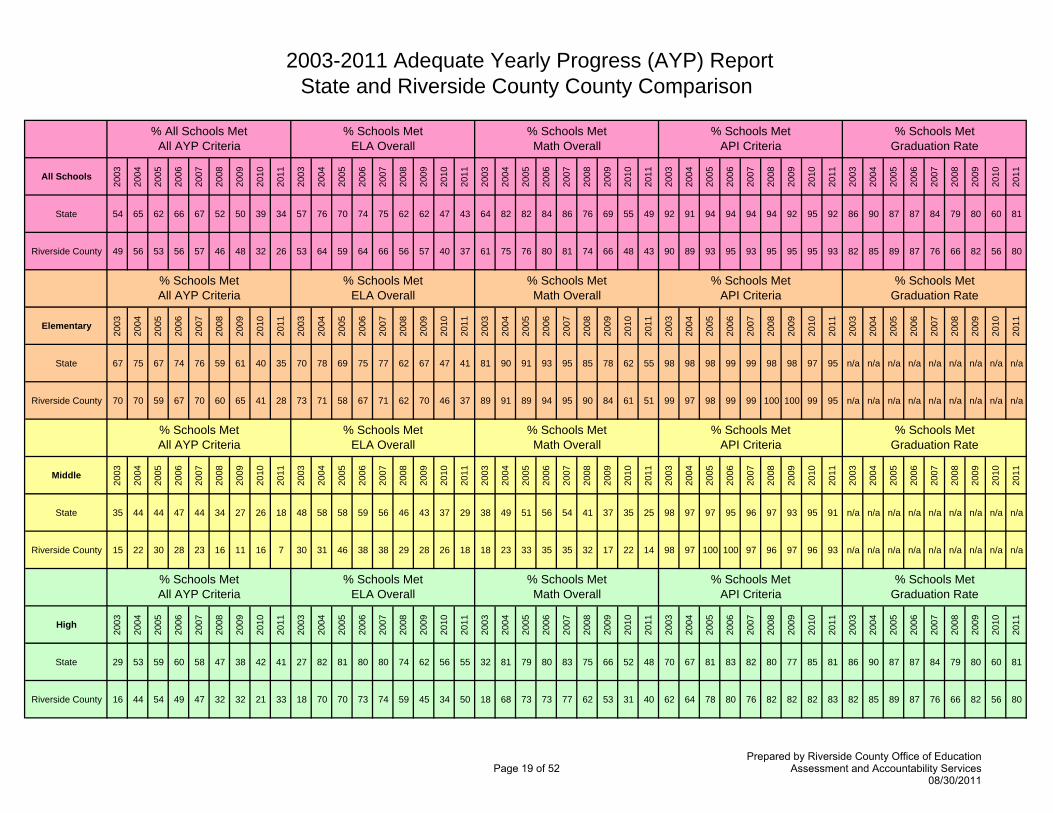
2003-2011 Adequate Yearly Progress (AYP) ReportState and Riverside County County Comparison
All Schools
2003
2004
2005
2006
2007
2008
2009
2010
2011
2003
2004
2005
2006
2007
2008
2009
2010
2011
2003
2004
2005
2006
2007
2008
2009
2010
2011
2003
2004
2005
2006
2007
2008
2009
2010
2011
2003
2004
2005
2006
2007
2008
2009
2010
2011
State 54 65 62 66 67 52 50 39 34 57 76 70 74 75 62 62 47 43 64 82 82 84 86 76 69 55 49 92 91 94 94 94 94 92 95 92 86 90 87 87 84 79 80 60 81
Riverside County 49 56 53 56 57 46 48 32 26 53 64 59 64 66 56 57 40 37 61 75 76 80 81 74 66 48 43 90 89 93 95 93 95 95 95 93 82 85 89 87 76 66 82 56 80
Elementary
2003
2004
2005
2006
2007
2008
2009
2010
2011
2003
2004
2005
2006
2007
2008
2009
2010
2011
2003
2004
2005
2006
2007
2008
2009
2010
2011
2003
2004
2005
2006
2007
2008
2009
2010
2011
2003
2004
2005
2006
2007
2008
2009
2010
2011
State 67 75 67 74 76 59 61 40 35 70 78 69 75 77 62 67 47 41 81 90 91 93 95 85 78 62 55 98 98 98 99 99 98 98 97 95 n/a n/a n/a n/a n/a n/a n/a n/a n/a
Riverside County 70 70 59 67 70 60 65 41 28 73 71 58 67 71 62 70 46 37 89 91 89 94 95 90 84 61 51 99 97 98 99 99 100 100 99 95 n/a n/a n/a n/a n/a n/a n/a n/a n/a
Middle
2003
2004
2005
2006
2007
2008
2009
2010
2011
2003
2004
2005
2006
2007
2008
2009
2010
2011
2003
2004
2005
2006
2007
2008
2009
2010
2011
2003
2004
2005
2006
2007
2008
2009
2010
2011
2003
2004
2005
2006
2007
2008
2009
2010
2011
State 35 44 44 47 44 34 27 26 18 48 58 58 59 56 46 43 37 29 38 49 51 56 54 41 37 35 25 98 97 97 95 96 97 93 95 91 n/a n/a n/a n/a n/a n/a n/a n/a n/a
Riverside County 15 22 30 28 23 16 11 16 7 30 31 46 38 38 29 28 26 18 18 23 33 35 35 32 17 22 14 98 97 100 100 97 96 97 96 93 n/a n/a n/a n/a n/a n/a n/a n/a n/a
High
2003
2004
2005
2006
2007
2008
2009
2010
2011
2003
2004
2005
2006
2007
2008
2009
2010
2011
2003
2004
2005
2006
2007
2008
2009
2010
2011
2003
2004
2005
2006
2007
2008
2009
2010
2011
2003
2004
2005
2006
2007
2008
2009
2010
2011
State 29 53 59 60 58 47 38 42 41 27 82 81 80 80 74 62 56 55 32 81 79 80 83 75 66 52 48 70 67 81 83 82 80 77 85 81 86 90 87 87 84 79 80 60 81
Riverside County 16 44 54 49 47 32 32 21 33 18 70 70 73 74 59 45 34 50 18 68 73 73 77 62 53 31 40 62 64 78 80 76 82 82 82 83 82 85 89 87 76 66 82 56 80
% Schools Met Graduation Rate
% Schools Met ELA Overall
% Schools Met Math Overall
% Schools Met API Criteria
% Schools Met Graduation Rate
% Schools Met API Criteria
% Schools Met Math Overall
% Schools Met ELA Overall
% Schools Met Graduation Rate
% Schools Met ELA Overall
% Schools Met Math Overall
% Schools Met API Criteria
% Schools Met Graduation Rate
% Schools Met ELA Overall
% Schools Met Math Overall
% Schools Met API Criteria
% All Schools Met All AYP Criteria
% Schools Met All AYP Criteria
% Schools Met All AYP Criteria
% Schools Met All AYP Criteria
Page 19 of 52Prepared by Riverside County Office of Education
Assessment and Accountability Services08/30/2011
List of Riverside County School Districts
2011 Accountability Progress Report (APR)Riverside County Districts
District
Met
All
2011
AYP
Crit
eria
?
Met
201
1 EL
A?
Met
201
1 M
ath?
Met
201
1API
?
Met
201
1 G
radu
atio
n R
ate?
2011
ELA
Pro
ficie
nt R
ate
2010
-201
1 EL
A
Pr
ofic
ient
Rat
e C
hang
e20
02-2
011
ELA
Prof
icie
nt R
ate
Cha
nge
2011
MAT
H P
rofic
ient
Rat
e
2010
-201
1 M
ATH
Prof
icie
nt R
ate
Cha
nge
2002
-201
1 M
ATH
Prof
icie
nt R
ate
Cha
nge
2011
Gra
duat
ion
Rat
e
2010
Bas
e AP
I
2011
Gro
wth
API
2010
-201
1 AP
I Cha
nge
2002
-201
1 AP
I Cha
nge
2011 Growth
API County Ranking (N=23)
2010-2011 API
Change County Ranking (N=23)
2011 Growth
API State
Ranking (N=929)
2010-2011 API
Change State
Ranking (N=928)
Alvord Unified No No No Yes No 49.6 3.2 28.3 54.7 2.2 27.5 77.72 753 776 23 151 12 3 528 122Banning Unified No No No Yes No 45.6 5.6 31.7 52.6 5.6 36.9 76.97 702 726 24 155 20 2 768 114
Beaumont Unified No No No Yes No 61.4 3.5 34.3 60.8 4.1 30.3 85.24 785 800 15 126 7 9 392 224Coachella Valley Unified No No No Yes No 35.4 2.4 27.6 47.0 1.8 34.0 71.11 685 692 7 185 21 15 850 459Corona-Norco Unified No No No Yes Yes 64.1 2.3 28.1 62.3 2.6 28.0 92.12 802 815 13 130 5 12 323 274Desert Center Unified Yes Yes Yes N/A N/A 41.7 18.6 12.7 33.3 10.2 -8.6 . . . . . . . .Desert Sands Unified No No No Yes Yes 57.6 2.5 32.3 60.7 0.9 30.9 86.88 787 795 8 160 8 13 414 426
Hemet Unified No No No Yes No 49.9 -0.3 21.6 50.5 0.3 21.8 81.17 754 755 1 93 13 21 638 662Jurupa Unified No No No Yes Yes 47.7 2.4 27.2 52.4 2.9 26.9 84.35 743 748 5 135 14 18 671 541
Lake Elsinore Unified Yes Yes Yes Yes Yes 69.8 6.0 41.3 69.7 5.5 41.2 93.67 813 833 20 174 4 5 243 151Menifee Union Elementary No No No Yes N/A 64.2 3.1 27.1 66.7 4.9 22.6 828 843 15 106 2 9 211 224
Moreno Valley Unified No No No Yes Yes 45.9 2.5 23.8 47.2 5.1 21.6 76.03 716 734 18 110 19 7 731 180Murrieta Valley Unified No No No Yes No 69.6 2.4 18.8 67.6 0.1 9.2 88.82 837 843 6 66 2 17 211 502
Nuview Union Yes Yes Yes Yes Yes 55.0 8.9 30.8 61.4 9.0 36.5 100.00 771 809 38 156 6 1 354 44Palm Springs Unified No No No Yes Yes 48.2 3.1 25.9 52.1 0.2 30.9 86.99 733 748 15 141 14 9 671 224Palo Verde Unified No No No Yes No 38.2 4.6 18.7 45.1 5.9 23.8 73.68 674 679 5 73 22 18 866 541Perris Elementary No No No Yes N/A 39.5 -2.7 24.4 53.0 -2.0 30.1 758 741 -17 130 17 23 703 868Perris Union High No No No Yes Yes 49.9 6.1 31.7 42.7 4.7 28.7 84.15 728 746 18 158 16 7 678 180
Riverside COE No No No No Yes 20.3 -0.2 10.2 10.4 -5.1 0.2 82.13 555 549 -6 98 23 22 911 796Riverside Unified No No No Yes Yes 57.0 1.3 26.8 59.3 2.2 25.0 87.85 781 788 7 121 11 15 458 459
Romoland Elementary No No No Yes N/A 53.6 2.7 38.5 63.2 4.9 43.0 775 795 20 200 8 5 414 151San Jacinto Unified No No No Yes Yes 44.8 4.9 28.4 54.1 8.5 37.8 85.14 717 738 21 153 18 4 717 140
Temecula Valley Unified No No No Yes Yes 75.4 0.6 22.7 71.5 -0.5 15.6 95.11 856 859 3 81 1 20 161 599Val Verde Unified No No No Yes No 55.3 4.6 34.3 62.7 0.0 36.4 76.69 781 789 8 161 10 13 451 426
Academic Performance Index (API)Adequate Yearly Progress (AYP)
Page 20 of 52Prepared by Riverside County Office of Education
Assessment and Accountability Services08/30/2011
List of Riverside County Elementary Schools
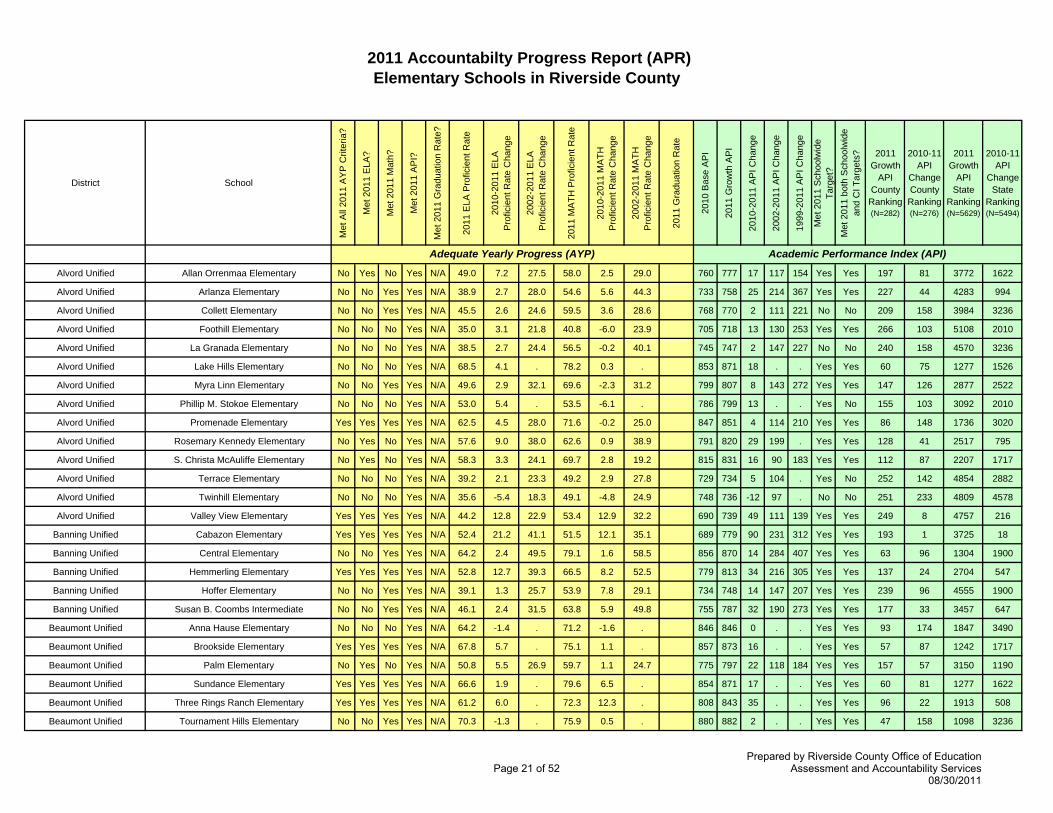
2011 Accountabilty Progress Report (APR)Elementary Schools in Riverside County
District School
Met
All
2011
AY
P C
riter
ia?
Met
201
1 E
LA?
Met
201
1 M
ath?
Met
201
1 A
PI?
Met
201
1 G
radu
atio
n R
ate?
2011
ELA
Pro
ficie
nt R
ate
2010
-201
1 E
LA
P
rofic
ient
Rat
e C
hang
e
2002
-201
1 E
LA
P
rofic
ient
Rat
e C
hang
e
2011
MA
TH P
rofic
ient
Rat
e
2010
-201
1 M
ATH
Pro
ficie
nt R
ate
Cha
nge
2002
-201
1 M
ATH
Pro
ficie
nt R
ate
Cha
nge
2011
Gra
duat
ion
Rat
e
2010
Bas
e A
PI
2011
Gro
wth
AP
I
2010
-201
1 A
PI C
hang
e
2002
-201
1 A
PI C
hang
e
1999
-201
1 A
PI C
hang
e
Met
201
1 S
choo
lwid
e Ta
rget
?M
et 2
011
both
Sch
oolw
ide
and
CI T
arge
ts? 2011
Growth API
County Ranking (N=282)
2010-11 API
Change County Ranking (N=276)
2011 Growth
API State
Ranking (N=5629)
2010-11 API
Change State
Ranking (N=5494)
Alvord Unified Allan Orrenmaa Elementary No Yes No Yes N/A 49.0 7.2 27.5 58.0 2.5 29.0 760 777 17 117 154 Yes Yes 197 81 3772 1622
Alvord Unified Arlanza Elementary No No Yes Yes N/A 38.9 2.7 28.0 54.6 5.6 44.3 733 758 25 214 367 Yes Yes 227 44 4283 994
Alvord Unified Collett Elementary No No Yes Yes N/A 45.5 2.6 24.6 59.5 3.6 28.6 768 770 2 111 221 No No 209 158 3984 3236
Alvord Unified Foothill Elementary No No No Yes N/A 35.0 3.1 21.8 40.8 -6.0 23.9 705 718 13 130 253 Yes Yes 266 103 5108 2010
Alvord Unified La Granada Elementary No No No Yes N/A 38.5 2.7 24.4 56.5 -0.2 40.1 745 747 2 147 227 No No 240 158 4570 3236
Alvord Unified Lake Hills Elementary No No No Yes N/A 68.5 4.1 . 78.2 0.3 . 853 871 18 . . Yes Yes 60 75 1277 1526
Alvord Unified Myra Linn Elementary No No Yes Yes N/A 49.6 2.9 32.1 69.6 -2.3 31.2 799 807 8 143 272 Yes Yes 147 126 2877 2522
Alvord Unified Phillip M. Stokoe Elementary No No No Yes N/A 53.0 5.4 . 53.5 -6.1 . 786 799 13 . . Yes No 155 103 3092 2010
Alvord Unified Promenade Elementary Yes Yes Yes Yes N/A 62.5 4.5 28.0 71.6 -0.2 25.0 847 851 4 114 210 Yes Yes 86 148 1736 3020
Alvord Unified Rosemary Kennedy Elementary No Yes No Yes N/A 57.6 9.0 38.0 62.6 0.9 38.9 791 820 29 199 . Yes Yes 128 41 2517 795
Alvord Unified S. Christa McAuliffe Elementary No Yes No Yes N/A 58.3 3.3 24.1 69.7 2.8 19.2 815 831 16 90 183 Yes Yes 112 87 2207 1717
Alvord Unified Terrace Elementary No No No Yes N/A 39.2 2.1 23.3 49.2 2.9 27.8 729 734 5 104 . Yes No 252 142 4854 2882
Alvord Unified Twinhill Elementary No No No Yes N/A 35.6 -5.4 18.3 49.1 -4.8 24.9 748 736 -12 97 . No No 251 233 4809 4578
Alvord Unified Valley View Elementary Yes Yes Yes Yes N/A 44.2 12.8 22.9 53.4 12.9 32.2 690 739 49 111 139 Yes Yes 249 8 4757 216
Banning Unified Cabazon Elementary Yes Yes Yes Yes N/A 52.4 21.2 41.1 51.5 12.1 35.1 689 779 90 231 312 Yes Yes 193 1 3725 18
Banning Unified Central Elementary No No Yes Yes N/A 64.2 2.4 49.5 79.1 1.6 58.5 856 870 14 284 407 Yes Yes 63 96 1304 1900
Banning Unified Hemmerling Elementary Yes Yes Yes Yes N/A 52.8 12.7 39.3 66.5 8.2 52.5 779 813 34 216 305 Yes Yes 137 24 2704 547
Banning Unified Hoffer Elementary No No Yes Yes N/A 39.1 1.3 25.7 53.9 7.8 29.1 734 748 14 147 207 Yes Yes 239 96 4555 1900
Banning Unified Susan B. Coombs Intermediate No No Yes Yes N/A 46.1 2.4 31.5 63.8 5.9 49.8 755 787 32 190 273 Yes Yes 177 33 3457 647
Beaumont Unified Anna Hause Elementary No No No Yes N/A 64.2 -1.4 . 71.2 -1.6 . 846 846 0 . . Yes Yes 93 174 1847 3490
Beaumont Unified Brookside Elementary Yes Yes Yes Yes N/A 67.8 5.7 . 75.1 1.1 . 857 873 16 . . Yes Yes 57 87 1242 1717
Beaumont Unified Palm Elementary No Yes No Yes N/A 50.8 5.5 26.9 59.7 1.1 24.7 775 797 22 118 184 Yes Yes 157 57 3150 1190
Beaumont Unified Sundance Elementary Yes Yes Yes Yes N/A 66.6 1.9 . 79.6 6.5 . 854 871 17 . . Yes Yes 60 81 1277 1622
Beaumont Unified Three Rings Ranch Elementary Yes Yes Yes Yes N/A 61.2 6.0 . 72.3 12.3 . 808 843 35 . . Yes Yes 96 22 1913 508
Beaumont Unified Tournament Hills Elementary No No Yes Yes N/A 70.3 -1.3 . 75.9 0.5 . 880 882 2 . . Yes Yes 47 158 1098 3236
Academic Performance Index (API)Adequate Yearly Progress (AYP)
Page 21 of 52Prepared by Riverside County Office of Education
Assessment and Accountability Services08/30/2011
2011 Accountabilty Progress Report (APR)Elementary Schools in Riverside County
District School
Met
All
2011
AY
P C
riter
ia?
Met
201
1 E
LA?
Met
201
1 M
ath?
Met
201
1 A
PI?
Met
201
1 G
radu
atio
n R
ate?
2011
ELA
Pro
ficie
nt R
ate
2010
-201
1 E
LA
P
rofic
ient
Rat
e C
hang
e
2002
-201
1 E
LA
P
rofic
ient
Rat
e C
hang
e
2011
MA
TH P
rofic
ient
Rat
e
2010
-201
1 M
ATH
Pro
ficie
nt R
ate
Cha
nge
2002
-201
1 M
ATH
Pro
ficie
nt R
ate
Cha
nge
2011
Gra
duat
ion
Rat
e
2010
Bas
e A
PI
2011
Gro
wth
AP
I
2010
-201
1 A
PI C
hang
e
2002
-201
1 A
PI C
hang
e
1999
-201
1 A
PI C
hang
e
Met
201
1 S
choo
lwid
e Ta
rget
?M
et 2
011
both
Sch
oolw
ide
and
CI T
arge
ts? 2011
Growth API
County Ranking (N=282)
2010-11 API
Change County Ranking (N=276)
2011 Growth
API State
Ranking (N=5629)
2010-11 API
Change State
Ranking (N=5494)
Academic Performance Index (API)Adequate Yearly Progress (AYP)
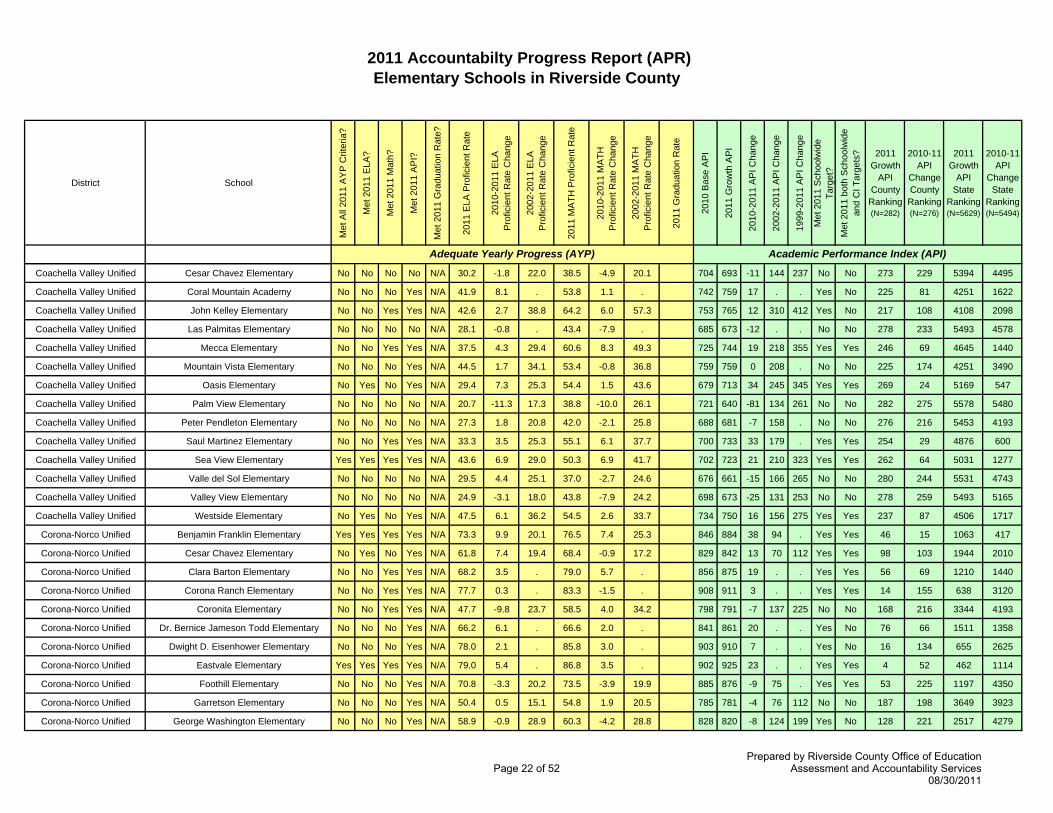
Coachella Valley Unified Cesar Chavez Elementary No No No No N/A 30.2 -1.8 22.0 38.5 -4.9 20.1 704 693 -11 144 237 No No 273 229 5394 4495
Coachella Valley Unified Coral Mountain Academy No No No Yes N/A 41.9 8.1 . 53.8 1.1 . 742 759 17 . . Yes No 225 81 4251 1622
Coachella Valley Unified John Kelley Elementary No No Yes Yes N/A 42.6 2.7 38.8 64.2 6.0 57.3 753 765 12 310 412 Yes No 217 108 4108 2098
Coachella Valley Unified Las Palmitas Elementary No No No No N/A 28.1 -0.8 . 43.4 -7.9 . 685 673 -12 . . No No 278 233 5493 4578
Coachella Valley Unified Mecca Elementary No No Yes Yes N/A 37.5 4.3 29.4 60.6 8.3 49.3 725 744 19 218 355 Yes Yes 246 69 4645 1440
Coachella Valley Unified Mountain Vista Elementary No No No Yes N/A 44.5 1.7 34.1 53.4 -0.8 36.8 759 759 0 208 . No No 225 174 4251 3490
Coachella Valley Unified Oasis Elementary No Yes No Yes N/A 29.4 7.3 25.3 54.4 1.5 43.6 679 713 34 245 345 Yes Yes 269 24 5169 547
Coachella Valley Unified Palm View Elementary No No No No N/A 20.7 -11.3 17.3 38.8 -10.0 26.1 721 640 -81 134 261 No No 282 275 5578 5480
Coachella Valley Unified Peter Pendleton Elementary No No No No N/A 27.3 1.8 20.8 42.0 -2.1 25.8 688 681 -7 158 . No No 276 216 5453 4193
Coachella Valley Unified Saul Martinez Elementary No No Yes Yes N/A 33.3 3.5 25.3 55.1 6.1 37.7 700 733 33 179 . Yes Yes 254 29 4876 600
Coachella Valley Unified Sea View Elementary Yes Yes Yes Yes N/A 43.6 6.9 29.0 50.3 6.9 41.7 702 723 21 210 323 Yes Yes 262 64 5031 1277
Coachella Valley Unified Valle del Sol Elementary No No No No N/A 29.5 4.4 25.1 37.0 -2.7 24.6 676 661 -15 166 265 No No 280 244 5531 4743
Coachella Valley Unified Valley View Elementary No No No No N/A 24.9 -3.1 18.0 43.8 -7.9 24.2 698 673 -25 131 253 No No 278 259 5493 5165
Coachella Valley Unified Westside Elementary No Yes No Yes N/A 47.5 6.1 36.2 54.5 2.6 33.7 734 750 16 156 275 Yes Yes 237 87 4506 1717
Corona-Norco Unified Benjamin Franklin Elementary Yes Yes Yes Yes N/A 73.3 9.9 20.1 76.5 7.4 25.3 846 884 38 94 . Yes Yes 46 15 1063 417
Corona-Norco Unified Cesar Chavez Elementary No Yes No Yes N/A 61.8 7.4 19.4 68.4 -0.9 17.2 829 842 13 70 112 Yes Yes 98 103 1944 2010
Corona-Norco Unified Clara Barton Elementary No No Yes Yes N/A 68.2 3.5 . 79.0 5.7 . 856 875 19 . . Yes Yes 56 69 1210 1440
Corona-Norco Unified Corona Ranch Elementary No No Yes Yes N/A 77.7 0.3 . 83.3 -1.5 . 908 911 3 . . Yes Yes 14 155 638 3120
Corona-Norco Unified Coronita Elementary No No Yes Yes N/A 47.7 -9.8 23.7 58.5 4.0 34.2 798 791 -7 137 225 No No 168 216 3344 4193
Corona-Norco Unified Dr. Bernice Jameson Todd Elementary No No No Yes N/A 66.2 6.1 . 66.6 2.0 . 841 861 20 . . Yes No 76 66 1511 1358
Corona-Norco Unified Dwight D. Eisenhower Elementary No No No Yes N/A 78.0 2.1 . 85.8 3.0 . 903 910 7 . . Yes No 16 134 655 2625
Corona-Norco Unified Eastvale Elementary Yes Yes Yes Yes N/A 79.0 5.4 . 86.8 3.5 . 902 925 23 . . Yes Yes 4 52 462 1114
Corona-Norco Unified Foothill Elementary No No No Yes N/A 70.8 -3.3 20.2 73.5 -3.9 19.9 885 876 -9 75 . Yes Yes 53 225 1197 4350
Corona-Norco Unified Garretson Elementary No No No Yes N/A 50.4 0.5 15.1 54.8 1.9 20.5 785 781 -4 76 112 No No 187 198 3649 3923
Corona-Norco Unified George Washington Elementary No No No Yes N/A 58.9 -0.9 28.9 60.3 -4.2 28.8 828 820 -8 124 199 Yes No 128 221 2517 4279
Page 22 of 52Prepared by Riverside County Office of Education
Assessment and Accountability Services08/30/2011
2011 Accountabilty Progress Report (APR)Elementary Schools in Riverside County
District School
Met
All
2011
AY
P C
riter
ia?
Met
201
1 E
LA?
Met
201
1 M
ath?
Met
201
1 A
PI?
Met
201
1 G
radu
atio
n R
ate?
2011
ELA
Pro
ficie
nt R
ate
2010
-201
1 E
LA
P
rofic
ient
Rat
e C
hang
e
2002
-201
1 E
LA
P
rofic
ient
Rat
e C
hang
e
2011
MA
TH P
rofic
ient
Rat
e
2010
-201
1 M
ATH
Pro
ficie
nt R
ate
Cha
nge
2002
-201
1 M
ATH
Pro
ficie
nt R
ate
Cha
nge
2011
Gra
duat
ion
Rat
e
2010
Bas
e A
PI
2011
Gro
wth
AP
I
2010
-201
1 A
PI C
hang
e
2002
-201
1 A
PI C
hang
e
1999
-201
1 A
PI C
hang
e
Met
201
1 S
choo
lwid
e Ta
rget
?M
et 2
011
both
Sch
oolw
ide
and
CI T
arge
ts? 2011
Growth API
County Ranking (N=282)
2010-11 API
Change County Ranking (N=276)
2011 Growth
API State
Ranking (N=5629)
2010-11 API
Change State
Ranking (N=5494)
Academic Performance Index (API)Adequate Yearly Progress (AYP)
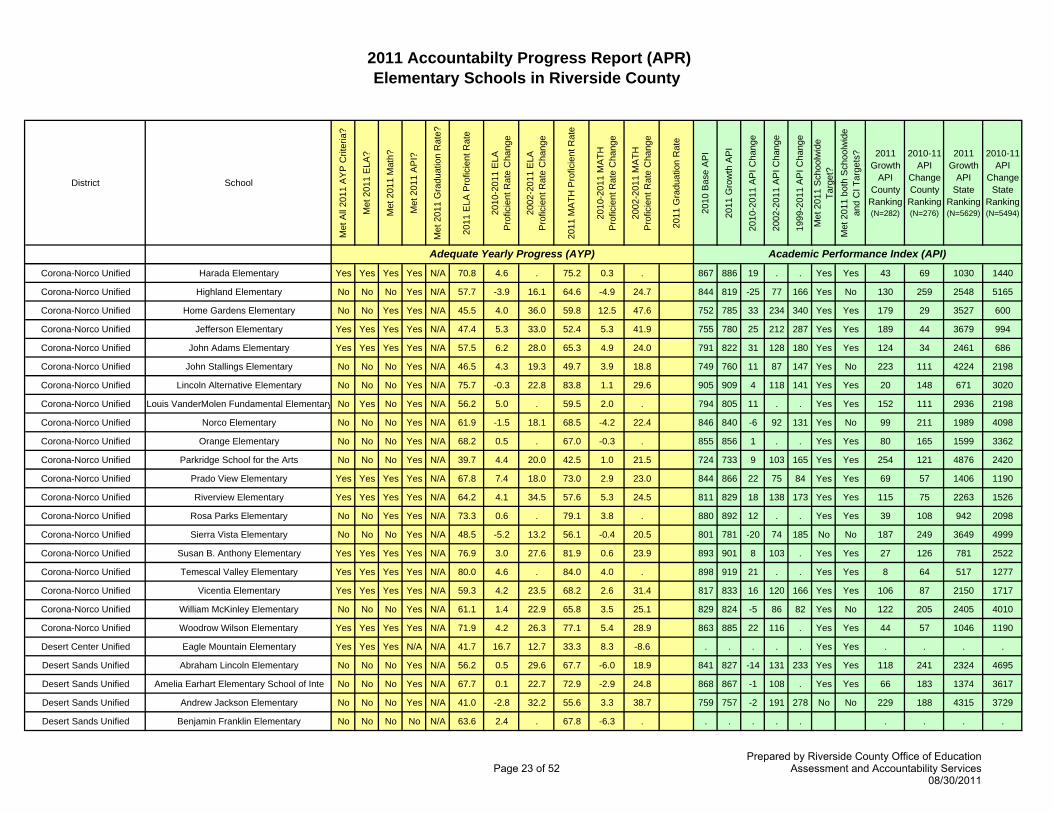
Corona-Norco Unified Harada Elementary Yes Yes Yes Yes N/A 70.8 4.6 . 75.2 0.3 . 867 886 19 . . Yes Yes 43 69 1030 1440
Corona-Norco Unified Highland Elementary No No No Yes N/A 57.7 -3.9 16.1 64.6 -4.9 24.7 844 819 -25 77 166 Yes No 130 259 2548 5165
Corona-Norco Unified Home Gardens Elementary No No Yes Yes N/A 45.5 4.0 36.0 59.8 12.5 47.6 752 785 33 234 340 Yes Yes 179 29 3527 600
Corona-Norco Unified Jefferson Elementary Yes Yes Yes Yes N/A 47.4 5.3 33.0 52.4 5.3 41.9 755 780 25 212 287 Yes Yes 189 44 3679 994
Corona-Norco Unified John Adams Elementary Yes Yes Yes Yes N/A 57.5 6.2 28.0 65.3 4.9 24.0 791 822 31 128 180 Yes Yes 124 34 2461 686
Corona-Norco Unified John Stallings Elementary No No No Yes N/A 46.5 4.3 19.3 49.7 3.9 18.8 749 760 11 87 147 Yes No 223 111 4224 2198
Corona-Norco Unified Lincoln Alternative Elementary No No No Yes N/A 75.7 -0.3 22.8 83.8 1.1 29.6 905 909 4 118 141 Yes Yes 20 148 671 3020
Corona-Norco Unified Louis VanderMolen Fundamental Elementary No Yes No Yes N/A 56.2 5.0 . 59.5 2.0 . 794 805 11 . . Yes Yes 152 111 2936 2198
Corona-Norco Unified Norco Elementary No No No Yes N/A 61.9 -1.5 18.1 68.5 -4.2 22.4 846 840 -6 92 131 Yes No 99 211 1989 4098
Corona-Norco Unified Orange Elementary No No No Yes N/A 68.2 0.5 . 67.0 -0.3 . 855 856 1 . . Yes Yes 80 165 1599 3362
Corona-Norco Unified Parkridge School for the Arts No No No Yes N/A 39.7 4.4 20.0 42.5 1.0 21.5 724 733 9 103 165 Yes Yes 254 121 4876 2420
Corona-Norco Unified Prado View Elementary Yes Yes Yes Yes N/A 67.8 7.4 18.0 73.0 2.9 23.0 844 866 22 75 84 Yes Yes 69 57 1406 1190
Corona-Norco Unified Riverview Elementary Yes Yes Yes Yes N/A 64.2 4.1 34.5 57.6 5.3 24.5 811 829 18 138 173 Yes Yes 115 75 2263 1526
Corona-Norco Unified Rosa Parks Elementary No No Yes Yes N/A 73.3 0.6 . 79.1 3.8 . 880 892 12 . . Yes Yes 39 108 942 2098
Corona-Norco Unified Sierra Vista Elementary No No No Yes N/A 48.5 -5.2 13.2 56.1 -0.4 20.5 801 781 -20 74 185 No No 187 249 3649 4999
Corona-Norco Unified Susan B. Anthony Elementary Yes Yes Yes Yes N/A 76.9 3.0 27.6 81.9 0.6 23.9 893 901 8 103 . Yes Yes 27 126 781 2522
Corona-Norco Unified Temescal Valley Elementary Yes Yes Yes Yes N/A 80.0 4.6 . 84.0 4.0 . 898 919 21 . . Yes Yes 8 64 517 1277
Corona-Norco Unified Vicentia Elementary Yes Yes Yes Yes N/A 59.3 4.2 23.5 68.2 2.6 31.4 817 833 16 120 166 Yes Yes 106 87 2150 1717
Corona-Norco Unified William McKinley Elementary No No No Yes N/A 61.1 1.4 22.9 65.8 3.5 25.1 829 824 -5 86 82 Yes No 122 205 2405 4010
Corona-Norco Unified Woodrow Wilson Elementary Yes Yes Yes Yes N/A 71.9 4.2 26.3 77.1 5.4 28.9 863 885 22 116 . Yes Yes 44 57 1046 1190
Desert Center Unified Eagle Mountain Elementary Yes Yes Yes N/A N/A 41.7 16.7 12.7 33.3 8.3 -8.6 . . . . . Yes Yes . . . .
Desert Sands Unified Abraham Lincoln Elementary No No No Yes N/A 56.2 0.5 29.6 67.7 -6.0 18.9 841 827 -14 131 233 Yes Yes 118 241 2324 4695
Desert Sands Unified Amelia Earhart Elementary School of Inte No No No Yes N/A 67.7 0.1 22.7 72.9 -2.9 24.8 868 867 -1 108 . Yes Yes 66 183 1374 3617
Desert Sands Unified Andrew Jackson Elementary No No No Yes N/A 41.0 -2.8 32.2 55.6 3.3 38.7 759 757 -2 191 278 No No 229 188 4315 3729
Desert Sands Unified Benjamin Franklin Elementary No No No No N/A 63.6 2.4 . 67.8 -6.3 . . . . . . . . . .
Page 23 of 52Prepared by Riverside County Office of Education
Assessment and Accountability Services08/30/2011
2011 Accountabilty Progress Report (APR)Elementary Schools in Riverside County
District School
Met
All
2011
AY
P C
riter
ia?
Met
201
1 E
LA?
Met
201
1 M
ath?
Met
201
1 A
PI?
Met
201
1 G
radu
atio
n R
ate?
2011
ELA
Pro
ficie
nt R
ate
2010
-201
1 E
LA
P
rofic
ient
Rat
e C
hang
e
2002
-201
1 E
LA
P
rofic
ient
Rat
e C
hang
e
2011
MA
TH P
rofic
ient
Rat
e
2010
-201
1 M
ATH
Pro
ficie
nt R
ate
Cha
nge
2002
-201
1 M
ATH
Pro
ficie
nt R
ate
Cha
nge
2011
Gra
duat
ion
Rat
e
2010
Bas
e A
PI
2011
Gro
wth
AP
I
2010
-201
1 A
PI C
hang
e
2002
-201
1 A
PI C
hang
e
1999
-201
1 A
PI C
hang
e
Met
201
1 S
choo
lwid
e Ta
rget
?M
et 2
011
both
Sch
oolw
ide
and
CI T
arge
ts? 2011
Growth API
County Ranking (N=282)
2010-11 API
Change County Ranking (N=276)
2011 Growth
API State
Ranking (N=5629)
2010-11 API
Change State
Ranking (N=5494)
Academic Performance Index (API)Adequate Yearly Progress (AYP)
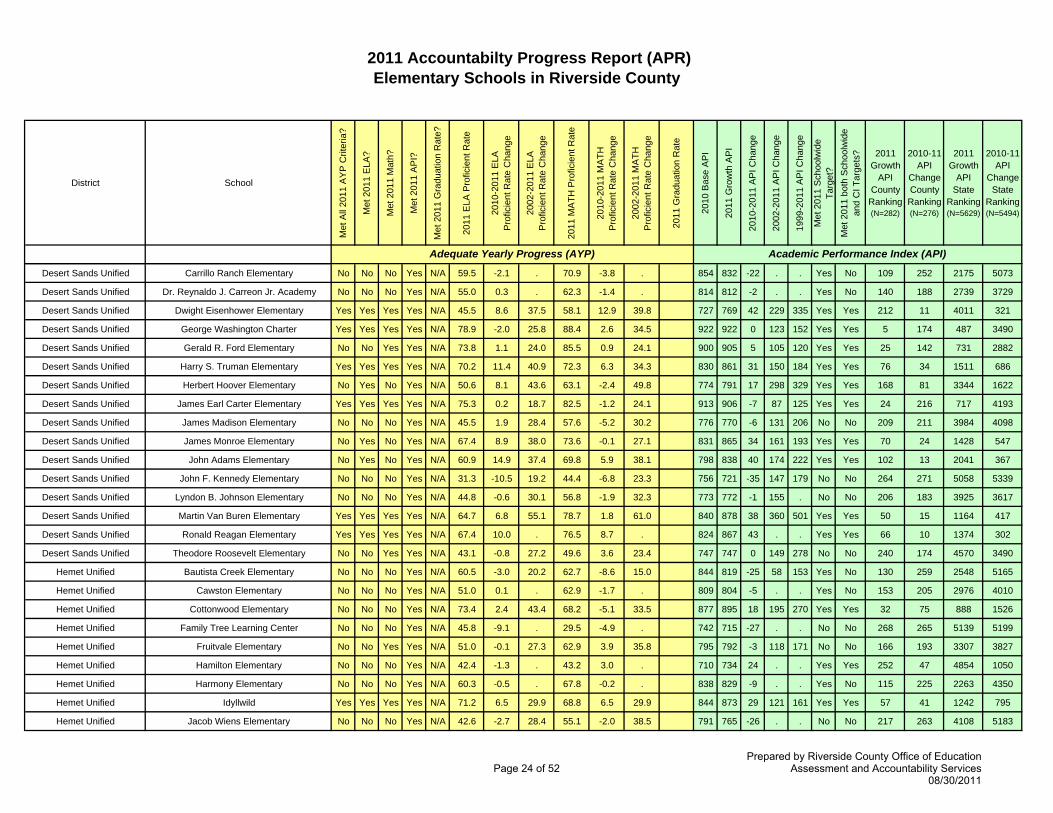
Desert Sands Unified Carrillo Ranch Elementary No No No Yes N/A 59.5 -2.1 . 70.9 -3.8 . 854 832 -22 . . Yes No 109 252 2175 5073
Desert Sands Unified Dr. Reynaldo J. Carreon Jr. Academy No No No Yes N/A 55.0 0.3 . 62.3 -1.4 . 814 812 -2 . . Yes No 140 188 2739 3729
Desert Sands Unified Dwight Eisenhower Elementary Yes Yes Yes Yes N/A 45.5 8.6 37.5 58.1 12.9 39.8 727 769 42 229 335 Yes Yes 212 11 4011 321
Desert Sands Unified George Washington Charter Yes Yes Yes Yes N/A 78.9 -2.0 25.8 88.4 2.6 34.5 922 922 0 123 152 Yes Yes 5 174 487 3490
Desert Sands Unified Gerald R. Ford Elementary No No Yes Yes N/A 73.8 1.1 24.0 85.5 0.9 24.1 900 905 5 105 120 Yes Yes 25 142 731 2882
Desert Sands Unified Harry S. Truman Elementary Yes Yes Yes Yes N/A 70.2 11.4 40.9 72.3 6.3 34.3 830 861 31 150 184 Yes Yes 76 34 1511 686
Desert Sands Unified Herbert Hoover Elementary No Yes No Yes N/A 50.6 8.1 43.6 63.1 -2.4 49.8 774 791 17 298 329 Yes Yes 168 81 3344 1622
Desert Sands Unified James Earl Carter Elementary Yes Yes Yes Yes N/A 75.3 0.2 18.7 82.5 -1.2 24.1 913 906 -7 87 125 Yes Yes 24 216 717 4193
Desert Sands Unified James Madison Elementary No No No Yes N/A 45.5 1.9 28.4 57.6 -5.2 30.2 776 770 -6 131 206 No No 209 211 3984 4098
Desert Sands Unified James Monroe Elementary No Yes No Yes N/A 67.4 8.9 38.0 73.6 -0.1 27.1 831 865 34 161 193 Yes Yes 70 24 1428 547
Desert Sands Unified John Adams Elementary No Yes No Yes N/A 60.9 14.9 37.4 69.8 5.9 38.1 798 838 40 174 222 Yes Yes 102 13 2041 367
Desert Sands Unified John F. Kennedy Elementary No No No Yes N/A 31.3 -10.5 19.2 44.4 -6.8 23.3 756 721 -35 147 179 No No 264 271 5058 5339
Desert Sands Unified Lyndon B. Johnson Elementary No No No Yes N/A 44.8 -0.6 30.1 56.8 -1.9 32.3 773 772 -1 155 . No No 206 183 3925 3617
Desert Sands Unified Martin Van Buren Elementary Yes Yes Yes Yes N/A 64.7 6.8 55.1 78.7 1.8 61.0 840 878 38 360 501 Yes Yes 50 15 1164 417
Desert Sands Unified Ronald Reagan Elementary Yes Yes Yes Yes N/A 67.4 10.0 . 76.5 8.7 . 824 867 43 . . Yes Yes 66 10 1374 302
Desert Sands Unified Theodore Roosevelt Elementary No No Yes Yes N/A 43.1 -0.8 27.2 49.6 3.6 23.4 747 747 0 149 278 No No 240 174 4570 3490
Hemet Unified Bautista Creek Elementary No No No Yes N/A 60.5 -3.0 20.2 62.7 -8.6 15.0 844 819 -25 58 153 Yes No 130 259 2548 5165
Hemet Unified Cawston Elementary No No No Yes N/A 51.0 0.1 . 62.9 -1.7 . 809 804 -5 . . Yes No 153 205 2976 4010
Hemet Unified Cottonwood Elementary No No No Yes N/A 73.4 2.4 43.4 68.2 -5.1 33.5 877 895 18 195 270 Yes Yes 32 75 888 1526
Hemet Unified Family Tree Learning Center No No No Yes N/A 45.8 -9.1 . 29.5 -4.9 . 742 715 -27 . . No No 268 265 5139 5199
Hemet Unified Fruitvale Elementary No No Yes Yes N/A 51.0 -0.1 27.3 62.9 3.9 35.8 795 792 -3 118 171 No No 166 193 3307 3827
Hemet Unified Hamilton Elementary No No No Yes N/A 42.4 -1.3 . 43.2 3.0 . 710 734 24 . . Yes Yes 252 47 4854 1050
Hemet Unified Harmony Elementary No No No Yes N/A 60.3 -0.5 . 67.8 -0.2 . 838 829 -9 . . Yes No 115 225 2263 4350
Hemet Unified Idyllwild Yes Yes Yes Yes N/A 71.2 6.5 29.9 68.8 6.5 29.9 844 873 29 121 161 Yes Yes 57 41 1242 795
Hemet Unified Jacob Wiens Elementary No No No Yes N/A 42.6 -2.7 28.4 55.1 -2.0 38.5 791 765 -26 . . No No 217 263 4108 5183
Page 24 of 52Prepared by Riverside County Office of Education
Assessment and Accountability Services08/30/2011

2011 Accountabilty Progress Report (APR)Elementary Schools in Riverside County
District School
Met
All
2011
AY
P C
riter
ia?
Met
201
1 E
LA?
Met
201
1 M
ath?
Met
201
1 A
PI?
Met
201
1 G
radu
atio
n R
ate?
2011
ELA
Pro
ficie
nt R
ate
2010
-201
1 E
LA
P
rofic
ient
Rat
e C
hang
e
2002
-201
1 E
LA
P
rofic
ient
Rat
e C
hang
e
2011
MA
TH P
rofic
ient
Rat
e
2010
-201
1 M
ATH
Pro
ficie
nt R
ate
Cha
nge
2002
-201
1 M
ATH
Pro
ficie
nt R
ate
Cha
nge
2011
Gra
duat
ion
Rat
e
2010
Bas
e A
PI
2011
Gro
wth
AP
I
2010
-201
1 A
PI C
hang
e
2002
-201
1 A
PI C
hang
e
1999
-201
1 A
PI C
hang
e
Met
201
1 S
choo
lwid
e Ta
rget
?M
et 2
011
both
Sch
oolw
ide
and
CI T
arge
ts? 2011
Growth API
County Ranking (N=282)
2010-11 API
Change County Ranking (N=276)
2011 Growth
API State
Ranking (N=5629)
2010-11 API
Change State
Ranking (N=5494)
Academic Performance Index (API)Adequate Yearly Progress (AYP)
Hemet Unified Little Lake Elementary Yes Yes Yes Yes N/A 63.6 4.1 24.5 70.8 4.3 24.7 824 833 9 91 135 Yes Yes 106 121 2150 2420
Hemet Unified McSweeny Elementary No No No Yes N/A 42.9 -4.3 . 54.6 -1.7 . 782 782 0 . . No No 185 174 3621 3490
Hemet Unified Ramona Elementary No No No Yes N/A 44.5 2.6 17.8 50.5 -2.3 22.5 747 758 11 94 143 Yes No 227 111 4283 2198
Hemet Unified Valle Vista Elementary No No No Yes N/A 47.8 -3.0 6.2 60.0 -1.1 11.2 789 780 -9 28 97 No No 189 225 3679 4350
Hemet Unified Whittier Elementary No No No Yes N/A 41.7 -4.1 18.8 46.2 -5.3 15.8 771 747 -24 76 193 No No 240 257 4570 5142
Hemet Unified Winchester Elementary No No No Yes N/A 45.7 -2.1 18.5 48.2 -1.8 13.5 761 757 -4 58 163 No No 229 198 4315 3923
Jurupa Unified Camino Real Elementary No No Yes Yes N/A 63.9 2.6 24.7 72.7 6.3 26.7 835 849 14 97 124 Yes No 87 96 1782 1900
Jurupa Unified Glen Avon Elementary No No Yes Yes N/A 45.8 3.0 28.8 61.3 4.6 37.5 775 773 -2 151 198 No No 203 188 3897 3729
Jurupa Unified Granite Hill Elementary No No Yes Yes N/A 51.3 0.8 31.0 64.3 6.1 29.4 785 797 12 . 288 Yes Yes 157 108 3150 2098
Jurupa Unified Ina Arbuckle Elementary No No Yes Yes N/A 36.3 -3.0 27.2 60.0 2.4 43.2 765 755 -10 206 336 No No 232 228 4373 4424
Jurupa Unified Indian Hills Elementary No No No Yes N/A 48.8 -7.0 17.1 60.4 -2.9 17.9 812 788 -24 65 133 No No 173 257 3428 5142
Jurupa Unified Mission Bell Elementary No No No Yes N/A 50.7 -4.0 30.0 64.2 1.2 31.7 808 809 1 145 231 Yes No 145 165 2813 3362
Jurupa Unified Pacific Avenue Elementary No No No Yes N/A 46.5 -3.3 33.5 64.8 1.7 37.4 798 792 -6 185 327 No No 166 211 3307 4098
Jurupa Unified Pedley Elementary Yes Yes Yes Yes N/A 50.3 5.2 34.1 55.8 3.9 34.9 759 774 15 149 304 Yes Yes 202 93 3860 1814
Jurupa Unified Peralta Elementary No No No Yes N/A 46.5 2.1 13.9 55.5 2.0 12.5 759 768 9 60 139 Yes Yes 214 121 4036 2420
Jurupa Unified Rustic Lane Elementary No No Yes Yes N/A 40.1 3.6 26.8 54.0 4.5 29.9 729 749 20 158 269 Yes Yes 238 66 4524 1358
Jurupa Unified Sky Country Elementary No No No Yes N/A 58.3 0.7 22.5 70.4 -1.0 31.2 835 831 -4 109 188 Yes No 112 198 2207 3923
Jurupa Unified Stone Avenue Elementary No No Yes Yes N/A 49.6 4.3 21.3 69.2 6.4 28.3 790 813 23 103 156 Yes Yes 137 52 2704 1114
Jurupa Unified Sunnyslope Elementary No No Yes Yes N/A 42.1 -1.2 18.0 59.3 5.6 23.3 774 766 -8 85 195 No No 216 221 4089 4279
Jurupa Unified Troth Street Elementary No No Yes Yes N/A 40.4 -1.0 27.3 64.8 13.4 40.4 750 773 23 165 277 Yes Yes 203 52 3897 1114
Jurupa Unified Van Buren Elementary No No No No N/A 45.6 1.1 26.6 50.7 0.9 21.5 . . . . . . . . .
Jurupa Unified West Riverside Elementary Yes Yes Yes Yes N/A 49.0 4.7 36.0 63.2 3.2 41.1 779 797 18 192 288 Yes Yes 157 75 3150 1526
Lake Elsinore Unified Cottonwood Canyon Elementary Yes Yes Yes Yes N/A 81.5 7.4 . 83.8 4.3 . 894 918 24 . . Yes Yes 10 47 532 1050
Lake Elsinore Unified Donald Graham Elementary No No Yes Yes N/A 71.1 4.9 38.2 83.7 6.0 48.5 879 894 15 175 217 Yes Yes 34 93 910 1814
Lake Elsinore Unified Earl Warren Elementary Yes Yes Yes Yes N/A 82.0 2.6 . 91.7 3.7 . 918 932 14 . . Yes Yes 3 96 373 1900
Page 25 of 52Prepared by Riverside County Office of Education
Assessment and Accountability Services08/30/2011

2011 Accountabilty Progress Report (APR)Elementary Schools in Riverside County
District School
Met
All
2011
AY
P C
riter
ia?
Met
201
1 E
LA?
Met
201
1 M
ath?
Met
201
1 A
PI?
Met
201
1 G
radu
atio
n R
ate?
2011
ELA
Pro
ficie
nt R
ate
2010
-201
1 E
LA
P
rofic
ient
Rat
e C
hang
e
2002
-201
1 E
LA
P
rofic
ient
Rat
e C
hang
e
2011
MA
TH P
rofic
ient
Rat
e
2010
-201
1 M
ATH
Pro
ficie
nt R
ate
Cha
nge
2002
-201
1 M
ATH
Pro
ficie
nt R
ate
Cha
nge
2011
Gra
duat
ion
Rat
e
2010
Bas
e A
PI
2011
Gro
wth
AP
I
2010
-201
1 A
PI C
hang
e
2002
-201
1 A
PI C
hang
e
1999
-201
1 A
PI C
hang
e
Met
201
1 S
choo
lwid
e Ta
rget
?M
et 2
011
both
Sch
oolw
ide
and
CI T
arge
ts? 2011
Growth API
County Ranking (N=282)
2010-11 API
Change County Ranking (N=276)
2011 Growth
API State
Ranking (N=5629)
2010-11 API
Change State
Ranking (N=5494)
Academic Performance Index (API)Adequate Yearly Progress (AYP)
Lake Elsinore Unified Elsinore Elementary Yes Yes Yes Yes N/A 71.6 19.0 57.5 71.6 3.2 54.0 833 870 37 269 368 Yes Yes 63 18 1304 459
Lake Elsinore Unified Lakeland Village No No No Yes N/A 61.3 . . 55.5 . . . 825 . . . N/A 120 . 2377 .
Lake Elsinore Unified Luiseno Yes Yes Yes Yes N/A 83.4 5.6 42.4 82.4 4.9 44.0 900 919 19 174 269 Yes Yes 8 69 517 1440
Lake Elsinore Unified Machado Elementary Yes Yes Yes Yes N/A 63.1 5.5 46.5 71.7 16.5 56.2 816 847 31 262 343 Yes Yes 90 34 1819 686
Lake Elsinore Unified Railroad Canyon Elementary No No Yes Yes N/A 63.1 0.8 31.9 82.0 6.3 43.0 864 877 13 . 218 Yes Yes 52 103 1176 2010
Lake Elsinore Unified Rice Canyon Elementary Yes Yes Yes Yes N/A 83.3 12.1 39.3 86.3 10.7 35.1 884 920 36 146 . Yes Yes 7 20 503 486
Lake Elsinore Unified Ronald Reagan Elementary Yes Yes Yes Yes N/A 77.3 2.1 . 85.2 8.9 . 885 901 16 . . Yes Yes 27 87 781 1717
Lake Elsinore Unified Sycamore Academy of Science and Cultural No Yes No Yes N/A 57.4 1.5 . 42.5 -10.6 . 804 784 -20 . . No No 182 249 3555 4999
Lake Elsinore Unified Tuscany Hills Elementary Yes Yes Yes Yes N/A 94.2 3.7 54.3 92.0 1.5 44.9 948 959 11 193 207 Yes Yes 1 111 113 2198
Lake Elsinore Unified Wildomar Elementary Yes Yes Yes Yes N/A 76.5 12.7 39.4 88.1 8.1 45.7 862 910 48 160 220 Yes Yes 16 9 655 233
Lake Elsinore Unified William Collier Elementary Yes Yes Yes Yes N/A 74.5 11.1 48.0 81.0 11.3 53.3 860 882 22 195 196 Yes Yes 47 57 1098 1190
Lake Elsinore Unified Withrow Elementary Yes Yes Yes Yes N/A 77.1 0.9 39.2 89.2 8.2 45.4 899 907 8 155 130 Yes Yes 22 126 701 2522
Menifee Union Elementary Callie Kirkpatrick Elementary Yes Yes Yes Yes N/A 64.9 4.0 20.6 77.5 5.0 21.4 847 864 17 66 91 Yes Yes 72 81 1446 1622
Menifee Union Elementary Chester W. Morrison Elementary No No No Yes N/A 58.8 1.2 17.3 69.7 2.5 18.3 823 825 2 55 87 Yes No 120 158 2377 3236
Menifee Union Elementary Evans Ranch Elementary Yes Yes Yes Yes N/A 72.1 3.8 . 83.1 1.4 . 880 895 15 . . Yes Yes 32 93 888 1814
Menifee Union Elementary Freedom Crest Elementary No No Yes Yes N/A 59.9 2.3 . 75.2 7.1 . 825 848 23 . . Yes Yes 88 52 1800 1114
Menifee Union Elementary Oak Meadows Elementary No No Yes Yes N/A 71.9 1.6 . 84.4 2.1 . 880 889 9 . . Yes Yes 42 121 978 2420
Menifee Union Elementary Quail Valley Elementary No Yes No Yes N/A 62.1 5.1 . 66.5 -0.3 . 832 833 1 . . Yes No 106 165 2150 3362
Menifee Union Elementary Ridgemoor Elementary No No Yes Yes N/A 69.8 1.0 32.7 81.7 2.4 28.3 878 876 -2 117 164 Yes Yes 53 188 1197 3729
Menifee Union Elementary Santa Rosa Academy Yes Yes Yes Yes N/A 64.7 1.3 . 54.9 8.5 . 775 806 31 . . Yes Yes 148 34 2909 686
Menifee Union Elementary Southshore Elementary No No Yes Yes N/A 59.5 -1.2 . 76.4 1.6 . 851 846 -5 . . Yes Yes 93 205 1847 4010
Moreno Valley Unified Armada Elementary No No No Yes N/A 32.7 4.3 15.5 38.0 1.7 11.0 678 692 14 60 183 Yes Yes 275 96 5404 1900
Moreno Valley Unified Bear Valley Elementary No No No Yes N/A 48.7 3.1 30.8 58.3 7.8 27.7 768 791 23 124 272 Yes No 168 52 3344 1114
Moreno Valley Unified Box Springs Elementary No No No Yes N/A 42.8 -5.4 11.9 52.5 -1.8 11.8 774 751 -23 27 118 No No 234 254 4475 5111
Moreno Valley Unified Butterfield Elementary No No No Yes N/A 36.2 -0.7 19.0 35.3 -3.0 13.7 715 712 -3 87 189 No No 270 193 5180 3827
Page 26 of 52Prepared by Riverside County Office of Education
Assessment and Accountability Services08/30/2011
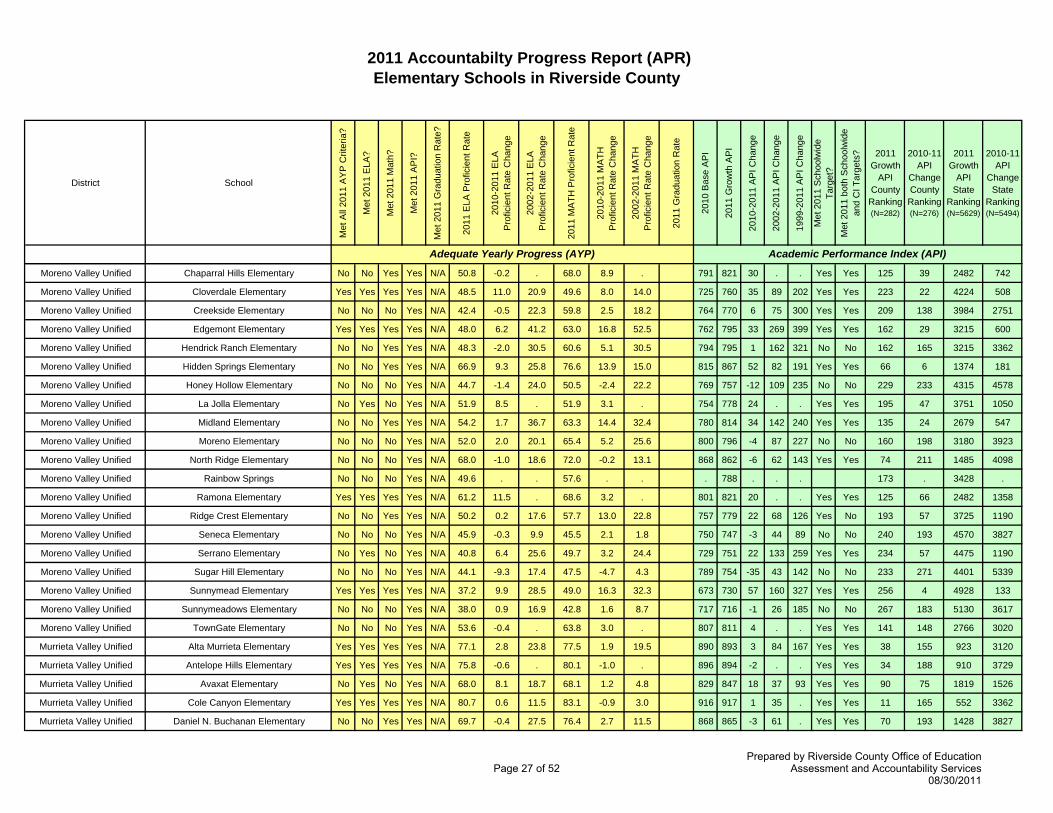
2011 Accountabilty Progress Report (APR)Elementary Schools in Riverside County
District School
Met
All
2011
AY
P C
riter
ia?
Met
201
1 E
LA?
Met
201
1 M
ath?
Met
201
1 A
PI?
Met
201
1 G
radu
atio
n R
ate?
2011
ELA
Pro
ficie
nt R
ate
2010
-201
1 E
LA
P
rofic
ient
Rat
e C
hang
e
2002
-201
1 E
LA
P
rofic
ient
Rat
e C
hang
e
2011
MA
TH P
rofic
ient
Rat
e
2010
-201
1 M
ATH
Pro
ficie
nt R
ate
Cha
nge
2002
-201
1 M
ATH
Pro
ficie
nt R
ate
Cha
nge
2011
Gra
duat
ion
Rat
e
2010
Bas
e A
PI
2011
Gro
wth
AP
I
2010
-201
1 A
PI C
hang
e
2002
-201
1 A
PI C
hang
e
1999
-201
1 A
PI C
hang
e
Met
201
1 S
choo
lwid
e Ta
rget
?M
et 2
011
both
Sch
oolw
ide
and
CI T
arge
ts? 2011
Growth API
County Ranking (N=282)
2010-11 API
Change County Ranking (N=276)
2011 Growth
API State
Ranking (N=5629)
2010-11 API
Change State
Ranking (N=5494)
Academic Performance Index (API)Adequate Yearly Progress (AYP)
Moreno Valley Unified Chaparral Hills Elementary No No Yes Yes N/A 50.8 -0.2 . 68.0 8.9 . 791 821 30 . . Yes Yes 125 39 2482 742
Moreno Valley Unified Cloverdale Elementary Yes Yes Yes Yes N/A 48.5 11.0 20.9 49.6 8.0 14.0 725 760 35 89 202 Yes Yes 223 22 4224 508
Moreno Valley Unified Creekside Elementary No No No Yes N/A 42.4 -0.5 22.3 59.8 2.5 18.2 764 770 6 75 300 Yes Yes 209 138 3984 2751
Moreno Valley Unified Edgemont Elementary Yes Yes Yes Yes N/A 48.0 6.2 41.2 63.0 16.8 52.5 762 795 33 269 399 Yes Yes 162 29 3215 600
Moreno Valley Unified Hendrick Ranch Elementary No No Yes Yes N/A 48.3 -2.0 30.5 60.6 5.1 30.5 794 795 1 162 321 No No 162 165 3215 3362
Moreno Valley Unified Hidden Springs Elementary No No Yes Yes N/A 66.9 9.3 25.8 76.6 13.9 15.0 815 867 52 82 191 Yes Yes 66 6 1374 181
Moreno Valley Unified Honey Hollow Elementary No No No Yes N/A 44.7 -1.4 24.0 50.5 -2.4 22.2 769 757 -12 109 235 No No 229 233 4315 4578
Moreno Valley Unified La Jolla Elementary No Yes No Yes N/A 51.9 8.5 . 51.9 3.1 . 754 778 24 . . Yes Yes 195 47 3751 1050
Moreno Valley Unified Midland Elementary No No Yes Yes N/A 54.2 1.7 36.7 63.3 14.4 32.4 780 814 34 142 240 Yes Yes 135 24 2679 547
Moreno Valley Unified Moreno Elementary No No No Yes N/A 52.0 2.0 20.1 65.4 5.2 25.6 800 796 -4 87 227 No No 160 198 3180 3923
Moreno Valley Unified North Ridge Elementary No No No Yes N/A 68.0 -1.0 18.6 72.0 -0.2 13.1 868 862 -6 62 143 Yes Yes 74 211 1485 4098
Moreno Valley Unified Rainbow Springs No No No Yes N/A 49.6 . . 57.6 . . . 788 . . . 173 . 3428 .
Moreno Valley Unified Ramona Elementary Yes Yes Yes Yes N/A 61.2 11.5 . 68.6 3.2 . 801 821 20 . . Yes Yes 125 66 2482 1358
Moreno Valley Unified Ridge Crest Elementary No No Yes Yes N/A 50.2 0.2 17.6 57.7 13.0 22.8 757 779 22 68 126 Yes No 193 57 3725 1190
Moreno Valley Unified Seneca Elementary No No No Yes N/A 45.9 -0.3 9.9 45.5 2.1 1.8 750 747 -3 44 89 No No 240 193 4570 3827
Moreno Valley Unified Serrano Elementary No Yes No Yes N/A 40.8 6.4 25.6 49.7 3.2 24.4 729 751 22 133 259 Yes Yes 234 57 4475 1190
Moreno Valley Unified Sugar Hill Elementary No No No Yes N/A 44.1 -9.3 17.4 47.5 -4.7 4.3 789 754 -35 43 142 No No 233 271 4401 5339
Moreno Valley Unified Sunnymead Elementary Yes Yes Yes Yes N/A 37.2 9.9 28.5 49.0 16.3 32.3 673 730 57 160 327 Yes Yes 256 4 4928 133
Moreno Valley Unified Sunnymeadows Elementary No No No Yes N/A 38.0 0.9 16.9 42.8 1.6 8.7 717 716 -1 26 185 No No 267 183 5130 3617
Moreno Valley Unified TownGate Elementary No No No Yes N/A 53.6 -0.4 . 63.8 3.0 . 807 811 4 . . Yes Yes 141 148 2766 3020
Murrieta Valley Unified Alta Murrieta Elementary Yes Yes Yes Yes N/A 77.1 2.8 23.8 77.5 1.9 19.5 890 893 3 84 167 Yes Yes 38 155 923 3120
Murrieta Valley Unified Antelope Hills Elementary Yes Yes Yes Yes N/A 75.8 -0.6 . 80.1 -1.0 . 896 894 -2 . . Yes Yes 34 188 910 3729
Murrieta Valley Unified Avaxat Elementary No Yes No Yes N/A 68.0 8.1 18.7 68.1 1.2 4.8 829 847 18 37 93 Yes Yes 90 75 1819 1526
Murrieta Valley Unified Cole Canyon Elementary Yes Yes Yes Yes N/A 80.7 0.6 11.5 83.1 -0.9 3.0 916 917 1 35 . Yes Yes 11 165 552 3362
Murrieta Valley Unified Daniel N. Buchanan Elementary No No Yes Yes N/A 69.7 -0.4 27.5 76.4 2.7 11.5 868 865 -3 61 . Yes Yes 70 193 1428 3827
Page 27 of 52Prepared by Riverside County Office of Education
Assessment and Accountability Services08/30/2011
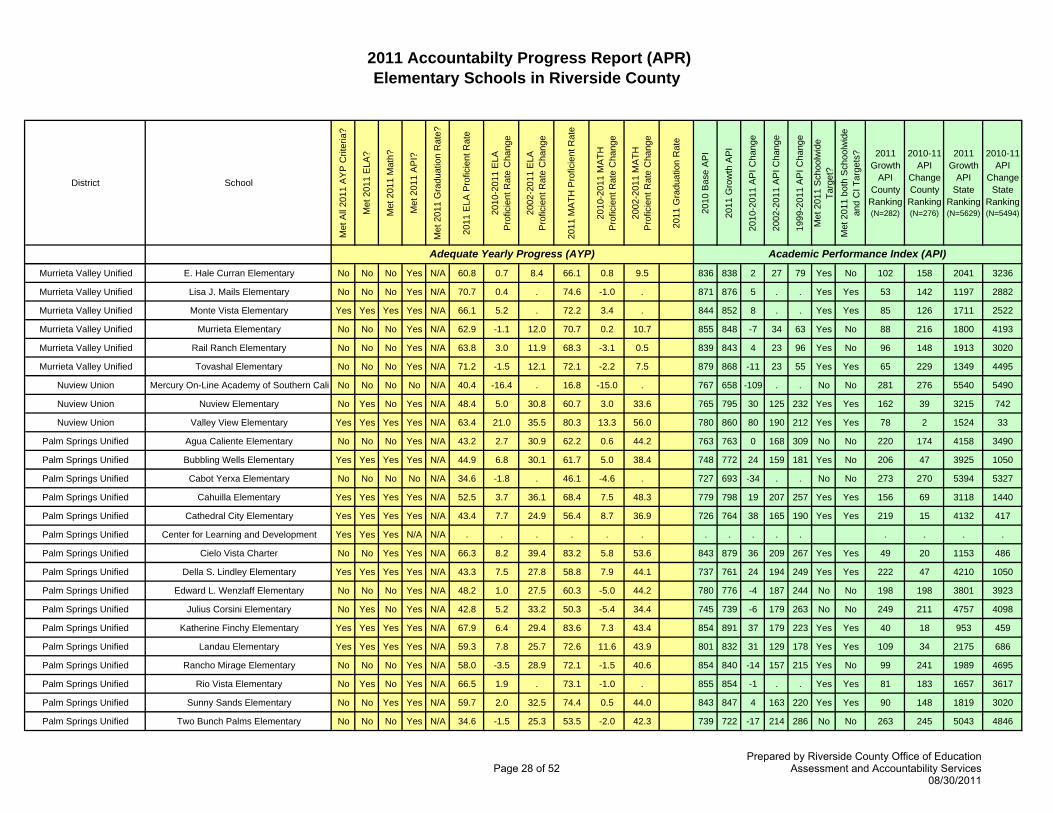
2011 Accountabilty Progress Report (APR)Elementary Schools in Riverside County
District School
Met
All
2011
AY
P C
riter
ia?
Met
201
1 E
LA?
Met
201
1 M
ath?
Met
201
1 A
PI?
Met
201
1 G
radu
atio
n R
ate?
2011
ELA
Pro
ficie
nt R
ate
2010
-201
1 E
LA
P
rofic
ient
Rat
e C
hang
e
2002
-201
1 E
LA
P
rofic
ient
Rat
e C
hang
e
2011
MA
TH P
rofic
ient
Rat
e
2010
-201
1 M
ATH
Pro
ficie
nt R
ate
Cha
nge
2002
-201
1 M
ATH
Pro
ficie
nt R
ate
Cha
nge
2011
Gra
duat
ion
Rat
e
2010
Bas
e A
PI
2011
Gro
wth
AP
I
2010
-201
1 A
PI C
hang
e
2002
-201
1 A
PI C
hang
e
1999
-201
1 A
PI C
hang
e
Met
201
1 S
choo
lwid
e Ta
rget
?M
et 2
011
both
Sch
oolw
ide
and
CI T
arge
ts? 2011
Growth API
County Ranking (N=282)
2010-11 API
Change County Ranking (N=276)
2011 Growth
API State
Ranking (N=5629)
2010-11 API
Change State
Ranking (N=5494)
Academic Performance Index (API)Adequate Yearly Progress (AYP)
Murrieta Valley Unified E. Hale Curran Elementary No No No Yes N/A 60.8 0.7 8.4 66.1 0.8 9.5 836 838 2 27 79 Yes No 102 158 2041 3236
Murrieta Valley Unified Lisa J. Mails Elementary No No No Yes N/A 70.7 0.4 . 74.6 -1.0 . 871 876 5 . . Yes Yes 53 142 1197 2882
Murrieta Valley Unified Monte Vista Elementary Yes Yes Yes Yes N/A 66.1 5.2 . 72.2 3.4 . 844 852 8 . . Yes Yes 85 126 1711 2522
Murrieta Valley Unified Murrieta Elementary No No No Yes N/A 62.9 -1.1 12.0 70.7 0.2 10.7 855 848 -7 34 63 Yes No 88 216 1800 4193
Murrieta Valley Unified Rail Ranch Elementary No No No Yes N/A 63.8 3.0 11.9 68.3 -3.1 0.5 839 843 4 23 96 Yes No 96 148 1913 3020
Murrieta Valley Unified Tovashal Elementary No No No Yes N/A 71.2 -1.5 12.1 72.1 -2.2 7.5 879 868 -11 23 55 Yes Yes 65 229 1349 4495
Nuview Union Mercury On-Line Academy of Southern Cali No No No No N/A 40.4 -16.4 . 16.8 -15.0 . 767 658 -109 . . No No 281 276 5540 5490
Nuview Union Nuview Elementary No Yes No Yes N/A 48.4 5.0 30.8 60.7 3.0 33.6 765 795 30 125 232 Yes Yes 162 39 3215 742
Nuview Union Valley View Elementary Yes Yes Yes Yes N/A 63.4 21.0 35.5 80.3 13.3 56.0 780 860 80 190 212 Yes Yes 78 2 1524 33
Palm Springs Unified Agua Caliente Elementary No No No Yes N/A 43.2 2.7 30.9 62.2 0.6 44.2 763 763 0 168 309 No No 220 174 4158 3490
Palm Springs Unified Bubbling Wells Elementary Yes Yes Yes Yes N/A 44.9 6.8 30.1 61.7 5.0 38.4 748 772 24 159 181 Yes No 206 47 3925 1050
Palm Springs Unified Cabot Yerxa Elementary No No No No N/A 34.6 -1.8 . 46.1 -4.6 . 727 693 -34 . . No No 273 270 5394 5327
Palm Springs Unified Cahuilla Elementary Yes Yes Yes Yes N/A 52.5 3.7 36.1 68.4 7.5 48.3 779 798 19 207 257 Yes Yes 156 69 3118 1440
Palm Springs Unified Cathedral City Elementary Yes Yes Yes Yes N/A 43.4 7.7 24.9 56.4 8.7 36.9 726 764 38 165 190 Yes Yes 219 15 4132 417
Palm Springs Unified Center for Learning and Development Yes Yes Yes N/A N/A . . . . . . . . . . . . . . .
Palm Springs Unified Cielo Vista Charter No No Yes Yes N/A 66.3 8.2 39.4 83.2 5.8 53.6 843 879 36 209 267 Yes Yes 49 20 1153 486
Palm Springs Unified Della S. Lindley Elementary Yes Yes Yes Yes N/A 43.3 7.5 27.8 58.8 7.9 44.1 737 761 24 194 249 Yes Yes 222 47 4210 1050
Palm Springs Unified Edward L. Wenzlaff Elementary No No No Yes N/A 48.2 1.0 27.5 60.3 -5.0 44.2 780 776 -4 187 244 No No 198 198 3801 3923
Palm Springs Unified Julius Corsini Elementary No Yes No Yes N/A 42.8 5.2 33.2 50.3 -5.4 34.4 745 739 -6 179 263 No No 249 211 4757 4098
Palm Springs Unified Katherine Finchy Elementary Yes Yes Yes Yes N/A 67.9 6.4 29.4 83.6 7.3 43.4 854 891 37 179 223 Yes Yes 40 18 953 459
Palm Springs Unified Landau Elementary Yes Yes Yes Yes N/A 59.3 7.8 25.7 72.6 11.6 43.9 801 832 31 129 178 Yes Yes 109 34 2175 686
Palm Springs Unified Rancho Mirage Elementary No No No Yes N/A 58.0 -3.5 28.9 72.1 -1.5 40.6 854 840 -14 157 215 Yes No 99 241 1989 4695
Palm Springs Unified Rio Vista Elementary No Yes No Yes N/A 66.5 1.9 . 73.1 -1.0 . 855 854 -1 . . Yes Yes 81 183 1657 3617
Palm Springs Unified Sunny Sands Elementary No No Yes Yes N/A 59.7 2.0 32.5 74.4 0.5 44.0 843 847 4 163 220 Yes Yes 90 148 1819 3020
Palm Springs Unified Two Bunch Palms Elementary No No No Yes N/A 34.6 -1.5 25.3 53.5 -2.0 42.3 739 722 -17 214 286 No No 263 245 5043 4846
Page 28 of 52Prepared by Riverside County Office of Education
Assessment and Accountability Services08/30/2011
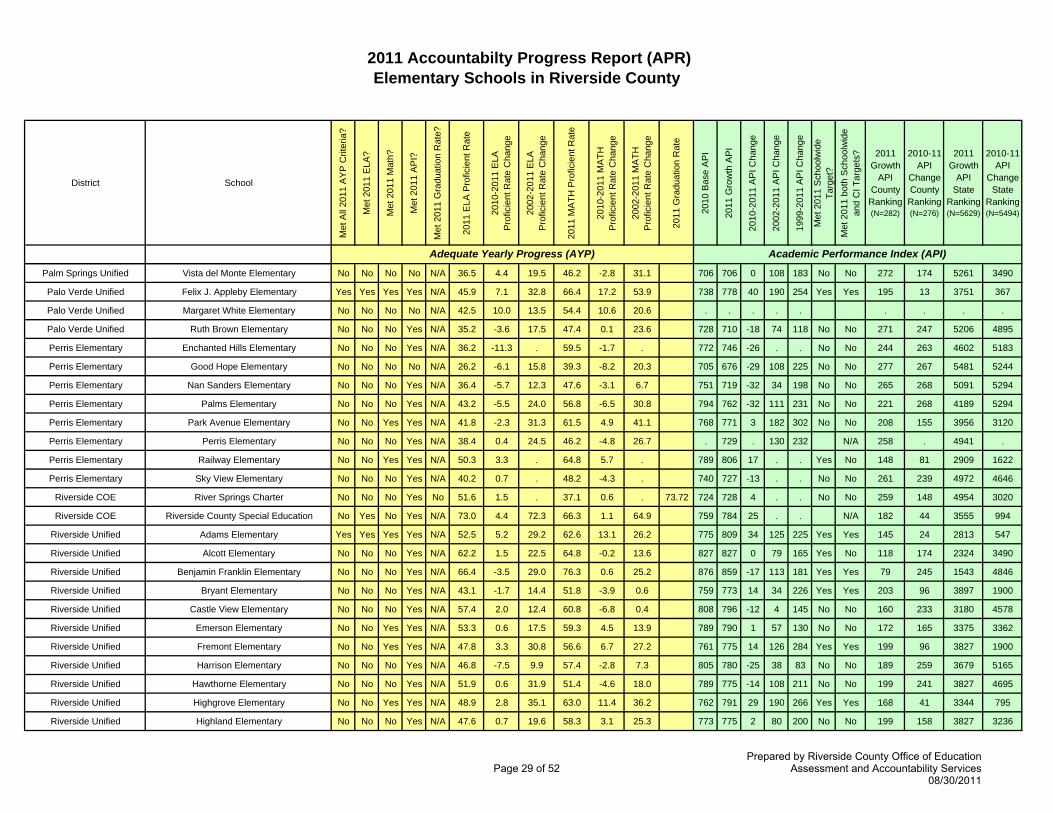
2011 Accountabilty Progress Report (APR)Elementary Schools in Riverside County
District School
Met
All
2011
AY
P C
riter
ia?
Met
201
1 E
LA?
Met
201
1 M
ath?
Met
201
1 A
PI?
Met
201
1 G
radu
atio
n R
ate?
2011
ELA
Pro
ficie
nt R
ate
2010
-201
1 E
LA
P
rofic
ient
Rat
e C
hang
e
2002
-201
1 E
LA
P
rofic
ient
Rat
e C
hang
e
2011
MA
TH P
rofic
ient
Rat
e
2010
-201
1 M
ATH
Pro
ficie
nt R
ate
Cha
nge
2002
-201
1 M
ATH
Pro
ficie
nt R
ate
Cha
nge
2011
Gra
duat
ion
Rat
e
2010
Bas
e A
PI
2011
Gro
wth
AP
I
2010
-201
1 A
PI C
hang
e
2002
-201
1 A
PI C
hang
e
1999
-201
1 A
PI C
hang
e
Met
201
1 S
choo
lwid
e Ta
rget
?M
et 2
011
both
Sch
oolw
ide
and
CI T
arge
ts? 2011
Growth API
County Ranking (N=282)
2010-11 API
Change County Ranking (N=276)
2011 Growth
API State
Ranking (N=5629)
2010-11 API
Change State
Ranking (N=5494)
Academic Performance Index (API)Adequate Yearly Progress (AYP)
Palm Springs Unified Vista del Monte Elementary No No No No N/A 36.5 4.4 19.5 46.2 -2.8 31.1 706 706 0 108 183 No No 272 174 5261 3490
Palo Verde Unified Felix J. Appleby Elementary Yes Yes Yes Yes N/A 45.9 7.1 32.8 66.4 17.2 53.9 738 778 40 190 254 Yes Yes 195 13 3751 367
Palo Verde Unified Margaret White Elementary No No No No N/A 42.5 10.0 13.5 54.4 10.6 20.6 . . . . . . . . .
Palo Verde Unified Ruth Brown Elementary No No No Yes N/A 35.2 -3.6 17.5 47.4 0.1 23.6 728 710 -18 74 118 No No 271 247 5206 4895
Perris Elementary Enchanted Hills Elementary No No No Yes N/A 36.2 -11.3 . 59.5 -1.7 . 772 746 -26 . . No No 244 263 4602 5183
Perris Elementary Good Hope Elementary No No No No N/A 26.2 -6.1 15.8 39.3 -8.2 20.3 705 676 -29 108 225 No No 277 267 5481 5244
Perris Elementary Nan Sanders Elementary No No No Yes N/A 36.4 -5.7 12.3 47.6 -3.1 6.7 751 719 -32 34 198 No No 265 268 5091 5294
Perris Elementary Palms Elementary No No No Yes N/A 43.2 -5.5 24.0 56.8 -6.5 30.8 794 762 -32 111 231 No No 221 268 4189 5294
Perris Elementary Park Avenue Elementary No No Yes Yes N/A 41.8 -2.3 31.3 61.5 4.9 41.1 768 771 3 182 302 No No 208 155 3956 3120
Perris Elementary Perris Elementary No No No Yes N/A 38.4 0.4 24.5 46.2 -4.8 26.7 . 729 . 130 232 N/A 258 . 4941 .
Perris Elementary Railway Elementary No No Yes Yes N/A 50.3 3.3 . 64.8 5.7 . 789 806 17 . . Yes No 148 81 2909 1622
Perris Elementary Sky View Elementary No No No Yes N/A 40.2 0.7 . 48.2 -4.3 . 740 727 -13 . . No No 261 239 4972 4646
Riverside COE River Springs Charter No No No Yes No 51.6 1.5 . 37.1 0.6 . 73.72 724 728 4 . . No No 259 148 4954 3020
Riverside COE Riverside County Special Education No Yes No Yes N/A 73.0 4.4 72.3 66.3 1.1 64.9 759 784 25 . . N/A 182 44 3555 994
Riverside Unified Adams Elementary Yes Yes Yes Yes N/A 52.5 5.2 29.2 62.6 13.1 26.2 775 809 34 125 225 Yes Yes 145 24 2813 547
Riverside Unified Alcott Elementary No No No Yes N/A 62.2 1.5 22.5 64.8 -0.2 13.6 827 827 0 79 165 Yes No 118 174 2324 3490
Riverside Unified Benjamin Franklin Elementary No No No Yes N/A 66.4 -3.5 29.0 76.3 0.6 25.2 876 859 -17 113 181 Yes Yes 79 245 1543 4846
Riverside Unified Bryant Elementary No No No Yes N/A 43.1 -1.7 14.4 51.8 -3.9 0.6 759 773 14 34 226 Yes Yes 203 96 3897 1900
Riverside Unified Castle View Elementary No No No Yes N/A 57.4 2.0 12.4 60.8 -6.8 0.4 808 796 -12 4 145 No No 160 233 3180 4578
Riverside Unified Emerson Elementary No No Yes Yes N/A 53.3 0.6 17.5 59.3 4.5 13.9 789 790 1 57 130 No No 172 165 3375 3362
Riverside Unified Fremont Elementary No No Yes Yes N/A 47.8 3.3 30.8 56.6 6.7 27.2 761 775 14 126 284 Yes Yes 199 96 3827 1900
Riverside Unified Harrison Elementary No No No Yes N/A 46.8 -7.5 9.9 57.4 -2.8 7.3 805 780 -25 38 83 No No 189 259 3679 5165
Riverside Unified Hawthorne Elementary No No No Yes N/A 51.9 0.6 31.9 51.4 -4.6 18.0 789 775 -14 108 211 No No 199 241 3827 4695
Riverside Unified Highgrove Elementary No No Yes Yes N/A 48.9 2.8 35.1 63.0 11.4 36.2 762 791 29 190 266 Yes Yes 168 41 3344 795
Riverside Unified Highland Elementary No No No Yes N/A 47.6 0.7 19.6 58.3 3.1 25.3 773 775 2 80 200 No No 199 158 3827 3236
Page 29 of 52Prepared by Riverside County Office of Education
Assessment and Accountability Services08/30/2011
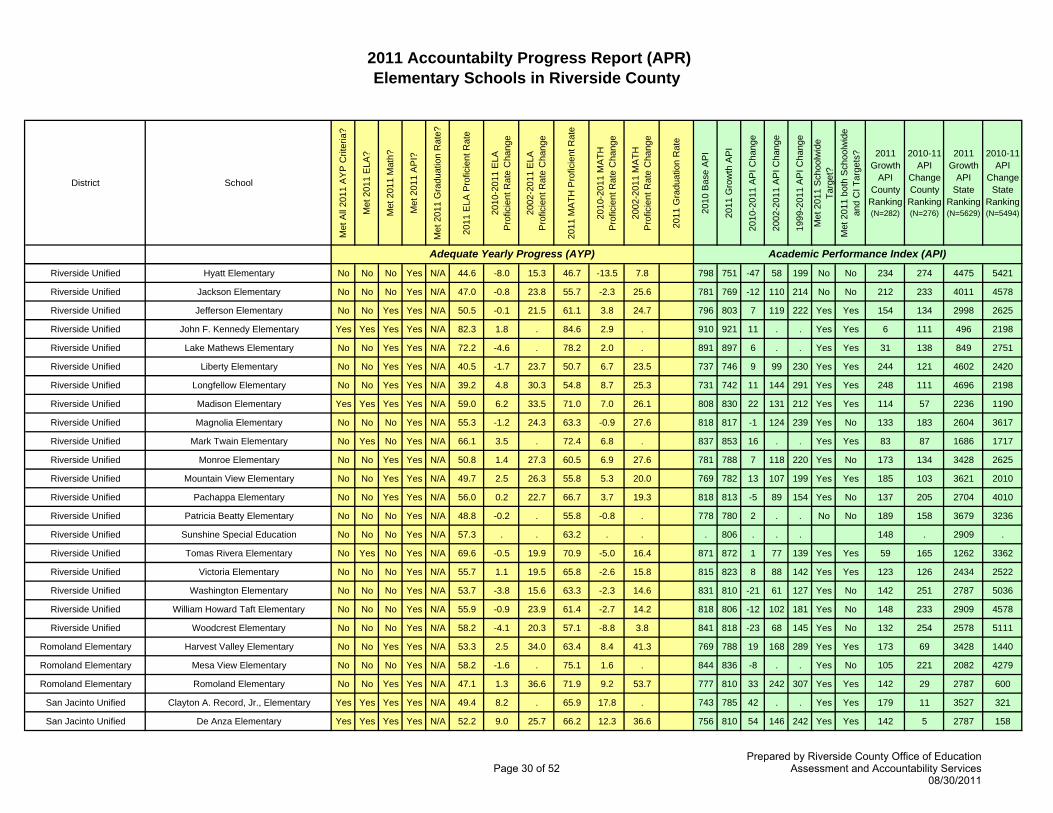
2011 Accountabilty Progress Report (APR)Elementary Schools in Riverside County
District School
Met
All
2011
AY
P C
riter
ia?
Met
201
1 E
LA?
Met
201
1 M
ath?
Met
201
1 A
PI?
Met
201
1 G
radu
atio
n R
ate?
2011
ELA
Pro
ficie
nt R
ate
2010
-201
1 E
LA
P
rofic
ient
Rat
e C
hang
e
2002
-201
1 E
LA
P
rofic
ient
Rat
e C
hang
e
2011
MA
TH P
rofic
ient
Rat
e
2010
-201
1 M
ATH
Pro
ficie
nt R
ate
Cha
nge
2002
-201
1 M
ATH
Pro
ficie
nt R
ate
Cha
nge
2011
Gra
duat
ion
Rat
e
2010
Bas
e A
PI
2011
Gro
wth
AP
I
2010
-201
1 A
PI C
hang
e
2002
-201
1 A
PI C
hang
e
1999
-201
1 A
PI C
hang
e
Met
201
1 S
choo
lwid
e Ta
rget
?M
et 2
011
both
Sch
oolw
ide
and
CI T
arge
ts? 2011
Growth API
County Ranking (N=282)
2010-11 API
Change County Ranking (N=276)
2011 Growth
API State
Ranking (N=5629)
2010-11 API
Change State
Ranking (N=5494)
Academic Performance Index (API)Adequate Yearly Progress (AYP)
Riverside Unified Hyatt Elementary No No No Yes N/A 44.6 -8.0 15.3 46.7 -13.5 7.8 798 751 -47 58 199 No No 234 274 4475 5421
Riverside Unified Jackson Elementary No No No Yes N/A 47.0 -0.8 23.8 55.7 -2.3 25.6 781 769 -12 110 214 No No 212 233 4011 4578
Riverside Unified Jefferson Elementary No No Yes Yes N/A 50.5 -0.1 21.5 61.1 3.8 24.7 796 803 7 119 222 Yes Yes 154 134 2998 2625
Riverside Unified John F. Kennedy Elementary Yes Yes Yes Yes N/A 82.3 1.8 . 84.6 2.9 . 910 921 11 . . Yes Yes 6 111 496 2198
Riverside Unified Lake Mathews Elementary No No Yes Yes N/A 72.2 -4.6 . 78.2 2.0 . 891 897 6 . . Yes Yes 31 138 849 2751
Riverside Unified Liberty Elementary No No Yes Yes N/A 40.5 -1.7 23.7 50.7 6.7 23.5 737 746 9 99 230 Yes Yes 244 121 4602 2420
Riverside Unified Longfellow Elementary No No Yes Yes N/A 39.2 4.8 30.3 54.8 8.7 25.3 731 742 11 144 291 Yes Yes 248 111 4696 2198
Riverside Unified Madison Elementary Yes Yes Yes Yes N/A 59.0 6.2 33.5 71.0 7.0 26.1 808 830 22 131 212 Yes Yes 114 57 2236 1190
Riverside Unified Magnolia Elementary No No No Yes N/A 55.3 -1.2 24.3 63.3 -0.9 27.6 818 817 -1 124 239 Yes No 133 183 2604 3617
Riverside Unified Mark Twain Elementary No Yes No Yes N/A 66.1 3.5 . 72.4 6.8 . 837 853 16 . . Yes Yes 83 87 1686 1717
Riverside Unified Monroe Elementary No No Yes Yes N/A 50.8 1.4 27.3 60.5 6.9 27.6 781 788 7 118 220 Yes No 173 134 3428 2625
Riverside Unified Mountain View Elementary No No Yes Yes N/A 49.7 2.5 26.3 55.8 5.3 20.0 769 782 13 107 199 Yes Yes 185 103 3621 2010
Riverside Unified Pachappa Elementary No No Yes Yes N/A 56.0 0.2 22.7 66.7 3.7 19.3 818 813 -5 89 154 Yes No 137 205 2704 4010
Riverside Unified Patricia Beatty Elementary No No No Yes N/A 48.8 -0.2 . 55.8 -0.8 . 778 780 2 . . No No 189 158 3679 3236
Riverside Unified Sunshine Special Education No No No Yes N/A 57.3 . . 63.2 . . . 806 . . . 148 . 2909 .
Riverside Unified Tomas Rivera Elementary No Yes No Yes N/A 69.6 -0.5 19.9 70.9 -5.0 16.4 871 872 1 77 139 Yes Yes 59 165 1262 3362
Riverside Unified Victoria Elementary No No No Yes N/A 55.7 1.1 19.5 65.8 -2.6 15.8 815 823 8 88 142 Yes Yes 123 126 2434 2522
Riverside Unified Washington Elementary No No No Yes N/A 53.7 -3.8 15.6 63.3 -2.3 14.6 831 810 -21 61 127 Yes No 142 251 2787 5036
Riverside Unified William Howard Taft Elementary No No No Yes N/A 55.9 -0.9 23.9 61.4 -2.7 14.2 818 806 -12 102 181 Yes No 148 233 2909 4578
Riverside Unified Woodcrest Elementary No No No Yes N/A 58.2 -4.1 20.3 57.1 -8.8 3.8 841 818 -23 68 145 Yes No 132 254 2578 5111
Romoland Elementary Harvest Valley Elementary No No Yes Yes N/A 53.3 2.5 34.0 63.4 8.4 41.3 769 788 19 168 289 Yes Yes 173 69 3428 1440
Romoland Elementary Mesa View Elementary No No No Yes N/A 58.2 -1.6 . 75.1 1.6 . 844 836 -8 . . Yes No 105 221 2082 4279
Romoland Elementary Romoland Elementary No No Yes Yes N/A 47.1 1.3 36.6 71.9 9.2 53.7 777 810 33 242 307 Yes Yes 142 29 2787 600
San Jacinto Unified Clayton A. Record, Jr., Elementary Yes Yes Yes Yes N/A 49.4 8.2 . 65.9 17.8 . 743 785 42 . . Yes Yes 179 11 3527 321
San Jacinto Unified De Anza Elementary Yes Yes Yes Yes N/A 52.2 9.0 25.7 66.2 12.3 36.6 756 810 54 146 242 Yes Yes 142 5 2787 158
Page 30 of 52Prepared by Riverside County Office of Education
Assessment and Accountability Services08/30/2011
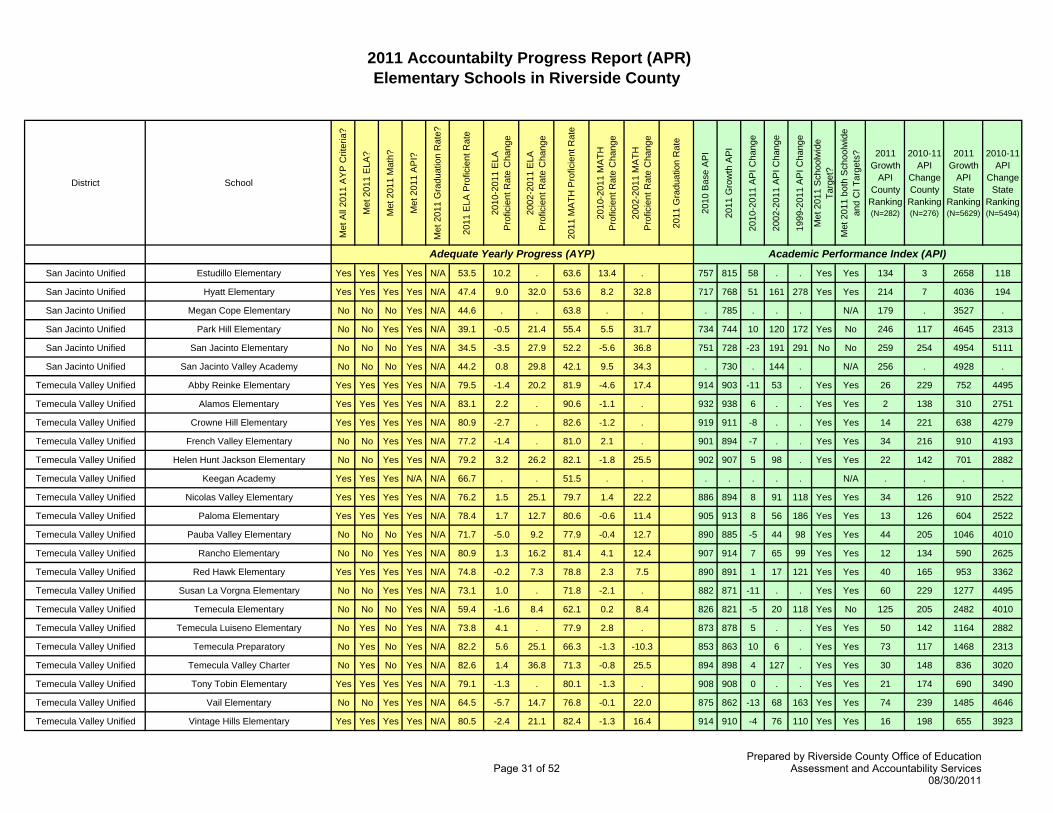
2011 Accountabilty Progress Report (APR)Elementary Schools in Riverside County
District School
Met
All
2011
AY
P C
riter
ia?
Met
201
1 E
LA?
Met
201
1 M
ath?
Met
201
1 A
PI?
Met
201
1 G
radu
atio
n R
ate?
2011
ELA
Pro
ficie
nt R
ate
2010
-201
1 E
LA
P
rofic
ient
Rat
e C
hang
e
2002
-201
1 E
LA
P
rofic
ient
Rat
e C
hang
e
2011
MA
TH P
rofic
ient
Rat
e
2010
-201
1 M
ATH
Pro
ficie
nt R
ate
Cha
nge
2002
-201
1 M
ATH
Pro
ficie
nt R
ate
Cha
nge
2011
Gra
duat
ion
Rat
e
2010
Bas
e A
PI
2011
Gro
wth
AP
I
2010
-201
1 A
PI C
hang
e
2002
-201
1 A
PI C
hang
e
1999
-201
1 A
PI C
hang
e
Met
201
1 S
choo
lwid
e Ta
rget
?M
et 2
011
both
Sch
oolw
ide
and
CI T
arge
ts? 2011
Growth API
County Ranking (N=282)
2010-11 API
Change County Ranking (N=276)
2011 Growth
API State
Ranking (N=5629)
2010-11 API
Change State
Ranking (N=5494)
Academic Performance Index (API)Adequate Yearly Progress (AYP)
San Jacinto Unified Estudillo Elementary Yes Yes Yes Yes N/A 53.5 10.2 . 63.6 13.4 . 757 815 58 . . Yes Yes 134 3 2658 118
San Jacinto Unified Hyatt Elementary Yes Yes Yes Yes N/A 47.4 9.0 32.0 53.6 8.2 32.8 717 768 51 161 278 Yes Yes 214 7 4036 194
San Jacinto Unified Megan Cope Elementary No No No Yes N/A 44.6 . . 63.8 . . . 785 . . . N/A 179 . 3527 .
San Jacinto Unified Park Hill Elementary No No Yes Yes N/A 39.1 -0.5 21.4 55.4 5.5 31.7 734 744 10 120 172 Yes No 246 117 4645 2313
San Jacinto Unified San Jacinto Elementary No No No Yes N/A 34.5 -3.5 27.9 52.2 -5.6 36.8 751 728 -23 191 291 No No 259 254 4954 5111
San Jacinto Unified San Jacinto Valley Academy No No No Yes N/A 44.2 0.8 29.8 42.1 9.5 34.3 . 730 . 144 . N/A 256 . 4928 .
Temecula Valley Unified Abby Reinke Elementary Yes Yes Yes Yes N/A 79.5 -1.4 20.2 81.9 -4.6 17.4 914 903 -11 53 . Yes Yes 26 229 752 4495
Temecula Valley Unified Alamos Elementary Yes Yes Yes Yes N/A 83.1 2.2 . 90.6 -1.1 . 932 938 6 . . Yes Yes 2 138 310 2751
Temecula Valley Unified Crowne Hill Elementary Yes Yes Yes Yes N/A 80.9 -2.7 . 82.6 -1.2 . 919 911 -8 . . Yes Yes 14 221 638 4279
Temecula Valley Unified French Valley Elementary No No Yes Yes N/A 77.2 -1.4 . 81.0 2.1 . 901 894 -7 . . Yes Yes 34 216 910 4193
Temecula Valley Unified Helen Hunt Jackson Elementary No No Yes Yes N/A 79.2 3.2 26.2 82.1 -1.8 25.5 902 907 5 98 . Yes Yes 22 142 701 2882
Temecula Valley Unified Keegan Academy Yes Yes Yes N/A N/A 66.7 . . 51.5 . . . . . . . N/A . . . .
Temecula Valley Unified Nicolas Valley Elementary Yes Yes Yes Yes N/A 76.2 1.5 25.1 79.7 1.4 22.2 886 894 8 91 118 Yes Yes 34 126 910 2522
Temecula Valley Unified Paloma Elementary Yes Yes Yes Yes N/A 78.4 1.7 12.7 80.6 -0.6 11.4 905 913 8 56 186 Yes Yes 13 126 604 2522
Temecula Valley Unified Pauba Valley Elementary No No No Yes N/A 71.7 -5.0 9.2 77.9 -0.4 12.7 890 885 -5 44 98 Yes Yes 44 205 1046 4010
Temecula Valley Unified Rancho Elementary No No Yes Yes N/A 80.9 1.3 16.2 81.4 4.1 12.4 907 914 7 65 99 Yes Yes 12 134 590 2625
Temecula Valley Unified Red Hawk Elementary Yes Yes Yes Yes N/A 74.8 -0.2 7.3 78.8 2.3 7.5 890 891 1 17 121 Yes Yes 40 165 953 3362
Temecula Valley Unified Susan La Vorgna Elementary No No Yes Yes N/A 73.1 1.0 . 71.8 -2.1 . 882 871 -11 . . Yes Yes 60 229 1277 4495
Temecula Valley Unified Temecula Elementary No No No Yes N/A 59.4 -1.6 8.4 62.1 0.2 8.4 826 821 -5 20 118 Yes No 125 205 2482 4010
Temecula Valley Unified Temecula Luiseno Elementary No Yes No Yes N/A 73.8 4.1 . 77.9 2.8 . 873 878 5 . . Yes Yes 50 142 1164 2882
Temecula Valley Unified Temecula Preparatory No Yes No Yes N/A 82.2 5.6 25.1 66.3 -1.3 -10.3 853 863 10 6 . Yes Yes 73 117 1468 2313
Temecula Valley Unified Temecula Valley Charter No Yes No Yes N/A 82.6 1.4 36.8 71.3 -0.8 25.5 894 898 4 127 . Yes Yes 30 148 836 3020
Temecula Valley Unified Tony Tobin Elementary Yes Yes Yes Yes N/A 79.1 -1.3 . 80.1 -1.3 . 908 908 0 . . Yes Yes 21 174 690 3490
Temecula Valley Unified Vail Elementary No No Yes Yes N/A 64.5 -5.7 14.7 76.8 -0.1 22.0 875 862 -13 68 163 Yes Yes 74 239 1485 4646
Temecula Valley Unified Vintage Hills Elementary Yes Yes Yes Yes N/A 80.5 -2.4 21.1 82.4 -1.3 16.4 914 910 -4 76 110 Yes Yes 16 198 655 3923
Page 31 of 52Prepared by Riverside County Office of Education
Assessment and Accountability Services08/30/2011
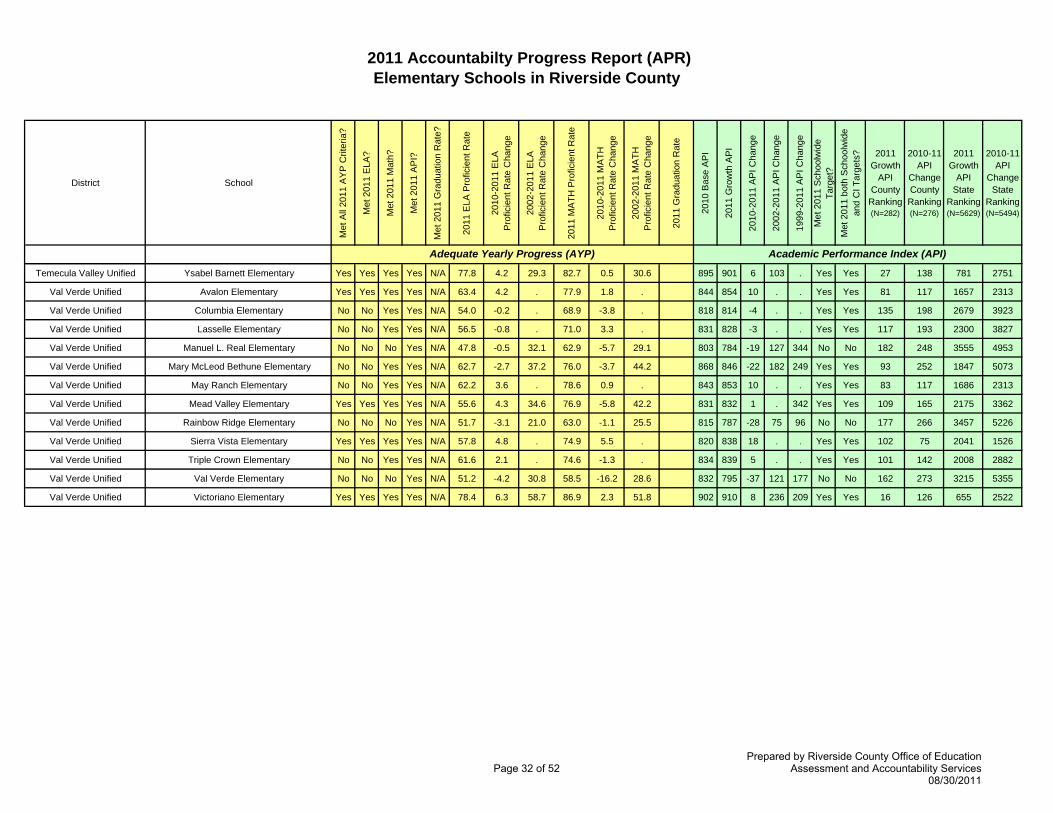
2011 Accountabilty Progress Report (APR)Elementary Schools in Riverside County
District School
Met
All
2011
AY
P C
riter
ia?
Met
201
1 E
LA?
Met
201
1 M
ath?
Met
201
1 A
PI?
Met
201
1 G
radu
atio
n R
ate?
2011
ELA
Pro
ficie
nt R
ate
2010
-201
1 E
LA
P
rofic
ient
Rat
e C
hang
e
2002
-201
1 E
LA
P
rofic
ient
Rat
e C
hang
e
2011
MA
TH P
rofic
ient
Rat
e
2010
-201
1 M
ATH
Pro
ficie
nt R
ate
Cha
nge
2002
-201
1 M
ATH
Pro
ficie
nt R
ate
Cha
nge
2011
Gra
duat
ion
Rat
e
2010
Bas
e A
PI
2011
Gro
wth
AP
I
2010
-201
1 A
PI C
hang
e
2002
-201
1 A
PI C
hang
e
1999
-201
1 A
PI C
hang
e
Met
201
1 S
choo
lwid
e Ta
rget
?M
et 2
011
both
Sch
oolw
ide
and
CI T
arge
ts? 2011
Growth API
County Ranking (N=282)
2010-11 API
Change County Ranking (N=276)
2011 Growth
API State
Ranking (N=5629)
2010-11 API
Change State
Ranking (N=5494)
Academic Performance Index (API)Adequate Yearly Progress (AYP)
Temecula Valley Unified Ysabel Barnett Elementary Yes Yes Yes Yes N/A 77.8 4.2 29.3 82.7 0.5 30.6 895 901 6 103 . Yes Yes 27 138 781 2751
Val Verde Unified Avalon Elementary Yes Yes Yes Yes N/A 63.4 4.2 . 77.9 1.8 . 844 854 10 . . Yes Yes 81 117 1657 2313
Val Verde Unified Columbia Elementary No No Yes Yes N/A 54.0 -0.2 . 68.9 -3.8 . 818 814 -4 . . Yes Yes 135 198 2679 3923
Val Verde Unified Lasselle Elementary No No Yes Yes N/A 56.5 -0.8 . 71.0 3.3 . 831 828 -3 . . Yes Yes 117 193 2300 3827
Val Verde Unified Manuel L. Real Elementary No No No Yes N/A 47.8 -0.5 32.1 62.9 -5.7 29.1 803 784 -19 127 344 No No 182 248 3555 4953
Val Verde Unified Mary McLeod Bethune Elementary No No Yes Yes N/A 62.7 -2.7 37.2 76.0 -3.7 44.2 868 846 -22 182 249 Yes Yes 93 252 1847 5073
Val Verde Unified May Ranch Elementary No No Yes Yes N/A 62.2 3.6 . 78.6 0.9 . 843 853 10 . . Yes Yes 83 117 1686 2313
Val Verde Unified Mead Valley Elementary Yes Yes Yes Yes N/A 55.6 4.3 34.6 76.9 -5.8 42.2 831 832 1 . 342 Yes Yes 109 165 2175 3362
Val Verde Unified Rainbow Ridge Elementary No No No Yes N/A 51.7 -3.1 21.0 63.0 -1.1 25.5 815 787 -28 75 96 No No 177 266 3457 5226
Val Verde Unified Sierra Vista Elementary Yes Yes Yes Yes N/A 57.8 4.8 . 74.9 5.5 . 820 838 18 . . Yes Yes 102 75 2041 1526
Val Verde Unified Triple Crown Elementary No No Yes Yes N/A 61.6 2.1 . 74.6 -1.3 . 834 839 5 . . Yes Yes 101 142 2008 2882
Val Verde Unified Val Verde Elementary No No No Yes N/A 51.2 -4.2 30.8 58.5 -16.2 28.6 832 795 -37 121 177 No No 162 273 3215 5355
Val Verde Unified Victoriano Elementary Yes Yes Yes Yes N/A 78.4 6.3 58.7 86.9 2.3 51.8 902 910 8 236 209 Yes Yes 16 126 655 2522
Page 32 of 52Prepared by Riverside County Office of Education
Assessment and Accountability Services08/30/2011
List of Riverside County Middle Schools
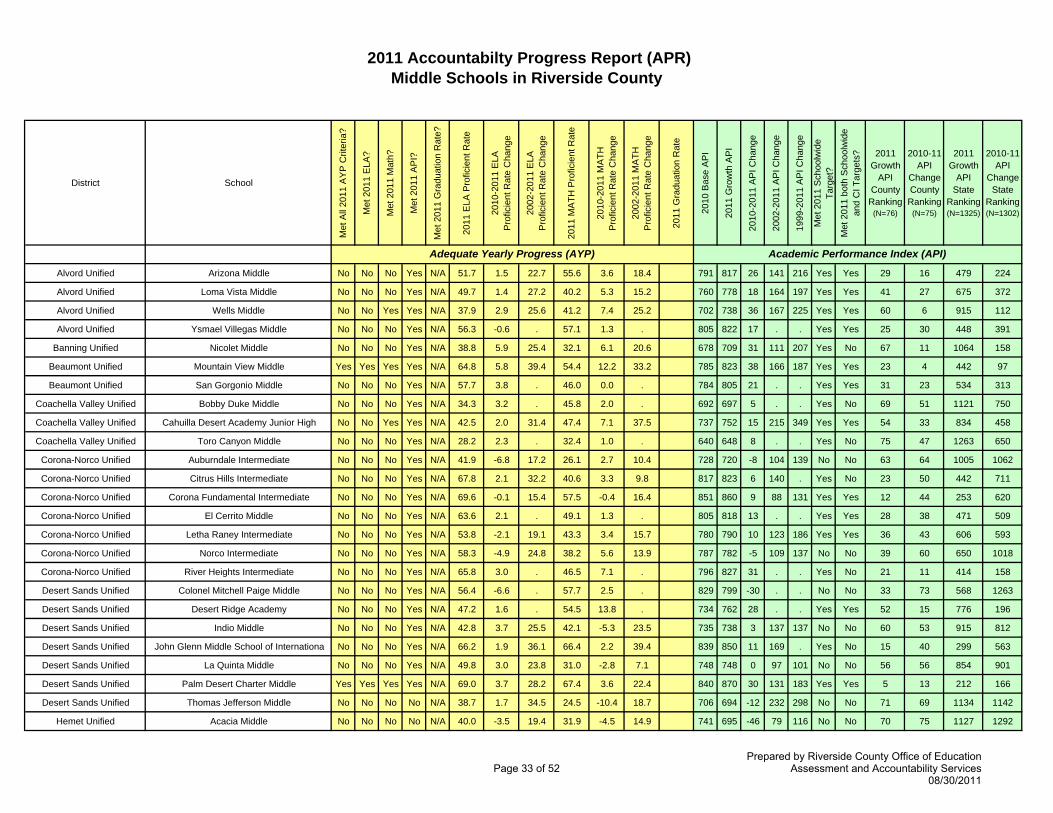
2011 Accountabilty Progress Report (APR)Middle Schools in Riverside County
District School
Met
All
2011
AY
P C
riter
ia?
Met
201
1 E
LA?
Met
201
1 M
ath?
Met
201
1 A
PI?
Met
201
1 G
radu
atio
n R
ate?
2011
ELA
Pro
ficie
nt R
ate
2010
-201
1 E
LA
P
rofic
ient
Rat
e C
hang
e
2002
-201
1 E
LA
P
rofic
ient
Rat
e C
hang
e
2011
MA
TH P
rofic
ient
Rat
e
2010
-201
1 M
ATH
Pro
ficie
nt R
ate
Cha
nge
2002
-201
1 M
ATH
Pro
ficie
nt R
ate
Cha
nge
2011
Gra
duat
ion
Rat
e
2010
Bas
e A
PI
2011
Gro
wth
AP
I
2010
-201
1 A
PI C
hang
e
2002
-201
1 A
PI C
hang
e
1999
-201
1 A
PI C
hang
e
Met
201
1 S
choo
lwid
e Ta
rget
?M
et 2
011
both
Sch
oolw
ide
and
CI T
arge
ts? 2011
Growth API
County Ranking
(N=76)
2010-11 API
Change County Ranking
(N=75)
2011 Growth
API State
Ranking (N=1325)
2010-11 API
Change State
Ranking (N=1302)
Alvord Unified Arizona Middle No No No Yes N/A 51.7 1.5 22.7 55.6 3.6 18.4 791 817 26 141 216 Yes Yes 29 16 479 224
Alvord Unified Loma Vista Middle No No No Yes N/A 49.7 1.4 27.2 40.2 5.3 15.2 760 778 18 164 197 Yes Yes 41 27 675 372
Alvord Unified Wells Middle No No Yes Yes N/A 37.9 2.9 25.6 41.2 7.4 25.2 702 738 36 167 225 Yes Yes 60 6 915 112
Alvord Unified Ysmael Villegas Middle No No No Yes N/A 56.3 -0.6 . 57.1 1.3 . 805 822 17 . . Yes Yes 25 30 448 391
Banning Unified Nicolet Middle No No No Yes N/A 38.8 5.9 25.4 32.1 6.1 20.6 678 709 31 111 207 Yes No 67 11 1064 158
Beaumont Unified Mountain View Middle Yes Yes Yes Yes N/A 64.8 5.8 39.4 54.4 12.2 33.2 785 823 38 166 187 Yes Yes 23 4 442 97
Beaumont Unified San Gorgonio Middle No No No Yes N/A 57.7 3.8 . 46.0 0.0 . 784 805 21 . . Yes Yes 31 23 534 313
Coachella Valley Unified Bobby Duke Middle No No No Yes N/A 34.3 3.2 . 45.8 2.0 . 692 697 5 . . Yes No 69 51 1121 750
Coachella Valley Unified Cahuilla Desert Academy Junior High No No Yes Yes N/A 42.5 2.0 31.4 47.4 7.1 37.5 737 752 15 215 349 Yes Yes 54 33 834 458
Coachella Valley Unified Toro Canyon Middle No No No Yes N/A 28.2 2.3 . 32.4 1.0 . 640 648 8 . . Yes No 75 47 1263 650
Corona-Norco Unified Auburndale Intermediate No No No Yes N/A 41.9 -6.8 17.2 26.1 2.7 10.4 728 720 -8 104 139 No No 63 64 1005 1062
Corona-Norco Unified Citrus Hills Intermediate No No No Yes N/A 67.8 2.1 32.2 40.6 3.3 9.8 817 823 6 140 . Yes No 23 50 442 711
Corona-Norco Unified Corona Fundamental Intermediate No No No Yes N/A 69.6 -0.1 15.4 57.5 -0.4 16.4 851 860 9 88 131 Yes Yes 12 44 253 620
Corona-Norco Unified El Cerrito Middle No No No Yes N/A 63.6 2.1 . 49.1 1.3 . 805 818 13 . . Yes Yes 28 38 471 509
Corona-Norco Unified Letha Raney Intermediate No No No Yes N/A 53.8 -2.1 19.1 43.3 3.4 15.7 780 790 10 123 186 Yes Yes 36 43 606 593
Corona-Norco Unified Norco Intermediate No No No Yes N/A 58.3 -4.9 24.8 38.2 5.6 13.9 787 782 -5 109 137 No No 39 60 650 1018
Corona-Norco Unified River Heights Intermediate No No No Yes N/A 65.8 3.0 . 46.5 7.1 . 796 827 31 . . Yes No 21 11 414 158
Desert Sands Unified Colonel Mitchell Paige Middle No No No Yes N/A 56.4 -6.6 . 57.7 2.5 . 829 799 -30 . . No No 33 73 568 1263
Desert Sands Unified Desert Ridge Academy No No No Yes N/A 47.2 1.6 . 54.5 13.8 . 734 762 28 . . Yes Yes 52 15 776 196
Desert Sands Unified Indio Middle No No No Yes N/A 42.8 3.7 25.5 42.1 -5.3 23.5 735 738 3 137 137 No No 60 53 915 812
Desert Sands Unified John Glenn Middle School of Internationa No No No Yes N/A 66.2 1.9 36.1 66.4 2.2 39.4 839 850 11 169 . Yes No 15 40 299 563
Desert Sands Unified La Quinta Middle No No No Yes N/A 49.8 3.0 23.8 31.0 -2.8 7.1 748 748 0 97 101 No No 56 56 854 901
Desert Sands Unified Palm Desert Charter Middle Yes Yes Yes Yes N/A 69.0 3.7 28.2 67.4 3.6 22.4 840 870 30 131 183 Yes Yes 5 13 212 166
Desert Sands Unified Thomas Jefferson Middle No No No No N/A 38.7 1.7 34.5 24.5 -10.4 18.7 706 694 -12 232 298 No No 71 69 1134 1142
Hemet Unified Acacia Middle No No No No N/A 40.0 -3.5 19.4 31.9 -4.5 14.9 741 695 -46 79 116 No No 70 75 1127 1292
Academic Performance Index (API)Adequate Yearly Progress (AYP)
Page 33 of 52Prepared by Riverside County Office of Education
Assessment and Accountability Services08/30/2011
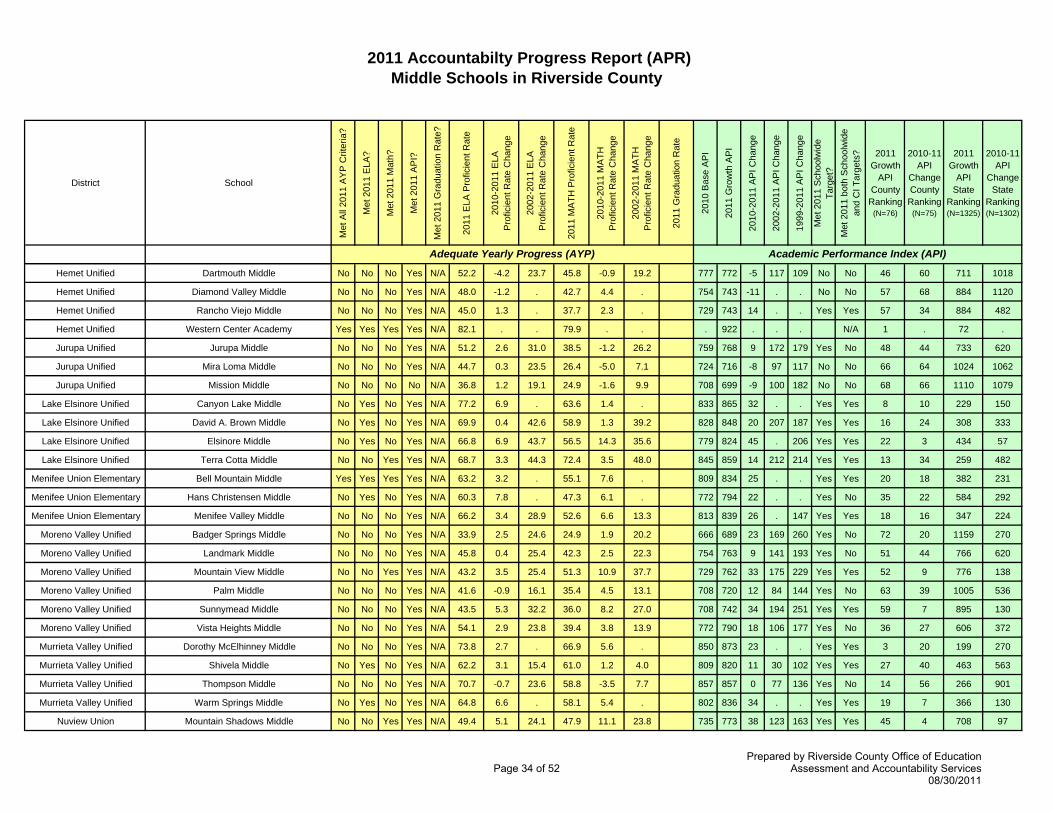
2011 Accountabilty Progress Report (APR)Middle Schools in Riverside County
District School
Met
All
2011
AY
P C
riter
ia?
Met
201
1 E
LA?
Met
201
1 M
ath?
Met
201
1 A
PI?
Met
201
1 G
radu
atio
n R
ate?
2011
ELA
Pro
ficie
nt R
ate
2010
-201
1 E
LA
P
rofic
ient
Rat
e C
hang
e
2002
-201
1 E
LA
P
rofic
ient
Rat
e C
hang
e
2011
MA
TH P
rofic
ient
Rat
e
2010
-201
1 M
ATH
Pro
ficie
nt R
ate
Cha
nge
2002
-201
1 M
ATH
Pro
ficie
nt R
ate
Cha
nge
2011
Gra
duat
ion
Rat
e
2010
Bas
e A
PI
2011
Gro
wth
AP
I
2010
-201
1 A
PI C
hang
e
2002
-201
1 A
PI C
hang
e
1999
-201
1 A
PI C
hang
e
Met
201
1 S
choo
lwid
e Ta
rget
?M
et 2
011
both
Sch
oolw
ide
and
CI T
arge
ts? 2011
Growth API
County Ranking
(N=76)
2010-11 API
Change County Ranking
(N=75)
2011 Growth
API State
Ranking (N=1325)
2010-11 API
Change State
Ranking (N=1302)
Academic Performance Index (API)Adequate Yearly Progress (AYP)
Hemet Unified Dartmouth Middle No No No Yes N/A 52.2 -4.2 23.7 45.8 -0.9 19.2 777 772 -5 117 109 No No 46 60 711 1018
Hemet Unified Diamond Valley Middle No No No Yes N/A 48.0 -1.2 . 42.7 4.4 . 754 743 -11 . . No No 57 68 884 1120
Hemet Unified Rancho Viejo Middle No No No Yes N/A 45.0 1.3 . 37.7 2.3 . 729 743 14 . . Yes Yes 57 34 884 482
Hemet Unified Western Center Academy Yes Yes Yes Yes N/A 82.1 . . 79.9 . . . 922 . . . N/A 1 . 72 .
Jurupa Unified Jurupa Middle No No No Yes N/A 51.2 2.6 31.0 38.5 -1.2 26.2 759 768 9 172 179 Yes No 48 44 733 620
Jurupa Unified Mira Loma Middle No No No Yes N/A 44.7 0.3 23.5 26.4 -5.0 7.1 724 716 -8 97 117 No No 66 64 1024 1062
Jurupa Unified Mission Middle No No No No N/A 36.8 1.2 19.1 24.9 -1.6 9.9 708 699 -9 100 182 No No 68 66 1110 1079
Lake Elsinore Unified Canyon Lake Middle No Yes No Yes N/A 77.2 6.9 . 63.6 1.4 . 833 865 32 . . Yes Yes 8 10 229 150
Lake Elsinore Unified David A. Brown Middle No Yes No Yes N/A 69.9 0.4 42.6 58.9 1.3 39.2 828 848 20 207 187 Yes Yes 16 24 308 333
Lake Elsinore Unified Elsinore Middle No Yes No Yes N/A 66.8 6.9 43.7 56.5 14.3 35.6 779 824 45 . 206 Yes Yes 22 3 434 57
Lake Elsinore Unified Terra Cotta Middle No No Yes Yes N/A 68.7 3.3 44.3 72.4 3.5 48.0 845 859 14 212 214 Yes Yes 13 34 259 482
Menifee Union Elementary Bell Mountain Middle Yes Yes Yes Yes N/A 63.2 3.2 . 55.1 7.6 . 809 834 25 . . Yes Yes 20 18 382 231
Menifee Union Elementary Hans Christensen Middle No Yes No Yes N/A 60.3 7.8 . 47.3 6.1 . 772 794 22 . . Yes No 35 22 584 292
Menifee Union Elementary Menifee Valley Middle No No No Yes N/A 66.2 3.4 28.9 52.6 6.6 13.3 813 839 26 . 147 Yes Yes 18 16 347 224
Moreno Valley Unified Badger Springs Middle No No No Yes N/A 33.9 2.5 24.6 24.9 1.9 20.2 666 689 23 169 260 Yes No 72 20 1159 270
Moreno Valley Unified Landmark Middle No No No Yes N/A 45.8 0.4 25.4 42.3 2.5 22.3 754 763 9 141 193 Yes No 51 44 766 620
Moreno Valley Unified Mountain View Middle No No Yes Yes N/A 43.2 3.5 25.4 51.3 10.9 37.7 729 762 33 175 229 Yes Yes 52 9 776 138
Moreno Valley Unified Palm Middle No No No Yes N/A 41.6 -0.9 16.1 35.4 4.5 13.1 708 720 12 84 144 Yes No 63 39 1005 536
Moreno Valley Unified Sunnymead Middle No No No Yes N/A 43.5 5.3 32.2 36.0 8.2 27.0 708 742 34 194 251 Yes Yes 59 7 895 130
Moreno Valley Unified Vista Heights Middle No No No Yes N/A 54.1 2.9 23.8 39.4 3.8 13.9 772 790 18 106 177 Yes No 36 27 606 372
Murrieta Valley Unified Dorothy McElhinney Middle No No No Yes N/A 73.8 2.7 . 66.9 5.6 . 850 873 23 . . Yes Yes 3 20 199 270
Murrieta Valley Unified Shivela Middle No Yes No Yes N/A 62.2 3.1 15.4 61.0 1.2 4.0 809 820 11 30 102 Yes Yes 27 40 463 563
Murrieta Valley Unified Thompson Middle No No No Yes N/A 70.7 -0.7 23.6 58.8 -3.5 7.7 857 857 0 77 136 Yes No 14 56 266 901
Murrieta Valley Unified Warm Springs Middle No Yes No Yes N/A 64.8 6.6 . 58.1 5.4 . 802 836 34 . . Yes Yes 19 7 366 130
Nuview Union Mountain Shadows Middle No No Yes Yes N/A 49.4 5.1 24.1 47.9 11.1 23.8 735 773 38 123 163 Yes Yes 45 4 708 97
Page 34 of 52Prepared by Riverside County Office of Education
Assessment and Accountability Services08/30/2011
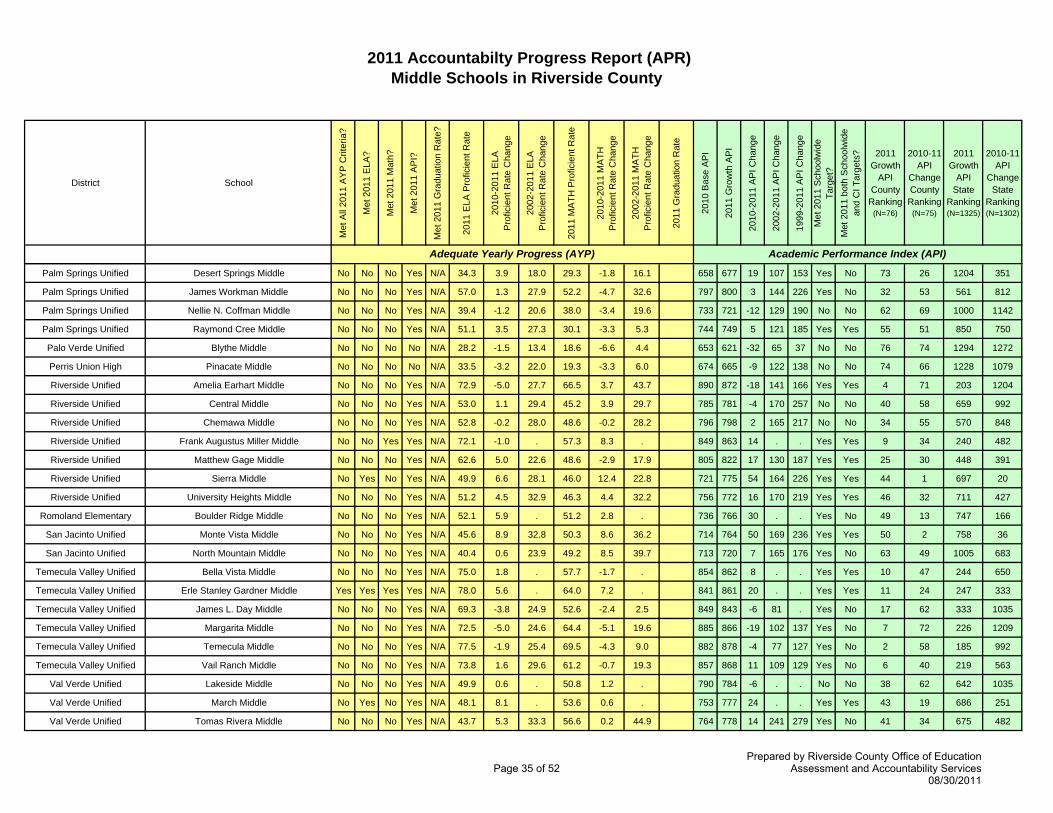
2011 Accountabilty Progress Report (APR)Middle Schools in Riverside County
District School
Met
All
2011
AY
P C
riter
ia?
Met
201
1 E
LA?
Met
201
1 M
ath?
Met
201
1 A
PI?
Met
201
1 G
radu
atio
n R
ate?
2011
ELA
Pro
ficie
nt R
ate
2010
-201
1 E
LA
P
rofic
ient
Rat
e C
hang
e
2002
-201
1 E
LA
P
rofic
ient
Rat
e C
hang
e
2011
MA
TH P
rofic
ient
Rat
e
2010
-201
1 M
ATH
Pro
ficie
nt R
ate
Cha
nge
2002
-201
1 M
ATH
Pro
ficie
nt R
ate
Cha
nge
2011
Gra
duat
ion
Rat
e
2010
Bas
e A
PI
2011
Gro
wth
AP
I
2010
-201
1 A
PI C
hang
e
2002
-201
1 A
PI C
hang
e
1999
-201
1 A
PI C
hang
e
Met
201
1 S
choo
lwid
e Ta
rget
?M
et 2
011
both
Sch
oolw
ide
and
CI T
arge
ts? 2011
Growth API
County Ranking
(N=76)
2010-11 API
Change County Ranking
(N=75)
2011 Growth
API State
Ranking (N=1325)
2010-11 API
Change State
Ranking (N=1302)
Academic Performance Index (API)Adequate Yearly Progress (AYP)
Palm Springs Unified Desert Springs Middle No No No Yes N/A 34.3 3.9 18.0 29.3 -1.8 16.1 658 677 19 107 153 Yes No 73 26 1204 351
Palm Springs Unified James Workman Middle No No No Yes N/A 57.0 1.3 27.9 52.2 -4.7 32.6 797 800 3 144 226 Yes No 32 53 561 812
Palm Springs Unified Nellie N. Coffman Middle No No No Yes N/A 39.4 -1.2 20.6 38.0 -3.4 19.6 733 721 -12 129 190 No No 62 69 1000 1142
Palm Springs Unified Raymond Cree Middle No No No Yes N/A 51.1 3.5 27.3 30.1 -3.3 5.3 744 749 5 121 185 Yes Yes 55 51 850 750
Palo Verde Unified Blythe Middle No No No No N/A 28.2 -1.5 13.4 18.6 -6.6 4.4 653 621 -32 65 37 No No 76 74 1294 1272
Perris Union High Pinacate Middle No No No No N/A 33.5 -3.2 22.0 19.3 -3.3 6.0 674 665 -9 122 138 No No 74 66 1228 1079
Riverside Unified Amelia Earhart Middle No No No Yes N/A 72.9 -5.0 27.7 66.5 3.7 43.7 890 872 -18 141 166 Yes Yes 4 71 203 1204
Riverside Unified Central Middle No No No Yes N/A 53.0 1.1 29.4 45.2 3.9 29.7 785 781 -4 170 257 No No 40 58 659 992
Riverside Unified Chemawa Middle No No No Yes N/A 52.8 -0.2 28.0 48.6 -0.2 28.2 796 798 2 165 217 No No 34 55 570 848
Riverside Unified Frank Augustus Miller Middle No No Yes Yes N/A 72.1 -1.0 . 57.3 8.3 . 849 863 14 . . Yes Yes 9 34 240 482
Riverside Unified Matthew Gage Middle No No No Yes N/A 62.6 5.0 22.6 48.6 -2.9 17.9 805 822 17 130 187 Yes Yes 25 30 448 391
Riverside Unified Sierra Middle No Yes No Yes N/A 49.9 6.6 28.1 46.0 12.4 22.8 721 775 54 164 226 Yes Yes 44 1 697 20
Riverside Unified University Heights Middle No No No Yes N/A 51.2 4.5 32.9 46.3 4.4 32.2 756 772 16 170 219 Yes Yes 46 32 711 427
Romoland Elementary Boulder Ridge Middle No No No Yes N/A 52.1 5.9 . 51.2 2.8 . 736 766 30 . . Yes No 49 13 747 166
San Jacinto Unified Monte Vista Middle No No No Yes N/A 45.6 8.9 32.8 50.3 8.6 36.2 714 764 50 169 236 Yes Yes 50 2 758 36
San Jacinto Unified North Mountain Middle No No No Yes N/A 40.4 0.6 23.9 49.2 8.5 39.7 713 720 7 165 176 Yes No 63 49 1005 683
Temecula Valley Unified Bella Vista Middle No No No Yes N/A 75.0 1.8 . 57.7 -1.7 . 854 862 8 . . Yes Yes 10 47 244 650
Temecula Valley Unified Erle Stanley Gardner Middle Yes Yes Yes Yes N/A 78.0 5.6 . 64.0 7.2 . 841 861 20 . . Yes Yes 11 24 247 333
Temecula Valley Unified James L. Day Middle No No No Yes N/A 69.3 -3.8 24.9 52.6 -2.4 2.5 849 843 -6 81 . Yes No 17 62 333 1035
Temecula Valley Unified Margarita Middle No No No Yes N/A 72.5 -5.0 24.6 64.4 -5.1 19.6 885 866 -19 102 137 Yes No 7 72 226 1209
Temecula Valley Unified Temecula Middle No No No Yes N/A 77.5 -1.9 25.4 69.5 -4.3 9.0 882 878 -4 77 127 Yes No 2 58 185 992
Temecula Valley Unified Vail Ranch Middle No No No Yes N/A 73.8 1.6 29.6 61.2 -0.7 19.3 857 868 11 109 129 Yes No 6 40 219 563
Val Verde Unified Lakeside Middle No No No Yes N/A 49.9 0.6 . 50.8 1.2 . 790 784 -6 . . No No 38 62 642 1035
Val Verde Unified March Middle No Yes No Yes N/A 48.1 8.1 . 53.6 0.6 . 753 777 24 . . Yes Yes 43 19 686 251
Val Verde Unified Tomas Rivera Middle No No No Yes N/A 43.7 5.3 33.3 56.6 0.2 44.9 764 778 14 241 279 Yes No 41 34 675 482
Page 35 of 52Prepared by Riverside County Office of Education
Assessment and Accountability Services08/30/2011
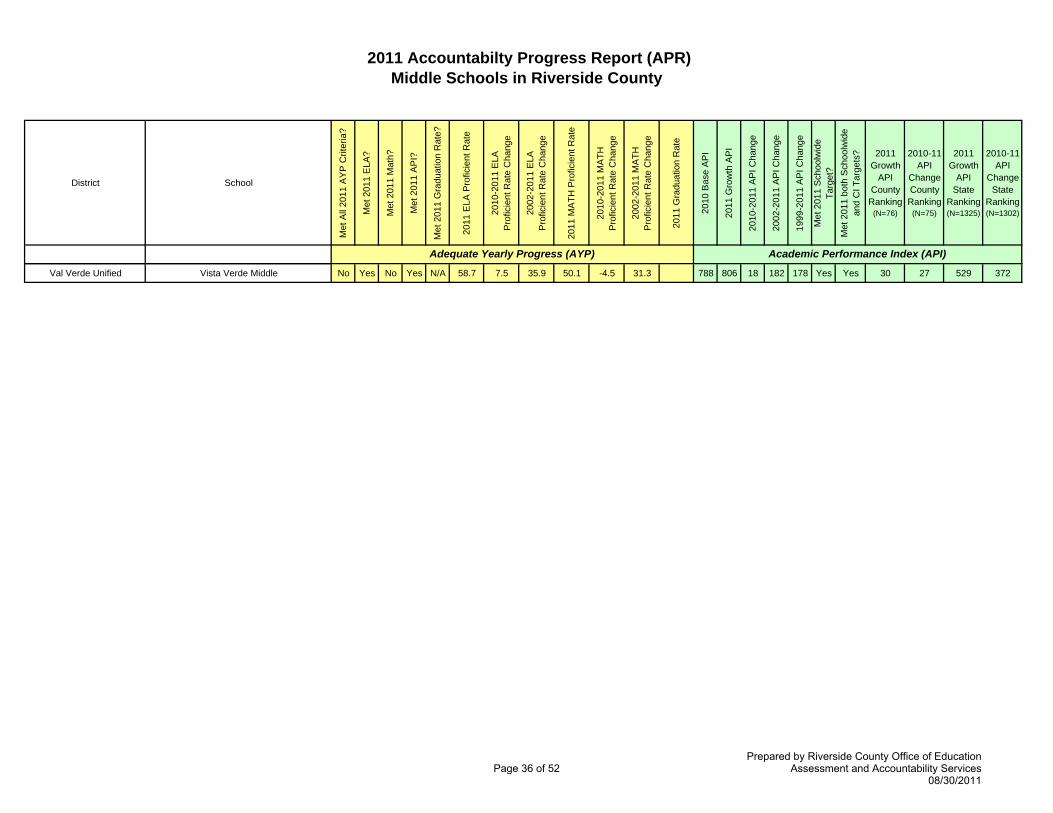
2011 Accountabilty Progress Report (APR)Middle Schools in Riverside County
District School
Met
All
2011
AY
P C
riter
ia?
Met
201
1 E
LA?
Met
201
1 M
ath?
Met
201
1 A
PI?
Met
201
1 G
radu
atio
n R
ate?
2011
ELA
Pro
ficie
nt R
ate
2010
-201
1 E
LA
P
rofic
ient
Rat
e C
hang
e
2002
-201
1 E
LA
P
rofic
ient
Rat
e C
hang
e
2011
MA
TH P
rofic
ient
Rat
e
2010
-201
1 M
ATH
Pro
ficie
nt R
ate
Cha
nge
2002
-201
1 M
ATH
Pro
ficie
nt R
ate
Cha
nge
2011
Gra
duat
ion
Rat
e
2010
Bas
e A
PI
2011
Gro
wth
AP
I
2010
-201
1 A
PI C
hang
e
2002
-201
1 A
PI C
hang
e
1999
-201
1 A
PI C
hang
e
Met
201
1 S
choo
lwid
e Ta
rget
?M
et 2
011
both
Sch
oolw
ide
and
CI T
arge
ts? 2011
Growth API
County Ranking
(N=76)
2010-11 API
Change County Ranking
(N=75)
2011 Growth
API State
Ranking (N=1325)
2010-11 API
Change State
Ranking (N=1302)
Academic Performance Index (API)Adequate Yearly Progress (AYP)
Val Verde Unified Vista Verde Middle No Yes No Yes N/A 58.7 7.5 35.9 50.1 -4.5 31.3 788 806 18 182 178 Yes Yes 30 27 529 372
Page 36 of 52Prepared by Riverside County Office of Education
Assessment and Accountability Services08/30/2011
List of Riverside County High Schools
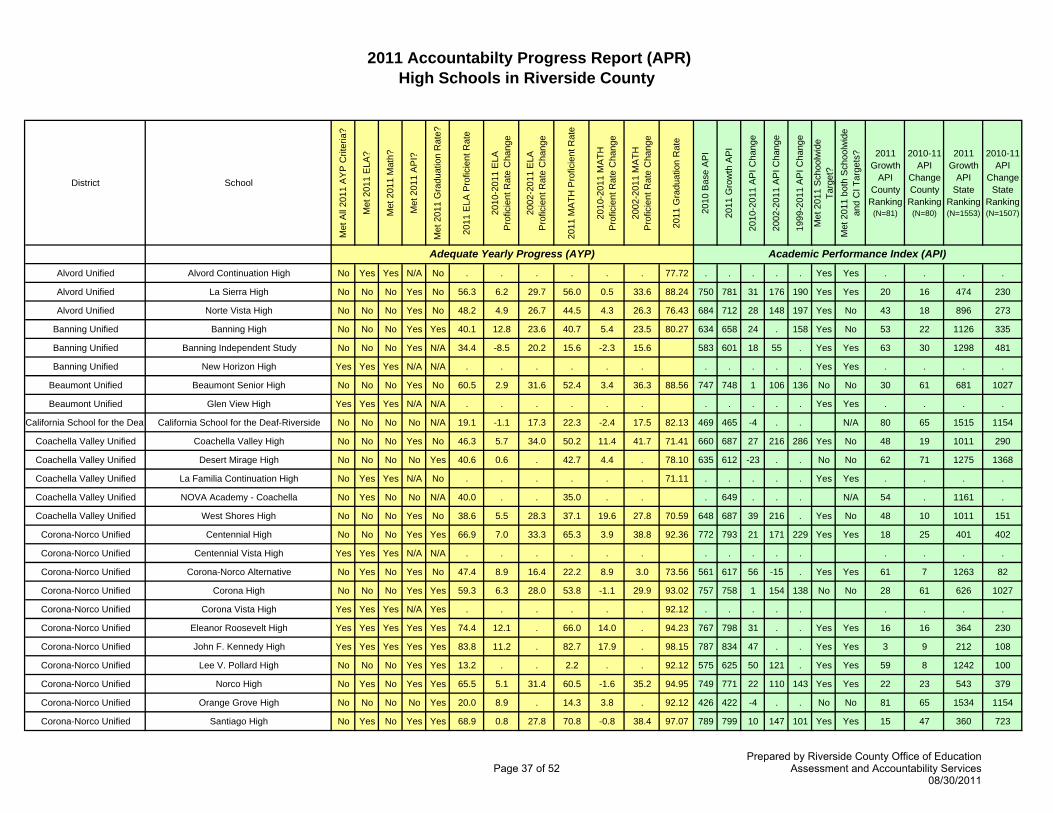
2011 Accountabilty Progress Report (APR)High Schools in Riverside County
District School
Met
All
2011
AY
P C
riter
ia?
Met
201
1 E
LA?
Met
201
1 M
ath?
Met
201
1 A
PI?
Met
201
1 G
radu
atio
n R
ate?
2011
ELA
Pro
ficie
nt R
ate
2010
-201
1 E
LA
P
rofic
ient
Rat
e C
hang
e
2002
-201
1 E
LA
P
rofic
ient
Rat
e C
hang
e
2011
MA
TH P
rofic
ient
Rat
e
2010
-201
1 M
ATH
Pro
ficie
nt R
ate
Cha
nge
2002
-201
1 M
ATH
Pro
ficie
nt R
ate
Cha
nge
2011
Gra
duat
ion
Rat
e
2010
Bas
e A
PI
2011
Gro
wth
AP
I
2010
-201
1 A
PI C
hang
e
2002
-201
1 A
PI C
hang
e
1999
-201
1 A
PI C
hang
e
Met
201
1 S
choo
lwid
e Ta
rget
?M
et 2
011
both
Sch
oolw
ide
and
CI T
arge
ts? 2011
Growth API
County Ranking
(N=81)
2010-11 API
Change County Ranking
(N=80)
2011 Growth
API State
Ranking (N=1553)
2010-11 API
Change State
Ranking (N=1507)
Alvord Unified Alvord Continuation High No Yes Yes N/A No . . . . . . 77.72 . . . . . Yes Yes . . . .
Alvord Unified La Sierra High No No No Yes No 56.3 6.2 29.7 56.0 0.5 33.6 88.24 750 781 31 176 190 Yes Yes 20 16 474 230
Alvord Unified Norte Vista High No No No Yes No 48.2 4.9 26.7 44.5 4.3 26.3 76.43 684 712 28 148 197 Yes No 43 18 896 273
Banning Unified Banning High No No No Yes Yes 40.1 12.8 23.6 40.7 5.4 23.5 80.27 634 658 24 . 158 Yes No 53 22 1126 335
Banning Unified Banning Independent Study No No No Yes N/A 34.4 -8.5 20.2 15.6 -2.3 15.6 583 601 18 55 . Yes Yes 63 30 1298 481
Banning Unified New Horizon High Yes Yes Yes N/A N/A . . . . . . . . . . . Yes Yes . . . .
Beaumont Unified Beaumont Senior High No No No Yes No 60.5 2.9 31.6 52.4 3.4 36.3 88.56 747 748 1 106 136 No No 30 61 681 1027
Beaumont Unified Glen View High Yes Yes Yes N/A N/A . . . . . . . . . . . Yes Yes . . . .
California School for the Deaf California School for the Deaf-Riverside No No No No N/A 19.1 -1.1 17.3 22.3 -2.4 17.5 82.13 469 465 -4 . . N/A 80 65 1515 1154
Coachella Valley Unified Coachella Valley High No No No Yes No 46.3 5.7 34.0 50.2 11.4 41.7 71.41 660 687 27 216 286 Yes No 48 19 1011 290
Coachella Valley Unified Desert Mirage High No No No No Yes 40.6 0.6 . 42.7 4.4 . 78.10 635 612 -23 . . No No 62 71 1275 1368
Coachella Valley Unified La Familia Continuation High No Yes Yes N/A No . . . . . . 71.11 . . . . . Yes Yes . . . .
Coachella Valley Unified NOVA Academy - Coachella No Yes No No N/A 40.0 . . 35.0 . . . 649 . . . N/A 54 . 1161 .
Coachella Valley Unified West Shores High No No No Yes No 38.6 5.5 28.3 37.1 19.6 27.8 70.59 648 687 39 216 . Yes No 48 10 1011 151
Corona-Norco Unified Centennial High No No No Yes Yes 66.9 7.0 33.3 65.3 3.9 38.8 92.36 772 793 21 171 229 Yes Yes 18 25 401 402
Corona-Norco Unified Centennial Vista High Yes Yes Yes N/A N/A . . . . . . . . . . . . . . .
Corona-Norco Unified Corona-Norco Alternative No Yes No Yes No 47.4 8.9 16.4 22.2 8.9 3.0 73.56 561 617 56 -15 . Yes Yes 61 7 1263 82
Corona-Norco Unified Corona High No No No Yes Yes 59.3 6.3 28.0 53.8 -1.1 29.9 93.02 757 758 1 154 138 No No 28 61 626 1027
Corona-Norco Unified Corona Vista High Yes Yes Yes N/A Yes . . . . . . 92.12 . . . . . . . . .
Corona-Norco Unified Eleanor Roosevelt High Yes Yes Yes Yes Yes 74.4 12.1 . 66.0 14.0 . 94.23 767 798 31 . . Yes Yes 16 16 364 230
Corona-Norco Unified John F. Kennedy High Yes Yes Yes Yes Yes 83.8 11.2 . 82.7 17.9 . 98.15 787 834 47 . . Yes Yes 3 9 212 108
Corona-Norco Unified Lee V. Pollard High No No No Yes Yes 13.2 . . 2.2 . . 92.12 575 625 50 121 . Yes Yes 59 8 1242 100
Corona-Norco Unified Norco High No Yes No Yes Yes 65.5 5.1 31.4 60.5 -1.6 35.2 94.95 749 771 22 110 143 Yes Yes 22 23 543 379
Corona-Norco Unified Orange Grove High No No No No Yes 20.0 8.9 . 14.3 3.8 . 92.12 426 422 -4 . . No No 81 65 1534 1154
Corona-Norco Unified Santiago High No Yes No Yes Yes 68.9 0.8 27.8 70.8 -0.8 38.4 97.07 789 799 10 147 101 Yes Yes 15 47 360 723
Academic Performance Index (API)Adequate Yearly Progress (AYP)
Page 37 of 52Prepared by Riverside County Office of Education
Assessment and Accountability Services08/30/2011
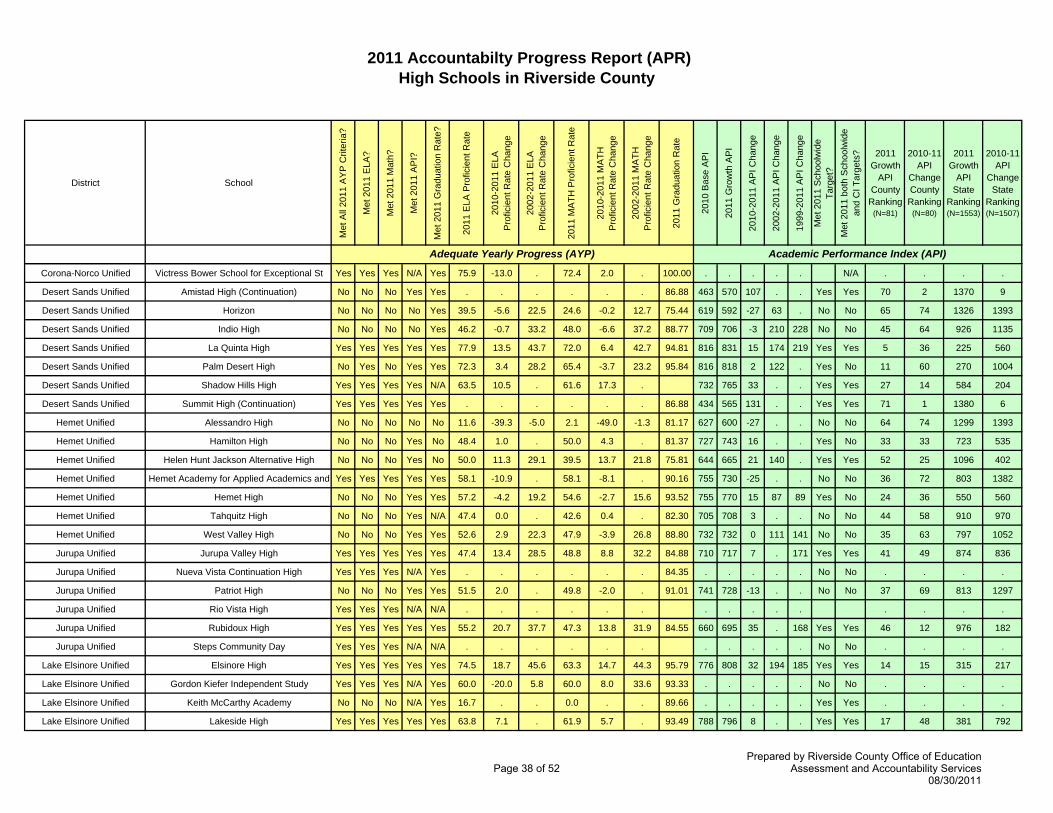
2011 Accountabilty Progress Report (APR)High Schools in Riverside County
District School
Met
All
2011
AY
P C
riter
ia?
Met
201
1 E
LA?
Met
201
1 M
ath?
Met
201
1 A
PI?
Met
201
1 G
radu
atio
n R
ate?
2011
ELA
Pro
ficie
nt R
ate
2010
-201
1 E
LA
P
rofic
ient
Rat
e C
hang
e
2002
-201
1 E
LA
P
rofic
ient
Rat
e C
hang
e
2011
MA
TH P
rofic
ient
Rat
e
2010
-201
1 M
ATH
Pro
ficie
nt R
ate
Cha
nge
2002
-201
1 M
ATH
Pro
ficie
nt R
ate
Cha
nge
2011
Gra
duat
ion
Rat
e
2010
Bas
e A
PI
2011
Gro
wth
AP
I
2010
-201
1 A
PI C
hang
e
2002
-201
1 A
PI C
hang
e
1999
-201
1 A
PI C
hang
e
Met
201
1 S
choo
lwid
e Ta
rget
?M
et 2
011
both
Sch
oolw
ide
and
CI T
arge
ts? 2011
Growth API
County Ranking
(N=81)
2010-11 API
Change County Ranking
(N=80)
2011 Growth
API State
Ranking (N=1553)
2010-11 API
Change State
Ranking (N=1507)
Academic Performance Index (API)Adequate Yearly Progress (AYP)
Corona-Norco Unified Victress Bower School for Exceptional St Yes Yes Yes N/A Yes 75.9 -13.0 . 72.4 2.0 . 100.00 . . . . . N/A . . . .
Desert Sands Unified Amistad High (Continuation) No No No Yes Yes . . . . . . 86.88 463 570 107 . . Yes Yes 70 2 1370 9
Desert Sands Unified Horizon No No No No Yes 39.5 -5.6 22.5 24.6 -0.2 12.7 75.44 619 592 -27 63 . No No 65 74 1326 1393
Desert Sands Unified Indio High No No No No Yes 46.2 -0.7 33.2 48.0 -6.6 37.2 88.77 709 706 -3 210 228 No No 45 64 926 1135
Desert Sands Unified La Quinta High Yes Yes Yes Yes Yes 77.9 13.5 43.7 72.0 6.4 42.7 94.81 816 831 15 174 219 Yes Yes 5 36 225 560
Desert Sands Unified Palm Desert High No Yes No Yes Yes 72.3 3.4 28.2 65.4 -3.7 23.2 95.84 816 818 2 122 . Yes No 11 60 270 1004
Desert Sands Unified Shadow Hills High Yes Yes Yes Yes N/A 63.5 10.5 . 61.6 17.3 . 732 765 33 . . Yes Yes 27 14 584 204
Desert Sands Unified Summit High (Continuation) Yes Yes Yes Yes Yes . . . . . . 86.88 434 565 131 . . Yes Yes 71 1 1380 6
Hemet Unified Alessandro High No No No No No 11.6 -39.3 -5.0 2.1 -49.0 -1.3 81.17 627 600 -27 . . No No 64 74 1299 1393
Hemet Unified Hamilton High No No No Yes No 48.4 1.0 . 50.0 4.3 . 81.37 727 743 16 . . Yes No 33 33 723 535
Hemet Unified Helen Hunt Jackson Alternative High No No No Yes No 50.0 11.3 29.1 39.5 13.7 21.8 75.81 644 665 21 140 . Yes Yes 52 25 1096 402
Hemet Unified Hemet Academy for Applied Academics and Yes Yes Yes Yes Yes 58.1 -10.9 . 58.1 -8.1 . 90.16 755 730 -25 . . No No 36 72 803 1382
Hemet Unified Hemet High No No No Yes Yes 57.2 -4.2 19.2 54.6 -2.7 15.6 93.52 755 770 15 87 89 Yes No 24 36 550 560
Hemet Unified Tahquitz High No No No Yes N/A 47.4 0.0 . 42.6 0.4 . 82.30 705 708 3 . . No No 44 58 910 970
Hemet Unified West Valley High No No No Yes Yes 52.6 2.9 22.3 47.9 -3.9 26.8 88.80 732 732 0 111 141 No No 35 63 797 1052
Jurupa Unified Jurupa Valley High Yes Yes Yes Yes Yes 47.4 13.4 28.5 48.8 8.8 32.2 84.88 710 717 7 . 171 Yes Yes 41 49 874 836
Jurupa Unified Nueva Vista Continuation High Yes Yes Yes N/A Yes . . . . . . 84.35 . . . . . No No . . . .
Jurupa Unified Patriot High No No No Yes Yes 51.5 2.0 . 49.8 -2.0 . 91.01 741 728 -13 . . No No 37 69 813 1297
Jurupa Unified Rio Vista High Yes Yes Yes N/A N/A . . . . . . . . . . . . . . .
Jurupa Unified Rubidoux High Yes Yes Yes Yes Yes 55.2 20.7 37.7 47.3 13.8 31.9 84.55 660 695 35 . 168 Yes Yes 46 12 976 182
Jurupa Unified Steps Community Day Yes Yes Yes N/A N/A . . . . . . . . . . . No No . . . .
Lake Elsinore Unified Elsinore High Yes Yes Yes Yes Yes 74.5 18.7 45.6 63.3 14.7 44.3 95.79 776 808 32 194 185 Yes Yes 14 15 315 217
Lake Elsinore Unified Gordon Kiefer Independent Study Yes Yes Yes N/A Yes 60.0 -20.0 5.8 60.0 8.0 33.6 93.33 . . . . . No No . . . .
Lake Elsinore Unified Keith McCarthy Academy No No No N/A Yes 16.7 . . 0.0 . . 89.66 . . . . . Yes Yes . . . .
Lake Elsinore Unified Lakeside High Yes Yes Yes Yes Yes 63.8 7.1 . 61.9 5.7 . 93.49 788 796 8 . . Yes Yes 17 48 381 792
Page 38 of 52Prepared by Riverside County Office of Education
Assessment and Accountability Services08/30/2011

2011 Accountabilty Progress Report (APR)High Schools in Riverside County
District School
Met
All
2011
AY
P C
riter
ia?
Met
201
1 E
LA?
Met
201
1 M
ath?
Met
201
1 A
PI?
Met
201
1 G
radu
atio
n R
ate?
2011
ELA
Pro
ficie
nt R
ate
2010
-201
1 E
LA
P
rofic
ient
Rat
e C
hang
e
2002
-201
1 E
LA
P
rofic
ient
Rat
e C
hang
e
2011
MA
TH P
rofic
ient
Rat
e
2010
-201
1 M
ATH
Pro
ficie
nt R
ate
Cha
nge
2002
-201
1 M
ATH
Pro
ficie
nt R
ate
Cha
nge
2011
Gra
duat
ion
Rat
e
2010
Bas
e A
PI
2011
Gro
wth
AP
I
2010
-201
1 A
PI C
hang
e
2002
-201
1 A
PI C
hang
e
1999
-201
1 A
PI C
hang
e
Met
201
1 S
choo
lwid
e Ta
rget
?M
et 2
011
both
Sch
oolw
ide
and
CI T
arge
ts? 2011
Growth API
County Ranking
(N=81)
2010-11 API
Change County Ranking
(N=80)
2011 Growth
API State
Ranking (N=1553)
2010-11 API
Change State
Ranking (N=1507)
Academic Performance Index (API)Adequate Yearly Progress (AYP)
Lake Elsinore Unified Ortega High No Yes No N/A Yes . . . . . . 93.67 . . . . . No No . . . .
Lake Elsinore Unified Temescal Canyon High No Yes No Yes Yes 64.8 4.1 32.7 58.8 -8.0 28.7 95.23 782 785 3 145 156 No No 19 58 446 970
Lake Elsinore Unified Tri-Valley Community Day Yes Yes Yes N/A Yes . . . . . . 93.67 . . . . . N/A . . . .
Moreno Valley Unified Alessandro Yes Yes Yes N/A N/A 28.1 5.4 . 21.9 8.9 . . . . . . N/A . . . .
Moreno Valley Unified Bayside Community Day No No No No Yes . . . . . . 76.03 550 525 -25 . . No No 75 72 1446 1382
Moreno Valley Unified Canyon Springs High No No No Yes Yes 49.9 -2.1 18.9 46.6 1.0 21.1 84.27 694 713 19 95 94 Yes No 42 28 891 460
Moreno Valley Unified March Mountain High No No Yes Yes Yes 0.0 -10.5 -5.5 7.7 7.7 7.7 76.03 498 558 60 . . Yes Yes 72 6 1391 64
Moreno Valley Unified March Valley No No No Yes N/A 24.0 7.9 8.0 12.0 5.7 -2.0 506 571 65 84 . Yes Yes 69 5 1366 51
Moreno Valley Unified Moreno Valley Community Learning Center No No No N/A N/A 12.0 5.3 . 0.0 0.0 -9.0 . . . . . No No . . . .
Moreno Valley Unified Moreno Valley High No No No Yes Yes 37.1 2.1 21.0 37.9 0.9 23.5 74.51 655 671 16 . 155 Yes No 51 33 1076 535
Moreno Valley Unified Valley View High No No No Yes Yes 51.6 4.0 19.8 46.8 5.2 21.8 81.32 701 721 20 113 142 Yes No 39 27 851 434
Moreno Valley Unified Vista del Lago High No No No Yes Yes 41.8 3.6 . 36.6 2.4 . 75.46 640 646 6 . . No No 56 54 1174 872
Murrieta Valley Unified Creekside High No Yes No N/A No . . . . . . 88.82 . . . . . No No . . . .
Murrieta Valley Unified Murrieta Mesa High No Yes No Yes N/A 75.5 8.9 . 69.8 -0.8 . 819 812 -7 . . Yes No 12 67 293 1210
Murrieta Valley Unified Murrieta Valley High Yes Yes Yes Yes Yes 77.6 6.3 27.0 66.6 -3.2 21.5 93.97 823 834 11 136 131 Yes No 3 43 212 686
Murrieta Valley Unified Tenaja Canyon Academy Yes Yes Yes N/A N/A 70.0 17.6 . 35.0 8.7 . . . . . . Yes Yes . . . .
Murrieta Valley Unified Vista Murrieta High No No No Yes Yes 68.6 -1.0 . 61.2 -9.7 . 94.30 819 825 6 . . Yes No 7 54 242 872
Nuview Union Nuview Bridge Early College High Yes Yes Yes Yes Yes 83.9 7.4 . 81.5 11.1 . 100.00 830 848 18 359 . Yes Yes 2 30 173 481
Palm Springs Unified Cathedral City High No Yes No Yes Yes 50.6 3.7 22.7 45.2 2.9 23.8 92.52 688 722 34 139 200 Yes No 38 13 846 191
Palm Springs Unified Desert Hot Springs High No No No Yes Yes 41.1 3.9 20.6 31.9 -1.2 14.7 84.24 656 683 27 122 . Yes No 50 19 1026 290
Palm Springs Unified Mt. San Jacinto High No Yes Yes No Yes . . . . . . 86.99 586 515 -71 . . No No 76 78 1467 1473
Palm Springs Unified Palm Springs High No No No Yes Yes 59.4 2.5 22.6 58.3 -2.2 34.9 93.81 750 767 17 175 225 Yes No 25 32 574 503
Palm Springs Unified Ramon Alternative Center No No No N/A N/A 7.4 . 7.4 4.2 . 4.2 . . . . . Yes Yes . . . .
Palo Verde Unified Palo Verde High No No No Yes No 47.3 17.6 21.0 47.6 12.1 22.6 81.72 634 647 13 62 103 Yes No 55 40 1171 624
Palo Verde Unified Palo Verde Valley Community Day No No No N/A N/A 0.0 -6.2 . 0.0 -6.2 . . . . . . No No . . . .
Page 39 of 52Prepared by Riverside County Office of Education
Assessment and Accountability Services08/30/2011
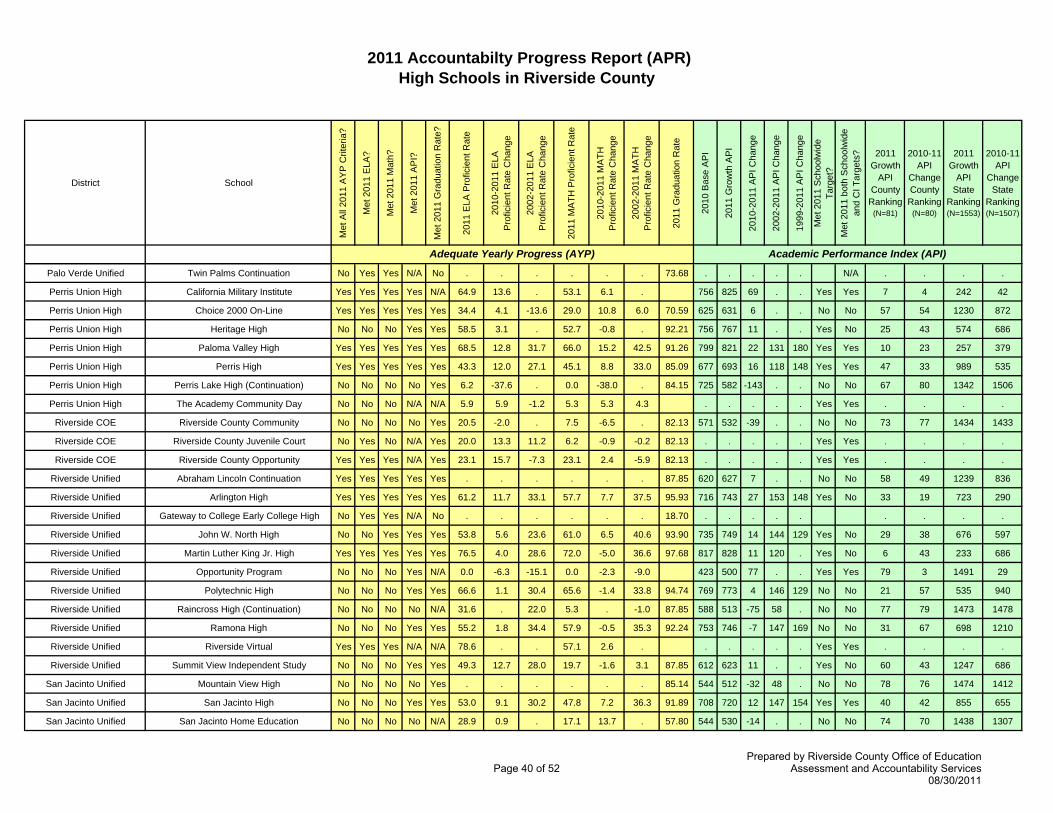
2011 Accountabilty Progress Report (APR)High Schools in Riverside County
District School
Met
All
2011
AY
P C
riter
ia?
Met
201
1 E
LA?
Met
201
1 M
ath?
Met
201
1 A
PI?
Met
201
1 G
radu
atio
n R
ate?
2011
ELA
Pro
ficie
nt R
ate
2010
-201
1 E
LA
P
rofic
ient
Rat
e C
hang
e
2002
-201
1 E
LA
P
rofic
ient
Rat
e C
hang
e
2011
MA
TH P
rofic
ient
Rat
e
2010
-201
1 M
ATH
Pro
ficie
nt R
ate
Cha
nge
2002
-201
1 M
ATH
Pro
ficie
nt R
ate
Cha
nge
2011
Gra
duat
ion
Rat
e
2010
Bas
e A
PI
2011
Gro
wth
AP
I
2010
-201
1 A
PI C
hang
e
2002
-201
1 A
PI C
hang
e
1999
-201
1 A
PI C
hang
e
Met
201
1 S
choo
lwid
e Ta
rget
?M
et 2
011
both
Sch
oolw
ide
and
CI T
arge
ts? 2011
Growth API
County Ranking
(N=81)
2010-11 API
Change County Ranking
(N=80)
2011 Growth
API State
Ranking (N=1553)
2010-11 API
Change State
Ranking (N=1507)
Academic Performance Index (API)Adequate Yearly Progress (AYP)
Palo Verde Unified Twin Palms Continuation No Yes Yes N/A No . . . . . . 73.68 . . . . . N/A . . . .
Perris Union High California Military Institute Yes Yes Yes Yes N/A 64.9 13.6 . 53.1 6.1 . 756 825 69 . . Yes Yes 7 4 242 42
Perris Union High Choice 2000 On-Line Yes Yes Yes Yes Yes 34.4 4.1 -13.6 29.0 10.8 6.0 70.59 625 631 6 . . No No 57 54 1230 872
Perris Union High Heritage High No No No Yes Yes 58.5 3.1 . 52.7 -0.8 . 92.21 756 767 11 . . Yes No 25 43 574 686
Perris Union High Paloma Valley High Yes Yes Yes Yes Yes 68.5 12.8 31.7 66.0 15.2 42.5 91.26 799 821 22 131 180 Yes Yes 10 23 257 379
Perris Union High Perris High Yes Yes Yes Yes Yes 43.3 12.0 27.1 45.1 8.8 33.0 85.09 677 693 16 118 148 Yes Yes 47 33 989 535
Perris Union High Perris Lake High (Continuation) No No No No Yes 6.2 -37.6 . 0.0 -38.0 . 84.15 725 582 -143 . . No No 67 80 1342 1506
Perris Union High The Academy Community Day No No No N/A N/A 5.9 5.9 -1.2 5.3 5.3 4.3 . . . . . Yes Yes . . . .
Riverside COE Riverside County Community No No No No Yes 20.5 -2.0 . 7.5 -6.5 . 82.13 571 532 -39 . . No No 73 77 1434 1433
Riverside COE Riverside County Juvenile Court No Yes No N/A Yes 20.0 13.3 11.2 6.2 -0.9 -0.2 82.13 . . . . . Yes Yes . . . .
Riverside COE Riverside County Opportunity Yes Yes Yes N/A Yes 23.1 15.7 -7.3 23.1 2.4 -5.9 82.13 . . . . . Yes Yes . . . .
Riverside Unified Abraham Lincoln Continuation Yes Yes Yes Yes Yes . . . . . . 87.85 620 627 7 . . No No 58 49 1239 836
Riverside Unified Arlington High Yes Yes Yes Yes Yes 61.2 11.7 33.1 57.7 7.7 37.5 95.93 716 743 27 153 148 Yes No 33 19 723 290
Riverside Unified Gateway to College Early College High No Yes Yes N/A No . . . . . . 18.70 . . . . . . . . .
Riverside Unified John W. North High No No Yes Yes Yes 53.8 5.6 23.6 61.0 6.5 40.6 93.90 735 749 14 144 129 Yes No 29 38 676 597
Riverside Unified Martin Luther King Jr. High Yes Yes Yes Yes Yes 76.5 4.0 28.6 72.0 -5.0 36.6 97.68 817 828 11 120 . Yes No 6 43 233 686
Riverside Unified Opportunity Program No No No Yes N/A 0.0 -6.3 -15.1 0.0 -2.3 -9.0 423 500 77 . . Yes Yes 79 3 1491 29
Riverside Unified Polytechnic High No No No Yes Yes 66.6 1.1 30.4 65.6 -1.4 33.8 94.74 769 773 4 146 129 No No 21 57 535 940
Riverside Unified Raincross High (Continuation) No No No No N/A 31.6 . 22.0 5.3 . -1.0 87.85 588 513 -75 58 . No No 77 79 1473 1478
Riverside Unified Ramona High No No No Yes Yes 55.2 1.8 34.4 57.9 -0.5 35.3 92.24 753 746 -7 147 169 No No 31 67 698 1210
Riverside Unified Riverside Virtual Yes Yes Yes N/A N/A 78.6 . . 57.1 2.6 . . . . . . Yes Yes . . . .
Riverside Unified Summit View Independent Study No No No Yes Yes 49.3 12.7 28.0 19.7 -1.6 3.1 87.85 612 623 11 . . Yes No 60 43 1247 686
San Jacinto Unified Mountain View High No No No No Yes . . . . . . 85.14 544 512 -32 48 . No No 78 76 1474 1412
San Jacinto Unified San Jacinto High No No No Yes Yes 53.0 9.1 30.2 47.8 7.2 36.3 91.89 708 720 12 147 154 Yes Yes 40 42 855 655
San Jacinto Unified San Jacinto Home Education No No No No N/A 28.9 0.9 . 17.1 13.7 . 57.80 544 530 -14 . . No No 74 70 1438 1307
Page 40 of 52Prepared by Riverside County Office of Education
Assessment and Accountability Services08/30/2011
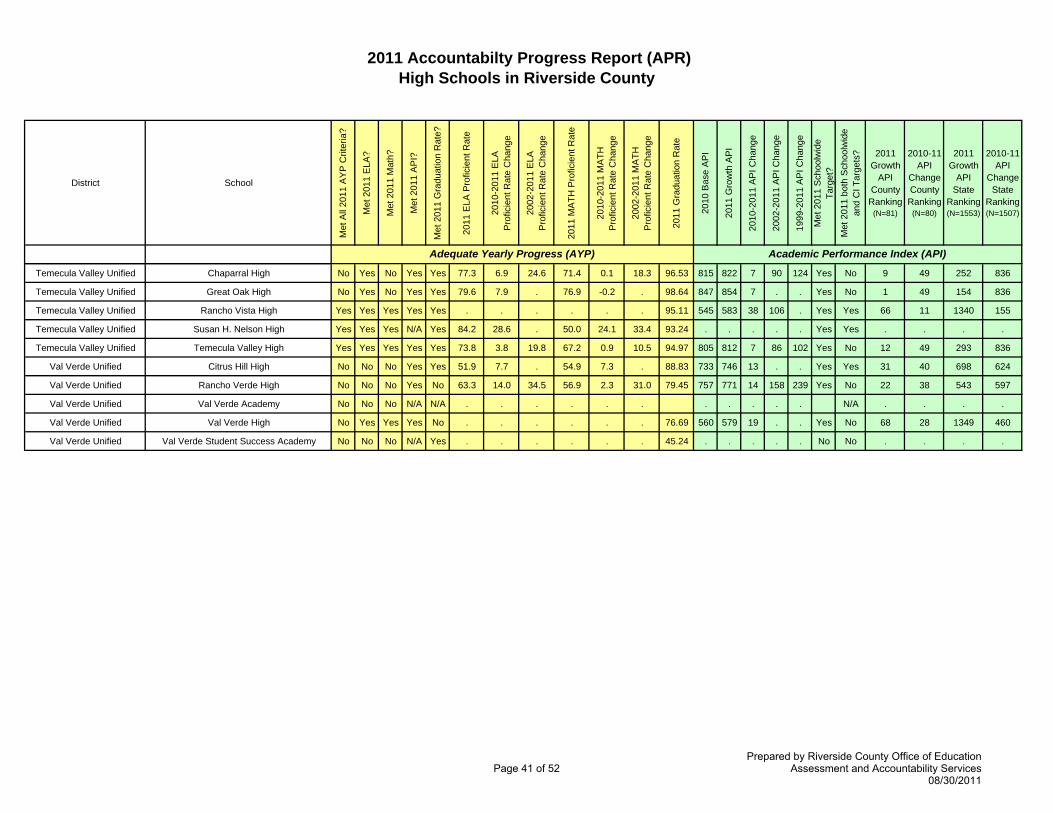
2011 Accountabilty Progress Report (APR)High Schools in Riverside County
District School
Met
All
2011
AY
P C
riter
ia?
Met
201
1 E
LA?
Met
201
1 M
ath?
Met
201
1 A
PI?
Met
201
1 G
radu
atio
n R
ate?
2011
ELA
Pro
ficie
nt R
ate
2010
-201
1 E
LA
P
rofic
ient
Rat
e C
hang
e
2002
-201
1 E
LA
P
rofic
ient
Rat
e C
hang
e
2011
MA
TH P
rofic
ient
Rat
e
2010
-201
1 M
ATH
Pro
ficie
nt R
ate
Cha
nge
2002
-201
1 M
ATH
Pro
ficie
nt R
ate
Cha
nge
2011
Gra
duat
ion
Rat
e
2010
Bas
e A
PI
2011
Gro
wth
AP
I
2010
-201
1 A
PI C
hang
e
2002
-201
1 A
PI C
hang
e
1999
-201
1 A
PI C
hang
e
Met
201
1 S
choo
lwid
e Ta
rget
?M
et 2
011
both
Sch
oolw
ide
and
CI T
arge
ts? 2011
Growth API
County Ranking
(N=81)
2010-11 API
Change County Ranking
(N=80)
2011 Growth
API State
Ranking (N=1553)
2010-11 API
Change State
Ranking (N=1507)
Academic Performance Index (API)Adequate Yearly Progress (AYP)
Temecula Valley Unified Chaparral High No Yes No Yes Yes 77.3 6.9 24.6 71.4 0.1 18.3 96.53 815 822 7 90 124 Yes No 9 49 252 836
Temecula Valley Unified Great Oak High No Yes No Yes Yes 79.6 7.9 . 76.9 -0.2 . 98.64 847 854 7 . . Yes No 1 49 154 836
Temecula Valley Unified Rancho Vista High Yes Yes Yes Yes Yes . . . . . . 95.11 545 583 38 106 . Yes Yes 66 11 1340 155
Temecula Valley Unified Susan H. Nelson High Yes Yes Yes N/A Yes 84.2 28.6 . 50.0 24.1 33.4 93.24 . . . . . Yes Yes . . . .
Temecula Valley Unified Temecula Valley High Yes Yes Yes Yes Yes 73.8 3.8 19.8 67.2 0.9 10.5 94.97 805 812 7 86 102 Yes No 12 49 293 836
Val Verde Unified Citrus Hill High No No No Yes Yes 51.9 7.7 . 54.9 7.3 . 88.83 733 746 13 . . Yes Yes 31 40 698 624
Val Verde Unified Rancho Verde High No No No Yes No 63.3 14.0 34.5 56.9 2.3 31.0 79.45 757 771 14 158 239 Yes No 22 38 543 597
Val Verde Unified Val Verde Academy No No No N/A N/A . . . . . . . . . . . N/A . . . .
Val Verde Unified Val Verde High No Yes Yes Yes No . . . . . . 76.69 560 579 19 . . Yes No 68 28 1349 460
Val Verde Unified Val Verde Student Success Academy No No No N/A Yes . . . . . . 45.24 . . . . . No No . . . .
Page 41 of 52Prepared by Riverside County Office of Education
Assessment and Accountability Services08/30/2011
Program Improvement (PI)
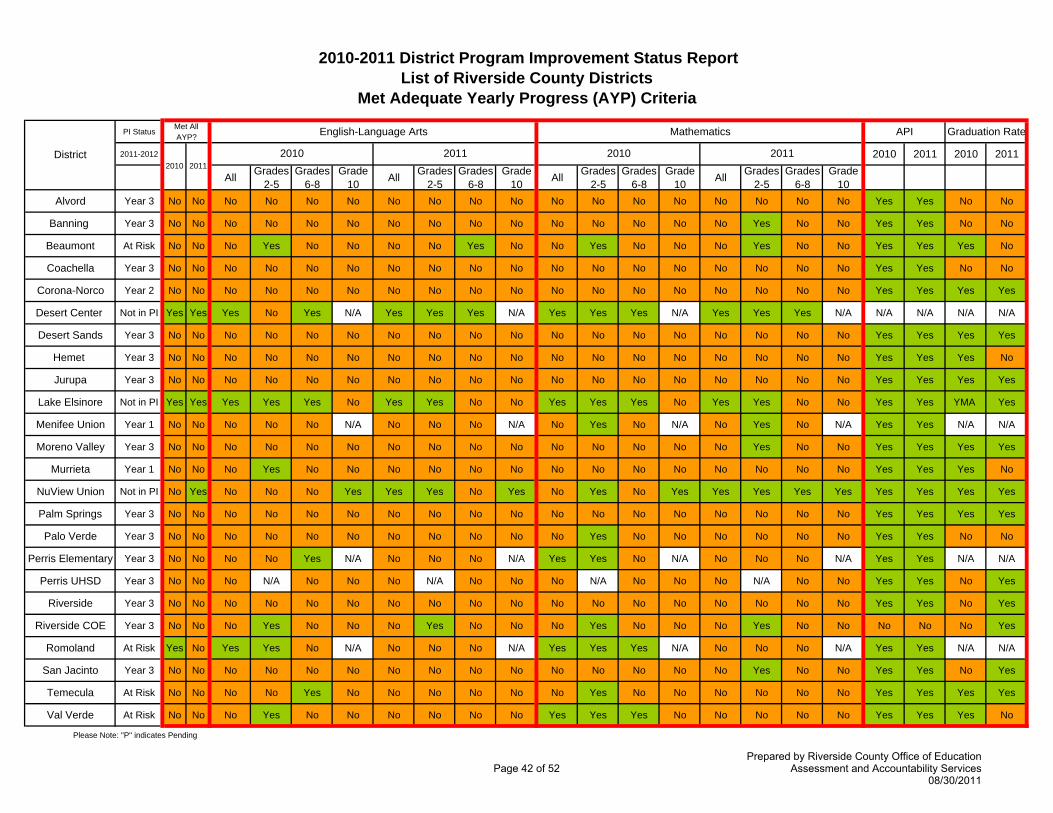
2010-2011 District Program Improvement Status Report List of Riverside County Districts
Met Adequate Yearly Progress (AYP) Criteria
PI Status
2011-2012 2010 2011 2010 2011
All Grades 2-5
Grades 6-8
Grade 10 All Grades
2-5Grades
6-8Grade
10 All Grades 2-5
Grades 6-8
Grade 10 All Grades
2-5Grades
6-8Grade
10Alvord Year 3 No No No No No No No No No No No No No No No No No No Yes Yes No No
Banning Year 3 No No No No No No No No No No No No No No No Yes No No Yes Yes No No
Beaumont At Risk No No No Yes No No No No Yes No No Yes No No No Yes No No Yes Yes Yes No
Coachella Year 3 No No No No No No No No No No No No No No No No No No Yes Yes No No
Corona-Norco Year 2 No No No No No No No No No No No No No No No No No No Yes Yes Yes Yes
Desert Center Not in PI Yes Yes Yes No Yes N/A Yes Yes Yes N/A Yes Yes Yes N/A Yes Yes Yes N/A N/A N/A N/A N/A
Desert Sands Year 3 No No No No No No No No No No No No No No No No No No Yes Yes Yes Yes
Hemet Year 3 No No No No No No No No No No No No No No No No No No Yes Yes Yes No
Jurupa Year 3 No No No No No No No No No No No No No No No No No No Yes Yes Yes Yes
Lake Elsinore Not in PI Yes Yes Yes Yes Yes No Yes Yes No No Yes Yes Yes No Yes Yes No No Yes Yes YMA Yes
Menifee Union Year 1 No No No No No N/A No No No N/A No Yes No N/A No Yes No N/A Yes Yes N/A N/A
Moreno Valley Year 3 No No No No No No No No No No No No No No No Yes No No Yes Yes Yes Yes
Murrieta Year 1 No No No Yes No No No No No No No No No No No No No No Yes Yes Yes No
NuView Union Not in PI No Yes No No No Yes Yes Yes No Yes No Yes No Yes Yes Yes Yes Yes Yes Yes Yes Yes
Palm Springs Year 3 No No No No No No No No No No No No No No No No No No Yes Yes Yes Yes
Palo Verde Year 3 No No No No No No No No No No No Yes No No No No No No Yes Yes No No
Perris Elementary Year 3 No No No No Yes N/A No No No N/A Yes Yes No N/A No No No N/A Yes Yes N/A N/A
Perris UHSD Year 3 No No No N/A No No No N/A No No No N/A No No No N/A No No Yes Yes No Yes
Riverside Year 3 No No No No No No No No No No No No No No No No No No Yes Yes No Yes
Riverside COE Year 3 No No No Yes No No No Yes No No No Yes No No No Yes No No No No No Yes
Romoland At Risk Yes No Yes Yes No N/A No No No N/A Yes Yes Yes N/A No No No N/A Yes Yes N/A N/A
San Jacinto Year 3 No No No No No No No No No No No No No No No Yes No No Yes Yes No Yes
Temecula At Risk No No No No Yes No No No No No No Yes No No No No No No Yes Yes Yes Yes
Val Verde At Risk No No No Yes No No No No No No Yes Yes Yes No No No No No Yes Yes Yes No
2010 2011District
APIMet All AYP? Graduation RateEnglish-Language Arts
2010 2011
Mathematics
2010 2011
Please Note: "P" indicates Pending
Page 42 of 52Prepared by Riverside County Office of Education
Assessment and Accountability Services08/30/2011
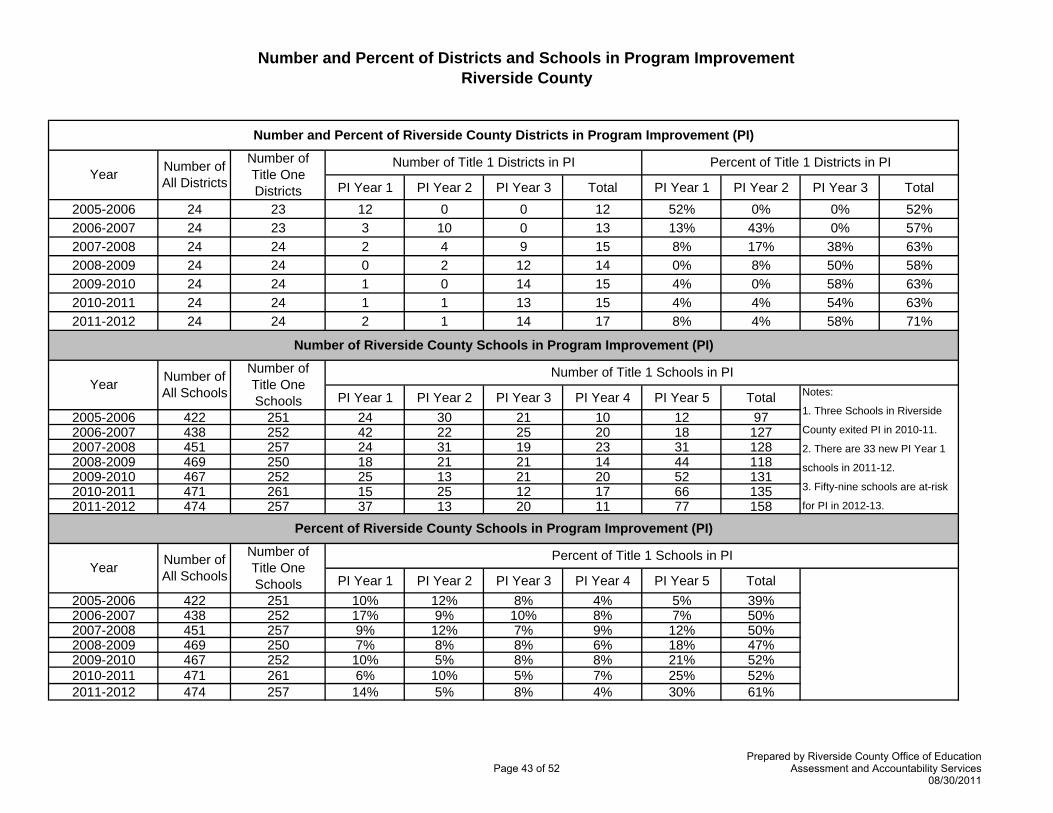
Number and Percent of Districts and Schools in Program ImprovementRiverside County
PI Year 1 PI Year 2 PI Year 3 Total PI Year 1 PI Year 2 PI Year 3 Total2005-2006 24 23 12 0 0 12 52% 0% 0% 52%2006-2007 24 23 3 10 0 13 13% 43% 0% 57%2007-2008 24 24 2 4 9 15 8% 17% 38% 63%2008-2009 24 24 0 2 12 14 0% 8% 50% 58%2009-2010 24 24 1 0 14 15 4% 0% 58% 63%2010-2011 24 24 1 1 13 15 4% 4% 54% 63%2011-2012 24 24 2 1 14 17 8% 4% 58% 71%
PI Year 1 PI Year 2 PI Year 3 PI Year 4 PI Year 5 Total2005-2006 422 251 24 30 21 10 12 972006-2007 438 252 42 22 25 20 18 1272007-2008 451 257 24 31 19 23 31 1282008-2009 469 250 18 21 21 14 44 1182009-2010 467 252 25 13 21 20 52 1312010-2011 471 261 15 25 12 17 66 1352011-2012 474 257 37 13 20 11 77 158
PI Year 1 PI Year 2 PI Year 3 PI Year 4 PI Year 5 Total2005-2006 422 251 10% 12% 8% 4% 5% 39%2006-2007 438 252 17% 9% 10% 8% 7% 50%2007-2008 451 257 9% 12% 7% 9% 12% 50%2008-2009 469 250 7% 8% 8% 6% 18% 47%2009-2010 467 252 10% 5% 8% 8% 21% 52%2010-2011 471 261 6% 10% 5% 7% 25% 52%2011-2012 474 257 14% 5% 8% 4% 30% 61%
Percent of Riverside County Schools in Program Improvement (PI)
Percent of Title 1 Schools in PIYear Number of
All Schools
Number of Title One Schools
Year Number of All Schools
Number of Title One Schools
Number of Riverside County Schools in Program Improvement (PI)
Number of Title 1 Schools in PINotes:
1. Three Schools in Riverside
County exited PI in 2010-11.
2. There are 33 new PI Year 1
schools in 2011-12.
3. Fifty-nine schools are at-risk
for PI in 2012-13.
Number and Percent of Riverside County Districts in Program Improvement (PI)
Number of Title 1 Districts in PI Percent of Title 1 Districts in PIYear Number of
All Districts
Number of Title One Districts
Page 43 of 52Prepared by Riverside County Office of Education
Assessment and Accountability Services08/30/2011
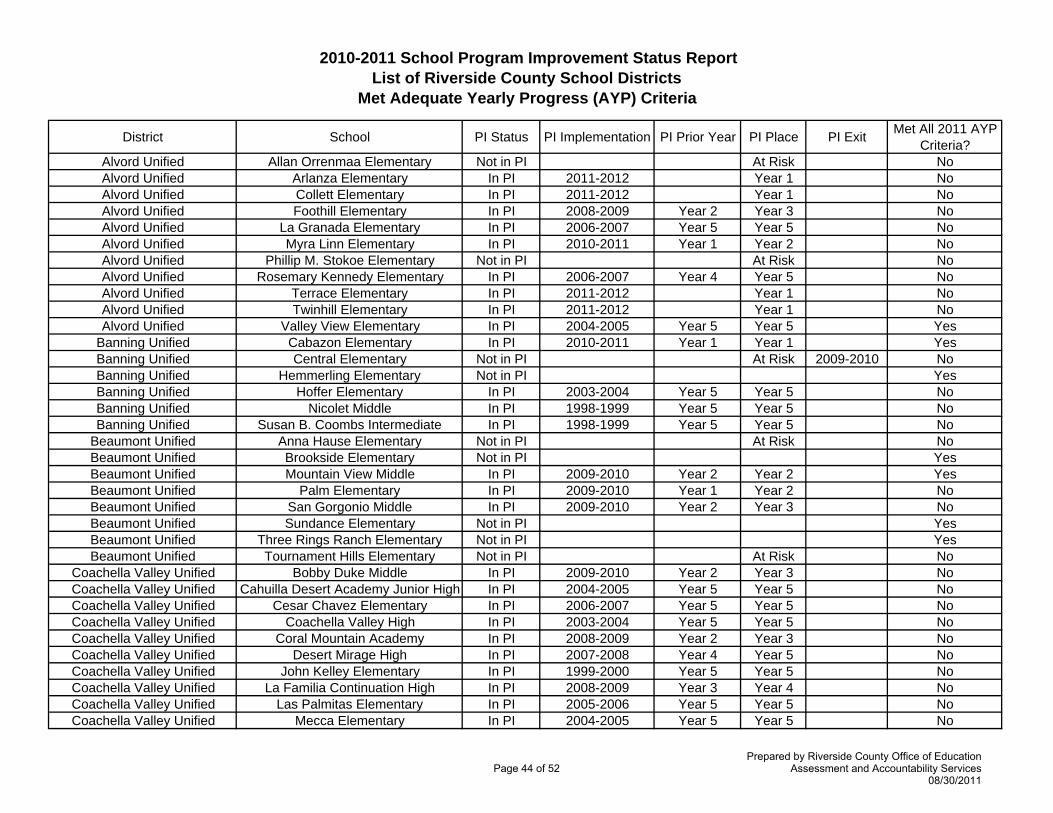
2010-2011 School Program Improvement Status Report List of Riverside County School Districts
Met Adequate Yearly Progress (AYP) Criteria
District School PI Status PI Implementation PI Prior Year PI Place PI Exit Met All 2011 AYP Criteria?
Alvord Unified Allan Orrenmaa Elementary Not in PI At Risk NoAlvord Unified Arlanza Elementary In PI 2011-2012 Year 1 NoAlvord Unified Collett Elementary In PI 2011-2012 Year 1 NoAlvord Unified Foothill Elementary In PI 2008-2009 Year 2 Year 3 NoAlvord Unified La Granada Elementary In PI 2006-2007 Year 5 Year 5 NoAlvord Unified Myra Linn Elementary In PI 2010-2011 Year 1 Year 2 NoAlvord Unified Phillip M. Stokoe Elementary Not in PI At Risk NoAlvord Unified Rosemary Kennedy Elementary In PI 2006-2007 Year 4 Year 5 NoAlvord Unified Terrace Elementary In PI 2011-2012 Year 1 NoAlvord Unified Twinhill Elementary In PI 2011-2012 Year 1 NoAlvord Unified Valley View Elementary In PI 2004-2005 Year 5 Year 5 Yes
Banning Unified Cabazon Elementary In PI 2010-2011 Year 1 Year 1 YesBanning Unified Central Elementary Not in PI At Risk 2009-2010 NoBanning Unified Hemmerling Elementary Not in PI YesBanning Unified Hoffer Elementary In PI 2003-2004 Year 5 Year 5 NoBanning Unified Nicolet Middle In PI 1998-1999 Year 5 Year 5 NoBanning Unified Susan B. Coombs Intermediate In PI 1998-1999 Year 5 Year 5 No
Beaumont Unified Anna Hause Elementary Not in PI At Risk NoBeaumont Unified Brookside Elementary Not in PI YesBeaumont Unified Mountain View Middle In PI 2009-2010 Year 2 Year 2 YesBeaumont Unified Palm Elementary In PI 2009-2010 Year 1 Year 2 NoBeaumont Unified San Gorgonio Middle In PI 2009-2010 Year 2 Year 3 NoBeaumont Unified Sundance Elementary Not in PI YesBeaumont Unified Three Rings Ranch Elementary Not in PI YesBeaumont Unified Tournament Hills Elementary Not in PI At Risk No
Coachella Valley Unified Bobby Duke Middle In PI 2009-2010 Year 2 Year 3 NoCoachella Valley Unified Cahuilla Desert Academy Junior High In PI 2004-2005 Year 5 Year 5 NoCoachella Valley Unified Cesar Chavez Elementary In PI 2006-2007 Year 5 Year 5 NoCoachella Valley Unified Coachella Valley High In PI 2003-2004 Year 5 Year 5 NoCoachella Valley Unified Coral Mountain Academy In PI 2008-2009 Year 2 Year 3 NoCoachella Valley Unified Desert Mirage High In PI 2007-2008 Year 4 Year 5 NoCoachella Valley Unified John Kelley Elementary In PI 1999-2000 Year 5 Year 5 NoCoachella Valley Unified La Familia Continuation High In PI 2008-2009 Year 3 Year 4 NoCoachella Valley Unified Las Palmitas Elementary In PI 2005-2006 Year 5 Year 5 NoCoachella Valley Unified Mecca Elementary In PI 2004-2005 Year 5 Year 5 No
Page 44 of 52Prepared by Riverside County Office of Education
Assessment and Accountability Services08/30/2011
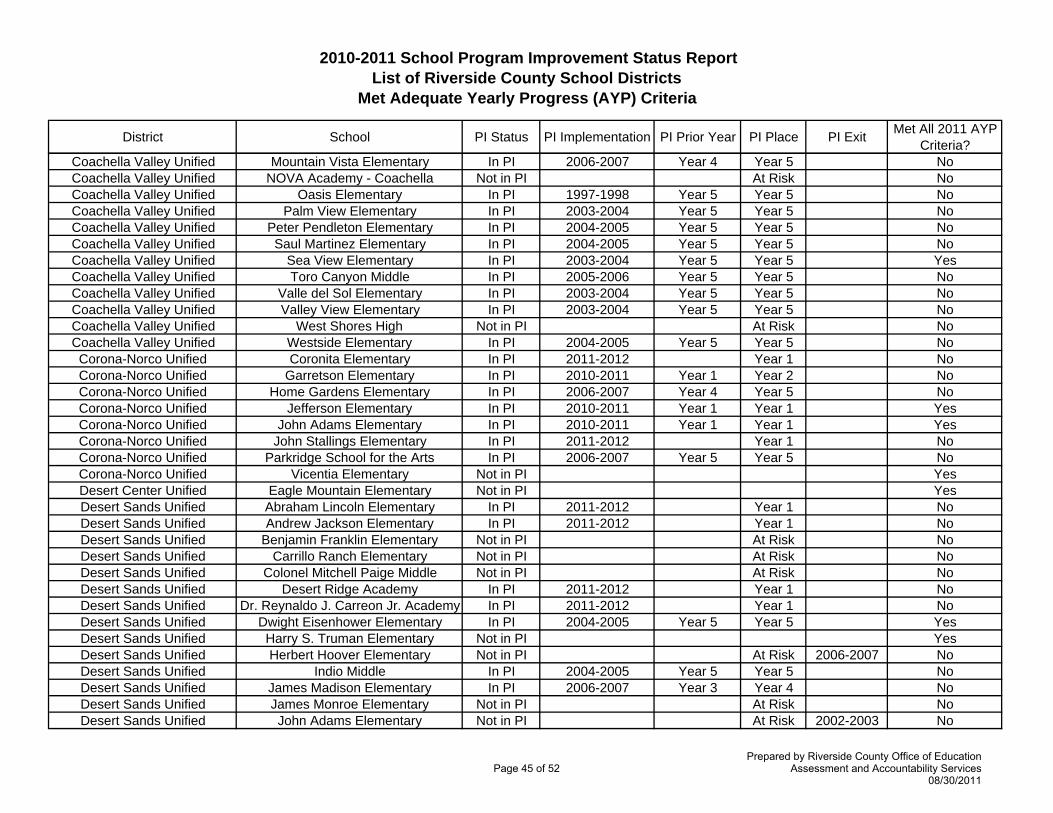
2010-2011 School Program Improvement Status Report List of Riverside County School Districts
Met Adequate Yearly Progress (AYP) Criteria
District School PI Status PI Implementation PI Prior Year PI Place PI Exit Met All 2011 AYP Criteria?
Coachella Valley Unified Mountain Vista Elementary In PI 2006-2007 Year 4 Year 5 NoCoachella Valley Unified NOVA Academy - Coachella Not in PI At Risk NoCoachella Valley Unified Oasis Elementary In PI 1997-1998 Year 5 Year 5 NoCoachella Valley Unified Palm View Elementary In PI 2003-2004 Year 5 Year 5 NoCoachella Valley Unified Peter Pendleton Elementary In PI 2004-2005 Year 5 Year 5 NoCoachella Valley Unified Saul Martinez Elementary In PI 2004-2005 Year 5 Year 5 NoCoachella Valley Unified Sea View Elementary In PI 2003-2004 Year 5 Year 5 YesCoachella Valley Unified Toro Canyon Middle In PI 2005-2006 Year 5 Year 5 NoCoachella Valley Unified Valle del Sol Elementary In PI 2003-2004 Year 5 Year 5 NoCoachella Valley Unified Valley View Elementary In PI 2003-2004 Year 5 Year 5 NoCoachella Valley Unified West Shores High Not in PI At Risk NoCoachella Valley Unified Westside Elementary In PI 2004-2005 Year 5 Year 5 NoCorona-Norco Unified Coronita Elementary In PI 2011-2012 Year 1 NoCorona-Norco Unified Garretson Elementary In PI 2010-2011 Year 1 Year 2 NoCorona-Norco Unified Home Gardens Elementary In PI 2006-2007 Year 4 Year 5 NoCorona-Norco Unified Jefferson Elementary In PI 2010-2011 Year 1 Year 1 YesCorona-Norco Unified John Adams Elementary In PI 2010-2011 Year 1 Year 1 YesCorona-Norco Unified John Stallings Elementary In PI 2011-2012 Year 1 NoCorona-Norco Unified Parkridge School for the Arts In PI 2006-2007 Year 5 Year 5 NoCorona-Norco Unified Vicentia Elementary Not in PI YesDesert Center Unified Eagle Mountain Elementary Not in PI YesDesert Sands Unified Abraham Lincoln Elementary In PI 2011-2012 Year 1 NoDesert Sands Unified Andrew Jackson Elementary In PI 2011-2012 Year 1 NoDesert Sands Unified Benjamin Franklin Elementary Not in PI At Risk NoDesert Sands Unified Carrillo Ranch Elementary Not in PI At Risk NoDesert Sands Unified Colonel Mitchell Paige Middle Not in PI At Risk NoDesert Sands Unified Desert Ridge Academy In PI 2011-2012 Year 1 NoDesert Sands Unified Dr. Reynaldo J. Carreon Jr. Academy In PI 2011-2012 Year 1 NoDesert Sands Unified Dwight Eisenhower Elementary In PI 2004-2005 Year 5 Year 5 YesDesert Sands Unified Harry S. Truman Elementary Not in PI YesDesert Sands Unified Herbert Hoover Elementary Not in PI At Risk 2006-2007 NoDesert Sands Unified Indio Middle In PI 2004-2005 Year 5 Year 5 NoDesert Sands Unified James Madison Elementary In PI 2006-2007 Year 3 Year 4 NoDesert Sands Unified James Monroe Elementary Not in PI At Risk NoDesert Sands Unified John Adams Elementary Not in PI At Risk 2002-2003 No
Page 45 of 52Prepared by Riverside County Office of Education
Assessment and Accountability Services08/30/2011
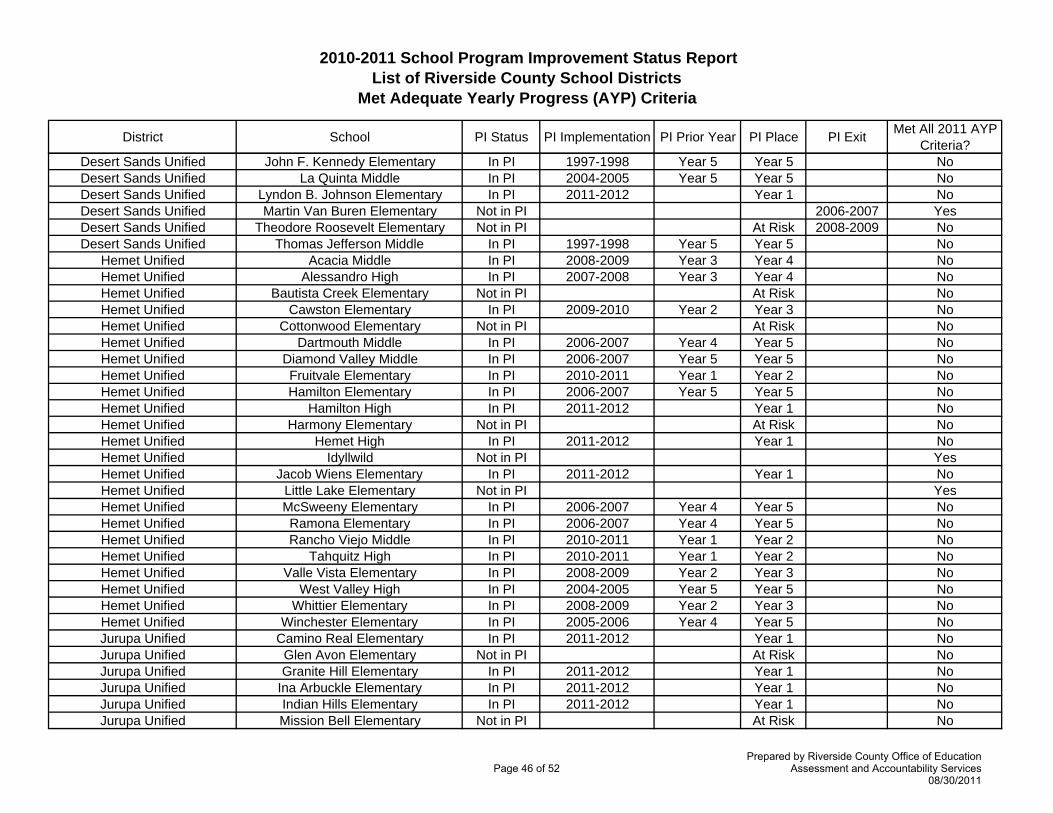
2010-2011 School Program Improvement Status Report List of Riverside County School Districts
Met Adequate Yearly Progress (AYP) Criteria
District School PI Status PI Implementation PI Prior Year PI Place PI Exit Met All 2011 AYP Criteria?
Desert Sands Unified John F. Kennedy Elementary In PI 1997-1998 Year 5 Year 5 NoDesert Sands Unified La Quinta Middle In PI 2004-2005 Year 5 Year 5 NoDesert Sands Unified Lyndon B. Johnson Elementary In PI 2011-2012 Year 1 NoDesert Sands Unified Martin Van Buren Elementary Not in PI 2006-2007 YesDesert Sands Unified Theodore Roosevelt Elementary Not in PI At Risk 2008-2009 NoDesert Sands Unified Thomas Jefferson Middle In PI 1997-1998 Year 5 Year 5 No
Hemet Unified Acacia Middle In PI 2008-2009 Year 3 Year 4 NoHemet Unified Alessandro High In PI 2007-2008 Year 3 Year 4 NoHemet Unified Bautista Creek Elementary Not in PI At Risk NoHemet Unified Cawston Elementary In PI 2009-2010 Year 2 Year 3 NoHemet Unified Cottonwood Elementary Not in PI At Risk NoHemet Unified Dartmouth Middle In PI 2006-2007 Year 4 Year 5 NoHemet Unified Diamond Valley Middle In PI 2006-2007 Year 5 Year 5 NoHemet Unified Fruitvale Elementary In PI 2010-2011 Year 1 Year 2 NoHemet Unified Hamilton Elementary In PI 2006-2007 Year 5 Year 5 NoHemet Unified Hamilton High In PI 2011-2012 Year 1 NoHemet Unified Harmony Elementary Not in PI At Risk NoHemet Unified Hemet High In PI 2011-2012 Year 1 NoHemet Unified Idyllwild Not in PI YesHemet Unified Jacob Wiens Elementary In PI 2011-2012 Year 1 NoHemet Unified Little Lake Elementary Not in PI YesHemet Unified McSweeny Elementary In PI 2006-2007 Year 4 Year 5 NoHemet Unified Ramona Elementary In PI 2006-2007 Year 4 Year 5 NoHemet Unified Rancho Viejo Middle In PI 2010-2011 Year 1 Year 2 NoHemet Unified Tahquitz High In PI 2010-2011 Year 1 Year 2 NoHemet Unified Valle Vista Elementary In PI 2008-2009 Year 2 Year 3 NoHemet Unified West Valley High In PI 2004-2005 Year 5 Year 5 NoHemet Unified Whittier Elementary In PI 2008-2009 Year 2 Year 3 NoHemet Unified Winchester Elementary In PI 2005-2006 Year 4 Year 5 NoJurupa Unified Camino Real Elementary In PI 2011-2012 Year 1 NoJurupa Unified Glen Avon Elementary Not in PI At Risk NoJurupa Unified Granite Hill Elementary In PI 2011-2012 Year 1 NoJurupa Unified Ina Arbuckle Elementary In PI 2011-2012 Year 1 NoJurupa Unified Indian Hills Elementary In PI 2011-2012 Year 1 NoJurupa Unified Mission Bell Elementary Not in PI At Risk No
Page 46 of 52Prepared by Riverside County Office of Education
Assessment and Accountability Services08/30/2011
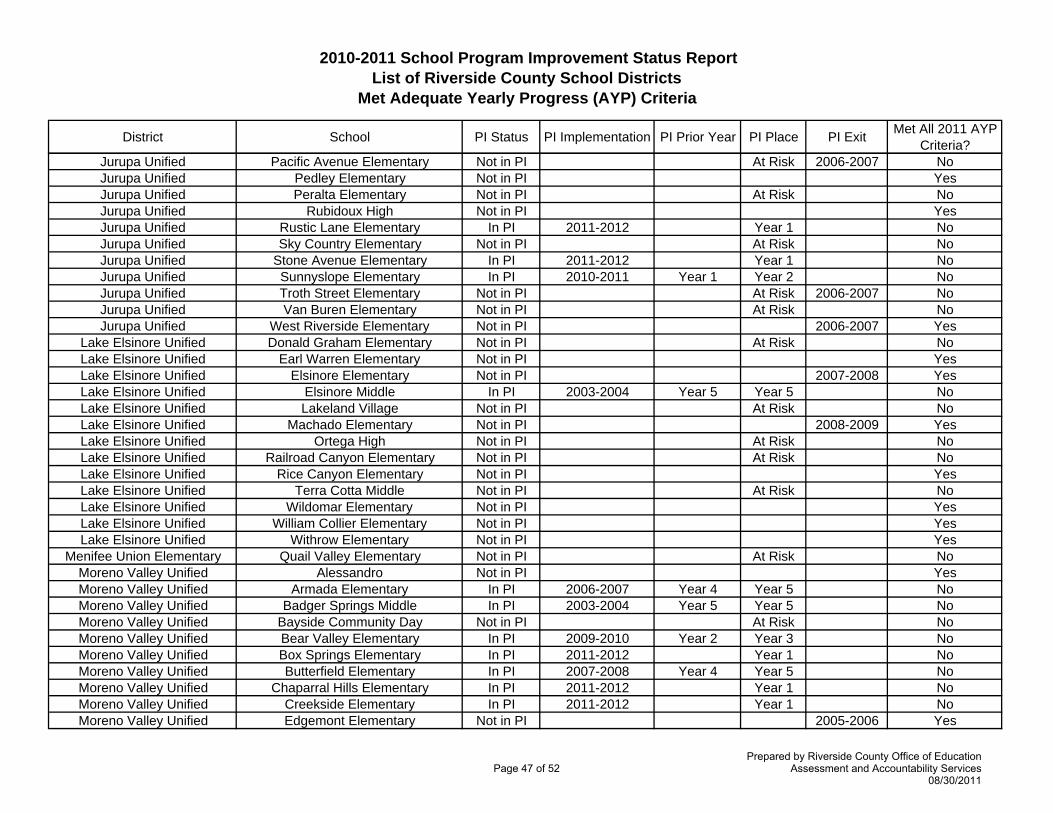
2010-2011 School Program Improvement Status Report List of Riverside County School Districts
Met Adequate Yearly Progress (AYP) Criteria
District School PI Status PI Implementation PI Prior Year PI Place PI Exit Met All 2011 AYP Criteria?
Jurupa Unified Pacific Avenue Elementary Not in PI At Risk 2006-2007 NoJurupa Unified Pedley Elementary Not in PI YesJurupa Unified Peralta Elementary Not in PI At Risk NoJurupa Unified Rubidoux High Not in PI YesJurupa Unified Rustic Lane Elementary In PI 2011-2012 Year 1 NoJurupa Unified Sky Country Elementary Not in PI At Risk NoJurupa Unified Stone Avenue Elementary In PI 2011-2012 Year 1 NoJurupa Unified Sunnyslope Elementary In PI 2010-2011 Year 1 Year 2 NoJurupa Unified Troth Street Elementary Not in PI At Risk 2006-2007 NoJurupa Unified Van Buren Elementary Not in PI At Risk NoJurupa Unified West Riverside Elementary Not in PI 2006-2007 Yes
Lake Elsinore Unified Donald Graham Elementary Not in PI At Risk NoLake Elsinore Unified Earl Warren Elementary Not in PI YesLake Elsinore Unified Elsinore Elementary Not in PI 2007-2008 YesLake Elsinore Unified Elsinore Middle In PI 2003-2004 Year 5 Year 5 NoLake Elsinore Unified Lakeland Village Not in PI At Risk NoLake Elsinore Unified Machado Elementary Not in PI 2008-2009 YesLake Elsinore Unified Ortega High Not in PI At Risk NoLake Elsinore Unified Railroad Canyon Elementary Not in PI At Risk NoLake Elsinore Unified Rice Canyon Elementary Not in PI YesLake Elsinore Unified Terra Cotta Middle Not in PI At Risk NoLake Elsinore Unified Wildomar Elementary Not in PI YesLake Elsinore Unified William Collier Elementary Not in PI YesLake Elsinore Unified Withrow Elementary Not in PI Yes
Menifee Union Elementary Quail Valley Elementary Not in PI At Risk NoMoreno Valley Unified Alessandro Not in PI YesMoreno Valley Unified Armada Elementary In PI 2006-2007 Year 4 Year 5 NoMoreno Valley Unified Badger Springs Middle In PI 2003-2004 Year 5 Year 5 NoMoreno Valley Unified Bayside Community Day Not in PI At Risk NoMoreno Valley Unified Bear Valley Elementary In PI 2009-2010 Year 2 Year 3 NoMoreno Valley Unified Box Springs Elementary In PI 2011-2012 Year 1 NoMoreno Valley Unified Butterfield Elementary In PI 2007-2008 Year 4 Year 5 NoMoreno Valley Unified Chaparral Hills Elementary In PI 2011-2012 Year 1 NoMoreno Valley Unified Creekside Elementary In PI 2011-2012 Year 1 NoMoreno Valley Unified Edgemont Elementary Not in PI 2005-2006 Yes
Page 47 of 52Prepared by Riverside County Office of Education
Assessment and Accountability Services08/30/2011
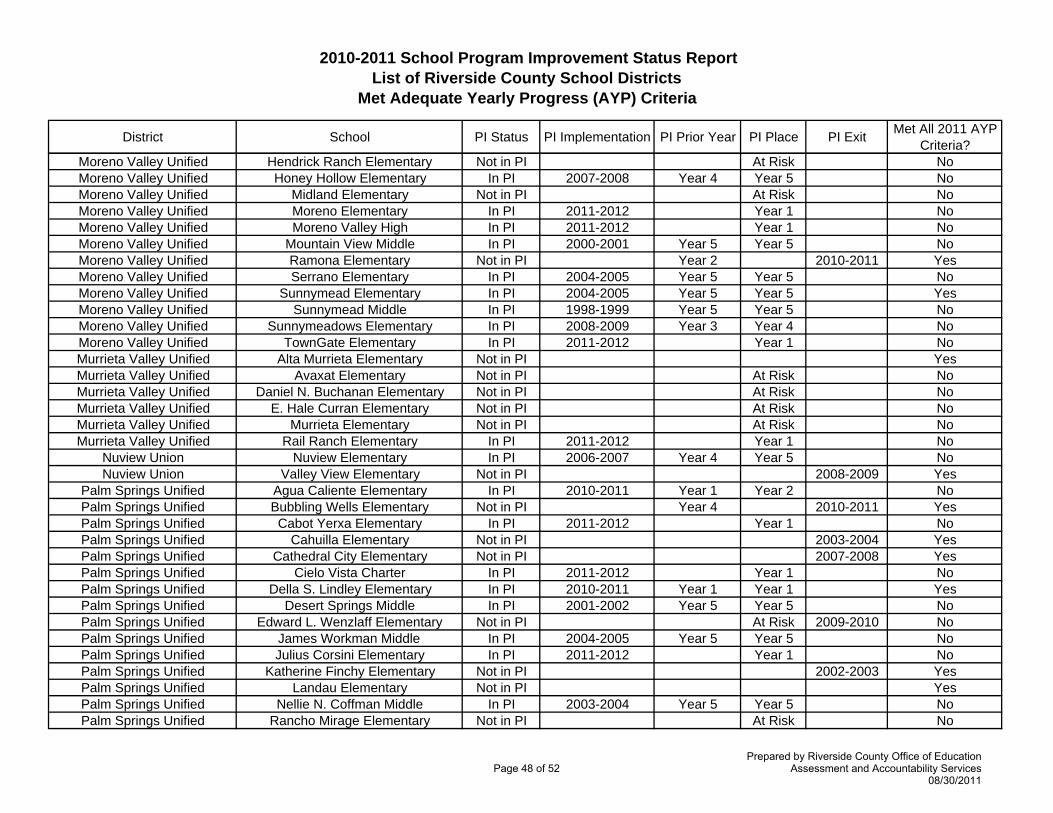
2010-2011 School Program Improvement Status Report List of Riverside County School Districts
Met Adequate Yearly Progress (AYP) Criteria
District School PI Status PI Implementation PI Prior Year PI Place PI Exit Met All 2011 AYP Criteria?
Moreno Valley Unified Hendrick Ranch Elementary Not in PI At Risk NoMoreno Valley Unified Honey Hollow Elementary In PI 2007-2008 Year 4 Year 5 NoMoreno Valley Unified Midland Elementary Not in PI At Risk NoMoreno Valley Unified Moreno Elementary In PI 2011-2012 Year 1 NoMoreno Valley Unified Moreno Valley High In PI 2011-2012 Year 1 NoMoreno Valley Unified Mountain View Middle In PI 2000-2001 Year 5 Year 5 NoMoreno Valley Unified Ramona Elementary Not in PI Year 2 2010-2011 YesMoreno Valley Unified Serrano Elementary In PI 2004-2005 Year 5 Year 5 NoMoreno Valley Unified Sunnymead Elementary In PI 2004-2005 Year 5 Year 5 YesMoreno Valley Unified Sunnymead Middle In PI 1998-1999 Year 5 Year 5 NoMoreno Valley Unified Sunnymeadows Elementary In PI 2008-2009 Year 3 Year 4 NoMoreno Valley Unified TownGate Elementary In PI 2011-2012 Year 1 NoMurrieta Valley Unified Alta Murrieta Elementary Not in PI YesMurrieta Valley Unified Avaxat Elementary Not in PI At Risk NoMurrieta Valley Unified Daniel N. Buchanan Elementary Not in PI At Risk NoMurrieta Valley Unified E. Hale Curran Elementary Not in PI At Risk NoMurrieta Valley Unified Murrieta Elementary Not in PI At Risk NoMurrieta Valley Unified Rail Ranch Elementary In PI 2011-2012 Year 1 No
Nuview Union Nuview Elementary In PI 2006-2007 Year 4 Year 5 NoNuview Union Valley View Elementary Not in PI 2008-2009 Yes
Palm Springs Unified Agua Caliente Elementary In PI 2010-2011 Year 1 Year 2 NoPalm Springs Unified Bubbling Wells Elementary Not in PI Year 4 2010-2011 YesPalm Springs Unified Cabot Yerxa Elementary In PI 2011-2012 Year 1 NoPalm Springs Unified Cahuilla Elementary Not in PI 2003-2004 YesPalm Springs Unified Cathedral City Elementary Not in PI 2007-2008 YesPalm Springs Unified Cielo Vista Charter In PI 2011-2012 Year 1 NoPalm Springs Unified Della S. Lindley Elementary In PI 2010-2011 Year 1 Year 1 YesPalm Springs Unified Desert Springs Middle In PI 2001-2002 Year 5 Year 5 NoPalm Springs Unified Edward L. Wenzlaff Elementary Not in PI At Risk 2009-2010 NoPalm Springs Unified James Workman Middle In PI 2004-2005 Year 5 Year 5 NoPalm Springs Unified Julius Corsini Elementary In PI 2011-2012 Year 1 NoPalm Springs Unified Katherine Finchy Elementary Not in PI 2002-2003 YesPalm Springs Unified Landau Elementary Not in PI YesPalm Springs Unified Nellie N. Coffman Middle In PI 2003-2004 Year 5 Year 5 NoPalm Springs Unified Rancho Mirage Elementary Not in PI At Risk No
Page 48 of 52Prepared by Riverside County Office of Education
Assessment and Accountability Services08/30/2011
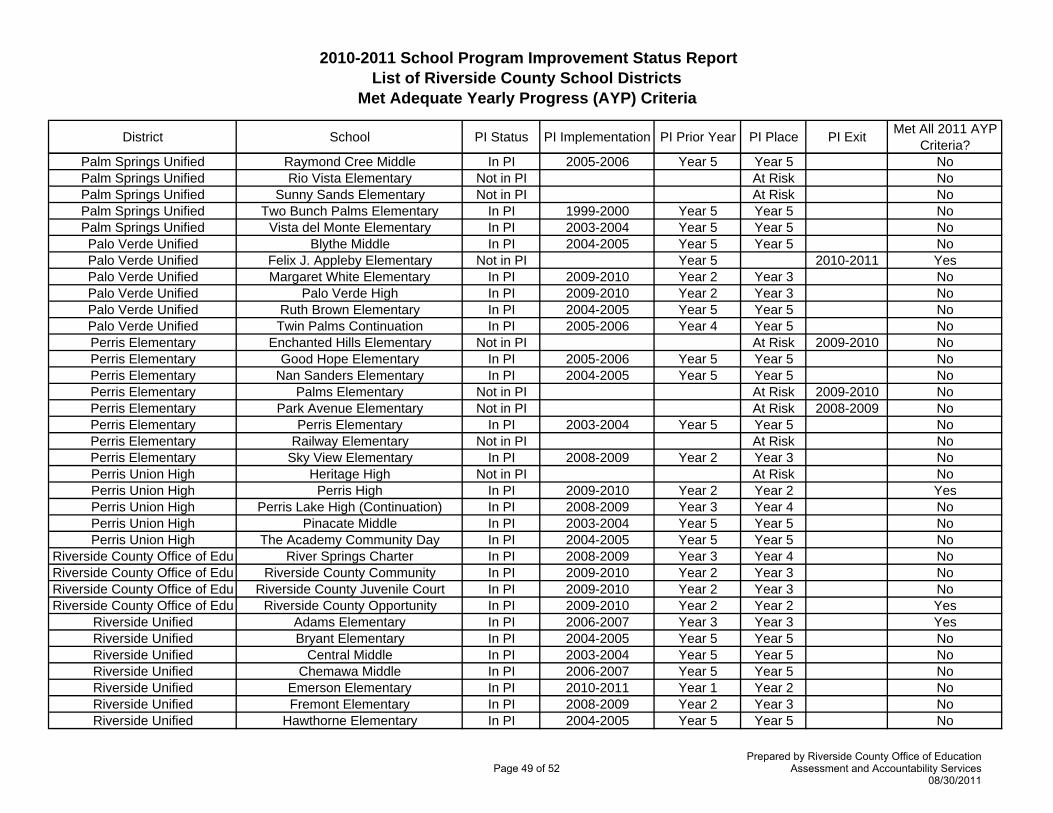
2010-2011 School Program Improvement Status Report List of Riverside County School Districts
Met Adequate Yearly Progress (AYP) Criteria
District School PI Status PI Implementation PI Prior Year PI Place PI Exit Met All 2011 AYP Criteria?
Palm Springs Unified Raymond Cree Middle In PI 2005-2006 Year 5 Year 5 NoPalm Springs Unified Rio Vista Elementary Not in PI At Risk NoPalm Springs Unified Sunny Sands Elementary Not in PI At Risk NoPalm Springs Unified Two Bunch Palms Elementary In PI 1999-2000 Year 5 Year 5 NoPalm Springs Unified Vista del Monte Elementary In PI 2003-2004 Year 5 Year 5 NoPalo Verde Unified Blythe Middle In PI 2004-2005 Year 5 Year 5 NoPalo Verde Unified Felix J. Appleby Elementary Not in PI Year 5 2010-2011 YesPalo Verde Unified Margaret White Elementary In PI 2009-2010 Year 2 Year 3 NoPalo Verde Unified Palo Verde High In PI 2009-2010 Year 2 Year 3 NoPalo Verde Unified Ruth Brown Elementary In PI 2004-2005 Year 5 Year 5 NoPalo Verde Unified Twin Palms Continuation In PI 2005-2006 Year 4 Year 5 NoPerris Elementary Enchanted Hills Elementary Not in PI At Risk 2009-2010 NoPerris Elementary Good Hope Elementary In PI 2005-2006 Year 5 Year 5 NoPerris Elementary Nan Sanders Elementary In PI 2004-2005 Year 5 Year 5 NoPerris Elementary Palms Elementary Not in PI At Risk 2009-2010 NoPerris Elementary Park Avenue Elementary Not in PI At Risk 2008-2009 NoPerris Elementary Perris Elementary In PI 2003-2004 Year 5 Year 5 NoPerris Elementary Railway Elementary Not in PI At Risk NoPerris Elementary Sky View Elementary In PI 2008-2009 Year 2 Year 3 NoPerris Union High Heritage High Not in PI At Risk NoPerris Union High Perris High In PI 2009-2010 Year 2 Year 2 YesPerris Union High Perris Lake High (Continuation) In PI 2008-2009 Year 3 Year 4 NoPerris Union High Pinacate Middle In PI 2003-2004 Year 5 Year 5 NoPerris Union High The Academy Community Day In PI 2004-2005 Year 5 Year 5 No
Riverside County Office of Edu River Springs Charter In PI 2008-2009 Year 3 Year 4 NoRiverside County Office of Edu Riverside County Community In PI 2009-2010 Year 2 Year 3 NoRiverside County Office of Edu Riverside County Juvenile Court In PI 2009-2010 Year 2 Year 3 NoRiverside County Office of Edu Riverside County Opportunity In PI 2009-2010 Year 2 Year 2 Yes
Riverside Unified Adams Elementary In PI 2006-2007 Year 3 Year 3 YesRiverside Unified Bryant Elementary In PI 2004-2005 Year 5 Year 5 NoRiverside Unified Central Middle In PI 2003-2004 Year 5 Year 5 NoRiverside Unified Chemawa Middle In PI 2006-2007 Year 5 Year 5 NoRiverside Unified Emerson Elementary In PI 2010-2011 Year 1 Year 2 NoRiverside Unified Fremont Elementary In PI 2008-2009 Year 2 Year 3 NoRiverside Unified Hawthorne Elementary In PI 2004-2005 Year 5 Year 5 No
Page 49 of 52Prepared by Riverside County Office of Education
Assessment and Accountability Services08/30/2011
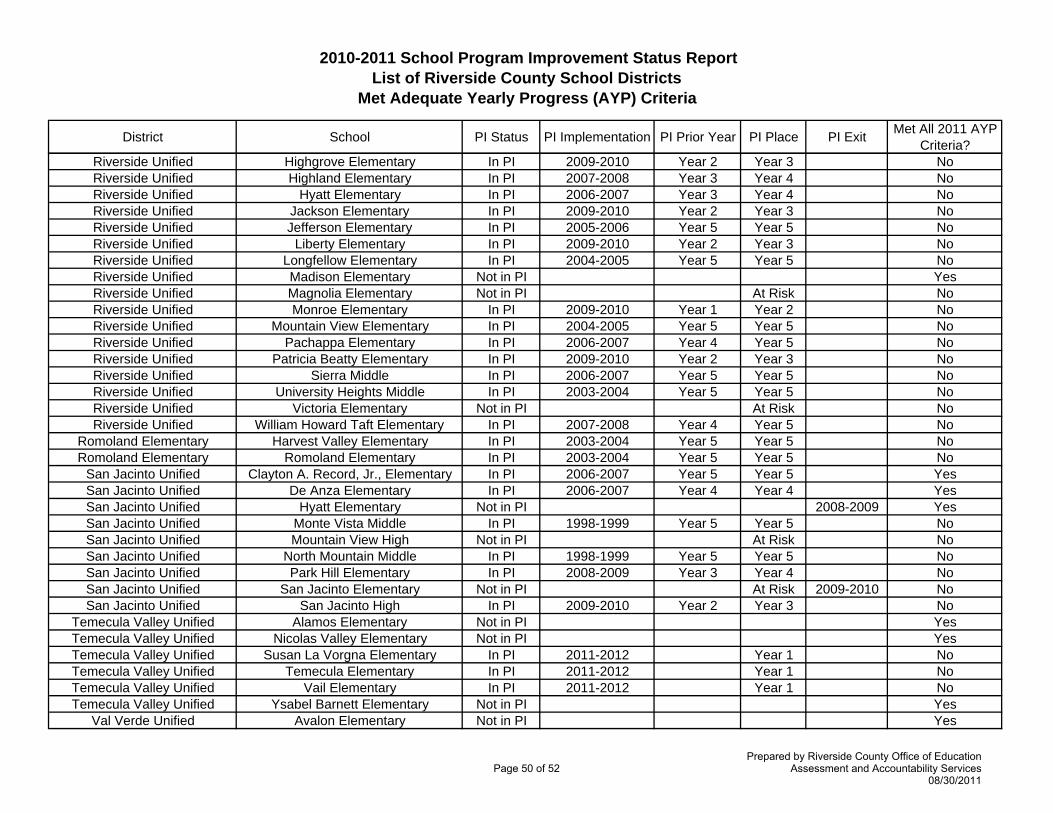
2010-2011 School Program Improvement Status Report List of Riverside County School Districts
Met Adequate Yearly Progress (AYP) Criteria
District School PI Status PI Implementation PI Prior Year PI Place PI Exit Met All 2011 AYP Criteria?
Riverside Unified Highgrove Elementary In PI 2009-2010 Year 2 Year 3 NoRiverside Unified Highland Elementary In PI 2007-2008 Year 3 Year 4 NoRiverside Unified Hyatt Elementary In PI 2006-2007 Year 3 Year 4 NoRiverside Unified Jackson Elementary In PI 2009-2010 Year 2 Year 3 NoRiverside Unified Jefferson Elementary In PI 2005-2006 Year 5 Year 5 NoRiverside Unified Liberty Elementary In PI 2009-2010 Year 2 Year 3 NoRiverside Unified Longfellow Elementary In PI 2004-2005 Year 5 Year 5 NoRiverside Unified Madison Elementary Not in PI YesRiverside Unified Magnolia Elementary Not in PI At Risk NoRiverside Unified Monroe Elementary In PI 2009-2010 Year 1 Year 2 NoRiverside Unified Mountain View Elementary In PI 2004-2005 Year 5 Year 5 NoRiverside Unified Pachappa Elementary In PI 2006-2007 Year 4 Year 5 NoRiverside Unified Patricia Beatty Elementary In PI 2009-2010 Year 2 Year 3 NoRiverside Unified Sierra Middle In PI 2006-2007 Year 5 Year 5 NoRiverside Unified University Heights Middle In PI 2003-2004 Year 5 Year 5 NoRiverside Unified Victoria Elementary Not in PI At Risk NoRiverside Unified William Howard Taft Elementary In PI 2007-2008 Year 4 Year 5 No
Romoland Elementary Harvest Valley Elementary In PI 2003-2004 Year 5 Year 5 NoRomoland Elementary Romoland Elementary In PI 2003-2004 Year 5 Year 5 No
San Jacinto Unified Clayton A. Record, Jr., Elementary In PI 2006-2007 Year 5 Year 5 YesSan Jacinto Unified De Anza Elementary In PI 2006-2007 Year 4 Year 4 YesSan Jacinto Unified Hyatt Elementary Not in PI 2008-2009 YesSan Jacinto Unified Monte Vista Middle In PI 1998-1999 Year 5 Year 5 NoSan Jacinto Unified Mountain View High Not in PI At Risk NoSan Jacinto Unified North Mountain Middle In PI 1998-1999 Year 5 Year 5 NoSan Jacinto Unified Park Hill Elementary In PI 2008-2009 Year 3 Year 4 NoSan Jacinto Unified San Jacinto Elementary Not in PI At Risk 2009-2010 NoSan Jacinto Unified San Jacinto High In PI 2009-2010 Year 2 Year 3 No
Temecula Valley Unified Alamos Elementary Not in PI YesTemecula Valley Unified Nicolas Valley Elementary Not in PI YesTemecula Valley Unified Susan La Vorgna Elementary In PI 2011-2012 Year 1 NoTemecula Valley Unified Temecula Elementary In PI 2011-2012 Year 1 NoTemecula Valley Unified Vail Elementary In PI 2011-2012 Year 1 NoTemecula Valley Unified Ysabel Barnett Elementary Not in PI Yes
Val Verde Unified Avalon Elementary Not in PI Yes
Page 50 of 52Prepared by Riverside County Office of Education
Assessment and Accountability Services08/30/2011
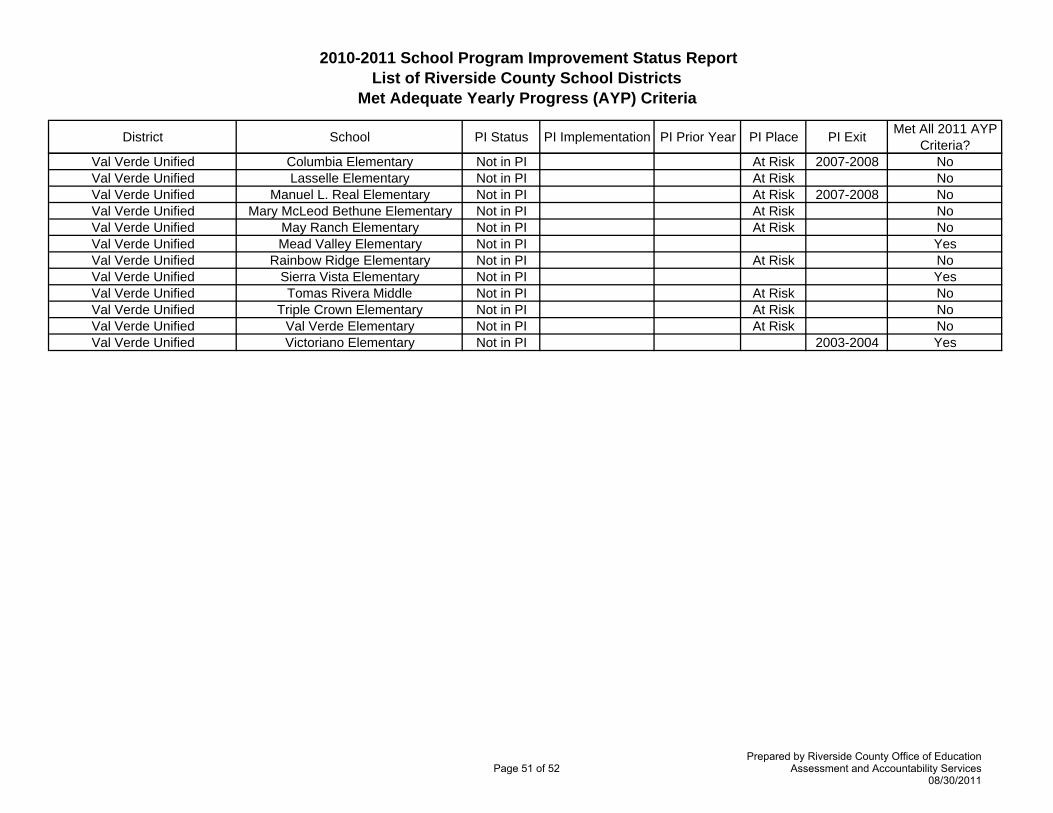
2010-2011 School Program Improvement Status Report List of Riverside County School Districts
Met Adequate Yearly Progress (AYP) Criteria
District School PI Status PI Implementation PI Prior Year PI Place PI Exit Met All 2011 AYP Criteria?
Val Verde Unified Columbia Elementary Not in PI At Risk 2007-2008 NoVal Verde Unified Lasselle Elementary Not in PI At Risk NoVal Verde Unified Manuel L. Real Elementary Not in PI At Risk 2007-2008 NoVal Verde Unified Mary McLeod Bethune Elementary Not in PI At Risk NoVal Verde Unified May Ranch Elementary Not in PI At Risk NoVal Verde Unified Mead Valley Elementary Not in PI YesVal Verde Unified Rainbow Ridge Elementary Not in PI At Risk NoVal Verde Unified Sierra Vista Elementary Not in PI YesVal Verde Unified Tomas Rivera Middle Not in PI At Risk NoVal Verde Unified Triple Crown Elementary Not in PI At Risk NoVal Verde Unified Val Verde Elementary Not in PI At Risk NoVal Verde Unified Victoriano Elementary Not in PI 2003-2004 Yes
Page 51 of 52Prepared by Riverside County Office of Education
Assessment and Accountability Services08/30/2011
Title III Accountability Report
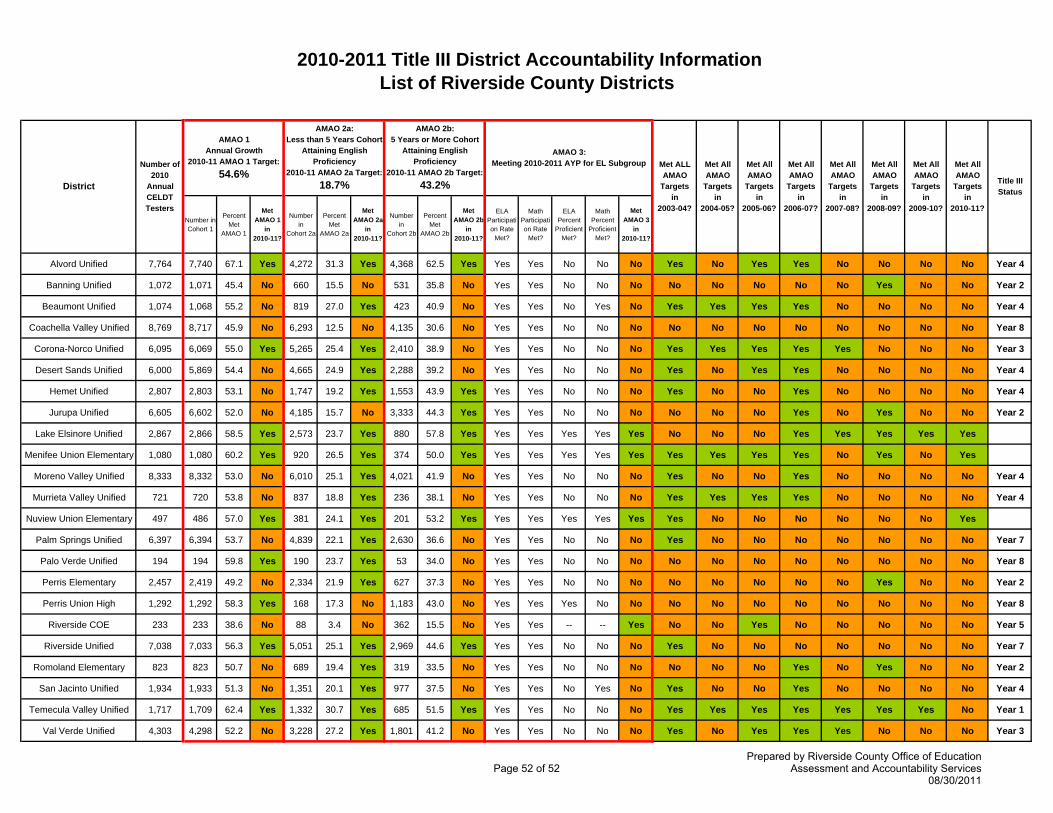
2010-2011 Title III District Accountability InformationList of Riverside County Districts
Number in Cohort 1
PercentMet
AMAO 1
Met AMAO 1
in 2010-11?
Numberin
Cohort 2a
PercentMet
AMAO 2a
Met AMAO 2a
in 2010-11?
Numberin
Cohort 2b
PercentMet
AMAO 2b
Met AMAO 2b
in 2010-11?
ELA Participation Rate
Met?
Math Participation Rate
Met?
ELA Percent
Proficient Met?
Math Percent
Proficient Met?
Met AMAO 3
in 2010-11?
Alvord Unified 7,764 7,740 67.1 Yes 4,272 31.3 Yes 4,368 62.5 Yes Yes Yes No No No Yes No Yes Yes No No No No Year 4
Banning Unified 1,072 1,071 45.4 No 660 15.5 No 531 35.8 No Yes Yes No No No No No No No No Yes No No Year 2
Beaumont Unified 1,074 1,068 55.2 No 819 27.0 Yes 423 40.9 No Yes Yes No Yes No Yes Yes Yes Yes No No No No Year 4
Coachella Valley Unified 8,769 8,717 45.9 No 6,293 12.5 No 4,135 30.6 No Yes Yes No No No No No No No No No No No Year 8
Corona-Norco Unified 6,095 6,069 55.0 Yes 5,265 25.4 Yes 2,410 38.9 No Yes Yes No No No Yes Yes Yes Yes Yes No No No Year 3
Desert Sands Unified 6,000 5,869 54.4 No 4,665 24.9 Yes 2,288 39.2 No Yes Yes No No No Yes No Yes Yes No No No No Year 4
Hemet Unified 2,807 2,803 53.1 No 1,747 19.2 Yes 1,553 43.9 Yes Yes Yes No No No Yes No No Yes No No No No Year 4
Jurupa Unified 6,605 6,602 52.0 No 4,185 15.7 No 3,333 44.3 Yes Yes Yes No No No No No No Yes No Yes No No Year 2
Lake Elsinore Unified 2,867 2,866 58.5 Yes 2,573 23.7 Yes 880 57.8 Yes Yes Yes Yes Yes Yes No No No Yes Yes Yes Yes Yes
Menifee Union Elementary 1,080 1,080 60.2 Yes 920 26.5 Yes 374 50.0 Yes Yes Yes Yes Yes Yes Yes Yes Yes Yes No Yes No Yes
Moreno Valley Unified 8,333 8,332 53.0 No 6,010 25.1 Yes 4,021 41.9 No Yes Yes No No No Yes No No Yes No No No No Year 4
Murrieta Valley Unified 721 720 53.8 No 837 18.8 Yes 236 38.1 No Yes Yes No No No Yes Yes Yes Yes No No No No Year 4
Nuview Union Elementary 497 486 57.0 Yes 381 24.1 Yes 201 53.2 Yes Yes Yes Yes Yes Yes Yes No No No No No No Yes
Palm Springs Unified 6,397 6,394 53.7 No 4,839 22.1 Yes 2,630 36.6 No Yes Yes No No No Yes No No No No No No No Year 7
Palo Verde Unified 194 194 59.8 Yes 190 23.7 Yes 53 34.0 No Yes Yes No No No No No No No No No No No Year 8
Perris Elementary 2,457 2,419 49.2 No 2,334 21.9 Yes 627 37.3 No Yes Yes No No No No No No No No Yes No No Year 2
Perris Union High 1,292 1,292 58.3 Yes 168 17.3 No 1,183 43.0 No Yes Yes Yes No No No No No No No No No No Year 8
Riverside COE 233 233 38.6 No 88 3.4 No 362 15.5 No Yes Yes -- -- Yes No No Yes No No No No No Year 5
Riverside Unified 7,038 7,033 56.3 Yes 5,051 25.1 Yes 2,969 44.6 Yes Yes Yes No No No Yes No No No No No No No Year 7
Romoland Elementary 823 823 50.7 No 689 19.4 Yes 319 33.5 No Yes Yes No No No No No No Yes No Yes No No Year 2
San Jacinto Unified 1,934 1,933 51.3 No 1,351 20.1 Yes 977 37.5 No Yes Yes No Yes No Yes No No Yes No No No No Year 4
Temecula Valley Unified 1,717 1,709 62.4 Yes 1,332 30.7 Yes 685 51.5 Yes Yes Yes No No No Yes Yes Yes Yes Yes Yes Yes No Year 1
Val Verde Unified 4,303 4,298 52.2 No 3,228 27.2 Yes 1,801 41.2 No Yes Yes No No No Yes No Yes Yes Yes No No No Year 3
District
Met All AMAO
Targets in
2004-05?
Met ALL AMAO
Targets in
2003-04?
AMAO 1 Annual Growth
2010-11 AMAO 1 Target: 54.6%
AMAO 2a: Less than 5 Years Cohort
Attaining English Proficiency
2010-11 AMAO 2a Target: 18.7%
AMAO 3: Meeting 2010-2011 AYP for EL Subgroup
AMAO 2b: 5 Years or More Cohort
Attaining English Proficiency
2010-11 AMAO 2b Target: 43.2%
Met All AMAO
Targets in
2005-06?
Number of2010
Annual CELDTTesters
Met All AMAO
Targets in
2006-07?
Met All AMAO
Targets in
2008-09?
Met All AMAO
Targets in
2010-11?
Title III Status
Met All AMAO
Targets in
2007-08?
Met All AMAO
Targets in
2009-10?
Page 52 of 52Prepared by Riverside County Office of Education
Assessment and Accountability Services08/30/2011