Embed Size (px)
Citation preview
2011 THIRD QUARTER FIXED INCOME PRESENTATION
OCTOBER 26, 2011(PRELIMINARY RESULTS)
SLIDE 1
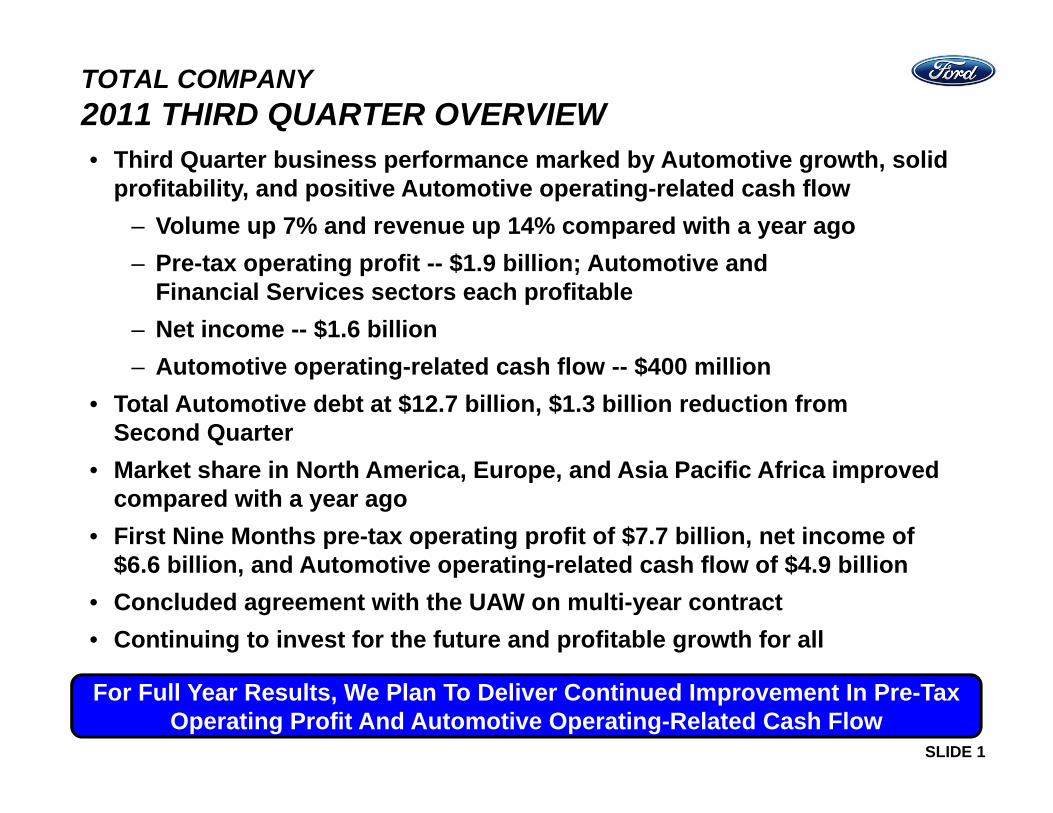
TOTAL COMPANY2011 THIRD QUARTER OVERVIEW• Third Quarter business performance marked by Automotive growth, solid
profitability, and positive Automotive operating-related cash flow– Volume up 7% and revenue up 14% compared with a year ago– Pre-tax operating profit -- $1.9 billion; Automotive and
Financial Services sectors each profitable– Net income -- $1.6 billion– Automotive operating-related cash flow -- $400 million
• Total Automotive debt at $12.7 billion, $1.3 billion reduction from Second Quarter
• Market share in North America, Europe, and Asia Pacific Africa improved compared with a year ago
• First Nine Months pre-tax operating profit of $7.7 billion, net income of $6.6 billion, and Automotive operating-related cash flow of $4.9 billion
• Concluded agreement with the UAW on multi-year contract• Continuing to invest for the future and profitable growth for all
For Full Year Results, We Plan To Deliver Continued Improvement In Pre-Tax Operating Profit And Automotive Operating-Related Cash Flow
SLIDE 2
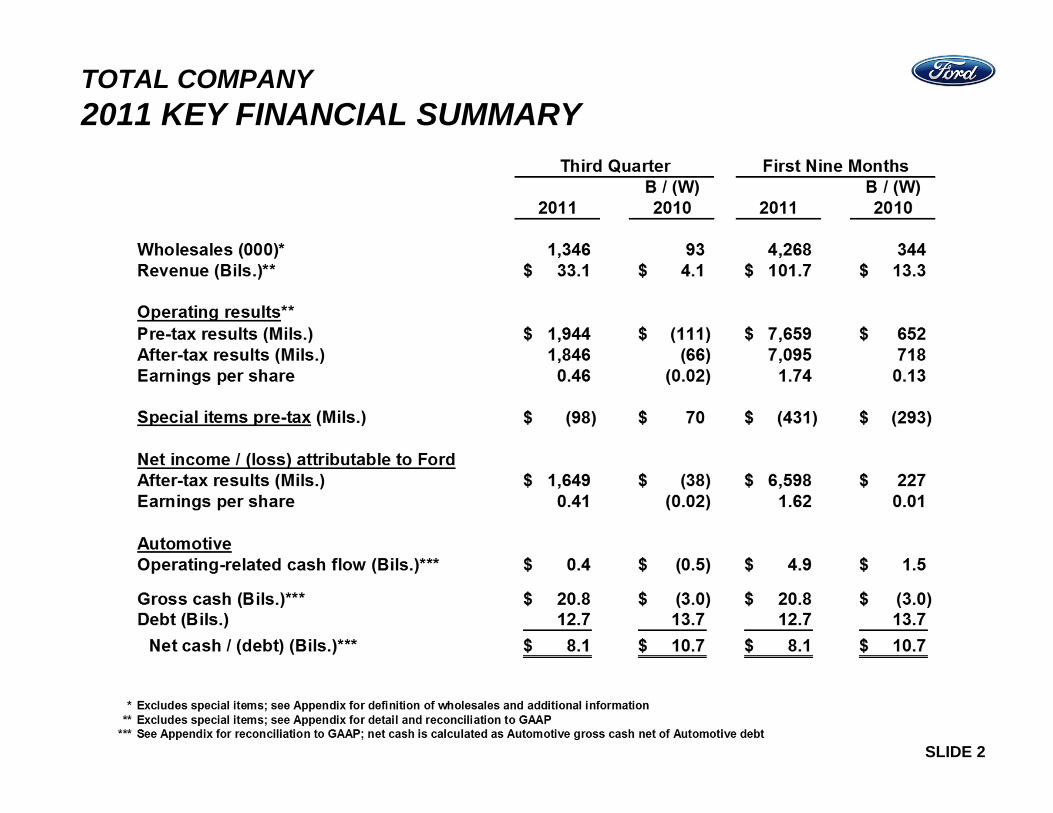
TOTAL COMPANY2011 KEY FINANCIAL SUMMARY
SLIDE 3
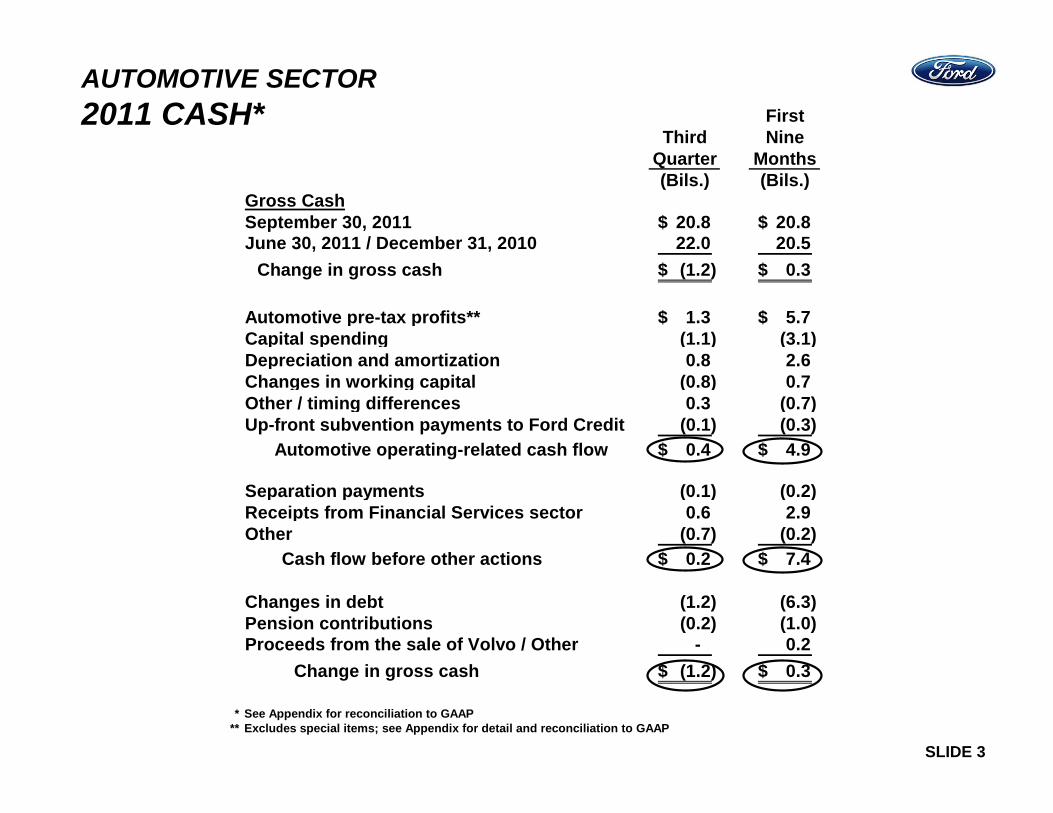
AUTOMOTIVE SECTOR2011 CASH* First
Third NineQuarter Months(Bils.) (Bils.)
Gross CashSeptember 30, 2011 20.8$ 20.8$ June 30, 2011 / December 31, 2010 22.0 20.5
Change in gross cash (1.2)$ 0.3$
Automotive pre-tax profits** 1.3$ 5.7$ Capital spending (1.1) (3.1) Depreciation and amortization 0.8 2.6 Changes in working capital (0.8) 0.7 Other / timing differences 0.3 (0.7) Up-front subvention payments to Ford Credit (0.1) (0.3)
Automotive operating-related cash flow 0.4$ 4.9$
Separation payments (0.1) (0.2) Receipts from Financial Services sector 0.6 2.9 Other (0.7) (0.2)
Cash flow before other actions 0.2$ 7.4$
Changes in debt (1.2) (6.3) Pension contributions (0.2) (1.0) Proceeds from the sale of Volvo / Other - 0.2
Change in gross cash (1.2)$ 0.3$
* See Appendix for reconciliation to GAAP ** Excludes special items; see Appendix for detail and reconciliation to GAAP
SLIDE 4
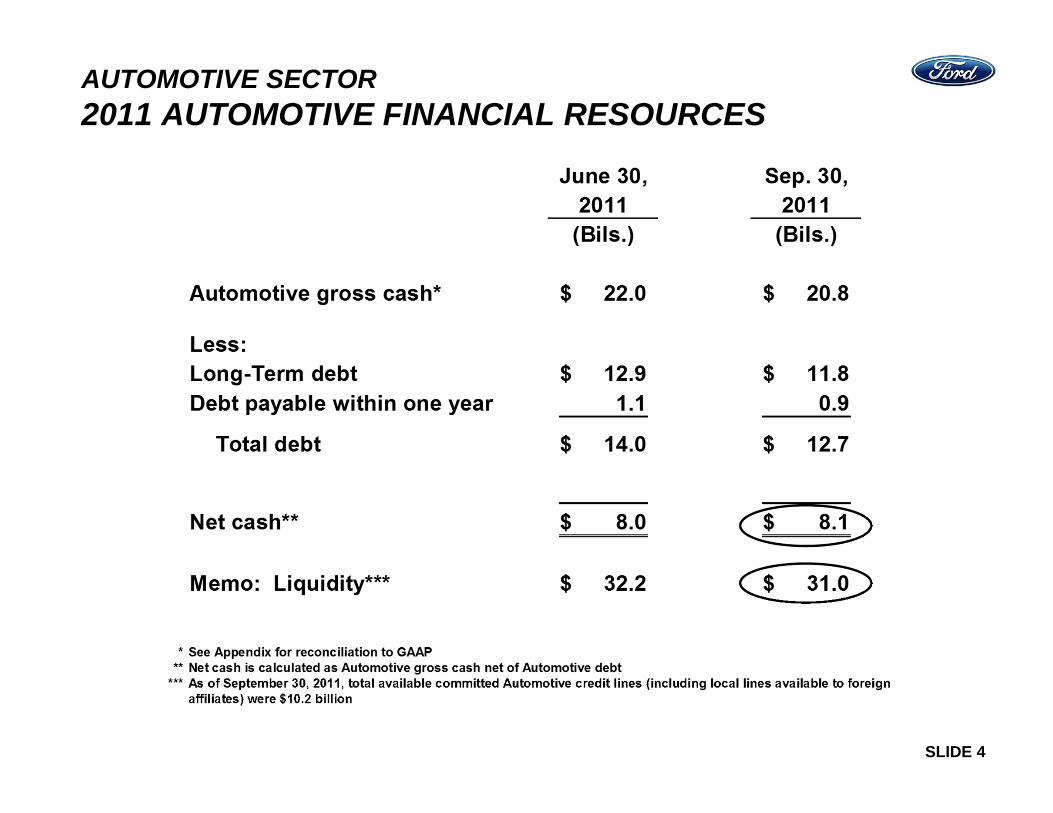
AUTOMOTIVE SECTOR2011 AUTOMOTIVE FINANCIAL RESOURCES
SLIDE 5
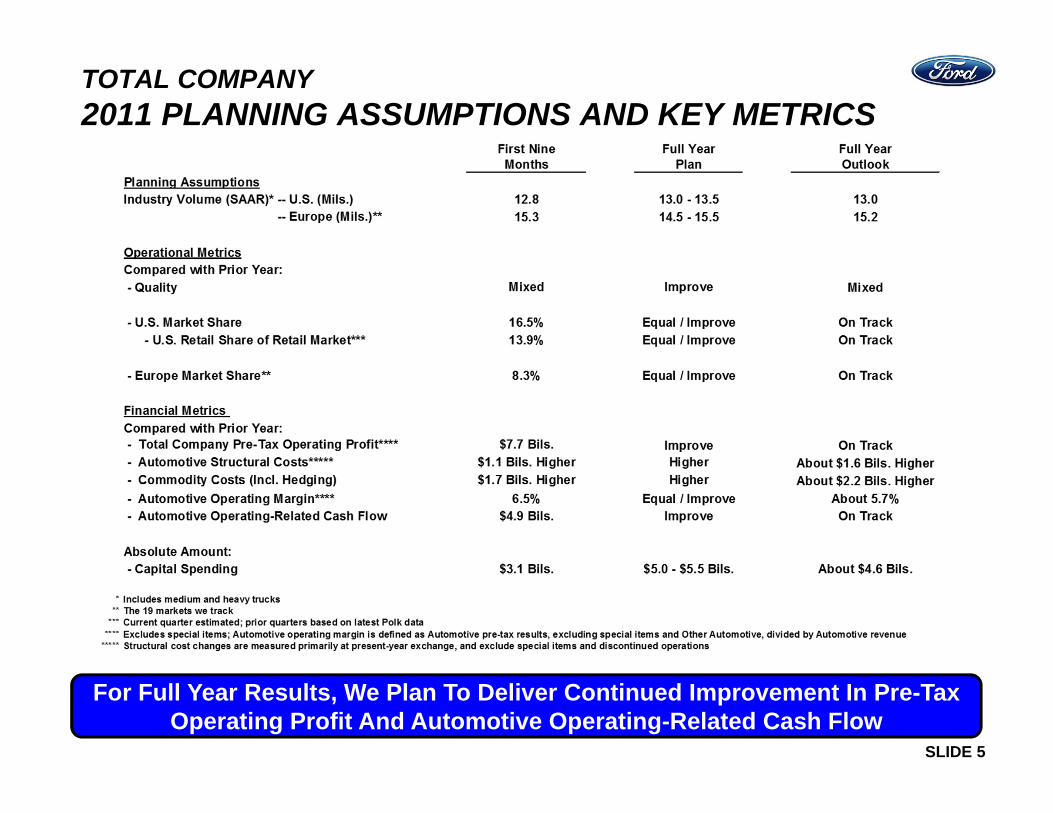
TOTAL COMPANY2011 PLANNING ASSUMPTIONS AND KEY METRICS
For Full Year Results, We Plan To Deliver Continued Improvement In Pre-Tax Operating Profit And Automotive Operating-Related Cash Flow
SLIDE 6
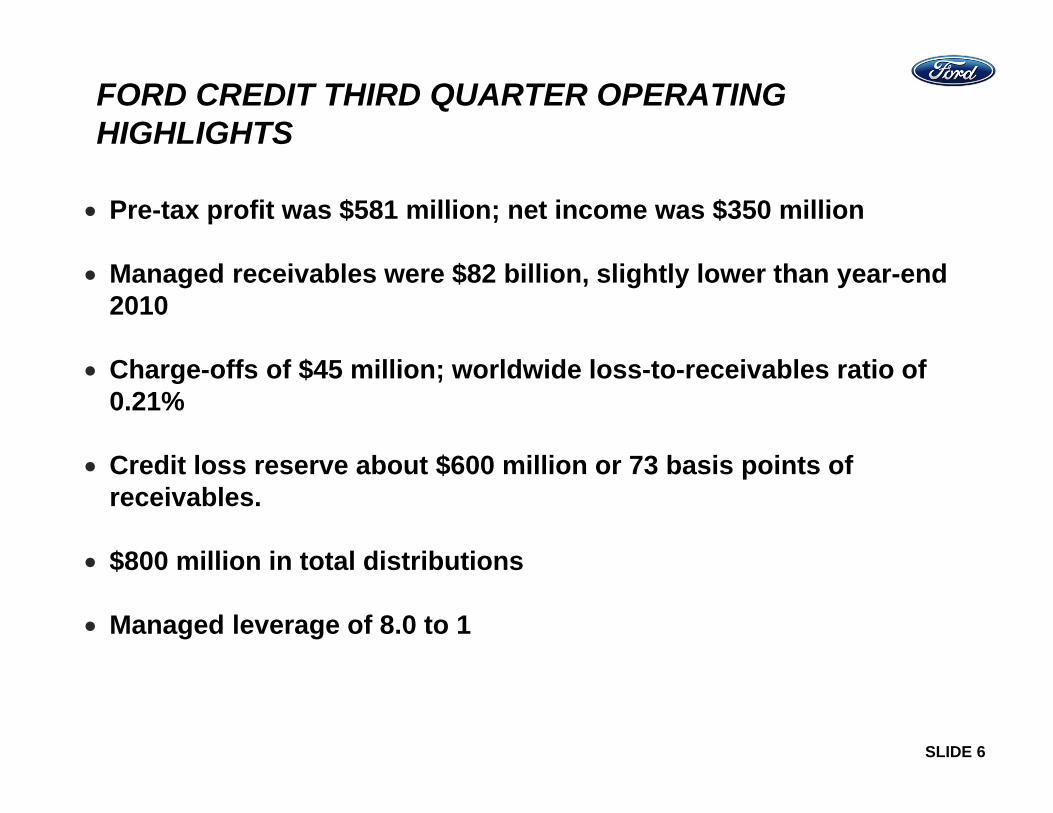
FORD CREDIT THIRD QUARTER OPERATING HIGHLIGHTS
Pre-tax profit was $581 million; net income was $350 million
Managed receivables were $82 billion, slightly lower than year-end 2010
Charge-offs of $45 million; worldwide loss-to-receivables ratio of 0.21%
Credit loss reserve about $600 million or 73 basis points of receivables.
$800 million in total distributions
Managed leverage of 8.0 to 1
SLIDE 7
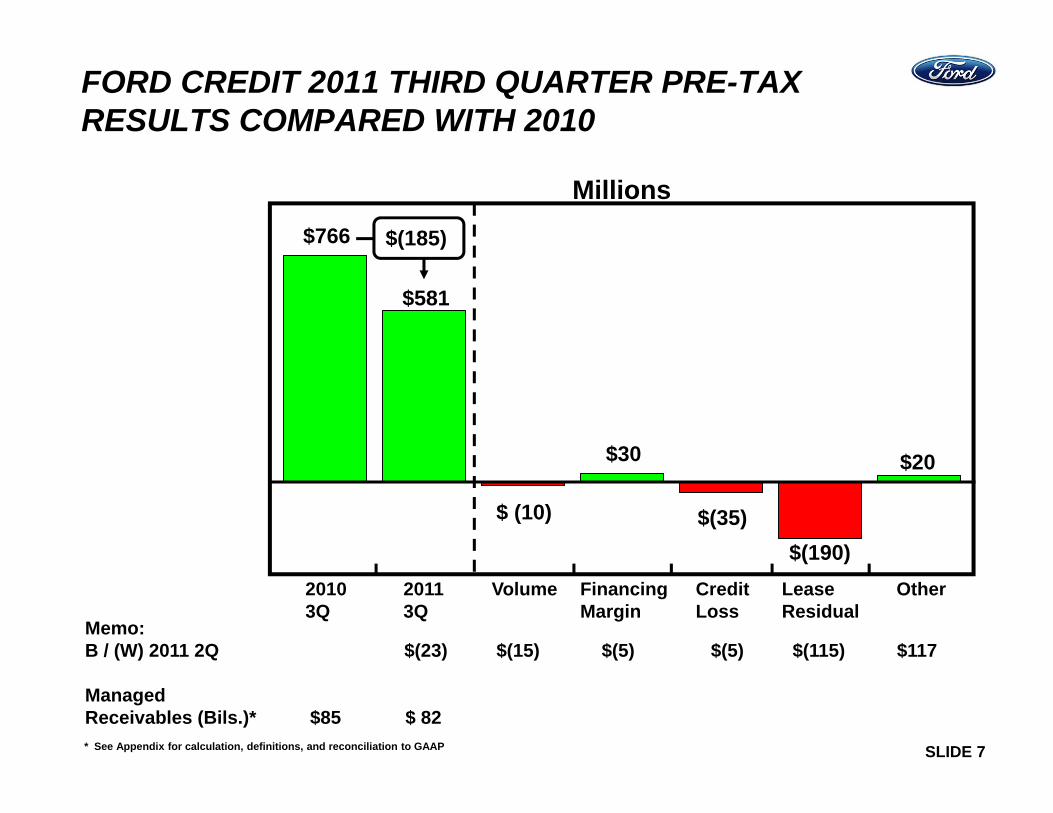
FORD CREDIT 2011 THIRD QUARTER PRE-TAX RESULTS COMPARED WITH 2010
LeaseResidual
Volume20113Q
20103Q
CreditLoss
Memo:B / (W) 2011 2Q $(23) $(15) $(5) $(5) $(115) $117
ManagedReceivables (Bils.)* $85 $ 82
Other
Millions
* See Appendix for calculation, definitions, and reconciliation to GAAP
FinancingMargin
$766
$581
$ (10)
$30
$(35)$(190)
$20
$(185)
SLIDE 8
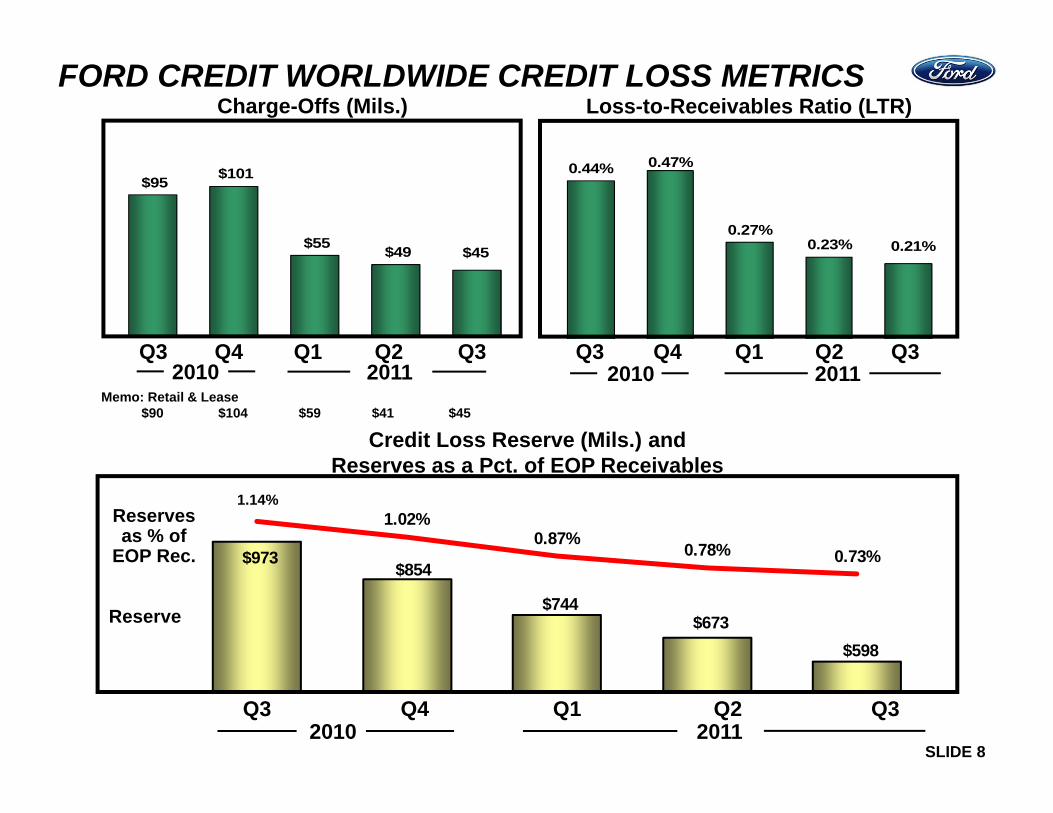
FORD CREDIT WORLDWIDE CREDIT LOSS METRICS
0.44% 0.47%
0.27%0.23% 0.21%
Loss-to-Receivables Ratio (LTR)
$95 $101
$55 $49 $45
Q4Q3 Q1 Q2 Q320112010
Charge-Offs (Mils.)
Q4Q3 Q1 Q2 Q320112010
Memo: Retail & Lease$90 $104 $59 $41 $45
Q4Q3 Q1 Q2 Q320112010
$973$854
$744$673
$598
1.02%0.87% 0.78% 0.73%
Credit Loss Reserve (Mils.) andReserves as a Pct. of EOP Receivables
Reserve
Reserves as % of
EOP Rec.
1.14%
SLIDE 9
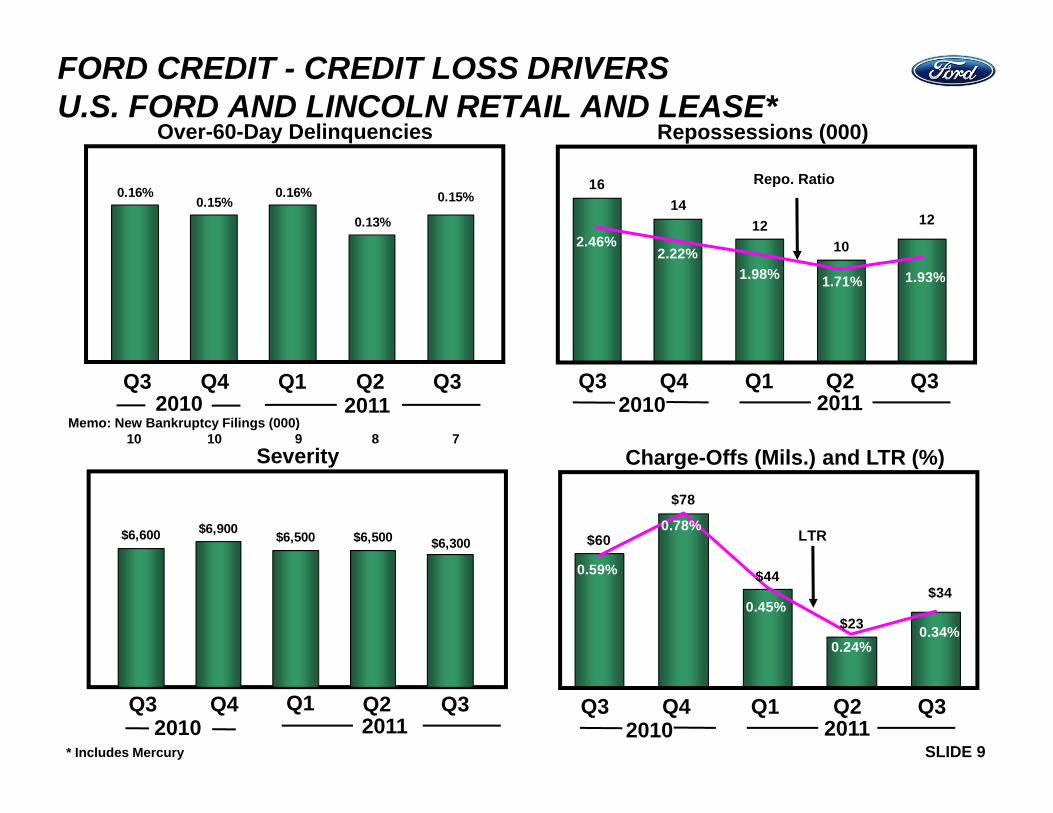
FORD CREDIT - CREDIT LOSS DRIVERS U.S. FORD AND LINCOLN RETAIL AND LEASE*
0.16%0.15%
0.16%
0.13%
0.15%
Q4Q3 Q1 Q2 Q320112010
Over-60-Day Delinquencies
Memo: New Bankruptcy Filings (000)10 10 9 8 7
1614
1210
122.46%
2.22%1.98% 1.71% 1.93%
Repossessions (000)
Repo. Ratio
Q4Q3 Q1 Q2 Q3
Severity
Q4Q3 Q1 Q2 Q32010 2011
$6,600 $6,900 $6,500 $6,500 $6,300
* Includes Mercury
$60
$78
$44
$23
$340.59%
0.78%
0.45%
0.24%0.34%
Charge-Offs (Mils.) and LTR (%)
LTR
Q4Q3 Q1 Q2 Q3
2010 2011
2010 2011
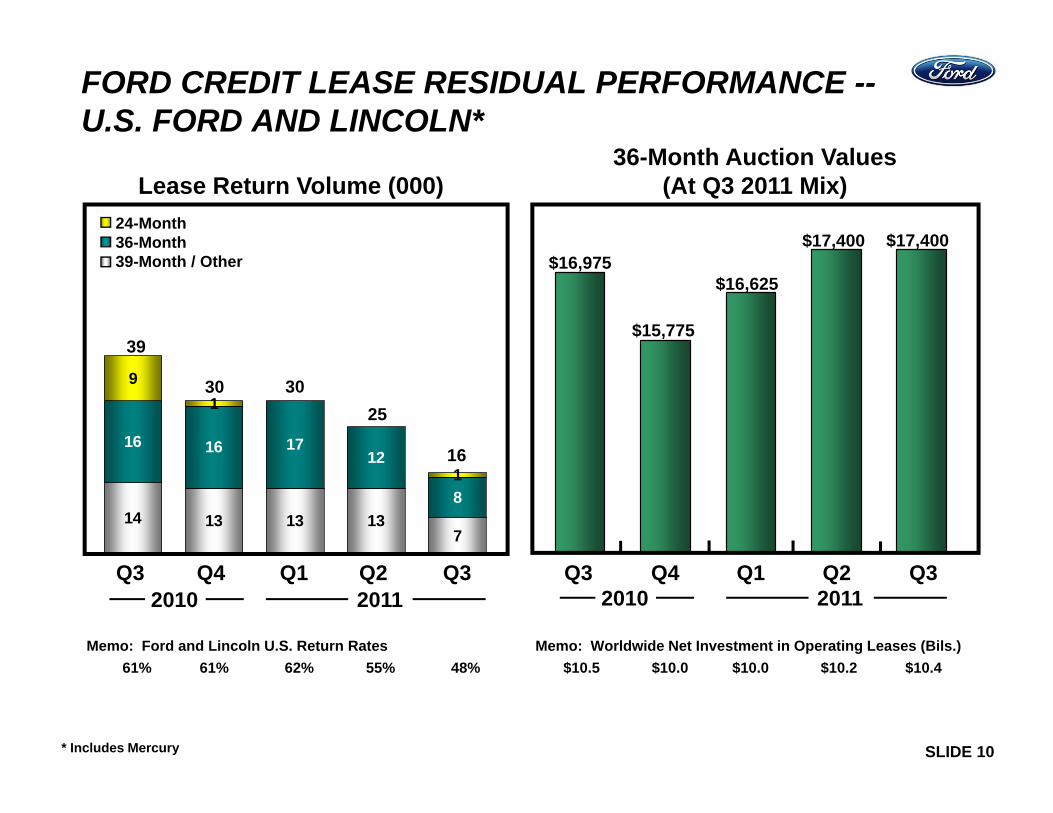
SLIDE 10
Memo: Ford and Lincoln U.S. Return Rates 61% 61% 62% 55% 48%
14 13 13 137
16 16 1712
8
91
1
FORD CREDIT LEASE RESIDUAL PERFORMANCE --U.S. FORD AND LINCOLN*
Lease Return Volume (000)36-Month Auction Values
(At Q3 2011 Mix)
Memo: Worldwide Net Investment in Operating Leases (Bils.)$10.5 $10.0 $10.0 $10.2 $10.4
39
Q1Q3 Q4 Q1Q3 Q4
$16,625
Q2 Q2
$16,975
Q3 Q3
$15,775
2010
30
$17,400
* Includes Mercury
2011
24-Month36-Month39-Month / Other
3025
16
$17,400
2010 2011
SLIDE 11
FORD CREDIT FUNDING HIGHLIGHTS
Our Full Year funding plan is largely complete despite a volatile market environment
Completed $7 billion of funding in the Third Quarter, and additional $3 billion of funding in October
Renewed $5 billion of committed capacity in the Third Quarter
Improving Credit Ratings; FCE Bank now rated investment grade by S&P
Key elements of our funding strategy remain unchanged and our liquidity remains strong
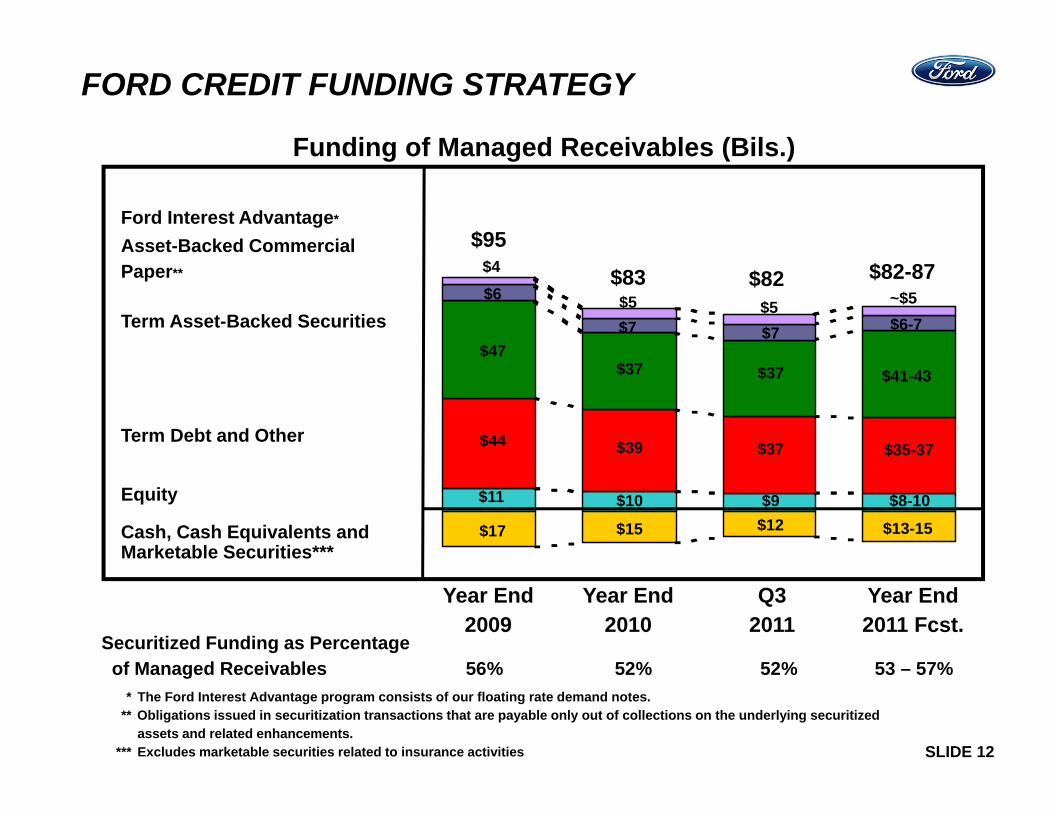
SLIDE 12
Equity
Asset-Backed Commercial Paper**
Year End2009
Year End2010
Year End2011 Fcst.
Securitized Funding as Percentageof Managed Receivables 56% 52% 52% 53 – 57%
Q32011
Term Asset-Backed Securities
Term Debt and Other
Cash, Cash Equivalents and Marketable Securities***
$82-87
$41-43
$35-37
$8-10$13-15
$6-7~$5
Ford Interest Advantage*
$83
$37
$10
$15
$7
$39
$5
$95
$47
$11
$17
$6
$44
$4 $82
$37
$9$12
$37
$7$5
* The Ford Interest Advantage program consists of our floating rate demand notes.** Obligations issued in securitization transactions that are payable only out of collections on the underlying securitized
assets and related enhancements.*** Excludes marketable securities related to insurance activities
Funding of Managed Receivables (Bils.)
FORD CREDIT FUNDING STRATEGY
SLIDE 13
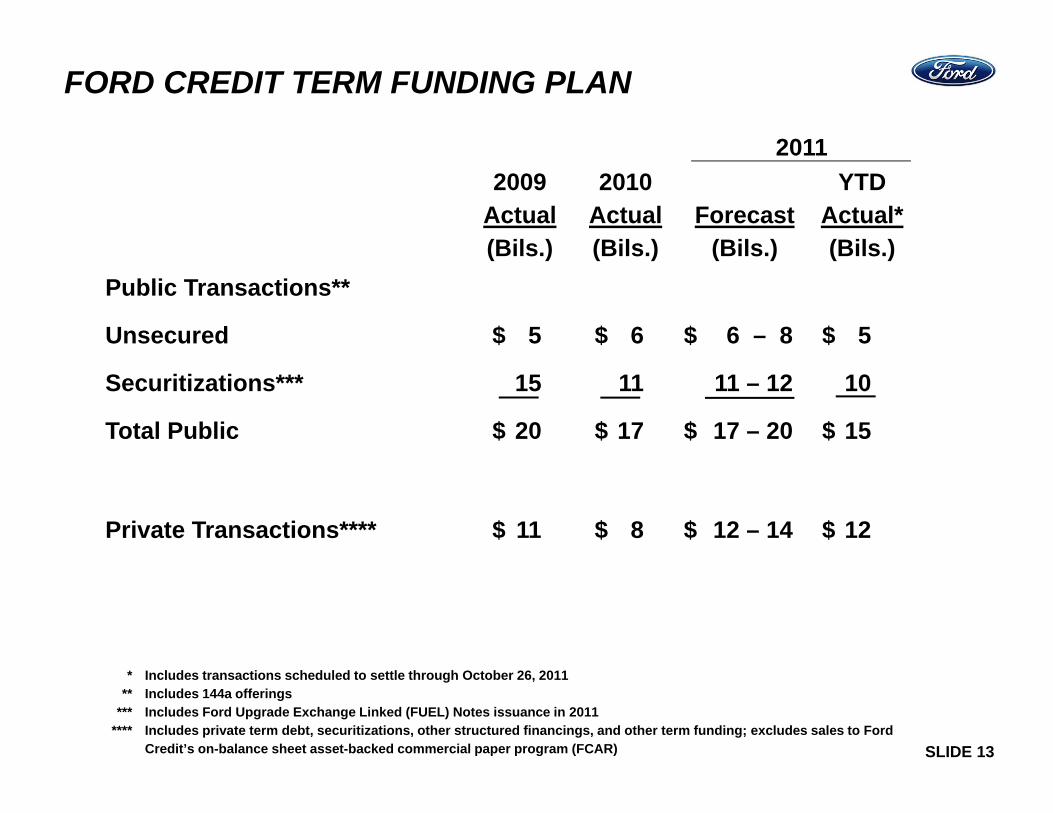
Public Transactions**
Unsecured $ 5 $ 6 $ 6 – 8 $ 5
Securitizations*** 15 11 11 – 12 10
Total Public $ 20 $ 17 $ 17 – 20 $ 15
Private Transactions**** $ 11 $ 8 $ 12 – 14 $ 12
Forecast(Bils.)
2009 Actual(Bils.)
2010 Actual(Bils.)
FORD CREDIT TERM FUNDING PLAN
YTD Actual*(Bils.)
2011
* Includes transactions scheduled to settle through October 26, 2011** Includes 144a offerings
*** Includes Ford Upgrade Exchange Linked (FUEL) Notes issuance in 2011**** Includes private term debt, securitizations, other structured financings, and other term funding; excludes sales to Ford
Credit’s on-balance sheet asset-backed commercial paper program (FCAR)
SLIDE 14
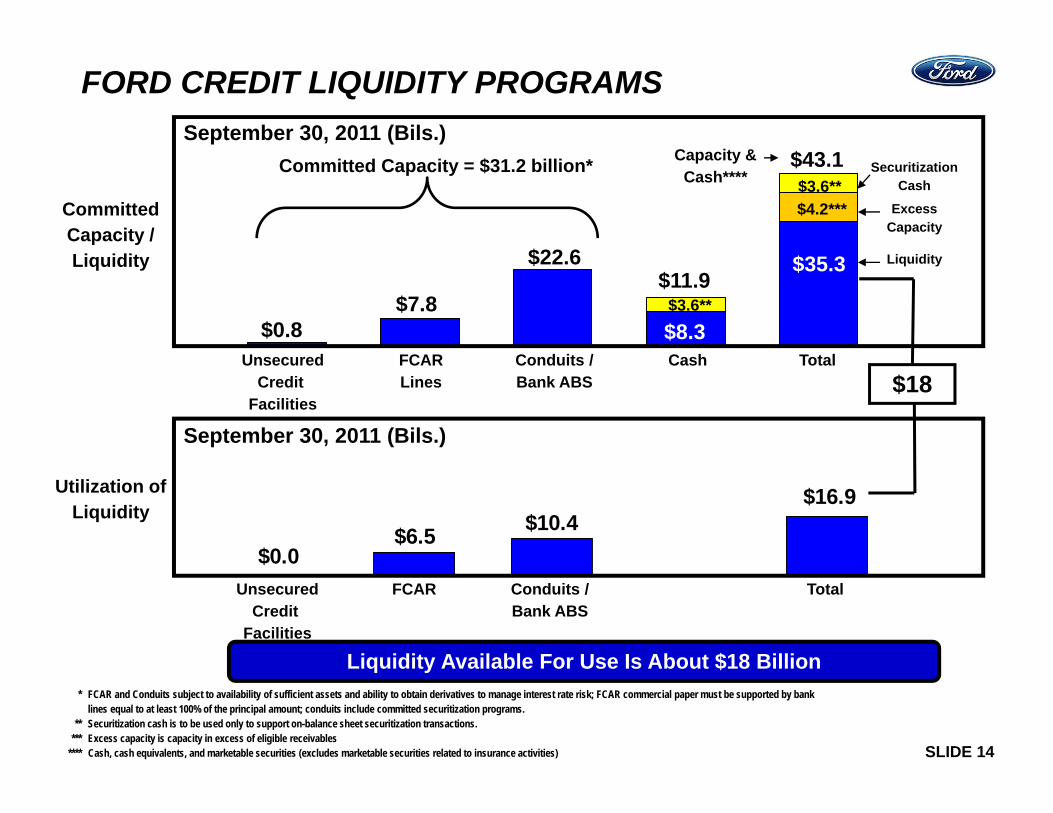
Liquidity Available For Use Is About $18 Billion
FORD CREDIT LIQUIDITY PROGRAMS
CommittedCapacity / Liquidity
September 30, 2011 (Bils.)$43.1
UnsecuredCredit
Facilities
FCARLines
Conduits /Bank ABS
Cash Total
$22.6
$7.8$0.8
$11.9
Capacity & Cash****
$35.3 Liquidity
Committed Capacity = $31.2 billion*
$16.9$10.4$6.5
$0.0Unsecured
Credit Facilities
FCAR Conduits /Bank ABS
Total
September 30, 2011 (Bils.)
$3.6**
$4.2***$3.6**
SecuritizationCash
ExcessCapacity
$18
Utilization of Liquidity
$8.3
* FCAR and Conduits subject to availability of sufficient assets and ability to obtain derivatives to manage interest rate risk; FCAR commercial paper must be supported by banklines equal to at least 100% of the principal amount; conduits include committed securitization programs.
** Securitization cash is to be used only to support on-balance sheet securitization transactions. *** Excess capacity is capacity in excess of eligible receivables
**** Cash, cash equivalents, and marketable securities (excludes marketable securities related to insurance activities)
SLIDE 15
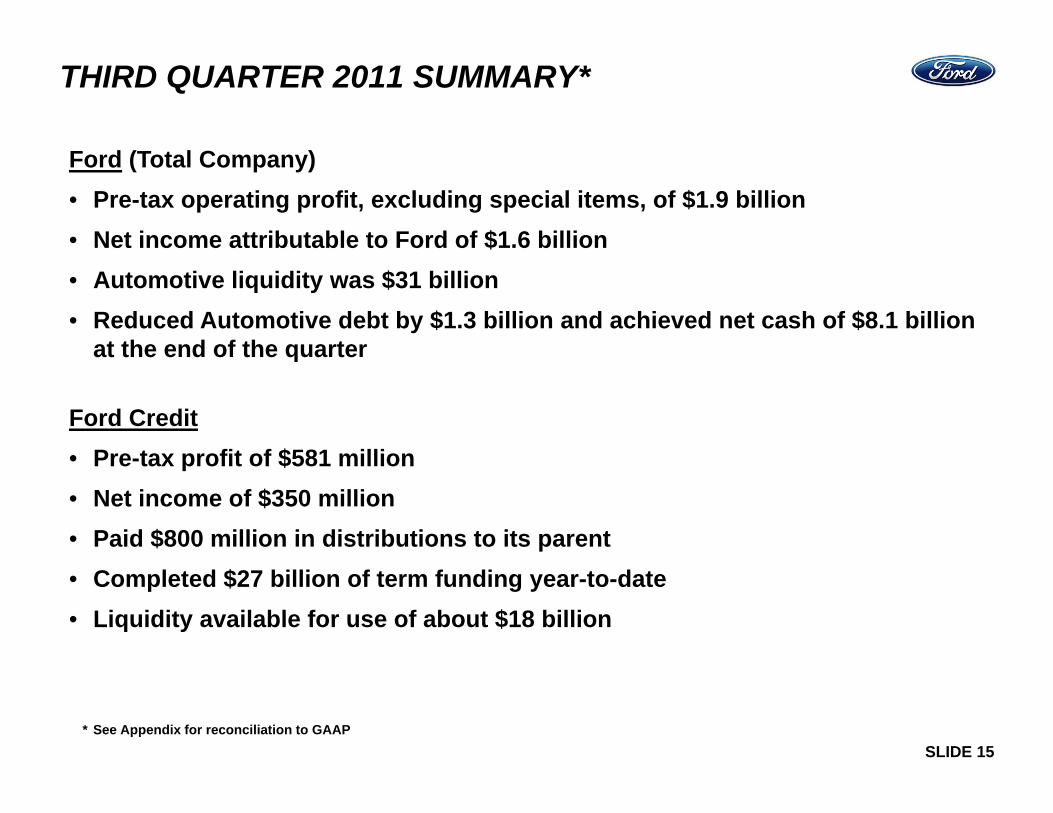
Ford (Total Company)• Pre-tax operating profit, excluding special items, of $1.9 billion• Net income attributable to Ford of $1.6 billion• Automotive liquidity was $31 billion• Reduced Automotive debt by $1.3 billion and achieved net cash of $8.1 billion
at the end of the quarter
Ford Credit• Pre-tax profit of $581 million• Net income of $350 million• Paid $800 million in distributions to its parent• Completed $27 billion of term funding year-to-date • Liquidity available for use of about $18 billion
THIRD QUARTER 2011 SUMMARY*
* See Appendix for reconciliation to GAAP
SLIDE 16
Statements included or incorporated by reference herein may constitute “forward-looking statements” within the meaning of the Private Securities Litigation Reform Act of 1995. Forward-looking statements are based on expectations, forecasts, and assumptions by our management and involve a number of risks, uncertainties, and other factors that could cause actual results to differ materially from those stated, including, without limitation:
SAFE HARBOR
We cannot be certain that any expectations, forecasts or assumptions made by management in preparing these forward-looking statements will prove accurate, or that any projections will be realized. It is to be expected that there may be differences between projected and actual results. Our forward-looking statements speak only as of the date of their initial issuance, and we do not undertake any obligation to update or revise publicly any forward-looking statements, whether as a result of new information, future events or otherwise. For additional discussion of these risk factors, see Item 1A of Part I of Ford’s 2010 10-K Report and Item 1A of Part I of Ford Credit’s 2010 10-K Report.
Automotive Related:• Decline in industry sales volume, particularly in the United States or Europe, due to financial crisis, recession, geo-political events or other factors;• Decline in Ford’s market share or failure to achieve growth;• Lower-than-anticipated market acceptance of new or existing Ford products;• An increase in or acceleration of market shift beyond Ford’s current planning assumptions from sales of trucks, medium- and large-sized utilities, or other more profitable
vehicles, particularly in the United States;• An increase in fuel prices, continued volatility of fuel prices, or reduced availability of fuel;• Continued or increased price competition resulting from industry overcapacity, currency fluctuations or other factors;• Adverse effects from the bankruptcy, insolvency, or government-funded restructuring of, change in ownership or control of, or alliances entered into by a major competitor;• Economic distress of suppliers may require Ford to provide substantial financial support or take other measures to ensure supplies of components or materials and could
increase Ford’s costs, affect Ford’s liquidity, or cause production constraints or disruptions;• Work stoppages at Ford or supplier facilities or other interruptions of production;• Single-source supply of components or materials;• Restriction on use of tax attributes from tax law “ownership change”;• The discovery of defects in Ford vehicles resulting in delays in new model launches, recall campaigns, reputational damage or increased warranty costs;• Increased safety, emissions, fuel economy or other regulation resulting in higher costs, cash expenditures and/or sales restrictions;• Unusual or significant litigation, governmental investigations or adverse publicity arising out of alleged defects in Ford products, perceived environmental impacts, or otherwise;• A change in Ford’s requirements for parts where it has entered into long-term supply arrangements that commit it to purchase minimum or fixed quantities of certain parts, or to
pay a minimum amount to the seller (“take-or-pay contracts”);• Adverse effects on Ford’s results from a decrease in or cessation or clawback of government incentives related to capital investments;• Adverse effects on Ford’s operations resulting from certain geo-political or other events;• Substantial levels of indebtedness adversely affecting Ford’s financial condition or preventing Ford from fulfilling its debt obligations;Ford Credit Related:• Inability to access debt, securitization or derivative markets around the world at competitive rates or in sufficient amounts due to credit rating downgrades, market volatility,
market disruption, regulatory requirements or other factors;• Higher-than-expected credit losses;• Increased competition from banks or other financial institutions seeking to increase their share of financing Ford vehicles;• Collection and servicing problems related to our finance receivables and net investment in operating leases;• Lower-than-anticipated residual values or higher-than-expected return volumes for leased vehicles;• New or increased credit, consumer or data protection or other laws and regulations resulting in higher costs and/or additional financing restrictions;• Imposition of additional costs or restrictions due to the Dodd-Frank Wall Street Reform and Consumer Protection Act (the “Act”) and its implementing rules and regulations;• Changes in Ford’s operations or changes in Ford’s marketing programs could result in a decline in our financing volumes;General:• Fluctuations in foreign currency exchange rates and interest rates;• Failure of financial institutions to fulfill commitments under committed credit and liquidity facilities;• Labor or other constraints on Ford’s or our ability to maintain competitive cost structure;• Substantial pension and postretirement healthcare and life insurance liabilities impairing Ford’s or our liquidity or financial condition; • Worse-than-assumed economic and demographic experience for postretirement benefit plans (e.g., discount rates or investment returns); and• Inherent limitations of internal controls impacting financing statements and safeguarding of assets.

APPENDIX
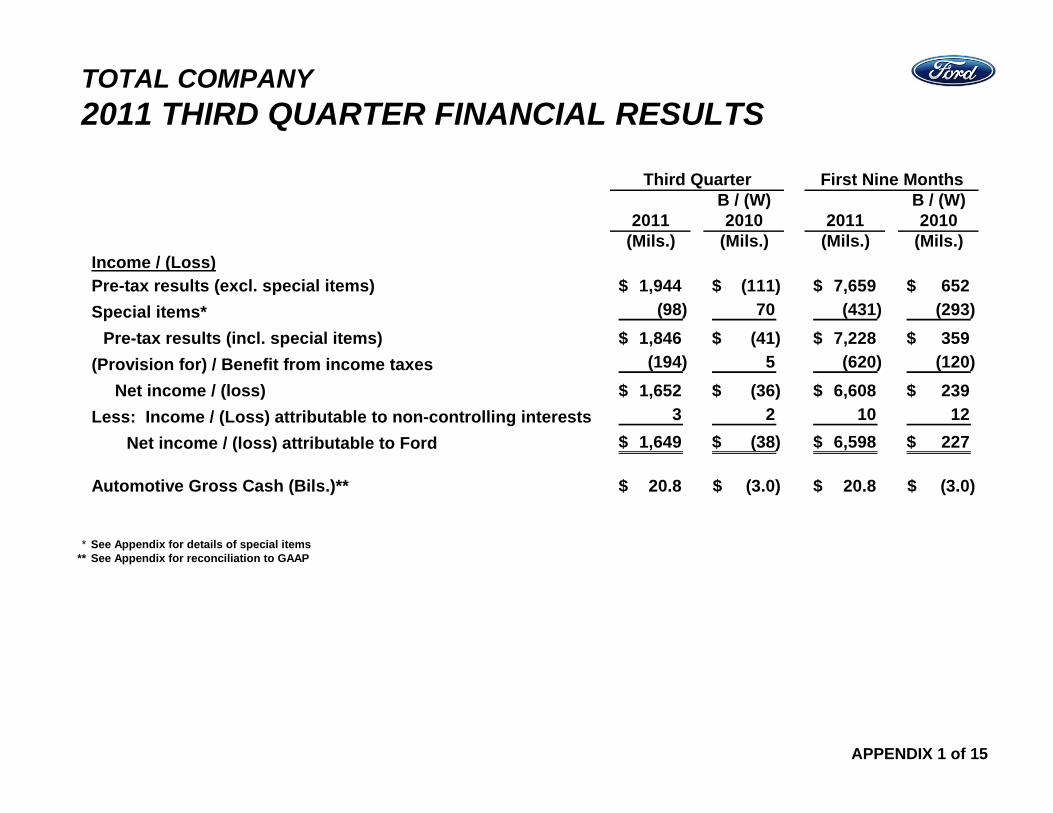
TOTAL COMPANY2011 THIRD QUARTER FINANCIAL RESULTS
B / (W) B / (W)2011 2010 2011 2010
(Mils.) (Mils.) (Mils.) (Mils.)Income / (Loss)Pre-tax results (excl. special items) 1,944$ (111)$ 7,659$ 652$ Special items* (98) 70 (431) (293)
Pre-tax results (incl. special items) 1,846$ (41)$ 7,228$ 359$ (Provision for) / Benefit from income taxes (194) 5 (620) (120)
Net income / (loss) 1,652$ (36)$ 6,608$ 239$ Less: Income / (Loss) attributable to non-controlling interests 3 2 10 12
Net income / (loss) attributable to Ford 1,649$ (38)$ 6,598$ 227$
Automotive Gross Cash (Bils.)** 20.8$ (3.0)$ 20.8$ (3.0)$
* See Appendix for details of special items ** See Appendix for reconciliation to GAAP
Third Quarter First Nine Months
APPENDIX 1 of 15
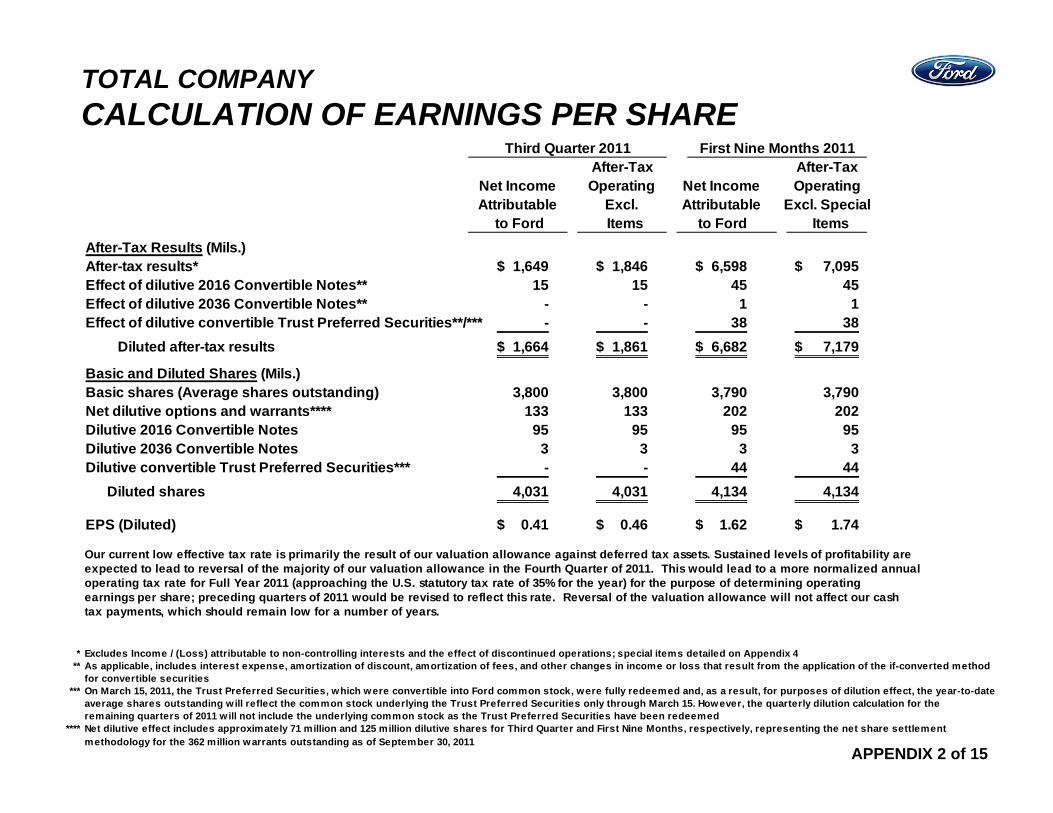
TOTAL COMPANYCALCULATION OF EARNINGS PER SHARE
APPENDIX 2 of 15
After-TaxOperating
Excl. Special Items
After-Tax Results (Mils.)After-tax results* 1,649$ 1,846$ 6,598$ 7,095$ Effect of dilutive 2016 Convertible Notes** 15 15 45 45 Effect of dilutive 2036 Convertible Notes** - - 1 1 Effect of dilutive convertible Trust Preferred Securities**/*** - - 38 38
Diluted after-tax results 1,664$ 1,861$ 6,682$ 7,179$
Basic and Diluted Shares (Mils.)Basic shares (Average shares outstanding) 3,800 3,800 3,790 3,790 Net dilutive options and warrants**** 133 133 202 202 Dilutive 2016 Convertible Notes 95 95 95 95 Dilutive 2036 Convertible Notes 3 3 3 3 Dilutive convertible Trust Preferred Securities*** - - 44 44
Diluted shares 4,031 4,031 4,134 4,134
EPS (Diluted) 0.41$ 0.46$ 1.62$ 1.74$
Our current low effective tax rate is primarily the result of our valuation allowance against deferred tax assets. Sustained levels of profitability areexpected to lead to reversal of the majority of our valuation allowance in the Fourth Quarter of 2011. This would lead to a more normalized annualoperating tax rate for Full Year 2011 (approaching the U.S. statutory tax rate of 35% for the year) for the purpose of determining operatingearnings per share; preceding quarters of 2011 would be revised to reflect this rate. Reversal of the valuation allowance will not affect our cashtax payments, which should remain low for a number of years.
* Excludes Income / (Loss) attributable to non-controlling interests and the effect of discontinued operations; special items detailed on Appendix 4** As applicable, includes interest expense, amortization of discount, amortization of fees, and other changes in income or loss that result from the application of the if-converted method
for convertible securities*** On March 15, 2011, the Trust Preferred Securities, which were convertible into Ford common stock, were fully redeemed and, as a result, for purposes of dilution effect, the year-to-date
average shares outstanding will reflect the common stock underlying the Trust Preferred Securities only through March 15. However, the quarterly dilution calculation for the remaining quarters of 2011 will not include the underlying common stock as the Trust Preferred Securities have been redeemed
**** Net dilutive effect includes approximately 71 million and 125 million dilutive shares for Third Quarter and First Nine Months, respectively, representing the net share settlement methodology for the 362 million warrants outstanding as of September 30, 2011
AttributableNet Income Operating
Third Quarter 2011 First Nine Months 2011After-Tax
to Ford to Ford Items
Net IncomeAttributable Excl.
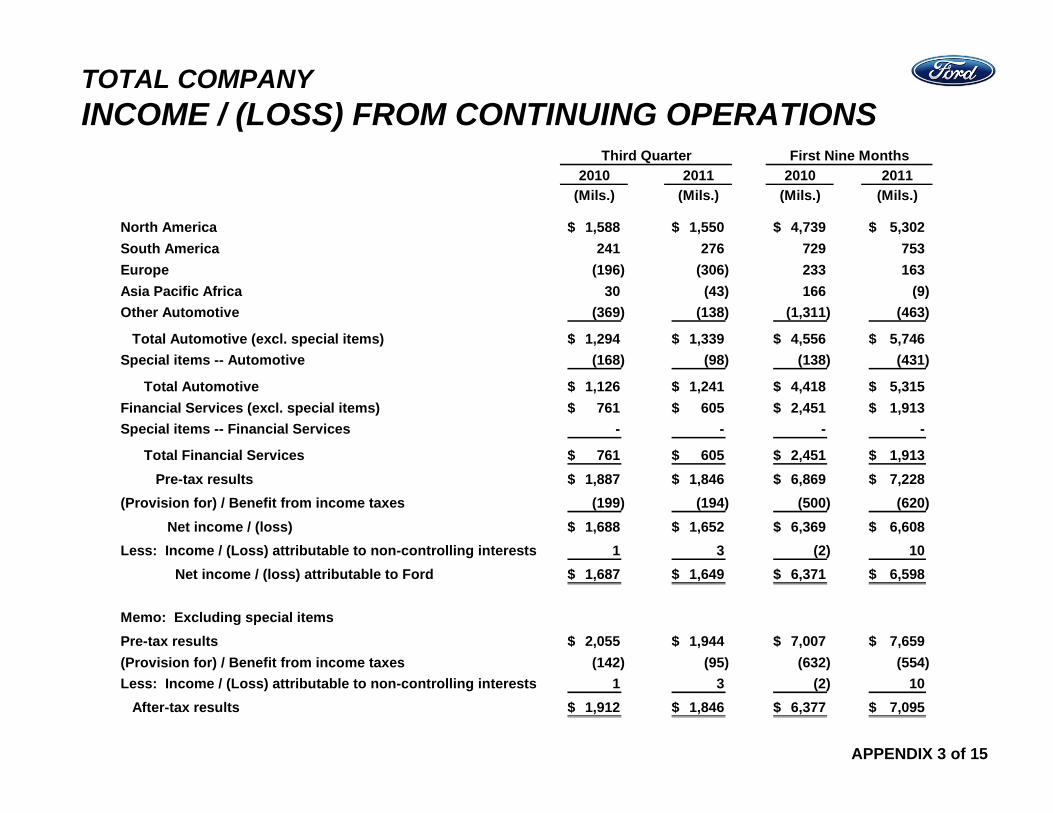
TOTAL COMPANYINCOME / (LOSS) FROM CONTINUING OPERATIONS
APPENDIX 3 of 15
2010 2011 2010 2011(Mils.) (Mils.) (Mils.) (Mils.)
North America 1,588$ 1,550$ 4,739$ 5,302$ South America 241 276 729 753 Europe (196) (306) 233 163 Asia Pacific Africa 30 (43) 166 (9) Other Automotive (369) (138) (1,311) (463)
Total Automotive (excl. special items) 1,294$ 1,339$ 4,556$ 5,746$ Special items -- Automotive (168) (98) (138) (431)
Total Automotive 1,126$ 1,241$ 4,418$ 5,315$ Financial Services (excl. special items) 761$ 605$ 2,451$ 1,913$ Special items -- Financial Services - - - -
Total Financial Services 761$ 605$ 2,451$ 1,913$ Pre-tax results 1,887$ 1,846$ 6,869$ 7,228$
(Provision for) / Benefit from income taxes (199) (194) (500) (620) Net income / (loss) 1,688$ 1,652$ 6,369$ 6,608$
Less: Income / (Loss) attributable to non-controlling interests 1 3 (2) 10 Net income / (loss) attributable to Ford 1,687$ 1,649$ 6,371$ 6,598$
Memo: Excluding special itemsPre-tax results 2,055$ 1,944$ 7,007$ 7,659$ (Provision for) / Benefit from income taxes (142) (95) (632) (554) Less: Income / (Loss) attributable to non-controlling interests 1 3 (2) 10
After-tax results 1,912$ 1,846$ 6,377$ 7,095$
Third Quarter First Nine Months
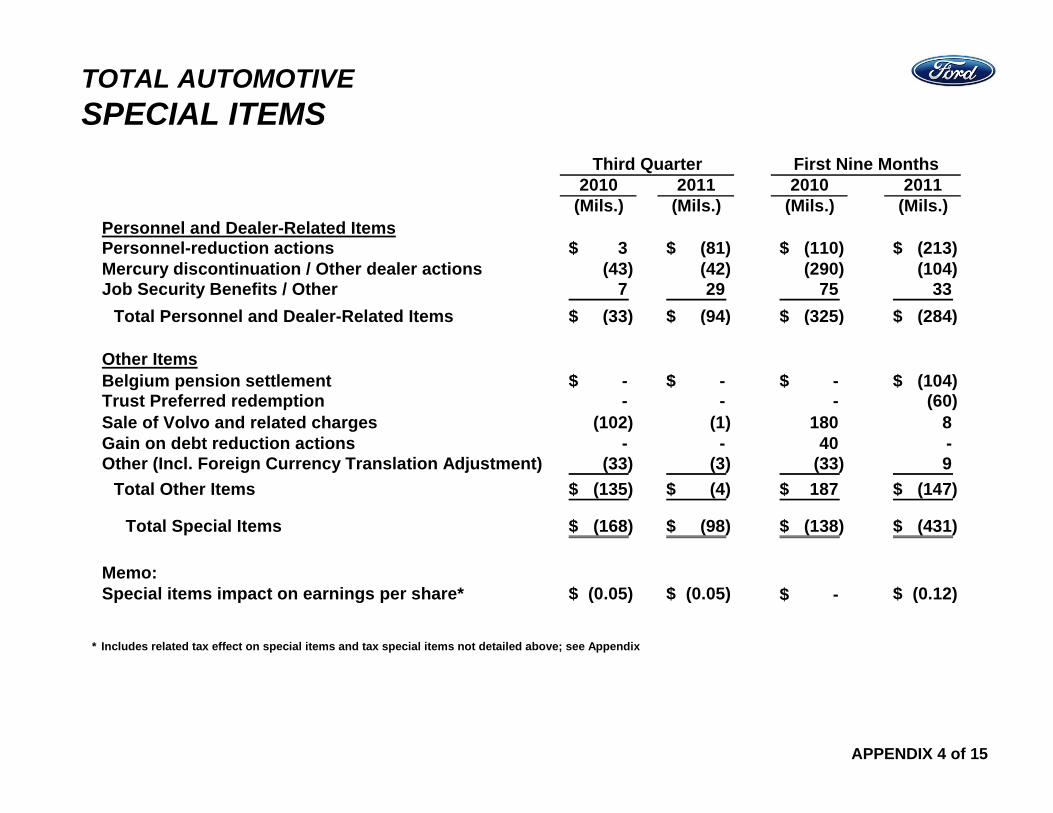
TOTAL AUTOMOTIVESPECIAL ITEMS
APPENDIX 4 of 15
2010 2011 2010 2011(Mils.) (Mils.) (Mils.) (Mils.)
Personnel and Dealer-Related ItemsPersonnel-reduction actions 3$ (81)$ (110)$ (213)$ Mercury discontinuation / Other dealer actions (43) (42) (290) (104) Job Security Benefits / Other 7 29 75 33
Total Personnel and Dealer-Related Items (33)$ (94)$ (325)$ (284)$
Other ItemsBelgium pension settlement -$ -$ -$ (104)$ Trust Preferred redemption - - - (60) Sale of Volvo and related charges (102) (1) 180 8 Gain on debt reduction actions - - 40 - Other (Incl. Foreign Currency Translation Adjustment) (33) (3) (33) 9
Total Other Items (135)$ (4)$ 187$ (147)$
Total Special Items (168)$ (98)$ (138)$ (431)$
Memo:Special items impact on earnings per share* (0.05)$ (0.05)$ -$ (0.12)$
* Includes related tax effect on special items and tax special items not detailed above; see Appendix
Third Quarter First Nine Months
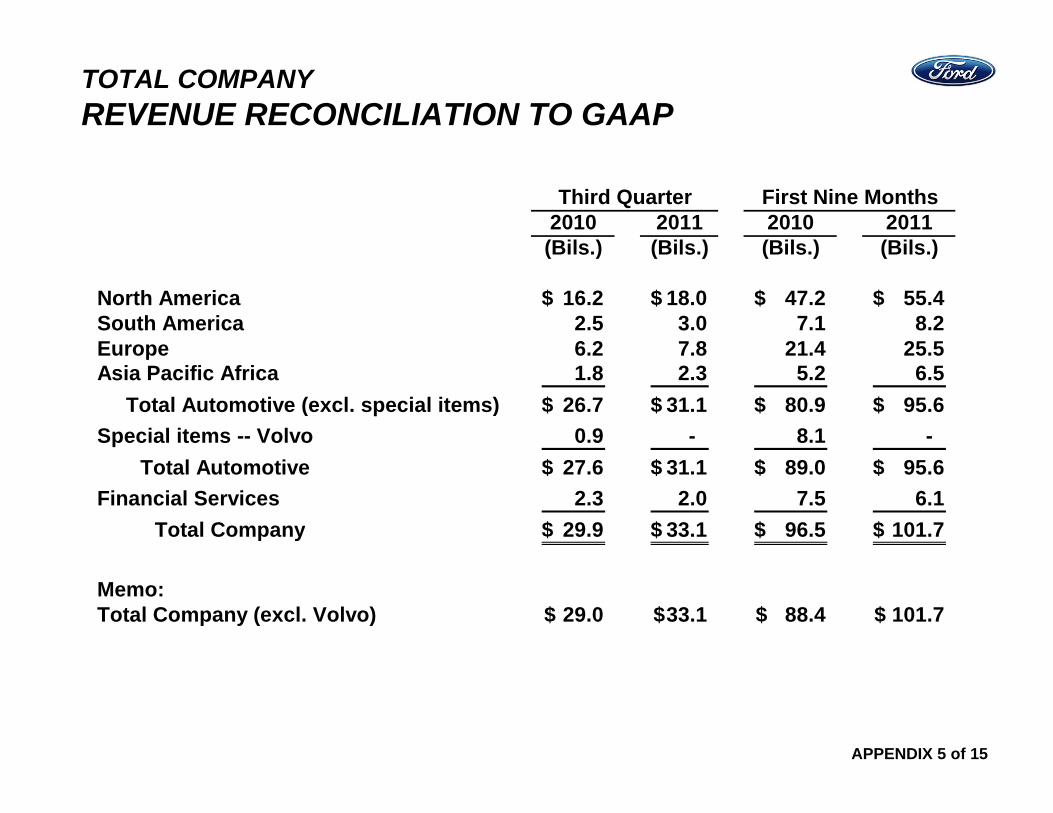
TOTAL COMPANYREVENUE RECONCILIATION TO GAAP
APPENDIX 5 of 15
2010 2011 2010 2011(Bils.) (Bils.) (Bils.) (Bils.)
North America 16.2$ 18.0$ 47.2$ 55.4$ South America 2.5 3.0 7.1 8.2 Europe 6.2 7.8 21.4 25.5 Asia Pacific Africa 1.8 2.3 5.2 6.5
Total Automotive (excl. special items) 26.7$ 31.1$ 80.9$ 95.6$ Special items -- Volvo 0.9 - 8.1 -
Total Automotive 27.6$ 31.1$ 89.0$ 95.6$ Financial Services 2.3 2.0 7.5 6.1
Total Company 29.9$ 33.1$ 96.5$ 101.7$
Memo:Total Company (excl. Volvo) 29.0$ 33.1$ 88.4$ 101.7$
First Nine MonthsThird Quarter
APPENDIX 6 of 15
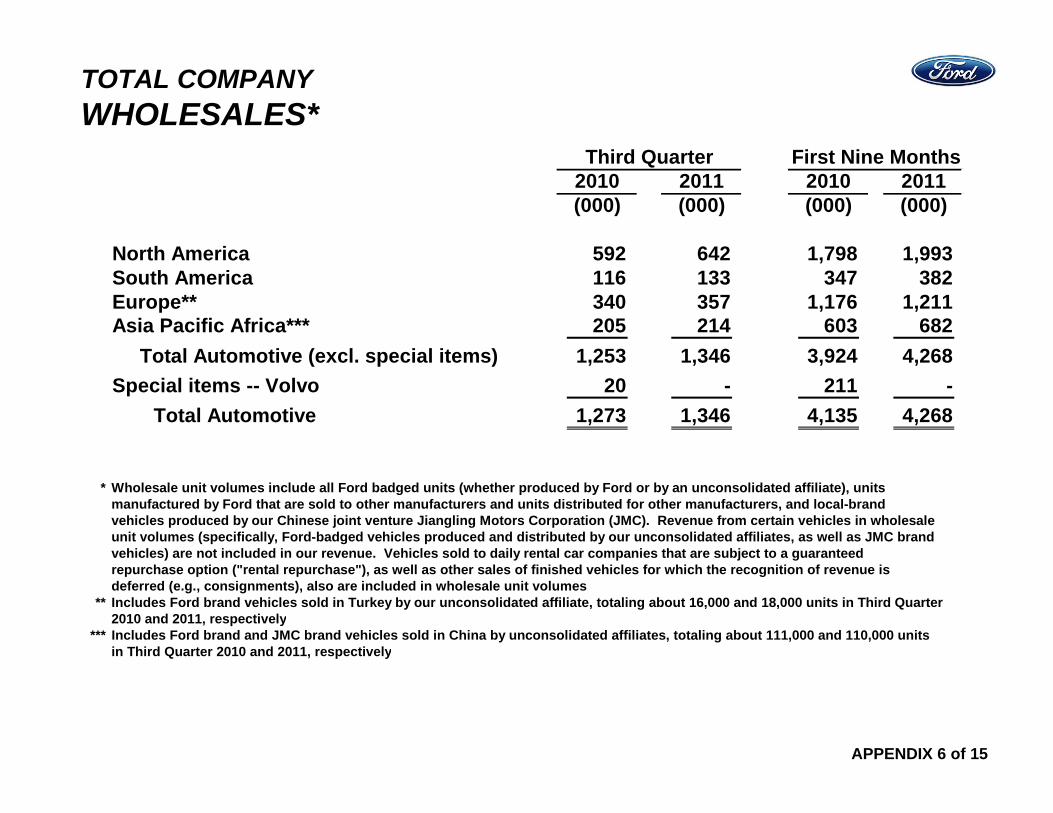
TOTAL COMPANYWHOLESALES*
2010 2011 2010 2011(000) (000) (000) (000)
North America 592 642 1,798 1,993South America 116 133 347 382 Europe** 340 357 1,176 1,211Asia Pacific Africa*** 205 214 603 682
Total Automotive (excl. special items) 1,253 1,346 3,924 4,268Special items -- Volvo 20 - 211 -
Total Automotive 1,273 1,346 4,135 4,268
* Wholesale unit volumes include all Ford badged units (whether produced by Ford or by an unconsolidated affiliate), unitsmanufactured by Ford that are sold to other manufacturers and units distributed for other manufacturers, and local-brandvehicles produced by our Chinese joint venture Jiangling Motors Corporation (JMC). Revenue from certain vehicles in wholesaleunit volumes (specifically, Ford-badged vehicles produced and distributed by our unconsolidated affiliates, as well as JMC brandvehicles) are not included in our revenue. Vehicles sold to daily rental car companies that are subject to a guaranteedrepurchase option ("rental repurchase"), as well as other sales of finished vehicles for which the recognition of revenue isdeferred (e.g., consignments), also are included in wholesale unit volumes
** Includes Ford brand vehicles sold in Turkey by our unconsolidated affiliate, totaling about 16,000 and 18,000 units in Third Quarter2010 and 2011, respectively
*** Includes Ford brand and JMC brand vehicles sold in China by unconsolidated affiliates, totaling about 111,000 and 110,000 unitsin Third Quarter 2010 and 2011, respectively
Third Quarter First Nine Months
APPENDIX 7 of 15
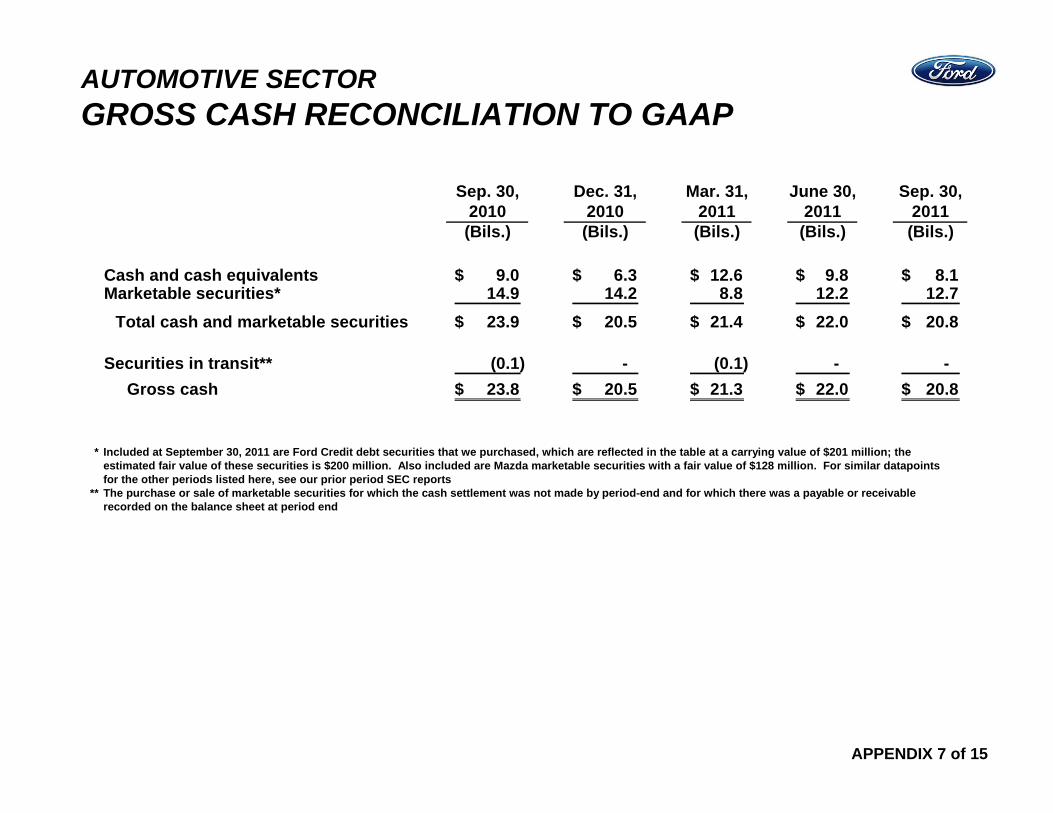
AUTOMOTIVE SECTORGROSS CASH RECONCILIATION TO GAAP
Sep. 30, Dec. 31, Mar. 31, June 30, Sep. 30,2010 2010 2011 2011 2011(Bils.) (Bils.) (Bils.) (Bils.) (Bils.)
Cash and cash equivalents 9.0$ 6.3$ 12.6$ 9.8$ 8.1$ Marketable securities* 14.9 14.2 8.8 12.2 12.7
Total cash and marketable securities 23.9$ 20.5$ 21.4$ 22.0$ 20.8$
Securities in transit** (0.1) - (0.1) - - Gross cash 23.8$ 20.5$ 21.3$ 22.0$ 20.8$
* Included at September 30, 2011 are Ford Credit debt securities that we purchased, which are reflected in the table at a carrying value of $201 million; theestimated fair value of these securities is $200 million. Also included are Mazda marketable securities with a fair value of $128 million. For similar datapointsfor the other periods listed here, see our prior period SEC reports
** The purchase or sale of marketable securities for which the cash settlement was not made by period-end and for which there was a payable or receivablerecorded on the balance sheet at period end
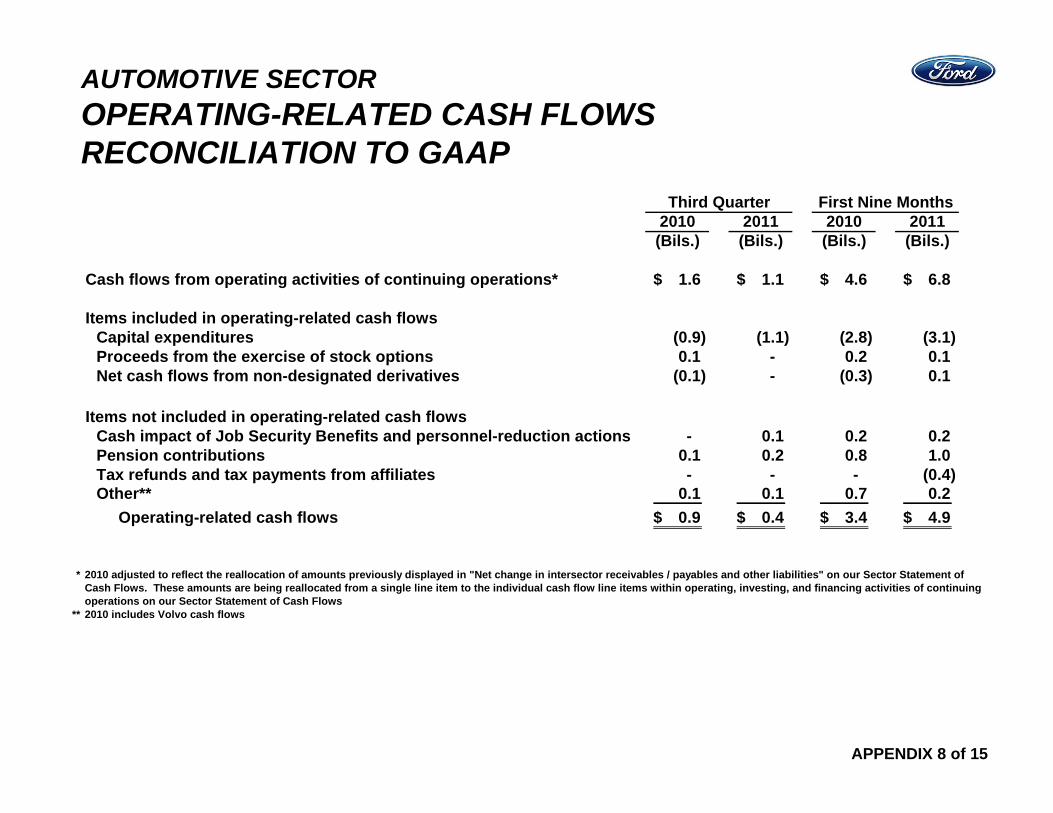
AUTOMOTIVE SECTOROPERATING-RELATED CASH FLOWS RECONCILIATION TO GAAP
APPENDIX 8 of 15
2010 2011 2010 2011(Bils.) (Bils.) (Bils.) (Bils.)
Cash flows from operating activities of continuing operations* 1.6$ 1.1$ 4.6$ 6.8$
Items included in operating-related cash flowsCapital expenditures (0.9) (1.1) (2.8) (3.1) Proceeds from the exercise of stock options 0.1 - 0.2 0.1 Net cash flows from non-designated derivatives (0.1) - (0.3) 0.1
Items not included in operating-related cash flowsCash impact of Job Security Benefits and personnel-reduction actions - 0.1 0.2 0.2 Pension contributions 0.1 0.2 0.8 1.0 Tax refunds and tax payments from affiliates - - - (0.4) Other** 0.1 0.1 0.7 0.2
Operating-related cash flows 0.9$ 0.4$ 3.4$ 4.9$
* 2010 adjusted to reflect the reallocation of amounts previously displayed in "Net change in intersector receivables / payables and other liabilities" on our Sector Statement ofCash Flows. These amounts are being reallocated from a single line item to the individual cash flow line items within operating, investing, and financing activities of continuingoperations on our Sector Statement of Cash Flows
** 2010 includes Volvo cash flows
Third Quarter First Nine Months
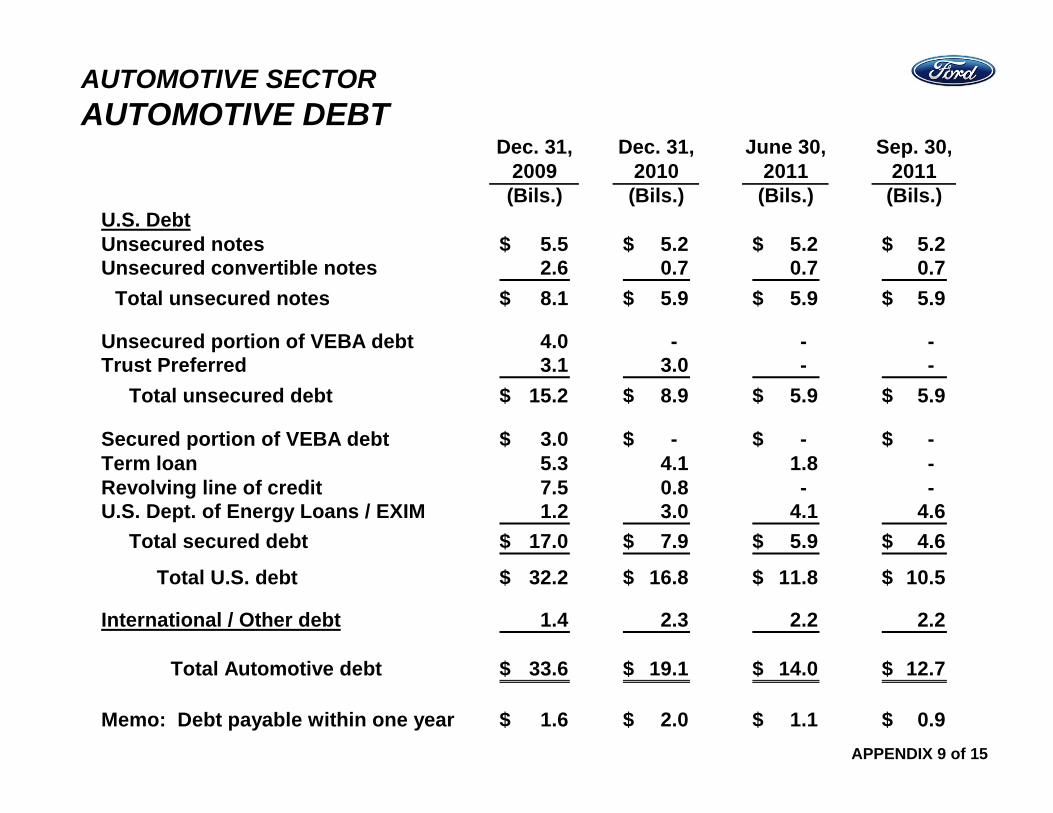
AUTOMOTIVE SECTORAUTOMOTIVE DEBT
APPENDIX 9 of 15
Dec. 31, Dec. 31, June 30, Sep. 30,2009 2010 2011 2011(Bils.) (Bils.) (Bils.) (Bils.)
U.S. DebtUnsecured notes 5.5$ 5.2$ 5.2$ 5.2$ Unsecured convertible notes 2.6 0.7 0.7 0.7
Total unsecured notes 8.1$ 5.9$ 5.9$ 5.9$
Unsecured portion of VEBA debt 4.0 - - - Trust Preferred 3.1 3.0 - -
Total unsecured debt 15.2$ 8.9$ 5.9$ 5.9$
Secured portion of VEBA debt 3.0$ -$ -$ -$ Term loan 5.3 4.1 1.8 - Revolving line of credit 7.5 0.8 - - U.S. Dept. of Energy Loans / EXIM 1.2 3.0 4.1 4.6
Total secured debt 17.0$ 7.9$ 5.9$ 4.6$
Total U.S. debt 32.2$ 16.8$ 11.8$ 10.5$
International / Other debt 1.4 2.3 2.2 2.2
Total Automotive debt 33.6$ 19.1$ 14.0$ 12.7$
Memo: Debt payable within one year 1.6$ 2.0$ 1.1$ 0.9$
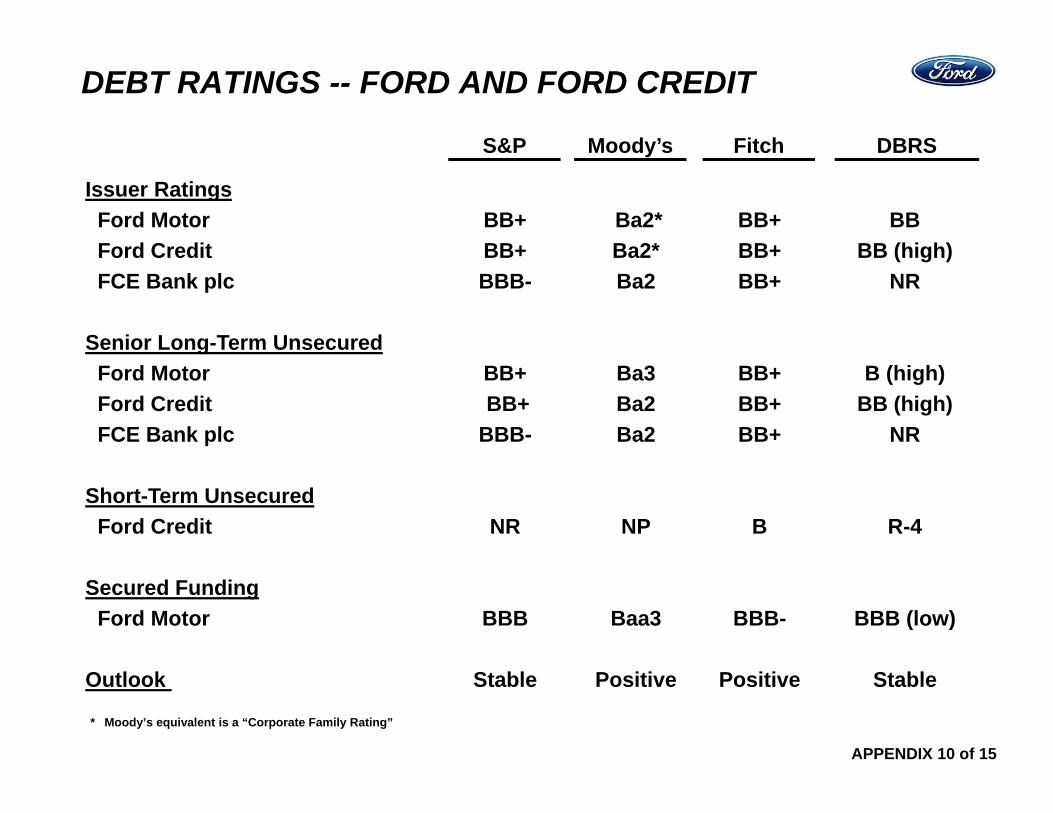
DEBT RATINGS -- FORD AND FORD CREDIT
Issuer RatingsFord Motor BB+ Ba2* BB+ BBFord Credit BB+ Ba2* BB+ BB (high)FCE Bank plc BBB- Ba2 BB+ NR
Senior Long-Term UnsecuredFord Motor BB+ Ba3 BB+ B (high)Ford Credit BB+ Ba2 BB+ BB (high)FCE Bank plc BBB- Ba2 BB+ NR
Short-Term UnsecuredFord Credit NR NP B R-4
Secured FundingFord Motor BBB Baa3 BBB- BBB (low)
Outlook Stable Positive Positive Stable
DBRSFitchMoody’sS&P
* Moody’s equivalent is a “Corporate Family Rating”
APPENDIX 10 of 15
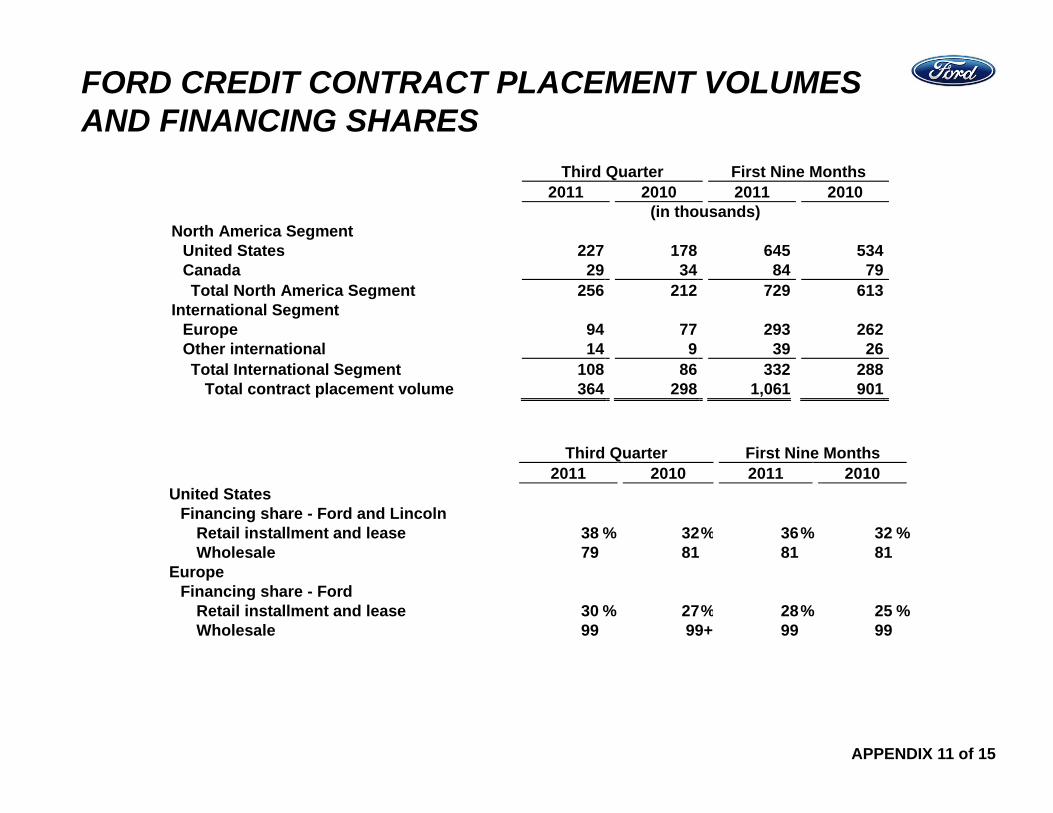
FORD CREDIT CONTRACT PLACEMENT VOLUMES AND FINANCING SHARES
APPENDIX 11 of 15
Third Quarter First Nine Months 2011 2010 2011 2010 (in thousands)North America Segment
United States 227 178 645 534Canada 29 34 84 79Total North America Segment 256 212 729 613
International Segment Europe 94 77 293 262Other international 14 9 39 26Total International Segment 108 86 332 288
Total contract placement volume 364 298 1,061 901
Third Quarter First Nine Months 2011 2010 2011 2010United States
Financing share - Ford and Lincoln Retail installment and lease 38 % 32% 36% 32 %Wholesale 79 81 81 81
Europe Financing share - Ford
Retail installment and lease 30 % 27% 28% 25 %Wholesale 99 99+ 99 99
FORD CREDIT KEY METRIC DEFINITIONS
In evaluating Ford Credit’s financial performance, Ford Credit management uses financial measures based on GAAP, as well as financial measures that include adjustments from GAAP; these measures are defined below. Information about the impact of on-balance sheet securitization is also included below:
Managed Receivables -- receivables reported on Ford Credit’s balance sheet, excluding unearned interest supplements related to finance receivables
Equity -- shareholder’s interest reported on Ford Credit’s balance sheet
Impact of On-Balance Sheet Securitization -- finance receivables (retail and wholesale) and net investment in operating leases reported on Ford Credit's balance sheet include assets that have been sold for legal purposes in securitization transactions that do not satisfy the requirements for accounting sale treatment. These receivables are available only for payment of the debt and other obligations issued or arising in the securitization transactions; they are not available to pay the other obligations of Ford Credit or the claims of Ford Credit's other creditors. Debt reported on Ford Credit's balance sheet includes obligations issued or arising in securitization transactions that are payable only out of collections on the underlying securitized assets and related enhancements. Ford Credit holds the right to the excess cash flows not needed to pay the debt and other obligations issued or arising in each of these securitization transactions
APPENDIX 12 of 15
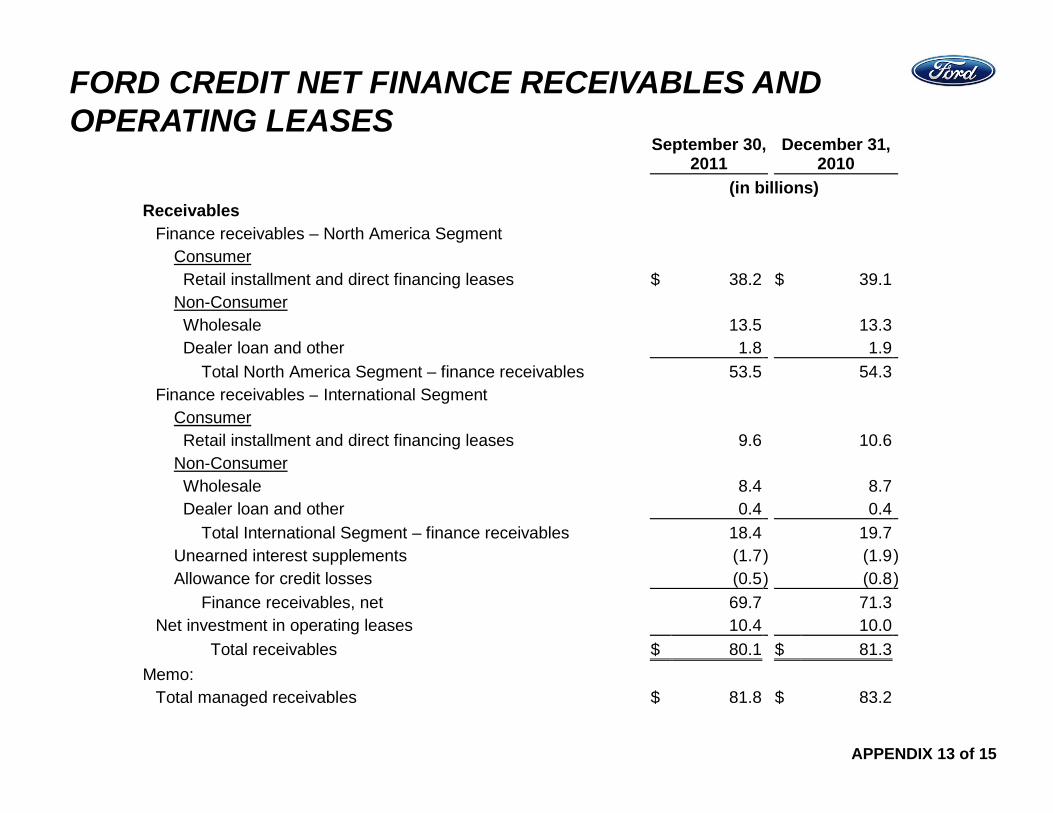
FORD CREDIT NET FINANCE RECEIVABLES AND OPERATING LEASES
APPENDIX 13 of 15
September 30,
2011December 31,
2010 (in billions)Receivables
Finance receivables – North America Segment Consumer Retail installment and direct financing leases $ 38.2 $ 39.1
Non-Consumer Wholesale 13.5 13.3Dealer loan and other 1.8 1.9
Total North America Segment – finance receivables 53.5 54.3Finance receivables – International Segment
Consumer Retail installment and direct financing leases 9.6 10.6
Non-Consumer Wholesale 8.4 8.7Dealer loan and other 0.4 0.4
Total International Segment – finance receivables 18.4 19.7Unearned interest supplements (1.7) (1.9)Allowance for credit losses (0.5) (0.8)
Finance receivables, net 69.7 71.3Net investment in operating leases 10.4 10.0
Total receivables $ 80.1 $ 81.3Memo:
Total managed receivables $ 81.8 $ 83.2
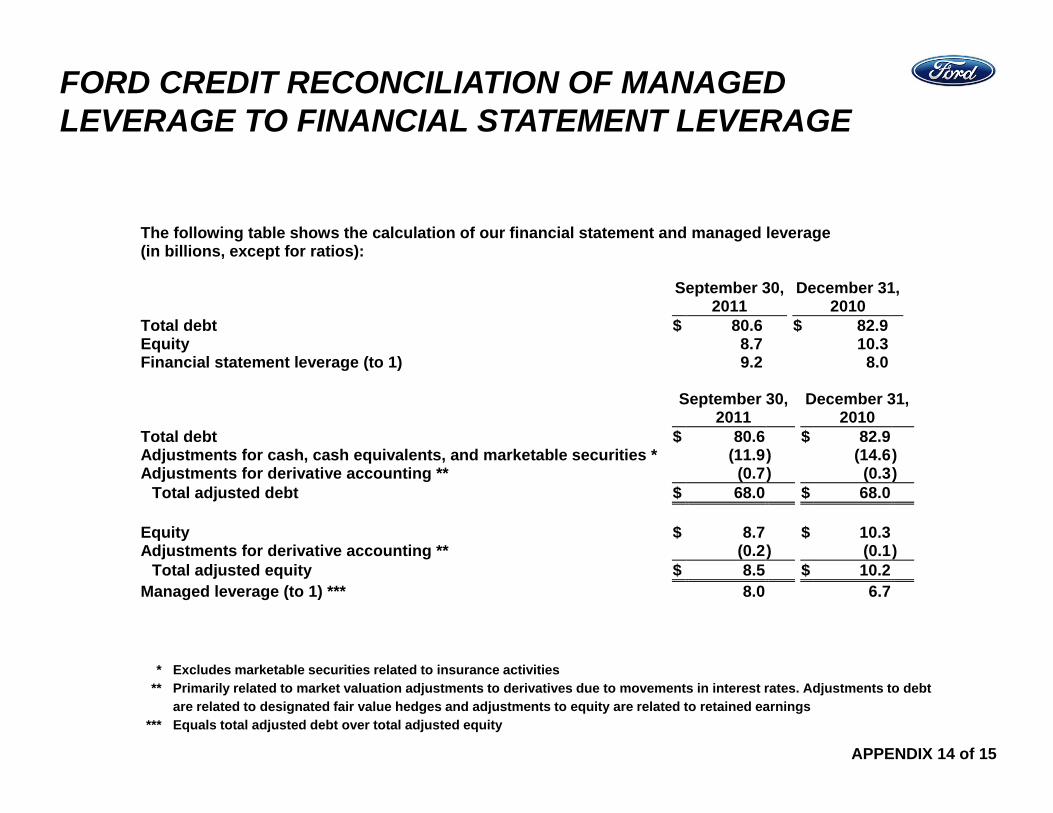
FORD CREDIT RECONCILIATION OF MANAGED LEVERAGE TO FINANCIAL STATEMENT LEVERAGE
APPENDIX 14 of 15
The following table shows the calculation of our financial statement and managed leverage (in billions, except for ratios):
September 30,
2011 December 31,
2010 Total debt $ 80.6 $ 82.9Equity 8.7 10.3Financial statement leverage (to 1) 9.2 8.0
September 30,
2011 December 31,
2010 Total debt $ 80.6 $ 82.9Adjustments for cash, cash equivalents, and marketable securities * (11.9) (14.6)Adjustments for derivative accounting ** (0.7) (0.3)
Total adjusted debt $ 68.0 $ 68.0 Equity $ 8.7 $ 10.3Adjustments for derivative accounting ** (0.2) (0.1)
Total adjusted equity $ 8.5 $ 10.2Managed leverage (to 1) *** 8.0 6.7
* Excludes marketable securities related to insurance activities** Primarily related to market valuation adjustments to derivatives due to movements in interest rates. Adjustments to debt
are related to designated fair value hedges and adjustments to equity are related to retained earnings*** Equals total adjusted debt over total adjusted equity
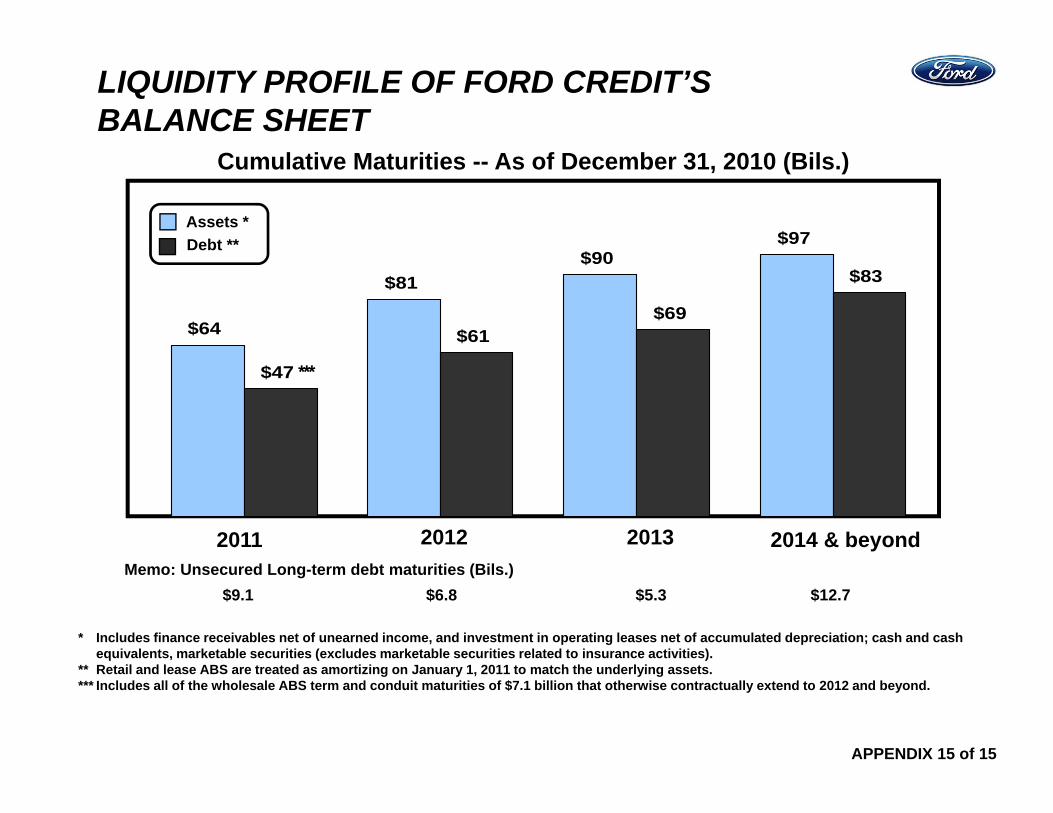
LIQUIDITY PROFILE OF FORD CREDIT’SBALANCE SHEET
Cumulative Maturities -- As of December 31, 2010 (Bils.)
* Includes finance receivables net of unearned income, and investment in operating leases net of accumulated depreciation; cash and cash equivalents, marketable securities (excludes marketable securities related to insurance activities).
** Retail and lease ABS are treated as amortizing on January 1, 2011 to match the underlying assets.*** Includes all of the wholesale ABS term and conduit maturities of $7.1 billion that otherwise contractually extend to 2012 and beyond.
$64
$81$90
$97
$47
$61$69
$83
2011 2012 2013 2014 & beyond
Assets *Debt **
***
Memo: Unsecured Long-term debt maturities (Bils.)$9.1 $6.8 $5.3 $12.7
APPENDIX 15 of 15