Embed Size (px)
Citation preview
2012 Minerals Yearbook
U.S. Department of the Interior U.S. Geological Survey
ALUMINUM
August 2016
Aluminum—2012 5.1
AluminumBy E. lee Bray
Domestic survey data and tables were prepared by Annie Hwang, statistical assistant, and the world production table was prepared by Glenn J. Wallace, international data coordinator.
During 2012, domestic primary smelters produced 2.07 million metric tons (mt) of aluminum metal valued at $4.61 billion, 4% more than the quantity and 9% less than the value in 2011. most production was from smelters east of the Mississippi River. At yearend, five companies were operating 10 primary aluminum smelters in seven States. An additional three smelters were temporarily idle. During the year, one smelter and some capacity at another smelter that had been temporarily idled were permanently shut down. About 26% [700,000 metric tons per year (t/yr)] of domestic primary aluminum smelting capacity (table 2), including idle potlines at operating smelters, was idle at yearend. The 2012 annual average u.S. market price of primary aluminum ingot decreased by 13% to $1.010 per pound from $1.161 per pound in 2011.
Aluminum recovered from purchased and tolled scrap increased by 5% to 3.27 mt. Of this recovered metal, 56% came from new (manufacturing) scrap, and 44% came from old (obsolete aluminum products) scrap. Aluminum used beverage cans (uBCs) accounted for 45% of the reported old scrap consumed in 2012 and 20% of total scrap consumed.
Apparent consumption of aluminum increased by 11% compared with that in 2011. united States and Canadian producers shipped 84.3% of their aluminum products to united States and Canadian markets, of which the transportation industry accounted for 29.9%; containers and packaging, 19.6%; building and construction, 11.0%; electrical, 8.0%; machinery and equipment, 6.5%; consumer durables, 6.2%; and other uses, 3.1%. Exports accounted for 15.7% of shipments from producers in Canada and the united States in 2012 (table 6).
At yearend 2012, total (unwrought, scrap, in process metal, and semifabricates) world inventories of aluminum, as reported by the international Aluminium institute (iAi) (2013), were 5% lower than those at yearend 2011. Combined inventories of aluminum metal and alloys held by the london metal Exchange ltd. (lmE), however, increased by 3%.
Primary aluminum was produced in 44 countries in 2012. China, Russia, Canada, and the united States, in decreasing order of metal produced, accounted for 63% of primary world production. World primary metal production increased by 3% compared with that of 2011 owing to increased production in China, Qatar, the united States, and several other nations. Commissioning of new smelters, brownfield expansions, as well as restarted capacity at smelters closed during recent years accounted for the increased production. These increases were partially offset by decreased production in Canada, Venezuela, the united Kingdom, the netherlands, South Africa, Spain, and several other countries. High power prices and low aluminum prices were cited for shutdowns of smelters in the netherlands, Spain, and the united Kingdom.
Primary production
in January, Alcoa inc. (Pittsburgh, PA) announced that the temporary closures of the 215,000-t/yr Alcoa, Tn, smelter and two of the six idled potlines (76,000 t/yr of capacity) at the 267,000-t/yr Rockdale, TX, smelter would be made permanent. The Rockdale smelter was shut down in 2008 owing to high electricity prices and declining aluminum prices, and the smelter in Tennessee was shut down in early 2009 owing to declining aluminum prices and demand. Subsequent efforts to obtain long-term power contracts for Rockdale at competitive prices were unsuccessful (Alcoa inc., 2012g).
Alcoa and Bonneville Power Administration (BPA) signed a power supply contract for the 279,000-t/yr intalco Works smelter at Ferndale, WA. Starting in January 2013, BPA agreed to provide 300 megawatts (mW) per year of power through September 2022. The prior long-term contract between Alcoa and BPA expired in may 2012, but power continued to be supplied to the smelter through short-term contracts during contract negotiations (Alcoa inc., 2012f).
Production reached full capacity at Century Aluminum Co.’s (monterey, CA) 244,000-t/yr Hawesville, KY, smelter during the first quarter of 2012. One of the five potlines was idled in march 2009 owing to low aluminum prices and was restarted in December 2010. issues concerning training new employees were cited for the delay in reaching full capacity (Century Aluminum Co., 2012).
noranda Aluminum Holding Corp. (Franklin, Tn) delayed the planned expansion of its primary aluminum smelter in new madrid, mO, to midyear-2013 from early 2013. The project would expand smelting capacity to 279,000 t/yr from 263,000 t/yr, and rampup of the new capacity was expected to be completed by yearend 2013 (Waite, 2012a).
A 5-year labor contract between noranda and the united Steelworkers union was ratified on September 7 by employees at the new madrid smelter. Work continued during contract negotiations after the previous contract set to expire on August 31 was extended through September 7 (noranda Aluminum Holding Corp., 2012).
Ormet Corp. (Hannibal, OH) shut down two potlines at its 271,000-t/yr smelter, citing high power prices and low aluminum prices for the shutdowns. One potline was shut down in late July and the second at the end of August for a combined 90,000 t/yr of smelting capacity (Ormet Corp., 2012; Waite, 2012b).
Rio Tinto plc (london, united Kingdom) was making progress with a modernization project at its smelter in Sebree, KY, but completion was delayed until 2014 or 2015 from yearend 2012, as originally planned. Capacity of the smelter
5.2 U.S. GEOLOGICAL SURVEY MINERALS YEARBOOK—2012
would increase to approximately 210,000 t/yr from 196,000 t/yr (Platts metals Week, 2012j).
Secondary production
A 3-month long strike at the nichols Aluminum llC (lincolnshire, il) remelt furnace and rolling mill in Davenport, IA, ended on April 6, and a new 5-year contract was ratified on September 28. Production at the smelter and rolling mill continued at a lower rate during the strike (Waite, 2012c).
in August, Aluminum Shapes, llC (Delair, nJ) shut down one of its 48,000-t/yr furnaces for unplanned maintenance for 1 month. Aluminum Shapes’ other furnace had been idle since 2010 because of low demand (Baltic, 2012).
in April, Bermco Aluminum Co. (Birmingham, Al) announced that it would move forward with construction of a new secondary aluminum smelter in Bessemer, Al. The 110,000-t/yr smelter would replace Bermco’s Birmgham smelter. lack of space to expand at the Birmingham smelter was cited for the move. The new smelter was expected to be completed in early 2013. in September, Bermco idled a 30,000-t/yr furnace at its secondary aluminum smelter in Birmgham. The lack of available scrap and decreased demand from some customers were cited for the shutdown. Two other furnaces continued to produce secondary aluminum ingot at the smelter (Platts metals Week, 2012b, c).
in January, Sapa Extrusions north America (Rosemont, il) [a subsidiary of Sapa Group (Stockholm, Sweden)] completed installation of a new 45,000-t/yr furnace for melting scrap in Cressona, PA. Sapa added the secondary smelting capacity and a billet casting pit to reduce the impact of volatile prices for aluminum billet from outside suppliers that can result from increased demand and short supply. The new capacity would be used mainly to produce specialty alloys (Sapa Group, 2012).
in march, Wise Alloys llC (muscle Shoals, Al) opened a new furnace to melt aluminum scrap from uBCs. The furnace was estimated to have a melting capacity of 225,000 t/yr of aluminum and increased the company’s uBC melting capacity by 55% (Wise Alloys llC, 2012).
Aleris international inc. (Beachwood, OH) completed upgrades to secondary smelters in Chicago Heights, il, and morgantown, KY. A holding furnace and two rotary furnaces were installed at the morgantown smelter, and a rotary furnace was installed at the Chicago Heights smelter. Both smelters produced secondary ingot, and the morgantown smelter also processed dross and salt cake from other secondary aluminum smelters to produce secondary ingot (Fitzgerald, 2012a).
Consumption
Apparent consumption of aluminum in the united States increased by 16% in 2012 from that in 2011. Shipments of aluminum by united States and Canadian producers to their combined domestic markets increased by 5% in 2012 compared with the amount shipped in 2011. Shipments of aluminum to the building and construction, consumer durables, electrical products, machinery, and transportation sectors increased by 6%, 7%, 8%, 2%, and 14%, respectively, compared with those
in 2011. Shipments to the containers and packaging sector decreased by 2% (table 6).
The increase in aluminum shipments for use in transportation was a result of increased automobile production and sales. Domestic sales of new passenger cars and light trucks in 2012 increased by 12.9% compared with sales in 2011 (Petry, 2013). However, strong domestic automobile sales were partially offset by weakness in European markets owing to the European debt crises, especially during the early part of 2012. in 2012, automobile sales in the European union (Eu) declined by 8.2% compared with sales in 2011 (Curtin, 2013).
Part of the increase in shipments of aluminum to the transportation sector was attributed to increased deliveries of commercial aircraft. The Boeing Co. (Chicago, il) reported that its deliveries of commercial aircraft increased by 26% compared with deliveries in 2011. Although a significant portion of the increased deliveries was 787 Dreamliners, an aircraft with a fuselage and wings made from composite materials instead of aluminum, deliveries of Boeing’s other commercial aircraft increased by 17% compared with deliveries in 2011 (Boeing Co., The, 2013, p. 26).
The increase in aluminum shipments for use in building and construction resulted from increased nonresidential and residential construction. Sales of new homes were 19.9% higher in 2012 than in 2011 (u.S. Census Bureau, 2013c). The u.S. Census Bureau and the u.S. Department of Housing and urban Development jointly reported that housing starts increased by 28.1% in 2012 compared with starts in 2011. The number of houses completed was 11.4% more than in 2011 (u.S. Census Bureau, 2013b). Total construction spending during 2012 increased by 9.2% compared with that in 2011, which was attributed to increased spending on residential construction (16.8%) and private nonresidential construction (15.4%). These increases were partially offset by a 2.7% decrease in spending on public construction (u.S. Census Bureau, 2013a). increased home construction and sales were attributed to increasing home values and lower mortgage interest rates.
Stocks
According to data reported by the Aluminum Association inc. (2012; 2013), united States and Canadian producers’ combined inventories of aluminum ingot, mill products, and scrap increased by 8% to 1.14 mt at yearend 2012 from 1.06 mt at yearend 2011. The lmE reported that primary aluminum metal ingot stocks at its u.S. warehouses decreased by 11% to 1.97 mt at yearend 2012 from 2.20 mt at yearend 2011. At yearend 2012, lmE warehouses in the united States also held 147,000 metric tons (t) of north American special aluminum alloy contract (nASAAC) metal ingot, a 7% decrease from the 157,000 t held at yearend 2011 (london metal Exchange 2011; 2012).
Prices
The monthly average u.S. market price of primary aluminum metal, as reported by Platts metals Week, started the year at $1.034 per pound in January and gradually rose to a peak
Aluminum—2012 5.3
of $1.079 per pound in march. The monthly average price declined gradually through August when it reached a low of $0.939 per pound. The price was volatile the remainder of the year, rallying in early September, with the monthly average price rising to $1.033 per pound before gradually declining to $0.983 per pound in november. The price rebounded to $1.051 per pound in December. The annual average price in 2012 decreased to $1.010 per pound from $1.161 per pound in 2011. The lmE monthly average cash prices for primary aluminum ingot followed the same general trend as the u.S. market price, and the 2012 annual average lmE cash price decreased to $0.916 per pound from $1.088 per pound in 2011. The indicator prices for selected secondary aluminum ingots and scrap, as published in American metal market, followed the same trend as primary ingot prices (table 8).
Foreign Trade
in 2012, total net imports of aluminum-base materials were essentially unchanged compared with net imports in 2011 (tables 11 and 12). imports for consumption of crude aluminum increased by 3%, while imports of semifabricated aluminum materials (plates, sheet, and bars) decreased by 3%, and scrap imports increased slightly. Canada remained the leading source country, accounting for 59% of the total (crude, semifabricated, and scrap) imports in 2012; Russia (7%) and the united Arab Emirates (6%) were the second and third ranked suppliers. imports of crude metal and alloys from Canada accounted for 44% of all aluminum imports during 2012 (table 12).
Total exports of aluminum increased slightly during 2012 compared with those of 2011 (tables 9 and 10). Exports of crude aluminum (metal and alloys) and semifabricated aluminum materials increased by 15% and 12%, respectively, but exports of scrap decreased by 5%. About 79% of total u.S. exports of unmanufactured aluminum (crude, semifabricated, and scrap) in 2012 were shipped to Canada, China, or mexico. The aluminum shipped to China was 97% scrap and accounted for 40% of all u.S. aluminum exports during 2012 (table 10).
A labor dispute and employee lockout at Rio Tinto’s Alma smelter in Saguenay-lac-Saint-Jean, Quebec, Canada, had a noticeable impact on the availability of wire rod in the united States. Two-thirds of the smelter’s 438,000-t/yr capacity was shut down for the first half of the year. The Alma smelter accounted for one-quarter of the aluminum wire rod capacity in north America, and u.S. wire manufacturers substituted imported material from iceland, the middle East, and South America (Rio Tinto Alcan inc., 2012b; Rio Tinto plc, 2012b, p. 5; Waite, 2012d).
World Industry Structure
Production.—World primary aluminum production increased by 3% in 2012 compared with that of 2011 owing to new smelters and smelter expansions in China and Qatar, as well as restarts of capacity in the united States. These gains were partially offset by smelter closures in several countries as a result of lower aluminum prices, high power costs, financial challenges, labor disputes, and technical issues. China, Russia, Canada, and the united States, in decreasing order of
production, accounted for 63% of total world primary aluminum production. China was the leading producer and accounted for 44% of global production.
During the fourth quarter of 2008 and early 2009, many primary smelters announced shutdowns in response to declining prices as demand for aluminum receded in the face of the financial crisis. Throughout 2010, most of these shutdowns continued, although several restarts were announced in the second half of the year. in 2011, more restarts were announced as prices and demand for aluminum increased. in 2012, new capacity was ramped up although price declines and other factors resulted in some smelter shutdowns, and world production was 16% greater than the prerecession level of 2008.
Stocks.—As aluminum prices recovered from their low level during the financial crisis in 2009, smelter restarts during late 2010 and early 2011 led to increased aluminum inventories by yearend 2011. At yearend 2012, however, combined iAi and lmE inventories of primary and alloyed aluminum were essentially unchanged from yearend 2011. Significant decreases in aluminum alloy inventories were offset by increased primary aluminum inventories as speculators preferred primary aluminum to alloyed aluminum. Yearend 2012 inventories of unalloyed aluminum metal held by the lmE increased by 5% to 5.21 mt from 4.98 mt at yearend 2011, and aluminum alloy inventories decreased by 38% to 87,700 t from 142,000 t. (london metal Exchange ltd., 2011; 2012).
The increased inventories at LME warehouses were offset by decreases in iAi total aluminum inventories, which decreased by 5% to 2.28 mt at yearend 2012 from 2.39 mt at yearend 2011. Total aluminum includes unwrought aluminum plus unprocessed scrap, metal in process, and finished semifabricated (mill) products. unwrought aluminum inventories held by iAi member producers decreased by 10% to 1.26 mt at yearend 2012 from 1.40 Mt at yearend 2011. Unwrought aluminum is defined by the iAi as aluminum in its basic form made from primary metal or from scrap and that is metallurgically unworked (international Aluminium institute, 2013).
Mergers and Acquisitions.—norsk Hydro ASA (Oslo, norway) sold its 75,000-t/yr secondary smelter which produced extrusion ingot in Taiwan to Ting Sin metal Co. ltd. in October (norsk Hydro ASA, 2012a). norsk Hydro also agreed to combine its extruded products division with Sapa Holdings HB [a subsidiary of Orkla ASA (Oslo)] in a joint venture owned equally by both companies. The new company would be known as Sapa and would have fabrication facilities throughout Europe and North America, as well as in Argentina, Brazil, China, India, and Vietnam. The merger was expected to be completed in the first half of 2013 (Norsk Hydro ASA, 2012b).
World Review
Australia.—Aluminum production in Australia declined by 4% (81,000 t) in 2012 compared with production in 2011 owing to the shutdown of norsk Hydro’s 180,000-t/yr Kurri Kurri smelter in new South Wales. One-third of Kurri Kurri’s capacity was shut down in February, and the remaining capacity was shut down in August. low prices and demand for aluminum, as well as unfavorable currency valuations, were cited for the shutdown (norsk Hydro ASA, 2012c, d).
5.4 U.S. GEOLOGICAL SURVEY MINERALS YEARBOOK—2012
Azerbaijan.—Production in Azerbaijan more than doubled as Det.Al Group (Baku) continued to ramp up its new 100,000-t/yr Ganja smelter which started production in november 2011. Production at full capacity was expected to be reached in 2013 (Platts metals Daily, 2012a).
Bahrain.—Aluminium Bahrain B.S.C. (Alba) (Bahrain) completed upgrading one potline at its smelter, increasing capacity to 937,000 t/yr from 880,000 t/yr. Further upgrades to two other potlines were being made to increase smelter capacity to 970,000 t/yr. Alba also was conducting a bankable feasibility study for a new potline that would increase smelter capacity by an additional 400,000 t/yr (Aluminium Bahrain B.S.C., 2012a, b).
Bosnia and Herzegovina.—Production decreased slightly because Alminij d.d. mostar (mostar) cut production at its 135,000-t/yr smelter to 118,000 t/yr in July, citing high power costs and low aluminum prices (CRu Aluminum monitor, 2012d).
Brazil.—In September, Brazil’s Government required utility companies to cut electricity rates by as much as 28% as a condition of renewing operating licenses through 2017. many companies in the mining and metals industries, including primary aluminum smelters, had lobbied for relief from Brazil’s high power prices, which reportedly averaged $163 per mW hour, significantly higher than in other parts of the world (Orihuela and Spinetto, 2012).
Production at Companhia Brasileira de Alumínio’s [a subsidiary of Votorantim Group (São Paulo)], 475,000-t/yr smelter at Sorocaba increased by 11.2% compared with production in 2011. Technical issues throughout 2011 caused a 13% decline compared with production in 2010 (Votorantim Group, 2011; Associação Brasileira do Alumínio, 2013).
Brazil recycled a record-high 98.3% of all aluminum beverage cans sold in the country during 2011, an increase from 97.6% in 2010 and the previous record rate of 98.2% achieved in 2009. Brazil collected and recycled 248,700 t of UBCs, the equivalent of 18.4 billion aluminum cans. Since 2001, Brazil has had the highest aluminum can recycling rate among countries that do not have mandatory recycling laws (Associação Brasileira do Alumínio, 2012).
novelis inc. [a subsidiary of Hindalco industries ltd. (mumbai, india)] continued expansion of its recycling facility and rolling mill in Pindamonhangaba to 390,000 t/yr from 200,000 t/yr, with completion expected by yearend 2013. The recycling center melts uBCs and other scrap, and the rolling mill produces can sheet and other rolled products (novelis inc., 2012b).
Canada.—in 2012, aluminum production in Canada declined by 7% (203,000 t) compared with production in 2011 because of a labor dispute at one smelter and a power failure at another smelter. A labor dispute and employee lockout that started January 1 at Rio Tinto’s 438,000-t/yr Alma smelter at Saguenay-lac-Saint-Jean, Quebec, ended on July 5 when a new contract was ratified. Two-thirds of the smelter’s capacity was shut down during the dispute (Rio Tinto Alcan inc., 2012b; Rio Tinto plc, 2012b, p. 5).
Rio Tinto’s 100,000-t/yr Shawinigan, Quebec, smelter returned to full capacity in march after production was cut by
one-half owing to a power failure on December 29, 2011. The smelter, which uses Soderberg technology, was scheduled to be shut down permanently by yearend 2014 to comply with Provincial environmental regulations (Rio Tinto Alcan inc., 2012c; Rio Tinto plc, 2012b, p. 16).
Construction continued on a new 60,000-t/yr smelter at Saguenay-Lac-Saint-Jean, Quebec, with the first metal expected in February 2013. The smelter would use pots designed by Rio Tinto Alcan that were expected to increase energy efficiency and production. Further expansions of the smelter to 460,000 t/yr were being studied. The smelter would replace Rio Tinto’s 176,000-t/yr Arvida smelter which started production in 1926 (Rio Tinto Alcan inc., 2012d).
Rio Tinto delayed completion of the modernization of the Kitimat, British Columbia, smelter to yearend 2014 citing challenging market conditions. When completed, the smelter would have a capacity of 420,000 t/yr from new prebaked pots which are replacing Soderberg pots. A new labor contract between Rio Tinto and employees at the Kitimat smelter and nearby powerplant was ratified on July 27 (Rio Tinto Alcan Inc., 2012a; Rio Tinto plc, 2013a, p. 23, 44).
Rochester Aluminum Smelting Canada ltd. (Concord, Ontario) installed a 22,000-t/yr furnace at its secondary smelter in Concord, Ontario. The new furnace replaced two furnaces that each had a capacity of 11,000 t/yr, which cost more to operate. The secondary smelter produces aluminum used by steel mills for deoxidation (Fitzgerald, 2012b).
China.—Primary aluminum production in China was 12% more in 2012 than in 2011 as the industry continued to evolve. Production from new smelters built principally in the northwestern provinces near coal-fired powerplants more than offset declines from older smelters in the eastern and southern provinces employing less efficient technology and that experienced power shortages and high power prices. The National Government was making efforts to encourage expansion of smelters in the northwestern Xinjiang Province, where rapid smelter expansions took place during the past year, but at the same time, limiting expansion to available power supplies and transportation infrastructure. in order to deal with power shortages and high power prices, many smelters were building captive powerplants. Permanent shutdowns of smelters with obsolete technology mandated by a 2011 national Government policy also contributed to the production decline in some eastern provinces. in the face of low aluminum prices, the national Government and some Provincial governments took action to support prices.
Significant expansion of China’s primary and secondary aluminum industry capacity took place in 2012, as did expansion of value-added downstream products. China’s primary aluminum capacity was approximately 26.9 mt/yr at yearend 2012, an increase from 25.6 mt/yr at yearend 2011. Expansions underway were expected to increase total capacity to approximately 30.2 mt/yr by yearend 2013 (China metal market—Alumina and Aluminum, 2012e; 2013a). Secondary aluminum production in China during 2011 was 5.2 mt, 6.6% more than that of 2010. China exported 680,000 t of secondary aluminum during 2011 (China metal market—Alumina and Aluminum, 2012c).
Aluminum—2012 5.5
The ministry of industry and information Technology issued a policy to permanently shut down 270,000 t/yr of obsolete primary smelting capacity by yearend to conserve power and reduce pollution. The policy also applied to outdated technology used to produce cement, coking coal, copper, ferrous alloys, iron and steel, lead, and zinc (China Metal Market—Alumina and Aluminum, 2012m). The Henan Provincial government issued a policy to permanently shut down 179,000 t/yr of obsolete smelting capacity by yearend 2012, 48,000 t/yr of which had been permanently shut down in 2011 (China metal market—Alumina and Aluminum, 2012g).
in response to low aluminum prices and weak demand, the national and certain provincial governments took action to support primary aluminum smelters. The State Reserve Bureau purchased 100,000 t of aluminum in november in order to boost the market price and announced plans to purchase an additional 100,000 t (CRu Aluminum monitor, 2012b). The Yunnan Provincial government also started a stockpile program to help aluminum smelters in the province. Aluminum would be warehoused and the smelters could use the metal as collateral for loans from banks, with the Yunnan Province government paying the interest on the loans. in november, 100,000 t was purchased for the provincial stockpile (China metal market—Alumina and Aluminum, 2012k; 2013a).
Some Provincial and municipal governments also provided subsides to smelters in response to high power prices and low aluminum prices. The Gansu Provincial government provided preferential power prices to energy-intensive industries, including primary aluminum smelters (China metal market—Alumina and Aluminum, 2012i). The municipal government of luoyang, Henan Province, started providing subsidies to aluminum smelters in September (China metal market—Alumina and Aluminum, 2012j). in July, the ningxia Provincial government started providing preferential power prices to energy-intensive industries, including primary aluminum smelters, which enabled smelters in ningxia to maintain production levels (China metal market—Alumina and Aluminum, 2012i).
Gansu Province.—in August, JiSCO Dongxing Special Aluminum Alloy Co. ltd. completed the ramp up of a 450,000-t/yr smelter in Jiuquan, which began producing in December 2011. An expansion was started in June that would increase capacity to 1 mt/yr and was expected to be completed in mid-2014 (China metal market—Alumina and Aluminum, 2012i).
in September, Gansu Hongtai Aluminum Co. ltd. (a subsidiary of Qingdao Dezheng Group Ltd.) started construction of a 1-mt/yr aluminum smelter in Baiyin. The project also included a 2,000-mW powerplant and a 15-mt/yr coal mine (China metal market—Alumina and Aluminum, 2012j; CRu Aluminum monitor, 2012f).
lintao Aluminum Co. ltd. was constructing a 50,000-t/yr potline to replace the smelter’s two obsolete potlines which were shut down in 2005 and 2006. When completed in early 2013, the smelter in lintai County would use abundant hydroelectric power (China metal market—Alumina and Aluminum, 2012d).
Guangxi Province.—in may, Guangxi Yinhai Aluminium Co. ltd. restarted potlines at two smelters which were shut
down in August and September 2011 owing to power shortages. The smelters each had a capacity of 225,000 t/yr and each had been producing at a rate of 110,000 t/yr during the shutdown (Platts metals Week, 2012f).
in February, Guangxi Suyuan investment Co. ltd. started construction of a smelter in Xinshan. The first 200,000 t/yr of capacity was to be completed in August 2013, and an expansion to 300,000 t/yr was planned. The project also included a 600-mW powerplant and a 300,000-t/yr rolling mill (China metal market—Alumina and Aluminum, 2012g).
Guizhou Province.—in June, Huangguoshu Aluminum Co. ltd. completed expansion of its smelter in Anshun and started production in October. The project increased capacity to 180,000 t/yr from 115,000 t/yr (China metal market—Alumina and Aluminum, 2012k).
Aluminum Corp. of China (Chinalco) temporarily shut down some capacity at its 255,000-t/yr smelter in Zuiyi during the first quarter, citing power shortages from hydroelectric powerplants experiencing drought conditions. Chinalco restarted the idled pots in may (China metal market—Alumina and Aluminum, 2012f, g).
Henan Province.—Sanmenxia Tianyuan Aluminum Co. ltd. shut down its 150,000-t/yr smelter in Hubin in September, citing high power costs and low aluminum prices. The company had already shut down its 120,000-t/yr smelter in mianchi in October 2011, citing the high cost of power in the Province. The company indicated that both shutdowns would likely be permanent (Platts metals Week, 2012g).
Citing low aluminum prices and the high cost of power, Shenhuo Group ltd. temporarily shut down the 140,000-t/yr Qingyang smelter and the 120,000-t/yr Xinfeng smelter during the first quarter of the year (CRU Aluminum Monitor, 2012a).
Inner Mongolia Province.—in July, Chinalco started construction of an integrated aluminum project in Jungar. in addition to a 500,000-t/yr smelter, the project would include a 1.2-Mt/yr alumina refinery that would produce alumina from coal ash, a 1,050-mW captive powerplant, and a 10-mt/yr coal mine (CRu Aluminum monitor, 2012d).
inner mongolia Jinlian Aluminum Semis Co. ltd. was constructing a 450,000-t/yr smelter in Holingol, along with a 1,100-mW powerplant, a 10-mt/yr coal mine, and a 500,000-t/yr rolling mill. Expansion of the smelter to 1 mt/yr was planned (China metal market—Alumina and Aluminum, 2012g).
Huomei Group Ltd. and Hangzhou Jiniang Group Ltd. started construction of a 450,000-t/yr smelter in Houlinhe during the first quarter of the year. Further expansion of the smelter to 1 mt/yr was planned, as well as a rolling mill, a 1,100-mW powerplant, and a 10-mt/yr coal mine (China metal market—Alumina and Aluminum, 2012c).
CPi Huomei Hongjun Aluminum and Power Co. ltd. ramped up new capacity at its smelter in Tongliao during the first quarter of the year. The expansion increased the smelting capacity to 780,000 t/yr from 430,000 t/yr (China metal market—Alumina and Aluminum, 2012a).
Liaoning Province.—China Zhongwang Holdings ltd. started construction of an aluminum smelter in Yingkou. The
5.6 U.S. GEOLOGICAL SURVEY MINERALS YEARBOOK—2012
first phase, with 400,000 t/yr of capacity, was expected to be completed in October 2013, and an expansion to 800,000 t/yr was to be built later. The company manufactures extruded aluminum parts for the electrical, machinery, and transportation sectors, and the smelter would enable it to supply its own billet (CRu Aluminum monitor, 2012e).
in June, Chinalco completed expanding its smelter in Fushun to 310,000 t/yr from 210,000 t/yr, and ramped up the new pot line to full capacity in August (China metal market—Alumina and Aluminum, 2012g, j).
Ningxia Province.—Chinalco began construction of a 1-mt/yr smelter with a 2,000-mW powerplant in Guyuan. The smelter would be built in two phases starting in October (China metal market—Alumina and Aluminum, 2012h).
Qinghai Province.—Sanmenxia Tianyuan was constructing a 500,000-t/yr smelter in Xining, with initial production expected in 2013 (Platts metals Week, 2012g).
The Huanghe Xinye Aluminum Co. ltd. smelter in Xining, Qinghai Province reached full capacity in January. The expansion, which was completed in march 2011, increased capacity to 550,000 t/yr from 250,000 t/yr (China metal market—Alumina and Aluminum, 2012b).
in January, West Hydropower Co. ltd. started production from its new 150,000-t/yr smelter in minhe County. Further expansion of the smelter to 400,000 t/yr and a rolling mill were reportedly being considered (China metal market—Alumina and Aluminum, 2012b; CRu Aluminum monitor, 2012c).
Qinghai material industry Group Co. ltd. completed modernization of its smelter in Datong County. The project increased capacity to 300,000 t/yr from 250,000 t/yr and the new capacity was put into production in December (China metal market—Alumina and Aluminum, 2013a).
in April, Tianrui Group ltd. started construction of an industrial complex that would include an aluminum smelter, a powerplant, and a rolling mill in Xining. The smelter was expected to be completed in 2015 (China metal market—Alumina and Aluminum, 2012f).
in June, Chinalco started to expand its smelter in Xining to 900,000 t/yr from 400,000 t/yr. The project would include a 1,050-mW captive powerplant (China metal market—Alumina and Aluminum, 2012g).
Shaanxi Province.—Shaanxi Yulin nonferrous metals Co. ltd. completed a 650,000-t/yr smelter in Yulin and started production in June. The project also included a 1,650-mW powerplant and 8-mt/yr coal mine (China metal market—Alumina and Aluminum, 2012e).
in December, Shanxi Yangquan Aluminum Co. ltd. permanently shut down its 40,000-t/yr smelter in Yangquan, citing high power prices and obsolete technology (China metal market—Alumina and Aluminum, 2013b).
Shandong Province.—in march, Shandong Yili Aluminum and Power Co. ltd. completed the ramp up of its 400,000-t/yr smelter in longkou. The smelter was completed in October 2011, and production started in november 2011 (China metal market—Alumina and Aluminum, 2012d).
Xinjiang Province.—During the first quarter of the year, Xinjiang Tianshan Aluminum Co. ltd. started production from its 460,000-t/yr smelter in Shihezhi. A 300,000-t/yr rolling mill
also started production and a captive powerplant was built. Further expansions were planned to increase smelting capacity to 1.6 mt/yr, rolling capacity to 1 mt/yr, and power generation to 3,500 mW by 2017 (China metal market—Alumina and Aluminum, 2012c; CRu Aluminum monitor, 2012c).
in July, Xinfa Xinjiang Aluminum & Power Co. (a subsidiary of Shandong Chiping Xinfa Group) completed expanding its smelter in Wujiaqu to 800,000 t/yr from 400,000 t/yr (China metal market—Alumina and Aluminum, 2012h).
Xinjiang Qiya Aluminum and Power ltd. completed its 450,000-t/yr smelter in Wucaiwan and started production in August. Further expansion of the smelter to 800,000 t/yr and a 1,440-mW powerplant were planned (China metal market—Alumina and Aluminum, 2012j; CRu Aluminum monitor, 2012e).
Xinjiang Shenhuo Coal and Power Co. completed a 130,000-t/yr smelter in Wucaiwan and started production in October. Expansion of the smelter to 1.6 mt/yr was planned (CRu Aluminum monitor, 2012g).
in December, East Hope Group ltd. completed expanding its smelter in Jimsar County to 600,000 t/yr from 300,000 t/yr. The first phase of the smelter was completed at yearend 2011 and started commercial production in the first quarter of 2012. Rampup of the second phase was expected to be completed in early 2013. Further expansions were planned to increase capacity to 2 mt/yr by the end of 2014 (Platts metals Daily, 2012b).
Xinjiang Jiarun Co. ltd. was constructing an 800,000-t/yr smelter in Manas County. The first phase of the smelter, with a capacity of 400,000 t/yr was completed at yearend 2012 and the second phase was expected to be completed in 2013. Further expansion to 1.6 mt/yr was planned (China metal market—Alumina and Aluminum, 2012h).
in January, construction started on a 1-mt/yr smelter in Shanshan County. The project, a joint venture between Chinalco (65%) and Jiaozuo Wanfang Aluminum Co. Ltd. (35%), was to include a 1,750-mW captive powerplant and a nearby 10-mt/yr coal mine (China metal market—Alumina and Aluminum, 2012l).
Xinjiang Joinworld Co. ltd. was planning to construct a smelter and rolling mill to produce high-purity aluminum (99.99%) in urumchi. When completed, the smelter would have a capacity of 90,000 t/yr and would supply high-purity aluminum foil for electronics manufacturers (China metal market—Alumina and Aluminum, 2012i).
Yunnan Province.—in February, Yunnan Dongyuan Aluminum Co. ltd. shut down 30,000 t/yr of capacity at its 410,000-t/yr smelter in Fuyuan County. A drought caused low water levels at hydroelectric powerplants in the area, resulting in a power shortage at the smelter (China metal market—Alumina and Aluminum, 2012n).
Yunnan Yongxin Aluminum Co. ltd. completed its 330,000-t/yr smelter in Jianshui County and started production during the second quarter of the year. The smelter ramped up to full capacity by yearend (China metal market—Alumina and Aluminum, 2012h).
Germany.—norsk Hydro signed a 5-year power supply contract with a Swedish utility company to enable the
Aluminum—2012 5.7
230,000-t/yr neuss smelter to increase production to 150,000 t/yr from 50,000 t/yr, starting in the first half of 2013. The German Government was providing financial assistance to energy-intensive industries, including the neuss smelter, to offset high power prices (Wookey, 2012).
in november, novelis started construction of a 400,000-t/yr secondary aluminum smelter at its rolling mill in nachterstedt. Recycled uBCs and other scrap would be used to make sheet ingot when completed in mid-2014 (novelis inc., 2012a).
Iceland.—Rio Tinto completed a billet casthouse at the iSAl smelter in Straumsvik and started billet production in the second quarter of the year. The casthouse was part of an expansion and modernization project that would increase the capacity of the smelter to 230,000 t/yr from 190,000 t/yr by July 2014 (Rio Tinto plc, 2012a, p. 7).
India.—Production of aluminum in india increased slightly (33,000 t) owing to expansions of existing smelters, partially offset by reduced production at one smelter caused by power shortages that began in 2011. Vedanta Resources plc completed expansion of the Jharsuguda smelter to 550,000 t/yr from 500,000 t/yr during the second quarter. Work on the 325,000-t/yr Korba iii smelter was also progressing toward completion in mid-2014 (Vedanta Resources plc, 2012; 2013).
Hindalco was expanding the Hirakud smelter to 213,000 t/yr from 161,000 t/yr with completion scheduled for early 2013. Construction of the 359,000-t/yr mahan smelter and an adjacent 900-mW powerplant continued during the year, with completion expected in early 2013 (Hindalco industries inc., 2012a, p. 51). Construction of the 359,000-t/yr Aditya smelter and an adjacent 900-mW powerplant also was progressing, although at a revised slower rate, with completion expected in early 2013 (Hindalco industries inc., 2012b).
national Aluminium Co. ltd. (nalco) (Bhubaneswar) operated the 345,000-t/yr Angul smelter at a rate of about 310,000 t/yr during the first half of the year. Production from the smelter and its captive powerplant were reduced in September 2011 owing to shortages of coal (national Aluminium Co. ltd., 2012a). nalco completed expansion of its Angul smelter that increased capacity to 460,000 t/yr from 345,000 t/yr during the first half of the year (National Aluminium Co. Ltd., 2012b).
Italy.—Production of aluminum declined by 35% (58,000 t)in italy during 2012 compared with production in 2011 as a result of reduced output at and closure in november of Alcoa’s 150,000-t/yr smelter in Portovesme owing to high power costs and low aluminum prices. Alcoa, which had been trying to sell the smelter prior to the shutdown, planned to keep the smelter in condition for a restart to maintain its marketability. in 2009, the European Commission ruled that power contracts between Alcoa and the italian Government did not comply with Eu regulations. Short-term agreements between Alcoa and the Government enabled the smelter to remain open for 3 years, but a new contract could not be negotiated that complied with Eu regulations and would enable the smelter to remain competitive. With the shutdown of the Portovesme smelter, italy no longer produced primary aluminum (Alcoa, 2012e; American metal market, 2012; Trabattoni, 2012).
Korea, Republic of.—in October, novelis completed its 265,000-t/yr secondary smelter in Yeongju. The smelter would
melt uBCs and supply rolling ingot for the adjacent rolling mill and another rolling mill at ulsan (novelis inc., 2012b).
Malaysia.—Press metal Berhad’s (Selangor) production increased by 50% (40,000 t) following completion and startup in the second half of the year at the 240,000-t/yr Samalaju smelter (Press metal Berhad, 2012).
Netherlands.—Aluminum production declined by 50% (150,000 t) in 2012 compared with production in 2011 after Zeeland Aluminum Co. (Zalco) (Vlissingen) closed its 275,000-t/yr smelter in Vlissingen in December 2011. The Zalco smelter, which had filed for bankruptcy when it closed, was sold in June. Century Aluminum purchased the 150,000-t/yr anode plant to supply its smelter at Grundartangi, iceland, and uTB industry, a Dutch machinery wholesaler, purchased the potlines and casthouse. The potlines were to be demolished because of the high cost of operating them, but the casthouse was to be used for secondary aluminum production (Platts metals Week, 2012h).
New Zealand.—Production from Rio Tinto’s 350,000-t/yr Tiwia Point smelter declined by 9% compared with production in 2011. low water levels reduced available power from hydroelectric powerplants which were the smelter’s primary power supply, and Rio Tinto was unable to obtain additional power for the smelter (Platts metals Week, 2012i; Rio Tinto plc, 2013b, p. 19).
Norway.—norsk Hydro shut down a casthouse used to produce secondary aluminum ingot at Ardal in August, citing the high costs of melting scrap. The remaining casthouse would continue using aluminum from Hydro’s primary smelter (norsk Hydro ASA, 2012e).
Romania.—Alro S.A. [a subsidiary of Vimetco N.V. (Bucharest)] decreased production from the Slatina smelter by 5% compared with production in 2011 citing power shortages. Hidroelectrica S.A., the main power provider for the 265,000-t/yr smelter, declared a force majeure in January, resulting in disruption of power supplies and higher costs for power (Alro S.A., 2012a, b).
Russia.—in February, united Company RuSAl (moscow) completed the first stage of a project at the Nadvoisty smelter that increased specialty ingot production from 15,000 t/yr to 45,000 t/yr. A second stage of the modernization project would increase specialty ingot capacity to match the smelter’s capacity of 81,000 t/yr. RUSAL also completed modernization projects adding capacity to produce specialty ingot and rolling slab at the Volkhov and Ural smelters about midyear. Further upgrades, expected to be completed by the first quarter of 2013, would add capacity for wire rod at the Kandalaksha smelter and for rolling slab at the Volgograd smelter. When completed, all production from these five smelters would be in the form of value-added products such as rolling slab, specialty ingot, or wire rod (united Company RuSAl, 2012d, h).
RuSAl announced plans to increase production of value added products at its smelters in Siberia to 1.26 mt/yr from 1.13 Mt/yr in 2012, and to 1.93 Mt/yr by 2016. The Bratz, Krasnoyarsk, and Sayanogrsk smelters were upgraded during the year to increase combined rolling slab production for the automotive sheet and packaging markets to 507,000 t/yr from 424,000 t/yr. The Novokuznetsk smelter was to be upgraded
5.8 U.S. GEOLOGICAL SURVEY MINERALS YEARBOOK—2012
to produce extrusion billet for the building and construction market. The irkutsk smelter was to be upgraded to produce wire rod from aluminum-rare-earth-element alloys for the cable industry (united Company RuSAl, 2012e).
RuSAl was progressing on the Boguchansky smelter, with production from the first 147,000-t/yr potline expected to start in August 2013. When completed in 2016, the smelter would have a capacity of 600,000 t/yr. The smelter would be powered by the 3,000-mW Boguchanskaya hydroelectric powerplant on the Angara River that started producing power from two of its nine turbines in October. The Boguchanskaya hydroelectric powerplant was a joint venture between RuSAl and RusHydro and was expected to be fully operational in 2013 (united Company RuSAl, 2012a, b, f).
Construction of infrastructure needed for the 750,000-t/yr Taishet smelter was progressing, but construction of the smelter was delayed until economic conditions improve (united Company RuSAl, 2012g).
RuSAl planned to permanently close 275,000 t/yr of high-cost capacity at its smelters in western Russia by 2018. The Bogoslovsk smelter shut down 150,000 t/yr of capacity by yearend 2012; the Nadvoitsy and Volkhov smelters were to shut down 75,000 t/yr total capacity in 2015; and the Novokuznetsk smelter was to shut down two potlines with a combined 50,000 t/yr of capacity in 2018. Expiring power contracts and the high price of power in western Russia were cited for the closures (united Company RuSAl, 2012c).
Saudi Arabia.—in December, Alcoa (25.1%) and Saudi Arabian mining Co. (ma’aden) (Riyadh) (74.9%) produced the first aluminum from their joint-venture smelter in Ras Al Khair. The 740,000-t/yr smelter was to ramp up to full capacity during 2013. Alcoa and ma’aden also broke ground in December for the second phase of the rolling mill adjacent to the smelter that would produce foil stock and sheet for the automotive and construction markets. When commissioned, the initial rolling mill capacity would produce sheet for containers and packaging. The entire rolling mill was expected to be completed in 2014 (Alcoa inc., 2012a, h).
South Africa.—Primary aluminum production from the 715,000-t/yr Hillside smelter decreased by 21% compared with production in 2011. BHP Billiton ltd. (melbourne, Victoria, Australia) attributed the production decline to a major unplanned outage of its anode furnace during the first quarter of the year. The smelter returned to full capacity by yearend, but the shutdown resulted in South Africa’s total aluminum production declining by 18% (144,000 t) compared with production in 2011 (Platts metals Week, 2012d; BHP Billiton ltd., 2013, p. 2, 7).
Spain.—Alcoa temporarily shut down the 93,000-t/yr Aviles and 87,000-t/yr La Coruna smelters during the first half of the year, resulting in a 37% (135,000 t) decrease in primary aluminum production in Spain during 2012. High costs for power and raw materials combined with falling aluminum prices were cited for the closures (Alcoa inc., 2012e).
United Arab Emirates.—in October, Emirates Aluminium ltd. (EmAl) (Abu Dhabi) increased capacity of the Al Taweelah smelter to 800,000 t/yr from 750,000 t/yr. Construction continued on a new potline that would further
increase capacity to 1.3 mt/yr when completed in 2014. EmAl was a partnership between Dubai Aluminium Co. ltd. and mubadala Development Co. (Emirates Aluminium ltd., 2012a, b).
United Kingdom.—Primary aluminum production in the united Kingdom decreased by 72% (153,000 t) during 2012 owing to the permanent closure of Rio Tinto’s 182,000-t/yr smelter at lynemouth on march 29. The high cost of power associated with compliance to emerging regulatory requirements was cited as the reason for the shutdown of the smelter which started production in 1972 (Rio Tinto plc, 2011; 2012b, p. 17).
Venezuela.—Primary aluminum production in Venezuela during 2012 was 47% (180,000 t) lower than in 2011 owing to shortages of raw materials at both of the country’s smelters, including aluminum fluoride, cryolite, and petroleum coke, which began in 2011 and continued through 2012. During the first half of 2012, the 170,000-t/yr Alcasa smelter produced at a rate of about 65,000 t/yr, and the production rate at the 430,000-t/yr Venalum smelter decreased to about 105,000 t/yr. in the middle of the year, the smelters received emergency Government funding to purchase raw materials, although the production rates did not increase significantly (Platts Metals Daily, 2012c; Platts metals Week, 2012a, e).
Outlook
Aluminum prices, which had increased during the second half of 2012, declined during the first half of 2013. As of June 1, 2013, about 25% (690,000 t/yr) of domestic primary aluminum smelting capacity was idled. World demand for aluminum in 2013 was not expected to change significantly from that in 2012 because the rate of economic expansion in China had declined and aluminum consumption in Europe continues to stagnate. Further uncertainties about Japan’s economy were expected to contribute to declining aluminum consumption in that country.
Lingering effects of the sovereign debt issues in Europe raised concerns about economic growth and consumer demand, and automobile sales declined during the early part of 2013 compared with sales in the same period of 2012. in the united States, consumption of aluminum was expected to increase during 2013, led by increased automobile manufacturing and home construction. Demographic trends suggested that European automobile sales may stay at the 2012 levels or decline further even after Europe’s economy recovers (Curtin, 2013). However, substitution of aluminum for steel in the automobile industry and increased aircraft manufacturing to replace older aircraft with more efficient aircraft were expected to contribute to increased aluminum consumption in the future in those applications.
Automakers were reportedly working with aluminum producers to develop vehicles with aluminum frames and doors to reduce vehicle weight and increase fuel efficiency in response to increased Corporate Average Fuel Economy standards. Substituting steel with aluminum in these parts could increase the average amount of aluminum per vehicle to 249 kilograms by 2025 from 156 kilograms in 2012 (Kelly, 2012). in anticipation of increased consumption of aluminum sheet by automobile manufactures, Alcoa started construction of an
Aluminum—2012 5.9
expansion of its rolling mill at Davenport, iA. The project was expected to be completed by yearend 2013 (Alcoa inc., 2012c).
To meet anticipated consumption increases in the aerospace industry, Alcoa was increasing its capacity to produce aluminum-lithium alloys. Projects located at lafayette, in, upper Burrell, PA, and Kitts Green, united Kingdom, would increase capacity to produce aluminum-lithium alloy billet and rolling ingot for making lighter aircraft. The new alloys were developed in response to competitive threats from composite materials for aircraft manufacture introduced in recent years. Capacity at the lafayette project was planned to be 20,000 t/yr of aluminum-lithium alloys and was expected to be completed by yearend 2014 (Alcoa inc., 2012b, d). Chinalco also developed a new aluminum-lithium alloy to be used in the aerospace industry. The alloy would be produced by Southwest Aluminum Group Co. ltd., a subsidiary of Chinalco (China metal market—Alumina and Aluminum, 2012b).
Relatively high electricity prices in parts of the united States diminish the likelihood that domestic smelters currently shut down will reopen in the near term. Owners of several operating smelters were negotiating for lower power prices in order to continue operating despite low aluminum prices. Production declines at several smelters in Canada, Europe, and india were announced in the early part of 2013, citing low aluminum prices, high power costs, power shortages, and the high cost of compliance with increasingly stringent environmental regulations. Older smelters in Canada, China, and the united States were being modernized to replace obsolete technology to comply with environmental regulations, increase efficiency, and reduce costs. new smelter construction where power costs are relatively low was expected to continue to replace production at high-cost smelters in the united States and elsewhere.
References Cited
Alcoa Inc., 2012a, Alcoa and Ma’aden break ground for Middle East’s first automotive products aluminum rolling mill: new York, nY, Alcoa inc. press release, December 12. (Accessed January 3, 2013, at http://www.alcoa.com/global/en/news/news_detail.asp?pageiD=20121212005612en&newsYear=2012.)
Alcoa inc., 2012b, Alcoa expanding aluminum lithium capabilities to meet growing aerospace demand for its industry-leading alloys: new York, nY, Alcoa inc. press release, January 25. (Accessed January 3, 2013, at http://www.alcoa.com/global/en/news/news_detail.asp?pageiD=20120125005796en&newsYear=2012.)
Alcoa inc., 2012c, Alcoa, Governor Branstad break ground on automotive expansion in Davenport, iowa: Riverdale, iA, Alcoa inc. press release,
march 2. (Accessed January 3, 2013, at http://www.alcoa.com/global/en/news/news_detail.asp?pageiD=20120302005791en&newsYear=2012.)
Alcoa inc., 2012d, Alcoa groundbreaking launches $90 million aluminum lithium operation: lafayette, in, Alcoa inc. press release, may 17. (Accessed January 3, 2013, at http://www.alcoa.com/global/en/news/
news_detail.asp?pageiD=20120517005681en&newsYear=2012.)Alcoa inc., 2012e, Alcoa plans to curtail smelters in italy and Spain as part of
global primary restructuring: new York, nY, Alcoa inc. press release, January 9. (Accessed January 9, 2012, at http://www.alcoa.com/global/en/
news/news_detail.asp?pageiD=20120109006109en&newsYear=2012.)Alcoa inc., 2012f, Alcoa signs ten-year power contract for intalco works: new
York, nY, Alcoa inc. press release, December 7. (Accessed January 3, 2013, at http://www.alcoa.com/global/en/news/news_detail.asp?pageiD=20121207005604en&newsYear=2012.)
Alcoa inc., 2012g, Alcoa to close or curtail 531,000 metric tons of smelting capacity: new York, nY, Alcoa inc. press release, January 5. (Accessed January 5, 2012, at http://www.alcoa.com/global/en/news/news_detail.asp?pageiD=20120105006536en&newsYear=2012.)
Alcoa Inc., 2012h, Ma’aden Alcoa joint venture reaches first hot metal milestone for smelter: new York, nY, Alcoa inc. press release, December 12. (Accessed January 3, 2013, at http://www.alcoa.com/global/en/news/
news_detail.asp?pageiD=20121212005611en&newsYear=2012.)Alro S.A., 2012a, Alro is contemplating various options to avoid reduction
of production due to temporary shortage of electricity supply: Slatina, Romania, Alro S.A. press release, August 31. (Accessed February 12, 2013, at http://www.alro.ro/en/article/alro-contemplating-various-options-avoid-reduction-production-due-temporary-shortage-electri.)
Alro S.A., 2012b, Alro reports net profit of RON 15 million for the first half of 2012: Slatina, Romania, Alro S.A. press release, August 31. (Accessed February 12, 2013, at http://www.alro.ro/en/article/ alro-reports-net-profit-ron-15-million-first-half-2012.)
Aluminium Bahrain B.S.C., 2012a, Alba awards Bechtel Canada a lOi to perform a bankable feasibility study for the line 6 expansion project: Bahrain, Kingdom of Bahrain, Aluminium Bahrain B.S.C. news release, December 12.
(Accessed January 7, 2013, at http://www.albasmelter.com/mc/news/Pages/2012/Bechtel-Canada.aspx.)
Aluminium Bahrain B.S.C., 2012b, Alba production gets a boost: Bahrain, Kingdom of Bahrain, Aluminium Bahrain B.S.C. news release, December 30.
(Accessed January 7, 2013, at http://www.albasmelter.com/mc/news/Pages/2012/production-gets-a-boost.aspx.)
Aluminum Association inc., The, 2012, The aluminum situation: Washington, DC, The Aluminum Association inc., march 23, 7 p.
Aluminum Association inc., The, 2013, The aluminum situation: Washington, DC, The Aluminum Association inc., march 29, 7 p.
American metal market, 2012, Glencore pulls out of pursuit for Portovesme: American metal market, v. 119, no. 40–2, October 2, p. 4.
Associação Brasileira do Alumínio, 2012, The aluminum beverage cans recycling rate is the largest in history: São Paulo, Brazil, Associação Brasileira do Alumínio news release, October 31. (Accessed
January 29, 2013, at http://www.abal.org.br/en/news/integra-news/?id=165.)Associação Brasileira do Alumínio, 2013, 1,435.4 thousand tons is the Brazilian
primary aluminum production in 2012: São Paulo, Brazil, Associação Brasileira do Alumínio news release, January. (Accessed January 25, 2013, at http://www.abal.org.br/en/news/integra-news/?id=168.)
Baltic, Sarah, 2012, Aluminum Shapes buying billet but may restart furnace—CEO: Platts metals Week, v. 83, no. 36, September 3, p. 4.
BHP Billiton ltd., 2013, BHP Billiton production report for the half year ended 31 December 2012: Melbourne, Victoria, Australia, BHP Billiton Ltd. news release, January 23, 19 p. (Accessed January 23, 2013, at http://
www.bhpbilliton.com/home/investors/reports/Documents/2013/130123_BHP Billiton Production Report for the Half Year Ended 31 December 2012.pdf.)
Boeing Co., The, 2013, 2012 annual report: Chicago, il, The Boeing Co., February 11, 130 p. (Accessed may 7, 2013, at http://services.corporate-ir.net/SEC.Enhanced/SecCapsule.aspx?c=85482&fid=8610474.)
Century Aluminum Co., 2012, Century reports first quarter 2012 results: monterey, CA, Century Aluminum Co. press release, April 24. (Accessed January 4, 2013, at http://investor.shareholder.com/cenx/
releasedetail.cfm?ReleaseiD=666970.)China metal market—Alumina and Aluminum, 2012a, Aluminum: China metal
market—Alumina and Aluminum, no. 181, January 1, p. 21–23.China metal market—Alumina and Aluminum, 2012b, Aluminum: China metal
market—Alumina and Aluminum, no. 182, February 1, p. 13–15.China metal market—Alumina and Aluminum, 2012c, Aluminum: China metal
market—Alumina and Aluminum, no. 183, march 1, p. 18–23.China metal market—Alumina and Aluminum, 2012d, Aluminum: China metal
market—Alumina and Aluminum, no. 184, April 1, p. 18–21.China metal market—Alumina and Aluminum, 2012e, Aluminum: China metal
market—Alumina and Aluminum, no. 185, may 1, p. 19–23.China metal market—Alumina and Aluminum, 2012f, Aluminum: China metal
market—Alumina and Aluminum, no. 186, June 1, p. 22–24.China metal market—Alumina and Aluminum, 2012g, Aluminum: China metal
market—Alumina and Aluminum, no. 187, July 1, p. 19–23.China metal market—Alumina and Aluminum, 2012h, Aluminum: China metal
market—Alumina and Aluminum, no. 188, August 1, p. 21–24.China metal market—Alumina and Aluminum, 2012i, Aluminum: China metal
market—Alumina and Aluminum, no. 189, September 1, p. 19–23.China metal market—Alumina and Aluminum, 2012j, Aluminum: China metal
market—Alumina and Aluminum, no. 190, October 1, p. 18–22.China metal market—Alumina and Aluminum, 2012k, Aluminum: China metal
market—Alumina and Aluminum, no. 191, november 1, p. 20–22.
5.10 U.S. GEOLOGICAL SURVEY MINERALS YEARBOOK—2012
China metal market—Alumina and Aluminum, 2012l, Aluminum: China metal market—Alumina and Aluminum, no. 192, December 1, p. 20–23.
China metal market—Alumina and Aluminum, 2012m, industrial policy, foreign investment & trade: China metal market—Alumina and Aluminum, no. 185, may 1, p. 14–15.
China metal market—Alumina and Aluminum, 2012n, Yunnan Dongyuan Aluminum reduces output as drought continues: China metal market—Alumina and Aluminum, no. 183, march 1, p. 7.
China metal market—Alumina and Aluminum, 2013a, Aluminum: China metal market—Alumina and Aluminum, no. 193, January 1, p. 21–23.
China metal market—Alumina and Aluminum, 2013b, Aluminum: China metal market—Alumina and Aluminum, no. 194, February 1, p. 22.
CRu Aluminum monitor, 2012a, Additional curtailments announced in China: CRu Aluminum monitor, may, p. 9.
CRu Aluminum monitor, 2012b, Government steps in to help aluminium smelters: CRu Aluminum monitor, December, p. 6.
CRu Aluminum monitor, 2012c, industry news: CRu Aluminum monitor, February, p. 12.
CRu Aluminum monitor, 2012d, industry news: CRu Aluminum monitor, August, p. 9–10.
CRu Aluminum monitor, 2012e, industry news: CRu Aluminum monitor, September, p. 10.
CRu Aluminum monitor, 2012f, industry news: CRu Aluminum monitor, October, p. 10.
CRu Aluminum monitor, 2012g, industry news: CRu Aluminum monitor, november, p. 9.
Curtin, matthew, 2013, Eu car sales slump: Wall Street Journal Online, January 16. (Accessed April 11, 2013, at http://online.wsj.com/article/ SB10001424127887323468604578244981638540410.html.)Emirates Aluminium Ltd., 2012a, EMAL pours first concrete for phase II
potrooms: Abu Dhabi, united Arab Emirates, Emirates Aluminium ltd. press release, April 15. (Accessed January 8, 2013, at http://www.emal.ae/
?view=newsDetail&id=65&itemiD=21.)Emirates Aluminium Ltd., 2012b, EMAL steps up efficiency at landmark
aluminium smelter: Abu Dhabi, united Arab Emirates, Emirates Aluminium ltd. press release, October 5. (Accessed January 8, 2013, at http://
www.emal.ae/en/Default.aspx?view=newsDetail&id=96&itemiD=21.)Fitzgerald, Daniel, 2012a, Aleris completes furnace upgrades: American Metal
market, v. 119, no. 19–2, may 8, p. 5.Fitzgerald, Daniel, 2012b, Rochester Aluminum starts new 100,000-pound
furnace: American metal market, v. 119, no. 38–2, September 18, p. 5.Hindalco industries inc., 2012a, Annual report 2011–2012: mumbai, india,
Hindalco industries inc., June 27, 168 p. (Accessed march 4, 2013, at http://www.hindalco.com/investors/downloads/
Hindalco_Annual_Report_2011-12.pdf.) Hindalco industries inc., 2012b, Hindalco’s Aditya aluminium project—
Financial closure achieved: mumbai, india, Hindalco industries inc. news release, September 17. (Accessed January 7, 2013, at http://
www.hindalco.com/media/press_releases/201209sep/ hindalco_aditya_aluminium_project.html.)international Aluminium institute, 2013, Aluminium inventories: london,
united Kingdom, international Aluminium institute form 351, march 26. (Accessed April 1, 2013, at https:// http://www.world-aluminium.org/media/filer_public/2013/03/26/reported_total_aluminium_producer_inventories_-_january_1973_to_february_2013.xls.)
Kelly, Chris, 2012, Aluminum cars, doors, frames—industry’s “next frontier”—Alcoa: Reuters, June 13. (Accessed June 14, 2012, at http://www.reuters.com/article/2012/06/13/us-aluminum-alcoa-auto-iduSBRE85C1KW20120613.)
london metal Exchange ltd., 2011, Aluminium stocks: london, united Kingdom, london metal Exchange ltd., December 30, 3 p.
london metal Exchange ltd., 2012, Aluminium stocks: london, united Kingdom, london metal Exchange ltd., December 31, 3 p.
national Aluminium Co. ltd., 2012a, nalco achieves highest ever bauxite and alumina production: Bhubaneswar, india, national Aluminium Co. ltd. news release, April 2. (Accessed January 7, 2013, at http://www.nalcoindia.com/Press-Brief.aspx.)
national Aluminium Co. ltd., 2012b, nalco announces dividend of Rs 257.72 crore for 2011–12: Bhubaneswar, india, national Aluminium Co. ltd. news release, August 14. (Accessed January 7, 2013, at http://www.nalcoindia.com/Press-Brief.aspx.)
noranda Aluminum Holding Corp., 2012, uSW members ratify new madrid labor agreement: Franklin, Tn, noranda Aluminum Holding Corp. news release, September 8. (Accessed September 20, 2012, at
http://investor.norandaaluminum.com/phoenix.zhtml?c=220051&p=irol-newsArticle&iD=1733155&highlight=.)
norsk Hydro ASA, 2012a, Hydro agrees to sell Taiwan remelter: Oslo, norway, norsk Hydro ASA news release, September 24. (Accessed January 4, 2013, at http://www.hydro.com/en/Press-room/news/Archive/2012/
Hydro-agrees-to-sell-Taiwan-remelter/.)norsk Hydro ASA, 2012b, Hydro and Orkla to form the world’s leading
aluminium solutions provider: Oslo, norway, norsk Hydro ASA news release, October 15. (Accessed October 22, 2012, at http://www.hydro.com/en/Press-room/news/Archive/Stock-exchange-announcements/2012/
Hydro-and-Orkla-to-form-the-worlds-leading-aluminium-solutions-provider/.)
norsk Hydro ASA, 2012c, Hydro curtails production in Kurri Kurri, Australia: Oslo, norway, norsk Hydro ASA news release, January 18. (Accessed February 2, 2012, at http://www.hydro.com/en/Press-room/news/Archive/Stock-exchange-announcements/2012/Hydro-curtails-production-in-Kurri-Kurri-Australia/.)
norsk Hydro ASA, 2012d, Hydro will close the Kurri Kurri aluminium plant: Oslo, norway, norsk Hydro ASA news release, June 5. (Accessed
June 5, 2012, at http://www.hydro.com/en/Press-room/news/ Archive/Stock-exchange-announcements/2012/ Hydro-will-close-the-Kurri-Kurri-aluminium-plant/.)norsk Hydro ASA, 2012e, Remelt operations to cease in Ardal: Oslo, norway,
norsk Hydro ASA news release, January 18. (Accessed February 2, 2012, at http://www.hydro.com/en/Press-room/news/Archive/2012/
Remelt-operations-to-cease-in-Ardal/.)novelis inc., 2012a, novelis breaks ground on $250 million aluminum recycling
plant in Germany: Atlanta, GA, novelis inc. news release, november 26. (Accessed January 7, 2013, at http://novelis.mediaroom.com/ index.php?s=43&item=358.)novelis inc., 2012b, novelis opens Asia’s largest beverage can recycling
operation: Atlanta, GA, novelis inc. news release, October 23. (Accessed January 7, 2013, at http://novelis.mediaroom.com/
index.php?s=43&item=352.)Orihuela, Rodrigo, and Spinetto, J.P., 2012, utilities pain is Alcoa gain
in Rousseff’s power plan: Bloomberg News, September 16. (Assessed September 18, 2012, at http://www.bloomberg.com/news/2012-09-17/utilities-pain-is-alcoa-gain-in-rousseff-s-power-plan.html.)
Ormet Corp., 2012, Ormet reduces operations at smelter: Hannibal, OH, Ormet Corp. news release, August 28, 1 p. (Accessed September 20, 2012, at http://www.ormet.com/news/PDF/Ormet press release 8-28 Final A.pdf.)
Petry, Corinna, 2013, Automakers remain optimistic following improved sales in 2012: American metal market, v. 120, no. 2–1, January 7, p. 8.
Platts metals Daily, 2012a, Detal delays completion of alumina plant revamp: Platts metals Daily, v. 1, no. 12, november 14, p. 3.
Platts metals Daily, 2012b, East Hope to double Xinjiang smelter capacity by December: Platts metals Daily, v. 1, no. 7, november 7, p. 3.
Platts Metals Daily, 2012c, Venalum’s sales down 48.4% to 10,313 mt for October: Platts metals Daily, v. 1, no. 15, november 19, p. 5.
Platts metals Week, 2012a, Alcasa to get much need raw materials: Platts metals Week, v. 83, no. 20, may 14, p. 7.
Platts Metals Week, 2012b, Bermco taking alloy furnace offline: Platts Metals Week, v. 83, no. 37, September 10, p. 7.
Platts metals Week, 2012c, Bermco to build new Alabama facility: Platts metals Week, v. 83, no. 14, April 2, p. 16–17.
Platts metals Week, 2012d, BHP’s Hillside loses 30% of capacity: Platts metals Week, v. 83, no. 18, April 30, p. 4.
Platts Metals Week, 2012e, Chavez approves funding for CVG brands: Platts metals Week, v. 83, no. 20, may 14, p. 6.
Platts metals Week, 2012f, China Guangxi Yinhai resumes full output: Platts metals Week, v. 83, no. 30, July 23, p. 13.
Platts metals Week, 2012g, China smelter closes Henan plant, relocates: Platts metals Week, v. 83, no. 38, September 17, p. 5.
Platts metals Week, 2012h, Dutch uTB buys bankrupt Zalco plants: Platts metals Week, v. 83, no. 25, June 18, p. 6.
Platts metals Week, 2012i, nZ smelter power talks results unknown: Platts metals Week, v. 83, no. 34, August 20, p. 17.
Platts metals Week, 2012j, RTA Sebree project to take two–three years: Platts metals Week, v. 83, no. 29, July 16, p. 9.
Press metal Berhad, 2012, major milestones: Selangor, malaysia, Press metal Berhad Web site. (Accessed January 31, 2013, at http://
www.pressmetal.com/.)
Aluminum—2012 5.11
Rio Tinto Alcan inc., 2012a, Employees at Rio Tinto Alcan’s Kitimat operations ratify new labour agreement: montreal, Quebec, Canada, Rio Tinto Alcan inc. media release, July 27. (Accessed August 9, 2012, at http://
www.riotintoalcan.com/EnG/media/media_releases_2357.asp.)Rio Tinto Alcan inc., 2012b, Rio Tinto Alcan continues to adjust production
at its Alma smelter: montreal, Quebec, Canada, Rio Tinto Alcan inc. media release, January 2. (Accessed January 5, 2012, at http://
www.riotintoalcan.com/EnG/media/media_releases_2215.asp.)Rio Tinto Alcan inc., 2012c, Rio Tinto Alcan to deploy plan to restart suspended
production lines at Shawinigan: montreal, Quebec, Canada, Rio Tinto Alcan inc. media release, February 3. (Accessed February 7, 2012, at http://
www.riotintoalcan.com/EnG/media/media_releases_2219.asp.)Rio Tinto Alcan Inc., 2012d, Rio Tinto Alcan welcomes the first electrolytic
cell at its Arvida AP60 technology centre: montreal, Quebec, Canada, Rio Tinto Alcan inc. media release, February 13. (Accessed February 13, 2012, at http://www.riotintoalcan.com/EnG/media/media_releases_2257.asp.)
Rio Tinto plc, 2011, Rio Tinto Alcan announces intention to close lynemouth aluminium smelter: london, united Kingdom, Rio Tinto plc media release, november 16, 1 p. (Accessed July 20, 2012, at http://www.riotinto.com/documents/PR932g_Rio_Tinto_Alcan_announces_intention_to_close_lynemouth_aluminium_smelter.pdf.)
Rio Tinto plc, 2012a, Rio Tinto announces first half underlying earnings of $5.2 billion: london, united Kingdom, Rio Tinto plc media release, August 8,
46 p. (Accessed August 9, 2012, at http://www.riotinto.com/documents/ 120808_Rio_Tinto_announces_first_half_underlying_earnings_of__5_2_
billion.pdf.)Rio Tinto plc, 2012b, Second quarter 2012 operations review: london, united
Kingdom, Rio Tinto plc media release, July 17, 25 p. (Accessed July 20, 2012, at http://www.riotinto.com/documents/ PR969g_Second_quarter_2012_operations_review.pdf.)Rio Tinto plc, 2013a, Annual report: london, united Kingdom, Rio Tinto plc
media release, January 15, 232 p. (Accessed may 20, 2013, at http:// www.riotinto.com/rio_tinto_2012_annual_report.pdf.)Rio Tinto plc, 2013b, Fourth quarter 2012 operations review: london, united
Kingdom, Rio Tinto plc media release, January 15, 28 p. (Accessed January 23, 2013, at http://www.riotinto.com/documents/ PR798g_Fourth_quarter_2012_operations_review.pdf.)Sapa Group, 2012, Sapa Extrusions Cressona cast house expansion complete:
Stockholm, Sweden, Sapa Group news release, January 13. (Accessed February 3, 2012, at http://www.sapagroup.com/en/press-/news/
sapa-extrusions-cressona-cast-house-expansion-complete/.)Trabattoni, Alina, 2012, Alcoa to push back closure of italian aluminum smelter:
Platts metals Week, v. 83, no. 14, April 2, p. 1, 13.u.S. Census Bureau, 2013a, December 2012 construction spending at $885.0
billion annual rate: Washington, DC, u.S. Census Bureau news release, February 1, 5 p. (Accessed April 2, 2013, at http://www.census.gov/construction/c30/pdf/pr201212.pdf.)
u.S. Census Bureau, 2013b, new residential construction in December 2012: Washington, DC, u.S. Census Bureau news release, January 17, 6 p. (Accessed January 25, 2013, at http://www.census.gov/construction/nrc/pdf/newresconst_201212.pdf.)
u.S. Census Bureau, 2013c, new residential sales in December 2012: Washington, DC, u.S. Census Bureau news release, January 25, 4 p. (Accessed January 25, 2013, at http://www.census.gov/construction/nrs/pdf/newressales.pdf.)
united Company RuSAl, 2012a, BEmO hydro powerplant successfully launched: moscow, Russia, united Company RuSAl press release,
October 15. (Accessed January 4, 2013, at http://www.rusal.ru/en/ press-center/news_details.aspx?id=7745&ibt=13&at=0.)united Company RuSAl, 2012b, uC RuSAl announces results for the
three and nine months ended 30 September 2012: moscow, Russia, united Company RuSAl press release, november 12. (Accessed
november 15, 2012, at http://www.rusal.ru/upload/uf/9b9/ 12.11.2012 RuSAl_9 months results 2012.pdf.)united Company RuSAl, 2012c, uC RuSAl board approves programme
of gradual curtailment of less efficient capacity: Moscow, Russia, United Company RuSAl press release, August 27. (Accessed August 28, 2012, at http://www.rusal.ru/en/press-center/
news_details.aspx?id=7487&ibt=13&at=0.)United Company RUSAL, 2012d, UC RUSAL completes the first stage of
aluminium division west modernization: Moscow, Russia, United Company RuSAl press release, June 21. (Accessed January 4, 2013, at http://
www.rusal.ru/en/press-center/news_details.aspx?id=7163&ibt=13&at=0.)
united Company RuSAl, 2012e, uC RuSAl largest aluminium division to increase alloy production by 70%: moscow, Russia, united Company RuSAl press release, February 14. (Accessed January 4, 2013, at http://www.rusal.ru/en/press-center/news_details.aspx?id=6572&ibt=13&at=0.)
united Company RuSAl, 2012f, uC RuSAl to install all pot shells for the BEMO smelter first pot room by end of 2012: Moscow, Russia, United Company RuSAl press release, October 11. (Accessed January 4, 2013, at http://www.rusal.ru/en/press-center/
news_details.aspx?id=7696&ibt=13&at=0.)united Company RuSAl, 2012g, uC RuSAl’s key highlights 2012: moscow,
Russia, united Company RuSAl press release, December 20. (Accessed January 4, 2013, at http://www.rusal.ru/upload/uf/9c1/
20.12.2012 RuSAl_Key highlights.pdf.)United Company RUSAL, 2012h, UC RUSAL’s NAZ completes first
modernization stage: Moscow, Russia, United Company RUSAL press release, February 28. (Accessed January 4, 2013, at http://www.rusal.ru/en/press-center/news_details.aspx?id=6617&ibt=13&at=0.)
Vedanta Resources plc, 2012, Production release for the first quarter ended 30 June 2012: London, United Kingdom, Vedanta Resources plc, July 31, 7 p. (Accessed August 9, 2012, at http://www.vedantaresources.com/uploads/vedantaq1fy2013productionrelease_final.pdf.)
Vedanta Resources plc, 2013, Production report for the third quarter and nine months ended 31 December 2012: London, United Kingdom, Vedanta Resources plc, January 31, 10 p. (Accessed April 4, 2013, at http://
www.vedantaresources.com/uploads/ved_q3_fy2013_productionrelease.pdf.)Votorantim Group, 2011, Votorantim announces its 9M11 results: São Paulo,
Brazil, Votorantim Group press release, November 29, 2 p. (Accessed June 15, 2012, at http://votorantim.mzweb.com.br/votorantim/web/arquivos/
Press Release 9m11_ing.pdf.)Waite, Suzy, 2012a, Noranda net income slides but producer still in black:
American metal market, v. 119, no. 17–43, April 26, p. 9.Waite, Suzy, 2012b, Ormet to begin idling potline at Ohio smelter: American
metal market, v. 119, no. 30-1, July 23, p. 1, 7.Waite, Suzy, 2012c, Teamsters accept Nichols’ offer, end 9-month dispute:
American metal market, v. 119, no. 40–2, October 2, p. 4.Waite, Suzy, 2012d, Wire rod concerns mount as Alma dispute continues:
American metal market, v. 120, no. 8–4, February 24, p. 2.Wise Alloys llC, 2012, Wise metals cuts ribbon for expanded recycling facility
named Element 13: muscle Shoals, Al, Wise Alloys llC press release, march 2, 3 p. (Accessed April 19, 2012, at http://www.wisemetals.com/news/press-releases/20120302_Element_13.pdf.)
Wookey, Jethro, 2012, norsk Hydro to triple smelter’s output: American metal market, v. 119, no. 36–2, September 5, p. 9.
GENERAL SOURCES OF INFORMATION
U.S. Geological Survey Publications
Aluminum. Ch. in mineral Commodity Summaries, annual. Aluminum. mineral industry Surveys, monthly. Aluminum and Bauxite. Ch. in united States mineral
Resources, Professional Paper 820, 1973.Bauxite and Alumina. Ch. in mineral Commodity Summaries,
annual.Historical Statistics for mineral and material Commodities in
the united States, Data Series 140.u.S. Trade in Bauxite and Alumina. mineral industry Surveys,
quarterly.World Bauxite Resources. Professional Paper 1076–B, 1986.
Other
Aluminum. Ch. in mineral Facts and Problems, u.S. Bureau of mines Bulletin 675, 1985.
Aluminum Statistical Review. The Aluminum Association inc., annual.
5.12 U.S. GEOLOGICAL SURVEY MINERALS YEARBOOK—2012
2008 2009 2010 2011 2012united States:
Primary production:Quantity 2,658 1,727 1,726 1,986 2,070Value millions $7,062 $3,025 $3,975 $5,083 $4,608
Price, average, u.S. market, spot cents per pound 120.5 79.4 104.4 116.1 101.0inventories (December 31):
Aluminum industry2 1,220 937 1,010 1,060 1,140london metal Exchange, u.S. warehouses3 1,290 2,200 2,230 2,360 2,120
Secondary recovery:4
new scrap 2,130 1,570 1,540 1,640 r 1,830Old scrap 1,500 1,260 1,250 1,470 r 1,440
Total 3,630 2,820 2,790 3,120 r 3,270Exports, crude, semicrude, and scrap 3,280 2,710 3,040 3,420 3,480imports for consumption, crude and semicrude5 3,710 3,680 3,610 3,710 3,760Supply, apparent6 6,070 4,890 5,000 5,210 r 5,780Consumption, apparent7 3,940 3,320 3,460 3,570 r 3,950
World, production 39,700 37,300 r 41,200 44,400 45,900 e
Canadian producers.3includes aluminum alloyed material.4metallic recovery from purchased, tolled, or imported new and old scrap expanded for full industry coverage.5Excludes scrap.6Defined as domestic primary metal production plus secondary recovery plus imports (excluding scrap) minus exports plus adjustments for london metal Exchange (u.S. warehouses) and industry stock changes.
TABlE 1SAliEnT Aluminum STATiSTiCS1
(Thousand metric tons unless otherwise specified)
rRevised.1Data are rounded to no more than three significant digits except “Primary production: Quantity and Value” and “Price, average, U.S.market, spot.”2Data from the Aluminum Association inc.; includes ingot, semifabricated material, and scrap inventory levels for united States and
7Apparent supply less recovery from purchased new scrap.
Yearend capacity(thousand metric tons)
Company and location 2011 2012 Ownership in 2012Alcoa inc.:
Alcoa, Tn 215 2 -- Alcoa inc., 100%.Evansville, in (Warrick) 269 269 Do.Ferndale, WA (intalco) 279 279 Do.massena, nY (St. lawrence) 125 125 Do.massena, nY 130 130 Do.mount Holly, SC 229 229 Alcoa inc., 50.3%; Century Aluminum Co., 49.7%.Rockdale, TX 267 2 191 2 Alcoa inc., 100%.Wenatchee, WA 184 184 Do.
Total 1,700 1,410Century Aluminum Co.:
Hawesville, KY 244 244 Century Aluminum Co., 100%.Ravenswood, WV 170 2 170 2 Do.
Total 414 414Columbia Falls Aluminum Co., Columbia Falls, mT 168 2 168 2 Glencore international AG, 100%.Goldendale Aluminum Co., Goldendale, WA -- r -- Private interest, 60%; employees, 40%.noranda Aluminum Holding Corp., new madrid, mO 263 263 noranda Aluminum Holding Corp., 100%.Ormet Primary Aluminum Corp., Hannibal, OH 271 r 271 Ormet Corp., 100%.Rio Tinto Alcan inc., Sebree, KY 196 196 Rio Tinto Alcan inc., 100%.
Grand total 3,010 r 2,720
TABlE 2PRimARY AnnuAl Aluminum PRODuCTiOn CAPACiTY in THE uniTED STATES, BY COmPAnY1
rRevised. Do. Ditto. -- Zero.1Data are rounded to no more than three significant digits; may not add to totals shown.2Temporarily idle at yearend.
Aluminum—2012 5.13
Class Consumption Aluminum metallic2011:
Secondary smelters 2,060,000 r 1,400,000 1,500,000independent mill fabricatorsr 1,480,000 1,260,000 1,340,000Foundries 50,700 41,400 44,300Other consumers 5,770 5,770 5,770
Totalr 3,600,000 2,710,000 2,890,000Estimated full industry coverager 3,890,000 2,920,000 3,120,000
2012:Secondary smelters 2,160,000 1,470,000 1,580,000independent mill fabricators 1,520,000 1,290,000 1,370,000Foundries 85,600 70,700 75,700Other consumers 5,700 5,700 5,700
Total 3,770,000 2,840,000 3,030,000Estimated full industry coverage 4,080,000 3,070,000 3,270,000
rRevised.1Excludes recovery from other than aluminum-base scrap.2Data are rounded to no more than three significant digits; may not add to totals shown.
TABlE 3U.S. CONSUMPTION OF AND RECOVERY FROM PURCHASED
nEW AnD OlD Aluminum SCRAP, BY ClASS1, 2
(metric tons)
Calculated recovery
Stocks, net Stocks,Class of consumer and type of scrap January 1 receipts3 Consumption December 31
Secondary smelters:new scrap:
Extrusions 18,900 312,000 312,000 19,300Can stock clippings 8,060 110,000 110,000 8,140Other wrought sheet and clippings 4,640 218,000 218,000 5,030Casting 2,150 47,900 48,300 1,810Borings and turnings 3,750 r 122,000 122,000 4,250Dross and skimmings 15,900 643,000 645,000 13,200
Total 53,400 1,450,000 1,460,000 51,700Old scrap:
Castings 2,530 118,000 117,000 3,290Extrusion 7,610 r 157,000 157,000 7,560Aluminum cans4 28,400 r 161,000 161,000 28,600Other wrought products 9,230 r 160,000 162,000 7,460Auto shredder scrap 1,350 r 102,000 102,000 1,810
Total 49,100 r 698,000 699,000 48,700Sweated pig 55 1,850 1,720 183
Grand total secondary smelters 103,000 r 2,150,000 2,160,000 101,000See footnotes at end of table.
TABlE 4u.S. STOCKS, RECEiPTS, AnD COnSumPTiOn OF PuRCHASED nEW AnD OlD Aluminum SCRAP
AnD SWEATED PiG in 20121, 2
(metric tons)
5.14 U.S. GEOLOGICAL SURVEY MINERALS YEARBOOK—2012
Stocks, net Stocks,Class of consumer and type of scrap January 1 receipts3 Consumption December 31
integrated aluminum companies, foundries, independentmill fabricators, other consumers:new scrap:
Extrusion 731 176,000 175,000 1,190Can stock clippings 2,660 162,000 164,000 581Other wrought sheet and clippings 8,770 268,000 270,000 6,210Casting 243 17,100 17,100 243Borings and turnings 414 14,100 14,100 459Dross and skimmings 487 4,750 4,800 432
Total 13,300 641,000 645,000 9,120Old scrap:
Castings 3,750 153,000 152,000 4,540Extrusion 831 16,200 16,000 1,010Aluminum cans4 2,100 r 584,000 583,000 2,360Other wrought products 381 222,000 212,000 10,600Auto shredder scrap 102 2,680 2,470 312
Total 7,160 r 978,000 966,000 18,800Grand total integrated aluminum companies, etc. 20,500 r 1,620,000 1,610,000 27,900
All scrap consumed:new scrap:
Extrusion 19,600 488,000 487,000 20,500Can stock clippings 10,700 272,000 274,000 8,720Other wrought sheet and clippings 13,400 486,000 488,000 11,200Casting 2,390 65,100 65,400 2,050Borings and turnings 4,160 r 137,000 136,000 4,710Dross and skimmings 16,400 r 647,000 650,000 13,600
Total 66,700 2,090,000 2,100,000 60,800Old scrap:
Castings 6,280 271,000 270,000 7,840Extrusion 8,440 r 173,000 173,000 8,570Aluminum cans4 30,500 r 745,000 744,000 30,900Other wrought products 9,610 r 383,000 374,000 18,100Auto shredder scrap 1,450 r 105,000 104,000 2,130
Total 56,300 r 1,680,000 1,660,000 67,500Sweated pig 55 1,850 1,720 183
Grand total of all scrap consumed 123,000 r 3,770,000 3,770,000 129,000
4used beverage cans toll treated for integrated producers are included in secondary smelter tabulation.
rRevised.1includes imported scrap. According to reporting companies, 2.50% of total receipts of aluminum-base scrap, or 96,300
2Data are rounded to no more than three significant digits; may not add to totals shown.3includes inventory adjustment.
metric tons, was received on toll arrangements.
TABlE 4—Continuedu.S. STOCKS, RECEiPTS, AnD COnSumPTiOn OF PuRCHASED nEW AnD OlD Aluminum SCRAP
AnD SWEATED PiG in 20121, 2
(metric tons)
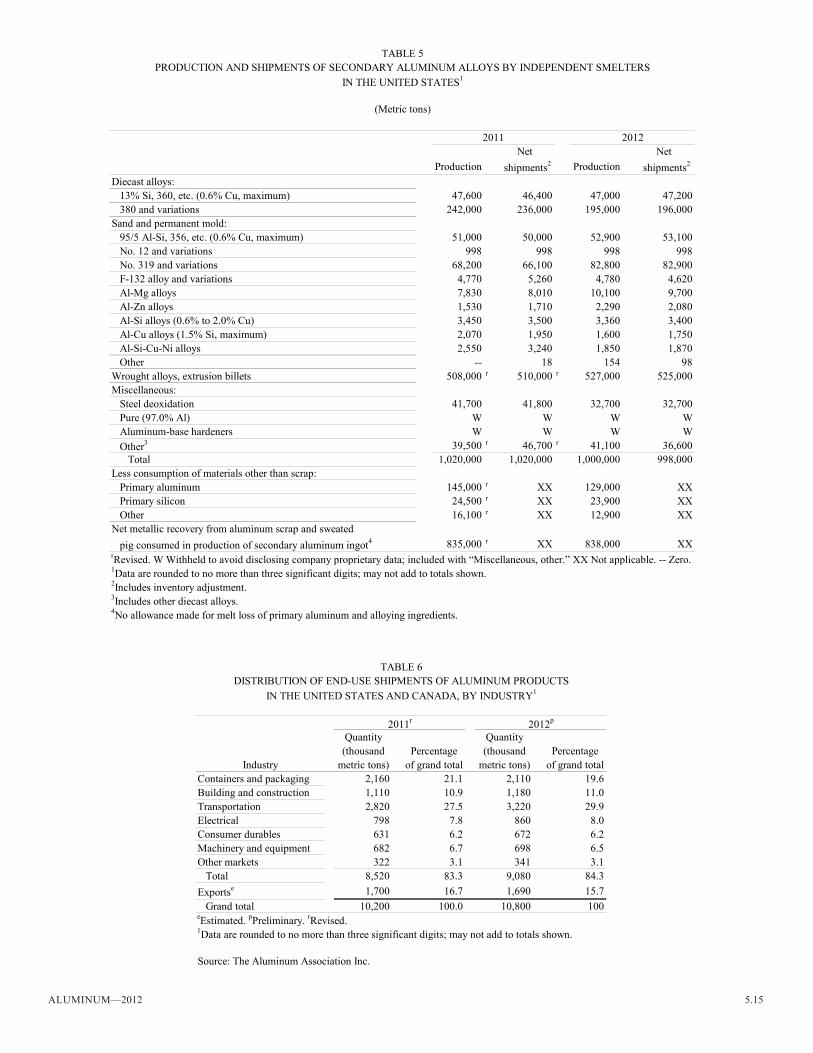
Aluminum—2012 5.15
2011 2012net net
Production shipments2 Production shipments2
Diecast alloys:13% Si, 360, etc. (0.6% Cu, maximum) 47,600 46,400 47,000 47,200380 and variations 242,000 236,000 195,000 196,000
Sand and permanent mold:95/5 Al-Si, 356, etc. (0.6% Cu, maximum) 51,000 50,000 52,900 53,100no. 12 and variations 998 998 998 998no. 319 and variations 68,200 66,100 82,800 82,900F-132 alloy and variations 4,770 5,260 4,780 4,620Al-mg alloys 7,830 8,010 10,100 9,700Al-Zn alloys 1,530 1,710 2,290 2,080Al-Si alloys (0.6% to 2.0% Cu) 3,450 3,500 3,360 3,400Al-Cu alloys (1.5% Si, maximum) 2,070 1,950 1,600 1,750Al-Si-Cu-ni alloys 2,550 3,240 1,850 1,870Other -- 18 154 98
Wrought alloys, extrusion billets 508,000 r 510,000 r 527,000 525,000miscellaneous:
Steel deoxidation 41,700 41,800 32,700 32,700Pure (97.0% Al) W W W WAluminum-base hardeners W W W WOther3 39,500 r 46,700 r 41,100 36,600
Total 1,020,000 1,020,000 1,000,000 998,000less consumption of materials other than scrap:
Primary aluminum 145,000 r XX 129,000 XXPrimary silicon 24,500 r XX 23,900 XXOther 16,100 r XX 12,900 XX
net metallic recovery from aluminum scrap and sweatedpig consumed in production of secondary aluminum ingot4 835,000 r XX 838,000 XX
1Data are rounded to no more than three significant digits; may not add to totals shown.2includes inventory adjustment.3includes other diecast alloys.4no allowance made for melt loss of primary aluminum and alloying ingredients.
TABlE 5PRODuCTiOn AnD SHiPmEnTS OF SECOnDARY Aluminum AllOYS BY inDEPEnDEnT SmElTERS
in THE uniTED STATES1
(metric tons)
rRevised. W Withheld to avoid disclosing company proprietary data; included with “miscellaneous, other.” XX not applicable. -- Zero.
2011r 2012p
Quantity Quantity(thousand Percentage (thousand Percentage
industry metric tons) of grand total metric tons) of grand totalContainers and packaging 2,160 21.1 2,110 19.6Building and construction 1,110 10.9 1,180 11.0Transportation 2,820 27.5 3,220 29.9Electrical 798 7.8 860 8.0Consumer durables 631 6.2 672 6.2machinery and equipment 682 6.7 698 6.5Other markets 322 3.1 341 3.1
Total 8,520 83.3 9,080 84.3Exportse 1,700 16.7 1,690 15.7
Grand total 10,200 100.0 10,800 100eEstimated. pPreliminary. rRevised.1Data are rounded to no more than three significant digits; may not add to totals shown.
Source: The Aluminum Association inc.
TABlE 6DiSTRiBuTiOn OF EnD-uSE SHiPmEnTS OF Aluminum PRODuCTS
in THE uniTED STATES AnD CAnADA, BY inDuSTRY1
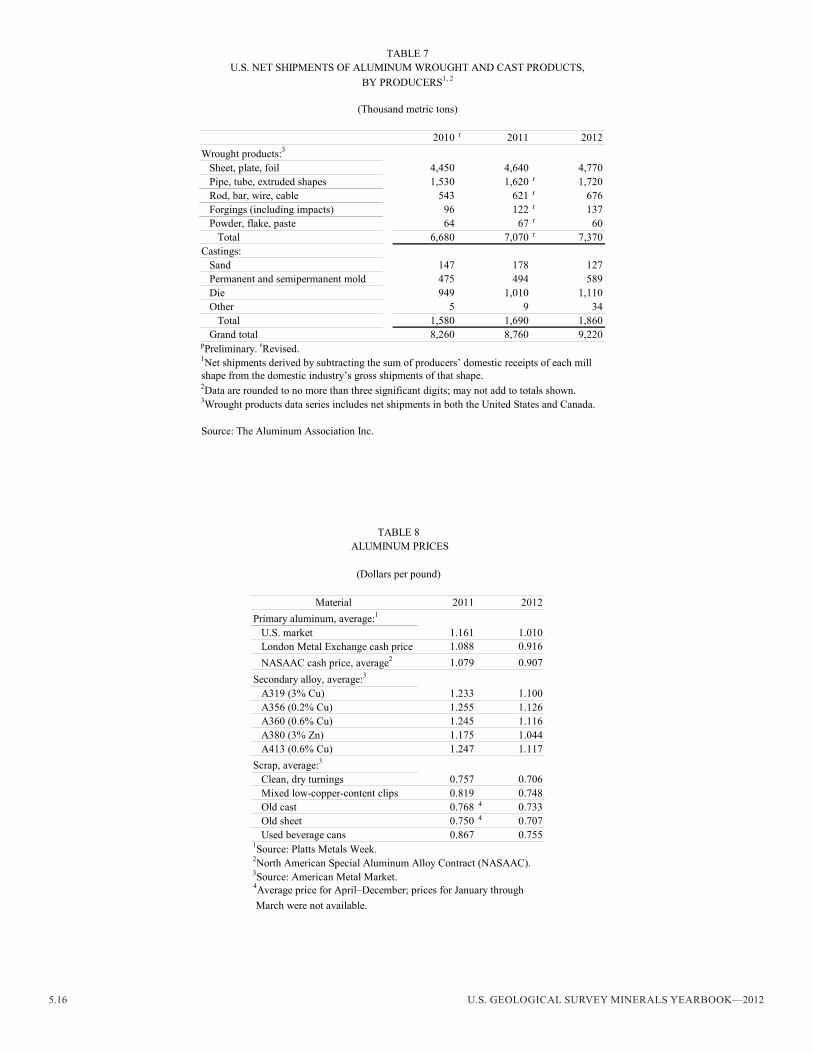
5.16 U.S. GEOLOGICAL SURVEY MINERALS YEARBOOK—2012
2010 r 2011 2012Wrought products:3
Sheet, plate, foil 4,450 4,640 4,770Pipe, tube, extruded shapes 1,530 1,620 r 1,720Rod, bar, wire, cable 543 621 r 676Forgings (including impacts) 96 122 r 137Powder, flake, paste 64 67 r 60
Total 6,680 7,070 r 7,370Castings:
Sand 147 178 127Permanent and semipermanent mold 475 494 589Die 949 1,010 1,110Other 5 9 34
Total 1,580 1,690 1,860Grand total 8,260 8,760 9,220
1net shipments derived by subtracting the sum of producers’ domestic receipts of each millshape from the domestic industry’s gross shipments of that shape.2Data are rounded to no more than three significant digits; may not add to totals shown.
Source: The Aluminum Association inc.
TABlE 7u.S. nET SHiPmEnTS OF Aluminum WROuGHT AnD CAST PRODuCTS,
BY PRODuCERS1, 2
3Wrought products data series includes net shipments in both the united States and Canada.
(Thousand metric tons)
pPreliminary. rRevised.
material 2011 2012Primary aluminum, average:1
u.S. market 1.161 1.010london metal Exchange cash price 1.088 0.916nASAAC cash price, average2 1.079 0.907
Secondary alloy, average:3
A319 (3% Cu) 1.233 1.100A356 (0.2% Cu) 1.255 1.126A360 (0.6% Cu) 1.245 1.116A380 (3% Zn) 1.175 1.044A413 (0.6% Cu) 1.247 1.117
Scrap, average:3
Clean, dry turnings 0.757 0.706mixed low-copper-content clips 0.819 0.748Old cast 0.768 4 0.733Old sheet 0.750 4 0.707used beverage cans 0.867 0.755
TABlE 8 Aluminum PRiCES
(Dollars per pound)
2north American Special Aluminum Alloy Contract (nASAAC).
4Average price for April–December; prices for January through march were not available.
3Source: American metal market.
1Source: Platts metals Week.
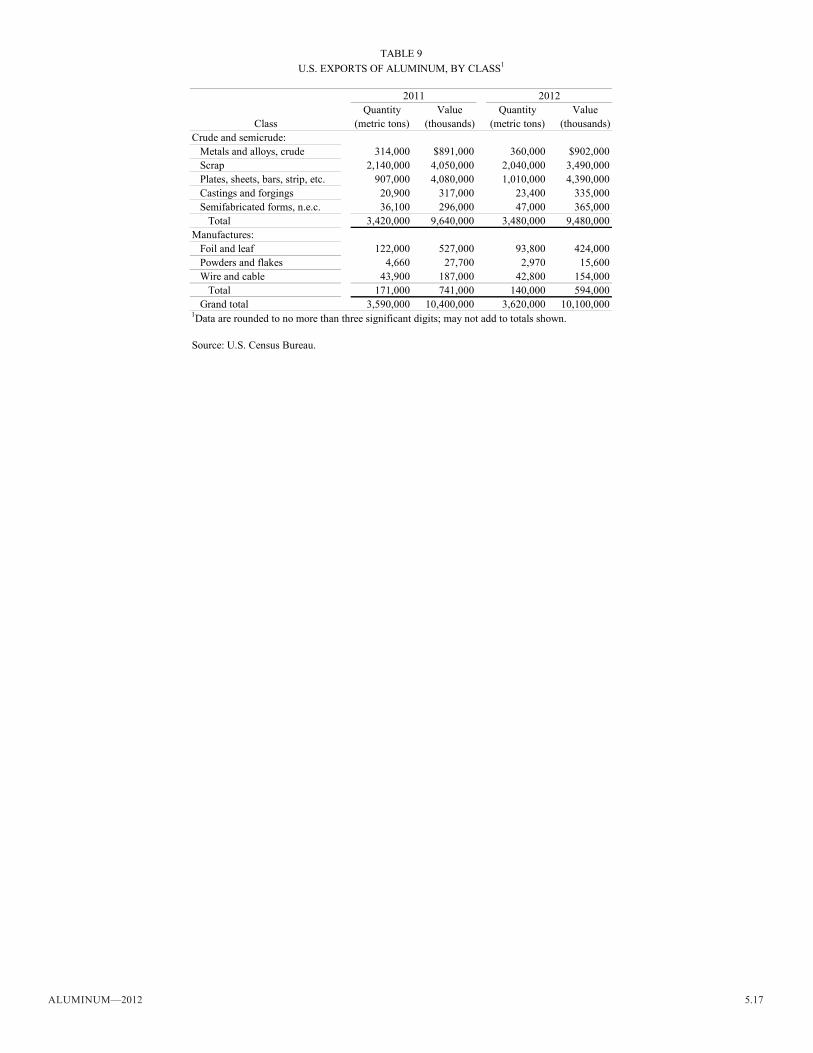
Aluminum—2012 5.17
2011 2012Quantity Value Quantity Value
Class (metric tons) (thousands) (metric tons) (thousands)Crude and semicrude:
metals and alloys, crude 314,000 $891,000 360,000 $902,000Scrap 2,140,000 4,050,000 2,040,000 3,490,000Plates, sheets, bars, strip, etc. 907,000 4,080,000 1,010,000 4,390,000Castings and forgings 20,900 317,000 23,400 335,000Semifabricated forms, n.e.c. 36,100 296,000 47,000 365,000
Total 3,420,000 9,640,000 3,480,000 9,480,000manufactures:
Foil and leaf 122,000 527,000 93,800 424,000Powders and flakes 4,660 27,700 2,970 15,600Wire and cable 43,900 187,000 42,800 154,000
Total 171,000 741,000 140,000 594,000Grand total 3,590,000 10,400,000 3,620,000 10,100,000
Source: u.S. Census Bureau.
TABlE 9u.S. EXPORTS OF Aluminum, BY ClASS1
1Data are rounded to no more than three significant digits; may not add to totals shown.
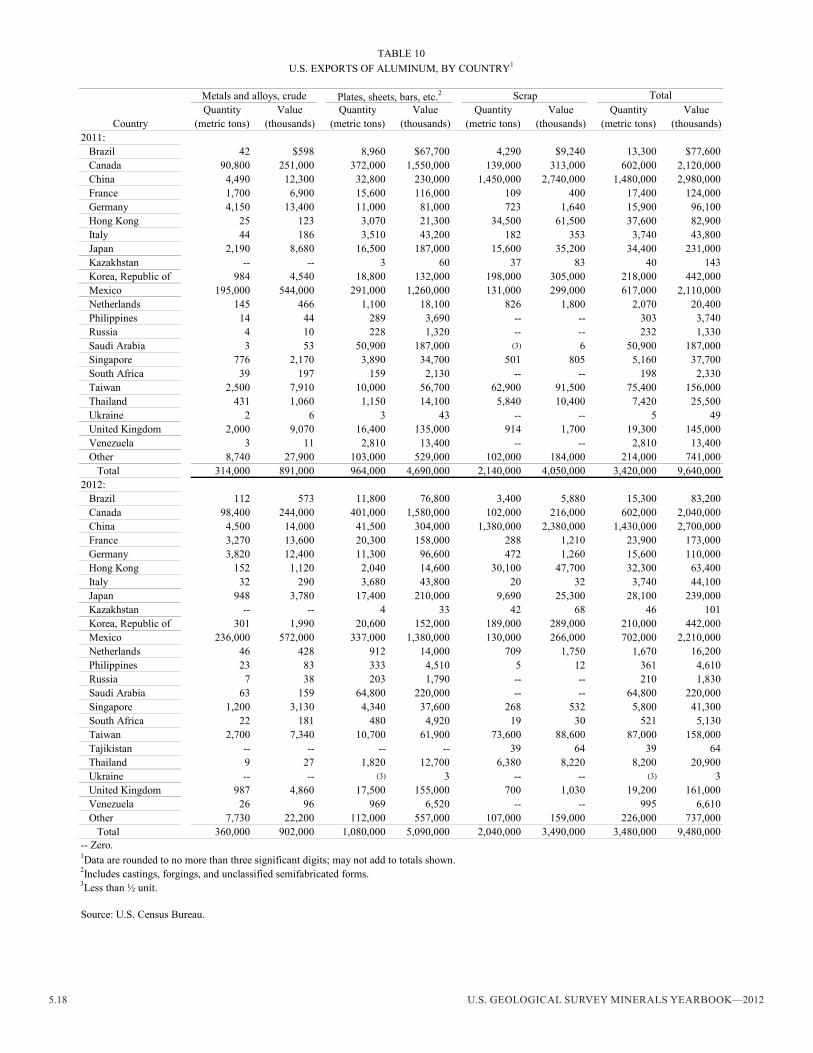
5.18 U.S. GEOLOGICAL SURVEY MINERALS YEARBOOK—2012
metals and alloys, crude Plates, sheets, bars, etc.2 ScrapQuantity Value Quantity Value Quantity Value Quantity Value
Country (metric tons) (thousands) (metric tons) (thousands) (metric tons) (thousands) (metric tons) (thousands)2011:
Brazil 42 $598 8,960 $67,700 4,290 $9,240 13,300 $77,600Canada 90,800 251,000 372,000 1,550,000 139,000 313,000 602,000 2,120,000China 4,490 12,300 32,800 230,000 1,450,000 2,740,000 1,480,000 2,980,000France 1,700 6,900 15,600 116,000 109 400 17,400 124,000Germany 4,150 13,400 11,000 81,000 723 1,640 15,900 96,100Hong Kong 25 123 3,070 21,300 34,500 61,500 37,600 82,900italy 44 186 3,510 43,200 182 353 3,740 43,800Japan 2,190 8,680 16,500 187,000 15,600 35,200 34,400 231,000Kazakhstan -- -- 3 60 37 83 40 143Korea, Republic of 984 4,540 18,800 132,000 198,000 305,000 218,000 442,000mexico 195,000 544,000 291,000 1,260,000 131,000 299,000 617,000 2,110,000netherlands 145 466 1,100 18,100 826 1,800 2,070 20,400Philippines 14 44 289 3,690 -- -- 303 3,740Russia 4 10 228 1,320 -- -- 232 1,330Saudi Arabia 3 53 50,900 187,000 (3) 6 50,900 187,000Singapore 776 2,170 3,890 34,700 501 805 5,160 37,700South Africa 39 197 159 2,130 -- -- 198 2,330Taiwan 2,500 7,910 10,000 56,700 62,900 91,500 75,400 156,000Thailand 431 1,060 1,150 14,100 5,840 10,400 7,420 25,500ukraine 2 6 3 43 -- -- 5 49united Kingdom 2,000 9,070 16,400 135,000 914 1,700 19,300 145,000Venezuela 3 11 2,810 13,400 -- -- 2,810 13,400Other 8,740 27,900 103,000 529,000 102,000 184,000 214,000 741,000
Total 314,000 891,000 964,000 4,690,000 2,140,000 4,050,000 3,420,000 9,640,0002012:
Brazil 112 573 11,800 76,800 3,400 5,880 15,300 83,200Canada 98,400 244,000 401,000 1,580,000 102,000 216,000 602,000 2,040,000China 4,500 14,000 41,500 304,000 1,380,000 2,380,000 1,430,000 2,700,000France 3,270 13,600 20,300 158,000 288 1,210 23,900 173,000Germany 3,820 12,400 11,300 96,600 472 1,260 15,600 110,000Hong Kong 152 1,120 2,040 14,600 30,100 47,700 32,300 63,400italy 32 290 3,680 43,800 20 32 3,740 44,100Japan 948 3,780 17,400 210,000 9,690 25,300 28,100 239,000Kazakhstan -- -- 4 33 42 68 46 101Korea, Republic of 301 1,990 20,600 152,000 189,000 289,000 210,000 442,000mexico 236,000 572,000 337,000 1,380,000 130,000 266,000 702,000 2,210,000netherlands 46 428 912 14,000 709 1,750 1,670 16,200Philippines 23 83 333 4,510 5 12 361 4,610Russia 7 38 203 1,790 -- -- 210 1,830Saudi Arabia 63 159 64,800 220,000 -- -- 64,800 220,000Singapore 1,200 3,130 4,340 37,600 268 532 5,800 41,300South Africa 22 181 480 4,920 19 30 521 5,130Taiwan 2,700 7,340 10,700 61,900 73,600 88,600 87,000 158,000Tajikistan -- -- -- -- 39 64 39 64Thailand 9 27 1,820 12,700 6,380 8,220 8,200 20,900ukraine -- -- (3) 3 -- -- (3) 3united Kingdom 987 4,860 17,500 155,000 700 1,030 19,200 161,000Venezuela 26 96 969 6,520 -- -- 995 6,610Other 7,730 22,200 112,000 557,000 107,000 159,000 226,000 737,000
Total 360,000 902,000 1,080,000 5,090,000 2,040,000 3,490,000 3,480,000 9,480,000
TABlE 10
-- Zero.1Data are rounded to no more than three significant digits; may not add to totals shown.2includes castings, forgings, and unclassified semifabricated forms.3less than ½ unit.
Source: u.S. Census Bureau.
u.S. EXPORTS OF Aluminum, BY COunTRY1
Total
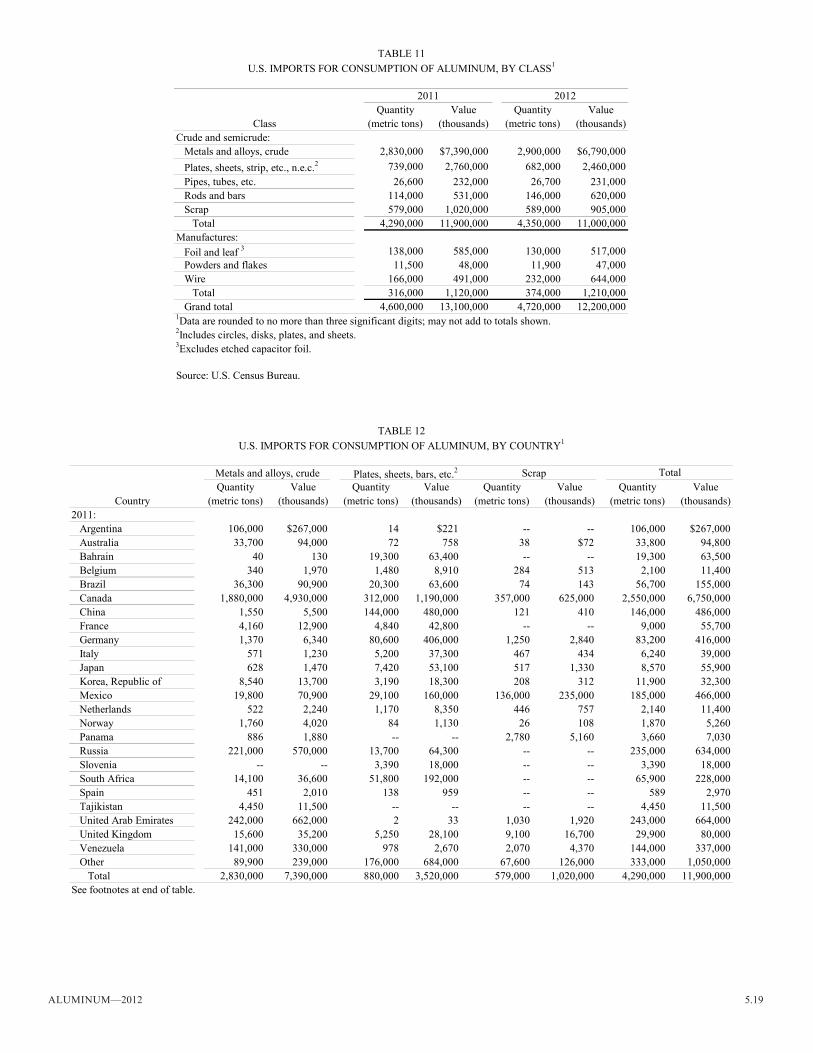
Aluminum—2012 5.19
2011 2012Quantity Value Quantity Value
Class (metric tons) (thousands) (metric tons) (thousands)Crude and semicrude:
metals and alloys, crude 2,830,000 $7,390,000 2,900,000 $6,790,000Plates, sheets, strip, etc., n.e.c.2 739,000 2,760,000 682,000 2,460,000Pipes, tubes, etc. 26,600 232,000 26,700 231,000Rods and bars 114,000 531,000 146,000 620,000Scrap 579,000 1,020,000 589,000 905,000
Total 4,290,000 11,900,000 4,350,000 11,000,000manufactures:
Foil and leaf 3 138,000 585,000 130,000 517,000Powders and flakes 11,500 48,000 11,900 47,000Wire 166,000 491,000 232,000 644,000
Total 316,000 1,120,000 374,000 1,210,000Grand total 4,600,000 13,100,000 4,720,000 12,200,000
Source: u.S. Census Bureau.
TABlE 11u.S. imPORTS FOR COnSumPTiOn OF Aluminum, BY ClASS1
1Data are rounded to no more than three significant digits; may not add to totals shown.2includes circles, disks, plates, and sheets.3Excludes etched capacitor foil.
metals and alloys, crude Plates, sheets, bars, etc.2 ScrapQuantity Value Quantity Value Quantity Value Quantity Value
Country (metric tons) (thousands) (metric tons) (thousands) (metric tons) (thousands) (metric tons) (thousands)2011:
Argentina 106,000 $267,000 14 $221 -- -- 106,000 $267,000Australia 33,700 94,000 72 758 38 $72 33,800 94,800Bahrain 40 130 19,300 63,400 -- -- 19,300 63,500Belgium 340 1,970 1,480 8,910 284 513 2,100 11,400Brazil 36,300 90,900 20,300 63,600 74 143 56,700 155,000Canada 1,880,000 4,930,000 312,000 1,190,000 357,000 625,000 2,550,000 6,750,000China 1,550 5,500 144,000 480,000 121 410 146,000 486,000France 4,160 12,900 4,840 42,800 -- -- 9,000 55,700Germany 1,370 6,340 80,600 406,000 1,250 2,840 83,200 416,000italy 571 1,230 5,200 37,300 467 434 6,240 39,000Japan 628 1,470 7,420 53,100 517 1,330 8,570 55,900Korea, Republic of 8,540 13,700 3,190 18,300 208 312 11,900 32,300mexico 19,800 70,900 29,100 160,000 136,000 235,000 185,000 466,000netherlands 522 2,240 1,170 8,350 446 757 2,140 11,400norway 1,760 4,020 84 1,130 26 108 1,870 5,260Panama 886 1,880 -- -- 2,780 5,160 3,660 7,030Russia 221,000 570,000 13,700 64,300 -- -- 235,000 634,000Slovenia -- -- 3,390 18,000 -- -- 3,390 18,000South Africa 14,100 36,600 51,800 192,000 -- -- 65,900 228,000Spain 451 2,010 138 959 -- -- 589 2,970Tajikistan 4,450 11,500 -- -- -- -- 4,450 11,500united Arab Emirates 242,000 662,000 2 33 1,030 1,920 243,000 664,000united Kingdom 15,600 35,200 5,250 28,100 9,100 16,700 29,900 80,000Venezuela 141,000 330,000 978 2,670 2,070 4,370 144,000 337,000Other 89,900 239,000 176,000 684,000 67,600 126,000 333,000 1,050,000
Total 2,830,000 7,390,000 880,000 3,520,000 579,000 1,020,000 4,290,000 11,900,000See footnotes at end of table.
TABlE 12u.S. imPORTS FOR COnSumPTiOn OF Aluminum, BY COunTRY1
Total
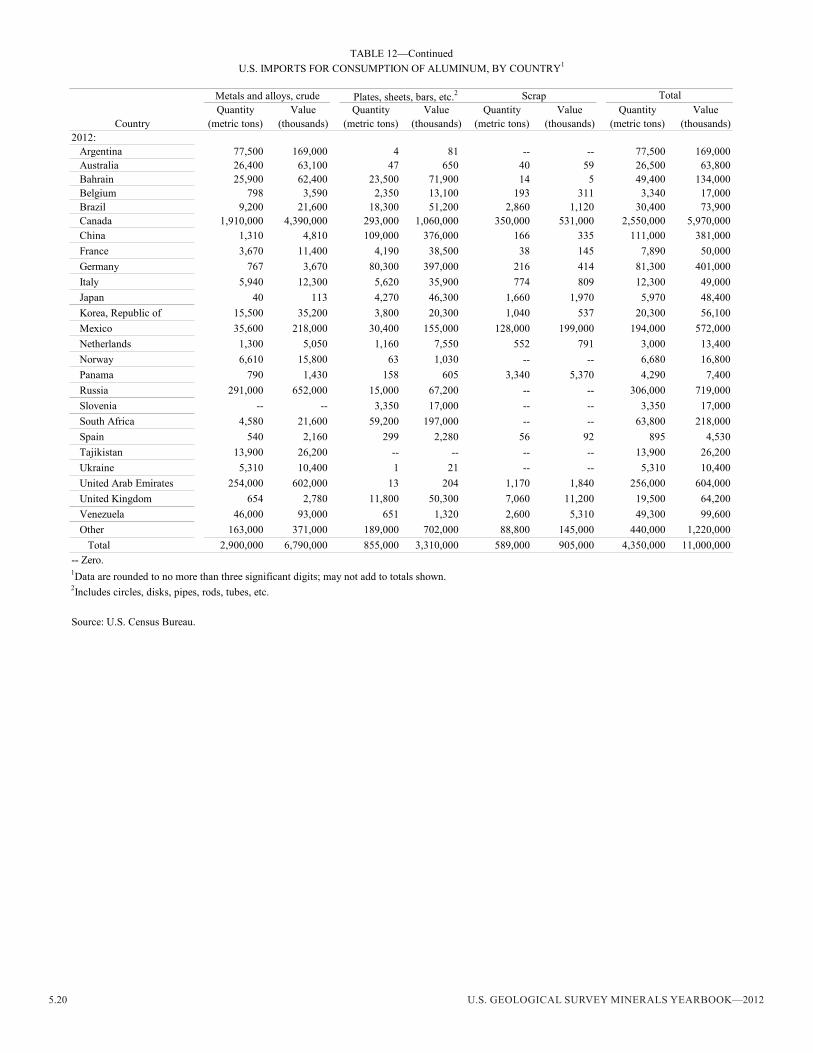
5.20 U.S. GEOLOGICAL SURVEY MINERALS YEARBOOK—2012
metals and alloys, crude Plates, sheets, bars, etc.2 ScrapQuantity Value Quantity Value Quantity Value Quantity Value
Country (metric tons) (thousands) (metric tons) (thousands) (metric tons) (thousands) (metric tons) (thousands)2012:
Argentina 77,500 169,000 4 81 -- -- 77,500 169,000Australia 26,400 63,100 47 650 40 59 26,500 63,800Bahrain 25,900 62,400 23,500 71,900 14 5 49,400 134,000Belgium 798 3,590 2,350 13,100 193 311 3,340 17,000Brazil 9,200 21,600 18,300 51,200 2,860 1,120 30,400 73,900Canada 1,910,000 4,390,000 293,000 1,060,000 350,000 531,000 2,550,000 5,970,000China 1,310 4,810 109,000 376,000 166 335 111,000 381,000France 3,670 11,400 4,190 38,500 38 145 7,890 50,000Germany 767 3,670 80,300 397,000 216 414 81,300 401,000italy 5,940 12,300 5,620 35,900 774 809 12,300 49,000Japan 40 113 4,270 46,300 1,660 1,970 5,970 48,400Korea, Republic of 15,500 35,200 3,800 20,300 1,040 537 20,300 56,100mexico 35,600 218,000 30,400 155,000 128,000 199,000 194,000 572,000netherlands 1,300 5,050 1,160 7,550 552 791 3,000 13,400norway 6,610 15,800 63 1,030 -- -- 6,680 16,800Panama 790 1,430 158 605 3,340 5,370 4,290 7,400Russia 291,000 652,000 15,000 67,200 -- -- 306,000 719,000Slovenia -- -- 3,350 17,000 -- -- 3,350 17,000South Africa 4,580 21,600 59,200 197,000 -- -- 63,800 218,000Spain 540 2,160 299 2,280 56 92 895 4,530Tajikistan 13,900 26,200 -- -- -- -- 13,900 26,200ukraine 5,310 10,400 1 21 -- -- 5,310 10,400united Arab Emirates 254,000 602,000 13 204 1,170 1,840 256,000 604,000united Kingdom 654 2,780 11,800 50,300 7,060 11,200 19,500 64,200Venezuela 46,000 93,000 651 1,320 2,600 5,310 49,300 99,600Other 163,000 371,000 189,000 702,000 88,800 145,000 440,000 1,220,000
Total 2,900,000 6,790,000 855,000 3,310,000 589,000 905,000 4,350,000 11,000,000
TABlE 12—Continuedu.S. imPORTS FOR COnSumPTiOn OF Aluminum, BY COunTRY1
Total
Source: u.S. Census Bureau.
-- Zero.1Data are rounded to no more than three significant digits; may not add to totals shown.2includes circles, disks, pipes, rods, tubes, etc.
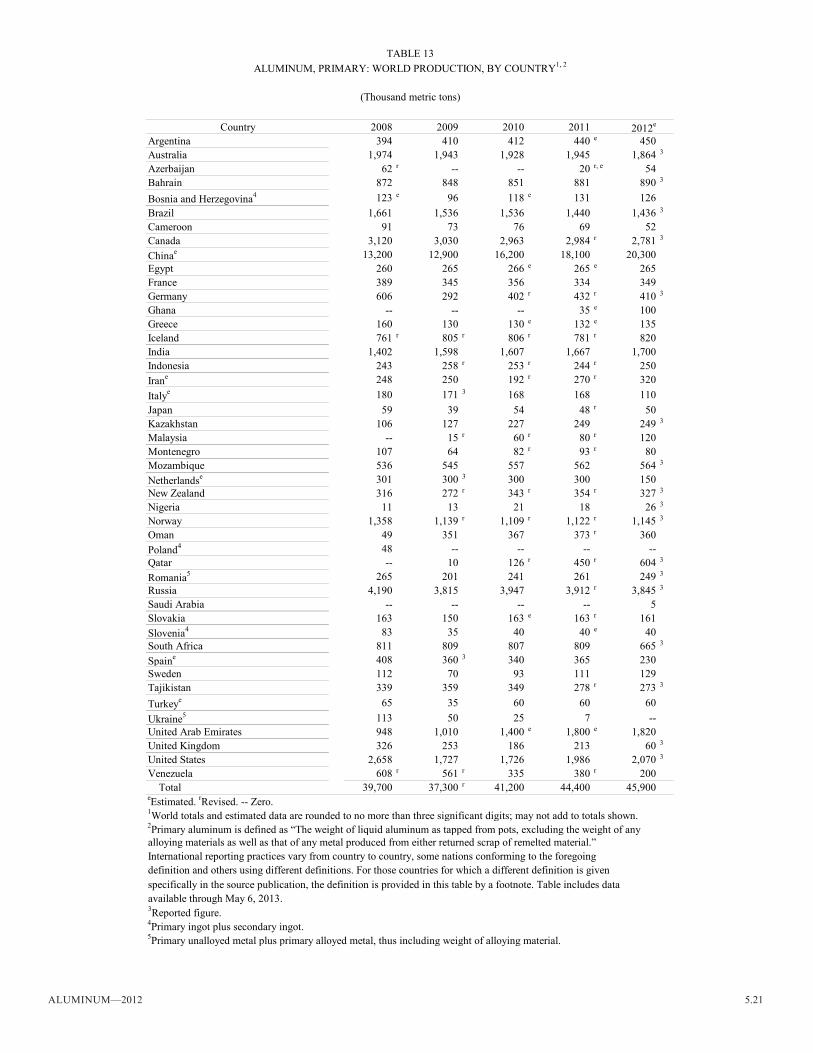
Aluminum—2012 5.21
Country 2008 2009 2010 2011 2012e
Argentina 394 410 412 440 e 450Australia 1,974 1,943 1,928 1,945 1,864 3
Azerbaijan 62 r -- -- 20 r, e 54Bahrain 872 848 851 881 890 3
Bosnia and Herzegovina4 123 e 96 118 e 131 126Brazil 1,661 1,536 1,536 1,440 1,436 3
Cameroon 91 73 76 69 52Canada 3,120 3,030 2,963 2,984 r 2,781 3
Chinae 13,200 12,900 16,200 18,100 20,300Egypt 260 265 266 e 265 e 265France 389 345 356 334 349Germany 606 292 402 r 432 r 410 3
Ghana -- -- -- 35 e 100Greece 160 130 130 e 132 e 135iceland 761 r 805 r 806 r 781 r 820india 1,402 1,598 1,607 1,667 1,700indonesia 243 258 r 253 r 244 r 250irane 248 250 192 r 270 r 320italye 180 171 3 168 168 110Japan 59 39 54 48 r 50Kazakhstan 106 127 227 249 249 3
malaysia -- 15 r 60 r 80 r 120montenegro 107 64 82 r 93 r 80Mozambique 536 545 557 562 564 3
netherlandse 301 300 3 300 300 150new Zealand 316 272 r 343 r 354 r 327 3
nigeria 11 13 21 18 26 3
norway 1,358 1,139 r 1,109 r 1,122 r 1,145 3
Oman 49 351 367 373 r 360Poland4 48 -- -- -- --Qatar -- 10 126 r 450 r 604 3
Romania5 265 201 241 261 249 3
Russia 4,190 3,815 3,947 3,912 r 3,845 3
Saudi Arabia -- -- -- -- 5Slovakia 163 150 163 e 163 r 161Slovenia4 83 35 40 40 e 40South Africa 811 809 807 809 665 3
Spaine 408 360 3 340 365 230Sweden 112 70 93 111 129Tajikistan 339 359 349 278 r 273 3
Turkeye 65 35 60 60 60ukraine5 113 50 25 7 --united Arab Emirates 948 1,010 1,400 e 1,800 e 1,820united Kingdom 326 253 186 213 60 3
united States 2,658 1,727 1,726 1,986 2,070 3
Venezuela 608 r 561 r 335 380 r 200 Total 39,700 37,300 r 41,200 44,400 45,900
specifically in the source publication, the definition is provided in this table by a footnote. Table includes data available through may 6, 2013.
TABlE 13Aluminum, PRimARY: WORlD PRODuCTiOn, BY COunTRY1, 2
(Thousand metric tons)
eEstimated. rRevised. -- Zero.1World totals and estimated data are rounded to no more than three significant digits; may not add to totals shown.2Primary aluminum is defined as “The weight of liquid aluminum as tapped from pots, excluding the weight of any
5Primary unalloyed metal plus primary alloyed metal, thus including weight of alloying material.
alloying materials as well as that of any metal produced from either returned scrap of remelted material.” international reporting practices vary from country to country, some nations conforming to the foregoing definition and others using different definitions. For those countries for which a different definition is given
3Reported figure.4Primary ingot plus secondary ingot.