Embed Size (px)
Citation preview
2012 Season Kick-Off
Pala Mesa Resort
January 12, 2012
Agenda• Good Agricultural Practices
• Country trends
• Volume summary
• US market trends
• Index marketing
• Harvest recommendations & success factors
• Price expectations
• Long term outlook
• Questions
Good Agricultural Practices• Why do growers need to implement?
• Food safety illnesses and deaths – cantaloupes, spinach, jalapeno, processed guacamole, etc…
• New FDA guidelines
• Customer concerns – Costco, Wal-Mart, Chipotle…
• All links in the distribution chain are exposed; growers, shippers, third party auditors, retailers and food service customers
• GAP audits across the industry mitigate the risk that individual growers and the avocado industry will suffer a fatal blow from a food
safety incident
Good Agricultural Practices• What is GAP?
• Grower• Field sanitation • Worker hygiene
• Agricultural inputs – water, fertilizer, mulch, etc…• Employee training• Record keeping
• Harvest Crews• Worker hygiene• Field sanitation
• Equipment sanitation• Training
• Record keeping
Good Agricultural Practices• What are my options?
Work under CAC guidelines• CAC rebate
• CDFA auditor under USDA contract• www.CaliforniaAvocadoGrowers.com/gap
Work with a third party auditor• Primus
• NSF Agriculture
Country Trends - California• Season = November to October
• 2012 crop up 34% • 2011 = 287 m lbs. (carryout removed)
• 2012 = 385 m lbs.
• 2011 heavy to south vs. 2012 heavy to north
• Fruit size = normal
• On tree quality = good – limited trips damage
• Acreage stable (increasing in North/decreasing in South, nurseries
sold out)
Country Trends - Mexico• Season = July to June
• 2012 crop up 20%• 2011 = 585 m lbs.• 2012 = 700 m lbs.
• Acreage increasing in Michoacán and Jalisco
• Mexican and Asian markets consume Mexican avocados
• Majority destined for US market
• Currently shipping at high rates
Country Trends – Chile
• Season = July to June
• 2012 crop up 25%• 2011 = 120 m lbs.• 2012 = 150 m lbs.
• Acreage stable to slightly increasing (3%/year)
• Chilean, European, Argentinian markets expanding
• Smaller % of production coming to US
• Inconsistent supply in 2011
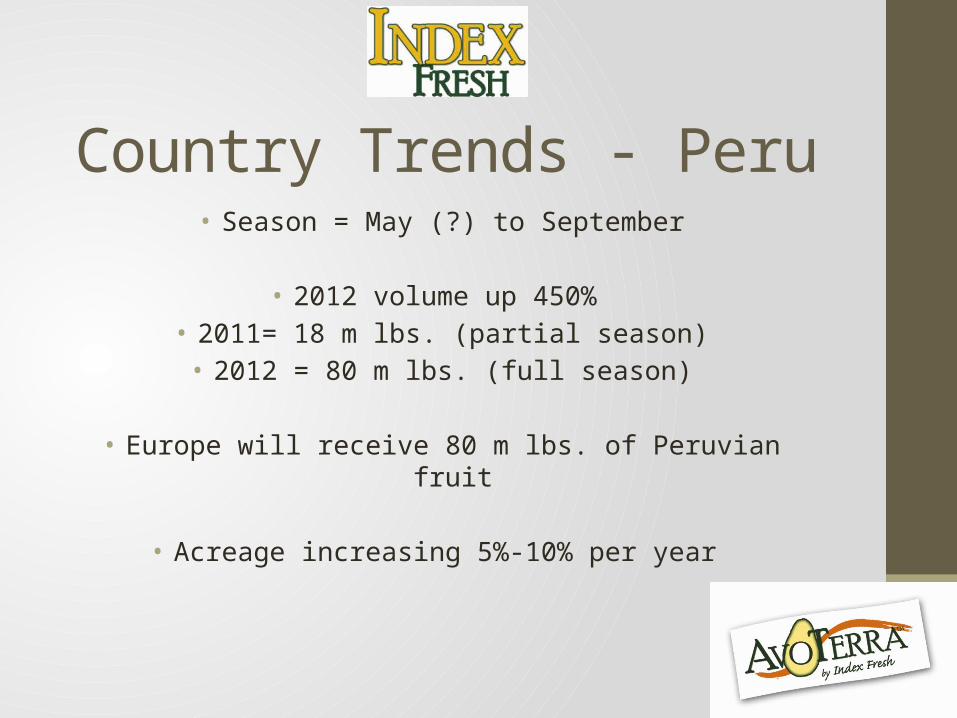
Country Trends - Peru• Season = May (?) to September
• 2012 volume up 450% • 2011= 18 m lbs. (partial season)• 2012 = 80 m lbs. (full season)
• Europe will receive 80 m lbs. of Peruvian fruit
• Acreage increasing 5%-10% per year
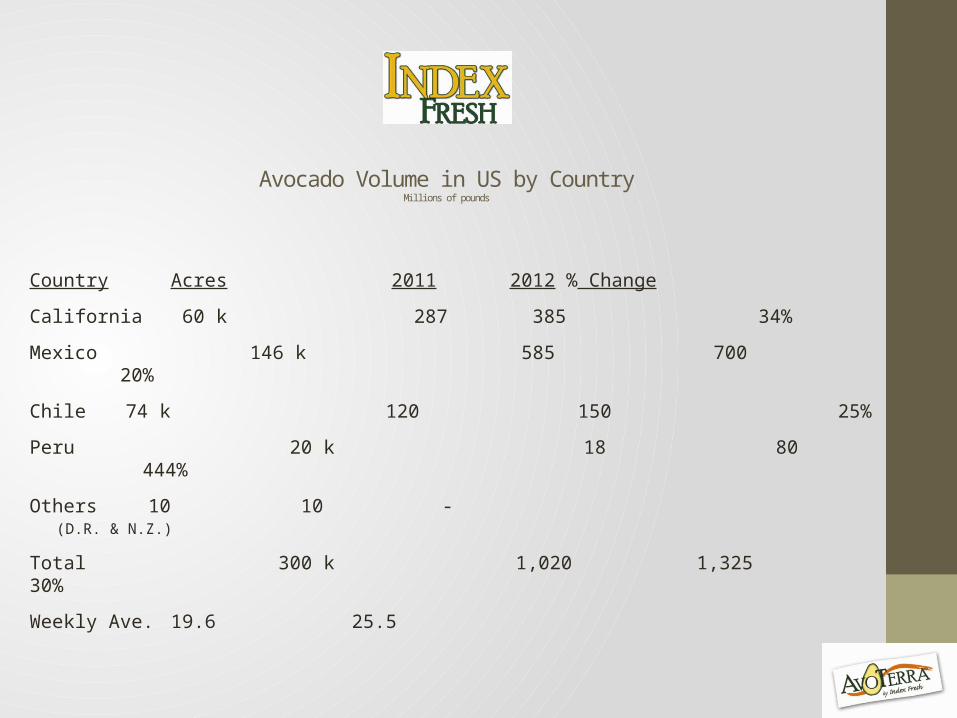
Avocado Volume in US by CountryMillions of pounds
Country Acres 2011 2012 % Change
California 60 k 287 385 34%
Mexico 146 k 585 700 20%
Chile 74 k 120 150 25%
Peru 20 k 18 80 444%
Others 10 10 - (D.R. & N.Z.)
Total 300 k 1,020 1,325 30%
Weekly Ave. 19.6 25.5
US Market Trends
• US market consumption is growing at an estimated 10% per year
• Current “sweet spot” is 20 to 24 million pounds per week
• Avocado holidays, Super-bowl, Cinco de Mayo, 4th of July can take up to 30 million pounds per week
US Avocado Market Trends• Market will continue to grow due to:
• Large number of households that can begin or expand their avocado usage
• Quality product
• Health benefits
• Increased usage and cache (indulgence)
• Money maker for retailers and food service
US Avocado Market Trends
• California has invested in the market since the 1960’s
• Today $30-$40 million are spent each year marketing avocados
• California Avocado Commission• Hass Avocado Board
• Mexican Hass Avocado Importers Association• Chilean Avocado Importers Association
• Peruvian Avocado Board• APEAM
Index Marketing• Concentrate on Avocados in the US market
• 10% of overall avocado market
• Packinghouse/storage/ripening in California
• Storage /ripening in Denver, Texas & Pennsylvania
Index Marketing• Retail Customers = 65%
• Food service = 15%
• Wholesale = 25%
• Nationwide sales
• Concentrate on program business with major avocado users
Index Marketing• Major Customers
• Costco, Safeway, Kroger, Sam’s, Supervalu, Albertson’s, Stater Brothers, Harmon’s, Sprouts, Sunflower, Wakefern, Fiesta Marts,
QFC, Chipotle, Rubio’s, Baja Fresh, Fresh Point, Markon, Restaurant Depot
• Continually prospecting and improving the base
• Index sales staff incentive based upon superior returns
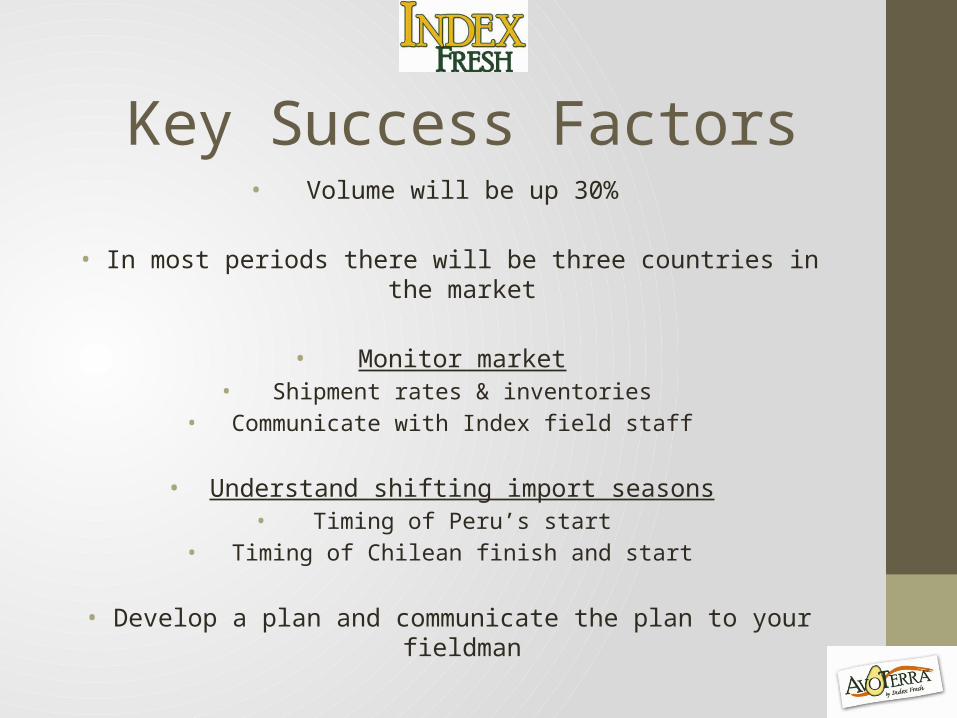
Key Success Factors• Volume will be up 30%
• In most periods there will be three countries in the market
• Monitor market• Shipment rates & inventories
• Communicate with Index field staff
• Understand shifting import seasons• Timing of Peru’s start
• Timing of Chilean finish and start
• Develop a plan and communicate the plan to your fieldman
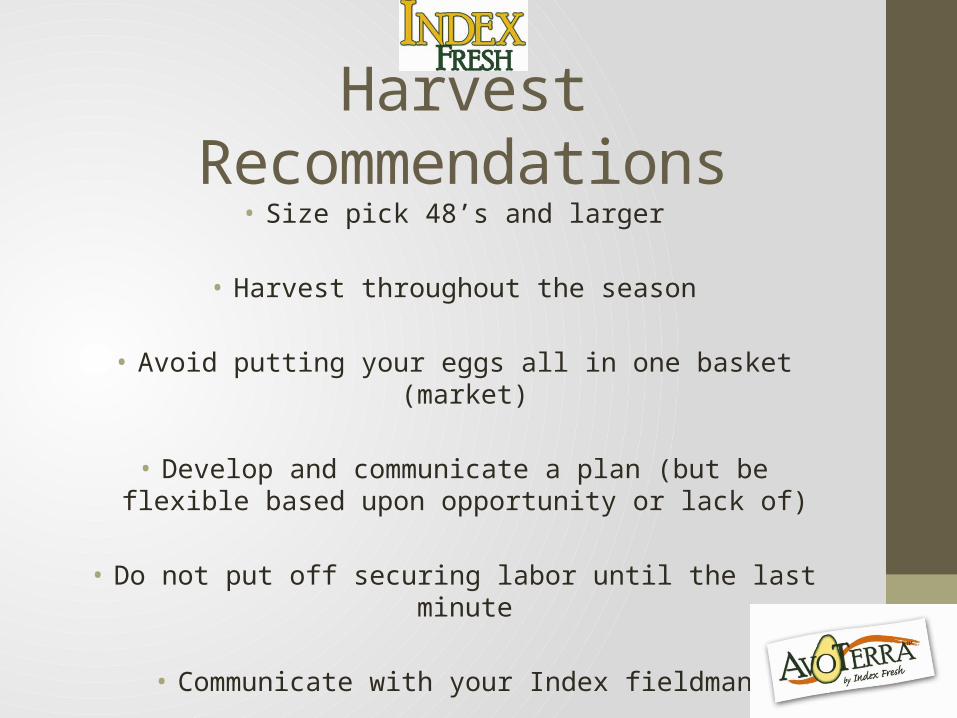
Harvest Recommendations• Size pick 48’s and larger
• Harvest throughout the season
• Avoid putting your eggs all in one basket (market)
• Develop and communicate a plan (but be flexible based upon opportunity or lack of)
• Do not put off securing labor until the last minute
• Communicate with your Index fieldman
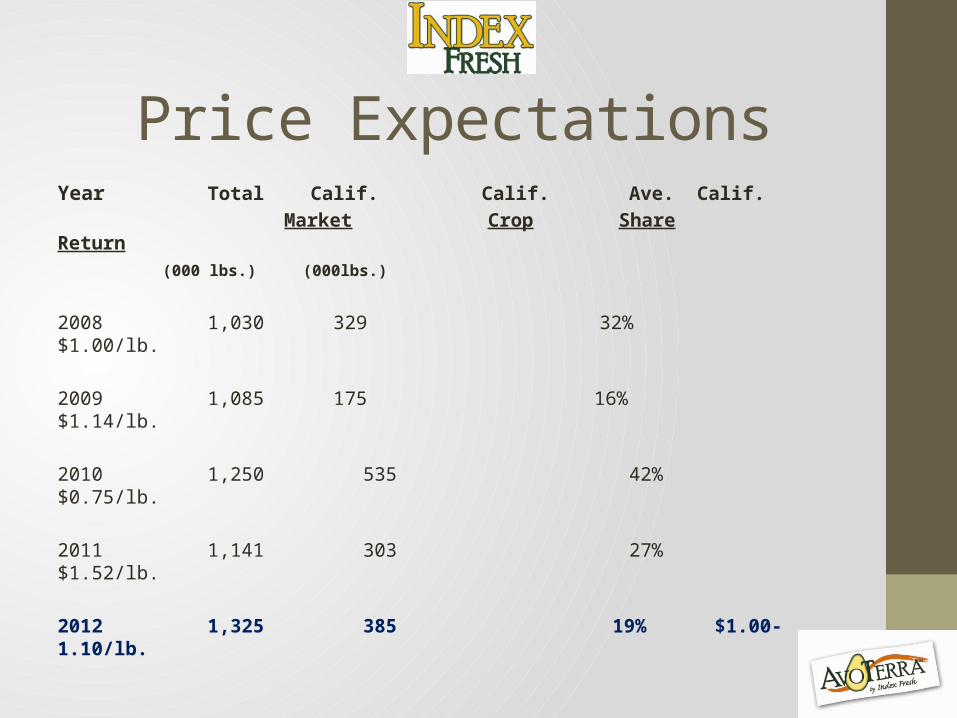
Price ExpectationsYear Total Calif. Calif. Ave. Calif.
Market Crop Share Return
(000 lbs.) (000lbs.)
2008 1,030 329 32% $1.00/lb.
2009 1,085 175 16% $1.14/lb.
2010 1,250 535 42% $0.75/lb.
2011 1,141 303 27% $1.52/lb.
2012 1,325 385 19% $1.00-1.10/lb.
Long Term Avocado Outlook• Demand for Hass will continue to grow
• Supply will increase, but demand should outpace supply
• Prices will remain attractive
• Index is positive about the future of the California avocado industry

Index Seminar Series• February – Pruning
• June - ?
• Suggestion for topics?
• Ideas to improve?
2012 Season Kick-Off
• Thank you!
• Questions?