Embed Size (px)
Citation preview
SCHOOL DISTRICT
OF
EGG HARBOR
TOWNSHIP
Egg Harbor Township Board of EducationEgg Harbor Township, New Jersey
Comprehensive Annual Financial Report For the Fiscal Year Ended June 30, 2014

Comprehensive AnnualFinancial Report
of the
Egg Harbor Township Board of Education
Egg Harbor Township, New Jersey
For the Fiscal Year Ended June 30, 2014
Prepared by
Egg Harbor Township Board of Education
Business Administration

INTRODUCTORY SECTION Page
Letter of Transmittal 1-12
Certificate of Excellence in Financial Reporting Award 13
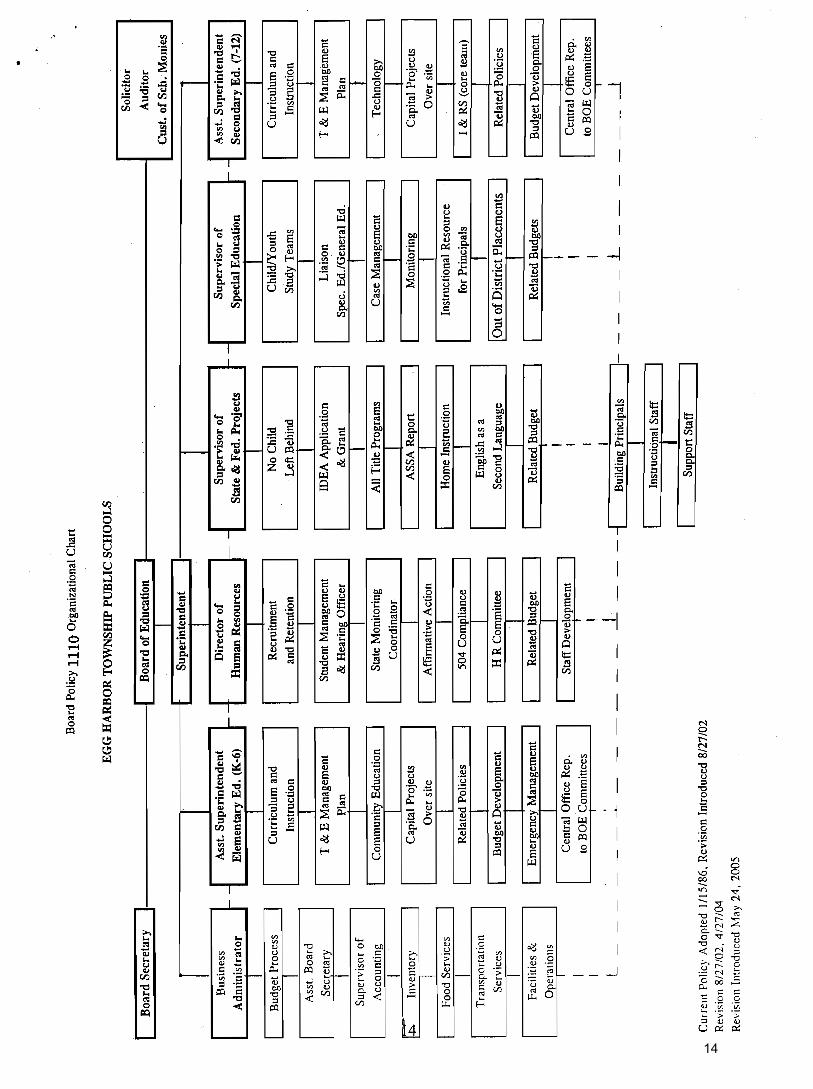
Organizational Chart 14
Roster of Officials 15
Consultants and Advisors 16
FINANCIAL SECTION
Independent Auditor's Report 17-19
Required Supplementary Information - Part I
Management's Discussion and Analysis 20-29
Basic Financial Statements
A District-wide Financial Statements:
A-1 Statement of Net Position 30
A-2 Statement of Activities 31
B Fund Financial Statement
Governmental Funds:
B-1 Balance Sheet 32
B-2 Statement of Revenues, Expenditures, and Changes in Fund Balances 33
B-3 Reconciliation of the Statement of Revenues, Expenditures, and
Changes in Fund Balances of Governmental Funds to the Statement
of Activities 34
Proprietary Funds:
B-4 Statement of Net Position 35
B-5 Statement of Revenues, Expenses, and Changes in Net Position 36
B-6 Statement of Cash Flows 37
Fiduciary Funds:
B-7 Statement of Fiduciary Net Position 38
B-8 Statement of Changes in Fiduciary Net Position 39
Notes to the Financial Statements 40-62
TABLE OF CONTENTS
Required Supplemental Information - Part II Page
C Budgetary Comparison Schedules
C-1 Budgetary Comparison Schedule - General Fund 63-74
C-1a Combining Schedule of Revenues, Expenditures, and Changes
in Fund Balance - Budget to Actual N/A
C-1b Community Development Block Grant - Budget and Actual N/A
C-2 Budgetary Comparison Schedule - Special Revenue Fund 75-76
Notes to the Required Supplementary Information
C-3 Budget-to-GAAP Reconciliation 77
Other Supplementary Information
D School Based Budget Schedules
D-1 Combining Balance Sheet N/A
D-2 Blended Resource Fund - Schedule of Expenditures
Allocated by Resource Type - Actual N/A
D-3 Blended Resource Fund - Schedule of Blended
Expenditures - Budget and Actual N/A
E Special Revenue Fund:
E-1 Combining Schedule of Program Revenues and
Expenditures Special Revenue Fund - Budgetary Basis 78-81
E-2 Preschool Education aid Schedule of
Expenditures - Budgetary Basis N/A
F Capital Projects Fund:
F-1 Summary Schedule of Project Expenditures 82
F-2 Summary Schedule of Revenues, Expenditures, and Changes
in Fund Balance - Budgetary Basis 83
F-2a -
F-2n Schedules of Project Revenues, Expenditures, Project Balance,
and Project Status - Budgetary Basis 84-98
G Proprietary Funds
Enterprise Fund:
G-1 Combining Statement of Net Position N/A
G-2 Combining Statement of Revenues, Expenses, and
Changes in Fund Net Position N/A
G-3 Combining Statement of Cash Flows N/A
TABLE OF CONTENTS (continued)
Page
Internal Service Fund:
G-4 Combining Statement of Net Position N/A
G-5 Combining Statement of Revenues, Expenses, and
Changes in Fund Net Position N/A
G-6 Combining Statement of Cash Flows N/A
H Fiduciary Funds:
H-1 Combining Statement of Fiduciary Net Position 99
H-2 Combining Statement of Changes in Fiduciary Net Position 100
H-3 Student Activity Agency Fund Schedule of Receipts and
Disbursements 101
H-4 Payroll Agency Fund Schedule of Receipts and
Disbursements 102-103
I Long-Term Debt:
I-1 Schedule of Serial Bonds 104-105
I-2 Schedule of Obligations under Capital Leases 106
I-3 Debt Service Fund Budgetary Comparison Schedule 107
STATISTICAL SECTION (Unaudited)
Introduction to the Statistical Section
Financial Trends
J-1 Net Position by Component 108
J-2 Changes in Net Position 109-111
J-3 Fund Balances - Governmental Funds 112
J-4 Changes in Fund Balances - Governmental Funds 113-114
J-5 General Fund Other Local Revenue by Source 115
Revenue Capacity
J-6 Assessed Value and Estimated Actual Value of Taxable Property 116
J-7 Direct and Overlapping Property Tax Rates 117
J-8 Principal Property Taxpayers 118
J-9 Property Tax Levies and Collections 119
Debt Capacity
J-10 Ratios of Outstanding Debt by Type 120
J-11 Ratios of General Bonded Debt Outstanding 121
J-12 Direct and Overlapping Governmental Activities Debt 122
J-13 Legal Debt Margin Information 123
TABLE OF CONTENTS (continued)
Page
STATISTICAL SECTION (Unaudited) - continued
Demographic and Economic Information
J-14 Demographic and Economic Statistics 124
J-15 Principal Employers 125
Operating Information
J-16 Full-time Equivalent District Employees by Function/Program 126
J-17 Operating Statistics 127
J-18 School Building Information 128-129
J-19 Schedule of Required Maintenance Expenditures
by School Facility 130
J-20 Insurance Schedule 131-132
SINGLE AUDIT SECTION
K-1 Independent Auditor's Report - Government Auditing Standards 133-134
K-2 Independent Auditor's Report - OMB Circular A-133 and New
Jersey OMB Circular Letter 04-04 135-136
K-3 Schedule of Expenditures of Federal Awards, Schedule A 137
K-4 Schedule of Expenditures of State Financial Assistance,
Schedule B 138
K-5 Notes to the Schedules of Awards and Financial Assistance 139-141
K-6 Schedule of Findings and Question Costs
Part I - Summary of Auditor's Results 142-143
Part 2 - Schedule of Financial Statement Findings 144
Part 3 - Schedule of State Award Findings and Questioned Costs 144
K-7 Summary Schedule of Prior Audit Findings 144
TABLE OF CONTENTS (continued)
Introductory Section

{THIS PAGE IS INTENTIONALLY LEFT BLANK}
Egg Harbor Township Schools 13 Swift Drive
Egg Harbor Township, NJ 08234 www.eht.k12.nj.us
Dr. Scott McCartney Superintendent’s Office
Superintendent Phone: (609)646-7911 Dr. Kimberly Gruccio Telefax: (609)383-8749
Assistant Superintendent Pedro Bretones
Assistant Superintendent Kateryna W. Bechtel, CPA Business Office School Business Administrator/ Phone: (609)646-8441
Board Secretary Telefax: (609)484-9432
December 2, 2014 Citizens, Honorable President and Members of the Board of Education Township of Egg Harbor School District Atlantic County, NJ The comprehensive annual financial report of the Township of Egg Harbor School District (District) for the fiscal year ended June 30, 2014 is hereby submitted. Responsibility for both the accuracy of the data and completeness and fairness of the presentation, including all disclosures, rests with the management of the Board of Education (Board). To the best of our knowledge and belief, the data presented in this report is accurate in all material respects and is reported in a manner designed to present fairly the financial position and results of operation of the various funds of the District. All disclosures necessary to enable the reader to gain an understanding of the District’s financial activities have been included.
The comprehensive annual financial report is presented in four sections: introductory, financial, statistical and single audit. The introductory section includes this transmittal letter, the District’s organizational chart and a list of principal officials. The financial section includes the Management’s Discussion and Analysis, basic financial statements and schedules, as well as the auditor’s report thereon. The statistical section includes selected financial and demographic information, generally presented on a multi-year basis. The District is required to undergo an annual single audit in conformity with the provisions of the Single Audit Act Amendment of 1996 and the US Office of Management and Budget Circular A-133, Audits of States, Local Governments, and Non-Profit Organizations, and the New Jersey OMB Circular 04-04, Single Audit Policy for Recipients of Federal Grants, State Grants and State Aid Payments. Information related to this single audit, including the auditor’s report on the internal control structure and compliance with applicable laws and regulations and findings and recommendations, are included in the single audit section of this report.
1) REPORTING ENTITY AND ITS SERVICES: The Township of Egg Harbor School District is an independent reporting entity as set forth in Section 2100 of the GASB Codification of Governmental Accounting and Financial Reporting Standards. All funds and account groups of the District are included in this report. The Township of Egg Harbor Board of Education and all its schools constitute the District’s reporting entity. For the 2013-2014 school year, the District’s schools were organized as follows: H. R. Swift School – This school houses a portion of the pre-kindergarten and the kindergarten through third grade classes. The pre-kindergarten classes are for handicapped children and are subsidized through a Federal Grant. Centralized registration offices, the Kids Klub (latchkey) coordinator and a child study team are located here in modular buildings. The school was built in 1956, and has undergone several renovations and additions in 1967, 1970 and 2003. E. H. Slaybaugh School Complex – There is a primary school building and elementary school building housed on this campus. The primary school houses a portion of the District’s pre-kindergarten and kindergarten through first grade classes. The elementary school houses a portion of the District’s second and third grade classes. The elementary school building was built in 1970 and was renovated in 1989 and 2003. The primary school building was constructed in 2007.
1
C. J. Davenport School Complex – There is a primary school building and elementary school building housed on this campus. The primary school houses a portion of the District’s pre-kindergarten and kindergarten through first grade classes. The elementary school houses a portion of the District’s second and third grade classes, as well as the elementary autistic special education program. The elementary school building was built in 1976 and renovated in 2003. The primary school was constructed in 2007. Dr. Joyanne D. Miller School – This school houses the District’s entire fourth and fifth grade population. This building was constructed in 2003. Alder Avenue Middle School – This school houses a portion of the District’s sixth through eighth grade classes. The Board of Education public meeting room is also at this location. The building was constructed in 1992, and was renovated in 2007. Fernwood Avenue Middle School – The District’s remaining sixth, seventh and eighth grade classes are housed in this school. This school also has a large auditorium that is used by the community. This building was constructed in 1992. EHT High School – The ninth, tenth, eleventh and twelfth grade classes are housed in this school. The Arthur O. Marinelli Athletic Field House is also on this site. This structure contains locker rooms for home and away teams, athletic trainer treatment room, boys’ and girls’ coaches’ offices, a concession stand and public rest rooms for sporting events. The athletic complex contains an artificial turf field that is used by a majority of the varsity school athletic programs. The building was constructed in 1983 and was renovated in 2003 and 2012. Eagle Academy – This school is an alternative school for grades 7-12. The District is leasing this building from the Township of Egg Harbor. The school building is almost 100 years old. The district is currently upgrading the HVAC and electrical systems, and replacing all the windows. District officials are working with the Township officials to transfer title to the school district as the Township has no current planned use for this facility.
In addition to the basic elementary curriculum emphasizing English Language Arts and Mathematics, each District school provides:
Remedial instruction Resource room instruction for classifiable learning disabilities Speech and language development services Occupational and physical therapy services Enrichment classes Computer instruction Art and music instruction STEM and media instruction Library programs Health and physical education Guidance and child study team services Full time nurses Before and after school child care (grades 1-5)
{This space intentionally left blank}
2
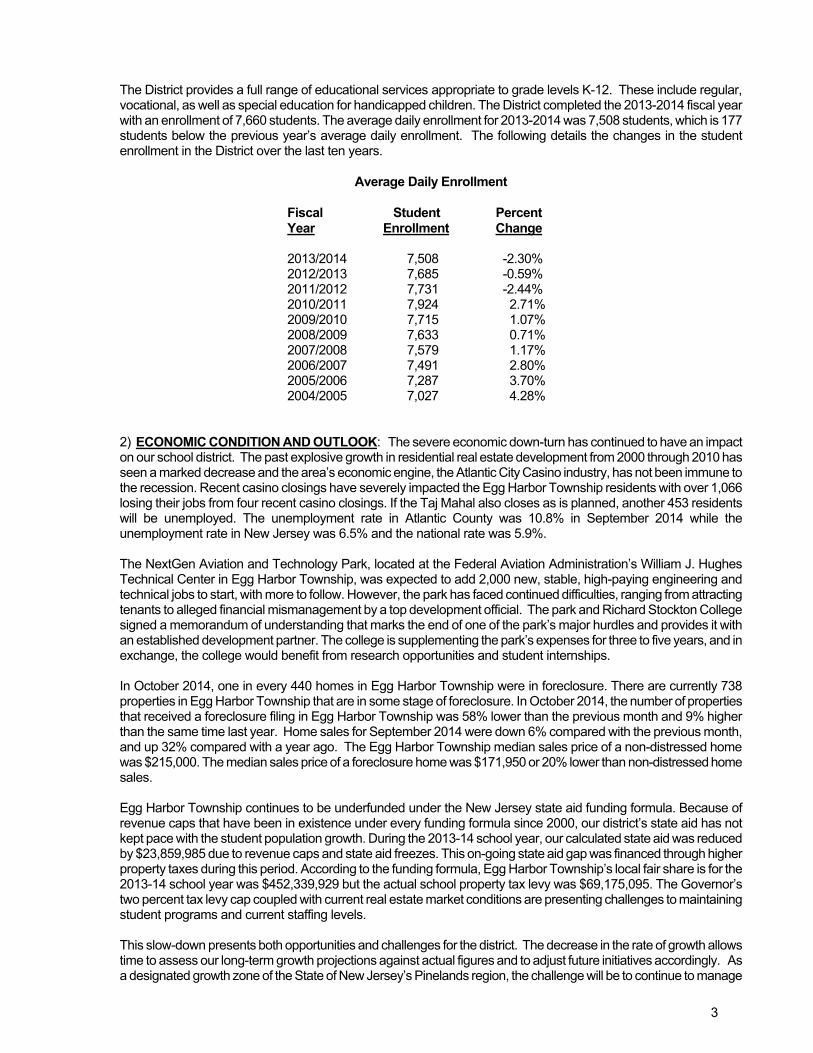
The District provides a full range of educational services appropriate to grade levels K-12. These include regular, vocational, as well as special education for handicapped children. The District completed the 2013-2014 fiscal year with an enrollment of 7,660 students. The average daily enrollment for 2013-2014 was 7,508 students, which is 177 students below the previous year’s average daily enrollment. The following details the changes in the student enrollment in the District over the last ten years.
Average Daily Enrollment Fiscal Student Percent Year Enrollment Change
2013/2014 7,508 -2.30% 2012/2013 7,685 -0.59% 2011/2012 7,731 -2.44% 2010/2011 7,924 2.71% 2009/2010 7,715 1.07%
2008/2009 7,633 0.71% 2007/2008 7,579 1.17%
2006/2007 7,491 2.80% 2005/2006 7,287 3.70%
2004/2005 7,027 4.28% 2) ECONOMIC CONDITION AND OUTLOOK: The severe economic down-turn has continued to have an impact on our school district. The past explosive growth in residential real estate development from 2000 through 2010 has seen a marked decrease and the area’s economic engine, the Atlantic City Casino industry, has not been immune to the recession. Recent casino closings have severely impacted the Egg Harbor Township residents with over 1,066 losing their jobs from four recent casino closings. If the Taj Mahal also closes as is planned, another 453 residents will be unemployed. The unemployment rate in Atlantic County was 10.8% in September 2014 while the unemployment rate in New Jersey was 6.5% and the national rate was 5.9%. The NextGen Aviation and Technology Park, located at the Federal Aviation Administration’s William J. Hughes Technical Center in Egg Harbor Township, was expected to add 2,000 new, stable, high-paying engineering and technical jobs to start, with more to follow. However, the park has faced continued difficulties, ranging from attracting tenants to alleged financial mismanagement by a top development official. The park and Richard Stockton College signed a memorandum of understanding that marks the end of one of the park’s major hurdles and provides it with an established development partner. The college is supplementing the park’s expenses for three to five years, and in exchange, the college would benefit from research opportunities and student internships. In October 2014, one in every 440 homes in Egg Harbor Township were in foreclosure. There are currently 738 properties in Egg Harbor Township that are in some stage of foreclosure. In October 2014, the number of properties that received a foreclosure filing in Egg Harbor Township was 58% lower than the previous month and 9% higher than the same time last year. Home sales for September 2014 were down 6% compared with the previous month, and up 32% compared with a year ago. The Egg Harbor Township median sales price of a non-distressed home was $215,000. The median sales price of a foreclosure home was $171,950 or 20% lower than non-distressed home sales. Egg Harbor Township continues to be underfunded under the New Jersey state aid funding formula. Because of revenue caps that have been in existence under every funding formula since 2000, our district’s state aid has not kept pace with the student population growth. During the 2013-14 school year, our calculated state aid was reduced by $23,859,985 due to revenue caps and state aid freezes. This on-going state aid gap was financed through higher property taxes during this period. According to the funding formula, Egg Harbor Township’s local fair share is for the 2013-14 school year was $452,339,929 but the actual school property tax levy was $69,175,095. The Governor’s two percent tax levy cap coupled with current real estate market conditions are presenting challenges to maintaining student programs and current staffing levels. This slow-down presents both opportunities and challenges for the district. The decrease in the rate of growth allows time to assess our long-term growth projections against actual figures and to adjust future initiatives accordingly. As a designated growth zone of the State of New Jersey’s Pinelands region, the challenge will be to continue to manage
3
growth as the economy rebounds and the Township comes into compliance with affordable housing requirements mandated by the State.
3) MAJOR INITIATIVES: During the 2013-2014 school year the Egg Harbor Township School District successfully implemented the three major objectives as follows:
A. To continue alignment of district curricula in Mathematics and Language Arts Literacy to the new Common Core Curriculum Standards (CCCS) and to provide professional development to fully implement the standards in the classroom.
B. To continue to implement the new teacher/administrator evaluation instrument as per state mandate for greater accountability and student achievement.
C. To continue to explore, develop and implement a comprehensive plan for the expansion of Science, Technology, Engineering, and Mathematics (STEM) across grades K-12.
In addition to meeting these goals, the district sustained its HERO theme for the second year. The theme gave the school district the opportunity to continue awareness of the great things being done by our students, faculty, staff and extended school community. Through our partnership with the HERO Campaign we have raised well over twenty thousand dollars for the organization to continue their mission of raising awareness of the dangers of drinking and driving. The district enjoined with over 40 other states in the union to align to and prepare for the implementation and assessment of the CCCS. Our district has aligned the curriculum, organized and supplemented instructional materials, provided professional development for our key stakeholders, improved technology infrastructure and has worked diligently to ensure that our students are being prepared for college and careers as measured by the State of New Jersey and by the CCCS Consortium. The district also has continued to enjoy success in its energy conservation program by monitoring and modifying energy consumption. We have engaged in a 4 year program with the assistance of Cenergistic, a national energy savings consulting firm, which resulted in nearly $4.5 million in energy cost avoidance. We have enhanced that program with a new electricity demand response program through Enernoc, a national firm that works with utility companies to provide opportunities for payments in exchange for being on call to significantly reduce consumption during possible brownouts. Together these tools provide district leadership with valuable resources and assistance to enable the district and its employees to save energy and energy costs so as to maximize available resources so that we can continue to keep our focus on students and learning. The Egg Harbor Township Board of Education and Administration understand that 21st Century Schools need to work in a changing fiscal and academic paradigm. Working creatively and working together as a community of learners we can and will continue to be “Proud to Be EHT!” Curriculum and professional development activities: 1. The professional development structures and designs offered included:
a. District wide in-services b. In service days which are building and/or district directed c. Professional days – teacher choice d. School Business days – District generated e. Monthly staff meetings f. Weekly Professional Learning Communities g. Before, during, and after school building based opportunities h. Summer workshops i. NJEA convention attendance
Grade levels and/or departments were partnered. Teams utilized Professional Learning Community (PLC) time to review student work and collaborate about successful strategies. In addition, the District adopted the Charlotte Danielson Framework for Teaching and Learning. Teachers will discuss and become proficient in the framework in order to prepare for the new evaluation system mandated by the NJDOE.
4
Partnerships have been developed with Atlantic Cape Community College, Richard Stockton College and Rowan University for teacher preparation. Additional partnerships include Southern Regional Institute & Educational Technology Training Center (SRI & ETTC) and online and on-site professional development course offerings from New Jersey Education Association.
Common assessments (i.e. quarterly and trimester benchmark tests) were developed by teachers across the grade levels, inclusive of special education staff, during summer curriculum workshops/institutes sponsored by the District.
PLC’s, staff meetings, School Leadership Team and I & RS play a major role in providing additional feedback to supplement professional development needs assessment results in developing school professional development opportunities. 2. We continue to work on the alignment of curriculum to the Common Core State Standards, creating pacing guides and assessment tools to create learning experiences that allow students to integrate knowledge, skills, and methods of inquiry in all academic areas. 3. The District supports professional development needs by providing job-embedded opportunities to assist teachers in developing an expanding range of strategies to accommodate a wide array of student learners. 4. The District continues to address professional learning gaps not addressed in schools by sustaining learning communities through team, department, and grade level meetings regarding the different buildings’ needs and concerns with a focus on data analysis. 5. The Egg Harbor School Township School District has implemented Professional Learning Communities throughout all schools. Through this the District is able to support the development of productive team structures for teachers and administration to analyze data results to drive instruction. 6. The District plan is communicated to staff through school-based staff meetings and then posted on the District’s common network server; which is accessible to all staff members. Furthermore, the plan is communicated to the community via www.eht.k12.nj.us. 7. The connection between student goals and professional development opportunities includes the establishment of Professional Learning Communities which analyze data in order to guide future instruction and offer new professional development opportunities. 8. Two (2) in-service days in October 2013 and one (1) in-service day in March 2014 were dedicated to Student Growth Objectives planning, development and completion and professional development aimed to address the district goals of alignment to the CCCS in mathematics and English Language Arts, was provided at the in-service days. Information Technology Services During the 2013-2014 school year, the Information Technology Services Department dedicated itself in the following areas: HARDWARE:
A district wide inventory of hardware with the focus of maintaining the minimum 5/1 student computer ratios across the district was performed. The current student computer ratio is 2.94 students for each computer. Repairs tickets documented in the IT Direct application total 755. The number of Help Desk calls during the 2013-2014 school year totaled 2,145.
Increasing our district WIFI availability with the addition of access points. We increased WIFI coverage from 90% in 2012-2013 to 100% coverage for the 2013-2014 school year. This is all in support of the District’s Bring Your Own Device (BYOD) and other wireless implementations.
Continued replacement of aging district equipment including the District’s core router. Upgraded and enhanced the current District Wide Area Network (WAN). This resulted in not only
redundant network communications, but faster network speeds to ensure compatibility and up time related to curriculum, PARCC testing, and support processes.
5
Developed and budgeted for the addition of four (4) computer labs with 26 student computers each at the Dr. Joyanne D. Miller School. This is not only to support digital curriculum, but also to ensure the school’s PARCC compliance. Project target completion is October 2014.
COMMUNICATIONS: Negotiated pricing with new phone and internet provider resulting in reduced costs and
approximate savings of over $35,000. This does not include the savings that will be realized from unlimited local and national long distance calls that are now included in the plan.
Upgraded the district phone system, including the addition of classroom phones at the Swift Elementary, Slaybaugh Elementary, and Davenport Elementary Schools. This upgrade resulted in provided approximately 120 classrooms with phone communications and provided additional reporting and safety related features.
CONSTRUCTION: The ITS Department, in order to reduce construction associated costs, completed the data and phone
line installation for the new Central Registration, Kids Club, and Swift Child Study Team offices.
TRAINING: The district regularly conducts building level and district level technology training and coordination
with the assistance of the Director of Human Resources and the cooperation from the Southern Regional Institute & Educational Technology Training Center (ETTC). Our district hosts and facilitates any requests from the ETTC in order to have our faculty and staff be able to participate in technology training within our own district facilities. During the 2013-2014 school year, we fully utilized the hours attributed to our district.
EHT TV2: The community/district broadcast channel, EHT TV2 has continued to provide excellent
programming during the 2013-2014 school year due to the addition of a Part Time TV studio assistant. These productions range from various High School sports and performing arts productions, informative sessions such as the “Superintendent’s Round Table,” and Township productions such as the “Mayor’s Forum” and the filming of Township public meetings. The ITS Department has continued to upgrade equipment beyond the generous donation of new High Definition equipment provided by the local education foundation during the 2012-2013 school year.
The department utilizes the Telvue Video Message Board System and digital video servers for video programming. This also includes PEGTV video archives for distribution on the internet, live internet distribution of the EHTTV2 video channels and other emergency management features through the new interface. During the 2013-2014 school year, EHT TV2 responded quickly to emergency snow closures, Township notifications and information, as well as school events and programming.
SOFTWARE:
Continued focus and support of the new staff evaluation system Baseline Edge. Developed parent approval letters and setup of Edmoto for staff and student use. Investigation of savings resulted in moving from Novell to Microsoft as the network operating
system. A plan will be developed during the 2014-2015 school year with migration targeted to begin late spring of 2015.
Supported the PARCC field test at the Dr. Joyanne D. Miller School. We were required to provide consistent network communication and speeds, proctor caching server, computer system configurations, support, and training to field test staff and equipment.
SECURITY:
Focus in security projects has dealt with the maintenance and replacement of aging cameras and DVRs.
Participation in crisis teams and continued evaluation of emergency procedures.
6
NJSMART (NJ Standards Measurement and Resource for Teaching (NJ SMART)
NJ Smart continues to evolve and have more requirements. Student ID (SID) management, Staff Member ID (SMID) management, pre-ID labels for state testing, etc. New to NJ Smart reporting for the 2013-2014 school year was the addition of staff evaluation submission. Working with Baseline Edge, we were responsible for developing a data export and ensuring data accuracy for submission to the State of NJ.
STUDENT INFORMATION SYSTEM: Standard support and upgrades of Infinite Campus were conducted throughout the 2013-2014
school year. The most significant change was related to the teacher instruction module in Infinite Campus. This required us to coordinate with the teacher trainers and develop instruction manuals and provide video prior to the start of the 2014-2015 school year.
ESEA-NCLB
FY 2014 July 1, 2013-June 30, 2014 Title I, II-A, III, III-Immigrant
Grant Implementation
An ESEA-NCLB program management team facilitated the grant application development as well as program articulation, implementation, and supervision under Title I, II-A, III and III-Immigrant. Student achievement goals focused on the improvement of learning for the identified at-risk population in the areas of English Language Arts and Mathematics.
Below are some exciting programs funded by ESEA-NCLB funds approved by the Board of Education:
1. An after school program during the 2013-2014 school year for 166 Miller School Title I students to enhance academic achievement. This program ran for 2 hours per week from November 2013 through May 2014. Transportation services home from the after-school services were also supplied for these Title I students.
2. Title I parent coordinators were hired at Davenport Elementary School (2) and Miller Elementary School (2) to educate Title I parents regarding the reading and math curricula in each grade level. They also instructed parents in helping children with homework and how to meaningfully participate in parent-teacher conferences. Over 500+ parents and children attended these trainings during 2013-2014.
3. The EHT ESEA/NCLB website was improved to increase parent, teacher, student and administrator knowledge of ESEA/NCLB. The ELA and Math Pacing Guides for 2013-2014 were added and other academic websites were added to increase parent participation and knowledge of ESEA/NCLB as well as various resources. During 2013-2014, the ESEA-NCLB district website received a total of 5,498 hits!
4. Test data analysts were hired through Title IIA funds. The purpose of these teacher data analysts was to identify student strengths and weaknesses on benchmark assessments to improve student test scores. Additional hours were given to Fernwood and the High School as they are identified RAC schools for 13-14.
Program objectives were consistent with Egg Harbor Township district goals established by the Board of Education and the new QSAC regulations. The educational needs of the Non-Public schools, i.e. Trocki Hebrew Academy, Atlantic Christian and English Creek Academy, were also met via multiple consultations with the non-public officials.
English Language Learners: Egg Harbor Township had already completed its 2011-2014 Three Year Program Plan. During 2013-2014, 221 ELL students district-wide received ELL services consistent with Title III. We have completed the development of a four year “cycle” for coursework with ELL high school students. This is designed to help ELL students meet required HSPA standards as well as the revised WIDA standards which are assessed by the ACCESS testing, additional state testing for ELL students.
7
Focus School Status for Fernwood Avenue Middle School and EHT High School Due to the NJDOE receiving a waiver from the USDE, there is no longer the concept of Adequate Yearly Progress (AYP), nor Schools in Need of Improvement. Based on state test data for three years (Spring 2009, 2010 and 2011), EHT High School and Fernwood Avenue Middle School continued to be designated as Focus Schools during 2013-2014. They received this designation as a result of having large achievement gaps within subgroups. Title I programs were implemented in the Targeted Assistance Title I Schools, i.e. Davenport and Miller Elementary Schools. Multiple assessment measures were used to determine eligibility. Examples of other assessments used for eligibility and/or progress measurement were: Story-Town tests, Math End of Book tests and teacher recommendations. Title I funds paid for 18 split funded remedial teachers. The programs were as follows: Davenport (K-3) and Miller Schools (4-5)
Eligible students were serviced in an in-class support or pull-out structure from 2 to 5 times per week for 30 to 40 minute sessions. Title I teachers reinforced the reading and math skills introduced by way of the newly revised pacing guides in ELA and Math. The revised pacing guides are aligned with the CCCS and teaching the necessary skills prior to state testing dates. A Phonics First Morning Program for Title I students was conducted with a total of 32 third grade Title I students attending. An after-school program was provided for 166 Miller Title I students.
Title I parents were provided with workshops by parent coordinators (Davenport and Miller), to inform them of the Title I regulations, how to monitor their child’s performance, and how to work with their child to improve achievement. At both schools, parents were also instructed in how to use the EHT ESEA/NCLB website for educational opportunities for their children. Title IIA funds were utilized to fully fund one Class Size Reduction teacher. They were also used to pay for the following stipend positions: Grades K-5 ELA and Math Trimester Test Data Analysis professionals and Grades 6-8 and grade 11 ELA and Math Quarterly Test Data Analysis Professionals,. Title III funds were utilized to pay for one split funded bilingual teacher and for one split funded ELL teacher as well as for instructional supplies. Title III-Immigrant funds were utilized to support an after-school program for immigrant students at the EHT High School, Fernwood and Alder Avenue Middle Schools. Non-Public School NCLB Activities
Title IIA funds were utilized to pay for professional conferences for Atlantic Christian School.
Individuals with Disabilities Education Act (IDEIA) FY 2014
2013-2014 Grant Implementation
During the 2013-2014 school year, the IDEIA grant period was changed. As a result, FY 2014 funds had to be used by June 30, 2014 rather than August 31, 2014. Unused funds became carryover for the FY 2015 grant period. The 2014 summer program was required to be funded through the FY2015 grant; consequently, no FY 2014 grant funds were used for summer programs due to this change over. Of the FY 2014 IDEIA grant, $262,462 had to be allocated to Coordinated Early Intervention Services (CEIS) due to an over-representation of minorities in the special education population. In addition, CEIS funding was carried forward from the FY 2013 grant in the amount of $229,205. CEIS funds were used to purchase license renewal for ST Math for the Miller School and Phonics First Training and materials for all general education 4th and 5th grade teachers to use with at risk students who were struggling with decoding and fluency. In addition, $168,771 of CEIS money was used to purchase American Reading teacher handbooks, leveled readers and professional development for all 2nd, 3rd, and 4th grade teachers, Basic Skills teachers, ELL teachers, Reading Specialists and Literacy Coaches. American Reading Company provides high-interest, low vocabulary books for students reading below grade level and scripted instructional strategies for identifying and teaching higher level comprehension
8
skills. The building principals used local funds to purchase the same program for special education teachers. Training began in June 2014 so that teachers could have access to the materials over the summer to prepare to launch the program in September 2014. The remainder of the 2014 CEIS money, in the amount of $170,053.57 was carried over into the FY2015 grant.
FY 2014 IDEIA funds paid for approximately $1,000,000 in out of district tuition placements for disabled students from pre-school through grade 12. Such placements included Atlantic County Special Services School District, Cape May County Special Services School District, Yale Academy, and Coastal Academy, among other private placements. As in the past, IDEIA funds also provided for an Out of District case manager/consultant, independent contractors to provide physical and occupational therapy services, translation services, substitute sign language interpreter services and two Child Study Team secretaries. Funds also were used to purchase special instructional materials for the lower functioning students who require unique books, curriculum, etc. as well as special equipment for disabled students. IDEIA funds also provided home instruction services for disabled students throughout the 2013-2014 school year. This permitted disabled students to continue to meet the goals of their IEPs. In addition, IDEIA funds also were used to purchase testing supplies for the district’s Child Study Teams and evaluation and instructional materials for the preschool disabled students. Funds also were used to pay for substitutes for teachers to attend annual review meetings as well as to provide for Child Study Team services throughout the summer for students referred late in the previous school year.
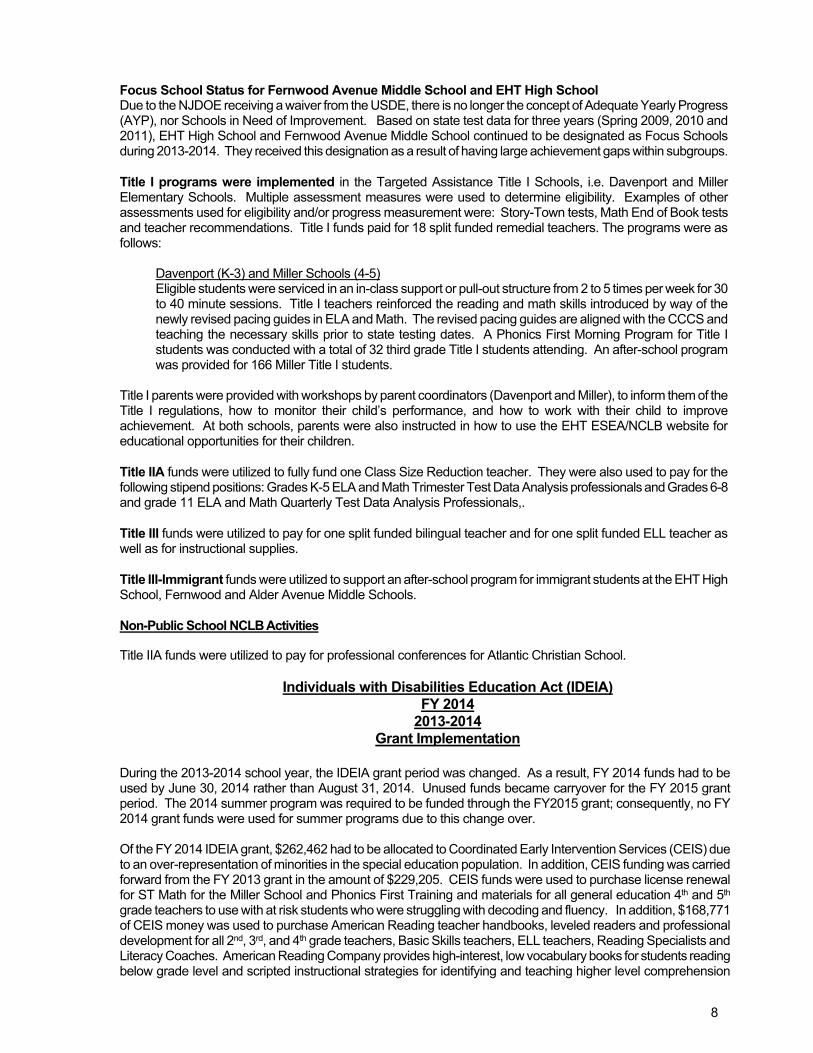
STUDENT TESTING The following tables reflect our district’s student assessment results for the 2013-2014 school year:
NEW JERSEY ASSESSMENT OF SKILLS AND KNOWLEDGE (NJASK3) 3TH Grade
TOTAL STUDENTS Content
Partially Proficient
Proficient
Advanced Proficient
Math 23.1% 42.0% 35.0%
Language Arts Literacy 38.8% 58.5% 2.7%
NEW JERSEY ASSESSMENT OF SKILLS AND KNOWLEDGE (NJASK4) 4TH Grade
TOTAL STUDENTS Content
Partially Proficient
Proficient
Advanced Proficient
Math 37.8% 41.3% 20.9%
Language Arts Literacy 50.7% 49.1% 0.2%
Science 12.3% 46.3% 41.4%
NEW JERSEY ASSESSMENT OF SKILLS AND KNOWLEDGE (NJASK5) 5TH Grade
TOTAL STUDENTS Content
Partially Proficient
Proficient
Advanced Proficient
Math 27.5% 47.5% 25.0%
Language Arts Literacy 43.5% 53.0% 3.5%
9
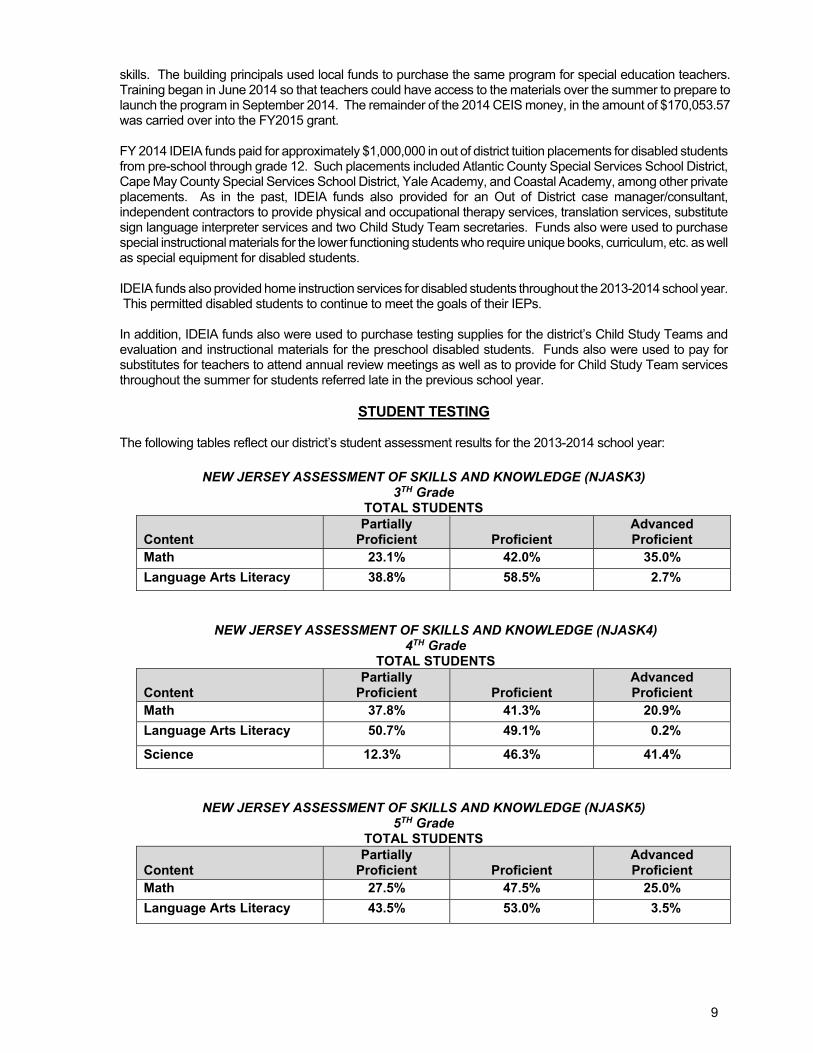
NEW JERSEY ASSESSMENT OF SKILLS AND KNOWLEDGE (NJASK6)
6TH Grade TOTAL STUDENTS
Content
Partially Proficient
Proficient
Advanced Proficient
Math 24.1% 50.7% 25.1%
Language Arts Literacy 37.4% 58.5% 4.1%
NEW JERSEY ASSESSMENT OF SKILLS AND KNOWLEDGE (NJASK7) 7TH Grade
TOTAL STUDENTS Content
Partially Proficient
Proficient
Advanced Proficient
Math 36.8% 42.9% 20.3%
Language Arts Literacy 45.1% 46.6% 8.3%
NEW JERSEY ASSESSMENT OF SKILLS AND KNOWLEDGE (NJASK8) 8TH Grade
TOTAL STUDENTS Content
Partially Proficient
Proficient
Advanced Proficient
Math 25.6% 39.8% 34.6% Language Arts Literacy 21.6% 70.5% 7.9%
Science 21.0% 57.0% 22.0%
HIGH SCHOOL PROFICIENCY ASSESSMENT (HSPA) 11TH Grade
TOTAL STUDENTS
Content Partially
Proficient
Proficient Advanced Proficient
Mathematics 24.9% 54.3% 20.8% Language Arts 8.7% 64.7% 26.6%
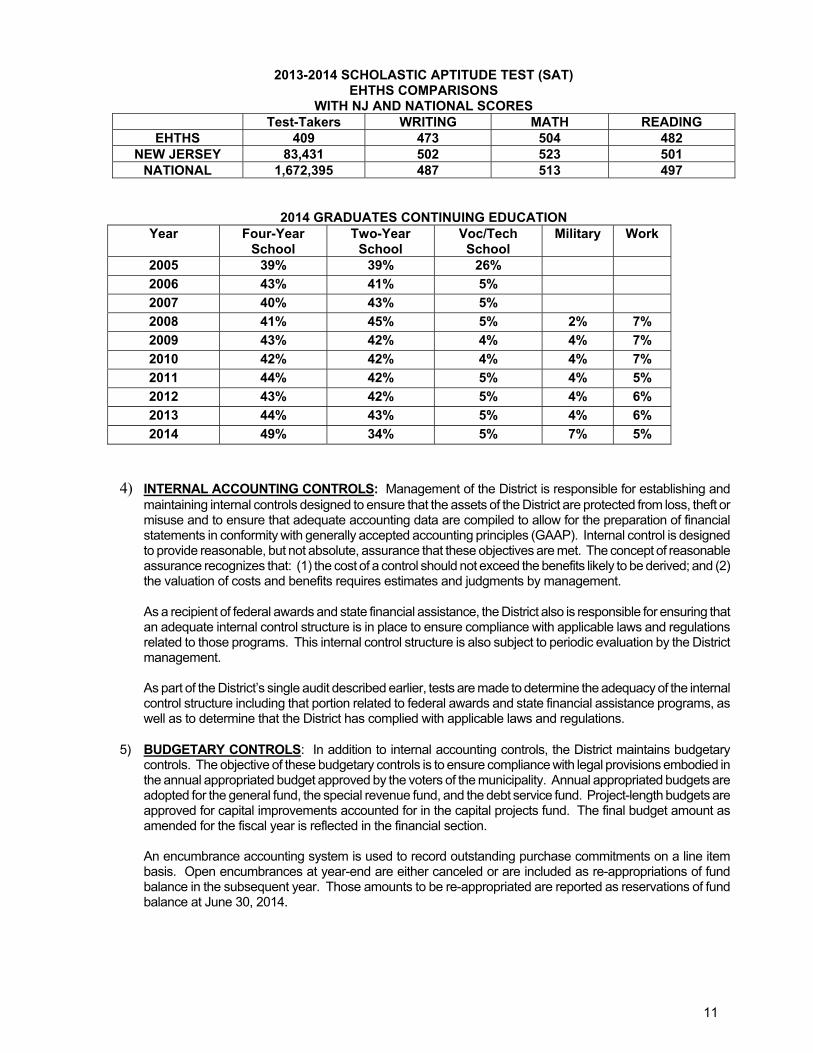
SCHOLASTIC APTITUDE TEST (SAT)
Year Test Takers Reading Math Writing Composite 2004-2005 228 507 510 n/a 1017 2005-2006 275 478 493 n/a 971 2006-2007 314 477 486 n/a 963 2007-2008 295 481 503 486 1470 2008-2009 328 477 498 470 1445 2009-2010 338 493 507 484 1484 2010-2011 403 477 497 475 1449 2011-2012 393 488 507 479 1474 2012-2013 413 490 504 485 1479 2013-2014 409 482 504 473 1459
10
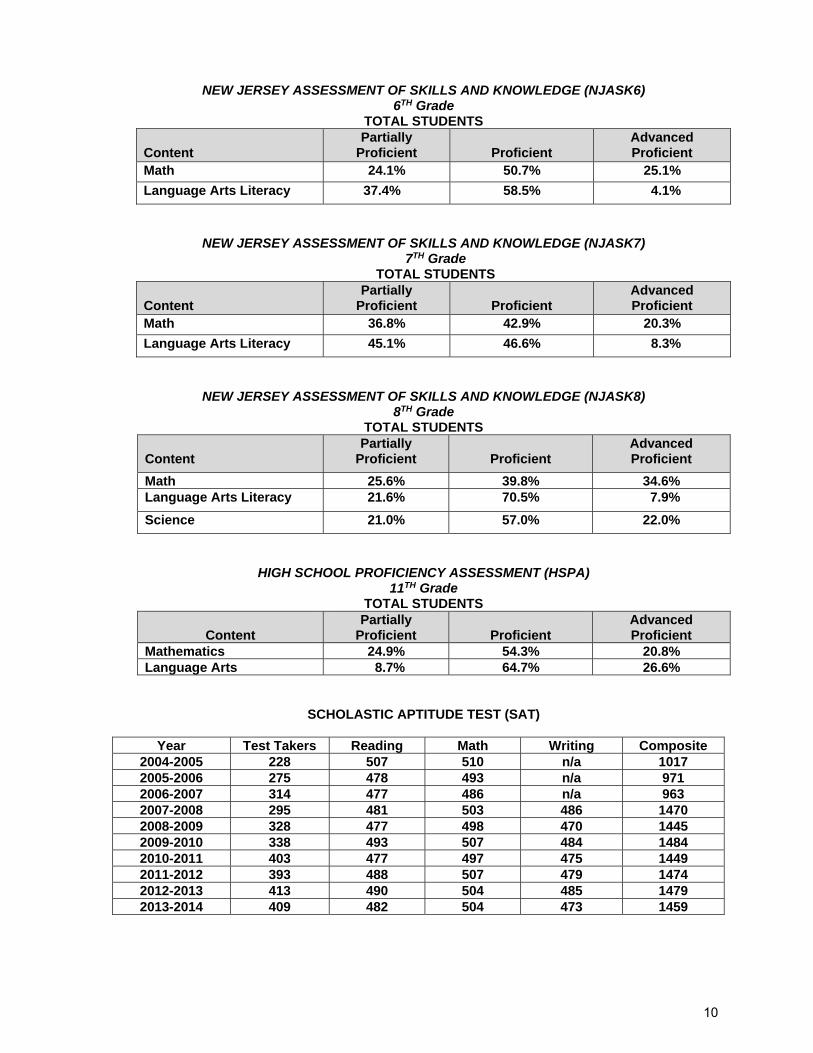
2013-2014 SCHOLASTIC APTITUDE TEST (SAT) EHTHS COMPARISONS
WITH NJ AND NATIONAL SCORES Test-Takers WRITING MATH READING
EHTHS 409 473 504 482 NEW JERSEY 83,431 502 523 501
NATIONAL 1,672,395 487 513 497
2014 GRADUATES CONTINUING EDUCATION Year Four-Year
School Two-Year
School Voc/Tech School
Military Work
2005 39% 39% 26%
2006 43% 41% 5%
2007 40% 43% 5%
2008 41% 45% 5% 2% 7%
2009 43% 42% 4% 4% 7%
2010 42% 42% 4% 4% 7%
2011 44% 42% 5% 4% 5%
2012 43% 42% 5% 4% 6%
2013 44% 43% 5% 4% 6%
2014 49% 34% 5% 7% 5% 4) INTERNAL ACCOUNTING CONTROLS: Management of the District is responsible for establishing and
maintaining internal controls designed to ensure that the assets of the District are protected from loss, theft or misuse and to ensure that adequate accounting data are compiled to allow for the preparation of financial statements in conformity with generally accepted accounting principles (GAAP). Internal control is designed to provide reasonable, but not absolute, assurance that these objectives are met. The concept of reasonable assurance recognizes that: (1) the cost of a control should not exceed the benefits likely to be derived; and (2) the valuation of costs and benefits requires estimates and judgments by management.
As a recipient of federal awards and state financial assistance, the District also is responsible for ensuring that
an adequate internal control structure is in place to ensure compliance with applicable laws and regulations related to those programs. This internal control structure is also subject to periodic evaluation by the District management.
As part of the District’s single audit described earlier, tests are made to determine the adequacy of the internal
control structure including that portion related to federal awards and state financial assistance programs, as well as to determine that the District has complied with applicable laws and regulations.
5) BUDGETARY CONTROLS: In addition to internal accounting controls, the District maintains budgetary
controls. The objective of these budgetary controls is to ensure compliance with legal provisions embodied in the annual appropriated budget approved by the voters of the municipality. Annual appropriated budgets are adopted for the general fund, the special revenue fund, and the debt service fund. Project-length budgets are approved for capital improvements accounted for in the capital projects fund. The final budget amount as amended for the fiscal year is reflected in the financial section.
An encumbrance accounting system is used to record outstanding purchase commitments on a line item
basis. Open encumbrances at year-end are either canceled or are included as re-appropriations of fund balance in the subsequent year. Those amounts to be re-appropriated are reported as reservations of fund balance at June 30, 2014.
11
6) A9COUNTINF SYSTEM AND BEPORTS: The District's accounting records reflect generatty acceptedaccounting principles_, as promulgated by the Govemmental Accounting Standards Bo;rd (GASB). Theaccounting system of the District is organized on the basis of funds and lccount groups. These funds andaccount groups are explained in "Notes to the Financial Statements.', Note 1.
DFBT ADMINISTRAII:O!: At June 30.2014. the Drstricts outstandrng debt issues inctuded $66,490,000 rnrerundrng bonds and $26'385,000 in general obligation bonds. The proceeds ofthese bond issues were toprovide.funds for capital lmprovement to the oistiict's buildings. These improvements include repairs andrenovations-to the High School, Davenport, Slaybaugh and Sirvift elementary schools, additions to the HighSchooland swn elementary school, the construciion oitwo new elemenlary schoots aswellas anotheradditionto the High school, boirer and chifler repracements, window repracements, roof repracements, sorar pan;rinstallation, upgrades to the high schoor athretic comprex, and the construc{ion of a fuering canopy.
OTHER INFORMATION:
Certificate of Excellence - The Association of School Business Officials International (ASBO) awarded acertificate ofExcellence in Financial Reporting Award tothe Egg HiooiTownsnip s"noo ciistria, state oir.te*Jersey, for its comprehensive annualfinancial report for the fiiialyear ended June 30, 2012. The district wasalso awarded a cedmcate of Excelence for the frscar year ended June 30, 201 .r . In order to be awarded acertificate of Excellence in Financial Reporting, a diitrict must puotist'
"n easily readable and efficienfly
organized comprehensive annualfinancial report This report must satisfy both generally a*"ptJ "*"r"ii"gprinciples and applicable legal requirements.
A certificate of Excellence is valid for a period of one year only ho/vever it was filed in December 2013 afterthefiscalyaar20l3 report had been filed with ttre state oiNewl#ef.'we oer,eue thal our cunent comprehensiveannual Jinancial report continues to meet the certificate of Excifience program,s requiremenG i; ;;;.submitting it to the ASBO to determine etigibitity for another ce;ifi;e-.-
Independent Audit - State statute_s require an annual audit by indep€ndent certified public accountants orregrstered municapar accountants. The accounting firm of Ford, Scott & Associates, t_t_c, cpns wai sJeaeoy-tl^".P""d ln addition to me€ting the requiremints s"t ro'tn r J"i" .t"trtes, the audit also was designed tomeet the requirements of the sinore Audit Act of |996 and the related oMB circurarA_133 and Ne;ie;;yoMB circular o4{4 The auditoi's report on the general-purpose financrat statements and combinina andindividuarfund statements and schedures is incrude; in the rinJ"i;i";J;;;ith;i"pi;. #J#i;ilr:i#:related specifcally to lhe single audit are included in the singte auoit iectron or tnis reoort.
SxN9,w!E99qExrs: we wourd rike to express our appreciation to the members of the Egg HarborTo/vnship Board of Education for theirconcern in i:roviding fi[iaccouniauility to tn" "it,r"ni "no
t"iiayJJJrthe school districl and thereby contributing thelrfuli support-to the development and maintenance ofourfinancialoperation .The
preparation of this report couh not have been ""*.liiJn"o *itnout the efficient and dedicatedservices of our financial and accountino slaff
8)
9)
,q) 4^%*,WSchool Business Administrator/
Board Secretary
P. Mccartney,
Association of School Business Officials International
The Certificate of Excellence in Financial Reporting Award
is presented to
Egg Harbor Township School District
For Its Comprehensive Annual Financial Report (CAFR) For the Fiscal Year Ended June 30, 2012
The CAFR has been reviewed and met or exceeded
ASBO International’s Certificate of Excellence standards
Ron McCulley, CPPB, RSBO John D. Musso, CAE, RSBA
President Executive Director
13
14
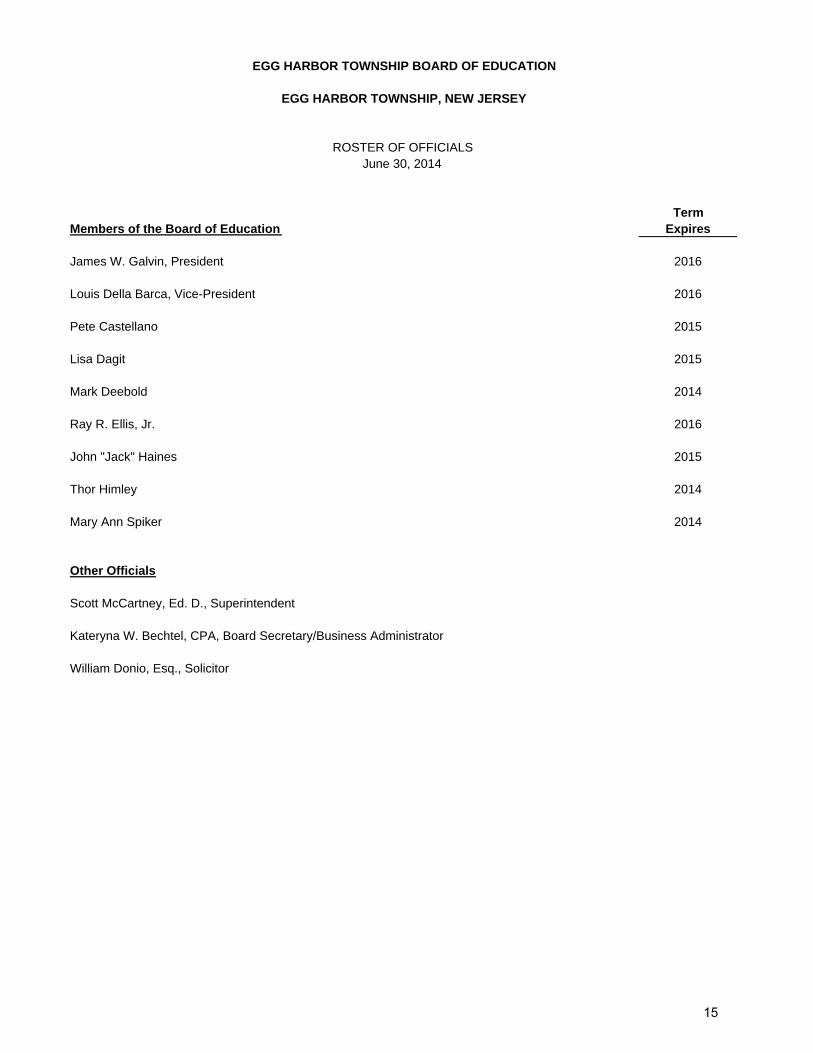
TermMembers of the Board of Education Expires
James W. Galvin, President 2016
Louis Della Barca, Vice-President 2016
Pete Castellano 2015
Lisa Dagit 2015
Mark Deebold 2014
Ray R. Ellis, Jr. 2016
John "Jack" Haines 2015
Thor Himley 2014
Mary Ann Spiker 2014
Other Officials
Scott McCartney, Ed. D., Superintendent
Kateryna W. Bechtel, CPA, Board Secretary/Business Administrator
William Donio, Esq., Solicitor
EGG HARBOR TOWNSHIP BOARD OF EDUCATION
EGG HARBOR TOWNSHIP, NEW JERSEY
ROSTER OF OFFICIALSJune 30, 2014
15
Architect
The Spiezle Group120 Sanhican DriveTrenton, NJ 08618
Audit Firm
Ford Scott & Associates, LLCCertified Public Accountants
1535 Haven AvenuePO Box 538
Ocean City, NJ 08226
Attorney
Cooper Levenson April Neidleman Wagenheim1125 Atlantic Avenue
Atlantic City, NJ 08401
Engineer
Polistina & Associates6684 Washington Avenue
Egg Harbor Township, NJ 08234
Bond Counsel
McManimon & Scotland, LLCOne Riverfront Plaza, 4th Floor
Newark, NJ 07102
Official Depository
Ocean City Home Bank1184 Ocean Heights Avenue
Egg Harbor Township, NJ 08234
EGG HARBOR TOWNSHIP BOARD OF EDUCATIONConsultants and Advisors
16

Financial Section

{THIS PAGE IS INTENTIONALLY LEFT BLANK}
Independent Auditor’s Report
Honorable President and Members of the Board of Education Egg Harbor Township School District County of Atlantic, New Jersey Report on the Financial Statements We have audited the accompanying financial statements of the governmental activities, the business-type activities, each major fund, and the aggregate remaining fund information of the Egg Harbor Township School District, Egg Harbor Township, New Jersey, as of and for the fiscal year ended June 30, 2014, and the related notes to the financial statements, which collectively comprise the District’s basic financial statements as listed in the table of contents. Management’s Responsibility for the Financial Statements
Management is responsible for the preparation and fair presentation of these financial statements in accordance with accounting principles generally accepted in the United States of America; this includes the design, implementation, and maintenance of internal control relevant to the preparation and fair presentation of financial statements that are free from material misstatement, whether due to fraud or error.
Auditor’s Responsibility
Our responsibility is to express opinions on these financial statements based on our audit. We conducted our audit in accordance with auditing standards generally accepted in the United States of America, the standards applicable to financial audits contained in Government Auditing Standards issued by the Comptroller General of the United States, and audit requirements as prescribed by the Office of School Finance, Department of Education, State of New Jersey. Those standards require that we plan and perform the audit to obtain reasonable assurance about whether the financial statements are free from material misstatement.
An audit involves performing procedures to obtain audit evidence about the amounts and disclosures in the financial statements. The procedures selected depend on the auditor’s judgment, including the assessment of the risks of material misstatement of the financial statements, whether due to fraud or error. In making those risk assessments, the auditor considers internal control relevant to the entity’s preparation and fair presentation of the financial statements in order to design audit procedures that are appropriate in the circumstances, but not for the purpose of expressing and opinion on the effectiveness of the entity’s internal control. Accordingly, we express no such opinion. An audit also includes evaluating the appropriateness of accounting policies used and the reasonableness of significant accounting estimates made by management, as well as evaluating the overall presentation of the financial statements.
We believe the audit evidence we have obtained is sufficient and appropriate to provide a basis for our audit opinions.
17
Opinions
In our opinion, the financial statements referred to above present fairly, in all material respects, the respective financial position of the governmental activities, the business-type activities, each major fund, and the aggregate remaining fund information of the Egg Harbor Township School District, Egg Harbor Township, New Jersey, as of June 30, 2014, and the respective changes in financial position and, where applicable, cash flows thereof for the fiscal year then ended in accordance with accounting principles generally accepted in the United States of America.
Other Matters
Required Supplementary Information
Accounting principles generally accepted in the United States of America require that the Management’s Discussion and Analysis and Budgetary Comparison Information identified in the table of contents be presented to supplement the basic financial statements. Such information, although not a part of the basic financial statements, is required by the Governmental Accounting Standards Board who considers it to be an essential part of financial reporting for placing the basic financial statements in an appropriate operational, economic, or historical context. We have applied certain limited procedures to the required supplementary information in accordance with auditing standards generally accepted in the United States of America, which consisted of inquiries of management about the methods of preparing the information and comparing the information for consistency with management’s responses to our inquiries, the basic financial statements, and other knowledge we obtained during our audit of the basic financial statements. We do not express an opinion or provide any assurance on the information because the limited procedures do not provide us with sufficient evidence to express an opinion or provide any assurance.
Other Information
Our audit was conducted for the purpose of forming opinions on the financial statements that collectively comprise the Egg Harbor Township School District’s basic financial statements. The introductory section, combining and individual nonmajor fund financial statements, schedule of expenditures of federal awards, as required by Office of Management and Budget Circular A-133, Audits of States, Local Governments, and Non-Profit Organizations, the schedule of state financial assistance as required by NJ OMB 04-04, and statistical information are presented for purposes of additional analysis and are not a required part of the basic financial statements.
The introductory section, combining statements, and individual nonmajor fund financial statements, schedule of expenditures of federal awards, as required by Office of Management and Budget Circular A-133, Audits of States, Local Governments, and Non-Profit Organizations, the schedule of state financial assistance as required by NJ OMB 04-04, and statistical information is the responsibility of management and was derived from and relates directly to the underlying accounting and other records used to prepare the basic financial statements. Such information has been subjected to the auditing procedures applied in the audit of the basic financial statements and certain additional procedures, including comparing and reconciling such information directly to the underlying accounting and other records used to prepare the basic financial statements or to the basic financial statements themselves, and other additional procedures in accordance with auditing standards generally accepted in the United States of America. In our opinion, the combining and individual nonmajor fund financial statements, schedule of expenditures of federal awards, as required by Office of Management and Budget Circular A-133, Audits of States, Local Governments, and Non-Profit Organizations, the schedule of state financial assistance as required by NJ OMB 04-04 is fairly stated, in all material respects, in relation to the basic financial statements as a whole.
The introductory and statistical sections have not been subject to the auditing procedures applied in the audit of the basic financial statements, and accordingly, we do not express an opinion or provide any assurance on it.
Other Reporting Required by Government Auditing Standards
In accordance with Government Auditing Standards, we have also issued our report dated December 2, 2014 on our consideration of the Egg Harbor Township School District's internal control over financial
18
reporting and on our tests of its compliance with certain provisions of laws, regulations, contracts, and grant agreements and other matters. The purpose of that report is to describe the scope of our testing of internal control over financial reporting and compliance and the results of that testing, and not to provide an opinion on internal control over financial reporting or on compliance. That report is an integral part of an audit performed in accordance with Government Auditing Standards in considering the Egg Harbor Township School District’s internal control over financial reporting and compliance.
Very truly yours,
Ford, Scott & Associates, L.L.C. FORD, SCOTT & ASSOCIATES, L.L.C.
CERTIFIED PUBLIC ACCOUNTANTS
Leon P. Costello Leon P. Costello Certified Public Accountant Licensed Public School Accountant No. 767 December 2, 2014
19

{THIS PAGE IS INTENTIONALLY LEFT BLANK}
Required Supplementary InformationPart I

{THIS PAGE IS INTENTIONALLY LEFT BLANK}
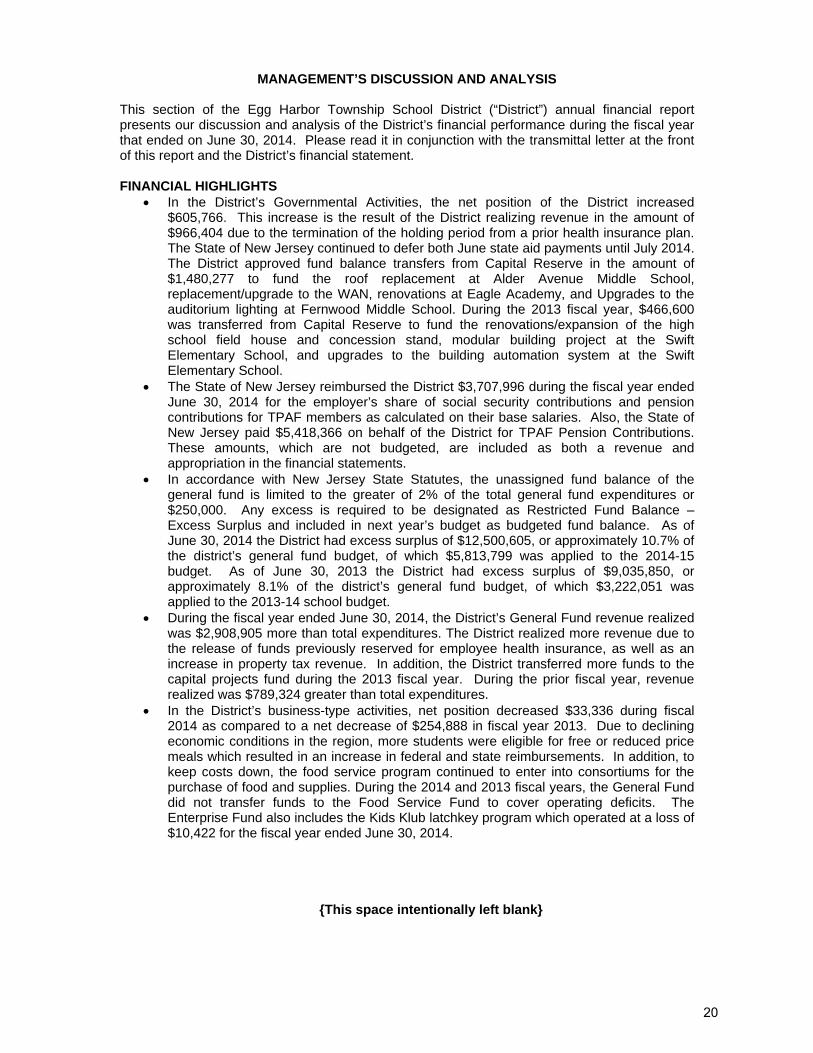
MANAGEMENT’S DISCUSSION AND ANALYSIS This section of the Egg Harbor Township School District (“District”) annual financial report presents our discussion and analysis of the District’s financial performance during the fiscal year that ended on June 30, 2014. Please read it in conjunction with the transmittal letter at the front of this report and the District’s financial statement. FINANCIAL HIGHLIGHTS
In the District’s Governmental Activities, the net position of the District increased $605,766. This increase is the result of the District realizing revenue in the amount of $966,404 due to the termination of the holding period from a prior health insurance plan. The State of New Jersey continued to defer both June state aid payments until July 2014. The District approved fund balance transfers from Capital Reserve in the amount of $1,480,277 to fund the roof replacement at Alder Avenue Middle School, replacement/upgrade to the WAN, renovations at Eagle Academy, and Upgrades to the auditorium lighting at Fernwood Middle School. During the 2013 fiscal year, $466,600 was transferred from Capital Reserve to fund the renovations/expansion of the high school field house and concession stand, modular building project at the Swift Elementary School, and upgrades to the building automation system at the Swift Elementary School.
The State of New Jersey reimbursed the District $3,707,996 during the fiscal year ended June 30, 2014 for the employer’s share of social security contributions and pension contributions for TPAF members as calculated on their base salaries. Also, the State of New Jersey paid $5,418,366 on behalf of the District for TPAF Pension Contributions. These amounts, which are not budgeted, are included as both a revenue and appropriation in the financial statements.
In accordance with New Jersey State Statutes, the unassigned fund balance of the general fund is limited to the greater of 2% of the total general fund expenditures or $250,000. Any excess is required to be designated as Restricted Fund Balance – Excess Surplus and included in next year’s budget as budgeted fund balance. As of June 30, 2014 the District had excess surplus of $12,500,605, or approximately 10.7% of the district’s general fund budget, of which $5,813,799 was applied to the 2014-15 budget. As of June 30, 2013 the District had excess surplus of $9,035,850, or approximately 8.1% of the district’s general fund budget, of which $3,222,051 was applied to the 2013-14 school budget.
During the fiscal year ended June 30, 2014, the District’s General Fund revenue realized was $2,908,905 more than total expenditures. The District realized more revenue due to the release of funds previously reserved for employee health insurance, as well as an increase in property tax revenue. In addition, the District transferred more funds to the capital projects fund during the 2013 fiscal year. During the prior fiscal year, revenue realized was $789,324 greater than total expenditures.
In the District’s business-type activities, net position decreased $33,336 during fiscal 2014 as compared to a net decrease of $254,888 in fiscal year 2013. Due to declining economic conditions in the region, more students were eligible for free or reduced price meals which resulted in an increase in federal and state reimbursements. In addition, to keep costs down, the food service program continued to enter into consortiums for the purchase of food and supplies. During the 2014 and 2013 fiscal years, the General Fund did not transfer funds to the Food Service Fund to cover operating deficits. The Enterprise Fund also includes the Kids Klub latchkey program which operated at a loss of $10,422 for the fiscal year ended June 30, 2014.
{This space intentionally left blank}
20
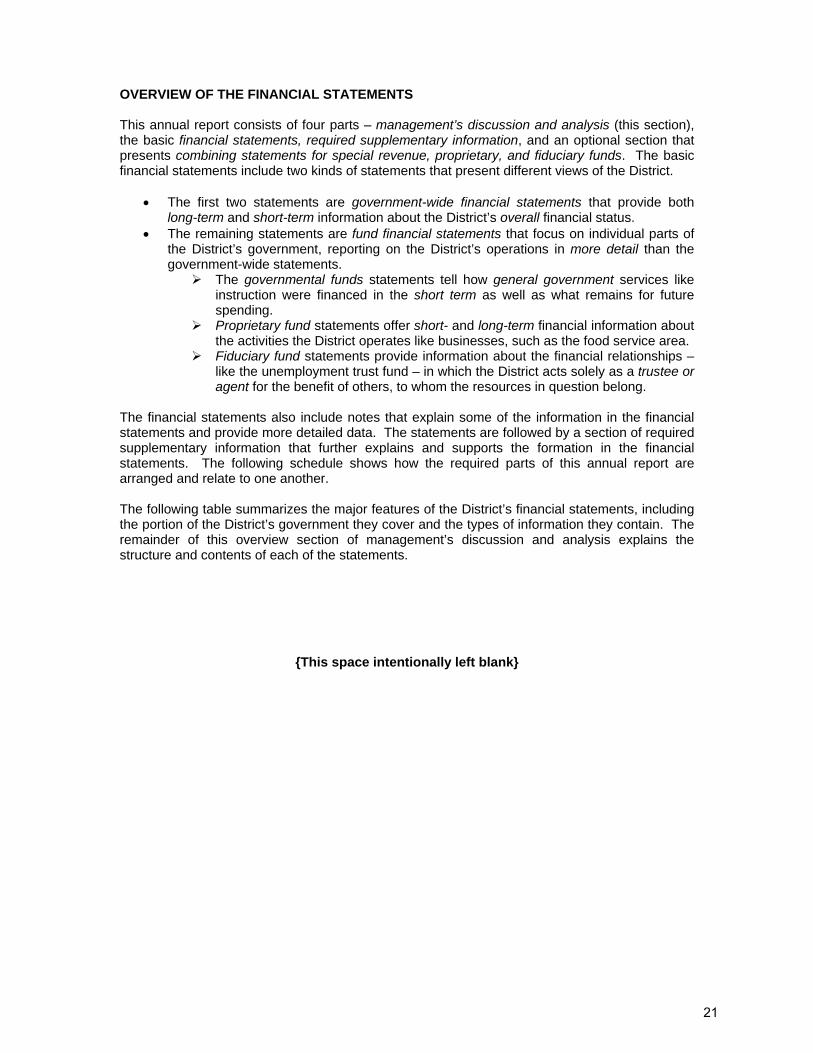
OVERVIEW OF THE FINANCIAL STATEMENTS This annual report consists of four parts – management’s discussion and analysis (this section), the basic financial statements, required supplementary information, and an optional section that presents combining statements for special revenue, proprietary, and fiduciary funds. The basic financial statements include two kinds of statements that present different views of the District.
The first two statements are government-wide financial statements that provide both long-term and short-term information about the District’s overall financial status.
The remaining statements are fund financial statements that focus on individual parts of the District’s government, reporting on the District’s operations in more detail than the government-wide statements.
The governmental funds statements tell how general government services like instruction were financed in the short term as well as what remains for future spending.
Proprietary fund statements offer short- and long-term financial information about the activities the District operates like businesses, such as the food service area.
Fiduciary fund statements provide information about the financial relationships – like the unemployment trust fund – in which the District acts solely as a trustee or agent for the benefit of others, to whom the resources in question belong.
The financial statements also include notes that explain some of the information in the financial statements and provide more detailed data. The statements are followed by a section of required supplementary information that further explains and supports the formation in the financial statements. The following schedule shows how the required parts of this annual report are arranged and relate to one another. The following table summarizes the major features of the District’s financial statements, including the portion of the District’s government they cover and the types of information they contain. The remainder of this overview section of management’s discussion and analysis explains the structure and contents of each of the statements.
{This space intentionally left blank}
21
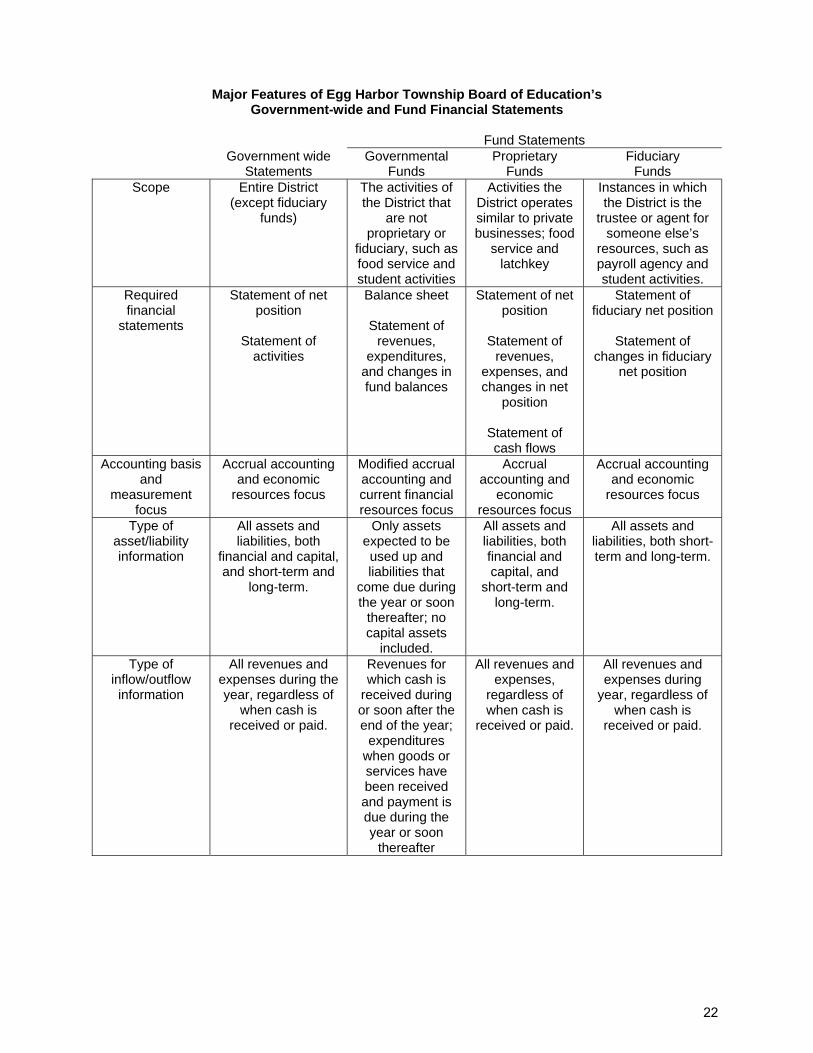
Major Features of Egg Harbor Township Board of Education’s
Government-wide and Fund Financial Statements Fund Statements Government wide Governmental Proprietary Fiduciary Statements Funds Funds Funds
Scope Entire District (except fiduciary
funds)
The activities of the District that
are not proprietary or
fiduciary, such as food service and student activities
Activities the District operates similar to private businesses; food
service and latchkey
Instances in which the District is the
trustee or agent for someone else’s
resources, such as payroll agency and student activities.
Required financial
statements
Statement of net position
Statement of
activities
Balance sheet
Statement of revenues,
expenditures, and changes in fund balances
Statement of net position
Statement of
revenues, expenses, and changes in net
position
Statement of cash flows
Statement of fiduciary net position
Statement of
changes in fiduciary net position
Accounting basis and
measurement focus
Accrual accounting and economic
resources focus
Modified accrual accounting and current financial resources focus
Accrual accounting and
economic resources focus
Accrual accounting and economic
resources focus
Type of asset/liability information
All assets and liabilities, both
financial and capital, and short-term and
long-term.
Only assets expected to be used up and liabilities that
come due during the year or soon
thereafter; no capital assets
included.
All assets and liabilities, both financial and capital, and
short-term and long-term.
All assets and liabilities, both short-term and long-term.
Type of inflow/outflow information
All revenues and expenses during the year, regardless of
when cash is received or paid.
Revenues for which cash is
received during or soon after the end of the year;
expenditures when goods or services have been received and payment is due during the year or soon
thereafter
All revenues and expenses,
regardless of when cash is
received or paid.
All revenues and expenses during
year, regardless of when cash is
received or paid.
22
Government-wide Statements The government-wide statements report information about the District as a whole using accounting methods similar to those used by private-sector companies. The statement of net position includes all of the government’s assets and liabilities. All of the current year’s revenues and expenses are accounted for in the statement of activities regardless of when cash is received or paid. The two government-wide statements report the District’s net position and how it has changed. Net position – the difference between the District’s assets and liabilities – is one way to measure the District’s financial health, or position.
Over time, increases or decreases in the District’s net position are an indicator of whether its financial health is improving or deteriorating, respectively.
To assess the overall health of the District you need to consider additional nonfinancial factors such as changes in the Township’s property tax base and the condition of the District’s facilities.
The government-wide financial statements of the District are divided into two categories:
Governmental activities – most of the District’s basic services are included here, such as instruction, transportation, administration, and plant operations. Property taxes and state and federal grants finance most of these activities.
Business-type activities – the District charges fees to customers to help it cover the costs of certain services it provides. The District’s food service and latchkey programs are included here.
Fund Financial Statements The fund financial statements provide more detailed information about the District’s most significant funds – not the District as a whole. Funds are accounting devices that the District uses to keep track of specific sources of funding and spending for particular purposes. The District has three kinds of funds:
Governmental funds – Most of the District’s basic services are included in governmental funds, which focus on (1) how cash and other financial assets that can readily be converted to cash flow in and out and (2) the balances left at year-end that are available for spending. Consequently, the governmental funds statements provide a detailed short-term view that helps you determine whether there are more or fewer financial resources that can be spent in the near future to finance the District’s programs. Because this information does not encompass the additional long-term focus of the government-wide statements, we provide additional information at the bottom of the governmental funds statement that explains the relationship (or differences) between them.
Proprietary funds – Services for which the District charges customers a fee are generally reported in proprietary funds. Proprietary funds, like the government-wide statements, provide both long- and short-term financial information. In fact, the District’s enterprise funds (one type of proprietary fund) are the same as its business-type activities, but provide more detail and additional information, such as cash flows.
Fiduciary funds – The District is the trustee, or fiduciary, for its employees’ unemployment compensation plan. It is also responsible for other assets that - because of a trust arrangement – can be used only for the trust beneficiaries. The District is responsible for ensuring that the assets reported in these funds are used for their intended purposes. All of the District’s fiduciary activities are reported in separate statement of fiduciary net position and a statement of changes in fiduciary net position. We exclude these activities
23
from the District’s government-wide financial statements because the District cannot use these assets to finance its operations.
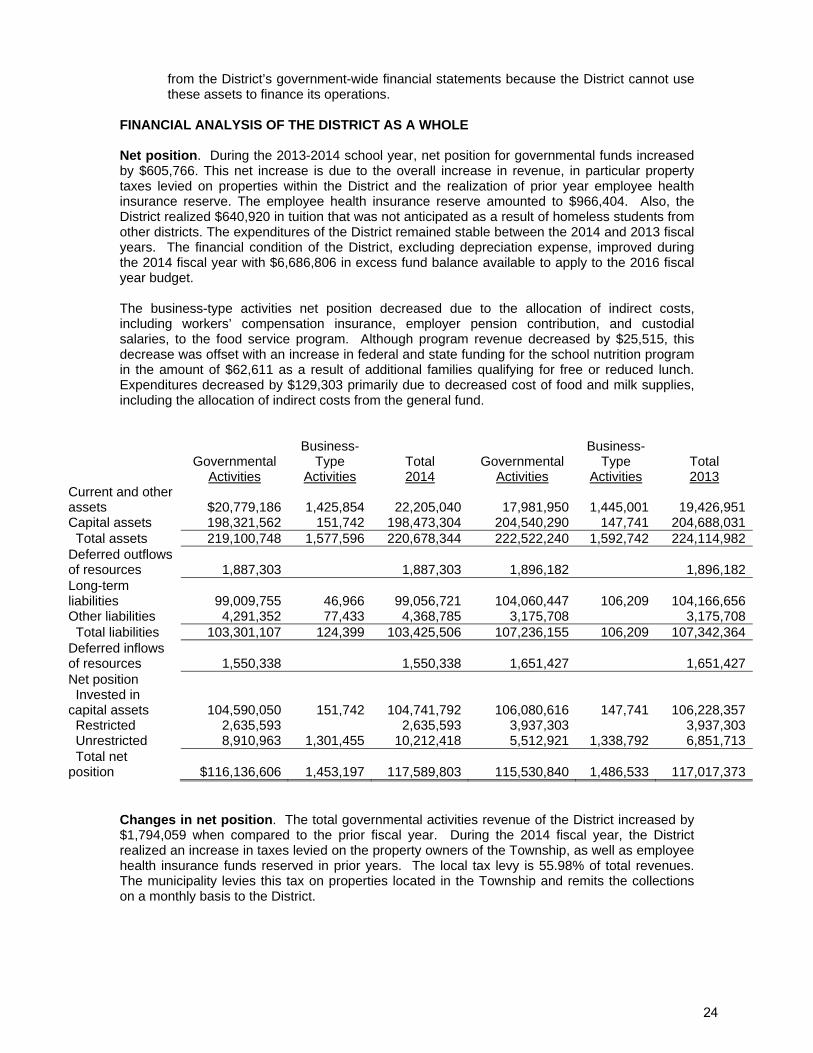
FINANCIAL ANALYSIS OF THE DISTRICT AS A WHOLE Net position. During the 2013-2014 school year, net position for governmental funds increased by $605,766. This net increase is due to the overall increase in revenue, in particular property taxes levied on properties within the District and the realization of prior year employee health insurance reserve. The employee health insurance reserve amounted to $966,404. Also, the District realized $640,920 in tuition that was not anticipated as a result of homeless students from other districts. The expenditures of the District remained stable between the 2014 and 2013 fiscal years. The financial condition of the District, excluding depreciation expense, improved during the 2014 fiscal year with $6,686,806 in excess fund balance available to apply to the 2016 fiscal year budget. The business-type activities net position decreased due to the allocation of indirect costs, including workers’ compensation insurance, employer pension contribution, and custodial salaries, to the food service program. Although program revenue decreased by $25,515, this decrease was offset with an increase in federal and state funding for the school nutrition program in the amount of $62,611 as a result of additional families qualifying for free or reduced lunch. Expenditures decreased by $129,303 primarily due to decreased cost of food and milk supplies, including the allocation of indirect costs from the general fund.
Business- Business- Governmental Type Total Governmental Type Total Activities Activities 2014 Activities Activities 2013 Current and other assets $20,779,186 1,425,854 22,205,040 17,981,950 1,445,001 19,426,951Capital assets 198,321,562 151,742 198,473,304 204,540,290 147,741 204,688,031 Total assets 219,100,748 1,577,596 220,678,344 222,522,240 1,592,742 224,114,982Deferred outflows of resources 1,887,303 1,887,303 1,896,182 1,896,182Long-term liabilities 99,009,755 46,966 99,056,721 104,060,447 106,209 104,166,656Other liabilities 4,291,352 77,433 4,368,785 3,175,708 3,175,708 Total liabilities 103,301,107 124,399 103,425,506 107,236,155 106,209 107,342,364Deferred inflows of resources 1,550,338 1,550,338 1,651,427 1,651,427Net position Invested in capital assets 104,590,050 151,742 104,741,792 106,080,616 147,741 106,228,357 Restricted 2,635,593 2,635,593 3,937,303 3,937,303 Unrestricted 8,910,963 1,301,455 10,212,418 5,512,921 1,338,792 6,851,713 Total net position $116,136,606 1,453,197 117,589,803 115,530,840 1,486,533 117,017,373
Changes in net position. The total governmental activities revenue of the District increased by $1,794,059 when compared to the prior fiscal year. During the 2014 fiscal year, the District realized an increase in taxes levied on the property owners of the Township, as well as employee health insurance funds reserved in prior years. The local tax levy is 55.98% of total revenues. The municipality levies this tax on properties located in the Township and remits the collections on a monthly basis to the District.
24
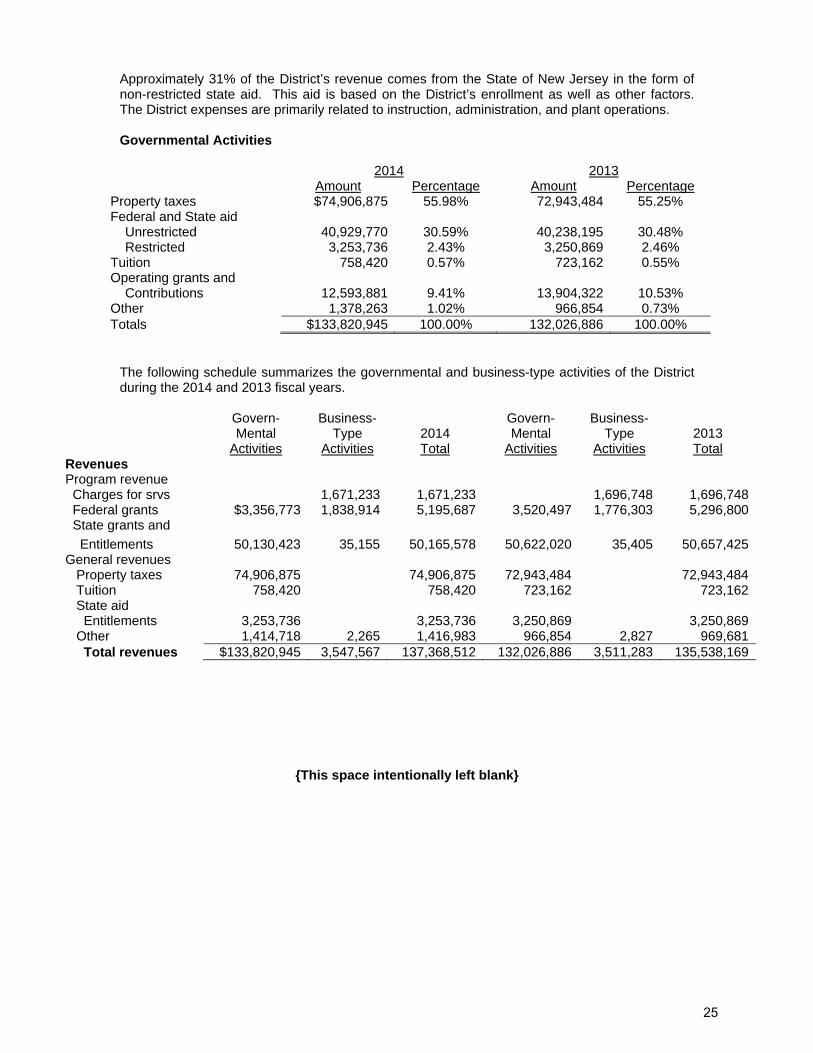
Approximately 31% of the District’s revenue comes from the State of New Jersey in the form of non-restricted state aid. This aid is based on the District’s enrollment as well as other factors. The District expenses are primarily related to instruction, administration, and plant operations. Governmental Activities
2014 2013 Amount Percentage Amount Percentage Property taxes $74,906,875 55.98% 72,943,484 55.25% Federal and State aid Unrestricted 40,929,770 30.59% 40,238,195 30.48% Restricted 3,253,736 2.43% 3,250,869 2.46% Tuition 758,420 0.57% 723,162 0.55% Operating grants and Contributions 12,593,881 9.41% 13,904,322 10.53% Other 1,378,263 1.02% 966,854 0.73% Totals $133,820,945 100.00% 132,026,886 100.00%
The following schedule summarizes the governmental and business-type activities of the District during the 2014 and 2013 fiscal years.
Govern- Business- Govern- Business- Mental Type 2014 Mental Type 2013 Activities Activities Total Activities Activities Total Revenues Program revenue Charges for srvs 1,671,233 1,671,233 1,696,748 1,696,748 Federal grants $3,356,773 1,838,914 5,195,687 3,520,497 1,776,303 5,296,800 State grants and
Entitlements 50,130,423 35,155 50,165,578 50,622,020 35,405 50,657,425General revenues Property taxes 74,906,875 74,906,875 72,943,484 72,943,484 Tuition 758,420 758,420 723,162 723,162 State aid Entitlements 3,253,736 3,253,736 3,250,869 3,250,869 Other 1,414,718 2,265 1,416,983 966,854 2,827 969,681 Total revenues $133,820,945 3,547,567 137,368,512 132,026,886 3,511,283 135,538,169
{This space intentionally left blank}
25
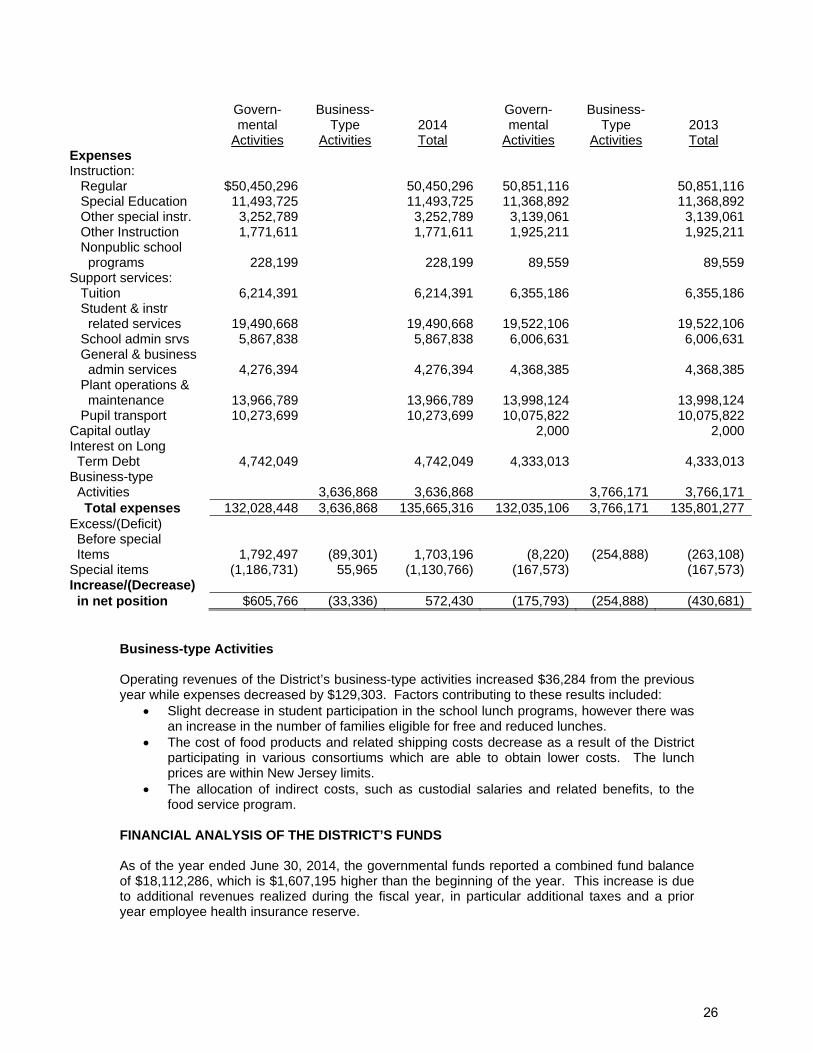
Govern- Business- Govern- Business- mental Type 2014 mental Type 2013 Activities Activities Total Activities Activities Total Expenses Instruction: Regular $50,450,296 50,450,296 50,851,116 50,851,116 Special Education 11,493,725 11,493,725 11,368,892 11,368,892 Other special instr. 3,252,789 3,252,789 3,139,061 3,139,061 Other Instruction 1,771,611 1,771,611 1,925,211 1,925,211 Nonpublic school programs 228,199 228,199 89,559 89,559Support services: Tuition 6,214,391 6,214,391 6,355,186 6,355,186 Student & instr related services 19,490,668 19,490,668 19,522,106 19,522,106 School admin srvs 5,867,838 5,867,838 6,006,631 6,006,631 General & business admin services 4,276,394 4,276,394 4,368,385 4,368,385 Plant operations & maintenance 13,966,789 13,966,789 13,998,124 13,998,124 Pupil transport 10,273,699 10,273,699 10,075,822 10,075,822Capital outlay 2,000 2,000Interest on Long Term Debt 4,742,049 4,742,049 4,333,013 4,333,013Business-type Activities 3,636,868 3,636,868 3,766,171 3,766,171 Total expenses 132,028,448 3,636,868 135,665,316 132,035,106 3,766,171 135,801,277Excess/(Deficit) Before special Items 1,792,497 (89,301) 1,703,196 (8,220) (254,888) (263,108)Special items (1,186,731) 55,965 (1,130,766) (167,573) (167,573)Increase/(Decrease) in net position $605,766 (33,336) 572,430 (175,793) (254,888) (430,681)
Business-type Activities Operating revenues of the District’s business-type activities increased $36,284 from the previous year while expenses decreased by $129,303. Factors contributing to these results included:
Slight decrease in student participation in the school lunch programs, however there was an increase in the number of families eligible for free and reduced lunches.
The cost of food products and related shipping costs decrease as a result of the District participating in various consortiums which are able to obtain lower costs. The lunch prices are within New Jersey limits.
The allocation of indirect costs, such as custodial salaries and related benefits, to the food service program.
FINANCIAL ANALYSIS OF THE DISTRICT’S FUNDS As of the year ended June 30, 2014, the governmental funds reported a combined fund balance of $18,112,286, which is $1,607,195 higher than the beginning of the year. This increase is due to additional revenues realized during the fiscal year, in particular additional taxes and a prior year employee health insurance reserve.
26
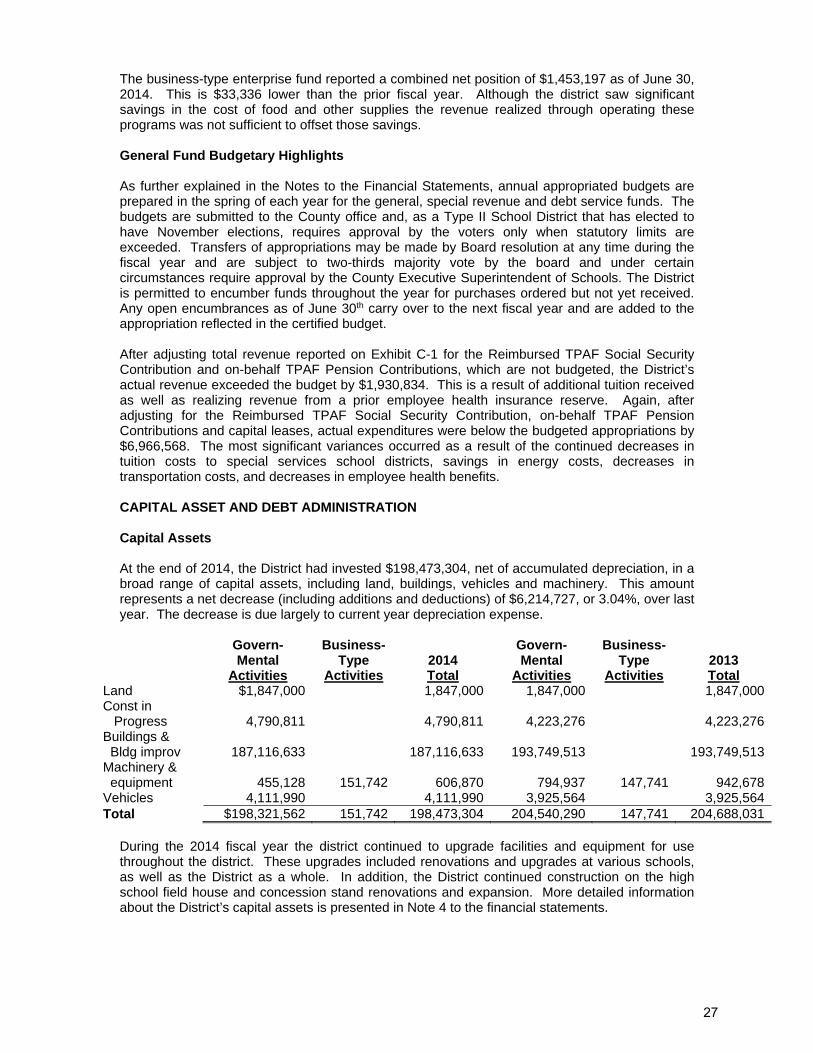
The business-type enterprise fund reported a combined net position of $1,453,197 as of June 30, 2014. This is $33,336 lower than the prior fiscal year. Although the district saw significant savings in the cost of food and other supplies the revenue realized through operating these programs was not sufficient to offset those savings. General Fund Budgetary Highlights As further explained in the Notes to the Financial Statements, annual appropriated budgets are prepared in the spring of each year for the general, special revenue and debt service funds. The budgets are submitted to the County office and, as a Type II School District that has elected to have November elections, requires approval by the voters only when statutory limits are exceeded. Transfers of appropriations may be made by Board resolution at any time during the fiscal year and are subject to two-thirds majority vote by the board and under certain circumstances require approval by the County Executive Superintendent of Schools. The District is permitted to encumber funds throughout the year for purchases ordered but not yet received. Any open encumbrances as of June 30th carry over to the next fiscal year and are added to the appropriation reflected in the certified budget. After adjusting total revenue reported on Exhibit C-1 for the Reimbursed TPAF Social Security Contribution and on-behalf TPAF Pension Contributions, which are not budgeted, the District’s actual revenue exceeded the budget by $1,930,834. This is a result of additional tuition received as well as realizing revenue from a prior employee health insurance reserve. Again, after adjusting for the Reimbursed TPAF Social Security Contribution, on-behalf TPAF Pension Contributions and capital leases, actual expenditures were below the budgeted appropriations by $6,966,568. The most significant variances occurred as a result of the continued decreases in tuition costs to special services school districts, savings in energy costs, decreases in transportation costs, and decreases in employee health benefits. CAPITAL ASSET AND DEBT ADMINISTRATION Capital Assets At the end of 2014, the District had invested $198,473,304, net of accumulated depreciation, in a broad range of capital assets, including land, buildings, vehicles and machinery. This amount represents a net decrease (including additions and deductions) of $6,214,727, or 3.04%, over last year. The decrease is due largely to current year depreciation expense.
Govern- Business- Govern- Business- Mental Type 2014 Mental Type 2013 Activities Activities Total Activities Activities Total Land $1,847,000 1,847,000 1,847,000 1,847,000Const in Progress 4,790,811 4,790,811 4,223,276 4,223,276Buildings & Bldg improv 187,116,633 187,116,633 193,749,513 193,749,513Machinery & equipment 455,128 151,742 606,870 794,937 147,741 942,678Vehicles 4,111,990 4,111,990 3,925,564 3,925,564Total $198,321,562 151,742 198,473,304 204,540,290 147,741 204,688,031
During the 2014 fiscal year the district continued to upgrade facilities and equipment for use throughout the district. These upgrades included renovations and upgrades at various schools, as well as the District as a whole. In addition, the District continued construction on the high school field house and concession stand renovations and expansion. More detailed information about the District’s capital assets is presented in Note 4 to the financial statements.
27
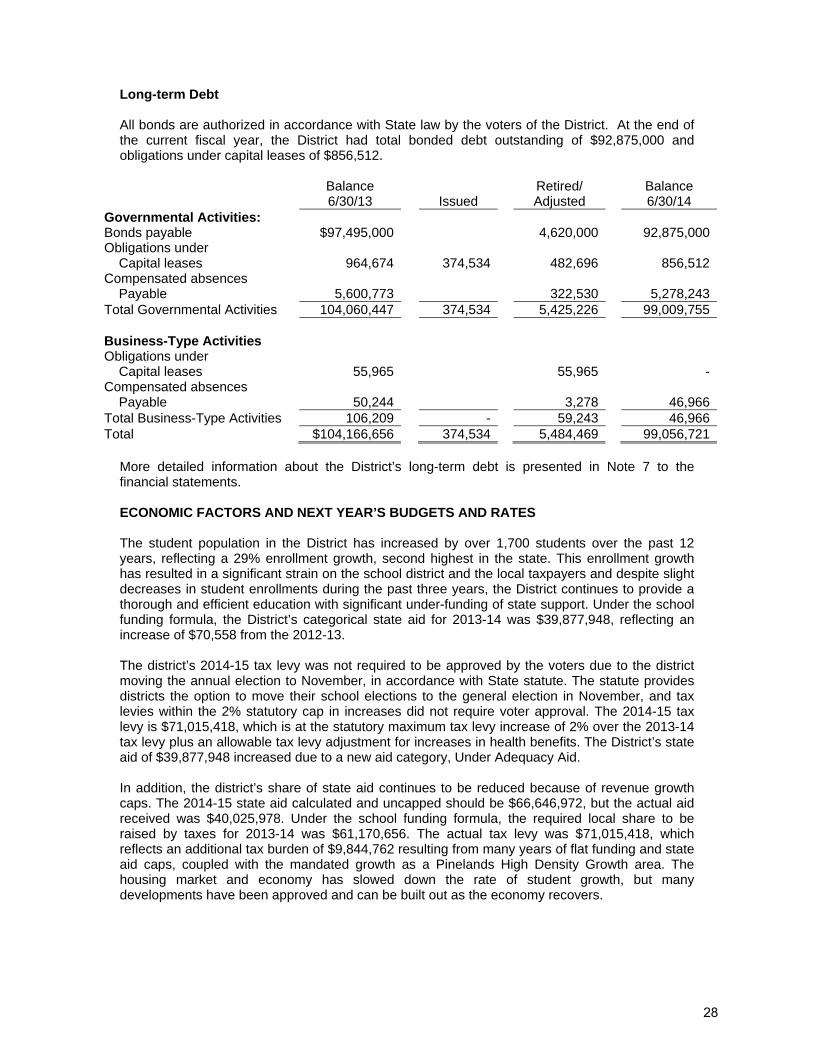
Long-term Debt All bonds are authorized in accordance with State law by the voters of the District. At the end of the current fiscal year, the District had total bonded debt outstanding of $92,875,000 and obligations under capital leases of $856,512.
Balance Retired/ Balance 6/30/13 Issued Adjusted 6/30/14 Governmental Activities: Bonds payable $97,495,000 4,620,000 92,875,000Obligations under Capital leases 964,674 374,534 482,696 856,512Compensated absences Payable 5,600,773 322,530 5,278,243Total Governmental Activities 104,060,447 374,534 5,425,226 99,009,755 Business-Type Activities Obligations under Capital leases 55,965 55,965 -Compensated absences Payable 50,244 3,278 46,966Total Business-Type Activities 106,209 - 59,243 46,966Total $104,166,656 374,534 5,484,469 99,056,721
More detailed information about the District’s long-term debt is presented in Note 7 to the financial statements. ECONOMIC FACTORS AND NEXT YEAR’S BUDGETS AND RATES The student population in the District has increased by over 1,700 students over the past 12 years, reflecting a 29% enrollment growth, second highest in the state. This enrollment growth has resulted in a significant strain on the school district and the local taxpayers and despite slight decreases in student enrollments during the past three years, the District continues to provide a thorough and efficient education with significant under-funding of state support. Under the school funding formula, the District’s categorical state aid for 2013-14 was $39,877,948, reflecting an increase of $70,558 from the 2012-13. The district’s 2014-15 tax levy was not required to be approved by the voters due to the district moving the annual election to November, in accordance with State statute. The statute provides districts the option to move their school elections to the general election in November, and tax levies within the 2% statutory cap in increases did not require voter approval. The 2014-15 tax levy is $71,015,418, which is at the statutory maximum tax levy increase of 2% over the 2013-14 tax levy plus an allowable tax levy adjustment for increases in health benefits. The District’s state aid of $39,877,948 increased due to a new aid category, Under Adequacy Aid. In addition, the district’s share of state aid continues to be reduced because of revenue growth caps. The 2014-15 state aid calculated and uncapped should be $66,646,972, but the actual aid received was $40,025,978. Under the school funding formula, the required local share to be raised by taxes for 2013-14 was $61,170,656. The actual tax levy was $71,015,418, which reflects an additional tax burden of $9,844,762 resulting from many years of flat funding and state aid caps, coupled with the mandated growth as a Pinelands High Density Growth area. The housing market and economy has slowed down the rate of student growth, but many developments have been approved and can be built out as the economy recovers.
28
CONTACTING THE DISTRICT’S FINANCIAL MANAGEMENT This financial report is designed to present users (residents, receiving districts, and creditors) with a general overview of the District’s finances and to demonstrate the District’s accountability. If you have questions about the report or need additional financial information, contact the District’s business administrator at 13 Swift Drive, Egg Harbor Township, New Jersey 08234.
29
DISTRICT - WIDE FINANCIAL STATEMENTS

{THIS PAGE IS INTENTIONALLY LEFT BLANK}
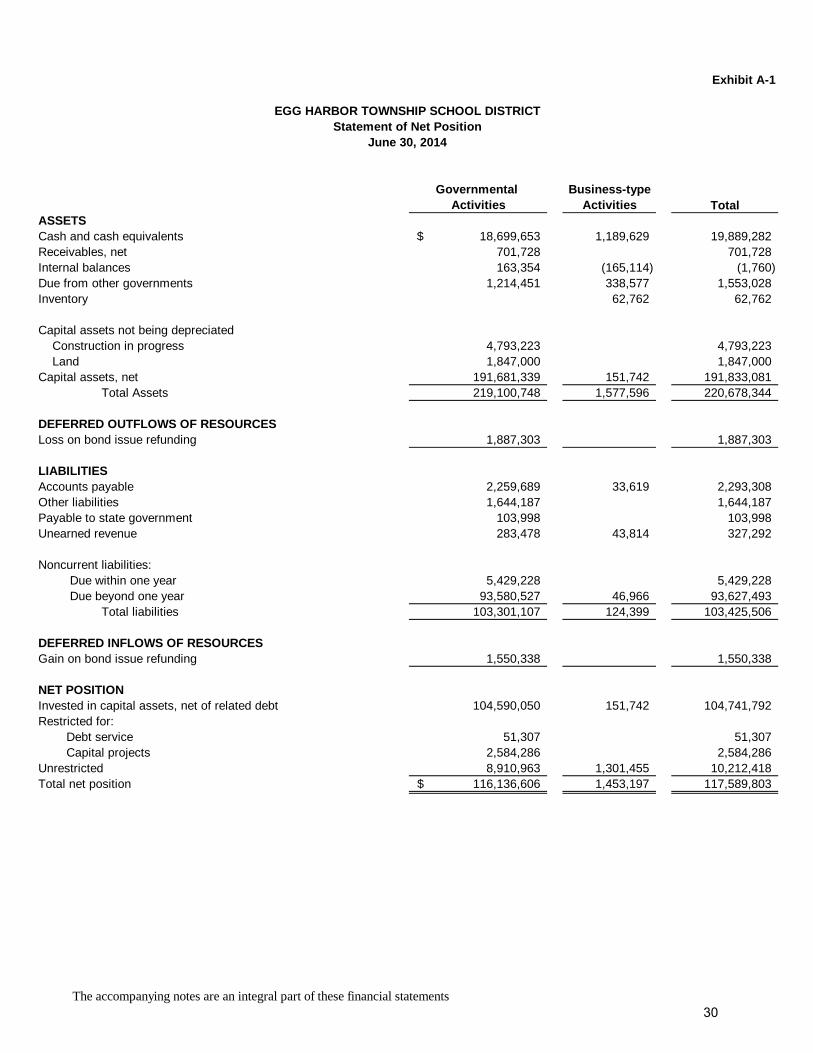
Exhibit A-1
Governmental Business-typeActivities Activities Total
ASSETSCash and cash equivalents 18,699,653$ 1,189,629 19,889,282 Receivables, net 701,728 701,728 Internal balances 163,354 (165,114) (1,760) Due from other governments 1,214,451 338,577 1,553,028 Inventory 62,762 62,762
Capital assets not being depreciated Construction in progress 4,793,223 4,793,223 Land 1,847,000 1,847,000 Capital assets, net 191,681,339 151,742 191,833,081 Total Assets 219,100,748 1,577,596 220,678,344
DEFERRED OUTFLOWS OF RESOURCESLoss on bond issue refunding 1,887,303 1,887,303
LIABILITIESAccounts payable 2,259,689 33,619 2,293,308 Other liabilities 1,644,187 1,644,187 Payable to state government 103,998 103,998 Unearned revenue 283,478 43,814 327,292
Noncurrent liabilities: Due within one year 5,429,228 5,429,228 Due beyond one year 93,580,527 46,966 93,627,493 Total liabilities 103,301,107 124,399 103,425,506
DEFERRED INFLOWS OF RESOURCESGain on bond issue refunding 1,550,338 1,550,338
NET POSITIONInvested in capital assets, net of related debt 104,590,050 151,742 104,741,792 Restricted for: Debt service 51,307 51,307 Capital projects 2,584,286 2,584,286 Unrestricted 8,910,963 1,301,455 10,212,418 Total net position 116,136,606$ 1,453,197 117,589,803
EGG HARBOR TOWNSHIP SCHOOL DISTRICTStatement of Net Position
June 30, 2014
The accompanying notes are an integral part of these financial statements30
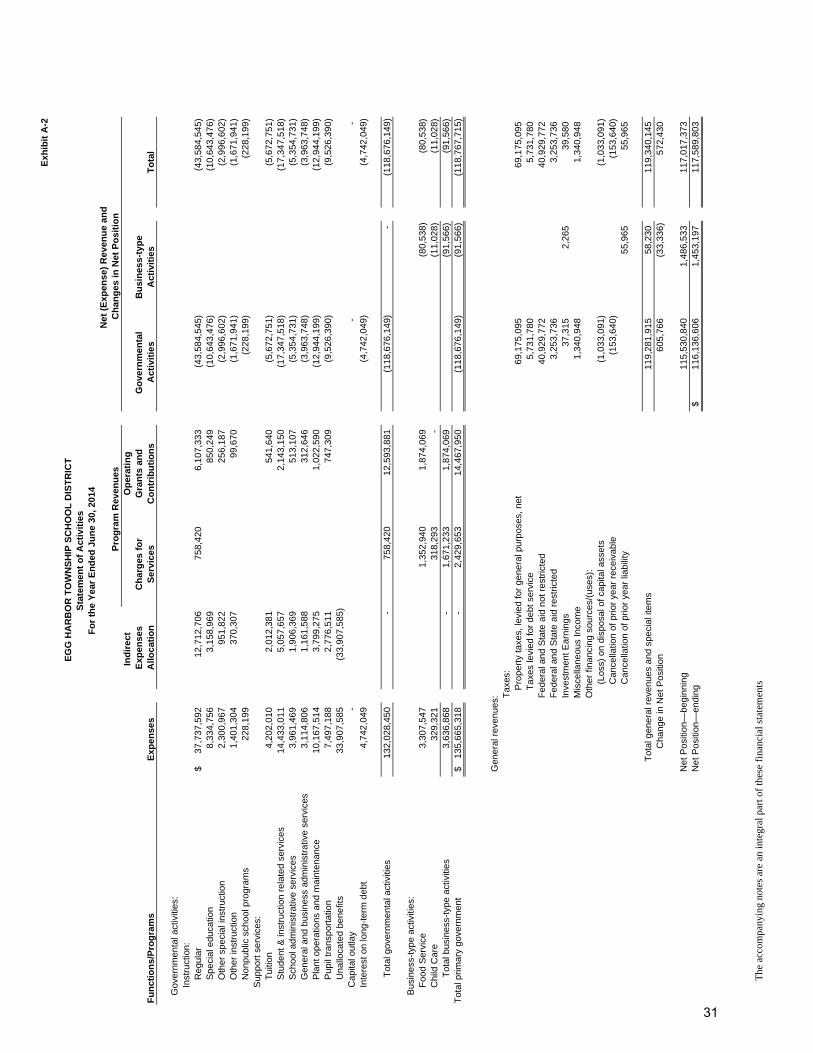
Exh
ibit
A-2
EG
G H
AR
BO
R T
OW
NS
HIP
SC
HO
OL
DIS
TR
ICT
Sta
tem
ent
of
Act
ivit
ies
Fo
r th
e Y
ear
En
ded
Ju
ne
30, 2
014
Net
(E
xpen
se)
Rev
enu
e an
dP
rog
ram
Rev
enu
es C
han
ges
in N
et P
osi
tio
nIn
dir
ect
Op
erat
ing
Exp
ense
sC
har
ges
fo
rG
ran
ts a
nd
Go
vern
men
tal
Bu
sin
ess-
typ
eF
un
ctio
ns/
Pro
gra
ms
Exp
ense
sA
lloca
tio
nS
ervi
ces
Co
ntr
ibu
tio
ns
Act
ivit
ies
Act
ivit
ies
To
tal
G
over
nmen
tal a
ctiv
ities
:
In
stru
ctio
n:
Reg
ular
37,7
37,5
92$
12,7
12,7
06
75
8,42
0
6,
107,
333
(4
3,58
4,54
5)
(4
3,58
4,54
5)
S
peci
al e
duca
tion
8,33
4,75
6
3,
158,
969
85
0,24
9
(1
0,64
3,47
6)
(1
0,64
3,47
6)
O
ther
spe
cial
inst
ruct
ion
2,30
0,96
7
95
1,82
2
25
6,18
7
(2
,996
,602
)
(2
,996
,602
)
O
ther
inst
ruct
ion
1,40
1,30
4
37
0,30
7
99
,670
(1,6
71,9
41)
(1,6
71,9
41)
Non
publ
ic s
choo
l pro
gram
s22
8,19
9
(228
,199
)
(228
,199
)
S
uppo
rt s
ervi
ces:
T
uitio
n4,
202,
010
2,01
2,38
1
541,
640
(5,6
72,7
51)
(5,6
72,7
51)
Stu
dent
& in
stru
ctio
n re
late
d se
rvic
es14
,433
,011
5,
057,
657
2,
143,
150
(1
7,34
7,51
8)
(1
7,34
7,51
8)
S
choo
l adm
inis
trat
ive
serv
ices
3,96
1,46
9
1,
906,
369
51
3,10
7
(5
,354
,731
)
(5
,354
,731
)
G
ener
al a
nd b
usin
ess
adm
inis
trat
ive
serv
ices
3,11
4,80
6
1,
161,
588
31
2,64
6
(3
,963
,748
)
(3
,963
,748
)
P
lant
ope
ratio
ns a
nd m
aint
enan
ce10
,167
,514
3,
799,
275
1,
022,
590
(1
2,94
4,19
9)
(1
2,94
4,19
9)
P
upil
tran
spor
tatio
n7,
497,
188
2,77
6,51
1
747,
309
(9,5
26,3
90)
(9,5
26,3
90)
Una
lloca
ted
bene
fits
33,9
07,5
85
(33,
907,
585)
Cap
ital o
utla
y-
-
-
In
tere
st o
n lo
ng-t
erm
deb
t4,
742,
049
(4,7
42,0
49)
(4,7
42,0
49)
T
otal
gov
ernm
enta
l act
iviti
es13
2,02
8,45
0
-
758,
420
12,5
93,8
81
(1
18,6
76,1
49)
-
(1
18,6
76,1
49)
B
usin
ess-
type
act
iviti
es:
Foo
d S
ervi
ce3,
307,
547
1,35
2,94
0
1,87
4,06
9
(80,
538)
(8
0,53
8)
Chi
ld C
are
329,
321
31
8,29
3
-
(11,
028)
(1
1,02
8)
T
otal
bus
ines
s-ty
pe a
ctiv
ities
3,63
6,86
8
-
1,67
1,23
3
1,87
4,06
9
(91,
566)
(9
1,56
6)
Tot
al p
rimar
y go
vern
men
t13
5,66
5,31
8$
-
2,42
9,65
3
14,4
67,9
50
(1
18,6
76,1
49)
(9
1,56
6)
(118
,767
,715
)
Gen
eral
rev
enue
s: Tax
es:
P
rope
rty
taxe
s, le
vied
for
gene
ral p
urpo
ses,
net
69,1
75,0
95
69
,175
,095
Tax
es le
vied
for
debt
ser
vice
5,73
1,78
0
5,73
1,78
0
F
eder
al a
nd S
tate
aid
not
res
tric
ted
40,9
29,7
72
40
,929
,772
F
eder
al a
nd S
tate
aid
res
tric
ted
3,25
3,73
6
3,25
3,73
6
In
vest
men
t Ear
ning
s37
,315
2,26
5
39
,580
M
isce
llane
ous
Inco
me
1,34
0,94
8
1,34
0,94
8
O
ther
fina
ncin
g so
urce
s/(u
ses)
:(L
oss)
on
disp
osal
of c
apita
l ass
ets
(1,0
33,0
91)
(1,0
33,0
91)
C
ance
llatio
n of
prio
r ye
ar r
ecei
vabl
e(1
53,6
40)
(1
53,6
40)
Can
cella
tion
of p
rior
year
liab
ility
55,9
65
55
,965
T
otal
gen
eral
rev
enue
s an
d sp
ecia
l ite
ms
119,
281,
915
58
,230
119,
340,
145
C
hang
e in
Net
Pos
ition
605,
766
(33,
336)
57
2,43
0
Net
Pos
ition
—be
ginn
ing
115,
530,
840
1,
486,
533
117,
017,
373
Net
Pos
ition
—en
ding
116,
136,
606
$
1,
453,
197
117,
589,
803
The
acc
ompa
nyin
g no
tes
are
an in
tegr
al p
art o
f th
ese
fina
ncia
l sta
tem
ents
31
FUND FINANCIAL STATEMENTS

{THIS PAGE IS INTENTIONALLY LEFT BLANK}
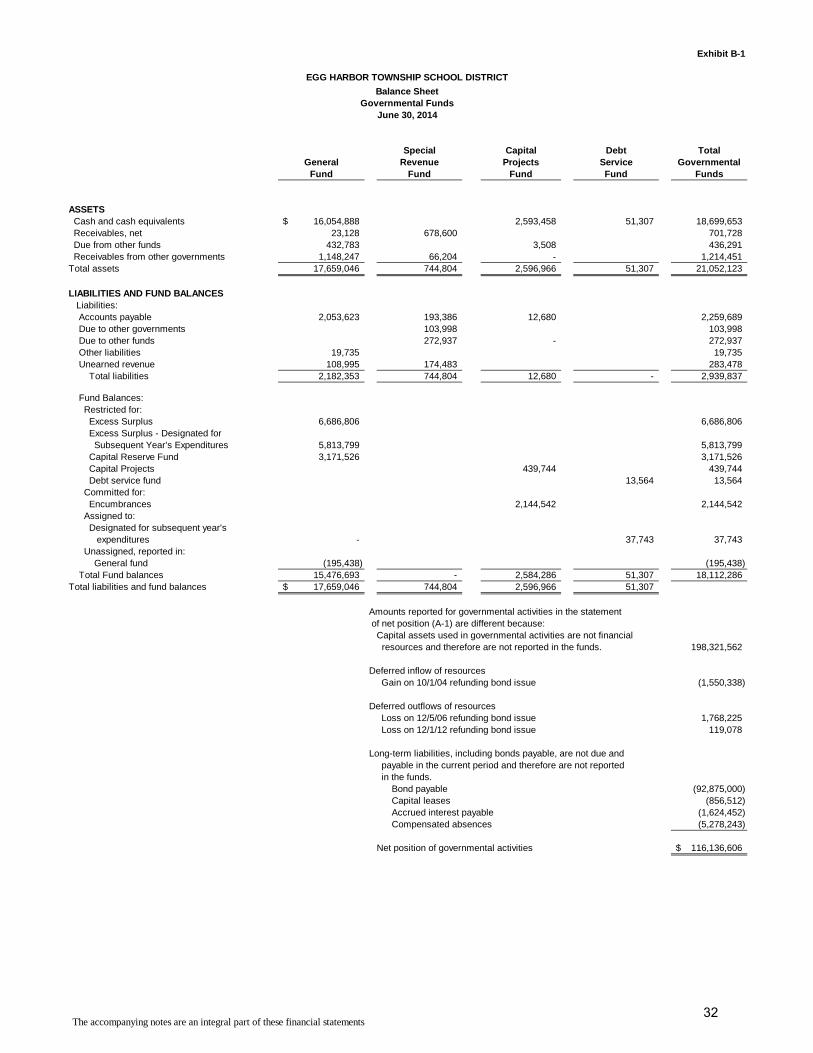
Exhibit B-1
Special Capital Debt TotalGeneral Revenue Projects Service Governmental
Fund Fund Fund Fund Funds
ASSETS Cash and cash equivalents 16,054,888$ 2,593,458 51,307 18,699,653 Receivables, net 23,128 678,600 701,728 Due from other funds 432,783 3,508 436,291 Receivables from other governments 1,148,247 66,204 - 1,214,451 Total assets 17,659,046 744,804 2,596,966 51,307 21,052,123
LIABILITIES AND FUND BALANCES Liabilities: Accounts payable 2,053,623 193,386 12,680 2,259,689 Due to other governments 103,998 103,998 Due to other funds 272,937 - 272,937 Other liabilities 19,735 19,735 Unearned revenue 108,995 174,483 283,478 Total liabilities 2,182,353 744,804 12,680 - 2,939,837
Fund Balances: Restricted for: Excess Surplus 6,686,806 6,686,806 Excess Surplus - Designated for Subsequent Year's Expenditures 5,813,799 5,813,799 Capital Reserve Fund 3,171,526 3,171,526 Capital Projects 439,744 439,744 Debt service fund 13,564 13,564 Committed for: Encumbrances 2,144,542 2,144,542 Assigned to: Designated for subsequent year's expenditures - 37,743 37,743 Unassigned, reported in: General fund (195,438) (195,438) Total Fund balances 15,476,693 - 2,584,286 51,307 18,112,286 Total liabilities and fund balances 17,659,046$ 744,804 2,596,966 51,307
Amounts reported for governmental activities in the statement of net position (A-1) are different because: Capital assets used in governmental activities are not financial resources and therefore are not reported in the funds. 198,321,562
Deferred inflow of resourcesGain on 10/1/04 refunding bond issue (1,550,338)
Deferred outflows of resourcesLoss on 12/5/06 refunding bond issue 1,768,225 Loss on 12/1/12 refunding bond issue 119,078
Long-term liabilities, including bonds payable, are not due andpayable in the current period and therefore are not reported
in the funds. Bond payable (92,875,000) Capital leases (856,512) Accrued interest payable (1,624,452) Compensated absences (5,278,243)
Net position of governmental activities 116,136,606$
EGG HARBOR TOWNSHIP SCHOOL DISTRICT
Balance SheetGovernmental Funds
June 30, 2014
The accompanying notes are an integral part of these financial statements32
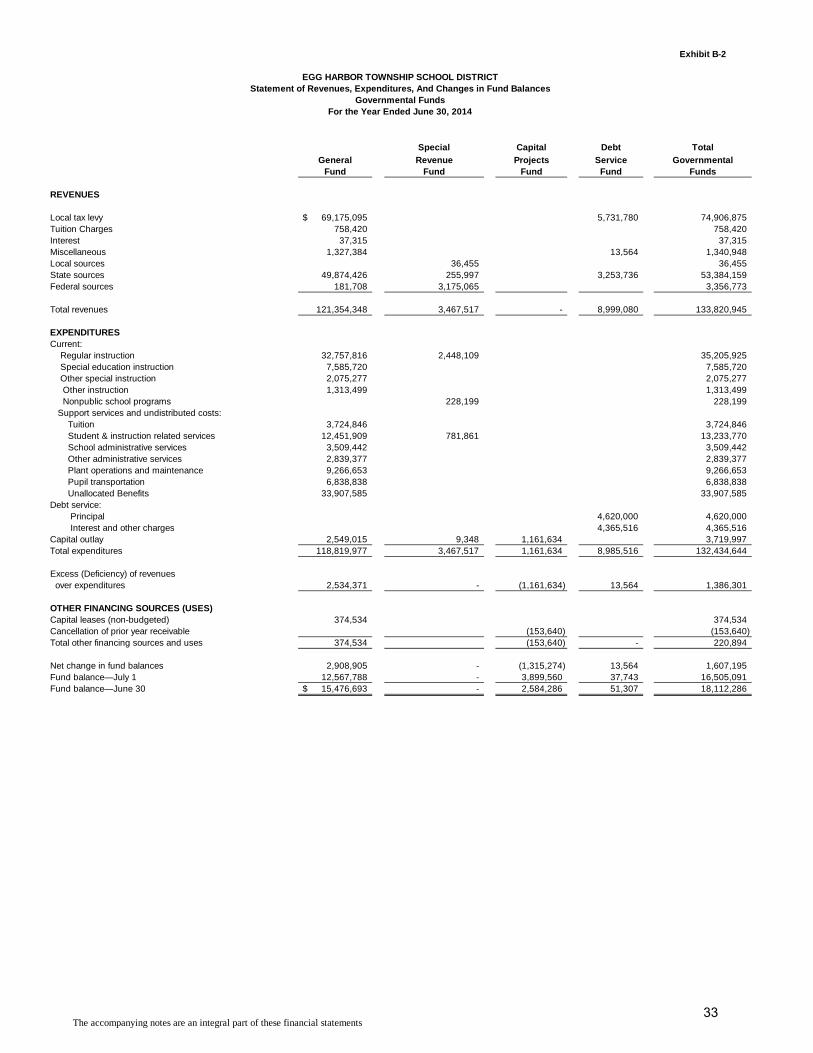
Exhibit B-2
Special Capital Debt Total
General Revenue Projects Service GovernmentalFund Fund Fund Fund Funds
REVENUES
Local tax levy 69,175,095$ 5,731,780 74,906,875 Tuition Charges 758,420 758,420 Interest 37,315 37,315 Miscellaneous 1,327,384 13,564 1,340,948 Local sources 36,455 36,455 State sources 49,874,426 255,997 3,253,736 53,384,159 Federal sources 181,708 3,175,065 3,356,773
Total revenues 121,354,348 3,467,517 - 8,999,080 133,820,945
EXPENDITURESCurrent: Regular instruction 32,757,816 2,448,109 35,205,925 Special education instruction 7,585,720 7,585,720 Other special instruction 2,075,277 2,075,277 Other instruction 1,313,499 1,313,499 Nonpublic school programs 228,199 228,199 Support services and undistributed costs: Tuition 3,724,846 3,724,846 Student & instruction related services 12,451,909 781,861 13,233,770 School administrative services 3,509,442 3,509,442 Other administrative services 2,839,377 2,839,377 Plant operations and maintenance 9,266,653 9,266,653 Pupil transportation 6,838,838 6,838,838 Unallocated Benefits 33,907,585 33,907,585 Debt service: Principal 4,620,000 4,620,000 Interest and other charges 4,365,516 4,365,516 Capital outlay 2,549,015 9,348 1,161,634 3,719,997 Total expenditures 118,819,977 3,467,517 1,161,634 8,985,516 132,434,644
Excess (Deficiency) of revenues over expenditures 2,534,371 - (1,161,634) 13,564 1,386,301
OTHER FINANCING SOURCES (USES)Capital leases (non-budgeted) 374,534 374,534 Cancellation of prior year receivable (153,640) (153,640) Total other financing sources and uses 374,534 (153,640) - 220,894
Net change in fund balances 2,908,905 - (1,315,274) 13,564 1,607,195 Fund balance—July 1 12,567,788 - 3,899,560 37,743 16,505,091 Fund balance—June 30 15,476,693$ - 2,584,286 51,307 18,112,286
EGG HARBOR TOWNSHIP SCHOOL DISTRICTStatement of Revenues, Expenditures, And Changes in Fund Balances
Governmental FundsFor the Year Ended June 30, 2014
The accompanying notes are an integral part of these financial statements33
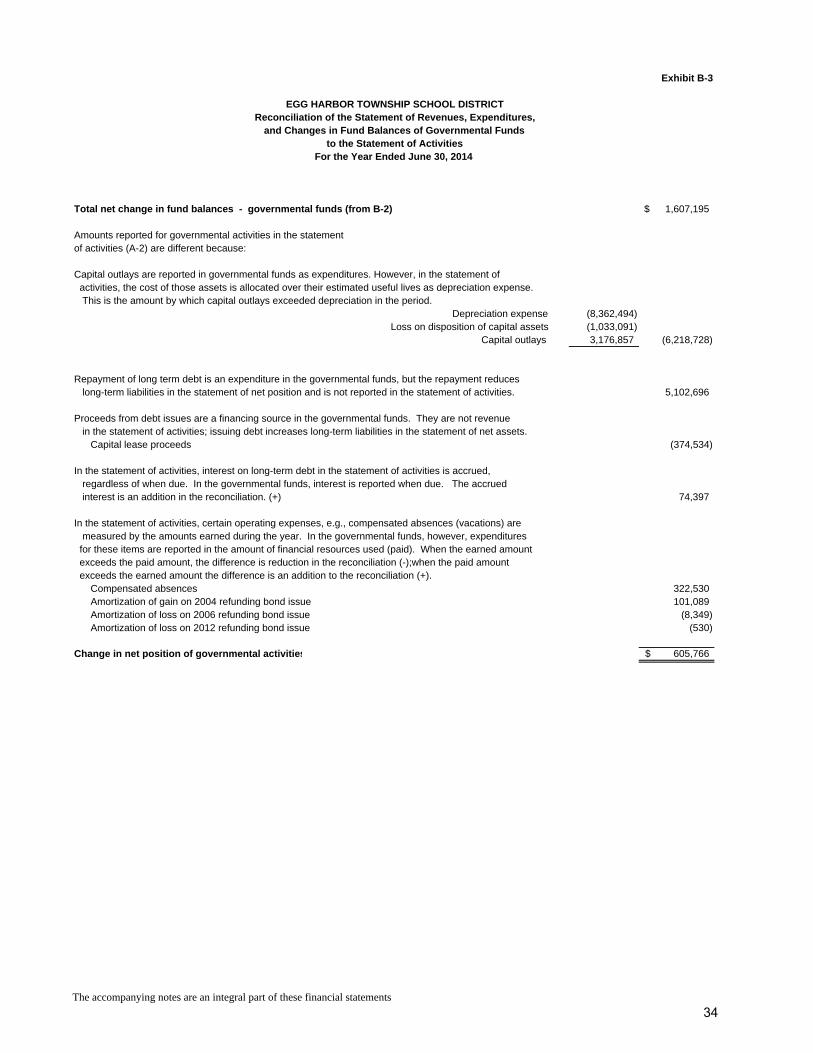
Exhibit B-3
Total net change in fund balances - governmental funds (from B-2) 1,607,195$
Amounts reported for governmental activities in the statementof activities (A-2) are different because:
Capital outlays are reported in governmental funds as expenditures. However, in the statement of activities, the cost of those assets is allocated over their estimated useful lives as depreciation expense. This is the amount by which capital outlays exceeded depreciation in the period.
Depreciation expense (8,362,494) Loss on disposition of capital assets (1,033,091)
Capital outlays 3,176,857 (6,218,728)
Repayment of long term debt is an expenditure in the governmental funds, but the repayment reduces long-term liabilities in the statement of net position and is not reported in the statement of activities. 5,102,696
Proceeds from debt issues are a financing source in the governmental funds. They are not revenue in the statement of activities; issuing debt increases long-term liabilities in the statement of net assets. Capital lease proceeds (374,534)
In the statement of activities, interest on long-term debt in the statement of activities is accrued, regardless of when due. In the governmental funds, interest is reported when due. The accrued interest is an addition in the reconciliation. (+) 74,397
In the statement of activities, certain operating expenses, e.g., compensated absences (vacations) are measured by the amounts earned during the year. In the governmental funds, however, expenditures for these items are reported in the amount of financial resources used (paid). When the earned amount exceeds the paid amount, the difference is reduction in the reconciliation (-);when the paid amount exceeds the earned amount the difference is an addition to the reconciliation (+). Compensated absences 322,530 Amortization of gain on 2004 refunding bond issue 101,089 Amortization of loss on 2006 refunding bond issue (8,349) Amortization of loss on 2012 refunding bond issue (530)
Change in net position of governmental activities 605,766$
For the Year Ended June 30, 2014
EGG HARBOR TOWNSHIP SCHOOL DISTRICTReconciliation of the Statement of Revenues, Expenditures,
and Changes in Fund Balances of Governmental Fundsto the Statement of Activities
The accompanying notes are an integral part of these financial statements
34
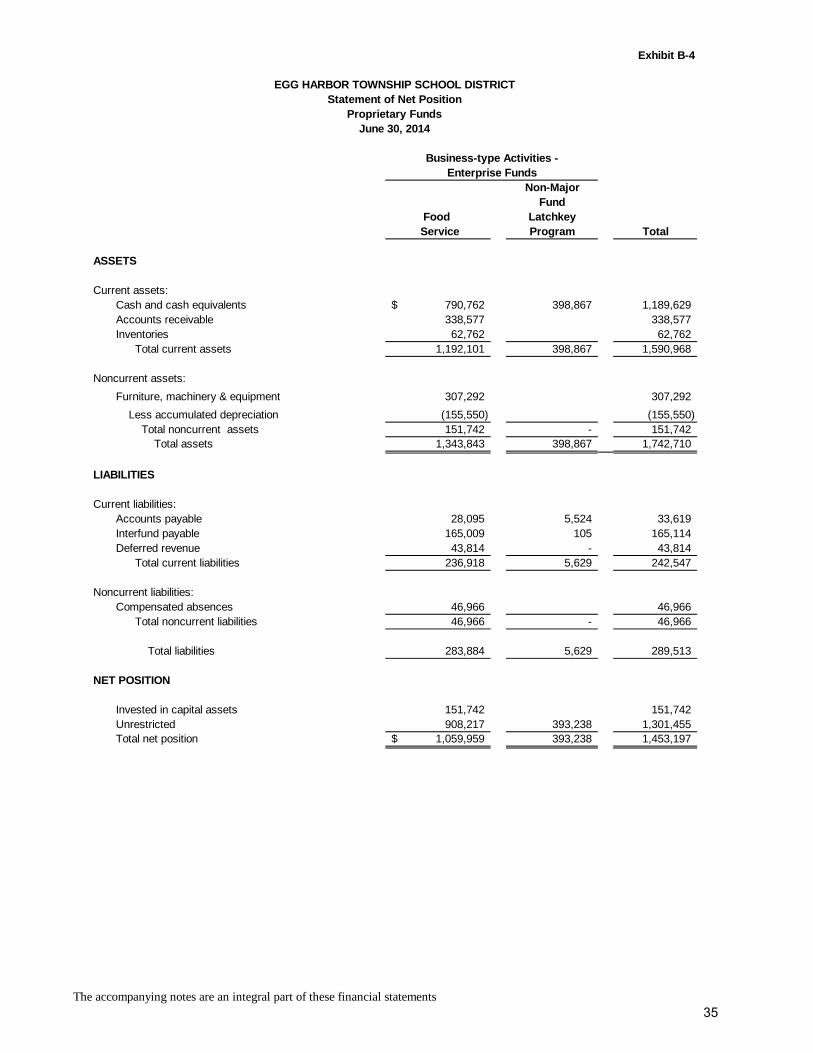
Exhibit B-4
Non-MajorFund
Food Latchkey Service Program Total
ASSETS
Current assets:Cash and cash equivalents 790,762$ 398,867 1,189,629 Accounts receivable 338,577 338,577 Inventories 62,762 62,762 Total current assets 1,192,101 398,867 1,590,968
Noncurrent assets:
Furniture, machinery & equipment 307,292 307,292
Less accumulated depreciation (155,550) (155,550) Total noncurrent assets 151,742 - 151,742 Total assets 1,343,843 398,867 1,742,710
LIABILITIES
Current liabilities:Accounts payable 28,095 5,524 33,619 Interfund payable 165,009 105 165,114 Deferred revenue 43,814 - 43,814 Total current liabilities 236,918 5,629 242,547
Noncurrent liabilities:Compensated absences 46,966 46,966 Total noncurrent liabilities 46,966 - 46,966
Total liabilities 283,884 5,629 289,513
NET POSITION
Invested in capital assets 151,742 151,742 Unrestricted 908,217 393,238 1,301,455 Total net position 1,059,959$ 393,238 1,453,197
EGG HARBOR TOWNSHIP SCHOOL DISTRICTStatement of Net Position
June 30, 2014Proprietary Funds
Business-type Activities -Enterprise Funds
The accompanying notes are an integral part of these financial statements35
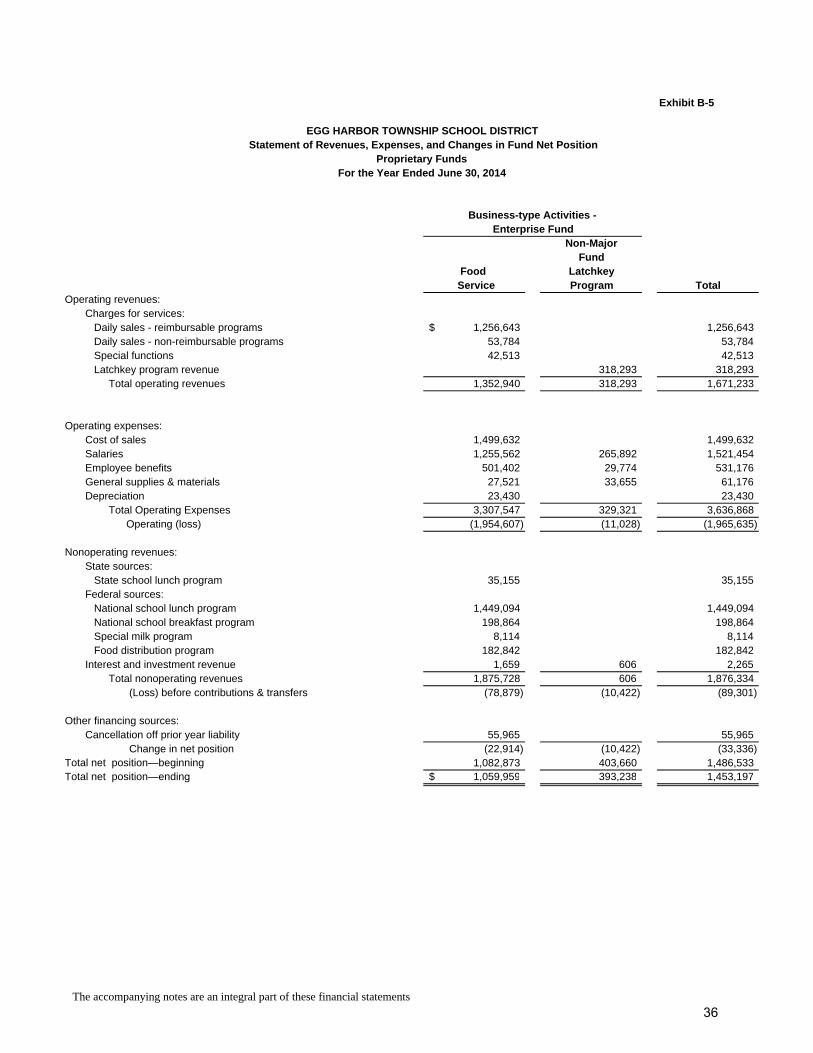
Exhibit B-5
Non-MajorFund
Food Latchkey Service Program Total
Operating revenues:Charges for services: Daily sales - reimbursable programs 1,256,643$ 1,256,643 Daily sales - non-reimbursable programs 53,784 53,784 Special functions 42,513 42,513 Latchkey program revenue 318,293 318,293 Total operating revenues 1,352,940 318,293 1,671,233
Operating expenses:Cost of sales 1,499,632 1,499,632 Salaries 1,255,562 265,892 1,521,454 Employee benefits 501,402 29,774 531,176 General supplies & materials 27,521 33,655 61,176 Depreciation 23,430 23,430 Total Operating Expenses 3,307,547 329,321 3,636,868 Operating (loss) (1,954,607) (11,028) (1,965,635)
Nonoperating revenues:State sources: State school lunch program 35,155 35,155 Federal sources: National school lunch program 1,449,094 1,449,094 National school breakfast program 198,864 198,864 Special milk program 8,114 8,114 Food distribution program 182,842 182,842 Interest and investment revenue 1,659 606 2,265 Total nonoperating revenues 1,875,728 606 1,876,334
(Loss) before contributions & transfers (78,879) (10,422) (89,301)
Other financing sources:Cancellation off prior year liability 55,965 55,965
(22,914) (10,422) (33,336) 1,082,873 403,660 1,486,533
Change in net position Total net position—beginningTotal net position—ending 1,059,959$ 393,238 1,453,197
EGG HARBOR TOWNSHIP SCHOOL DISTRICTStatement of Revenues, Expenses, and Changes in Fund Net Position
Proprietary FundsFor the Year Ended June 30, 2014
Business-type Activities - Enterprise Fund
The accompanying notes are an integral part of these financial statements
36
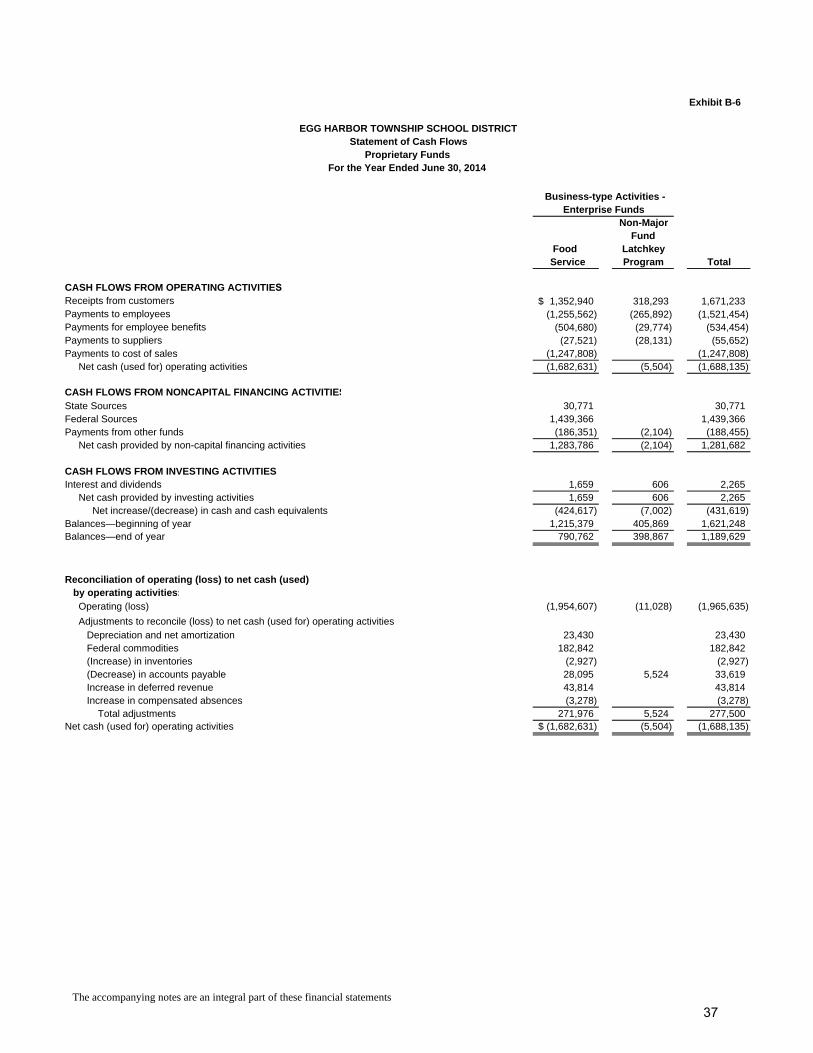
Exhibit B-6
EGG HARBOR TOWNSHIP SCHOOL DISTRICT Statement of Cash Flows
Proprietary Funds
Non-MajorFund
Food Latchkey Service Program Total
1,352,940$ 318,293 1,671,233 (1,255,562) (265,892) (1,521,454)
(504,680) (29,774) (534,454) (27,521) (28,131) (55,652)
CASH FLOWS FROM OPERATING ACTIVITIES Receipts from customersPayments to employeesPayments for employee benefitsPayments to suppliersPayments to cost of sales (1,247,808) (1,247,808) Net cash (used for) operating activities (1,682,631) (5,504) (1,688,135)
CASH FLOWS FROM NONCAPITAL FINANCING ACTIVITIESState Sources 30,771 30,771 Federal Sources 1,439,366 1,439,366 Payments from other funds (186,351) (2,104) (188,455) Net cash provided by non-capital financing activities 1,283,786 (2,104) 1,281,682
CASH FLOWS FROM INVESTING ACTIVITIESInterest and dividends 1,659 606 2,265 Net cash provided by investing activities 1,659 606 2,265 Net increase/(decrease) in cash and cash equivalents (424,617) (7,002) (431,619) Balances—beginning of year 1,215,379 405,869 1,621,248 Balances—end of year 790,762 398,867 1,189,629
Reconciliation of operating (loss) to net cash (used) by operating activities: Operating (loss) (1,954,607) (11,028) (1,965,635)
Adjustments to reconcile (loss) to net cash (used for) operating activities Depreciation and net amortization 23,430 23,430 Federal commodities 182,842 182,842 (Increase) in inventories (2,927) (2,927) (Decrease) in accounts payable 28,095 5,524 33,619 Increase in deferred revenue 43,814 43,814 Increase in compensated absences (3,278) (3,278) Total adjustments 271,976 5,524 277,500 Net cash (used for) operating activities (1,682,631)$ (5,504) (1,688,135)
For the Year Ended June 30, 2014
Business-type Activities -Enterprise Funds
The accompanying notes are an integral part of these financial statements
37
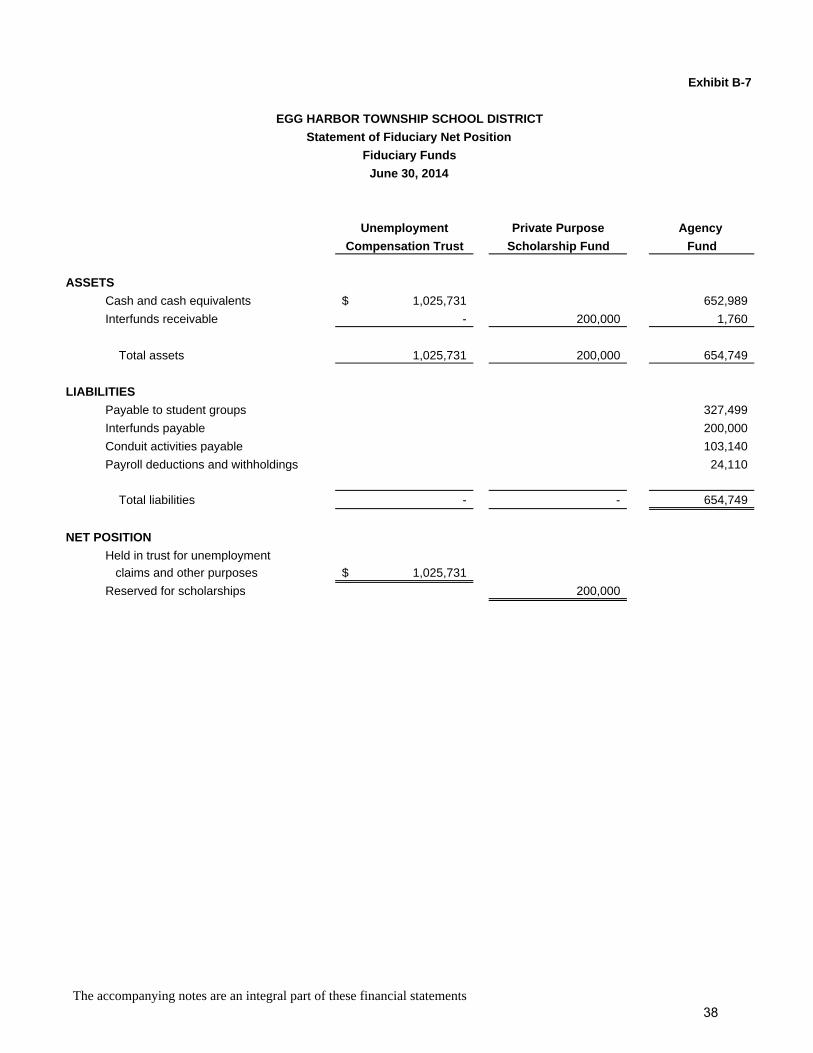
Exhibit B-7
Unemployment Private Purpose Agency
Compensation Trust Scholarship Fund Fund
ASSETS
Cash and cash equivalents 1,025,731$ 652,989
Interfunds receivable - 200,000 1,760
Total assets 1,025,731 200,000 654,749
LIABILITIES
Payable to student groups 327,499
Interfunds payable 200,000
Conduit activities payable 103,140
Payroll deductions and withholdings 24,110
Total liabilities - - 654,749
NET POSITION
Held in trust for unemployment
claims and other purposes 1,025,731$
Reserved for scholarships 200,000
EGG HARBOR TOWNSHIP SCHOOL DISTRICT
Statement of Fiduciary Net Position
Fiduciary Funds
June 30, 2014
The accompanying notes are an integral part of these financial statements38
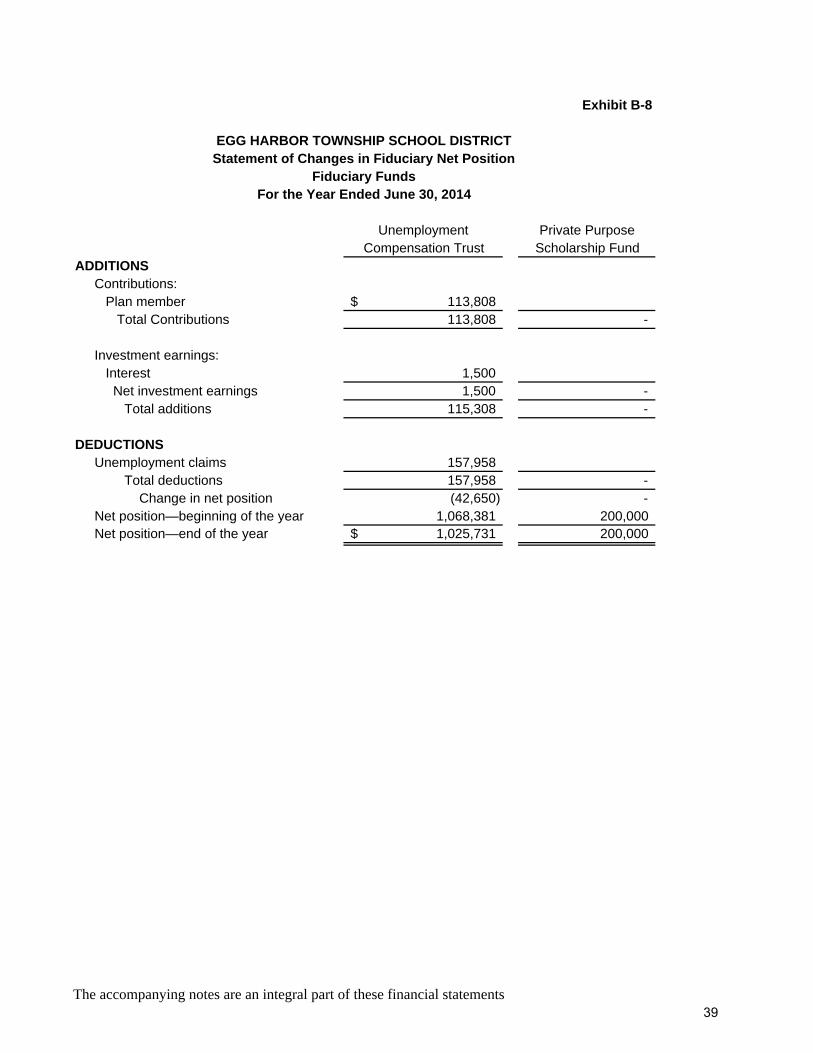
Exhibit B-8
Unemployment Private PurposeCompensation Trust Scholarship Fund
ADDITIONSContributions: Plan member 113,808$ Total Contributions 113,808 -
Investment earnings: Interest 1,500 Net investment earnings 1,500 - Total additions 115,308 -
DEDUCTIONSUnemployment claims 157,958 Total deductions 157,958 - Change in net position (42,650) - Net position—beginning of the year 1,068,381 200,000 Net position—end of the year 1,025,731$ 200,000
EGG HARBOR TOWNSHIP SCHOOL DISTRICTStatement of Changes in Fiduciary Net Position
Fiduciary FundsFor the Year Ended June 30, 2014
The accompanying notes are an integral part of these financial statements39

Notes to the Financial Statements

{THIS PAGE IS INTENTIONALLY LEFT BLANK}
Egg Harbor Township School District Notes to Financial Statements June 30, 2014
NOTE 1. SUMMARY OF SIGNIFICANT ACCOUNTING POLICIES The Egg Harbor Township School District is an instrumentality of the State of New Jersey, established to function as an educational institution. The Board consists of elected officials and is responsible for the fiscal control of the District. A superintendent is appointed by the Board and is responsible for the administrative control of the District. The financial statements of the Board of Education (Board) of the Egg Harbor Township School District (District) have been prepared in conformity with generally accepted accounting principles (GAAP) as applied to governmental units. The Governmental Accounting Standards Board (GASB) is the accepted standard-setting body for establishing governmental accounting and financial reporting principles. In its accounting and financial reporting, the District follows the pronouncements of the Governmental Accounting Standards Board (GASB). The more significant accounting policies established in GAAP and used by the District are discussed below. A. REPORTING ENTITY: The Egg Harbor Township School District is a Type II district located in the County of Atlantic, State of New Jersey. As a Type II District, the School District functions independently through a Board of Education. The board is comprised of nine members elected to three-year terms. The purpose of the district is to educate students in grades K-12. The Egg Harbor Township School District had an enrollment at June 30, 2014 and 2013 of 7,660 and 7,804 students. The primary criterion for including activities within the District's reporting entity, as set forth in Section 2100 of the GASB Codification of Governmental Accounting and Financial Reporting Standards, is whether:
the organization is legally separate (can sue or be sued in their own name) the District holds the corporate powers of the organization the District appoints a voting majority of the organization’s board the District is able to impose its will on the organization the organization has the potential to impose a financial benefit/burden on the District there is a fiscal dependency by the organization on the District
Based on the aforementioned criteria, the District has no component units. B. BASIC FINANCIAL STATEMENTS – GOVERNMENT-WIDE STATEMENTS: The District’s basic financial statements include both government-wide (reporting the District as a whole) and fund financial statements (reporting the District’s major funds). Both the government-wide and fund financial statements categorize primary activities as either governmental or business type. The District’s general, special revenue, capital projects, and debt service activities are classified as governmental activities. The District’s food service and Kids Klub (latchkey) program are classified as business-type activities. In the governmental-wide Statement of Net Position, both the governmental and business-type activities columns (a) are presented on a consolidated basis by column, (b) and are reported on a full accrual, economic resource basis, which recognizes all long-term assets and receivables as well as long-term debt and obligations. The District’s net position are reported in three parts-invested in capital assets, net of related debt; restricted net position; and unrestricted net position. The District first utilizes restricted resources to finance qualifying activities.
40
Egg Harbor Township School District Notes to Financial Statements June 30, 2014
The government-wide Statement of Activities reports both the gross and net cost of each of the District’s functions and business-type activities (food service and latchkey). The functions are also supported by general government revenues (property taxes, tuition, certain intergovernmental revenues, etc.). The Statement of Activities reduces gross expenses (including depreciation) by related program revenues, operating and capital grants. Program revenues must be directly associated with the function (regular instruction, vocational programs, student & instruction related services, etc.) or a business-type activity. Operating grants include operating-specific and discretionary (either operating or capital) grants while the capital grants column reflects capital-specific grants. The net costs (by function or business-type activity) are normally covered by general revenue (property taxes, tuition, interest income, etc.).
a. The District does allocate indirect costs such as on-behalf TPAF Pension Contributions, and Reimbursed TPAF Social Security Contributions.
The government-wide focus is more on the sustainability of the District as an entity and the change in the District’s net position resulting from the current year’s activities. Fiduciary funds are excluded from the government-wide financial statements. C. BASIC FINANCIAL STATEMENTS – FUND FINANCIAL STATEMENTS The financial transactions of the District are reported in individual funds in the fund financial statements. Each fund is accounted for by providing a separate set of self-balancing accounts that comprise its assets, liabilities, reserves, fund equity, revenues and expenditures/expenses. The various funds are reported by generic classification within the financial statements. The emphasis in fund financial statements is on the major funds in either the governmental or business-type activities categories. Nonmajor funds by category are summarized into a single column. GASBS sets forth minimum criteria (percentage of the assets, liabilities, revenues or expenditures/expenses of either fund category or the governmental and enterprise combined) for the determination of major funds. The nonmajor funds are combined in a column in the fund financial statements. The State of New Jersey Department of Education has mandated that all New Jersey School districts must report all governmental funds a major, regardless of the fund meeting the GASB definition of a major fund. However, the criteria are applied to proprietary funds. The following fund types are used by the District:
1. Governmental Funds: The focus of the governmental funds’ measurement (in the fund statements) is upon determination of financial position and changes in financial position (sources, uses, and balances of financial resources) rather than upon net income. The following is a description of the governmental funds of the District.
a. General fund is the general operating fund of the District. It is used to account for all financial resources except those required to be accounted for in another fund.
b. Special revenue funds are used to account for the proceeds of specific revenue sources that are legally restricted to expenditures for a specific purpose. The special revenue fund is specifically used to account for state and federal grant monies that have been allocated to the District.
c. Capital projects funds are used to account for all financial resources to be used for the acquisition or construction of major capital facilities. The financial resources are derived from temporary notes or serial bonds that are specifically authorized by the voters as a separate question on the ballot either during the annual election or at a special election.
41
Egg Harbor Township School District Notes to Financial Statements June 30, 2014
d. Debt service funds are used to account for the accumulation of resources for, and the payment of principal and interest on bonds issued to finance major property acquisition, construction and improvement programs.
Fund Balances – Governmental Funds In the fund financial statements, governmental funds report the following classifications of fund balance:
Nonspendable – includes amounts that cannot be spent because they are either not spendable in form or are legally or contractually required to be maintained intact.
Restricted – includes amounts restricted by external sources (creditors, laws of other
governments, etc.) or by constitutional provision or enabling legislation.
Committed – includes amounts that can only be used for specific purposes. Committed fund balance is reported pursuant to resolutions passed by the Board of Education, the District’s highest level of decision making authority. Commitments may be modified or rescinded only through resolutions approved by the Board of Education.
Assigned – includes amounts that the District intends to use for a specific purpose, but do not meet the definition of restricted or committed fund balance. Under the District’s policy, amounts may be assigned by the Business Administrator.
Unassigned – includes amounts that have not been assigned to other funds or restricted, committed or assigned to a specific purpose within the General Fund. The District reports all amounts that meet the unrestricted General Fund Balance Policy described below as unassigned:
The details of the fund balances are included in the Governmental Funds Balance Sheet. When an expenditure is incurred for purposes for which both restricted and unrestricted fund balance is available, the District considers restricted funds to have been spent first. When an expenditure is incurred for which committed, assigned, or unassigned fund balance are available, the District considers amounts to have been spent first out of committed funds, then assigned funds, and finally unassigned funds, as needed. 2. Proprietary Funds: The focus of proprietary fund measurement is upon determination of operating income, changes in net position, financial position, and cash flows. The generally accepted accounting principles applicable are those similar to businesses in the private sector. The following is a description of the proprietary funds of the District:
a. Enterprise funds are required to be used to account for operations for which a fee is charged to external users for goods or services and the activity (a) is financed with debt that is solely secured by a pledge of the net revenues, (b) has third party requirements that the cost of providing services, including capital costs, be recovered with fees and charges or (c) establishes fees and charges based on a pricing policy designated to recover similar costs.
Food Services Fund – provides for the operation of food services in all schools within the school district. Latchkey – accounts for the operation of an after school program for all children within the district.
42
Egg Harbor Township School District Notes to Financial Statements June 30, 2014
3. Fiduciary Funds: Fiduciary funds are used to report assets held in a trustee or agency capacity for others and therefore are not available to support District programs. The reporting focus is on net position and changes in net position, and are reported using accounting principles similar to proprietary funds. The District’s fiduciary funds are presented in the fiduciary fund financial statements by type (pension, private purpose and agency). Since by definition these assets are being held for the benefit of a third party (other local governments), private parties, pension participants, etc.) and cannot be used to address activities or obligations of the government, these funds are not incorporated into the government-wide statements. D. BASIS OF ACCOUNTING Basis of accounting refers to the point at which revenues or expenditures/expenses are recognized in the accounts and reported in the financial statements. It relates to the timing of the measurements made regardless of the measurement focus applied. 1. Accrual: Both governmental and business-type activities in the government-wide financial statements and the proprietary and fiduciary fund financial statements are presented on the accrual basis of accounting. Revenues are recognized when earned and expenses are recognized when incurred. 2. Modified Accrual: The governmental fund financial statements are presented on the modified accrual basis of accounting. Under the modified accrual basis of accounting, revenues are recorded when susceptible to accrual; i.e., both measurable and available. “Available” means collectible within the current period or within 60 days after year end. Expenditures are generally recognized under the modified accrual basis of accounting when the related liability is incurred. The exception to this general rule is that principal and interest on general obligation long-term debt, if any, is recognized when due. E. FINANCIAL STATEMENT AMOUNTS 1. Cash and Cash Equivalents: Cash and cash equivalents include petty cash, change funds, cash in banks and all highly liquid investments with a maturity of three months or less at the time of purchase and are stated at cost plus accrued interest. U.S. Treasury and agency obligations and certificates of deposit with maturities of one year or less when purchased are stated at cost. All other investments are stated at fair value. New Jersey school districts are limited as to the types of investments and types of financial institutions they may invest in. New Jersey statute 18A:20-37 provides a list of permissible investments that may be purchased by New Jersey school districts. Additionally, the District has adopted a cash management plan that requires it to deposit public funds in public depositories protected from loss under the provisions of the Governmental Unit Deposit Protection Act (“GUDPA”). GUDPA was enacted in 1970 to protect Governmental Units from a loss of funds on deposit with a failed banking institution in New Jersey.
43
Egg Harbor Township School District Notes to Financial Statements June 30, 2014
NJSA 17:9-41 et. seq. establishes the requirements for the security of deposits of governmental units. The statute requires that no governmental unit shall deposit public funds in a public depository unless such funds are secured in accordance with the Act. Public depositories include Savings and Loan institutions, banks (both state and national banks) and savings banks the deposits of which are federally insured. All public depositories must pledge collateral, having a market value at least equal to five percent of the average daily balance of collected public funds, to secure the deposits of Governmental Units. If a public depository fails, the collateral it has pledged, plus the collateral of all other public depositories, is available to pay the full amount of their deposits to the Governmental units. 2. Investments: Investments, including deferred compensation and pension funds, are stated at fair value, (quoted market price or the best available estimate). Interest earned in the Capital Projects Fund is recognized in the District’s General Fund. 3. Inventories: Inventories in the general fund consist of expendable supplies held for the District’s use and are carried at cost using the first-in, first-out method. Inventories in the enterprise fund are valued at cost, which approximates market, using the first-in, first –out method. As of June 30, 2014, the District did not have inventory in the general fund and had the following inventory in the enterprise fund:
Food $ 55,698 Supplies 7,064 $ 62,762
The value of Federal donated commodities as reflected on Schedule A (required by the Single Audit Law of 1996) is the difference between market value and cost of the commodities at the date of purchase and has been included as an item of nonoperating revenue in the financial statements. The value of commodities included in the food service inventory on June 30, 2014 is $43,814. 4. Capital Assets: Capital assets purchased or acquired with an original cost of $2,000 or more are reported at historical cost or estimated historical cost. Contributed assets are reported at fair market value as of the date received. Additions, improvements and other capital outlays that significantly extend the useful life of an asset are capitalized. Other costs incurred for repairs and maintenance are expensed as incurred. Depreciation on all assets is provided on the straight-line basis over the following estimated useful lives:
Buildings 20-50 years Machinery and equipment 5-10 years Improvements 10-20 years
Infrastructure assets include roads, parking lots, underground pipe, etc. All infrastructure assets are reported in the financial statements and are being depreciated over their useful lives. 5. Revenues: Substantially all governmental fund revenues are accrued. Property taxes are susceptible to accrual and under New Jersey State Statutes a municipality is required to remit to its school district the entire balance
44
Egg Harbor Township School District Notes to Financial Statements June 30, 2014
of taxes in the amount voted upon or certified, prior to the end of the school year. The District records the entire approved tax levy as revenue (accrued) at the start of the fiscal year, since the revenue is both measurable and available. Subsidies and grants to proprietary funds, which finance either capital or current operations, are reported as non operating revenue. In respect to grant revenues, the provider recognizes liabilities and expenses and recipient recognizes receivables and revenue when the applicable eligibility requirements, including time requirements are met. Resources transmitted before the eligibility requirements are met are reported as advances by the provider and deferred revenue by the recipient. Program revenues, including tuition revenue, are reported as reductions to expenses in the Statement of Activities. 6. Expenditures: Expenditures are recognized when the related fund liability is incurred. Inventory costs are reported in the period when inventory items are used, rather than in the period purchased. 7. Compensated Absences: Compensated absences are those absences for which employees will be paid, such as vacation, sick leave, and sabbatical leave. A liability for compensated absences that are attributable to services already rendered, and that are not contingent on a specific event that is outside the control of the District and its employees, is accrued as the employees earn the rights to the benefits. Compensated absences that relate to future services, or that are contingent on a specific event that is outside the control of the District and its employees, are accounted for in the period in which such services are rendered or in which such events take place. In governmental and similar trust funds, compensated absences that are expected to be liquidated with expendable available financial resources are reported as an expenditure and fund liability in the fund that will pay for the compensated absences. The remainder of the compensated absences liability is reported in the District-wide Financial Statements as a Governmental Activity. In proprietary and similar trust funds, compensated absences are recorded as an expense and liability of the fund that will pay for them. 8. Interfund Activity: Interfund activity is reported as either loans, services provided, reimbursements or transfers. Loans are reported as interfund receivables and payables as appropriate and are subject to elimination upon consolidation. Services provided, deemed to be at market or near market rates, are treated as revenues and expenditures/expenses. Reimbursements are when one fund incurs a cost, charges the appropriate benefiting fund and reduces its related costs as reimbursement. All other interfund transactions are treated as transfers. Transfers between governmental or proprietary funds are netted as part of the reconciliation to the government-wide financial statements. All funds internal activity is eliminated when carried to the Government-wide statements. 9. Budgets/Budgetary Control: Annual appropriated budgets are prepared in the spring of each year for the general, special revenue and debt service funds. The budgets are submitted to the county office for approval and, as long as the District budget is within State mandated CAPs, there is no public vote on the budget. If the budget exceeds State mandated CAPs, the voters have an opportunity approve or reject the budget at the regular election held in November. Budgets are prepared using the modified accrual basis of accounting, except for the special revenue fund as described later. The legal level of budgetary control is established
45
Egg Harbor Township School District Notes to Financial Statements June 30, 2014
at line item accounts within each fund. Line item accounts are defined as the lowest (most specific) level of detail as established pursuant to the minimum chart of accounts referenced in N.J.A.C. 6:23-2.2(f). Transfers of appropriations may be made by School Board resolution at any time during the fiscal year and are subject to two-thirds majority vote by the School Board and under certain circumstances require approval by the Executive County Superintendent of Schools. The Board of Education approved the following significant budgetary appropriation transfers during the 2014 fiscal year:
Account Name Amount Salaries of Teachers – Grades 1-5 ($177,000)Salaries of Teachers – Grades 9-12 (99,235)Learning and Language Disabilities – Salaries 150,000Tuition to CSSD & Regional Day Schools (246,000)Other Support Services – Students – Extra Services Salaries 203,608Required Maintenance for School Facilities Cleaning, Repair, and Maintenance Services 106,374Custodial Services Energy (Electricity) (129,200) Energy (Natural Gas) 120,000Student Transportation Services Salaries (Between Home and School)-Regular (150,000) Salaries (Other Than Between Home and School) 128,357 Contracted Srvs (Between Home and School)-Joint Agree. 344,230 Contracted Srvs (Between Home and School)-Vendors (428,230) Contracted Srvs (Special Ed Students)-Joint Agree. 197,000Facilities Acquisition and Construction Services: Construction Services 1,836,396 Other Objects-Debt Service Assessment (193,844) Other Objects (171,121)
Formal budgetary integration into the accounting system is employed as a management control device during the year. For governmental funds there are no substantial differences between the budgetary basis of accounting and generally accepted accounting principles with the exception of the legally mandated revenue recognition of one or more June state aid payments for budgetary purposes only and the special revenue fund as noted below. Encumbrance accounting is also employed as an extension of formal budgetary integration in the governmental fund types. Unencumbered appropriations lapse at fiscal year end. The accounting records of the special revenue fund are maintained on the grant accounting budgetary basis. The grant accounting budgetary basis differs from GAAP in that the grant accounting budgetary basis recognizes encumbrances as expenditures and also recognizes the related revenues, whereas the GAAP basis does not. Sufficient supplemental records are maintained to allow for the presentation of GAAP basis financial reports. 10. Tuition Receivable Tuition charges were established by the Board of Education based on estimated costs. The charges are subject to adjustment when the final costs have been determined.
46
Egg Harbor Township School District Notes to Financial Statements June 30, 2014
11. Tuition Payable Tuition charges for the fiscal year 2013/14 were based on rates established by the receiving district. These rates are subject to change when the actual costs have been determined. 12. Use of Estimates The preparation of financial statements in conformity with generally accepted accounting principles requires management to make estimates and assumptions that affect certain reported amounts and disclosures. Accordingly, actual results could differ from those results. 13. Allocation of Costs In the government-wide statement of activities, the District has allocated unallocated benefits to various programs based on the original budgetary expenditures by program. F. RECENT ACCOUNTING PRONOUNCEMENTS In June 2012, the Governmental Accounting Standards Board (GASB) issued Statement No. 68, “Accounting and Financial Reporting for Pensions – an amendment of GASB Statement No 27”. This statement is effective for fiscal periods beginning after June 15, 2014. Although not determinable, the impact of this statement on the net position of the entity is anticipated to be significant. In January 2013, the Governmental Accounting Standards Board (GASB) issued Statement No. 69 “Government Combinations and Disposals of Government Operations”. This statement, which is effective for fiscal periods beginning after December 15, 2013, will not have any effect on the District’s financial reporting. In April 2013, the Governmental Accounting Standards Board (GASB) issued Statement No. 70 “Accounting and Financial Reporting for Nonexchange Financial Guarantees”. This statement, which is effective for fiscal periods beginning after June 15, 2013, will not have any impact on the District’s financial statements. In November 2013, Governmental Accounting Standards Board (GASB) issued Statement No. 71 “Pension Transition for Contributions Made Subsequent to the Measurement Date-an amendment of GASB Statement No. 68”. The provisions of this statement are required to be applied simultaneously with the provisions of Statement 68 which is effective for periods beginning after June 15, 2014. Although not determinable, the impact of this statement on the net position of the entity is anticipated to be significant. NOTE 2. INVESTMENTS As of June 30, 2014, the District had no investments. Interest Rate Risk. The District does not have a formal investment policy that limits investment maturities as a means of managing its exposure to fair value losses arising from increasing interest rates. However, New Jersey Statutes 18A:20-37 limits the length of time for most investments to 397 days. Credit Risk. New Jersey Statutes 18A:20-37 limits District investments to those specified in the Statutes. The type of allowable investments are Bonds of the United States of America or of the District or the local units in which the District is located; obligations of federal agencies not exceeding 397 days; government
47
Egg Harbor Township School District Notes to Financial Statements June 30, 2014
money market mutual funds; the State of New Jersey Cash Management Plan; local government investment pools; or repurchase of fully collateralized securities. Concentration of Credit Risk. The District places no limit on the amount the District may invest in any one issuer. NOTE 3. CASH Custodial Credit Risk – Deposits. Custodial credit risk is the risk that in the event of a bank failure, the government’s deposits may not be returned to it. The District’s policy is based on New Jersey Statutes requiring cash be deposited only in New Jersey based banking institutions that participate in the New Jersey Governmental Depository Protection Act (GUDPA) which mandates the collateralization of all government deposits, or in qualified investments established in New Jersey Statutes 18A:20-37 that are treated as cash equivalents. As of June 30, 2014, $2,380,877 of the District’s bank balance of $20,360,038 was exposed to custodial credit risk.
{This space intentionally left blank}
48
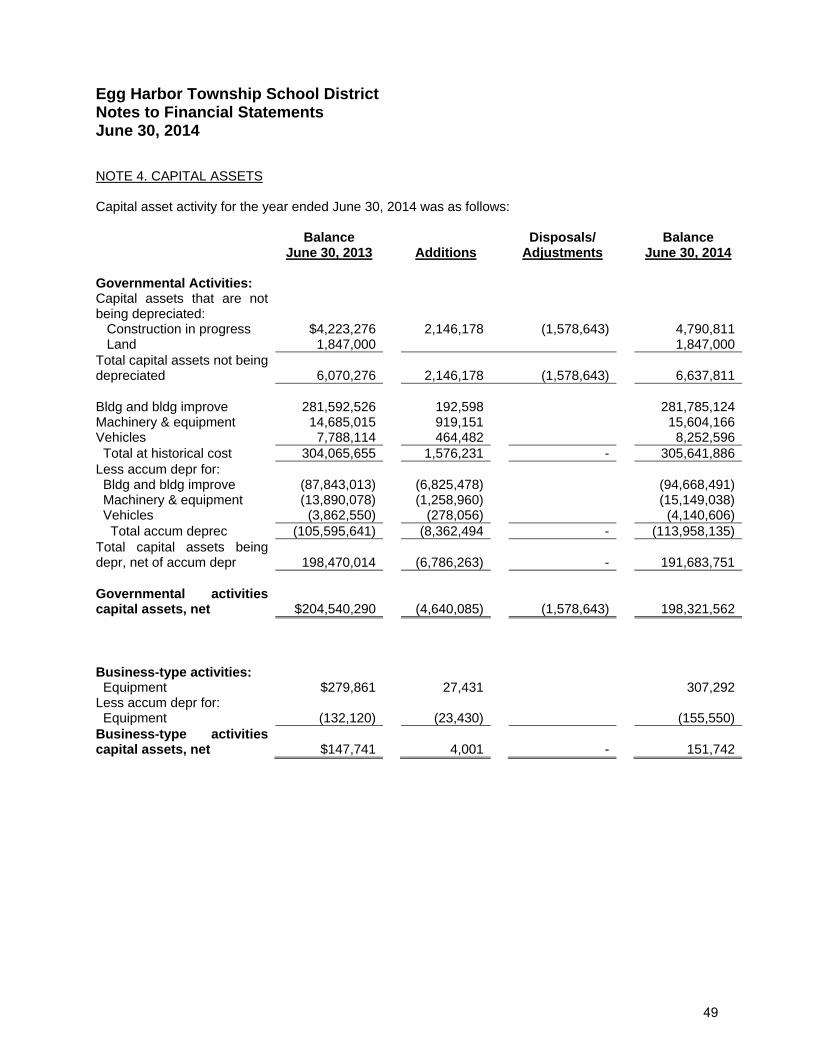
Egg Harbor Township School District Notes to Financial Statements June 30, 2014
NOTE 4. CAPITAL ASSETS Capital asset activity for the year ended June 30, 2014 was as follows: Balance
June 30, 2013 Additions
Disposals/ Adjustments
Balance June 30, 2014
Governmental Activities: Capital assets that are not being depreciated:
Construction in progress $4,223,276 2,146,178 (1,578,643) 4,790,811 Land 1,847,000 1,847,000Total capital assets not being depreciated 6,070,276 2,146,178 (1,578,643) 6,637,811 Bldg and bldg improve 281,592,526 192,598 281,785,124Machinery & equipment 14,685,015 919,151 15,604,166Vehicles 7,788,114 464,482 8,252,596 Total at historical cost 304,065,655 1,576,231 - 305,641,886Less accum depr for: Bldg and bldg improve (87,843,013) (6,825,478) (94,668,491) Machinery & equipment (13,890,078) (1,258,960) (15,149,038) Vehicles (3,862,550) (278,056) (4,140,606) Total accum deprec (105,595,641) (8,362,494 - (113,958,135)Total capital assets being depr, net of accum depr 198,470,014 (6,786,263) - 191,683,751 Governmental activities capital assets, net $204,540,290 (4,640,085) (1,578,643) 198,321,562 Business-type activities: Equipment $279,861 27,431 307,292Less accum depr for: Equipment (132,120) (23,430) (155,550)Business-type activities capital assets, net $147,741 4,001 - 151,742
49
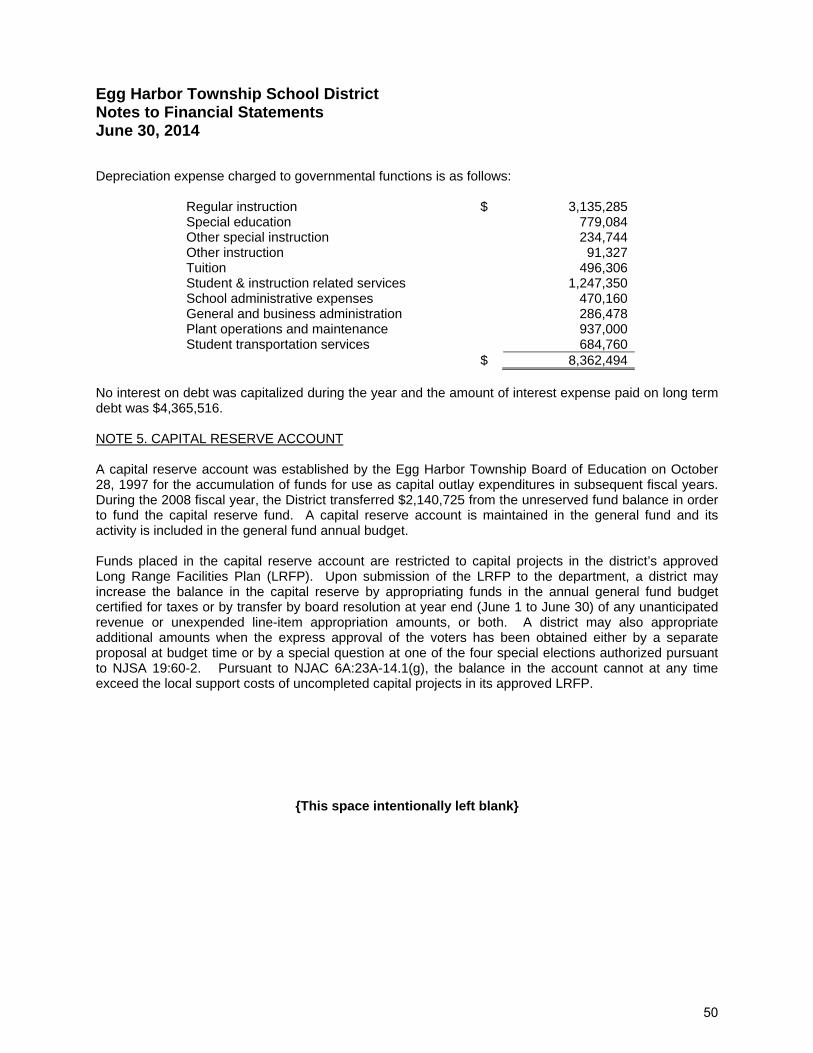
Egg Harbor Township School District Notes to Financial Statements June 30, 2014
Depreciation expense charged to governmental functions is as follows:
Regular instruction $ 3,135,285 Special education 779,084 Other special instruction 234,744 Other instruction 91,327 Tuition 496,306 Student & instruction related services 1,247,350 School administrative expenses 470,160 General and business administration 286,478 Plant operations and maintenance 937,000 Student transportation services 684,760 $ 8,362,494
No interest on debt was capitalized during the year and the amount of interest expense paid on long term debt was $4,365,516. NOTE 5. CAPITAL RESERVE ACCOUNT A capital reserve account was established by the Egg Harbor Township Board of Education on October 28, 1997 for the accumulation of funds for use as capital outlay expenditures in subsequent fiscal years. During the 2008 fiscal year, the District transferred $2,140,725 from the unreserved fund balance in order to fund the capital reserve fund. A capital reserve account is maintained in the general fund and its activity is included in the general fund annual budget. Funds placed in the capital reserve account are restricted to capital projects in the district’s approved Long Range Facilities Plan (LRFP). Upon submission of the LRFP to the department, a district may increase the balance in the capital reserve by appropriating funds in the annual general fund budget certified for taxes or by transfer by board resolution at year end (June 1 to June 30) of any unanticipated revenue or unexpended line-item appropriation amounts, or both. A district may also appropriate additional amounts when the express approval of the voters has been obtained either by a separate proposal at budget time or by a special question at one of the four special elections authorized pursuant to NJSA 19:60-2. Pursuant to NJAC 6A:23A-14.1(g), the balance in the account cannot at any time exceed the local support costs of uncompleted capital projects in its approved LRFP.
{This space intentionally left blank}
50
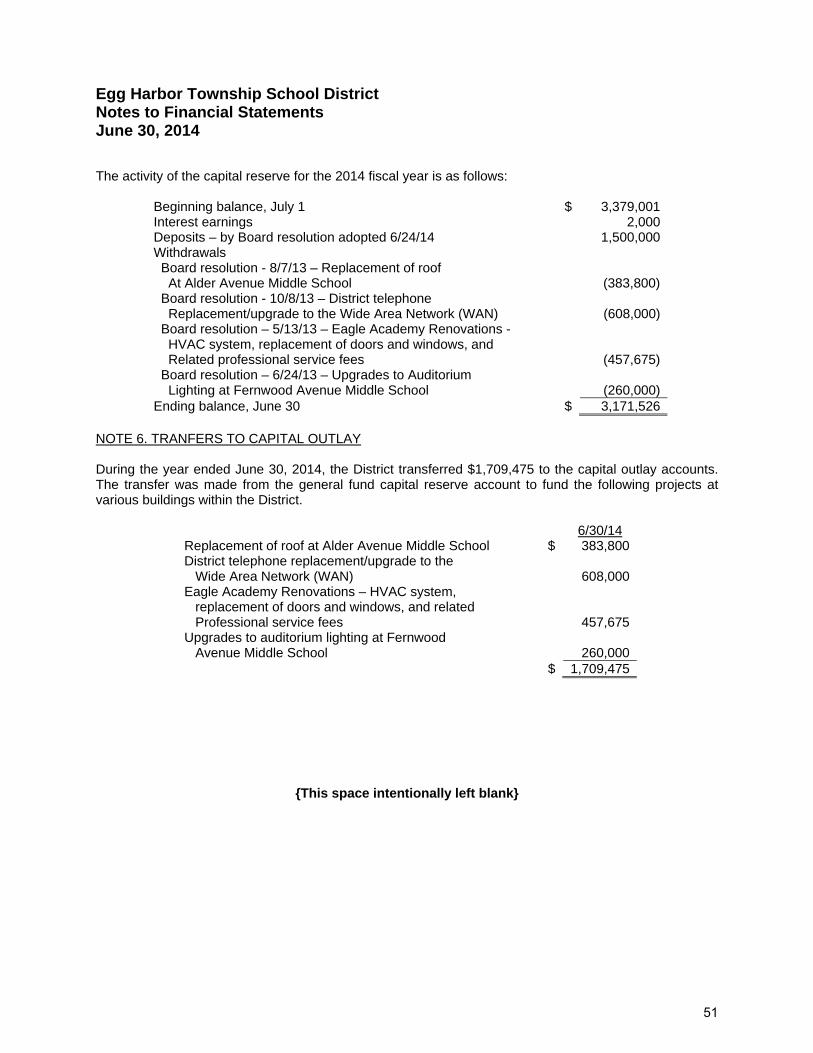
Egg Harbor Township School District Notes to Financial Statements June 30, 2014
The activity of the capital reserve for the 2014 fiscal year is as follows:
Beginning balance, July 1 $ 3,379,001Interest earnings 2,000Deposits – by Board resolution adopted 6/24/14 1,500,000Withdrawals Board resolution - 8/7/13 – Replacement of roof At Alder Avenue Middle School (383,800) Board resolution - 10/8/13 – District telephone Replacement/upgrade to the Wide Area Network (WAN) (608,000) Board resolution – 5/13/13 – Eagle Academy Renovations - HVAC system, replacement of doors and windows, and Related professional service fees (457,675) Board resolution – 6/24/13 – Upgrades to Auditorium Lighting at Fernwood Avenue Middle School (260,000)Ending balance, June 30 $ 3,171,526
NOTE 6. TRANFERS TO CAPITAL OUTLAY During the year ended June 30, 2014, the District transferred $1,709,475 to the capital outlay accounts. The transfer was made from the general fund capital reserve account to fund the following projects at various buildings within the District.
6/30/14 Replacement of roof at Alder Avenue Middle School $ 383,800 District telephone replacement/upgrade to the Wide Area Network (WAN) 608,000 Eagle Academy Renovations – HVAC system, replacement of doors and windows, and related Professional service fees 457,675 Upgrades to auditorium lighting at Fernwood Avenue Middle School 260,000 $ 1,709,475
{This space intentionally left blank}
51
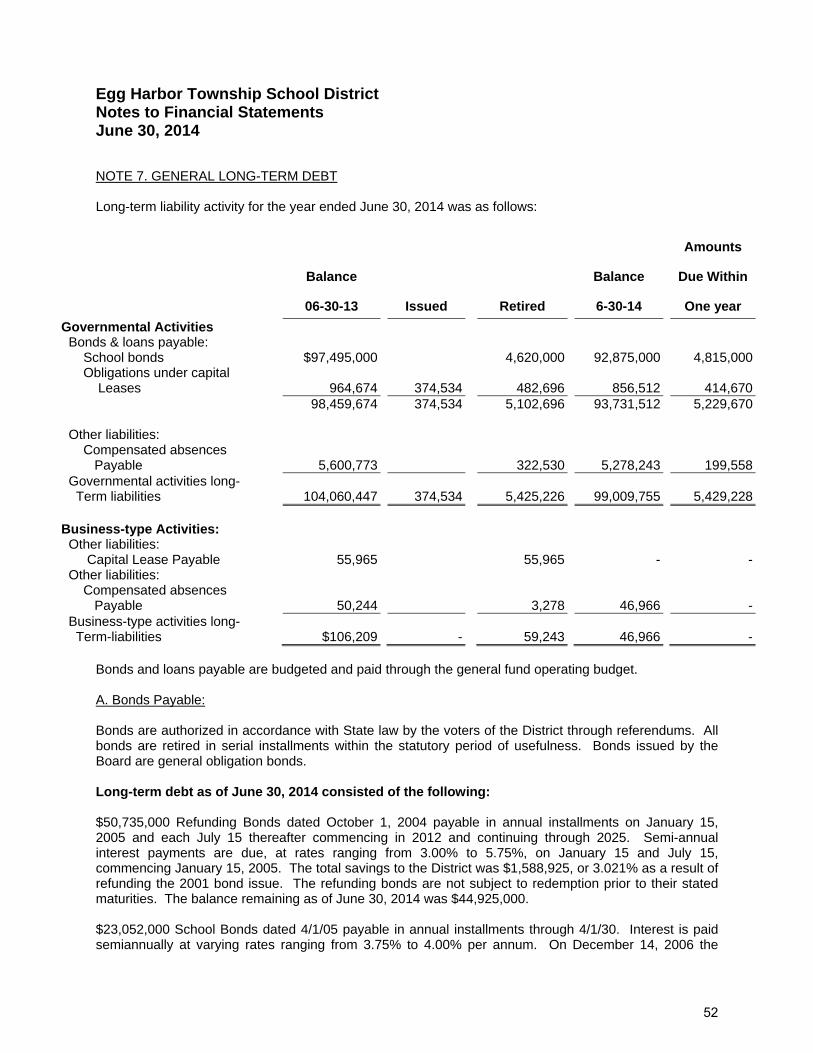
Egg Harbor Township School District Notes to Financial Statements June 30, 2014
NOTE 7. GENERAL LONG-TERM DEBT Long-term liability activity for the year ended June 30, 2014 was as follows:
Amounts
Balance
Balance Due Within
06-30-13 Issued
Retired 6-30-14 One year
Governmental Activities Bonds & loans payable: School bonds $97,495,000 4,620,000 92,875,000 4,815,000 Obligations under capital Leases 964,674 374,534 482,696 856,512 414,670 98,459,674 374,534 5,102,696 93,731,512 5,229,670 Other liabilities: Compensated absences Payable 5,600,773 322,530 5,278,243 199,558 Governmental activities long- Term liabilities 104,060,447 374,534 5,425,226 99,009,755 5,429,228 Business-type Activities: Other liabilities: Capital Lease Payable 55,965 55,965 - - Other liabilities: Compensated absences Payable 50,244 3,278 46,966 - Business-type activities long- Term-liabilities $106,209 - 59,243 46,966 -
Bonds and loans payable are budgeted and paid through the general fund operating budget. A. Bonds Payable: Bonds are authorized in accordance with State law by the voters of the District through referendums. All bonds are retired in serial installments within the statutory period of usefulness. Bonds issued by the Board are general obligation bonds. Long-term debt as of June 30, 2014 consisted of the following: $50,735,000 Refunding Bonds dated October 1, 2004 payable in annual installments on January 15, 2005 and each July 15 thereafter commencing in 2012 and continuing through 2025. Semi-annual interest payments are due, at rates ranging from 3.00% to 5.75%, on January 15 and July 15, commencing January 15, 2005. The total savings to the District was $1,588,925, or 3.021% as a result of refunding the 2001 bond issue. The refunding bonds are not subject to redemption prior to their stated maturities. The balance remaining as of June 30, 2014 was $44,925,000. $23,052,000 School Bonds dated 4/1/05 payable in annual installments through 4/1/30. Interest is paid semiannually at varying rates ranging from 3.75% to 4.00% per annum. On December 14, 2006 the
52
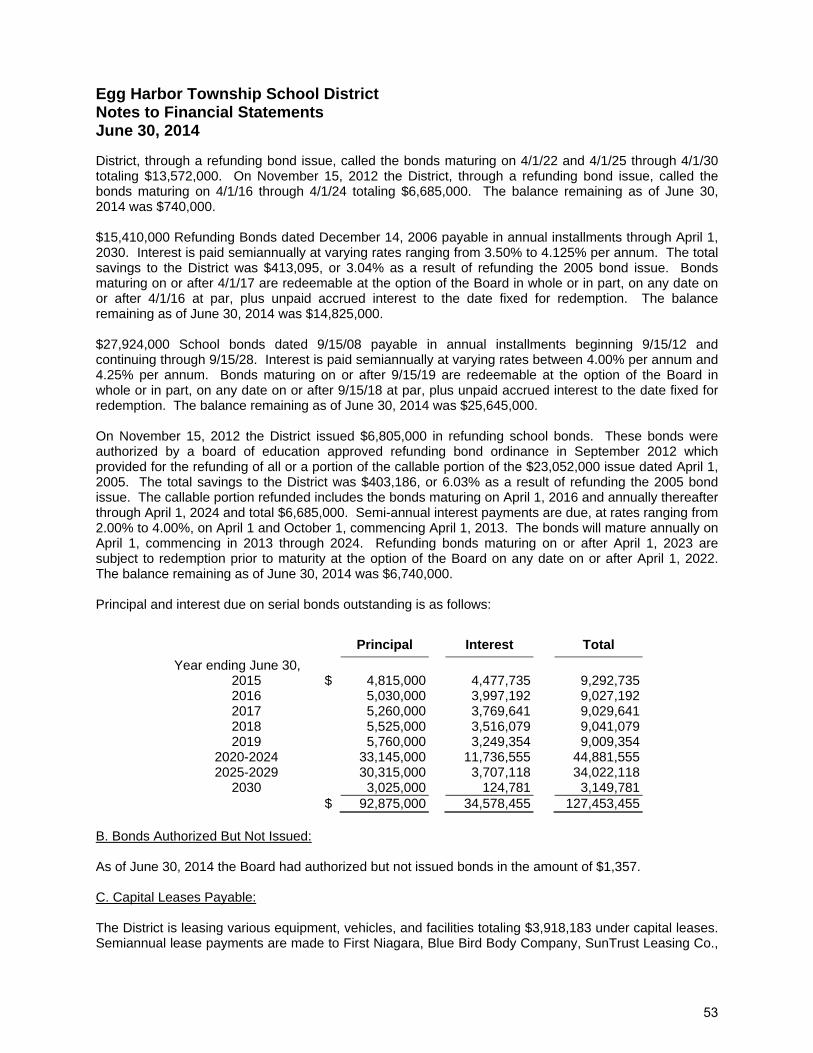
Egg Harbor Township School District Notes to Financial Statements June 30, 2014
District, through a refunding bond issue, called the bonds maturing on 4/1/22 and 4/1/25 through 4/1/30 totaling $13,572,000. On November 15, 2012 the District, through a refunding bond issue, called the bonds maturing on 4/1/16 through 4/1/24 totaling $6,685,000. The balance remaining as of June 30, 2014 was $740,000. $15,410,000 Refunding Bonds dated December 14, 2006 payable in annual installments through April 1, 2030. Interest is paid semiannually at varying rates ranging from 3.50% to 4.125% per annum. The total savings to the District was $413,095, or 3.04% as a result of refunding the 2005 bond issue. Bonds maturing on or after 4/1/17 are redeemable at the option of the Board in whole or in part, on any date on or after 4/1/16 at par, plus unpaid accrued interest to the date fixed for redemption. The balance remaining as of June 30, 2014 was $14,825,000. $27,924,000 School bonds dated 9/15/08 payable in annual installments beginning 9/15/12 and continuing through 9/15/28. Interest is paid semiannually at varying rates between 4.00% per annum and 4.25% per annum. Bonds maturing on or after 9/15/19 are redeemable at the option of the Board in whole or in part, on any date on or after 9/15/18 at par, plus unpaid accrued interest to the date fixed for redemption. The balance remaining as of June 30, 2014 was $25,645,000. On November 15, 2012 the District issued $6,805,000 in refunding school bonds. These bonds were authorized by a board of education approved refunding bond ordinance in September 2012 which provided for the refunding of all or a portion of the callable portion of the $23,052,000 issue dated April 1, 2005. The total savings to the District was $403,186, or 6.03% as a result of refunding the 2005 bond issue. The callable portion refunded includes the bonds maturing on April 1, 2016 and annually thereafter through April 1, 2024 and total $6,685,000. Semi-annual interest payments are due, at rates ranging from 2.00% to 4.00%, on April 1 and October 1, commencing April 1, 2013. The bonds will mature annually on April 1, commencing in 2013 through 2024. Refunding bonds maturing on or after April 1, 2023 are subject to redemption prior to maturity at the option of the Board on any date on or after April 1, 2022. The balance remaining as of June 30, 2014 was $6,740,000. Principal and interest due on serial bonds outstanding is as follows:
Principal
Interest
Total
Year ending June 30, 2015 $ 4,815,000 4,477,735 9,292,735 2016 5,030,000 3,997,192 9,027,192 2017 5,260,000 3,769,641 9,029,641 2018 5,525,000 3,516,079 9,041,079 2019 5,760,000 3,249,354 9,009,354
2020-2024 33,145,000 11,736,555 44,881,555 2025-2029 30,315,000 3,707,118 34,022,118
2030 3,025,000 124,781 3,149,781 $ 92,875,000 34,578,455 127,453,455
B. Bonds Authorized But Not Issued: As of June 30, 2014 the Board had authorized but not issued bonds in the amount of $1,357. C. Capital Leases Payable: The District is leasing various equipment, vehicles, and facilities totaling $3,918,183 under capital leases. Semiannual lease payments are made to First Niagara, Blue Bird Body Company, SunTrust Leasing Co.,
53
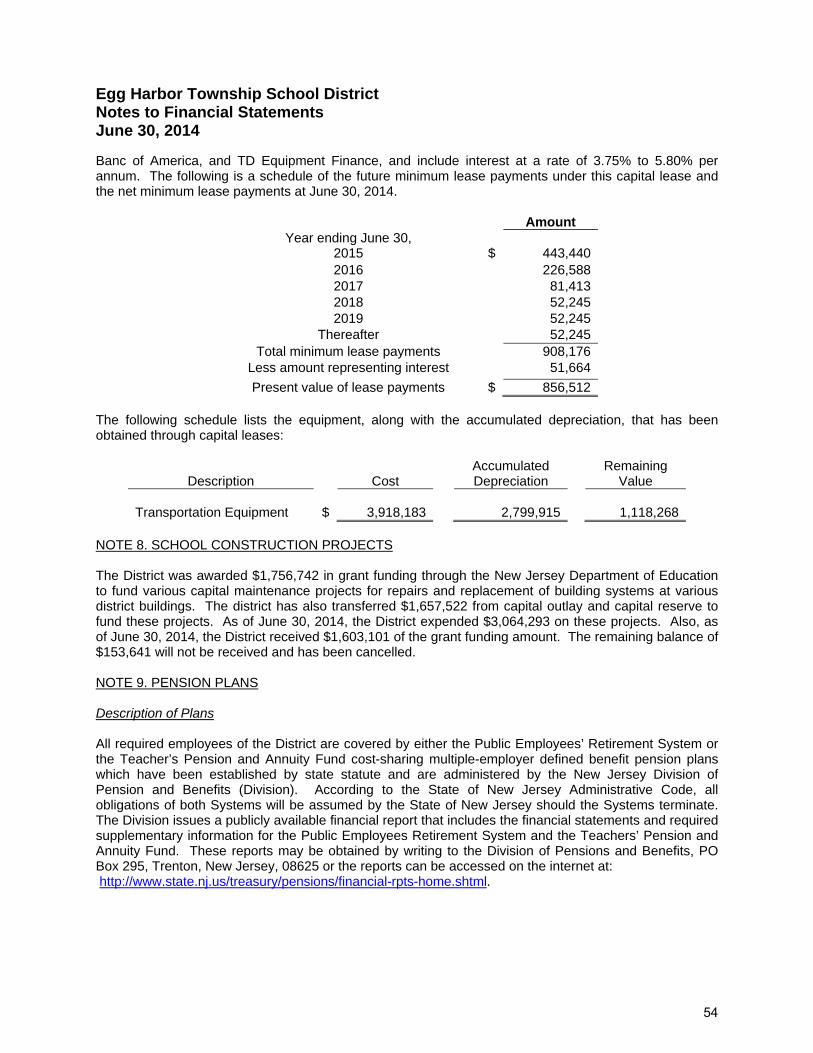
Egg Harbor Township School District Notes to Financial Statements June 30, 2014
Banc of America, and TD Equipment Finance, and include interest at a rate of 3.75% to 5.80% per annum. The following is a schedule of the future minimum lease payments under this capital lease and the net minimum lease payments at June 30, 2014.
Amount Year ending June 30,
2015 $ 443,440 2016 226,588 2017 81,413 2018 52,245 2019 52,245
Thereafter 52,245 Total minimum lease payments 908,176
Less amount representing interest 51,664
Present value of lease payments $ 856,512 The following schedule lists the equipment, along with the accumulated depreciation, that has been obtained through capital leases:
Accumulated Remaining Description Cost Depreciation Value
Transportation Equipment $ 3,918,183 2,799,915 1,118,268
NOTE 8. SCHOOL CONSTRUCTION PROJECTS The District was awarded $1,756,742 in grant funding through the New Jersey Department of Education to fund various capital maintenance projects for repairs and replacement of building systems at various district buildings. The district has also transferred $1,657,522 from capital outlay and capital reserve to fund these projects. As of June 30, 2014, the District expended $3,064,293 on these projects. Also, as of June 30, 2014, the District received $1,603,101 of the grant funding amount. The remaining balance of $153,641 will not be received and has been cancelled. NOTE 9. PENSION PLANS Description of Plans All required employees of the District are covered by either the Public Employees’ Retirement System or the Teacher’s Pension and Annuity Fund cost-sharing multiple-employer defined benefit pension plans which have been established by state statute and are administered by the New Jersey Division of Pension and Benefits (Division). According to the State of New Jersey Administrative Code, all obligations of both Systems will be assumed by the State of New Jersey should the Systems terminate. The Division issues a publicly available financial report that includes the financial statements and required supplementary information for the Public Employees Retirement System and the Teachers’ Pension and Annuity Fund. These reports may be obtained by writing to the Division of Pensions and Benefits, PO Box 295, Trenton, New Jersey, 08625 or the reports can be accessed on the internet at: http://www.state.nj.us/treasury/pensions/financial-rpts-home.shtml.
54
Egg Harbor Township School District Notes to Financial Statements June 30, 2014
Teachers' Pension and Annuity Fund The Teachers' Pension and Annuity Fund was established in January, 1955 under the provisions of N.J.S.A. 18A:66 to provide retirement benefits, death, disability and medical benefits to certain qualified members. The Teachers’ Pension and Annuity Fund is considered a cost-sharing multiple-employer plan with a special funding situation, as under current statute, all employer contributions are made by the State of New Jersey on behalf of the District and the system’s other related non-contributing employers. Membership is mandatory for substantially all teachers or members of the professional staff certified by the State Board of Examiners, and employees of the Department of Education who have titles that are unclassified, professional and certified. Public Employees' Retirement System The Public Employees' Retirement System was established in January, 1955 under the provisions of N.J.S.A. 43:15A to provide retirement, death, disability and medical benefits to certain qualified members. The Public Employees’ Retirement System is a cost-sharing multiple-employer plan. Membership is mandatory for substantially all full time employees of the State or any county, municipality, school district or public agency provided the employee is not required to be a member of another State-administered retirement system or other state or local jurisdiction. Defined Contribution Retirement Program (DCRP) The Defined Contribution Retirement Program (DCRP) was established as of July 1, 2008 under the provisions of Chapter 92, P.L. 2008 and Chapter 103, P.L. 2008 (NJSA 43:15C-1 et seq). The DCRP is a cost-sharing multiple-employer defined contribution pension fund. The DCRP provides eligible members, and their beneficiaries with a tax-sheltered, defined contribution retirement benefit, along with life insurance and disability coverage. Vesting and benefit provisions are established by NJSA 43:15C-1 et seq. Funding Policy The contribution policy is set by N.J.S.A. 43:15A, Chapter 62, P.L. of 1994, Chapter 115, P.L. of 1997 and N.J.S.A. 18:66, and requires contributions by active members and contributing employers. Plan member and employer contributions may be amended by State of New Jersey legislation. TPAF and PERS provide for employee contributions of 6.5% of employees’ annual compensation, as defined. Employers are required to contribute at an actuarially determined rate in both TPAF and PERS. The current TPAF rate is 11.0% and the PERS rate is 10.77% of covered payroll. The School District’s contributions to TPAF for the years ending June 30, 2014, 2013, and 2012 were $5,418,366, $6,663,901, and $4,487,824, respectively, and paid by the State of New Jersey on behalf of the board, equal to the required contributions for each year. The School District’s contributions to PERS for the years ending June 30, 2014, 2013, and 2012 were $1,332,587, $1,223,404, and $1,354,251, respectively, equal to the required contributions for each year. The Board’s total payroll for the years ended June 30, 2014, 2013, and 2012 was $66,708,087, $67,101,735, and $65,410,587, covered payroll was $49,227,235, $49,131,489, and $47,417,604 for TPAF; and $12,372,353, $12,234,369, and $11,967,967 for PERS.
55
Egg Harbor Township School District Notes to Financial Statements June 30, 2014
Significant Legislation Chapter 78, P.L. 2011, effective June 28, 2011 made various changes to the manner in which the Public Employees’ Retirement System (PERS) and the Teacher’s Pension and Annuity Fund (TPAF) operate and to the benefit provisions of those systems. Chapter 78’s provisions impacting employee pension and health benefits include:
New members of the PERS and TPAF hired on or after June 28, 2011 (Tier 5 members) will need 30 years of creditable service and age 65 for receipt of the early retirement benefit without a reduction of ¼ of 1% for each month that the member is under age 65.
The eligibility age to qualify for a service retirement in the systems is increased from age 63 to 65 for Tier 5 members.
Increases in active member contribution rates. PERS active member rates increase from 5.5% of annual compensation to 6.5% plus an additional 1% phased-in over 7 years; PFRS active member rate increase from 8.5% to 10%. For fiscal year 2013, the member contribution rates increased in October 2012. The phase-in of the additional incremental member contribution rates for PERS members will take place in July of each subsequent fiscal year.
The payment of automatic cost-of-living adjustment (COLA) additional increases to current and future retirees and beneficiaries is suspended until reactivated as permitted by this law.
New employee contribution requirements towards the cost of employer-provided health benefit coverage. Employees are required to contribute a certain percentage of the cost of coverage. The rate of contribution is determined based on the employee’s annual salary and the selected level of coverage. The increased employee contributions will be phased in over a 4-year period for those employed prior to Chapter 78’s effective date with a minimum contribution required to be at least 1.5% of salary.
In addition, this new legislation changes the method for amortizing the pension systems’ unfunded accrued liability (from a level percent of pay method to a level dollar of pay).
Chapter 1, P.L. 2010, effective May 21, 2010, made a number of changes to the State-administered retirement systems concerning eligibility, the retirement allowance formula, the definition of compensation, the positions eligible for service credit, the non-forfeitable right to a pension, and employer contributions to the retirement systems. Also, Chapter 1, P.L. 2010 changed the membership eligibility criteria for new members of PERS from the amount of annual compensation to the number of hours worked weekly. Also, it returned the benefit multiplier for new members of PERS and TPAF to 1/60th from 1/55th, and it provided that new members of PERS and TPAF have the retirement allowance calculated using the average annual compensation for the last five years of service instead of the last three years of service. New members of PERS and TPAF will no longer receive pension service credit from more than one employer. Pension service credit will be earned for the highest paid position only. The law also requires the State to make its full pension contribution, defined a 1/7th of the required amount, beginning in fiscal years 2012. Chapter 3, P.L. 2010, effective May 21, 2010, replaced the accidental and ordinary disability retirement for new members of the PERS with disability insurance coverage similar to that provided by the State to individuals enrolled in the State’s Defined Contribution Retirement Program. Chapter 92, P.L. 2007 implemented certain recommendations contained in the December 1, 2006 report of the Joint Legislative Committee on Public Employee Benefits Reform; established a DCRP for elected and certain appointed officials, effective July 1, 2007; the new pension loan interest rate became 4.69% per year, and an $8.00 processing fee per loan was charged, effective January 1, 2008. The legislation
56
Egg Harbor Township School District Notes to Financial Statements June 30, 2014
also removed language from existing law that permits the State Treasurer to reduce employer pension contributions needed to fund the Funds and Systems when excess assets are available. NOTE 10. LABOR CONTRACTS As of June 30, 2014, the District’s employees are organized in two collective bargaining units.
Bargaining Unit Employees Covered Expiration
EHT Education Association
All regularly employed certified personnel, secretarial, and
clerical personnel, and paraprofessional. This contract
also includes regularly employed custodial, grounds, maintenance, and cafeteria personnel, except
supervisors.
June 30, 2013 (District ratified a new 3 year contract in October
2014)
Principals’ and Supervisors’ Association
All certified administrative personnel, excluding the
Superintendent, Asst Superintendents, Business
Administrator, and all employees considered confidential by law.
June 30, 2015
In addition to the above contracts, the Board of Education has entered into individual employment agreements with the Superintendent, Assistant Superintendents, Business Administrator and Central Office employees. The expiration of these contracts will vary depending on the position. NOTE 11. POST-RETIREMENT BENEFITS P.L. 1987, c. 384 and P.L. 1990, c. 6 required Teachers’ Pensions and Annuity Fund (TPAF) and the Public Employees’ Retirement System (PERS), respectively, to fund post-retirement medical benefits for those State employees who retire after accumulating 25 years of credited service or on a disability retirement. P.L. 2007, c. 103 amended the law to eliminate the funding of post-retirement medical benefits through the TPAF and PERS. It created separate funds outside of the pension plans for the funding and payment of post-retirement medical benefits for retired State employees and retired educational employees. As of June 30, 2013, there were 100,134 retirees eligible for post-retirement medical benefits, and the State contributed $1.07 billion on their behalf. The cost of these benefits is funded through contributions by the State in accordance with Chapter 62, P.L. 1994. Funding of post-retirement medical premiums changed from a pre-funding basis to a pay-as-you go basis beginning in fiscal year 1994. The State is also responsible for the cost attributable to P.L. 1992 c. 126, which provides free health benefits to members of PERS and the Alternate Benefit Program who retired from a board of education or county college with 25 years of service. The State paid $173.8 million toward Chapter 126 benefits for 17,356 eligible retired members in Fiscal Year 2013. NOTE 12. SPECIAL PAY DEFERRAL PLAN Effective July 1, 2003 the District implemented a Special Pay Deferral Plan in accordance with Section 403(b) of the Internal Revenue Code. This plan will allow employees who are 50 years of age or older and have a minimum accumulated leave of $1,000 to contribute the value of these benefits to a Tax-
57
Egg Harbor Township School District Notes to Financial Statements June 30, 2014
Sheltered Custodial Account for distribution after the participant reaches age 70 1/2. Distribution may be made in the form of a life annuity, 50% qualified joint and survivor annuity, installments, or as a lump sum distribution. NOTE 13. DEFERRED COMPENSATION The Board offers its employees a deferred compensation plan created in accordance with Internal Revenue Code Section 403(b). The plans, which are administered by the entities listed below, permits participants to defer a portion of their salary until future years. Amounts deferred under the plans are not available to employees until termination, retirement, death or unforeseeable emergency. The plan administrators are as follows:
Equitable Vanguard Lincoln Investment Planning Retirement Annuity Consultants, Inc. Siracusa Benefits Program TSA Consulting Group
NOTE 14. COMPENSATED ABSENCES The District accounts for compensated absences (e.g. sick leave) as directed by Governmental Accounting Standards Board Statement No. 16 (GASB 16), “Accounting for Compensated Absences”. A liability for compensated absences attributable to services already rendered and not contingent on a specific event that is outside the control of the employer and employee is accrued as employees earn the rights to the benefits. District employees are granted vacation and sick leave in varying amounts under the District’s personnel policies. Sick leave benefits provide for ordinary sick pay and is capped based on the various employee contracts. In the district-wide Statement of Net Position, the liabilities whose average maturities are greater than one year should be reported in two components – the amount due within one year and the amount due in more than one year. The liability for vested compensated absences of the proprietary fund types is recorded within those funds as the benefits accrue to employees. NOTE 15. LITIGATION From time to time, the District is a defendant in legal proceedings relating to its operations as a school district. In the best judgment of the District’s management, there are potential legal proceedings that may have a material affect on the accompanying financial statements. NOTE 16. FUND BALANCE APPROPRIATED General Fund (Exhibit B-1) – Of the $15,476,693 General Fund fund balance at June 30, 2014, $0 is committed for encumbrances (actual encumbrances of $1,260,687 less deficit in unassigned fund balance of $1,260,687); $12,500,605 is restricted as excess surplus in accordance with NJSA 18A:7F-7 ($5,813,799 of the total restricted for excess surplus has been appropriated and included as anticipated revenue for the year ending June 30, 2015); $3,171,526 has been restricted in the Capital Reserve Account; $0 has been appropriated and included as anticipated revenue for the year ending June 30, 2015; and $(195,438) is unassigned. During the fiscal year, authorized and approved appropriations of $1,480,277 in surplus were made on June 30, 2014.
58
Egg Harbor Township School District Notes to Financial Statements June 30, 2014
Debt Service Fund – Of the Debt Service Fund fund balance at June 30, 2014, $13,564 is restricted in accordance with N.J.S.A. 7F-41c(2) and $37,743 is unassigned. NOTE 17. CALCULATION OF EXCESS SURPLUS The designation for Restricted Fund Balance – Excess Surplus is a required calculation pursuant to N.J.S.A. 18A:7F-7, as amended. New Jersey school districts are required to restrict General Fund fund balance at the fiscal year end of June 30 if they did not appropriate a required minimum amount as budgeted fund balance in their subsequent years’ budget. The excess fund balance at June 30, 2014 is $12,500,605, of which $5,813,799 has been included in the 2014-15 budget. The excess fund balance at June 30, 2013 was $9,035,850. NOTE 18. DEFICIT FUND BALANCE The District has a deficit fund balance of $195,438 in the General Fund as of June 30, 2014 as reported in the fund statements (modified accrual basis). NJSA 18A:22-44.2 provides that in the event a state school aid payment is not made until the following school budget year, districts must record the delayed one or more June state aid payments as revenue, for budget purposes only, in the current school budget year. The bill provides legal authority for school districts to recognize this revenue in the current budget year. For intergovernmental transactions, GASB Statement No. 33 requires that recognition (revenue, expenditure, asset, liability) should be in symmetry, i.e., if one government recognizes an asset, the other government recognizes a liability. Since the State is recording the June state aid payments in the subsequent fiscal year, the school district cannot recognize the June state aid payments (on the GAAP financial statements) until the year the State records the payable. This amount was $3,684,067 in the General Fund. Due to the timing difference of recording the June state aid payments, the General Fund balance deficit does not alone indicate that the district is facing financial difficulties. NOTE 19. ECONOMIC DEPENDENCY The District is heavily reliant on local property taxation and State Aid to fund the District operations and debt service. During the 2013-14 fiscal year, 94% of the Districts operations were funded through property taxes and State aid. NOTE 20. RISK MANAGEMENT The District is exposed to various risks of loss related to torts; theft of, damage to, and destruction of assets; errors and omissions; injuries to employees; and natural disasters. Property and Liability Insurance – The District maintains commercial insurance coverage for property, liability and surety bonds. During the fiscal year ended June 30, 2014 the District did not incur claims in excess of their coverage and the amount of coverage did not significantly decrease. New Jersey Unemployment Compensation Insurance – The District has elected to fund its New Jersey Unemployment Compensation Insurance under the “Benefit Reimbursement Method”. Under this plan, the District is required to reimburse the New Jersey Unemployment Trust Fund for benefits paid to its former employees and charged to its account with the State. The District is billed quarterly for amounts due to the State. The following is a summary of District contributions, employee contributions, reimbursements to the State for benefits paid and the ending balance of the District’s expendable trust fund for the current and prior year:
59
Egg Harbor Township School District Notes to Financial Statements June 30, 2014
District Employee Amount Ending
Fiscal Year Contributions Contributions Reimbursed Balance 2013-2014 None 115,308 157,958 1,025,7312012-2013 None 116,302 168,439 1,068,3812011-2012 189,982 112,229 194,735 1,120,518
Worker’s Compensation Fund – Through February 1, 1999, the District retained risk through an established self-funded workers compensation fund with Berkley Risk Managers, Inc. Premiums were paid into the fund and were available to pay claims, claim reserves and administrative costs of the program. The Board currently maintains traditional insurance for its worker’s compensation coverage. Liabilities are reported when it is probable that a loss has occurred and the amount of the loss can be reasonably estimated. Liabilities include an amount for claims that have been incurred but not reported. Claim liabilities are calculated considering the effects of inflation, recent claim settlement trends including frequency and amount of payouts and other economic and social factors. The workers compensation account is reported in the general fund. Only amounts that are current liabilities have been included as a charge against the budget line item. For the fiscal year ended June 30, 2014, $0 was charged to the worker’s compensation budget line item. The balance of estimated unpaid claims and settlement expense as of June 30, 2014 and 2013 was $19,737 and $38,686, respectively. There is a potential contingent liability that exceeds the amount the District has in the worker’s compensation fund.
Fiscal Year Balance Claims Claims Balance Ended Beginning of Year Incurred Paid End of Year 6/30/14 $38,686 18,949 19,7376/30/13 39,025 339 38,6866/30/12 43,075 4,050 39,025
NOTE 21. BLUE CROSS/BLUE SHIELD – IBNR CLAIMS RESERVE Effective January 1, 2010 the District changed their health insurance plan to a minimum premium billing plan with Blue Cross/Blue Shield of New Jersey. This plan requires that a liability be maintained on the balance sheet of the District to cover the claims that have been incurred but not reported to the carrier. The District’s insurance consultant obtains the amount to be maintained annually from reports obtained from Blue Cross/Blue Shield. The balance in the reserve fund as of June 30, 2014 was $0 and $947,121 as of June 30, 2013. Effective September 1, 2010, the District terminated the above agreement and is now covered through the State Health Benefits Plan. The reserve fund was required to be maintained for a period of three years after termination. Based on this, the balance in the reserve was transferred to the general fund and is available to the District for use in their 2015-16 fiscal year budget.
{This space intentionally left blank}
60
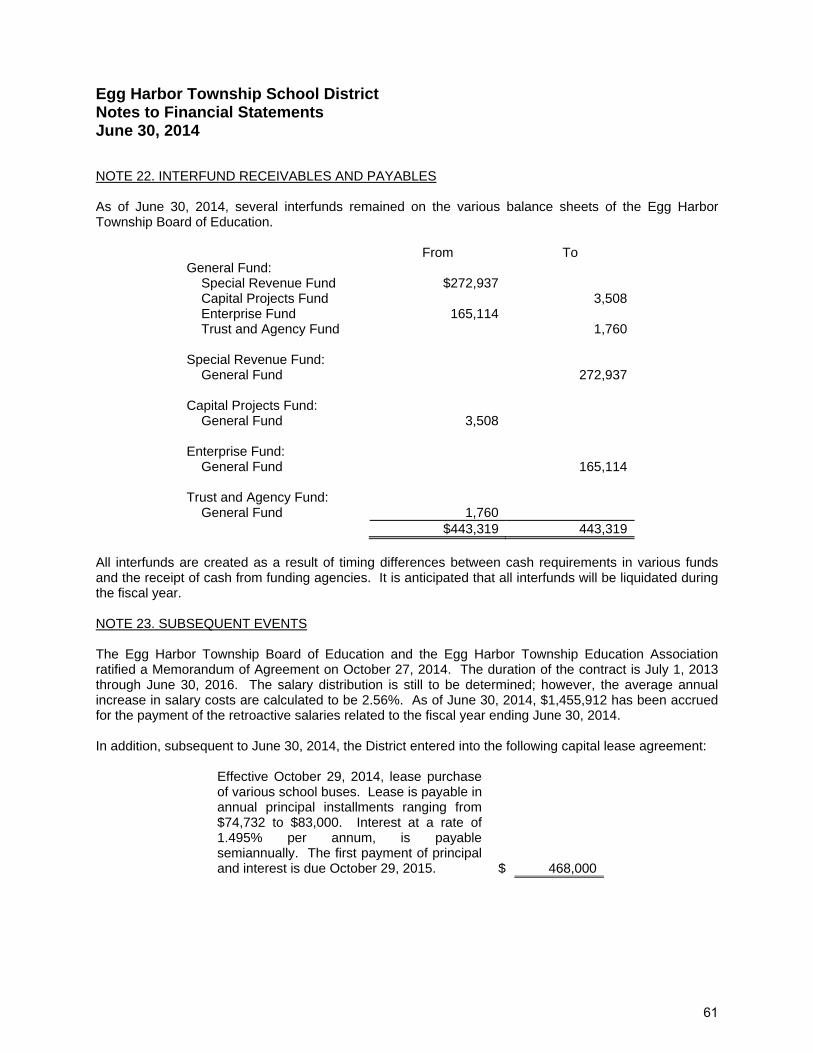
Egg Harbor Township School District Notes to Financial Statements June 30, 2014
NOTE 22. INTERFUND RECEIVABLES AND PAYABLES As of June 30, 2014, several interfunds remained on the various balance sheets of the Egg Harbor Township Board of Education.
From To General Fund: Special Revenue Fund $272,937 Capital Projects Fund 3,508 Enterprise Fund 165,114 Trust and Agency Fund 1,760 Special Revenue Fund: General Fund 272,937 Capital Projects Fund: General Fund 3,508 Enterprise Fund: General Fund 165,114 Trust and Agency Fund: General Fund 1,760 $443,319 443,319
All interfunds are created as a result of timing differences between cash requirements in various funds and the receipt of cash from funding agencies. It is anticipated that all interfunds will be liquidated during the fiscal year. NOTE 23. SUBSEQUENT EVENTS The Egg Harbor Township Board of Education and the Egg Harbor Township Education Association ratified a Memorandum of Agreement on October 27, 2014. The duration of the contract is July 1, 2013 through June 30, 2016. The salary distribution is still to be determined; however, the average annual increase in salary costs are calculated to be 2.56%. As of June 30, 2014, $1,455,912 has been accrued for the payment of the retroactive salaries related to the fiscal year ending June 30, 2014. In addition, subsequent to June 30, 2014, the District entered into the following capital lease agreement:
Effective October 29, 2014, lease purchase of various school buses. Lease is payable in annual principal installments ranging from $74,732 to $83,000. Interest at a rate of 1.495% per annum, is payable semiannually. The first payment of principal and interest is due October 29, 2015. $ 468,000
61
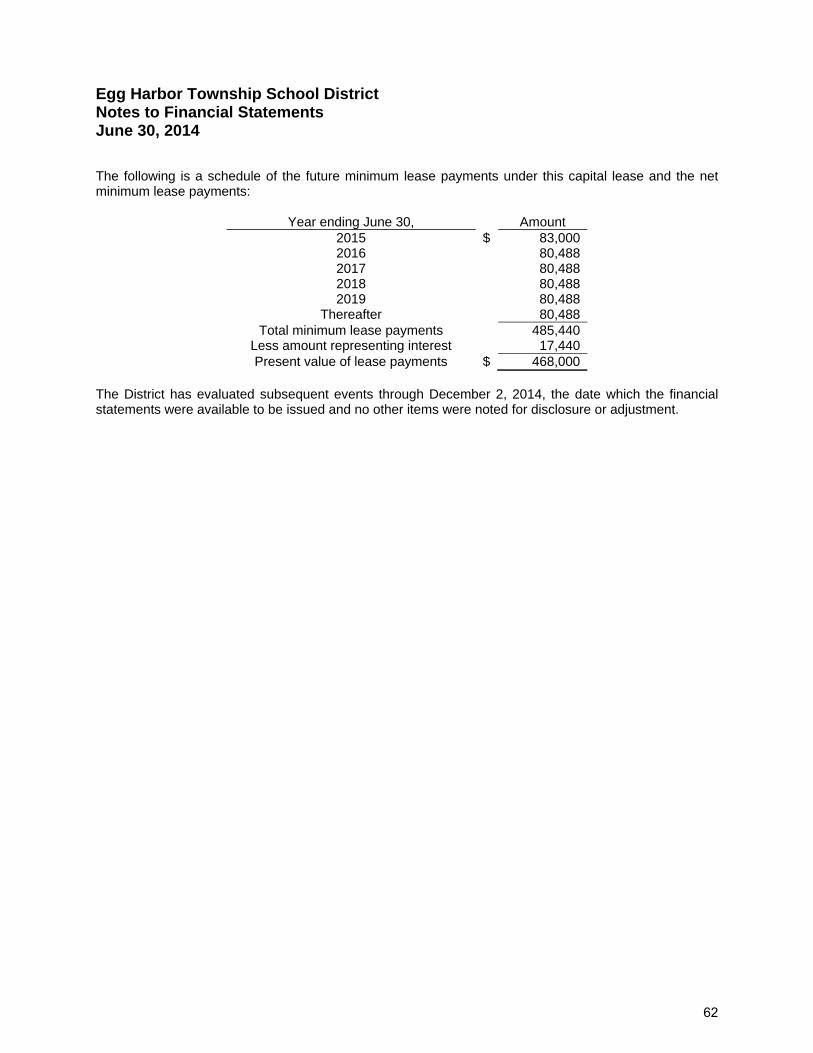
Egg Harbor Township School District Notes to Financial Statements June 30, 2014
The following is a schedule of the future minimum lease payments under this capital lease and the net minimum lease payments:
Year ending June 30, Amount 2015 $ 83,000 2016 80,488 2017 80,488 2018 80,488 2019 80,488
Thereafter 80,488 Total minimum lease payments 485,440
Less amount representing interest 17,440 Present value of lease payments $ 468,000
The District has evaluated subsequent events through December 2, 2014, the date which the financial statements were available to be issued and no other items were noted for disclosure or adjustment.
62

{THIS PAGE IS INTENTIONALLY LEFT BLANK}
Required Supplementary InformationPart II

{THIS PAGE IS INTENTIONALLY LEFT BLANK}
BUDGETARY COMPARISON SCHEDULES

{THIS PAGE IS INTENTIONALLY LEFT BLANK}
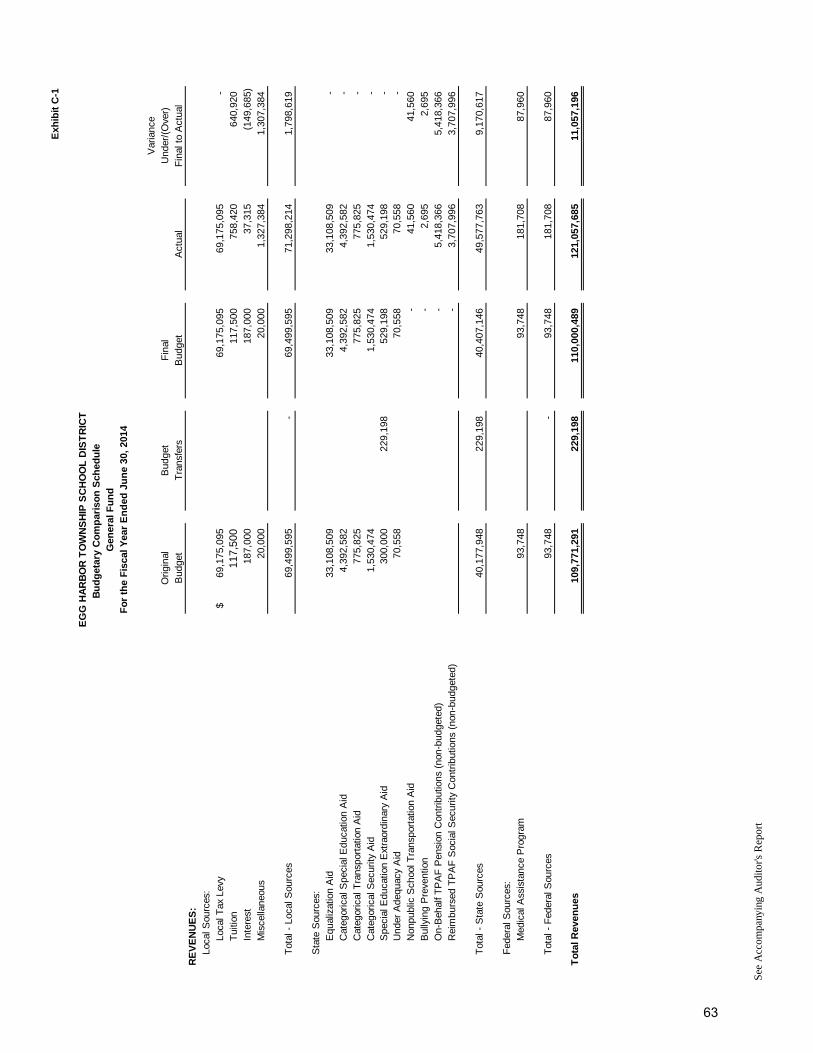
Exh
ibit
C-1
Var
ianc
eO
rigin
alB
udge
tF
inal
Und
er/(
Ove
r)B
udge
tT
rans
fers
Bud
get
Act
ual
Fin
al t
o A
ctua
lR
EV
EN
UE
S:
Loca
l Sou
rces
:Lo
cal T
ax L
evy
69,1
75,0
95$
69,1
75,0
95
69,1
75,0
95
-
Tui
tion
11
7,5
00
11
7,50
0
758,
420
64
0,92
0
In
tere
st18
7,00
0
18
7,00
0
37,3
15
(149
,685
)
Mis
cella
neou
s20
,000
20
,000
1,32
7,38
4
1,30
7,38
4
Tot
al -
Loc
al S
ourc
es69
,499
,595
-
69
,499
,595
71
,298
,214
1,79
8,61
9
Sta
te S
ourc
es:
Equ
aliz
atio
n A
id33
,108
,509
33,1
08,5
09
33,1
08,5
09
-
Cat
egor
ical
Spe
cial
Edu
catio
n A
id4,
392,
582
4,
392,
582
4,39
2,58
2
-
C
ateg
oric
al T
rans
port
atio
n A
id77
5,82
5
77
5,82
5
775,
825
-
Cat
egor
ical
Sec
urity
Aid
1,53
0,47
4
1,53
0,47
4
1,
530,
474
-
Spe
cial
Edu
catio
n E
xtra
ordi
nary
Aid
300,
000
229,
198
529,
198
52
9,19
8
-
U
nder
Ade
quac
y A
id70
,558
70
,558
70,5
58
-
N
onpu
blic
Sch
ool T
rans
port
atio
n A
id-
41
,560
41
,560
B
ully
ing
Pre
vent
ion
-
2,69
5
2,
695
On-
Beh
alf T
PA
F P
ensi
on C
ontr
ibut
ions
(no
n-bu
dget
ed)
-
5,41
8,36
6
5,41
8,36
6
R
eim
burs
ed T
PA
F S
ocia
l Sec
urity
Con
trib
utio
ns (
non-
budg
eted
)-
3,
707,
996
3,
707,
996
Tot
al -
Sta
te S
ourc
es40
,177
,948
229,
198
40,4
07,1
46
49,5
77,7
63
9,
170,
617
Fed
eral
Sou
rces
:M
edic
al A
ssis
tanc
e P
rogr
am93
,748
93
,748
181,
708
87
,960
Tot
al -
Fed
eral
Sou
rces
93,7
48
-
93
,748
181,
708
87
,960
To
tal R
even
ues
109,
771,
291
22
9,19
8
11
0,00
0,48
9
12
1,05
7,68
5
11,0
57,1
96
Fo
r th
e F
isca
l Yea
r E
nd
ed J
un
e 30
, 20
14
EG
G H
AR
BO
R T
OW
NS
HIP
SC
HO
OL
DIS
TR
ICT
Bu
dg
etar
y C
om
par
iso
n S
ched
ule
G
ener
al F
un
d
See
Acc
ompa
nyin
g A
udito
r's R
epor
t
63
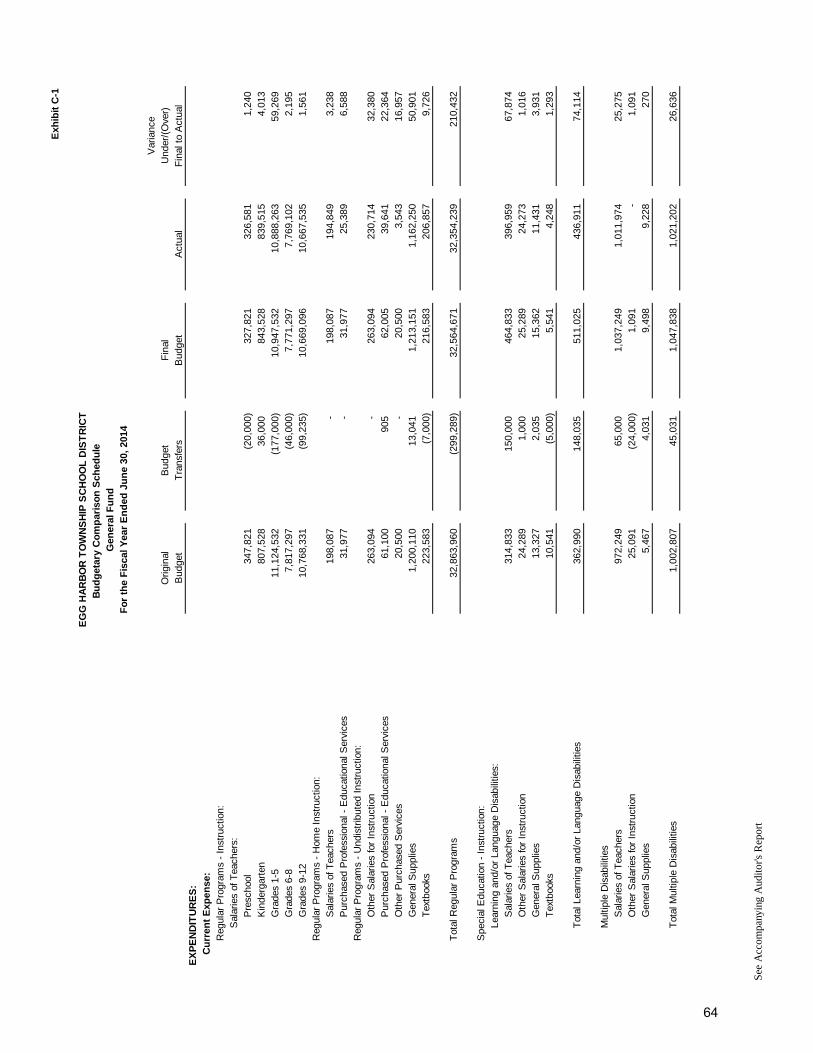
Exh
ibit
C-1
Var
ianc
eO
rigin
alB
udge
tF
inal
Und
er/(
Ove
r)B
udge
tT
rans
fers
Bud
get
Act
ual
Fin
al t
o A
ctua
l
Fo
r th
e F
isca
l Yea
r E
nd
ed J
un
e 30
, 20
14
EG
G H
AR
BO
R T
OW
NS
HIP
SC
HO
OL
DIS
TR
ICT
Bu
dg
etar
y C
om
par
iso
n S
ched
ule
G
ener
al F
un
d
EX
PE
ND
ITU
RE
S:
Cu
rren
t E
xpen
se:
Reg
ular
Pro
gram
s -
Inst
ruct
ion:
Sal
arie
s of
Tea
cher
s:P
resc
hool
347,
821
(20,
000)
327,
821
32
6,58
1
1,24
0
K
inde
rgar
ten
807,
528
36,0
00
843,
528
83
9,51
5
4,01
3
G
rade
s 1-
511
,124
,532
(177
,000
)
10,9
47,5
32
10,8
88,2
63
59
,269
G
rade
s 6-
87,
817,
297
(4
6,00
0)
7,
771,
297
7,76
9,10
2
2,19
5
G
rade
s 9-
1210
,768
,331
(99,
235)
10,6
69,0
96
10,6
67,5
35
1,
561
Reg
ular
Pro
gram
s -
Hom
e In
stru
ctio
n:S
alar
ies
of T
each
ers
198,
087
-
19
8,08
7
194,
849
3,
238
Pur
chas
ed P
rofe
ssio
nal -
Edu
catio
nal S
ervi
ces
31,9
77
-
31
,977
25,3
89
6,58
8
R
egul
ar P
rogr
ams
- U
ndis
trib
uted
Ins
truc
tion:
Oth
er S
alar
ies
for
Inst
ruct
ion
263,
094
-
26
3,09
4
230,
714
32
,380
P
urch
ased
Pro
fess
iona
l - E
duca
tiona
l Ser
vice
s61
,100
90
5
62,0
05
39
,641
22
,364
O
ther
Pur
chas
ed S
ervi
ces
20,5
00
-
20
,500
3,54
3
16
,957
G
ener
al S
uppl
ies
1,20
0,11
0
13,0
41
1,21
3,15
1
1,
162,
250
50
,901
T
extb
ooks
223,
583
(7,0
00)
21
6,58
3
206,
857
9,
726
Tot
al R
egul
ar P
rogr
ams
32,8
63,9
60
(2
99,2
89)
32
,564
,671
32
,354
,239
210,
432
Spe
cial
Edu
catio
n -
Inst
ruct
ion:
Lear
ning
and
/or
Lang
uage
Dis
abili
ties:
Sal
arie
s of
Tea
cher
s31
4,83
3
15
0,00
0
46
4,83
3
396,
959
67
,874
O
ther
Sal
arie
s fo
r In
stru
ctio
n24
,289
1,
000
25,2
89
24
,273
1,
016
Gen
eral
Sup
plie
s13
,327
2,
035
15,3
62
11
,431
3,
931
Tex
tboo
ks10
,541
(5
,000
)
5,54
1
4,24
8
1,
293
Tot
al L
earn
ing
and/
or L
angu
age
Dis
abili
ties
362,
990
148,
035
511,
025
43
6,91
1
74,1
14
Mul
tiple
Dis
abili
ties
Sal
arie
s of
Tea
cher
s97
2,24
9
65
,000
1,
037,
249
1,01
1,97
4
25,2
75
Oth
er S
alar
ies
for
Inst
ruct
ion
25,0
91
(24,
000)
1,09
1
-
1,
091
Gen
eral
Sup
plie
s5,
467
4,03
1
9,
498
9,
228
270
Tot
al M
ultip
le D
isab
ilitie
s1,
002,
807
45
,031
1,
047,
838
1,02
1,20
2
26,6
36
See
Acc
ompa
nyin
g A
udito
r's R
epor
t
64
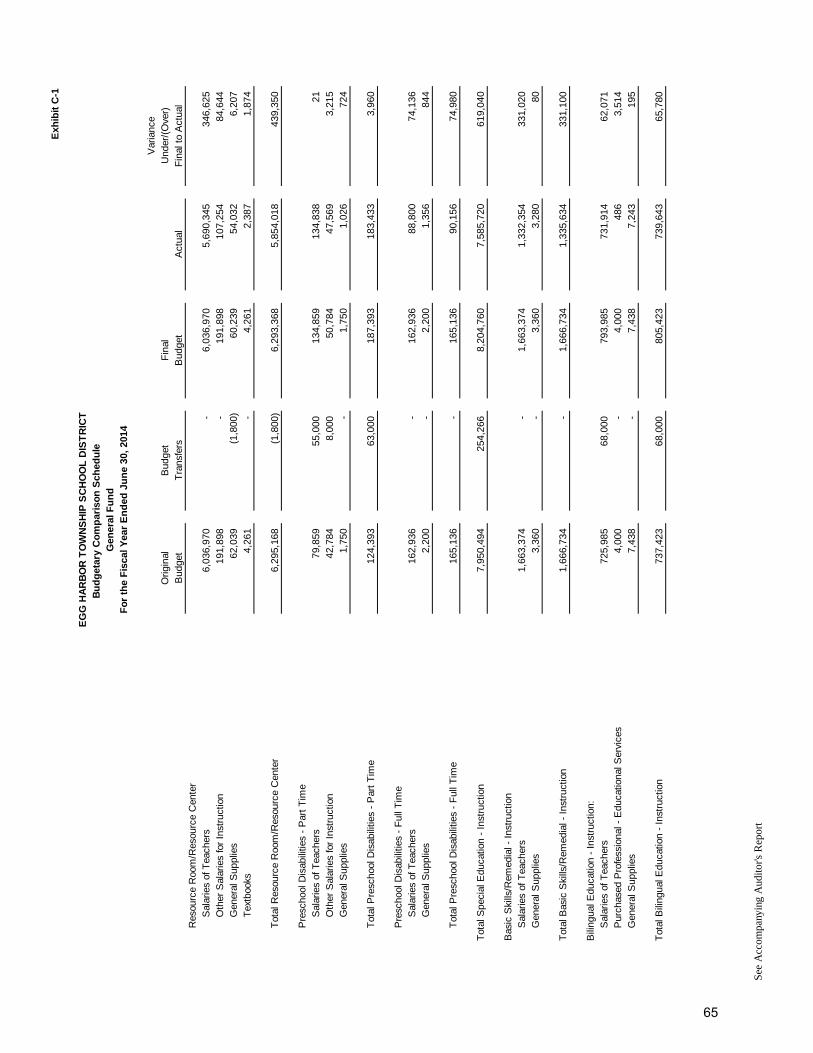
Exh
ibit
C-1
Var
ianc
eO
rigin
alB
udge
tF
inal
Und
er/(
Ove
r)B
udge
tT
rans
fers
Bud
get
Act
ual
Fin
al t
o A
ctua
l
Fo
r th
e F
isca
l Yea
r E
nd
ed J
un
e 30
, 20
14
EG
G H
AR
BO
R T
OW
NS
HIP
SC
HO
OL
DIS
TR
ICT
Bu
dg
etar
y C
om
par
iso
n S
ched
ule
G
ener
al F
un
d
Res
ourc
e R
oom
/Res
ourc
e C
ente
rS
alar
ies
of T
each
ers
6,03
6,97
0
-
6,
036,
970
5,69
0,34
5
346,
625
Oth
er S
alar
ies
for
Inst
ruct
ion
191,
898
-
19
1,89
8
107,
254
84
,644
G
ener
al S
uppl
ies
62,0
39
(1,8
00)
60
,239
54,0
32
6,20
7
T
extb
ooks
4,26
1
-
4,26
1
2,38
7
1,
874
Tot
al R
esou
rce
Roo
m/R
esou
rce
Cen
ter
6,29
5,16
8
(1,8
00)
6,
293,
368
5,85
4,01
8
439,
350
Pre
scho
ol D
isab
ilitie
s -
Par
t T
ime
Sal
arie
s of
Tea
cher
s79
,859
55
,000
13
4,85
9
134,
838
21
Oth
er S
alar
ies
for
Inst
ruct
ion
42,7
84
8,00
0
50
,784
47,5
69
3,21
5
G
ener
al S
uppl
ies
1,75
0
-
1,75
0
1,02
6
72
4
Tot
al P
resc
hool
Dis
abili
ties
- P
art
Tim
e12
4,39
3
63
,000
18
7,39
3
183,
433
3,
960
Pre
scho
ol D
isab
ilitie
s -
Ful
l Tim
eS
alar
ies
of T
each
ers
162,
936
-
16
2,93
6
88,8
00
74,1
36
Gen
eral
Sup
plie
s2,
200
-
2,
200
1,
356
844
Tot
al P
resc
hool
Dis
abili
ties
- F
ull T
ime
165,
136
-
16
5,13
6
90,1
56
74,9
80
Tot
al S
peci
al E
duca
tion
- In
stru
ctio
n7,
950,
494
25
4,26
6
8,
204,
760
7,58
5,72
0
619,
040
Bas
ic S
kills
/Rem
edia
l - I
nstr
uctio
nS
alar
ies
of T
each
ers
1,66
3,37
4
-
1,
663,
374
1,33
2,35
4
331,
020
Gen
eral
Sup
plie
s3,
360
-
3,
360
3,
280
80
Tot
al B
asic
Ski
lls/R
emed
ial -
Ins
truc
tion
1,66
6,73
4
-
1,
666,
734
1,33
5,63
4
331,
100
Bili
ngua
l Edu
catio
n -
Inst
ruct
ion:
Sal
arie
s of
Tea
cher
s72
5,98
5
68
,000
79
3,98
5
731,
914
62
,071
P
urch
ased
Pro
fess
iona
l - E
duca
tiona
l Ser
vice
s4,
000
-
4,
000
48
6
3,
514
Gen
eral
Sup
plie
s7,
438
-
7,
438
7,
243
195
Tot
al B
iling
ual E
duca
tion
- In
stru
ctio
n73
7,42
3
68
,000
80
5,42
3
739,
643
65
,780
See
Acc
ompa
nyin
g A
udito
r's R
epor
t
65
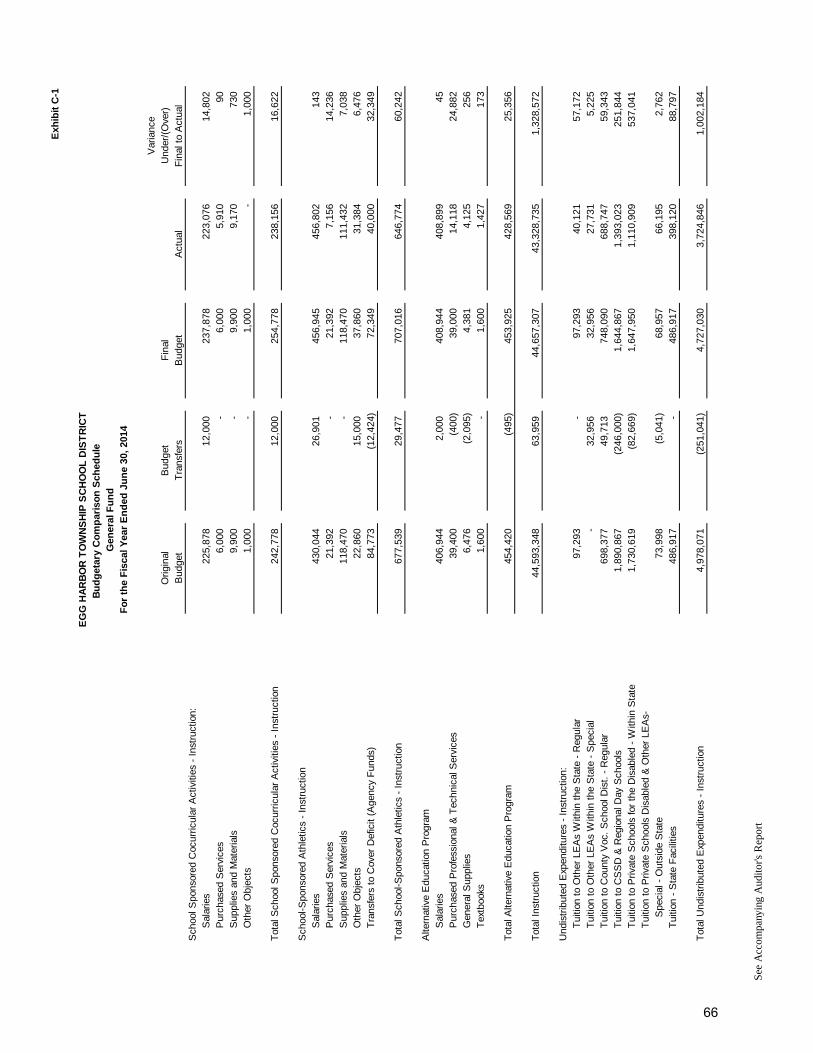
Exh
ibit
C-1
Var
ianc
eO
rigin
alB
udge
tF
inal
Und
er/(
Ove
r)B
udge
tT
rans
fers
Bud
get
Act
ual
Fin
al t
o A
ctua
l
Fo
r th
e F
isca
l Yea
r E
nd
ed J
un
e 30
, 20
14
EG
G H
AR
BO
R T
OW
NS
HIP
SC
HO
OL
DIS
TR
ICT
Bu
dg
etar
y C
om
par
iso
n S
ched
ule
G
ener
al F
un
d
Sch
ool S
pons
ored
Coc
urric
ular
Act
iviti
es -
Ins
truc
tion:
Sal
arie
s22
5,87
8
12
,000
23
7,87
8
223,
076
14
,802
P
urch
ased
Ser
vice
s6,
000
-
6,
000
5,
910
90
S
uppl
ies
and
Mat
eria
ls9,
900
-
9,
900
9,
170
730
O
ther
Obj
ects
1,00
0
-
1,00
0
-
1,
000
Tot
al S
choo
l Spo
nsor
ed C
ocur
ricul
ar A
ctiv
ities
- I
nstr
uctio
n24
2,77
8
12
,000
25
4,77
8
238,
156
16
,622
Sch
ool-S
pons
ored
Ath
letic
s -
Inst
ruct
ion
Sal
arie
s43
0,04
4
26
,901
45
6,94
5
456,
802
14
3
Pur
chas
ed S
ervi
ces
21,3
92
-
21
,392
7,15
6
14
,236
S
uppl
ies
and
Mat
eria
ls11
8,47
0
-
118,
470
11
1,43
2
7,03
8
O
ther
Obj
ects
22,8
60
15,0
00
37,8
60
31
,384
6,
476
Tra
nsfe
rs t
o C
over
Def
icit
(Age
ncy
Fun
ds)
84,7
73
(12,
424)
72,3
49
40
,000
32
,349
Tot
al S
choo
l-Spo
nsor
ed A
thle
tics
- In
stru
ctio
n67
7,53
9
29
,477
70
7,01
6
646,
774
60
,242
Alte
rnat
ive
Edu
catio
n P
rogr
amS
alar
ies
406,
944
2,00
0
40
8,94
4
408,
899
45
Pur
chas
ed P
rofe
ssio
nal &
Tec
hnic
al S
ervi
ces
39,4
00
(400
)
39,0
00
14
,118
24
,882
G
ener
al S
uppl
ies
6,47
6
(2
,095
)
4,38
1
4,12
5
25
6
Tex
tboo
ks1,
600
-
1,
600
1,
427
173
Tot
al A
ltern
ativ
e E
duca
tion
Pro
gram
454,
420
(495
)
453,
925
42
8,56
9
25,3
56
Tot
a l I
nstr
uctio
n44
,593
,348
63,9
59
44,6
57,3
07
43,3
28,7
35
1,
328,
572
Und
istr
ibut
ed E
xpen
ditu
res
- In
stru
ctio
n:T
uitio
n to
Oth
er L
EA
s W
ithin
the
Sta
te -
Reg
ular
97,2
93
-
97
,293
40,1
21
57,1
72
Tui
tion
to O
ther
LE
As
With
in t
he S
tate
- S
peci
al-
32,9
56
32,9
56
27
,731
5,
225
Tui
tion
to C
ount
y V
oc.
Sch
ool D
ist.
- R
egul
ar69
8,37
7
49
,713
74
8,09
0
688,
747
59
,343
T
uitio
n to
CS
SD
& R
egio
nal D
ay S
choo
ls1,
890,
867
(2
46,0
00)
1,
644,
867
1,39
3,02
3
251,
844
Tui
tion
to P
rivat
e S
choo
ls fo
r th
e D
isab
led
- W
ithin
Sta
te1,
730,
619
(8
2,66
9)
1,
647,
950
1,11
0,90
9
537,
041
Tui
tion
to P
rivat
e S
choo
ls D
isab
led
& O
ther
LE
As-
Spe
cial
- O
utsi
de S
tate
73,9
98
(5,0
41)
68
,957
66,1
95
2,76
2
T
uitio
n -
Sta
te F
acili
ties
486,
917
-
48
6,91
7
398,
120
88
,797
Tot
al U
ndis
trib
uted
Exp
endi
ture
s -
Inst
ruct
ion
4,97
8,07
1
(251
,041
)
4,72
7,03
0
3,
724,
846
1,
002,
184
See
Acc
ompa
nyin
g A
udito
r's R
epor
t
66
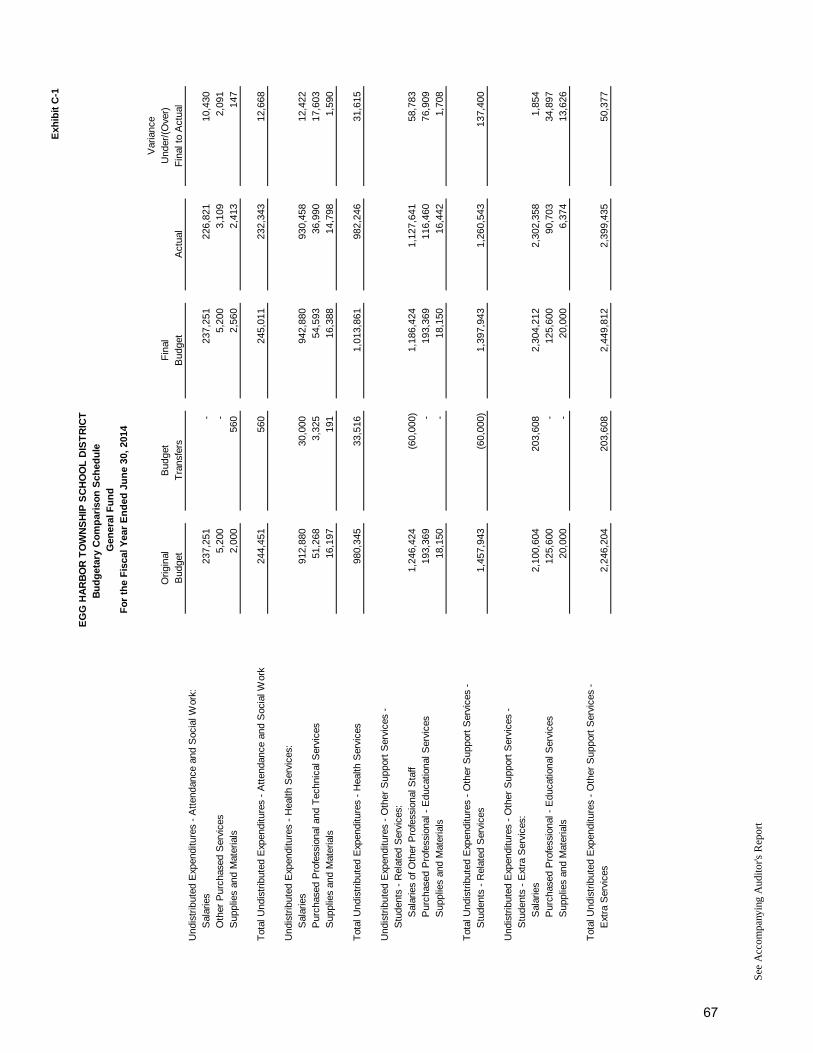
Exh
ibit
C-1
Var
ianc
eO
rigin
alB
udge
tF
inal
Und
er/(
Ove
r)B
udge
tT
rans
fers
Bud
get
Act
ual
Fin
al t
o A
ctua
l
Fo
r th
e F
isca
l Yea
r E
nd
ed J
un
e 30
, 20
14
EG
G H
AR
BO
R T
OW
NS
HIP
SC
HO
OL
DIS
TR
ICT
Bu
dg
etar
y C
om
par
iso
n S
ched
ule
G
ener
al F
un
d
Und
istr
ibut
ed E
xpen
ditu
res
- A
tten
danc
e an
d S
ocia
l Wor
k:S
alar
ies
237,
251
-
23
7,25
1
226,
821
10
,430
O
ther
Pur
chas
ed S
ervi
ces
5,20
0
-
5,20
0
3,10
9
2,
091
Sup
plie
s an
d M
ater
ials
2,00
0
56
0
2,56
0
2,41
3
14
7
Tot
al U
ndis
trib
uted
Exp
endi
ture
s -
Att
enda
nce
and
Soc
ial W
ork
244,
451
560
24
5,01
1
232,
343
12
,668
Und
istr
ibut
ed E
xpen
ditu
res
- H
ealth
Ser
vice
s:S
alar
ies
912,
880
30,0
00
942,
880
93
0,45
8
12,4
22
Pur
chas
ed P
rofe
ssio
nal a
nd T
echn
ical
Ser
vice
s51
,268
3,
325
54,5
93
36
,990
17
,603
S
uppl
ies
and
Mat
eria
ls16
,197
19
1
16,3
88
14
,798
1,
590
Tot
al U
ndis
trib
uted
Exp
endi
ture
s -
Hea
lth S
ervi
ces
980,
345
33,5
16
1,01
3,86
1
98
2,24
6
31,6
15
Und
istr
ibut
ed E
xpen
ditu
res
- O
ther
Sup
port
Ser
vice
s -
Stu
dent
s -
Rel
ated
Ser
vice
s:S
alar
ies
of O
ther
Pro
fess
iona
l Sta
ff1,
246,
424
(6
0,00
0)
1,
186,
424
1,12
7,64
1
58,7
83
Pur
chas
ed P
rofe
ssio
nal -
Edu
catio
nal S
ervi
ces
193,
369
-
19
3,36
9
116,
460
76
,909
S
uppl
ies
and
Mat
eria
ls18
,150
-
18,1
50
16
,442
1,
708
Tot
al U
ndis
trib
uted
Exp
endi
ture
s -
Oth
er S
uppo
rt S
ervi
ces
-S
tude
nts
- R
elat
ed S
ervi
ces
1,45
7,94
3
(60,
000)
1,39
7,94
3
1,
260,
543
13
7,40
0
Und
istr
ibut
ed E
xpen
ditu
res
- O
ther
Sup
port
Ser
vice
s -
Stu
dent
s -
Ext
ra S
ervi
ces:
Sal
arie
s2,
100,
604
20
3,60
8
2,
304,
212
2,30
2,35
8
1,85
4
P
urch
ased
Pro
fess
iona
l - E
duca
tiona
l Ser
vice
s12
5,60
0
-
125,
600
90
,703
34
,897
S
uppl
ies
and
Mat
eria
ls20
,000
-
20,0
00
6,
374
13,6
26
Tot
al U
ndis
trib
uted
Exp
endi
ture
s -
Oth
er S
uppo
rt S
ervi
ces
-E
xtra
Ser
vice
s2,
246,
204
20
3,60
8
2,
449,
812
2,39
9,43
5
50,3
77
See
Acc
ompa
nyin
g A
udito
r's R
epor
t
67
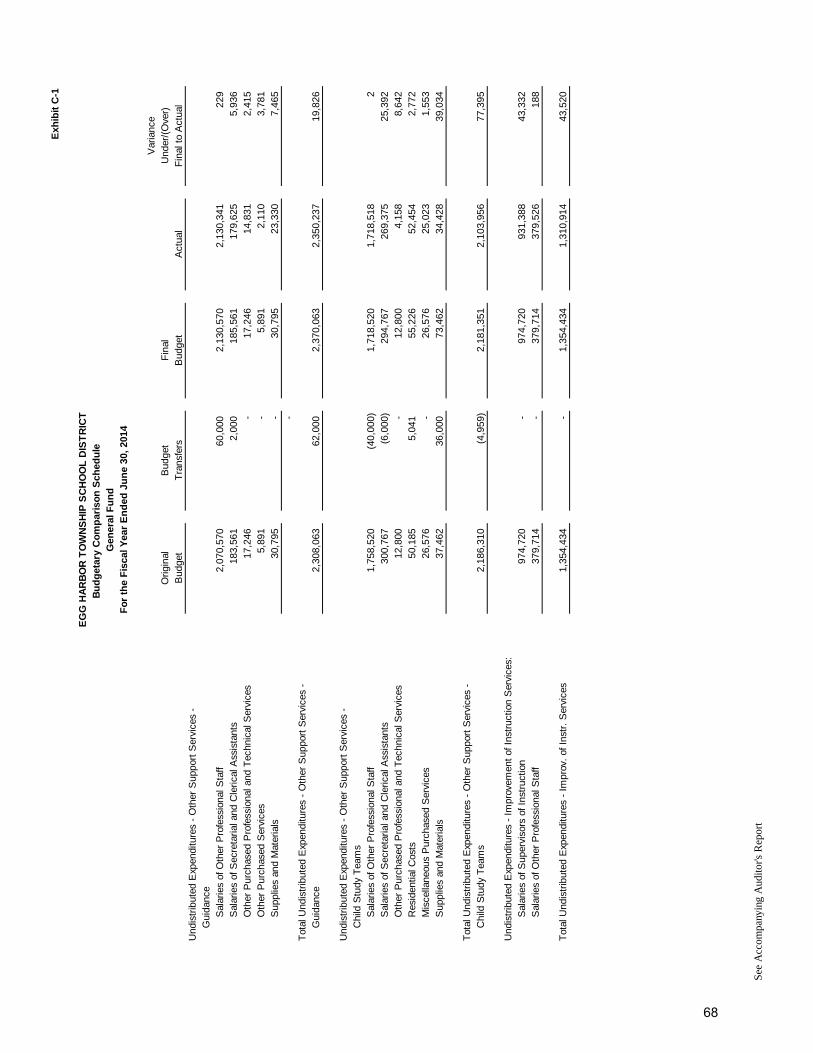
Exh
ibit
C-1
Var
ianc
eO
rigin
alB
udge
tF
inal
Und
er/(
Ove
r)B
udge
tT
rans
fers
Bud
get
Act
ual
Fin
al t
o A
ctua
l
Fo
r th
e F
isca
l Yea
r E
nd
ed J
un
e 30
, 20
14
EG
G H
AR
BO
R T
OW
NS
HIP
SC
HO
OL
DIS
TR
ICT
Bu
dg
etar
y C
om
par
iso
n S
ched
ule
G
ener
al F
un
d
Und
istr
ibut
ed E
xpen
ditu
res
- O
ther
Sup
port
Ser
vice
s -
Gui
danc
eS
alar
ies
of O
ther
Pro
fess
iona
l Sta
ff2,
070,
570
60
,000
2,
130,
570
2,13
0,34
1
229
S
alar
ies
of S
ecre
taria
l and
Cle
rical
Ass
ista
nts
183,
561
2,00
0
18
5,56
1
179,
625
5,
936
Oth
er P
urch
ased
Pro
fess
iona
l and
Tec
hnic
al S
ervi
ces
17,2
46
-
17
,246
14,8
31
2,41
5
O
ther
Pur
chas
ed S
ervi
ces
5,89
1
-
5,89
1
2,11
0
3,
781
Sup
plie
s an
d M
ater
ials
30,7
95
-
30
,795
23,3
30
7,46
5
-
Tot
al U
ndis
trib
uted
Exp
endi
ture
s -
Oth
er S
uppo
rt S
ervi
ces
-G
uida
nce
2,30
8,06
3
62,0
00
2,37
0,06
3
2,
350,
237
19
,826
Und
istr
ibut
ed E
xpen
ditu
res
- O
ther
Sup
port
Ser
vice
s -
Chi
ld S
tudy
Tea
ms
Sal
arie
s of
Oth
er P
rofe
ssio
nal S
taff
1,75
8,52
0
(40,
000)
1,71
8,52
0
1,
718,
518
2
S
alar
ies
of S
ecre
taria
l and
Cle
rical
Ass
ista
nts
300,
767
(6,0
00)
29
4,76
7
269,
375
25
,392
O
ther
Pur
chas
ed P
rofe
ssio
nal a
nd T
echn
ical
Ser
vice
s12
,800
-
12,8
00
4,
158
8,64
2
R
esid
entia
l Cos
ts50
,185
5,
041
55,2
26
52
,454
2,
772
Mis
cella
neou
s P
urch
ased
Ser
vice
s26
,576
-
26,5
76
25
,023
1,
553
Sup
plie
s an
d M
ater
ials
37,4
62
36,0
00
73,4
62
34
,428
39
,034
Tot
al U
ndis
trib
uted
Exp
endi
ture
s -
Oth
er S
uppo
rt S
ervi
ces
-C
hild
Stu
dy T
eam
s2,
186,
310
(4
,959
)
2,18
1,35
1
2,
103,
956
77
,395
Und
istr
ibut
ed E
xpen
ditu
res
- Im
prov
emen
t of
Ins
truc
tion
Ser
vice
s:S
alar
ies
of S
uper
viso
rs o
f Ins
truc
tion
974,
720
-
97
4,72
0
931,
388
43
,332
S
alar
ies
of O
ther
Pro
fess
iona
l Sta
ff37
9,71
4
-
379,
714
37
9,52
6
188
Tot
al U
ndis
trib
uted
Exp
endi
ture
s -
Impr
ov.
of I
nstr
. S
ervi
ces
1,35
4,43
4
-
1,
354,
434
1,31
0,91
4
43,5
20
See
Acc
ompa
nyin
g A
udito
r's R
epor
t
68
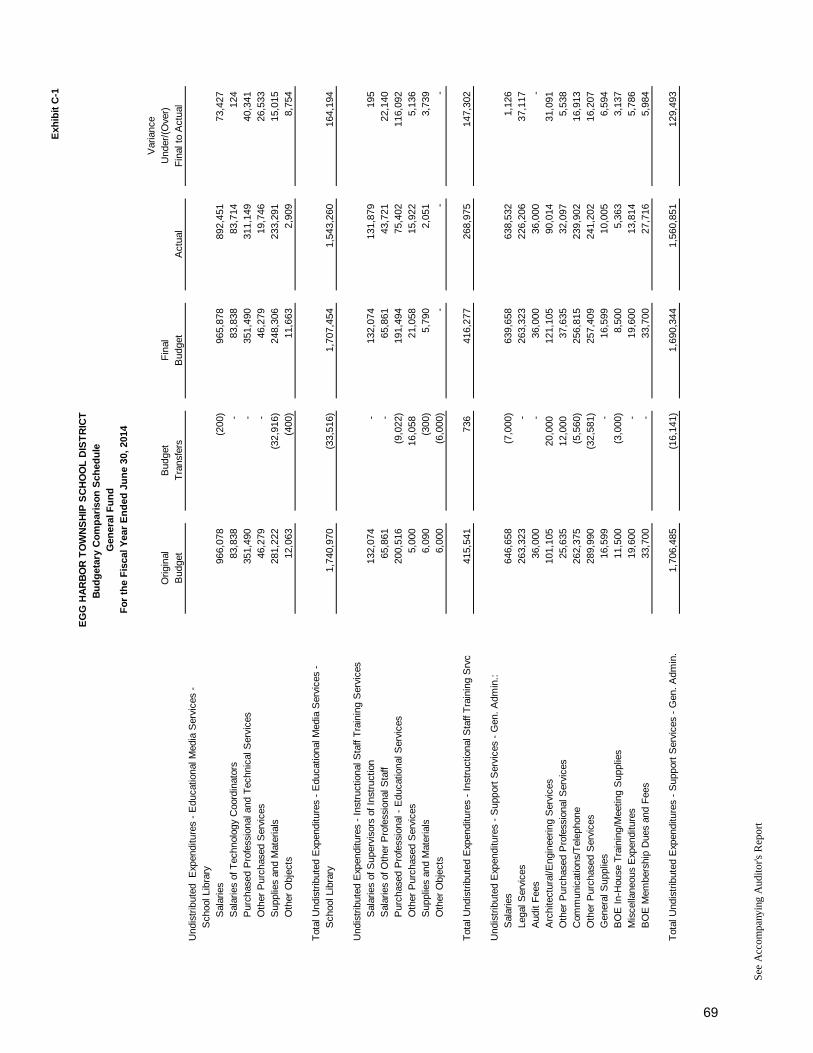
Exh
ibit
C-1
Var
ianc
eO
rigin
alB
udge
tF
inal
Und
er/(
Ove
r)B
udge
tT
rans
fers
Bud
get
Act
ual
Fin
al t
o A
ctua
l
Fo
r th
e F
isca
l Yea
r E
nd
ed J
un
e 30
, 20
14
EG
G H
AR
BO
R T
OW
NS
HIP
SC
HO
OL
DIS
TR
ICT
Bu
dg
etar
y C
om
par
iso
n S
ched
ule
G
ener
al F
un
d
Und
istr
ibut
ed
Exp
endi
ture
s -
Edu
catio
nal M
edia
Ser
vice
s -
Sch
ool L
ibra
ryS
alar
ies
966,
078
(200
)
965,
878
89
2,45
1
73,4
27
Sal
arie
s of
Tec
hnol
ogy
Coo
rdin
ator
s83
,838
-
83,8
38
83
,714
12
4
Pur
chas
ed P
rofe
ssio
nal a
nd T
echn
ical
Ser
vice
s35
1,49
0
-
351,
490
31
1,14
9
40,3
41
Oth
er P
urch
ased
Ser
vice
s46
,279
-
46,2
79
19
,746
26
,533
S
uppl
ies
and
Mat
eria
ls28
1,22
2
(3
2,91
6)
24
8,30
6
233,
291
15
,015
O
ther
Obj
ects
12,0
63
(400
)
11,6
63
2,
909
8,75
4
Tot
al U
ndis
trib
uted
Exp
endi
ture
s -
Edu
catio
nal M
edia
Ser
vice
s -
Sch
ool L
ibra
ry1,
740,
970
(3
3,51
6)
1,
707,
454
1,54
3,26
0
164,
194
Und
istr
ibut
ed E
xpen
ditu
res
- In
stru
ctio
nal S
taff
Tra
inin
g S
ervi
ces
Sal
arie
s of
Sup
ervi
sors
of I
nstr
uctio
n13
2,07
4
-
132,
074
13
1,87
9
195
S
alar
ies
of O
ther
Pro
fess
iona
l Sta
ff65
,861
-
65,8
61
43
,721
22
,140
P
urch
ased
Pro
fess
iona
l - E
duca
tiona
l Ser
vice
s20
0,51
6
(9
,022
)
191,
494
75
,402
11
6,09
2
O
ther
Pur
chas
ed S
ervi
ces
5,00
0
16
,058
21
,058
15,9
22
5,13
6
S
uppl
ies
and
Mat
eria
ls6,
090
(300
)
5,79
0
2,05
1
3,
739
Oth
er O
bjec
ts6,
000
(6,0
00)
-
-
-
Tot
al U
ndis
trib
uted
Exp
endi
ture
s -
Inst
ruct
iona
l Sta
ff T
rain
ing
Srv
c41
5,54
1
73
6
416,
277
26
8,97
5
147,
302
Und
istr
ibut
ed E
xpen
ditu
res
- S
uppo
rt S
ervi
ces
- G
en.
Adm
in.:
Sal
arie
s64
6,65
8
(7
,000
)
639,
658
63
8,53
2
1,12
6
Le
gal S
ervi
ces
263,
323
-
26
3,32
3
226,
206
37
,117
A
udit
Fee
s36
,000
-
36,0
00
36
,000
-
Arc
hite
ctur
al/E
ngin
eerin
g S
ervi
ces
101,
105
20,0
00
121,
105
90
,014
31
,091
O
ther
Pur
chas
ed P
rofe
ssio
nal S
ervi
ces
25,6
35
12,0
00
37,6
35
32
,097
5,
538
Com
mun
icat
ions
/Tel
epho
ne26
2,37
5
(5
,560
)
256,
815
23
9,90
2
16,9
13
Oth
er P
urch
ased
Ser
vice
s28
9,99
0
(3
2,58
1)
25
7,40
9
241,
202
16
,207
G
ener
al S
uppl
ies
16,5
99
-
16
,599
10,0
05
6,59
4
B
OE
In-
Hou
se T
rain
ing/
Mee
ting
Sup
plie
s11
,500
(3
,000
)
8,50
0
5,36
3
3,
137
Mis
cella
neou
s E
xpen
ditu
res
19,6
00
-
19
,600
13,8
14
5,78
6
B
OE
Mem
bers
hip
Due
s an
d F
ees
33,7
00
-
33
,700
27,7
16
5,98
4
Tot
al U
ndis
trib
uted
Exp
endi
ture
s -
Sup
port
Ser
vice
s -
Gen
. A
dmin
.1,
706,
485
(1
6,14
1)
1,
690,
344
1,56
0,85
1
129,
493
See
Acc
ompa
nyin
g A
udito
r's R
epor
t
69
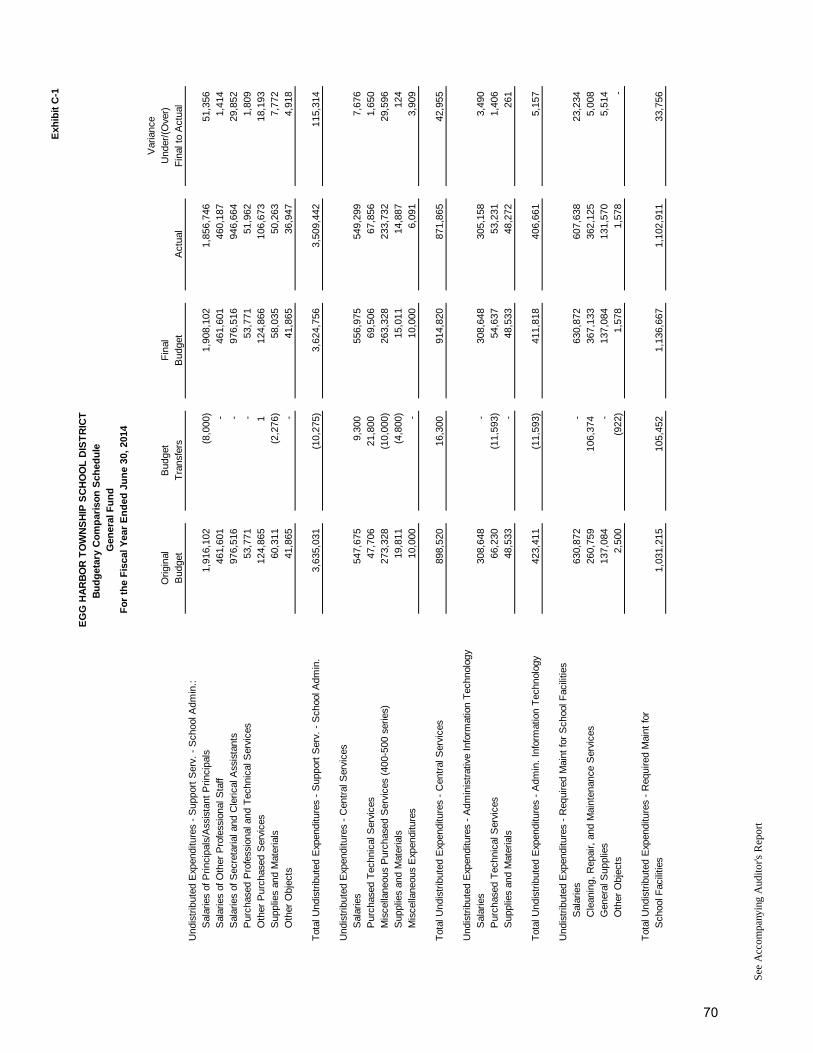
Exh
ibit
C-1
Var
ianc
eO
rigin
alB
udge
tF
inal
Und
er/(
Ove
r)B
udge
tT
rans
fers
Bud
get
Act
ual
Fin
al t
o A
ctua
l
Fo
r th
e F
isca
l Yea
r E
nd
ed J
un
e 30
, 20
14
EG
G H
AR
BO
R T
OW
NS
HIP
SC
HO
OL
DIS
TR
ICT
Bu
dg
etar
y C
om
par
iso
n S
ched
ule
G
ener
al F
un
d
Und
istr
ibut
ed E
xpen
ditu
res
- S
uppo
rt S
erv.
- S
choo
l Adm
in.:
Sal
arie
s of
Prin
cipa
ls/A
ssis
tant
Prin
cipa
ls1,
916,
102
(8
,000
)
1,90
8,10
2
1,
856,
746
51
,356
S
alar
ies
of O
ther
Pro
fess
iona
l Sta
ff46
1,60
1
-
461,
601
46
0,18
7
1,41
4
S
alar
ies
of S
ecre
taria
l and
Cle
rical
Ass
ista
nts
976,
516
-
97
6,51
6
946,
664
29
,852
P
urch
ased
Pro
fess
iona
l and
Tec
hnic
al S
ervi
ces
53,7
71
-
53
,771
51,9
62
1,80
9
O
ther
Pur
chas
ed S
ervi
ces
124,
865
1
124,
866
10
6,67
3
18,1
93
Sup
plie
s an
d M
ater
ials
60,3
11
(2,2
76)
58
,035
50,2
63
7,77
2
O
ther
Obj
ects
41,8
65
-
41
,865
36,9
47
4,91
8
Tot
al U
ndis
trib
uted
Exp
endi
ture
s -
Sup
port
Ser
v. -
Sch
ool A
dmin
.3,
635,
031
(1
0,27
5)
3,
624,
756
3,50
9,44
2
115,
314
Und
istr
ibut
ed E
xpen
ditu
res
- C
entr
al S
ervi
ces
Sal
arie
s54
7,67
5
9,
300
556,
975
54
9,29
9
7,67
6
P
urch
ased
Tec
hnic
al S
ervi
ces
47,7
06
21,8
00
69,5
06
67
,856
1,
650
Mis
cella
neou
s P
urch
ased
Ser
vice
s (4
00-5
00 s
erie
s)27
3,32
8
(1
0,00
0)
26
3,32
8
233,
732
29
,596
S
uppl
ies
and
Mat
eria
ls19
,811
(4
,800
)
15,0
11
14
,887
12
4
Mis
cella
neou
s E
xpen
ditu
res
10,0
00
-
10
,000
6,09
1
3,
909
Tot
al U
ndis
trib
uted
Exp
endi
ture
s -
Cen
tral
Ser
vice
s89
8,52
0
16
,300
91
4,82
0
871,
865
42
,955
Und
istr
ibut
ed E
xpen
ditu
res
- A
dmin
istr
ativ
e In
form
atio
n T
echn
olog
yS
alar
ies
308,
648
-
30
8,64
8
305,
158
3,
490
Pur
chas
ed T
echn
ical
Ser
vice
s66
,230
(1
1,59
3)
54
,637
53,2
31
1,40
6
S
uppl
ies
and
Mat
eria
ls48
,533
-
48,5
33
48
,272
26
1
Tot
al U
ndis
trib
uted
Exp
endi
ture
s -
Adm
in.
Info
rmat
ion
Tec
hnol
ogy
423,
411
(11,
593)
411,
818
40
6,66
1
5,15
7
Und
istr
ibut
ed E
xpen
ditu
res
- R
equi
red
Mai
nt fo
r S
choo
l Fac
ilitie
sS
alar
ies
630,
872
-
63
0,87
2
607,
638
23
,234
C
lean
ing,
Rep
air,
and
Mai
nten
ance
Ser
vice
s26
0,75
9
10
6,37
4
36
7,13
3
362,
125
5,
008
Gen
eral
Sup
plie
s13
7,08
4
-
137,
084
13
1,57
0
5,51
4
O
ther
Obj
ects
2,50
0
(9
22)
1,
578
1,
578
-
Tot
al U
ndis
trib
uted
Exp
endi
ture
s -
Req
uire
d M
aint
for
Sch
ool F
acili
ties
1,03
1,21
5
105,
452
1,13
6,66
7
1,
102,
911
33
,756
See
Acc
ompa
nyin
g A
udito
r's R
epor
t
70
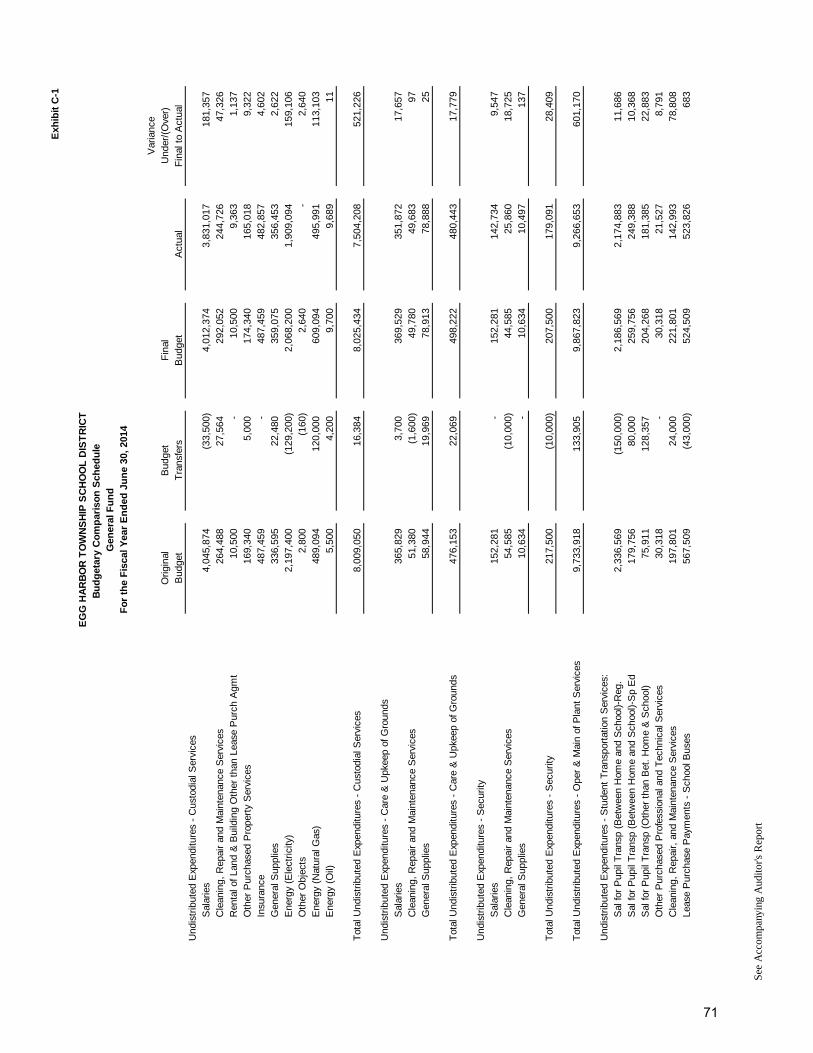
Exh
ibit
C-1
Var
ianc
eO
rigin
alB
udge
tF
inal
Und
er/(
Ove
r)B
udge
tT
rans
fers
Bud
get
Act
ual
Fin
al t
o A
ctua
l
Fo
r th
e F
isca
l Yea
r E
nd
ed J
un
e 30
, 20
14
EG
G H
AR
BO
R T
OW
NS
HIP
SC
HO
OL
DIS
TR
ICT
Bu
dg
etar
y C
om
par
iso
n S
ched
ule
G
ener
al F
un
d
Und
istr
ibut
ed E
xpen
ditu
res
- C
usto
dial
Ser
vice
sS
alar
ies
4,04
5,87
4
(33,
500)
4,01
2,37
4
3,
831,
017
18
1,35
7
C
lean
ing,
Rep
air
and
Mai
nten
ance
Ser
vice
s26
4,48
8
27
,564
29
2,05
2
244,
726
47
,326
R
enta
l of L
and
& B
uild
ing
Oth
er t
han
Leas
e P
urch
Agm
t10
,500
-
10,5
00
9,
363
1,13
7
O
ther
Pur
chas
ed P
rope
rty
Ser
vice
s16
9,34
0
5,
000
174,
340
16
5,01
8
9,32
2
In
sura
nce
487,
459
-
48
7,45
9
482,
857
4,
602
Gen
eral
Sup
plie
s33
6,59
5
22
,480
35
9,07
5
356,
453
2,
622
Ene
rgy
(Ele
ctric
ity)
2,19
7,40
0
(129
,200
)
2,06
8,20
0
1,
909,
094
15
9,10
6
O
ther
Obj
ects
2,80
0
(1
60)
2,
640
-
2,64
0
E
nerg
y (N
atur
al G
as)
489,
094
120,
000
609,
094
49
5,99
1
113,
103
Ene
rgy
(Oil)
5,50
0
4,
200
9,70
0
9,68
9
11
Tot
al U
ndis
trib
uted
Exp
endi
ture
s -
Cus
todi
al S
ervi
ces
8,00
9,05
0
16,3
84
8,02
5,43
4
7,
504,
208
52
1,22
6
Und
istr
ibut
ed E
xpen
ditu
res
- C
are
& U
pkee
p of
Gro
unds
Sal
arie
s36
5,82
9
3,
700
369,
529
35
1,87
2
17,6
57
Cle
anin
g, R
epai
r an
d M
aint
enan
ce S
ervi
ces
51,3
80
(1,6
00)
49
,780
49,6
83
97
G
ener
al S
uppl
ies
58,9
44
19,9
69
78,9
13
78
,888
25
Tot
al U
ndis
trib
uted
Exp
endi
ture
s -
Car
e &
Upk
eep
of G
roun
ds47
6,15
3
22
,069
49
8,22
2
480,
443
17
,779
Und
istr
ibut
ed E
xpen
ditu
res
- S
ecur
ityS
alar
ies
152,
281
-
15
2,28
1
142,
734
9,
547
Cle
anin
g, R
epai
r an
d M
aint
enan
ce S
ervi
ces
54,5
85
(10,
000)
44,5
85
25
,860
18
,725
G
ener
al S
uppl
ies
10,6
34
-
10
,634
10,4
97
137
Tot
al U
ndis
trib
uted
Exp
endi
ture
s -
Sec
urity
217,
500
(10,
000)
207,
500
17
9,09
1
28,4
09
Tot
al U
ndis
trib
uted
Exp
endi
ture
s -
Ope
r &
Mai
n of
Pla
nt S
ervi
ces
9,73
3,91
8
133,
905
9,86
7,82
3
9,
266,
653
60
1,17
0
Und
istr
ibut
ed E
xpen
ditu
res
- S
tude
nt T
rans
port
atio
n S
ervi
ces:
Sal
for
Pup
il T
rans
p (B
etw
een
Hom
e an
d S
choo
l)-R
eg.
2,33
6,56
9
(150
,000
)
2,18
6,56
9
2,
174,
883
11
,686
S
al fo
r P
upil
Tra
nsp
(Bet
wee
n H
ome
and
Sch
ool)-
Sp
Ed
179,
756
80,0
00
259,
756
24
9,38
8
10,3
68
Sal
for
Pup
il T
rans
p (O
ther
tha
n B
et.
Hom
e &
Sch
ool)
75,9
11
128,
357
204,
268
18
1,38
5
22,8
83
Oth
er P
urch
ased
Pro
fess
iona
l and
Tec
hnic
al S
ervi
ces
30,3
18
-
30
,318
21,5
27
8,79
1
C
lean
ing,
Rep
air,
and
Mai
nten
ance
Ser
vice
s19
7,80
1
24
,000
22
1,80
1
142,
993
78
,808
Le
ase
Pur
chas
e P
aym
ents
- S
choo
l Bus
es56
7,50
9
(4
3,00
0)
52
4,50
9
523,
826
68
3
See
Acc
ompa
nyin
g A
udito
r's R
epor
t
71
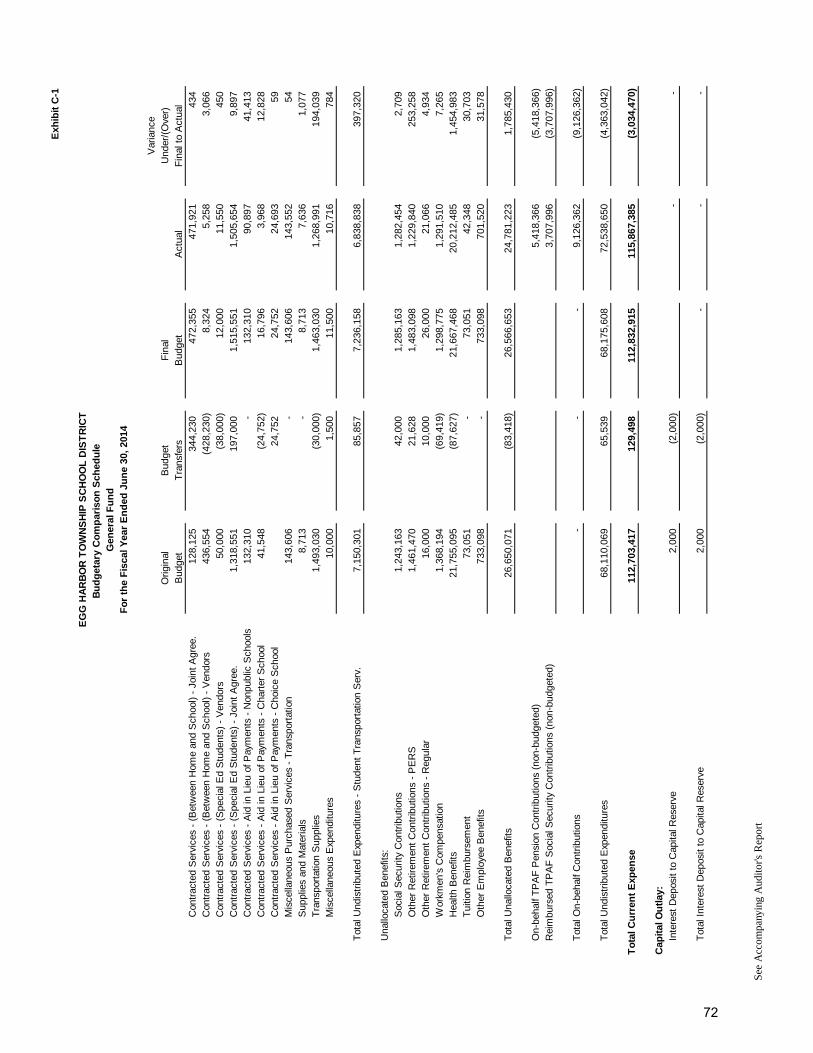
Exh
ibit
C-1
Var
ianc
eO
rigin
alB
udge
tF
inal
Und
er/(
Ove
r)B
udge
tT
rans
fers
Bud
get
Act
ual
Fin
al t
o A
ctua
l
Fo
r th
e F
isca
l Yea
r E
nd
ed J
un
e 30
, 20
14
EG
G H
AR
BO
R T
OW
NS
HIP
SC
HO
OL
DIS
TR
ICT
Bu
dg
etar
y C
om
par
iso
n S
ched
ule
G
ener
al F
un
d
Con
trac
ted
Ser
vice
s -
(Bet
wee
n H
ome
and
Sch
ool)
- Jo
int
Agr
ee.
128,
125
344,
230
472,
355
47
1,92
1
434
C
ontr
acte
d S
ervi
ces
- (B
etw
een
Hom
e an
d S
choo
l) -
Ven
dors
436,
554
(428
,230
)
8,32
4
5,25
8
3,
066
Con
trac
ted
Ser
vice
s -
(Spe
cial
Ed
Stu
dent
s) -
Ven
dors
50,0
00
(38,
000)
12,0
00
11
,550
45
0
Con
trac
ted
Ser
vice
s -
(Spe
cial
Ed
Stu
dent
s) -
Joi
nt A
gree
.1,
318,
551
19
7,00
0
1,
515,
551
1,50
5,65
4
9,89
7
C
ontr
acte
d S
ervi
ces
- A
id in
Lie
u of
Pay
men
ts -
Non
publ
ic S
choo
ls13
2,31
0
-
132,
310
90
,897
41
,413
C
ontr
acte
d S
ervi
ces
- A
id in
Lie
u of
Pay
men
ts -
Cha
rter
Sch
ool
41,5
48
(24,
752)
16,7
96
3,
968
12,8
28
Con
trac
ted
Ser
vice
s -
Aid
in L
ieu
of P
aym
ents
- C
hoic
e S
choo
l24
,752
24
,752
24,6
93
59
M
isce
llane
ous
Pur
chas
ed S
ervi
ces
- T
rans
port
atio
n14
3,60
6
-
143,
606
14
3,55
2
54
S
uppl
ies
and
Mat
eria
ls8,
713
-
8,
713
7,
636
1,07
7
T
rans
port
atio
n S
uppl
ies
1,49
3,03
0
(30,
000)
1,46
3,03
0
1,
268,
991
19
4,03
9
M
isce
llane
ous
Exp
endi
ture
s10
,000
1,
500
11,5
00
10
,716
78
4
Tot
al U
ndis
trib
uted
Exp
endi
ture
s -
Stu
dent
Tra
nspo
rtat
ion
Ser
v.7,
150,
301
85
,857
7,
236,
158
6,83
8,83
8
397,
320
Una
lloca
ted
Ben
efits
:S
ocia
l Sec
urity
Con
trib
utio
ns1,
243,
163
42
,000
1,
285,
163
1,28
2,45
4
2,70
9
O
ther
Ret
irem
ent
Con
trib
utio
ns -
PE
RS
1,46
1,47
0
21,6
28
1,48
3,09
8
1,
229,
840
25
3,25
8
O
ther
Ret
irem
ent
Con
trib
utio
ns -
Reg
ular
16,0
00
10,0
00
26,0
00
21
,066
4,
934
Wor
kmen
's C
ompe
nsat
ion
1,36
8,19
4
(69,
419)
1,29
8,77
5
1,
291,
510
7,
265
Hea
lth B
enef
its21
,755
,095
(87,
627)
21,6
67,4
68
20,2
12,4
85
1,
454,
983
Tui
tion
Rei
mbu
rsem
ent
73,0
51
-
73
,051
42,3
48
30,7
03
Oth
er E
mpl
oyee
Ben
efits
733,
098
-
73
3,09
8
701,
520
31
,578
Tot
al U
nallo
cate
d B
enef
its26
,650
,071
(83,
418)
26,5
66,6
53
24,7
81,2
23
1,
785,
430
On-
beha
lf T
PA
F P
ensi
on C
ontr
ibut
ions
(no
n-bu
dget
ed)
5,41
8,36
6
(5,4
18,3
66)
Rei
mbu
rsed
TP
AF
Soc
ial S
ecur
ity C
ontr
ibut
ions
(no
n-bu
dget
ed)
3,70
7,99
6
(3,7
07,9
96)
Tot
al O
n-be
half
Con
trib
utio
ns-
-
-
9,
126,
362
(9
,126
,362
)
Tot
al U
ndis
trib
uted
Exp
endi
ture
s68
,110
,069
65,5
39
68,1
75,6
08
72,5
38,6
50
(4
,363
,042
)
To
tal C
urr
ent
Exp
ense
112,
703,
417
12
9,49
8
11
2,83
2,91
5
11
5,86
7,38
5
(3,0
34,4
70)
Cap
ital
Ou
tlay
:In
tere
st D
epos
it to
Cap
ital R
eser
ve2,
000
(2,0
00)
-
-
Tot
al I
nter
est
Dep
osit
to C
apita
l Res
erve
2,00
0
(2
,000
)
-
-
-
See
Acc
ompa
nyin
g A
udito
r's R
epor
t
72
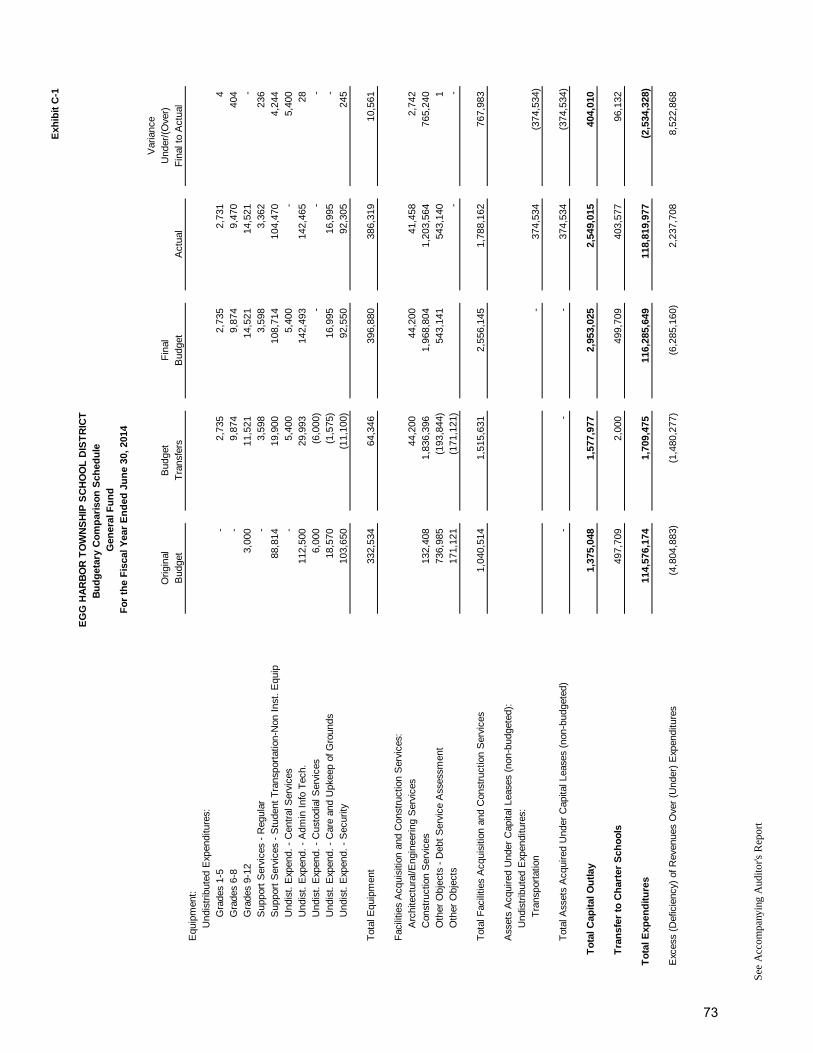
Exh
ibit
C-1
Var
ianc
eO
rigin
alB
udge
tF
inal
Und
er/(
Ove
r)B
udge
tT
rans
fers
Bud
get
Act
ual
Fin
al t
o A
ctua
l
Fo
r th
e F
isca
l Yea
r E
nd
ed J
un
e 30
, 20
14
EG
G H
AR
BO
R T
OW
NS
HIP
SC
HO
OL
DIS
TR
ICT
Bu
dg
etar
y C
om
par
iso
n S
ched
ule
G
ener
al F
un
d
Equ
ipm
ent:
Und
istr
ibut
ed E
xpen
ditu
res:
Gra
des
1-5
-
2,
735
2,73
5
2,73
1
4
G
rade
s 6-
8-
9,87
4
9,
874
9,
470
404
G
rade
s 9-
123,
000
11,5
21
14,5
21
14
,521
-
Sup
port
Ser
vice
s -
Reg
ular
-
3,
598
3,59
8
3,36
2
23
6
Sup
port
Ser
vice
s -
Stu
dent
Tra
nspo
rtat
ion-
Non
Ins
t. E
quip
88,8
14
19,9
00
108,
714
10
4,47
0
4,24
4
U
ndis
t. E
xpen
d. -
Cen
tral
Ser
vice
s-
5,40
0
5,
400
-
5,40
0
U
ndis
t. E
xpen
d. -
Adm
in I
nfo
Tec
h.11
2,50
0
29
,993
14
2,49
3
142,
465
28
Und
ist.
Exp
end.
- C
usto
dial
Ser
vice
s6,
000
(6,0
00)
-
-
-
U
ndis
t. E
xpen
d. -
Car
e an
d U
pkee
p of
Gro
unds
18,5
70
(1,5
75)
16
,995
16,9
95
-
U
ndis
t. E
xpen
d. -
Sec
urity
103,
650
(11,
100)
92,5
50
92
,305
24
5
Tot
al E
quip
men
t33
2,53
4
64
,346
39
6,88
0
386,
319
10
,561
Fac
ilitie
s A
cqui
sitio
n an
d C
onst
ruct
ion
Ser
vice
s:A
rchi
tect
ural
/Eng
inee
ring
Ser
vice
s44
,200
44
,200
41,4
58
2,74
2
C
onst
ruct
ion
Ser
vice
s13
2,40
8
1,
836,
396
1,96
8,80
4
1,
203,
564
76
5,24
0
O
ther
Obj
ects
- D
ebt
Ser
vice
Ass
essm
ent
736,
985
(193
,844
)
543,
141
54
3,14
0
1
Oth
er O
bjec
ts17
1,12
1
(1
71,1
21)
-
-
Tot
al F
acili
ties
Acq
uisi
tion
and
Con
stru
ctio
n S
ervi
ces
1,04
0,51
4
1,51
5,63
1
2,
556,
145
1,78
8,16
2
767,
983
Ass
ets
Acq
uire
d U
nder
Cap
ital L
ease
s (n
on-b
udge
ted)
:U
ndi s
tri b
uted
Exp
endi
ture
s:T
rans
port
atio
n-
37
4,53
4
(374
,534
)
Tot
al A
sset
s A
cqui
red
Und
er C
apita
l Lea
ses
(non
-bud
gete
d)-
-
-
37
4,53
4
(374
,534
)
To
tal C
apit
al O
utl
ay1,
375,
048
1,
577,
977
2,95
3,02
5
2,
549,
015
40
4,01
0
Tra
nsf
er t
o C
har
ter
Sch
oo
ls49
7,70
9
2,
000
499,
709
40
3,57
7
96,1
32
To
tal E
xpen
dit
ure
s11
4,57
6,17
4
1,70
9,47
5
11
6,28
5,64
9
11
8,81
9,97
7
(2,5
34,3
28)
Exc
ess
(Def
icie
ncy)
of R
even
ues
Ove
r (U
nder
) E
xpen
ditu
res
(4,8
04,8
83)
(1,4
80,2
77)
(6,2
85,1
60)
2,
237,
708
8,
522,
868
See
Acc
ompa
nyin
g A
udito
r's R
epor
t
73
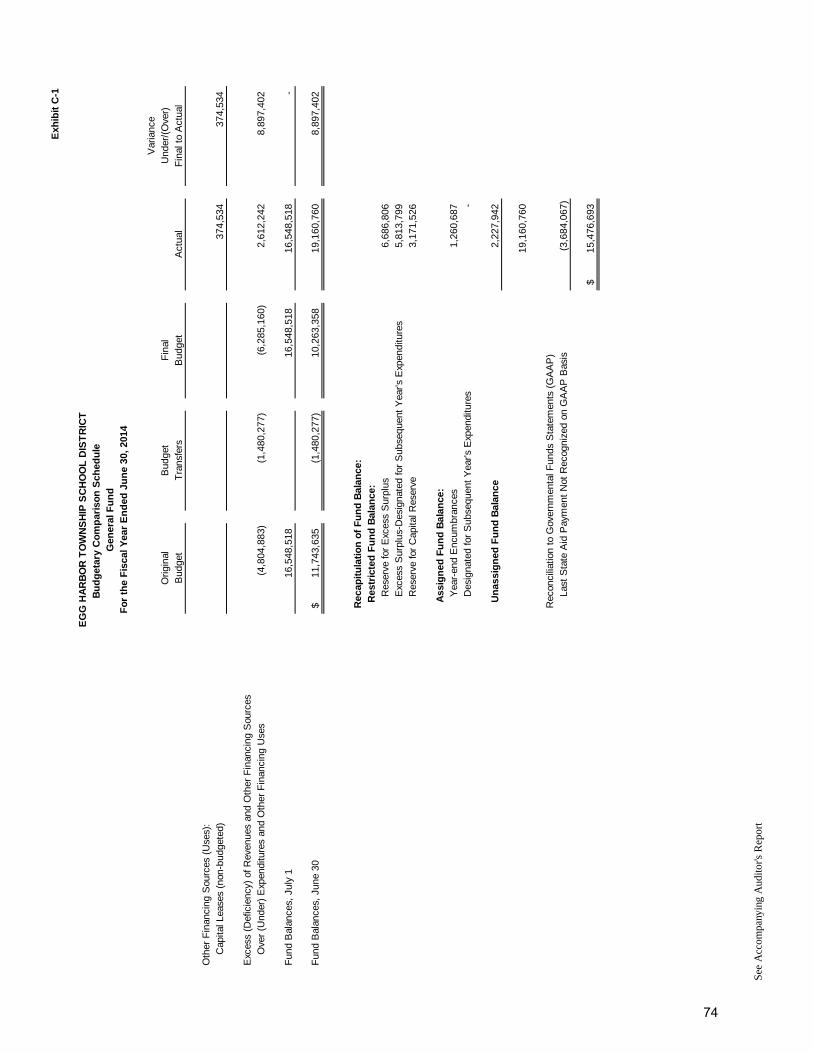
Exh
ibit
C-1
Var
ianc
eO
rigin
alB
udge
tF
inal
Und
er/(
Ove
r)B
udge
tT
rans
fers
Bud
get
Act
ual
Fin
al t
o A
ctua
l
Fo
r th
e F
isca
l Yea
r E
nd
ed J
un
e 30
, 20
14
EG
G H
AR
BO
R T
OW
NS
HIP
SC
HO
OL
DIS
TR
ICT
Bu
dg
etar
y C
om
par
iso
n S
ched
ule
G
ener
al F
un
d
Oth
er F
inan
cing
Sou
rces
(U
ses)
:C
apita
l Lea
ses
(non
-bud
gete
d)37
4,53
4
374,
534
Exc
ess
(Def
icie
ncy)
of R
even
ues
and
Oth
er F
inan
cing
Sou
rces
Ove
r (U
nder
) E
xpen
ditu
res
and
Oth
er F
inan
cing
Use
s(4
,804
,883
)
(1
,480
,277
)
(6
,285
,160
)
2,61
2,24
2
8,89
7,40
2
Fun
d B
alan
ces,
Jul
y 1
16,5
48,5
18
16
,548
,518
16
,548
,518
-
Fun
d B
alan
ces,
Jun
e 30
11,7
43,6
35$
(1,4
80,2
77)
10,2
63,3
58
19,1
60,7
60
8,
897,
402
Rec
apit
ula
tio
n o
f F
un
d B
alan
ce:
R
estr
icte
d F
un
d B
alan
ce:
Res
erve
for
Exc
ess
Sur
plus
6,68
6,80
6
Exc
ess
Sur
plus
-Des
igna
ted
for
Sub
sequ
ent
Yea
r's E
xpen
ditu
res
5,81
3,79
9
Res
erve
for
Cap
ital R
eser
ve3,
171,
526
A
ssig
ned
Fu
nd
Bal
ance
:
Y
ear-
end
Enc
umbr
ance
s1,
260,
687
D
esig
nate
d fo
r S
ubse
quen
t Y
ear's
Exp
endi
ture
s-
U
nas
sig
ned
Fu
nd
Bal
ance
2,22
7,94
2
19
,160
,760
Rec
onci
liatio
n to
Gov
ernm
enta
l Fun
ds S
tate
men
ts (
GA
AP
)
La
st S
tate
Aid
Pay
men
t N
ot R
ecog
nize
d on
GA
AP
Bas
is(3
,684
,067
)
15
,476
,693
$
See
Acc
ompa
nyin
g A
udito
r's R
epor
t
74
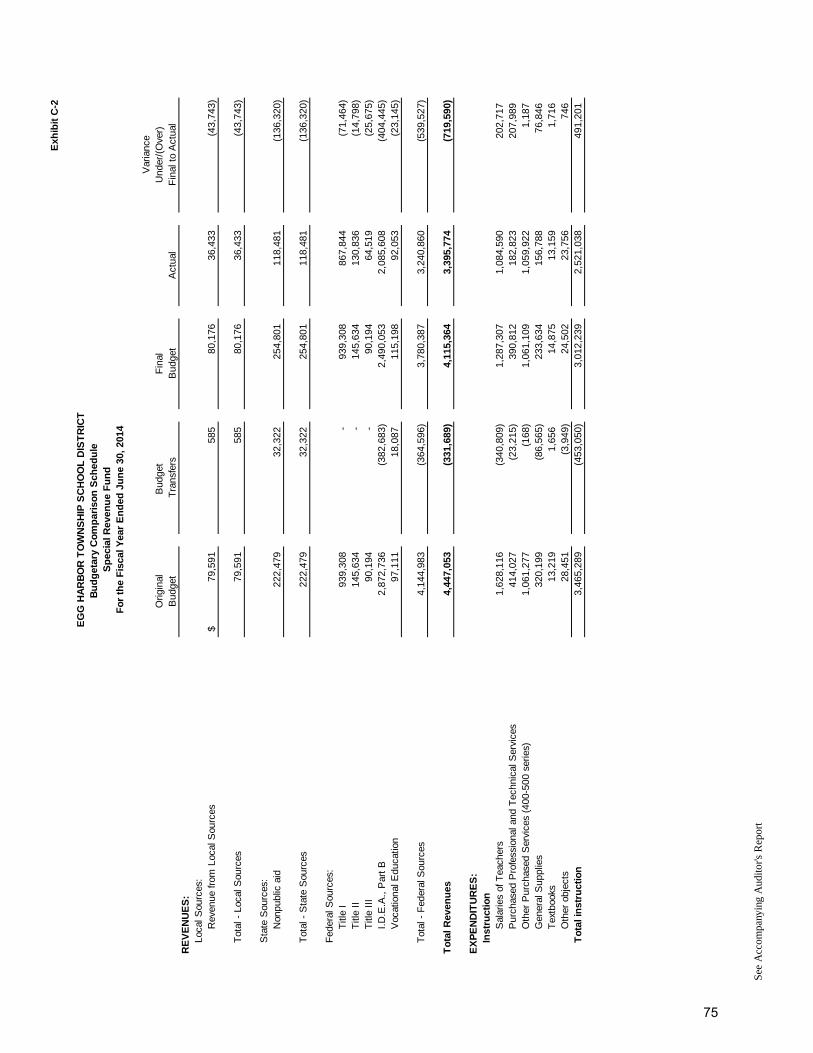
Exh
ibit
C-2
Var
ianc
eO
rigin
alB
udge
t F
inal
Und
er/(
Ove
r)B
udge
tT
rans
fers
Bud
get
Act
ual
Fin
al t
o A
ctua
lR
EV
EN
UE
S:
Loca
l Sou
rces
:R
even
ue fr
om L
ocal
Sou
rces
79,5
91$
585
80
,176
36
,433
(43,
743)
Tot
al -
Loc
al S
ourc
es79
,591
58
5
80,1
76
36,4
33
(4
3,74
3)
Sta
te S
ourc
es:
Non
publ
ic a
id22
2,47
9
32
,322
25
4,80
1
11
8,48
1
(136
,320
)
Tot
al -
Sta
te S
ourc
es22
2,47
9
32
,322
25
4,80
1
11
8,48
1
(136
,320
)
Fed
eral
Sou
rces
:T
itle
I93
9,30
8
-
939,
308
867,
844
(7
1,46
4)
Titl
e II
145,
634
-
14
5,63
4
13
0,83
6
(14,
798)
T
itle
III
90,1
94
-
90
,194
64
,519
(25,
675)
I.
D.E
.A.,
Par
t B
2,87
2,73
6
(382
,683
)
2,
490,
053
2,
085,
608
(4
04,4
45)
Voc
atio
nal E
duca
tion
97,1
11
18,0
87
115,
198
92,0
53
(2
3,14
5)
Tot
al -
Fed
eral
Sou
rces
4,14
4,98
3
(364
,596
)
3,
780,
387
3,
240,
860
(5
39,5
27)
To
tal R
even
ues
4,44
7,05
3
(331
,689
)
4,
115,
364
3,
395,
774
(7
19,5
90)
EX
PE
ND
ITU
RE
S:
Inst
ruct
ion
Sal
arie
s of
Tea
cher
s1,
628,
116
(3
40,8
09)
1,28
7,30
7
1,08
4,59
0
202,
717
P
urch
ased
Pro
fess
iona
l and
Tec
hnic
al S
ervi
ces
414,
027
(23,
215)
390,
812
182,
823
20
7,98
9
Oth
er P
urch
ased
Ser
vice
s (4
00-5
00 s
erie
s)1,
061,
277
(1
68)
1,
061,
109
1,
059,
922
1,
187
Gen
eral
Sup
plie
s32
0,19
9
(8
6,56
5)
23
3,63
4
15
6,78
8
76,8
46
Tex
tboo
ks13
,219
1,
656
14,8
75
13,1
59
1,
716
Oth
er o
bjec
ts28
,451
(3
,949
)
24,5
02
23,7
56
74
6
T
ota
l in
stru
ctio
n3,
465,
289
(4
53,0
50)
3,01
2,23
9
2,52
1,03
8
491,
201
Fo
r th
e F
isca
l Yea
r E
nd
ed J
un
e 30
, 20
14
EG
G H
AR
BO
R T
OW
NS
HIP
SC
HO
OL
DIS
TR
ICT
Bu
dg
etar
y C
om
par
iso
n S
ched
ule
S
pec
ial R
even
ue
Fu
nd
See
Acc
ompa
nyin
g A
udito
r's R
epor
t
75
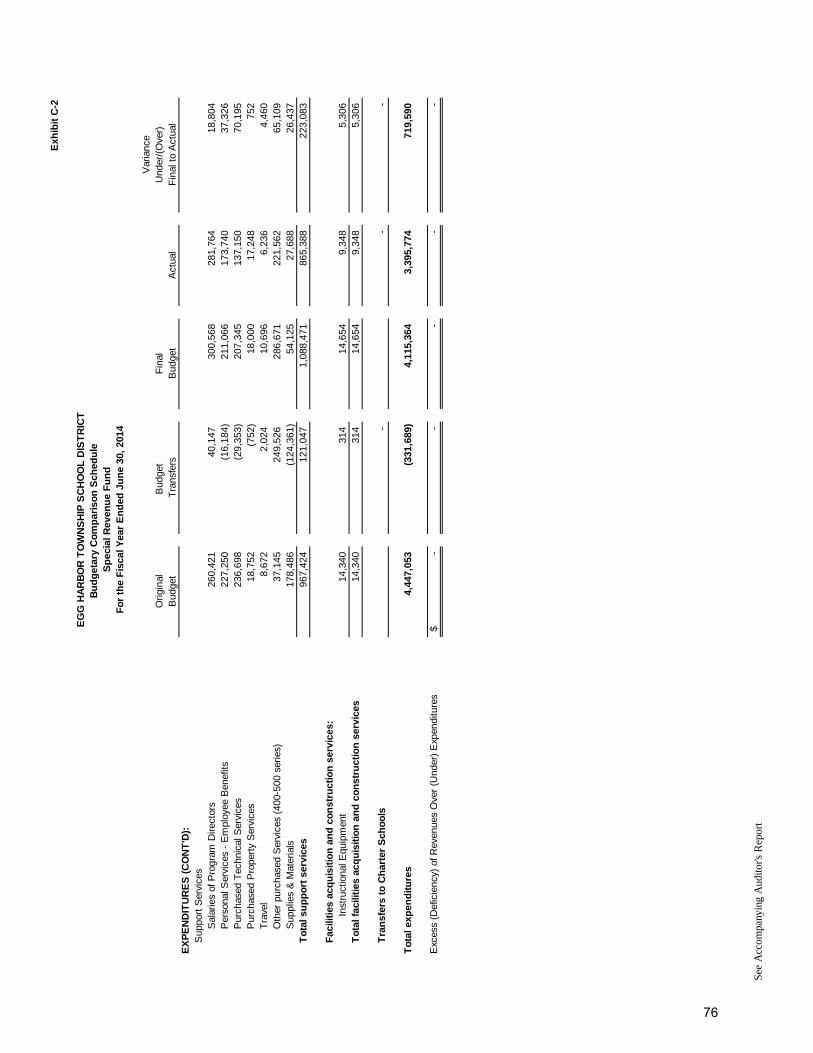
Exh
ibit
C-2
Var
ianc
eO
rigin
alB
udge
t F
inal
Und
er/(
Ove
r)B
udge
tT
rans
fers
Bud
get
Act
ual
Fin
al t
o A
ctua
l
Fo
r th
e F
isca
l Yea
r E
nd
ed J
un
e 30
, 20
14
EG
G H
AR
BO
R T
OW
NS
HIP
SC
HO
OL
DIS
TR
ICT
Bu
dg
etar
y C
om
par
iso
n S
ched
ule
S
pec
ial R
even
ue
Fu
nd
EX
PE
ND
ITU
RE
S (
CO
NT
'D):
Sup
port
Ser
vice
sS
alar
ies
of P
rogr
am D
irect
ors
260,
421
40,1
47
300,
568
281,
764
18
,804
P
erso
nal S
ervi
ces
- E
mpl
oyee
Ben
efits
227,
250
(16,
184)
211,
066
173,
740
37
,326
P
urch
ased
Tec
hnic
al S
ervi
ces
236,
698
(29,
353)
207,
345
137,
150
70
,195
P
urch
ased
Pro
pert
y S
ervi
ces
18,7
52
(752
)
18,0
00
17,2
48
75
2
T
rave
l8,
672
2,02
4
10
,696
6,
236
4,
460
Oth
er p
urch
ased
Ser
vice
s (4
00-5
00 s
erie
s)37
,145
24
9,52
6
28
6,67
1
22
1,56
2
65,1
09
Sup
plie
s &
Mat
eria
ls17
8,48
6
(1
24,3
61)
54,1
25
27,6
88
26
,437
T
ota
l su
pp
ort
ser
vice
s96
7,42
4
12
1,04
7
1,
088,
471
86
5,38
8
223,
083
Fac
iliti
es a
cqu
isit
ion
an
d c
on
stru
ctio
n s
ervi
ces:
Inst
ruct
iona
l Equ
ipm
ent
14,3
40
314
14
,654
9,
348
5,
306
To
tal f
acili
ties
acq
uis
itio
n a
nd
co
nst
ruct
ion
ser
vice
s14
,340
31
4
14,6
54
9,34
8
5,30
6
Tra
nsf
ers
to C
har
ter
Sch
oo
ls-
-
-
To
tal e
xpen
dit
ure
s4,
447,
053
(3
31,6
89)
4,11
5,36
4
3,39
5,77
4
719,
590
Exc
ess
(Def
icie
ncy)
of R
even
ues
Ove
r (U
nder
) E
xpen
ditu
res
-$
-
-
-
-
See
Acc
ompa
nyin
g A
udito
r's R
epor
t
76
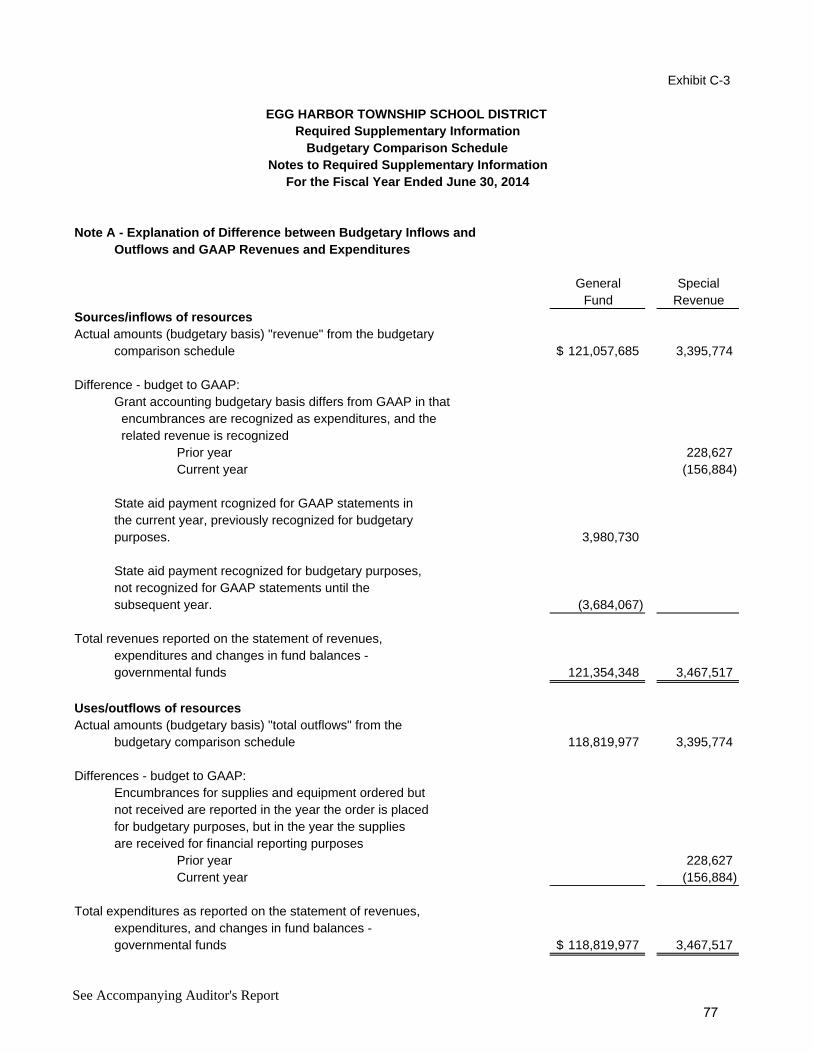
Exhibit C-3
Note A - Explanation of Difference between Budgetary Inflows andOutflows and GAAP Revenues and Expenditures
General SpecialFund Revenue
Sources/inflows of resourcesActual amounts (budgetary basis) "revenue" from the budgetary
comparison schedule 121,057,685$ 3,395,774
Difference - budget to GAAP:Grant accounting budgetary basis differs from GAAP in that encumbrances are recognized as expenditures, and the related revenue is recognized
Prior year 228,627 Current year (156,884)
State aid payment rcognized for GAAP statements inthe current year, previously recognized for budgetarypurposes. 3,980,730
State aid payment recognized for budgetary purposes,not recognized for GAAP statements until thesubsequent year. (3,684,067)
Total revenues reported on the statement of revenues,expenditures and changes in fund balances -governmental funds 121,354,348 3,467,517
Uses/outflows of resourcesActual amounts (budgetary basis) "total outflows" from the
budgetary comparison schedule 118,819,977 3,395,774
Differences - budget to GAAP:Encumbrances for supplies and equipment ordered butnot received are reported in the year the order is placedfor budgetary purposes, but in the year the suppliesare received for financial reporting purposes
Prior year 228,627 Current year (156,884)
Total expenditures as reported on the statement of revenues,expenditures, and changes in fund balances -governmental funds 118,819,977$ 3,467,517
For the Fiscal Year Ended June 30, 2014
EGG HARBOR TOWNSHIP SCHOOL DISTRICTRequired Supplementary Information
Budgetary Comparison ScheduleNotes to Required Supplementary Information
See Accompanying Auditor's Report77

{THIS PAGE IS INTENTIONALLY LEFT BLANK}

SPECIAL REVENUE FUND

{THIS PAGE IS INTENTIONALLY LEFT BLANK}
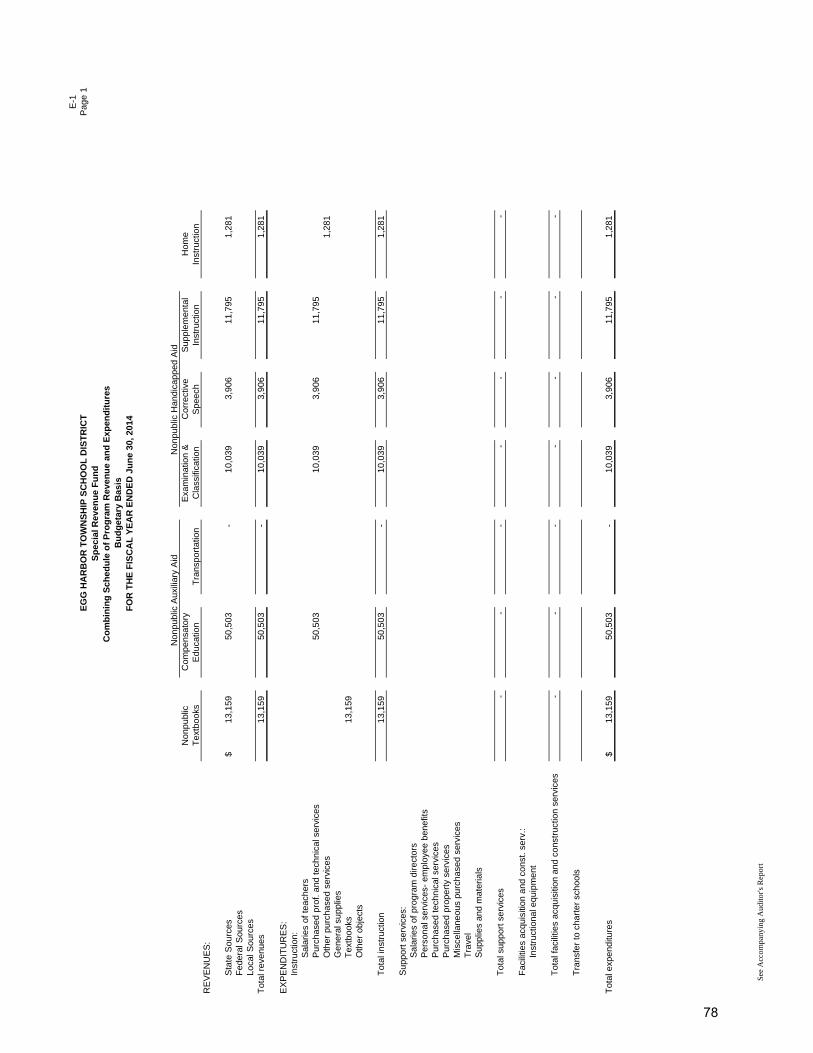
E-1
EG
G H
AR
BO
R T
OW
NS
HIP
SC
HO
OL
DIS
TR
ICT
Pag
e 1
Sp
ecia
l Rev
enu
e F
un
dC
om
bin
ing
Sch
edu
le o
f P
rog
ram
Rev
enu
e an
d E
xpen
dit
ure
sB
ud
get
ary
Bas
isF
OR
TH
E F
ISC
AL
YE
AR
EN
DE
D J
un
e 30
, 201
4
Non
publ
ic A
uxili
ary
Aid
Non
publ
ic H
andi
capp
ed A
idN
onpu
blic
Com
pens
ator
yE
xam
inat
ion
&C
orre
ctiv
eS
uppl
emen
tal
Hom
eT
extb
ooks
Edu
catio
nT
rans
port
atio
nC
lass
ifica
tion
Spe
ech
Inst
ruct
ion
Inst
ruct
ion
RE
VE
NU
ES
:
Sta
te S
ourc
es13
,159
$
50
,503
-
10
,039
3,
906
11,7
95
1,28
1
F
eder
al S
ourc
esLo
cal S
ourc
esT
otal
rev
enue
s13
,159
50
,503
-
10
,039
3,
906
11,7
95
1,28
1
EX
PE
ND
ITU
RE
S:
Inst
ruct
ion:
Sal
arie
s of
teac
hers
Pur
chas
ed p
rof.
and
tech
nica
l ser
vice
s50
,503
10
,039
3,
906
11,7
95
Oth
er p
urch
ased
ser
vice
s1,
281
Gen
eral
sup
plie
sT
extb
ooks
13,1
59
Oth
er o
bjec
ts
Tot
al in
stru
ctio
n13
,159
50
,503
-
10
,039
3,
906
11,7
95
1,28
1
Sup
port
ser
vice
s:S
alar
ies
of p
rogr
am d
irect
ors
Per
sona
l ser
vice
s- e
mpl
oyee
ben
efits
Pur
chas
ed te
chni
cal s
ervi
ces
Pur
chas
ed p
rope
rty
serv
ices
Mis
cella
neou
s pu
rcha
sed
serv
ices
Tra
vel
Sup
plie
s an
d m
ater
ials
Tot
al s
uppo
rt s
ervi
ces
-
-
-
-
-
-
-
Fac
ilitie
s ac
quis
ition
and
con
st. s
erv.
:In
stru
ctio
nal e
quip
men
t
Tot
al fa
cilit
ies
acqu
isiti
on a
nd c
onst
ruct
ion
serv
ices
-
-
-
-
-
-
-
Tra
nsfe
r to
cha
rter
sch
ools
Tot
al e
xpen
ditu
res
13,1
59$
50,5
03
-
10,0
39
3,90
6
11
,795
1,
281
See
Acc
ompa
nyin
g A
udit
or's
Rep
ort
78
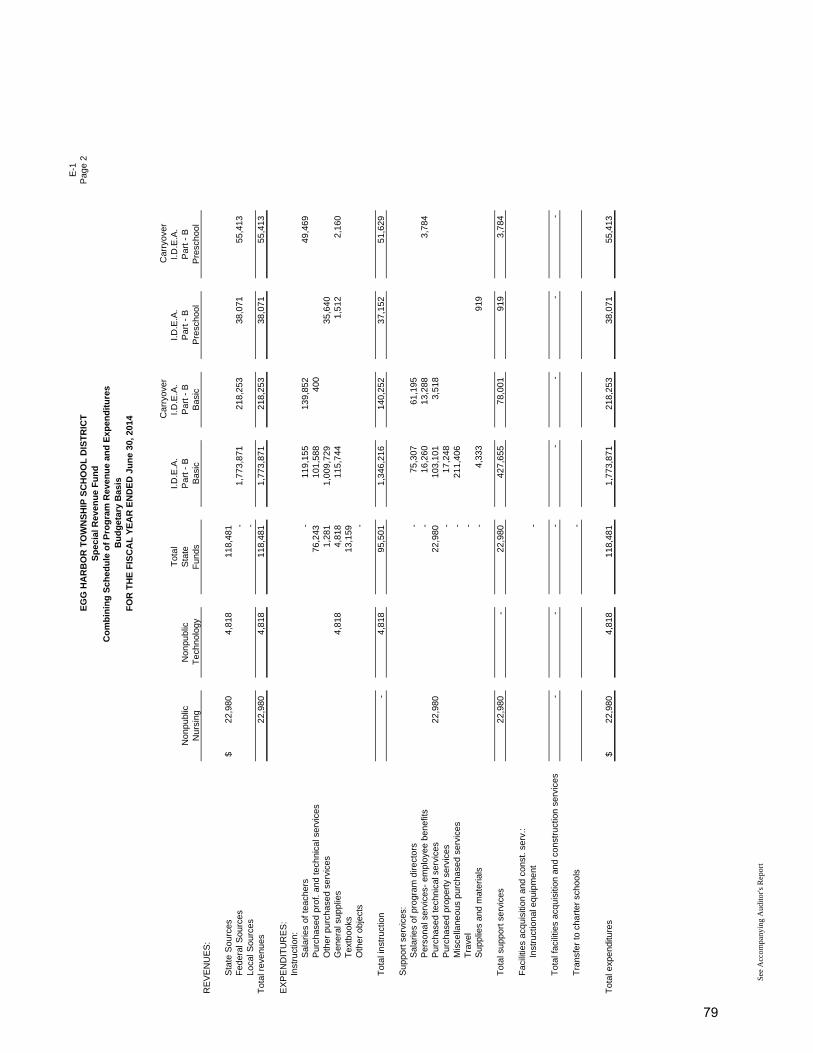
E-1
EG
G H
AR
BO
R T
OW
NS
HIP
SC
HO
OL
DIS
TR
ICT
Pag
e 2
Sp
ecia
l Rev
enu
e F
un
dC
om
bin
ing
Sch
edu
le o
f P
rog
ram
Rev
enu
e an
d E
xpen
dit
ure
sB
ud
get
ary
Bas
isF
OR
TH
E F
ISC
AL
YE
AR
EN
DE
D J
un
e 30
, 201
4 Car
ryov
erC
arry
over
Tot
alI.D
.E.A
.I.D
.E.A
.I.D
.E.A
.I.D
.E.A
.N
onpu
blic
Non
publ
icS
tate
Par
t - B
Par
t - B
Par
t - B
Par
t - B
Nur
sing
Tec
hnol
ogy
Fun
dsB
asic
Bas
icP
resc
hool
Pre
scho
olR
EV
EN
UE
S:
Sta
te S
ourc
es22
,980
$
4,
818
118,
481
F
eder
al S
ourc
es-
1,
773,
871
21
8,25
3
38,0
71
55,4
13
Loca
l Sou
rces
-
Tot
al r
even
ues
22,9
80
4,81
8
11
8,48
1
1,77
3,87
1
218,
253
38
,071
55
,413
EX
PE
ND
ITU
RE
S:
Inst
ruct
ion:
Sal
arie
s of
teac
hers
-
119,
155
139,
852
49
,469
P
urch
ased
pro
f. an
d te
chni
cal s
ervi
ces
76,2
43
10
1,58
8
40
0
Oth
er p
urch
ased
ser
vice
s1,
281
1,00
9,72
9
35,6
40
Gen
eral
sup
plie
s4,
818
4,81
8
11
5,74
4
1,
512
2,16
0
T
extb
ooks
13,1
59
O
ther
obj
ects
-
Tot
al in
stru
ctio
n-
4,
818
95,5
01
1,
346,
216
14
0,25
2
37,1
52
51,6
29
Sup
port
ser
vice
s:S
alar
ies
of p
rogr
am d
irect
ors
-
75,3
07
61,1
95
Per
sona
l ser
vice
s- e
mpl
oyee
ben
efits
-
16,2
60
13,2
88
3,78
4
P
urch
ased
tech
nica
l ser
vice
s22
,980
22
,980
103,
101
3,51
8
P
urch
ased
pro
pert
y se
rvic
es-
17
,248
M
isce
llane
ous
purc
hase
d se
rvic
es-
21
1,40
6
T
rave
l-
S
uppl
ies
and
mat
eria
ls-
4,
333
91
9
Tot
al s
uppo
rt s
ervi
ces
22,9
80
-
22,9
80
42
7,65
5
78
,001
91
9
3,78
4
Fac
ilitie
s ac
quis
ition
and
con
st. s
erv.
:In
stru
ctio
nal e
quip
men
t-
Tot
al fa
cilit
ies
acqu
isiti
on a
nd c
onst
ruct
ion
serv
ices
-
-
-
-
-
-
-
Tra
nsfe
r to
cha
rter
sch
ools
-
Tot
al e
xpen
ditu
res
22,9
80$
4,81
8
11
8,48
1
1,77
3,87
1
218,
253
38
,071
55
,413
See
Acc
ompa
nyin
g A
udit
or's
Rep
ort
79
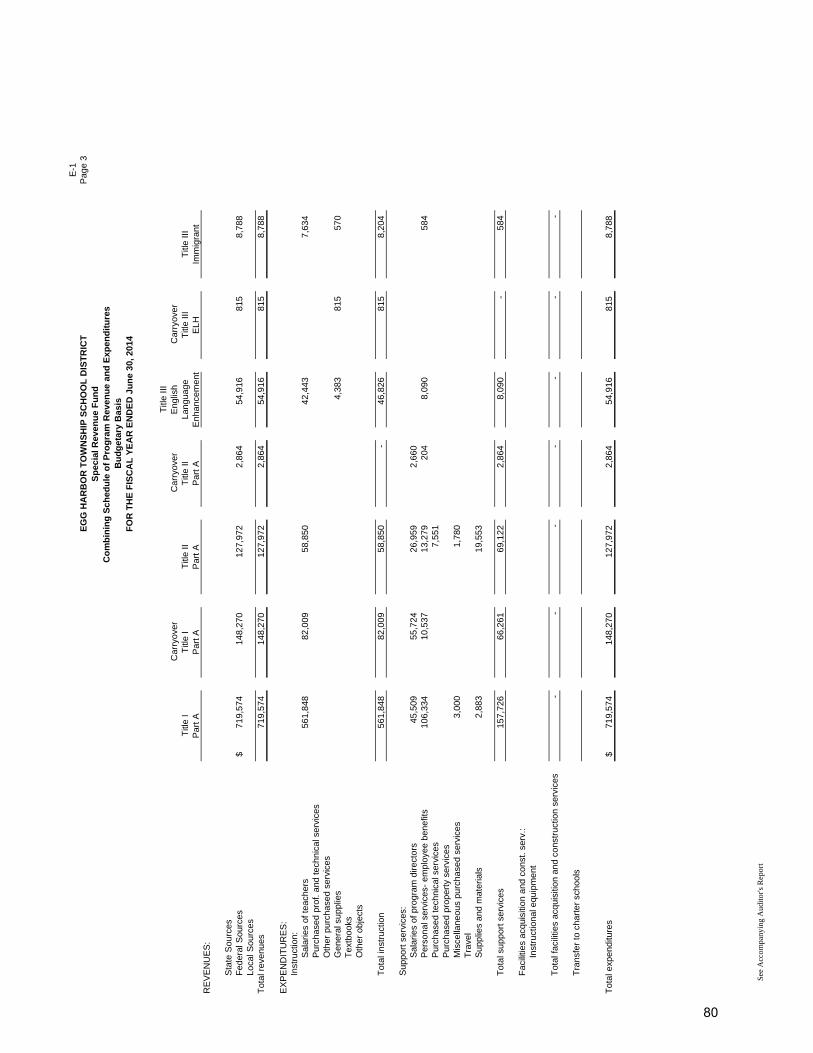
E-1
EG
G H
AR
BO
R T
OW
NS
HIP
SC
HO
OL
DIS
TR
ICT
Pag
e 3
Sp
ecia
l Rev
enu
e F
un
dC
om
bin
ing
Sch
edu
le o
f P
rog
ram
Rev
enu
e an
d E
xpen
dit
ure
sB
ud
get
ary
Bas
isF
OR
TH
E F
ISC
AL
YE
AR
EN
DE
D J
un
e 30
, 201
4
Titl
e III
Car
ryov
erC
arry
over
Eng
lish
Car
ryov
erT
itle
IT
itle
IT
itle
IIT
itle
IILa
ngua
geT
itle
IIIT
itle
IIIP
art A
Par
t AP
art A
Par
t AE
nhan
cem
ent
ELH
Imm
igra
ntR
EV
EN
UE
S:
Sta
te S
ourc
esF
eder
al S
ourc
es71
9,57
4$
148,
270
12
7,97
2
2,86
4
54,9
16
815
8,
788
Loca
l Sou
rces
Tot
al r
even
ues
719,
574
14
8,27
0
127,
972
2,
864
54
,916
81
5
8,78
8
EX
PE
ND
ITU
RE
S:
Inst
ruct
ion:
Sal
arie
s of
teac
hers
561,
848
82
,009
58
,850
42,4
43
7,63
4
P
urch
ased
pro
f. an
d te
chni
cal s
ervi
ces
Oth
er p
urch
ased
ser
vice
sG
ener
al s
uppl
ies
4,38
3
81
5
570
T
extb
ooks
Oth
er o
bjec
ts
Tot
al in
stru
ctio
n56
1,84
8
82,0
09
58,8
50
-
46,8
26
815
8,
204
Sup
port
ser
vice
s:S
alar
ies
of p
rogr
am d
irect
ors
45,5
09
55,7
24
26,9
59
2,
660
P
erso
nal s
ervi
ces-
em
ploy
ee b
enef
its10
6,33
4
10,5
37
13,2
79
20
4
8,
090
584
P
urch
ased
tech
nica
l ser
vice
s7,
551
Pur
chas
ed p
rope
rty
serv
ices
Mis
cella
neou
s pu
rcha
sed
serv
ices
3,00
0
1,
780
Tra
vel
Sup
plie
s an
d m
ater
ials
2,88
3
19
,553
Tot
al s
uppo
rt s
ervi
ces
157,
726
66
,261
69
,122
2,86
4
8,09
0
-
584
Fac
ilitie
s ac
quis
ition
and
con
st. s
erv.
:In
stru
ctio
nal e
quip
men
t
Tot
al fa
cilit
ies
acqu
isiti
on a
nd c
onst
ruct
ion
serv
ices
-
-
-
-
-
-
-
Tra
nsfe
r to
cha
rter
sch
ools
Tot
al e
xpen
ditu
res
719,
574
$
14
8,27
0
127,
972
2,
864
54
,916
81
5
8,78
8
See
Acc
ompa
nyin
g A
udit
or's
Rep
ort
80
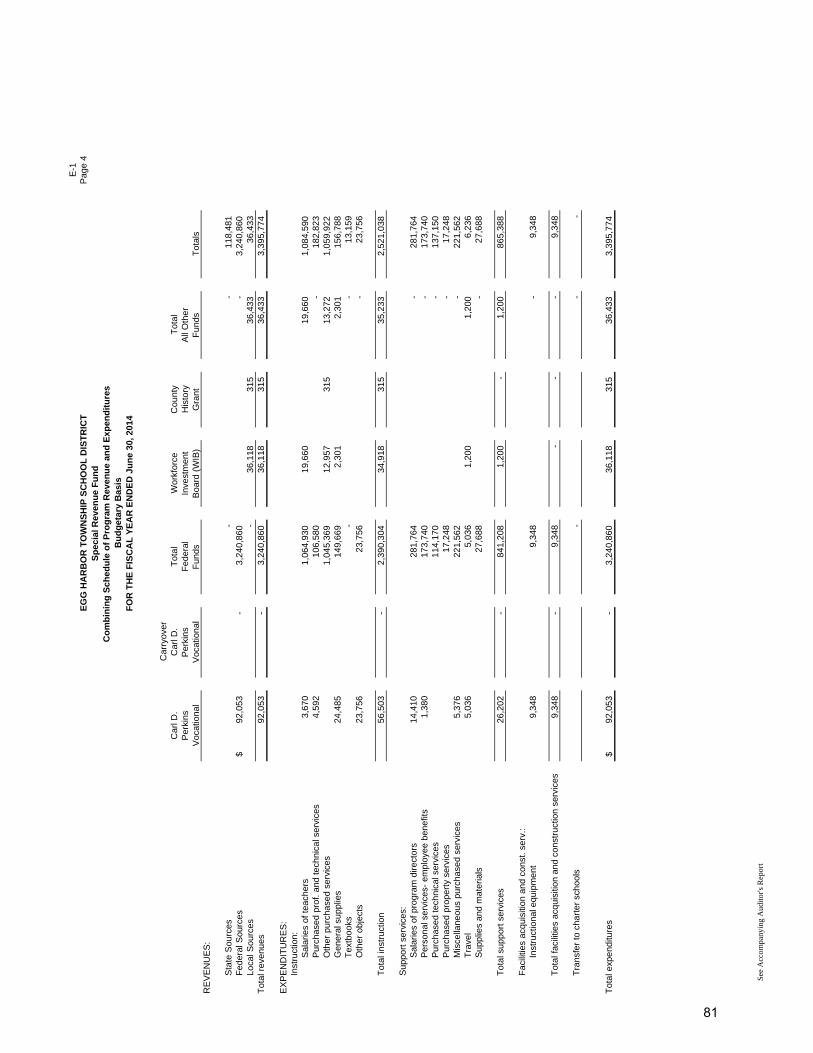
E-1
EG
G H
AR
BO
R T
OW
NS
HIP
SC
HO
OL
DIS
TR
ICT
Pag
e 4
Sp
ecia
l Rev
enu
e F
un
dC
om
bin
ing
Sch
edu
le o
f P
rog
ram
Rev
enu
e an
d E
xpen
dit
ure
sB
ud
get
ary
Bas
isF
OR
TH
E F
ISC
AL
YE
AR
EN
DE
D J
un
e 30
, 201
4
Car
ryov
erC
arl D
.C
arl D
.T
otal
Wor
kfor
ceC
ount
yT
otal
Per
kins
Per
kins
Fed
eral
Inve
stm
ent
His
tory
All
Oth
erV
ocat
iona
lV
ocat
iona
lF
unds
Boa
rd (
WIB
)G
rant
Fun
dsT
otal
sR
EV
EN
UE
S:
Sta
te S
ourc
es-
-
118,
481
Fed
eral
Sou
rces
92,0
53$
-
3,24
0,86
0
-
3,24
0,86
0
Loca
l Sou
rces
-
36,1
18
315
36
,433
36
,433
T
otal
rev
enue
s92
,053
-
3,
240,
860
36,1
18
315
36
,433
3,
395,
774
EX
PE
ND
ITU
RE
S:
Inst
ruct
ion:
Sal
arie
s of
teac
hers
3,67
0
1,
064,
930
19,6
60
19,6
60
1,08
4,59
0
Pur
chas
ed p
rof.
and
tech
nica
l ser
vice
s4,
592
106,
580
-
182,
823
Oth
er p
urch
ased
ser
vice
s1,
045,
369
12,9
57
315
13
,272
1,
059,
922
G
ener
al s
uppl
ies
24,4
85
149,
669
2,
301
2,
301
156,
788
Tex
tboo
ks-
-
13,1
59
Oth
er o
bjec
ts23
,756
23
,756
-
23
,756
Tot
al in
stru
ctio
n56
,503
-
2,
390,
304
34,9
18
315
35
,233
2,
521,
038
Sup
port
ser
vice
s:S
alar
ies
of p
rogr
am d
irect
ors
14,4
10
281,
764
-
281,
764
Per
sona
l ser
vice
s- e
mpl
oyee
ben
efits
1,38
0
17
3,74
0
-
17
3,74
0
P
urch
ased
tech
nica
l ser
vice
s11
4,17
0
-
13
7,15
0
P
urch
ased
pro
pert
y se
rvic
es17
,248
-
17
,248
M
isce
llane
ous
purc
hase
d se
rvic
es5,
376
221,
562
-
221,
562
Tra
vel
5,03
6
5,
036
1,20
0
1,20
0
6,
236
Sup
plie
s an
d m
ater
ials
27,6
88
-
27,6
88
Tot
al s
uppo
rt s
ervi
ces
26,2
02
-
841,
208
1,
200
-
1,
200
865,
388
Fac
ilitie
s ac
quis
ition
and
con
st. s
erv.
:In
stru
ctio
nal e
quip
men
t9,
348
9,34
8
-
9,34
8
Tot
al fa
cilit
ies
acqu
isiti
on a
nd c
onst
ruct
ion
serv
ices
9,34
8
-
9,
348
-
-
-
9,34
8
Tra
nsfe
r to
cha
rter
sch
ools
-
-
-
Tot
al e
xpen
ditu
res
92,0
53$
-
3,24
0,86
0
36
,118
31
5
36,4
33
3,39
5,77
4
See
Acc
ompa
nyin
g A
udit
or's
Rep
ort
81
CAPITAL PROJECTS FUND
{THIS PAGE IS INTENTIONALLY LEFT BLANK}
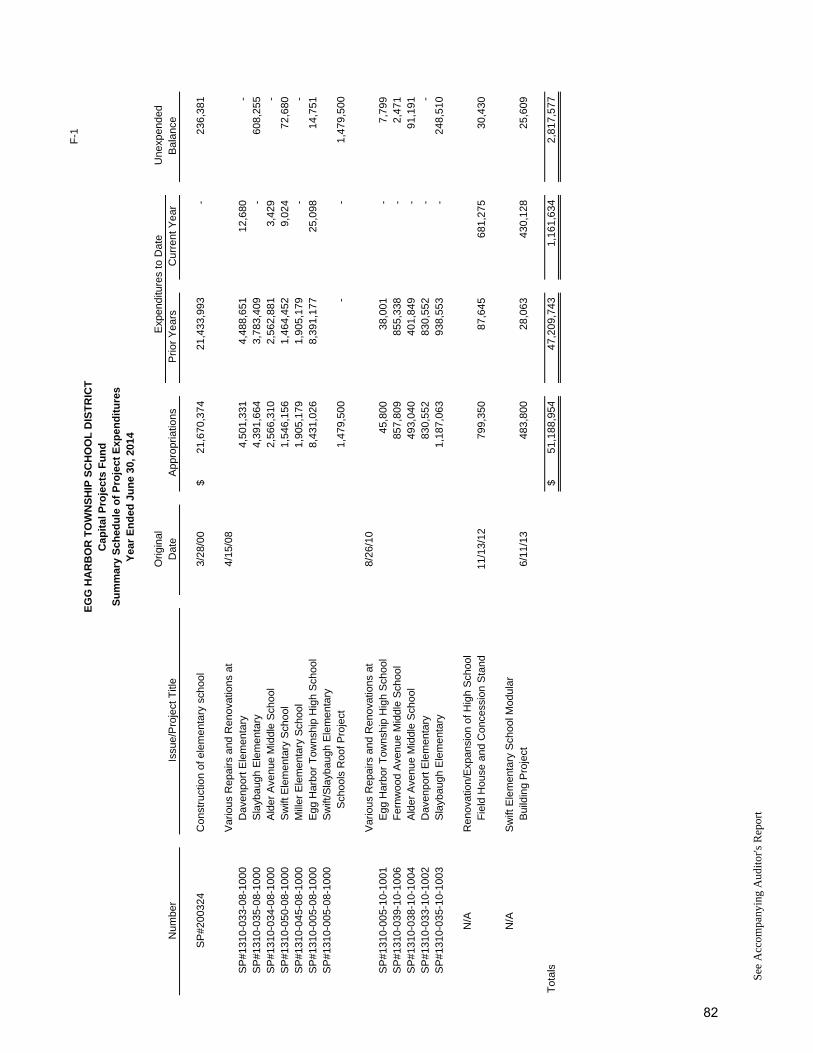
F-1
EG
G H
AR
BO
R T
OW
NS
HIP
SC
HO
OL
DIS
TR
ICT
Cap
ital
Pro
ject
s F
un
dS
um
mar
y S
ched
ule
of
Pro
ject
Exp
end
itu
res
Yea
r E
nd
ed J
un
e 30
, 201
4
Orig
inal
Exp
endi
ture
s to
Dat
eU
nexp
ende
dN
umbe
rIs
sue/
Pro
ject
Titl
eD
ate
App
ropr
iatio
nsP
rior
Yea
rsC
urre
nt Y
ear
Bal
ance
SP
#200
324
Con
stru
ctio
n of
ele
men
tary
sch
ool
3/28
/00
21,6
70,3
74$
21
,433
,993
-
236,
381
Var
ious
Rep
airs
and
Ren
ovat
ions
at
4/15
/08
SP
#131
0-03
3-08
-100
0
Dav
enpo
rt E
lem
enta
ry4,
501,
331
4,
488,
651
12,6
80
-
SP
#131
0-03
5-08
-100
0
Sla
ybau
gh E
lem
enta
ry4,
391,
664
3,
783,
409
-
608,
255
S
P#1
310-
034-
08-1
000
A
lder
Ave
nue
Mid
dle
Sch
ool
2,56
6,31
0
2,56
2,88
1
3,
429
-
SP
#131
0-05
0-08
-100
0
Sw
ift E
lem
enta
ry S
choo
l1,
546,
156
1,
464,
452
9,02
4
72
,680
SP
#131
0-04
5-08
-100
0
Mill
er E
lem
enta
ry S
choo
l1,
905,
179
1,
905,
179
-
-
SP
#131
0-00
5-08
-100
0
Egg
Har
bor
Tow
nshi
p H
igh
Sch
ool
8,43
1,02
6
8,39
1,17
7
25
,098
14
,751
SP
#131
0-00
5-08
-100
0
Sw
ift/S
layb
augh
Ele
men
tary
Sch
ools
Roo
f Pro
ject
1,47
9,50
0
-
-
1,47
9,50
0
Var
ious
Rep
airs
and
Ren
ovat
ions
at
8/26
/10
SP
#131
0-00
5-10
-100
1
Egg
Har
bor
Tow
nshi
p H
igh
Sch
ool
45,8
00
38,0
01
-
7,
799
S
P#1
310-
039-
10-1
006
F
ernw
ood
Ave
nue
Mid
dle
Sch
ool
857,
809
855,
338
-
2,
471
S
P#1
310-
038-
10-1
004
A
lder
Ave
nue
Mid
dle
Sch
ool
493,
040
401,
849
-
91
,191
SP
#131
0-03
3-10
-100
2
Dav
enpo
rt E
lem
enta
ry83
0,55
2
83
0,55
2
-
-
SP
#131
0-03
5-10
-100
3
Sla
ybau
gh E
lem
enta
ry1,
187,
063
93
8,55
3
-
248,
510
N/A
Ren
ovat
ion/
Exp
ansi
on o
f Hig
h S
choo
l
Fie
ld H
ouse
and
Con
cess
ion
Sta
nd11
/13/
1279
9,35
0
87
,645
681,
275
30
,430
N/A
Sw
ift E
lem
enta
ry S
choo
l Mod
ular
B
uild
ing
Pro
ject
6/11
/13
483,
800
28,0
63
43
0,12
8
25,6
09
Tot
als
51,1
88,9
54$
47
,209
,743
1,
161,
634
2,
817,
577
See
Acc
ompa
nyin
g A
udit
or's
Rep
ort
82
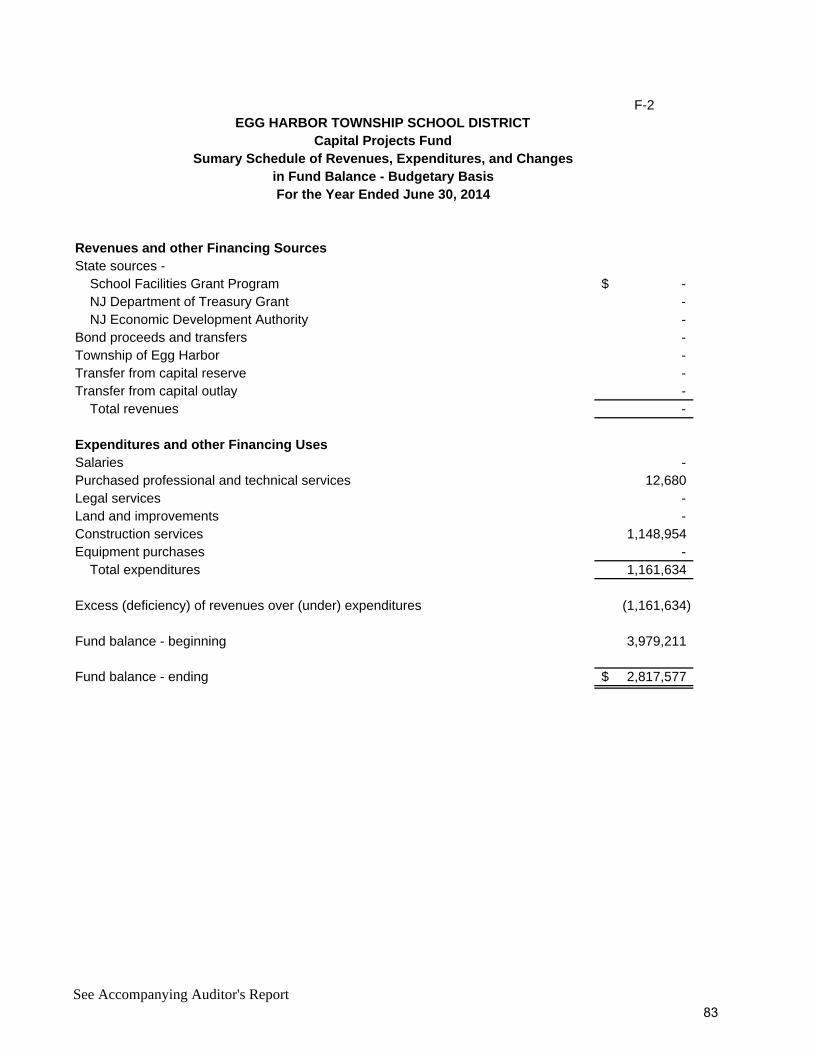
F-2
Revenues and other Financing SourcesState sources - School Facilities Grant Program -$ NJ Department of Treasury Grant - NJ Economic Development Authority - Bond proceeds and transfers - Township of Egg Harbor - Transfer from capital reserve - Transfer from capital outlay - Total revenues -
Expenditures and other Financing UsesSalaries - Purchased professional and technical services 12,680 Legal services - Land and improvements - Construction services 1,148,954 Equipment purchases - Total expenditures 1,161,634
Excess (deficiency) of revenues over (under) expenditures (1,161,634)
Fund balance - beginning 3,979,211
Fund balance - ending 2,817,577$
EGG HARBOR TOWNSHIP SCHOOL DISTRICTCapital Projects Fund
Sumary Schedule of Revenues, Expenditures, and Changes
For the Year Ended June 30, 2014in Fund Balance - Budgetary Basis
See Accompanying Auditor's Report83
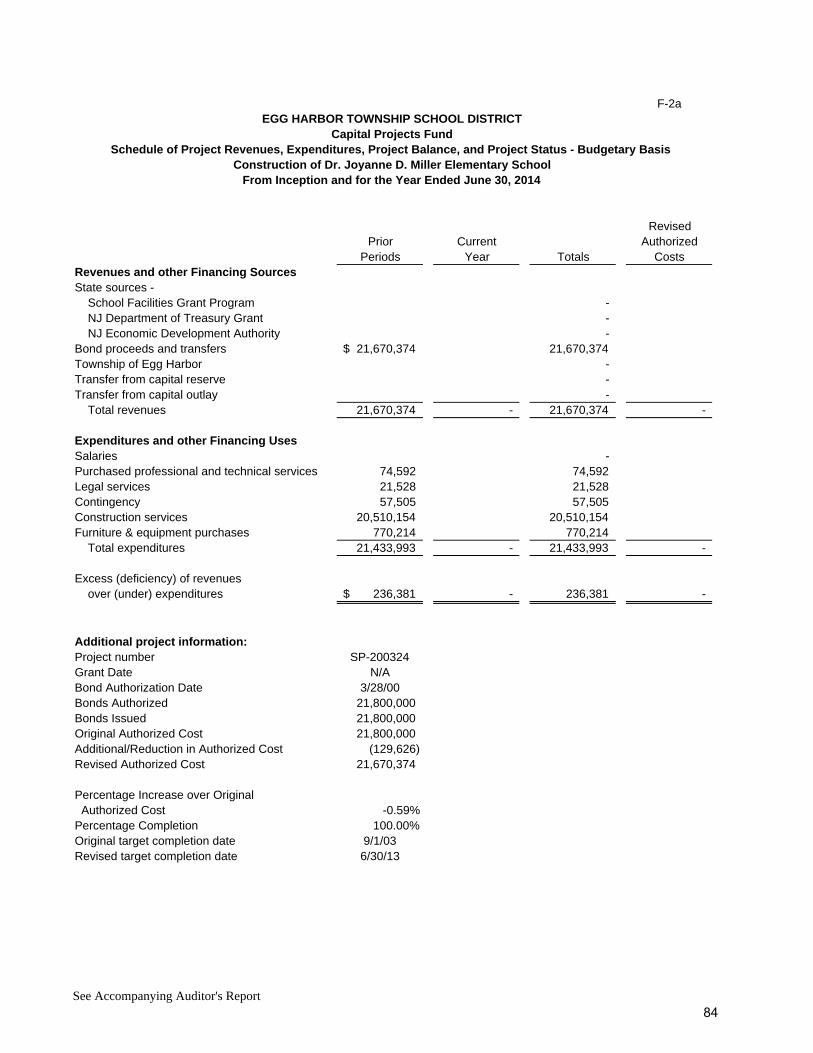
F-2a
RevisedPrior Current Authorized
Periods Year Totals CostsRevenues and other Financing SourcesState sources - School Facilities Grant Program - NJ Department of Treasury Grant - NJ Economic Development Authority - Bond proceeds and transfers 21,670,374$ 21,670,374 Township of Egg Harbor - Transfer from capital reserve - Transfer from capital outlay - Total revenues 21,670,374 - 21,670,374 -
Expenditures and other Financing UsesSalaries - Purchased professional and technical services 74,592 74,592 Legal services 21,528 21,528 Contingency 57,505 57,505 Construction services 20,510,154 20,510,154 Furniture & equipment purchases 770,214 770,214 Total expenditures 21,433,993 - 21,433,993 -
Excess (deficiency) of revenues over (under) expenditures 236,381$ - 236,381 -
Additional project information:Project number SP-200324Grant Date N/ABond Authorization Date 3/28/00Bonds Authorized 21,800,000 Bonds Issued 21,800,000 Original Authorized Cost 21,800,000 Additional/Reduction in Authorized Cost (129,626) Revised Authorized Cost 21,670,374
Percentage Increase over Original Authorized Cost -0.59%Percentage Completion 100.00%Original target completion date 9/1/03Revised target completion date 6/30/13
From Inception and for the Year Ended June 30, 2014
EGG HARBOR TOWNSHIP SCHOOL DISTRICTCapital Projects Fund
Schedule of Project Revenues, Expenditures, Project Balance, and Project Status - Budgetary BasisConstruction of Dr. Joyanne D. Miller Elementary School
See Accompanying Auditor's Report84
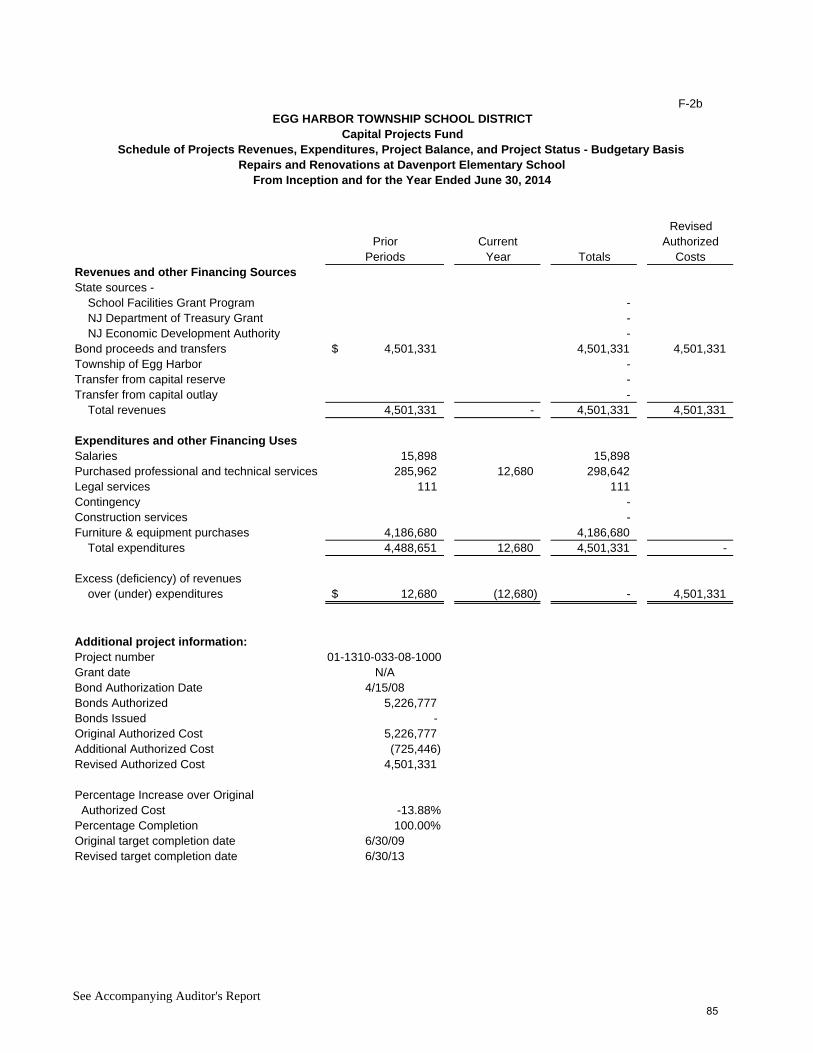
F-2b
RevisedPrior Current Authorized
Periods Year Totals CostsRevenues and other Financing SourcesState sources - School Facilities Grant Program - NJ Department of Treasury Grant - NJ Economic Development Authority - Bond proceeds and transfers 4,501,331$ 4,501,331 4,501,331 Township of Egg Harbor - Transfer from capital reserve - Transfer from capital outlay - Total revenues 4,501,331 - 4,501,331 4,501,331
Expenditures and other Financing UsesSalaries 15,898 15,898 Purchased professional and technical services 285,962 12,680 298,642 Legal services 111 111 Contingency - Construction services - Furniture & equipment purchases 4,186,680 4,186,680 Total expenditures 4,488,651 12,680 4,501,331 -
Excess (deficiency) of revenues over (under) expenditures 12,680$ (12,680) - 4,501,331
Additional project information:Project number 01-1310-033-08-1000Grant date N/ABond Authorization Date 4/15/08Bonds Authorized 5,226,777 Bonds Issued - Original Authorized Cost 5,226,777 Additional Authorized Cost (725,446) Revised Authorized Cost 4,501,331
Percentage Increase over Original Authorized Cost -13.88%Percentage Completion 100.00%Original target completion date 6/30/09Revised target completion date 6/30/13
From Inception and for the Year Ended June 30, 2014
EGG HARBOR TOWNSHIP SCHOOL DISTRICTCapital Projects Fund
Schedule of Projects Revenues, Expenditures, Project Balance, and Project Status - Budgetary BasisRepairs and Renovations at Davenport Elementary School
See Accompanying Auditor's Report85

F-2c
RevisedPrior Current Authorized
Periods Year Totals CostsRevenues and other Financing SourcesState sources - School Facilities Grant Program - NJ Department of Treasury Grant - NJ Economic Development Authority - Bond proceeds and transfers 4,391,664$ 4,391,664 4,391,664 Township of Egg Harbor - Transfer from capital reserve - Transfer from capital outlay - Total revenues 4,391,664 - 4,391,664 4,391,664
13,358 13,358 182,165 182,165
98 98 -
3,587,788 3,587,788
Expenditures and other Financing Uses SalariesPurchased professional and technical services Legal servicesContingencyConstruction servicesFurniture & equipment purchases - Total expenditures 3,783,409 - 3,783,409 -
Excess (deficiency) of revenues over (under) expenditures 608,255$ - 608,255 4,391,664
Additional project information:Project number 01-1310-035-08-1000Grant date N/ABond Authorization Date 4/15/08Bonds Authorized 4,391,664 Bonds Issued - Original Authorized Cost 4,391,664 Additional Authorized Cost - Revised Authorized Cost 4,391,664
Percentage Increase over Original Authorized Cost 0.00%Percentage Completion 86.15%Original target completion date 6/30/09Revised target completion date 6/30/13
From Inception and for the Year Ended June 30, 2014
EGG HARBOR TOWNSHIP SCHOOL DISTRICTCapital Projects Fund
Schedule of Projects Revenues, Expenditures, Project Balance, and Project Status - Budgetary BasisRepairs and Renovations at Slaybaugh Elementary School
See Accompanying Auditor's Report86
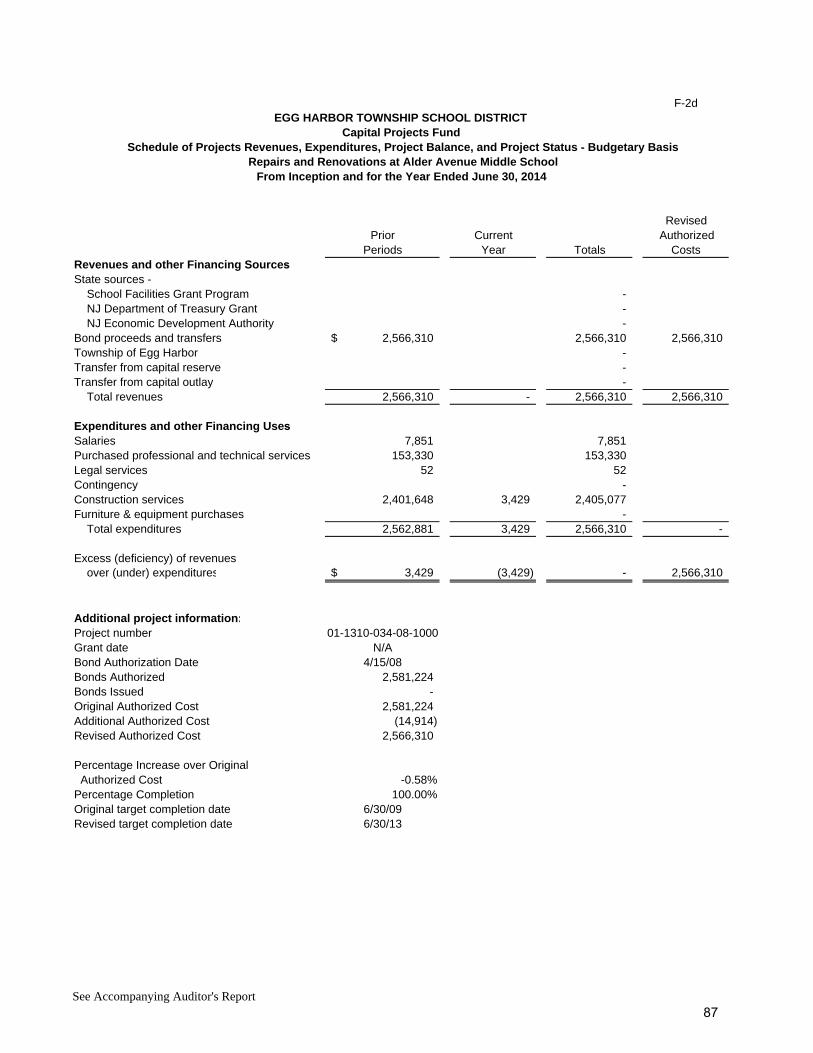
F-2d
RevisedPrior Current Authorized
Periods Year Totals CostsRevenues and other Financing SourcesState sources - School Facilities Grant Program - NJ Department of Treasury Grant - NJ Economic Development Authority - Bond proceeds and transfers 2,566,310$ 2,566,310 2,566,310 Township of Egg Harbor - Transfer from capital reserve - Transfer from capital outlay - Total revenues 2,566,310 - 2,566,310 2,566,310
7,851 7,851 153,330 153,330
52 52 -
2,401,648 3,429 2,405,077
Expenditures and other Financing Uses SalariesPurchased professional and technical services Legal servicesContingencyConstruction servicesFurniture & equipment purchases - Total expenditures 2,562,881 3,429 2,566,310 -
Excess (deficiency) of revenues over (under) expenditures 3,429$ (3,429) - 2,566,310
Additional project information:Project number 01-1310-034-08-1000Grant date N/ABond Authorization Date 4/15/08Bonds Authorized 2,581,224 Bonds Issued - Original Authorized Cost 2,581,224 Additional Authorized Cost (14,914) Revised Authorized Cost 2,566,310
Percentage Increase over Original Authorized Cost -0.58%Percentage Completion 100.00%Original target completion date 6/30/09Revised target completion date 6/30/13
From Inception and for the Year Ended June 30, 2014
EGG HARBOR TOWNSHIP SCHOOL DISTRICTCapital Projects Fund
Schedule of Projects Revenues, Expenditures, Project Balance, and Project Status - Budgetary BasisRepairs and Renovations at Alder Avenue Middle School
See Accompanying Auditor's Report87

F-2e
RevisedPrior Current Authorized
Periods Year Totals CostsRevenues and other Financing SourcesState sources - School Facilities Grant Program - NJ Department of Treasury Grant - NJ Economic Development Authority - Bond proceeds and transfers 1,546,156$ 1,546,156 1,546,156 Township of Egg Harbor - Transfer from capital reserve - Transfer from capital outlay - Total revenues 1,546,156 - 1,546,156 1,546,156
5,789 5,789 108,972 108,972
60 60 -
1,349,631 9,024 1,358,655
Expenditures and other Financing Uses SalariesPurchased professional and technical services Legal servicesContingencyConstruction servicesFurniture & equipment purchases - Total expenditures 1,464,452 9,024 1,473,476 -
Excess (deficiency) of revenues over (under) expenditures 81,704$ (9,024) 72,680 1,546,156
Additional project information:Project number 01-1310-050-08-1000Grant date N/ABond Authorization Date 4/15/08Bonds Authorized 1,903,196Bonds Issued - Original Authorized Cost 1,903,196Additional Authorized Cost (357,040) Revised Authorized Cost 1,546,156
Percentage Increase over Original Authorized Cost -18.76%Percentage Completion 95.30%Original target completion date 6/30/09Revised target completion date 6/30/13
From Inception and for the Year Ended June 30, 2014
EGG HARBOR TOWNSHIP SCHOOL DISTRICTCapital Projects Fund
Schedule of Projects Revenues, Expenditures, Project Balance, and Project Status - Budgetary BasisRepairs and Renovations at Swift Elementary School
See Accompanying Auditor's Report88

F-2f
RevisedPrior Current Authorized
Periods Year Totals CostsRevenues and other Financing SourcesState sources - School Facilities Grant Program - NJ Department of Treasury Grant - NJ Economic Development Authority - Bond proceeds and transfers 1,905,179$ 1,905,179 1,905,179 Township of Egg Harbor - Transfer from capital reserve - Transfer from capital outlay - Total revenues 1,905,179 - 1,905,179 1,905,179
6,957 6,957 132,457 132,457
69 69 -
1,765,696 1,765,696
Expenditures and other Financing Uses SalariesPurchased professional and technical services Legal servicesContingencyConstruction servicesFurniture & equipment purchases - Total expenditures 1,905,179 - 1,905,179 -
Excess (deficiency) of revenues over (under) expenditures -$ - - 1,905,179
Additional project information:Project number 01-1310-045-08-1000Grant date N/ABond Authorization Date 4/15/08Bonds Authorized 2,287,280 Bonds Issued - Original Authorized Cost 2,287,280 Additional Authorized Cost (382,101) Revised Authorized Cost 1,905,179
Percentage Increase over Original Authorized Cost -16.71%Percentage Completion 100.00%Original target completion date 6/30/09Revised target completion date 6/30/13
From Inception and for the Year Ended June 30, 2014
EGG HARBOR TOWNSHIP SCHOOL DISTRICTCapital Projects Fund
Schedule of Projects Revenues, Expenditures, Project Balance, and Project Status - Budgetary BasisRepairs and Renovations at Miller Elementary School
See Accompanying Auditor's Report89
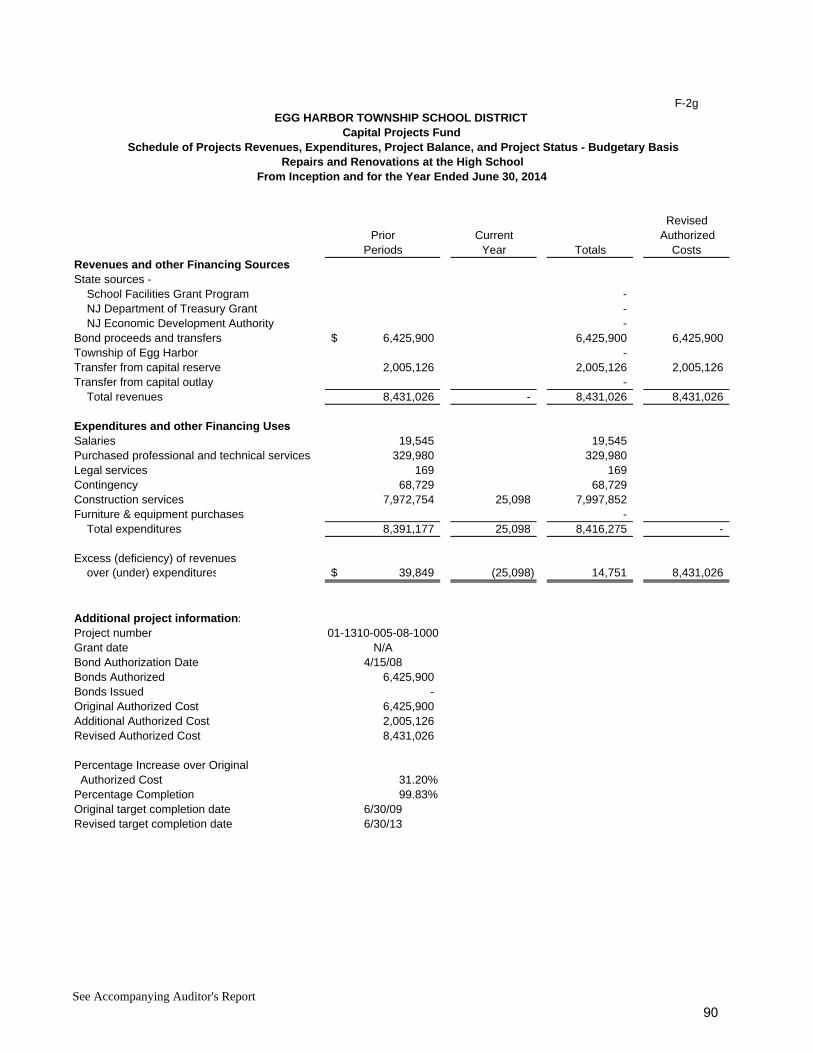
F-2g
RevisedPrior Current Authorized
Periods Year Totals CostsRevenues and other Financing SourcesState sources - School Facilities Grant Program - NJ Department of Treasury Grant - NJ Economic Development Authority - Bond proceeds and transfers 6,425,900$ 6,425,900 6,425,900 Township of Egg Harbor - Transfer from capital reserve 2,005,126 2,005,126 2,005,126 Transfer from capital outlay - Total revenues 8,431,026 - 8,431,026 8,431,026
19,545 19,545 329,980 329,980
169 169 68,729 68,729
7,972,754 25,098 7,997,852
Expenditures and other Financing Uses SalariesPurchased professional and technical services Legal servicesContingencyConstruction servicesFurniture & equipment purchases - Total expenditures 8,391,177 25,098 8,416,275 -
Excess (deficiency) of revenues over (under) expenditures 39,849$ (25,098) 14,751 8,431,026
Additional project information:Project number 01-1310-005-08-1000Grant date N/ABond Authorization Date 4/15/08Bonds Authorized 6,425,900 Bonds Issued - Original Authorized Cost 6,425,900 Additional Authorized Cost 2,005,126 Revised Authorized Cost 8,431,026
Percentage Increase over Original Authorized Cost 31.20%Percentage Completion 99.83%Original target completion date 6/30/09Revised target completion date 6/30/13
From Inception and for the Year Ended June 30, 2014
EGG HARBOR TOWNSHIP SCHOOL DISTRICTCapital Projects Fund
Schedule of Projects Revenues, Expenditures, Project Balance, and Project Status - Budgetary BasisRepairs and Renovations at the High School
See Accompanying Auditor's Report90
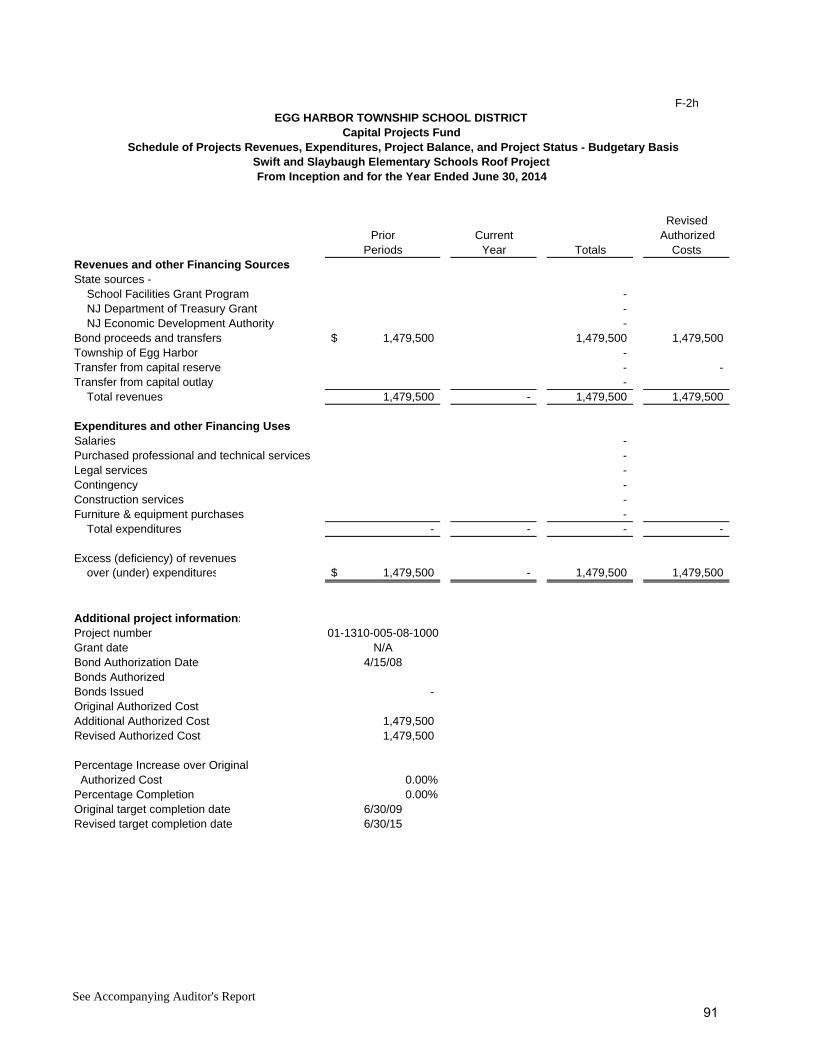
F-2h
RevisedPrior Current Authorized
Periods Year Totals CostsRevenues and other Financing SourcesState sources - School Facilities Grant Program - NJ Department of Treasury Grant - NJ Economic Development Authority - Bond proceeds and transfers 1,479,500$ 1,479,500 1,479,500 Township of Egg Harbor - Transfer from capital reserve - - Transfer from capital outlay - Total revenues 1,479,500 - 1,479,500 1,479,500
- - - - -
Expenditures and other Financing Uses SalariesPurchased professional and technical services Legal servicesContingencyConstruction servicesFurniture & equipment purchases - Total expenditures - - - -
Excess (deficiency) of revenues over (under) expenditures 1,479,500$ - 1,479,500 1,479,500
Additional project information:Project number 01-1310-005-08-1000Grant date N/ABond Authorization Date 4/15/08Bonds AuthorizedBonds Issued - Original Authorized CostAdditional Authorized Cost 1,479,500 Revised Authorized Cost 1,479,500
Percentage Increase over Original Authorized Cost 0.00%Percentage Completion 0.00%Original target completion date 6/30/09Revised target completion date 6/30/15
EGG HARBOR TOWNSHIP SCHOOL DISTRICTCapital Projects Fund
Schedule of Projects Revenues, Expenditures, Project Balance, and Project Status - Budgetary BasisSwift and Slaybaugh Elementary Schools Roof ProjectFrom Inception and for the Year Ended June 30, 2014
See Accompanying Auditor's Report91

F-2i
RevisedPrior Current Authorized
Periods Year Totals CostsRevenues and other Financing SourcesState sources - School Facilities Grant Program 24,203$ 24,203 24,203 NJ Department of Treasury Grant - NJ Economic Development Authority - Bond proceeds and transfers - Township of Egg Harbor - Transfer from capital reserve 24,203 24,203 24,203 Transfer from capital outlay - Total revenues 48,406 - 48,406 48,406
- 5,186 5,186
- -
35,421 35,421
Expenditures and other Financing Uses SalariesPurchased professional and technical services Legal servicesContingencyConstruction servicesFurniture & equipment purchases - Total expenditures 40,607 - 40,607 -
Excess (deficiency) of revenues over (under) expenditures 7,799$ - 7,799 48,406
Additional project information:Project number 01-1310-005-10-1001Grant date 8/26/10Bond Authorization Date N/ABonds Authorized - Bonds Issued - Original Authorized Cost 45,800 Additional Authorized Cost 2,606 Revised Authorized Cost 48,406
Percentage Increase over Original Authorized Cost 5.69%Percentage Completion 83.89%Original target completion date 8/31/11Revised target completion date 6/30/13
EGG HARBOR TOWNSHIP SCHOOL DISTRICTCapital Projects Fund
Schedule of Projects Revenues, Expenditures, Project Balance, and Project Status - Budgetary BasisRepairs and Renovations at the High School
From Inception and for the Year Ended June 30, 2014
See Accompanying Auditor's Report92
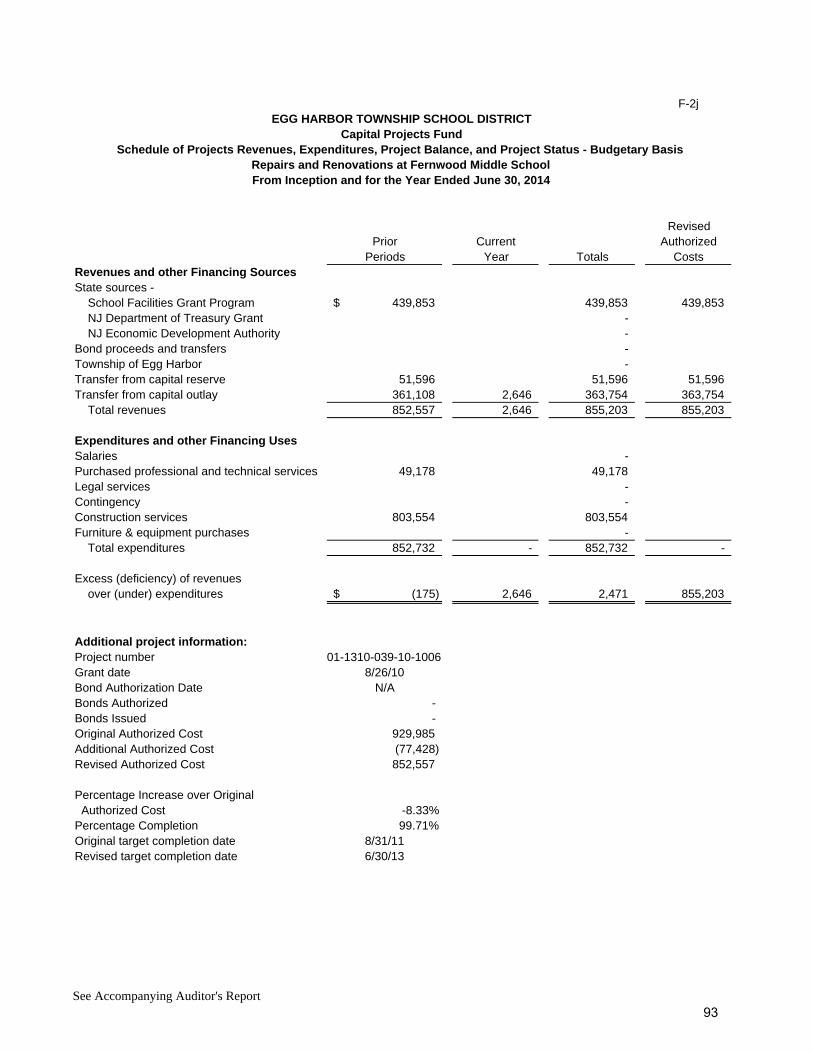
F-2j
RevisedPrior Current Authorized
Periods Year Totals CostsRevenues and other Financing SourcesState sources - School Facilities Grant Program 439,853$ 439,853 439,853 NJ Department of Treasury Grant - NJ Economic Development Authority - Bond proceeds and transfers - Township of Egg Harbor - Transfer from capital reserve 51,596 51,596 51,596 Transfer from capital outlay 361,108 2,646 363,754 363,754 Total revenues 852,557 2,646 855,203 855,203
Expenditures and other Financing UsesSalaries - Purchased professional and technical services 49,178 49,178 Legal services - Contingency - Construction services 803,554 803,554 Furniture & equipment purchases - Total expenditures 852,732 - 852,732 -
Excess (deficiency) of revenues over (under) expenditures (175)$ 2,646 2,471 855,203
Additional project information:Project number 01-1310-039-10-1006Grant date 8/26/10Bond Authorization Date N/ABonds Authorized - Bonds Issued - Original Authorized Cost 929,985 Additional Authorized Cost (77,428) Revised Authorized Cost 852,557
Percentage Increase over Original Authorized Cost -8.33%Percentage Completion 99.71%Original target completion date 8/31/11Revised target completion date 6/30/13
EGG HARBOR TOWNSHIP SCHOOL DISTRICTCapital Projects Fund
Schedule of Projects Revenues, Expenditures, Project Balance, and Project Status - Budgetary BasisRepairs and Renovations at Fernwood Middle SchoolFrom Inception and for the Year Ended June 30, 2014
See Accompanying Auditor's Report93

F-2k
RevisedPrior Current Authorized
Periods Year Totals CostsRevenues and other Financing SourcesState sources - School Facilities Grant Program 259,014$ 259,014 259,014 NJ Department of Treasury Grant - NJ Economic Development Authority - Bond proceeds and transfers - Township of Egg Harbor - Transfer from capital reserve 30,525 30,525 30,525 Transfer from capital outlay 203,501 203,501 203,501 Total revenues 493,040 - 493,040 493,040
- 28,079 28,079
- -
373,770 373,770
Expenditures and other Financing Uses SalariesPurchased professional and technical services Legal servicesContingencyConstruction servicesFurniture & equipment purchases - Total expenditures 401,849 - 401,849 -
Excess (deficiency) of revenues over (under) expenditures 91,191$ - 91,191 493,040
Additional project information:Project number 01-1310-038-10-1004Grant date 8/26/10Bond Authorization Date N/ABonds Authorized - Bonds Issued - Original Authorized Cost 1,272,725 Additional Authorized Cost (779,685) Revised Authorized Cost 493,040
Percentage Increase over Original Authorized Cost -61.26%Percentage Completion 81.50%Original target completion date 8/31/11Revised target completion date 6/30/13
EGG HARBOR TOWNSHIP SCHOOL DISTRICTCapital Projects Fund
Schedule of Projects Revenues, Expenditures, Project Balance, and Project Status - Budgetary BasisRepairs and Renovations at Alder Middle School
From Inception and for the Year Ended June 30, 2014
See Accompanying Auditor's Report94

F-2l
RevisedPrior Current Authorized
Periods Year Totals CostsRevenues and other Financing SourcesState sources - School Facilities Grant Program 437,304$ 437,304 437,304 NJ Department of Treasury Grant - NJ Economic Development Authority - Bond proceeds and transfers - Township of Egg Harbor - Transfer from capital reserve - Transfer from capital outlay 390,221 3,027 393,248 393,248 Total revenues 827,525 3,027 830,552 830,552
- 43,344 43,344
- -
787,208 787,208
Expenditures and other Financing Uses SalariesPurchased professional and technical services Legal servicesContingencyConstruction servicesFurniture & equipment purchases - Total expenditures 830,552 - 830,552 -
Excess (deficiency) of revenues over (under) expenditures (3,027)$ 3,027 - 830,552
Additional project information:Project number 01-1310-033-10-1002Grant date 8/26/10Bond Authorization Date N/ABonds Authorized - Bonds Issued - Original Authorized Cost 827,525 Additional Authorized Cost - Revised Authorized Cost 827,525
Percentage Increase over Original Authorized Cost 0.00%Percentage Completion 100.00%Original target completion date 8/31/11Revised target completion date 6/30/13
EGG HARBOR TOWNSHIP SCHOOL DISTRICTCapital Projects Fund
Schedule of Projects Revenues, Expenditures, Project Balance, and Project Status - Budgetary BasisRepairs and Renovations at Davenport Elementary School
From Inception and for the Year Ended June 30, 2014
See Accompanying Auditor's Report95

F-2m
RevisedPrior Current Authorized
Periods Year Totals CostsRevenues and other Financing SourcesState sources - School Facilities Grant Program 596,368$ 596,368 596,368 NJ Department of Treasury Grant - NJ Economic Development Authority - Bond proceeds and transfers - Township of Egg Harbor - Transfer from capital reserve - Transfer from capital outlay 596,368 (5,673) 590,695 590,695 Total revenues 1,192,736 (5,673) 1,187,063 1,187,063
- 69,879 69,879
- -
868,674 868,674
Expenditures and other Financing Uses SalariesPurchased professional and technical services Legal servicesContingencyConstruction servicesFurniture & equipment purchases - Total expenditures 938,553 - 938,553 -
Excess (deficiency) of revenues over (under) expenditures 254,183$ (5,673) 248,510 1,187,063
Additional project information:Project number 01-1310-035-10-1003Grant date 8/26/10Bond Authorization Date N/ABonds Authorized - Bonds Issued - Original Authorized Cost 1,307,425 Additional Authorized Cost (115,689) Revised Authorized Cost 1,191,736
Percentage Increase over Original Authorized Cost -8.85%Percentage Completion 79.07%Original target completion date 8/31/11Revised target completion date 6/30/13
EGG HARBOR TOWNSHIP SCHOOL DISTRICTCapital Projects Fund
Schedule of Projects Revenues, Expenditures, Project Balance, and Project Status - Budgetary BasisRepairs and Renovations at Slaybaugh Elementary School
From Inception and for the Year Ended June 30, 2014
See Accompanying Auditor's Report96
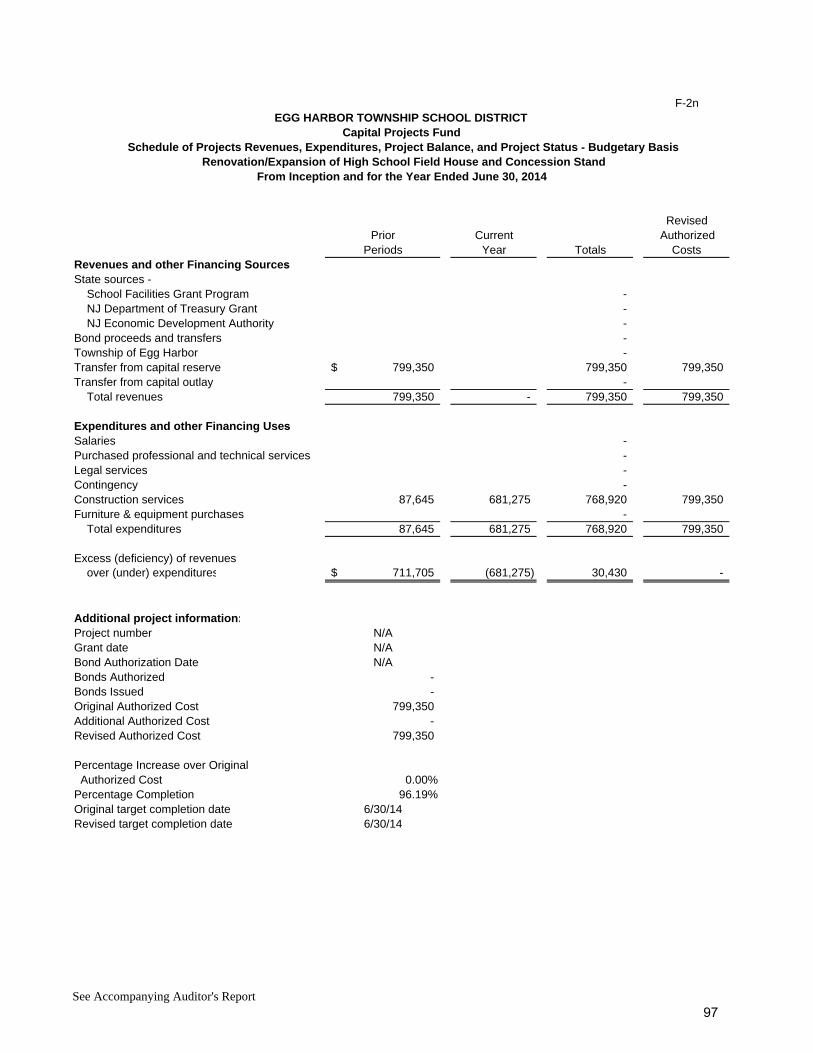
F-2n
RevisedPrior Current Authorized
Periods Year Totals CostsRevenues and other Financing SourcesState sources - School Facilities Grant Program - NJ Department of Treasury Grant - NJ Economic Development Authority - Bond proceeds and transfers - Township of Egg Harbor - Transfer from capital reserve 799,350$ 799,350 799,350 Transfer from capital outlay - Total revenues 799,350 - 799,350 799,350
- - - -
87,645 681,275 768,920 799,350
Expenditures and other Financing Uses SalariesPurchased professional and technical services Legal servicesContingencyConstruction servicesFurniture & equipment purchases - Total expenditures 87,645 681,275 768,920 799,350
Excess (deficiency) of revenues over (under) expenditures 711,705$ (681,275) 30,430 -
Additional project information:Project number N/AGrant date N/ABond Authorization Date N/ABonds Authorized - Bonds Issued - Original Authorized Cost 799,350 Additional Authorized Cost - Revised Authorized Cost 799,350
Percentage Increase over Original Authorized Cost 0.00%Percentage Completion 96.19%Original target completion date 6/30/14Revised target completion date 6/30/14
EGG HARBOR TOWNSHIP SCHOOL DISTRICTCapital Projects Fund
Schedule of Projects Revenues, Expenditures, Project Balance, and Project Status - Budgetary BasisRenovation/Expansion of High School Field House and Concession Stand
From Inception and for the Year Ended June 30, 2014
See Accompanying Auditor's Report97
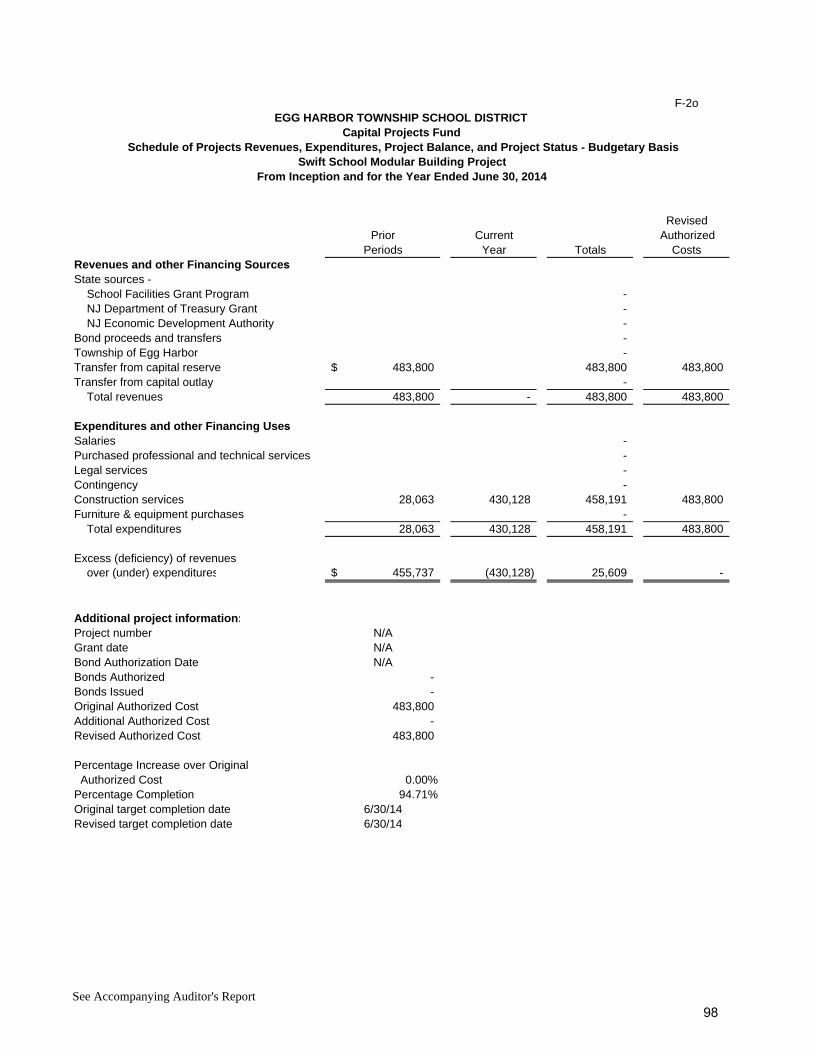
F-2o
RevisedPrior Current Authorized
Periods Year Totals CostsRevenues and other Financing SourcesState sources - School Facilities Grant Program - NJ Department of Treasury Grant - NJ Economic Development Authority - Bond proceeds and transfers - Township of Egg Harbor - Transfer from capital reserve 483,800$ 483,800 483,800 Transfer from capital outlay - Total revenues 483,800 - 483,800 483,800
- - - -
28,063 430,128 458,191 483,800
Expenditures and other Financing Uses SalariesPurchased professional and technical services Legal servicesContingencyConstruction servicesFurniture & equipment purchases - Total expenditures 28,063 430,128 458,191 483,800
Excess (deficiency) of revenues over (under) expenditures 455,737$ (430,128) 25,609 -
Additional project information:Project number N/AGrant date N/ABond Authorization Date N/ABonds Authorized - Bonds Issued - Original Authorized Cost 483,800 Additional Authorized Cost - Revised Authorized Cost 483,800
Percentage Increase over Original Authorized Cost 0.00%Percentage Completion 94.71%Original target completion date 6/30/14Revised target completion date 6/30/14
EGG HARBOR TOWNSHIP SCHOOL DISTRICTCapital Projects Fund
Schedule of Projects Revenues, Expenditures, Project Balance, and Project Status - Budgetary BasisSwift School Modular Building Project
From Inception and for the Year Ended June 30, 2014
See Accompanying Auditor's Report98

{THIS PAGE IS INTENTIONALLY LEFT BLANK}
FIDUCIARY FUNDS

{THIS PAGE IS INTENTIONALLY LEFT BLANK}
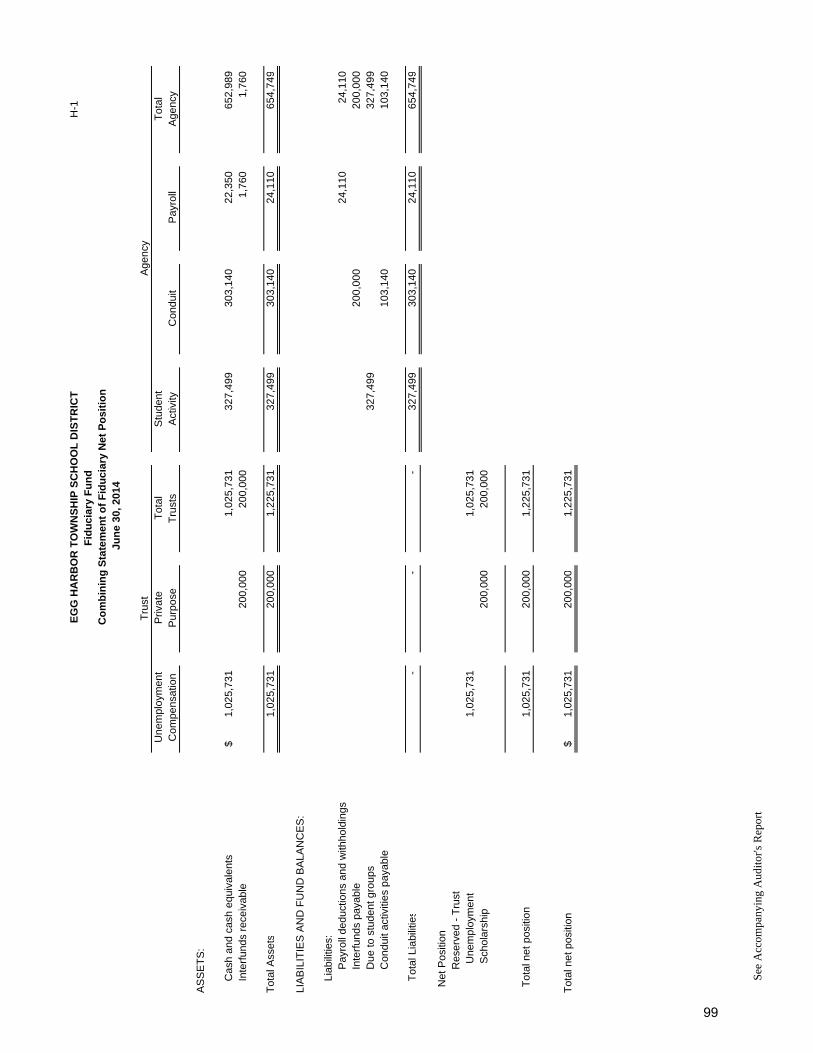
EG
G H
AR
BO
R T
OW
NS
HIP
SC
HO
OL
DIS
TR
ICT
H-1
Fid
uci
ary
Fu
nd
Co
mb
inin
g S
tate
men
t o
f F
idu
ciar
y N
et P
osi
tio
nJu
ne
30, 2
014
Une
mpl
oym
ent
Priv
ate
Tot
alS
tude
ntT
otal
Com
pens
atio
nP
urpo
seT
rust
sA
ctiv
ityC
ondu
itP
ayro
llA
genc
y
AS
SE
TS
:
C
ash
and
cash
equ
ival
ents
1,02
5,73
1$
1,
025,
731
327,
499
30
3,14
0
22,3
50
652,
989
Inte
rfun
ds r
ecei
vabl
e20
0,00
0
200,
000
1,
760
1,
760
Tot
al A
sset
s1,
025,
731
200,
000
1,22
5,73
1
327,
499
303,
140
24
,110
65
4,74
9
LIA
BIL
ITIE
S A
ND
FU
ND
BA
LAN
CE
S:
L
iabi
litie
s:
P
ayro
ll de
duct
ions
and
with
hold
ings
24,1
10
24,1
10
Int
erfu
nds
paya
ble
200,
000
20
0,00
0
Due
to s
tude
nt g
roup
s32
7,49
9
327,
499
C
ondu
it ac
tiviti
es p
ayab
le10
3,14
0
103,
140
T
otal
Lia
bilit
ies
--
-32
7,49
9
30
3,14
0
24,1
10
654,
749
Net
Pos
ition
Res
erve
d -
Tru
st
Une
mpl
oym
ent
1,02
5,73
1
1,
025,
731
S
chol
arsh
ip20
0,00
0
200,
000
Tot
al n
et p
ositi
on1,
025,
731
200,
000
1,
225,
731
Tot
al n
et p
ositi
on1,
025,
731
$
200,
000
1,22
5,73
1
Tru
stA
genc
y
See
Acc
ompa
nyin
g A
udit
or's
Rep
ort
99
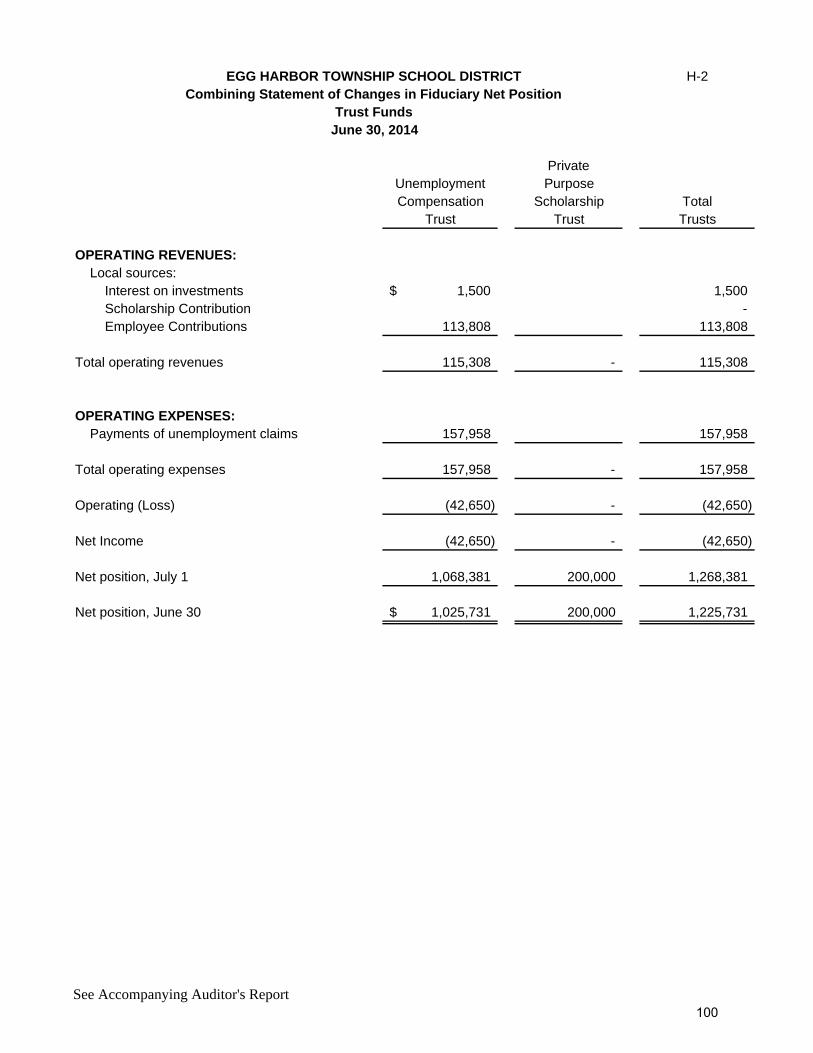
EGG HARBOR TOWNSHIP SCHOOL DISTRICT H-2Combining Statement of Changes in Fiduciary Net Position
Trust FundsJune 30, 2014
PrivateUnemployment PurposeCompensation Scholarship Total
Trust Trust Trusts
OPERATING REVENUES: Local sources: Interest on investments 1,500$ 1,500 Scholarship Contribution - Employee Contributions 113,808 113,808
Total operating revenues 115,308 - 115,308
OPERATING EXPENSES: Payments of unemployment claims 157,958 157,958
Total operating expenses 157,958 - 157,958
Operating (Loss) (42,650) - (42,650)
Net Income (42,650) - (42,650)
Net position, July 1 1,068,381 200,000 1,268,381
Net position, June 30 1,025,731$ 200,000 1,225,731
See Accompanying Auditor's Report100
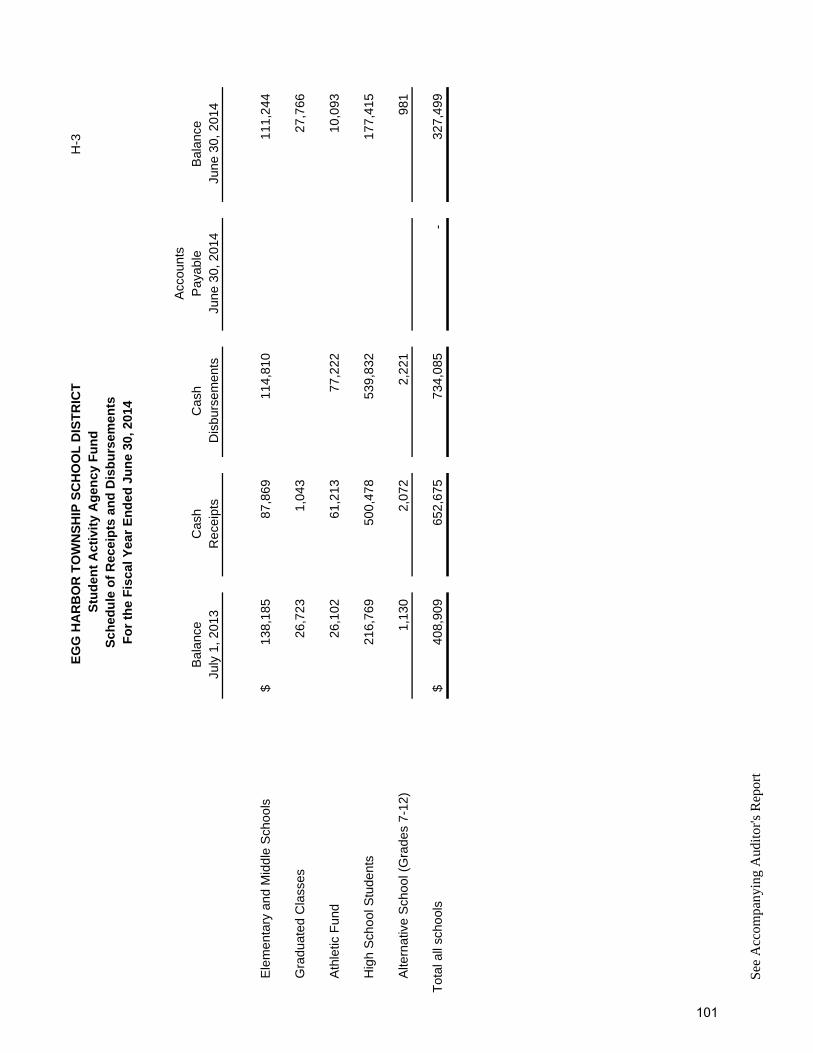
EG
G H
AR
BO
R T
OW
NS
HIP
SC
HO
OL
DIS
TR
ICT
H-3
Stu
den
t A
ctiv
ity
Ag
ency
Fu
nd
Sch
edu
le o
f R
ecei
pts
an
d D
isb
urs
emen
tsF
or
the
Fis
cal Y
ear
En
ded
Ju
ne
30, 2
014
Acc
ount
sB
alan
ceC
ash
Cas
hP
ayab
leB
alan
ceJu
ly 1
, 201
3R
ecei
pts
Dis
burs
emen
tsJu
ne 3
0, 2
014
June
30,
201
4
E
lem
enta
ry a
nd M
iddl
e S
choo
ls13
8,18
5$
87,8
69
114,
810
11
1,24
4
G
radu
ated
Cla
sses
26,7
23
1,
043
27,7
66
A
thle
tic F
und
26,1
02
61
,213
77
,222
10,0
93
H
igh
Sch
ool S
tude
nts
216,
769
50
0,47
8
539,
832
17
7,41
5
A
ltern
ativ
e S
choo
l (G
rade
s 7-
12)
1,13
0
2,
072
2,22
1
981
Tot
al a
ll sc
hool
s40
8,90
9$
652,
675
73
4,08
5
-
32
7,49
9
See
Acc
ompa
nyin
g A
udit
or's
Rep
ort
101
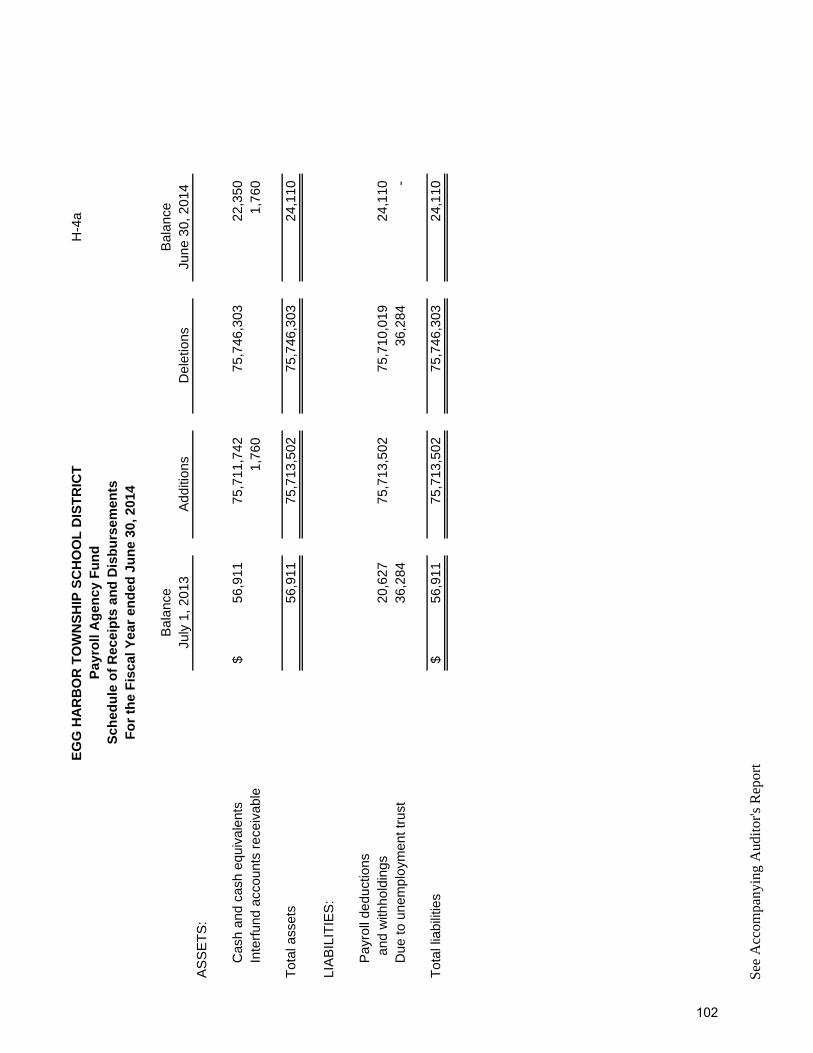
EG
G H
AR
BO
R T
OW
NS
HIP
SC
HO
OL
DIS
TR
ICT
H-4
aP
ayro
ll A
gen
cy F
un
dS
ched
ule
of
Rec
eip
ts a
nd
Dis
bu
rsem
ents
Fo
r th
e F
isca
l Yea
r en
ded
Ju
ne
30, 2
014
Bal
ance
Bal
ance
July
1, 2
013
Add
ition
sD
elet
ions
June
30,
201
4A
SS
ET
S:
C
ash
and
cash
equ
ival
ents
56,9
11$
75
,711
,742
75
,746
,303
22,3
50
In
terf
und
acco
unts
rec
eiva
ble
1,76
0
1,
760
Tot
al a
sset
s56
,911
75,7
13,5
02
75,7
46,3
03
24
,110
LIA
BIL
ITIE
S:
P
ayro
ll de
duct
ions
and
with
hold
ings
20,6
27
75
,713
,502
75
,710
,019
24,1
10
D
ue to
une
mpl
oym
ent t
rust
36,2
84
36
,284
-
Tot
al li
abili
ties
56,9
11$
75
,713
,502
75
,746
,303
24,1
10
See
Acc
ompa
nyin
g A
udit
or's
Rep
ort
102
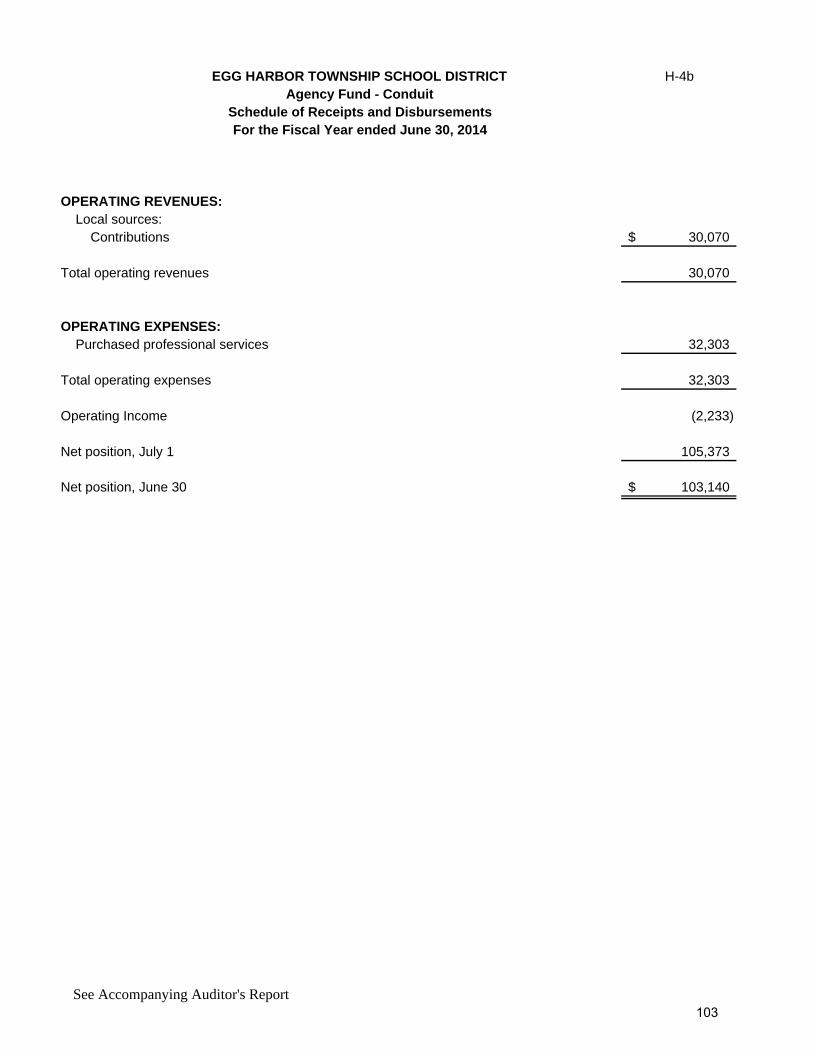
EGG HARBOR TOWNSHIP SCHOOL DISTRICT H-4bAgency Fund - Conduit
Schedule of Receipts and DisbursementsFor the Fiscal Year ended June 30, 2014
OPERATING REVENUES: Local sources: Contributions 30,070$
Total operating revenues 30,070
OPERATING EXPENSES: Purchased professional services 32,303
Total operating expenses 32,303
Operating Income (2,233)
Net position, July 1 105,373
Net position, June 30 103,140$
See Accompanying Auditor's Report103

{THIS PAGE IS INTENTIONALLY LEFT BLANK}

LONG-TERM DEBT

{THIS PAGE IS INTENTIONALLY LEFT BLANK}
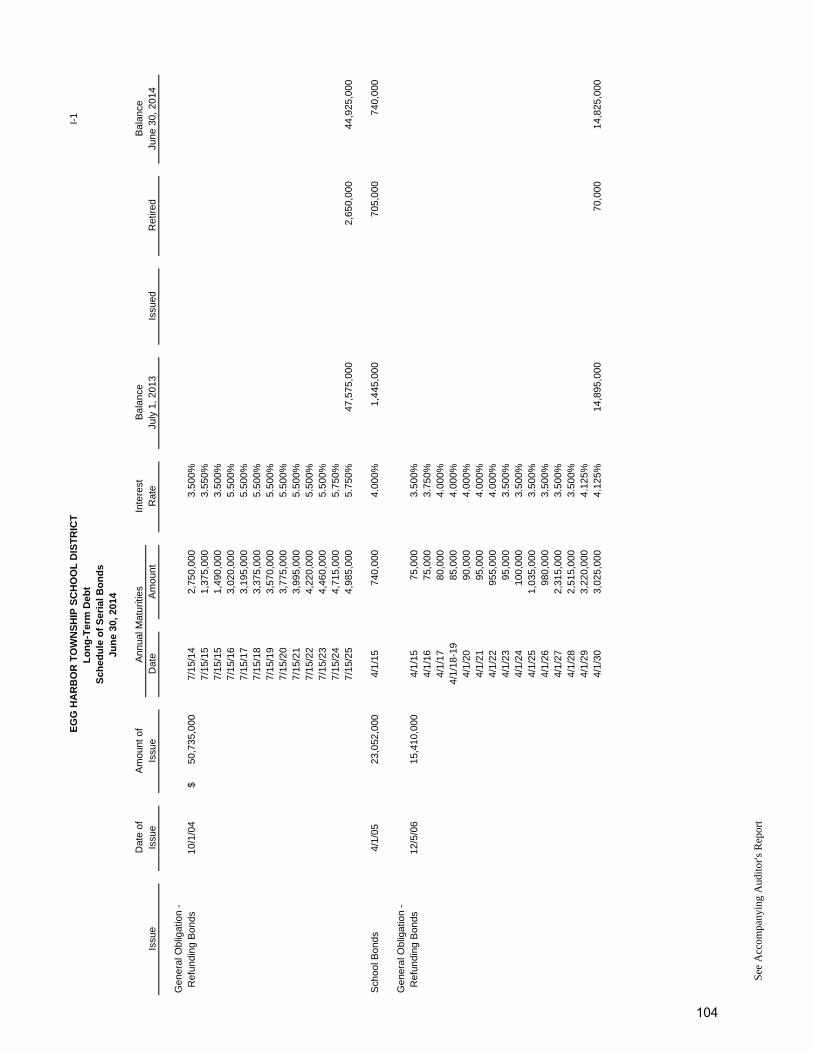
EG
G H
AR
BO
R T
OW
NS
HIP
SC
HO
OL
DIS
TR
ICT
I-1
Lo
ng
-Ter
m D
ebt
Sch
edu
le o
f S
eria
l Bo
nd
sJu
ne
30, 2
014
Dat
e of
Am
ount
of
Ann
ual M
atur
ities
Inte
rest
Bal
ance
Bal
ance
Issu
eIs
sue
Issu
eD
ate
Am
ount
Rat
eJu
ly 1
, 201
3Is
sued
Ret
ired
June
30,
201
4
Gen
eral
Obl
igat
ion
- R
efun
ding
Bon
ds10
/1/0
450
,735
,000
$
7/15
/14
2,75
0,00
0
3.50
0%7/
15/1
51,
375,
000
3.
550%
7/15
/15
1,49
0,00
0
3.50
0%7/
15/1
63,
020,
000
5.
500%
7/15
/17
3,19
5,00
0
5.50
0%7/
15/1
83,
375,
000
5.
500%
7/15
/19
3,57
0,00
0
5.50
0%7/
15/2
03,
775,
000
5.
500%
7/15
/21
3,99
5,00
0
5.50
0%7/
15/2
24,
220,
000
5.
500%
7/15
/23
4,46
0,00
0
5.50
0%7/
15/2
44,
715,
000
5.
750%
7/15
/25
4,98
5,00
0
5.75
0%47
,575
,000
2,
650,
000
44,9
25,0
00
Sch
ool B
onds
4/1/
0523
,052
,000
4/1/
1574
0,00
0
4.
000%
1,44
5,00
0
705,
000
74
0,00
0
Gen
eral
Obl
igat
ion
- R
efun
ding
Bon
ds12
/5/0
615
,410
,000
4/1/
1575
,000
3.
500%
4/1/
1675
,000
3.
750%
4/1/
1780
,000
4.
000%
4/1/
18-1
985
,000
4.
000%
4/1/
2090
,000
4.
000%
4/1/
2195
,000
4.
000%
4/1/
2295
5,00
0
4.
000%
4/1/
2395
,000
3.
500%
4/1/
2410
0,00
0
3.
500%
4/1/
251,
035,
000
3.
500%
4/1/
2698
0,00
0
3.
500%
4/1/
272,
315,
000
3.
500%
4/1/
282,
515,
000
3.
500%
4/1/
293,
220,
000
4.
125%
4/1/
303,
025,
000
4.
125%
14,8
95,0
00
70,0
00
14,8
25,0
00
See
Acc
ompa
nyin
g A
udit
or's
Rep
ort
104
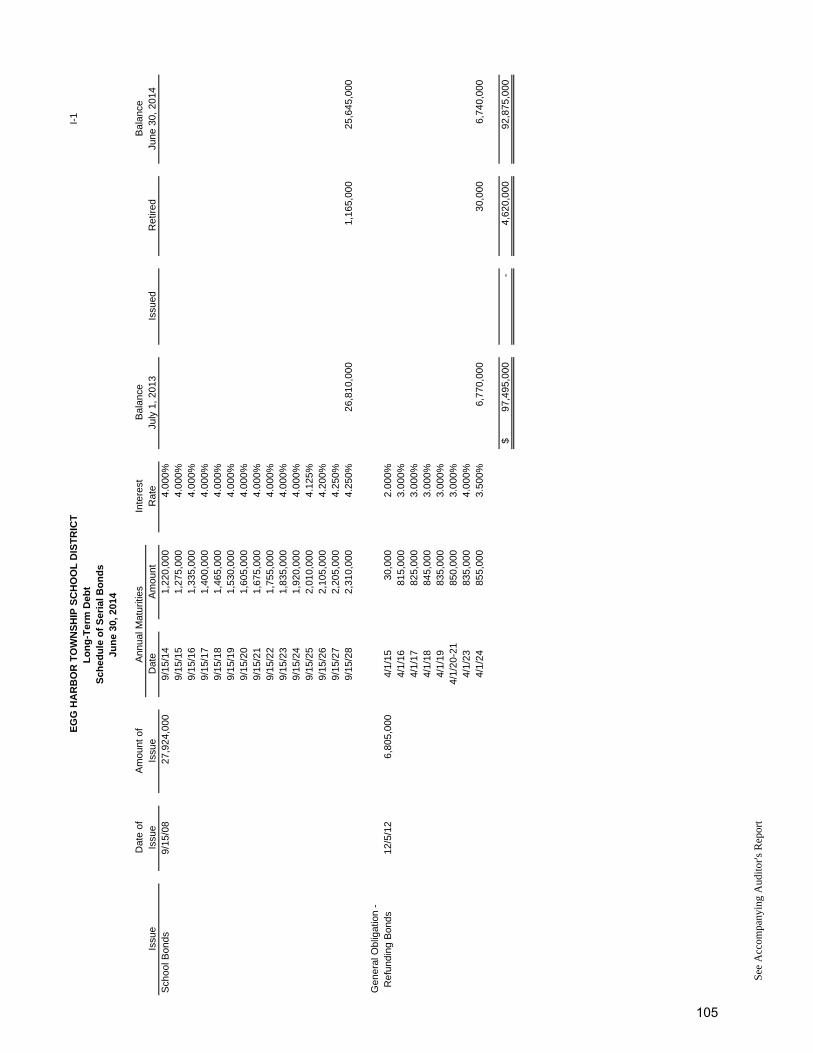
EG
G H
AR
BO
R T
OW
NS
HIP
SC
HO
OL
DIS
TR
ICT
I-1
Lo
ng
-Ter
m D
ebt
Sch
edu
le o
f S
eria
l Bo
nd
sJu
ne
30, 2
014
Dat
e of
Am
ount
of
Ann
ual M
atur
ities
Inte
rest
Bal
ance
Bal
ance
Issu
eIs
sue
Issu
eD
ate
Am
ount
Rat
eJu
ly 1
, 201
3Is
sued
Ret
ired
June
30,
201
4S
choo
l Bon
ds9/
15/0
827
,924
,000
9/15
/14
1,22
0,00
0
4.00
0%9/
15/1
51,
275,
000
4.
000%
9/15
/16
1,33
5,00
0
4.00
0%9/
15/1
71,
400,
000
4.
000%
9/15
/18
1,46
5,00
0
4.00
0%9/
15/1
91,
530,
000
4.
000%
9/15
/20
1,60
5,00
0
4.00
0%9/
15/2
11,
675,
000
4.
000%
9/15
/22
1,75
5,00
0
4.00
0%9/
15/2
31,
835,
000
4.
000%
9/15
/24
1,92
0,00
0
4.00
0%9/
15/2
52,
010,
000
4.
125%
9/15
/26
2,10
5,00
0
4.20
0%9/
15/2
72,
205,
000
4.
250%
9/15
/28
2,31
0,00
0
4.25
0%26
,810
,000
1,
165,
000
25,6
45,0
00
Gen
eral
Obl
igat
ion
- R
efun
ding
Bon
ds12
/5/1
26,
805,
000
4/1/
1530
,000
2.
000%
4/1/
1681
5,00
0
3.
000%
4/1/
1782
5,00
0
3.
000%
4/1/
1884
5,00
0
3.
000%
4/1/
1983
5,00
0
3.
000%
4/1/
20-2
185
0,00
0
3.
000%
4/1/
2383
5,00
0
4.
000%
4/1/
2485
5,00
0
3.
500%
6,77
0,00
0
30,0
00
6,74
0,00
0
97,4
95,0
00$
-
4,
620,
000
92,8
75,0
00
See
Acc
ompa
nyin
g A
udit
or's
Rep
ort
105
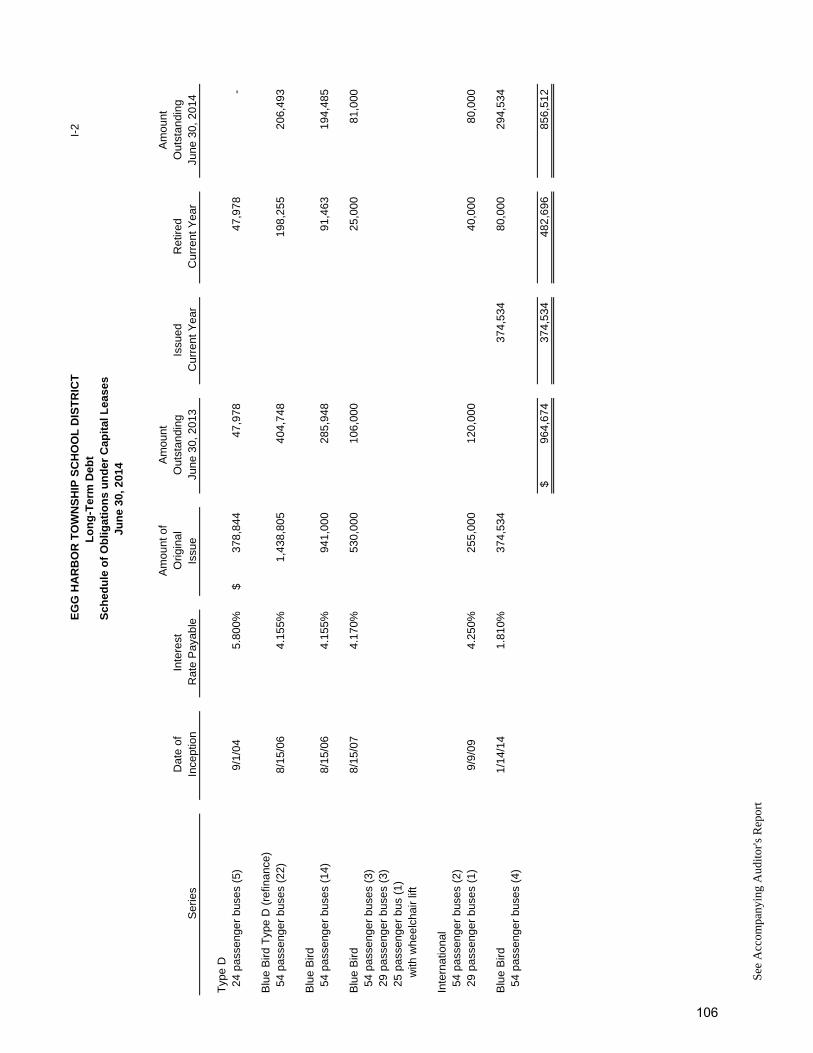
EG
G H
AR
BO
R T
OW
NS
HIP
SC
HO
OL
DIS
TR
ICT
I-2
Lo
ng
-Ter
m D
ebt
Sch
edu
le o
f O
blig
atio
ns
un
der
Cap
ital
Lea
ses
Jun
e 30
, 201
4
Am
ount
of
Am
ount
Am
ount
Dat
e of
Inte
rest
Orig
inal
Out
stan
ding
Issu
edR
etire
dO
utst
andi
ngS
erie
sIn
cept
ion
Rat
e P
ayab
leIs
sue
June
30,
201
3C
urre
nt Y
ear
Cur
rent
Yea
rJu
ne 3
0, 2
014
Typ
e D
24
pass
enge
r bu
ses
(5)
9/1/
045.
800%
378,
844
$
47
,978
47,9
78
-
Blu
e B
ird T
ype
D (
refin
ance
) 5
4 pa
ssen
ger
buse
s (2
2)8/
15/0
64.
155%
1,43
8,80
5
40
4,74
8
198,
255
20
6,49
3
Blu
e B
ird 5
4 pa
ssen
ger
buse
s (1
4)8/
15/0
64.
155%
941,
000
28
5,94
8
91,4
63
19
4,48
5
Blu
e B
ird8/
15/0
74.
170%
530,
000
10
6,00
0
25,0
00
81
,000
54
pass
enge
r bu
ses
(3)
29
pass
enge
r bu
ses
(3)
25
pass
enge
r bu
s (1
)
with
whe
elch
air
lift
Inte
rnat
iona
l 5
4 pa
ssen
ger
buse
s (2
) 2
9 pa
ssen
ger
buse
s (1
)9/
9/09
4.25
0%25
5,00
0
120,
000
40
,000
80,0
00
Blu
e B
ird1/
14/1
41.
810%
374,
534
37
4,53
4
80,0
00
29
4,53
4
54
pass
enge
r bu
ses
(4)
964,
674
$
37
4,53
4
482,
696
85
6,51
2
See
Acc
ompa
nyin
g A
udit
or's
Rep
ort
106
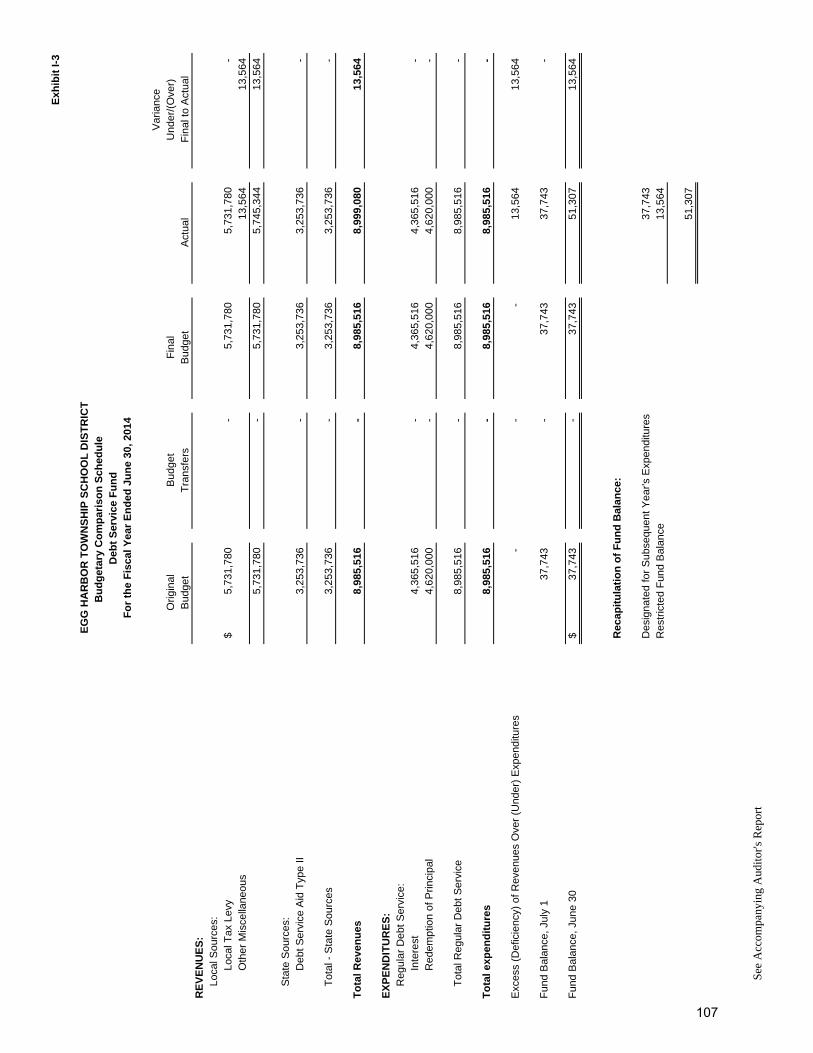
Exh
ibit
I-3
Var
ianc
eO
rigin
alB
udge
tF
inal
Und
er/(
Ove
r)B
udge
tT
rans
fers
Bud
get
Act
ual
Fin
al to
Act
ual
RE
VE
NU
ES
:Lo
cal S
ourc
es:
Loca
l Tax
Lev
y5,
731,
780
$
-
5,
731,
780
5,73
1,78
0
-
Oth
er M
isce
llane
ous
13,5
64
13,5
64
5,73
1,78
0
-
5,73
1,78
0
5,
745,
344
13,5
64
Sta
te S
ourc
es:
Deb
t Ser
vice
Aid
Typ
e II
3,25
3,73
6
-
3,25
3,73
6
3,
253,
736
-
Tot
al -
Sta
te S
ourc
es3,
253,
736
-
3,
253,
736
3,25
3,73
6
-
To
tal R
even
ues
8,98
5,51
6
-
8,98
5,51
6
8,
999,
080
13,5
64
EX
PE
ND
ITU
RE
S:
Reg
ular
Deb
t Ser
vice
:In
tere
st4,
365,
516
-
4,
365,
516
4,36
5,51
6
-
Red
empt
ion
of P
rinci
pal
4,62
0,00
0
-
4,62
0,00
0
4,
620,
000
-
Tot
al R
egul
ar D
ebt S
ervi
ce8,
985,
516
-
8,
985,
516
8,98
5,51
6
-
To
tal e
xpen
dit
ure
s8,
985,
516
-
8,
985,
516
8,98
5,51
6
-
Exc
ess
(Def
icie
ncy)
of R
even
ues
Ove
r (U
nder
) E
xpen
ditu
res
-
-
-
13
,564
13
,564
Fun
d B
alan
ce, J
uly
137
,743
-
37,7
43
37,7
43
-
Fun
d B
alan
ce, J
une
3037
,743
$
-
37,7
43
51,3
07
13,5
64
Rec
apit
ula
tio
n o
f F
un
d B
alan
ce:
Des
igna
ted
for
Sub
sequ
ent Y
ear's
Exp
endi
ture
s37
,743
R
estr
icte
d F
und
Bal
ance
13,5
64
51
,307
Fo
r th
e F
isca
l Yea
r E
nd
ed J
un
e 30
, 201
4
EG
G H
AR
BO
R T
OW
NS
HIP
SC
HO
OL
DIS
TR
ICT
Bu
dg
etar
y C
om
par
iso
n S
ched
ule
D
ebt
Ser
vice
Fu
nd
See
Acc
ompa
nyin
g A
udit
or's
Rep
ort
107
Statistical Section
Financial Trends (J-1 through J-5)
These schedules contain trend information to help the reader understandhow the School District's financial position has changed over time.
Revenue Capacity (J-6 through J-9)
These schedules contain information to help the reader understand and
assess the factors affecting the School District's ability to generate
its most significant local revenue source, the propery tax.
Debt Capacity (J-10 through J-13)
These schedules present information to help the reader assess the affordabilityof the School District's current levels of outstanding debt and the School
District's ability to issue additional debt in the future.
Demographic and Economic Information (J-14 and J-15)
These schedules offer economic and demographic indicators to help thereader understand the environment within which the School District's
financial activities take place and to provide information that facilitatescomparisons of financial information over time and among governments.
Operating Information (J-16 through J-20)
These schedules contain service and infrastructure data to help the readerunderstand how the information in the School District's financial report
relates to the services the School District provides and the activities it performs.

{THIS PAGE IS INTENTIONALLY LEFT BLANK}

J-1
2005
2006
2007
2008
2009
2010
2011
2012
2013
2014
Gov
ernm
enta
l act
iviti
esN
et in
vest
men
t in
capi
tal a
sset
s$
41,2
08,0
35
39
,306
,247
38
,524
,993
65
,409
,682
68
,517
,439
78
,925
,882
80
,245
,144
10
7,59
6,50
9
106,
080,
616
10
4,59
0,05
0
Res
tric
ted
31,8
78,4
93
34
,697
,055
35
,134
,539
34
,240
,661
39
,309
,721
17
,240
,873
9,
181,
319
4,
661,
596
3,93
7,30
3
2,
635,
593
U
nres
tric
ted
(11,
021,
150)
(9
,456
,186
)
(9
,020
,267
)
(7
,336
,108
)
(1
8,15
5,05
6)
(12,
189,
021)
(2
,941
,253
)
3,44
8,52
8
5,
512,
921
8,91
0,96
3
Tot
al g
over
nmen
tal a
ctiv
ities
net
pos
ition
62,0
65,3
78
64
,547
,116
64
,639
,265
92
,314
,235
89
,672
,104
83
,977
,734
86
,485
,210
11
5,70
6,63
3
115,
530,
840
11
6,13
6,60
6
Bus
ines
s-ty
pe a
ctiv
ities
Net
inve
stm
ent i
n ca
pita
l ass
ets
23,8
75
8,
247
59,6
31
64
,568
154,
785
13
9,76
4
124,
316
113,
406
14
7,74
1
151,
742
Unr
estr
icte
d63
,506
77,1
92
26
2,48
0
291,
589
51
1,87
3
912,
539
1,
339,
255
1,
628,
015
1,33
8,79
2
1,
301,
455
T
otal
bus
ines
s-ty
pe a
ctiv
ities
net
pos
ition
87,3
81
85
,439
322,
111
35
6,15
7
666,
658
1,
052,
303
1,46
3,57
1
1,74
1,42
1
1,
486,
533
1,45
3,19
7
Dis
tric
t-w
ide
Net
inve
stm
ent i
n ca
pita
l ass
ets
41,2
31,9
10
39
,314
,494
38
,584
,624
65
,474
,250
68
,672
,224
79
,065
,646
80
,369
,460
10
7,70
9,91
5
106,
228,
357
10
4,74
1,79
2
Res
tric
ted
31,8
78,4
93
34
,697
,055
35
,134
,539
34
,240
,661
39
,309
,721
17
,240
,873
9,
181,
319
4,
661,
596
3,93
7,30
3
2,
635,
593
U
nres
tric
ted
(10,
957,
644)
(9
,378
,994
)
(8
,757
,787
)
(7
,044
,519
)
(1
7,64
3,18
3)
(11,
276,
482)
(1
,601
,998
)
5,01
3,46
1
6,
851,
713
10,2
12,4
18
T
otal
dis
tric
t net
pos
ition
$62
,152
,759
64,6
32,5
55
64,9
61,3
76
92,6
70,3
92
90,3
38,7
62
85,0
30,0
37
87,9
48,7
81
117,
384,
972
11
7,01
7,37
3
117,
589,
803
N
ote:
As
a re
sult
of im
plem
entin
g G
over
nmen
tal A
ccou
ntin
g S
tand
ards
Boa
rd (
GA
SB
) S
tate
men
t No.
63
and
65, t
he D
istr
ict
has
rest
ated
the
June
30,
201
2 G
over
nmen
tal A
ctiv
ities
Unr
estr
icte
d ne
t pos
ition
. T
he r
esta
tmen
t res
ulte
d in
an
incr
ease
of $
68,0
83 to
net
pos
ition
.
Sou
rce:
CA
FR
Sce
hdul
e A
-1
Un
aud
ited
Las
t T
en F
isca
l Yea
rsN
et P
osi
tio
n b
y C
om
po
nen
t,T
OW
NS
HIP
OF
EG
G H
AR
BO
R S
CH
OO
L D
IST
RIC
T
108
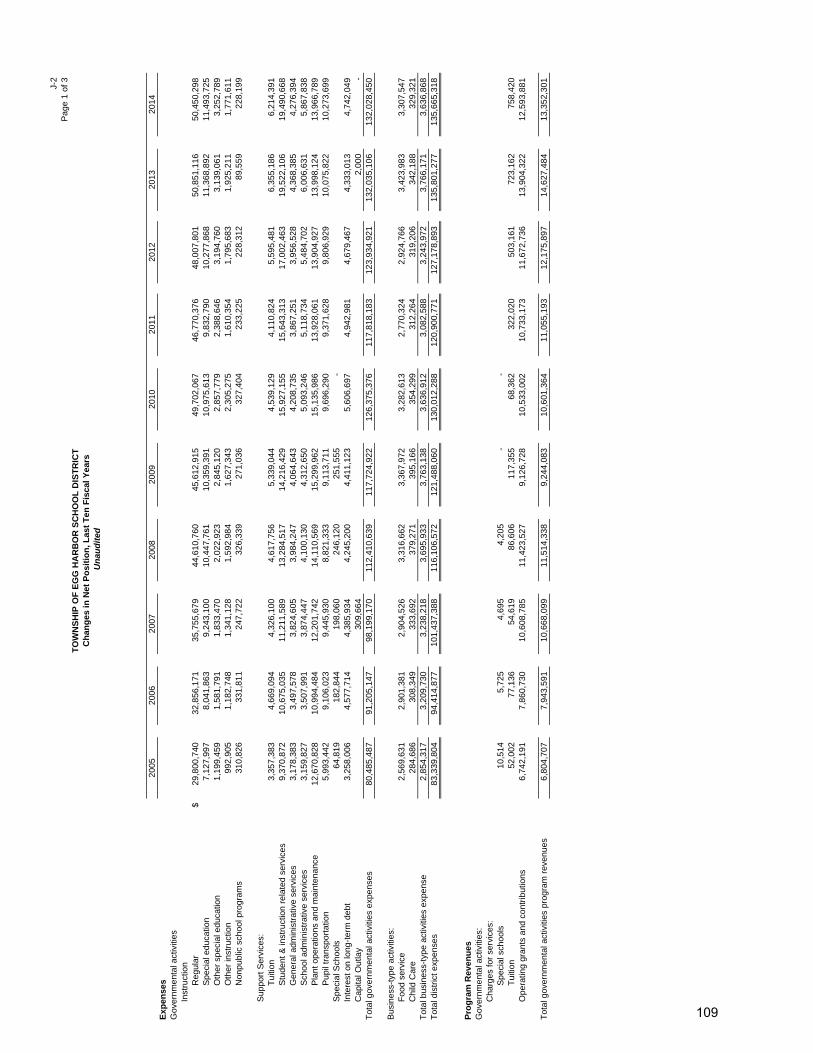
J-2
Pag
e 1
of 3
2005
2006
2007
2008
2009
2010
2011
2012
2013
2014
Exp
ense
sG
over
nmen
tal a
ctiv
ities
Inst
ruct
ion
Reg
ular
$29
,800
,740
32,8
56,1
71
35,7
55,6
79
44,6
10,7
60
45,6
12,9
15
49,7
02,0
67
46
,770
,376
48
,007
,801
50
,851
,116
50
,450
,298
S
peci
al e
duca
tion
7,12
7,99
7
8,04
1,86
3
9,24
3,10
0
10,4
47,7
61
10,3
59,3
91
10,9
75,6
13
9,
832,
790
10,2
77,8
68
11,3
68,8
92
11,4
93,7
25
Oth
er s
peci
al e
duca
tion
1,19
9,45
9
1,58
1,79
1
1,83
3,47
0
2,02
2,92
3
2,
845,
120
2,85
7,77
9
2,38
8,64
6
3,
194,
760
3,13
9,06
1
3,
252,
789
Oth
er in
stru
ctio
n99
2,90
5
1,
182,
748
1,
341,
128
1,
592,
984
1,62
7,34
3
2,
305,
275
1,
610,
354
1,79
5,68
3
1,
925,
211
1,77
1,61
1
N
onpu
blic
sch
ool p
rogr
ams
310,
826
331,
811
247,
722
326,
339
27
1,03
6
327,
404
233,
225
22
8,31
2
89,5
59
228,
199
Sup
port
Ser
vice
s:T
uitio
n3,
357,
383
4,
669,
094
4,
326,
100
4,
617,
756
5,33
9,04
4
4,
539,
129
4,
110,
824
5,59
5,48
1
6,
355,
186
6,21
4,39
1
S
tude
nt &
inst
ruct
ion
rela
ted
serv
ices
9,37
0,87
2
10,6
75,0
35
11,2
11,5
89
13,2
84,5
17
14,2
16,4
29
15,9
27,1
55
15
,643
,313
17
,002
,463
19
,522
,106
19
,490
,668
G
ener
al a
dmin
istr
ativ
e se
rvic
es3,
178,
383
3,
497,
578
3,
824,
605
3,
984,
247
4,06
4,64
3
4,
208,
735
3,
867,
251
3,95
6,52
8
4,
368,
385
4,27
6,39
4
S
choo
l adm
inis
trat
ive
serv
ices
3,15
9,82
7
3,50
7,99
1
3,87
4,44
7
4,10
0,13
0
4,
312,
650
5,09
3,24
6
5,11
8,73
4
5,
484,
702
6,00
6,63
1
5,
867,
838
Pla
nt o
pera
tions
and
mai
nten
ance
12,6
70,8
28
10
,994
,484
12
,201
,742
14
,110
,569
15
,299
,962
15
,135
,986
13,9
28,0
61
13,9
04,9
27
13,9
98,1
24
13,9
66,7
89
Pup
il tr
ansp
orta
tion
5,99
3,44
2
9,10
6,02
3
9,44
5,93
0
8,82
1,33
3
9,
113,
711
9,69
6,29
0
9,37
1,62
8
9,
806,
929
10,0
75,8
22
10,2
73,6
99
Spe
cial
Sch
ools
64,8
19
18
2,84
4
19
8,06
0
24
6,12
0
251,
555
-
In
tere
st o
n lo
ng-t
erm
deb
t3,
258,
006
4,
577,
714
4,
385,
934
4,
245,
200
4,41
1,12
3
5,
606,
697
4,
942,
981
4,67
9,46
7
4,
333,
013
4,74
2,04
9
C
apita
l Out
lay
309,
664
2,00
0
-
T
otal
gov
ernm
enta
l act
iviti
es e
xpen
ses
80,4
85,4
87
91
,205
,147
98
,199
,170
11
2,41
0,63
911
7,72
4,92
2
126,
375,
376
11
7,81
8,18
312
3,93
4,92
113
2,03
5,10
613
2,02
8,45
0
Bus
ines
s-ty
pe a
ctiv
ities
:F
ood
serv
ice
2,56
9,63
1
2,90
1,38
1
2,90
4,52
6
3,31
6,66
2
3,
367,
972
3,28
2,61
3
2,77
0,32
4
2,
924,
766
3,42
3,98
3
3,
307,
547
Chi
ld C
are
284,
686
308,
349
333,
692
379,
271
39
5,16
6
354,
299
312,
264
31
9,20
6
342,
188
32
9,32
1
Tot
al b
usin
ess-
type
act
iviti
es e
xpen
se2,
854,
317
3,
209,
730
3,
238,
218
3,
695,
933
3,76
3,13
8
3,
636,
912
3,
082,
588
3,24
3,97
2
3,
766,
171
3,63
6,86
8
T
otal
dis
tric
t exp
ense
s83
,339
,804
94,4
14,8
77
101,
437,
388
116,
106,
572
121,
488,
060
13
0,01
2,28
8
120,
900,
771
127,
178,
893
135,
801,
277
135,
665,
318
Pro
gra
m R
even
ues
Gov
ernm
enta
l act
iviti
es:
Cha
rges
for
serv
ices
:S
peci
al s
choo
ls10
,514
5,72
5
4,69
5
4,
205
-
-
Tui
tion
52,0
02
77
,136
54
,619
86
,606
11
7,35
5
68,3
62
32
2,02
0
503,
161
72
3,16
2
758,
420
O
pera
ting
gran
ts a
nd c
ontr
ibut
ions
6,74
2,19
1
7,86
0,73
0
10,6
08,7
85
11,4
23,5
27
9,12
6,72
8
10
,533
,002
10,7
33,1
73
11,6
72,7
36
13,9
04,3
22
12,5
93,8
81
Tot
al g
over
nmen
tal a
ctiv
ities
pro
gram
rev
enue
s6,
804,
707
7,
943,
591
10
,668
,099
11
,514
,338
9,
244,
083
10,6
01,3
64
11
,055
,193
12
,175
,897
14
,627
,484
13
,352
,301
Un
aud
ited
Ch
ang
es in
Net
Po
siti
on
, Las
t T
en F
isca
l Yea
rsT
OW
NS
HIP
OF
EG
G H
AR
BO
R S
CH
OO
L D
IST
RIC
T
109
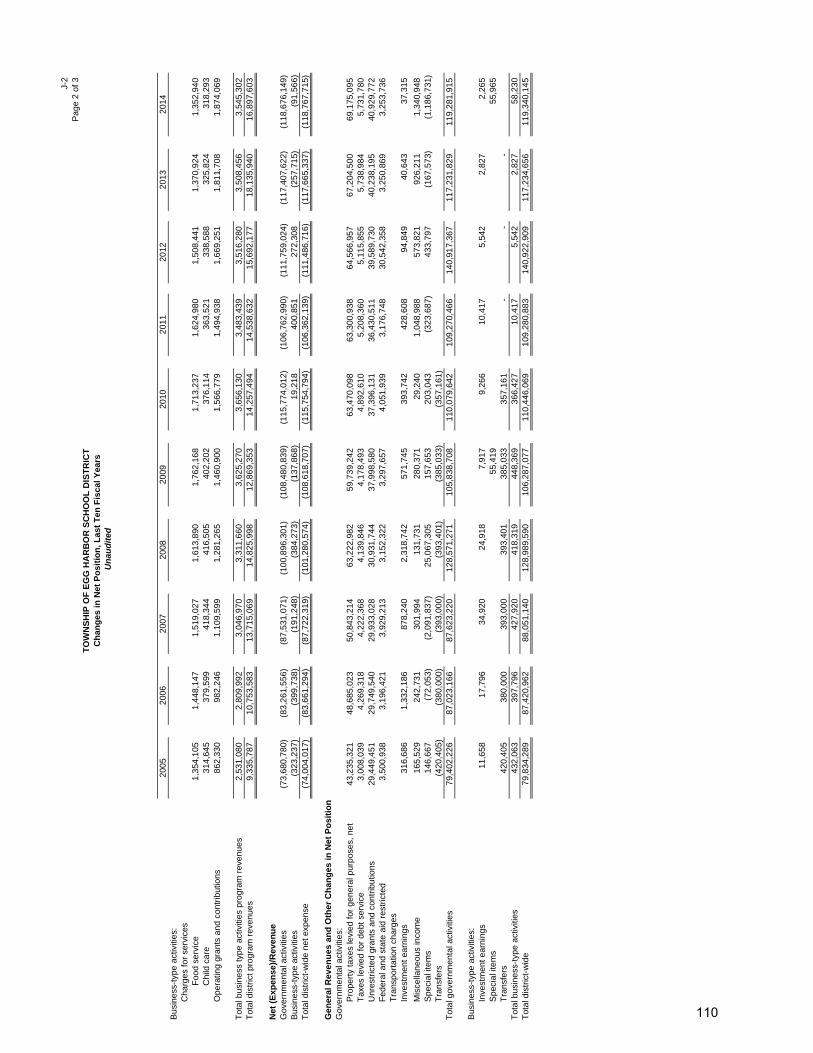
J-2
Pag
e 2
of 3
2005
2006
2007
2008
2009
2010
2011
2012
2013
2014
Bus
ines
s-ty
pe a
ctiv
ities
:C
harg
es fo
r se
rvic
esF
ood
serv
ice
1,35
4,10
5
1,44
8,14
7
1,51
9,02
7
1,61
3,89
0
1,
762,
168
1,71
3,23
7
1,62
4,98
0
1,
508,
441
1,37
0,92
4
1,
352,
940
Chi
ld c
are
314,
645
379,
599
418,
344
416,
505
40
2,20
2
376,
114
363,
521
33
8,58
8
325,
824
31
8,29
3
Ope
ratin
g gr
ants
and
con
trib
utio
ns86
2,33
0
98
2,24
6
1,
109,
599
1,
281,
265
1,46
0,90
0
1,
566,
779
1,
494,
938
1,66
9,25
1
1,
811,
708
1,87
4,06
9
Tot
al b
usin
ess
type
act
iviti
es p
rogr
am r
even
ues
2,53
1,08
0
2,80
9,99
2
3,04
6,97
0
3,31
1,66
0
3,
625,
270
3,65
6,13
0
3,48
3,43
9
3,
516,
280
3,50
8,45
6
3,
545,
302
Tot
al d
istr
ict p
rogr
am r
even
ues
9,33
5,78
7
10,7
53,5
83
13,7
15,0
69
14,8
25,9
98
12,8
69,3
53
14,2
57,4
94
14
,538
,632
15
,692
,177
18
,135
,940
16
,897
,603
Net
(E
xpen
se)/
Rev
enu
eG
over
nmen
tal a
ctiv
ities
(73,
680,
780)
(83,
261,
556)
(87,
531,
071)
(100
,896
,301
)(1
08,4
80,8
39)
(115
,774
,012
)
(106
,762
,990
)(1
11,7
59,0
24)
(117
,407
,622
)(1
18,6
76,1
49)
Bus
ines
s-ty
pe a
ctiv
ities
(323
,237
)
(399
,738
)
(1
91,2
48)
(384
,273
)
(1
37,8
68)
19,2
18
40
0,85
1
272,
308
(2
57,7
15)
(91,
566)
T
otal
dis
tric
t-w
ide
net e
xpen
se(7
4,00
4,01
7)
(8
3,66
1,29
4)(8
7,72
2,31
9)(1
01,2
80,5
74)
(108
,618
,707
)(1
15,7
54,7
94)
(1
06,3
62,1
39)
(111
,486
,716
)(1
17,6
65,3
37)
(118
,767
,715
)
Gen
eral
Rev
enu
es a
nd
Oth
er C
han
ges
in N
et P
osi
tio
nG
over
nmen
tal a
ctiv
ities
:P
rope
rty
taxe
s le
vied
for
gene
ral p
urpo
ses,
net
43,2
35,3
21
48
,685
,023
50
,843
,214
63
,222
,982
59
,739
,242
63
,470
,098
63,3
00,9
38
64,5
66,9
57
67,2
04,5
00
69,1
75,0
95
Tax
es le
vied
for
debt
ser
vice
3,00
8,03
9
4,26
9,31
8
4,22
2,36
8
4,13
9,84
6
4,
178,
493
4,89
2,61
0
5,20
8,36
0
5,
115,
855
5,73
8,98
4
5,
731,
780
Unr
estr
icte
d gr
ants
and
con
trib
utio
ns29
,449
,451
29,7
49,5
40
29,9
33,0
28
30,9
31,7
44
37,9
98,5
80
37,3
96,1
31
36
,430
,511
39
,589
,730
40
,238
,195
40
,929
,772
F
eder
al a
nd s
tate
aid
res
tric
ted
3,50
0,93
8
3,19
6,42
1
3,92
9,21
3
3,15
2,32
2
3,
297,
657
4,05
1,93
9
3,17
6,74
8
30
,542
,358
3,
250,
869
3,25
3,73
6
T
rans
port
atio
n ch
arge
sIn
vest
men
t ear
ning
s31
6,68
6
1,
332,
186
87
8,24
0
2,
318,
742
571,
745
39
3,74
2
42
8,60
8
94,8
49
40,6
43
37,3
15
Mis
cella
neou
s in
com
e 16
5,52
9
24
2,73
1
301,
994
13
1,73
1
28
0,37
1
29
,240
1,04
8,98
8
573,
821
926,
211
1,34
0,94
8
Spe
cial
item
s14
6,66
7
(7
2,05
3)
(2
,091
,837
)
25,0
67,3
05
157,
653
20
3,04
3
(3
23,6
87)
433,
797
(1
67,5
73)
(1,1
86,7
31)
Tra
nsfe
rs(4
20,4
05)
(3
80,0
00)
(393
,000
)
(3
93,4
01)
(385
,033
)
(3
57,1
61)
T
otal
gov
ernm
enta
l act
iviti
es79
,402
,226
87,0
23,1
66
87,6
23,2
20
128,
571,
271
105,
838,
708
11
0,07
9,64
2
109,
270,
466
140,
917,
367
117,
231,
829
119,
281,
915
Bus
ines
s-ty
pe a
ctiv
ities
:In
vest
men
t ear
ning
s11
,658
17,7
96
34,9
20
24,9
18
7,91
7
9,
266
10,4
17
5,54
2
2,
827
2,26
5
S
peci
al it
ems
55,4
19
55,9
65
Tra
nsfe
rs42
0,40
5
38
0,00
0
39
3,00
0
39
3,40
1
385,
033
35
7,16
1
-
-
-
Tot
al b
usin
ess-
type
act
iviti
es43
2,06
3
39
7,79
6
42
7,92
0
41
8,31
9
448,
369
36
6,42
7
10
,417
5,
542
2,82
7
58
,230
T
otal
dis
tric
t-w
ide
79,8
34,2
89
87
,420
,962
88
,051
,140
12
8,98
9,59
010
6,28
7,07
7
110,
446,
069
10
9,28
0,88
314
0,92
2,90
911
7,23
4,65
611
9,34
0,14
5
Ch
ang
es in
Net
Po
siti
on
, Las
t T
en F
isca
l Yea
rsT
OW
NS
HIP
OF
EG
G H
AR
BO
R S
CH
OO
L D
IST
RIC
T
Un
aud
ited
110
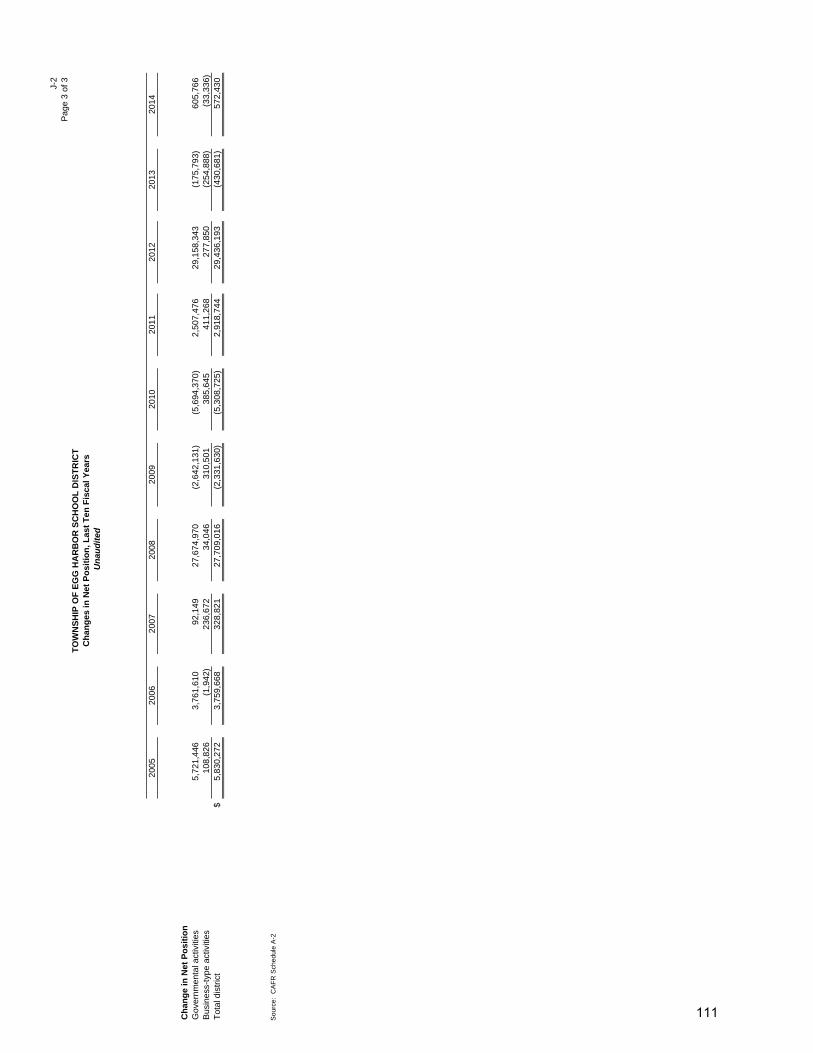
J-2
Pag
e 3
of 3
2005
2006
2007
2008
2009
2010
2011
2012
2013
2014
Ch
ang
e in
Net
Po
siti
on
Gov
ernm
enta
l act
iviti
es5,
721,
446
3,
761,
610
92
,149
27
,674
,970
(2
,642
,131
)
(5
,694
,370
)
2,
507,
476
29,1
58,3
43
(175
,793
)
60
5,76
6
Bus
ines
s-ty
pe a
ctiv
ities
108,
826
(1,9
42)
23
6,67
2
34
,046
31
0,50
1
385,
645
411,
268
27
7,85
0
(254
,888
)
(3
3,33
6)
Tot
al d
istr
ict
$5,
830,
272
3,
759,
668
32
8,82
1
27
,709
,016
(2
,331
,630
)
(5
,308
,725
)
2,
918,
744
29,4
36,1
93
(430
,681
)
57
2,43
0
Sou
rce:
CA
FR
Sch
edul
e A
-2
Un
aud
ited
Ch
ang
es in
Net
Po
siti
on
, Las
t T
en F
isca
l Yea
rsT
OW
NS
HIP
OF
EG
G H
AR
BO
R S
CH
OO
L D
IST
RIC
T
111
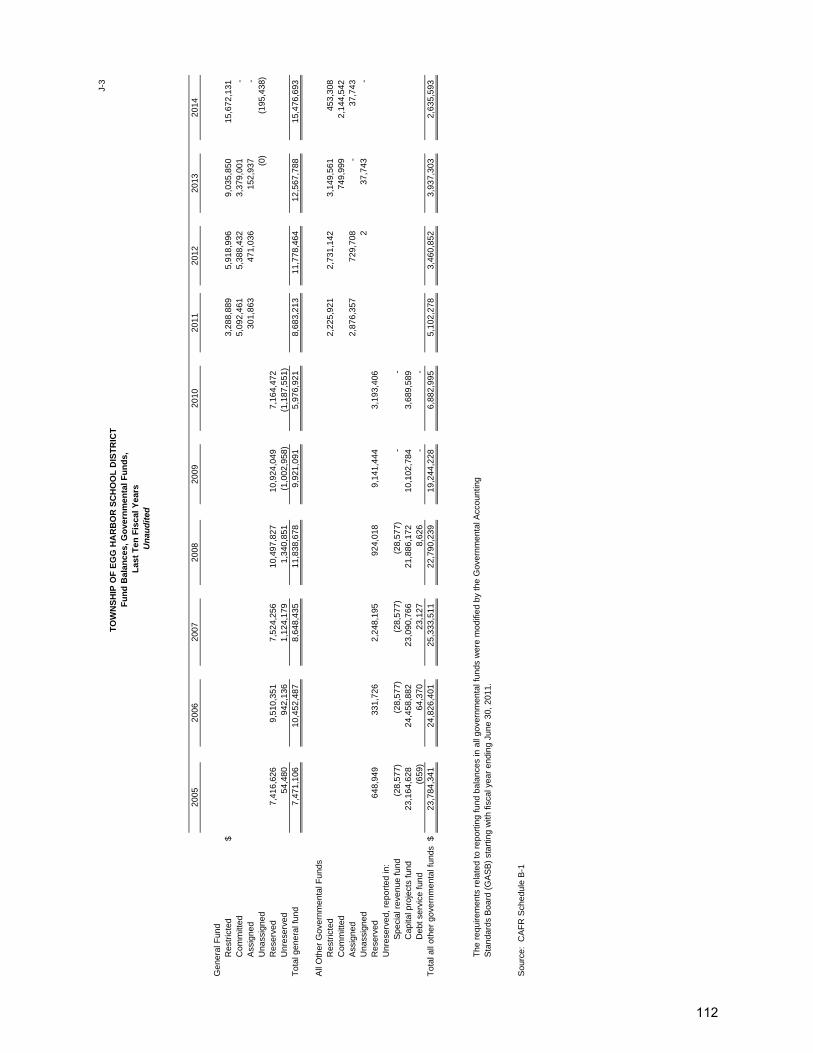
J-3
2005
2006
2007
2008
2009
2010
2011
2012
2013
2014
Gen
eral
Fun
dR
estr
icte
d$
3,28
8,88
9
5,
918,
996
9,03
5,85
0
15
,672
,131
Com
mitt
ed5,
092,
461
5,38
8,43
2
3,
379,
001
-
A
ssig
ned
301,
863
47
1,03
6
152,
937
-
Una
ssig
ned
(0)
(1
95,4
38)
Res
erve
d7,
416,
626
9,51
0,35
1
7,52
4,25
6
10,4
97,8
27
10
,924
,049
7,16
4,47
2
Unr
eser
ved
54,4
80
942,
136
1,12
4,17
9
1,34
0,85
1
(1,0
02,9
58)
(1,1
87,5
51)
T
otal
gen
eral
fund
7,47
1,10
6
10
,452
,487
8,
648,
435
11
,838
,678
9,92
1,09
1
5,
976,
921
8,
683,
213
11,7
78,4
64
12
,567
,788
15,4
76,6
93
All
Oth
er G
over
nmen
tal F
unds
Res
tric
ted
2,22
5,92
1
2,
731,
142
3,14
9,56
1
45
3,30
8
C
omm
itted
749,
999
2,
144,
542
A
ssig
ned
2,87
6,35
7
72
9,70
8
-
37,7
43
Una
ssig
ned
2
37,7
43
-
Res
erve
d64
8,94
9
331,
726
2,24
8,19
5
924,
018
9,14
1,44
4
3,
193,
406
U
nres
erve
d, r
epor
ted
in:
Spe
cial
rev
enue
fund
(28,
577)
(2
8,57
7)
(28,
577)
(2
8,57
7)
-
-
Cap
ital p
roje
cts
fund
23,1
64,6
28
24,4
58,8
82
23,0
90,7
66
21,8
86,1
72
10
,102
,784
3,68
9,58
9
Deb
t ser
vice
fund
(659
)
64,3
70
23,1
27
8,62
6
-
-
T
otal
all
othe
r go
vern
men
tal f
unds
$23
,784
,341
24
,826
,401
25
,333
,511
22
,790
,239
19,2
44,2
28
6,
882,
995
5,
102,
278
3,46
0,85
2
3,
937,
303
2,63
5,59
3
The
req
uire
men
ts r
elat
ed to
rep
ortin
g fu
nd b
alan
ces
in a
ll go
vern
men
tal f
unds
wer
e m
odifi
ed b
y th
e G
over
nmen
tal A
ccou
ntin
gS
tand
ards
Boa
rd (
GA
SB
) st
artin
g w
ith fi
scal
yea
r en
ding
Jun
e 30
, 201
1.
Sou
rce:
CA
FR
Sch
edul
e B
-1
Un
aud
ited
Las
t T
en F
isca
l Yea
rsF
un
d B
alan
ces,
Go
vern
men
tal F
un
ds,
TO
WN
SH
IP O
F E
GG
HA
RB
OR
SC
HO
OL
DIS
TR
ICT
112
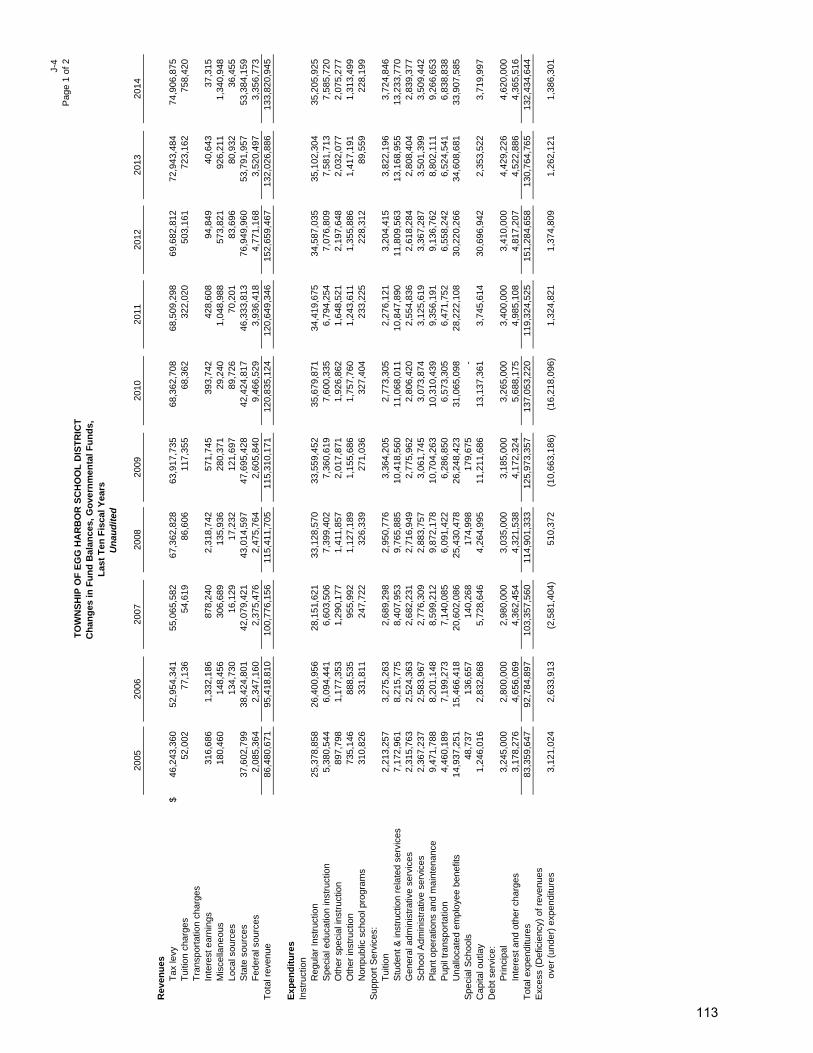
J-4
Pag
e 1
of 2
2005
2006
2007
2008
2009
2010
2011
2012
2013
2014
Rev
enu
esT
ax le
vy$
46,2
43,3
60
52
,954
,341
55,0
65,5
82
67
,362
,828
63,9
17,7
35
68
,362
,708
68,5
09,2
98
69
,682
,812
72,9
43,4
84
74
,906
,875
Tui
tion
char
ges
52,0
02
77
,136
54,6
19
86,6
06
11
7,35
5
68
,362
32
2,02
0
50
3,16
1
72
3,16
2
75
8,42
0
T
rans
port
atio
n ch
arge
sIn
tere
st e
arni
ngs
316,
686
1,33
2,18
6
87
8,24
0
2,
318,
742
571,
745
393,
742
428,
608
94,8
49
40
,643
37,3
15
Mis
cella
neou
s18
0,46
0
14
8,45
6
306,
689
135,
936
28
0,37
1
29
,240
1,
048,
988
57
3,82
1
92
6,21
1
1,
340,
948
Lo
cal s
ourc
es13
4,73
0
16,1
29
17,2
32
12
1,69
7
89
,726
70
,201
83,6
96
80
,932
36,4
55
Sta
te s
ourc
es37
,602
,799
38,4
24,8
01
42
,079
,421
43,0
14,5
97
47
,695
,428
42,4
24,8
17
46
,333
,813
76,9
49,9
60
53
,791
,957
53,3
84,1
59
F
eder
al s
ourc
es2,
085,
364
2,
347,
160
2,37
5,47
6
2,47
5,76
4
2,
605,
840
9,
466,
529
3,
936,
418
4,
771,
168
3,
520,
497
3,
356,
773
T
otal
rev
enue
86,4
80,6
71
95
,418
,810
100,
776,
156
115,
411,
705
11
5,31
0,17
1
12
0,83
5,12
4
12
0,64
9,34
6
152,
659,
467
13
2,02
6,88
6
133,
820,
945
Exp
end
itu
res
Inst
ruct
ion
Reg
ular
Inst
ruct
ion
25,3
78,8
58
26
,400
,956
28,1
51,6
21
33
,128
,570
33,5
59,4
52
35
,679
,871
34,4
19,6
75
34
,587
,035
35,1
02,3
04
35
,205
,925
Spe
cial
edu
catio
n in
stru
ctio
n5,
380,
544
6,
094,
441
6,60
3,50
6
7,39
9,40
2
7,
360,
619
7,
600,
335
6,
794,
254
7,
076,
809
7,
581,
713
7,
585,
720
O
ther
spe
cial
inst
ruct
ion
897,
798
1,17
7,35
3
1,
290,
177
1,
411,
857
2,01
7,87
1
1,92
6,86
2
1,64
8,52
1
2,19
7,64
8
2,03
2,07
7
2,07
5,27
7
Oth
er in
stru
ctio
n73
5,14
6
88
8,53
5
955,
992
1,12
7,18
9
1,
155,
686
1,
757,
760
1,
243,
611
1,
355,
886
1,
417,
191
1,
313,
499
N
onpu
blic
sch
ool p
rogr
ams
310,
826
331,
811
24
7,72
2
32
6,33
9
271,
036
327,
404
233,
225
228,
312
89,5
59
22
8,19
9
S
uppo
rt S
ervi
ces:
Tui
tion
2,21
3,25
7
3,27
5,26
3
2,
689,
298
2,
950,
776
3,36
4,20
5
2,77
3,30
5
2,27
6,12
1
3,20
4,41
5
3,82
2,19
6
3,72
4,84
6
Stu
dent
& in
stru
ctio
n re
late
d se
rvic
es7,
172,
961
8,
215,
775
8,40
7,95
3
9,76
5,88
5
10
,418
,560
11,0
68,0
11
10
,847
,890
11,8
09,5
63
13
,168
,955
13,2
33,7
70
G
ener
al a
dmin
istr
ativ
e se
rvic
es2,
315,
763
2,
524,
363
2,68
2,23
1
2,71
6,94
9
2,
775,
962
2,
806,
420
2,
554,
836
2,
618,
284
2,
808,
404
2,
839,
377
S
choo
l Adm
inis
trat
ive
serv
ices
2,36
7,23
7
2,58
3,96
7
2,
776,
309
2,
883,
757
3,06
1,74
5
3,07
3,87
4
3,12
5,61
9
3,36
7,28
7
3,50
1,39
9
3,50
9,44
2
Pla
nt o
pera
tions
and
mai
nten
ance
9,47
1,78
8
8,20
1,14
8
8,
599,
212
9,
872,
178
10,7
04,2
63
10
,310
,439
9,35
6,19
1
9,13
6,76
2
8,80
2,11
1
9,26
6,65
3
Pup
il tr
ansp
orta
tion
4,46
0,18
9
7,19
9,27
3
7,
140,
085
6,
091,
422
6,28
6,85
0
6,57
3,30
5
6,47
1,75
2
6,55
8,24
2
6,52
4,54
1
6,83
8,83
8
Una
lloca
ted
empl
oyee
ben
efits
14,9
37,2
51
15
,466
,418
20,6
02,0
86
25
,430
,478
26,2
48,4
23
31
,065
,098
28,2
22,1
08
30
,220
,266
34,6
08,6
81
33
,907
,585
Spe
cial
Sch
ools
48,7
37
13
6,65
7
140,
268
174,
998
17
9,67
5
-
Cap
ital o
utla
y1,
246,
016
2,
832,
868
5,72
8,64
6
4,26
4,99
5
11
,211
,686
13,1
37,3
61
3,
745,
614
30
,696
,942
2,35
3,52
2
3,71
9,99
7
Deb
t ser
vice
:P
rinci
pal
3,24
5,00
0
2,80
0,00
0
2,
980,
000
3,
035,
000
3,18
5,00
0
3,26
5,00
0
3,40
0,00
0
3,41
0,00
0
4,42
9,22
6
4,62
0,00
0
Inte
rest
and
oth
er c
harg
es3,
178,
276
4,
656,
069
4,36
2,45
4
4,32
1,53
8
4,
172,
324
5,
688,
175
4,
985,
108
4,
817,
207
4,
522,
886
4,
365,
516
T
otal
exp
endi
ture
s83
,359
,647
92,7
84,8
97
10
3,35
7,56
0
11
4,90
1,33
3
125,
973,
357
137,
053,
220
119,
324,
525
15
1,28
4,65
8
130,
764,
765
13
2,43
4,64
4
E
xces
s (D
efic
ienc
y) o
f rev
enue
s o
ver
(und
er)
expe
nditu
res
3,12
1,02
4
2,63
3,91
3
(2
,581
,404
)
51
0,37
2
(10,
663,
186)
(16,
218,
096)
1,32
4,82
1
1,37
4,80
9
1,26
2,12
1
1,38
6,30
1
Un
aud
ited
Las
t T
en F
isca
l Yea
rsC
han
ges
in F
un
d B
alan
ces,
Go
vern
men
tal F
un
ds,
TO
WN
SH
IP O
F E
GG
HA
RB
OR
SC
HO
OL
DIS
TR
ICT
113
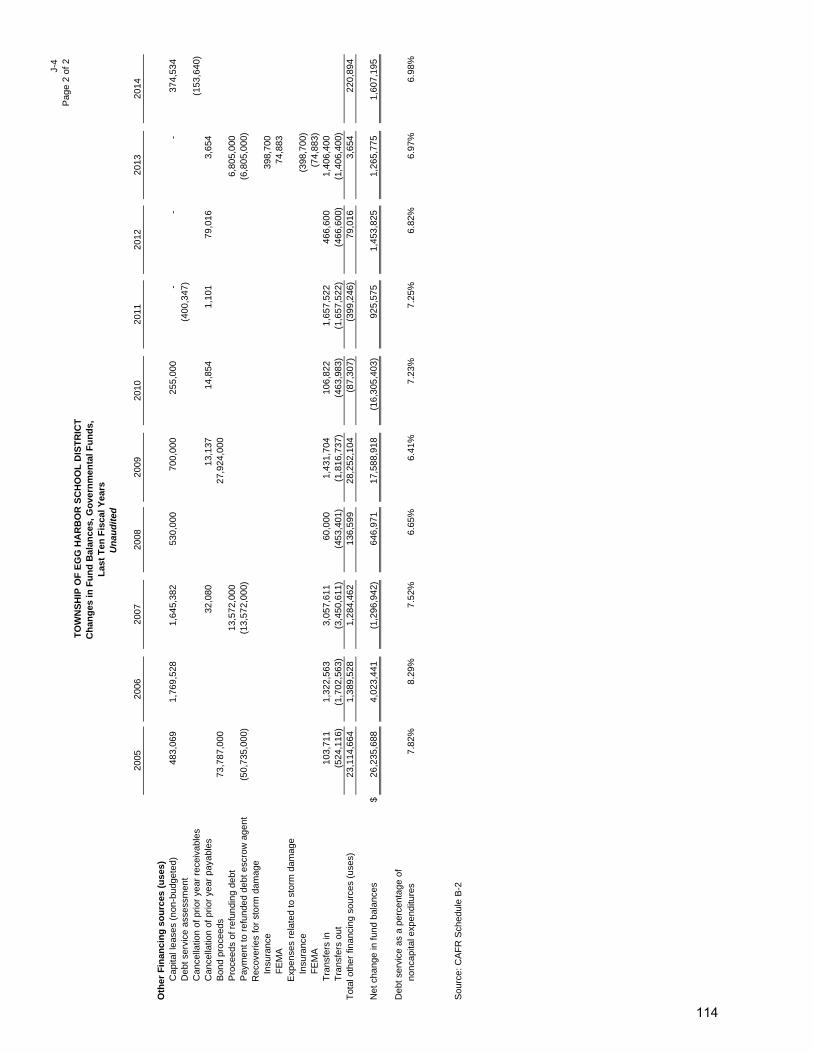
J-4
Pag
e 2
of 2
2005
2006
2007
2008
2009
2010
2011
2012
2013
2014
Oth
er F
inan
cin
g s
ou
rces
(u
ses)
Cap
ital l
ease
s (n
on-b
udge
ted)
483,
069
1,76
9,52
8
1,
645,
382
53
0,00
0
700,
000
255,
000
-
-
-
37
4,53
4
D
ebt s
ervi
ce a
sses
smen
t(4
00,3
47)
C
ance
llatio
n of
prio
r ye
ar r
ecei
vabl
es(1
53,6
40)
C
ance
llatio
n of
prio
r ye
ar p
ayab
les
32,0
80
13,1
37
14,8
54
1,10
1
79,0
16
3,
654
B
ond
proc
eeds
73,7
87,0
00
27
,924
,000
Pro
ceed
s of
ref
undi
ng d
ebt
13,5
72,0
00
6,
805,
000
P
aym
ent t
o re
fund
ed d
ebt e
scro
w a
gent
(50,
735,
000)
(13,
572,
000)
(6,8
05,0
00)
Rec
over
ies
for
stor
m d
amag
e
Insu
ranc
e39
8,70
0
FE
MA
74,8
83
E
xpen
ses
rela
ted
to s
torm
dam
age
In
sura
nce
(398
,700
)
F
EM
A(7
4,88
3)
T
rans
fers
in10
3,71
1
1,
322,
563
3,05
7,61
1
60,0
00
1,
431,
704
10
6,82
2
1,
657,
522
46
6,60
0
1,
406,
400
T
rans
fers
out
(524
,116
)
(1,7
02,5
63)
(3,4
50,6
11)
(453
,401
)
(1,8
16,7
37)
(463
,983
)
(1,6
57,5
22)
(466
,600
)
(1,4
06,4
00)
Tot
al o
ther
fina
ncin
g so
urce
s (u
ses)
23,1
14,6
64
1,
389,
528
1,28
4,46
2
136,
599
28
,252
,104
(87,
307)
(399
,246
)
79,0
16
3,
654
22
0,89
4
Net
cha
nge
in fu
nd b
alan
ces
$26
,235
,688
4,02
3,44
1
(1
,296
,942
)
64
6,97
1
17,5
88,9
18
(1
6,30
5,40
3)
92
5,57
5
1,
453,
825
1,
265,
775
1,
607,
195
Deb
t ser
vice
as
a pe
rcen
tage
of
nonc
apita
l exp
endi
ture
s7.
82%
8.29
%7.
52%
6.65
%6.
41%
7.23
%7.
25%
6.82
%6.
97%
6.98
%
Sou
rce:
CA
FR
Sch
edul
e B
-2
Un
aud
ited
Las
t T
en F
isca
l Yea
rsC
han
ges
in F
un
d B
alan
ces,
Go
vern
men
tal F
un
ds,
TO
WN
SH
IP O
F E
GG
HA
RB
OR
SC
HO
OL
DIS
TR
ICT
114
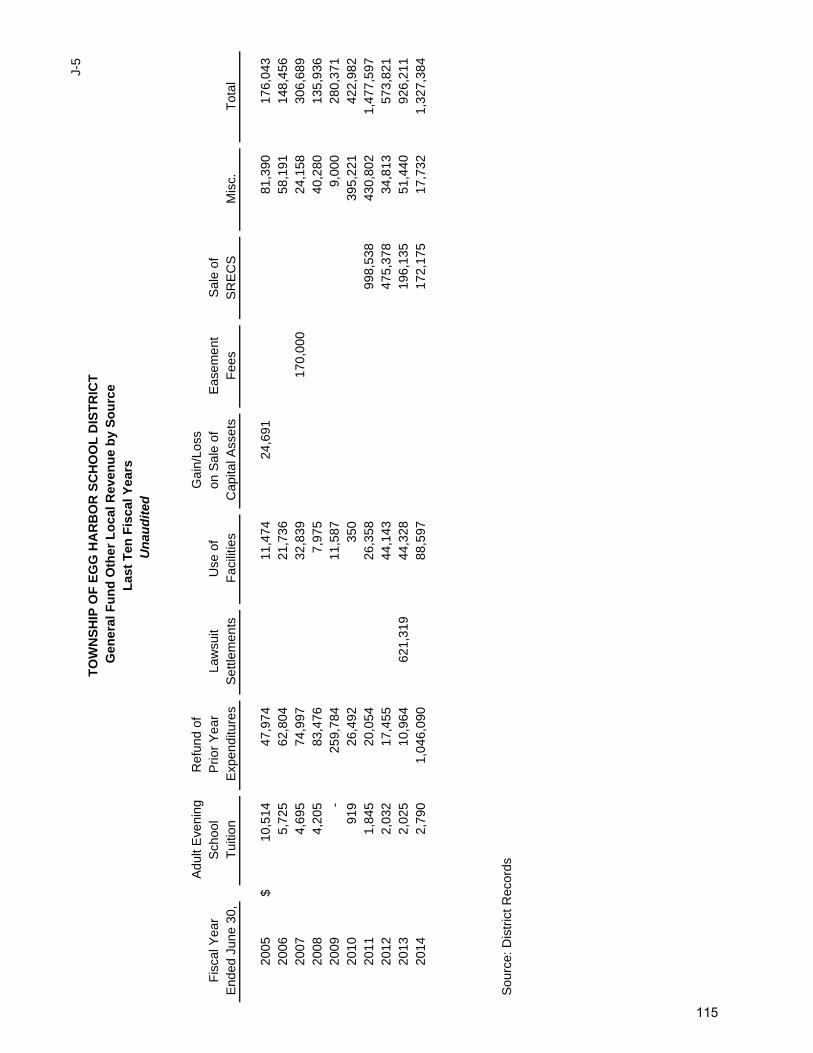
J-5
TO
WN
SH
IP O
F E
GG
HA
RB
OR
SC
HO
OL
DIS
TR
ICT
Gen
eral
Fu
nd
Oth
er L
oca
l Rev
enu
e b
y S
ou
rce
Las
t T
en F
isca
l Yea
rsU
nau
dit
ed
Adu
lt E
veni
ngR
efun
d of
Gai
n/Lo
ssF
isca
l Yea
rS
choo
lP
rior
Yea
rLa
wsu
itU
se o
fon
Sal
e of
Eas
emen
tS
ale
ofE
nded
Jun
e 30
,T
uitio
nE
xpen
ditu
res
Set
tlem
ents
Fac
ilitie
sC
apita
l Ass
ets
Fee
sS
RE
CS
Mis
c.T
otal
2005
$10
,514
47,9
74
11
,474
24,6
91
81,3
90
176,
043
2006
5,72
5
62,8
04
21
,736
58,1
91
148,
456
2007
4,69
5
74,9
97
32
,839
170,
000
24
,158
30
6,68
9
20
084,
205
83
,476
7,97
5
40,2
80
135,
936
2009
-
259,
784
11
,587
9,00
0
28
0,37
1
20
1091
9
26
,492
350
395,
221
42
2,98
2
20
111,
845
20
,054
26,3
58
99
8,53
8
430,
802
1,
477,
597
20
122,
032
17
,455
44,1
43
47
5,37
8
34,8
13
573,
821
2013
2,02
5
10,9
64
62
1,31
9
44,3
28
19
6,13
5
51,4
40
926,
211
2014
2,79
0
1,04
6,09
0
88
,597
172,
175
17
,732
1,
327,
384
Sou
rce:
Dis
tric
t Rec
ords
115
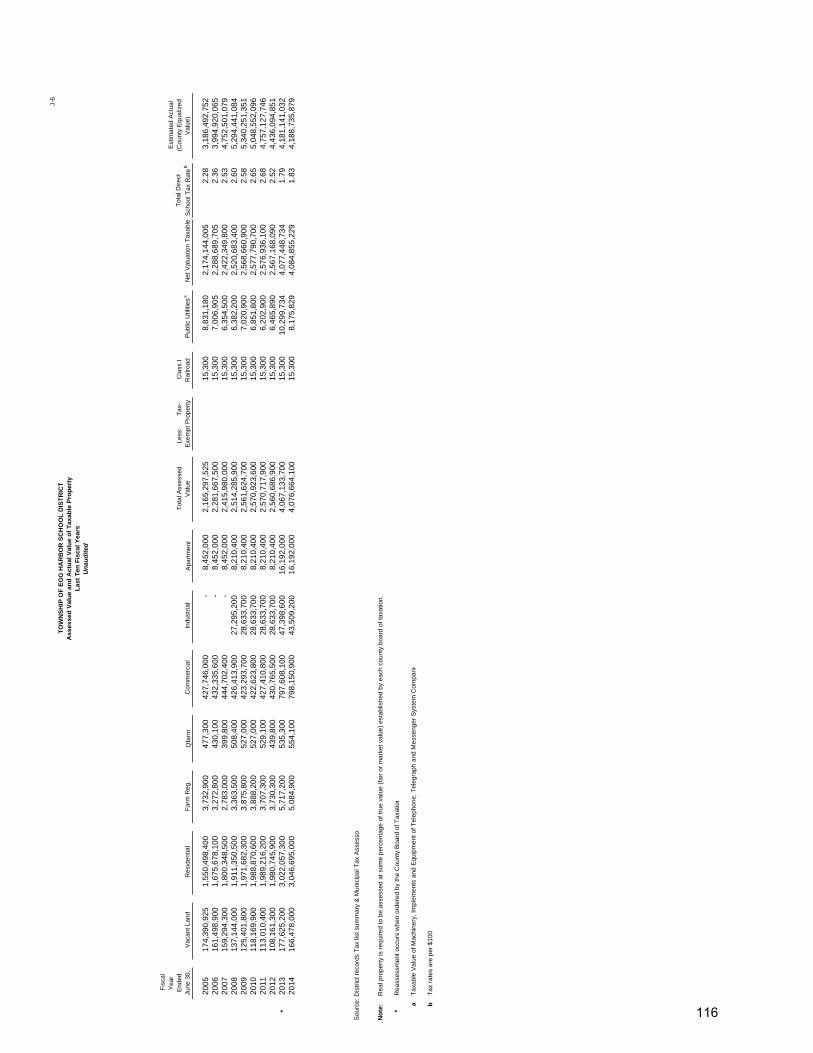
J-6
TO
WN
SH
IP O
F E
GG
HA
RB
OR
SC
HO
OL
DIS
TR
ICT
Ass
esse
d V
alu
e an
d A
ctu
al V
alu
e o
f T
axab
le P
rop
erty
Las
t T
en F
isca
l Yea
rsU
nau
dit
ed
Fis
cal
Yea
r E
nded
Ju
ne 3
0,
Vac
ant L
and
Res
iden
tial
Far
m R
eg.
Qfa
rm C
omm
erci
al
Indu
stria
l A
part
men
t
Tot
al A
sses
sed
Val
ue
Les
s:
T
ax-
Exe
mpt
Pro
pert
y C
lass
I R
ailro
ad
Pub
lic U
tiliti
es a
Net
Val
uatio
n T
axab
le
Tot
al D
irect
Sch
ool T
ax R
ate
b
Est
imat
ed A
ctua
l (C
ount
y E
qual
ized
V
alue
)
2005
174,
390,
925
1,
550,
498,
400
3,
732,
900
477,
300
427,
746,
000
-
8,
452,
000
2,
165,
297,
525
15
,300
8,83
1,18
0
2,17
4,14
4,00
5
2.28
3,18
6,49
2,75
2
2006
161,
498,
900
1,
675,
678,
100
3,
272,
800
430,
100
432,
335,
600
-
8,
452,
000
2,
281,
667,
500
15
,300
7,00
6,90
5
2,28
8,68
9,70
5
2.36
3,99
4,92
0,06
5
2007
159,
294,
300
1,
800,
348,
500
2,
783,
000
399,
800
444,
702,
400
-
8,
452,
000
2,
415,
980,
000
15
,300
6,35
4,50
0
2,42
2,34
9,80
0
2.53
4,75
2,50
1,07
9
2008
137,
144,
000
1,
911,
350,
500
3,
363,
500
508,
400
426,
413,
900
27,2
95,2
008,
210,
400
2,
514,
285,
900
15
,300
6,38
2,20
0
2,52
0,68
3,40
0
2.60
5,29
4,44
1,08
4
2009
125,
401,
800
1,
971,
682,
300
3,
875,
800
527,
000
423,
293,
700
28,6
33,7
008,
210,
400
2,
561,
624,
700
15
,300
7,02
0,90
0
2,56
8,66
0,90
0
2.58
5,34
0,25
1,35
1
2010
118,
169,
900
1,
988,
870,
600
3,
888,
200
527,
000
422,
623,
800
28,6
33,7
008,
210,
400
2,
570,
923,
600
15
,300
6,85
1,80
0
2,57
7,79
0,70
0
2.65
5,04
8,55
2,09
6
2011
113,
010,
400
1,
989,
216,
200
3,
707,
300
529,
100
427,
410,
800
28,6
33,7
008,
210,
400
2,
570,
717,
900
15
,300
6,20
2,90
0
2,57
6,93
6,10
0
2.68
4,75
7,12
7,74
6
2012
108,
161,
300
1,
980,
745,
900
3,
730,
300
439,
800
430,
765,
500
28,6
33,7
008,
210,
400
2,
560,
686,
900
15
,300
6,46
5,89
0
2,56
7,16
8,09
0
2.52
4,43
6,09
4,85
1
*20
1317
7,62
5,20
0
3,02
2,05
7,30
0
5,71
7,20
0
53
5,30
0
79
7,60
8,10
047
,398
,600
16,1
92,0
004,
067,
133,
700
15
,300
10,2
99,7
344,
077,
448,
734
1.
79
4,
181,
141,
032
20
1416
6,47
8,00
0
3,04
6,69
5,00
0
5,08
4,90
0
55
4,10
0
79
8,15
0,90
043
,509
,200
16,1
92,0
004,
076,
664,
100
15
,300
8,17
5,82
9
4,08
4,85
5,22
9
1.83
4,18
8,73
5,87
9
Sou
rce:
Dis
tric
t rec
ords
Tax
list
sum
mar
y &
Mun
icip
al T
ax A
sses
so
No
te:
*R
eass
essm
ent o
ccur
s w
hen
orde
red
by
the
Cou
nty
Boa
rd o
f Tax
atio
n
aT
axab
le V
alue
of M
achi
nery
, Im
plem
ents
and
Equ
ipm
ent o
f Tel
epho
ne, T
eleg
raph
and
Mes
seng
er S
yste
m C
ompa
nie
bT
ax r
ates
are
per
$10
0
Rea
l pro
pert
y is
req
uire
d to
be
asse
ssed
at s
ome
perc
enta
ge o
f tru
e va
lue
(fai
r or
mar
ket v
alue
) es
tabl
ishe
d by
eac
h co
unty
bo
ard
of ta
xatio
n.
116
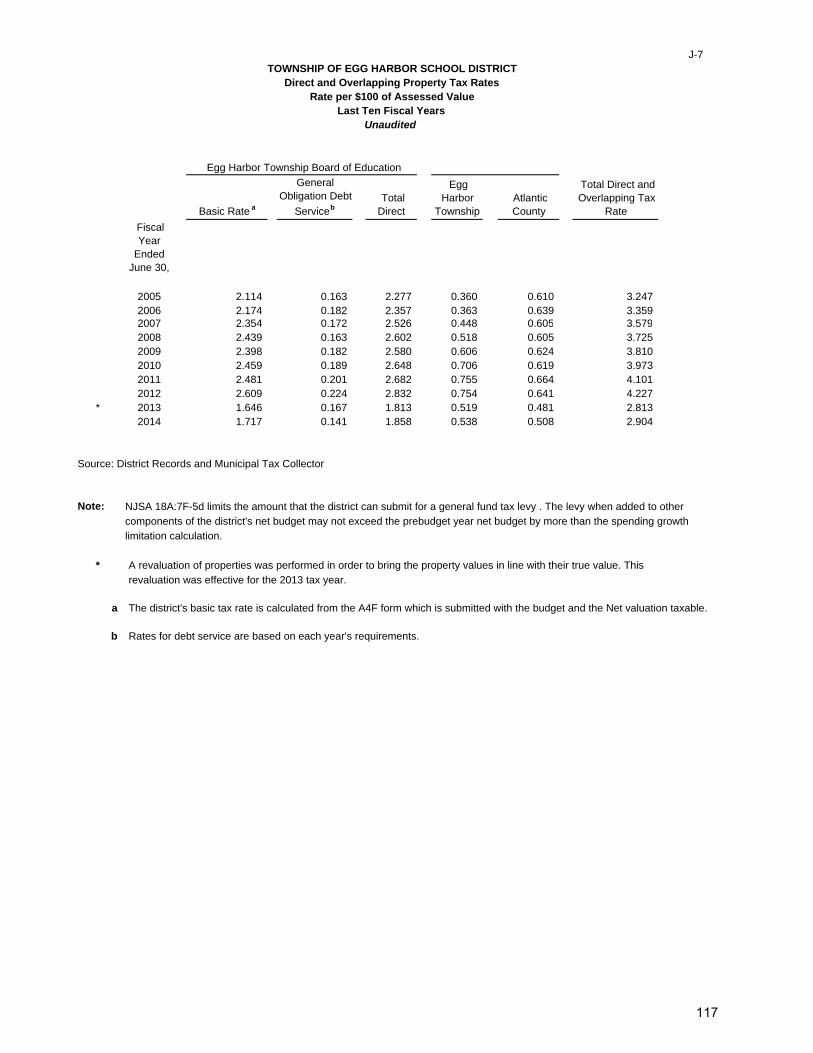
J-7TOWNSHIP OF EGG HARBOR SCHOOL DISTRICT
Direct and Overlapping Property Tax RatesRate per $100 of Assessed Value
Last Ten Fiscal YearsUnaudited
Basic Rate a
General Obligation Debt
Service b Total Direct
Egg Harbor
Township Atlantic County
Total Direct and Overlapping Tax
Rate
Fiscal Year
Ended June 30,
2005 2.114 0.163 2.277 0.360 0.610 3.247 2006 2.174 0.182 2.357 0.363 0.639 3.359 2007 2.354 0.172 2.526 0.448 0.605 3.579 2008 2.439 0.163 2.602 0.518 0.605 3.725 2009 2.398 0.182 2.580 0.606 0.624 3.810 2010 2.459 0.189 2.648 0.706 0.619 3.973 2011 2.481 0.201 2.682 0.755 0.664 4.101 2012 2.609 0.224 2.832 0.754 0.641 4.227
* 2013 1.646 0.167 1.813 0.519 0.481 2.813 2014 1.717 0.141 1.858 0.538 0.508 2.904
Source: District Records and Municipal Tax Collector
Note: NJSA 18A:7F-5d limits the amount that the district can submit for a general fund tax levy . The levy when added to othercomponents of the district's net budget may not exceed the prebudget year net budget by more than the spending growthlimitation calculation.
* A revaluation of properties was performed in order to bring the property values in line with their true value. Thisrevaluation was effective for the 2013 tax year.
a The district's basic tax rate is calculated from the A4F form which is submitted with the budget and the Net valuation taxable.
b Rates for debt service are based on each year's requirements.
Egg Harbor Township Board of Education
117
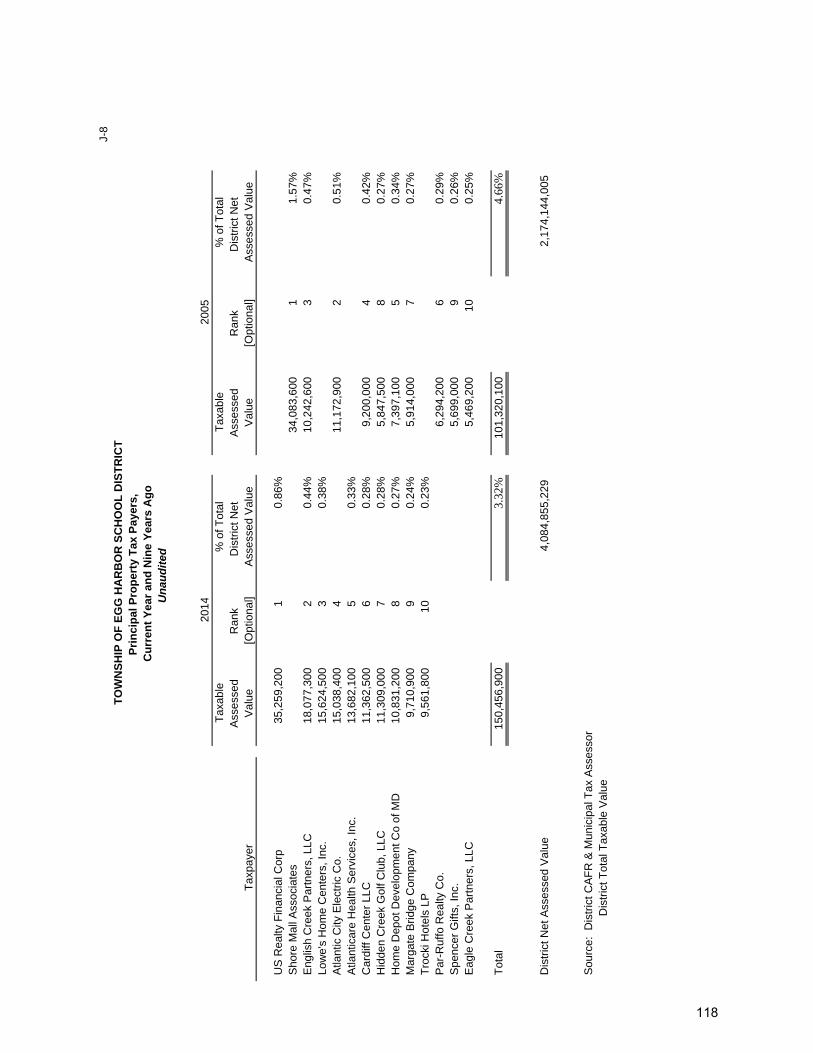
J-8
TO
WN
SH
IP O
F E
GG
HA
RB
OR
SC
HO
OL
DIS
TR
ICT
Pri
nci
pal
Pro
per
ty T
ax P
ayer
s,C
urr
ent
Yea
r an
d N
ine
Yea
rs A
go
Un
aud
ited
Tax
able
% o
f Tot
alT
axab
le%
of T
otal
Ass
esse
dR
ank
Dis
tric
t Net
A
sses
sed
Ran
kD
istr
ict N
et
Tax
paye
rV
alue
[Opt
iona
l]A
sses
sed
Val
ueV
alue
[Opt
iona
l]A
sses
sed
Val
ue
US
Rea
lty F
inan
cial
Cor
p35
,259
,200
1
0.
86%
Sho
re M
all A
ssoc
iate
s34
,083
,600
1
1.
57%
Eng
lish
Cre
ek P
artn
ers,
LLC
18,0
77,3
00
2
0.44
%10
,242
,600
3
0.
47%
Low
e's
Hom
e C
ente
rs, I
nc.
15,6
24,5
00
3
0.38
%A
tlant
ic C
ity E
lect
ric C
o.15
,038
,400
4
11
,172
,900
2
0.
51%
Atla
ntic
are
Hea
lth S
ervi
ces,
Inc.
13,6
82,1
00
5
0.33
%C
ardi
ff C
ente
r LL
C11
,362
,500
6
0.
28%
9,20
0,00
0
4
0.42
%H
idde
n C
reek
Gol
f Clu
b, L
LC11
,309
,000
7
0.
28%
5,84
7,50
0
8
0.27
%H
ome
Dep
ot D
evel
opm
ent C
o of
MD
10,8
31,2
00
8
0.27
%7,
397,
100
5
0.
34%
Mar
gate
Brid
ge C
ompa
ny9,
710,
900
9
0.
24%
5,91
4,00
0
7
0.27
%T
rock
i Hot
els
LP9,
561,
800
10
0.23
%P
ar-R
uffo
Rea
lty C
o.6,
294,
200
6
0.
29%
Spe
ncer
Gift
s, In
c.5,
699,
000
9
0.
26%
Eag
le C
reek
Par
tner
s, L
LC5,
469,
200
10
0.
25%
Tot
al15
0,45
6,90
0
3.
32%
101,
320,
100
4.66
%
Dis
tric
t Net
Ass
esse
d V
alue
4,08
4,85
5,22
9
2,17
4,14
4,00
5
Sou
rce:
Dis
tric
t CA
FR
& M
unic
ipal
Tax
Ass
esso
r
D
istr
ict T
otal
Tax
able
Val
ue
201 4
2005
118
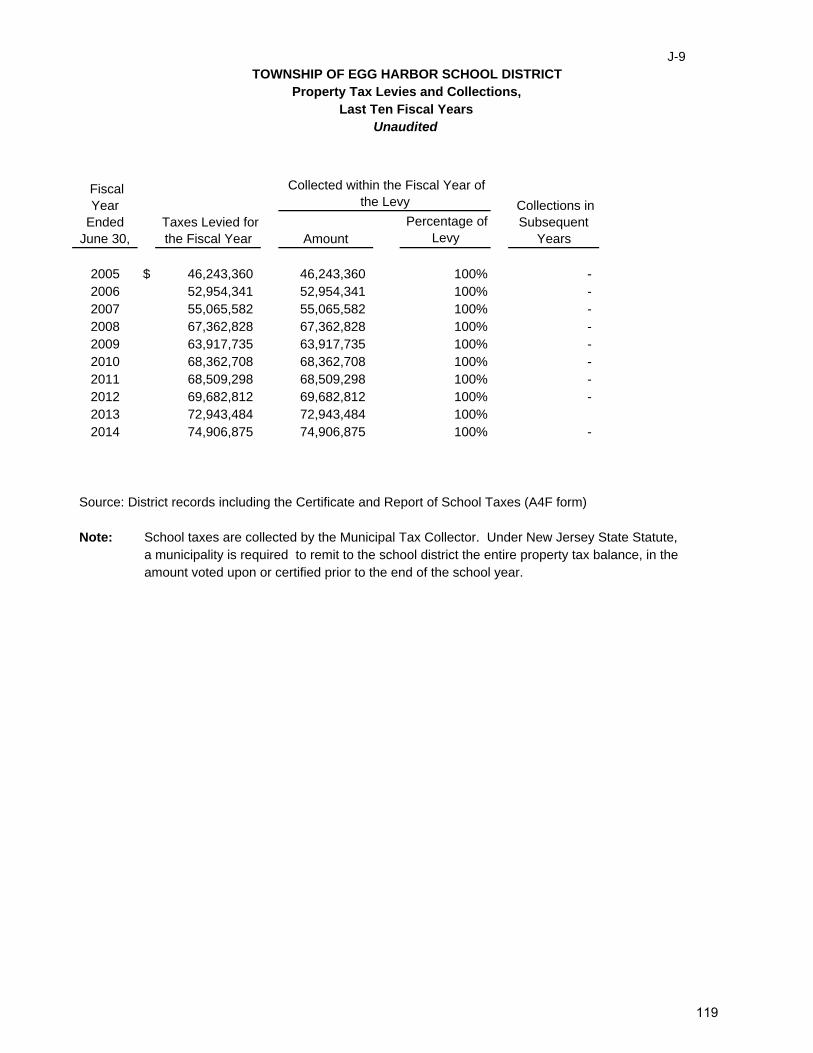
J-9TOWNSHIP OF EGG HARBOR SCHOOL DISTRICT
Property Tax Levies and Collections,Last Ten Fiscal Years
Unaudited
AmountPercentage of
Levy
2005 $ 46,243,360 46,243,360 100% - 2006 52,954,341 52,954,341 100% - 2007 55,065,582 55,065,582 100% - 2008 67,362,828 67,362,828 100% - 2009 63,917,735 63,917,735 100% - 2010 68,362,708 68,362,708 100% - 2011 68,509,298 68,509,298 100% - 2012 69,682,812 69,682,812 100% - 2013 72,943,484 72,943,484 100%2014 74,906,875 74,906,875 100% -
Source: District records including the Certificate and Report of School Taxes (A4F form)
Note: School taxes are collected by the Municipal Tax Collector. Under New Jersey State Statute, a municipality is required to remit to the school district the entire property tax balance, in the amount voted upon or certified prior to the end of the school year.
Fiscal Year
Ended June 30,
Taxes Levied for the Fiscal Year
Collected within the Fiscal Year of the Levy Collections in
Subsequent Years
119
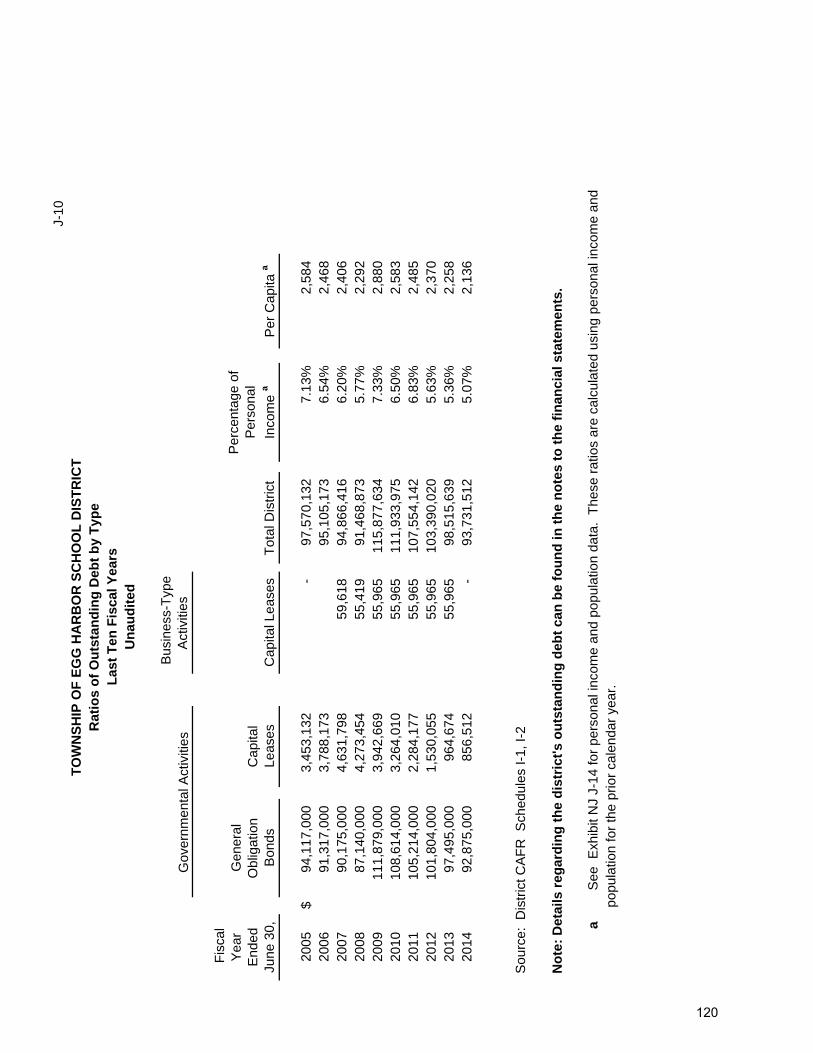
J-10
TO
WN
SH
IP O
F E
GG
HA
RB
OR
SC
HO
OL
DIS
TR
ICT
Rat
ios
of
Ou
tsta
nd
ing
Deb
t b
y T
ype
Las
t T
en F
isca
l Yea
rsU
nau
dit
ed
Bus
ines
s-T
ype
Act
iviti
es
Fis
cal
Yea
r E
nded
Ju
ne 3
0,
Gen
eral
O
blig
atio
n B
onds
Cap
ital
Leas
esC
apita
l Lea
ses
Tot
al D
istr
ict
Per
cent
age
of
Per
sona
l
Inco
me
aP
er C
apita
a
2005
$94
,117
,000
3,45
3,13
2
-
97,5
70,1
32
7.
13%
2,58
4
2006
91,3
17,0
00
3,
788,
173
95,1
05,1
73
6.
54%
2,46
8
2007
90,1
75,0
00
4,
631,
798
59,6
18
94,8
66,4
16
6.
20%
2,40
6
2008
87,1
40,0
00
4,
273,
454
55,4
19
91,4
68,8
73
5.
77%
2,29
2
2009
111,
879,
000
3,94
2,66
9
55
,965
11
5,87
7,63
4
7.33
%2,
880
20
1010
8,61
4,00
0
3,
264,
010
55,9
65
111,
933,
975
6.
50%
2,58
3
2011
105,
214,
000
2,28
4,17
7
55
,965
10
7,55
4,14
2
6.83
%2,
485
20
1210
1,80
4,00
0
1,
530,
055
55,9
65
103,
390,
020
5.
63%
2,37
0
2013
97,4
95,0
00
96
4,67
4
55,9
65
98,5
15,6
39
5.
36%
2,25
8
2014
92,8
75,0
00
85
6,51
2
-
93
,731
,512
5.07
%2,
136
Sou
rce:
Dis
tric
t CA
FR
Sch
edul
es I-
1, I-
2
No
te:
Det
ails
reg
ard
ing
th
e d
istr
ict'
s o
uts
tan
din
g d
ebt
can
be
fou
nd
in t
he
no
tes
to t
he
fin
anci
al s
tate
men
ts.
aS
ee E
xhib
it N
J J-
14 fo
r pe
rson
al in
com
e an
d po
pula
tion
data
. T
hese
rat
ios
are
calc
ulat
ed u
sing
per
sona
l inc
ome
and
popu
latio
n fo
r th
e pr
ior
cale
ndar
yea
r.
Gov
ernm
enta
l Act
iviti
es
120
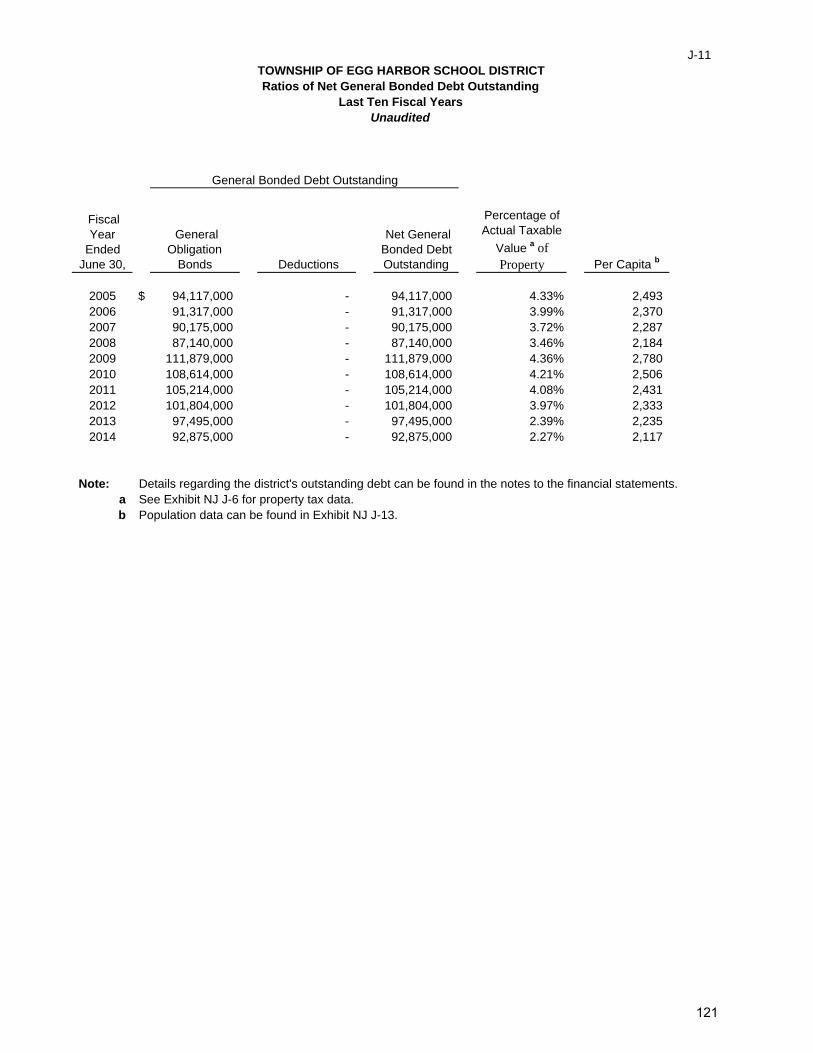
J-11TOWNSHIP OF EGG HARBOR SCHOOL DISTRICTRatios of Net General Bonded Debt Outstanding
Last Ten Fiscal YearsUnaudited
Fiscal Year
Ended June 30,
General Obligation
Bonds Deductions
Net General Bonded Debt Outstanding
Percentage of Actual Taxable
Value a of Property Per Capita b
2005 $ 94,117,000 - 94,117,000 4.33% 2,493 2006 91,317,000 - 91,317,000 3.99% 2,370 2007 90,175,000 - 90,175,000 3.72% 2,287 2008 87,140,000 - 87,140,000 3.46% 2,184 2009 111,879,000 - 111,879,000 4.36% 2,780 2010 108,614,000 - 108,614,000 4.21% 2,506 2011 105,214,000 - 105,214,000 4.08% 2,431 2012 101,804,000 - 101,804,000 3.97% 2,333 2013 97,495,000 - 97,495,000 2.39% 2,235 2014 92,875,000 - 92,875,000 2.27% 2,117
Note: Details regarding the district's outstanding debt can be found in the notes to the financial statements.a See Exhibit NJ J-6 for property tax data. b Population data can be found in Exhibit NJ J-13.
General Bonded Debt Outstanding
121
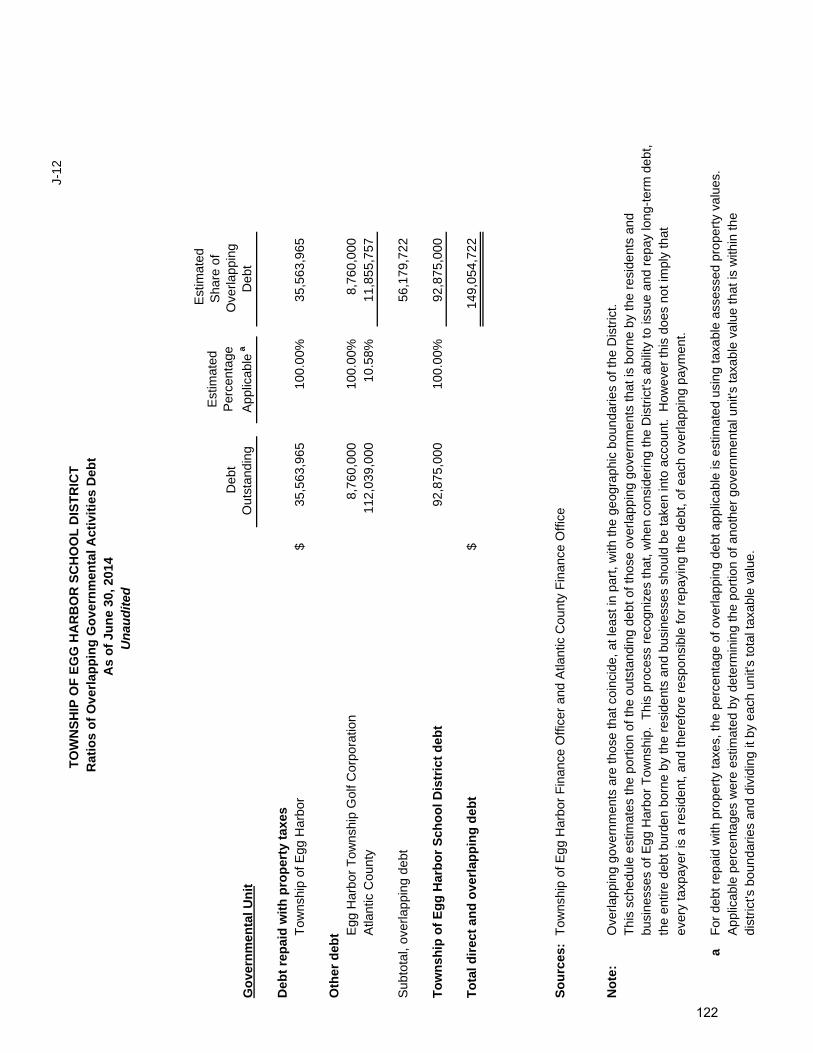
J-12
TO
WN
SH
IP O
F E
GG
HA
RB
OR
SC
HO
OL
DIS
TR
ICT
Rat
ios
of
Ove
rlap
pin
g G
ove
rnm
enta
l Act
ivit
ies
Deb
tA
s o
f Ju
ne
30, 2
014
Un
aud
ited
Go
vern
men
tal U
nit
Deb
t O
utst
andi
ng
Est
imat
ed
Per
cent
age
App
licab
le a
Est
imat
ed
Sha
re o
f O
verla
ppin
g D
ebt
Deb
t re
pai
d w
ith
pro
per
ty t
axes
Tow
nshi
p of
Egg
Har
bor
$35
,563
,965
100.
00%
35,5
63,9
65
Oth
er d
ebt E
gg H
arbo
r T
owns
hip
Gol
f Cor
pora
tion
8,76
0,00
0
100.
00%
8,76
0,00
0
Atla
ntic
Cou
nty
112,
039,
000
10
.58%
11,8
55,7
57
Sub
tota
l, ov
erla
ppin
g de
bt56
,179
,722
To
wn
ship
of
Eg
g H
arb
or
Sch
oo
l Dis
tric
t d
ebt
92,8
75,0
00
10
0.00
%92
,875
,000
To
tal d
irec
t an
d o
verl
app
ing
deb
t$
149,
054,
722
So
urc
es:
Tow
nshi
p of
Egg
Har
bor
Fin
ance
Offi
cer
and
Atla
ntic
Cou
nty
Fin
ance
Offi
ce
No
te:
Ove
rlapp
ing
gove
rnm
ents
are
thos
e th
at c
oinc
ide,
at l
east
in p
art,
with
the
geog
raph
ic b
ound
arie
s of
the
Dis
tric
t.
Thi
s sc
hedu
le e
stim
ates
the
port
ion
of th
e ou
tsta
ndin
g de
bt o
f tho
se o
verla
ppin
g go
vern
men
ts th
at is
bor
ne b
y th
e re
side
nts
and
bu
sine
sses
of E
gg H
arbo
r T
owns
hip.
Thi
s pr
oces
s re
cogn
izes
that
, whe
n co
nsid
erin
g th
e D
istr
ict's
abi
lity
to is
sue
and
repa
y lo
ng-t
erm
deb
t,th
e en
tire
debt
bur
den
born
e by
the
resi
dent
s an
d bu
sine
sses
sho
uld
be ta
ken
into
acc
ount
. H
owev
er th
is d
oes
not i
mpl
y th
at
ever
y ta
xpay
er is
a r
esid
ent,
and
ther
efor
e re
spon
sibl
e fo
r re
payi
ng th
e de
bt, o
f eac
h ov
erla
ppin
g pa
ymen
t.
aF
or d
ebt r
epai
d w
ith p
rope
rty
taxe
s, th
e pe
rcen
tage
of o
verla
ppin
g de
bt a
pplic
able
is e
stim
ated
usi
ng ta
xabl
e as
sess
ed p
rope
rty
valu
es.
App
licab
le p
erce
ntag
es w
ere
estim
ated
by
dete
rmin
ing
the
port
ion
of a
noth
er g
over
nmen
tal u
nit's
taxa
ble
valu
e th
at is
with
in th
e di
stric
t's b
ound
arie
s an
d di
vidi
ng it
by
each
uni
t's to
tal t
axab
le v
alue
.
122
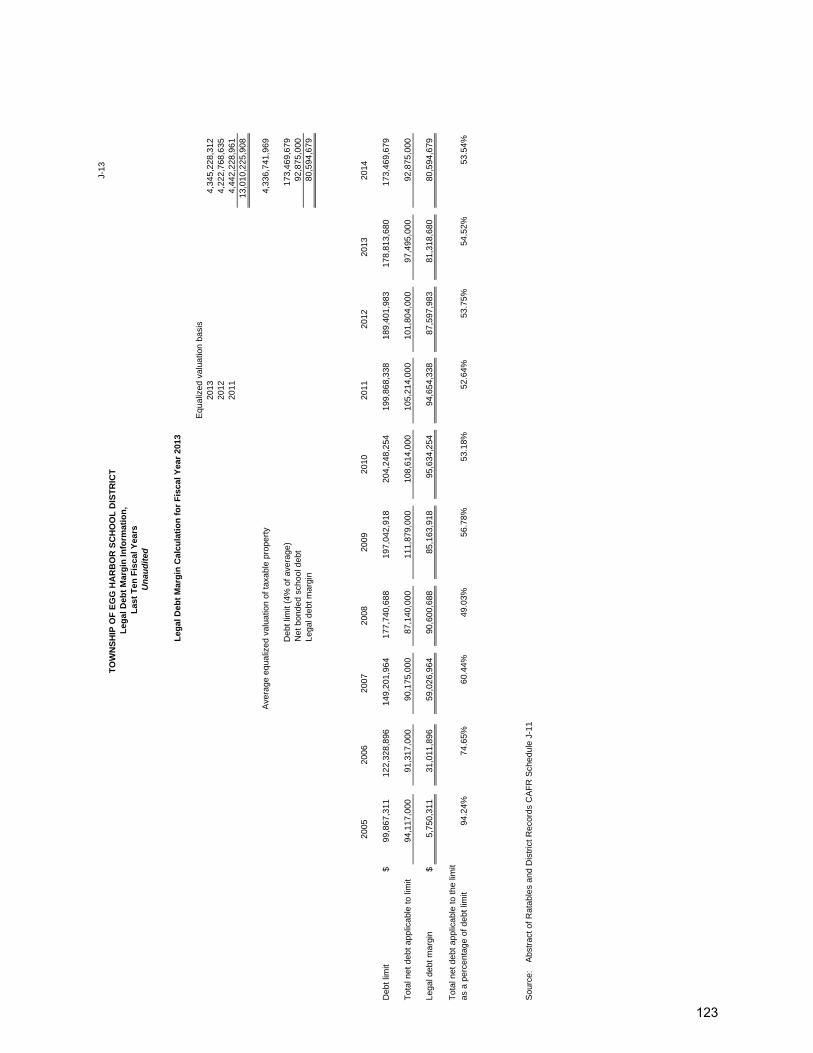
J-13
TO
WN
SH
IP O
F E
GG
HA
RB
OR
SC
HO
OL
DIS
TR
ICT
Leg
al D
ebt
Mar
gin
Info
rmat
ion
,L
ast
Ten
Fis
cal Y
ears
Un
aud
ite d
Leg
al D
ebt
Mar
gin
Cal
cula
tio
n f
or
Fis
cal Y
ear
2013
Equ
aliz
ed v
alua
tion
basi
s20
134,
345,
228,
312
20
124,
222,
768,
635
20
114,
442,
228,
961
13,0
10,2
25,9
08
Ave
rage
equ
aliz
ed v
alua
tion
of ta
xabl
e pr
oper
ty4,
336,
741,
969
173,
469,
679
Net
bon
ded
scho
ol d
ebt
92,8
75,0
00
Lega
l deb
t mar
gin
80,5
94,6
79
2005
2006
2007
2008
2009
2010
2011
2012
2013
2014
Deb
t lim
it$
99,8
67,3
11
122,
328,
896
14
9,20
1,96
417
7,74
0,68
819
7,04
2,91
8
20
4,24
8,25
4
199,
868,
338
189,
401,
983
17
8,81
3,68
0
173,
469,
679
Tot
al n
et d
ebt a
pplic
able
to li
mit
94,1
17,0
00
91,3
17,0
00
90
,175
,000
87
,140
,000
11
1,87
9,00
0
10
8,61
4,00
0
105,
214,
000
101,
804,
000
97
,495
,000
92,8
75,0
00
Lega
l deb
t mar
gin
$5,
750,
311
31,0
11,8
96
59
,026
,964
90
,600
,688
85
,163
,918
95
,634
,254
94,6
54,3
38
87,5
97,9
83
81
,318
,680
80,5
94,6
79
Tot
al n
et d
ebt a
pplic
able
to th
e lim
itas
a p
erce
ntag
e of
deb
t lim
it94
.24%
74.6
5%60
.44%
49.0
3%56
.78%
53.1
8%52
.64%
53.7
5%54
.52%
53.5
4%
Sou
rce:
Abs
trac
t of R
atab
les
and
Dis
tric
t Rec
ords
CA
FR
Sch
edul
e J-
11
Deb
t lim
it (4
% o
f ave
rage
)
123
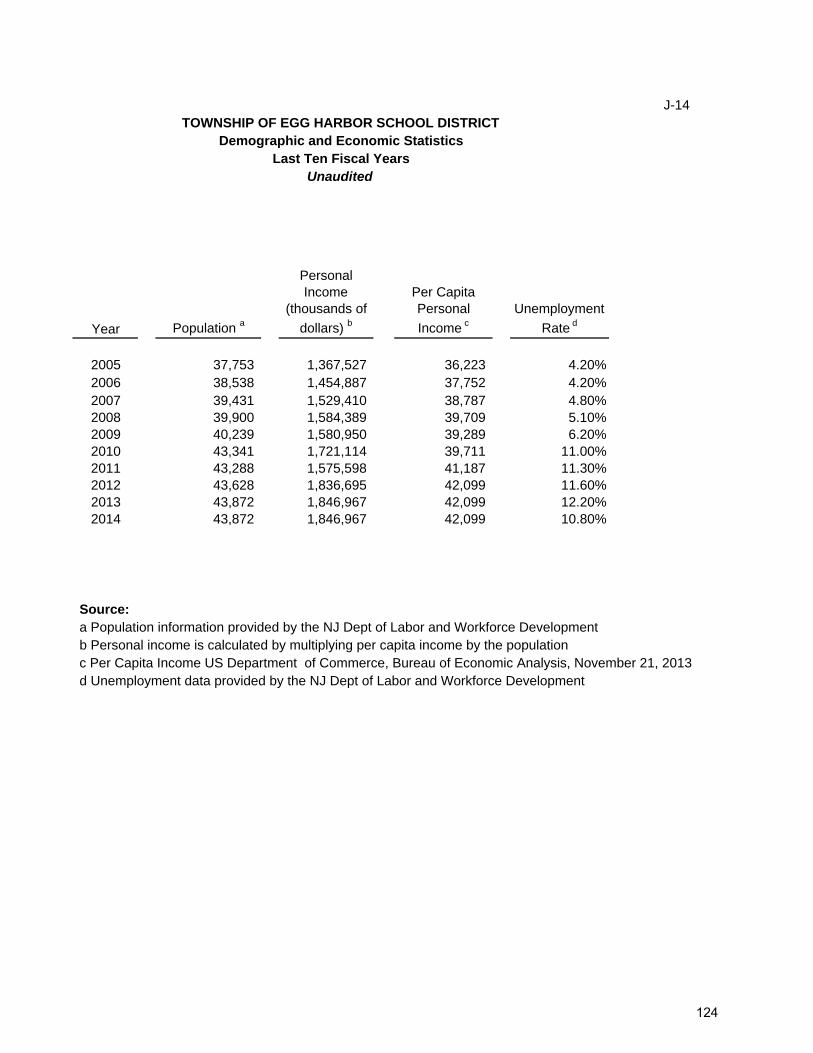
J-14TOWNSHIP OF EGG HARBOR SCHOOL DISTRICT
Demographic and Economic StatisticsLast Ten Fiscal Years
Unaudited
Year Population a
Personal Income
(thousands of
dollars) b
Per Capita Personal
Income c
Unemployment
Rate d
2005 37,753 1,367,527 36,223 4.20%2006 38,538 1,454,887 37,752 4.20%2007 39,431 1,529,410 38,787 4.80%2008 39,900 1,584,389 39,709 5.10%2009 40,239 1,580,950 39,289 6.20%2010 43,341 1,721,114 39,711 11.00%2011 43,288 1,575,598 41,187 11.30%2012 43,628 1,836,695 42,099 11.60%2013 43,872 1,846,967 42,099 12.20%2014 43,872 1,846,967 42,099 10.80%
Source: a Population information provided by the NJ Dept of Labor and Workforce Developmentb Personal income is calculated by multiplying per capita income by the populationc Per Capita Income US Department of Commerce, Bureau of Economic Analysis, November 21, 2013d Unemployment data provided by the NJ Dept of Labor and Workforce Development
124

J-15
TO
WN
SH
IP O
F E
GG
HA
RB
OR
SC
HO
OL
DIS
TR
ICT
Pri
nci
pal
Em
plo
yers
,C
urr
ent
Yea
r an
d N
ine
Yea
rs A
go
Un
aud
ited
Em
plo
yer
Em
plo
yees
Ran
k (O
pti
on
al)
Per
cen
tag
e o
f T
ota
l E
mp
loym
ent
Em
plo
yees
Ran
k (O
pti
on
al)
Per
cen
tag
e o
f T
ota
l E
mp
loym
ent
Info
rmat
ion
not a
vaila
ble
Fed
eral
Avi
atio
n A
dmin
istr
atio
n3,
500
1
16%
0.00
%E
gg H
arbo
r T
owns
hip
Sch
ool D
istr
ict
1,16
8
2
5%
0.00
%A
tlant
iCar
e54
6
3
3%0.
00%
Air
Nat
iona
l Gua
rd40
0
4
2%0.
00%
Bos
cov'
s27
5
5
1%0.
00%
U.S
. Coa
st G
uard
255
6
1%
0.00
%H
ome
Dep
ot24
8
7
1%0.
00%
Egg
Har
bor
Tow
nshi
p24
6
8
1%0.
00%
Spe
ncer
Gift
s21
0
9
1%0.
00%
Low
e's
208
10
1%
0.00
%
7,05
6
33
%-
-
GA
SB
req
uire
s th
is ta
ble
pres
ent t
he p
rinci
pal t
axpa
yers
for
the
curr
ent y
ear
and
nine
yea
rs a
go, h
owev
er in
form
atio
n fr
om 2
005
was
not
ava
ilabl
e.A
lso,
the
Tow
nshi
p do
es n
ot u
pdat
e th
is in
form
atio
n on
an
annu
al b
asis
, the
refo
re th
e m
ost r
ecen
t inf
orm
atio
n is
rep
orte
d.
Sou
rce:
T
owns
hip
of E
gg H
arbo
r T
ax A
sses
sor
2014
2005
125
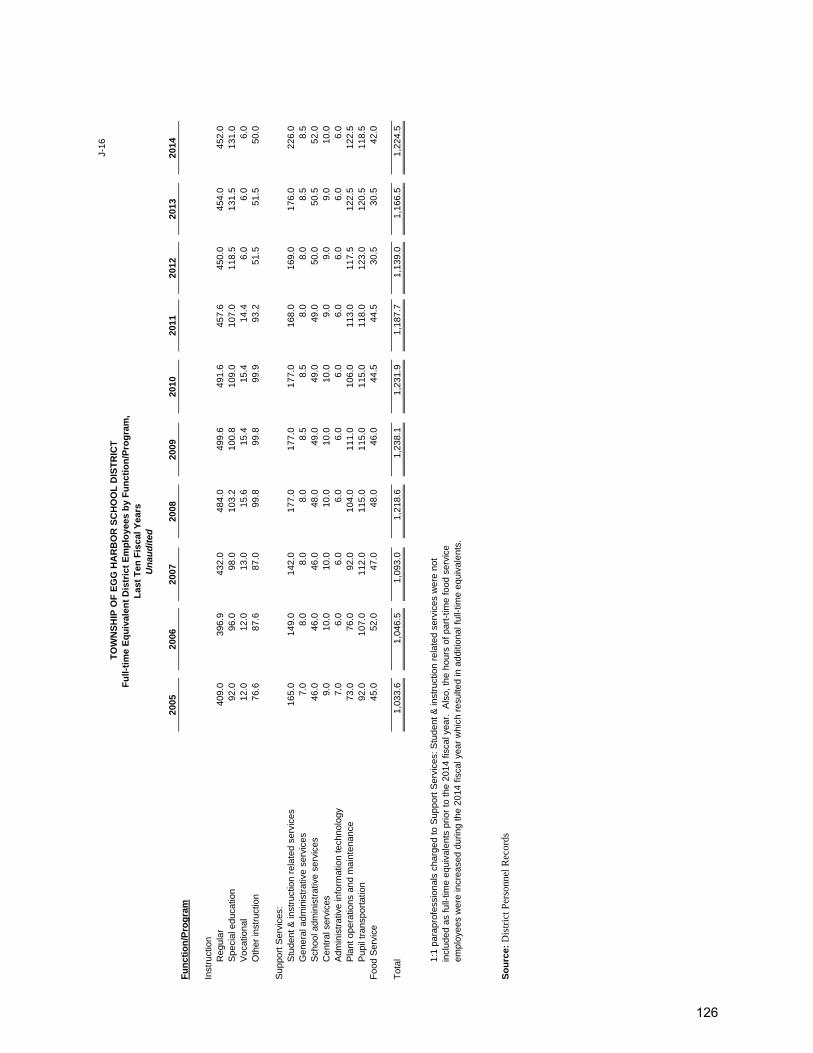
J-16
2005
2006
2007
2008
2009
2010
2011
2012
2013
2014
Fu
nct
ion
/Pro
gra
m
Inst
ruct
ion
Reg
ular
409.
0
396.
9
43
2.0
48
4.0
49
9.6
49
1.6
45
7.6
45
0.0
45
4.0
45
2.0
S
peci
al e
duca
tion
92.0
96.0
98
.0
10
3.2
10
0.8
10
9.0
10
7.0
11
8.5
13
1.5
13
1.0
V
ocat
iona
l12
.0
12
.0
13.0
15.6
15.4
15.4
14.4
6.0
6.0
6.0
O
ther
inst
ruct
ion
76.6
87.6
87
.0
99
.8
99
.8
99
.9
93
.2
51
.5
51
.5
50
.0
Sup
port
Ser
vice
s:S
tude
nt &
inst
ruct
ion
rela
ted
serv
ices
165.
0
149.
0
14
2.0
17
7.0
17
7.0
17
7.0
16
8.0
16
9.0
17
6.0
22
6.0
G
ener
al a
dmin
istr
ativ
e se
rvic
es7.
0
8.0
8.0
8.
0
8.5
8.
5
8.0
8.0
8.5
8.5
S
choo
l adm
inis
trat
ive
serv
ices
46.0
46.0
46
.0
48
.0
49
.0
49
.0
49
.0
50
.0
50
.5
52
.0
C
entr
al s
ervi
ces
9.0
10
.0
10.0
10.0
10.0
10.0
9.0
9.0
9.0
10.0
Adm
inis
trat
ive
info
rmat
ion
tech
nolo
gy7.
0
6.0
6.0
6.
0
6.0
6.
0
6.0
6.0
6.0
6.0
P
lant
ope
ratio
ns a
nd m
aint
enan
ce73
.0
76
.0
92.0
104.
0
111.
0
106.
0
113.
0
117.
5
122.
5
122.
5
Pup
il tr
ansp
orta
tion
92.0
107.
0
11
2.0
11
5.0
11
5.0
11
5.0
11
8.0
12
3.0
12
0.5
11
8.5
F
ood
Ser
vice
45.0
52.0
47
.0
48
.0
46
.0
44
.5
44
.5
30
.5
30
.5
42
.0
Tot
al1,
033.
6
1,
046.
5
1,09
3.0
1,21
8.6
1,23
8.1
1,23
1.9
1,18
7.7
1,13
9.0
1,16
6.5
1,22
4.5
1:1
para
prof
essi
onal
s ch
arge
d to
Sup
port
Ser
vice
s: S
tude
nt &
inst
ruct
ion
rela
ted
serv
ices
wer
e no
tin
clud
ed a
s fu
ll-tim
e eq
uiva
lent
s pr
ior
to th
e 20
14 fi
scal
yea
r. A
lso,
the
hour
s of
par
t-tim
e fo
od s
ervi
ceem
ploy
ees
wer
e in
crea
sed
durin
g th
e 20
14 fi
scal
yea
r w
hich
res
ulte
d in
add
ition
al fu
ll-tim
e eq
uiva
lent
s.
So
urc
e: D
istr
ict P
erso
nnel
Rec
ords
Un
aud
ited
Las
t T
en F
isca
l Yea
rsF
ull-
tim
e E
qu
ival
ent
Dis
tric
t E
mp
loye
es b
y F
un
ctio
n/P
rog
ram
,T
OW
NS
HIP
OF
EG
G H
AR
BO
R S
CH
OO
L D
IST
RIC
T
126
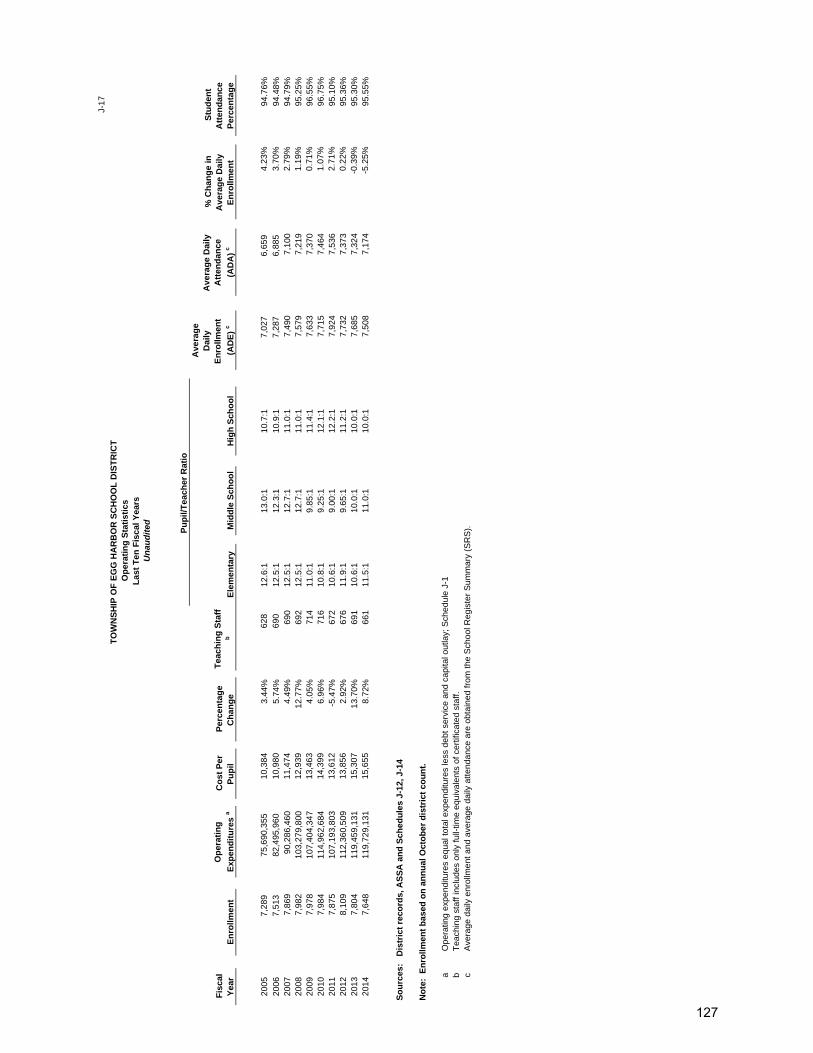
J-17
TO
WN
SH
IP O
F E
GG
HA
RB
OR
SC
HO
OL
DIS
TR
ICT
Op
erat
ing
Sta
tist
ics
Las
t T
en F
isca
l Yea
rsU
nau
dit
e d
Fis
cal
Yea
r E
nro
llmen
t
Op
erat
ing
Exp
end
itu
res
a C
ost
Per
P
up
il P
erce
nta
ge
Ch
ang
e
Tea
chin
g S
taff
b
Ele
men
tary
M
idd
le S
cho
ol
Hig
h S
cho
ol
Ave
rag
e D
aily
E
nro
llmen
t
(AD
E)
c
Ave
rag
e D
aily
A
tten
dan
ce
(AD
A)
c
% C
han
ge
in
Ave
rag
e D
aily
E
nro
llmen
t
Stu
den
t A
tten
dan
ce
Per
cen
tag
e
2005
7,
289
75,
690,
355
10,
384
3.44
%
628
12
.6:1
13.0
:110
.7:1
7,02
7
6,65
9 4.
23%
94.7
6%20
06
7,51
3
8
2,49
5,96
0
1
0,98
0 5.
74%
6
90
12.5
:112
.3:1
10.9
:1
7,
287
6,
885
3.70
%94
.48%
2007
7,86
9
90
,286
,460
1
1,47
4 4.
49%
690
12
.5:1
12.7
:111
.0:1
7,49
0
7,10
0
2.
79%
94.7
9%20
087,
982
103,
279,
800
1
2,93
9 12
.77%
692
12
.5:1
12.7
:111
.0:1
7,57
9
7,21
9
1.
19%
95.2
5%20
097,
978
107,
404,
347
1
3,46
3 4.
05%
714
11
.0:1
9.85
:111
.4:1
7,63
3
7,37
0
0.
71%
96.5
5%20
107,
984
114,
962,
684
1
4,39
9 6.
96%
716
10
.8:1
9.25
:112
.1:1
7,71
5
7,46
4
1.
07%
96.7
5%20
117,
875
107,
193,
803
1
3,61
2 -5
.47%
672
10
.6:1
9.00
:112
.2:1
7,92
4
7,53
6
2.
71%
95.1
0%20
128,
109
112,
360,
509
1
3,85
6 2.
92%
676
11
.9:1
9.65
:111
.2:1
7,73
2
7,37
3
0.
22%
95.3
6%20
137,
804
119,
459,
131
1
5,30
7 13
.70%
691
10
.6:1
10.0
:110
.0:1
7,68
5
7,32
4
-0
.39%
95.3
0%20
147,
648
119,
729,
131
1
5,65
5 8.
72%
661
11
.5:1
11.0
:110
.0:1
7,50
8
7,17
4
-5
.25%
95.5
5%
So
urc
es:
Dis
tric
t re
cord
s, A
SS
A a
nd
Sch
edu
les
J-12
, J-1
4
No
te:
En
rollm
ent
bas
ed o
n a
nn
ual
Oct
ob
er d
istr
ict
cou
nt.
aO
pera
ting
expe
nditu
res
equa
l tot
al e
xpen
ditu
res
less
deb
t ser
vice
and
cap
ital o
utla
y; S
ched
ule
J-1
bT
each
ing
staf
f inc
lude
s on
ly fu
ll-tim
e eq
uiva
lent
s of
cer
tific
ated
sta
ff.c
Ave
rage
dai
ly e
nrol
lmen
t and
ave
rage
dai
ly a
ttend
ance
are
obt
aine
d fr
om th
e S
choo
l Reg
iste
r S
umm
ary
(SR
S).Pu
pil/
Tea
cher
Rat
io
127
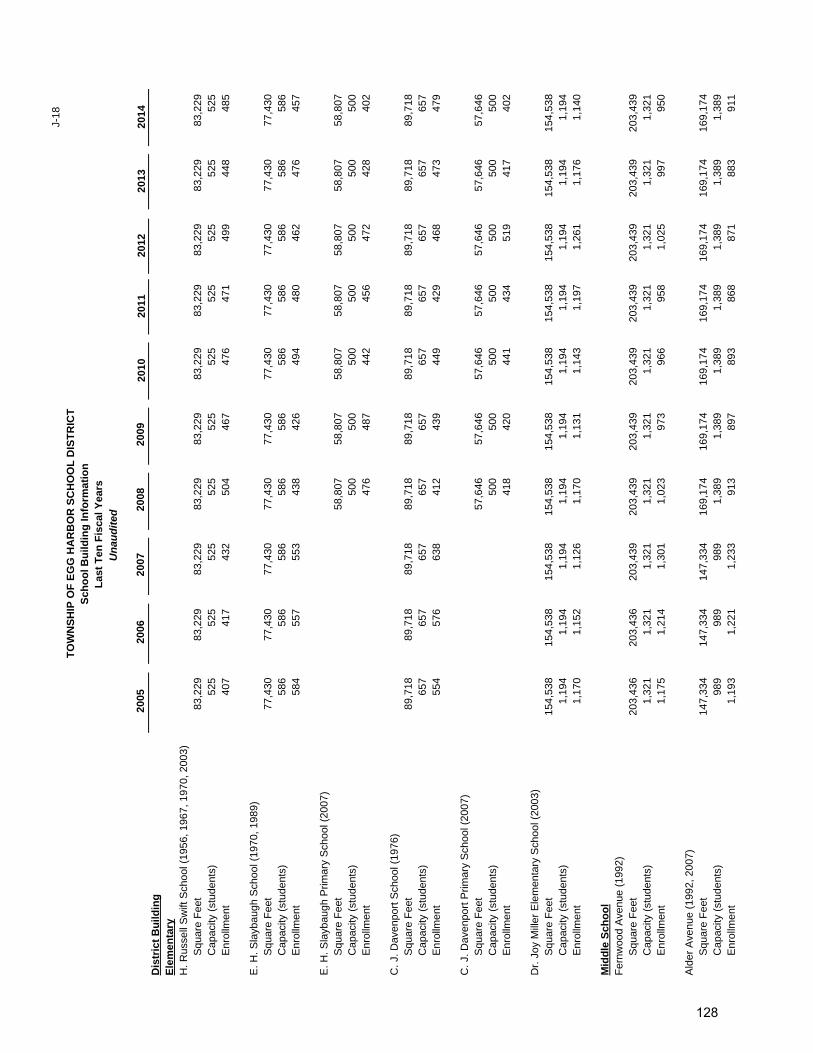
J-18
2005
20
06
2007
20
08
2009
20
1020
1120
1220
1320
14D
istr
ict
Bu
ildin
gE
lem
enta
ryH
. Rus
sell
Sw
ift S
choo
l (19
56, 1
967,
197
0, 2
003)
Squ
are
Fee
t83
,229
83
,229
83
,229
83,2
29
83
,229
83,2
29
83
,229
83,2
29
83
,229
83,2
29
C
apac
ity (
stud
ents
)52
5
52
5
52
5
52
5
52
5
52
5
52
5
52
5
52
5
52
5
E
nrol
lmen
t40
7
41
7
43
2
50
4
46
7
47
6
47
1
49
9
44
8
48
5
E. H
. Sla
ybau
gh S
choo
l (19
70, 1
989)
Squ
are
Fee
t77
,430
77
,430
77
,430
77,4
30
77
,430
77,4
30
77
,430
77,4
30
77
,430
77,4
30
C
apac
ity (
stud
ents
)58
6
58
6
58
6
58
6
58
6
58
6
58
6
58
6
58
6
58
6
E
nrol
lmen
t58
4
55
7
55
3
43
8
42
6
49
4
48
0
46
2
47
6
45
7
E. H
. Sla
ybau
gh P
rimar
y S
choo
l (20
07)
Squ
are
Fee
t58
,807
58,8
07
58
,807
58,8
07
58
,807
58,8
07
58
,807
Cap
acity
(st
uden
ts)
500
500
500
500
500
500
500
Enr
ollm
ent
476
487
442
456
472
428
402
C. J
. Dav
enpo
rt S
choo
l (19
76)
Squ
are
Fee
t89
,718
89
,718
89
,718
89,7
18
89
,718
89,7
18
89
,718
89,7
18
89
,718
89,7
18
C
apac
ity (
stud
ents
)65
7
65
7
65
7
65
7
65
7
65
7
65
7
65
7
65
7
65
7
E
nrol
lmen
t55
4
57
6
63
8
41
2
43
9
44
9
42
9
46
8
47
3
47
9
C. J
. Dav
enpo
rt P
rimar
y S
choo
l (20
07)
Squ
are
Fee
t57
,646
57,6
46
57
,646
57,6
46
57
,646
57,6
46
57
,646
Cap
acity
(st
uden
ts)
500
500
500
500
500
500
500
Enr
ollm
ent
418
420
441
434
519
417
402
Dr.
Joy
Mill
er E
lem
enta
ry S
choo
l (20
03)
Squ
are
Fee
t15
4,53
8
15
4,53
8
15
4,53
8
15
4,53
8
15
4,53
8
15
4,53
8
15
4,53
8
154,
538
15
4,53
8
154,
538
Cap
acity
(st
uden
ts)
1,19
4
1,19
4
1,19
4
1,19
4
1,19
4
1,19
4
1,19
4
1,19
4
1,19
4
1,19
4
Enr
ollm
ent
1,17
0
1,15
2
1,12
6
1,17
0
1,13
1
1,14
3
1,19
7
1,26
1
1,17
6
1,14
0
Mid
dle
Sch
oo
lF
ernw
ood
Ave
nue
(199
2)S
quar
e F
eet
203,
436
203,
436
203,
439
203,
439
203,
439
203,
439
203,
439
20
3,43
9
203,
439
20
3,43
9
C
apac
ity (
stud
ents
)1,
321
1,
321
1,
321
1,
321
1,
321
1,
321
1,
321
1,
321
1,
321
1,
321
E
nrol
lmen
t1,
175
1,
214
1,
301
1,
023
97
3
96
6
95
8
1,
025
99
7
95
0
Ald
er A
venu
e (1
992,
200
7)S
quar
e F
eet
147,
334
147,
334
147,
334
169,
174
169,
174
169,
174
169,
174
16
9,17
4
169,
174
16
9,17
4
C
apac
ity (
stud
ents
)98
9
98
9
98
9
1,
389
1,
389
1,
389
1,
389
1,
389
1,
389
1,
389
E
nrol
lmen
t1,
193
1,
221
1,
233
91
3
89
7
89
3
86
8
87
1
88
3
91
1
Un
aud
ited
Las
t T
en F
isca
l Yea
rsS
cho
ol B
uild
ing
Info
rmat
ion
TO
WN
SH
IP O
F E
GG
HA
RB
OR
SC
HO
OL
DIS
TR
ICT
128
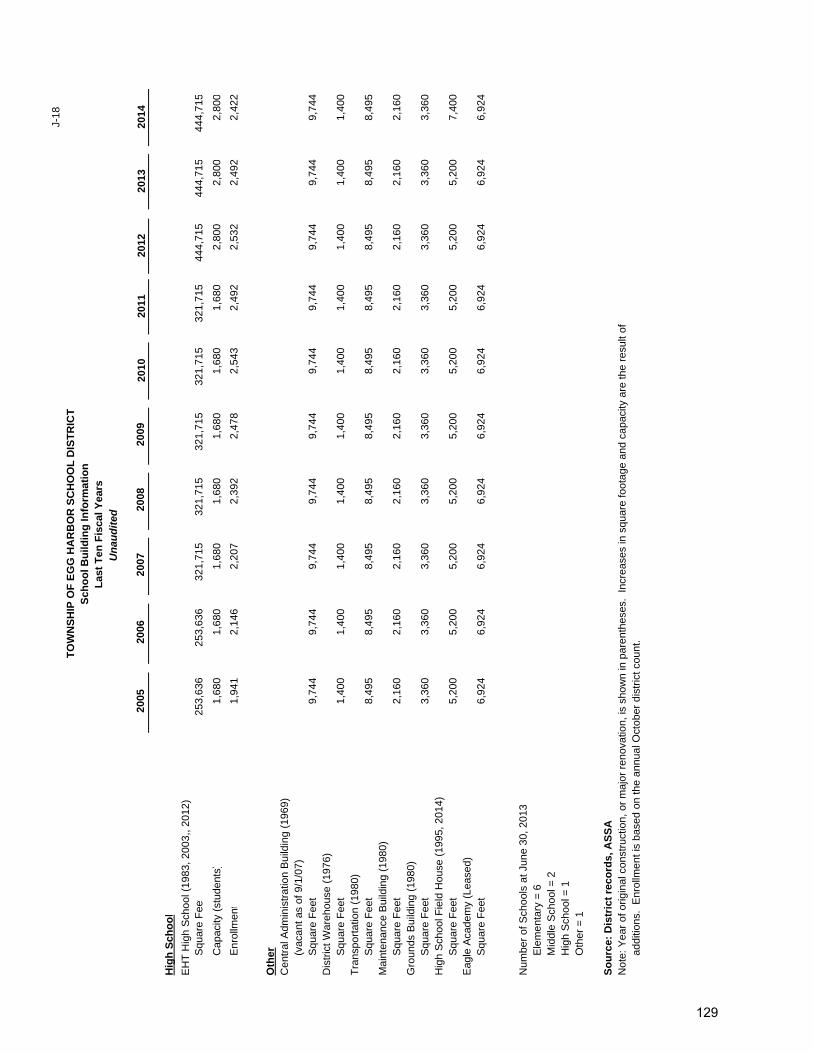
J-18
2005
20
06
2007
20
08
2009
20
1020
1120
1220
1320
14
Un
aud
ited
Las
t T
en F
isca
l Yea
rsS
cho
ol B
uild
ing
Info
rmat
ion
TO
WN
SH
IP O
F E
GG
HA
RB
OR
SC
HO
OL
DIS
TR
ICT
Hig
h S
cho
ol
EH
T H
igh
Sch
ool (
1983
, 200
3,, 2
012)
Squ
are
Fee
t25
3,63
6
25
3,63
6
321,
715
32
1,71
5
321,
715
32
1,71
5
321,
715
44
4,71
5
444,
715
44
4,71
5
Cap
acity
(st
uden
ts)
1,68
0
1,68
0
1,68
0
1,
680
1,68
0
1,68
0
1,
680
2,80
0
2,
800
2,80
0
Enr
ollm
ent
1,94
1
2,14
6
2,20
7
2,
392
2,47
8
2,54
3
2,
492
2,53
2
2,
492
2,42
2
Oth
erC
entr
al A
dmin
istr
atio
n B
uild
ing
(196
9)(v
acan
t as
of 9
/1/0
7)S
quar
e F
eet
9,74
4
9,74
4
9,74
4
9,74
4
9,74
4
9,74
4
9,74
4
9,74
4
9,74
4
9,74
4
Dis
tric
t War
ehou
se (
1976
)S
quar
e F
eet
1,40
0
1,40
0
1,40
0
1,40
0
1,40
0
1,40
0
1,40
0
1,40
0
1,40
0
1,40
0
Tra
nspo
rtat
ion
(198
0)S
quar
e F
eet
8,49
5
8,49
5
8,49
5
8,49
5
8,49
5
8,49
5
8,49
5
8,49
5
8,49
5
8,49
5
Mai
nten
ance
Bui
ldin
g (1
980)
Squ
are
Fee
t2,
160
2,
160
2,
160
2,
160
2,
160
2,
160
2,
160
2,
160
2,
160
2,
160
G
roun
ds B
uild
ing
(198
0)S
quar
e F
eet
3,36
0
3,36
0
3,36
0
3,36
0
3,36
0
3,36
0
3,36
0
3,36
0
3,36
0
3,36
0
Hig
h S
choo
l Fie
ld H
ouse
(19
95, 2
014)
Squ
are
Fee
t5,
200
5,
200
5,
200
5,
200
5,
200
5,
200
5,
200
5,
200
5,
200
7,
400
E
agle
Aca
dem
y (L
ease
d)S
quar
e F
eet
6,92
4
6,92
4
6,92
4
6,92
4
6,92
4
6,92
4
6,92
4
6,92
4
6,92
4
6,92
4
Num
ber
of S
choo
ls a
t Jun
e 30
, 201
3E
lem
enta
ry =
6M
iddl
e S
choo
l = 2
Hig
h S
choo
l = 1
Oth
er =
1
So
urc
e: D
istr
ict
reco
rds,
AS
SA
Not
e: Y
ear
of o
rigin
al c
onst
ruct
ion,
or
maj
or r
enov
atio
n, is
sho
wn
in p
aren
thes
es.
Incr
ease
s in
squ
are
foot
age
and
capa
city
are
the
resu
lt of
ad
ditio
ns.
Enr
ollm
ent i
s ba
sed
on th
e an
nual
Oct
ober
dis
tric
t cou
nt.
129
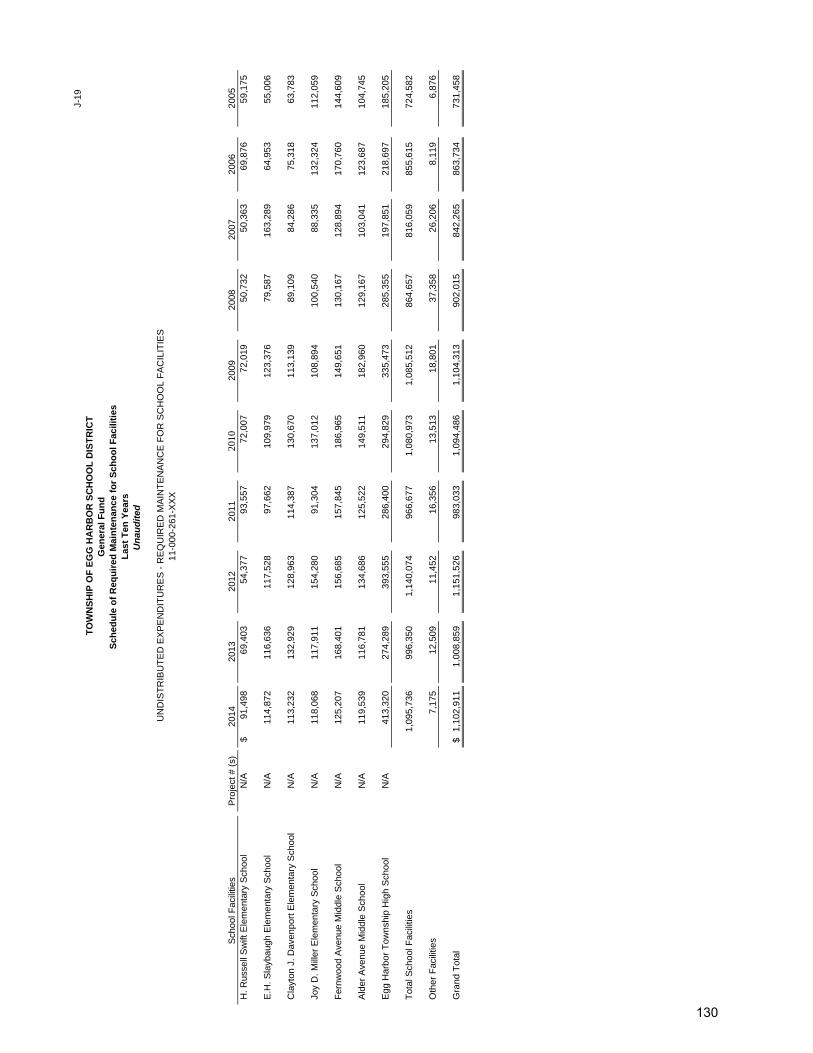
J-19
TO
WN
SH
IP O
F E
GG
HA
RB
OR
SC
HO
OL
DIS
TR
ICT
Gen
eral
Fu
nd
Sch
edu
le o
f R
equ
ired
Mai
nte
nan
ce f
or
Sch
oo
l Fac
iliti
esL
ast
Ten
Yea
rsU
nau
dit
ed
Sch
ool F
acili
ties
Pro
ject
# (
s)20
1420
1320
1220
1120
1020
0920
0820
0720
0620
05H
. Rus
sell
Sw
ift E
lem
enta
ry S
choo
lN
/A91
,498
$
69,4
03
54
,377
93,5
57
72
,007
72,0
19
50
,732
50,3
63
69
,876
59
,175
E.H
. Sla
ybau
gh E
lem
enta
ry S
choo
lN
/A11
4,87
2
116,
636
11
7,52
8
97,6
62
10
9,97
9
123,
376
79
,587
163,
289
64
,953
55
,006
Cla
yton
J. D
aven
port
Ele
men
tary
Sch
ool
N/A
113,
232
13
2,92
9
128,
963
11
4,38
7
130,
670
11
3,13
9
89,1
09
84
,286
75,3
18
63,7
83
Joy
D. M
iller
Ele
men
tary
Sch
ool
N/A
118,
068
11
7,91
1
154,
280
91
,304
137,
012
10
8,89
4
100,
540
88
,335
132,
324
112,
059
Fer
nwoo
d A
venu
e M
iddl
e S
choo
lN
/A12
5,20
7
168,
401
15
6,68
5
157,
845
18
6,96
5
149,
651
13
0,16
7
128,
894
17
0,76
0
14
4,60
9
Ald
er A
venu
e M
iddl
e S
choo
lN
/A11
9,53
9
116,
781
13
4,68
6
125,
522
14
9,51
1
182,
960
12
9,16
7
103,
041
12
3,68
7
10
4,74
5
Egg
Har
bor
Tow
nshi
p H
igh
Sch
ool
N/A
413,
320
27
4,28
9
393,
555
28
6,40
0
294,
829
33
5,47
3
285,
355
19
7,85
1
218,
697
185,
205
Tot
al S
choo
l Fac
ilitie
s1,
095,
736
996,
350
1,
140,
074
966,
677
1,
080,
973
1,08
5,51
2
86
4,65
7
816,
059
85
5,61
5
72
4,58
2
Oth
er F
acili
ties
7,17
5
12
,509
11,4
52
16
,356
13,5
13
18
,801
37,3
58
26
,206
8,11
9
6,87
6
Gra
nd T
otal
1,10
2,91
1$
1,
008,
859
1,15
1,52
6
98
3,03
3
1,09
4,48
6
1,
104,
313
902,
015
84
2,26
5
863,
734
731,
458
UN
DIS
TR
IBU
TE
D E
XP
EN
DIT
UR
ES
- R
EQ
UIR
ED
MA
INT
EN
AN
CE
FO
R S
CH
OO
L F
AC
ILIT
IES
11-0
00-2
61-X
XX
130
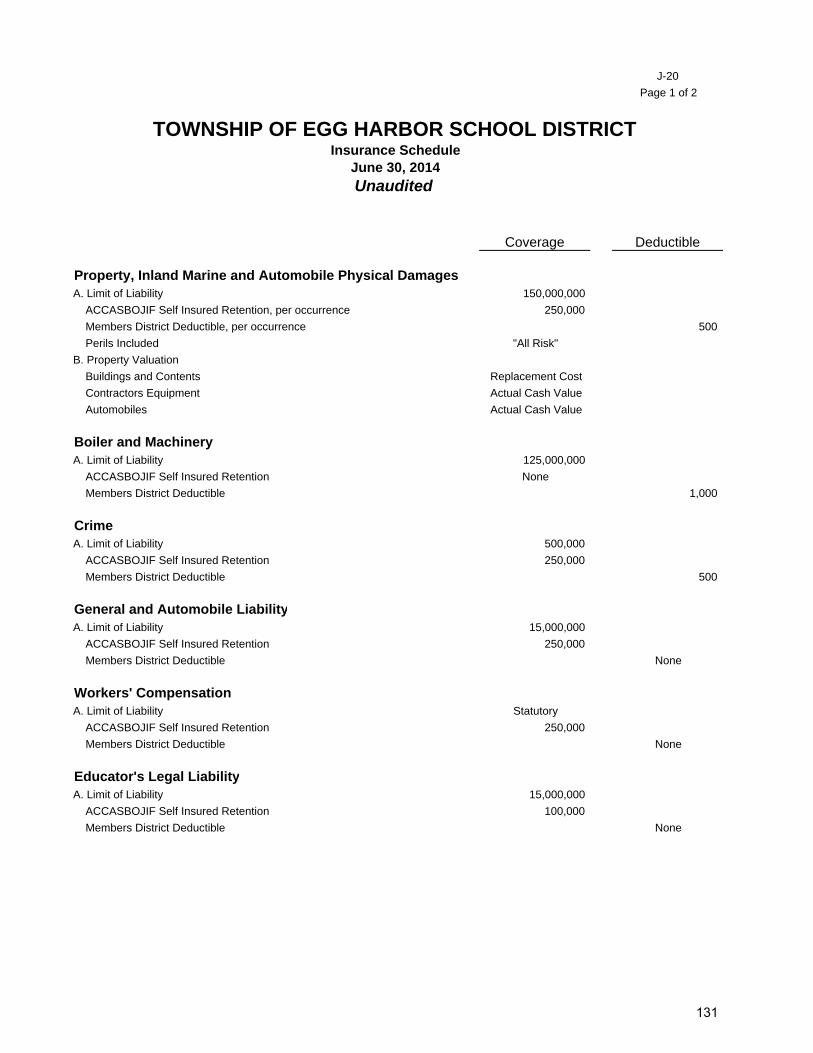
J-20
Page 1 of 2
Coverage Deductible
Property, Inland Marine and Automobile Physical DamagesA. Limit of Liability 150,000,000
ACCASBOJIF Self Insured Retention, per occurrence 250,000
Members District Deductible, per occurrence 500
Perils Included "All Risk"
B. Property Valuation
Buildings and Contents Replacement Cost
Contractors Equipment Actual Cash Value
Automobiles Actual Cash Value
Boiler and MachineryA. Limit of Liability 125,000,000
ACCASBOJIF Self Insured Retention None
Members District Deductible 1,000
CrimeA. Limit of Liability 500,000
ACCASBOJIF Self Insured Retention 250,000
Members District Deductible 500
General and Automobile LiabilityA. Limit of Liability 15,000,000
ACCASBOJIF Self Insured Retention 250,000
Members District Deductible None
Workers' CompensationA. Limit of Liability Statutory
ACCASBOJIF Self Insured Retention 250,000
Members District Deductible None
Educator's Legal LiabilityA. Limit of Liability 15,000,000
ACCASBOJIF Self Insured Retention 100,000
Members District Deductible None
TOWNSHIP OF EGG HARBOR SCHOOL DISTRICTInsurance Schedule
June 30, 2014
Unaudited
131
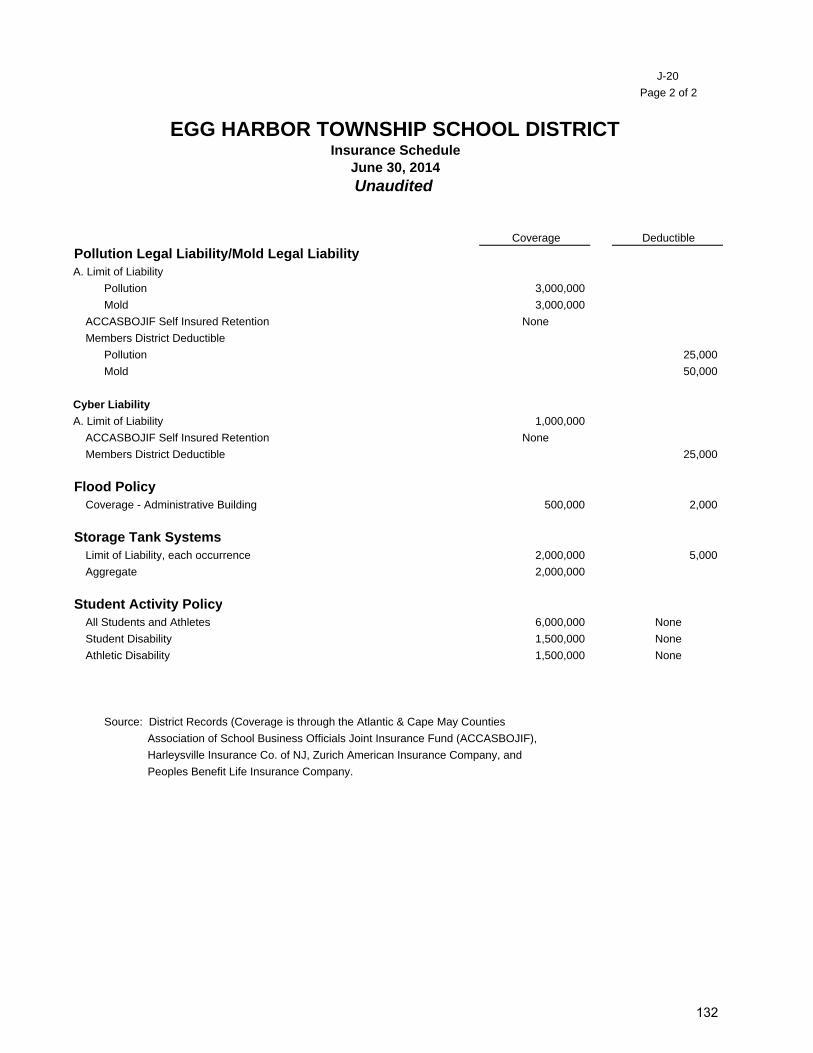
J-20
Page 2 of 2
Coverage Deductible
Pollution Legal Liability/Mold Legal LiabilityA. Limit of Liability
Pollution 3,000,000
Mold 3,000,000
ACCASBOJIF Self Insured Retention None
Members District Deductible
Pollution 25,000
Mold 50,000
Cyber Liability
A. Limit of Liability 1,000,000
ACCASBOJIF Self Insured Retention None
Members District Deductible 25,000
Flood Policy Coverage - Administrative Building 500,000 2,000
Storage Tank Systems Limit of Liability, each occurrence 2,000,000 5,000
Aggregate 2,000,000
Student Activity Policy All Students and Athletes 6,000,000 None
Student Disability 1,500,000 None
Athletic Disability 1,500,000 None
Source: District Records (Coverage is through the Atlantic & Cape May Counties
Association of School Business Officials Joint Insurance Fund (ACCASBOJIF),
Harleysville Insurance Co. of NJ, Zurich American Insurance Company, and
Peoples Benefit Life Insurance Company.
June 30, 2014
Unaudited
EGG HARBOR TOWNSHIP SCHOOL DISTRICTInsurance Schedule
132

{THIS PAGE IS INTENTIONALLY LEFT BLANK}
Single Audit Section

{THIS PAGE IS INTENTIONALLY LEFT BLANK}
Independent Auditor’s Report
The Honorable President and Members of the Board of Education Egg Harbor Township School District County of Atlantic Egg Harbor Township, New Jersey We have audited, in accordance with the auditing standards generally accepted in the United States of America, the standards applicable to financial audits contained in Government Auditing Standards issued by the Comptroller General of the United States, and audit requirements as prescribed by the Office of School Finance, Department of Education, State of New Jersey, the financial statements of the governmental activities, the business-type activities, each major fund, and the aggregate remaining fund information of the Egg Harbor Township School District, as of and for the year ended June 30, 2014, and the related notes to the financial statements, which collectively comprise the Egg Harbor Township School District’s basic financial statements, and have issued our report thereon dated December 2, 2014. Internal Control over Financial Reporting
In planning and performing our audit of the financial statements, we considered the Egg Harbor Township School District’s control over financial reporting (internal control) to determine the audit procedures that are appropriate in the circumstances for the purpose of expressing our opinions on the financial statements but not for the purpose of expressing an opinion on the effectiveness of the Egg Harbor Township School District’s internal control. Accordingly, we do not express an opinion on the effectiveness of District’s internal control.
A deficiency in internal control exists when the design or operation of a control does not allow management or employees, in the normal course of performing their assigned functions, to prevent, or detect and correct, misstatements on a timely basis. A material weakness is a deficiency, or a combination of deficiencies, in internal control, such that there is a reasonable possibility that a material misstatement of the entity’s financial statements will not be prevented, or detected and corrected on a timely basis. A significant deficiency is a deficiency, or a combination of deficiencies, in internal control that is less severe than a material weakness, yet important enough to merit attention by those charged with governance.
Our consideration of internal control was for the limited purpose described in the first paragraph of this section and was not designed to identify all deficiencies in internal control that might be material weaknesses or significant deficiencies. Given these limitations, during our audit we did not identify any deficiencies in internal control that we consider to be material weaknesses. However, material weaknesses may exist that have not been identified.
Compliance and Other Matters
As part of obtaining reasonable assurance about whether the Egg Harbor Township School District’s financial statements are free from material misstatement, we performed tests of its compliance with certain provisions of laws, regulations, contracts, and grant agreements, noncompliance with which could have a direct and material effect on the determination of financial statement amounts. However, providing an opinion on compliance with those provisions was not an objective of our audit, and accordingly, we do
133
not express such an opinion. The results of our tests disclosed no instances of noncompliance or other matters that are required to be reported under Government Auditing Standards and audit requirements as prescribed by the Office of School Finance, Department of Education, State of New Jersey.
Purpose of this Report
The purpose of this report is solely to describe the scope of our testing of internal control and compliance and the results of that testing, and not to provide an opinion on the effectiveness of the entity’s internal control or on compliance. This report is an integral part of an audit performed in accordance with Government Auditing Standards in considering the entity’s internal control and compliance. Accordingly, this communication is not suitable for any other purpose.
Very truly yours,
Ford, Scott & Associates, L.L.C. FORD, SCOTT & ASSOCIATES, L.L.C.
CERTIFIED PUBLIC ACCOUNTANTS
Leon P. Costello Leon P. Costello Certified Public Accountant Licensed Public School Accountant No. 767 December 2, 2014
134
Independent Auditor’s Report
Honorable President and Members of the Board of Education Egg Harbor Township School District County of Atlantic, New Jersey
Report on Compliance for Each Major State Program
We have audited the Egg Harbor Township School District’s compliance with the types of compliance requirements described in the U.S. Office of Management and Budget (OMB) Circular A-133 Compliance Supplement and the New Jersey State Aid/Grant Compliance Supplement that could have a direct and material effect on each of the Egg Harbor Township School District’s major federal and state programs for the year ended June 30, 2014. The Egg Harbor Township School District’s major federal and state programs are identified in the summary of auditor’s results section of the accompanying schedule of findings and questioned costs.
Management’s Responsibility
Management is responsible for compliance with the requirements of laws, regulations, contracts, and grants applicable to its federal and state programs.
Auditor’s Responsibility
Our responsibility is to express an opinion on compliance for each of the Egg Harbor Township School District’s major federal and state programs based on our audit of the types of compliance requirements referred to above. We conducted our audit of compliance in accordance with auditing standards generally accepted in the United States of America; the standards applicable to financial audits contained in Government Auditing Standards, issued by the Comptroller General of the United States; OMB Circular A-133, and New Jersey 04-04 State Aid/Grant Compliance Supplement. Those standards and Circulars require that we plan and perform the audit to obtain reasonable assurance about whether noncompliance with the types of compliance requirements referred to above that could have a direct and material effect on a major federal or state program occurred. An audit includes examining, on a test basis, evidence about the Egg Harbor Township School District’s compliance with those requirements and performing such other procedures as we considered necessary in the circumstances.
We believe that our audit provides a reasonable basis for our opinion on compliance for each major federal and state program. However, our audit does not provide a legal determination of the Egg Harbor Township School District’s compliance.
Opinion on Each Major Federal and State Program
In our opinion, the Egg Harbor Township School District complied, in all material respects, with the types of compliance requirements referred to above that could have a direct and material effect on each of its federal and major state programs for the year ended June 30, 2014.
135
Report on Internal Control Over Compliance
Management of the Egg Harbor Township School District is responsible for establishing and maintaining effective internal control over compliance with the types of compliance requirements referred to above. In planning and performing our audit of compliance, we considered the Egg Harbor Township School District’s internal control over compliance with the types of requirements that could have a direct and material effect on each major federal and state program to determine the auditing procedures that are appropriate in the circumstances for the purpose of expressing an opinion on compliance for each major federal and state program and to test and report on internal control over compliance in accordance with OMB Circular A-133 and NJ OMB 04-04, but not for the purpose of expressing an opinion on the effectiveness of internal control over compliance. Accordingly, we do not express an opinion on the effectiveness of the Egg Harbor Township School District’s internal control over compliance.
A deficiency in internal control over compliance exists when the design or operation of a control over compliance does not allow management or employees, in the normal course of performing their assigned functions, to prevent, or detect and correct, noncompliance with a type of compliance requirement of a state program on a timely basis. A material weakness in internal control over compliance is a deficiency, or combination of deficiencies, in internal control over compliance, such that there is a reasonable possibility that material noncompliance with a type of compliance requirement of a federal or state program will not be prevented, or detected and corrected, on a timely basis. A significant deficiency in internal control over compliance is a deficiency, or a combination of deficiencies, in internal control over compliance with a type of compliance requirement of a federal or state program that is less severe than a material weakness in internal control over compliance, yet important enough to merit attention by those charged with governance.
Our consideration of internal control over compliance was for the limited purpose described in the first paragraph of this section and was not designed to identify all deficiencies in internal control over compliance that might be material weaknesses or significant deficiencies. We did not identify any deficiencies in internal control over compliance that we consider to be material weaknesses. However, material weaknesses may exist that have not been identified.
The purpose of this report on internal control over compliance is solely to describe the scope of our testing of internal control over compliance and the results of that testing based on the requirements of OMB Circular A-133 and NJ OMB 04-04. Accordingly, this report is not suitable for any other purpose.
Very truly yours,
Ford, Scott & Associates, L.L.C. FORD, SCOTT & ASSOCIATES, L.L.C.
CERTIFIED PUBLIC ACCOUNTANTS
Leon P. Costello Leon P. Costello Certified Public Accountant Licensed Public School Accountant No. 767 December 2, 2014
136
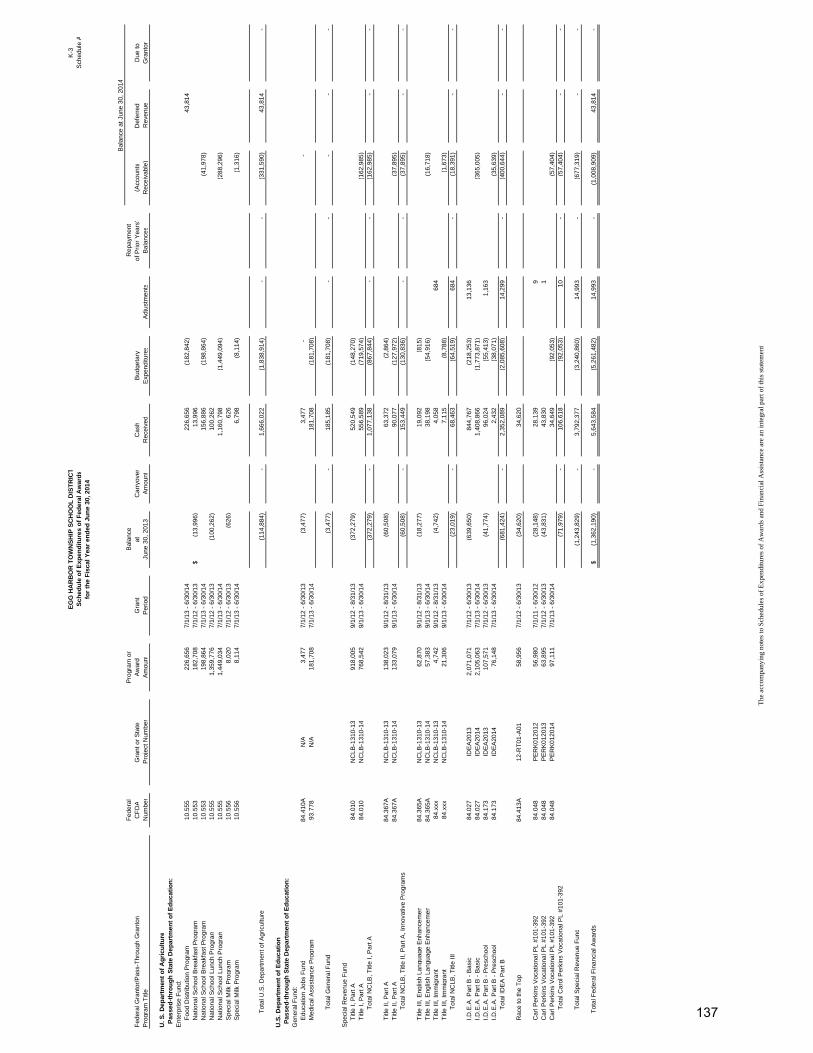
EG
G H
AR
BO
R T
OW
NS
HIP
SC
HO
OL
DIS
TR
ICT
K-3
Sch
edu
le o
f E
xpen
dit
ure
s o
f F
eder
al A
war
ds
Sch
edul
e A
for
the
Fis
cal Y
ear
end
ed J
un
e 30
, 201
4
Bal
ance
at J
une
30, 2
014
Fed
eral
Pro
gram
or
Bal
ance
Rep
aym
ent
Fed
eral
Gra
ntor
/Pas
s-T
hrou
gh G
rant
or/
CF
DA
Gra
nt o
r S
tate
Aw
ard
Gra
ntat
Car
ryov
erC
ash
Bud
geta
ryof
Prio
r Y
ears
'(A
ccou
nts
Def
erre
dD
ue to
Pro
gram
Titl
eN
umbe
rP
roje
ct N
umbe
rA
mou
ntP
erio
dJu
ne 3
0, 2
013
Am
ount
Rec
eive
dE
xpen
ditu
res
Adj
ustm
ents
Bal
ance
sR
ecei
vabl
e)R
even
ueG
rant
or
U. S
. Dep
artm
ent
of
Ag
ricu
ltu
re P
asse
d-t
hro
ug
h S
tate
Dep
artm
ent
of
Ed
uca
tio
n:
Ent
erpr
ise
Fun
d:
Foo
d D
istr
ibut
ion
Pro
gram
10.5
5522
6,65
6
7/1/
13 -
6/3
0/14
226,
656
(182
,842
)
43,8
14
N
atio
nal S
choo
l Bre
akfa
st P
rogr
am10
.553
182,
708
7/
1/12
- 6
/30/
13(1
3,99
6)$
13,9
96
N
atio
nal S
choo
l Bre
akfa
st P
rogr
am10
.553
198,
864
7/
1/13
- 6
/30/
1415
6,88
6
(1
98,8
64)
(4
1,97
8)
Nat
iona
l Sch
ool L
unch
Pro
gram
10.5
551,
359,
776
7/1/
12 -
6/3
0/13
(100
,262
)
10
0,26
2
Nat
iona
l Sch
ool L
unch
Pro
gram
10.5
551,
449,
034
7/1/
13 -
6/3
0/14
1,16
0,79
8
(1
,449
,094
)
(2
88,2
96)
S
peci
al M
ilk P
rogr
am10
.556
8,02
0
7/
1/12
- 6
/30/
13(6
26)
626
Spe
cial
Milk
Pro
gram
10.5
568,
114
7/1/
13 -
6/3
0/14
6,79
8
(8
,114
)
(1
,316
)
Tot
al U
.S. D
epar
tmen
t of A
gric
ultu
re(1
14,8
84)
-
1,66
6,02
2
(1
,838
,914
)
-
-
(331
,590
)
43
,814
-
U.S
. Dep
artm
ent
of
Ed
uca
tio
n P
asse
d-t
hro
ug
h S
tate
Dep
artm
ent
of
Ed
uca
tio
n:
Gen
eral
Fun
d:
Edu
catio
n Jo
bs F
und
84.4
10A
N/A
3,47
7
7/
1/12
- 6
/30/
13(3
,477
)
3,47
7
-
-
M
edic
al A
ssis
tanc
e P
rogr
am93
.778
N/A
181,
708
7/
1/13
- 6
/30/
1418
1,70
8
(1
81,7
08)
T
otal
Gen
eral
Fun
d(3
,477
)
-
185,
185
(181
,708
)
-
-
-
-
-
Spe
cial
Rev
enue
Fun
d
Titl
e I,
Par
t A84
.010
NC
LB-1
310-
1391
8,00
5
9/1/
12 -
8/3
1/13
(372
,279
)
52
0,54
9
(1
48,2
70)
Titl
e I,
Par
t A84
.010
NC
LB-1
310-
1476
8,54
2
9/1/
13 -
6/3
0/14
556,
589
(719
,574
)
(162
,985
)
Tot
al N
CLB
, Titl
e I,
Par
t A(3
72,2
79)
-
1,07
7,13
8
(8
67,8
44)
-
-
(162
,985
)
-
-
T
itle
II, P
art A
84.3
67A
NC
LB-1
310-
1313
8,02
3
9/1/
12 -
8/3
1/13
(60,
508)
63
,372
(2
,864
)
Titl
e II,
Par
t A84
.367
AN
CLB
-131
0-14
133,
079
9/
1/13
- 6
/30/
1490
,077
(1
27,9
72)
(3
7,89
5)
Tot
al N
CLB
, Titl
e II,
Par
t A, I
nnov
ativ
e P
rogr
ams
(60,
508)
-
15
3,44
9
(1
30,8
36)
-
-
(37,
895)
-
-
T
itle
III, E
nglis
h La
ngua
ge E
nhan
cem
en84
.365
AN
CLB
-131
0-13
62,8
70
9/
1/12
- 8
/31/
13(1
8,27
7)
19,0
92
(815
)
T
itle
III, E
n glis
h La
ngua
ge E
nhan
cem
en84
.365
AN
CLB
-131
0-14
57,3
83
9/
1/13
- 6
/30/
1438
,198
(5
4,91
6)
(16,
718)
T
itle
III, I
mm
igra
nt84
.xxx
NC
LB-1
310-
134,
742
9/1/
12 -
8/3
1/13
(4,7
42)
4,
058
684
T
itle
III, I
mm
igra
nt84
.xxx
NC
LB-1
310-
1421
,306
9/1/
13 -
6/3
0/14
7,11
5
(8
,788
)
(1
,673
)
T
otal
NC
LB, T
itle
III(2
3,01
9)
-
68,4
63
(64,
519)
68
4
-
(18,
391)
-
-
I.
D.E
.A. P
art B
- B
asic
84.0
27ID
EA
2013
2,07
1,07
1
7/
1/12
- 6
/30/
13(6
39,6
50)
844,
767
(218
,253
)
13,1
36
I.D
.E.A
. Par
t B -
Bas
ic84
.027
IDE
A20
1 42,
105,
063
7/1/
13 -
6/3
0/14
1,40
8,86
6
(1
,773
,871
)
(3
65,0
05)
I.
D.E
.A. P
art B
- P
resc
hool
84.1
73ID
EA
2013
107,
571
7/
1/12
- 6
/30/
13(4
1,77
4)
96,0
24
(55,
413)
1,
163
I.D
.E.A
. Par
t B -
Pre
scho
ol84
.173
IDE
A20
1476
,148
7/1/
13 -
6/3
0/14
2,43
2
(3
8,07
1)
(35,
639)
T
otal
IDE
A P
art B
(681
,424
)
-
2,
352,
089
(2,0
85,6
08)
14,2
99
-
(400
,644
)
-
-
R
ace
to th
e T
op84
.413
A12
-RT
01-A
0158
,956
7/1/
12 -
6/3
0/13
(34,
620)
34
,620
C
arl P
erki
ns V
ocat
iona
l PL
#101
-392
84.0
48P
ER
K01
2012
56,9
80
7/
1/11
- 6
/30/
12(2
8,14
8)
28,1
39
9
C
arl P
erki
ns V
ocat
iona
l PL
#101
-392
84.0
48P
ER
K01
2013
63,8
95
7/
1/12
- 6
/30/
13(4
3,83
1)
43,8
30
1
C
arl P
erki
ns V
ocat
iona
l PL
#101
-39 2
84.0
48P
ER
K01
2014
97,1
11
7/
1/13
- 6
/30/
1434
,649
(9
2,05
3)
(57,
404)
T
otal
Car
ol P
erki
ns V
ocat
iona
l PL
#101
-392
(71,
979)
-
10
6,61
8
(9
2,05
3)
10
-
(57,
404)
-
-
T
otal
Spe
cial
Rev
enue
Fun
d(1
,243
,829
)
-
3,79
2,37
7
(3
,240
,860
)
14
,993
-
(6
77,3
19)
-
-
Tot
al F
eder
al F
inan
cial
Aw
ards
(1,3
62,1
90)
$
-
5,64
3,58
4
(5
,261
,482
)
14
,993
-
(1
,008
,909
)
43,8
14
-
The
acc
ompa
nyin
g no
tes
to S
ched
ules
of
Exp
endi
ture
s of
Aw
ards
and
Fin
anci
al A
ssis
tanc
e ar
e an
inte
gral
par
t of
this
sta
tem
ent
137
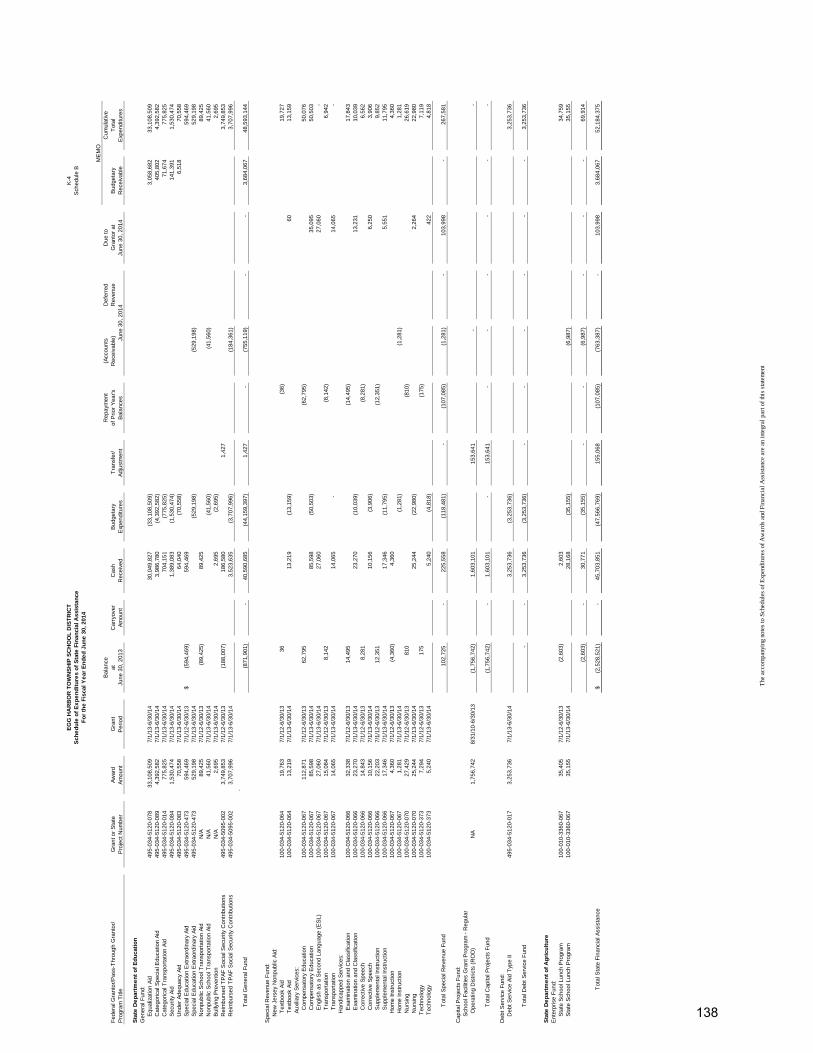
EG
G H
AR
BO
R T
OW
NS
HIP
SC
HO
OL
DIS
TR
ICT
K-4
Sch
ed
ule
of
Ex
pe
nd
itu
res
of
Sta
te F
inan
cial
Ass
ista
nce
Sch
edul
e B
Fo
r th
e F
isca
l Ye
ar E
nd
ed
Ju
ne
30,
201
4
ME
MO
Bal
ance
Rep
aym
ent
(Acc
ount
sD
efer
red
Due
toC
umul
ativ
eF
eder
al G
rant
or/P
ass-
Thr
ough
Gra
ntor
/G
rant
or
Sta
teA
war
dG
rant
atC
arry
over
Cas
hB
udge
tary
Tra
nsfe
r/of
Prio
r Y
ear's
Rec
eiva
ble)
Rev
enue
Gra
ntor
at
Bud
geta
ryT
otal
Pro
gram
Titl
eP
roje
ct N
umbe
rA
mou
ntP
erio
dJu
ne 3
0, 2
013
Am
ount
Rec
eive
dE
xpen
ditu
res
Adj
ustm
ent
Bal
ance
sJu
ne 3
0, 2
014
June
30,
201
4R
ecei
vabl
eE
xpen
ditu
res
Sta
te D
ep
artm
en
t o
f E
du
cati
on
Gen
eral
Fun
d:
Equ
aliz
atio
n A
id49
5-03
4-51
20-0
7833
,108
,509
7/
1/13
-6/3
0/14
30,0
49,8
27
(33,
108,
509)
3,
058,
682
33,1
08,5
09
C
ateg
oric
al S
peci
al E
duca
tion
Aid
495-
034-
5120
-089
4,39
2,58
2
7/
1/13
-6/3
0/14
3,98
6,78
0
(4,3
92,5
82)
405,
802
4,
392,
582
C
ateg
oric
al T
rans
port
atio
n A
id49
5-03
4-51
20-0
1477
5,82
5
7/1/
13-6
/30/
1470
4,15
1
(7
75,8
25)
71
,674
775,
825
Sec
urity
Aid
495-
034-
5120
-084
1,53
0,47
4
7/
1/13
-6/3
0/14
1,38
9,08
3
(1,5
30,4
74)
141,
391
1,
530,
474
U
nder
Ade
quac
y A
id49
5-03
4-51
20-0
8370
,558
7/1/
13-6
/30/
1464
,040
(7
0,55
8)
6,51
8
70
,558
S
peci
al E
duca
tion
Ext
raor
dina
ry A
id49
5-03
4-51
20-4
7359
4,46
9
7/1/
12-6
/30/
13(5
94,4
69)
$
59
4,46
9
59
4,46
9
S
peci
al E
duca
tion
Ext
raor
dina
ry A
id49
5-03
4-51
20-4
7352
9,19
8
7/1/
13-6
/30/
14(5
29,1
98)
(5
29,1
98)
52
9,19
8
N
onpu
blic
Sch
ool T
rans
port
atio
n A
idN
/A89
,425
7/1/
12-6
/30/
13(8
9,42
5)
89
,425
89
,425
N
onpu
blic
Sch
ool T
rans
port
atio
n A
idN
/A41
,560
7/1/
13-6
/30/
14(4
1,56
0)
(41,
560)
41
,560
B
ully
ing
Pre
vent
ion
N/A
2,69
5
7/
1/13
-6/3
0/14
2,69
5
(2
,695
)
2,
695
R
eim
burs
ed T
PA
F S
ocia
l Sec
urity
Con
trib
utio
ns49
5-03
4-50
95-0
023,
749,
853
7/1/
12-6
/30/
13(1
88,0
07)
18
6,58
0
1,
427
3,74
9,85
3
Rei
mbu
rsed
TP
AF
Soc
ial S
ecur
ity C
ontr
ibut
ions
495-
034-
5095
-002
3,70
7,99
6
7/
1/13
-6/3
0/14
3,52
3,63
5
(3,7
07,9
96)
(184
,361
)
3,70
7,99
6
.
T
otal
Gen
eral
Fun
d(8
71,9
01)
-
40,5
90,6
85
(44,
159,
397)
1,
427
-
(755
,119
)
-
-
3,
684,
067
48,5
93,1
44
Spe
cial
Rev
enue
Fun
d:
New
Jer
sey
Non
publ
ic A
id:
Tex
tboo
k A
id10
0-03
4-51
20-0
6419
,763
7/1/
12-6
/30/
1336
(36)
19,7
27
T
extb
ook
Aid
100-
034-
5120
-064
13,2
19
7/
1/13
-6/3
0/14
13,2
19
(13,
159)
60
13
,159
Aux
iliar
y S
ervi
ces:
Com
pens
ator
y E
duca
tion
100-
034-
5120
-067
112,
871
7/
1/12
-6/3
0/13
62,7
95
(6
2,79
5)
50
,076
Com
pens
ator
y E
duca
tion
100-
034-
5120
-067
85,5
98
7/
1/13
-6/3
0/14
85,5
98
(50,
503)
35
,095
50,5
03
E
nglis
h as
a S
econ
d La
ngua
ge (
ES
L)10
0-03
4-51
20-0
6727
,060
7/1/
13-6
/30/
1427
,060
27
,060
-
Tra
nspo
rtat
ion
100-
034-
5120
-067
15,0
84
7/
1/12
-6/3
0/13
8,14
2
(8,1
42)
6,94
2
T
rans
port
atio
n10
0-03
4-51
20-0
6714
,065
7/1/
13-6
/30/
1414
,065
-
14
,065
-
Han
dica
pped
Ser
vice
s:
E
xam
inat
ion
and
Cla
ssifi
catio
n10
0-03
4-51
20-0
6632
,338
7/1/
12-6
/30/
1314
,495
(14,
495)
17,8
43
E
xam
inat
ion
and
Cla
ssifi
catio
n10
0-03
4-51
20-0
6623
,270
7/1/
13-6
/30/
1423
,270
(1
0,03
9)
13,2
31
10
,039
Cor
rect
ive
Spe
ech
100-
034-
5120
-066
14,8
43
7/
1/12
-6/3
0/13
8,28
1
(8,2
81)
6,56
2
C
orre
ctiv
e S
peec
h10
0-03
4-51
20-0
6610
,156
7/1/
13-6
/30/
1410
,156
(3
,906
)
6,
250
3,
906
Sup
plem
enta
l Ins
truc
tion
100-
034-
5120
-066
22,2
03
7/
1/12
-6/3
0/13
12,3
51
(1
2,35
1)
9,
852
Sup
plem
enta
l Ins
truc
tion
100-
034-
5120
-066
17,3
46
7/
1/13
-6/3
0/14
17,3
46
(11,
795)
5,
551
11
,795
Hom
e In
stru
ctio
n10
0-03
4-51
20-0
674,
360
7/1/
12-6
/30/
13(4
,360
)
4,
360
4,36
0
H
ome
Inst
ruct
ion
100-
034-
5120
-067
1,28
1
7/
1/13
-6/3
0/14
(1,2
81)
(1,2
81)
1,28
1
N
ursi
ng10
0-03
4-51
20-0
7027
,429
7/1/
12-6
/30/
1381
0
(8
10)
26
,619
Nur
sing
100-
034-
5120
-070
25,2
44
7/
1/13
-6/3
0/14
25,2
44
(22,
980)
2,
264
22
,980
T
echn
olog
y10
0-03
4-51
20-3
737,
294
7/1/
12-6
/30/
1317
5
(1
75)
7,
119
T
echn
olog
y10
0-03
4-51
20-3
735,
240
7/1/
13-6
/30/
145,
240
(4,8
18)
422
4,81
8
T
otal
Spe
cial
Rev
enue
Fun
d10
2,72
5
-
22
5,55
8
(1
18,4
81)
-
(107
,085
)
(1,2
81)
-
103,
998
-
267,
581
Cap
ital P
roje
cts
Fun
d:
Sch
ool F
acili
ties
Gra
nt P
rogr
am -
Reg
ular
Ope
ratin
g D
istr
icts
(R
OD
)N
A1,
756,
742
8/31
/10-
6/30
/13
(1,7
56,7
42)
1,60
3,10
1
153,
641
-
-
T
otal
Cap
ital P
roje
cts
Fun
d(1
,756
,742
)
-
1,60
3,10
1
-
153,
641
-
-
-
-
-
-
Deb
t Ser
vice
Fun
d:
Deb
t Ser
vice
Aid
Typ
e II
495-
034-
5120
-017
3,25
3,73
6
7/
1/13
-6/3
0/14
3,25
3,73
6
(3,2
53,7
36)
3,25
3,73
6
T
otal
Deb
t Ser
vice
Fun
d-
-
3,25
3,73
6
(3,2
53,7
36)
-
-
-
-
-
-
3,25
3,73
6
Sta
te D
ep
artm
en
t o
f A
gri
cult
ure
Ent
erpr
ise
Fun
d:
Sta
te S
choo
l Lun
ch P
rogr
am10
0-01
0-33
60-0
6735
,405
7/1/
12-6
/30/
13(2
,603
)
2,
603
34,7
59
Sta
te S
choo
l Lun
ch P
rogr
am10
0-01
0-33
60-0
6735
,155
7/1/
13-6
/30/
1428
,168
(3
5,15
5)
(6,9
87)
35,1
55
(2,6
03)
-
30
,771
(3
5,15
5)
-
-
(6
,987
)
-
-
-
69,9
14
Tot
al S
tate
Fin
anci
al A
ssis
tanc
e(2
,528
,521
)$
-
45,7
03,8
51
(47,
566,
769)
15
5,06
8
(1
07,0
85)
(7
63,3
87)
-
10
3,99
8
3,
684,
067
52,1
84,3
75
The
acc
ompa
nyin
g no
tes
to S
ched
ules
of E
xpen
ditu
res
of A
war
ds a
nd F
inan
cial
Ass
ista
nce
are
an in
tegr
al p
art o
f thi
s st
atem
ent
138
Egg Harbor Township Board of Education Notes to the Schedules of Financial Assistance June 30, 2014
NOTE 1. GENERAL The accompanying schedules of expenditures of federal awards and state financial assistance include federal and state award activity of the Board of Education, Egg Harbor Township School District. The Board of Education is defined in Note 1(A) to the Board's basic financial statements. All federal awards and state financial assistance received directly from federal and state agencies, as well as federal awards and state financial assistance passed through other government agencies is included on the schedule of expenditures of federal awards and state financial assistance. NOTE 2. BASIS OF ACCOUNTING The accompanying schedules of expenditures of awards and financial assistance are presented on the budgetary basis of accounting with the exception of programs recorded in the food service fund, which are presented using the accrual basis of accounting. These bases of accounting are described in Note 1 to the Board's basic financial statements. The information in this schedule is presented in accordance with the requirements of OMB Circular A-133, Audits of States, Local Governments, and Non-Profit Organizations. Therefore, some amounts presented in this schedule may differ from amounts presented in, or used in the preparation of, the basic financial statements. NOTE 3. RELATIONSHIP TO GENERAL PURPOSE FINANCIAL STATEMENTS The basic financial statements present the general fund and special revenue fund on a GAAP basis. Budgetary comparison statements or schedules (RSI) are presented for the general fund and special revenue fund to demonstrate finance-related legal compliance in which certain revenue is permitted by law or grant agreement to be recognized in the audit year, whereas for GAAP reporting, revenue is not recognized until the subsequent year or when expenditures have been made. The general fund is presented in the accompanying schedules on the modified accrual basis with the exception of the revenue recognition of the last state aid payment in the current budget year, which is mandated pursuant to NJSA 18A:22-44.2. For GAAP purposes that payment is not recognized until the subsequent budget year due to the state deferral and recording of the last state aid payment in the subsequent year. The special revenue fund is presented in the accompanying schedules on the grant accounting budgetary basis which recognizes encumbrances as expenditures and also recognizes the related revenues, whereas the GAAP basis does not. The special revenue fund also recognizes the last state aid payment in the current budget year, consistent with NJSA 18A:22-44.2. The net adjustment to reconcile from budgetary basis to GAAP basis is $296,663 for the general fund and $71,743 for the special revenue fund. See the following schedule for a reconciliation of the budgetary basis to the modified accrual basis of accounting for the general and special revenue funds. Awards and financial assistance revenues are reported in the Board's basic financial statements on a GAAP basis as follows:
{This space intentionally left blank}
139
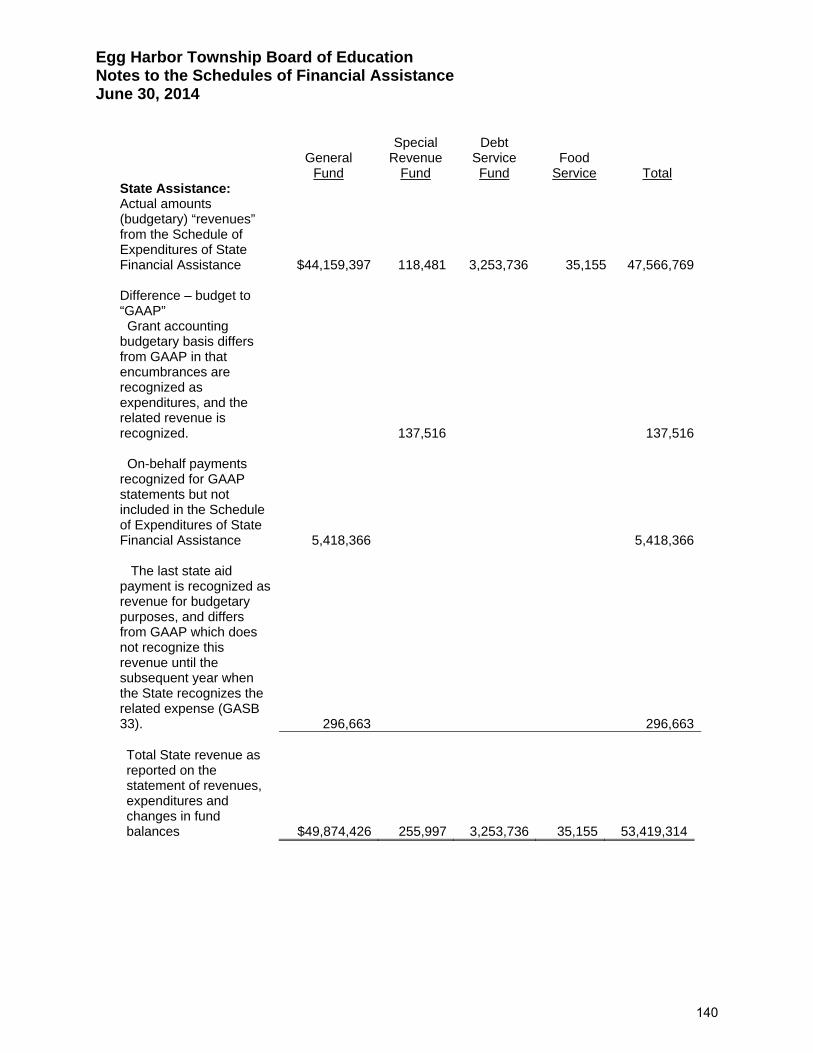
Egg Harbor Township Board of Education Notes to the Schedules of Financial Assistance June 30, 2014
Special Debt General Revenue Service Food Fund Fund Fund Service Total State Assistance: Actual amounts (budgetary) “revenues” from the Schedule of Expenditures of State Financial Assistance $44,159,397 118,481 3,253,736 35,155 47,566,769 Difference – budget to “GAAP” Grant accounting budgetary basis differs from GAAP in that encumbrances are recognized as expenditures, and the related revenue is recognized. 137,516 137,516 On-behalf payments recognized for GAAP statements but not included in the Schedule of Expenditures of State Financial Assistance 5,418,366 5,418,366 The last state aid payment is recognized as revenue for budgetary purposes, and differs from GAAP which does not recognize this revenue until the subsequent year when the State recognizes the related expense (GASB 33). 296,663 296,663 Total State revenue as reported on the statement of revenues, expenditures and changes in fund balances $49,874,426 255,997 3,253,736 35,155 53,419,314
140
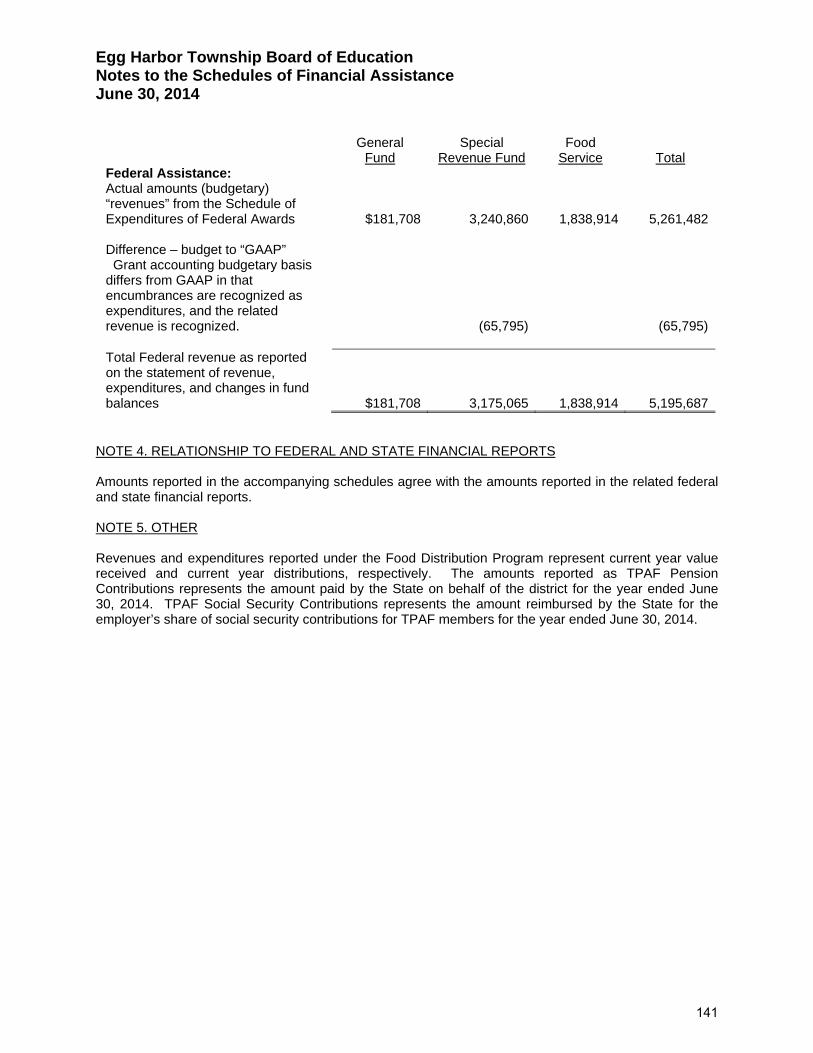
Egg Harbor Township Board of Education Notes to the Schedules of Financial Assistance June 30, 2014
General Special Food Fund Revenue Fund Service Total Federal Assistance: Actual amounts (budgetary) “revenues” from the Schedule of Expenditures of Federal Awards $181,708 3,240,860 1,838,914 5,261,482 Difference – budget to “GAAP” Grant accounting budgetary basis differs from GAAP in that encumbrances are recognized as expenditures, and the related revenue is recognized. (65,795) (65,795) Total Federal revenue as reported on the statement of revenue, expenditures, and changes in fund balances $181,708 3,175,065 1,838,914 5,195,687
NOTE 4. RELATIONSHIP TO FEDERAL AND STATE FINANCIAL REPORTS Amounts reported in the accompanying schedules agree with the amounts reported in the related federal and state financial reports. NOTE 5. OTHER Revenues and expenditures reported under the Food Distribution Program represent current year value received and current year distributions, respectively. The amounts reported as TPAF Pension Contributions represents the amount paid by the State on behalf of the district for the year ended June 30, 2014. TPAF Social Security Contributions represents the amount reimbursed by the State for the employer’s share of social security contributions for TPAF members for the year ended June 30, 2014.
141
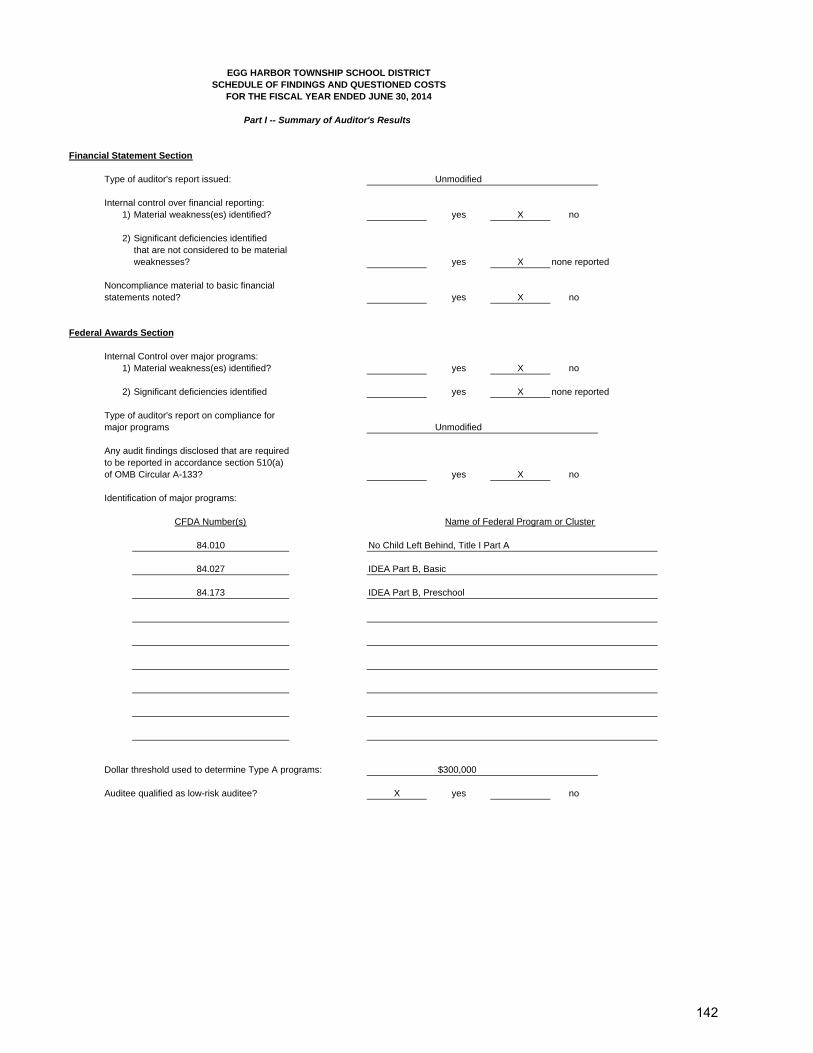
EGG HARBOR TOWNSHIP SCHOOL DISTRICTSCHEDULE OF FINDINGS AND QUESTIONED COSTS
FOR THE FISCAL YEAR ENDED JUNE 30, 2014
Part I -- Summary of Auditor's Results
Financial Statement Section
Type of auditor's report issued: Unmodified
Internal control over financial reporting:1) Material weakness(es) identified? yes X no
2) Significant deficiencies identifiedthat are not considered to be materialweaknesses? yes X none reported
Noncompliance material to basic financialstatements noted? yes X no
Federal Awards Section
Internal Control over major programs:1) Material weakness(es) identified? yes X no
2) Significant deficiencies identified yes X none reported
Type of auditor's report on compliance for major programs Unmodified
Any audit findings disclosed that are requiredto be reported in accordance section 510(a)of OMB Circular A-133? yes X no
Identification of major programs:
CFDA Number(s) Name of Federal Program or Cluster
84.010 No Child Left Behind, Title I Part A
84.027 IDEA Part B, Basic
84.173 IDEA Part B, Preschool
Dollar threshold used to determine Type A programs: $300,000
Auditee qualified as low-risk auditee? X yes no
142
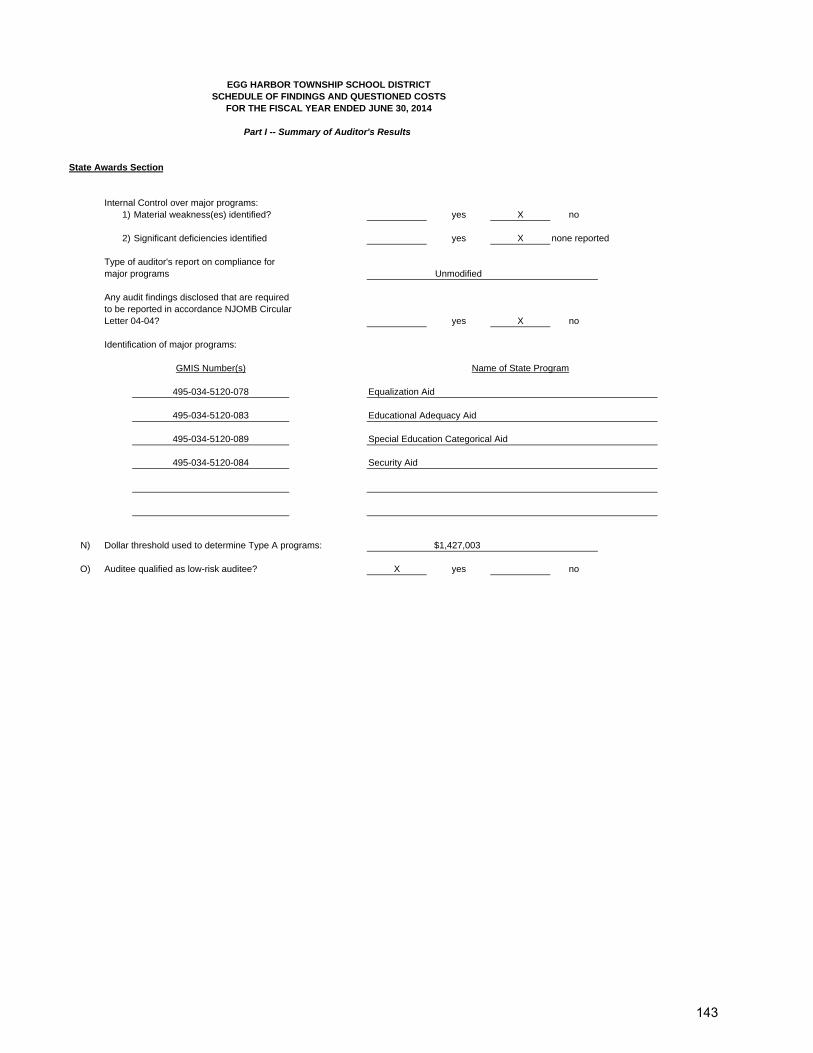
EGG HARBOR TOWNSHIP SCHOOL DISTRICTSCHEDULE OF FINDINGS AND QUESTIONED COSTS
FOR THE FISCAL YEAR ENDED JUNE 30, 2014
Part I -- Summary of Auditor's Results
State Awards Section
Internal Control over major programs:1) Material weakness(es) identified? yes X no
2) Significant deficiencies identified yes X none reported
Type of auditor's report on compliance for major programs Unmodified
Any audit findings disclosed that are requiredto be reported in accordance NJOMB CircularLetter 04-04? yes X no
Identification of major programs:
GMIS Number(s) Name of State Program
495-034-5120-078 Equalization Aid
495-034-5120-083 Educational Adequacy Aid
495-034-5120-089 Special Education Categorical Aid
495-034-5120-084 Security Aid
N) Dollar threshold used to determine Type A programs: $1,427,003
O) Auditee qualified as low-risk auditee? X yes no
143
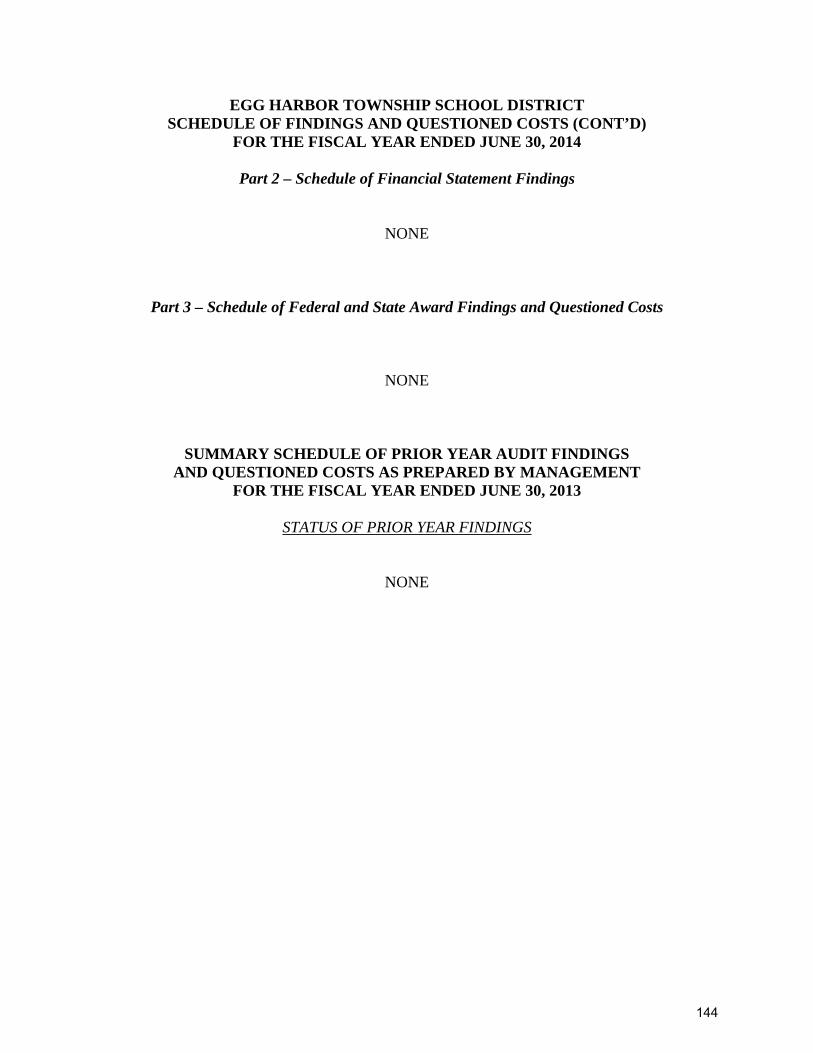
EGG HARBOR TOWNSHIP SCHOOL DISTRICT SCHEDULE OF FINDINGS AND QUESTIONED COSTS (CONT’D)
FOR THE FISCAL YEAR ENDED JUNE 30, 2014
Part 2 – Schedule of Financial Statement Findings
NONE
Part 3 – Schedule of Federal and State Award Findings and Questioned Costs
NONE
SUMMARY SCHEDULE OF PRIOR YEAR AUDIT FINDINGS AND QUESTIONED COSTS AS PREPARED BY MANAGEMENT
FOR THE FISCAL YEAR ENDED JUNE 30, 2013
STATUS OF PRIOR YEAR FINDINGS
NONE
144