Embed Size (px)
Citation preview
2014 Hawaii Statewide Antibiogram
for Selected Bacteria of Public Health Significance
The 2014 statewide antibiogram is the third annual antibiogram report released by the Hawaii State Department of
Health (HDOH). Similar to prior statewide antibiograms, data were compiled based on recommendations from the
Clinical and Laboratory Standards Institute (CLSI) M39 Guidelines (See Appendix A). The 2014 antibiogram report reflects
data submitted by the four major clinical laboratories throughout the state and an independent hospital.
o Tripler Army Medical Center, Kaiser Permanente, Diagnostic Laboratory Services, Clinical Laboratories of
Hawaii (CLH), and Wahiawa General Hospital (WGH) each submitted their data in aggregate form.
o The data represent isolates cultured from January 2014 through December 2014.
Changes for the 2014 antibiogram
o WGH’s antibiogram was included for the first time.
o CLH provided an aggregate antibiogram for their contracted critical access hospitals, long-term care
facilities, and outpatient facilities.
o Data from 2012–2014 were analyzed to identify significant trends over time.
Note: data are presented for surveillance purposes only and are not intended for use in clinical decision
making. This antibiogram should not take the place of individual clinical assessment and isolate susceptibility
testing.
Limitations:
o One facility did not differentiate MRSA and MSSA; Staphylococcus aureus data for this facility are
presented in aggregate form only.
o A distinction was not made between inpatient and outpatient isolates in all laboratories; additionally,
not all laboratories distinguished between urine and systemic isolates (See Appendix B). Data presented
on the statewide antibiogram are thus presented in aggregate form for those parameters.
o Not all laboratories have implemented the revised carbapenem breakpoints for Enterobacteriaceae
recommended by CLSI in 2010 (M100-S20).
Detect and Protect Against Antibiotic Resistance
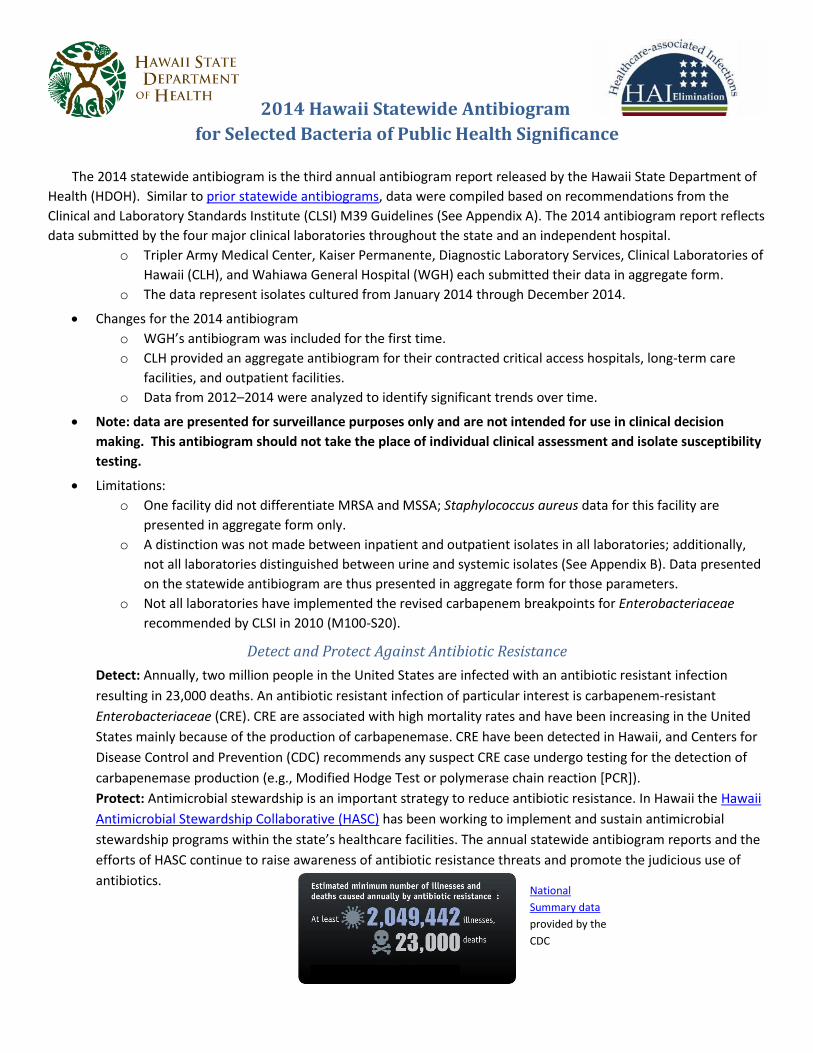
Detect: Annually, two million people in the United States are infected with an antibiotic resistant infection
resulting in 23,000 deaths. An antibiotic resistant infection of particular interest is carbapenem-resistant
Enterobacteriaceae (CRE). CRE are associated with high mortality rates and have been increasing in the United
States mainly because of the production of carbapenemase. CRE have been detected in Hawaii, and Centers for
Disease Control and Prevention (CDC) recommends any suspect CRE case undergo testing for the detection of
carbapenemase production (e.g., Modified Hodge Test or polymerase chain reaction [PCR]).
Protect: Antimicrobial stewardship is an important strategy to reduce antibiotic resistance. In Hawaii the Hawaii
Antimicrobial Stewardship Collaborative (HASC) has been working to implement and sustain antimicrobial
stewardship programs within the state’s healthcare facilities. The annual statewide antibiogram reports and the
efforts of HASC continue to raise awareness of antibiotic resistance threats and promote the judicious use of
antibiotics.
National
Summary data
provided by the
CDC
2014 Hawaii Statewide Antibiogram
2
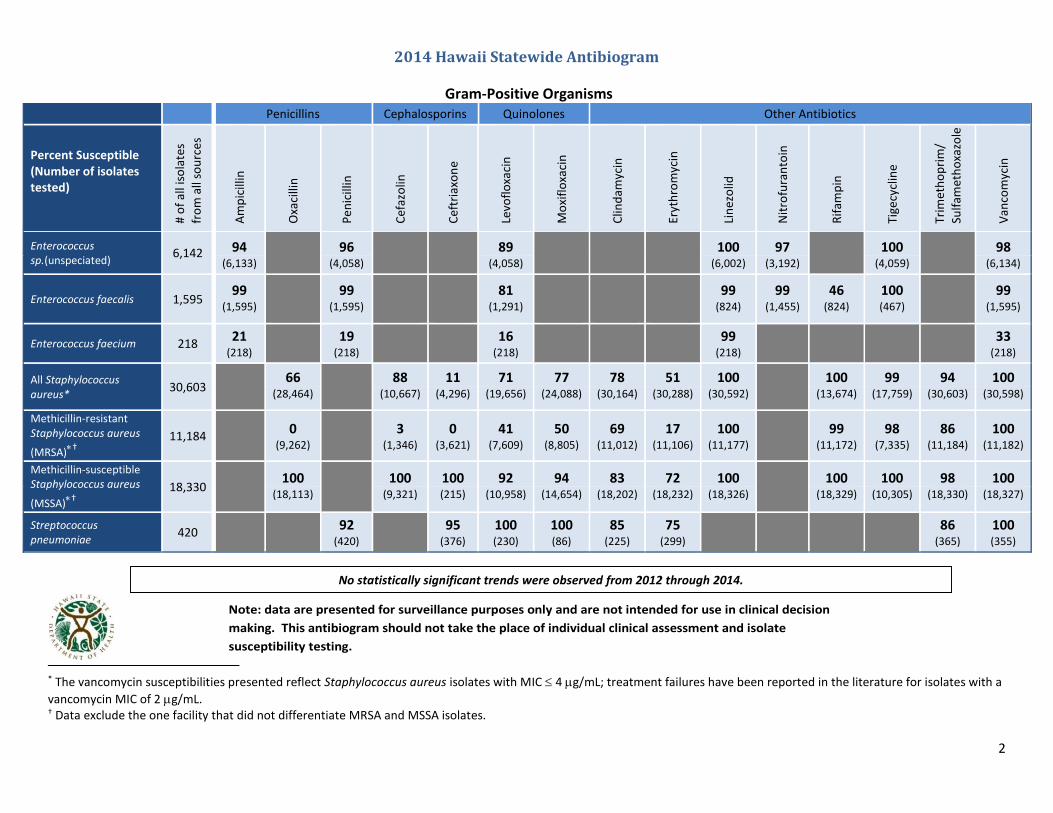
No statistically significant trends were observed from 2012 through 2014.
Gram-Positive Organisms Penicillins Cephalosporins Quinolones Other Antibiotics
Percent Susceptible (Number of isolates tested)
# o
f al
l iso
late
s
fro
m a
ll so
urc
es
Am
pic
illin
Oxa
cilli
n
Pen
icill
in
Cef
azo
lin
Cef
tria
xon
e
Levo
flo
xaci
n
Mo
xifl
oxa
cin
Clin
dam
ycin
Eryt
hro
myc
in
Lin
ezo
lid
Nit
rofu
ran
toin
Rif
amp
in
Tige
cycl
ine
Trim
eth
op
rim
/
Sulf
amet
ho
xazo
le
Van
com
ycin
Enterococcus sp.(unspeciated)
6,142 94
96
89
100 97
100
98 (6,133) (4,058) (4,058) (6,002) (3,192) (4,059) (6,134)
Enterococcus faecalis 1,595 99
99
81
99 99 46 100
99 (1,595) (1,595) (1,291) (824) (1,455) (824) (467) (1,595)
Enterococcus faecium 218 21
(218)
19 (218)
16 (218)
99 (218)
33 (218)
All Staphylococcus aureus*
30,603 66
88 11 71 77 78 51 100
100 99 94 100 (28,464) (10,667) (4,296) (19,656) (24,088) (30,164) (30,288) (30,592) (13,674) (17,759) (30,603) (30,598)
Methicillin-resistant Staphylococcus aureus
(MRSA)†
11,184 0
(9,262)
3 (1,346)
0 (3,621)
41 (7,609)
50 (8,805)
69 (11,012)
17 (11,106)
100 (11,177)
99
(11,172) 98
(7,335) 86
(11,184) 100
(11,182)
Methicillin-susceptible Staphylococcus aureus
(MSSA)†
18,330 100
100 100 92 94 83 72 100
100 100 98 100 (18,113) (9,321) (215) (10,958) (14,654) (18,202) (18,232) (18,326) (18,329) (10,305) (18,330) (18,327)
Streptococcus pneumoniae
420 92
(420)
95 (376)
100 (230)
100 (86)
85 (225)
75 (299)
86 (365)
100 (355)
* The vancomycin susceptibilities presented reflect Staphylococcus aureus isolates with MIC 4 g/mL; treatment failures have been reported in the literature for isolates with a
vancomycin MIC of 2 g/mL. † Data exclude the one facility that did not differentiate MRSA and MSSA isolates.
Note: data are presented for surveillance purposes only and are not intended for use in clinical decision
making. This antibiogram should not take the place of individual clinical assessment and isolate
susceptibility testing.
2014 Hawaii Statewide Antibiogram
3
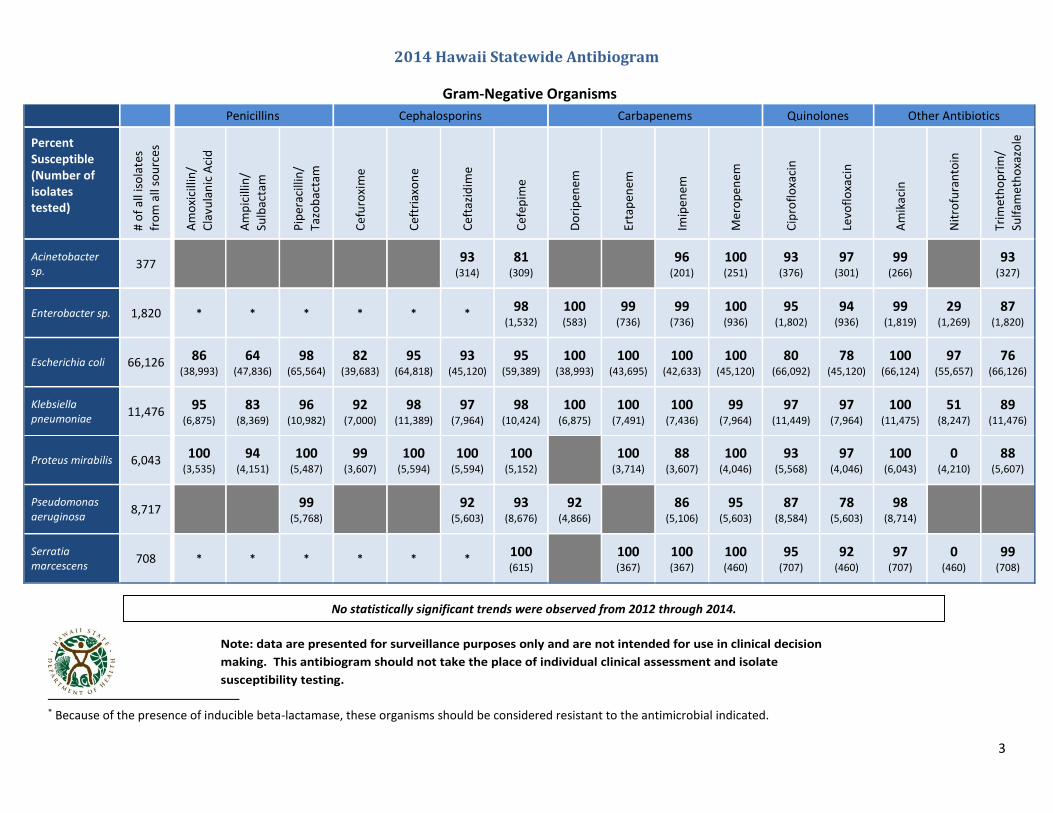
Gram-Negative Organisms
Penicillins Cephalosporins Carbapenems Quinolones Other Antibiotics
Percent Susceptible (Number of isolates tested) #
of
all i
sola
tes
fro
m a
ll so
urc
es
Am
oxi
cilli
n/
Cla
vula
nic
Aci
d
Am
pic
illin
/
Sulb
acta
m
Pip
erac
illin
/
Tazo
bac
tam
Cef
uro
xim
e
Cef
tria
xon
e
Cef
tazi
dim
e
Cef
epim
e
Do
rip
enem
Erta
pen
em
Imip
ene
m
Mer
op
ene
m
Cip
rofl
oxa
cin
Levo
flo
xaci
n
Am
ikac
in
Nit
rofu
ran
toin
Trim
eth
op
rim
/
Sulf
amet
ho
xazo
le
Acinetobacter sp.
377
93
(314) 81
(309) 96
(201) 100 (251)
93 (376)
97 (301)
99 (266)
93 (327)
Enterobacter sp. 1,820 * * * * * * 98
(1,532) 100 (583)
99 (736)
99 (736)
100 (936)
95 (1,802)
94 (936)
99 (1,819)
29 (1,269)
87 (1,820)
Escherichia coli 66,126 86 (38,993)
64 (47,836)
98 (65,564)
82 (39,683)
95 (64,818)
93 (45,120)
95 (59,389)
100 (38,993)
100 (43,695)
100 (42,633)
100 (45,120)
80 (66,092)
78 (45,120)
100 (66,124)
97 (55,657)
76 (66,126)
Klebsiella pneumoniae
11,476 95
(6,875) 83
(8,369) 96
(10,982) 92
(7,000) 98
(11,389) 97
(7,964) 98
(10,424) 100
(6,875) 100
(7,491) 100
(7,436) 99
(7,964) 97
(11,449) 97
(7,964) 100
(11,475) 51
(8,247) 89
(11,476)
Proteus mirabilis 6,043 100
(3,535) 94
(4,151) 100
(5,487) 99
(3,607) 100
(5,594) 100
(5,594) 100
(5,152) 100
(3,714) 88
(3,607) 100
(4,046) 93
(5,568) 97
(4,046) 100
(6,043) 0
(4,210) 88
(5,607)
Pseudomonas aeruginosa
8,717
99
(5,768) 92
(5,603) 93
(8,676) 92
(4,866) 86
(5,106) 95
(5,603) 87
(8,584) 78
(5,603) 98
(8,714)
Serratia marcescens
708 * * * * * * 100 (615)
100 (367)
100 (367)
100 (460)
95 (707)
92 (460)
97 (707)
0 (460)
99 (708)
1
* Because of the presence of inducible beta-lactamase, these organisms should be considered resistant to the antimicrobial indicated.
Note: data are presented for surveillance purposes only and are not intended for use in clinical decision
making. This antibiogram should not take the place of individual clinical assessment and isolate
susceptibility testing.
No statistically significant trends were observed from 2012 through 2014.
4
Appendix A: Summary of the recommendations contained in CLSI M39-A4 Guidelines
The Routine Cumulative Antibiogram
Analyze/present cumulative antibiogram report at least annually
Include only final, verified test results
Include only species with testing data for ≥30 isolates
Include only diagnostic isolates
Eliminate duplicate isolates
Include only antimicrobial agents routinely tested
Report percent susceptible and do not include percent intermediate
Suggested supplemental analyses: o For Streptococcus pneumoniae and cefotaxime/ceftriaxone/penicillin: report percent susceptible for
both meningitis and non-meningitis breakpoints o For viridans group streptococci and penicillin: list both percent intermediate and percent susceptible o For antimicrobial agents that have susceptible dose-dependent (SDD)* interpretive criteria, calculate and
list separately the %S and %SDD o Perform separate analyses for oxacillin-resistant S. aureus (MRSA) and oxacillin-susceptible S. aureus o Differentiate Enterococcus faecalis and E. faecium, and present their susceptibility patterns separately
The Enhanced Antibiogram
Stratifying cumulative antibiogram data by various parameters o Differentiate by nursing unit or site of care (e.g. ICU, outpatient clinic) † o Differentiate by an organism’s resistance characteristics, especially for multidrug resistant organisms
(MDROs) (e.g. VRE) o Differentiate by specimen type or infection site (e.g. urine and blood isolates) † o Differentiate by clinical service or patient population (e.g. surgical, pediatric)
Supplemental analyses of MDROs o List the percentage of a species that is MDR next to the organism name o Stratify isolates of species where multidrug resistance is known to occur (e.g. K. pneumoniae)
Examine the percentage of isolates susceptible to drugs in relevant combinations for individual species or for groups of organisms
Appendix B: Additional factors that can impact aggregate antibiogram data Interpretation and clinical utility of particular pathogen-antibiotic combinations may differ depending on site of
infection, in particular for urinary or central nervous system infections; additionally, susceptibility testing performed at different laboratories may vary depending on site of culture, and different minimum inhibitory concentration (MIC)‡ “breakpoints” may be given for antibiotics most frequently used to treat urinary tract infections—for instance, nitrofurantoin and trimethoprim-sulfamethoxazole
Patient population served: for example, substantial differences may be seen in susceptibility patterns in the outpatient and inpatient setting
Culturing practices: for example, susceptibility patterns may be biased if local practice involves culturing for uncomplicated infections only in the context of treatment failure
Laboratory antimicrobial susceptibility testing and reporting policies
Temporal outbreaks
* The SDD category implies that susceptibility of an isolate is dependent on the dosing regimen that is used in the patient. † These recommendations moved from Suggested Supplemental Analyses (M39-A3) to the Enhanced Antibiogram (M39-A4). ‡ The MIC is defined as the lowest concentration of a drug that will inhibit the visible growth of an organism after overnight
incubation.