Embed Size (px)
Citation preview
Sonoma County Indicators Economy, Environment, Health, Society, Tourism, Workforce
20A
B
R
I D14
G E D E D I T I O N
Table of Contents
1. Executive Summary
2. Trends
4. How Competitive is Sonoma County?
Economy6. Unemployment
Median Home Prices
Median Household Income
Poverty
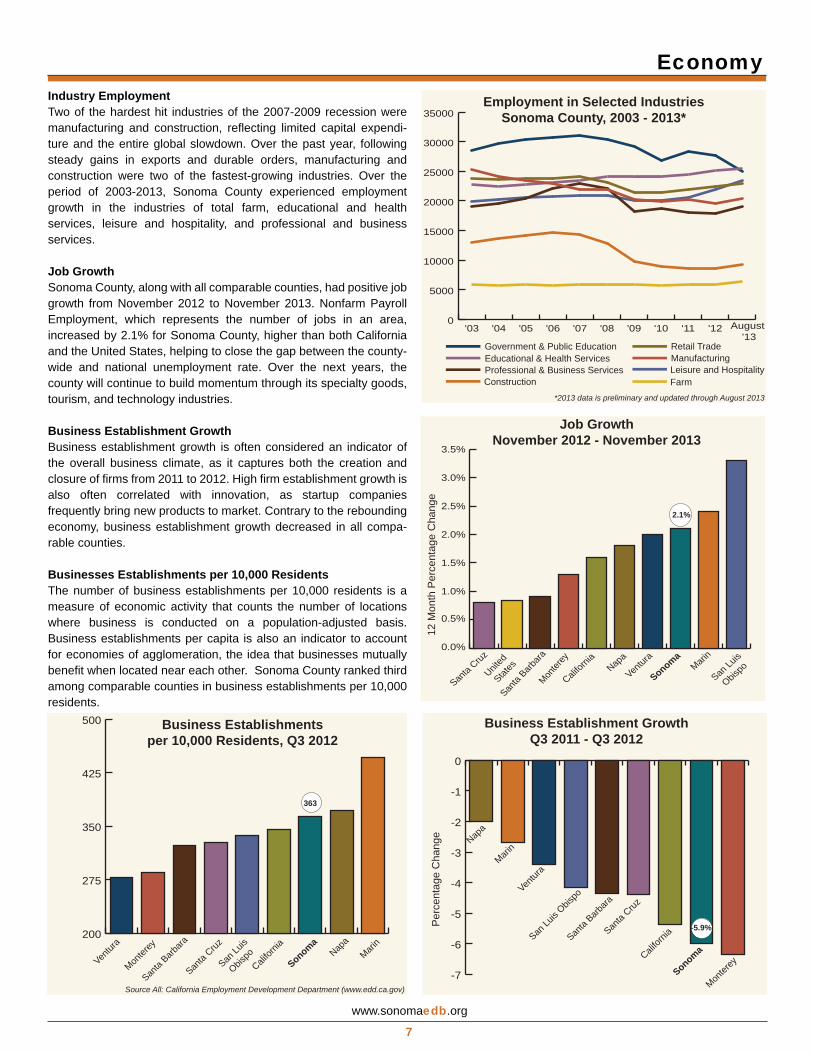
7. Industry Employment
Job Growth
Business Establishment Growth
Business Establishments per 10,000 Residents
Environment8. Air Quality
Waste Disposal
Water Use
Open Space Acreage
Health9. Uninsured
Causes of Death
Types of Health Insurance Coverage
Youth Alcohol Use
Society10. Age Distribution by Ethnicity
High School Exit Exam Scores
Crime Rates
Educational Attainment
Workforce11. Industry Employment Ages 55+
Population Growth & Demographic Change
Industry Growth, Concentration, and Wages
Tourism12. Hotel Occupancy Rates
Tourism-Related Taxes
Visitor Spending
13. Methodology & Sources
Executive Summary
The Sonoma County Economic Development Board (EDB) is pleased to present the 2014 Sonoma County Indicators Abridged Edition. The indicators chosen for this year’s report focus on the connections between our economy and community, measuring our progress, and bench-marking our performance to similar counties in California. In an effort to provide the most current and comprehensive annual data in this year’s report, the scope of this preliminary version has been narrowed. The full unabridged report will be made available online at www.sonomaedb.org in the spring of 2014.
The report features a “competitiveness index” section intended to measure regional competi-tiveness not only by economic elements but through the region’s quality of life and how the region supports innovation. The “Quality of Place Index” and “Innovative Environment Index” were created to measure these types of competitiveness.
Some highlights and challenges in this report include:
• Sonoma County is a competitive place to do business both because of an attractive business climate and the high quality of life shown thorough the high scores on the Innovative Environ-ment Index and the Quality of Place Index.
•The seasonally unadjusted unemployment rate for Sonoma County was 6.0% in November 2013, a four-year low and below the state wide average. Job growth in Sonoma County was 2.1% from November 2012 to November 2013.
• Sonoma County had the third-highest number of business establishments per capita among comparable counties. This is indicative of a high level of economic activity and a healthy business environment.
• Tourism indicators are overwhelmingly positive. Revenue from the transient occupancy tax (TOT) started increasing in the first quarter of 2010, and and saw one of the best first quarters in recorded history in 2013. This is the first time that TOT revenues have surpassed pre-recession levels, and have increased by 17% over a year. At the same time, hotel occu-pancy rates have increased 6.8%.
The EDB encourages readers to delve further into these issues by contacting the agencies and organizations listed throughout this report, and by visiting the EDB’s website, www.sonomaedb.org. This annual assessment of our region’s economic progress is meant to help guide discussions by local business, government, community and workforce leaders regarding strategies for shaping our region’s economic future. The Economic Development Board is committed to working with our partners to take the actions necessary to build on our strengths and to address our deficiencies – to improve economic opportunities and quality of life for all Sonoma County residents.
Pamela Chanter Ben StoneChair Executive DirectorEconomic Development Board Economic Development Board
Board of Directors Pamela Chanter, Chair Joe Orlando, Vice Chair Libby Harvey FitzGerald
Michael Nicholls Linda Kachiu Melanie BagbyMichael Tomasini Marcos Suarez John Webley
www.sonomaedb.org
1
www.sonomaedb.org
2
Trends
What is a trend?Trends state changes in data over time. They are a simple way to identify changes in community indicators, based on one, five or ten-year periods of observation. In this section there are trend summaries for Sonoma County, offering a snapshot of information and measurements of recent economic and community performance. Performances are categorized as positive, concerning, or unclear trends. The purpose of trends is to identify those areas where Sonoma County is succeeding, and just as importantly, those where it faces challenges.
Positive Trends
EconomyUnemployment Rate
Sonoma County has seen a steady decrease in its unemployment rate over the past three years, with the most recent rate showing signs of reaching pre-recession levels. From November 2012 to November 2013 alone, Sonoma County experienced 1.7 percent-age points decline in its unemployment rate. (See page 6)
EnvironmentWaste Disposal
After a slight increase in 2010, Sonoma County showed a significant decline in the volume of waste produced by residents in the following years. In 2012, the Sonoma County average waste per person decreased by 0.3 pound, whereas the California average waste per person decreased by 0.1 pound. (Pg. 8)
Air QualitySonoma County saw a 4% increase in air quality in the northern air basin from 2011 to 2012. Compared to other similar counties, Sonoma County ranks forth behind Santa Cruz, Monterey and Marin counties. (Pg. 8)
Society
College Educational AttainmentThe percentage of Sonoma County residents over the age of 25 with a bachelor’s degree has decreased slightly by 0.4% while the percentage of residents holding advanced degrees has increased by 0.2%. Sonoma County is still the third-most highly educated county among comparable counties, with an above state average population holding at least a bachelor’s degree. (Pg. 10)
Greater Youth DiversityThere is more ethnic diversity among the youth in Sonoma County. This indicates that Sonoma County has a rapidly growing young Hispanic population and an aging white population, suggesting a higher ethnic diversity in the workforce and society. (Pg. 10)
Tourism
Hotel Occupancy RatesSonoma County hotel occupancy rates have increased 6.8% year-to-date. This suggests that visitors are returning to Sonoma County. The county also outperformed other comparable counties by a large margin, suggesting increased attractiveness of Sonoma County and effective tourism promotion events. (Pg. 12)
Transient Occupancy TaxTOT revenues started increasing in the first quarter of 2010, and saw one of the best first quarters in recorded history in 2013. This is the first time that TOT revenues have surpassed pre-recession levels and increased by 17% over a year. (Pg. 12)
www.sonomaedb.org
3
Trends
Concerning TrendsWorkforceEmployment of Workers 55+
Every industry, except educational services, showed an increase in total employees aged 55+ in 2012. Educational services, however, proportionally remains the largest employed industry of workers aged 55+ with over 32 percent of the total employment pool. Real estate, utilities, and health care service industries also showed a large share of employees aged 55+ ranging from 25 to 27 percent, while food services, mining, construction, and retail trade industries showed the lowest from 11 to 17 percent. (Pg. 11)
EnvironmentWater Use
Sonoma County has had a strong history of water conservation. Since 2008, there had been a declining trend in water use per capita per day in the county. However, From 2011 to 2012, Sonoma County’s water use increased by 6 gallons per capita per day, a 5.3% increase within a year. (Pg. 8)
EconomyBusiness Growth
Sonoma County as well as other comparable counties and the state had negative business establishment growths from 2011 to 2012. Sonoma County’s business establishment growth fell from 2.7 percent in 2011 to -5.9% in 2012. However, Sonoma County still has the third-highest number of business establishments per capita among comparable counties. (Pg. 7)
HealthInsurance Rates
The proportion of individuals not covered by health insurance in Sonoma County increased 0.7 percentage points from 2011 to 2012, equating to 3,556 fewer covered individuals, and moving the county below the national average. Sonoma County, however, performed better than the state of California with 2.9 percent of fewer individuals without health insurance. This is subject to change as a result of the Affordable Care Act. (Pg. 9)
Society
Education Achievement GapWhile Sonoma County performs well compared to other counties and the state average, there is a noticeable educational achieve-ment gap in English language proficiency and high school graduation rates among different ethnic groups within the county. (Pg. 10)
Unclear TrendsEconomy
Percent Below the Poverty LineThe percentage of Sonoma County residents living below the national poverty line fell only 0.1 percentage point from 2011 to 2012 and this remains higher than 2009. Due to the higher cost of living in Sonoma County, an adjusted poverty rate may be higher. (Pg. 6)
Median Home PricesThe median sales price of an existing home in Sonoma County is at a five-year high, and the recovery of median home prices in Sonoma County has been volatile. Home prices still remain attractive relative to the pre-recession highs, and this bodes well for new home buyers. (Pg. 6)
Health
Cause of DeathCompared to the national average, Sonoma County had a slightly lower rate of coronary heart disease and a higher rate of cancer in 2009. Conversely, deaths in Sonoma County by coronary heart disease reached the national rate in 2010 accounting for 23% of all deaths. Total deaths by cancer, however, decreased by about 1 percentage point over the same year. (Pg. 9)
www.sonomaedb.org4
How Competitive is Sonoma County?
Regional competitiveness is the ability of a region to produce goods and services that are successful in the global market. When measuring competitiveness, it is not only important to take into account economic elements, but also ways the region supports continuing innovation and productivity and maintains a high standard of living. We have done this by establishing a competitiveness index which measures innovation and quality of place. There are many indicators that can be used in these indexes, the ones selected were chosen because they effectively measure an innovative environment and a high quality of life.
Quality of Place IndexAn area’s quality of life is becoming more and more important in an increasingly competitive global economy as a way to attract and retain top talent. This is because highly educated workers have more flexibility in where they choose to live as their special
knowledge and skills are in high demand. As such, an area’s lifestyle attributes are crucial to its long-term economic success.
Overall: We examine six measures indicative of quality of place in order to establish how competi-tive Sonoma County is relative to comparable counties. Sonoma County’s above-average ranking is primarily due to good air quality, lower crime rate and better access to health care. SSThese aa
individual measures are summarized below.
nn LLuuiis s OO
Quality of Place Indicators
bbisispp
Air Quality: A weighted average of days with air quality measured as ‘good’ or ‘moderate’ by the Environmental Protection Agency. Sonoma County ranked fourth behind Marin County with a score of 121.
Crime Rate: The crime rate measures the number of both violent and property crimes committed per 100,000 people. Sonoma County had the second- lowest crime rank among comparable counties with a score of 157, indicating that crime rates in Sonoma County were 57% below the state average.
Commute Time: The commute time measures the average time spent commuting by county residents. Sonoma County ranked 6th among comparable counties with a score of 107. However, the average commute time was 7% below the California average commute time.
Access to Health Care: The number of health care practitioners and technical occupations (NAICS 62) provides a measure of access to health care professionals. Sonoma County ranked third among comparable counties for access to health care with a score of 109.
Culture and Recreation: Employment in the arts, entertainment and recreation (NAICS 71) per capita provides a measure of an area’s cultural and recreational opportunities. Sonoma County ranked fourth among comparable counties for culture and recreation with a score of 98.
Per Capita Income: Earnings per person, provides a measure of standard of living and economic vitality. Sonoma County ranked fourth among comparable counties with an income per capita index of 111.
90 140
Califo
rnia
Average
100
Sonoma County 2014 115 Sonoma County
2012-13 (Avg.) 116
90 140
Califo
rnia
Average
100
Sonoma County 2014 117
Sonoma County 2012-13 (Avg.) 116
Quality of Place Index 2013-14
Marin
138
Santa B
arbara
115
Napa
114
Santa Cruz
109
Ventura
107
San Luis Obispo
104
Monterey
95
Indicators for Quality of Place IndexSonoma County 2013-14
50
75
100
125
150
175
200
Comparable Counties' Average Index
Sonoma County Index
Per Cap
ita
Inco
me
Culture
and
Rec
reatio
n
Acces
s to
Health
Care
Commute
Time
Lower
Crime
RateAir Q
uality
California Index = 100
Source All: Environmental Protection Agency (www.epa.gov), Federal Bureau of Investigation (www.fbi.gov), U.S. Census Bureau (www.census.gov), Bureau of Labor Statistics (www.bls.gov), U.S.
www.sonomaedb.org5
How Competitive is Sonoma County?
Innovative Environment Index
What is an index? This section examines different indicators of regional economic competitiveness. Each indicator is divided by the value for California and multiplied by 100. An adjusted value of 120 means the region is performing 20% above the state average, andan adjusted value of 90 means the region is performing 10% below the state average. Each indicator is weighted equally in the overall index. For more information, see ‘Index methodology’ on page 13.
An environment of innovation encourages the launch of new businesses, provides growth opportunities for existing businesses,and attracts businesses from outside the area. It is important because a strong innovative environment leads to business growth in the region. This index examines six measures indicative of an innovative environment in order to establish how competitive Sonoma County is relative to comparable counties.
Overall: Sonoma County’s above the state average ranking is primarily because of the relatively low cost of labor, high percent of the population with high school and college degrees, and the dense concentra-tion of small to mid-size businesses.
Innovative Environment Index Indicators
SSaann LLuui
Labor Cost: Labor cost is an important factor
is s OObin the cost of doing business and is measured by
bisispptotal earnings per employee at the 3-digit NAICS level. Sonoma County ranked seventh among comparable counties with a score of 102.84. However, the labor cost was 2.84% below the California average labor cost.
Employment in Technical Professions: This indicator represents the percentage of employment in computer, science and engineering professions (NAICS 54), which provides a measure of the research and development industry. Sonoma County ranked fourth relative to comparable counties with a score of 72.2.
Concentration of Small to Mid-size Businesses: This indicator represents the number of businesses in an area, presented per 1,000 employees. A growing number of small to mid-size businesses over time correlates to a strong environment for new business creation. For this indicator, small to mid-size businesses are classified as having 250 employees or less. Sonoma County ranked fourth among compa-rable counties with a score of 135.
Business Churn: The business churn metric is the ratio of business births and deaths to the total number of business establishments. This measure of entre-preneurship captures the cycle of the birth of profitable business, and the closing of struggling business. Sonoma County ranked fourth with a score of 90.
High School Graduates: This indicator represents the percentage of adult population (25+) with a high school diploma or higher. The better educated the regional workforce, the more quickly an economy can take advantage of new opportunities and recover from negative shocks. Sonoma County ranked third with a score of 106.
College Graduates: Educated residents with bachelor’s degree and higher have specialized skills and knowledge that fuel the performance of existing firms and serve to attract new employers. Sonoma County ranked fourth with a score of 102.
90 140
Califo
rnia
Average
100
Sonoma County 2014 115 Sonoma County
2012-13 (Avg.) 116
85 135
California
Average
100
Sonoma County 2014 101 Sonoma County
2012-13 (Avg.) 104
Innovative Environment Index 2013-14
Marin133
Santa Cruz
106
San Luis Obispo
104.7
Santa Barbara
99
Ventura
98 Napa
90 Monterey
88
Indicators for Innovative Environment IndexSonoma County 2013-14
50
75
100
125
150
175
200
Comparable Counties' Average Index
Sonoma County Index
CollegeGraduates
High School Graduates
BusinessChurn
Concentration ofSmall to Mid-Size
Businesses
Employmentin TechnicalProfessions
Labor Cost
California Index = 100
Source All: Moody’s Analytics, Bureau of Labor Statistics, California Employment Development Department, U.S. Census Bureau, California Postsecondary Education Commission.
EconomyEconomy indicators include employment levels, median home prices, income and poverty measures. In addition to representing the type and level of economic activity in the county; economic indicators illustrate strengths, challenges, and changes within Sonoma County relative to comparable counties.
Unemployment RateThe unemployment rate measures the percentage of individuals who are not working but are able, available, and actively seeking work, relative to the entire workforce. The seasonally unadjusted unemployment rate in November 2013 was 6.0% for Sonoma County which is lower than the state average (8.3%), and one of the lowest among comparable counties.
Median Home PricesMedian sales prices reflect the selling price of a middle-priced single family home in Sonoma County. In August 2013, the median sales price of an existing home was approximately $450,000. While home prices have decreased significantly from their peak in 2006, prices appear to be rising. The overall trend of declining median housing prices has dramatically improved hous-ing affordability, however, average rents are up by double digits and vacancy rates are at an all-time low.
Median Household IncomeMedian household income measures the level of each county’s middle earning households. From 2011 to 2012, the median household income in Sonoma County fell 1.8% from $61,020 to $59,941. Sonoma County’s median household income places higher than the United States as well as California.
PovertyPoverty level is the minimum level of income deemed necessary to have an adequate standard of living in a given region. The 2013 national poverty level for a family of four is $23,550. The popula-tion of Sonoma County living below the poverty line decreased 0.1 percentage points from 2011 to 2012. Just over 12% of Sonoma County residents live below the poverty line, more than 4 points lower than the state and nation.
Unemployment RateSeasonally Unadjusted, November 2013
Source: California Employment Development Department (www.edd.ca.gov)
4
5
6
7
8
9
6.0%
Monter
ey
Santa
Barbara
U.S. N
ation
al
Califor
nia
Santa
Cruz
San Lu
is
Obispo Ve
ntura
Sonom
aNap
aMari
n
Per
cent
age
Median Sales Price of an Existing Home*Sonoma County, 2003 - August 2013
Thou
sand
s of
dol
lars
$200
$300
$400
$500
$600
$700
$800Sonoma CountyCalifornia
'13'12'11'10'09'08'07'06'05'04'03
Note: *Single Family Detached HomesSource: California Association of Realtors (www.car.org)
0%
5%
10%
15%
20%
Source: U.S. Census Bureau, American Community Survey, (www.census.gov)
Percent Below Poverty Line, 2011 & 2012 2011
2012
Monter
ey
Santa
Barbara
U.S. N
ation
al
Califor
nia
Santa
Cruz
San Lu
is
Obispo
Ventu
ra
Sonom
aNap
aMari
n
www.sonomaedb.org
6
Source: U.S. Census Bureau, American Community Survey, (www.census.gov)
Median Household Income, 2011 & 2012
$30
$40
$50
$60
$70
$80
$90
$100
Thou
sand
s of
dol
lars
Marin
Ventur
aNap
a
Sonoma
Santa
Cruz
Santa
Barbara
Califor
nia
Monter
ey
San Lu
is
Obispo
U.S. Nati
onal
20112012
EconomyIndustry EmploymentTwo of the hardest hit industries of the 2007-2009 recession were manufacturing and construction, reflecting limited capital expendi-ture and the entire global slowdown. Over the past year, following steady gains in exports and durable orders, manufacturing and construction were two of the fastest-growing industries. Over the period of 2003-2013, Sonoma County experienced employment growth in the industries of total farm, educational and health services, leisure and hospitality, and professional and business services.
Job GrowthSonoma County, along with all comparable counties, had positive job growth from November 2012 to November 2013. Nonfarm Payroll Employment, which represents the number of jobs in an area, increased by 2.1% for Sonoma County, higher than both California and the United States, helping to close the gap between the county-wide and national unemployment rate. Over the next years, the county will continue to build momentum through its specialty goods, tourism, and technology industries.
Business Establishment GrowthBusiness establishment growth is often considered an indicator of the overall business climate, as it captures both the creation and closure of firms from 2011 to 2012. High firm establishment growth is also often correlated with innovation, as startup companies frequently bring new products to market. Contrary to the rebounding economy, business establishment growth decreased in all compa-rable counties.
Businesses Establishments per 10,000 ResidentsThe number of business establishments per 10,000 residents is a measure of economic activity that counts the number of locations where business is conducted on a population-adjusted basis. Business establishments per capita is also an indicator to account for economies of agglomeration, the idea that businesses mutually benefit when located near each other. Sonoma County ranked third among comparable counties in business establishments per 10,000 residents.
www.sonomaedb.org
7
Employment in Selected IndustriesSonoma County, 2003 - 2013*
0
5000
10000
15000
20000
25000
30000
35000
August '13
'12'11'10'09'08'07'06'05'04'03
Government & Public EducationEducational & Health ServicesProfessional & Business Services
Retail TradeManufacturingLeisure and Hospitality
Construction Farm*2013 data is preliminary and updated through August 2013
Job GrowthNovember 2012 - November 2013
12 M
onth
Per
cent
age
Cha
nge
0.0%
0.5%
1.0%
1.5%
2.0%
2.5%
3.0%
3.5%
Santa
Barbara
Califor
nia
Ventur
aNap
a
Santa
Cruz
SonomaMari
n
San Lu
is
Obispo
Monter
ey
2.1%
United
Stat
es
Business Establishmentsper 10,000 Residents, Q3 2012
200
275
350
425
Source All: California Employment Development Department (www.edd.ca.gov)
363
Marin
SonomaNap
a
Califor
nia
San Lu
is
Obispo
Santa
Cruz
Santa
Barbara
Monter
ey
Ventur
a
500 Business Establishment GrowthQ3 2011 - Q3 2012
-7
-6
-5
-4
-3
-2
-1
0
Marin
Sonoma
Napa
Califor
niaSan Lu
is Obis
po
Santa
Cruz
Santa
Barbara
Monter
ey
Ventur
a
-5.9%Per
cent
age
Cha
nge
Environment
Environmental indicators provide data on energy use, water conserva-tion, and waste production. These indicators gauge relative environmen-tal performance for Sonoma County.
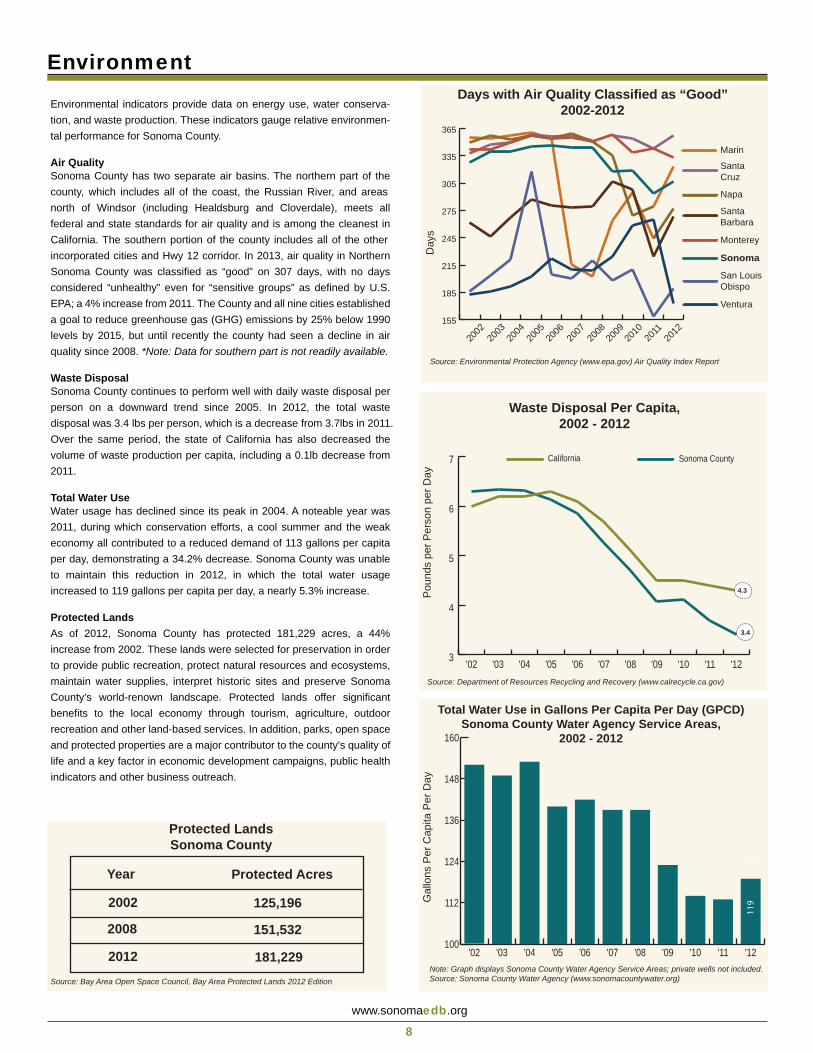
Air QualitySonoma County has two separate air basins. The northern part of the county, which includes all of the coast, the Russian River, and areas north of Windsor (including Healdsburg and Cloverdale), meets all federal and state standards for air quality and is among the cleanest in California. The southern portion of the county includes all of the other incorporated cities and Hwy 12 corridor. In 2013, air quality in Northern Sonoma County was classified as “good” on 307 days, with no days considered “unhealthy” even for “sensitive groups” as defined by U.S. EPA; a 4% increase from 2011. The County and all nine cities established a goal to reduce greenhouse gas (GHG) emissions by 25% below 1990 levels by 2015, but until recently the county had seen a decline in air quality since 2008. *Note: Data for southern part is not readily available.
Waste DisposalSonoma County continues to perform well with daily waste disposal per person on a downward trend since 2005. In 2012, the total waste disposal was 3.4 lbs per person, which is a decrease from 3.7lbs in 2011. Over the same period, the state of California has also decreased the volume of waste production per capita, including a 0.1lb decrease from 2011.
Total Water UseWater usage has declined since its peak in 2004. A noteable year was 2011, during which conservation efforts, a cool summer and the weak economy all contributed to a reduced demand of 113 gallons per capita per day, demonstrating a 34.2% decrease. Sonoma County was unable to maintain this reduction in 2012, in which the total water usage increased to 119 gallons per capita per day, a nearly 5.3% increase.
Protected LandsAs of 2012, Sonoma County has protected 181,229 acres, a 44% increase from 2002. These lands were selected for preservation in order to provide public recreation, protect natural resources and ecosystems, maintain water supplies, interpret historic sites and preserve Sonoma County's world-renown landscape. Protected lands offer significant benefits to the local economy through tourism, agriculture, outdoor recreation and other land-based services. In addition, parks, open space and protected properties are a major contributor to the county's quality of life and a key factor in economic development campaigns, public health indicators and other business outreach.
www.sonomaedb.org
8
155
185
215
245
275
305
335
365
Source: Environmental Protection Agency (www.epa.gov) Air Quality Index Report
Day
s
Days with Air Quality Classified as “Good”2002-2012
San Louis Obispo
Ventura
2008
2007
2006
2005
2004
2003
2002
Marin
SantaCruz
Napa
Santa Barbara
Monterey
Sonoma
2009
2010
2011
2012
3
4
5
6
7
'12'11'10'09'08'07'06'05'04'03'02
Pou
nds
per P
erso
n pe
r Day
Waste Disposal Per Capita,2002 - 2012
Source: Department of Resources Recycling and Recovery (www.calrecycle.ca.gov)
California Sonoma County
4.3
3.4
Total Water Use in Gallons Per Capita Per Day (GPCD)Sonoma County Water Agency Service Areas,
2002 - 2012
100
112
124
136
148
160
'12'11'10'09'08'07'06'05'04'03'02
119G
allo
ns P
er C
apita
Per
Day
Note: Graph displays Sonoma County Water Agency Service Areas; private wells not included.Source: Sonoma County Water Agency (www.sonomacountywater.org)
17
Protected LandsSonoma County
Year Protected Acres
2002 125,196
2008 151,532
2012 181,229Source: Bay Area Open Space Council, Bay Area Protected Lands 2012 Edition
Health
www.sonomaedb.org
9
Health indicators provide information on health care, causes of death, and youth alcohol consumption in Sonoma Count y. These statistics offer a glimpse into the health and wellness of the county, particularly in comparison to California.
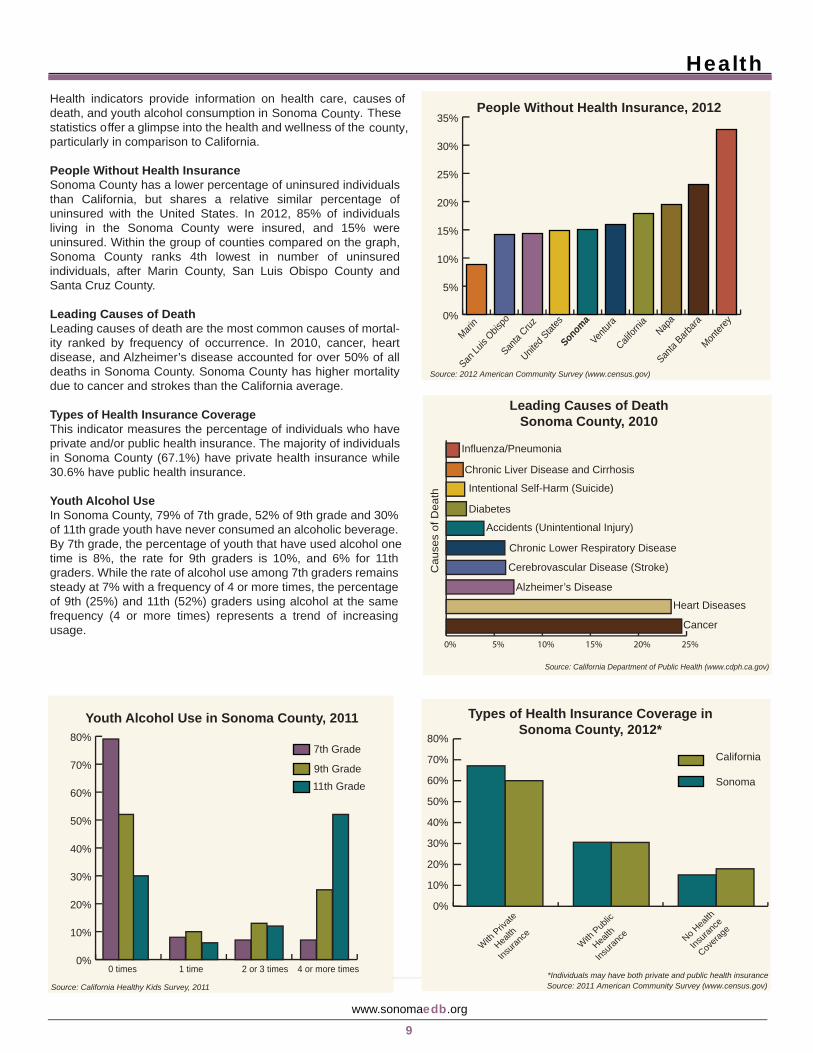
People Without Health Insurance Sonoma County has a lower percentage of uninsured individuals than California, but shares a relative similar percentage of uninsured with the United States. In 2012, 85% of individuals living in the Sonoma County were insured, and 15% were uninsured. Within the group of counties compared on the graph, Sonoma County ranks 4th lowest in number of uninsured individuals, after Marin County, San Luis Obispo County and Santa Cruz County.
Leading Causes of DeathLeading causes of death are the most common causes of mortal-ity ranked by frequency of occurrence. In 2010, cancer, heart disease, and Alzheimer’s disease accounted for over 50% of all deaths in Sonoma County. Sonoma County has higher mortality due to cancer and strokes than the California average.
Types of Health Insurance CoverageThis indicator measures the percentage of individuals who have private and/or public health insurance. The majority of individuals in Sonoma County (67.1%) have private health insurance while 30.6% have public health insurance. Youth Alcohol UseIn Sonoma County, 79% of 7th grade, 52% of 9th grade and 30% of 11th grade youth have never consumed an alcoholic beverage. By 7th grade, the percentage of youth that have used alcohol one time is 8%, the rate for 9th graders is 10%, and 6% for 11th graders. While the rate of alcohol use among 7th graders remains steady at 7% with a frequency of 4 or more times, the percentage of 9th (25%) and 11th (52%) graders using alcohol at the same frequency (4 or more times) represents a trend of increasing usage.
People Without Health Insurance, 2012
Source: 2012 American Community Survey (www.census.gov)
0%
5%
10%
15%
20%
25%
30%
35%
Napa
Santa
Barbara
Sonoma
Santa
Cruz
Califor
nia
Ventur
a
Marin
San Lu
is Obis
po
Monter
ey
United
States
Cau
ses
of D
eath
Source: California Department of Public Health (www.cdph.ca.gov)
Leading Causes of DeathSonoma County, 2010
Chronic Liver Disease and Cirrhosis
Intentional Self-Harm (Suicide)
Diabetes
Alzheimer’s Disease
Influenza/Pneumonia
Chronic Lower Respiratory Disease
Cancer
Heart Diseases
Accidents (Unintentional Injury)
Cerebrovascular Disease (Stroke)
0% 5% 10% 15% 20% 25%
Youth Alcohol Use in Sonoma County, 2011
Source: California Healthy Kids Survey, 2011
0%
10%
20%
30%
40%
50%
60%
70%
80%
11th Grade9th Grade
7th Grade
4 or more times2 or 3 times1 time0 times
0%
10%
20%
30%
40%
50%
60%
70%
80%
California
Sonoma
Source: 2011 American Community Survey (www.census.gov)
Types of Health Insurance Coverage in Sonoma County, 2012*
With Priv
ate
Health
Insura
nce No H
ealth
Insura
nce
Covera
ge
With Pub
lic
Health
Insura
nce
*Individuals may have both private and public health insurance
SocietySociety indicators include education levels, demographic trends and crime rates. These indicators illustrate relative performance in quality of education, safety and demographic trends.
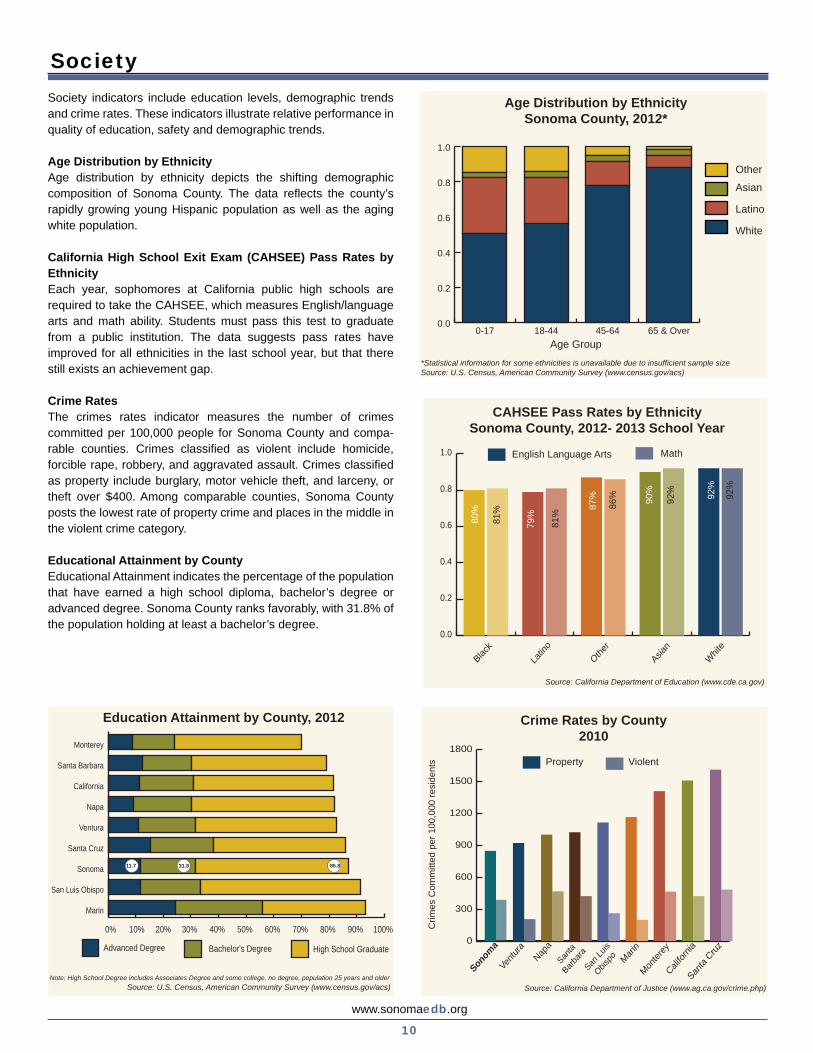
Age Distribution by Ethnicity Age distribution by ethnicity depicts the shifting demographic composition of Sonoma County. The data reflects the county’s rapidly growing young Hispanic population as well as the aging white population.
California High School Exit Exam (CAHSEE) Pass Rates by EthnicityEach year, sophomores at California public high schools are required to take the CAHSEE, which measures English/language arts and math ability. Students must pass this test to graduate from a public institution. The data suggests pass rates have improved for all ethnicities in the last school year, but that there still exists an achievement gap.
Crime RatesThe crimes rates indicator measures the number of crimes committed per 100,000 people for Sonoma County and compa-rable counties. Crimes classified as violent include homicide, forcible rape, robbery, and aggravated assault. Crimes classified as property include burglary, motor vehicle theft, and larceny, or theft over $400. Among comparable counties, Sonoma County posts the lowest rate of property crime and places in the middle in the violent crime category.
Educational Attainment by County Educational Attainment indicates the percentage of the population that have earned a high school diploma, bachelor’s degree or advanced degree. Sonoma County ranks favorably, with 31.8% of the population holding at least a bachelor’s degree.
Age Distribution by EthnicitySonoma County, 2012*
*Statistical information for some ethnicities is unavailable due to insufficient sample sizeSource: U.S. Census, American Community Survey (www.census.gov/acs)
0.0
0.2
0.4
0.6
0.8
1.0
Other
Asian
Latino
White
65 & Over45-6418-440-17Age Group
0.0
0.2
0.4
0.6
0.8
1.0
Whit
eAsia
nOthe
r
Latin
oBlac
k
CAHSEE Pass Rates by EthnicitySonoma County, 2012- 2013 School Year
Source: California Department of Education (www.cde.ca.gov)
MathEnglish Language Arts
81%
80%
81%
79%
86%
87% 92
%
90% 92%
92%
Source: U.S. Census, American Community Survey (www.census.gov/acs)
Education Attainment by County, 2012
0% 10% 20% 30% 40% 50% 60% 70% 80% 90% 100%
High School GraduateBachelor's DegreeAdvanced Degree
Marin
San Luis Obispo
Sonoma
Santa Cruz
Ventura
Napa
California
Santa Barbara
Monterey
86.831.811.7
Note: High School Degree includes Associates Degree and some college, no degree, population 25 years and older
www.sonomaedb.org
10
Source: California Department of Justice (www.ag.ca.gov/crime.php)
Crime Rates by County2010
Crim
es C
omm
itted
per
100
,000
resi
dent
s
0
300
600
900
1200
1500
1800ViolentProperty
Sonom
a
Ventu
raSan
ta
BarbaraNap
a
San Lu
is
Obispo Mari
n
Monter
ey
Califor
nia
Santa
Cruz
0.9%
www.sonomaedb.org
11
WorkforceWorkforce indicators provide information on demographic trends, employment concentration and growth in Sonoma County. These indicators illustrate opportunities and challenges for the county’s workforce.
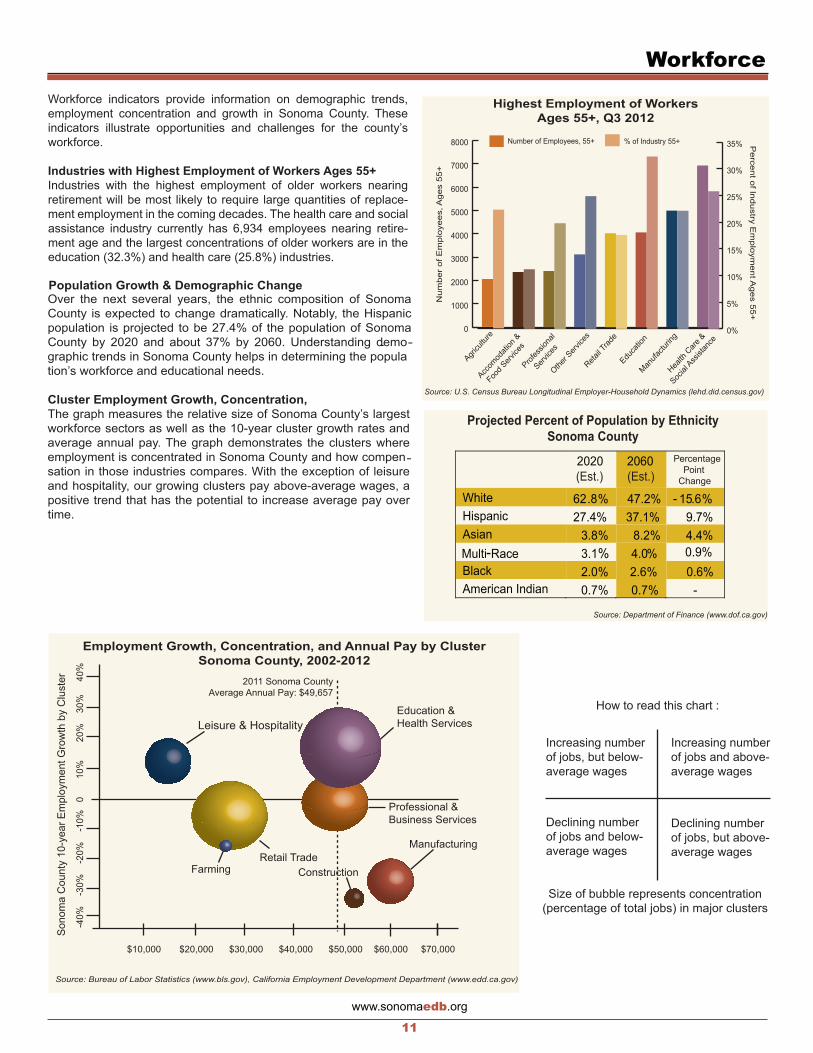
Industries with Highest Employment of Workers Ages 55+Industries with the highest employment of older workers nearing retirement will be most likely to require large quantities of replace-ment employment in the coming decades. The health care and social assistance industry currently has 6,934 employees nearing retire-ment age and the largest concentrations of older workers are in the education (32.3%) and health care (25.8%) industries.
Population Growth & Demographic ChangeOver the next several years, the ethnic composition of Sonoma County is expected to change dramatically. Notably, the Hispanic population is projected to be 27.4% of the population of Sonoma County by 2020 and about 37% by 2060. Understanding demo- -graphic trends in Sonoma County helps in determining the population’s workforce and educational needs.
Cluster Employment Growth, Concentration, The graph measures the relative size of Sonoma County’s largestworkforce sectors as well as the 10-year cluster growth rates and average annual pay. The graph demonstrates the clusters whereemployment is concentrated in Sonoma County and how compen-sation in those industries compares. With the exception of leisure and hospitality, our growing clusters pay above-average wages, apositive trend that has the potential to increase average pay overtime.
Highest Employment of WorkersAges 55+, Q3 2012
Source: U.S. Census Bureau Longitudinal Employer-Household Dynamics (lehd.did.census.gov)
Num
ber
of E
mpl
oyee
s, A
ges
55+
0
1000
2000
3000
4000
5000
6000
7000
8000
0%
5%
10%
15%
20%
25%
30%
35%% of Industry 55+Number of Employees, 55+
Retail T
rade
Manufa
cturin
g
Profes
siona
l
Service
s
Accom
odati
on &
Food S
ervice
s
Other S
ervice
s
Health
Care
&
Social
Assist
ance
Agricu
lture
Educa
tion
Percent of Industry E
mploym
ent Ages 55+
Projected Percent of Population by Ethnicity Sonoma County
2020(Est.)
2060(Est.)
Percentage Point
Change
White 62.8% 47.2% - 15.6%Hispanic 27.4% 37.1% 9.7%Asian 3.8% 8.2 % 4.4%Multi-Race 3.1% 4.0% 0.9%Black 2.0% 2.6% 0.6%American Indian 0.7% 0.7% -
Source: Department of Finance (www.dof.ca.gov)
Source: Bureau of Labor Statistics (www.bls.gov), California Employment Development Department (www.edd.ca.gov)
Sono
ma
Cou
nty
10-y
ear E
mpl
oym
ent G
row
th b
y C
lust
er
-40
%
-30%
-2
0%
-10%
0
10%
20%
3
0%
40%
Employment Growth, Concentration, and Annual Pay by ClusterSonoma County, 2002-2012
$10,000 $20,000 $30,000 $40,000 $50,000 $60,000 $70,000
Farming
Education & Health Services
Professional &Business Services
Construction
Manufacturing
Leisure & Hospitality
Retail Trade
2011 Sonoma CountyAverage Annual Pay: $49,657
How to read this chart :
Increasing number Increasing number of jobs, but below- of jobs and above- average wages average wages
Declining number Declining number of jobs and below- of jobs, but above- average wages average wages
Size of bubble represents concentration (percentage of total jobs) in major clusters
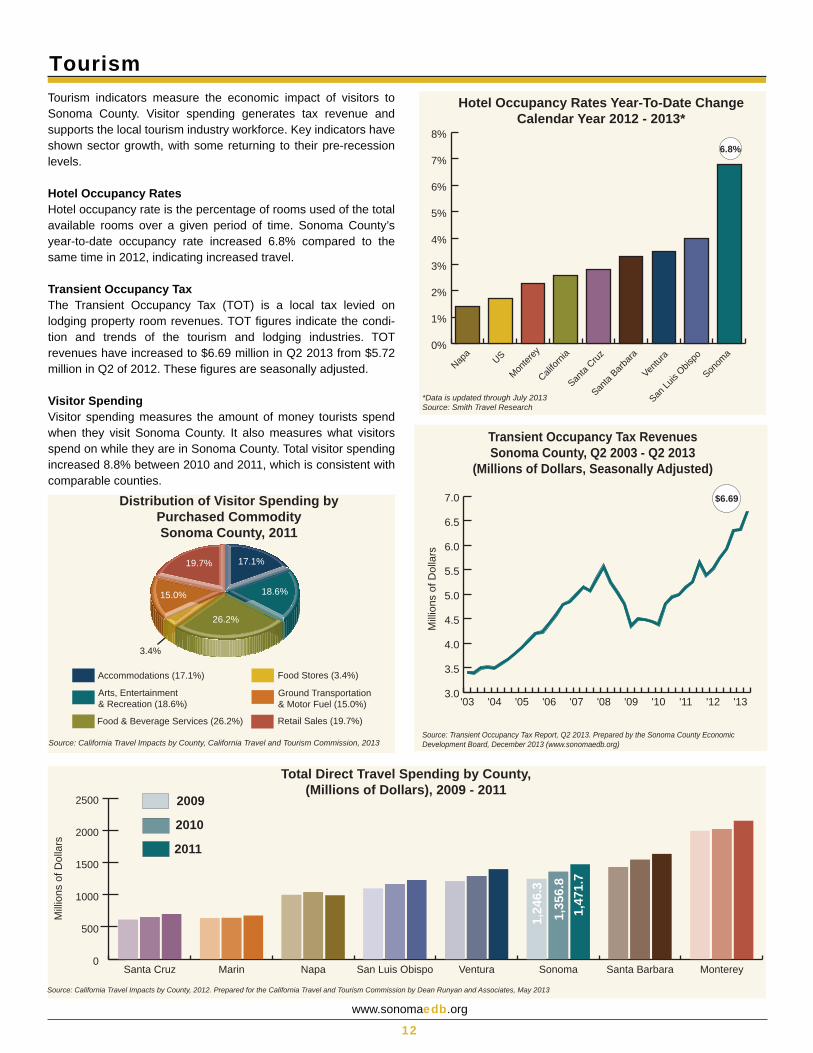
TourismTourism indicators measure the economic impact of visitors to Sonoma County. Visitor spending generates tax revenue and supports the local tourism industry workforce. Key indicators have shown sector growth, with some returning to their pre-recession levels.
Hotel Occupancy RatesHotel occupancy rate is the percentage of rooms used of the total available rooms over a given period of time. Sonoma County’s year-to-date occupancy rate increased 6.8% compared to the same time in 2012, indicating increased travel.
Transient Occupancy TaxThe Transient Occupancy Tax (TOT) is a local tax levied on lodging property room revenues. TOT figures indicate the condi-tion and trends of the tourism and lodging industries. TOT revenues have increased to $6.69 million in Q2 2013 from $5.72 million in Q2 of 2012. These figures are seasonally adjusted.
Visitor SpendingVisitor spending measures the amount of money tourists spend when they visit Sonoma County. It also measures what visitors spend on while they are in Sonoma County. Total visitor spending increased 8.8% between 2010 and 2011, which is consistent with comparable counties.
www.sonomaedb.org
12
Hotel Occupancy Rates Year-To-Date ChangeCalendar Year 2012 - 2013*
*Data is updated through July 2013Source: Smith Travel Research
0%
1%
2%
3%
4%
5%
6%
7%
8%
Sonom
a
Ventur
a
San Lu
is Obis
po
Santa
Barbara
Santa
Cruz
Califor
nia
Monter
eyUSNap
a
6.8%
Source: California Travel Impacts by County, California Travel and Tourism Commission, 2013
Distribution of Visitor Spending by Purchased CommoditySonoma County, 2011
Retail Sales (19.7%)
Ground Transportation & Motor Fuel (15.0%)
Food Stores (3.4%)
Food & Beverage Services (26.2%)
Arts, Entertainment& Recreation (18.6%)
Accommodations (17.1%)
17.1%
18.6%
26.2%
19.7%
15.0%
3.4%
Transient Occupancy Tax RevenuesSonoma County, Q2 2003 - Q2 2013
(Millions of Dollars, Seasonally Adjusted)
Source: Transient Occupancy Tax Report, Q2 2013. Prepared by the Sonoma County Economic
3.0
3.5
4.0
4.5
5.0
5.5
6.0
6.5
7.0
'13'12'11'10'09'08'07'06'05'04'03
Mill
ions
of D
olla
rs
$6.69
Development Board, December 2013 (www.sonomaedb.org)
Source: California Travel Impacts by County, 2012. Prepared for the California Travel and Tourism Commission by Dean Runyan and Associates, May 2013
Total Direct Travel Spending by County,(Millions of Dollars), 2009 - 2011
0
500
1000
1500
2000
2500
MontereySanta BarbaraSonomaVenturaSan Luis ObispoNapaMarinSanta Cruz
Mill
ions
of D
olla
rs
1,35
6.8
1,24
6.3
1,47
1.7
2009
2010
2011
Methodology, Sources, and Notes
www.sonomaedb.org
13
Note on Data Sources
The 2014 Sonoma County Indicators provides a comparative study on various economic, demographic, environmental, and social aspects of Sonoma County. Economic Develop-ment Board (EDB) research originates from information avail-able from outside resources and previously published mate-rial. The 2014 Sonoma County Indicators offer partial or composite representations of raw data and cite respective source data sets. For more information, please see the listed sources.
The Indicators do not provide complete in depth analyses of all facets of Sonoma County. The EDB believes all data contained within this report to be accurate and the most current available, but does not guarantee its accuracy or completeness. Use of data from an outside source does not represent an endorsement of any product or service by the EDB, its members or affiliates.
The 2014 Sonoma County Indicators was developed from national and local data sources. Its content is based on models of similar reports from comparable regions around the country, combined with input from various agencies and organizations within the county. The Sonoma County EDB appreciates organizations that have pioneered approaches used in the 2013 Sonoma County Indicators report and is grateful to those who provided feedback.
Interested readers are encouraged to contact data source agencies or organizations for further research or visit our website www.sonomaedb.org for the unabridged version of Indicators released in Spring 2014. Readers are also invited to suggest indicators for future reports by calling (707) 565-7170 or e-mailing [email protected].
Sources
Bay Area Real Estate Information Services, Inc.California Association of RealtorsCalifornia Department of EducationCalifornia Department of FinanceCalifornia Department of Public HealthCalifornia Department of Health ServicesCalifornia Department of JusticeCalifornia Department of Resources Recycling RecoveryCalifornia Employment Development DepartmentCalifornia Postsecondary Education Commission California Travel & Tourism CommissionDean Runyan & AssociatesMoody’s AnalyticsMycoolbackgrounds.comRobert Holmes PhotographySmith Travel ResearchSonoma County Agricultural and Open Space DistrictSonoma County Economic Development BoardSonoma County Water AgencyUCLA California Health Interview Survey United States Bureau of the CensusUnited States Bureau of Labor StatisticsUnited States Environmental Protection Agency
Index Methodology
An index is an economic tool that is used to make general comparisons across a range of metrics.
For the competitiveness indices, each indicator was divided by the average value for California and then multiplied by 100. The total index figure was calculated by averaging, with equal weight, each indicator in the index.
The metrics were selected after evaluating other indices, namely the 2010 Regional Economic Scorecard produced by the Charleston Regional Development Alliance. The competi-tive indices, combined with the other indicators, can provide a more comprehensive understanding of trends in Sonoma County.
Indicators TeamThe 2014 Sonoma County Indicators was prepared by the Economic Development Board project coordinators.
Palista Kharel was the project lead, managed and edited the report’s overall layout and content. She specifically gathered data and prepared both the Economy section and the Indicator’s ‘Competitiveness Indexes’, with acknowledgment to Moody’s Analyt-ics and California Employment Development Department.
Hanna Berglund was responsible for the research and preparation of the Tourism and Society sections, with acknowledgment to Sonoma County Tourism and the California Travel and Tourism Commission reports published by Smith Travel Research.
Andres Peña gathered data and published both the Workforce, Health and Environment sections, with acknowledgment to the State of California Economic Development Department, Sonoma County Health Services, Sonoma County Agricultural Preserva-tion and Open Space District, and Sonoma County Water Agency.
With acknowledgement and appreciation to local key businessessupporting Sonoma County Economic Development:
Director
Sponsors
Executive
RE PUBLIC
CALIFORNIA
A G R I C U LT U R EI N D U S T R Y
R E C R E A T I O N
SONOMA COUN
TY
■ County of Sonoma Board of Supervisors Sonoma County Health Services
Economic Development Board141 Stony Circle, Suite 110Santa Rosa, CA 95401(707) 565-7170www.sonomaedb.org