Embed Size (px)
Citation preview
<This page deliberately left blank>
GUIDE TO THE BUDGET PAPERS
STRUCTURE AND CONTENT OF THE 2015-16 BUDGET PAPERS
BUDGET REVIEW
The purpose of the Budget Review is to provide updated information to allow an assessment of the Government’s financial performance against its financial policy objectives and strategies as set out in the previous Budget.
ISSN 1327-581X
© Australian Capital Territory, Canberra December 2015
Publication No 15/1264
Material in this publication may be reproduced provided due acknowledgement is made.
Produced for the Chief Minister, Treasury and Economic Development Directorate by Publishing Services.
Enquiries about this publication should be directed to the Chief Minister, Treasury and Economic Development Directorate, GPO Box 158, Canberra City, 2601
http://www.act.gov.au/budget
Telephone: Canberra 13ACT1 or 13 22 81
2015-16 Budget Review i
TABLE OF CONTENTSPage No.
Introduction 1
Overview 3
Chapter 1 Economic Performance and Outlook 7
1.1 Economic Overview 9
1.2 International Economic Outlook 11
1.3 Australian Economic Outlook 13
1.4 ACT Economic Outlook 15
1.5 Risks to the Economic Outlook 19
Chapter 2 Budget Outlook and Fiscal Strategy 21
2.1 Budget Outlook 23
2.2 Fiscal Strategy 29
2.3 Loose-fill Asbestos Insulation Eradication Scheme – Financial Details
35
2.4 New Initiatives 37
Chapter 3 Infrastructure and Capital 39
3.1 Capital Works 41
Chapter 4 Federal Financial Relations 43
4.1 Federal Financial Relations Update 45
2015-16 Budget Review ii Table of Contents
TABLE OF CONTENTSPage No.
Chapter 5 Asset and Liability Management 47
5.1 Net Debt and Net Financial Liabilities 49
5.2 Unfunded Superannuation Liability 51
5.3 Borrowings 53
Chapter 6 General Government Sector Financial Statements 55
6.1 GGS GFS/GAAP Harmonised Financial Statements 57
Appendices 69
A Re-profiled Capital Works Projects 71
B Statement of Risks 77
C Public Trading Enterprises Financial Statements 83
D Total Territory Financial Statements 93
E Loan Council Allocation and Nomination 103
2015-16 Budget Review iii Table of Contents
INTRODUCTION
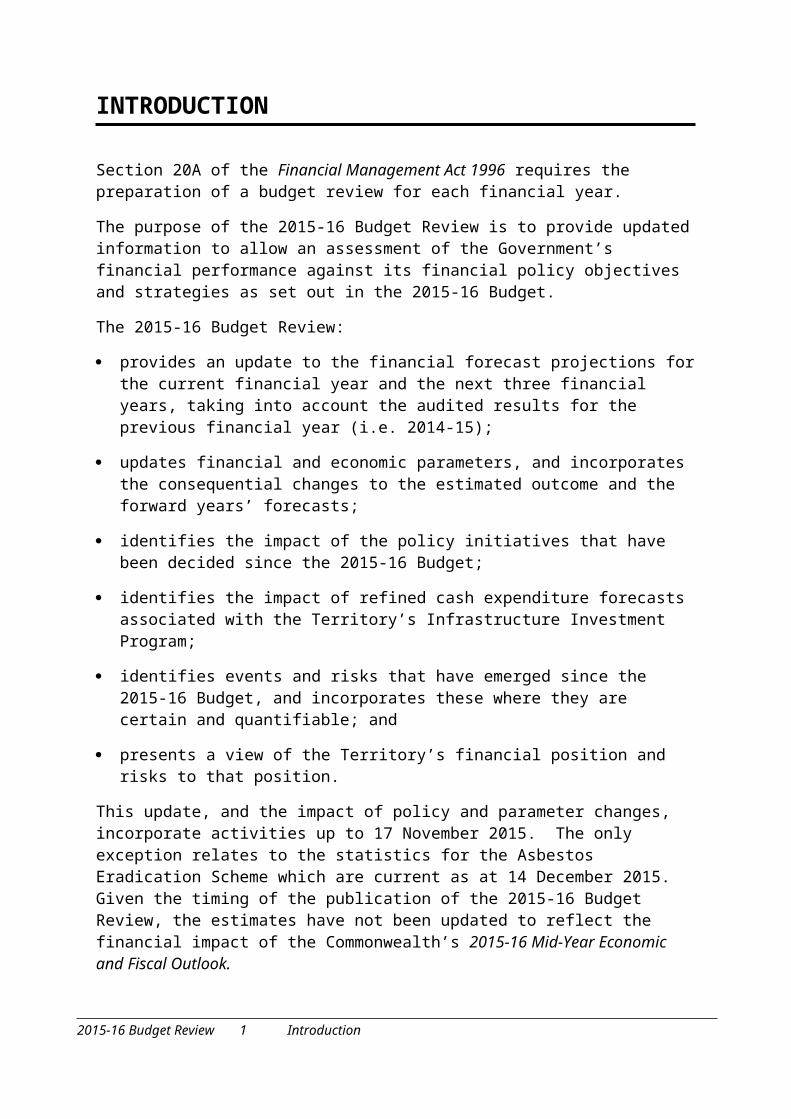
Section 20A of the Financial Management Act 1996 requires the preparation of a budget review for each financial year.
The purpose of the 2015-16 Budget Review is to provide updated information to allow an assessment of the Government’s financial performance against its financial policy objectives and strategies as set out in the 2015-16 Budget.
The 2015-16 Budget Review:
provides an update to the financial forecast projections for the current financial year and the next three financial years, taking into account the audited results for the previous financial year (i.e. 2014-15);
updates financial and economic parameters, and incorporates the consequential changes to the estimated outcome and the forward years’ forecasts;
identifies the impact of the policy initiatives that have been decided since the 2015-16 Budget;
identifies the impact of refined cash expenditure forecasts associated with the Territory’s Infrastructure Investment Program;
identifies events and risks that have emerged since the 2015-16 Budget, and incorporates these where they are certain and quantifiable; and
presents a view of the Territory’s financial position and risks to that position.
This update, and the impact of policy and parameter changes, incorporate activities up to 17 November 2015. The only exception relates to the statistics for the Asbestos Eradication Scheme which are current as at 14 December 2015. Given the timing of the publication of the 2015-16 Budget Review, the estimates have not been updated to reflect the financial impact of the Commonwealth’s 2015-16 Mid-Year Economic and Fiscal Outlook.
This report also contains Uniform Presentation Framework statements consistent with the Territory’s Australian Loan Council reporting obligations. Where significant issues have been identified, but are not certain, or are unable to be quantified with reasonable certainty, they have been identified as potential risks to the estimates. These risks may have either positive or negative budgetary implications.
2015-16 Budget Review 1 Introduction
2015-16 Budget Review 2 Introduction
OVERVIEW
The 2015-16 Budget Review confirms that the Government is on track to deliver its fiscal strategy and that it continues to manage the ACT’s public finances in a prudent manner; supporting the Territory’s economy in the short term, returning the budget to balance over the medium term, and investing in infrastructure to support long-run growth and prosperity.
The Government is achieving its vision for Canberra, despite the uncertain economic environment against which the 2015-16 Budget was framed. While facing financial pressures arising from reductions in Commonwealth grants, including cuts to health funding and reductions in the ACT’s share of the Goods and Services Tax, as well as the costs of the Asbestos Eradication Scheme, the Government continues to provide significant support to the Canberra community.
The investments the Government announced in the 2015-16 Budget continue to progress. The total cost of services provided by the ACT Government will amount to $5.1 billion in 2015-16. In addition, the ACT Government will invest $760 million in new infrastructure. These investments will provide stability and boost employment in this challenging economic climate. These outlays, and those of prior budgets, are bolstering our economy and, to some extent, have mitigated against the Commonwealth Government’s fiscal consolidation and job losses.
Economic growth, as measured by Gross State Product, increased by 1.4 per cent in 2014-15, double the 2013-14 result of 0.7 per cent. This result indicates a moderate recovery in the ACT’s economy, though it remains significantly below the long-run (20 year) average of 2.6 per cent.
Expanding upon prior years, the 2015-16 Budget focused on the themes of health and education; economic growth and diversification; suburban renewal and transport; and liveability and social inclusion. These are more than concepts – we see the effects of these investments in the quality of our schools, our hospitals, our roads, and our parks and reserves every day. Less visible, but just as important, are the services delivered daily across the Territory, ranging from helping those in need of domestic violence support services, to addressing homelessness, to providing coordinated and connected transport networks, to promoting innovation in local businesses and helping them thrive by making it easier to do business in Canberra.
In September 2015, international ratings agency Standard & Poor’s reaffirmed the ACT’s AAA long term and A-1+ short term credit ratings with the rating outlook retained as stable. The reaffirmation of the Territory’s credit rating demonstrates that the Government’s economic and fiscal strategies continue to successfully support the economy and the Canberra community.
2015-16 Budget Review 3 Overview

The Government’s Asbestos Eradication Scheme continues work towards eradication of the ongoing risk of asbestos exposure through the demolition of affected properties. By 14 December 2015, the Taskforce had worked with homeowners to secure the purchase of 964 properties as part of the Voluntary Buyback Scheme. Fifty-four properties have now been demolished.
The Scheme has come at a significant cost to the Territory’s General Government Sector (GGS) Headline Net Operating Balance (HNOB) reducing it by $358.6 million in 2014-15. While the cost of the Scheme remains broadly in line with the estimates in the 2015-16 Budget, the financial and cash impacts are based on a number of assumptions (e.g. demolition and remediation costs, and land sales forecasts) that will be refined as the Scheme progresses.
The financial position of the 2015-16 Budget Review remains broadly consistent with that of the 2015-16 Budget. Omitting impacts associated with the Asbestos Eradication Scheme, the revised GGS HNOB is estimated to be a deficit of $396.2 million in 2015-16, with a total net increase to the forecast deficit (including Asbestos Eradication Scheme impacts) across the four financial years of $99.6 million. This movement is driven almost entirely by a revised 2014-15 superannuation liability valuation. This variation, which is the result of the current low level of interest rates, is technical in nature, involves no additional cash outlays, and is similar to that which has occurred in recent years. The 2015-16 Budget Review contains no new spending initiatives and, as such, there is no need for a Supplementary Appropriation Bill. Two new revenue initiatives are detailed in Chapter 2, Section 2.4.
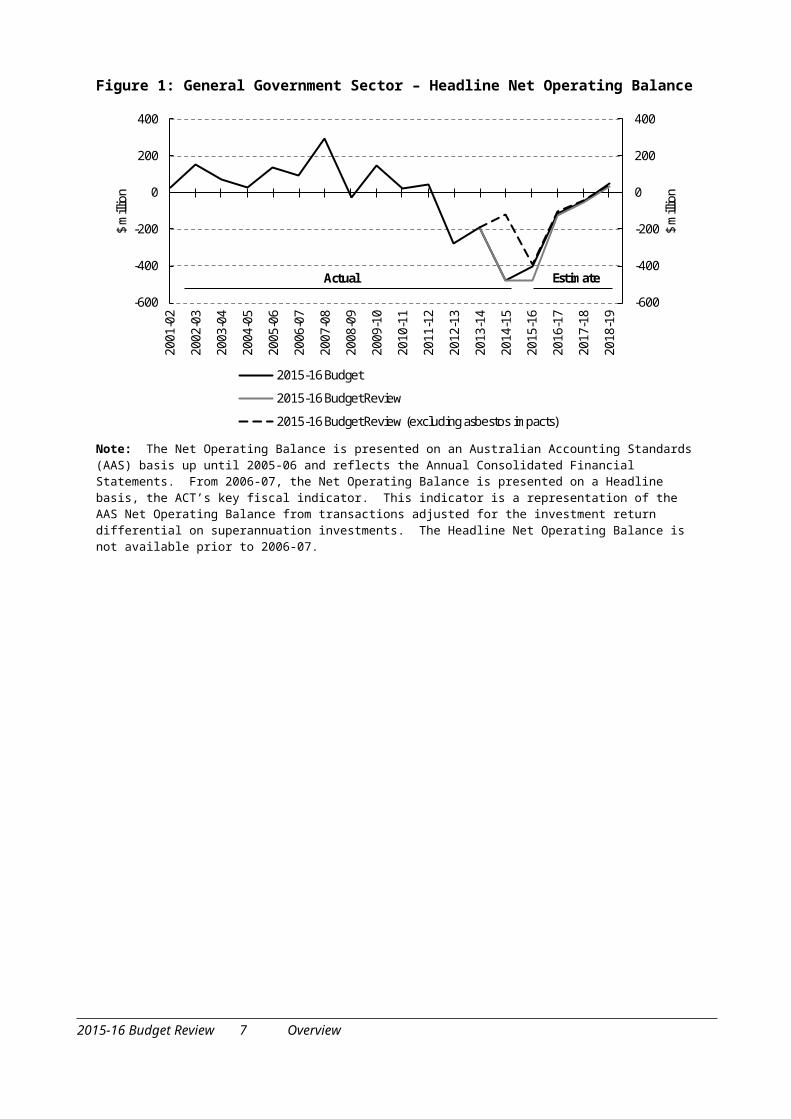
Figure 1: General Government Sector – Headline Net Operating Balance
-600
-400
-200
0
200
400
-600
-400
-200
0
200
400
2001
-02
2002
-03
2003
-04
2004
-05
2005
-06
2006
-07
2007
-08
2008
-09
2009
-10
2010
-11
2011
-12
2012
-13
2013
-14
2014
-15
2015
-16
2016
-17
2017
-18
2018
-19
$ m
illio
n
$ m
illio
n
2015-16 Budget
2015-16 Budget Review
2015-16 Budget Review (excluding asbestos impacts)
EstimateActual
Note: The Net Operating Balance is presented on an Australian Accounting Standards (AAS) basis up until 2005-06 and reflects the Annual Consolidated Financial Statements. From 2006-07, the Net Operating Balance is presented on a Headline basis, the ACT’s key fiscal indicator. This indicator is a representation of the AAS Net Operating Balance from transactions adjusted for the investment return differential on superannuation investments. The Headline Net Operating Balance is not available prior to 2006-07.
2015-16 Budget Review 4 Overview
The Way AheadThe Government remains committed to its fiscal strategy objectives of: sustainable economic growth; sound public finances; quality and efficient services; sustainable taxation revenue; and a strong balance sheet. The Government will continue to manage the Territory’s public finances in a sensible manner, achieving an operating balance over time, offsetting temporary deficits with surpluses in other periods. This goal of achieving an operating balance over the medium term provides the Government with the necessary flexibility to adapt to changes in our economic climate.
We remain on track to return to a balanced budget in 2018-19, and our extensive capital program will continue to provide support to the local economy, providing investment certainty for industry, but also providing local jobs.
The Government will continue to manage debt prudently, aiming to fully fund the Territory’s unfunded superannuation liability by 2030, maintain the AAA credit rating in the long term, and ensure that taxation revenue remains at sustainable levels. The Government remains committed to a taxation system that is fair, simple and progressively more efficient over time. These elements combined will provide the foundation for a considered 2016-17 Budget, and will deliver budgets into the future that balance the needs of our economy, maintain sound public finances, and provide investment for the future of our modern and evolving city.
2015-16 Budget Review 5 Overview
2015-16 Budget Review 6 Overview
CHAPTER 1
ECONOMIC PERFORMANCE AND OUTLOOK
Chapter Page
1.1 Economic Overview 9
1.2 International Economic Outlook 11
1.3 Australian Economic Outlook 13
1.4 ACT Economic Outlook 15
1.5 Risks to the Economic Outlook 19
2015-16 Budget Review 7 Economic Performance and Outlook
2015-16 Budget Review 8 Economic Performance and Outlook
1.1 ECONOMIC OVERVIEW
Since the 2015-16 Budget, the ACT economy has staged a modest recovery in line with the 2015-16 Budget forecasts. Economic growth was 1.4 per cent in 2014-15, double the rate of 2013-14, though still around half of its long term average.
Other indicators of economic activity, such as Retail Trade and Housing Finance, have also shown improvement, though labour market conditions remain weaker than expected. It is anticipated that the ending of the Commonwealth Government hiring freeze on 1 July 2015 and a pickup in Australian Public Service and broader internet job vacancies will contribute to improved labour market conditions going forward.
The national economy has remained resilient in the face of weak international conditions and large falls in mining related investment, with outcomes in the latter half of 2015 – employment growth in particular – remaining solid. The low Australian dollar and historically low interest rates are expected to continue to support growth going forward.
Since the 2015-16 Budget, the International Monetary Fund has downgraded its forecasts for global economic growth, reflecting a weaker outlook for developing economies. Downside risks to the global outlook are also considered to have risen, due to declining commodity prices as well as increased financial market volatility and pressure on emerging market currencies.
2015-16 Budget Review 9 Economic Overview
2015-16 Budget Review 10 Economic Overview
1.2 INTERNATIONAL ECONOMIC OUTLOOK
Global economic growth declined in the first half of 2015, and is now expected by the International Monetary Fund (IMF) to grow at a slightly lower rate than was anticipated at the 2015-16 Budget.
In the first half of 2015, the United States growth was positive, although slightly weaker than was expected, leading to downward revisions to growth forecasts in 2015 and 2016. Economic growth in Japan was also weaker than anticipated, with consumption and exports falling short of expectations, with growth forecasts for 2015 and 2016 revised down accordingly. Recovery in Europe is in line with forecasts, with growth in Italy, Ireland and Spain stronger than anticipated, leaving forecasts for 2015 unchanged.
The growth slowdown in China has proceeded broadly in line with forecasts, though effects on China’s trading partners have been larger than anticipated – reflected in weakening commodity prices. China’s growth forecast for 2015 remains essentially unchanged, though slightly lower in 2016.
More broadly, the IMF estimates that the weak commodity price outlook could subtract close to a percentage point from commodity exporters’ annual economic growth over the next 12-18 months, as compared with 2012-2014 – with a larger effect for energy exporters. Moreover, this slowdown is considered to have a long-lived, structural component, and will weigh on potential economic growth in these economies.
2015-16 Budget Review 11 International Economic Outlook
2015-16 Budget Review 12 International Economic Outlook
1.3 AUSTRALIAN ECONOMIC OUTLOOK
The Australian economy is continuing to expand, despite large falls in mining related investment from the end of the mining boom. Although weak international conditions continue to place downward pressure on commodity prices (the Reserve Bank of Australia’s Commodity Price Index has declined 11 per cent through the year to November 2015), export volumes of non-rural commodities have continued to grow, as previous investment in supply capacity comes online.
The decline in the value of the Australian dollar has led to higher net exports, driven by both exports and a fall in imports of investment related goods and materials. Overall, though, Australia’s terms of trade have still declined by around 10 per cent over the past year, necessarily leading to a decline in households’ purchasing power.
Recent partial indicators of economic activity, such as Retail Trade and those for housing activity, assisted by historically low interest rates, point to moderate economic growth going forward. Stronger than expected employment growth and rising job vacancies also support the view of a ‘soft landing’ from the end of the mining boom, though with downside risks to this central case.
2015-16 Budget Review 13 Australian Economic Outlook
2015-16 Budget Review 14 Australian Economic Outlook
1.4 ACT ECONOMIC OUTLOOK
The ACT experienced solid economic growth of 1.4 per cent in 2014-15 despite the loss of almost 7,000 ACT based Australian Public Service jobs over the two years to June 2015. While the 2015-16 Budget Review forecasts represent a downgrading from expectations at the time of the 2015-16 Budget, they still show a moderate recovery in 2015-16, which gains pace in 2016-17.
Outcomes for Gross State Product, wages, inflation and population growth for 2014-15 were all in line with the 2015-16 Budget forecasts. Employment fell by 0.6 per cent, compared to the expected fall of ¼ per cent, in part, as a result of the front loading of the Commonwealth job cuts over the space of two years, rather than three. These job cuts represented around 3.3 per cent of total jobs in the ACT, making them proportionally larger than the losses experienced by the ACT in 1996-98.
Growth in State Final Demand was also lower than expected in 2014-15 as a result of lower than expected Commonwealth Government consumption expenditure.
In 2015-16, forecasts for a number of indicators have been modestly downgraded, reflecting to a degree subdued September quarter 2015 outcomes. Nevertheless, Gross State Product is expected to have slightly stronger performance in 2015-16 than expected at the time of the 2015-16 Budget, on the back of the forecast turnaround from negative to positive employment growth over the course of 2014-15 to 2015-16.
Table 1.4.1 shows the 2015-16 Budget Review forecasts for major economic parameters. The numbers in brackets represent the change in the forecast from the 2015-16 Budget to the 2015-16 Budget Review for the years 2014-15 and 2015-16.
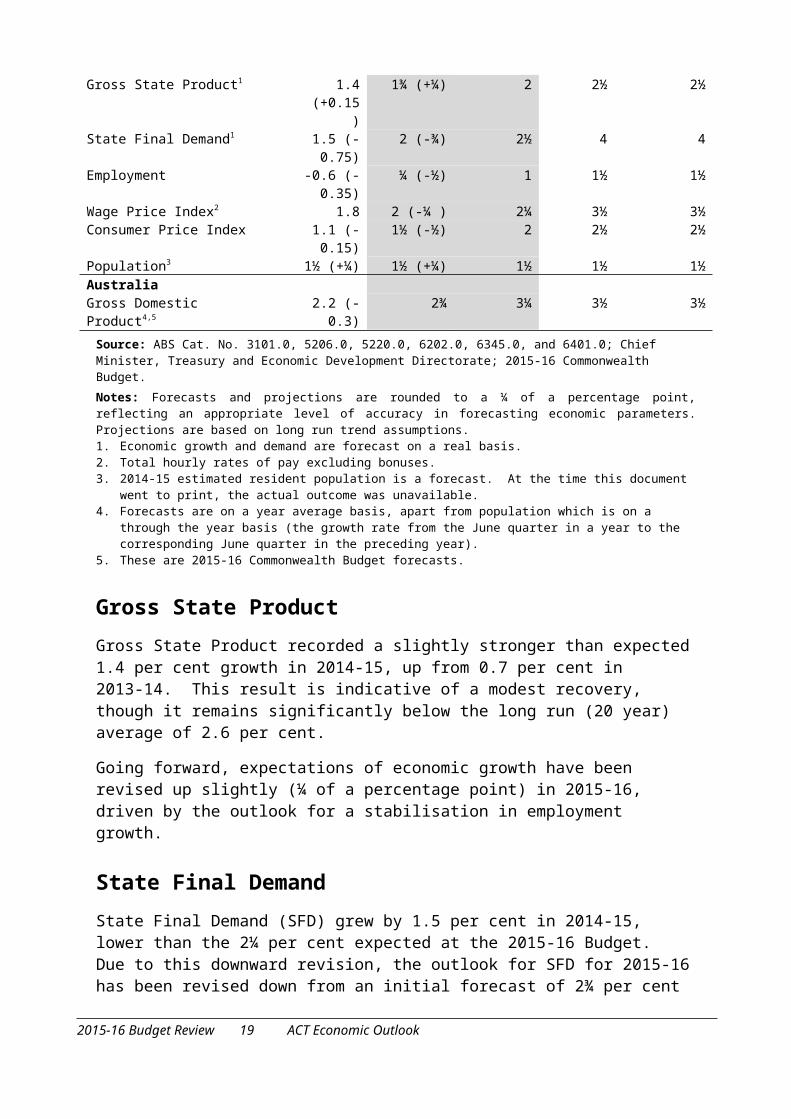
Table 1.4.1: Budget Review Economic Forecasts, Year-on-year Percentage Change
Empty Cell Actual Forecasts Projections2014-15 2015-16 2016-17 2017-18 2018-19
ACT Empty Cell Empty Cell Empty Cell
Gross State Product1 1.4 (+0.15) 1¾ (+¼) 2 2½ 2½State Final Demand1 1.5 (-0.75) 2 (-¾) 2½ 4 4Employment -0.6 (-0.35) ¼ (-½) 1 1½ 1½Wage Price Index2 1.8 2 (-¼ ) 2¼ 3½ 3½Consumer Price Index 1.1 (-0.15) 1½ (-½) 2 2½ 2½Population3 1½ (+¼) 1½ (+¼) 1½ 1½ 1½Australia Empty Cell Empty Cell Empty Cell
Gross Domestic Product4,5 2.2 (-0.3) 2¾ 3¼ 3½ 3½ Source: ABS Cat. No. 3101.0, 5206.0, 5220.0, 6202.0, 6345.0, and 6401.0; Chief Minister, Treasury and Economic Development Directorate; 2015-16 Commonwealth Budget.Notes: Forecasts and projections are rounded to a ¼ of a percentage point, reflecting an appropriate level of accuracy in forecasting economic parameters. Projections are based on long run trend assumptions.1. Economic growth and demand are forecast on a real basis.2. Total hourly rates of pay excluding bonuses.3. 2014-15 estimated resident population is a forecast. At the time this document went to print, the actual outcome was
unavailable.4. Forecasts are on a year average basis, apart from population which is on a through the year basis (the growth rate
from the June quarter in a year to the corresponding June quarter in the preceding year).
2015-16 Budget Review 15 ACT Economic Outlook

5. These are 2015-16 Commonwealth Budget forecasts.
Gross State ProductGross State Product recorded a slightly stronger than expected 1.4 per cent growth in 2014-15, up from 0.7 per cent in 2013-14. This result is indicative of a modest recovery, though it remains significantly below the long run (20 year) average of 2.6 per cent.
Going forward, expectations of economic growth have been revised up slightly (¼ of a percentage point) in 2015-16, driven by the outlook for a stabilisation in employment growth.
State Final DemandState Final Demand (SFD) grew by 1.5 per cent in 2014-15, lower than the 2¼ per cent expected at the 2015-16 Budget. Due to this downward revision, the outlook for SFD for 2015-16 has been revised down from an initial forecast of 2¾ per cent to 2 per cent. Growth is expected to pick up to 2½ per cent in 2016-17, primarily due to an expected increase in investment.
EmploymentEmployment growth was weaker than expected, declining by 0.7 per cent in 2014-15 as Australian Public Service job cuts came into effect. Over the course of 2014-15, a total of 3,522 Australian Public Service jobs were lost in the ACT. Given total employment losses in the ACT over this same period were 3,190 persons, this indicates that negative flow through effects on hiring decisions by other sectors of the ACT economy were minimised.
Despite the lifting of the Commonwealth Government hiring freeze on 1 July 2015, employment growth over the course of 2015-16 is expected to be weak, at ¼ of a per cent.
While labour market conditions have improved considerably over the past year, the improvement has not been as rapid as anticipated at the time of the 2015-16 Budget with the trend unemployment rate rising for each of the 6 months to November 2015. Employment growth, though, has stabilised and the number of employed people is now at its highest point since May 2014.
The Government expects stronger employment growth once the Commonwealth’s cuts to public sector employment finally work through the system.
Employment is forecast to grow by 1 per cent in 2016-17 as conditions steadily improve. This is in line with the upward trend shown by leading indicators of labour demand in the ACT, supported by weak wage growth pressure.
2015-16 Budget Review 16 ACT Economic Outlook
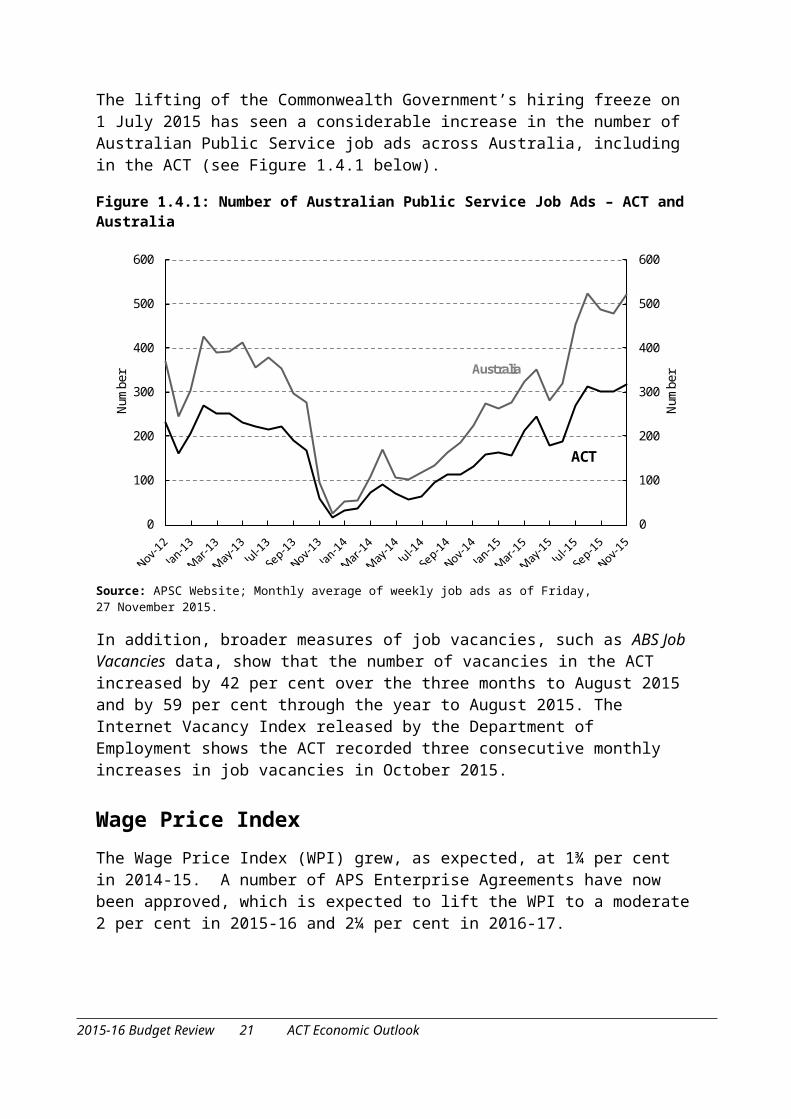
The lifting of the Commonwealth Government’s hiring freeze on 1 July 2015 has seen a considerable increase in the number of Australian Public Service job ads across Australia, including in the ACT (see Figure 1.4.1 below).
Figure 1.4.1: Number of Australian Public Service Job Ads – ACT and Australia
0
100
200
300
400
500
600
0
100
200
300
400
500
600
Num
ber
Num
ber
ACT
Australia
Source: APSC Website; Monthly average of weekly job ads as of Friday, 27 November 2015.
In addition, broader measures of job vacancies, such as ABS Job Vacancies data, show that the number of vacancies in the ACT increased by 42 per cent over the three months to August 2015 and by 59 per cent through the year to August 2015. The Internet Vacancy Index released by the Department of Employment shows the ACT recorded three consecutive monthly increases in job vacancies in October 2015.
Wage Price IndexThe Wage Price Index (WPI) grew, as expected, at 1¾ per cent in 2014-15. A number of APS Enterprise Agreements have now been approved, which is expected to lift the WPI to a moderate 2 per cent in 2015-16 and 2¼ per cent in 2016-17.
Consumer Price IndexThe Consumer Price Index came in close to 2015-16 Budget forecasts, at a low 1.1 per cent in 2014-15. To date there has been little evidence of the depreciation of the Australian dollar affecting consumer prices, leading to a downward revision to the 2015-16 forecast to 1.5 per cent, rising to 2 per cent in 2016-17.
2015-16 Budget Review 17 ACT Economic Outlook

PopulationPopulation growth in the ACT is forecast to grow at a higher-than-expected 1½ per cent in 2014-15, mainly as a result of a decrease in net outflows from interstate migration. Positive net overseas migration and natural increases also contributed to the revised forecast.
Population growth is forecast to continue to grow at around trend of 1½ per cent from 2015-16 onward, as the net outflow from interstate migration is forecast to subside further.
2015-16 Budget Review 18 ACT Economic Outlook
1.5 RISKS TO THE ECONOMIC OUTLOOK
While the ACT’s economic forecasts show a gradual return to around trend growth, there exist a number of risks to this central case.
External risks to the Australian outlook include prices for Australia’s major commodity exports falling further short of expectations, potentially driven by any additional downgrades to the outlook for Chinese growth.
The transmission of Australian economic activity to the ACT economy occurs primarily via Commonwealth Government decisions in regard to its gross expenditure patterns – both in relation to the employment and wage outcomes of Canberra based public servants as well as levels of direct funding to the States and Territories. Total Commonwealth expenditure growth is, in turn, heavily influenced by both its revenue receipts as well as by its fiscal policy. Unanticipated Commonwealth Government revenue shortfalls or an additional tightening of fiscal policy therefore both represent major downside risks to the ACT economy.
Within the ACT, a moderate downside risk exists in relation to commercial property investment, given both the ACT’s historically high vacancy rate and the ongoing implementation of Project Tetris, which aims to reduce costs associated with unused office space currently leased by the Commonwealth Government.
The growing importance of the tertiary education sector to the ACT economy may represent an upside risk as more foreign students take advantage of the low Australian dollar to gain an education in Canberra.
A further upside risk exists in relation to new development along the Northbourne Avenue corridor as investors seek to take advantage of the construction of the proposed new light rail route.
2015-16 Budget Review 19 Risks to the Economic Outlook
2015-16 Budget Review 20 Risks to the Economic Outlook
CHAPTER 2
BUDGET OUTLOOK AND FISCAL STRATEGY
Chapter Page
2.1 Budget Outlook 23
2.2 Fiscal Strategy 29
2.3 Loose-Fill Asbestos Insulation Eradication Scheme – Financial Details
35
2.4 New Initiatives 37
2015-16 Budget Review 21 Budget Outlook and Fiscal Strategy
2015-16 Budget Review 22 Budget Outlook and Fiscal Strategy
2.1 BUDGET OUTLOOK
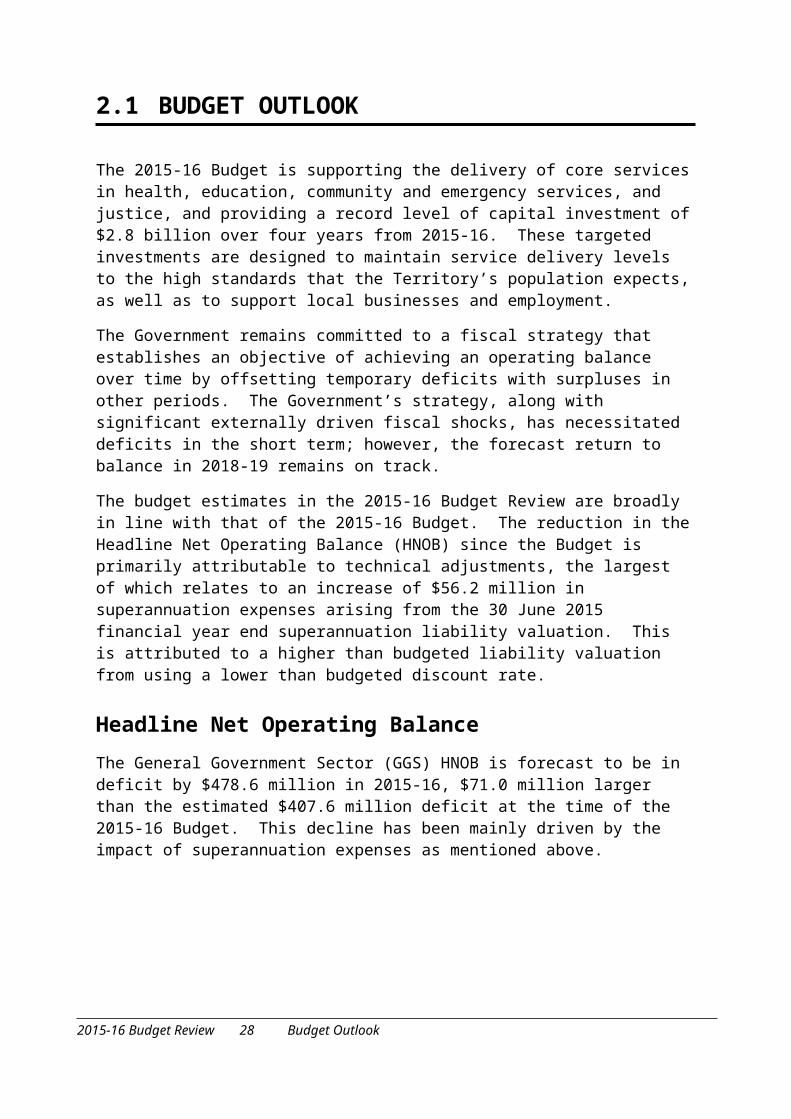
The 2015-16 Budget is supporting the delivery of core services in health, education, community and emergency services, and justice, and providing a record level of capital investment of $2.8 billion over four years from 2015-16. These targeted investments are designed to maintain service delivery levels to the high standards that the Territory’s population expects, as well as to support local businesses and employment.
The Government remains committed to a fiscal strategy that establishes an objective of achieving an operating balance over time by offsetting temporary deficits with surpluses in other periods. The Government’s strategy, along with significant externally driven fiscal shocks, has necessitated deficits in the short term; however, the forecast return to balance in 2018-19 remains on track.
The budget estimates in the 2015-16 Budget Review are broadly in line with that of the 2015-16 Budget. The reduction in the Headline Net Operating Balance (HNOB) since the Budget is primarily attributable to technical adjustments, the largest of which relates to an increase of $56.2 million in superannuation expenses arising from the 30 June 2015 financial year end superannuation liability valuation. This is attributed to a higher than budgeted liability valuation from using a lower than budgeted discount rate.
Headline Net Operating BalanceThe General Government Sector (GGS) HNOB is forecast to be in deficit by $478.6 million in 2015-16, $71.0 million larger than the estimated $407.6 million deficit at the time of the 2015-16 Budget. This decline has been mainly driven by the impact of superannuation expenses as mentioned above.
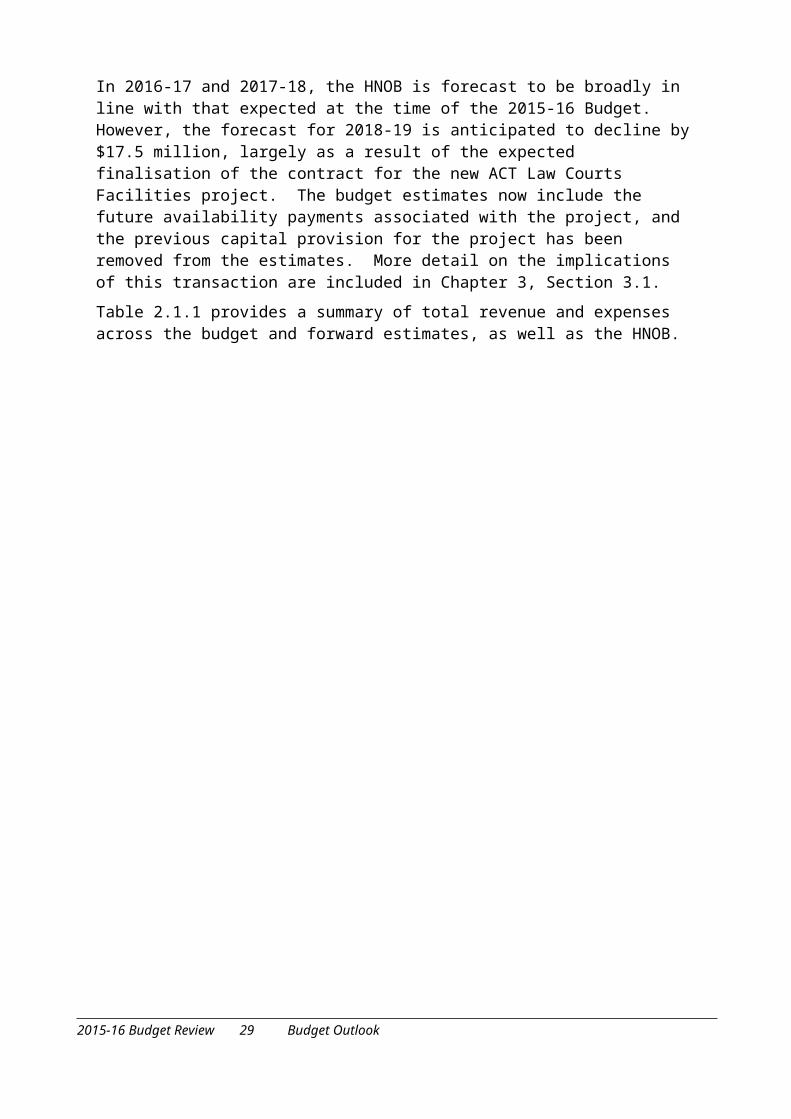
In 2016-17 and 2017-18, the HNOB is forecast to be broadly in line with that expected at the time of the 2015-16 Budget. However, the forecast for 2018-19 is anticipated to decline by $17.5 million, largely as a result of the expected finalisation of the contract for the new ACT Law Courts Facilities project. The budget estimates now include the future availability payments associated with the project, and the previous capital provision for the project has been removed from the estimates. More detail on the implications of this transaction are included in Chapter 3, Section 3.1.
Table 2.1.1 provides a summary of total revenue and expenses across the budget and forward estimates, as well as the HNOB.
2015-16 Budget Review 23 Budget Outlook
Table 2.1.1: General Government Sector Headline Net Operating Balance
Empty Cell 2014-15 2015-16 2015-16 2016-17 2017-18 2018-19Empty Cell Actual
OutcomeOriginal Budget
Budget Review
Revised Estimate
Revised Estimate
Revised Estimate
Empty Cell $mRevenue 4,554.1 4,609.5 4,601.6 4,893.4 5,100.9 5,302.8Expenses 5,143.0 5,148.5 5,240.5 5,188.3 5,342.9 5,470.4Superannuation return
adjustment1109.6 131.4 160.3 172.2 186.4 200.5
HEADLINE NET OPERATING BALANCE
-479.3 -407.6 -478.6 -122.7 -55.6 32.9
HEADLINE NET OPERATING BALANCE (excluding the Asbestos Eradication Scheme)
-120.7 -349.0 -396.2 -105.7 -41.2 42.8
Net Cash from Operating Activities
173.5 -5.9 -1.9 331.5 424.9 650.8
Net Debt (excluding superannuation)
909.6 2,425.7 1,956.5 2,487.9 2,663.0 2,360.6
Net Financial Liabilities 7,002.7 5,663.9 5,319.1 5,887.2 6,056.9 5,819.4
Notes: Table may not add due to rounding.1. The Headline Net Operating Balance incorporates the impact of long-term superannuation investment earnings in
order to provide an accurate assessment of the longer term sustainability of the budget position.
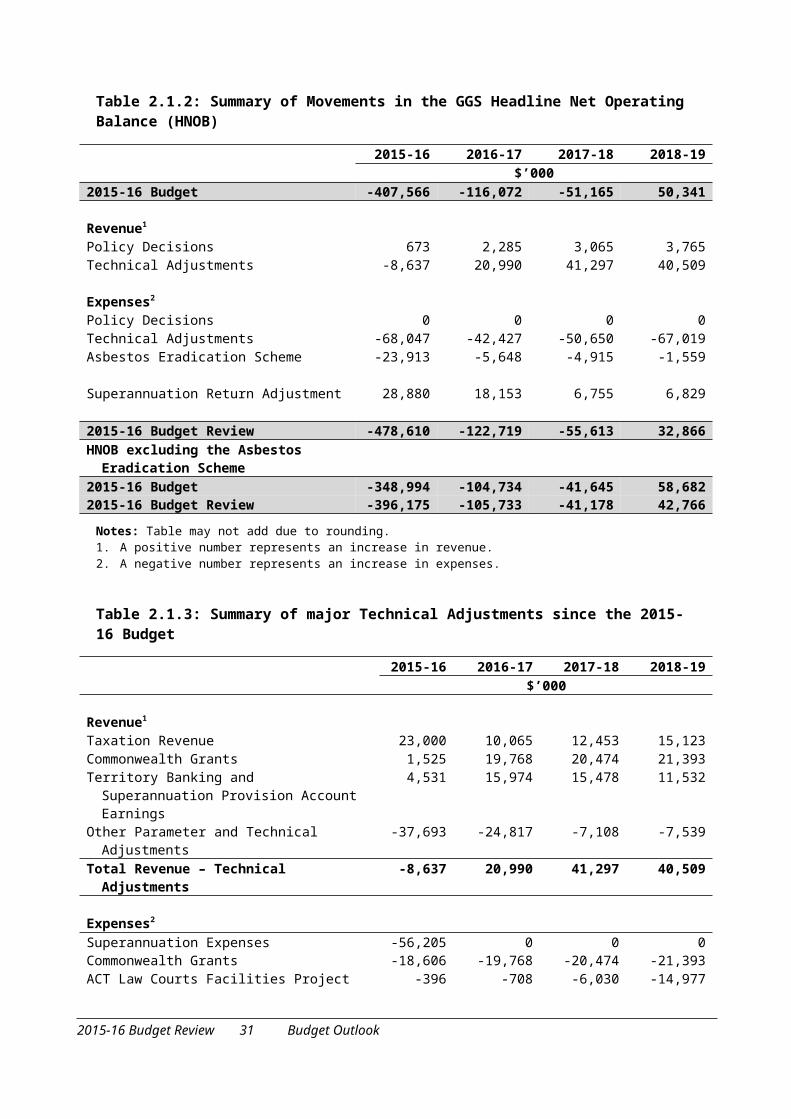
Summary of MovementsTable 2.1.2 shows the variations in the GGS HNOB between the 2015-16 Budget and the 2015-16 Budget Review. Further details of the major technical adjustments are shown in Table 2.1.3.
2015-16 Budget Review 24 Budget Outlook
Table 2.1.2: Summary of Movements in the GGS Headline Net Operating Balance (HNOB)
Empty Cell 2015-16 2016-17 2017-18 2018-19Empty Cell $’000
2015-16 Budget -407,566 -116,072 -51,165 50,341Empty Cell Empty Cell Empty Cell Empty Cell Empty Cell
Revenue1 Empty Cell Empty Cell Empty Cell Empty Cell
Policy Decisions 673 2,285 3,065 3,765Technical Adjustments -8,637 20,990 41,297 40,509
Empty Cell Empty Cell Empty Cell Empty Cell Empty Cell
Expenses2 Empty Cell Empty Cell Empty Cell Empty Cell
Policy Decisions 0 0 0 0Technical Adjustments -68,047 -42,427 -50,650 -67,019Asbestos Eradication Scheme -23,913 -5,648 -4,915 -1,559
Empty Cell Empty Cell Empty Cell Empty Cell Empty Cell
Superannuation Return Adjustment 28,880 18,153 6,755 6,829Empty Cell Empty Cell Empty Cell Empty Cell Empty Cell
2015-16 Budget Review -478,610 -122,719 -55,613 32,866HNOB excluding the Asbestos Eradication Scheme Empty Cell Empty Cell Empty Cell Empty Cell
2015-16 Budget -348,994 -104,734 -41,645 58,6822015-16 Budget Review -396,175 -105,733 -41,178 42,766
Notes: Table may not add due to rounding.1. A positive number represents an increase in revenue.2. A negative number represents an increase in expenses.
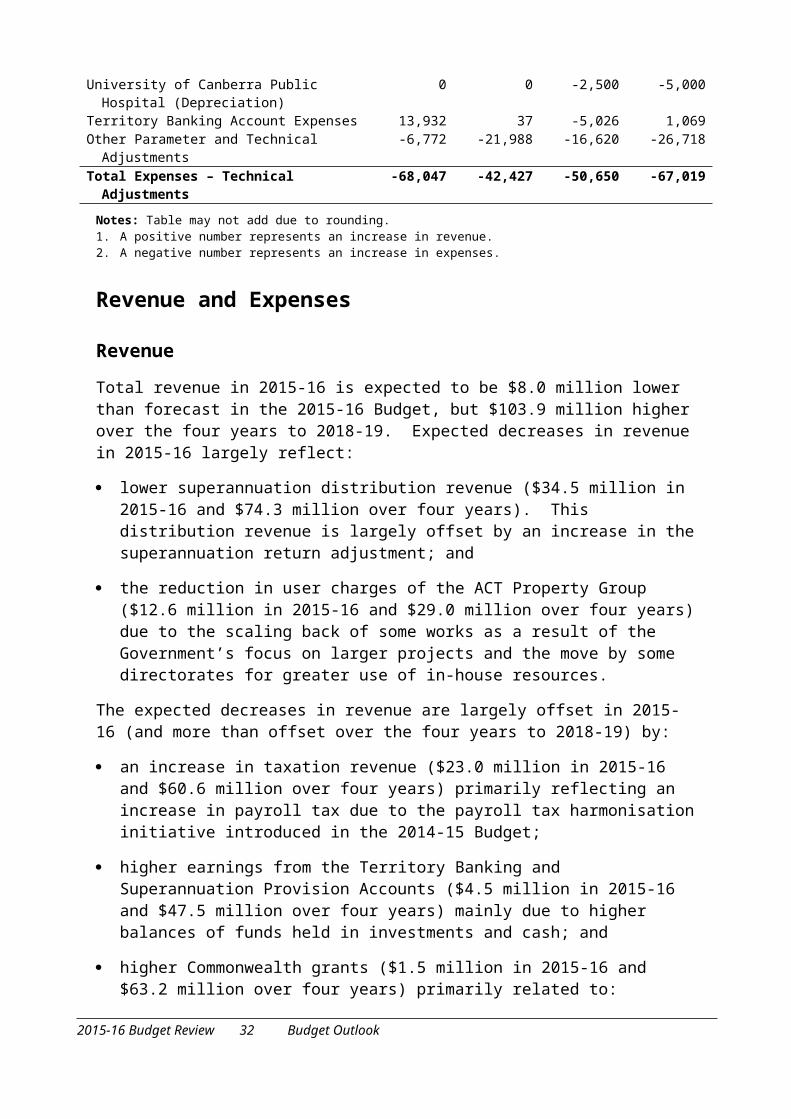
Table 2.1.3: Summary of major Technical Adjustments since the 2015-16 Budget
Empty Cell 2015-16 2016-17 2017-18 2018-19 Empty Cell $’000Empty Cell Empty Cell Empty Cell Empty Cell Empty Cell
Revenue1 Empty Cell Empty Cell Empty Cell Empty Cell
Taxation Revenue 23,000 10,065 12,453 15,123Commonwealth Grants 1,525 19,768 20,474 21,393Territory Banking and Superannuation Provision
Account Earnings4,531 15,974 15,478 11,532
Other Parameter and Technical Adjustments -37,693 -24,817 -7,108 -7,539Total Revenue – Technical Adjustments -8,637 20,990 41,297 40,509
Empty Cell Empty Cell Empty Cell Empty Cell Empty Cell
Expenses2 Empty Cell Empty Cell Empty Cell Empty Cell
Superannuation Expenses -56,205 0 0 0Commonwealth Grants -18,606 -19,768 -20,474 -21,393ACT Law Courts Facilities Project -396 -708 -6,030 -14,977University of Canberra Public Hospital (Depreciation) 0 0 -2,500 -5,000Territory Banking Account Expenses 13,932 37 -5,026 1,069Other Parameter and Technical Adjustments -6,772 -21,988 -16,620 -26,718Total Expenses – Technical Adjustments -68,047 -42,427 -50,650 -67,019
Notes: Table may not add due to rounding.1. A positive number represents an increase in revenue.2. A negative number represents an increase in expenses.
2015-16 Budget Review 25 Budget Outlook
Revenue and Expenses
Revenue
Total revenue in 2015-16 is expected to be $8.0 million lower than forecast in the 2015-16 Budget, but $103.9 million higher over the four years to 2018-19. Expected decreases in revenue in 2015-16 largely reflect:
lower superannuation distribution revenue ($34.5 million in 2015-16 and $74.3 million over four years). This distribution revenue is largely offset by an increase in the superannuation return adjustment; and
the reduction in user charges of the ACT Property Group ($12.6 million in 2015-16 and $29.0 million over four years) due to the scaling back of some works as a result of the Government’s focus on larger projects and the move by some directorates for greater use of in-house resources.
The expected decreases in revenue are largely offset in 2015-16 (and more than offset over the four years to 2018-19) by:
an increase in taxation revenue ($23.0 million in 2015-16 and $60.6 million over four years) primarily reflecting an increase in payroll tax due to the payroll tax harmonisation initiative introduced in the 2014-15 Budget;
higher earnings from the Territory Banking and Superannuation Provision Accounts ($4.5 million in 2015-16 and $47.5 million over four years) mainly due to higher balances of funds held in investments and cash; and
higher Commonwealth grants ($1.5 million in 2015-16 and $63.2 million over four years) primarily related to:
- a decrease of $24.3 million in 2015-16 for Finance Assistance Grants reflecting the early payment of such grants in 2014-15;
- the inclusion of Goods and Services Tax (GST) ($18.6 million in 2015-16 and $80.2 million over four years) in the reporting of Commonwealth Government grants passed on to non-government schools. This technical adjustment, introduced following the receipt of accounting advice, is fully offset by a corresponding adjustment to expenses; and
- higher GST grants of $7.2 million in 2015-16 following the 2014-15 Commonwealth Final Budget Outcome. This does not take account of the changes reflected in the 2015-16 MYEFO.
2015-16 Budget Review 26 Budget Outlook
Expenses
Total expenses in 2015-16 are expected to be $92.0 million higher than forecast at the time of the 2015-16 Budget, and $264.2 million over the four years to 2018-19. Expected increases in expenses largely reflect:
an increase in superannuation expenses ($56.2 million in 2015-16 only) arising from the 30 June 2015 financial year end superannuation liability valuation. This is attributed to a higher than budgeted liability valuation from using a lower than budgeted discount rate;
an increase relating to the Asbestos Eradication Scheme ($23.9 million in 2015-16 and $36.0 million over four years), mainly due to the timing of homeowners opting into the Scheme. In the 2015-16 Budget, it was forecast that 935 homeowners would opt into the Scheme; as at 30 June 2015, the total number of homeowners who had opted in was 859. The total net cash cost over the five years of the Scheme is largely unchanged;
an increase relating to the treatment of GST within the Education and Training Directorate ($18.6 million in 2015-16 and $80.2 million over four years). This technical adjustment, introduced following the receipt of accounting advice, is fully offset by a corresponding adjustment to revenue;
the inclusion of expenses relating to the Public Private Partnership availability payment for the ACT Law Courts Facilities project ($0.4 million in 2015-16 and $22.1 million over four years); and
the inclusion of depreciation expenses for the University of Canberra Public Hospital ($7.5 million over two years from 2017-18) to reflect their initial recognition in the accounts of the Health Directorate.
These increases are partially offset by a net decrease in expenses in the Territory Banking Account ($13.9 million in 2015-16 and $10.0 million over four years). The net decrease in borrowing costs reflects a revision to the estimated timing of new borrowings.
Superannuation Return Adjustment
The Government is seeking to extinguish the Territory’s unfunded defined benefit superannuation liability by accumulating financial assets in the Superannuation Provision Account (SPA). The investment earnings on these financial assets include interest, dividends, distributions and capital growth.
Under the Government Finance Statistics reporting framework, capital growth on financial assets is not included as transactional revenue in the Net Operating Balance. This approach understates the expected investment revenue and overstates the net superannuation expense related to the superannuation liability. The superannuation return adjustment, together with interest, distribution and dividend revenues, provides for expected overall returns of 7.5 per cent, the long term target annual return of the SPA.
2015-16 Budget Review 27 Budget Outlook

The overall expectation for SPA investment earnings over the 2015-16 Budget and forward years has not changed materially from the 2015-16 Budget. However, lower than previously estimated distribution revenue is being offset by higher than previously estimated unrealised capital gains. As a result, the superannuation return adjustment has increased by $28.9 million in 2015-16 and $60.6 million over four years.
2015-16 Budget Review 28 Budget Outlook
2.2 FISCAL STRATEGY
The Government’s fiscal strategy is unchanged from the 2015-16 Budget. It remains committed to:
supporting and boosting the ACT economy in the short term, with particular focus on creating jobs and continuing to deliver appropriate services to the community;
sustaining a strong operating balance over the medium term; and
continuing to invest in important infrastructure projects to allow the Canberra community to enjoy the benefits of these assets in the longer-term.
As part of the Government’s prudent management of the Territory’s finances, both in terms of expenditure and debt, it seeks to achieve an operating balance over time, offsetting temporary deficits with surpluses in other periods.
Other elements of the strategy include directing investment towards assets capable of generating economic growth, prudent management of the Territory’s balance sheet, maintaining taxation revenues at sustainable levels, and ensuring service levels are maintained to a standard that the Territory’s population expects.
The Government also remains committed to delivering the Asbestos Eradication Scheme within its overall fiscal strategy. The activity of the ACT Asbestos Response Taskforce, namely the Government’s purchase of affected properties and their subsequent remediation, is placing pressure on the public finances. However, the demolition and remediation of all properties is the only enduring solution to the health risks.
As for prior budget updates, the Government’s fiscal strategy can be grouped into five high level objectives:
sustainable economic growth;
sound public finances;
quality and efficient services;
sustainable taxation revenue; and
a strong balance sheet.
Brief explanations on each of these objectives are outlined below.
Sustainable Economic GrowthThe Government’s growth strategy entails expanding and diversifying the Territory’s economic base, providing support for local jobs and job creation strategies, and infrastructure investment targeted at assets that will generate long-term economic benefits.
2015-16 Budget Review 29 Fiscal Strategy
Since the 2015-16 Budget, the Government has rolled out the CBR Innovation Development Fund, announced as part of the Confident and Business Ready: Building on our Strengths program, to help drive innovation, entrepreneurship and job growth in Canberra. The Territory’s extensive capital works program (currently valued at $2.8 billion over four years) will provide new facilities across Canberra, but also promote growth through increased private sector involvement in infrastructure investment.
The Government has also progressed its first Public Private Partnership, with the preferred proponent for the new ACT Law Courts Facilities project recently announced. This new facility is expected to meet the Territory’s requirements for the next 50 years, and will generate around 350 jobs during its construction phase.
Work in relation to the Asset Recycling Initiative is also continuing, particularly in relation to the sale of ageing public housing assets in the ACT, as part of the Government’s efforts to revitalise Canberra’s suburbs.
The General Government Sector (GGS) Headline Net Operating Balance (HNOB) deficits presented in this Budget Review reflect the Government’s efforts to stimulate activity in the short to medium term, offsetting in part the contraction in Commonwealth Government spending and jobs. This strategy, while imposing short-term deficits, aims to secure existing and generate new employment, and use government investment to bolster the economy for much longer timeframes.
Sound Public Finances
Headline Net Operating Balance
The Government’s objective is to achieve a net operating balance over the medium to long term; temporary deficits must only occur if they are offset by surpluses at other times.
The GGS HNOB is forecast to be in deficit by $478.6 million in 2015-16, largely reflecting the impact of the Asbestos Eradication Scheme. The Government has set out a path to return to balance by 2018-19. The decline of $71.0 million since the 2015-16 Budget is, however, mainly due to the 2014-15 superannuation liability valuation.
Net Operating Cash
Net Operating Cash (Table 2.2.1) is the cash counterpart to the accrual Net Operating Balance. It measures all operating cash receipts for a financial year (for example, taxes, fees and fines, and operating grants from the Commonwealth Government) less all operating cash payments (including wages and salaries, cash superannuation payments, and payments for goods and services).
The revised net operating cash position for the GGS in 2015-16 is a deficit of $1.9 million. This is broadly in line with the 2015-16 Budget estimated deficit of $5.9 million. This temporary deficit reflects the impact of the Asbestos Eradication Scheme and the net operating cash is expected to return to surplus in 2016-17.
2015-16 Budget Review 30 Fiscal Strategy
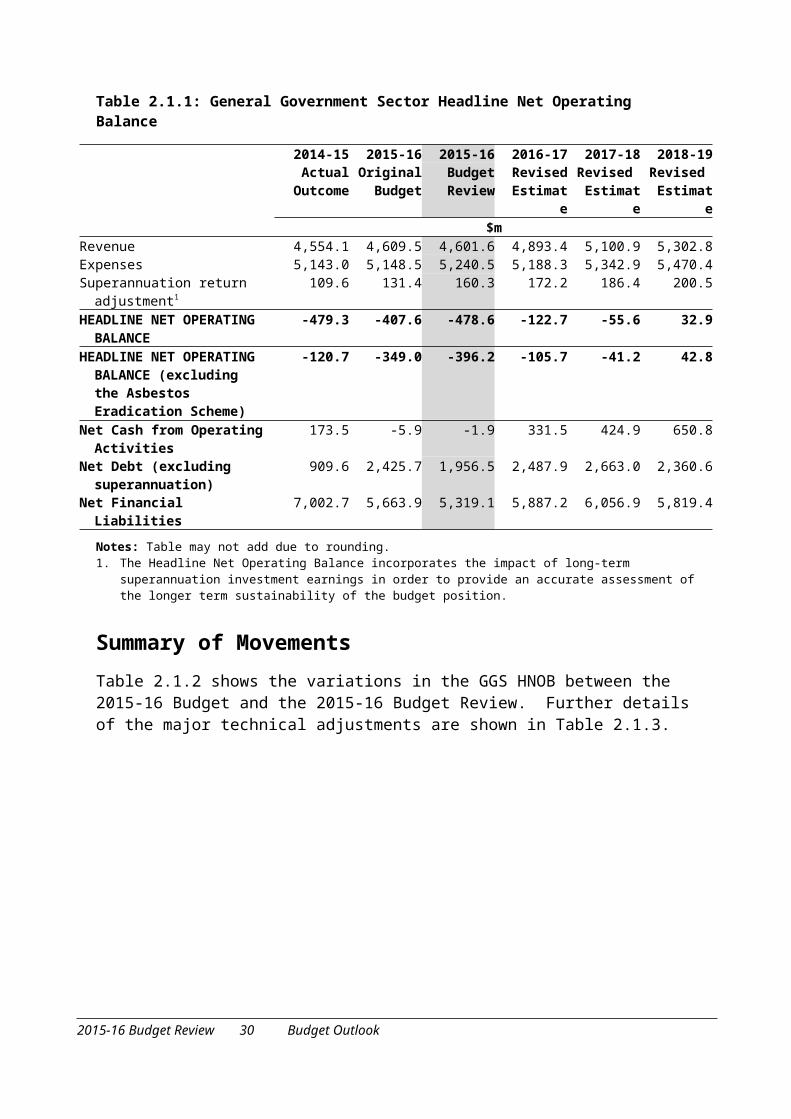
Table 2.2.1: Net Operating Cash
General Government Sector 2015-16 2016-17 2017-18 2018-19 $m
2015-16 Budget -5.9 352.5 420.4 646.92015-16 Budget Review -1.9 331.5 424.9 650.8
The Territory’s Credit Rating
International ratings agency Standard & Poor’s Ratings Services affirmed the ACT’s AAA long-term and A-1+ short-term local currency credit ratings on 25 September 2015 with the rating outlook retained as stable.
The AAA and A 1+ ratings are the highest ratings assigned by Standard & Poor’s and the ACT‐ remains one of a small number of governments in the world to hold this rating.
In affirming the Territory’s stable AAA rating, Standard & Poor’s considers that the Territory will broadly achieve its financial forecasts as set out in the 2015-16 Budget, particularly in terms of revenue targets associated with the land release program, and completing the Asbestos Eradication Scheme within budget. The rating reflects the Territory’s very strong economy and financial management, strong budget flexibility and exceptionally high liquidity.
The reaffirmation of the Territory’s rating demonstrates that the Government’s economic and fiscal strategies continue to successfully support the economy and the Canberra community.
Quality and Efficient Public ServicesThe Government remains committed to delivering high quality services, with an objective of delivering more efficient and productive public services.
Significant milestones for the Capital Metro light rail network have been reached in the period since delivery of the 2015-16 Budget, with completion of the project’s Environmental Impact Statement and its subsequent endorsement by the Environment and Planning Directorate (EPD). This endorsement allowed the development applications for the City to Gungahlin first stage and the option for a Russell extension being lodged with EPD in October 2015.
As part of its Public Transport Improvement Plan, the Government recently decided to unify responsibility for Canberra’s light rail and bus network into a single agency from 1 July 2016. Transport Canberra will be launched with the remit of ensuring the smooth integration of bus and light rail into a convenient, efficient, affordable and reliable network, to the eventual redistribution of capacity from freed up bus services when light rail services commence. It will deploy a single ticketing system, act as a central point of contact on associated public transport matters, and ensure a coordinated timetabling system is developed.
2015-16 Budget Review 31 Fiscal Strategy
The importance of the domestic violence prevention and crisis services funded through the 2015-16 Budget has been underscored by the Government’s recent launch of the Second Implementation Plan under the ACT Prevention of Violence against Women Strategy 2011-2017. The Plan identifies new areas of action that will guide the Government’s efforts in this area of service delivery, with a fundamental understanding that domestic violence will not be tolerated in our community.
As part of its fiscal strategy, the Government will continue to ensure that service-related spending is carefully targeted towards areas of activity where the Government considers it can meet the Territory’s priority needs, and also deliver maximum economic benefit. On this basis, the Government will continue to invest in health, education and urban services, ensuring that Canberra remains a city of which its residents can rightly be proud.
Sustainable Taxation RevenueThe Government is committed to making the Territory’s taxation system fairer, simpler and more efficient. Importantly, the Government’s fiscal strategy also depends on ensuring taxation revenue is at sustainable levels.
The significant reforms to the Territory’s taxation system, which began in 2012-13, continued as part of the 2015-16 Budget. Under this program of reform, the Government is abolishing conveyance duty and insurance duty and replacing the revenue through the collection of general rates. This approach will preserve capacity for the Government to deliver public services in the future, while reducing the impact of inefficient taxes on the economy.
Following the implementation of these reforms, taxation revenue in 2015-16 is expected to be $1.5 billion, or 4.2 per cent of nominal Gross State Product (GSP).
Strong Balance SheetThe ACT’s balance sheet continues to perform relatively well compared to other jurisdictions and is able to maintain its flexibility to support high priority investments.
Net Debt
A key balance sheet measure in the Government Finance Statistics framework is net debt, which takes into account gross debt liabilities as well as financial assets (such as cash reserves and investments). Compared to the 2015-16 Budget estimate of 6 per cent, the GGS’s net debt as a percentage of GSP is now estimated to be 5.5 per cent in 2015-16.
The decrease in net debt as a percentage of GSP is largely due to higher balances of funds held in investments and cash by the Territory Banking Account. Further details can be found at Chapter 5, Section 5.1.
2015-16 Budget Review 32 Fiscal Strategy
Net Financial Liabilities
Net Financial Liabilities are a broad measure of GGS liabilities, including net debt and superannuation liabilities. The Net Financial Liabilities to GSP ratio is largely unchanged from the 2015-16 Budget estimate at 14.8 per cent.
Net Financial Liabilities are calculated as total liabilities less financial assets (such as cash reserves and investments). They take into account all non-equity financial assets, but exclude the value of equity held by the GGS in public corporations.
Figure 2.2.1 below compares the ACT’s Net Financial Liabilities as a proportion of GSP with other jurisdictions. The ACT remains broadly in line with other AAA rated jurisdictions (New South Wales and Victoria).
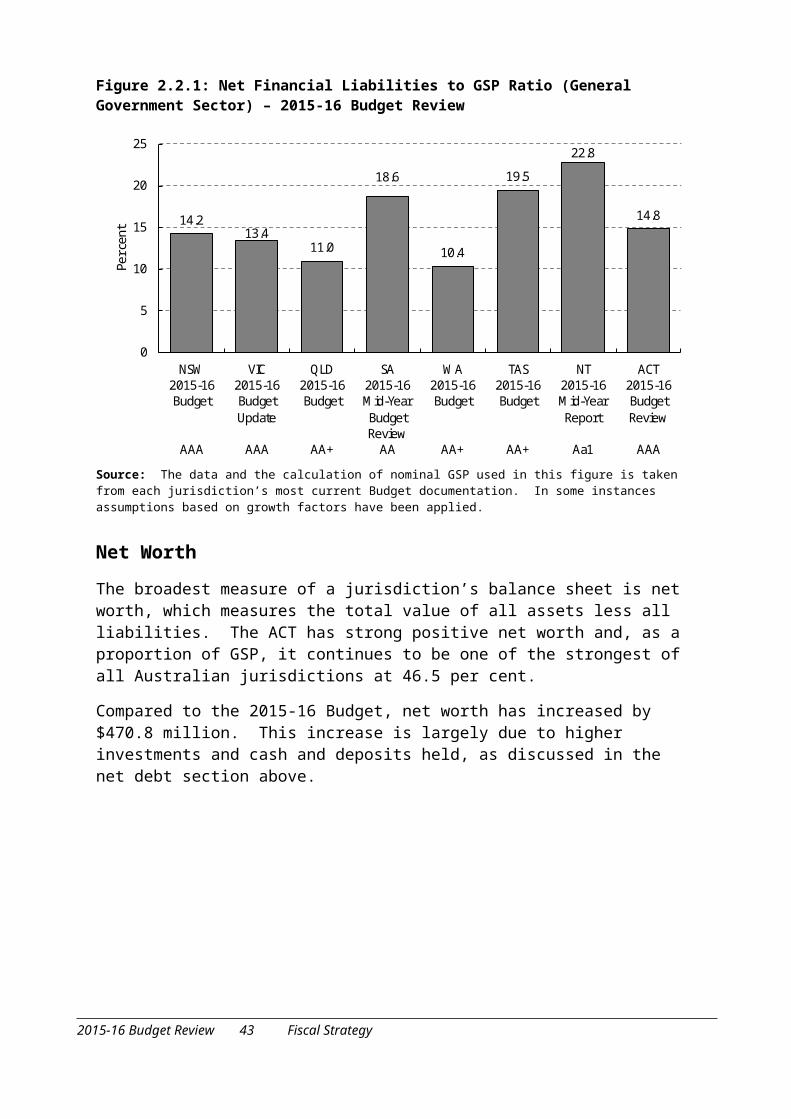
Figure 2.2.1: Net Financial Liabilities to GSP Ratio (General Government Sector) – 2015-16 Budget Review
14.213.4
11.0
18.6
10.4
19.5
22.8
14.8
0
5
10
15
20
25
NSW2015-16 Budget
AAA
VIC 2015-16 Budget Update
AAA
QLD 2015-16 Budget
AA+
SA2015-16 Mid-Year
Budget Review
AA
WA 2015-16 Budget
AA+
TAS 2015-16 Budget
AA+
NT2015-16 Mid-Year
Report
Aa1
ACT 2015-16 Budget Review
AAA
Per c
ent
Source: The data and the calculation of nominal GSP used in this figure is taken from each jurisdiction’s most current Budget documentation. In some instances assumptions based on growth factors have been applied.
Net Worth
The broadest measure of a jurisdiction’s balance sheet is net worth, which measures the total value of all assets less all liabilities. The ACT has strong positive net worth and, as a proportion of GSP, it continues to be one of the strongest of all Australian jurisdictions at 46.5 per cent.
Compared to the 2015-16 Budget, net worth has increased by $470.8 million. This increase is largely due to higher investments and cash and deposits held, as discussed in the net debt section above.
2015-16 Budget Review 33 Fiscal Strategy
2015-16 Budget Review 34 Fiscal Strategy
2.3 LOOSE-FILL ASBESTOS INSULATION ERADICATION SCHEME – FINANCIAL DETAILS
Loose-fill Asbestos Insulation Eradication SchemeOn 28 October 2014, the Government announced the implementation of a buyback scheme for all ACT houses affected by loose-fill asbestos (Mr Fluffy) insulation. This decision was based on advice from the ACT Asbestos Response Taskforce that eradication of the risk of asbestos exposure, through demolition of all such properties, is the only enduring solution to the health risks posed by affected homes. This scheme has since been extended to a small number of impacted dwellings in close proximity to affected properties.
Under the Loose-fill Asbestos Insulation Eradication Scheme (the Scheme), the ACT Government is acquiring, demolishing and safely disposing of all affected homes, remediating affected blocks and then reselling them to defray overall Scheme costs. The Scheme also includes the emergency financial assistance, asbestos assessment and hazard reduction program undertaken by the Asbestos Response Taskforce since it was formed in mid-2014, as well as relocation assistance grants payable as affected homes are vacated.
As at 14 December 2015, offers for purchase had been accepted by 94 per cent of the 1,022 affected houses with 964 offers accepted by homeowners, and the ACT Government had taken possession of 785 of these properties.
The demolition program has commenced, with 54 properties demolished.
Accounting TreatmentThe funding profile of the Scheme is based on a range of assumptions coupled with the best possible estimates at the time of the 2015-16 Budget Review. Given the nature of the Scheme, the associated timing and quantum of financial impacts is subject to uncertainty. Any funding that is not expected to be required for particular activities during a specific financial year has been re-allocated to contingency. Decisions on the use of contingency, and the extent of any overall savings will be made once the total number of homeowners participating in the Scheme, the number of impacted properties, and the progress of the demolition program are better understood and further progressed.
Since the 2015-16 Budget, there has been a change in accounting advice relating to when the demolition and remediation works will be capitalised. Based on this most recent advice, the Government will capitalise and record a provision for the cost of demolition and remediation upon the acquisition of the properties, instead of at the time that the works were undertaken (as per the previous treatment). The related provision will be reduced as building demolition and land remediation is undertaken. This change has no impact on the Headline Net Operating Balance (HNOB).
2015-16 Budget Review 35 Loose-fill Asbestos Insulation Eradication Scheme Financial Details
The 2014-15 Financial Statements for the Chief Minister, Treasury and Economic Development Directorate (CMTEDD), which are presented in the 2014-15 CMTEDD Annual Report, provide details of the accounting treatment adopted for the Scheme. The same accounting treatment will be applied in the 2016-17 Budget year and across the forward estimates. The Scheme has had a significant negative impact on the HNOB in 2014-15 and 2015-16, as a large portion of the costs has been required to be expensed. The majority of these expenses are recognised in the Operating Statement as Grants and Purchased Services.
Since the 2015-16 Budget, there has been a slight change to the timing of property acquisitions, resulting in expenses increasing by $23.9 million in 2015-16, offset by a reduction in expenses in 2014-15. The cost of purchasing properties was increased in the 2015-16 Budget to reflect actual prices being paid. Costs of demolition to date are broadly in line with the 2015-16 Budget estimates, and no properties have been sold at this stage. Expected sales proceeds are also unchanged from the previous estimates.
The overall budget for the Scheme is unchanged. Variances largely relate to accounting treatments and the timing of acquisitions, demolitions and land sales.
2015-16 Budget Review 36 Loose-fill Asbestos Insulation Eradication Scheme Financial Details
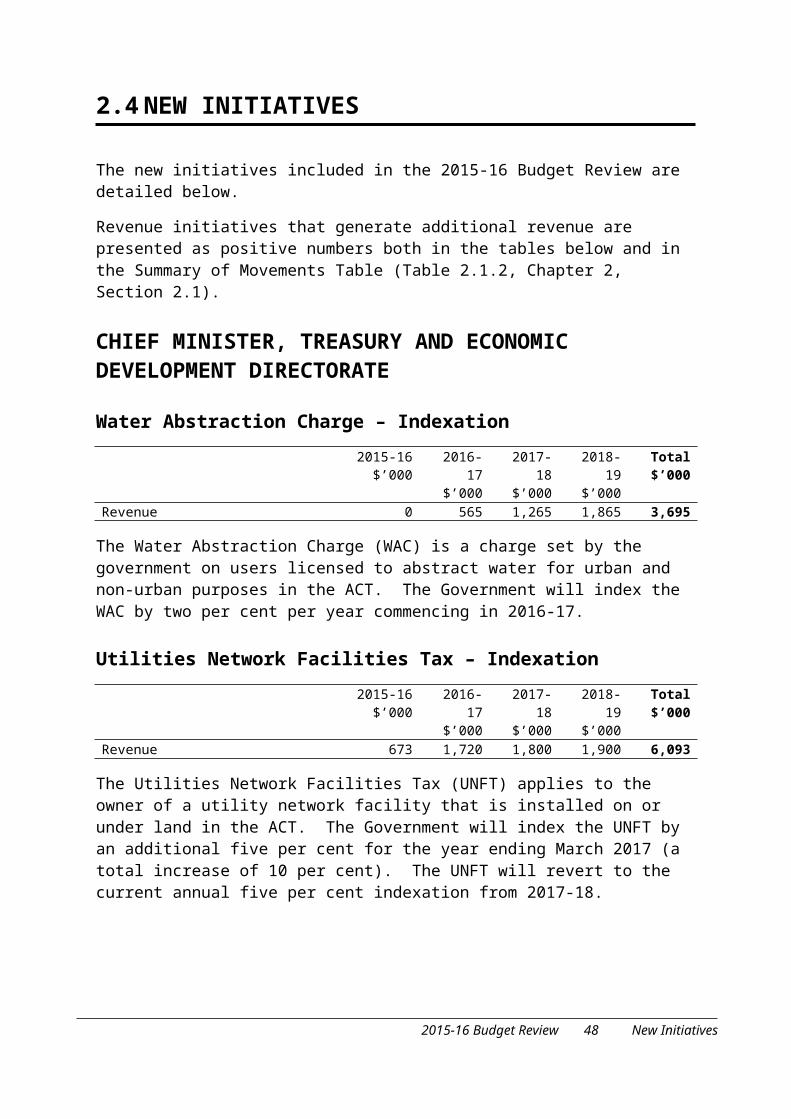
2.4 NEW INITIATIVES
The new initiatives included in the 2015-16 Budget Review are detailed below.
Revenue initiatives that generate additional revenue are presented as positive numbers both in the tables below and in the Summary of Movements Table (Table 2.1.2, Chapter 2, Section 2.1).
CHIEF MINISTER, TREASURY AND ECONOMIC DEVELOPMENT DIRECTORATE
Water Abstraction Charge – IndexationEmpty Cell 2015-16
$’0002016-17
$’0002017-18
$’0002018-19
$’000Total$’000
Revenue 0 565 1,265 1,865 3,695
The Water Abstraction Charge (WAC) is a charge set by the government on users licensed to abstract water for urban and non-urban purposes in the ACT. The Government will index the WAC by two per cent per year commencing in 2016-17.
Utilities Network Facilities Tax – IndexationEmpty Cell 2015-16
$’0002016-17
$’0002017-18
$’0002018-19
$’000Total$’000
Revenue 673 1,720 1,800 1,900 6,093
The Utilities Network Facilities Tax (UNFT) applies to the owner of a utility network facility that is installed on or under land in the ACT. The Government will index the UNFT by an additional five per cent for the year ending March 2017 (a total increase of 10 per cent). The UNFT will revert to the current annual five per cent indexation from 2017-18.
2015-16 Budget Review 37 New Initiatives
2015-16 Budget Review 38 New Initiatives
CHAPTER 3
INFRASTRUCTURE AND CAPITAL
Chapter Page
3.1 Capital Works 41
2015-16 Budget Review 39 Infrastructure and Capital
2015-16 Budget Review 40 Infrastructure and Capital
3.1 CAPITAL WORKS
IntroductionThrough the 2015-16 Infrastructure Investment Program (the Program) outlined in the 2015-16 Budget, the ACT Government announced a record level of capital investment of $2.8 billion over four years from 2015-16. This investment in major infrastructure is setting the foundation for improving productivity and addressing the needs of the Canberra community as the Government looks to diversify the Territory’s economic base and attract investment.
The Government has a clear vision for supporting the economy and infrastructure investment to deliver world-best living standards for Canberra. We are proudly continuing to build new infrastructure, revitalise public infrastructure through the Urban Renewal Program, and plan for the Canberra of tomorrow.
The Program will generate jobs for Canberra, stimulate the building and construction industry in the ACT, and provide the facilities and infrastructure our residents and businesses need. This investment reflects the Government’s commitment to delivering high quality, well maintained infrastructure of which we can all be proud.
The Government is committed to its $2.8 billion Infrastructure Investment Program, including capital works being delivered under Public Private Partnerships (PPPs), over the four years to 2018-19. This includes capital works expenditure ($1.3 billion), investment in information and communication technology projects ($164 million), and plant and equipment ($55 million). The $2.8 billion also includes $1.2 billion in capital works provisions over the four year period ending in 2018-19.
The Government’s approach to PPPs is to provision the capital value of the project until a PPP agreement is reached. Once this occurs, the provision is extinguished and the access payment and other accounting treatments are included in the forward estimates. This approach ensures that the Territory’s forward year financial statements reflect the infrastructure and financing costs of the project. Two major projects that will have this treatment applied include Capital Metro and the new ACT Law Courts Facilities.
Capital Metro currently remains in the $1.2 billion capital work provision, while the new ACT Law Courts Facilities project has been removed from the capital works provision following the announcement of the partnership arrangement in October 2015. The associated access payments for the ACT Law Courts Facilities project have been recognised in the forward estimates of the budget. The final asset will be recognised as a Territory asset and therefore remains as part of the $2.8 billion Infrastructure Investment Program.
2015-16 Budget Review 41 Capital Works
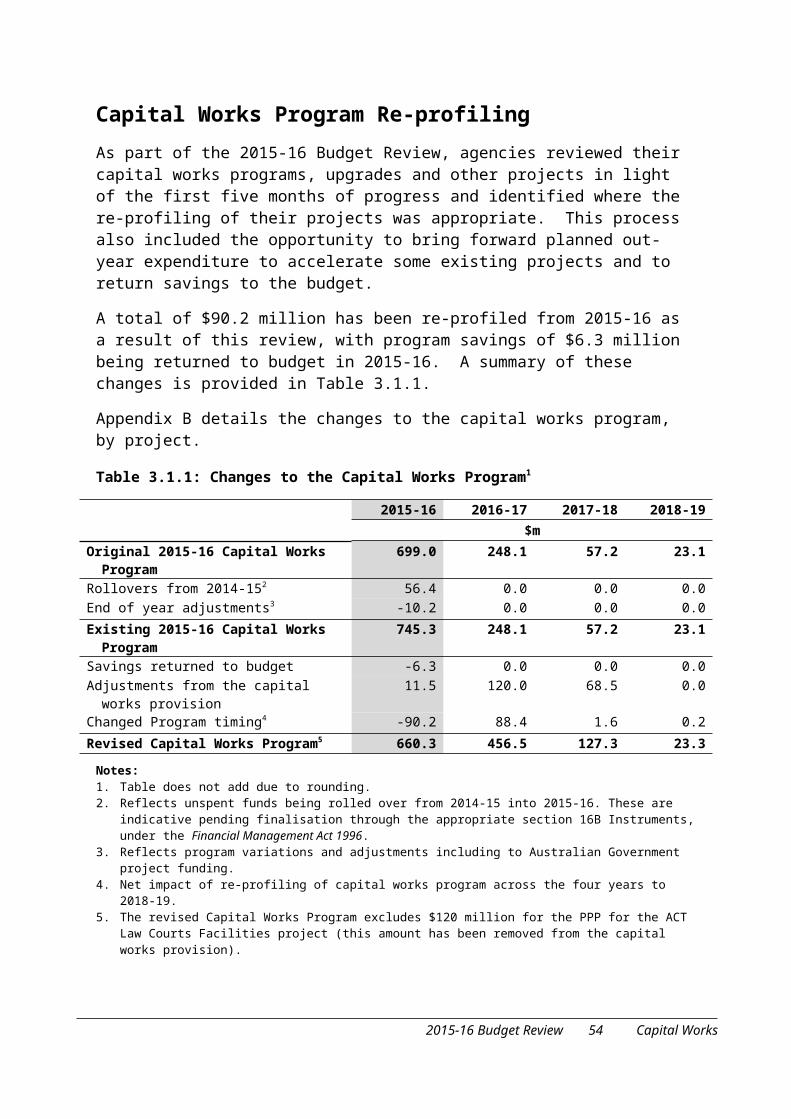
Capital Works Program Re-profilingAs part of the 2015-16 Budget Review, agencies reviewed their capital works programs, upgrades and other projects in light of the first five months of progress and identified where the re-profiling of their projects was appropriate. This process also included the opportunity to bring forward planned out-year expenditure to accelerate some existing projects and to return savings to the budget.
A total of $90.2 million has been re-profiled from 2015-16 as a result of this review, with program savings of $6.3 million being returned to budget in 2015-16. A summary of these changes is provided in Table 3.1.1.
Appendix B details the changes to the capital works program, by project.
Table 3.1.1: Changes to the Capital Works Program1
Empty Cell 2015-16 2016-17 2017-18 2018-19$m
Original 2015-16 Capital Works Program 699.0 248.1 57.2 23.1Rollovers from 2014-152 56.4 0.0 0.0 0.0End of year adjustments3 -10.2 0.0 0.0 0.0
Existing 2015-16 Capital Works Program 745.3 248.1 57.2 23.1Savings returned to budget -6.3 0.0 0.0 0.0Adjustments from the capital works provision 11.5 120.0 68.5 0.0Changed Program timing4 -90.2 88.4 1.6 0.2
Revised Capital Works Program5 660.3 456.5 127.3 23.3
Notes: 1. Table does not add due to rounding.2. Reflects unspent funds being rolled over from 2014-15 into 2015-16. These are indicative pending finalisation through
the appropriate section 16B Instruments, under the Financial Management Act 1996.3. Reflects program variations and adjustments including to Australian Government project funding.4. Net impact of re-profiling of capital works program across the four years to 2018-19.5. The revised Capital Works Program excludes $120 million for the PPP for the ACT Law Courts Facilities project (this
amount has been removed from the capital works provision).
2015-16 Budget Review 42 Capital Works
CHAPTER 4
FEDERAL FINANCIAL RELATIONS
Chapter Page
4.1 Federal Financial Relations Update 45
2015-16 Budget Review 43 Federal Financial Relations
2015-16 Budget Review 44 Federal Financial Relations
4.1 FEDERAL FINANCIAL RELATIONS UPDATE
Commonwealth RevenueThe ACT will receive approximately 41 per cent of its funding from the Commonwealth in 2015-16.
As a result of the timing of the publication of this document, any changes to estimates arising from the Commonwealth’s 2015-16 Mid-Year Economic and Fiscal Outlook have not been reflected in the ACT’s revised estimates nor in this Chapter.
GST RevenueGST revenue grants for 2015-16 have been revised to include a balancing adjustment for an underpayment of GST in 2014-15 following the 2014-15 Commonwealth Final Budget Outcome. This has increased the GST estimate in 2015-16 by $7.2 million compared to that published in the 2015-16 Budget.
Financial Assistance Grants to Local GovernmentsThe Commonwealth advised the ACT on 29 June 2015 that the first two instalments of the 2015-16 estimates of the Financial Assistance Grants to Local Governments (FAGs) would be brought forward into 2014-15. This increased FAGs payments in 2014-15, and has reduced the 2015-16 estimates in 2015-16 by $24.3 million. The bringing forward of the FAGs from 2015-16 into 2014-15 was intended to give local councils immediate use of these funds for critical infrastructure.
Specific Purpose Payments
The Commonwealth has already announced that its approach to health and education funding will change in 2017-18 with its contribution to be indexed by the Consumer Price Index (CPI) and population growth and distributed on a population share basis rather than according to activity. Increasing funding by CPI and population does not provide sufficient funding to meet future growth in expenditure and represents a cost shifting onto the States and Territories.
In the past year the Commonwealth has arranged short-term extensions for Specific Purpose Payments (SPPs) for Bowel Cancer Screening and Breast Screening, as well as for Bushfire Mitigation. No other changes to SPPs have been announced between the Commonwealth’s 2015-16 Budget and 17 November 2015.
2015-16 Budget Review 45 Federal Financial Relations Update
National Partnership Agreements
National Partnership Agreements (NPAs) are currently under review as part of the Commonwealth Government’s White Paper on Reform of the Federation. While this review is being undertaken, the Commonwealth has limited the extension of existing agreements to short-term arrangements of one to two years. This has created uncertainty amongst service providers operating within the affected sectors.
The 2015-16 Commonwealth Budget extended funding for some key NPAs, including the NPAs for Universal Access to Early Childhood Education, Homelessness and Legal Assistance Services. Since then, the Commonwealth has offered a very short-term extension of the NPA on Natural Disaster Resilience, while offering a 12 month agreement for the NPA on Adult Public Dental Services to replace the expiring NPA on Treating More Public Dental Patients.
The Universal Access to Early Childhood Education agreement has also been extended for a further two years until the end of the 2017 school year, with the revised agreement setting more challenging performance targets for the receipt of funding.
Funding and outlays relating to expiring agreements are not included in the ACT Budget Review past their current expiry dates, except where the Commonwealth has made ongoing provision for funding in the 2015-16 Commonwealth Budget.
2015-16 Budget Review 46 Federal Financial Relations Update
CHAPTER 5
ASSET AND LIABILITY MANAGEMENT
Chapter Page
5.1 Net Debt and Net Financial Liabilities 49
5.2 Unfunded Superannuation Liability 51
5.3 Borrowings 53
2015-16 Budget Review 47 Asset and Liability Management
2015-16 Budget Review 48 Asset and Liability Management
5.1 NET DEBT AND NET FINANCIAL LIABILITIES
Net Debt and Net Financial Liabilities are two key indicators of the strength of Government finances. Net Debt is a measure of the Government’s ability to repay its liabilities. It is defined as the sum of the Government’s gross debt, less its liquid financial assets (such as cash and investments). Net Financial Liabilities take into account unfunded superannuation liabilities and provide a broader measure of debt than Net Debt.
Net Worth is the sum of all of the Government assets (both financial and non-financial), less its liabilities.
Tables 5.1.1, 5.1.2, and 5.1.3 below provide a summary of the key balance sheet measures for the General Government Sector.
Table 5.1.1: Net Debt (excluding super)
Empty Cell 2015-16Estimate
2016-17Estimate
2017-18Estimate
2018-19Estimate
Empty Cell $m2015-16 Budget 2,425.7 2,848.6 3,130.0 2,867.32015-16 Budget Review 1,956.5 2,487.9 2,663.0 2,360.6Net Debt to GSP (%) 5.5 6.7 6.8 5.7
Net Debt is projected to decrease in 2015-16 compared with the original budget mainly reflecting higher cash and investments held by the Territory Banking Account. This is consistent with lower cash drawdowns by agencies over 2014-15 and was reflected in the final audited outcome for 2014-15. It also reflects higher than anticipated territorial receipts and capital distributions received in 2014-15. Net Debt is projected to increase across the forward estimates, consistent with annual borrowing requirements, but remains below the levels forecast in the 2015-16 Budget.
Table 5.1.2: Net Financial Liabilities
Empty Cell 2015-16Estimate
2016-17Estimate
2017-18Estimate
2018-19Estimate
Empty Cell $m2015-16 Budget 5,663.9 6,141.0 6,432.3 6,247.92015-16 Budget Review 5,319.1 5,887.2 6,056.9 5,819.4Net Financial Liabilities to GSP (%) 14.8 15.8 15.5 14.1
Net Financial Liabilities are projected to decrease compared with the original budget. This largely reflects the change in cash and investments discussed above. Consistent with the original budget, Net Financial Liabilities are projected to increase across the forward estimates period, largely due to estimated annual borrowings undertaken to support capital projects and a projected growth in the superannuation liability, but remain below the levels forecast in the 2015-16 Budget.
2015-16 Budget Review 49 Net Debt and Net Financial Liabilities
Table 5.1.3: Net Worth
Empty Cell 2015-16BudgetReview
2016-17Estimate
2017-18Estimate
2018-19Estimate
Empty Cell $m2015-16 Budget 16,232.7 16,371.5 16,472.0 16,768.72015-16 Budget Review 16,703.5 16,835.9 16,932.4 17,212.0Net Worth to GSP (%) 46.5 45.1 43.2 41.8
Net Worth is projected to increase compared with the 2015-16 Budget. This increase largely reflects the change in cash and investments discussed above.
2015-16 Budget Review 50 Net Debt and Net Financial Liabilities
5.2 UNFUNDED SUPERANNUATION LIABILITY
ACT Government employees are members of a number of different superannuation schemes as arrangements have changed over time. As at 30 June 2015, 8,507 current full time employees are members of the Commonwealth’s defined benefit superannuation schemes the Commonwealth Superannuation Scheme (CSS) and the Public Sector Superannuation Scheme (PSS).
With the exception of employer productivity contributions, the employer-financed component of entitlements for both of these schemes is unfunded and is not required to be paid until members retire. The Government maintains, as a key financial objective, a funding plan to extinguish the Territory’s unfunded defined benefit superannuation liability by 2030.
The superannuation liability is a long-term liability with employee retirement benefits projected well into the future. The budget superannuation liability valuation estimates therefore incorporate the use of a long-term discount rate estimate of six per cent to calculate the present value of these future estimated superannuation liabilities.
The Superannuation Provision Account (SPA) investment portfolio has a long-term investment strategy that is based on a strategic asset allocation that is projected to deliver a long-term average return of the Consumer Price Index (CPI) plus five per cent per annum (net of fees).
Over the 19 years to 30 June 2015, the SPA investment portfolio has achieved a return of CPI plus 5.2 per cent per annum (net of fees), which is in line with the long-term target return objective of CPI plus five per cent per annum.
The coverage ratio of the Territory’s defined benefit superannuation liability with investment assets is estimated to be 59 per cent as at 30 June 2016 (unchanged from the 2015-16 Budget estimate) based on the liability valuation estimate utilising the long-term budget discount rate assumption and reflecting an investment return in line with the long-term objective.
Based on current estimates, the funding plan remains on target.
Table 5.2.1 below outlines the revised estimates of the SPA.
Table 5.2.1: Superannuation Provision Account
Empty Cell 2015-16 2016-17 2017-18 2018-19Empty Cell $m
Superannuation Assets 3,591.5 3,859.9 4,148.7 4,459.5Superannuation Liabilities 6,096.2 6,369.3 6,634.2 6,890.5Percentage of Funded Superannuation (%) 59 61 63 65
Note: Superannuation liabilities reflect a long-term expected average discount rate of six per cent.
2015-16 Budget Review 51 Unfunded Superannuation Liability

2015-16 Budget Review 52 Unfunded Superannuation Liability
5.3 BORROWINGS
The Government’s debt funding requirements are mainly achieved through the issuance of debt securities in the domestic capital markets by way of the Government’s debt issuance program.
The securities issued include:
long-term inflation-linked bonds where the interest and principal repayments are indexed to inflation that feature differing maturity profiles (2020, 2030 and 2048) and the repayment of principal over time or at maturity;
nominal bonds where the interest cost (coupon) is fixed for the life of each bond and that feature differing maturity profiles (currently 2018, 2020, 2022 and 2024) with the repayment of principal at each maturity; and
short-term discount debt securities with maturities of less than 12 months.
Other funding comprises residual Commonwealth loans provided to the Territory at self-government that are fixed rate, with annual principal repayments and final repayment in 2042. In 2014-15, the debt funding program was supplemented by a $1 billion loan provided from the Commonwealth to fund the costs of the Asbestos Eradication Scheme.
The estimated outstanding borrowings and interest expenses are detailed below in Tables 5.3.1 and 5.3.2.
Table 5.3.1: Territory Borrowings – Principal Outstanding – 2015-16 Budget Review
2015-16 Budget Review 2015-16 2016-17 2017-18 2018-19Empty Cell $m
General Government Sector Empty Cell Empty Cell Empty Cell
Market Borrowings 2,259.9 2,710.1 3,060.3 2,861.7Historic Commonwealth Loans (self-government) 75.7 71.8 67.8 63.7Commonwealth Loan – Asbestos Eradication Scheme 1,000.0 1,000.0 950.0 900.0Sub-Total 3,335.6 3,782.0 4,078.2 3,825.4
Empty Cell Empty Cell Empty Cell Empty Cell
Public Trading Enterprise Sector Empty Cell Empty Cell Empty Cell
Market Borrowings 1,580.8 1,676.8 1,754.2 1,797.4Historic Commonwealth Loans (self-government) 67.5 62.8 58.1 53.5Sub-Total 1,648.3 1,739.5 1,812.3 1,850.8
Total1 4,983.9 5,521.5 5,890.5 5,676.3
Note:1. Refer to sum of ‘Advances Received’ and ‘Other Borrowings’ in Appendix D, Consolidated Total Territory Balance Sheet.
2015-16 Budget Review 53 Borrowings
Table 5.3.2: Territory Borrowings – Interest Expense – 2015-16 Budget
2015-16 Budget 2015-16 2016-17 2017-18 2018-19Empty Cell $m
General Government Sector Empty Cell Empty Cell Empty Cell
Market Borrowings 76.8 100.3 112.8 109.8Historic Commonwealth Loans (self-government) 3.9 3.7 3.5 3.3Commonwealth Loan – Asbestos Eradication Scheme 26.8 27.1 27.1 25.7Sub-Total 107.5 131.1 143.4 138.8
Empty Cell Empty Cell Empty Cell Empty Cell
Public Trading Enterprise Sector Empty Cell Empty Cell Empty Cell
Market Borrowings 77.1 81.9 85.7 89.3Historic Commonwealth Loans (self-government) 3.2 3.0 2.8 2.6Sub-Total 80.3 84.9 88.6 91.9
Total1 187.9 216.0 231.9 230.7
Note:1. Refer to ‘Interest Expense’ in Appendix D, Consolidated Total Territory Operating Statement.
The 2015-16 borrowing program remains largely unchanged from the one published at the time of the 2015-16 Budget, with the funding transaction to be completed opportunistically in conjunction with liquidity requirements.
2015-16 Budget Review 54 Borrowings
CHAPTER 6
GENERAL GOVERNMENT SECTOR FINANCIAL STATEMENTS
Chapter Page
6.1 GGS GFS/GAAP Harmonised Financial Statements 57
2015-16 Budget Review 55 General Government SectorFinancial Statements
2015-16 Budget Review 56 General Government SectorFinancial Statements

6.1 GGS GFS/GAAP HARMONISED FINANCIAL STATEMENTS
Australian Capital TerritoryGeneral Government Sector
Operating Statement Empty Cell 2014-15 2015-16 2015-16 2016-17 2017-18 2018-19
Empty Cell
ActualOutcome
AnnualBudget
RevisedEstimate
RevisedEstimate
RevisedEstimate
RevisedEstimate
Empty Cell $’000 $’000 $’000 $’000 $’000 $’000Empty Cell Empty Cell Empty Cell Empty Cell Empty Cell Empty Cell Empty Cell
Revenue Empty Cell Empty Cell Empty Cell Empty Cell Empty Cell Empty Cell
Taxation Revenue 1,376,763 1,491,730 1,524,481 1,604,809 1,720,227 1,840,805Grants Revenue Empty Cell Empty Cell Empty Cell Empty Cell Empty Cell Empty Cell
Commonwealth Grants 1,991,719 1,860,511 1,866,002 2,024,227 2,070,549 2,124,503Gains from Contributed Assets 82,062 109,573 109,573 166,120 136,719 120,229
Sales of Goods and Services 475,473 482,202 471,928 485,463 566,859 578,341Interest Income 130,797 135,201 135,430 141,065 143,433 137,544Distributions from Financial
Investments68,692 63,167 28,631 38,291 48,551 52,037
Dividend and Income Tax Equivalents Income
298,838 329,428 331,474 296,254 275,262 307,155
Other Revenue 129,715 137,729 134,058 137,186 139,312 142,168Total Revenue 4,554,059 4,609,541 4,601,577 4,893,415 5,100,912 5,302,782
Empty Cell Empty Cell Empty Cell Empty Cell Empty Cell Empty Cell Empty Cell
Expenses Empty Cell Empty Cell Empty Cell Empty Cell Empty Cell Empty Cell
Employee Expenses 1,761,285 1,805,053 1,805,098 1,849,615 1,880,311 1,939,165Superannuation Expenses Empty Cell Empty Cell Empty Cell Empty Cell Empty Cell Empty Cell
Superannuation Interest Cost 313,820 350,898 315,401 366,913 382,446 397,490Other Superannuation Expense 332,212 268,258 361,416 278,298 280,225 282,016
Depreciation and Amortisation 355,531 372,258 368,565 389,870 403,846 419,182Interest Expense 158,568 203,895 189,042 215,567 235,186 220,009Other Operating Expenses Empty Cell Empty Cell Empty Cell Empty Cell Empty Cell Empty Cell
Supplies and Services 831,523 991,906 1,007,808 974,701 1,003,734 1,044,922Other Operating Expenses 169,152 250,940 215,582 200,870 204,836 207,251
Grants and Purchased Services 1,220,887 905,339 977,595 912,475 952,292 960,370Total Expenses 5,142,979 5,148,547 5,240,507 5,188,309 5,342,876 5,470,405
Empty Cell Empty Cell Empty Cell Empty Cell Empty Cell Empty Cell Empty Cell
UPF Net Operating Balance -588,919 -539,006 -638,930 -294,894 -241,964 -167,623Empty Cell Empty Cell Empty Cell Empty Cell Empty Cell Empty Cell Empty Cell
Other Economic Flows – Included in the Operating Result
Empty Cell Empty Cell Empty Cell Empty Cell Empty Cell Empty Cell
Dividends (Market Gains on Land Sales)
5,074 49,775 49,775 132,315 20,639 88,251
Net Land Revenue (Undeveloped Land Value)
49,063 89,746 89,746 87,367 107,909 124,547
Net Gain/(Loss) on Sale/(Disposal) of Non-Financial Assets
-50,469 -1,732 -1,694 -1,821 -1,800 -1,881
Empty Cell Empty Cell Empty Cell Empty Cell Empty Cell Empty Cell Empty Cell
Empty Cell Empty Cell Empty Cell Empty Cell Empty Cell Empty Cell Empty Cell
Empty Cell Empty Cell Empty Cell Empty Cell Empty Cell Empty Cell Empty Cell
Empty Cell Empty Cell Empty Cell Empty Cell Empty Cell Empty Cell Empty Cell
Empty Cell Empty Cell Empty Cell Empty Cell Empty Cell Empty Cell Empty Cell
2015-16 Budget Review 57 GGS GFS/GAAP HarmonisedFinancial Statements
Australian Capital TerritoryGeneral Government Sector
Operating Statement Empty Cell 2014-15 2015-16 2015-16 2016-17 2017-18 2018-19
Empty Cell
ActualOutcome
AnnualBudget
RevisedEstimate
RevisedEstimate
RevisedEstimate
RevisedEstimate
Empty Cell $’000 $’000 $’000 $’000 $’000 $’000Net Gain/(Loss) on Financial Assets or
Liabilities at Fair Value246,593 131,440 161,944 172,175 186,351 200,489
Doubtful Debts -2,479 -5,804 -5,804 -6,015 -6,156 -6,379Empty Cell Empty Cell Empty Cell Empty Cell Empty Cell Empty Cell Empty Cell
Operating Result -341,138 -275,581 -344,963 89,127 64,979 237,404 Empty Cell Empty Cell Empty Cell Empty Cell Empty Cell Empty Cell
Other Economic Flows - Other Comprehensive Income
Empty Cell Empty Cell Empty Cell Empty Cell Empty Cell Empty Cell
Items that will not be Reclassified Subsequently to Profit or Loss
Empty Cell Empty Cell Empty Cell Empty Cell Empty Cell Empty Cell
Payments to ACT Government Agencies
-43,421 - -38,401 -12,038 -5,000 -5,000
Capital Distributions 8,858 - - 5,155 56,367 -Superannuation Actuarial Gain/(Loss) -666,808 - 2,733,049 - - -Prior Year Adjustment -612 - - - - -Other Movements -132 889 889 889 889 889Increase/(Decrease) in the Asset
Revaluation Surplus133,365 18,954 19,284 30,735 30,736 30,735
Increase/(Decrease) in Other Reserves 300 - - - - -Empty Cell Empty Cell Empty Cell Empty Cell Empty Cell Empty Cell Empty Cell
Items that may be Subsequently Reclassified to Profit or Loss
Empty Cell Empty Cell Empty Cell Empty Cell Empty Cell Empty Cell
Increase/(Decrease) in Net Assets of Public Trading Entities
314,612 - 48,688 31,701 67,421 15,576
Empty CellEmpty Cell Empty Cell Empty Cell Empty Cell Empty Cell Empty Cell
Total Comprehensive Income -594,976 -255,738 2,418,546 145,569 215,392 279,604 Empty Cell Empty Cell Empty Cell Empty Cell Empty Cell Empty Cell Empty Cell
UPF Net Operating Balance -588,919 -539,006 -638,930 -294,894 -241,964 -167,623less Net Acquisition of Non-Financial
AssetsEmpty Cell Empty Cell Empty Cell Empty Cell Empty Cell Empty Cell
Payments for Non-Financial Assets 813,220 1,022,674 934,735 980,065 704,019 444,986Sales of Non-Financial Assets -44,187 -55,834 -55,497 -81,942 -135,025 -135,025Land Revenue (Net Cash Receipts) -65,135 -79,843 -79,843 -72,802 -83,888 -100,617Depreciation and Amortisation -355,531 -372,258 -368,565 -389,870 -403,846 -419,182Other Movements in Non-Financial
Assets76,884 109,313 109,313 165,849 136,439 119,938
Total Net Acquisition of Non-Financial Assets
425,251 624,052 540,143 601,300 217,699 -89,900
Empty Cell Empty Cell Empty Cell Empty Cell Empty Cell Empty Cell Empty Cell
Net Lending / (Borrowing) -1,014,170 -1,163,058 -1,179,073 -896,194 -459,663 -77,723Empty Cell
Empty Cell Empty Cell Empty Cell Empty Cell Empty Cell Empty Cell
Empty CellEmpty Cell Empty Cell Empty Cell Empty Cell Empty Cell Empty Cell
Empty CellEmpty Cell Empty Cell Empty Cell Empty Cell Empty Cell Empty Cell
Empty CellEmpty Cell Empty Cell Empty Cell Empty Cell Empty Cell Empty Cell
Empty CellEmpty Cell Empty Cell Empty Cell Empty Cell Empty Cell Empty Cell
Empty CellEmpty Cell Empty Cell Empty Cell Empty Cell Empty Cell Empty Cell
2015-16 Budget Review 58 GGS GFS/GAAP HarmonisedFinancial Statements
Australian Capital TerritoryGeneral Government Sector
Operating Statement Empty Cell 2014-15 2015-16 2015-16 2016-17 2017-18 2018-19
Empty Cell
ActualOutcome
AnnualBudget
RevisedEstimate
RevisedEstimate
RevisedEstimate
RevisedEstimate
Empty Cell $’000 $’000 $’000 $’000 $’000 $’000GOVERNMENT FISCAL MEASURE –
BUDGET OPERATING SURPLUS/DEFICIT
Empty Cell Empty Cell Empty Cell Empty Cell Empty Cell Empty Cell
UPF Net Operating Balance -588,919 -539,006 -638,930 -294,894 -241,964 -167,623Superannuation Return Adjustment 109,636 131,440 160,320 172,175 186,351 200,489
Empty Cell Empty Cell Empty Cell Empty Cell Empty Cell Empty Cell Empty Cell
HEADLINE NET OPERATING BALANCE -479,283 -407,566 -478,610 -122,719 -55,613 32,866
2015-16 Budget Review 59 GGS GFS/GAAP HarmonisedFinancial Statements
Australian Capital TerritoryGeneral Government Sector
Balance SheetEmpty Cell 2014-15 2015-16 2015-16 2016-17 2017-18 2018-19Empty Cell Actual
OutcomeAnnualBudget
RevisedEstimate
RevisedEstimate
RevisedEstimate
RevisedEstimate
Empty Cell $’000 $’000 $’000 $’000 $’000 $’000Empty Cell Empty Cell Empty Cell Empty Cell Empty Cell Empty Cell Empty Cell
Financial Assets Empty Cell Empty Cell Empty Cell Empty Cell Empty Cell Empty Cell
Cash and Deposits 723,610 317,777 443,283 442,428 436,505 429,650Advances Paid 1,594,828 1,688,810 1,684,057 1,777,506 1,849,943 1,887,996Investments and Loans 4,220,199 4,231,169 4,556,373 4,659,432 5,165,270 5,537,103Receivables 405,049 422,773 529,013 520,609 527,908 435,007Equity - Investments in Other Public
Sector Entities6,036,024 5,768,346 6,084,712 6,116,413 6,183,834 6,199,410
Total Financial Assets 12,979,710 12,428,875 13,297,438 13,516,388 14,163,460 14,489,166Empty Cell Empty Cell Empty Cell Empty Cell Empty Cell Empty Cell Empty Cell
Non-Financial Assets Empty CellEmpty Cell Empty Cell Empty Cell Empty Cell Empty Cell
Produced Assets Empty CellEmpty Cell Empty Cell Empty Cell Empty Cell Empty Cell
Property, Plant and Equipment 11,532,720 11,205,033 11,487,120 11,920,226 12,409,021 12,500,248Investment Properties 2,600 2,600 2,600 2,600 2,600 2,600Intangibles 52,975 87,701 77,783 85,599 112,829 124,847Inventories 14,338 16,353 14,536 14,734 14,933 15,133Assets Held for Sale 50 690 50 50 50 50Capital Works-in-Progress 620,437 1,212,637 856,584 1,006,733 660,708 555,688
Non Produced AssetsProperty, Plant and Equipment 2,719,384 3,576,786 3,078,046 3,199,536 3,317,449 3,438,358Loose-Fill Asbestos Insulation
Eradication Scheme Land282,617 - 394,622 350,746 261,390 168,567
Biological Assets 26,489 26,457 26,489 26,489 26,489 26,489 Other Non-Financial Assets 17 45 2 2 2 2Total Non-Financial Assets 15,251,626 16,128,302 15,937,832 16,606,715 16,805,471 16,831,982Total Assets 28,231,336 28,557,177 29,235,270 30,123,103 30,968,931 31,321,148
Empty Cell Empty Cell Empty Cell Empty Cell Empty Cell Empty Cell Empty Cell
Liabilities Empty Cell Empty Cell Empty Cell Empty Cell Empty Cell Empty Cell
Deposits Held 133,785 133,034 137,747 54,140 139,347 138,764Advances Received 829,400 1,075,688 1,075,688 1,071,835 1,017,833 963,676Borrowings Empty Cell Empty Cell Empty Cell Empty Cell Empty Cell Empty Cell
Finance Leases 277 22,312 294 181 63 22Other Borrowings 3,148,401 3,826,776 3,840,755 4,386,886 4,814,539 4,659,113
Superannuation 8,499,767 6,098,349 6,103,111 6,376,343 6,641,258 6,897,582Employee Benefits 660,355 618,271 648,273 676,713 703,546 730,473Other Provisions 219,730 33,789 236,877 204,381 172,420 140,476Payables 432,621 500,238 481,967 510,955 542,043 573,822Other Liabilities 22,052 15,998 7,064 5,726 5,467 5,199Total Liabilities 13,946,388 12,324,455 12,531,776 13,287,160 14,036,516 14,109,127
Empty Cell Empty Cell Empty Cell Empty Cell Empty Cell Empty Cell Empty Cell
Net Assets 14,284,948 16,232,722 16,703,494 16,835,943 16,932,415 17,212,021Empty Cell Empty Cell Empty Cell Empty Cell Empty Cell Empty Cell Empty Cell
Empty Cell Empty Cell Empty Cell Empty Cell Empty Cell Empty Cell Empty Cell
Empty Cell Empty Cell Empty Cell Empty Cell Empty Cell Empty Cell Empty Cell
Empty Cell Empty Cell Empty Cell Empty Cell Empty Cell Empty Cell Empty Cell
Empty Cell Empty Cell Empty Cell Empty Cell Empty Cell Empty Cell Empty Cell
2015-16 Budget Review 60 GGS GFS/GAAP HarmonisedFinancial Statements
Australian Capital TerritoryGeneral Government Sector
Balance SheetEmpty Cell 2014-15 2015-16 2015-16 2016-17 2017-18 2018-19Empty Cell Actual
OutcomeAnnualBudget
RevisedEstimate
RevisedEstimate
RevisedEstimate
RevisedEstimate
Empty Cell $’000 $’000 $’000 $’000 $’000 $’000Empty Cell Empty Cell Empty Cell Empty Cell Empty Cell Empty Cell Empty Cell
Equity in Public Trading Entities 6,036,024 5,768,346 6,084,712 6,116,413 6,183,834 6,199,410Accumulated Funds 2,926,370 5,134,842 5,276,944 5,346,957 5,345,272 5,578,567Asset Revaluation Surplus 5,322,054 5,329,184 5,341,388 5,372,093 5,402,809 5,433,544Other Reserves 500 350 500 500 500 500
Empty Cell Empty Cell Empty Cell Empty Cell Empty Cell Empty Cell Empty Cell
Net Worth 14,284,948 16,232,722 16,703,494 16,835,943 16,932,415 17,212,021Empty Cell Empty Cell Empty Cell Empty Cell Empty Cell Empty Cell Empty Cell
Net Financial Worth -966,678 104,420 765,662 229,228 126,944 380,039Net Financial Liabilities 7,002,702 5,663,926 5,319,050 5,887,185 6,056,890 5,819,371Net Debt (Including
Superannuation Related Investments)
-2,426,775 -1,179,946 -1,629,229 -1,366,324 -1,479,936 -2,093,174
Net Debt (Excluding Superannuation Related Investments)
909,557 2,425,710 1,956,515 2,487,860 2,663,012 2,360,561
Empty Cell Empty Cell Empty Cell Empty Cell Empty Cell Empty Cell Empty Cell
2015-16 Budget Review 61 GGS GFS/GAAP HarmonisedFinancial Statements
Australian Capital TerritoryGeneral Government Sector
Statement of Changes in Equity Empty Cell 2014-15 2015-16 2015-16 2016-17 2017-18 2018-19
Empty Cell
ActualOutcome
AnnualBudget
RevisedEstimate
RevisedEstimate
RevisedEstimate
RevisedEstimate
Empty Cell $’000 $’000 $’000 $’000 $’000 $’000Empty Cell
Empty Cell Empty Cell Empty Cell Empty CellEmpty Cell Empty Cell
Opening Equity Empty Cell Empty Cell Empty Cell Empty CellEmpty Cell Empty Cell
Opening Equity in Public Trading Entities
5,721,412 5,727,069 6,036,024 6,084,712 6,116,413 6,183,834
Opening Accumulated Funds 3,874,849 5,440,535 2,926,370 5,276,944 5,346,957 5,345,270Opening Asset Revaluation Surplus 5,283,464 5,310,230 5,322,054 5,341,338 5,372,073 5,402,809Opening Other Reserves 200 350 500 500 500 500Opening Balance 14,879,924 16,478,184 14,284,948 16,703,494 16,835,943 16,932,415
Empty Cell Empty Cell Empty Cell Empty Cell Empty Cell Empty Cell Empty Cell
Comprehensive Income Empty Cell Empty Cell Empty Cell Empty Cell Empty Cell Empty Cell
Included in Accumulated Funds: Empty Cell Empty Cell Empty Cell Empty Cell Empty Cell Empty Cell
Operating Result for the Period -341,138 -275,581 -344,963 89,127 64,979 237,404Payments to ACT Government
Agencies-43,421 - -38,401 -12,038 -5,000 -5,000
Capital Distributions 8,858 - - 5,155 56,367 -Superannuation Actuarial
Gain/(Loss)-666,808 - 2,733,049 - - -
Prior Year Adjustment -612 - - - - -Other Movements -132 889 889 889 889 889
Included in Equity in Public Trading Entities:
Empty Cell Empty Cell Empty Cell Empty Cell Empty Cell Empty Cell
Increase/(Decrease) in Net Assets of Public Trading Entities
314,612 - 48,688 31,701 67,421 15,576
Included in Asset Revaluation Surplus:
Empty Cell Empty Cell Empty Cell Empty Cell Empty Cell Empty Cell
Increase/(Decrease) in the Asset Revaluation Surplus
133,365 18,954 19,284 30,735 30,736 30,735
Included in Other Reserves: Empty Cell Empty Cell Empty Cell Empty Cell Empty Cell Empty Cell
Increase/(Decrease) in Other Reserves
300 - - - - -
Total Comprehensive Income -594,976 -255,738 2,418,546 145,569 215,392 279,604 Empty Cell
Empty Cell Empty Cell Empty Cell Empty Cell Empty Cell Empty Cell
Other Empty Cell Empty Cell Empty Cell Empty Cell Empty Cell Empty Cell
Transfer to/(from) Accumulated Funds
94,774 - - - - -
Movement in the Asset Revaluation Surplus
-94,774 - - - - -
Total Other 0 0 0 0 0 0 Empty Cell Empty Cell Empty Cell Empty Cell Empty Cell Empty Cell Empty Cell
Transactions Involving Owners Affecting Accumulated Funds
Empty Cell Empty Cell Empty Cell Empty Cell Empty Cell Empty Cell
Included in Accumulated Funds: Empty Cell Empty Cell Empty Cell Empty Cell Empty Cell Empty Cell
Capital Injections/Distributions - -31,001 - - - -Transfer of Assets to the PTE Sector - - - -13,120 -118,920 -Included in Equity in Public Trading
Entities:
Empty Cell Empty Cell Empty Cell Empty Cell Empty Cell Empty Cell
Empty Cell Empty Cell Empty Cell Empty Cell Empty Cell Empty Cell Empty Cell
Empty Cell Empty Cell Empty Cell Empty Cell Empty Cell Empty Cell Empty Cell
2015-16 Budget Review 62 GGS GFS/GAAP HarmonisedFinancial Statements
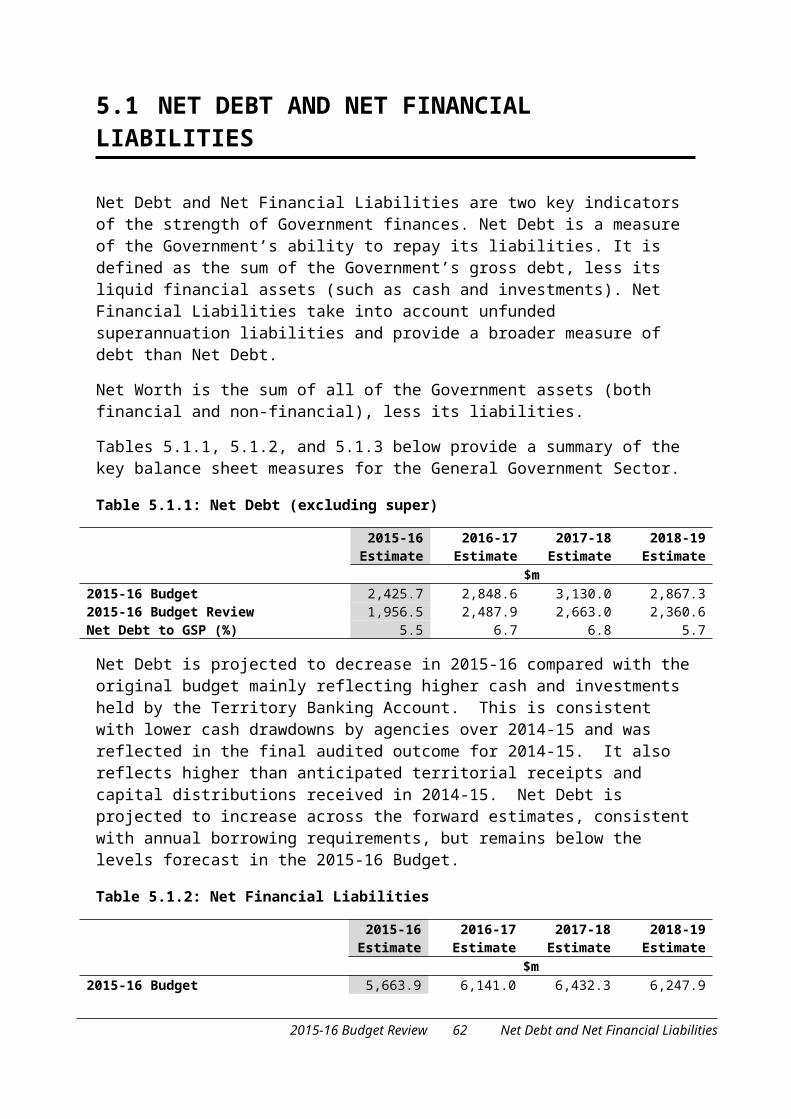
Australian Capital TerritoryGeneral Government Sector
Statement of Changes in Equity Empty Cell 2014-15 2015-16 2015-16 2016-17 2017-18 2018-19
Empty Cell
ActualOutcome
AnnualBudget
RevisedEstimate
RevisedEstimate
RevisedEstimate
RevisedEstimate
Empty Cell $’000 $’000 $’000 $’000 $’000 $’000Increase/(Decrease) in Net Assets of
Public Trading Entities- 41,277 - - - -
Total Transactions Involving Owners Affecting Accumulated Funds
0 10,276 0 -13,120 -118,920 0
Empty Cell Empty Cell Empty Cell Empty Cell Empty Cell Empty Cell Empty Cell
Closing Equity Empty Cell Empty Cell Empty Cell Empty Cell Empty Cell Empty Cell
Closing Equity in Public Trading Entities
6,036,024 5,768,346 6,084,712 6,116,413 6,183,834 6,199,410
Closing Accumulated Funds 2,926,370 5,134,842 5,276,944 5,346,957 5,345,272 5,578,567Closing Asset Revaluation Surplus 5,322,054 5,329,184 5,341,338 5,372,073 5,402,809 5,433,544Closing Other Reserves 500 350 500 500 500 500
Empty Cell Empty Cell Empty Cell Empty Cell Empty Cell Empty Cell Empty Cell
Balance at the End of the Reporting Period
14,284,948 16,232,722 16,703,494 16,835,943 16,932,415 17,212,021
2015-16 Budget Review 63 GGS GFS/GAAP HarmonisedFinancial Statements
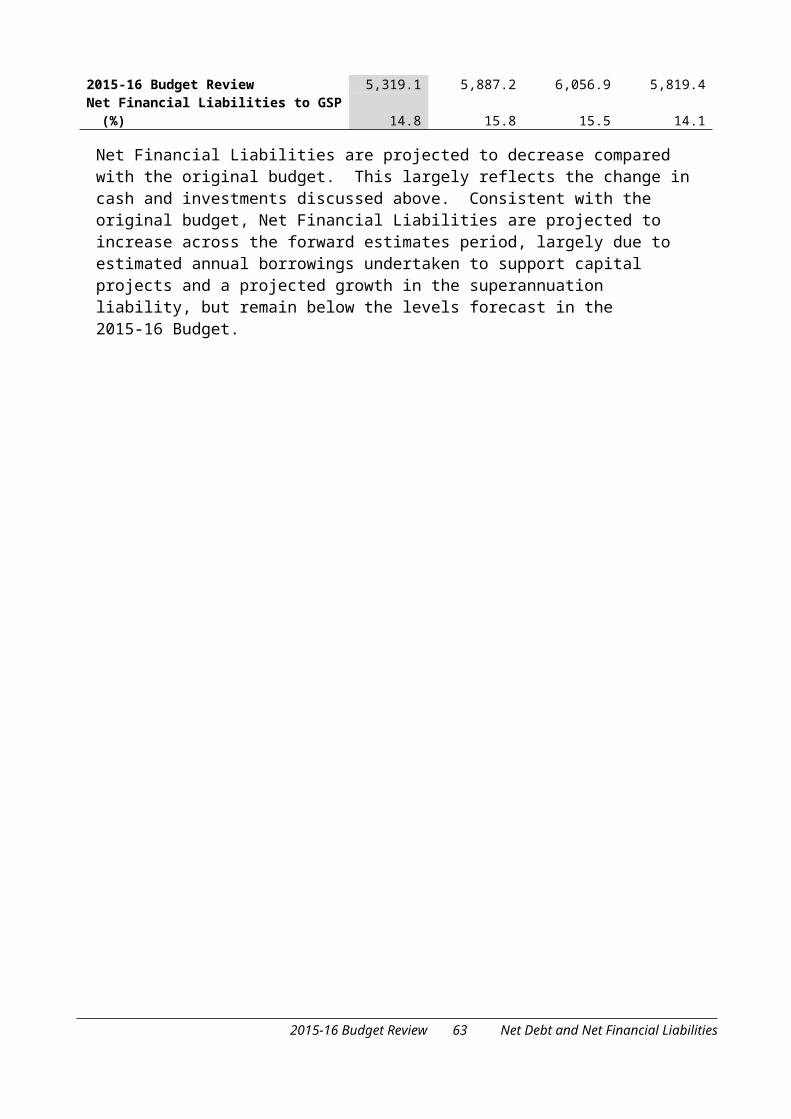
Australian Capital TerritoryGeneral Government Sector
Cash Flow Statement Empty Cell 2014-15 2015-16 2015-16 2016-17 2017-18 2018-19 Empty Cell Actual
OutcomeAnnualBudget
RevisedEstimate
RevisedEstimate
RevisedEstimate
RevisedEstimate
Empty Cell $’000 $’000 $’000 $’000 $’000 $’000Cash Flows from Operating
ActivitiesEmpty Cell Empty Cell Empty Cell Empty Cell Empty Cell Empty Cell
Cash Receipts Empty Cell Empty Cell Empty Cell Empty Cell Empty CellEmpty Cell
Taxes Received 1,377,007 1,493,652 1,516,347 1,610,334 1,727,924 1,847,465Receipts from Sales of Goods and
Services516,801 532,606 521,653 536,780 635,194 666,936
Grants/Subsidies Received 1,989,100 1,864,625 1,866,300 2,029,083 2,102,919 2,124,216Distributions from Financial
Investments60,135 63,166 137,878 140,077 142,638 137,387
Interest Receipts 134,192 133,972 28,631 38,291 48,551 52,037Dividends and Income Tax
Equivalents257,711 279,798 291,900 295,650 229,718 403,533
Other Receipts 369,172 408,483 408,280 407,785 407,899 409,248Total Cash Received from
Operating Activities4,704,118 4,776,302 4,770,989 5,058,000 5,294,843 5,640,822
Empty Cell Empty Cell Empty Cell Empty Cell Empty Cell Empty Cell Empty Cell
Cash Payments Empty Cell Empty Cell Empty Cell Empty Cell Empty Cell Empty Cell
Payments for Employees -2,035,583 -2,171,135 -2,175,481 -2,219,692 -2,278,059 -2,362,865Payments for Goods and Services -852,108 -921,074 -947,078 -902,492 -954,724 -1,006,208Grants/Subsidies Paid -1,111,300 -986,620 -1,022,780 -913,133 -941,275 -937,860Interest Paid -152,477 -202,159 -187,692 -215,910 -234,708 -218,962Other Payments -379,187 -501,193 -439,818 -475,300 -461,137 -464,087Total Cash Paid from Operating
Activities-4,530,655 -4,782,181 -4,772,849 -4,726,527 -4,869,903 -4,989,982
Net Cash Flows from Operating Activities
173,463 -5,879 -1,860 331,473 424,940 650,840
Empty Cell Empty Cell Empty Cell Empty Cell Empty Cell Empty Cell Empty Cell
Cash Flows from Investing Activities
Empty Cell Empty Cell Empty Cell Empty Cell Empty Cell Empty Cell
Cash Flows from Investments in Non-Financial Assets
Empty Cell Empty Cell Empty Cell Empty Cell Empty Cell
Sales of Non-Financial Assets 44,187 55,834 55,497 81,942 135,025 135,025Payments for Non-Financial Assets -813,220 -1,022,674 -934,735 -980,065 -704,019 -444,986Net Cash Flows from Investments
in Non-Financial Assets-769,033 -966,840 -879,238 -898,123 -568,994 -309,961
Empty Cell Empty Cell Empty Cell Empty Cell Empty Cell Empty Cell Empty Cell
Cash Flows from Investments in Financial Assets for Policy Purposes
Empty Cell Empty Cell Empty Cell Empty Cell Empty Cell Empty Cell
Cash Receipts Empty Cell Empty Cell Empty Cell Empty Cell Empty Cell Empty Cell
Repayment of Loans 73 498 498 366 2,778 2,728Capital Receipts from Government
Agencies110,253 - - 5,155 56,367 -
Dividends - Market Gains on Land Sales
5,074 49,775 49,775 132,315 20,639 88,251
Total Cash Received from Investment in Financial Assets for Policy Purposes
115,400 50,273 50,273 137,836 79,784 90,979
2015-16 Budget Review 64 GGS GFS/GAAP HarmonisedFinancial Statements
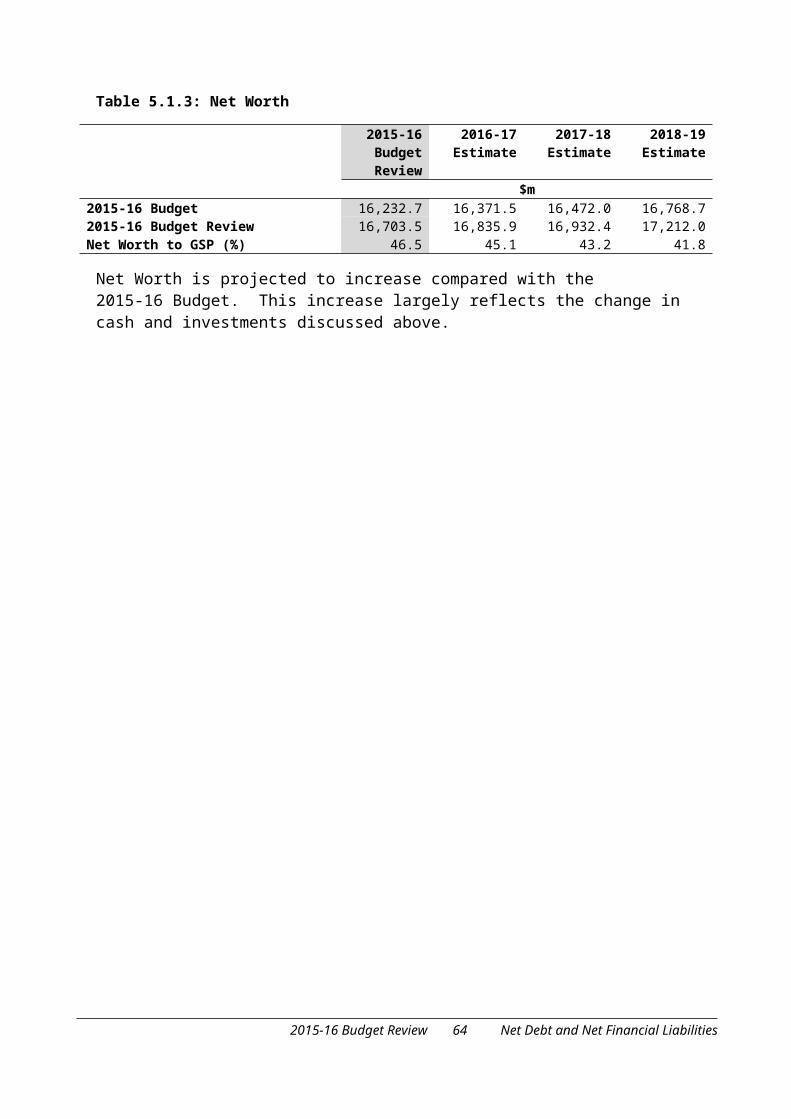
Australian Capital TerritoryGeneral Government Sector
Cash Flow Statement Empty Cell 2014-15 2015-16 2015-16 2016-17 2017-18 2018-19 Empty Cell Actual
OutcomeAnnualBudget
RevisedEstimate
RevisedEstimate
RevisedEstimate
RevisedEstimate
Empty Cell $’000 $’000 $’000 $’000 $’000 $’000Empty Cell Empty Cell Empty Cell Empty Cell Empty Cell Empty Cell Empty Cell
Cash Payments Empty Cell Empty Cell Empty Cell Empty Cell Empty Cell Empty Cell
Issue of Loans - -62 -62 -62 -62 -62Capital Payments to Government
Agencies-43,421 -31,001 -38,401 -12,038 -5,000 -5,000
Total Cash Paid from Investments in Financial Assets for Policy Purposes
-43,421 -31,063 -38,463 -12,100 -5,062 -5,062
Net Cash Flows from Investments in Financial Assets for Policy Purposes
71,978 19,210 11,810 125,736 74,722 85,917
Empty Cell Empty Cell Empty Cell Empty Cell
Cash Flows from Investments in Financial Assets for Liquidity Purposes
Empty Cell Empty Cell Empty Cell Empty Cell Empty Cell Empty Cell
Sales of Investments 589,496 712,341 727,541 525,929 425,533 347,509Payments for Investments -564,887 -644,658 -866,064 -532,281 -658,620 -517,803Cash Flows from Investments in
Financial Assets for Liquidity Purposes
24,610 67,683 -138,523 -6,352 -233,087 -170,294
Net Cash Flows from Investing Activities
-672,445 -879,947 -1,005,951 -778,739 -727,359 -394,338
Empty Cell Empty Cell Empty Cell Empty Cell Empty Cell Empty Cell Empty Cell
Cash Flows from Financing Activities
Empty Cell Empty Cell Empty Cell Empty Cell Empty Cell Empty Cell
Cash Receipts Empty Cell Empty Cell Empty Cell Empty Cell Empty Cell Empty Cell
Borrowings 866,809 960,968 883,853 570,880 754,144 29,228Total Cash Received from
Financing Activities866,809 960,968 883,853 570,880 754,144 29,228
Empty Cell Empty Cell Empty Cell Empty Cell Empty Cell Empty Cell Empty Cell
Cash Payments Empty Cell Empty Cell Empty Cell Empty Cell Empty Cell Empty Cell
Borrowings -71,628 -117,180 -113,862 -124,469 -457,648 -292,585Total Cash Paid from Financing
Activities-71,628 -117,180 -113,862 -124,469 -457,648 -292,585
Net Cash Flows from Financing Activities
795,181 834,788 769,991 446,411 296,496 -263,357
Net Increase/(Decrease) in Cash Held
296,198 -42,038 -237,820 -855 -5,923 -6,855
Empty Cell Empty Cell Empty Cell Empty Cell Empty Cell Empty Cell Empty Cell
Cash and Cash Equivalents at the Beginning of Reporting Period
415,002 375,354 710,200 472,380 471,525 465,602
Cash and Cash Equivalents at the End of Reporting Period
710,200 333,316 472,380 471,525 465,602 458,747
Empty Cell Empty Cell Empty Cell Empty Cell Empty Cell Empty Cell Empty Cell
Empty Cell Empty Cell Empty Cell Empty Cell Empty Cell Empty Cell Empty Cell
Empty Cell Empty Cell Empty Cell Empty Cell Empty Cell Empty Cell Empty Cell
Empty Cell Empty Cell Empty Cell Empty Cell Empty Cell Empty Cell Empty Cell
Empty Cell Empty Cell Empty Cell Empty Cell Empty Cell Empty Cell Empty Cell
2015-16 Budget Review 65 GGS GFS/GAAP HarmonisedFinancial Statements
Australian Capital TerritoryGeneral Government Sector
Cash Flow Statement Empty Cell 2014-15 2015-16 2015-16 2016-17 2017-18 2018-19 Empty Cell Actual
OutcomeAnnualBudget
RevisedEstimate
RevisedEstimate
RevisedEstimate
RevisedEstimate
Empty Cell $’000 $’000 $’000 $’000 $’000 $’000
Key Fiscal Aggregates Empty Cell Empty Cell Empty Cell Empty Cell Empty Cell Empty Cell
Net Cash from Operating Activities 173,463 -5,879 -1,860 331,473 424,940 650,840Investments in Non-Financial
Assets-769,033 -966,840 -879,238 -898,123 -568,994 -309,961
Cash Surplus (+) / Deficit (-) -595,571 -972,719 -881,098 -566,650 -144,054 340,879Note that a positive number denotes a cash inflow, while a negative sign denotes a cash outflow. Empty Cell
Derivation of ABS GFS Cash Surplus/Deficit
Empty Cell Empty Cell Empty Cell Empty Cell Empty Cell Empty Cell
Cash Surplus (+) / Deficit (-) -595,571 -972,719 -881,098 -566,650 -144,054 340,879Acquisitions Under Finance Leases
and Similar Arrangements(a)- - - - - -
Empty Cell Empty Cell Empty Cell Empty Cell Empty Cell Empty Cell Empty Cell
ABS GFSCash Surplus (+)/Deficit (-)
Including Finance and Similar Arrangements
-595,571 -972,719 -881,098 -566,650 -144,054 340,879
Note: (a) Finance leases are shown with a negative sign as they are deducted in compiling the ABS GFS cash surplus/deficit.
2015-16 Budget Review 66 GGS GFS/GAAP HarmonisedFinancial Statements
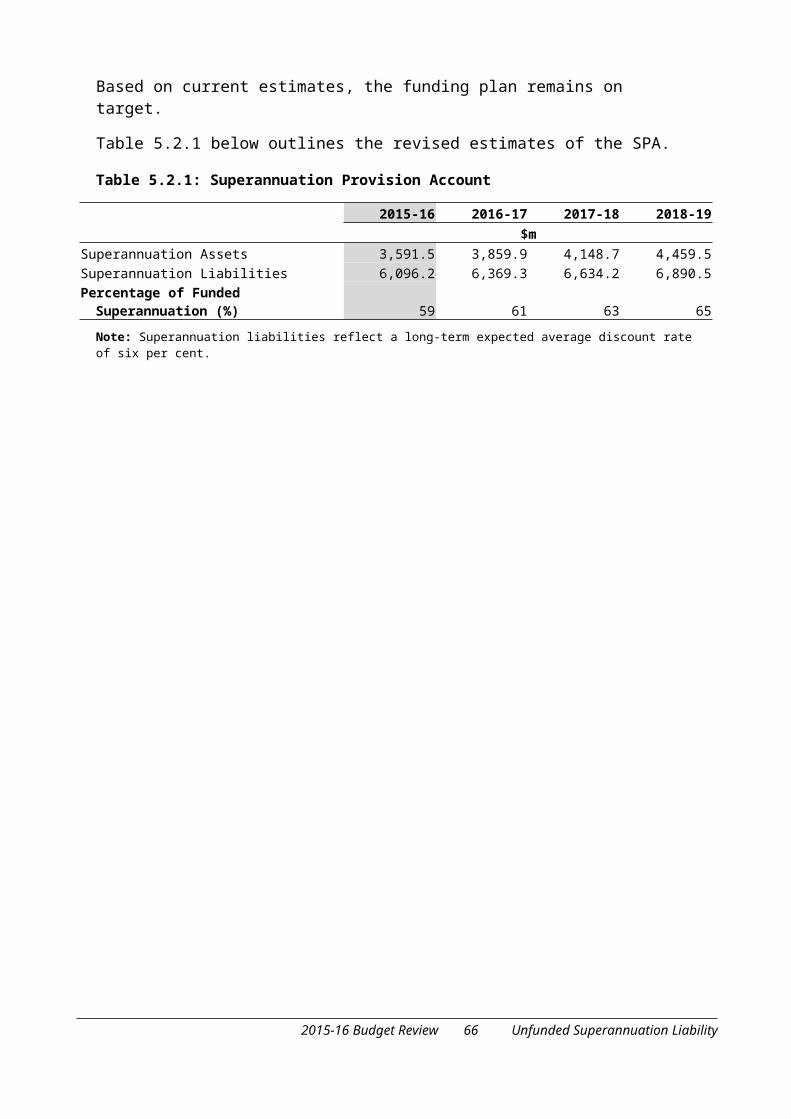
Australian Capital TerritoryGeneral Government Sector
Taxation Revenue Empty Cell 2014-15 2015-16 2015-16 2016-17 2017-18 2018-19
Empty Cell
ActualOutcome
AnnualBudget
RevisedEstimate
RevisedEstimate
RevisedEstimate
RevisedEstimate
Empty Cell $’000 $’000 $’000 $’000 $’000 $’000Empty Cell Empty Cell Empty Cell Empty Cell Empty Cell Empty Cell Empty Cell
General Tax Empty Cell Empty Cell Empty Cell Empty Cell Empty Cell Empty Cell
Payroll Tax 357,840 402,250 422,250 439,152 470,294 503,647Tax Waivers - 5,733 5,733 172 178 182General Rates 375,937 419,759 419,242 462,749 506,650 552,794Land Tax 96,169 94,069 94,069 101,345 108,579 116,112Total General Tax 829,946 921,811 941,294 1,003,418 1,085,701 1,172,735
Empty CellEmpty Cell Empty Cell Empty Cell Empty Cell Empty Cell Empty Cell
Duties Empty Cell Empty Cell Empty Cell Empty Cell Empty Cell Empty Cell
Conveyances 215,722 229,057 232,057 238,554 248,647 258,833General Insurance 23,415 12,964 12,964 - - -Leases* -41 - - - - -Life Insurance 1,776 873 873 - - -Motor Vehicle Registrations and
Transfers30,221 30,286 30,286 31,317 32,381 33,482
Shares and Marketable Securities# -2 - - - - -Total Duties 271,091 273,180 276,180 269,871 281,028 292,315
Empty CellEmpty Cell Empty Cell Empty Cell Empty Cell Empty Cell Empty Cell
Gambling Taxes Empty Cell Empty Cell Empty Cell Empty Cell Empty Cell Empty Cell
ACTTAB/Tabcorp Licence Fee 1,672 1,025 1,025 1,051 1,077 1,104Gaming Tax 33,144 33,793 33,793 34,639 35,505 36,393Casino Tax 1,837 1,538 1,538 1,576 1,615 1,655Interstate Lotteries 14,855 15,683 15,683 16,075 16,476 16,888Total Gambling Taxes 51,508 52,039 52,039 53,341 54,673 56,040
Empty Cell Empty Cell Empty Cell Empty Cell Empty Cell Empty Cell Empty Cell
Other Taxes Empty Cell Empty Cell Empty Cell Empty Cell Empty Cell Empty Cell
Motor Vehicle Registrations 110,983 121,013 121,013 129,708 138,053 147,011Ambulance Levy 18,986 20,652 20,652 22,194 23,281 24,424Lease Variation Charge 11,358 16,290 16,290 17,593 18,174 18,118Utilities (Network Facilities) Tax 26,140 26,980 26,980 29,679 31,146 32,732Fire and Emergency Service Levy 43,059 54,411 54,348 62,887 71,715 80,632City Centre Marketing and
Improvements Levy1,819 1,806 1,806 1,743 1,682 1,624
Energy Industry Levy 1,737 3,548 4,029 4,125 4,224 4,324Lifetime Care and Support Levy 10,136 - 9,850 10,250 10,550 10,850Total Other Taxes 224,218 244,700 254,968 278,179 298,825 319,715
Empty Cell Empty Cell Empty Cell Empty Cell Empty Cell Empty Cell Empty Cell
Total Taxation 1,376,763 1,491,730 1,524,481 1,604,809 1,720,227 1,840,805
Notes:* Duty on leases was abolished on 1 July 2009. The 2014-15 actual outcome reflects transactions relating to the 2008-09 financial year. # Duty on shares and marketable securities was abolished on 1 July 2010. The 2014-15 actual outcome reflects payment for transactions relating to
previous years.
2015-16 Budget Review 67 GGS GFS/GAAP HarmonisedFinancial Statements
2015-16 Budget Review 68 GGS GFS/GAAP HarmonisedFinancial Statements
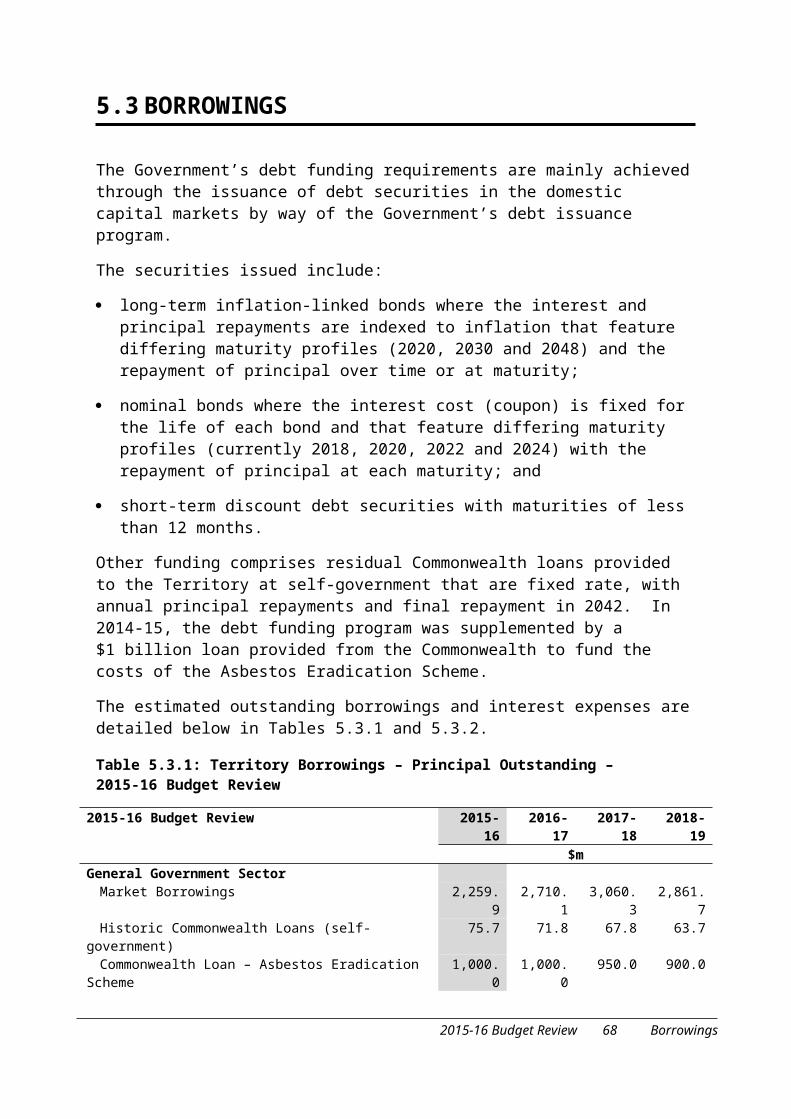
APPENDICES
Appendices Page
A Re-profiled Capital Works Projects 71
B Statement of Risks 77
C Public Trading Enterprises Financial Statements 83
D Total Territory Financial Statements 93
E Loan Council Allocation and Nomination 103
2015-16 Budget Review 69 Appendices
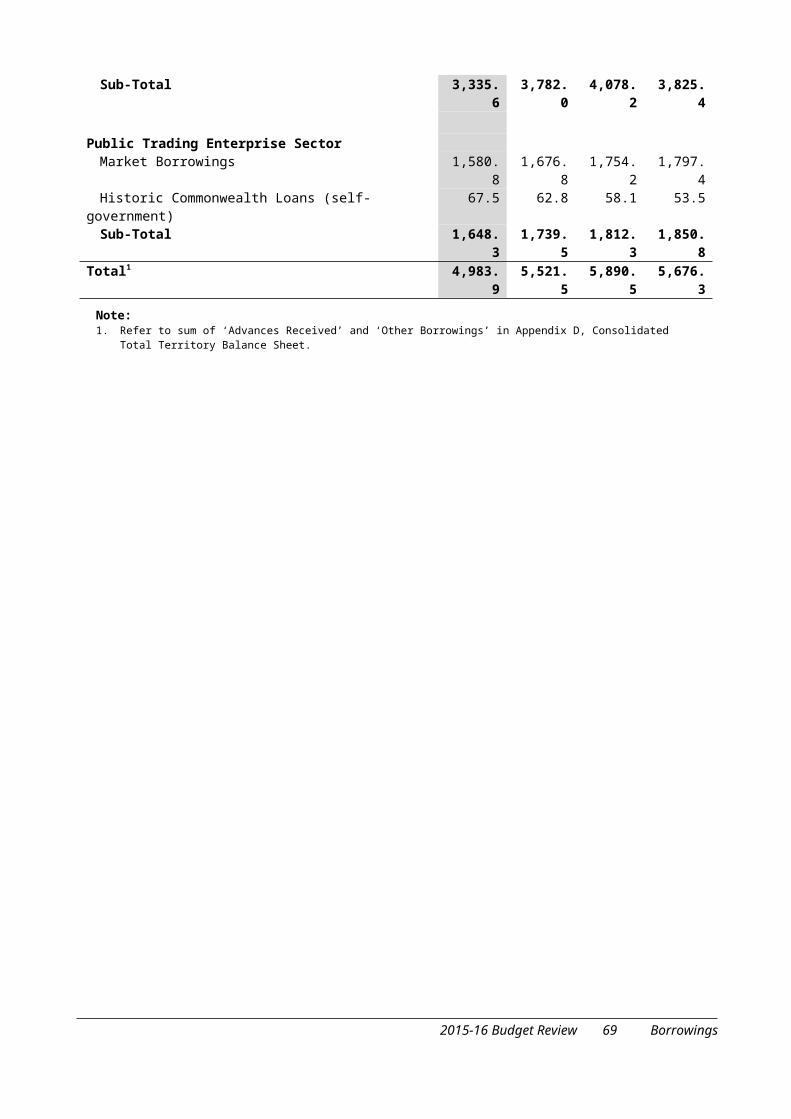
2015-16 Budget Review 70 Appendices
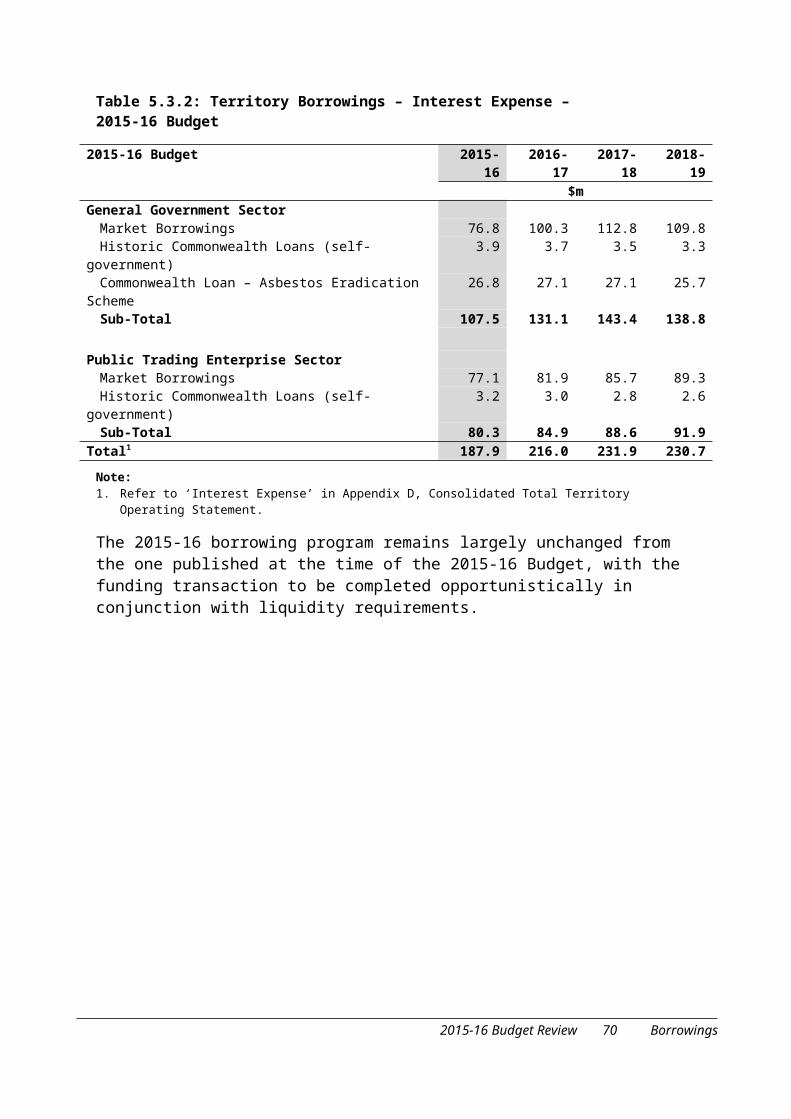
APPENDIX A
RE-PROFILED CAPITAL WORKS PROJECTS
2015-16 Budget Review 71 Re-profiled Capital Works Projects
2015-16 Budget Review 72 Re-profiled Capital Works Projects
APPENDIX A: RE-PROFILED CAPITAL WORKS PROJECTS
Project Name1
TotalProject
Value
$’000
Original Cash FlowTotal
RevisedProjectValue2
$’000
Re-profiled Capital Works ProgramPrior
YearsFinancing
$’000
2015-16
$’000
2016-17
$’000
2017-18
$’000
2018-19
$’000
PriorYears
Financing$’000
2015-163
$’0002016-17
$’000
2017-18
$’000
2018-19
$’000
Empty Cell Empty Cell Empty Cell Empty Cell Empty Cell Empty Cell Empty Cell Empty Cell Empty Cell Empty Cell Empty Cell Empty Cell Empty Cell
Canberra Institute of Technology Empty Cell Empty Cell Empty Cell Empty Cell Empty Cell Empty Cell Empty Cell Empty Cell Empty Cell Empty Cell Empty Cell Empty Cell
CIT Modernisation – Tuggeranong, Bruce and Reid campuses
7,425 0 4,950 2,475 0 0 7,425 0 7,425 0 0 0
Empty Cell Empty Cell Empty Cell Empty Cell Empty Cell Empty Cell Empty Cell Empty Cell Empty Cell Empty Cell Empty Cell Empty Cell Empty Cell
Chief Minister, Treasury and Economic Development Directorate
Empty Cell Empty Cell Empty Cell Empty Cell Empty Cell Empty Cell Empty Cell Empty Cell Empty Cell Empty Cell Empty Cell Empty Cell
Urban Renewal Program – Better Public Housing – Allawah Court
45,111 0 29,322 15,789 0 0 45,111 0 22,122 22,989 0 0
Urban Renewal Program – Better Public Housing – Karuah
17,661 0 11,479 6,182 0 0 17,661 0 8,879 8,782 0 0
Urban Renewal Program – Better Public Housing – Owen Flats
13,120 0 13,120 0 0 0 13,120 0 8,420 4,700 0 0
Urban Renewal Program – Better Public Housing – Red Hill housing precinct
56,148 0 36,496 19,652 0 0 56,148 0 31,996 24,152 0 0
Urban Renewal Program – City to the Lake – West Basin infrastructure
10,098 0 6,633 3,465 0 0 10,098 0 1,400 8,698 0 0
Urban Renewal Program – Melrose football precinct
6,653 0 1,980 4,178 495 0 6,653 0 1,000 5,158 495 0
Urban Renewal Program – Phillip Oval upgrade
4,613 0 990 3,623 0 0 4,613 0 700 3,913 0 0
Urban Renewal Program – Molonglo 3 infrastructure
2,970 0 1,980 990 0 0 2,970 0 750 2,220 0 0
Stromlo Forest Park Planning and Infrastructure
2,800 1,606 1,194 0 0 0 2,800 1,606 594 600 0 0
2015-16 Budget Review 73 Re-profiled Capital Works Projects
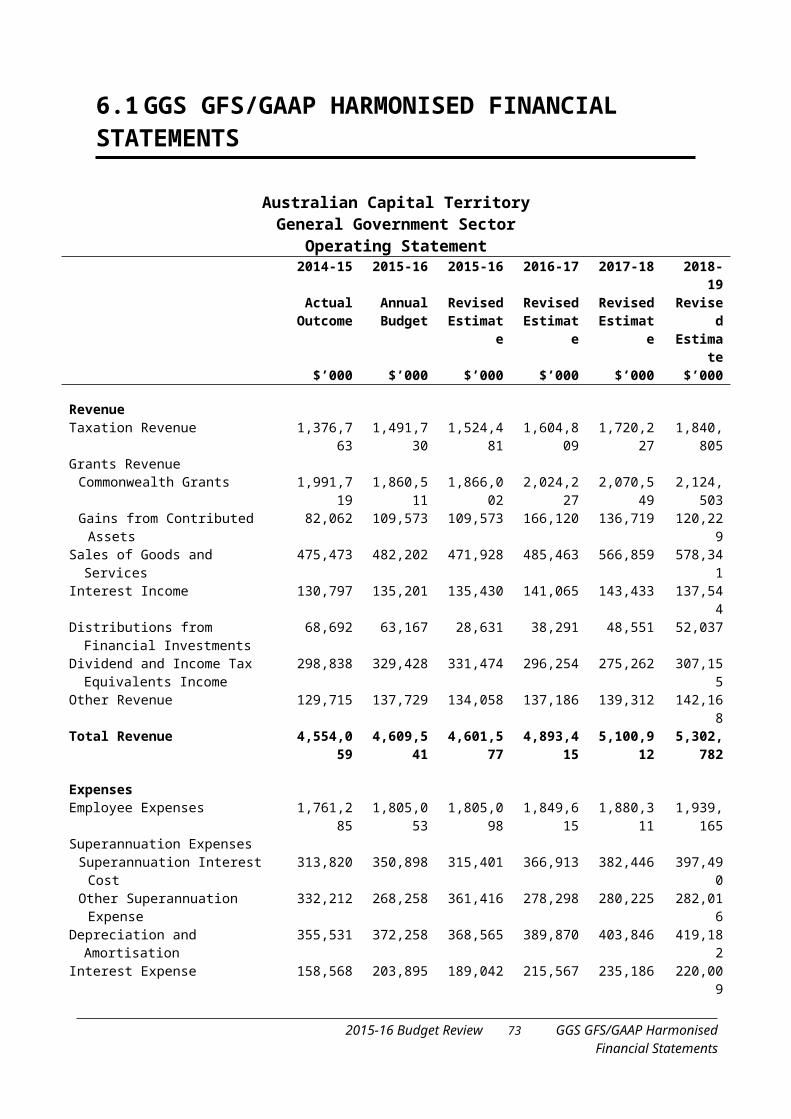
Project Name1
TotalProject
Value
$’000
Original Cash FlowTotal
RevisedProjectValue2
$’000
Re-profiled Capital Works ProgramPrior
YearsFinancing
$’000
2015-16
$’000
2016-17
$’000
2017-18
$’000
2018-19
$’000
PriorYears
Financing$’000
2015-163
$’0002016-17
$’000
2017-18
$’000
2018-19
$’000
Throsby Multisport Complex (Design) 500 314 186 0 0 0 500 314 0 186 0 0Cravens Creek Water Quality Control
Pond21,000 629 20,371 0 0 0 21,000 629 6,371 14,000 0 0
Horse Park Drive Water Quality Control Pond
6,000 3,295 2,705 0 0 0 6,000 3,295 205 2500 0 0
Isabella Weir Spillway – Upgrades 10,100 645 9,455 0 0 0 10,100 645 1,455 8,000 0 0John Gorton Drive Extension to
Molonglo 2 and Group Centre61,927 50,678 11,249 0 0 0 61,927 50,678 8,249 3,000 0 0
Majura Parkway to Majura Road – Link road
14,756 309 14,447 0 0 0 14,756 309 7,247 7,200 0 0
Molonglo 2 – Uriarra Road Upgrade 13,500 12,077 1,423 0 0 0 13,500 12,077 223 1,200 0 0Molonglo 2 – Water Supply, Trunk
Sewer and Stormwater Infrastructure – Stage 1
10,000 6,405 3,595 0 0 0 10,000 6,405 1,695 1,900 0 0
Molonglo 2 Sewer and Pedestrian Bridge over Molonglo River
12,400 9,753 2,647 0 0 0 12,400 9,753 947 1,700 0 0
Molonglo Infrastructure Investment 17,000 3864 10,136 3,000 0 0 17,000 3,864 8,136 5,000 0 0Throsby – Access road and western
intersection5,300 4 4,296 1,000 0 0 5,300 4 3,796 1,500 0 0
Empty Cell Empty Cell Empty Cell Empty Cell Empty Cell Empty Cell Empty Cell Empty Cell Empty Cell Empty Cell Empty Cell Empty Cell Empty Cell
Education and Training Directorate Empty Cell Empty Cell Empty Cell Empty Cell Empty Cell Empty Cell Empty Cell Empty Cell Empty Cell Empty Cell Empty Cell Empty Cell
Schools for the Future – Caroline Chisholm School – Centre for Innovation and Learning
5,896 0 495 1,980 3,421 0 5,896 0 315 2,160 3,421 0
Schools for the Future – Modernising Belconnen High
17,627 0 4,950 10,697 1,980 0 17,627 0 2,950 12,697 1,980 0
Empty Cell Empty Cell Empty Cell Empty Cell Empty Cell Empty Cell Empty Cell Empty Cell Empty Cell Empty Cell Empty Cell Empty Cell Empty Cell
Empty Cell Empty Cell Empty Cell Empty Cell Empty Cell Empty Cell Empty Cell Empty Cell Empty Cell Empty Cell Empty Cell Empty Cell Empty Cell
Empty Cell Empty Cell Empty Cell Empty Cell Empty Cell Empty Cell Empty Cell Empty Cell Empty Cell Empty Cell Empty Cell Empty Cell Empty Cell
2015-16 Budget Review 74 Re-profiled Capital Works Projects
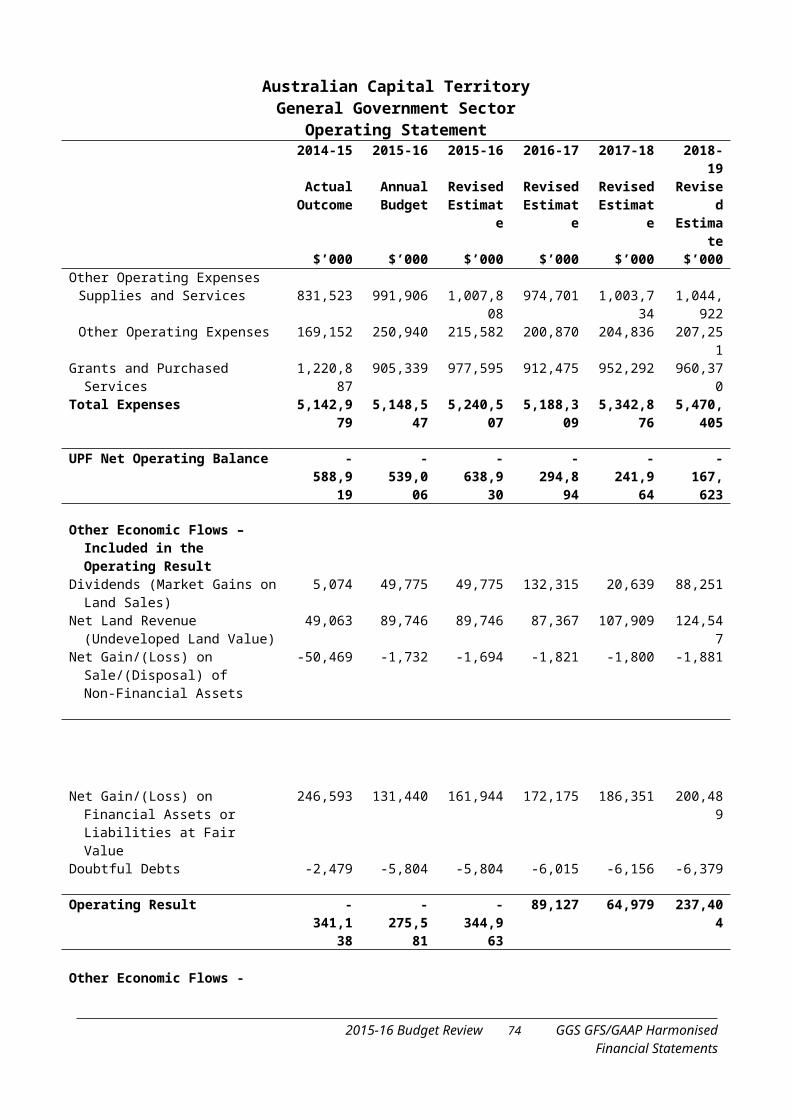
Project Name1
TotalProject
Value
$’000
Original Cash FlowTotal
RevisedProjectValue2
$’000
Re-profiled Capital Works ProgramPrior
YearsFinancing
$’000
2015-16
$’000
2016-17
$’000
2017-18
$’000
2018-19
$’000
PriorYears
Financing$’000
2015-163
$’0002016-17
$’000
2017-18
$’000
2018-19
$’000
Empty Cell Empty Cell Empty Cell Empty Cell Empty Cell Empty Cell Empty Cell Empty Cell Empty Cell Empty Cell Empty Cell Empty Cell Empty Cell
Empty Cell Empty Cell Empty Cell Empty Cell Empty Cell Empty Cell Empty Cell Empty Cell Empty Cell Empty Cell Empty Cell Empty Cell Empty Cell
Justice and Community Safety Directorate
Empty Cell Empty Cell Empty Cell Empty Cell Empty Cell Empty Cell Empty Cell Empty Cell Empty Cell Empty Cell Empty Cell Empty Cell
Courts Public Private Partnership (PPP) (formerly called ACT Court Facilities Early Works Package)
14,197 0 12,712 842 644 0 7,929 0 2,050 3,693 2,005 181
Emergency Services Agency Station Upgrade and Relocation – Aranda station
18,864 2,113 16,620 131 0 0 18,864 2,113 14,883 1,868 0 0
Empty Cell Empty Cell Empty Cell Empty Cell Empty Cell Empty Cell Empty Cell Empty Cell Empty Cell Empty Cell Empty Cell Empty Cell Empty Cell
Territory and Municipal Services Directorate
Empty Cell Empty Cell Empty Cell Empty Cell Empty Cell Empty Cell Empty Cell Empty Cell Empty Cell Empty Cell Empty Cell Empty Cell
Better Roads for Gungahlin – Gundaroo Drive duplication – Stage 1
31,185 0 9,900 21,285 0 0 31,185 0 6,900 24,285 0 0
Better Roads for Tuggeranong – Ashley Drive duplication – Stage 2
24,602 0 4,950 10,890 8,762 0 24,602 0 3,950 11,890 8,762 0
Constitution Ave to Vernon Circle – GPO 2,800 0 2,800 0 0 0 2,800 0 0 2,800 0 0Pialligo and Airport Road Network –
GPO 900 0 0 900 0 0 900 0 700 200 0 0
Enhancing the Protection of Endangered Species and Habitat
6,090 0 1,339 3,030 1,721 0 6,090 0 689 3,680 1,721 0
Urban Renewal Program – Acton – Sullivans Creek cycle path upgrades
1,500 0 1,500 0 0 0 1,500 0 900 600 0 0
Urban Renewal Program – Tuggeranong – Anketell Street (north) upgrade – Stage 1
430 0 430 0 0 0 430 0 180 250 0 0
Civic to Gungahlin Corridor Improvements
20,000 2,428 17,572 0 0 0 20,000 2,428 13,072 4,500 0 0
Environmental Offsets – Lawson South 872 120 471 216 65 0 872 120 221 466 65 0
2015-16 Budget Review 75 Re-profiled Capital Works Projects
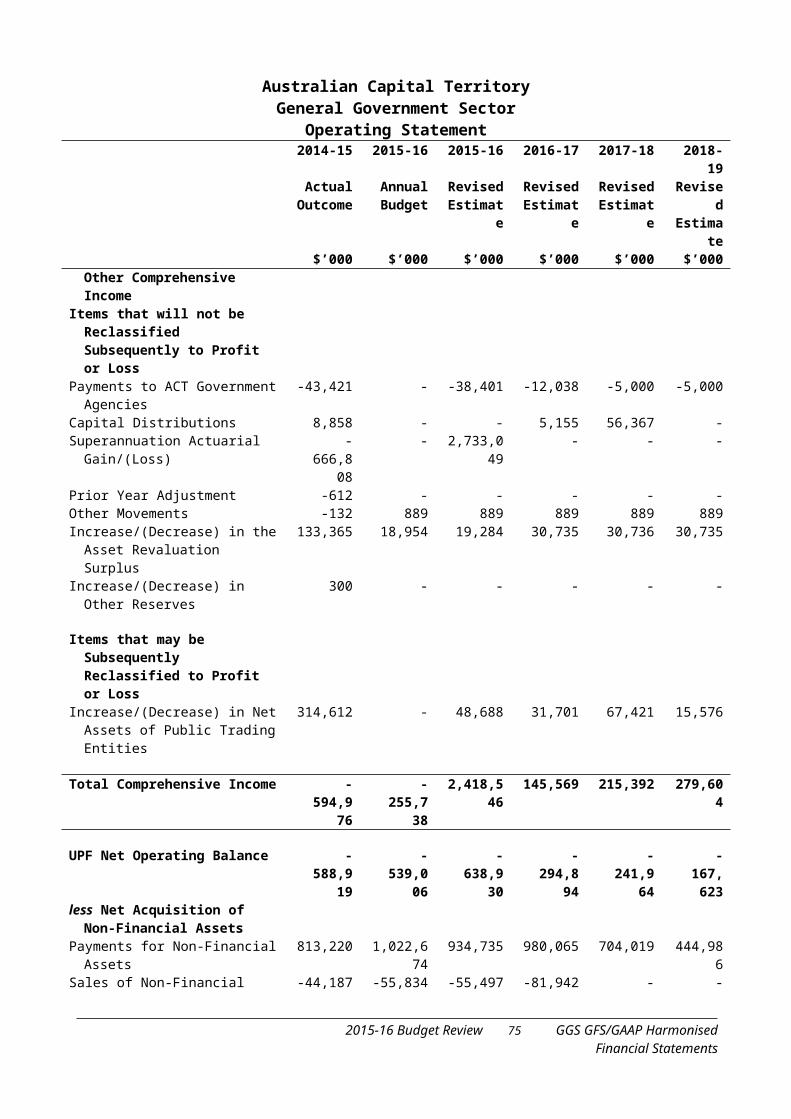
Project Name1
TotalProject
Value
$’000
Original Cash FlowTotal
RevisedProjectValue2
$’000
Re-profiled Capital Works ProgramPrior
YearsFinancing
$’000
2015-16
$’000
2016-17
$’000
2017-18
$’000
2018-19
$’000
PriorYears
Financing$’000
2015-163
$’0002016-17
$’000
2017-18
$’000
2018-19
$’000
Environmental Offsets – Gungahlin (EPIC)
462 45 211 206 0 0 462 45 111 306 0 0
National Arboretum Canberra – Event Terrace and Precinct Facilities
1,484 127 1,357 0 0 0 1,484 127 557 800 0 0
Strategic Bushfire Management Plan 2,744 1,784 960 0 0 0 2,744 1,784 210 750 0 0West Belconnen Resource Management
Centre Rehabilitation of Landfill Cells1,705 1,417 288 0 0 0 1,705 1,417 88 0 200 0
Mugga Lane – Rehabilitation of Old Landfill Cells
3,100 1,849 1,251 0 0 0 3,100 1,849 751 500 0 0
Notes:1. Projects listed in the above table are only those in the 2015-16 Capital Works Program that have changed their funding profiles.2. Savings of $6.3 million were returned to the budget in 2015-16 from the capital works program.3. 2015-16 figures include pending section 16B instruments under the Financial Management Act 1996.
2015-16 Budget Review 76 Re-profiled Capital Works Projects
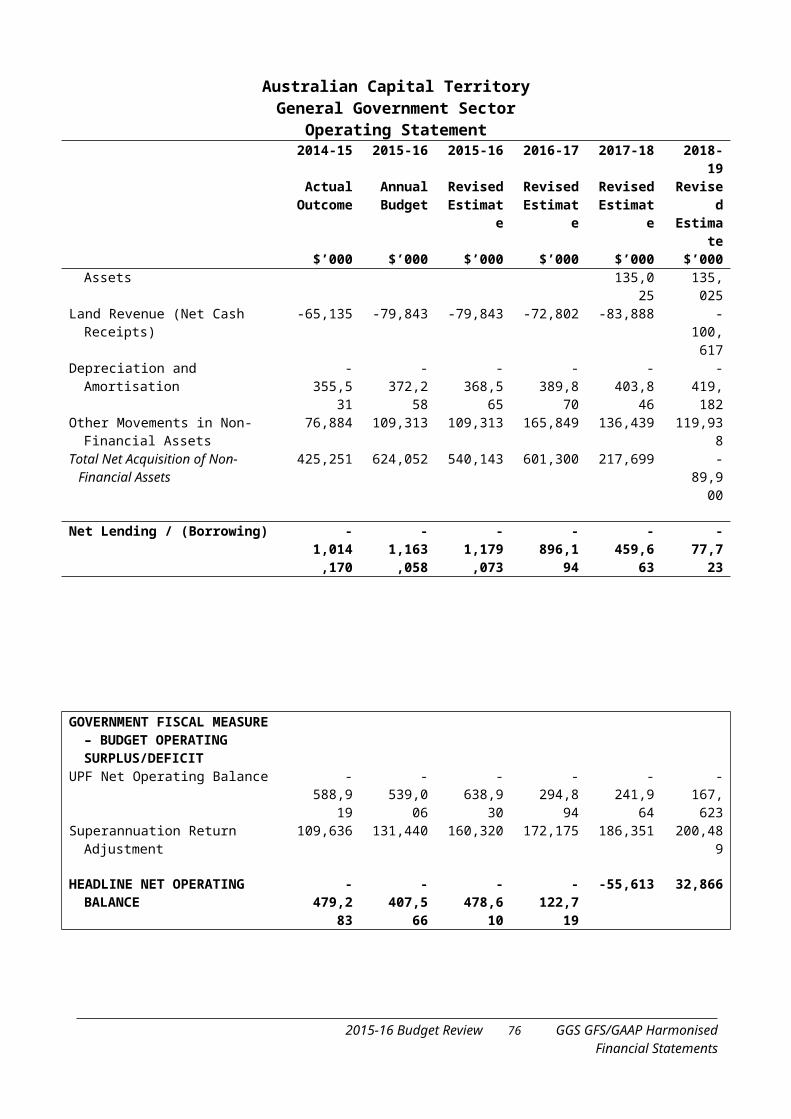
APPENDIX B
STATEMENT OF RISKS
2015-16 Budget Review 77 Statement of Risks
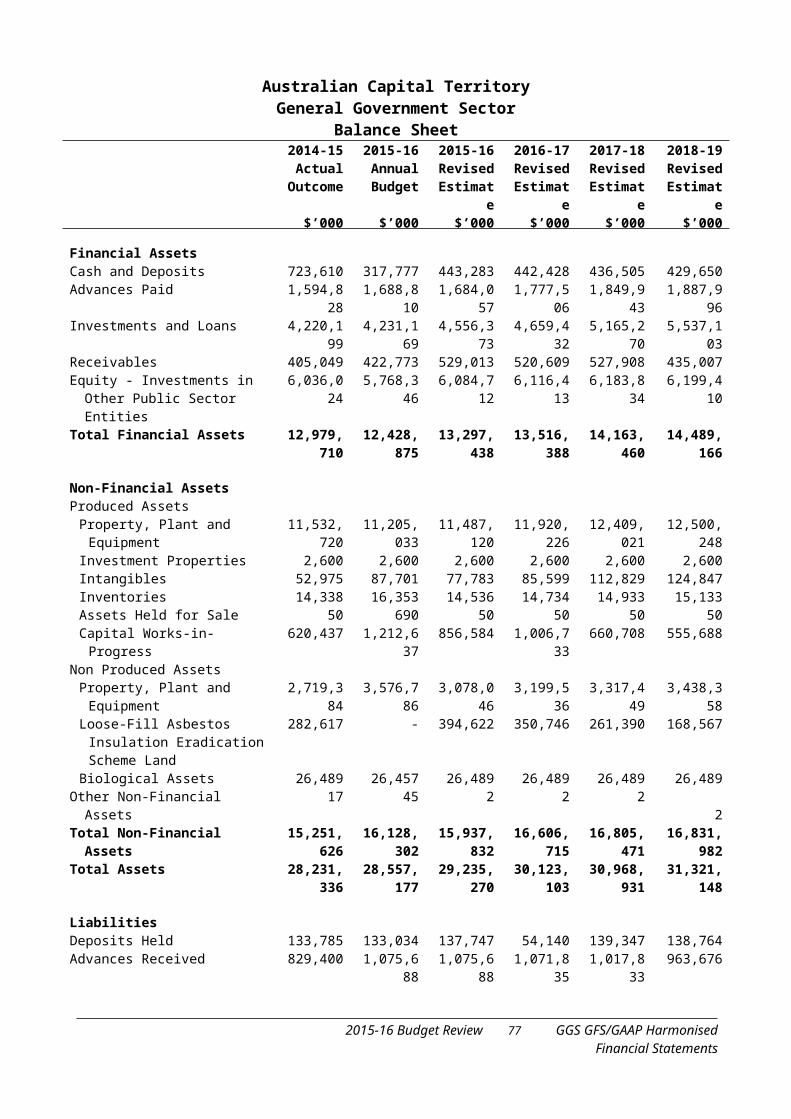
2015-16 Budget Review 78 Statement of Risks
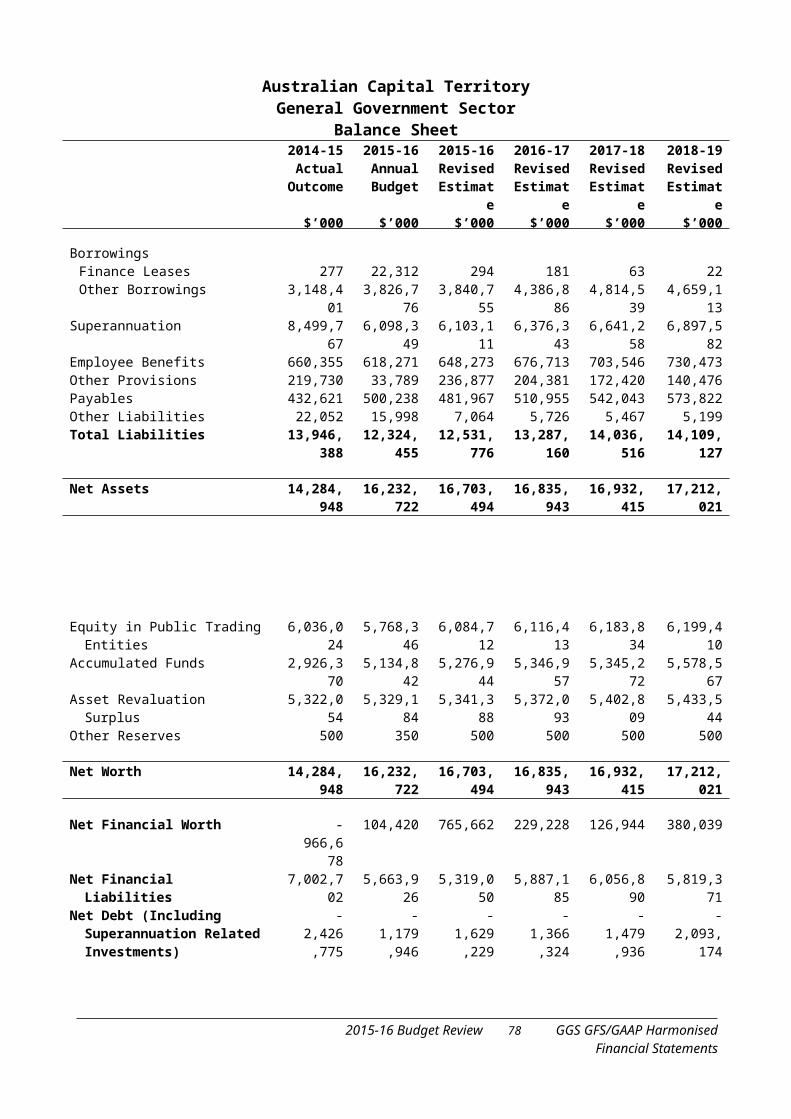
APPENDIX B: STATEMENT OF RISKS
Consistent with Section 11(d) of the Financial Management Act 1996, each budget update is required to provide a statement describing the risks – quantified if possible – that may affect the budget estimates. The following risks have been identified at the time of the publication of the 2015-16 Budget Review. Unless indicated below, risks identified in the 2015-16 Budget are unchanged.
Economic RisksCommonwealth Government decisions in regard to its gross expenditure patterns remain a significant risk to the ACT economy.
External risks to the Australian outlook include prices for Australia’s major commodity exports falling further short of expectations. Interest rate changes (both domestic and overseas) also have an effect on asset prices, trade, tourism and consumer confidence.
Within the ACT, an oversupply of commercial property represents a downside risk to short-term investment. Upside risks include a low Australian dollar enabling more students to gain an education in Canberra, and faster than expected new development along the Northbourne Avenue corridor.
Fiscal RisksThere are a number of other risks that may impact on the Territory’s finances. These are described below:
Loose-fill Asbestos Insulation Eradication Scheme
The Government has commenced a scheme to buy back, demolish and remediate all homes in the ACT affected by loose-fill asbestos insulation. The remediated blocks of land will be sold to defray the overall Scheme costs. The financial impacts of the Asbestos Eradication Scheme (the Scheme) have been modelled using a range of assumptions together with the best estimates available.
Both the timing and quantum of financial impacts associated with the Scheme are subject to uncertainty. The final Scheme opt in rate, industry capacity to undertake demolition and remediation, and the actual complexity of the demolition and remediation required present risks to the Budget.
Uncertainty around whether Draft Variation 343 to the Territory Plan will be approved by the Assembly, and the unknown market response to the sale of remediated vacant land pose further risks.
2015-16 Budget Review 79 Statement of Risks
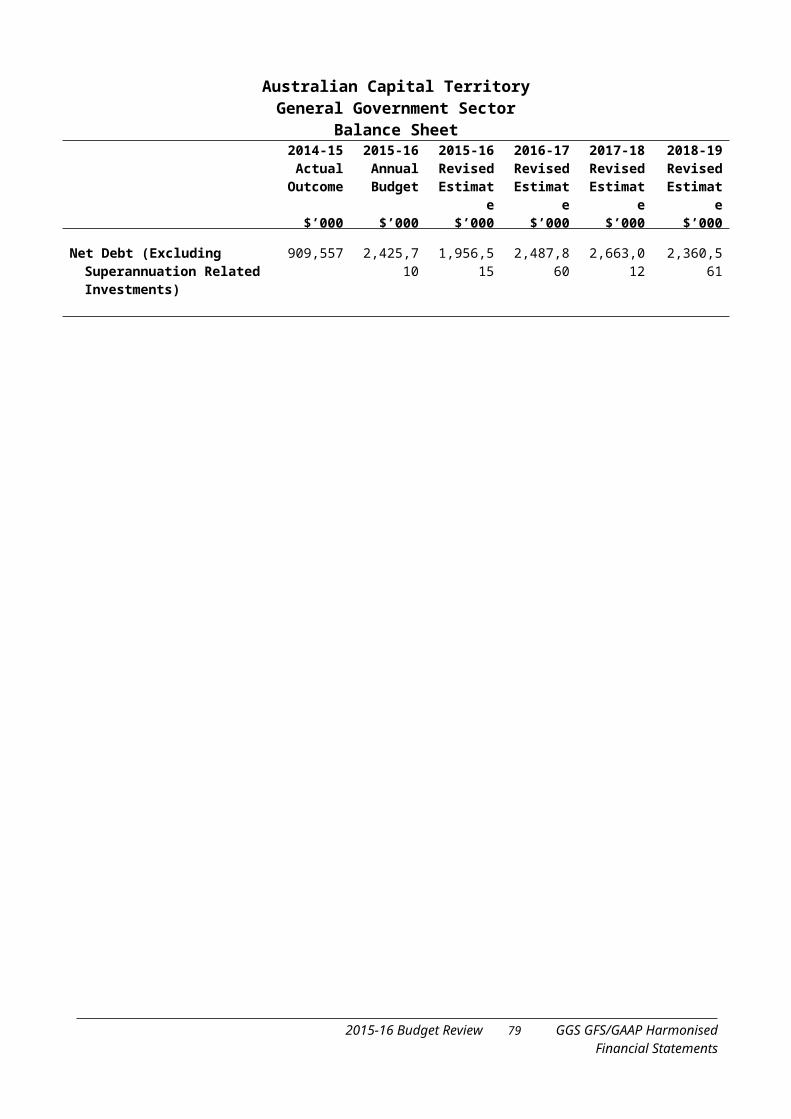
National Disability Insurance Scheme
Under the arrangements agreed with the previous Commonwealth Government, the National Disability Insurance Scheme (NDIS) trial (previously referred to as the NDIS launch) in the ACT commenced on 1 July 2014. The trial will run for three years, before transitioning in 2017-18 and 2018-19, with the full Scheme commencing in 2019-20.
The Commonwealth Government is currently in bilateral discussions with States and Territories regarding the distribution of cash and in-kind services provided during the trial. On 16 September 2015, the Commonwealth signed bilateral agreements for the transition to the full scheme with New South Wales by July 2018 and Victoria by July 2019. The Commonwealth and remaining jurisdictions are working collaboratively on detailed schedules to achieve transition to the NDIS. In the ACT, all eligible participants are expected to transition to the NDIS by July 2016, so a new transition bilateral agreement is not required.
The ACT and the Commonwealth continue to monitor client transitions into the NDIS and associated funding transfers. At the end of the trial period, an adjustment will be made if either party has contributed more than their expected share of funding for the Scheme.
The DisabilityCare Australia Fund (DCAF) is managed by the Commonwealth and has been established to administer the revenue collected through the increased Medicare Levy to support the NDIS. DCAF was established to assist States and Territories with their contributions to the NDIS.
The 2015-16 Commonwealth Budget funding profile for the DCAF presents a cash flow risk to the Territory as the bulk of the funding becomes available in 2017-18 after completion of the trial. Early access to a larger proportion of the Territory’s share of funding from the DCAF will be pursued through bilateral negotiations with the Commonwealth. The Commonwealth has proposed different cash flow scenarios but has not yet made a final offer. It is anticipated that an offer will be made early in 2016.
Commonwealth Government Funding
Specific Purpose Payments
The Commonwealth Government’s approach to health and education funding continues to undermine the stability, certainty and sufficiency of the Specific Purpose Payments (SPPs) which had previously been assured by the Intergovernmental Agreement on Federal Financial Relations. The Commonwealth made a unilateral decision to return to a block funding approach for health and education funding from 2017-18, with indexation based on population growth and the Consumer Price Index (CPI). This significantly reduces funding to the States and Territories for those services compared to what would have been paid under the reform models and under the previous SPP indexation arrangements.
2015-16 Budget Review 80 Statement of Risks
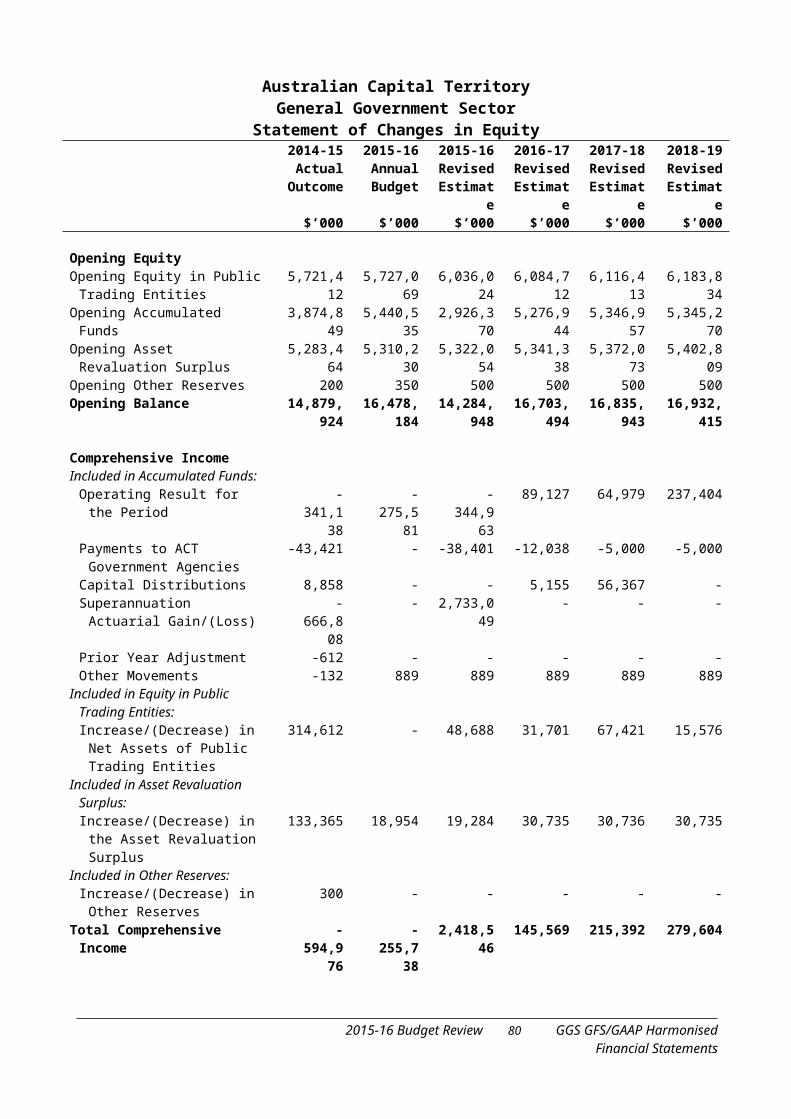
The SPPs on Housing and Homelessness, Disability Services and Skills and Workforce Development are indexed by a composite rate based on the wage cost index 1 and CPI, and are sensitive to assumptions underlying the parameters. The Disability Services SPP is expected to be rolled back by the Commonwealth as the NDIS is implemented nationally. The Commonwealth Budget does not reflect this as the funding arrangements for the transition and full scheme phases are yet to be finalised. It is also unclear at this stage what level of disability services expenditure may be outside the scope of the NDIS and how this will be funded on an ongoing basis. The NDIS is discussed in greater detail earlier in this Appendix.
White Papers on Reform of the Federation and Taxation
The Federation and Taxation White Papers foreshadowed by the Commonwealth Government will consider reform to Commonwealth-State roles and responsibilities, vertical fiscal imbalance and horizontal fiscal equalisation. The outcomes of the reform processes under consideration could have significant implications for future ACT Government revenue and expenditure estimates.
National Partnership Payments
National Partnership Payments (NPPs) are payments made in accordance with time-limited National Partnership Agreements and Project Agreements. The milestones and performance targets linked to each payment are generally written into the agreement itself. The level of risk associated with each agreement relates to the nature of the conditions attached to the payments and the difficulties of agencies adjusting expenditure levels when payments unexpectedly decrease or cease due to expiry of the agreement without sufficient notice.
The Commonwealth Government allowed some NPPs to expire during 2015-16 and has only extended or replaced others with short-term arrangements. The short-term nature of these funding arrangements creates risk for the ACT Government and its service providers due to the uncertainty of the Commonwealth’s commitment to ongoing funding.
Outstanding Insurance Claims LiabilityThe value of insurance liabilities is the present value of the future claim payments that have accrued at the calculation date. This approach is required under Australian Accounting Standard AASB1023 General Insurance Contracts.
Accounting for insurance claims is complex and actuarial assumptions are required to estimate the ACT Insurance Authority’s obligations and claims expense. There is uncertainty in the estimate of the liability and this can result in actuarial gains or losses when the claims experience differs from the estimates. The liabilities are discounted to allow for the time value of money as claims may be settled many years after the claim is incurred.
2015-16 Budget Review 81 Statement of Risks
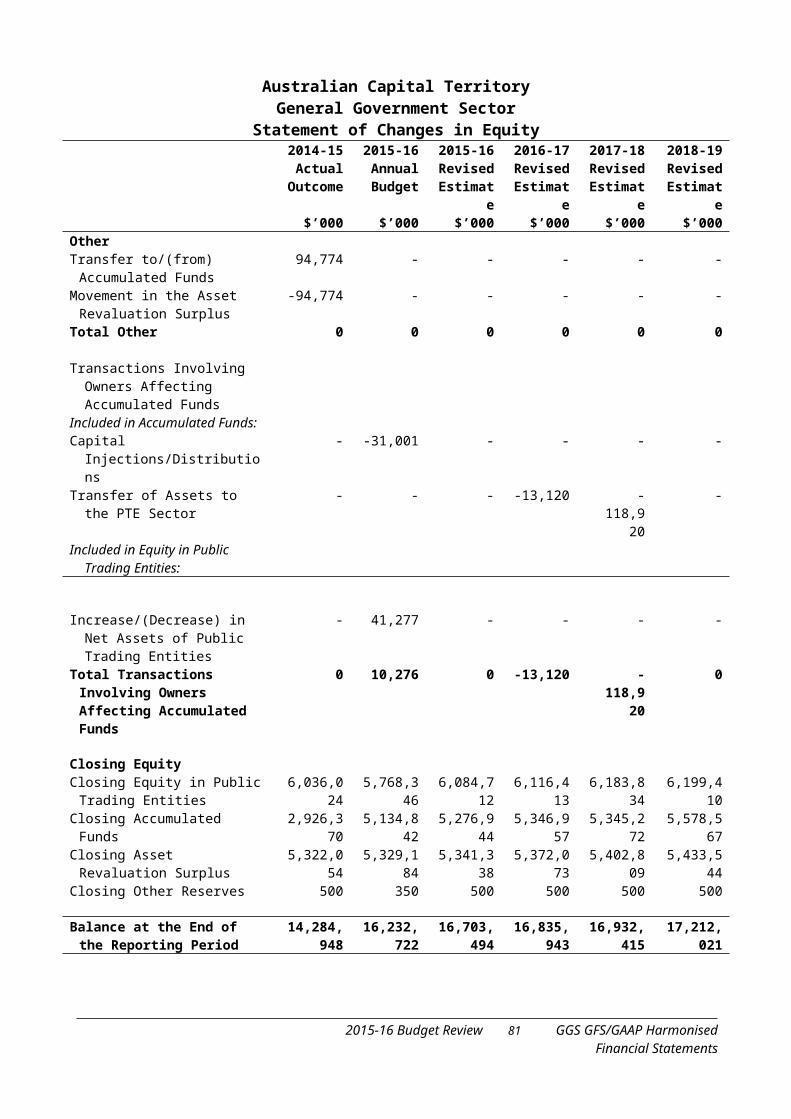
Sensitivity to Discount Rate
The outstanding claims liability is calculated by reference to expected future payments. These payments are discounted to adjust for the time value of money. Australian Accounting Standard AASB1023 General Insurance Contracts requires the outstanding claims liabilities to be valued using a ‘risk free’ rate of return, which are generally accepted to be the discount rate derived from market yields on Commonwealth Government Bonds. The discount rates adopted match the weighted term to maturity of insurance claims. The long-term nature of the projected cashflows from the liability means that small changes in the discount rate adopted can lead to significant variations in the liability valuations and the claims expense.
The outstanding claims provision as at 30 June 2015 was $255.6 million net of Reinsurance Recoveries. Variations in the discount rate of +/- one percentage point results in an estimated change to the liability of between a $11.7 million decrease and a $12.6 million increase, equivalent to a change of between -4.6 per cent and 4.9 per cent.
2015-16 Budget Review 82 Statement of Risks
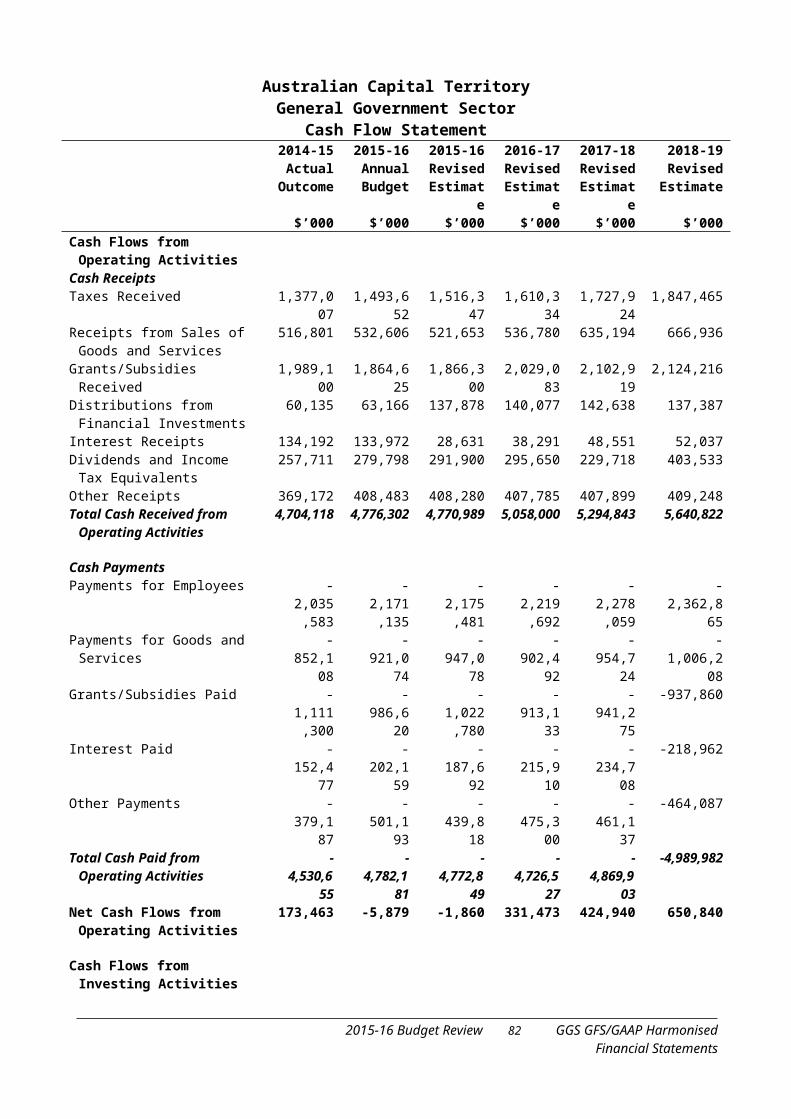
APPENDIX C
PUBLIC TRADING ENTERPRISES FINANCIAL STATEMENTS
2015-16 Budget Review 83 Public Trading EnterprisesFinancial Statements
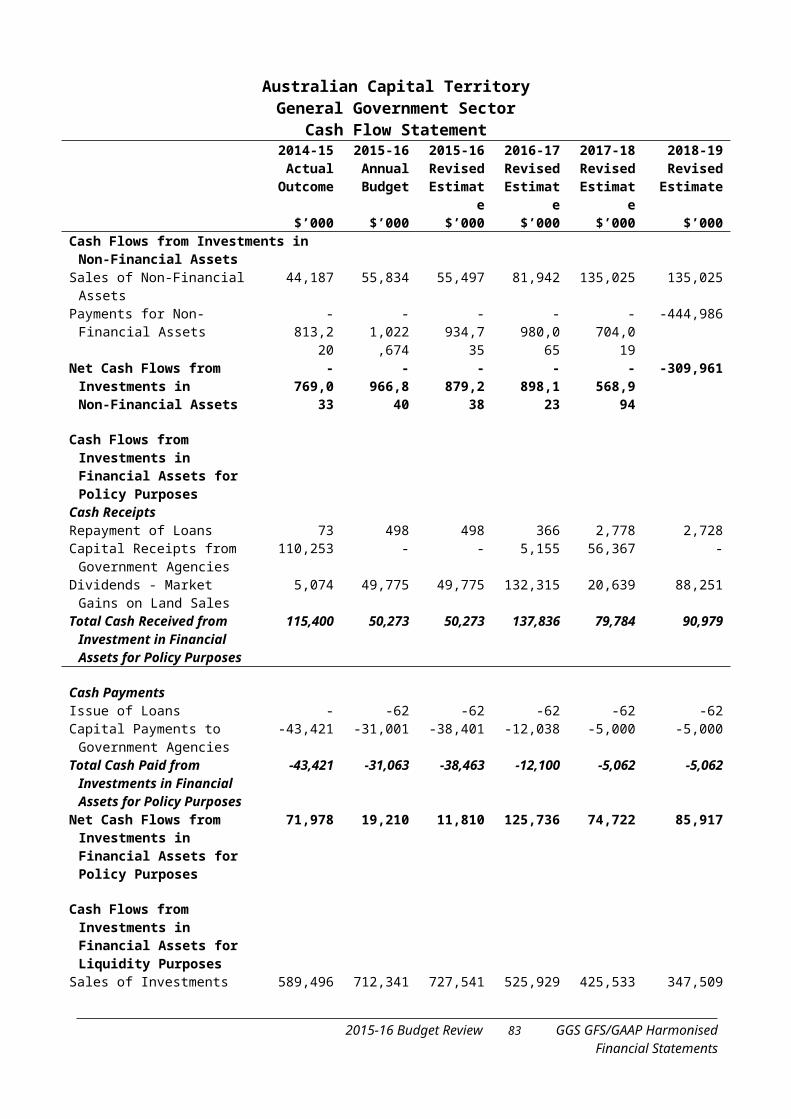
2015-16 Budget Review 84 Public Trading EnterprisesFinancial Statements
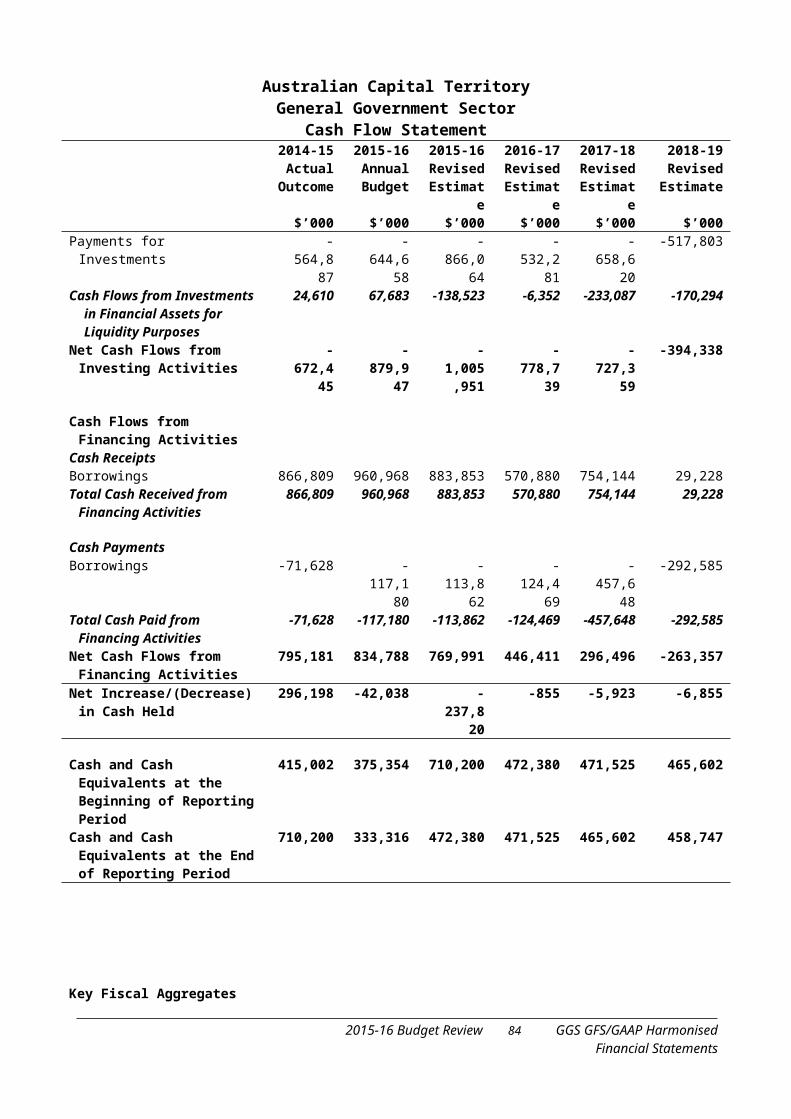
Australian Capital TerritoryPublic Trading Enterprises
Operating Statement Empty Cell 2014-15 2015-16 2015-16 2016-17 2017-18 2018-19 Empty Cell Actual
OutcomeAnnualBudget
RevisedEstimate
RevisedEstimate
RevisedEstimate
RevisedEstimate
Empty Cell $’000 $’000 $’000 $’000 $’000 $’000Empty Cell Empty Cell Empty Cell Empty Cell Empty Cell Empty Cell Empty Cell
Revenue Empty Cell Empty Cell Empty CellEmpty Cell Empty Cell Empty Cell
Government Payment for Outputs 163,041 178,460 178,474 153,993 150,100 152,307Grants Revenue Empty Cell Empty Cell Empty Cell Empty Cell Empty Cell Empty Cell
Commonwealth Grants 2,110 - - - - -Gains from Contributed Assets 10,596 - - - - -
Sales of Goods and Services Revenue
Empty Cell Empty Cell Empty Cell Empty Cell Empty Cell Empty Cell
Revenue from Associates and Joint Ventures
102,730 67,032 67,032 74,822 76,965 77,048
Other Sales of Goods and Services 412,516 425,943 425,943 439,592 449,749 460,404Interest Income 5,503 2,224 2,151 1,921 1,918 1,947Distributions from Investments with
the Territory Banking Account3,244 3,936 4,009 875 815 755
Other Revenue Empty Cell Empty Cell Empty Cell Empty Cell Empty Cell Empty Cell
Land Revenue (Value Add Component)
301,149 406,530 406,530 384,559 399,549 347,792
Other Revenue 22,455 11,369 11,369 11,953 12,922 12,432Total Revenue 1,023,342 1,095,494 1,095,508 1,067,715 1,092,018 1,052,685
Empty CellEmpty Cell Empty Cell Empty Cell Empty Cell Empty Cell Empty Cell
Expenses Empty Cell Empty Cell Empty Cell Empty Cell Empty Cell Empty Cell
Employee Expenses 180,756 180,219 180,219 172,341 176,073 175,417Other Superannuation Expenses 15,001 22,889 22,889 22,734 23,037 23,370Depreciation and Amortisation 79,123 72,287 72,253 78,966 97,343 77,591Interest Expenses 72,552 85,516 85,446 89,537 94,168 98,103Other Property Expenses (Income
Tax Expense)76,307 96,854 96,854 113,133 72,612 101,265
Other Operating Expenses Empty Cell Empty Cell Empty Cell Empty Cell Empty Cell Empty Cell
Supplies and Services 197,196 206,969 207,063 208,170 216,643 218,342Other Operating Expenses 171,430 199,598 199,598 70,529 127,417 164,334
Grants and Purchased Services 75,533 83,134 83,148 139,998 108,100 93,022Total Expenses 867,899 947,466 947,470 895,408 915,393 951,444
Empty CellEmpty Cell Empty Cell Empty Cell Empty Cell Empty Cell Empty Cell
UPF Net Operating Balance 155,444 148,028 148,038 172,307 176,625 101,241Empty Cell Empty Cell Empty Cell Empty Cell Empty Cell
Other Economic Flows - Included in the Operating Result
Empty Cell Empty Cell Empty Cell Empty Cell Empty Cell Empty Cell
Land Revenue (Market Gains on Land Sales)
7,248 71,107 71,107 108,921 29,485 126,073
Net Gain/(Loss) on Sale/(Disposal) of Non-Financial Assets
46,825 -24,759 -24,759 -54,326 -93,321 -29,888
Net Gain/(Loss) on Financial Assets or Liabilities at Fair Value
447 314 314 312 312 312
Doubtful Debts -2,286 -2,247 -2,247 -2,377 -2,463 -2,467Empty Cell Empty Cell Empty Cell Empty Cell Empty Cell Empty Cell Empty Cell
Operating Result 207,678 192,443 192,453 224,837 110,638 195,271Empty Cell Empty Cell Empty Cell Empty Cell Empty Cell Empty Cell Empty CellEmpty Cell Empty Cell Empty Cell Empty Cell Empty Cell Empty Cell Empty CellEmpty Cell Empty Cell Empty Cell Empty Cell Empty Cell Empty Cell Empty Cell
2015-16 Budget Review 85 Public Trading EnterprisesFinancial Statements
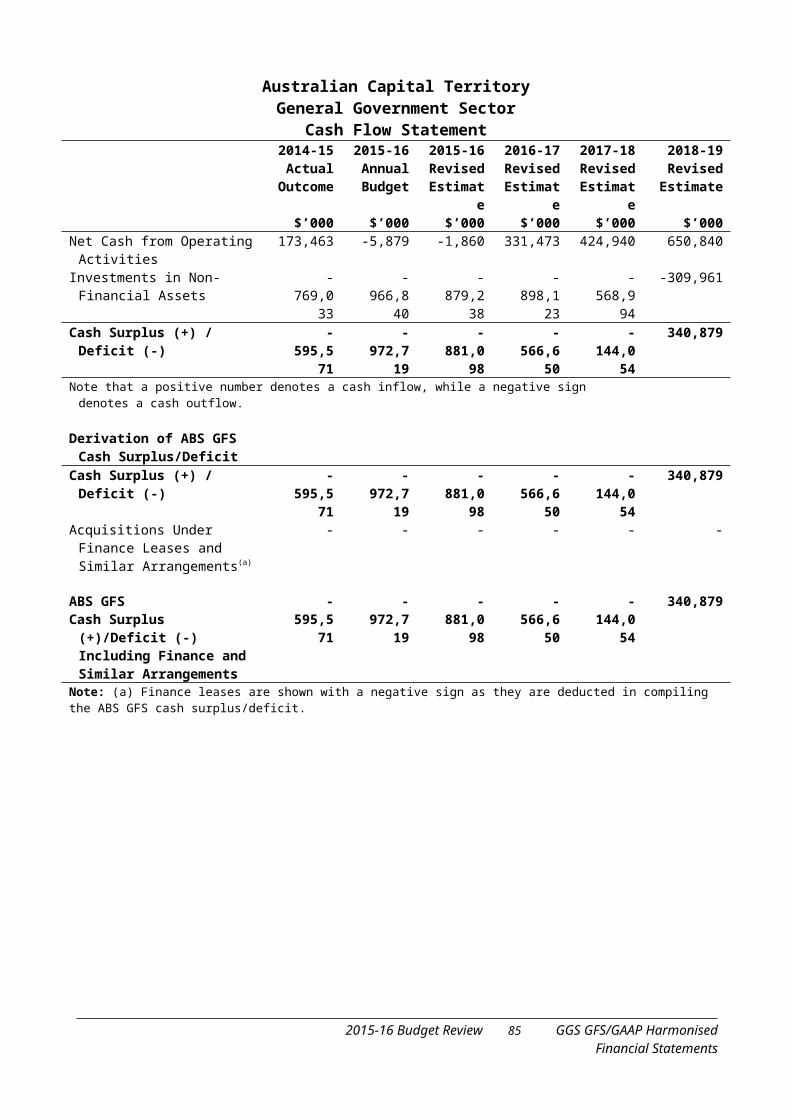
Australian Capital TerritoryPublic Trading Enterprises
Operating Statement Empty Cell 2014-15 2015-16 2015-16 2016-17 2017-18 2018-19 Empty Cell Actual
OutcomeAnnualBudget
RevisedEstimate
RevisedEstimate
RevisedEstimate
RevisedEstimate
Empty Cell $’000 $’000 $’000 $’000 $’000 $’000
Other Economic Flows - Other Comprehensive Income
Empty Cell Empty Cell Empty Cell Empty Cell Empty Cell Empty Cell
Items that will not be Reclassified Subsequently to Profit or Loss
Empty Cell Empty Cell Empty Cell Empty Cell Empty Cell Empty Cell
Empty Cell Empty Cell Empty Cell Empty Cell Empty Cell Empty Cell Empty Cell
Other Movements 49,686 - - - - -Increase/(Decrease) in the Asset
Revaluation Surplus263,637 44,323 44,324 51,340 59,159 52,092
Empty Cell Empty Cell Empty Cell Empty Cell Empty Cell Empty Cell Empty Cell
Items that may be Subsequently Reclassified to Profit or Loss
Empty Cell Empty Cell Empty Cell Empty Cell Empty Cell Empty Cell
Increase/(Decrease) in Other Reserves
-3,000 - - - - -
Empty Cell Empty Cell Empty Cell Empty Cell Empty Cell Empty Cell Empty Cell
Total Comprehensive Income 518,001 236,766 236,777 276,177 169,797 247,363Empty Cell Empty Cell Empty Cell Empty Cell Empty Cell Empty Cell Empty Cell
UPF Net Operating Balance 155,444 148,028 148,038 172,307 176,625 101,241less Net Acquisition of Non-
Financial Assets Empty Cell Empty Cell Empty Cell Empty Cell Empty Cell Empty Cell
Payments for Non-Financial Assets 123,646 177,960 185,360 174,778 152,621 132,945Sales of Non-Financial Assets -56,500 -35,576 -35,576 -50,490 -54,590 -64,738Land Revenue (Net Cash Receipts) -25,836 -53,877 -53,877 -110,572 -25,635 -123,727Depreciation and Amortisation -79,123 -72,287 -72,253 -78,966 -97,343 -77,591Other Movements in Non-Financial
Assets-44,392 -59,313 -59,313 -115,849 -86,439 -69,938
Total Net Acquisition of Non-Financial Assets
-82,206 -43,093 -35,659 -181,099 -111,386 -203,049
Empty Cell Empty Cell Empty Cell Empty Cell Empty Cell Empty Cell Empty Cell
Net Lending / (Borrowing) 237,649 191,121 183,697 353,406 288,011 304,290 Empty Cell Empty Cell Empty Cell Empty Cell Empty Cell Empty Cell Empty Cell
Empty Cell Empty Cell Empty Cell Empty Cell Empty Cell Empty Cell
UPF Net Operating Balance 154,444 148,028 148,038 172,307 176,625 101,241Empty Cell Empty Cell Empty Cell Empty Cell Empty Cell Empty Cell Empty Cell
HEADLINE NET OPERATING BALANCE
154,444 148,028 148,038 172,307 176,625 101,241
2015-16 Budget Review 86 Public Trading EnterprisesFinancial Statements
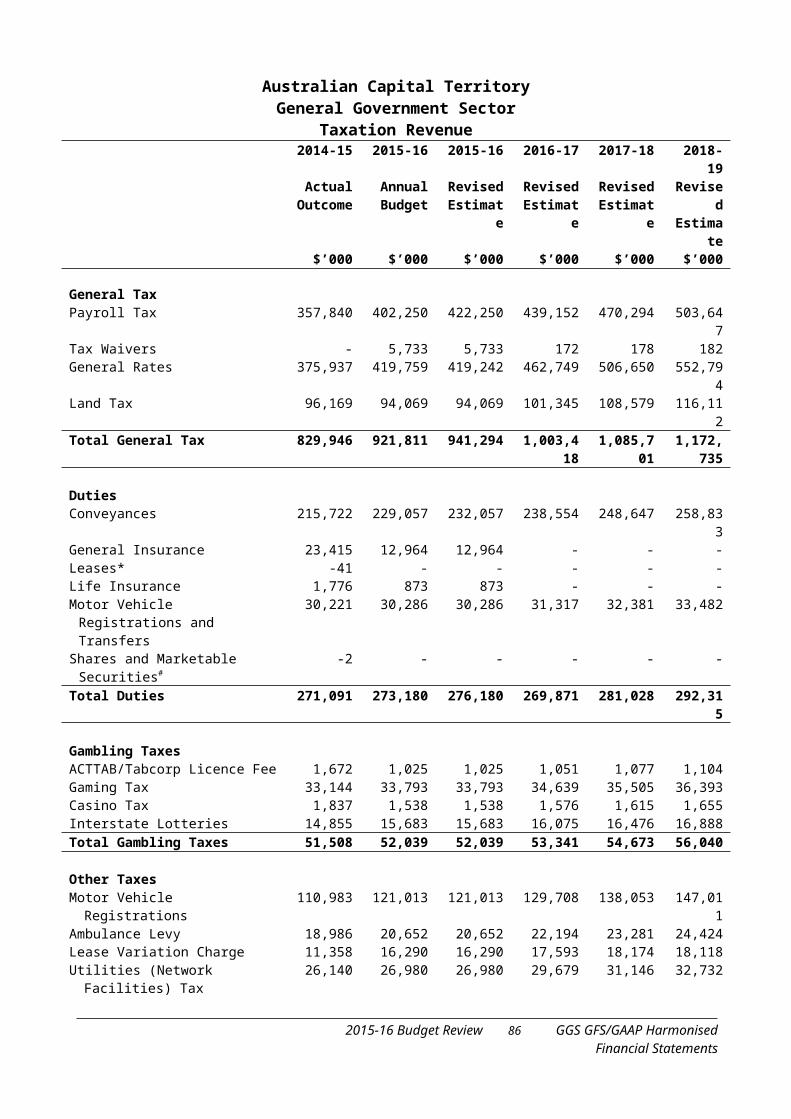
Australian Capital TerritoryPublic Trading Enterprises
Balance Sheet Empty Cell 2014-15 2015-16 2015-16 2016-17 2017-18 2018-19
Empty Cell
ActualOutcome
AnnualBudget
RevisedEstimate
RevisedEstimate
RevisedEstimate
RevisedEstimate
Empty Cell $’000 $’000 $’000 $’000 $’000 $’000Financial Assets Empty Cell Empty Cell Empty Cell Empty Cell Empty Cell Empty Cell
Cash and Deposits 195,265 112,491 181,052 91,148 174,494 173,574Investments and Loans 79,591 67,438 67,580 68,221 66,456 67,027Receivables 127,633 168,437 153,104 149,408 151,164 152,007Equity – Investments Accounted
for Using the Equity Method921,086 724,514 953,884 971,797 986,180 994,683
Total Financial Assets 1,323,575 1,072,880 1,355,620 1,280,574 1,378,294 1,387,291 Empty Cell Empty Cell Empty Cell Empty Cell Empty Cell Empty Cell Empty Cell
Non-Financial Assets Empty Cell Empty Cell Empty Cell Empty Cell Empty Cell Empty Cell
Produced Assets Empty Cell Empty Cell Empty Cell Empty Cell Empty Cell Empty Cell
Property, Plant and Equipment 3,428,473 3,414,922 3,481,975 3,481,217 3,443,483 3,354,348Investment Properties 8,147 9,452 9,130 10,111 11,092 12,073Intangibles 23,673 17,729 23,650 23,626 23,603 23,603Inventories 287,822 298,180 313,435 410,304 394,702 314,631Assets Held for Sale 6,842 2,540 2,911 3,180 3,449 3,718Capital Works-in-Progress 161,190 128,983 169,168 178,298 299,426 300,485
Non Produced Assets Empty Cell Empty Cell Empty Cell Empty Cell Empty Cell Empty Cell
Property, Plant and Equipment 3,213,149 3,257,244 3,286,528 3,390,696 3,432,815 3,566,498Other Non-Financial Assets Empty Cell Empty Cell Empty Cell Empty Cell Empty Cell Empty Cell
Deferred Tax Assets 32,192 28,167 32,196 32,196 32,196 32,196Other Non-Financial Assets - 11 - - - -
Total Non-Financial Assets 7,161,490 7,157,228 7,318,993 7,529,628 7,640,766 7,607,552Total Assets 8,485,065 8,230,108 8,674,613 8,810,202 9,019,060 8,994,843
Empty Cell Empty Cell Empty Cell Empty Cell Empty Cell Empty Cell Empty Cell
Liabilities Empty Cell Empty Cell Empty Cell Empty Cell Empty Cell Empty Cell
Advances Received 1,568,533 1,652,518 1,671,255 1,761,274 1,832,751 1,869,762Borrowings Empty Cell Empty Cell Empty Cell Empty Cell Empty Cell Empty Cell
Finance Leases - 845 - - - -Employee Benefits 61,590 63,407 59,988 60,594 61,164 61,732Other Provisions 185,203 139,556 196,284 209,433 234,689 254,125Payables 125,479 124,868 125,647 125,307 123,782 124,423Other Liabilities Empty Cell Empty Cell Empty Cell Empty Cell Empty Cell Empty Cell
Current Tax Liability 20,999 25,006 15,907 16,546 9,335 18,166Deferred Tax Liability 440,834 347,195 445,890 446,890 446,888 446,891Other Liabilities 46,135 108,367 74,930 73,745 126,617 20,334
Total Liabilities 2,449,041 2,461,762 2,589,901 2,693,789 2,835,226 2,795,433Net Assets 6,036,024 5,768,346 6,084,712 6,116,413 6,183,834 6,199,410
Empty Cell Empty Cell Empty Cell Empty Cell Empty Cell Empty Cell Empty Cell
Accumulated Funds 2,323,089 2,258,864 2,349,453 2,344,836 2,306,690 2,292,174Asset Revaluation Surplus 3,703,095 3,499,642 3,725,419 3,761,737 3,867,304 3,897,396Other Reserves 9,840 9,840 9,840 9,840 9,840 9,840
Empty Cell Empty Cell Empty Cell Empty Cell Empty Cell Empty Cell Empty Cell
Net Worth 6,036,024 5,768,346 6,084,712 6,116,413 6,183,834 6,199,410Empty Cell Empty Cell Empty Cell Empty Cell Empty Cell Empty Cell Empty Cell
Net Financial Worth -1,125,466 -1,388,882 -1,234,281 -1,413,215 -1,456,932 -1,408,142Net Debt 1,293,677 1,473,434 1,422,623 1,601,905 1,591,801 1,629,161
2015-16 Budget Review 87 Public Trading EnterprisesFinancial Statements
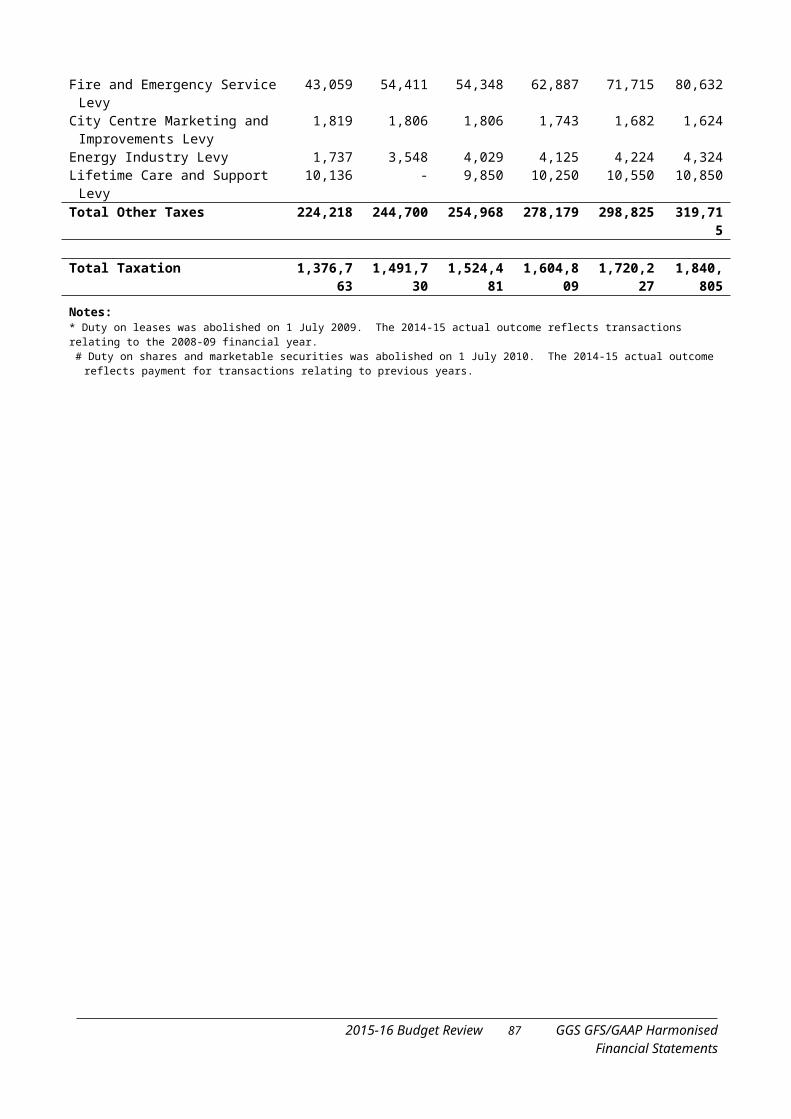
Australian Capital TerritoryPublic Trading Enterprises
Statement of Changes in EquityEmpty Cell 2014-15 2015-16 2015-16 2016-17 2017-18 2018-19
Empty Cell
ActualOutcome
AnnualBudget
RevisedEstimate
RevisedEstimate
RevisedEstimate
RevisedEstimate
Empty Cell $’000 $’000 $’000 $’000 $’000 $’000Empty Cell Empty Cell Empty Cell Empty Cell Empty Cell Empty Cell Empty Cell
Opening Equity Empty Cell Empty Cell Empty Cell Empty Cell Empty Cell Empty Cell
Opening Accumulated Funds 2,222,024 2,239,910 2,323,089 2,349,453 2,344,836 2,306,690Opening Asset Revaluation Surplus 3,486,549 3,477,319 3,703,095 3,725,419 3,761,737 3,867,304Opening Other Reserves 12,840 9,840 9,840 9,840 9,840 9,840Opening Balance 5,721,412 5,727,069 6,036,024 6,084,712 6,116,413 6,183,834
Empty Cell Empty Cell Empty Cell Empty Cell Empty Cell Empty Cell Empty Cell
Comprehensive Income Empty Cell Empty Cell Empty Cell Empty Cell Empty Cell Empty Cell
Included in Accumulated Funds: Empty Cell Empty Cell Empty Cell Empty Cell Empty Cell Empty Cell
Operating Result for the Period 207,678 192,443 192,453 224,837 110,638 195,271Other Movements 49,686 - - - - -
Included in Asset Revaluation Surplus:
Empty Cell Empty Cell Empty Cell Empty Cell Empty Cell Empty Cell
Increase/(Decrease) in the Asset Revaluation Surplus
263,637 44,323 44,324 51,340 59,159 52,092
Included in Other Reserves: Empty Cell Empty Cell Empty Cell Empty Cell Empty Cell Empty Cell
Increase/(Decrease) in Other Reserves
-3,000 - - - - -
Total Comprehensive Income 518,001 236,766 236,777 276,177 169,797 247,363 Empty Cell
Empty Cell Empty Cell Empty Cell Empty Cell Empty Cell Empty Cell
Other Empty Cell Empty Cell Empty Cell Empty Cell Empty Cell Empty Cell
Transfer to/(from) Accumulated Funds
47,091 22,000 22,000 15,022 -46,408 22,000
Movement in the Asset Revaluation Surplus
-47,091 -22,000 -22,000 -15,022 46,408 -22,000
Total Other 0 0 0 0 0 0 Empty Cell
Empty Cell Empty Cell Empty Cell Empty Cell Empty Cell Empty Cell
Transactions Involving Owners Affecting Accumulated Funds
Empty Cell Empty Cell Empty Cell Empty Cell Empty Cell Empty Cell
Capital Injections 43,421 31,001 38,401 12,038 5,000 5,000Capital Distributions -71,893 - - -5,155 -56,367 -Increase/(Decrease) in Net Assets
from the GGS574 - - 13,120 118,920 -
Dividends Approved -172,981 -226,490 -226,490 -264,479 -169,929 -236,787Total Transactions Involving
Owners Affecting Accumulated Funds
-200,878 -195,489 -188,089 -244,476 -102,376 -231,787
Empty CellEmpty Cell Empty Cell Empty Cell Empty Cell Empty Cell Empty Cell
Closing Equity Empty Cell Empty Cell Empty Cell Empty Cell Empty Cell Empty Cell
Closing Accumulated Funds 2,323,089 2,258,864 2,349,453 2,344,836 2,306,690 2,292,174Closing Asset Revaluation Surplus 3,703,095 3,499,642 3,725,419 3,761,737 3,867,304 3,897,396Closing Other Reserves 9,840 9,840 9,840 9,840 9,840 9,840Balance at the End of the Reporting
Period6,036,024 5,768,346 6,084,712 6,116,413 6,183,834 6,199,410
2015-16 Budget Review 88 Public Trading EnterprisesFinancial Statements
Australian Capital TerritoryPublic Trading Enterprises
Cash Flow Statement Empty Cell 2014-15 2015-16 2015-16 2016-17 2017-18 2018-19 Empty Cell Actual
OutcomeAnnualBudget
RevisedEstimate
RevisedEstimate
RevisedEstimate
RevisedEstimate
Empty Cell $’000 $’000 $’000 $’000 $’000 $’000Cash Flows from Operating
ActivitiesEmpty Cell Empty Cell Empty Cell Empty Cell Empty Cell Empty Cell
Cash Receipts Empty Cell Empty Cell Empty Cell Empty Cell Empty Cell Empty Cell
Receipts from Sales of Goods and Services
821,119 967,837 967,837 1,008,587 960,602 1,033,678
Grants/Subsidies Received 152,885 178,460 178,474 153,993 150,100 152,307Interest Receipts 5,416 2,224 2,224 1,921 1,918 1,947Distribution from Investments with
the Territory Banking Account3,610 3,636 3,636 1,625 815 755
Other Receipts 115,636 81,210 81,210 99,371 94,868 111,502Total Cash Received from Operating
Activities1,098,666 1,233,367 1,233,381 1,265,497 1,208,303 1,300,189
Empty Cell Empty Cell Empty Cell Empty Cell Empty Cell Empty Cell Empty Cell
Cash Payments Empty Cell Empty Cell Empty Cell Empty Cell Empty Cell Empty Cell
Payments for Employees -187,537 -208,438 -203,142 -195,109 -199,144 -198,821Payments for Goods and Services -197,829 -213,952 -219,399 -203,584 -212,069 -213,748Grants/Subsidies Paid -23,923 -23,821 -23,835 -24,149 -21,661 -23,084Interest Paid -76,896 -90,140 -90,119 -94,739 -101,125 -103,661Other Payments -348,783 -405,084 -405,084 -430,626 -314,799 -298,648Total Cash Paid from Operating
Activities-834,968 -941,435 -941,579 -948,207 -848,798 -837,962
Net Cash Flows from Operating Activities
263,698 291,932 291,802 317,290 359,505 462,227
Empty CellEmpty Cell Empty Cell Empty Cell Empty Cell Empty Cell Empty Cell
Cash Flows from Investing Activities Empty Cell Empty Cell Empty Cell Empty Cell Empty Cell Empty Cell
Cash Flows from Investments in Non-Financial Assets
Empty Cell Empty Cell Empty Cell Empty Cell Empty Cell Empty Cell
Sales of Non-Financial Assets 56,500 35,576 35,576 50,490 54,590 64,738Payments for Non-Financial Assets -123,646 -177,960 -185,360 -174,778 -152,621 -132,945Net Cash Flows from Investments in
Non-Financial Assets-67,145 -142,384 -149,784 -124,288 -98,031 -68,207
Empty CellEmpty Cell Empty Cell Empty Cell Empty Cell Empty Cell Empty Cell
Cash Flows from Investments in Financial Assets for Policy Purposes
Empty Cell Empty Cell Empty Cell Empty Cell
Cash Receipts Empty CellEmpty Cell
Empty Cell Empty Cell Empty Cell Empty Cell
Capital Receipts from Government Agencies
43,421 31,001 38,401 12,038 5,000 5,000
Total Cash Received from Investment in Financial Assets for Policy Purposes
43,421 31,001 38,401 12,038 5,000 5,000
Empty Cell Empty Cell Empty Cell Empty Cell Empty Cell Empty Cell Empty CellEmpty Cell Empty Cell Empty Cell Empty Cell Empty Cell Empty Cell Empty CellEmpty Cell Empty Cell Empty Cell Empty Cell Empty Cell Empty Cell Empty CellEmpty Cell Empty Cell Empty Cell Empty Cell Empty Cell Empty Cell Empty CellEmpty Cell Empty Cell Empty Cell Empty Cell Empty Cell Empty Cell Empty CellEmpty Cell Empty Cell Empty Cell Empty Cell Empty Cell Empty Cell Empty CellEmpty Cell Empty Cell Empty Cell Empty Cell Empty Cell Empty Cell Empty CellEmpty Cell Empty Cell Empty Cell Empty Cell Empty Cell Empty Cell Empty CellEmpty Cell Empty Cell Empty Cell Empty Cell Empty Cell Empty Cell Empty CellEmpty Cell Empty Cell Empty Cell Empty Cell Empty Cell Empty Cell Empty CellEmpty Cell Empty Cell Empty Cell Empty Cell Empty Cell Empty Cell Empty CellEmpty Cell Empty Cell Empty Cell Empty Cell Empty Cell Empty Cell Empty CellEmpty Cell Empty Cell Empty Cell Empty Cell Empty Cell Empty Cell Empty CellEmpty Cell Empty Cell Empty Cell Empty Cell Empty Cell Empty Cell Empty CellEmpty Cell Empty Cell Empty Cell Empty Cell Empty Cell Empty Cell Empty CellEmpty Cell Empty Cell Empty Cell Empty Cell Empty Cell Empty Cell Empty Cell
2015-16 Budget Review 89 Public Trading EnterprisesFinancial Statements
Australian Capital TerritoryPublic Trading Enterprises
Cash Flow Statement Empty Cell 2014-15 2015-16 2015-16 2016-17 2017-18 2018-19 Empty Cell Actual
OutcomeAnnualBudget
RevisedEstimate
RevisedEstimate
RevisedEstimate
RevisedEstimate
Empty Cell $’000 $’000 $’000 $’000 $’000 $’000Cash Payments Empty Cell Empty Cell Empty Cell Empty Cell Empty Cell Empty Cell
Dividends – Market Gains on Land Sales
-5,074 -49,775 -49,775 -137,470 -77,006 -88,251
Distributions to Government -110,253 - - - - -Total Cash Paid from Investment in
Financial Assets for Policy Purposes
-115,327 -49,775 -49,775 -137,470 -77,006 -88,251
Net Cash Flows from Investments in Financial Assets for Policy Purposes
-71,905 -18,774 -11,374 -125,432 -72,006 -83,251
Empty Cell Empty Cell Empty Cell Empty Cell Empty Cell
Cash Flows from Investments in Financial Assets for Liquidity Purposes
Empty Cell Empty Cell Empty Cell Empty Cell Empty Cell Empty Cell
Sales of Investments 177,679 339,874 324,345 464,512 304,512 384,827Payments for Investments -36,577 -349,036 -429,130 -383,698 -392,461 -386,842Cash Flows from Investments in
Financial Assets for Liquidity Purposes
141,102 -9,162 -104,785 80,814 -87,949 -2,015
Net Cash Flows from Investing Activities
2,052 -170,320 -265,943 -168,906 -257,986 -153,473
Empty Cell Empty Cell Empty Cell Empty Cell Empty Cell Empty Cell Empty Cell
Cash Flows from Financing Activities
Empty CellEmpty Cell Empty Cell Empty Cell Empty Cell Empty Cell
Cash Receipts Empty Cell Empty Cell Empty Cell Empty Cell Empty Cell Empty Cell
Borrowings 60,678 104,300 104,300 108,300 392,300 61,301Total Cash Received from Financing
Activities60,678 104,300 104,300 108,300 392,300 61,301
Empty Cell Empty Cell Empty Cell Empty Cell Empty Cell Empty Cell Empty Cell
Cash Payments Empty Cell Empty Cell Empty Cell Empty Cell Empty Cell Empty Cell
Borrowings -21,960 -17,160 -17,030 -18,648 -321,086 -23,642Dividends Paid -151,319 -132,049 -142,924 -132,199 -96,535 -253,745Other Financing -66,674 -96,891 -96,891 -111,493 -79,824 -92,434Total Cash Paid from Financing
Activities-239,954 -246,100 -256,845 -262,340 -497,445 -369,821
Net Cash Flows from Financing Activities
-179,275 -141,800 -152,545 -154,040 -105,145 -308,520
Empty Cell Empty Cell Empty Cell Empty Cell Empty Cell Empty Cell Empty Cell
Net Increase/(Decrease) in Cash Held
86,474 -20,188 -126,686 -5,656 -3,626 234
Empty Cell Empty Cell Empty Cell Empty Cell Empty Cell Empty Cell Empty Cell
Cash and Cash Equivalents at the Beginning of Reporting Period
166,791 82,622 253,265 126,579 120,923 117,297
Cash and Cash Equivalents at the End of Reporting Period
253,265 62,434 126,579 120,923 117,297 117,531
Empty Cell Empty Cell Empty Cell Empty Cell Empty Cell Empty Cell Empty CellEmpty Cell Empty Cell Empty Cell Empty Cell Empty Cell Empty Cell Empty CellEmpty Cell Empty Cell Empty Cell Empty Cell Empty Cell Empty Cell Empty CellEmpty Cell Empty Cell Empty Cell Empty Cell Empty Cell Empty Cell Empty CellEmpty Cell Empty Cell Empty Cell Empty Cell Empty Cell Empty Cell Empty CellEmpty Cell Empty Cell Empty Cell Empty Cell Empty Cell Empty Cell Empty Cell
2015-16 Budget Review 90 Public Trading EnterprisesFinancial Statements
Australian Capital TerritoryPublic Trading Enterprises
Cash Flow Statement Empty Cell 2014-15 2015-16 2015-16 2016-17 2017-18 2018-19 Empty Cell Actual
OutcomeAnnualBudget
RevisedEstimate
RevisedEstimate
RevisedEstimate
RevisedEstimate
Empty Cell $’000 $’000 $’000 $’000 $’000 $’000
Key Fiscal Aggregates Empty Cell Empty Cell Empty Cell Empty Cell Empty Cell Empty Cell
Net Cash from Operating Activities 263,698 291,932 291,802 317,290 359,505 462,227Net Cash Flows from Investments in
Non-Financial Assets-67,145 -142,384 -149,784 -124,288 -98,031 -68,207
Distributions Paid -217,993 -228,940 -239,815 -243,692 -176,359 -346,179Cash Surplus (+) / Deficit (-) -21,440 -79,392 -97,797 -50,690 85,115 47,841
Empty Cell Empty Cell Empty Cell Empty Cell Empty Cell Empty Cell Empty Cell
Derivation of ABS GFS Cash Surplus/Deficit Empty Cell Empty Cell Empty Cell Empty Cell
Empty Cell Empty Cell Empty Cell Empty Cell Empty Cell
Cash Surplus (+) / Deficit (-) -21,440 -79,392 -97,797 -50,690 85,115 47,841Acquisitions Under Finance Leases
and Similar Arrangements(a)- - - - - -
ABS GFS Cash Surplus (+)/Deficit (-) Including Finance and Similar Arrangements
-21,440 -79,392 -97,797 -50,690 85,115 47,841
Note: (a) Finance leases are shown with a negative sign as they are deducted in compiling the ABS GFS cash surplus/deficit.
2015-16 Budget Review 91 Public Trading EnterprisesFinancial Statements
2015-16 Budget Review 92 Public Trading EnterprisesFinancial Statements
APPENDIX D
TOTAL TERRITORY FINANCIAL STATEMENTS
2015-16 Budget Review 93 Total TerritoryFinancial Statements
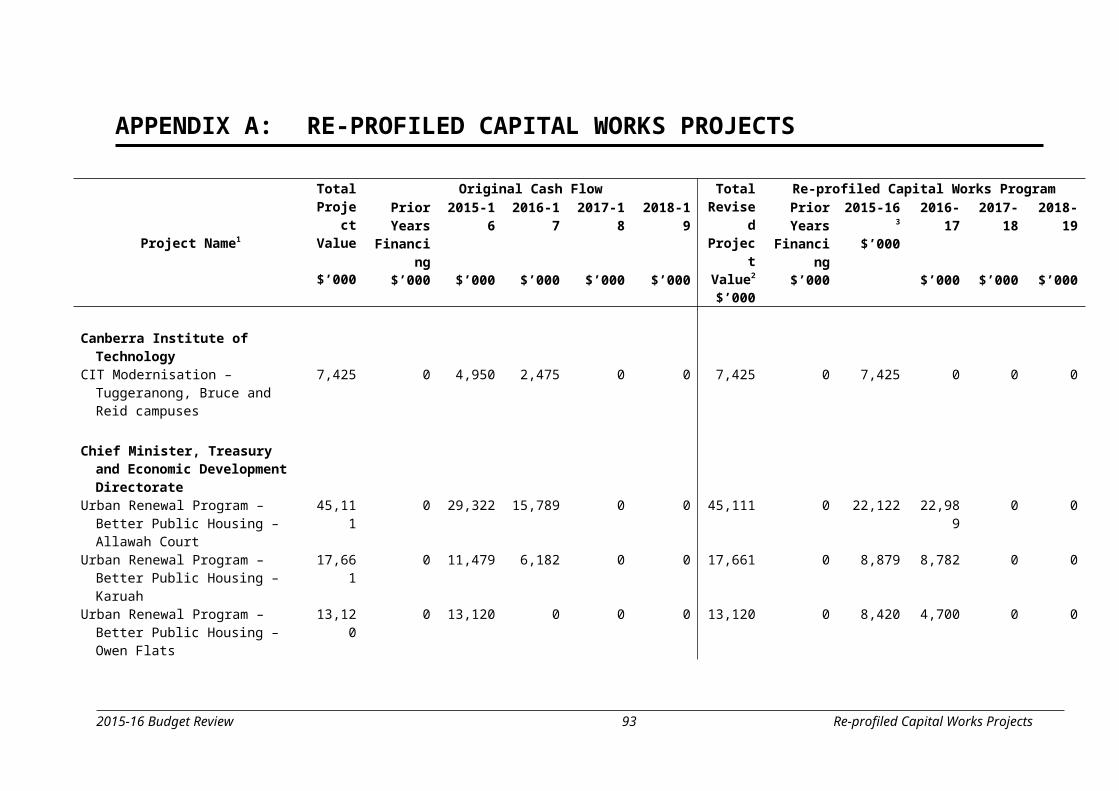
2015-16 Budget Review 94 Total TerritoryFinancial Statements
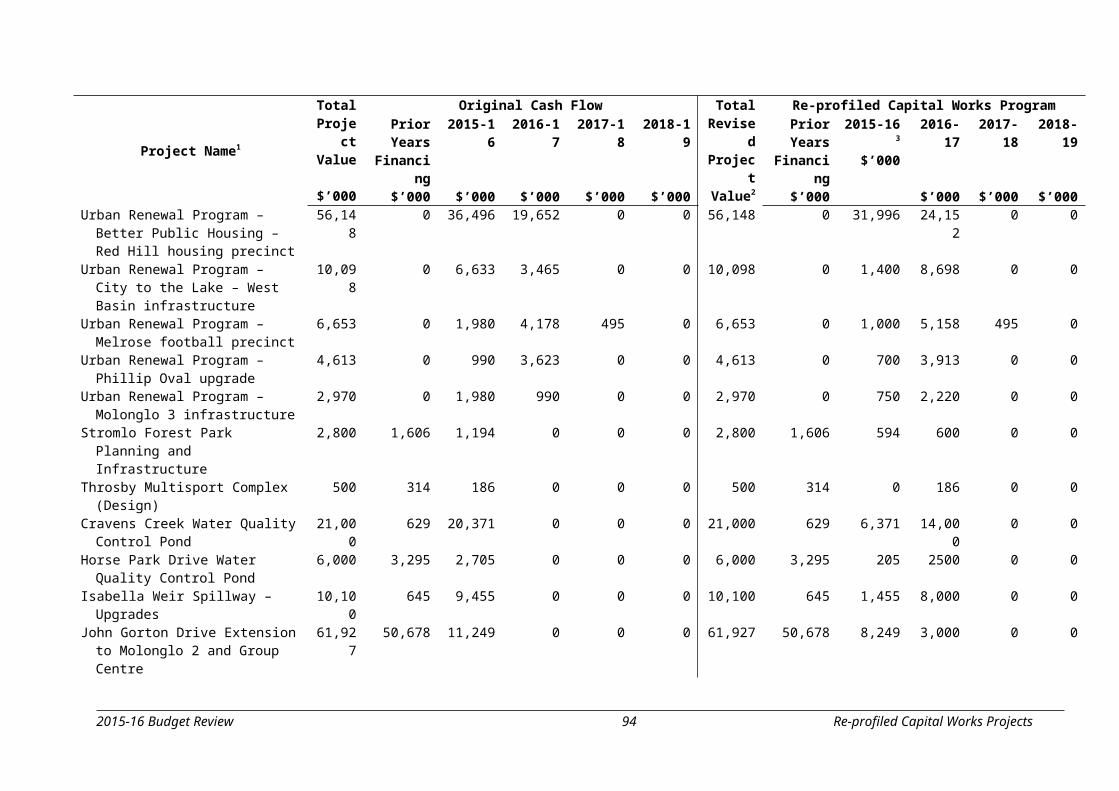
Australian Capital TerritoryConsolidated Total Territory
Operating Statement Empty Cell 2014-15 2015-16 2015-16 2016-17 2017-18 2018-19 Empty Cell Actual
OutcomeAnnualBudget
RevisedEstimate
RevisedEstimate
RevisedEstimate
RevisedEstimate
Empty Cell $’000 $’000 $’000 $’000 $’000 $’000Revenue Empty Cell Empty Cell Empty Cell Empty Cell Empty Cell Empty Cell
Taxation Revenue 1,338,891 1,453,547 1,486,044 1,565,888 1,679,031 1,797,569Grants Revenue Empty Cell Empty Cell Empty Cell Empty Cell Empty Cell Empty Cell
Commonwealth Grants 1,993,828 1,860,511 1,862,186 2,024,227 2,070,549 2,124,503Gains from Contributed Assets 38,453 50,260 50,260 50,271 50,280 50,291
Sales of Goods and Services Empty Cell Empty Cell Empty Cell Empty Cell Empty Cell Empty Cell
Revenue from Associates and Joint Ventures
102,730 67,032 67,032 74,822 76,965 77,048
Other Sales of Goods and Services 809,668 829,673 819,399 844,828 934,463 954,871Interest Income 62,770 54,055 54,891 54,789 48,740 52,855Distributions from Financial
Investments68,692 63,167 28,631 38,291 48,551 52,037
Dividend Income 50,356 50,858 52,085 51,958 53,359 57,354Other Revenue Empty Cell Empty Cell Empty Cell Empty Cell Empty Cell Empty Cell
Land Revenue (Value Add Component)
242,026 305,556 305,556 344,068 359,402 315,960
Other Revenue 135,682 136,667 136,812 136,843 139,349 142,435Total Revenue 4,843,096 4,871,326 4,862,896 5,185,985 5,460,689 5,624,923
Empty Cell Empty Cell Empty Cell Empty Cell Empty Cell Empty Cell Empty Cell
Expenses Empty Cell Empty Cell Empty Cell Empty Cell Empty Cell Empty Cell
Employee Expenses 1,942,042 1,985,272 1,985,317 2,021,956 2,056,384 2,114,582Superannuation Expenses Empty Cell Empty Cell Empty Cell Empty Cell Empty Cell Empty Cell
Superannuation Interest Cost 313,820 350,898 315,401 366,913 382,446 397,490Other Superannuation Expense 336,288 280,384 373,542 290,584 292,913 295,048
Depreciation and Amortisation 434,654 444,545 440,818 468,836 501,189 496,773Interest Expense 154,346 202,105 187,862 216,032 231,928 230,721Other Operating Expenses Empty Cell Empty Cell Empty Cell Empty Cell Empty Cell Empty Cell
Supplies and Services 978,867 1,162,677 1,178,673 1,145,156 1,180,518 1,222,669Other Operating Expenses 240,492 333,622 298,010 176,233 229,319 266,248
Grants and Purchased Services 1,088,454 761,137 833,393 793,334 834,829 842,038Total Expenses 5,488,963 5,520,640 5,613,016 5,479,044 5,709,526 5,865,569UPF Net Operating Balance -645,867 -649,314 -750,120 -293,059 -248,837 -240,646
Empty Cell Empty Cell Empty Cell Empty Cell
Other Economic Flows - Included in the Operating Result Empty Cell Empty Cell Empty Cell
Land Revenue (Market Gains on Land Sales)
7,248 71,107 71,107 108,921 29,485 126,073
Net Land Revenue (Undeveloped Land Value)
45,133 89,746 89,746 87,367 107,909 124,547
Net Gain/(Loss) on Sale/(Disposal) of NonFinancial Assets
-4,848 -26,491 -26,453 -56,147 -95,121 -31,769
Net Gain/(Loss) on Financial Assets or Liabilities at Fair Value
188,172 131,754 162,331 172,487 186,663 200,801
Doubtful Debts -4,765 -8,051 -8,051 -8,392 -8,619 -8,846Operating Result -414,927 -391,249 -461,440 11,177 -28,520 170,160
Empty Cell Empty Cell Empty Cell Empty Cell
Empty Cell Empty Cell Empty Cell Empty Cell
Empty Cell Empty Cell Empty Cell Empty Cell
Empty Cell Empty Cell Empty Cell Empty Cell
2015-16 Budget Review 95 Total TerritoryFinancial Statements
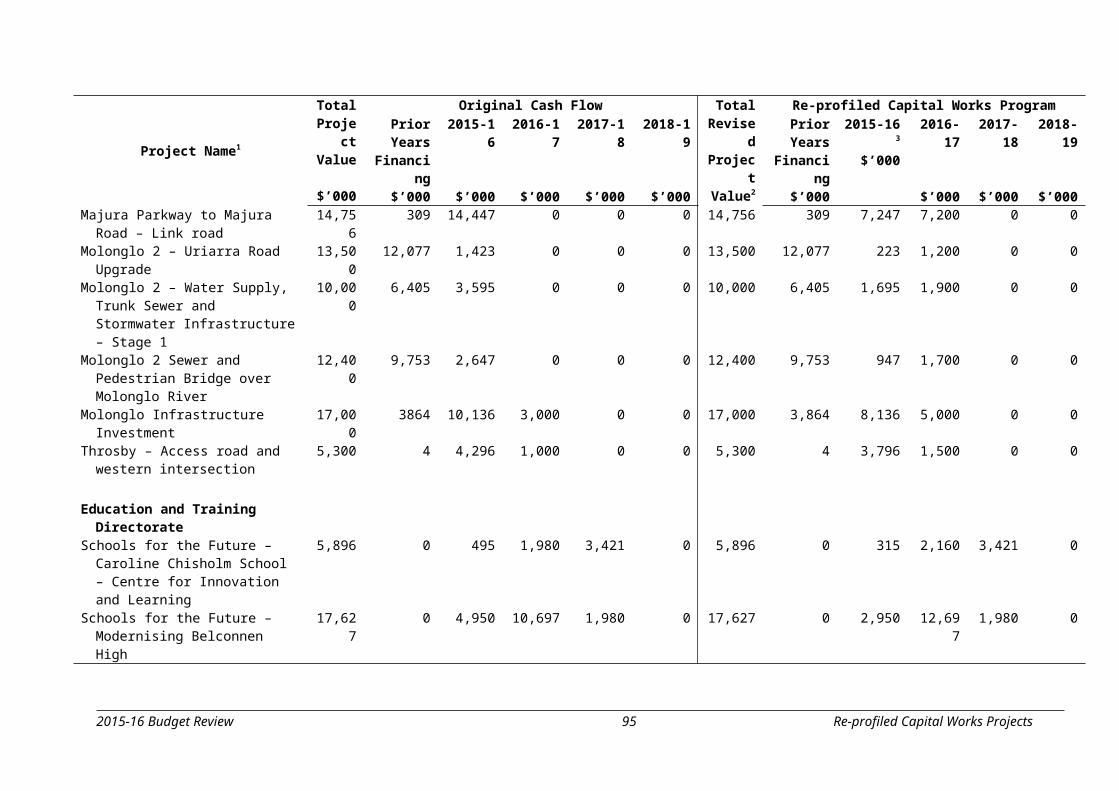
Australian Capital TerritoryConsolidated Total Territory
Operating Statement Empty Cell 2014-15 2015-16 2015-16 2016-17 2017-18 2018-19 Empty Cell Actual
OutcomeAnnualBudget
RevisedEstimate
RevisedEstimate
RevisedEstimate
RevisedEstimate
Empty Cell $’000 $’000 $’000 $’000 $’000 $’000Other Economic Flows - Other
Comprehensive IncomeEmpty Cell Empty Cell Empty Cell Empty Cell Empty Cell Empty Cell
Items that will not be Subsequently Reclassified to Profit or Loss
Empty Cell Empty Cell Empty Cell Empty Cell Empty Cell Empty Cell
Superannuation Actuarial Gain/(Loss) -666,808 - 2,733,049 - - -Prior Year Adjustment -612 - - - - -Other Movements 49,554 889 889 889 889 889Increase/(Decrease) in the Asset
Revaluation Surplus514,298 139,898 160,403 121,385 124,203 108,557
Increase/(Decrease) in Other Reserves -2,700 - - - - -Empty Cell Empty Cell Empty Cell Empty Cell Empty Cell Empty Cell Empty Cell
Total Comprehensive Income -521,195 -250,462 2,432,901 133,451 96,572 279,606Empty Cell Empty Cell Empty Cell Empty Cell Empty Cell Empty Cell Empty Cell
UPF Net Operating Balance -645,867 -649,314 -750,120 -293,059 -248,837 -240,646less Net Acquisition of Non-Financial
Assets Empty Cell Empty Cell Empty Cell Empty Cell Empty Cell Empty Cell
Payments for Non-Financial Assets 842,077 1,113,634 1,033,095 1,108,843 816,640 543,931Sales of Non-Financial Assets -100,687 -91,410 -91,073 -132,432 -189,615 -199,763Land Revenue (Net Cash Receipts) -55,305 -147,694 -147,694 -177,865 -109,670 -222,176Depreciation and Amortisation -434,654 -444,545 -440,818 -468,836 -501,189 -496,773Other Movements in Non-Financial Assets 34,757 50,000 50,000 50,000 50,000 50,000Total Net Acquisition of Non-Financial
Assets286,188 479,985 403,510 379,710 66,166 -324,781
Empty Cell Empty Cell Empty Cell Empty Cell Empty Cell Empty Cell Empty Cell
Net Lending / (Borrowing) -932,054 -1,129,299 -1,153,630 -672,769 -315,003 84,135Empty Cell Empty Cell Empty Cell Empty Cell Empty Cell Empty Cell Empty Cell
Empty Cell Empty Cell Empty Cell Empty Cell Empty Cell Empty Cell
UPF Net Operating Balance -645,867 -649,314 -750,120 -293,059 -248,837 -240,646Superannuation Return Adjustment 109,636 131,440 160,320 172,175 186,351 200,489
Empty Cell Empty Cell Empty Cell Empty Cell Empty Cell Empty Cell Empty Cell
HEADLINE NET OPERATING BALANCE -536,231 -517,874 -589,800 -120,884 -62,486 -40,157
2015-16 Budget Review 96 Total TerritoryFinancial Statements
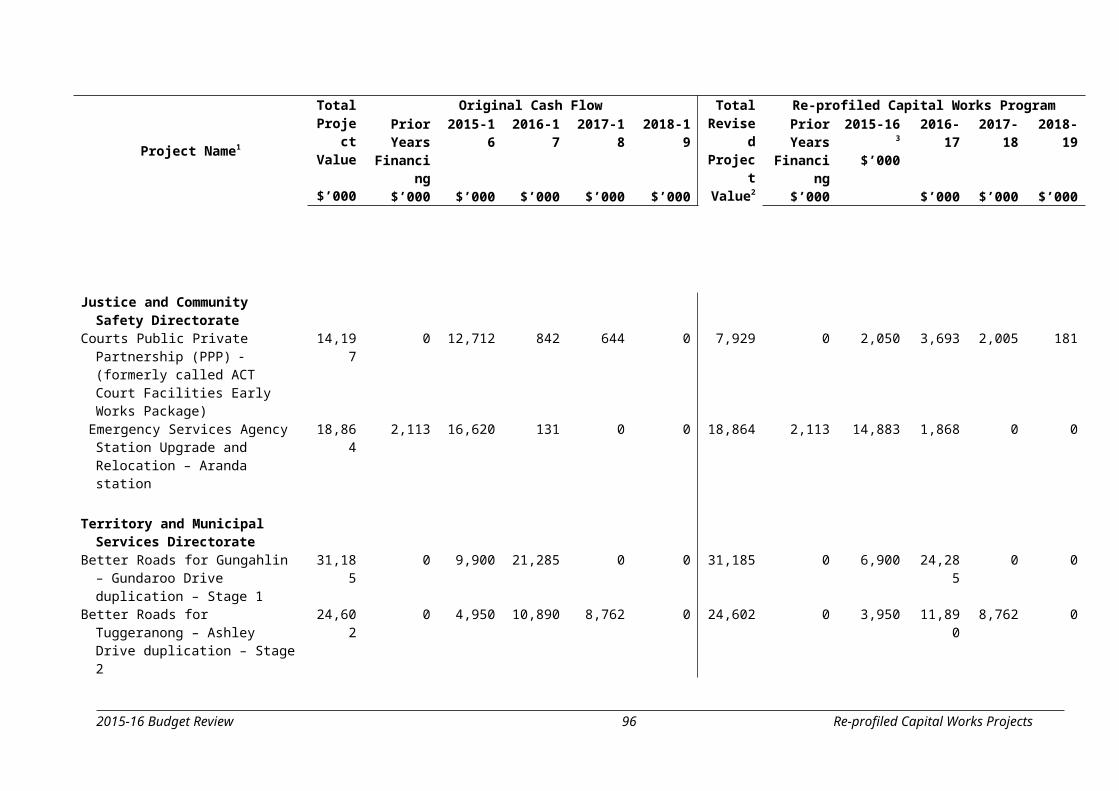
Australian Capital TerritoryConsolidated Total Territory
Balance SheetEmpty Cell 2014-15 2015-16 2015-16 2016-17 2017-18 2018-19Empty Cell Actual
OutcomeAnnualBudget
RevisedEstimate
RevisedEstimate
RevisedEstimate
RevisedEstimate
Empty Cell $’000 $’000 $’000 $’000 $’000 $’000Financial Assets Empty Cell Empty Cell Empty Cell Empty Cell Empty Cell Empty Cell
Cash and Deposits 822,376 334,591 513,128 506,977 497,694 491,003Advances Paid 101,174 103,747 80,257 79,014 75,290 71,713Investments and Loans 4,278,179 4,276,769 4,613,087 4,715,786 5,221,358 5,593,261Receivables 339,259 318,703 497,028 484,771 449,142 453,209Equity – Investments Accounted for
Using the Equity Method921,086 724,514 953,884 971,797 986,180 994,683
Total Financial Assets 6,462,075 5,758,324 6,657,384 6,758,345 7,229,664 7,603,869Empty Cell Empty Cell Empty Cell Empty Cell Empty Cell Empty Cell Empty Cell
Non-Financial Assets Empty Cell Empty Cell Empty Cell Empty Cell Empty Cell Empty Cell
Produced Assets Empty Cell Empty Cell Empty Cell Empty Cell Empty Cell Empty Cell
Property, Plant and Equipment 16,417,882 14,619,955 14,969,095 15,401,443 15,852,504 15,854,596Investment Properties 10,747 12,052 11,730 12,711 13,692 14,673Intangibles 76,648 105,430 101,433 109,225 136,432 148,450Inventories 302,160 293,459 300,163 397,230 381,827 301,956Assets Held for Sale 6,892 3,230 2,961 3,230 3,499 3,768Capital Works-in-Progress 781,627 1,341,620 1,025,752 1,185,031 960,134 856,173
Non Produced Assets Empty Cell Empty Cell Empty Cell Empty Cell Empty Cell Empty Cell
Property, Plant and Equipment 4,475,844 6,834,837 6,365,029 6,591,142 6,751,629 7,006,676Loose-Fill Asbestos Insulation
Eradication Scheme Land282,617 - 394,622 350,746 261,390 168,567
Biological Assets 26,489 26,457 26,491 26,491 26,491 26,491Other Non-Financial Assets 17 56 - - - -Total Non-Financial Assets 22,380,924 23,237,096 23,197,276 24,077,249 24,387,598 24,381,350
Empty Cell Empty Cell Empty Cell Empty Cell Empty Cell Empty Cell Empty Cell
Total Assets 28,842,998 28,995,420 29,854,660 30,835,594 31,617,262 31,985,219Empty Cell Empty Cell Empty Cell Empty Cell Empty Cell Empty Cell Empty Cell
Liabilities Empty Cell Empty Cell Empty Cell Empty Cell Empty Cell Empty Cell
Deposits Held 15,694 15,539 15,694 15,694 15,694 15,694Advances Received 904,279 1,143,143 1,143,143 1,134,617 1,075,931 1,017,155Borrowings Empty Cell Empty Cell Empty Cell Empty Cell Empty Cell Empty Cell
Finance Leases 277 23,157 294 181 63 22Other Borrowings 3,148,401 3,826,776 3,840,755 4,386,886 4,814,539 4,659,113
Superannuation 8,500,035 6,098,573 6,103,378 6,376,610 6,641,525 6,897,849Employee Benefits 722,038 681,454 708,086 737,132 764,535 792,030Other Provisions 332,954 131,978 363,821 343,324 336,736 323,154Payables 524,759 569,903 567,015 596,563 627,339 659,962Other Liabilities 22,405 15,766 7,417 6,079 5,820 5,552
Empty Cell Empty Cell Empty Cell Empty Cell Empty Cell Empty Cell Empty Cell
Total Liabilities 14,170,842 12,506,289 12,749,603 13,597,086 14,282,182 14,370,531Empty Cell Empty Cell Empty Cell Empty Cell Empty Cell Empty Cell Empty Cell
Net Assets 14,672,156 16,489,131 17,105,057 17,238,508 17,335,080 17,614,688Empty Cell Empty Cell Empty Cell Empty Cell Empty Cell Empty Cell Empty Cell
Empty Cell Empty Cell Empty Cell Empty Cell Empty Cell Empty Cell Empty Cell
Empty Cell Empty Cell Empty Cell Empty Cell Empty Cell Empty Cell Empty Cell
Empty Cell Empty Cell Empty Cell Empty Cell Empty Cell Empty Cell Empty Cell
Empty Cell Empty Cell Empty Cell Empty Cell Empty Cell Empty Cell Empty Cell
2015-16 Budget Review 97 Total TerritoryFinancial Statements
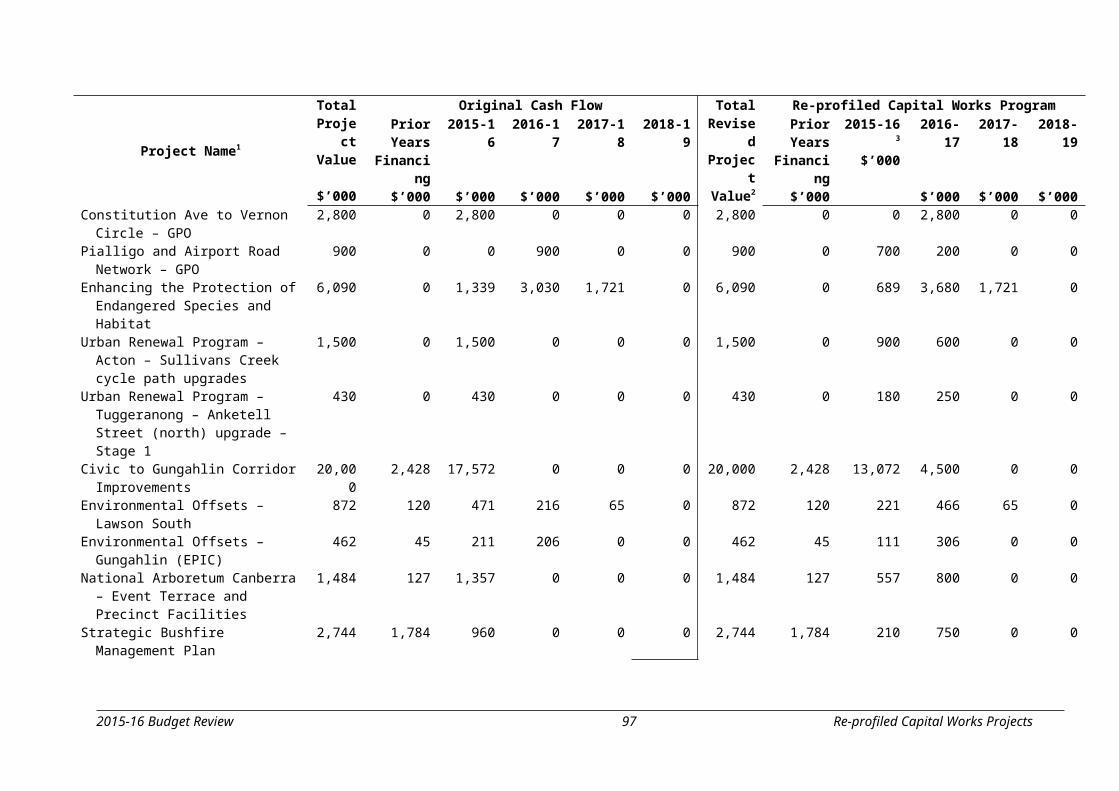
Australian Capital TerritoryConsolidated Total Territory
Balance SheetEmpty Cell 2014-15 2015-16 2015-16 2016-17 2017-18 2018-19Empty Cell Actual
OutcomeAnnualBudget
RevisedEstimate
RevisedEstimate
RevisedEstimate
RevisedEstimate
Empty Cell $’000 $’000 $’000 $’000 $’000 $’000Accumulated Funds 5,316,340 7,232,993 7,610,838 7,637,926 7,563,887 7,756,938Asset Revaluation Surplus 9,345,476 9,245,948 9,483,879 9,590,242 9,760,853 9,847,410Other Reserves 10,340 10,190 10,340 10,340 10,340 10,340
Empty Cell Empty Cell Empty Cell Empty Cell Empty Cell Empty Cell Empty Cell
Net Worth 14,672,156 16,489,131 17,105,057 17,238,508 17,335,080 17,614,688Empty Cell Empty Cell Empty Cell Empty Cell Empty Cell Empty Cell Empty Cell
Net Financial Worth -7,708,768 -6,747,965 -6,092,219 -6,838,741 -7,052,518 -6,766,662Net Financial Liabilities 8,629,854 7,472,479 7,046,103 7,810,538 8,038,698 7,761,345Net Debt (Including Superannuation
Related Investments)-1,133,078 293,508 -206,586 235,601 111,885 -463,993
Net Debt (excluding Superannuation related Investments)
2,203,254 3,899,164 3,379,158 4,089,785 4,254,833 3,989,742
Empty Cell Empty Cell Empty Cell Empty Cell Empty Cell Empty Cell Empty Cell
2015-16 Budget Review 98 Total TerritoryFinancial Statements
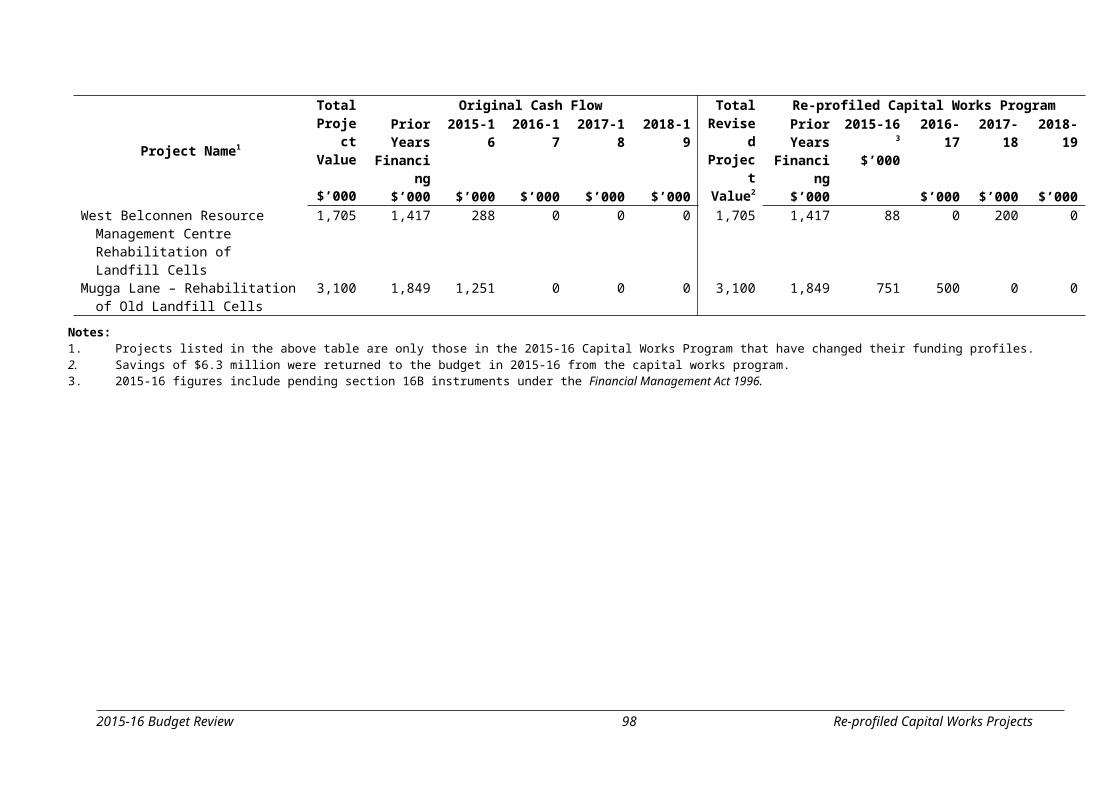
Australian Capital TerritoryConsolidated Total Territory
Statement of Changes in Equity Empty Cell 2014-15 2015-16 2015-16 2016-17 2017-18 2018-19
Empty Cell
ActualOutcome
AnnualBudget
RevisedEstimate
RevisedEstimate
RevisedEstimate
RevisedEstimate
Empty Cell $’000 $’000 $’000 $’000 $’000 $’000Opening Equity Empty Cell Empty Cell Empty Cell Empty Cell Empty Cell Empty Cell
Opening Accumulated Funds 6,113,493 7,601,353 5,316,340 7,610,838 7,637,926 7,563,887Opening Asset Revaluation Surplus 9,066,244 9,128,050 9,345,476 9,483,879 9,590,242 9,760,853Opening Other Reserves 13,040 10,190 10,340 10,340 10,340 10,340Opening Balance 15,192,777 16,739,593 14,672,156 17,105,057 17,238,508 17,335,080
Empty Cell Empty Cell Empty Cell Empty Cell Empty Cell Empty Cell Empty Cell
Comprehensive Income Empty Cell Empty Cell Empty Cell Empty Cell Empty Cell Empty Cell
Included in Accumulated Funds: Empty Cell Empty Cell Empty Cell Empty Cell Empty Cell Empty Cell
Operating Result for the Period -414,927 -391,249 -461,440 11,177 -28,520 170,162Superannuation Actuarial Gain/(Loss) -666,808 - 2,733,049 - - -Prior Year Adjustment -612 - - - - -Other Movements 49,554 889 889 889 889 889Included in Asset Revaluation Surplus: Empty Cell Empty Cell Empty Cell Empty Cell Empty Cell Empty Cell
Increase/(Decrease) in the Asset Revaluation Surplus
514,298 139,898 160,403 121,385 124,203 108,557
Included in Other Reserves: Empty Cell Empty Cell Empty Cell Empty Cell Empty Cell Empty Cell
Increase/(Decrease) in Other Reserves
-2,700 - - - - -
Total Comprehensive Income -521,195 -250,462 2,432,901 133,451 96,572 279,608 Empty Cell Empty Cell Empty Cell Empty Cell Empty Cell Empty Cell Empty Cell
Other Empty Cell Empty Cell Empty Cell Empty Cell Empty Cell Empty Cell
Transfer to/(from) Accumulated Funds
235,067 22,000 22,000 15,022 -46,408 22,000
Movement in the Asset Revaluation Surplus
-235,067 -22,000 -22,000 -15,022 46,408 -22,000
Total Other 0 0 0 0 0 0 Empty Cell Empty Cell Empty Cell Empty Cell Empty Cell Empty Cell Empty Cell
Transactions Involving Owners Affecting Accumulated Funds
Empty Cell Empty Cell Empty Cell Empty Cell Empty Cell Empty Cell
Increase/(Decrease) in ACTTAB Net Assets
574 - - - - -
Total Transactions Involving Owners Affecting Accumulated Funds
574 0 0 0 0 0
Empty Cell Empty Cell Empty Cell Empty Cell Empty Cell Empty Cell Empty Cell
Closing Equity Empty Cell Empty Cell Empty Cell Empty Cell Empty Cell Empty Cell
Closing Accumulated Funds 5,316,340 7,232,993 7,610,838 7,637,926 7,563,887 7,756,938Closing Asset Revaluation Surplus 9,345,476 9,245,948 9,483,879 9,590,242 9,760,853 9,847,410Closing Other Reserves 10,340 10,190 10,340 10,340 10,340 10,340Balance at the End of the Reporting
Period14,672,156 16,489,131 17,105,057 17,238,508 17,335,080 17,614,688
2015-16 Budget Review 99 Total TerritoryFinancial Statements
Australian Capital TerritoryConsolidated Total Territory
Cash Flow Statement Empty Cell 2014-15 2015-16 2015-16 2016-17 2017-18 2018-19 Empty Cell Actual
OutcomeAnnualBudget
RevisedEstimate
RevisedEstimate
RevisedEstimate
RevisedEstimate
Empty Cell $’000 $’000 $’000 $’000 $’000 $’000Cash Flows from Operating
ActivitiesEmpty Cell Empty Cell Empty Cell Empty Cell Empty Cell Empty Cell
Cash Receipts Empty Cell Empty Cell Empty Cell Empty Cell Empty Cell Empty Cell
Taxes Received 1,351,814 1,455,478 1,487,975 1,572,423 1,686,736 1,803,647Receipts from Sales of Goods and
Services1,139,325 1,254,792 1,243,839 1,346,014 1,389,451 1,482,728
Grants/Subsidies Received 1,990,900 1,864,625 1,866,300 2,029,083 2,102,919 2,124,216Interest Receipts 71,951 54,009 58,522 54,317 48,488 52,633Distributions from Financial
Investments60,135 63,166 28,631 38,291 48,551 52,037
Dividends 51,205 51,546 52,085 51,958 53,359 57,354Other Receipts 451,378 447,109 447,645 464,885 459,340 477,628Total Cash Received from Operating
Activities5,116,707 5,190,725 5,184,997 5,556,971 5,788,844 6,050,243
Empty Cell Empty Cell Empty Cell Empty Cell Empty Cell Empty Cell Empty Cell
Cash Payments Empty Cell Empty Cell Empty Cell Empty Cell Empty Cell Empty Cell
Payments for Employees -2,210,079 -2,368,807 -2,367,908 -2,404,395 -2,466,896 -2,551,391Payments for Goods and Services -1,036,151 -1,057,042 -1,088,493 -1,025,730 -1,083,419 -1,136,418Grants/Subsidies Paid -980,485 -842,419 -878,579 -793,993 -823,813 -819,529Interest Paid -158,106 -206,476 -192,595 -221,343 -238,950 -235,167Other Payments -603,885 -745,868 -694,295 -752,439 -607,680 -574,850Total Cash Paid from Operating
Activities-4,988,706 -5,220,612 -5,221,870 -5,197,900 -5,220,758 -5,317,355
Net Cash Flows from Operating Activities
128,002 -29,887 -36,873 359,071 568,086 732,888
Empty Cell Empty Cell Empty Cell Empty Cell Empty Cell Empty Cell Empty Cell
Cash Flows from Investing Activities Empty Cell Empty Cell Empty Cell Empty Cell Empty Cell Empty Cell
Cash Flows from Investments in Non-Financial Assets
Empty Cell Empty Cell Empty Cell Empty Cell Empty Cell Empty Cell
Sales of Non-Financial Assets 100,687 91,410 91,073 132,432 189,615 199,763Payments for Non-Financial Assets -842,077 -1,113,634 -1,033,095 -1,108,843 -816,640 -543,931Net Cash Flows from Investments in
Non-Financial Assets-741,390 -1,022,224 -942,022 -976,411 -627,025 -344,168
Empty Cell Empty Cell Empty Cell Empty Cell Empty Cell
Cash Flows from Investments in Financial Assets for Policy Purposes
Empty Cell Empty Cell Empty Cell Empty Cell Empty Cell Empty Cell
Cash Receipts Empty Cell Empty Cell Empty Cell Empty Cell Empty Cell Empty Cell
Repayment of Loans 73 498 498 366 2,778 2,728Total Cash Received from
Investments in Financial Assets for Policy Purposes
73 498 498 366 2,778 2,728
Empty Cell Empty Cell Empty Cell Empty Cell Empty Cell Empty Cell Empty Cell
Empty Cell Empty Cell Empty Cell Empty Cell Empty Cell Empty Cell Empty Cell
Empty Cell Empty Cell Empty Cell Empty Cell Empty Cell Empty Cell Empty Cell
Empty Cell Empty Cell Empty Cell Empty Cell Empty Cell Empty Cell Empty Cell
Empty Cell Empty Cell Empty Cell Empty Cell Empty Cell Empty Cell Empty Cell
2015-16 Budget Review 100 Total TerritoryFinancial Statements
Australian Capital TerritoryConsolidated Total Territory
Cash Flow Statement Empty Cell 2014-15 2015-16 2015-16 2016-17 2017-18 2018-19 Empty Cell Actual
OutcomeAnnualBudget
RevisedEstimate
RevisedEstimate
RevisedEstimate
RevisedEstimate
Empty Cell $’000 $’000 $’000 $’000 $’000 $’000Cash Payments Empty Cell Empty Cell Empty Cell Empty Cell Empty Cell Empty Cell
Issue of Loans - -62 -62 -62 -62 -62Total Cash Paid from Investments in
Financial Assets for Policy Purposes
0 -62 -62 -62 -62 -62
Net Cash Flows from Investments in Financial Assets for Policy Purposes
73 436 436 304 2,716 2,666
Empty Cell Empty Cell Empty Cell Empty Cell Empty Cell Empty Cell Empty Cell
Cash Flows from Investments in Financial Assets for Liquidity Purposes
Sales of Investments 403,022 983,123 972,794 827,603 715,990 722,842Payments for Investments -276,934 -924,602 -1,119,602 -753,141 -1,037,026 -895,151Cash Flows from Investments in
Financial Assets for Liquidity Purposes
126,088 58,521 -146,808 74,462 -321,036 -172,309
Net Cash Flows from Investing Activities
-615,229 -963,267 -1,088,394 -901,645 -945,345 -513,811
Empty Cell Empty Cell Empty Cell Empty Cell Empty Cell Empty Cell Empty Cell
Cash Flows from Financing Activities
Empty Cell Empty Cell Empty Cell Empty Cell Empty Cell Empty Cell
Cash Receipts Empty Cell Empty Cell Empty Cell Empty Cell Empty Cell Empty Cell
Borrowings 844,835 939,767 862,529 548,176 429,802 2,258Total Cash Received from Financing
Activities844,835 939,767 862,529 548,176 429,802 2,258
Empty Cell Empty Cell Empty Cell Empty Cell Empty Cell Empty Cell Empty Cell
Cash Payments Empty Cell Empty Cell Empty Cell Empty Cell Empty Cell Empty Cell
Borrowings -10,937 -8,839 -5,268 -12,113 -62,092 -227,956Total Cash Paid from Financing
Activities-10,937 -8,839 -5,268 -12,113 -62,092 -227,956
Net Cash Flows from Financing Activities
833,899 930,928 857,261 536,063 367,710 -225,698
Net Increase/(Decrease) in Cash Held
346,672 -62,226 -268,006 -6,511 -9,549 -6,621
Empty Cell Empty Cell Empty Cell Empty Cell Empty Cell Empty Cell Empty Cell
Cash and Cash Equivalents at the Beginning of Reporting Period
521,293 457,976 866,965 598,959 592,448 582,899
Cash and Cash Equivalents at the End of Reporting Period
866,965 395,750 598,959 592,448 582,899 576,278
Empty Cell Empty Cell Empty Cell Empty Cell Empty Cell Empty Cell Empty Cell
Empty Cell Empty Cell Empty Cell Empty Cell Empty Cell Empty Cell Empty Cell
Empty Cell Empty Cell Empty Cell Empty Cell Empty Cell Empty Cell Empty Cell
Empty Cell Empty Cell Empty Cell Empty Cell Empty Cell Empty Cell Empty Cell
Empty Cell Empty Cell Empty Cell Empty Cell Empty Cell Empty Cell Empty Cell
Empty Cell Empty Cell Empty Cell Empty Cell Empty Cell Empty Cell Empty Cell
Empty Cell Empty Cell Empty Cell Empty Cell Empty Cell Empty Cell Empty Cell
2015-16 Budget Review 101 Total TerritoryFinancial Statements
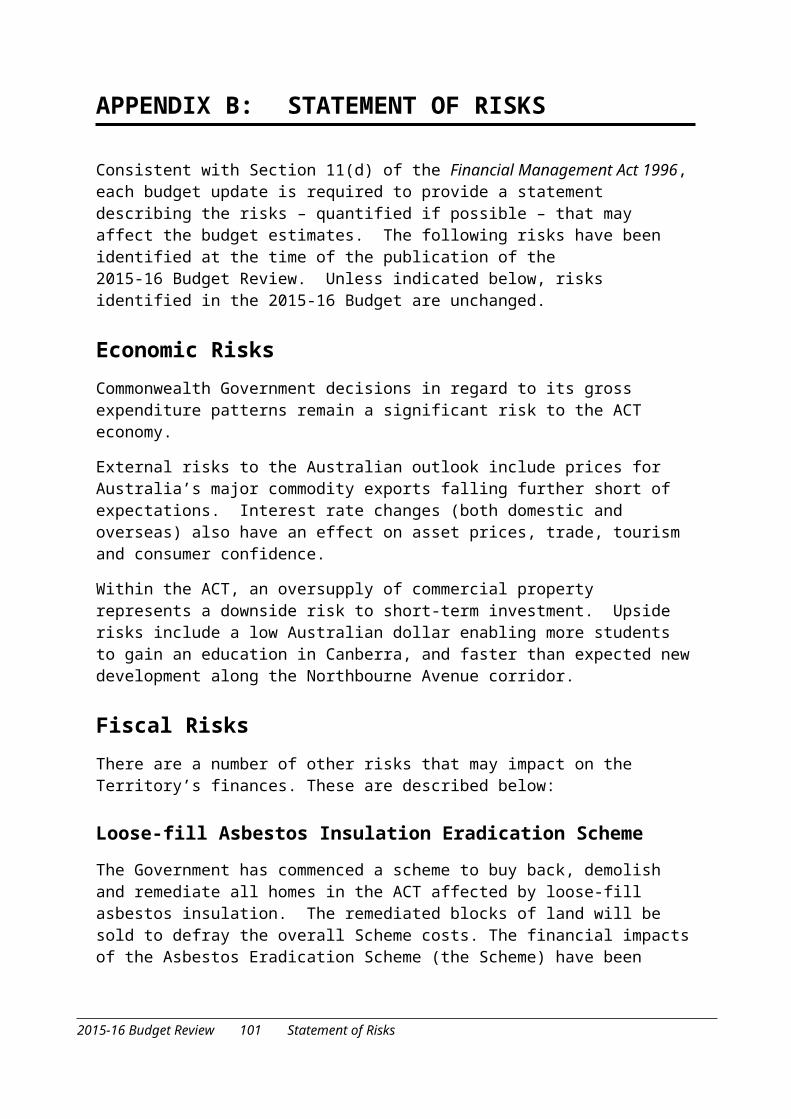
Australian Capital TerritoryConsolidated Total Territory
Cash Flow Statement Empty Cell 2014-15 2015-16 2015-16 2016-17 2017-18 2018-19 Empty Cell Actual
OutcomeAnnualBudget
RevisedEstimate
RevisedEstimate
RevisedEstimate
RevisedEstimate
Empty Cell $’000 $’000 $’000 $’000 $’000 $’000Key Fiscal Aggregates Empty Cell Empty Cell Empty Cell Empty Cell Empty Cell Empty Cell
Net Cash from Operating Activities 128,002 -29,887 -36,873 359,071 568,086 732,888Investments in Non-Financial Assets -741,390 -1,022,224 -942,022 -976,411 -627,025 -344,168Cash Surplus (+) / Deficit (-) -613,388 -1,052,111 -978,895 -617,340 -58,939 388,720Note that a positive number denotes a cash inflow, while a negative sign denotes a cash outflow.
Derivation of ABS GFS Cash Surplus/Deficit
Empty Cell Empty Cell Empty Cell Empty Cell Empty Cell Empty Cell
Cash Surplus (+) / Deficit (-) -613,388 -1,052,111 -978,895 -617,340 -58,939 388,720Acquisitions Under Finance Leases
and Similar Arrangements(a)- - - - - -
Empty Cell Empty Cell Empty Cell Empty Cell Empty Cell Empty Cell Empty Cell
ABS GFS Cash Surplus (+)/Deficit (-) Including Finance and Similar Arrangements
-613,388 -1,052,111 -978,895 -617,340 -58,939 388,720
Note: (a) Finance leases are shown with a negative sign as they are deducted in compiling the ABS GFS cash surplus/deficit.
2015-16 Budget Review 102 Total TerritoryFinancial Statements
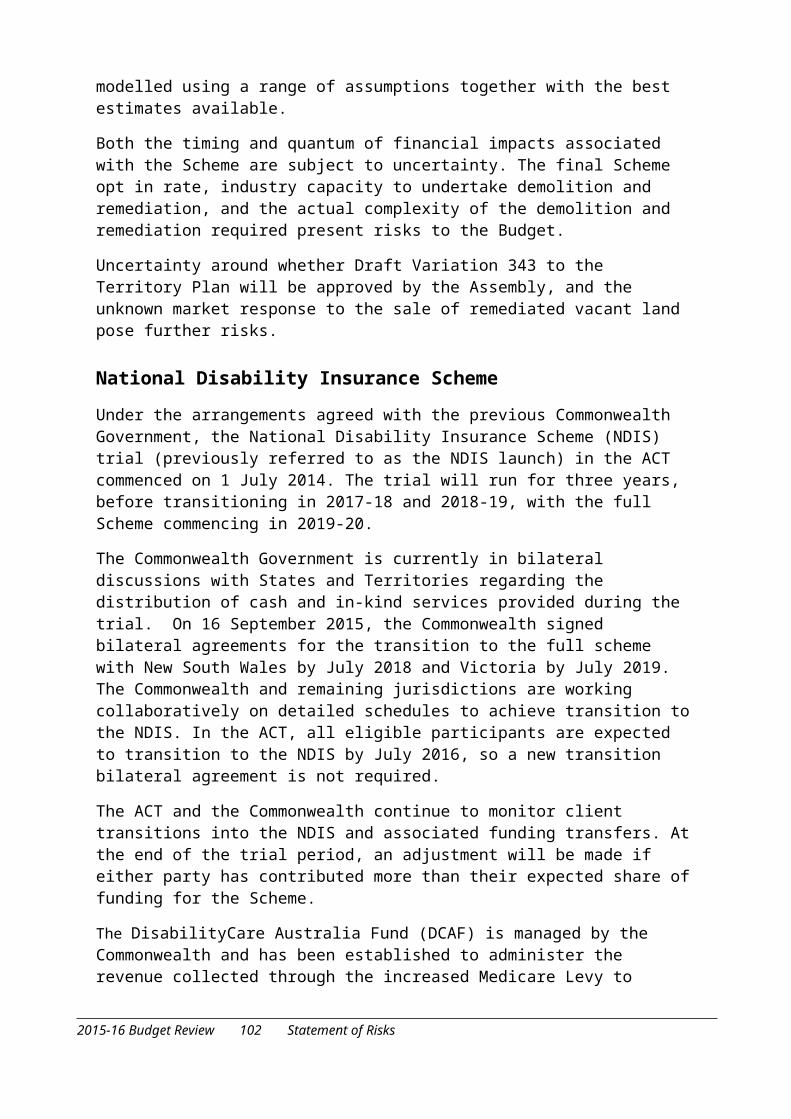
APPENDIX E
LOAN COUNCIL ALLOCATION AND NOMINATION
2015-16 Budget Review 103 Loan Council Allocation and Nomination
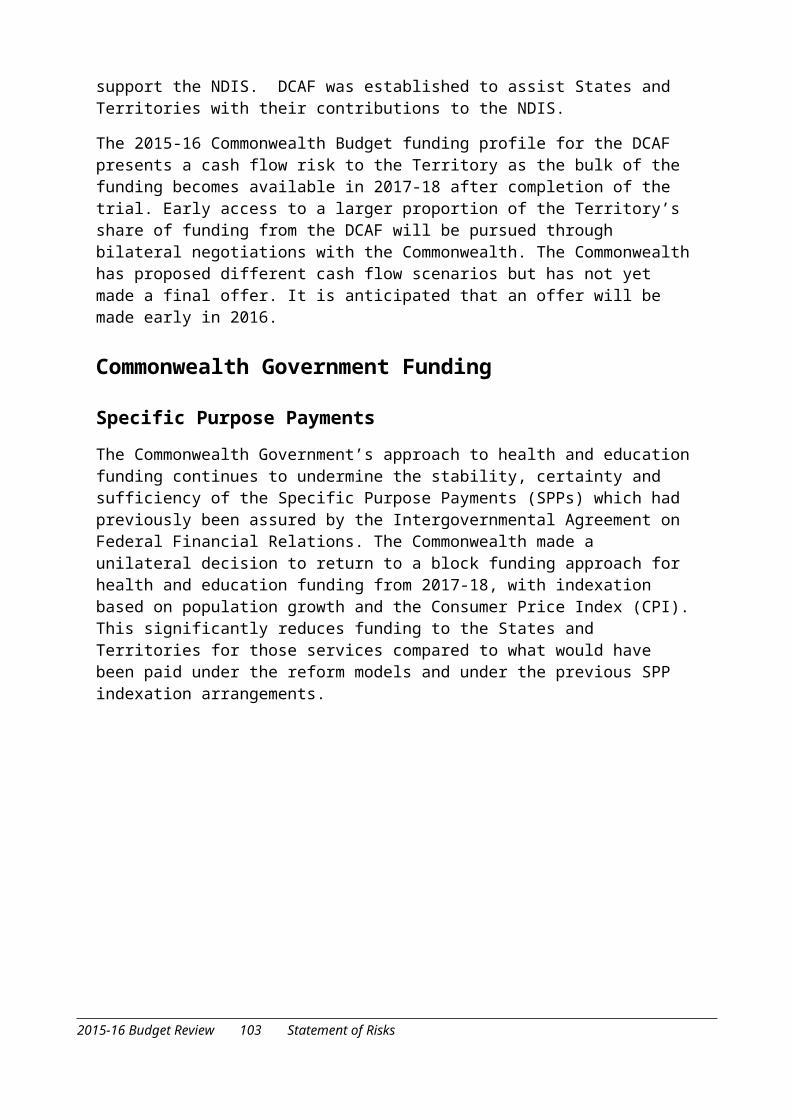
2015-16 Budget Review 104 Loan Council Allocation and Nomination
APPENDIX E: LOAN COUNCIL ALLOCATION AND NOMINATION
Each jurisdiction is required to estimate its Loan Council Allocation (LCA) for the forthcoming year to give an indication of the jurisdiction’s probable cash call on the financial markets over the year. The LCA nomination is calculated broadly as the reverse of the Total Territory cash surplus/deficit.
A positive allocation indicates a net borrowing position and cash being drawn from financial markets or investments.
A negative allocation indicates a net lending position and cash being contributed to the financial market or increase in investments.
Each jurisdiction must report against the nominated allocation.
Should the final outcome result be outside the tolerance limit (measured as +/- 2 per cent of total public sector receipts) then advice of this deviation needs to be provided to all jurisdictions.
The table below indicates the 2016-17 nomination and the revised 2015-16 estimate.
Empty Cell Empty Cell 2015-16 2015-16 2016-17
Empty Cell Empty Cell
BudgetEstimate
BudgetReview
LCANomination
Empty Cell Empty Cell EstimateEmpty Cell Empty Cell $mEmpty Cell Empty Cell Empty Cell Empty Cell Empty Cell
Empty Cell General Government Sector (GGS) Cash Deficit/(Surplus) (a) 973 881 567 Empty
CellPublic Non Financial Corporation (PNFC) Sector Cash
Deficit/(Surplus) (a)79 98 51
Empty Cell Non Financial Public Sector (NFPS) Sector Cash Deficit/(Surplus) (a) (b)
1,052 979 617
Empty Cell Acquisition under Finance Leases and Similar Arrangements (a)
0 0 0
equals Australian Bureau of Statistics (ABS) Government Finance Statistics (GFS) Cash Deficit/(Surplus) (a) (b)
1,052 979 617
less Net Cash Flows from Investments in Financial Assets for Policy Purposes (c)
0 0 0
Empty Cell Adjusted NFPS Sector Cash Deficit/(Surplus) 1,052 979 617Empty Cell Empty Cell Empty Cell Empty Cell Empty Cell
plus Memorandum Items (d) 13 13 -35Empty Cell Loan Council Allocation 1,065 992 582Empty Cell Empty Cell Empty Cell Empty Cell Empty Cell
Tolerance Limit (2 per cent of non-financial public sector cash receipts from operating activities)
+/- 104 +/- 104 +/- 111
2015-16 Budget Review 105 Loan Council Allocation and Nomination
Notes:(a) Cash surplus/deficits and finance leases are displayed with the opposite sign to that under which they
are reported in cash flow statements. That is, a surplus is displayed as a negative number and vice versa.
(b) May not directly equate to the sum of the GGS and PNFC sector cash surplus/deficit due to intersectoral transfers which are netted out, and/or rounding.
(c) Net cash flows from investments in financial assets for policy purposes are displayed with the same sign as which they are reported in cash flow statements.
(d) Memorandum items are used to adjust the ABS GFS cash surplus/deficit to include in LCA transactions – such as operating leases – that have many of the characteristics of public sector borrowings, but do not constitute formal borrowings. They are also used, where appropriate, to deduct from the ABS GFS cash surplus/deficit transactions that Loan Council has agreed should not be included in LCAs for example, the funding of more than employers’ emerging costs under public sector superannuation schemes, or borrowings by entities such as statutory marketing authorities.
Empty Cell
Memorandum items also include the net surplus/deficit of public universities in the jurisdiction controlled by the government. For the ACT, the University of Canberra has been included to reflect its financing requirement.
2015-16 Budget Review 106 Loan Council Allocation and Nomination