Embed Size (px)
Citation preview
1
Pollock Conservation Cooperative
and
High Seas Catchers’ Cooperative
Joint Annual Report 2015
North Pacific Fishery Management Council
April 1, 2016
2
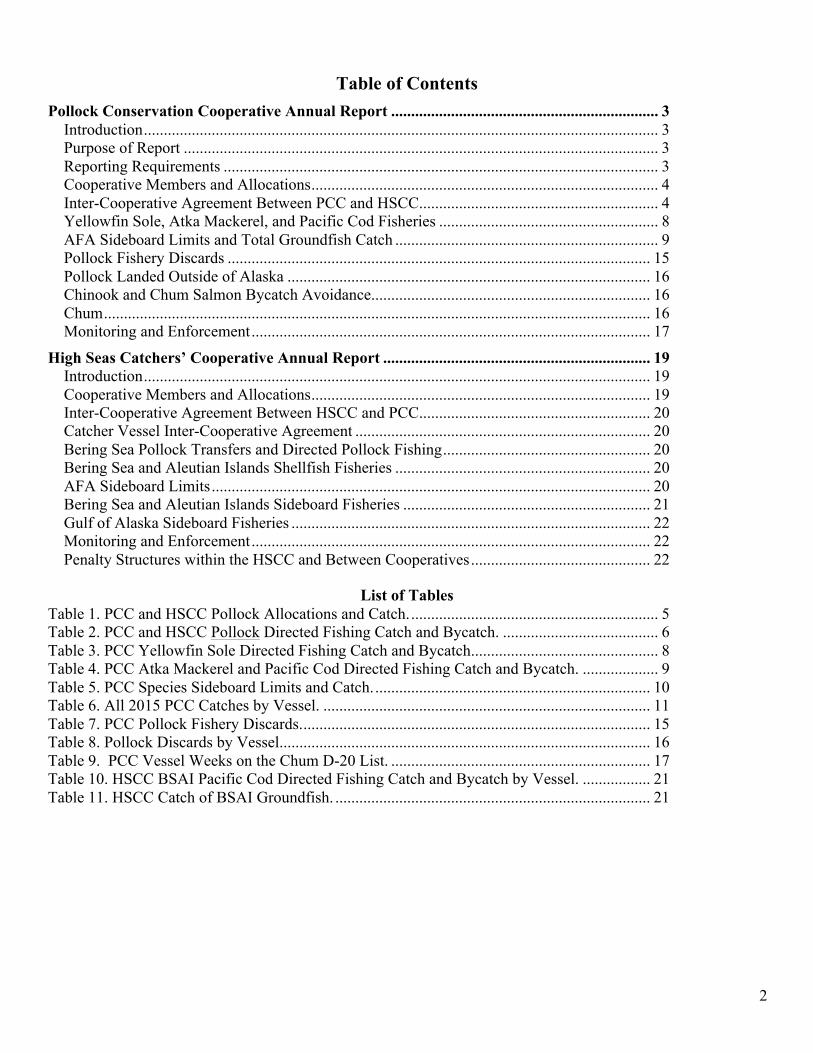
Table of Contents Pollock Conservation Cooperative Annual Report ................................................................... 3
Introduction ................................................................................................................................. 3 Purpose of Report ....................................................................................................................... 3 Reporting Requirements ............................................................................................................. 3 Cooperative Members and Allocations ....................................................................................... 4 Inter-Cooperative Agreement Between PCC and HSCC ............................................................ 4 Yellowfin Sole, Atka Mackerel, and Pacific Cod Fisheries ....................................................... 8 AFA Sideboard Limits and Total Groundfish Catch .................................................................. 9 Pollock Fishery Discards .......................................................................................................... 15 Pollock Landed Outside of Alaska ........................................................................................... 16 Chinook and Chum Salmon Bycatch Avoidance ...................................................................... 16 Chum ......................................................................................................................................... 16 Monitoring and Enforcement .................................................................................................... 17
High Seas Catchers’ Cooperative Annual Report ................................................................... 19 Introduction ............................................................................................................................... 19 Cooperative Members and Allocations ..................................................................................... 19 Inter-Cooperative Agreement Between HSCC and PCC .......................................................... 20 Catcher Vessel Inter-Cooperative Agreement .......................................................................... 20 Bering Sea Pollock Transfers and Directed Pollock Fishing .................................................... 20 Bering Sea and Aleutian Islands Shellfish Fisheries ................................................................ 20 AFA Sideboard Limits .............................................................................................................. 20 Bering Sea and Aleutian Islands Sideboard Fisheries .............................................................. 21 Gulf of Alaska Sideboard Fisheries .......................................................................................... 22 Monitoring and Enforcement .................................................................................................... 22 Penalty Structures within the HSCC and Between Cooperatives ............................................. 22
List of Tables
Table 1. PCC and HSCC Pollock Allocations and Catch. .............................................................. 5Table 2. PCC and HSCC Pollock Directed Fishing Catch and Bycatch. ....................................... 6Table 3. PCC Yellowfin Sole Directed Fishing Catch and Bycatch ............................................... 8Table 4. PCC Atka Mackerel and Pacific Cod Directed Fishing Catch and Bycatch. ................... 9Table 5. PCC Species Sideboard Limits and Catch. ..................................................................... 10Table 6. All 2015 PCC Catches by Vessel. .................................................................................. 11Table 7. PCC Pollock Fishery Discards. ....................................................................................... 15Table 8. Pollock Discards by Vessel ............................................................................................. 16Table 9. PCC Vessel Weeks on the Chum D-20 List. ................................................................. 17Table 10. HSCC BSAI Pacific Cod Directed Fishing Catch and Bycatch by Vessel. ................. 21Table 11. HSCC Catch of BSAI Groundfish. ............................................................................... 21
3
Pollock Conservation Cooperative Annual Report
Introduction
In 1998, the owners of the catcher-processors and catcher-vessels that deliver to catcher-processors in the Bering Sea and Aleutian Islands (BSAI) pollock fishery formed separate fishing cooperatives to coordinate pollock harvesting under the American Fisheries Act. The Pollock Conservation Cooperative (PCC) is the catcher-processor cooperative, and the High Seas Catchers’ Cooperative (HSCC) is the catcher-vessel cooperative. On January 21, 1999, the PCC and HSCC completed an inter-cooperative agreement to facilitate efficient management and accurate accounting between the two cooperatives. The agreement, “Cooperative Agreement Between Offshore Pollock Catchers’ Cooperative and Pollock Conservation Cooperative” remains in force, has not been changed, and is available upon request from the NPFMC.
Purpose of Report
This report is intended to disclose all information required or identified in the American Fisheries Act (AFA), per the North Pacific Fishery Management Council (NPFMC) October 1999 recommendation to the U.S. Secretary of Commerce, and in further guidance provided by the NPFMC in letters dated October 21, 1999 and November 1, 1999. The tables and figures in this report are largely self-explanatory, although some notes have been included to provide detail. The catch data in this report was provided by SeaState, Inc., and was obtained from the National Marine Fisheries Service (NMFS) North Pacific Groundfish Observer Program.1
Reporting Requirements
Fishing cooperatives formed under the AFA are subject to certain annual reporting requirements. Section 210(a)(1)(B) of the AFA requires the North Pacific Fisheries Management Council and the US Secretary of Commerce to “make available to the public in such a manner as the North Pacific Council and Secretary deem appropriate, catch information for all species (including bycatch) in the directed pollock fishery on a vessel-by-vessel basis.” In doing so, however, the NPFMC and Secretary must take into account “the interest of the parties to [a fishing cooperative] in protecting the confidentiality of proprietary information.” In October 1999, the NPFMC took action to implement section 210(a)(1)(B) of the AFA by requiring that cooperatives annually prepare a report containing: (1) the allocation of pollock and sideboard species to a cooperative; (2) any sub-allocations of pollock and sideboard species on a vessel-by-vessel basis; (3) retained and discarded catch on an area-by-area and vessel-by-vessel basis; (4) the methods used to monitor fisheries in which cooperative vessels participated; (5) any actions taken by cooperatives to enforce vessel or aggregate catches that exceed allowed catch and bycatch in the pollock and sideboard fisheries; (6) the total weight of pollock landed outside the State of Alaska on a vessel-by-vessel basis; (7) the number of salmon taken by species and season; and (8) the number of times each vessel appears on the weekly ‘dirty 20’ lists for non-Chinook salmon.
1The NMFS catch database for the 2015 fishing year is still subject to revision as catch data and other information from the fishery is finalized. To the extent that information in this report is based on NMFS data, it is still subject to revision. At this point, however, neither the PCC nor the HSCC are aware of any data discrepancies that would materially alter the substantive elements of this report.
4
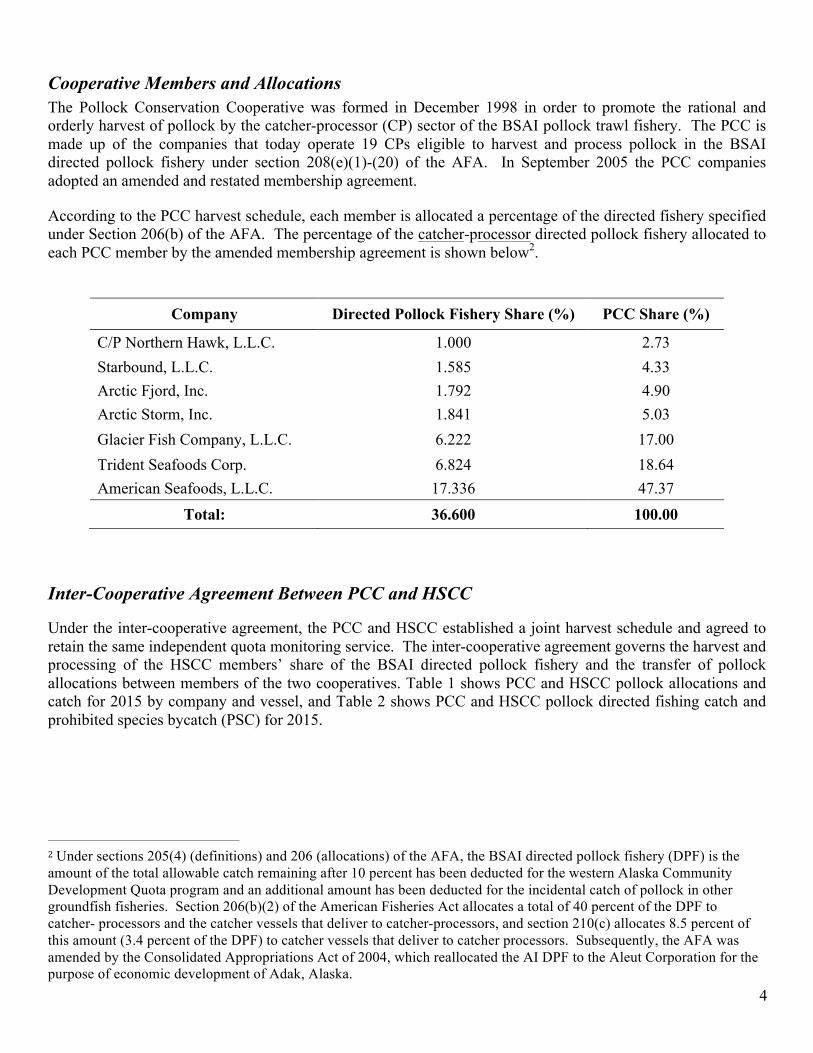
Cooperative Members and Allocations The Pollock Conservation Cooperative was formed in December 1998 in order to promote the rational and orderly harvest of pollock by the catcher-processor (CP) sector of the BSAI pollock trawl fishery. The PCC is made up of the companies that today operate 19 CPs eligible to harvest and process pollock in the BSAI directed pollock fishery under section 208(e)(1)-(20) of the AFA. In September 2005 the PCC companies adopted an amended and restated membership agreement. According to the PCC harvest schedule, each member is allocated a percentage of the directed fishery specified under Section 206(b) of the AFA. The percentage of the catcher-processor directed pollock fishery allocated to each PCC member by the amended membership agreement is shown below2.
Company Directed Pollock Fishery Share (%) PCC Share (%)
C/P Northern Hawk, L.L.C. 1.000 2.73 Starbound, L.L.C. 1.585 4.33 Arctic Fjord, Inc. 1.792 4.90 Arctic Storm, Inc. 1.841 5.03 Glacier Fish Company, L.L.C. 6.222 17.00 Trident Seafoods Corp. 6.824 18.64 American Seafoods, L.L.C. 17.336 47.37
Total: 36.600 100.00
Inter-Cooperative Agreement Between PCC and HSCC
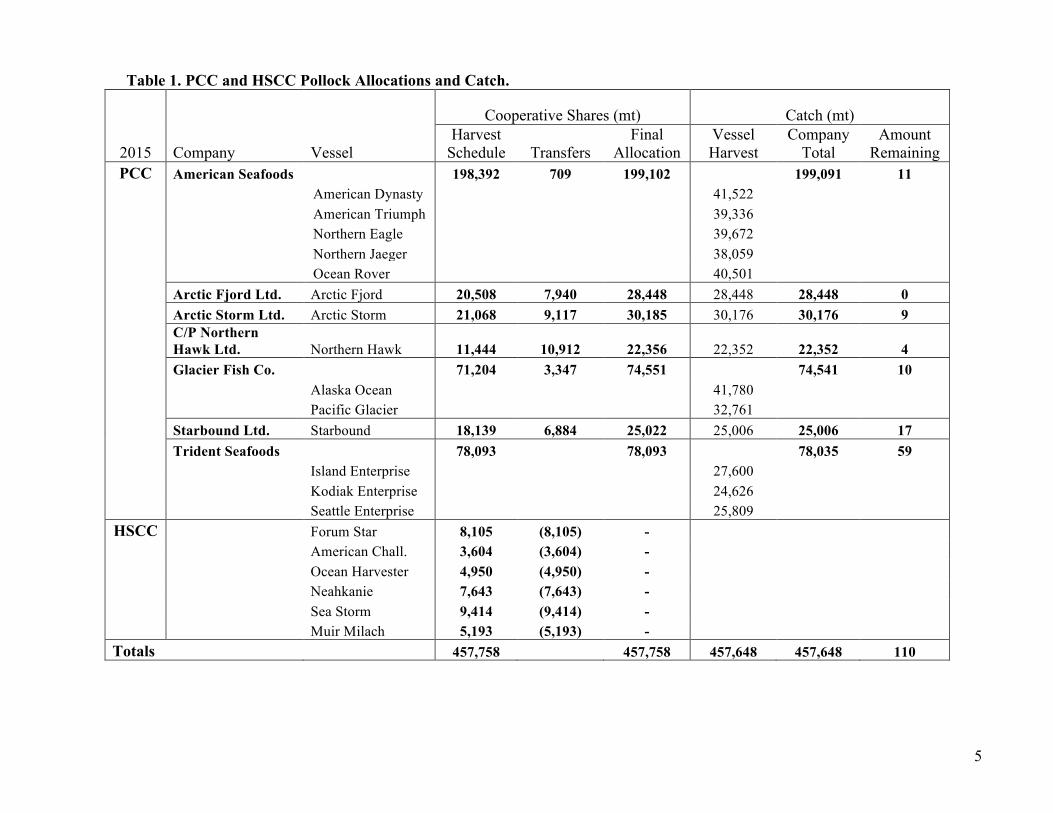
Under the inter-cooperative agreement, the PCC and HSCC established a joint harvest schedule and agreed to retain the same independent quota monitoring service. The inter-cooperative agreement governs the harvest and processing of the HSCC members’ share of the BSAI directed pollock fishery and the transfer of pollock allocations between members of the two cooperatives. Table 1 shows PCC and HSCC pollock allocations and catch for 2015 by company and vessel, and Table 2 shows PCC and HSCC pollock directed fishing catch and prohibited species bycatch (PSC) for 2015.
2Under sections 205(4) (definitions) and 206 (allocations) of the AFA, the BSAI directed pollock fishery (DPF) is the amount of the total allowable catch remaining after 10 percent has been deducted for the western Alaska Community Development Quota program and an additional amount has been deducted for the incidental catch of pollock in other groundfish fisheries. Section 206(b)(2) of the American Fisheries Act allocates a total of 40 percent of the DPF to catcher- processors and the catcher vessels that deliver to catcher-processors, and section 210(c) allocates 8.5 percent of this amount (3.4 percent of the DPF) to catcher vessels that deliver to catcher processors. Subsequently, the AFA was amended by the Consolidated Appropriations Act of 2004, which reallocated the AI DPF to the Aleut Corporation for the purpose of economic development of Adak, Alaska.
5
Table 1. PCC and HSCC Pollock Allocations and Catch.
2015 Company Vessel
Cooperative Shares (mt) Catch (mt) Harvest
Schedule Transfers Final
Allocation Vessel Harvest
Company Total
Amount Remaining
PCC American Seafoods 198,392 709 199,102 199,091 11 American Dynasty 41,522 American Triumph 39,336 Northern Eagle 39,672 Northern Jaeger 38,059 Ocean Rover 40,501
Arctic Fjord Ltd. Arctic Fjord 20,508 7,940 28,448 28,448 28,448 0 Arctic Storm Ltd. Arctic Storm 21,068 9,117 30,185 30,176 30,176 9 C/P Northern Hawk Ltd. Northern Hawk 11,444 10,912 22,356 22,352 22,352 4 Glacier Fish Co. 71,204 3,347 74,551 74,541 10
Alaska Ocean 41,780 Pacific Glacier 32,761
Starbound Ltd. Starbound 18,139 6,884 25,022 25,006 25,006 17 Trident Seafoods 78,093 78,093 78,035 59
Island Enterprise 27,600 Kodiak Enterprise 24,626 Seattle Enterprise 25,809
HSCC Forum Star 8,105 (8,105) - American Chall. 3,604 (3,604) - Ocean Harvester 4,950 (4,950) - Neahkanie 7,643 (7,643) - Sea Storm 9,414 (9,414) - Muir Milach 5,193 (5,193) -
Totals 457,758 457,758 457,648 457,648 110
6
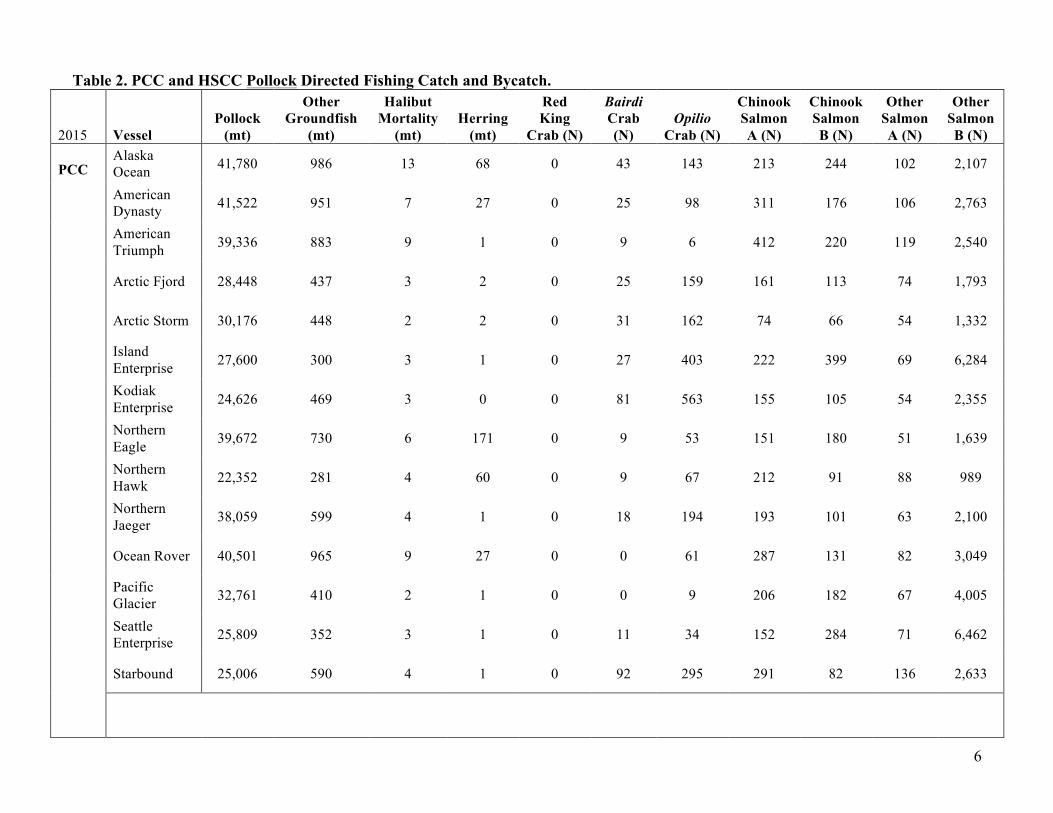
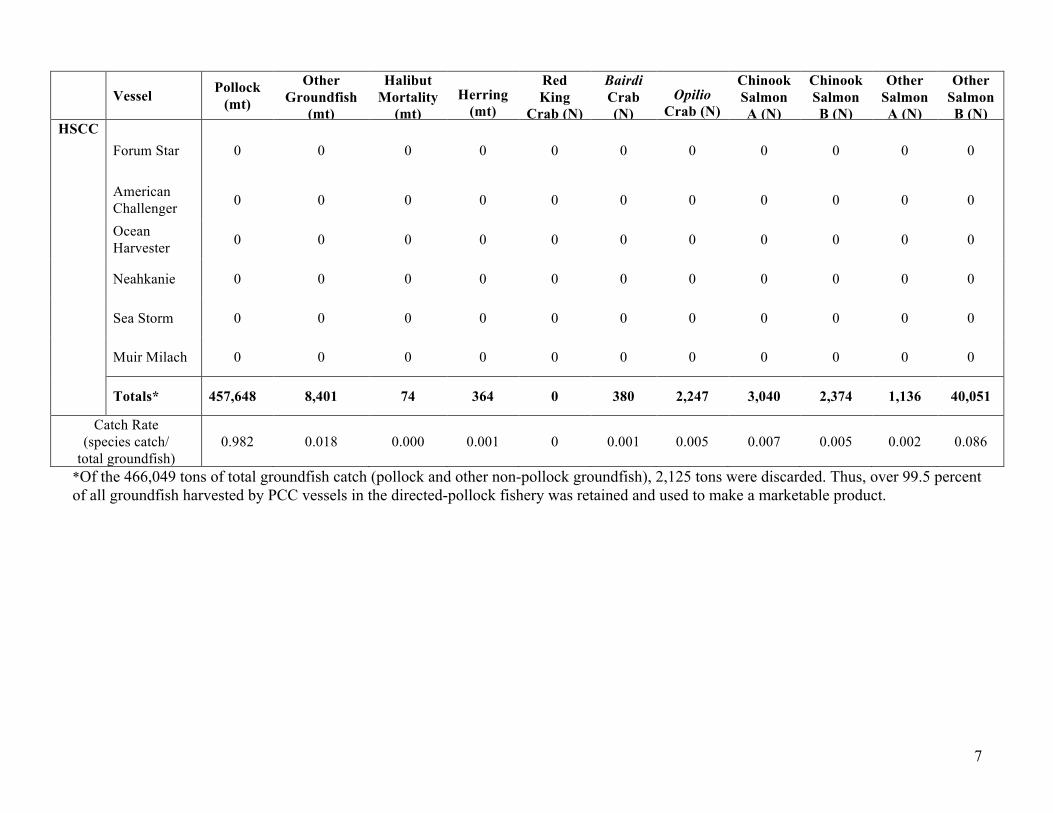
Table 2. PCC and HSCC Pollock Directed Fishing Catch and Bycatch.
2015 Vessel Pollock
(mt)
Other Groundfish
(mt)
Halibut Mortality
(mt) Herring
(mt)
Red King
Crab (N)
Bairdi Crab (N)
Opilio Crab (N)
Chinook Salmon A (N)
Chinook Salmon B (N)
Other Salmon A (N)
Other Salmon B (N)
PCC Alaska Ocean 41,780 986 13 68 0 43 143 213 244 102 2,107
American Dynasty 41,522 951 7 27 0 25 98 311 176 106 2,763
American Triumph 39,336 883 9 1 0 9 6 412 220 119 2,540
Arctic Fjord 28,448 437 3 2 0 25 159 161 113 74 1,793
Arctic Storm 30,176 448 2 2 0 31 162 74 66 54 1,332
Island Enterprise 27,600 300 3 1 0 27 403 222 399 69 6,284
Kodiak Enterprise 24,626 469 3 0 0 81 563 155 105 54 2,355
Northern Eagle 39,672 730 6 171 0 9 53 151 180 51 1,639
Northern Hawk 22,352 281 4 60 0 9 67 212 91 88 989
Northern Jaeger 38,059 599 4 1 0 18 194 193 101 63 2,100
Ocean Rover 40,501 965 9 27 0 0 61 287 131 82 3,049
Pacific Glacier 32,761 410 2 1 0 0 9 206 182 67 4,005
Seattle Enterprise 25,809 352 3 1 0 11 34 152 284 71 6,462
Starbound 25,006 590 4 1 0 92 295 291 82 136 2,633
7
Vessel Pollock (mt)
Other Groundfish
(mt)
Halibut Mortality
(mt) Herring
(mt)
Red King
Crab (N)
Bairdi Crab (N)
Opilio Crab (N)
Chinook Salmon A (N)
Chinook Salmon B (N)
Other Salmon A (N)
Other Salmon B (N)
HSCC Forum Star 0 0 0 0 0 0 0 0 0 0 0
American Challenger 0 0 0 0 0 0 0 0 0 0 0
Ocean Harvester 0 0 0 0 0 0 0 0 0 0 0
Neahkanie 0 0 0 0 0 0 0 0 0 0 0
Sea Storm 0 0 0 0 0 0 0 0 0 0 0
Muir Milach 0 0 0 0 0 0 0 0 0 0 0
Totals* 457,648 8,401 74 364 0 380 2,247 3,040 2,374 1,136 40,051
Catch Rate (species catch/
total groundfish) 0.982 0.018 0.000 0.001 0 0.001 0.005 0.007 0.005 0.002 0.086
*Of the 466,049 tons of total groundfish catch (pollock and other non-pollock groundfish), 2,125 tons were discarded. Thus, over 99.5 percentof all groundfish harvested by PCC vessels in the directed-pollock fishery was retained and used to make a marketable product.
8
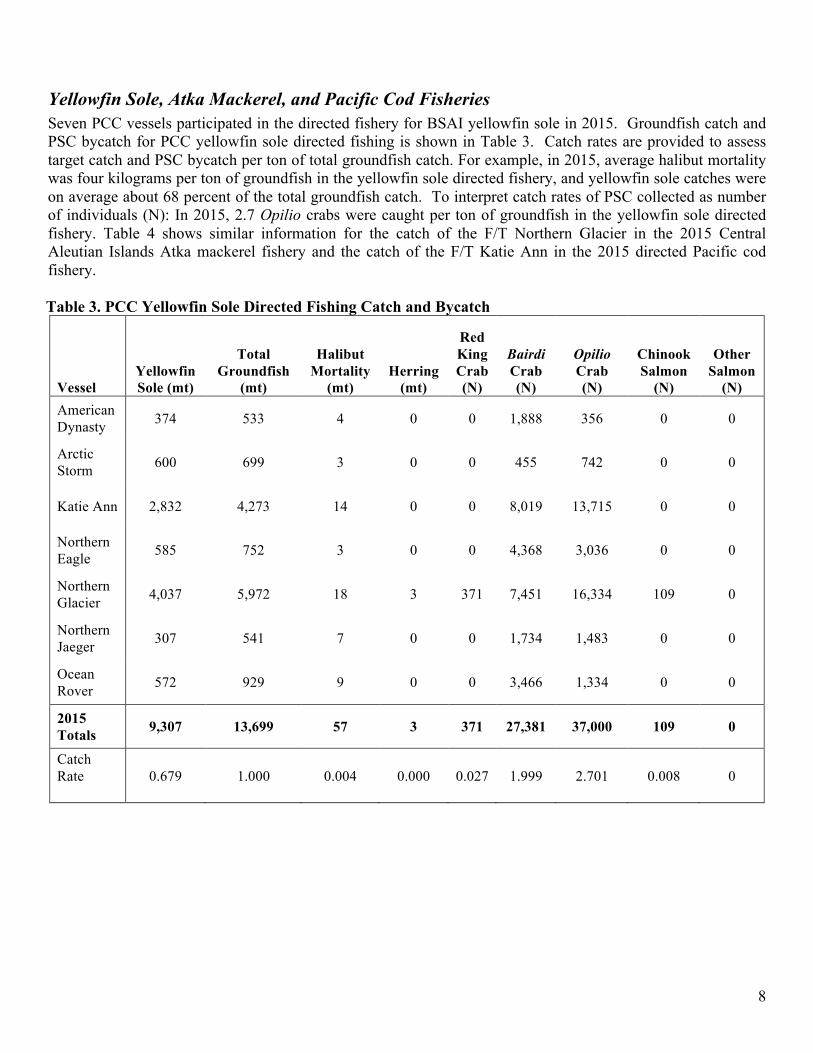
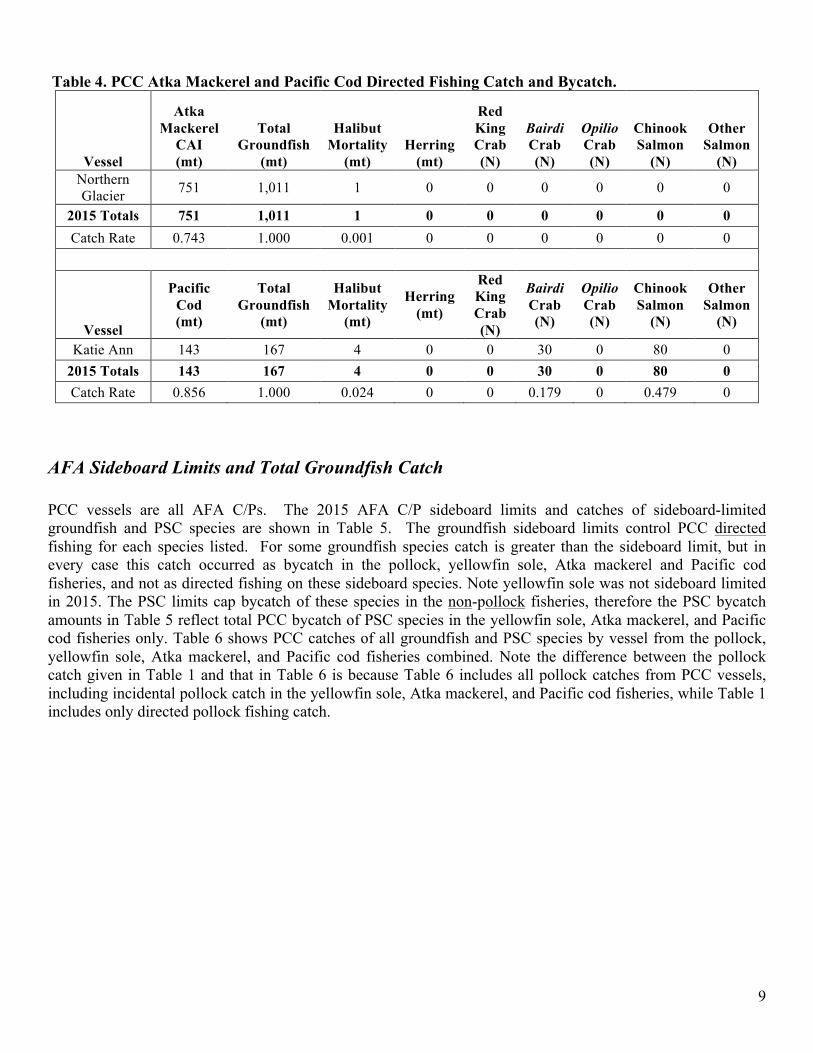
Yellowfin Sole, Atka Mackerel, and Pacific Cod Fisheries Seven PCC vessels participated in the directed fishery for BSAI yellowfin sole in 2015. Groundfish catch and PSC bycatch for PCC yellowfin sole directed fishing is shown in Table 3. Catch rates are provided to assess target catch and PSC bycatch per ton of total groundfish catch. For example, in 2015, average halibut mortality was four kilograms per ton of groundfish in the yellowfin sole directed fishery, and yellowfin sole catches were on average about 68 percent of the total groundfish catch. To interpret catch rates of PSC collected as number of individuals (N): In 2015, 2.7 Opilio crabs were caught per ton of groundfish in the yellowfin sole directed fishery. Table 4 shows similar information for the catch of the F/T Northern Glacier in the 2015 Central Aleutian Islands Atka mackerel fishery and the catch of the F/T Katie Ann in the 2015 directed Pacific cod fishery.
Table 3. PCC Yellowfin Sole Directed Fishing Catch and Bycatch
Vessel Yellowfin Sole (mt)
Total Groundfish
(mt)
Halibut Mortality
(mt) Herring
(mt)
Red King Crab (N)
Bairdi Crab (N)
Opilio Crab (N)
Chinook Salmon
(N)
Other Salmon
(N) American Dynasty 374 533 4 0 0 1,888 356 0 0
Arctic Storm 600 699 3 0 0 455 742 0 0
Katie Ann 2,832 4,273 14 0 0 8,019 13,715 0 0
Northern Eagle 585 752 3 0 0 4,368 3,036 0 0
Northern Glacier 4,037 5,972 18 3 371 7,451 16,334 109 0
Northern Jaeger 307 541 7 0 0 1,734 1,483 0 0
Ocean Rover 572 929 9 0 0 3,466 1,334 0 0
2015 Totals 9,307 13,699 57 3 371 27,381 37,000 109 0
Catch Rate 0.679 1.000 0.004 0.000 0.027 1.999 2.701 0.008 0
9
Table 4. PCC Atka Mackerel and Pacific Cod Directed Fishing Catch and Bycatch.
Vessel
Atka Mackerel
CAI (mt)
Total Groundfish
(mt)
Halibut Mortality
(mt) Herring
(mt)
Red King Crab (N)
Bairdi Crab (N)
Opilio Crab (N)
Chinook Salmon
(N)
Other Salmon
(N) Northern Glacier 751 1,011 1 0 0 0 0 0 0
2015 Totals 751 1,011 1 0 0 0 0 0 0 Catch Rate 0.743 1.000 0.001 0 0 0 0 0 0
Vessel
Pacific Cod (mt)
Total Groundfish
(mt)
Halibut Mortality
(mt)
Herring (mt)
Red King Crab (N)
Bairdi Crab (N)
Opilio Crab (N)
Chinook Salmon
(N)
Other Salmon
(N)
Katie Ann 143 167 4 0 0 30 0 80 0 2015 Totals 143 167 4 0 0 30 0 80 0 Catch Rate 0.856 1.000 0.024 0 0 0.179 0 0.479 0
AFA Sideboard Limits and Total Groundfish Catch
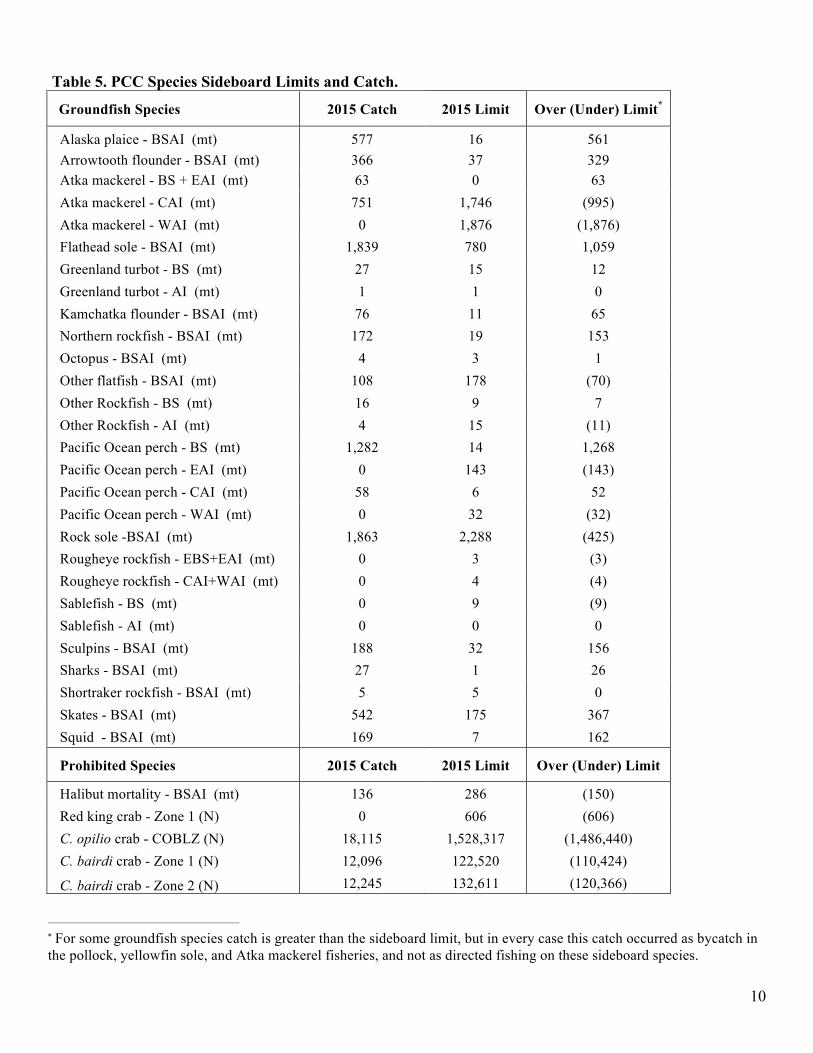
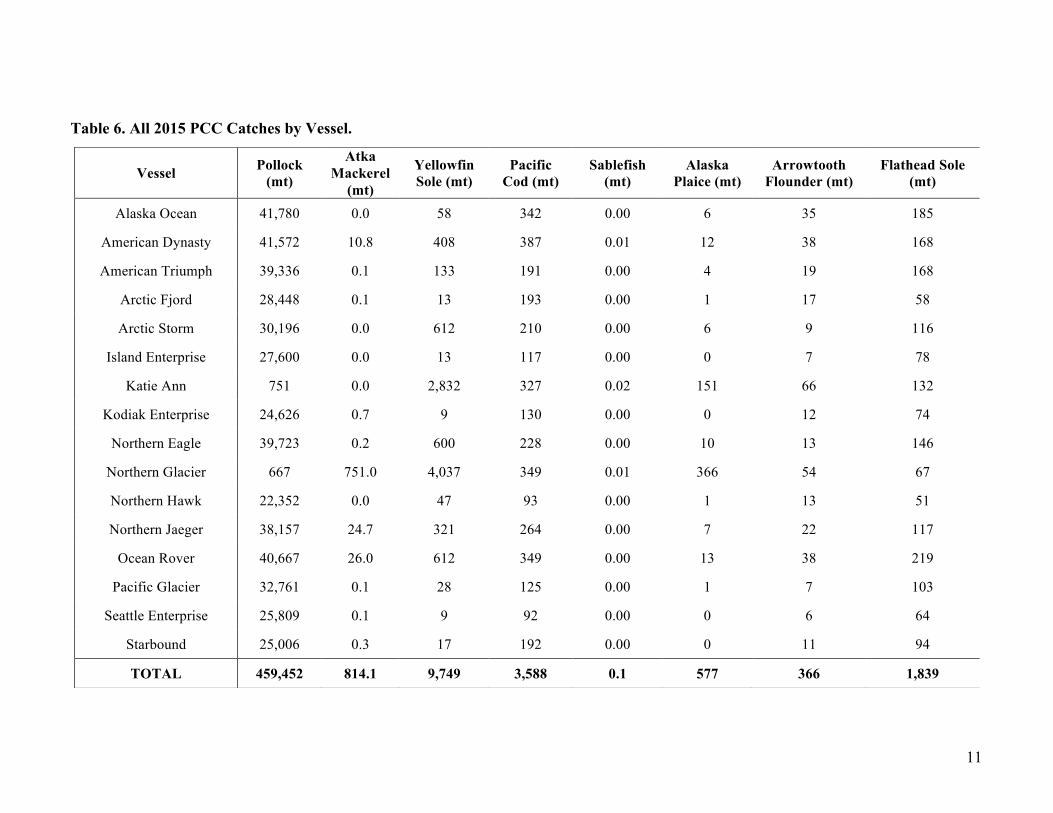
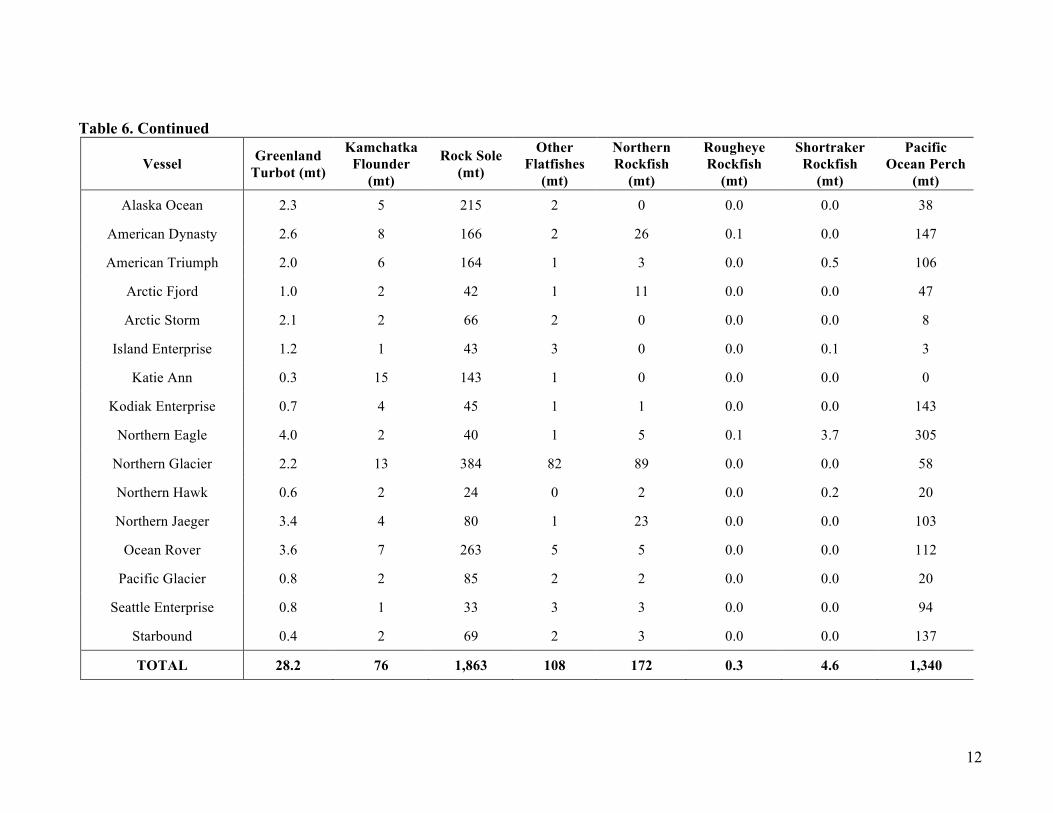
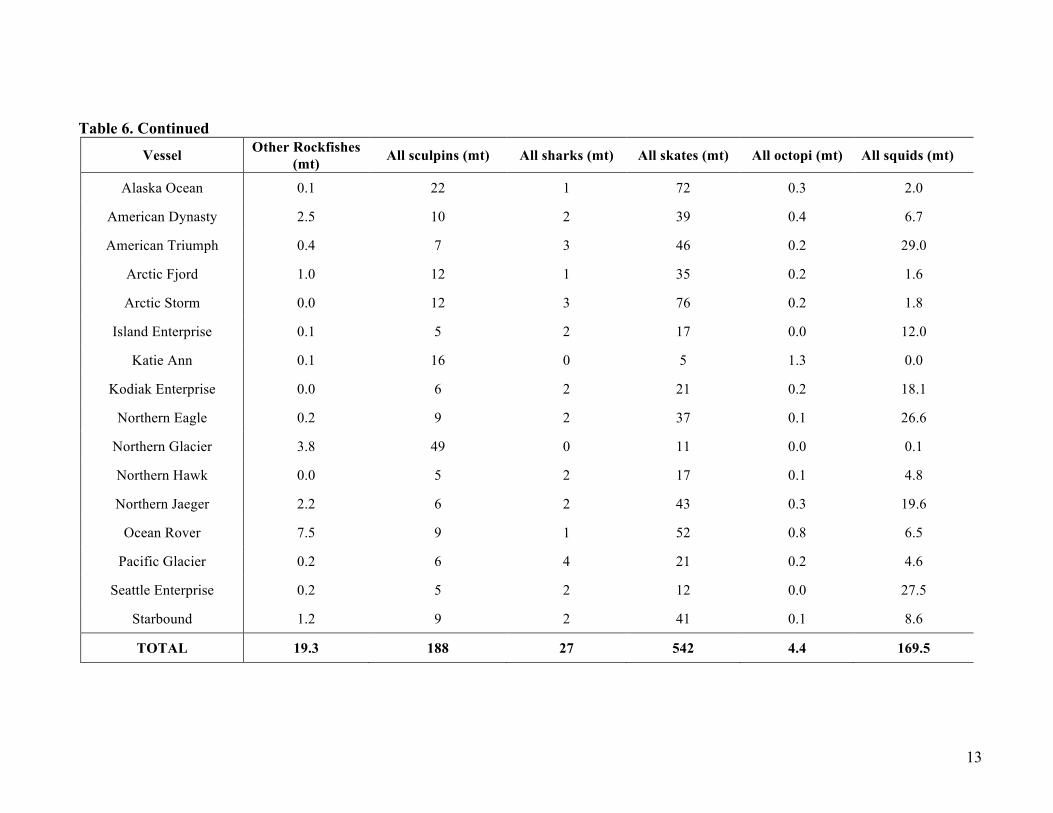
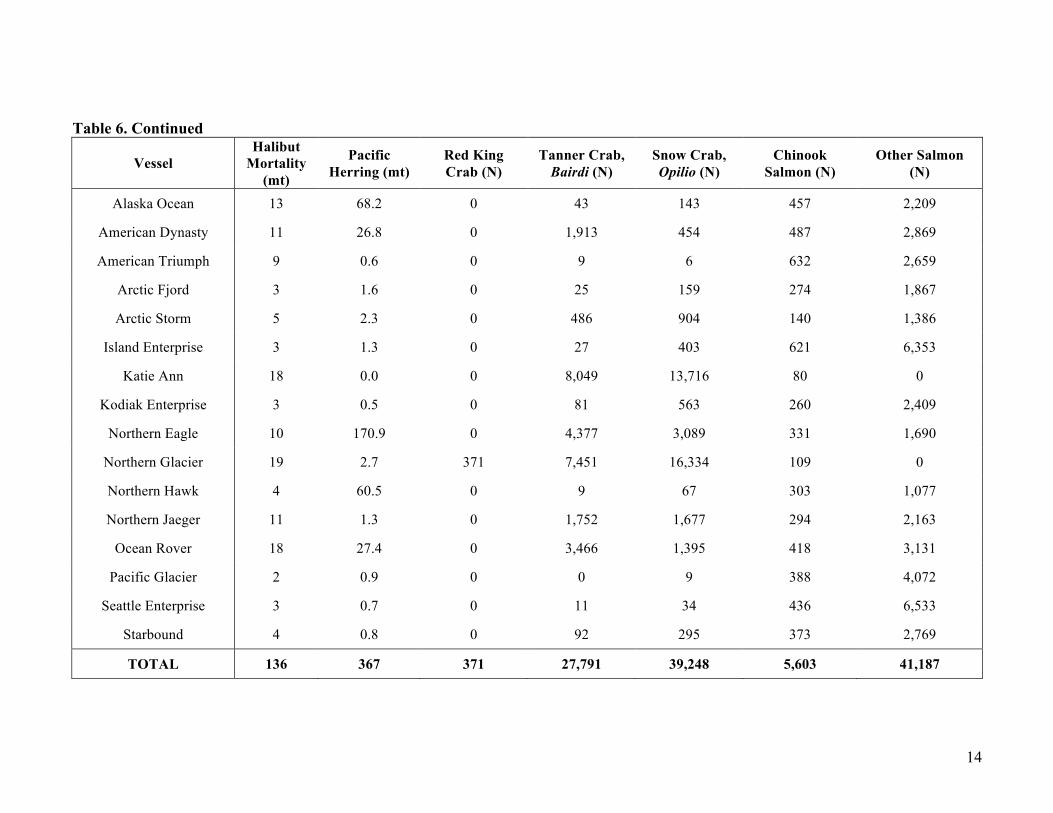
PCC vessels are all AFA C/Ps. The 2015 AFA C/P sideboard limits and catches of sideboard-limited groundfish and PSC species are shown in Table 5. The groundfish sideboard limits control PCC directed fishing for each species listed. For some groundfish species catch is greater than the sideboard limit, but in every case this catch occurred as bycatch in the pollock, yellowfin sole, Atka mackerel and Pacific cod fisheries, and not as directed fishing on these sideboard species. Note yellowfin sole was not sideboard limited in 2015. The PSC limits cap bycatch of these species in the non-pollock fisheries, therefore the PSC bycatch amounts in Table 5 reflect total PCC bycatch of PSC species in the yellowfin sole, Atka mackerel, and Pacific cod fisheries only. Table 6 shows PCC catches of all groundfish and PSC species by vessel from the pollock, yellowfin sole, Atka mackerel, and Pacific cod fisheries combined. Note the difference between the pollock catch given in Table 1 and that in Table 6 is because Table 6 includes all pollock catches from PCC vessels, including incidental pollock catch in the yellowfin sole, Atka mackerel, and Pacific cod fisheries, while Table 1 includes only directed pollock fishing catch.
10
Table 5. PCC Species Sideboard Limits and Catch.
Groundfish Species 2015 Catch 2015 Limit Over (Under) Limit*
Alaska plaice - BSAI (mt) 577 16 561 Arrowtooth flounder - BSAI (mt) 366 37 329 Atka mackerel - BS + EAI (mt) 63 0 63 Atka mackerel - CAI (mt) 751 1,746 (995) Atka mackerel - WAI (mt) 0 1,876 (1,876) Flathead sole - BSAI (mt) 1,839 780 1,059 Greenland turbot - BS (mt) 27 15 12 Greenland turbot - AI (mt) 1 1 0 Kamchatka flounder - BSAI (mt) 76 11 65 Northern rockfish - BSAI (mt) 172 19 153 Octopus - BSAI (mt) 4 3 1 Other flatfish - BSAI (mt) 108 178 (70) Other Rockfish - BS (mt) 16 9 7 Other Rockfish - AI (mt) 4 15 (11) Pacific Ocean perch - BS (mt) 1,282 14 1,268 Pacific Ocean perch - EAI (mt) 0 143 (143) Pacific Ocean perch - CAI (mt) 58 6 52 Pacific Ocean perch - WAI (mt) 0 32 (32) Rock sole -BSAI (mt) 1,863 2,288 (425) Rougheye rockfish - EBS+EAI (mt) 0 3 (3) Rougheye rockfish - CAI+WAI (mt) 0 4 (4) Sablefish - BS (mt) 0 9 (9) Sablefish - AI (mt) 0 0 0 Sculpins - BSAI (mt) 188 32 156 Sharks - BSAI (mt) 27 1 26 Shortraker rockfish - BSAI (mt) 5 5 0 Skates - BSAI (mt) 542 175 367 Squid - BSAI (mt) 169 7 162
Prohibited Species 2015 Catch 2015 Limit Over (Under) Limit
Halibut mortality - BSAI (mt) 136 286 (150) Red king crab - Zone 1 (N) 0 606 (606) C. opilio crab - COBLZ (N) 18,115 1,528,317 (1,486,440) C. bairdi crab - Zone 1 (N) 12,096 122,520 (110,424)
C. bairdi crab - Zone 2 (N) 12,245 132,611 (120,366)
* For some groundfish species catch is greater than the sideboard limit, but in every case this catch occurred as bycatch inthe pollock, yellowfin sole, and Atka mackerel fisheries, and not as directed fishing on these sideboard species.
11
Table 6. All 2015 PCC Catches by Vessel.
Vessel Pollock (mt)
Atka Mackerel
(mt)
Yellowfin Sole (mt)
Pacific Cod (mt)
Sablefish (mt)
Alaska Plaice (mt)
Arrowtooth Flounder (mt)
Flathead Sole (mt)
Alaska Ocean 41,780 0.0 58 342 0.00 6 35 185
American Dynasty 41,572 10.8 408 387 0.01 12 38 168
American Triumph 39,336 0.1 133 191 0.00 4 19 168
Arctic Fjord 28,448 0.1 13 193 0.00 1 17 58
Arctic Storm 30,196 0.0 612 210 0.00 6 9 116
Island Enterprise 27,600 0.0 13 117 0.00 0 7 78
Katie Ann 751 0.0 2,832 327 0.02 151 66 132
Kodiak Enterprise 24,626 0.7 9 130 0.00 0 12 74
Northern Eagle 39,723 0.2 600 228 0.00 10 13 146
Northern Glacier 667 751.0 4,037 349 0.01 366 54 67
Northern Hawk 22,352 0.0 47 93 0.00 1 13 51
Northern Jaeger 38,157 24.7 321 264 0.00 7 22 117
Ocean Rover 40,667 26.0 612 349 0.00 13 38 219
Pacific Glacier 32,761 0.1 28 125 0.00 1 7 103
Seattle Enterprise 25,809 0.1 9 92 0.00 0 6 64
Starbound 25,006 0.3 17 192 0.00 0 11 94
TOTAL 459,452 814.1 9,749 3,588 0.1 577 366 1,839
12
Table 6. Continued
Vessel Greenland Turbot (mt)
Kamchatka Flounder
(mt)
Rock Sole (mt)
Other Flatfishes
(mt)
Northern Rockfish
(mt)
Rougheye Rockfish
(mt)
Shortraker Rockfish
(mt)
Pacific Ocean Perch
(mt)
Alaska Ocean 2.3 5 215 2 0 0.0 0.0 38
American Dynasty 2.6 8 166 2 26 0.1 0.0 147
American Triumph 2.0 6 164 1 3 0.0 0.5 106
Arctic Fjord 1.0 2 42 1 11 0.0 0.0 47
Arctic Storm 2.1 2 66 2 0 0.0 0.0 8
Island Enterprise 1.2 1 43 3 0 0.0 0.1 3
Katie Ann 0.3 15 143 1 0 0.0 0.0 0
Kodiak Enterprise 0.7 4 45 1 1 0.0 0.0 143
Northern Eagle 4.0 2 40 1 5 0.1 3.7 305
Northern Glacier 2.2 13 384 82 89 0.0 0.0 58
Northern Hawk 0.6 2 24 0 2 0.0 0.2 20
Northern Jaeger 3.4 4 80 1 23 0.0 0.0 103
Ocean Rover 3.6 7 263 5 5 0.0 0.0 112
Pacific Glacier 0.8 2 85 2 2 0.0 0.0 20
Seattle Enterprise 0.8 1 33 3 3 0.0 0.0 94
Starbound 0.4 2 69 2 3 0.0 0.0 137
TOTAL 28.2 76 1,863 108 172 0.3 4.6 1,340
13
Table 6. Continued
Vessel Other Rockfishes (mt) All sculpins (mt) All sharks (mt) All skates (mt) All octopi (mt) All squids (mt)
Alaska Ocean 0.1 22 1 72 0.3 2.0
American Dynasty 2.5 10 2 39 0.4 6.7
American Triumph 0.4 7 3 46 0.2 29.0
Arctic Fjord 1.0 12 1 35 0.2 1.6
Arctic Storm 0.0 12 3 76 0.2 1.8
Island Enterprise 0.1 5 2 17 0.0 12.0
Katie Ann 0.1 16 0 5 1.3 0.0
Kodiak Enterprise 0.0 6 2 21 0.2 18.1
Northern Eagle 0.2 9 2 37 0.1 26.6
Northern Glacier 3.8 49 0 11 0.0 0.1
Northern Hawk 0.0 5 2 17 0.1 4.8
Northern Jaeger 2.2 6 2 43 0.3 19.6
Ocean Rover 7.5 9 1 52 0.8 6.5
Pacific Glacier 0.2 6 4 21 0.2 4.6
Seattle Enterprise 0.2 5 2 12 0.0 27.5
Starbound 1.2 9 2 41 0.1 8.6
TOTAL 19.3 188 27 542 4.4 169.5
14
Table 6. Continued
Vessel Halibut
Mortality (mt)
Pacific Herring (mt)
Red King Crab (N)
Tanner Crab, Bairdi (N)
Snow Crab, Opilio (N)
Chinook Salmon (N)
Other Salmon (N)
Alaska Ocean 13 68.2 0 43 143 457 2,209
American Dynasty 11 26.8 0 1,913 454 487 2,869
American Triumph 9 0.6 0 9 6 632 2,659
Arctic Fjord 3 1.6 0 25 159 274 1,867
Arctic Storm 5 2.3 0 486 904 140 1,386
Island Enterprise 3 1.3 0 27 403 621 6,353
Katie Ann 18 0.0 0 8,049 13,716 80 0
Kodiak Enterprise 3 0.5 0 81 563 260 2,409
Northern Eagle 10 170.9 0 4,377 3,089 331 1,690
Northern Glacier 19 2.7 371 7,451 16,334 109 0
Northern Hawk 4 60.5 0 9 67 303 1,077
Northern Jaeger 11 1.3 0 1,752 1,677 294 2,163
Ocean Rover 18 27.4 0 3,466 1,395 418 3,131
Pacific Glacier 2 0.9 0 0 9 388 4,072
Seattle Enterprise 3 0.7 0 11 34 436 6,533
Starbound 4 0.8 0 92 295 373 2,769
TOTAL 136 367 371 27,791 39,248 5,603 41,187
15
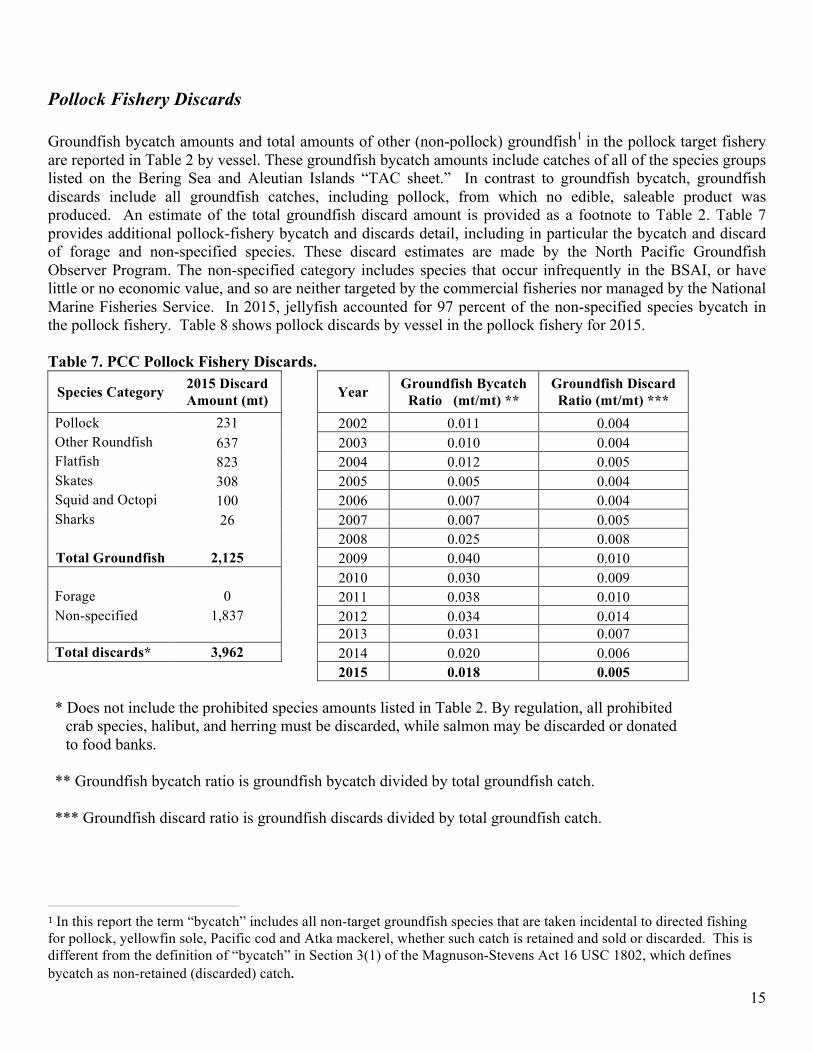
Pollock Fishery Discards Groundfish bycatch amounts and total amounts of other (non-pollock) groundfish1 in the pollock target fishery are reported in Table 2 by vessel. These groundfish bycatch amounts include catches of all of the species groups listed on the Bering Sea and Aleutian Islands “TAC sheet.” In contrast to groundfish bycatch, groundfish discards include all groundfish catches, including pollock, from which no edible, saleable product was produced. An estimate of the total groundfish discard amount is provided as a footnote to Table 2. Table 7 provides additional pollock-fishery bycatch and discards detail, including in particular the bycatch and discard of forage and non-specified species. These discard estimates are made by the North Pacific Groundfish Observer Program. The non-specified category includes species that occur infrequently in the BSAI, or have little or no economic value, and so are neither targeted by the commercial fisheries nor managed by the National Marine Fisheries Service. In 2015, jellyfish accounted for 97 percent of the non-specified species bycatch in the pollock fishery. Table 8 shows pollock discards by vessel in the pollock fishery for 2015. Table 7. PCC Pollock Fishery Discards.
Species Category 2015 Discard Amount (mt)
Year Groundfish Bycatch Ratio (mt/mt) **
Groundfish Discard Ratio (mt/mt) ***
Pollock 231 2002 0.011 0.004 Other Roundfish 637 2003 0.010 0.004 Flatfish 823 2004 0.012 0.005 Skates 308 2005 0.005 0.004 Squid and Octopi 100 2006 0.007 0.004 Sharks 26 2007 0.007 0.005
2008 0.025 0.008 Total Groundfish 2,125 2009 0.040 0.010
2010 0.030 0.009 Forage 0 2011 0.038 0.010 Non-specified 1,837 2012 0.034 0.014
2013 0.031 0.007 Total discards* 3,962 2014 0.020 0.006 2015 0.018 0.005 * Does not include the prohibited species amounts listed in Table 2. By regulation, all prohibited
crab species, halibut, and herring must be discarded, while salmon may be discarded or donated to food banks.
** Groundfish bycatch ratio is groundfish bycatch divided by total groundfish catch. *** Groundfish discard ratio is groundfish discards divided by total groundfish catch.
1In this report the term “bycatch” includes all non-target groundfish species that are taken incidental to directed fishing for pollock, yellowfin sole, Pacific cod and Atka mackerel, whether such catch is retained and sold or discarded. This is different from the definition of “bycatch” in Section 3(1) of the Magnuson-Stevens Act 16 USC 1802, which defines bycatch as non-retained (discarded) catch.
16
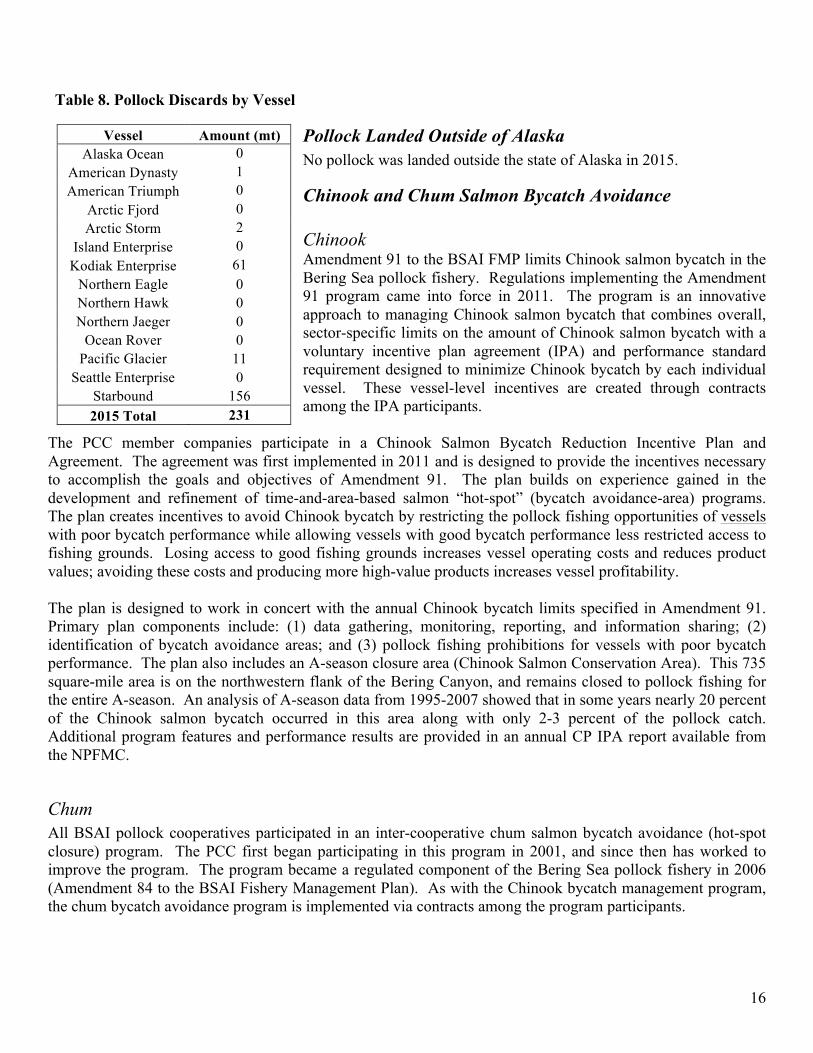
Table 8. Pollock Discards by Vessel
Pollock Landed Outside of Alaska No pollock was landed outside the state of Alaska in 2015.
Chinook and Chum Salmon Bycatch Avoidance Chinook Amendment 91 to the BSAI FMP limits Chinook salmon bycatch in the Bering Sea pollock fishery. Regulations implementing the Amendment 91 program came into force in 2011. The program is an innovative approach to managing Chinook salmon bycatch that combines overall, sector-specific limits on the amount of Chinook salmon bycatch with a voluntary incentive plan agreement (IPA) and performance standard requirement designed to minimize Chinook bycatch by each individual vessel. These vessel-level incentives are created through contracts among the IPA participants.
The PCC member companies participate in a Chinook Salmon Bycatch Reduction Incentive Plan and Agreement. The agreement was first implemented in 2011 and is designed to provide the incentives necessary to accomplish the goals and objectives of Amendment 91. The plan builds on experience gained in the development and refinement of time-and-area-based salmon “hot-spot” (bycatch avoidance-area) programs. The plan creates incentives to avoid Chinook bycatch by restricting the pollock fishing opportunities of vessels with poor bycatch performance while allowing vessels with good bycatch performance less restricted access to fishing grounds. Losing access to good fishing grounds increases vessel operating costs and reduces product values; avoiding these costs and producing more high-value products increases vessel profitability. The plan is designed to work in concert with the annual Chinook bycatch limits specified in Amendment 91. Primary plan components include: (1) data gathering, monitoring, reporting, and information sharing; (2) identification of bycatch avoidance areas; and (3) pollock fishing prohibitions for vessels with poor bycatch performance. The plan also includes an A-season closure area (Chinook Salmon Conservation Area). This 735 square-mile area is on the northwestern flank of the Bering Canyon, and remains closed to pollock fishing for the entire A-season. An analysis of A-season data from 1995-2007 showed that in some years nearly 20 percent of the Chinook salmon bycatch occurred in this area along with only 2-3 percent of the pollock catch. Additional program features and performance results are provided in an annual CP IPA report available from the NPFMC.
Chum All BSAI pollock cooperatives participated in an inter-cooperative chum salmon bycatch avoidance (hot-spot closure) program. The PCC first began participating in this program in 2001, and since then has worked to improve the program. The program became a regulated component of the Bering Sea pollock fishery in 2006 (Amendment 84 to the BSAI Fishery Management Plan). As with the Chinook bycatch management program, the chum bycatch avoidance program is implemented via contracts among the program participants.
Vessel Amount (mt) Alaska Ocean 0
American Dynasty 1 American Triumph 0
Arctic Fjord 0 Arctic Storm 2
Island Enterprise 0 Kodiak Enterprise 61
Northern Eagle 0 Northern Hawk 0 Northern Jaeger 0
Ocean Rover 0 Pacific Glacier 11
Seattle Enterprise 0 Starbound 156 2015 Total 231
17
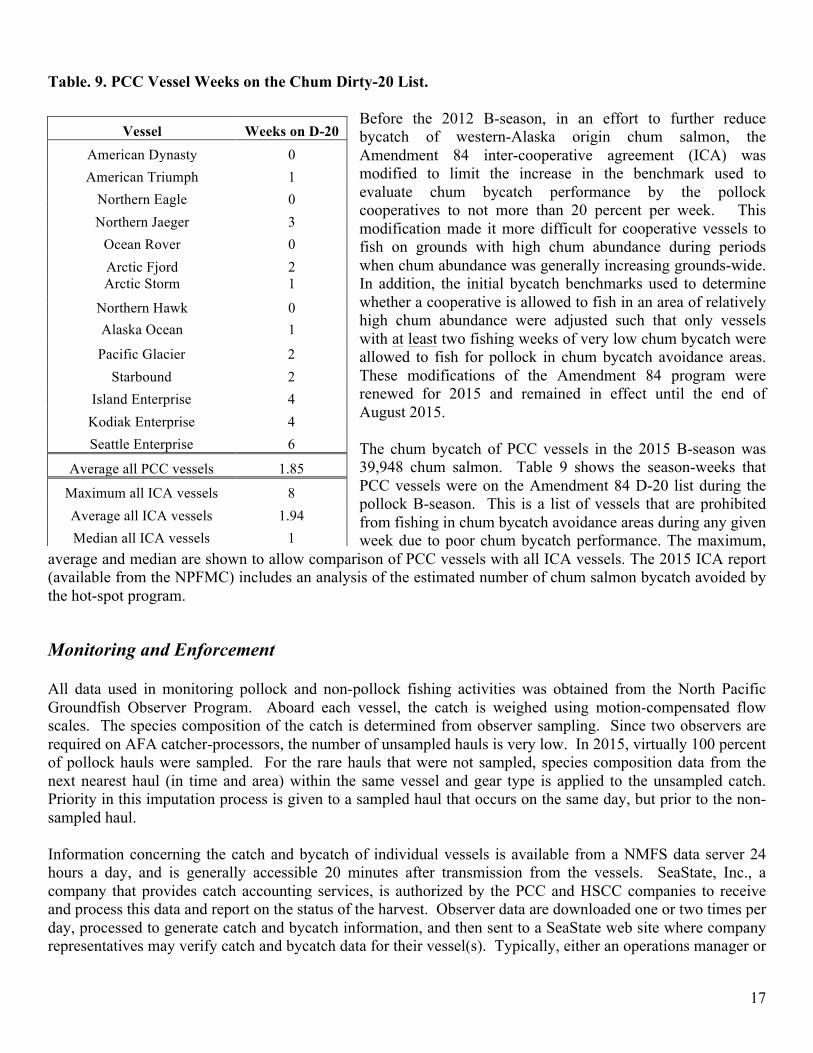
Table. 9. PCC Vessel Weeks on the Chum Dirty-20 List.
Before the 2012 B-season, in an effort to further reduce bycatch of western-Alaska origin chum salmon, the Amendment 84 inter-cooperative agreement (ICA) was modified to limit the increase in the benchmark used to evaluate chum bycatch performance by the pollock cooperatives to not more than 20 percent per week. This modification made it more difficult for cooperative vessels to fish on grounds with high chum abundance during periods when chum abundance was generally increasing grounds-wide. In addition, the initial bycatch benchmarks used to determine whether a cooperative is allowed to fish in an area of relatively high chum abundance were adjusted such that only vessels with at least two fishing weeks of very low chum bycatch were allowed to fish for pollock in chum bycatch avoidance areas. These modifications of the Amendment 84 program were renewed for 2015 and remained in effect until the end of August 2015. The chum bycatch of PCC vessels in the 2015 B-season was 39,948 chum salmon. Table 9 shows the season-weeks that PCC vessels were on the Amendment 84 D-20 list during the pollock B-season. This is a list of vessels that are prohibited from fishing in chum bycatch avoidance areas during any given week due to poor chum bycatch performance. The maximum,
average and median are shown to allow comparison of PCC vessels with all ICA vessels. The 2015 ICA report (available from the NPFMC) includes an analysis of the estimated number of chum salmon bycatch avoided by the hot-spot program.
Monitoring and Enforcement All data used in monitoring pollock and non-pollock fishing activities was obtained from the North Pacific Groundfish Observer Program. Aboard each vessel, the catch is weighed using motion-compensated flow scales. The species composition of the catch is determined from observer sampling. Since two observers are required on AFA catcher-processors, the number of unsampled hauls is very low. In 2015, virtually 100 percent of pollock hauls were sampled. For the rare hauls that were not sampled, species composition data from the next nearest haul (in time and area) within the same vessel and gear type is applied to the unsampled catch. Priority in this imputation process is given to a sampled haul that occurs on the same day, but prior to the non-sampled haul. Information concerning the catch and bycatch of individual vessels is available from a NMFS data server 24 hours a day, and is generally accessible 20 minutes after transmission from the vessels. SeaState, Inc., a company that provides catch accounting services, is authorized by the PCC and HSCC companies to receive and process this data and report on the status of the harvest. Observer data are downloaded one or two times per day, processed to generate catch and bycatch information, and then sent to a SeaState web site where company representatives may verify catch and bycatch data for their vessel(s). Typically, either an operations manager or
Vessel Weeks on D-20 American Dynasty 0 American Triumph 1
Northern Eagle 0 Northern Jaeger 3
Ocean Rover 0 Arctic Fjord 2 Arctic Storm 1
Northern Hawk 0 Alaska Ocean 1
Pacific Glacier 2 Starbound 2
Island Enterprise 4 Kodiak Enterprise 4 Seattle Enterprise 6
Average all PCC vessels 1.85
Maximum all ICA vessels 8 Average all ICA vessels 1.94 Median all ICA vessels 1
18
vessel operator checks into the site each day to make sure recorded harvest amounts for his vessel(s) are consistent with vessel tallies.
Companies with several vessels often set initial vessel allocations, and then manage vessel harvests independently until late in the season. Typically, inter- and intra-company transfers of pollock occur near the end of the season to promote quota usage. No enforcement actions were taken by the PCC against any members during 2015.
19
High Seas Catchers’ Cooperative Annual Report
Introduction
The High Seas Catchers Coop is a fisheries cooperative of all vessels eligible to fish for BSAI pollock under section 208(b) of the American Fisheries Act (AFA). The HSCC is party to an inter-cooperative agreement with the PCC for purposes of pollock harvest management, and a participant in an AFA catcher-vessel inter-cooperative agreement for purposes of sideboard species harvest management.
Cooperative Members and Allocations
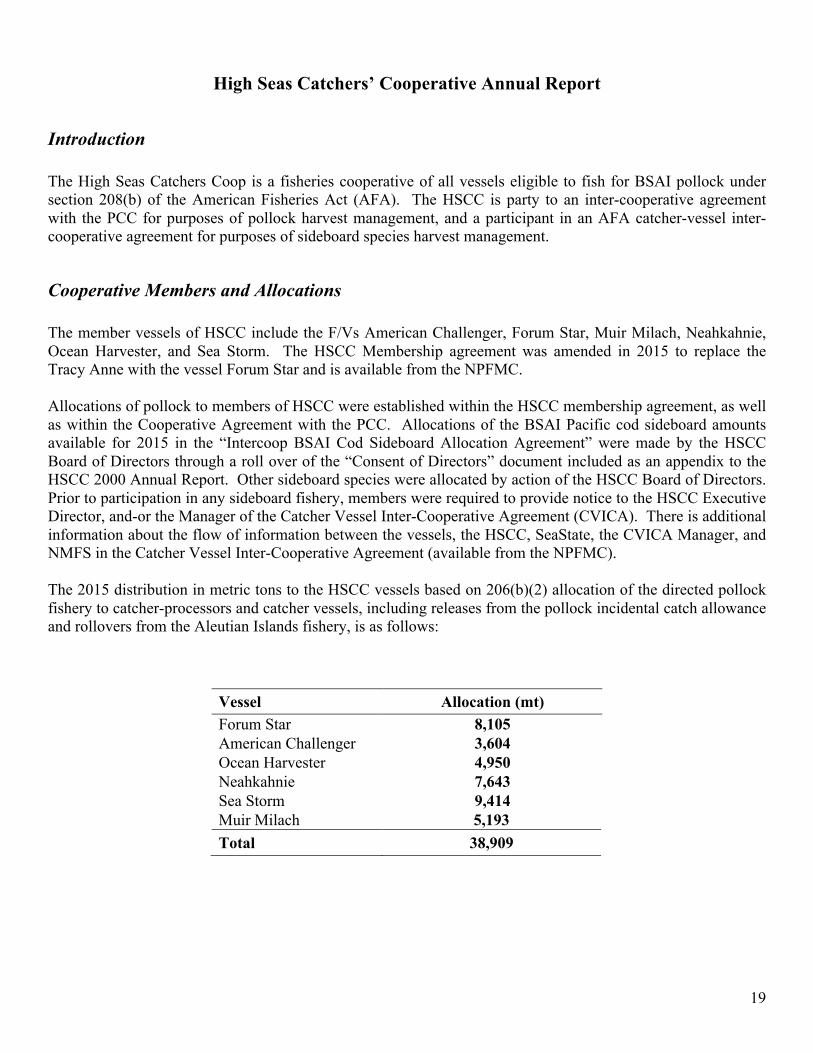
The member vessels of HSCC include the F/Vs American Challenger, Forum Star, Muir Milach, Neahkahnie, Ocean Harvester, and Sea Storm. The HSCC Membership agreement was amended in 2015 to replace the Tracy Anne with the vessel Forum Star and is available from the NPFMC.
Allocations of pollock to members of HSCC were established within the HSCC membership agreement, as well as within the Cooperative Agreement with the PCC. Allocations of the BSAI Pacific cod sideboard amounts available for 2015 in the “Intercoop BSAI Cod Sideboard Allocation Agreement” were made by the HSCC Board of Directors through a roll over of the “Consent of Directors” document included as an appendix to the HSCC 2000 Annual Report. Other sideboard species were allocated by action of the HSCC Board of Directors. Prior to participation in any sideboard fishery, members were required to provide notice to the HSCC Executive Director, and-or the Manager of the Catcher Vessel Inter-Cooperative Agreement (CVICA). There is additional information about the flow of information between the vessels, the HSCC, SeaState, the CVICA Manager, and NMFS in the Catcher Vessel Inter-Cooperative Agreement (available from the NPFMC).
The 2015 distribution in metric tons to the HSCC vessels based on 206(b)(2) allocation of the directed pollock fishery to catcher-processors and catcher vessels, including releases from the pollock incidental catch allowance and rollovers from the Aleutian Islands fishery, is as follows:
Vessel Allocation (mt) Forum Star 8,105 American Challenger 3,604 Ocean Harvester 4,950 Neahkahnie 7,643 Sea Storm 9,414 Muir Milach 5,193 Total 38,909
20
Inter-Cooperative Agreement Between HSCC and PCC
The members of PCC and HSCC are allocated pollock under section 206(b)(2) of the AFA. As noted, HSCC is a party to the “Cooperative Agreement Between Offshore Pollock Catchers’ Cooperative and Pollock Conservation Cooperative” for purposes of pollock management, and this agreement is available from the NPFMC.
Catcher Vessel Inter-Cooperative Agreement
HSCC is also a party to the Catcher Vessel Inter-Cooperative Agreement (CVICA) for purposes of groundfish sideboard harvest management. Compliance with both agreements is based upon monitoring of catch and bycatch by SeaState, Inc. Information concerning CVICA allocations and rules as well as inter-cooperative transfer arrangements is contained in an annual report submitted to the NPFMC by the CVICA Manager. Among other things, the CVICA contains specific provisions on management of halibut prohibited-species catches (PSC) in the BSAI Pacific cod fishery, in which some HSCC vessels participate (see below). Prohibited species bycatch (PSC) by HSCC vessels is provided in Table 10.
Bering Sea Pollock Transfers and Directed Pollock Fishing
Based upon the January 1999 “Cooperative Agreement Between Offshore Pollock Catchers’ Cooperative and Pollock Conservation Cooperative,” individual members of HSCC have made transfers of pollock to individual members of PCC. These transfers are reported in Table 1 while catch and bycatch information for the directed Bering Sea pollock fishery is provided in Table 2.
Bering Sea and Aleutian Islands Shellfish Fisheries
The BSAI crab rationalization program was implemented in August 2005. As part of that program, the AFA crab sideboard limits were eliminated. The HSCC vessel Forum Star leased all of its scallop catch history and so did not catch any scallops in 2015.
AFA Sideboard Limits
The NMFS publishes in the Federal Register the sideboard limits for all AFA catcher vessels as well as a set of information tables which provide historic catches of sideboard species by cooperative for those species for which directed fishing is allowed. The regulations allow two or more cooperatives to enter into an inter-cooperative agreement where vessel catches are limited by the combined cooperative sideboard limits. Bering Sea and Aleutian Islands Sideboard Fisheries
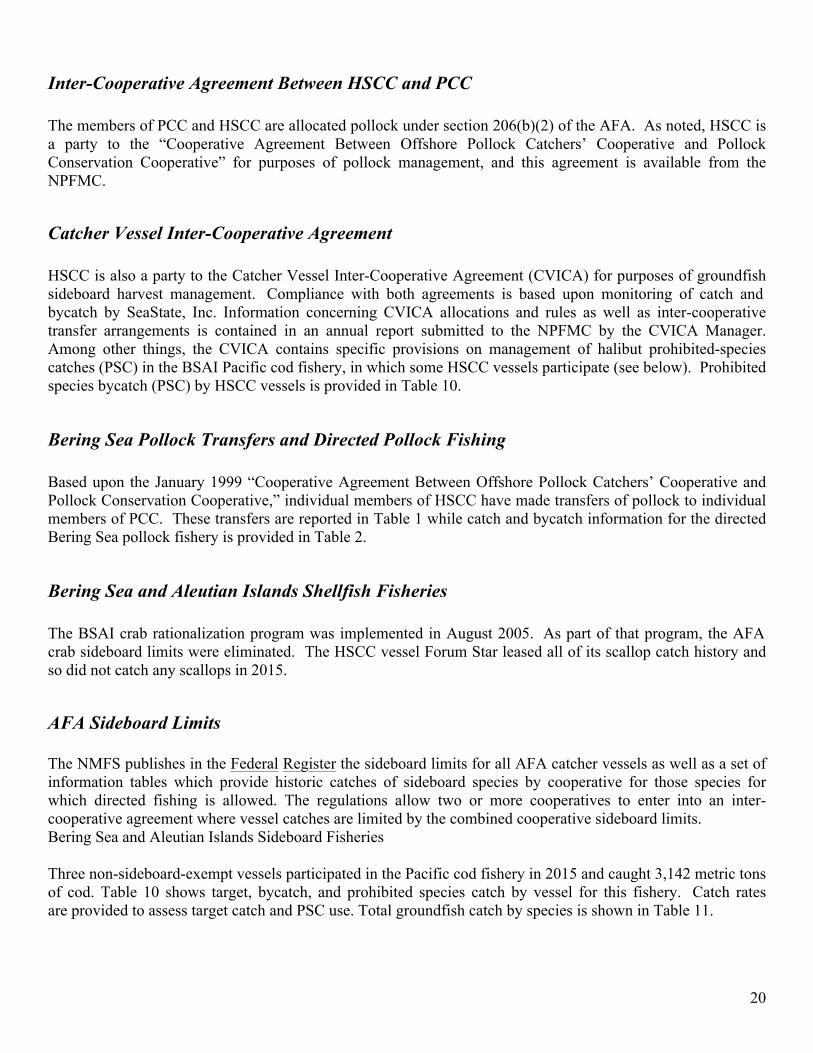
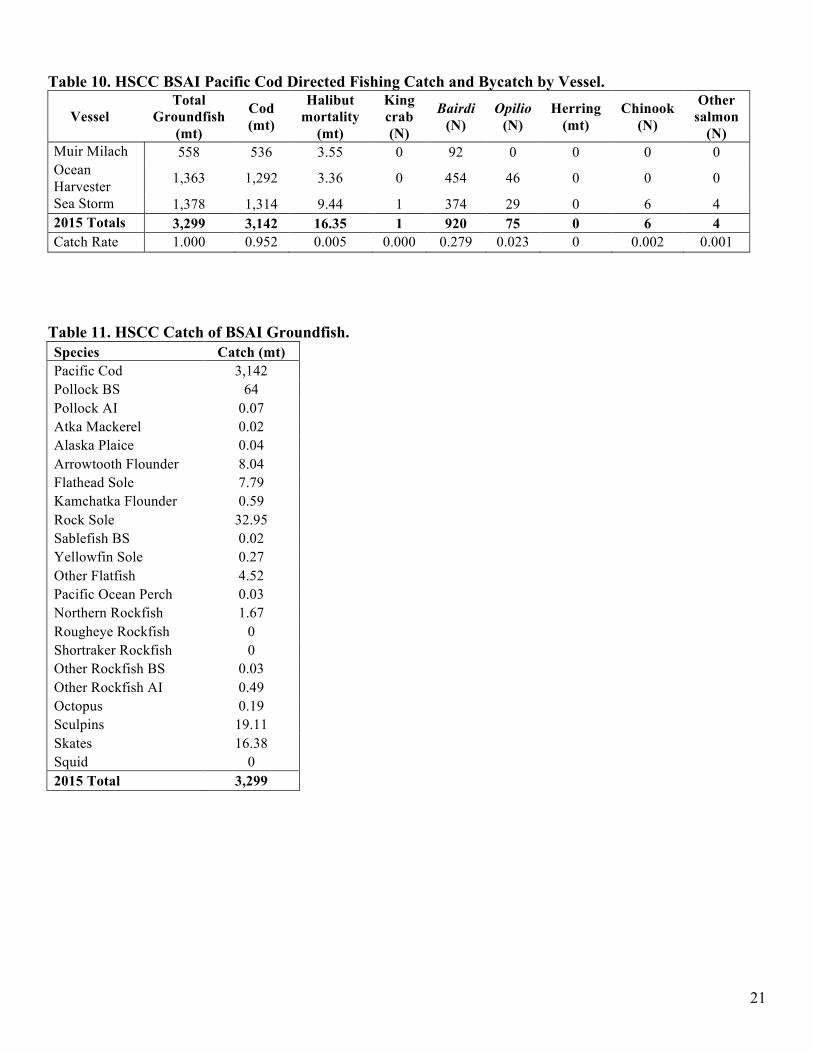
Three non-sideboard-exempt vessels participated in the Pacific cod fishery in 2015 and caught 3,142 metric tons of cod. Table 10 shows target, bycatch, and prohibited species catch by vessel for this fishery. Catch rates are provided to assess target catch and PSC use. Total groundfish catch by species is shown in Table 11.
21
Table 10. HSCC BSAI Pacific Cod Directed Fishing Catch and Bycatch by Vessel.
Vessel Total
Groundfish (mt)
Cod (mt)
Halibut mortality
(mt)
King crab (N)
Bairdi (N)
Opilio (N)
Herring (mt)
Chinook (N)
Other salmon
(N) Muir Milach 558 536 3.55 0 92 0 0 0 0 Ocean Harvester 1,363 1,292 3.36 0 454 46 0 0 0
Sea Storm 1,378 1,314 9.44 1 374 29 0 6 4 2015 Totals 3,299 3,142 16.35 1 920 75 0 6 4 Catch Rate 1.000 0.952 0.005 0.000 0.279 0.023 0 0.002 0.001
Table 11. HSCC Catch of BSAI Groundfish. Species Catch (mt) Pacific Cod 3,142 Pollock BS 64 Pollock AI 0.07 Atka Mackerel 0.02 Alaska Plaice 0.04 Arrowtooth Flounder 8.04 Flathead Sole 7.79 Kamchatka Flounder 0.59 Rock Sole 32.95 Sablefish BS 0.02 Yellowfin Sole 0.27 Other Flatfish 4.52 Pacific Ocean Perch 0.03 Northern Rockfish 1.67 Rougheye Rockfish 0 Shortraker Rockfish 0 Other Rockfish BS 0.03 Other Rockfish AI 0.49 Octopus 0.19 Sculpins 19.11 Skates 16.38 Squid 0 2015 Total 3,299
22
Gulf of Alaska Sideboard Fisheries
No HSCC vessels participated in the Western GOA pollock sideboard fishery in 2015.
Monitoring and Enforcement All data used in monitoring HSCC pollock and non-pollock fishing for delivery to offshore processors was obtained from the NMFS North Pacific Groundfish Observer Program. Information is available on the NMFS password-protected web site 24 hours a day, and is generally accessible 20 minutes after transmission from the vessel. Sea State, Inc. is authorized by the HSCC and its members to receive and process this observer data and report back to the members on the status of the harvest. The methods are the same as those described above under PCC Monitoring and Enforcement.
For deliveries to shore-side processors, each company submitted copies of its Alaska Department of Fish and Game (ADFG) fish tickets to SeaState, Inc. for tabulation through the NMFS Electronic Fish Ticket Program. In addition, HSCC member companies provided confidentiality waiver requests to ADFG for release of the data directly to SeaState to verify the completeness and accuracy of data submitted by HSCC members. This information was then made available to all HSCC members on the SeaState web site.
Penalty Structures within the HSCC and Between Cooperatives
The Cooperative Agreement between HSCC and PCC provides for inter-cooperative enforcement of penalties in the event of over-harvest of pollock. The CVICA also contains penalty provisions for over-harvest of sideboard species. No enforcement actions were taken by HSCC members in either its pollock or sideboard fisheries in 2015; members complied with the provisions of the membership agreement.