Embed Size (px)
Citation preview
2015 RESULTS: SMARTER BALANCED
ASSESSMENT CONSORTIUM (SBAC)
SFUSD Board Presentation September 29, 2015
Presentation Outline
¨ Context of SBAC
¨ Participation on SBAC
¨ Districtwide SBAC Results
¨ SBAC Student Report (Parent Resources)
¨ School Action
Context of SBAC
Smarter Balanced Assessments
Smarter Balanced Assessment Facts
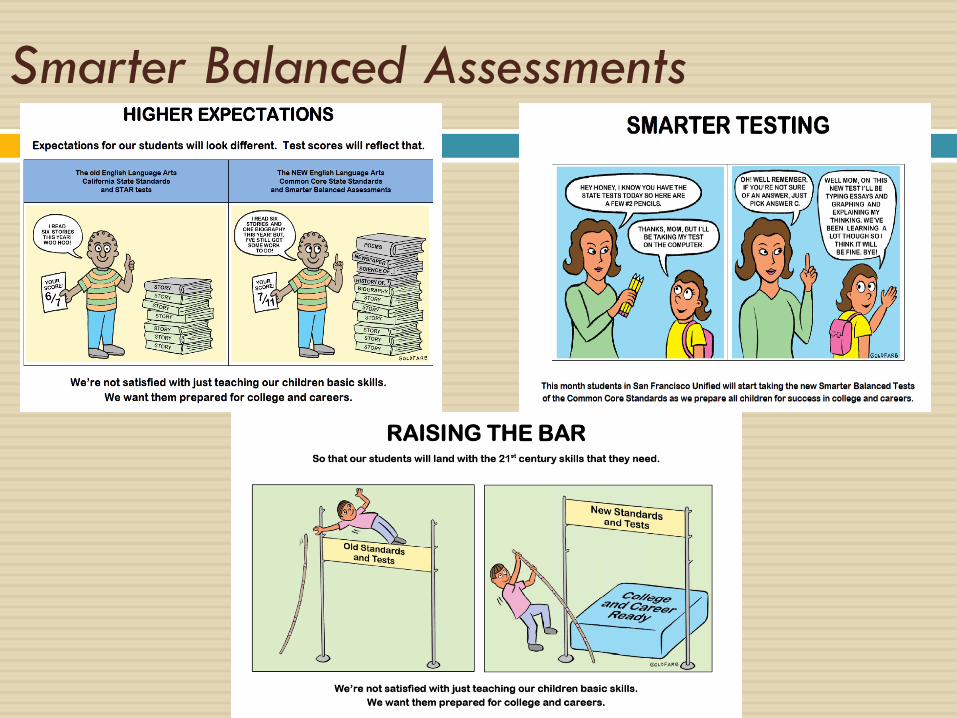
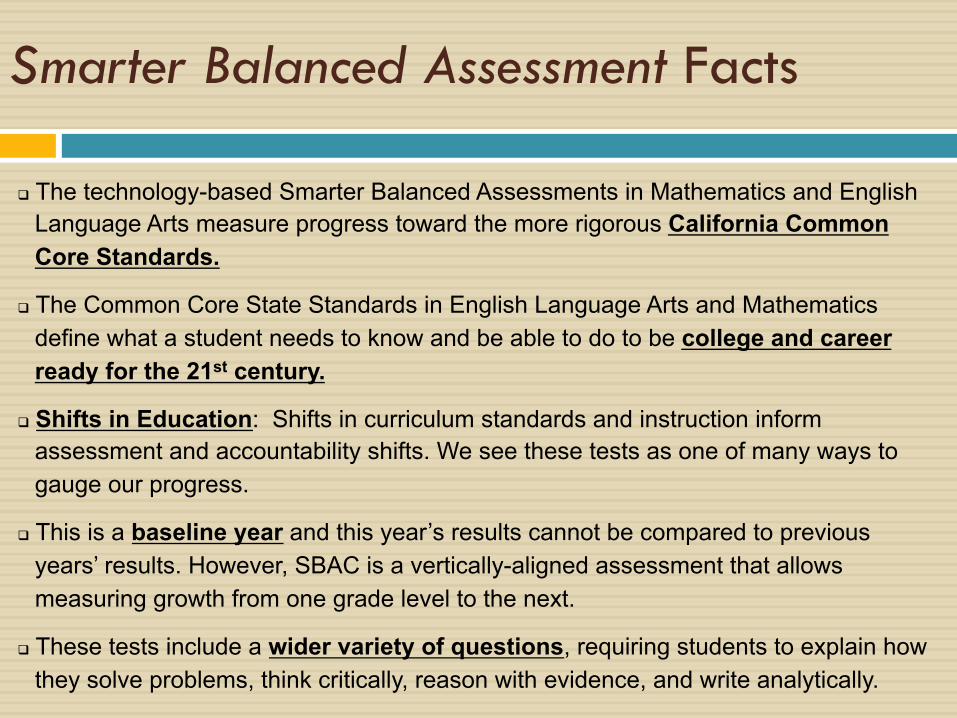
q The technology-based Smarter Balanced Assessments in Mathematics and English Language Arts measure progress toward the more rigorous California Common Core Standards.
q The Common Core State Standards in English Language Arts and Mathematics define what a student needs to know and be able to do to be college and career ready for the 21st century.
q Shifts in Education: Shifts in curriculum standards and instruction inform assessment and accountability shifts. We see these tests as one of many ways to gauge our progress.
q This is a baseline year and this year’s results cannot be compared to previous years’ results. However, SBAC is a vertically-aligned assessment that allows measuring growth from one grade level to the next.
q These tests include a wider variety of questions, requiring students to explain how they solve problems, think critically, reason with evidence, and write analytically.
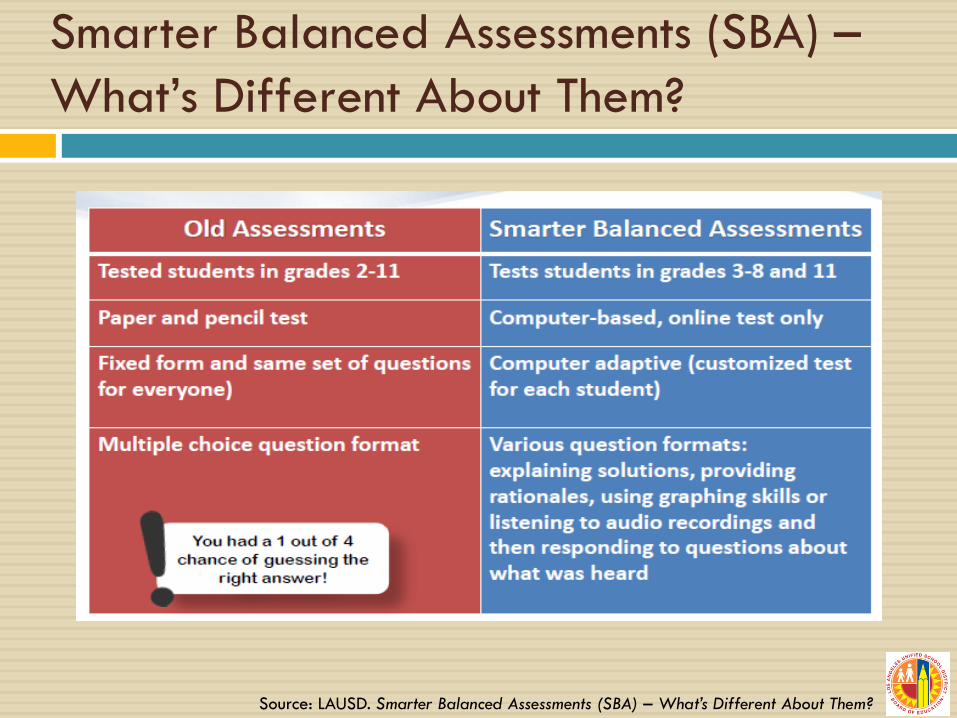
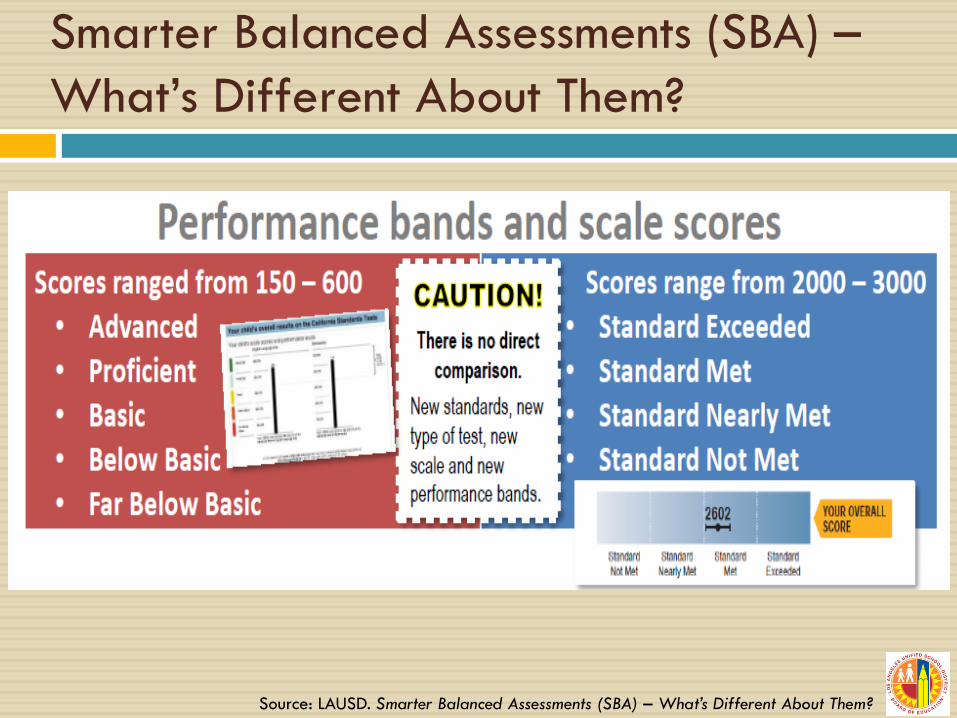
Smarter Balanced Assessments (SBA) – What’s Different About Them?
Source: LAUSD. Smarter Balanced Assessments (SBA) – What’s Different About Them?
Source: LAUSD. Smarter Balanced Assessments (SBA) – What’s Different About Them?
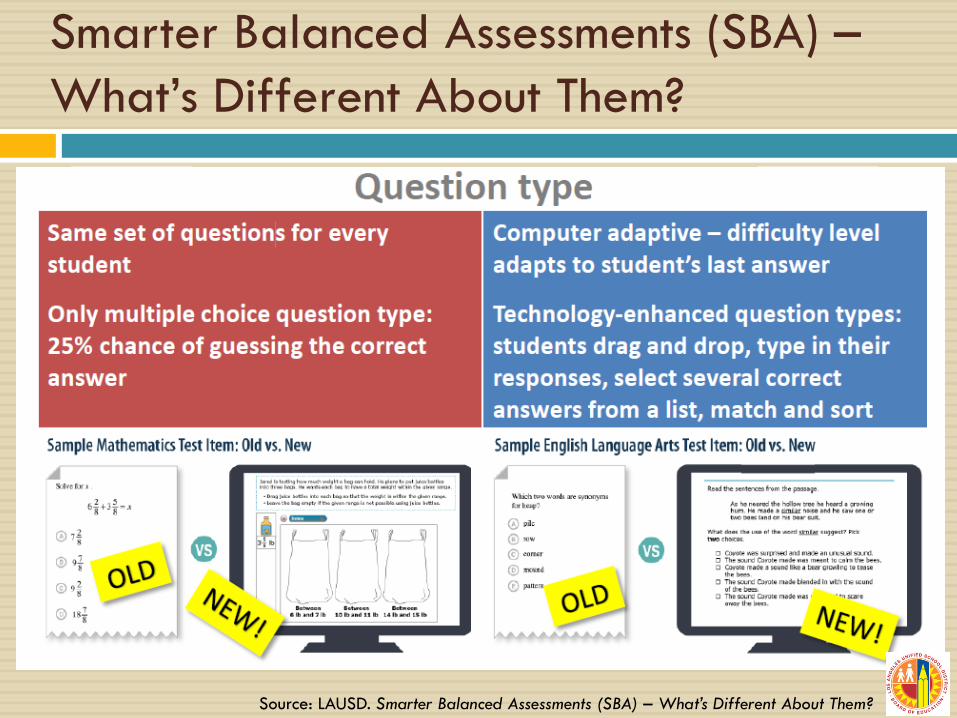
Smarter Balanced Assessments (SBA) – What’s Different About Them?
Source: LAUSD. Smarter Balanced Assessments (SBA) – What’s Different About Them?
Smarter Balanced Assessments (SBA) – What’s Different About Them?
Participation on SBAC
Participation on SBAC
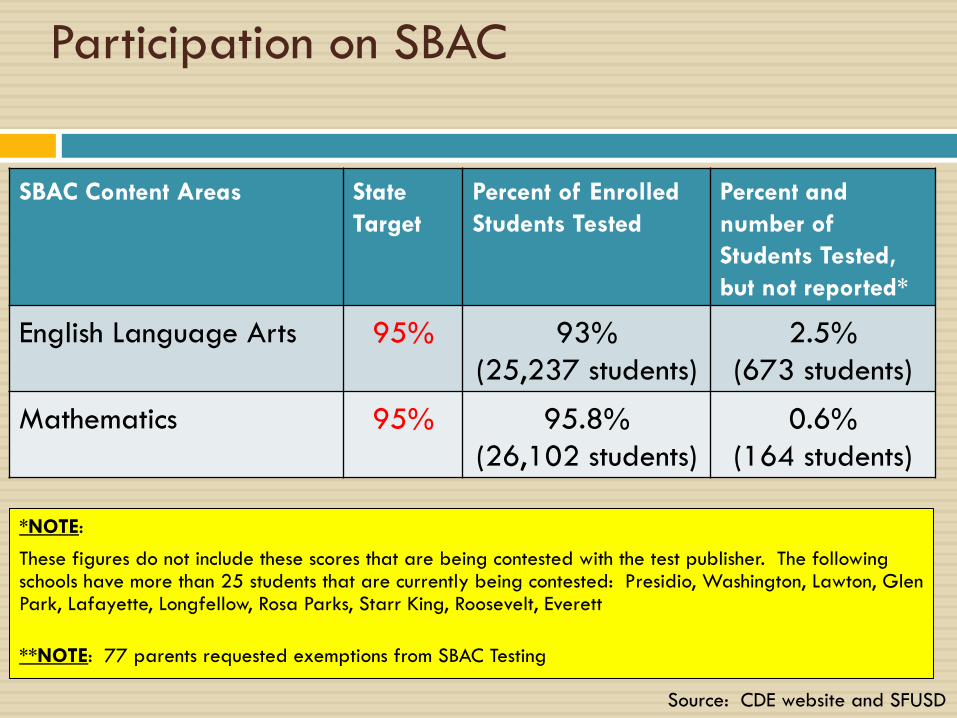
*NOTE:
These figures do not include these scores that are being contested with the test publisher. The following schools have more than 25 students that are currently being contested: Presidio, Washington, Lawton, Glen Park, Lafayette, Longfellow, Rosa Parks, Starr King, Roosevelt, Everett
**NOTE: 77 parents requested exemptions from SBAC Testing
Source: CDE website and SFUSD
SBAC Content Areas State Target
Percent of Enrolled Students Tested
Percent and number of Students Tested, but not reported*
English Language Arts 95% 93% (25,237 students)
2.5% (673 students)
Mathematics 95% 95.8% (26,102 students)
0.6% (164 students)
Special Education and English Learner Testing
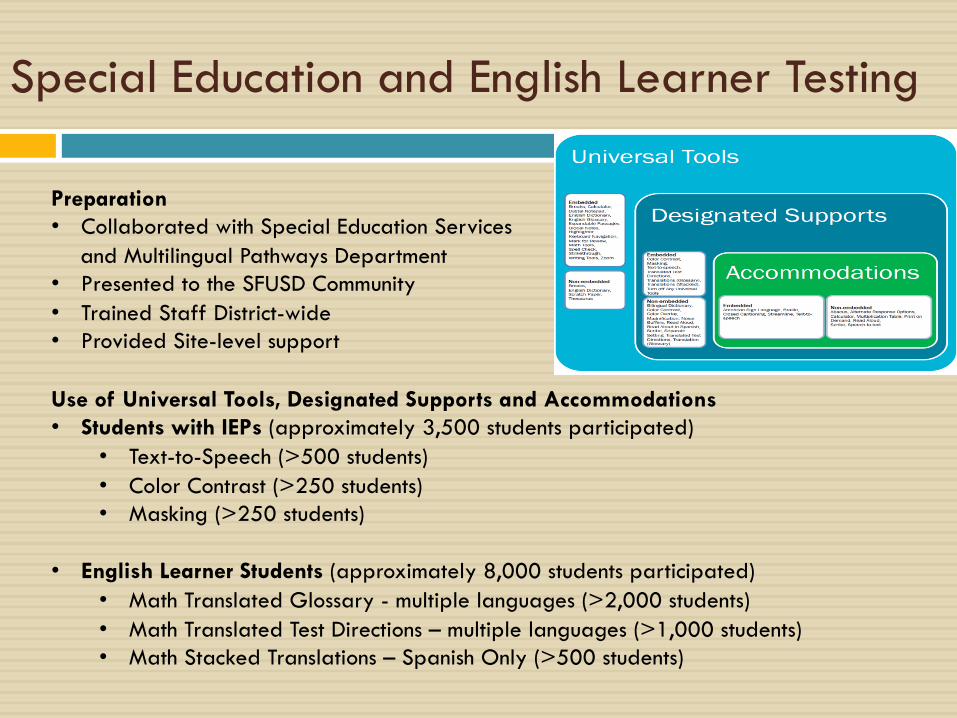
Preparation • Collaborated with Special Education Services
and Multilingual Pathways Department • Presented to the SFUSD Community • Trained Staff District-wide • Provided Site-level support
Use of Universal Tools, Designated Supports and Accommodations • Students with IEPs (approximately 3,500 students participated)
• Text-to-Speech (>500 students) • Color Contrast (>250 students) • Masking (>250 students)
• English Learner Students (approximately 8,000 students participated) • Math Translated Glossary - multiple languages (>2,000 students) • Math Translated Test Directions – multiple languages (>1,000 students) • Math Stacked Translations – Spanish Only (>500 students)
Districtwide SBAC Results
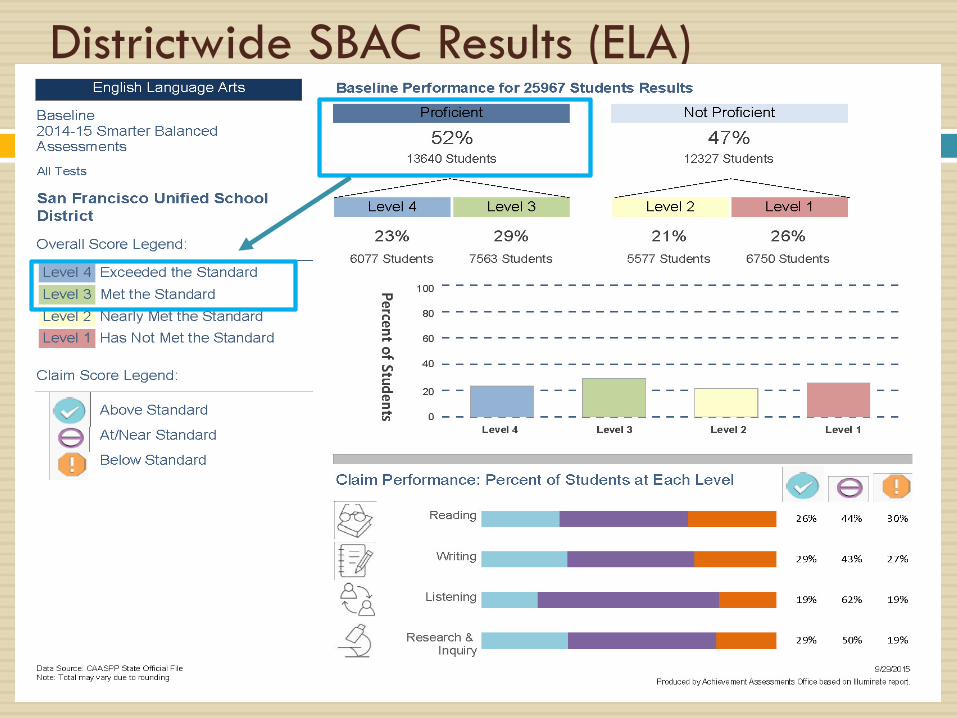
Districtwide SBAC Results (ELA)
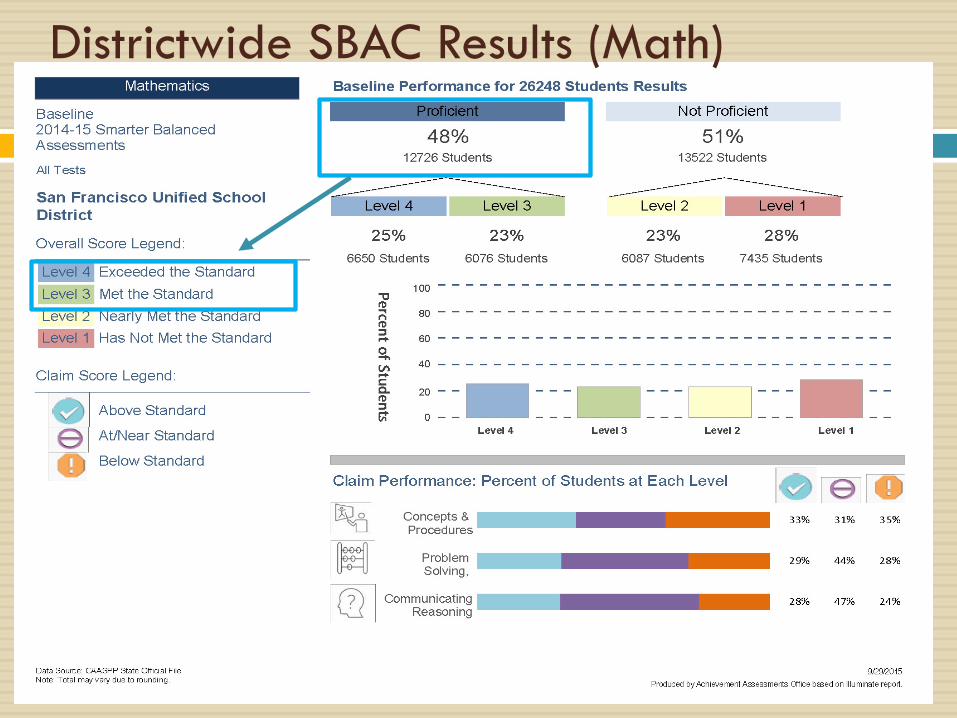
Districtwide SBAC Results (Math)
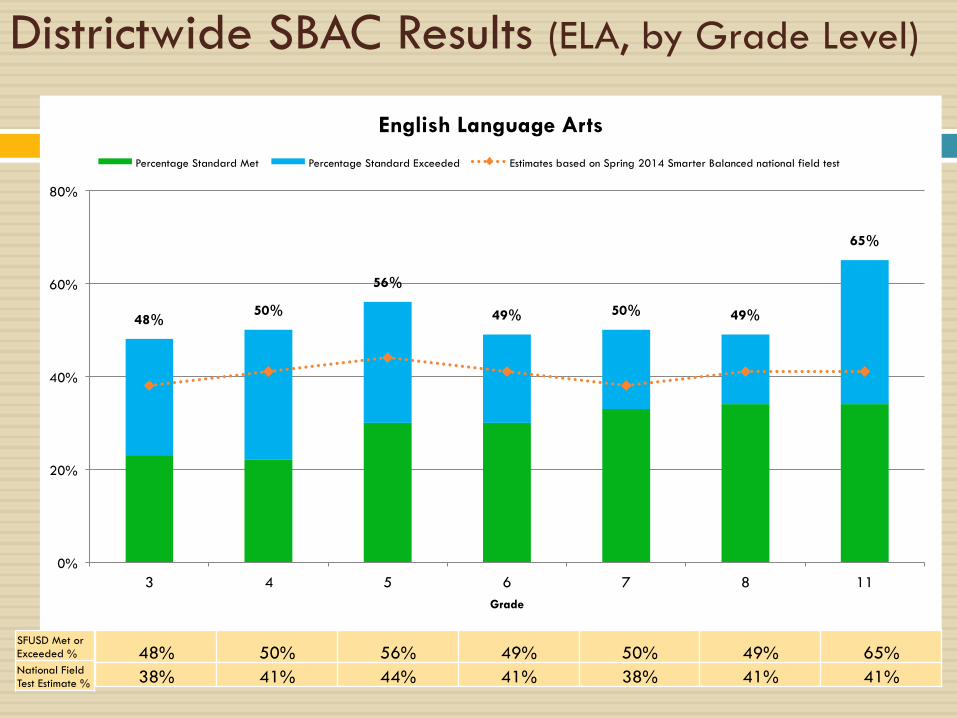
Districtwide SBAC Results (ELA, by Grade Level)
48% 50%
56%
49% 50% 49%
65%
0%
20%
40%
60%
80%
3 4 5 6 7 8 11 Grade
English Language Arts
Percentage Standard Met Percentage Standard Exceeded Estimates based on Spring 2014 Smarter Balanced national field test
48% 50% 56% 49% 50% 49% 65% 38% 41% 44% 41% 38% 41% 41%
SFUSD Met or Exceeded % National Field Test Estimate %
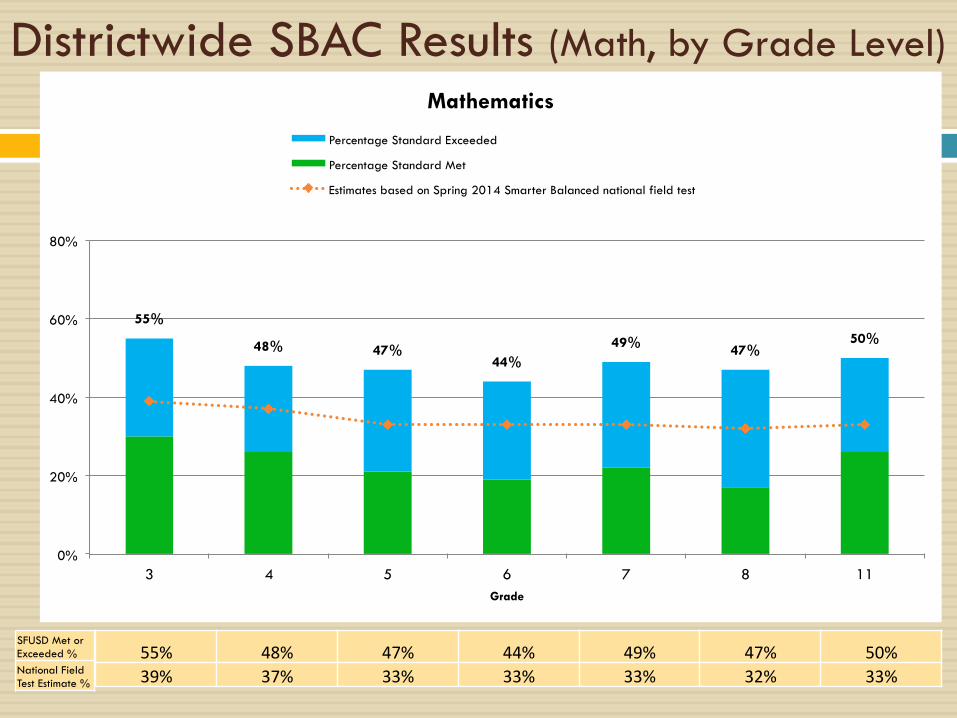
Districtwide SBAC Results (Math, by Grade Level)
55%
48% 47% 44%
49% 47% 50%
0%
20%
40%
60%
80%
3 4 5 6 7 8 11 Grade
Mathematics
Percentage Standard Exceeded
Percentage Standard Met
Estimates based on Spring 2014 Smarter Balanced national field test
55% 48% 47% 44% 49% 47% 50% 39% 37% 33% 33% 33% 32% 33%
SFUSD Met or Exceeded % National Field Test Estimate %
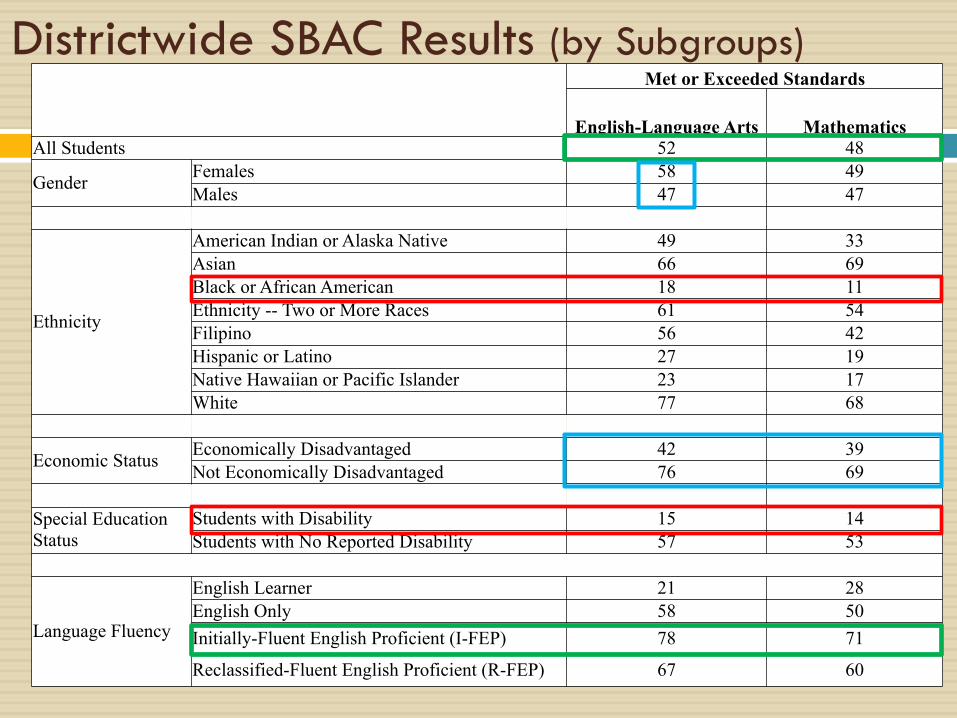
Met or Exceeded Standards
English-Language Arts Mathematics All Students 52 48
Gender Females 58 49 Males 47 47
Ethnicity
American Indian or Alaska Native 49 33 Asian 66 69 Black or African American 18 11 Ethnicity -- Two or More Races 61 54 Filipino 56 42 Hispanic or Latino 27 19 Native Hawaiian or Pacific Islander 23 17 White 77 68
Economic Status Economically Disadvantaged 42 39 Not Economically Disadvantaged 76 69
Special Education Status
Students with Disability 15 14 Students with No Reported Disability 57 53
Language Fluency
English Learner 21 28 English Only 58 50 Initially-Fluent English Proficient (I-FEP) 78 71
Reclassified-Fluent English Proficient (R-FEP) 67 60
Districtwide SBAC Results (by Subgroups)
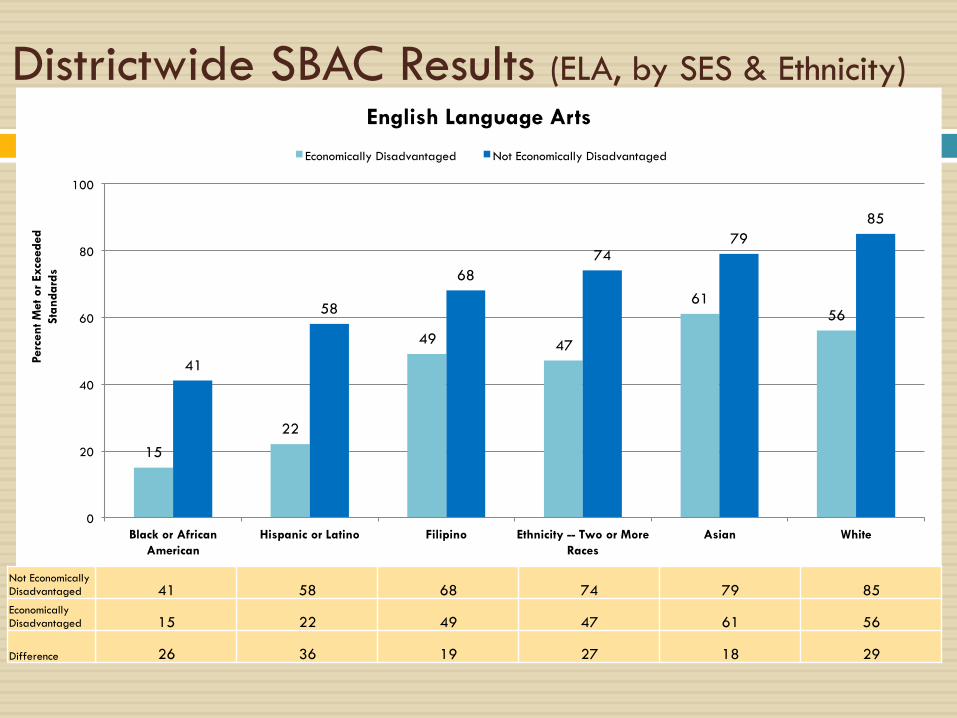
Districtwide SBAC Results (ELA, by SES & Ethnicity)
15 22
49 47
61 56
41
58
68 74
79 85
0
20
40
60
80
100
Black or African American
Hispanic or Latino Filipino Ethnicity -- Two or More Races
Asian White
Perc
ent M
et o
r Ex
ceed
ed
Stan
dard
s
English Language Arts
Economically Disadvantaged Not Economically Disadvantaged
41 58 68 74 79 85
15 22 49 47 61 56
26 36 19 27 18 29
Not Economically Disadvantaged Economically Disadvantaged
Difference
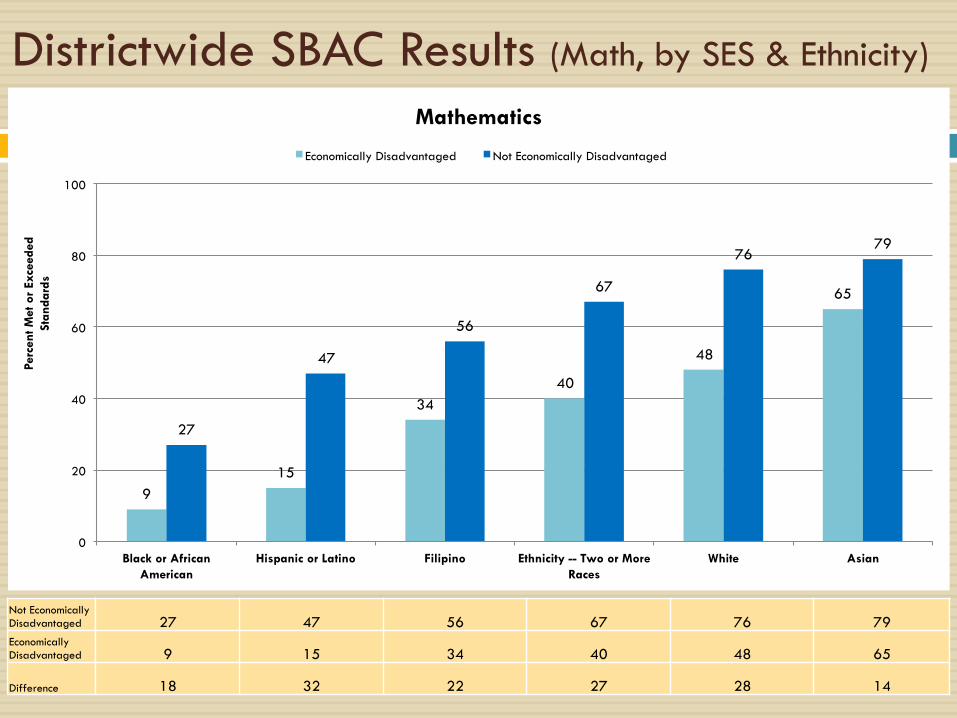
Districtwide SBAC Results (Math, by SES & Ethnicity)
9 15
34 40
48
65
27
47
56
67
76 79
0
20
40
60
80
100
Black or African American
Hispanic or Latino Filipino Ethnicity -- Two or More Races
White Asian
Perc
ent M
et o
r Ex
ceed
ed
Stan
dard
s
Mathematics
Economically Disadvantaged Not Economically Disadvantaged
Not Economically Disadvantaged Economically Disadvantaged
Difference
27 47 56 67 76 79
9 15 34 40 48 65
18 32 22 27 28 14
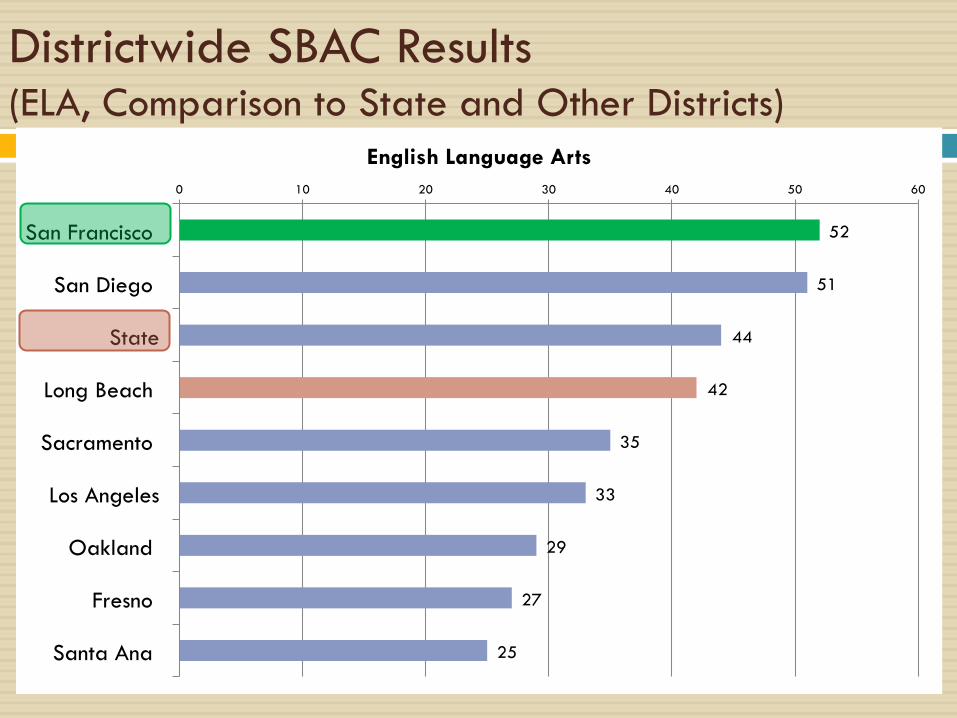
52
51
44
42
35
33
29
27
25
0 10 20 30 40 50 60
San Francisco
San Diego
State
Long Beach
Sacramento
Los Angeles
Oakland
Fresno
Santa Ana
English Language Arts
Districtwide SBAC Results (ELA, Comparison to State and Other Districts)
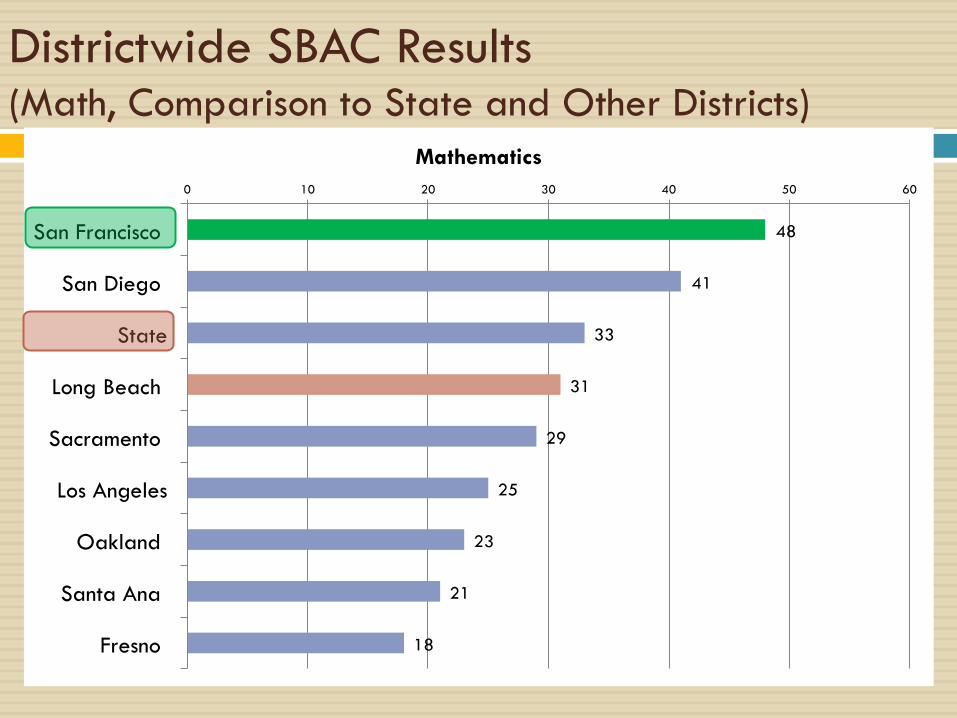
Districtwide SBAC Results (Math, Comparison to State and Other Districts)
48
41
33
31
29
25
23
21
18
0 10 20 30 40 50 60
San Francisco
San Diego
State
Long Beach
Sacramento
Los Angeles
Oakland
Santa Ana
Fresno
Mathematics
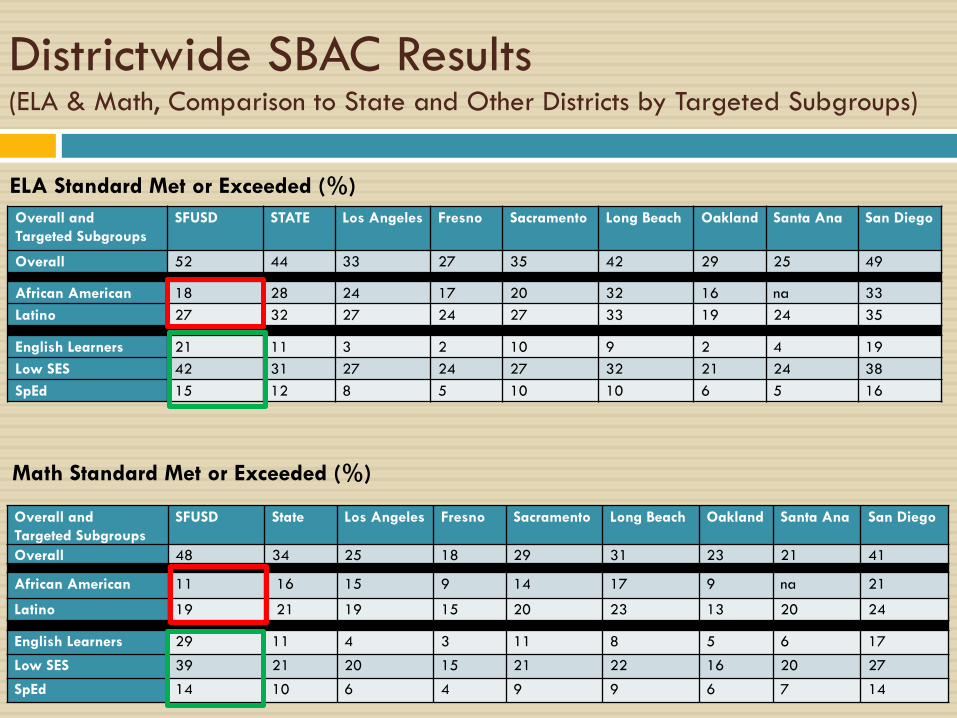
Districtwide SBAC Results (ELA & Math, Comparison to State and Other Districts by Targeted Subgroups)
Overall and Targeted Subgroups
SFUSD STATE Los Angeles Fresno Sacramento Long Beach Oakland Santa Ana San Diego
Overall 52 44 33 27 35 42 29 25 49
African American 18 28 24 17 20 32 16 na 33 Latino 27 32 27 24 27 33 19 24 35
English Learners 21 11 3 2 10 9 2 4 19 Low SES 42 31 27 24 27 32 21 24 38 SpEd 15 12 8 5 10 10 6 5 16
ELA Standard Met or Exceeded (%)
Math Standard Met or Exceeded (%)
Overall and Targeted Subgroups
SFUSD State Los Angeles Fresno Sacramento Long Beach Oakland Santa Ana San Diego
Overall 48 34 25 18 29 31 23 21 41
African American 11 16 15 9 14 17 9 na 21
Latino 19 21 19 15 20 23 13 20 24
English Learners 29 11 4 3 11 8 5 6 17
Low SES 39 21 20 15 21 22 16 20 27
SpEd 14 10 6 4 9 9 6 7 14
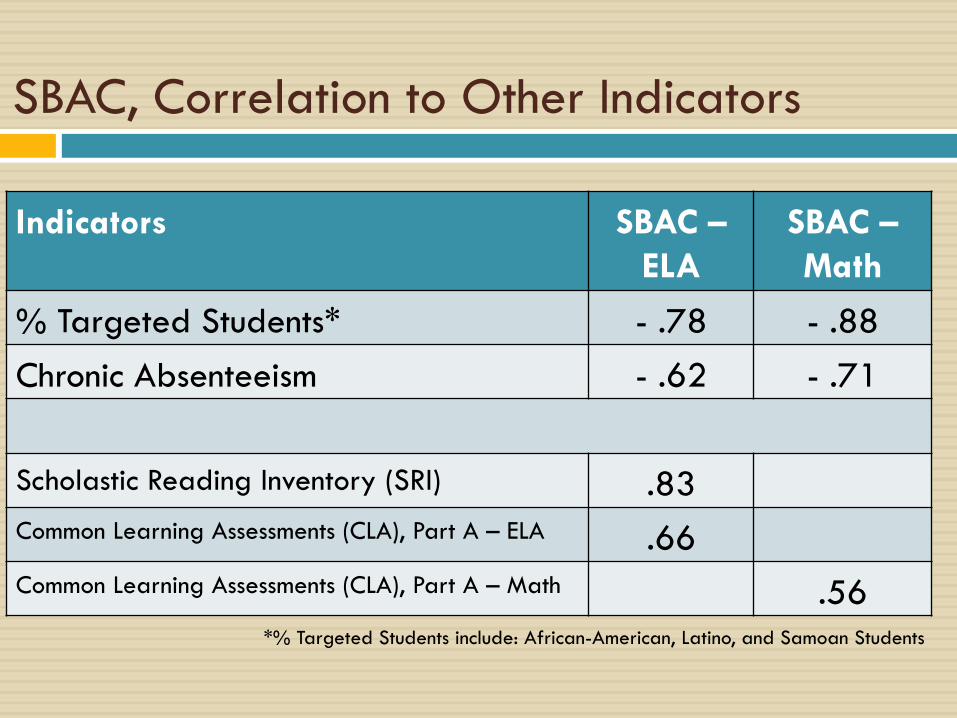
SBAC, Correlation to Other Indicators
*% Targeted Students include: African-American, Latino, and Samoan Students
Indicators SBAC – ELA
SBAC – Math
% Targeted Students* - .78 - .88 Chronic Absenteeism - .62 - .71
Scholastic Reading Inventory (SRI) .83 Common Learning Assessments (CLA), Part A – ELA .66 Common Learning Assessments (CLA), Part A – Math .56
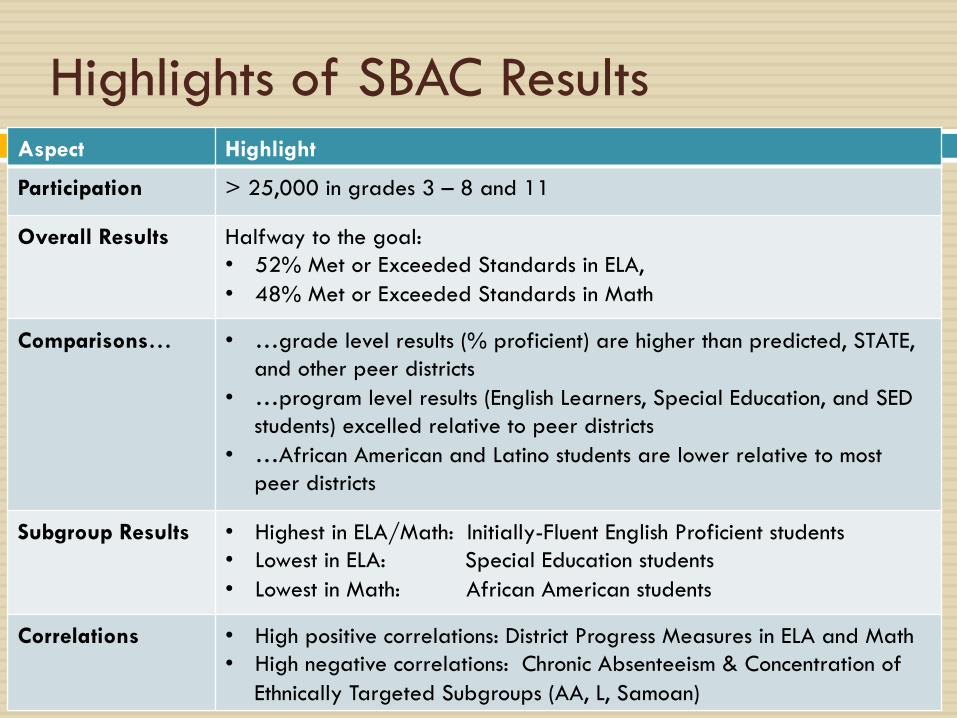
Highlights of SBAC Results Aspect Highlight
Participation > 25,000 in grades 3 – 8 and 11
Overall Results Halfway to the goal: • 52% Met or Exceeded Standards in ELA, • 48% Met or Exceeded Standards in Math
Comparisons… • …grade level results (% proficient) are higher than predicted, STATE, and other peer districts
• …program level results (English Learners, Special Education, and SED students) excelled relative to peer districts
• …African American and Latino students are lower relative to most peer districts
Subgroup Results • Highest in ELA/Math: Initially-Fluent English Proficient students • Lowest in ELA: Special Education students • Lowest in Math: African American students
Correlations • High positive correlations: District Progress Measures in ELA and Math • High negative correlations: Chronic Absenteeism & Concentration of
Ethnically Targeted Subgroups (AA, L, Samoan)
SBAC Student Report (Parent Resources) NOTE: As a parent, you should receive your student score report within the next two weeks. If not, please contact us at 415-241-6400.
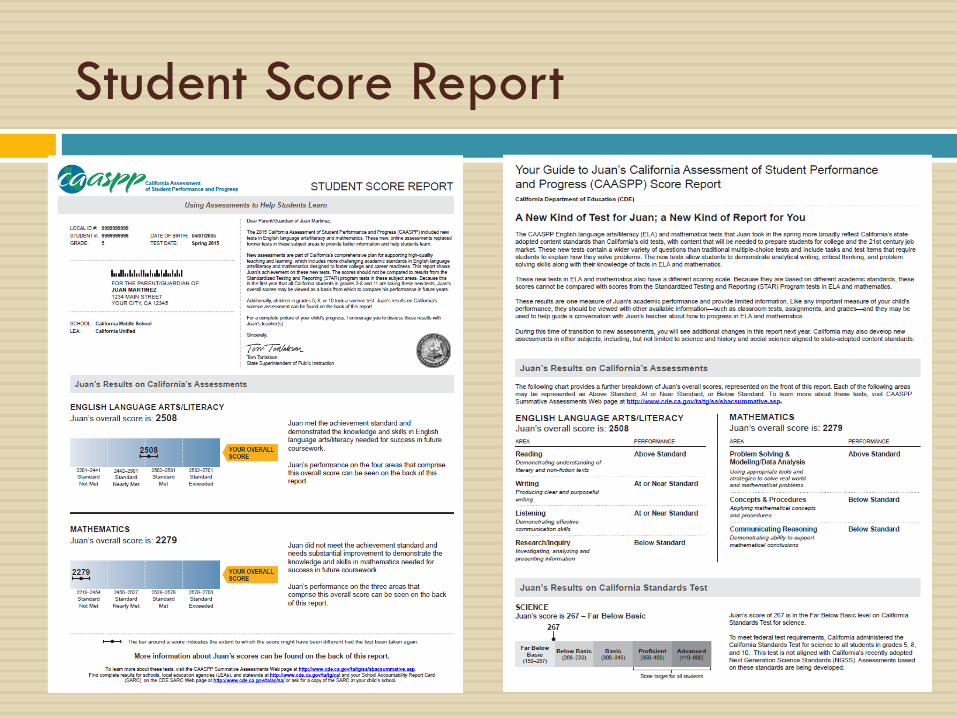
Student Score Report
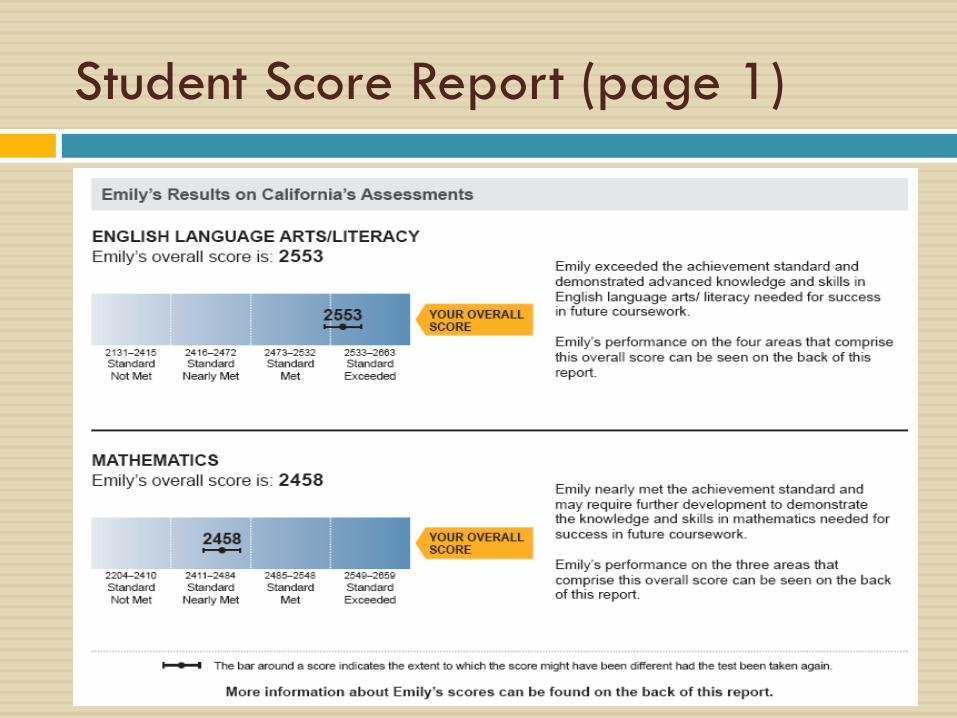
Student Score Report (page 1)
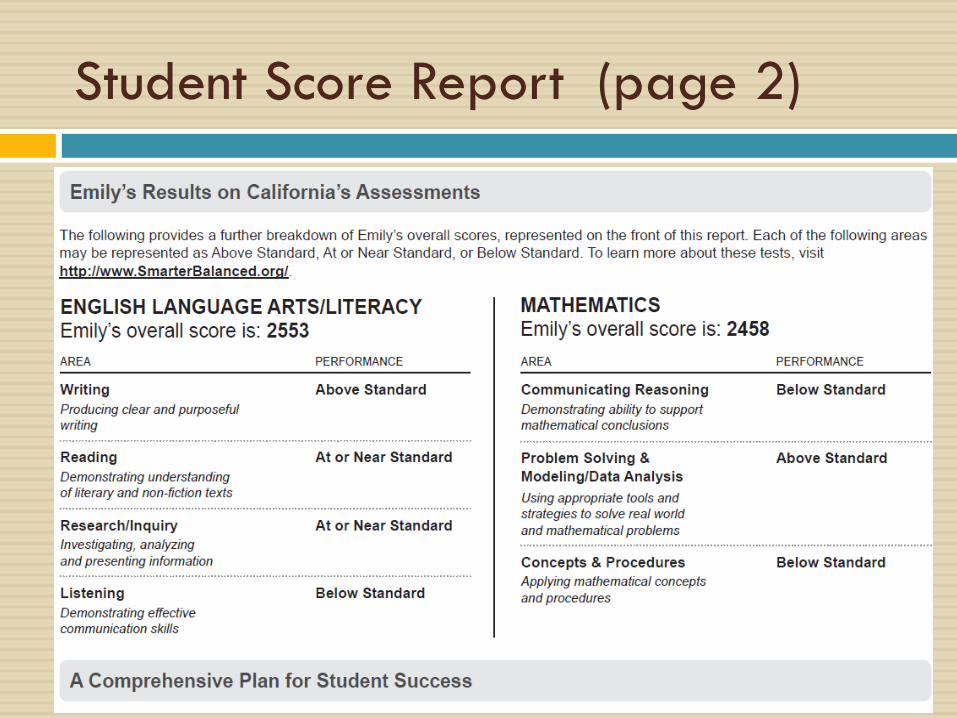
Student Score Report (page 2)
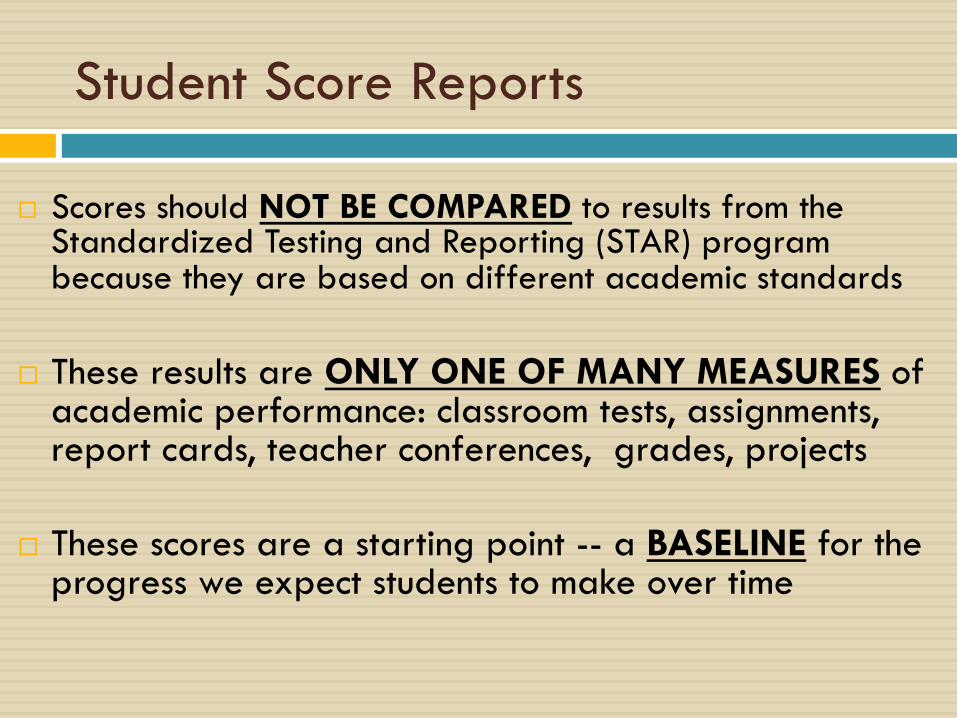
Student Score Reports
¨ Scores should NOT BE COMPARED to results from the Standardized Testing and Reporting (STAR) program because they are based on different academic standards
¨ These results are ONLY ONE OF MANY MEASURES of
academic performance: classroom tests, assignments, report cards, teacher conferences, grades, projects
¨ These scores are a starting point -- a BASELINE for the progress we expect students to make over time
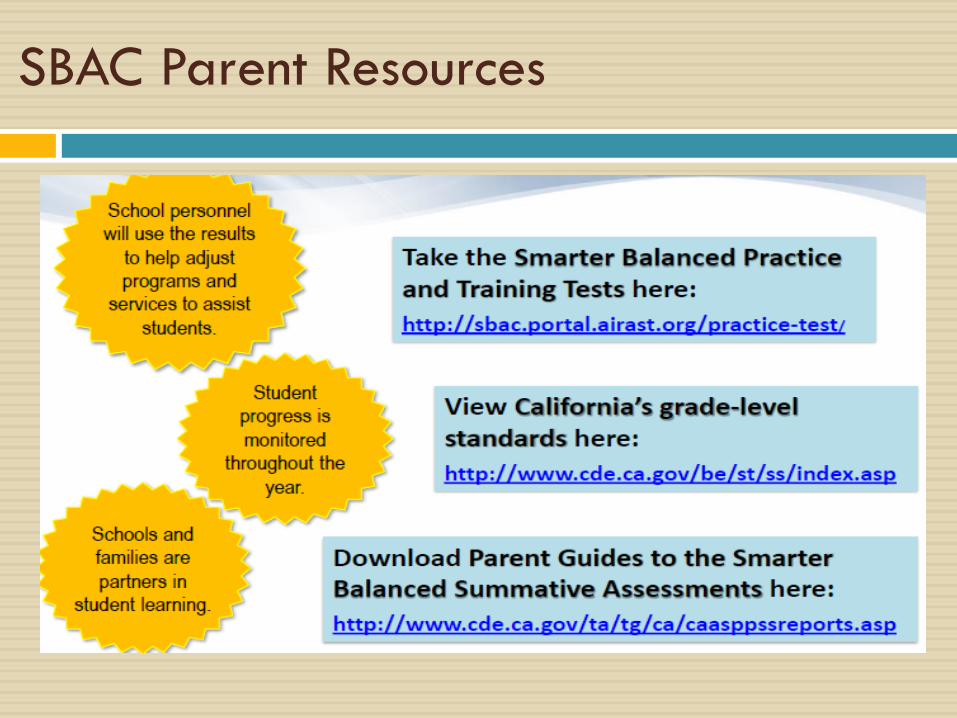
SBAC Parent Resources
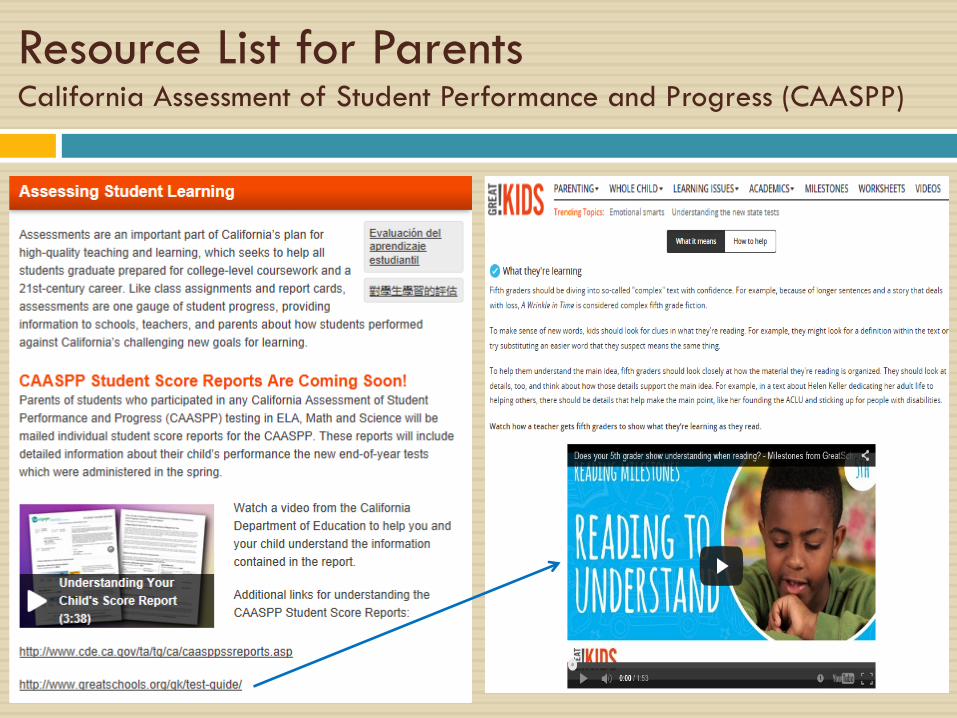
Resource List for Parents California Assessment of Student Performance and Progress (CAASPP)
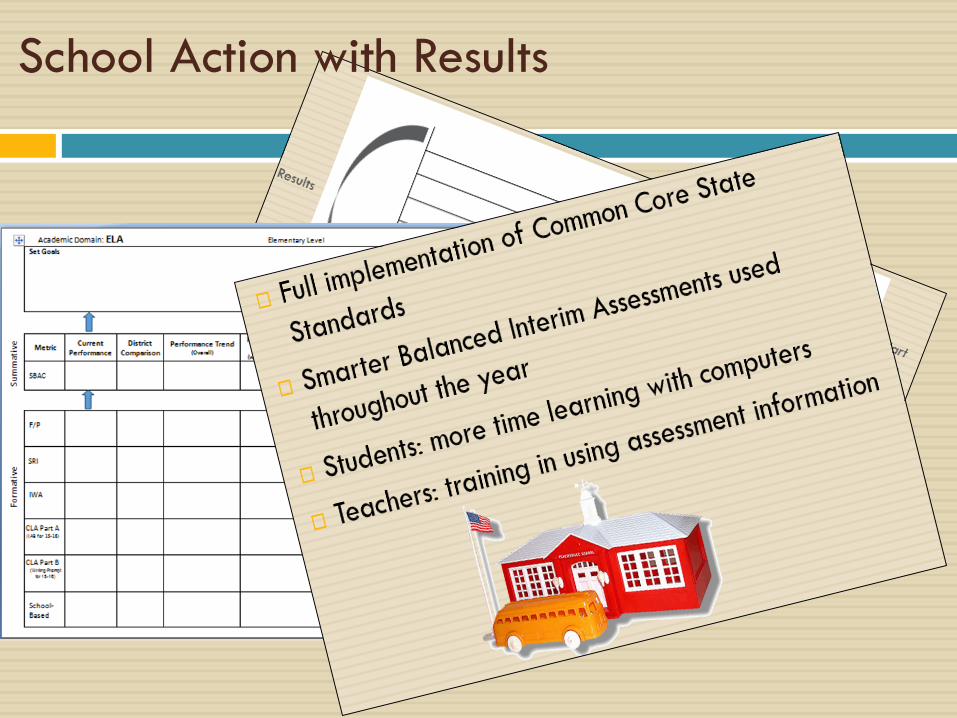
School Action with Results
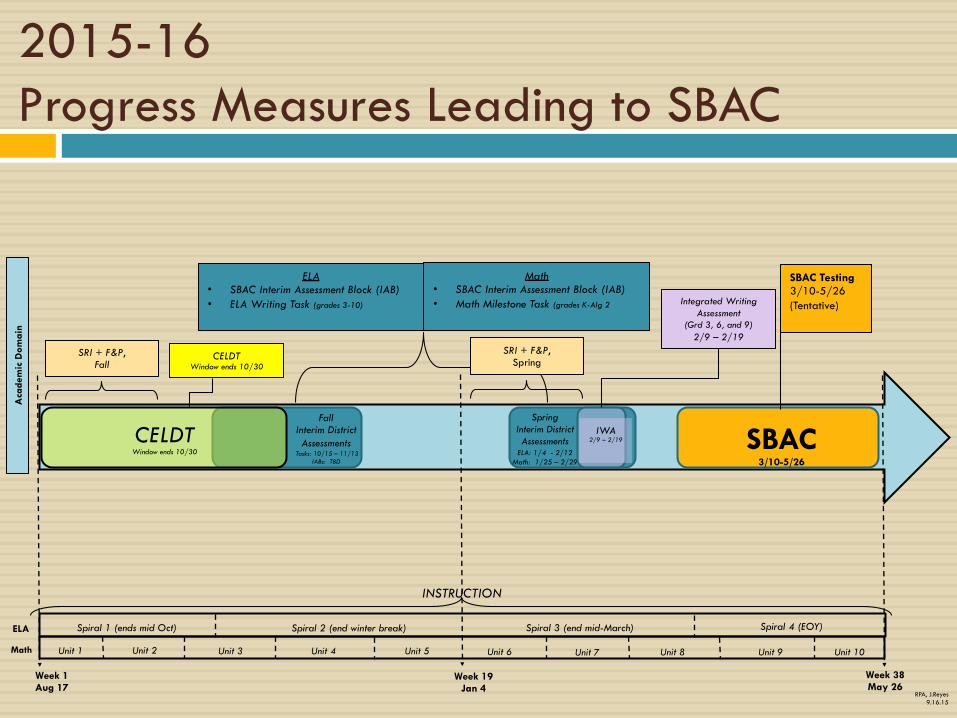
2015-16 Progress Measures Leading to SBAC
Week 1 Aug 17
Week 19 Jan 4
Week 38 May 26
SBAC Testing 3/10-5/26 (Tentative)
SBAC 3/10-5/26
Spring Interim District Assessments
ELA: 1/4 - 2/12 Math: 1/25 – 2/29
Math • SBAC Interim Assessment Block (IAB) • Math Milestone Task (grades K-Alg 2
ELA • SBAC Interim Assessment Block (IAB) • ELA Writing Task (grades 3-10)
Fall Interim District Assessments
Tasks: 10/15 – 11/13 IABs: TBD
IWA 2/9 – 2/19
Integrated Writing Assessment
(Grd 3, 6, and 9) 2/9 – 2/19
SRI + F&P, Spring
SRI + F&P, Fall
Spiral 1 (ends mid Oct) Spiral 2 (end winter break) Spiral 3 (end mid-March) Spiral 4 (EOY)
Unit 1 Unit 2 Unit 3 Unit 4 Unit 5 Unit 6 Unit 7 Unit 8 Unit 9 Unit 10
ELA
Math
INSTRUCTION
Aca
dem
ic D
omai
n
RPA, J.Reyes 9.16.15
CELDT Window ends 10/30
CELDT Window ends 10/30
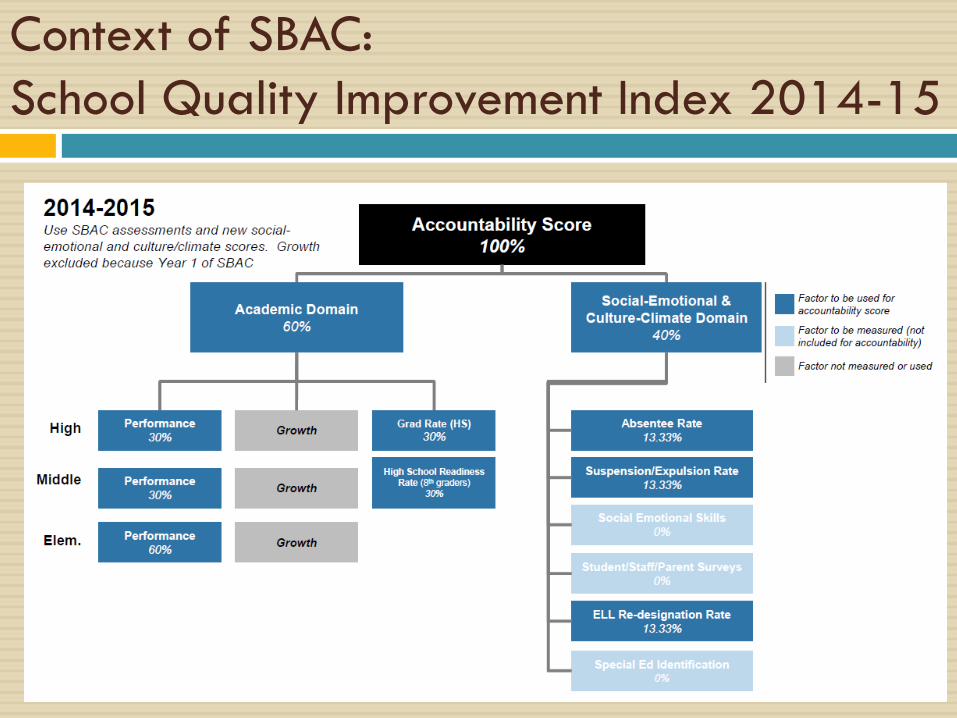
Context of SBAC: School Quality Improvement Index 2014-15