Embed Size (px)
Citation preview
Resource Stewardship, Process Improvement, and Lean Charles Wright Deputy Superintendent
January 14, 2015
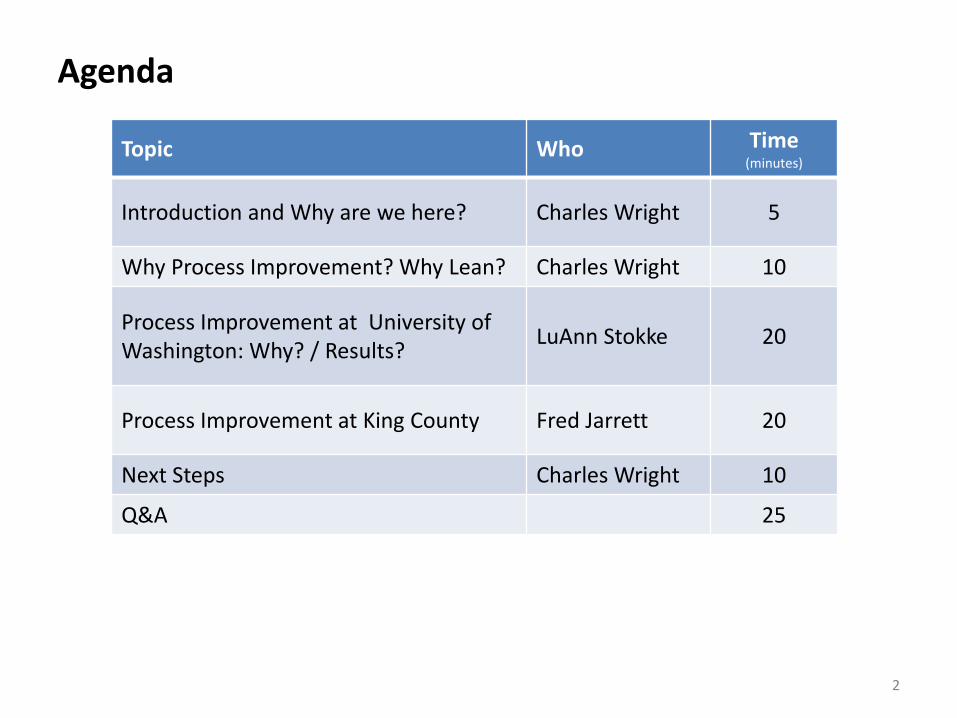
Agenda
2
Topic Who Time (minutes)
Introduction and Why are we here? Charles Wright 5
Why Process Improvement? Why Lean? Charles Wright 10
Process Improvement at University of Washington: Why? / Results?
LuAnn Stokke 20
Process Improvement at King County Fred Jarrett 20
Next Steps Charles Wright 10
Q&A 25
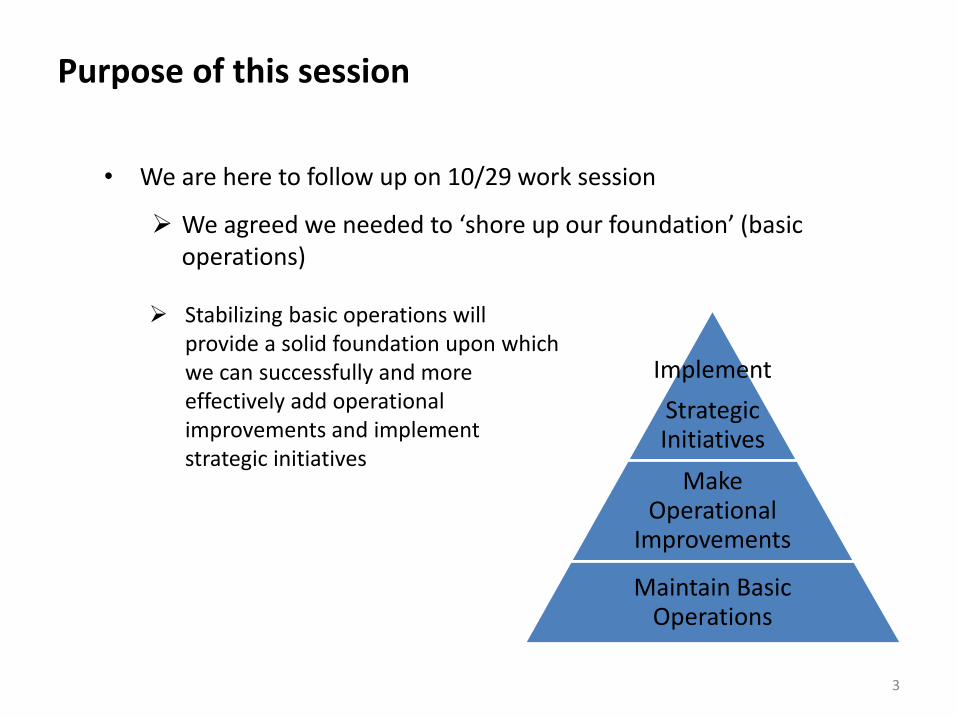
Purpose of this session
• We are here to follow up on 10/29 work session
We agreed we needed to ‘shore up our foundation’ (basic operations)
Implement
Strategic Initiatives
Make Operational
Improvements
Maintain Basic Operations
Stabilizing basic operations will provide a solid foundation upon which we can successfully and more effectively add operational improvements and implement strategic initiatives
3
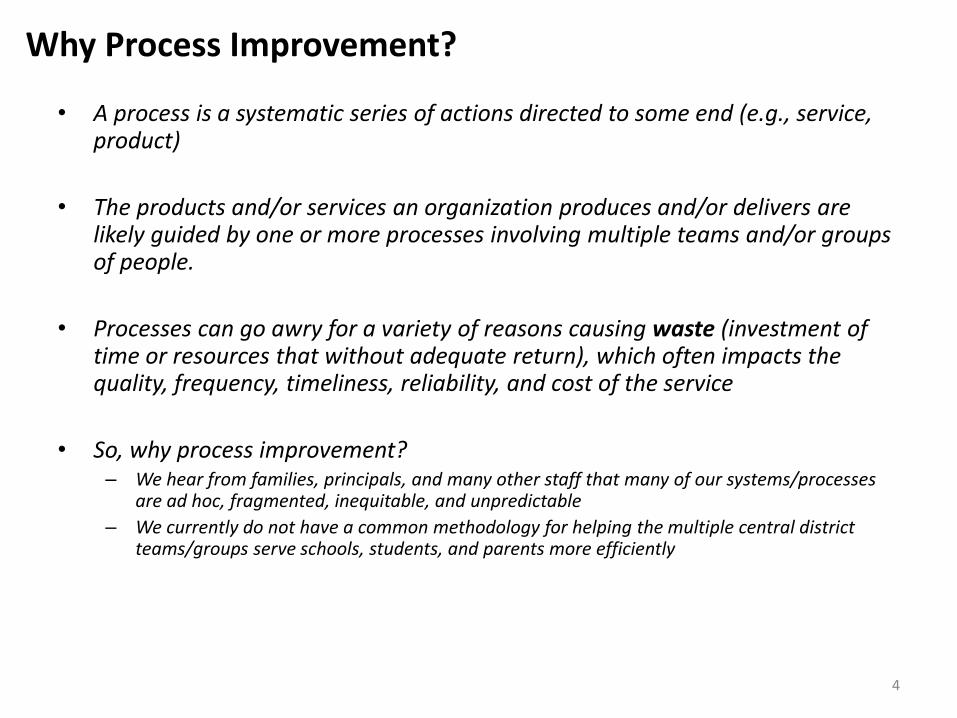
Why Process Improvement?
• A process is a systematic series of actions directed to some end (e.g., service, product)
• The products and/or services an organization produces and/or delivers are likely guided by one or more processes involving multiple teams and/or groups of people.
• Processes can go awry for a variety of reasons causing waste (investment of time or resources that without adequate return), which often impacts the quality, frequency, timeliness, reliability, and cost of the service
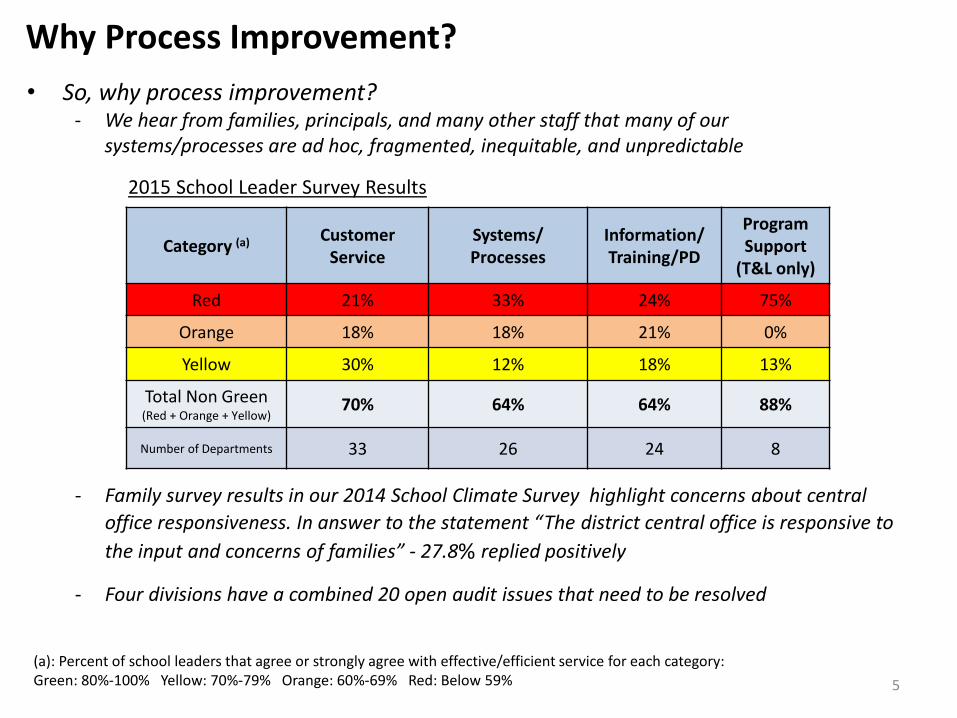
• So, why process improvement? – We hear from families, principals, and many other staff that many of our systems/processes
are ad hoc, fragmented, inequitable, and unpredictable
– We currently do not have a common methodology for helping the multiple central district teams/groups serve schools, students, and parents more efficiently
4
Why Process Improvement?
5
• So, why process improvement? - We hear from families, principals, and many other staff that many of our
systems/processes are ad hoc, fragmented, inequitable, and unpredictable
2015 School Leader Survey Results
N=127 responses
Category (a) Customer Service
Systems/ Processes
Information/ Training/PD
Program Support
(T&L only)
Red 21% 33% 24% 75%
Orange 18% 18% 21% 0%
Yellow 30% 12% 18% 13%
Total Non Green (Red + Orange + Yellow)
70% 64% 64% 88%
Number of Departments 33 26 24 8
(a): Percent of school leaders that agree or strongly agree with effective/efficient service for each category: Green: 80%-100% Yellow: 70%-79% Orange: 60%-69% Red: Below 59%
- Family survey results in our 2014 School Climate Survey highlight concerns about central
office responsiveness. In answer to the statement “The district central office is responsive to
the input and concerns of families” - 27.8% replied positively
- Four divisions have a combined 20 open audit issues that need to be resolved
What is Lean?
Lean is a methodology that allows organizations to drastically improve product and services by improving processes and monitoring everyday business activities to reduce errors in ways that increase value and minimize work, non-customer value-added tasks, and waste while increasing customer satisfaction based on idea that faster processes yield less waste, less cost, less work in process, less complexity, higher quality, and happier customers.
6
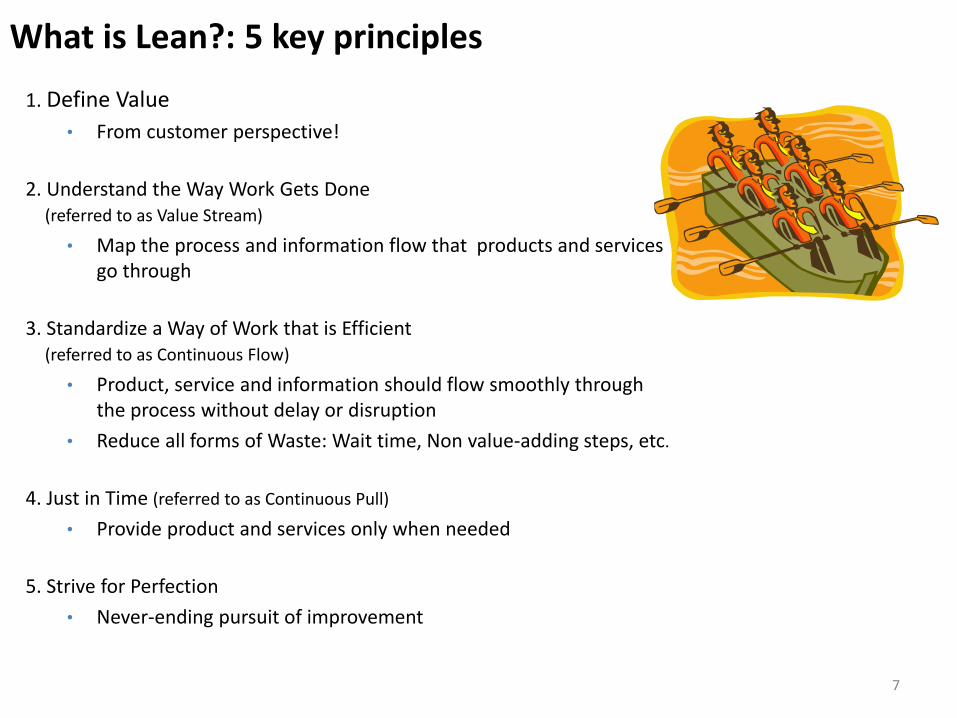
What is Lean?: 5 key principles
1. Define Value
• From customer perspective!
2. Understand the Way Work Gets Done (referred to as Value Stream)
• Map the process and information flow that products and services go through
3. Standardize a Way of Work that is Efficient (referred to as Continuous Flow)
• Product, service and information should flow smoothly through the process without delay or disruption
• Reduce all forms of Waste: Wait time, Non value-adding steps, etc.
4. Just in Time (referred to as Continuous Pull)
• Provide product and services only when needed
5. Strive for Perfection
• Never-ending pursuit of improvement
7
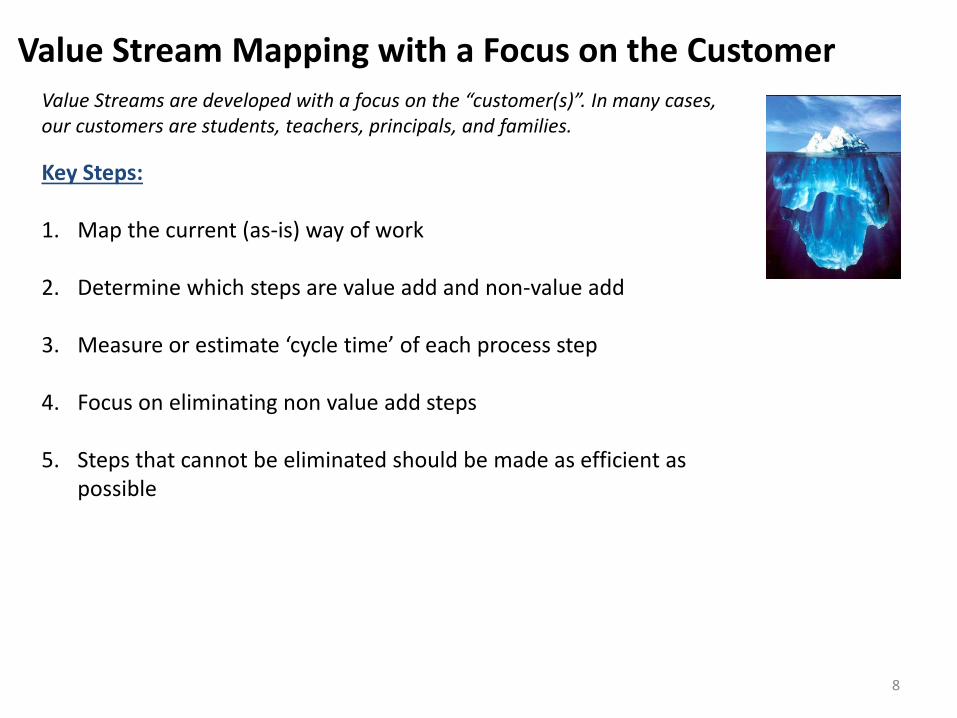
Value Stream Mapping with a Focus on the Customer
8
Key Steps: 1. Map the current (as-is) way of work
2. Determine which steps are value add and non-value add
3. Measure or estimate ‘cycle time’ of each process step
4. Focus on eliminating non value add steps
5. Steps that cannot be eliminated should be made as efficient as
possible
Value Streams are developed with a focus on the “customer(s)”. In many cases, our customers are students, teachers, principals, and families.
UNIVERSITY OF WASHINGTON
9
KING COUNTY
10
EXAMPLES FROM K-12 EDUCATION
11
12
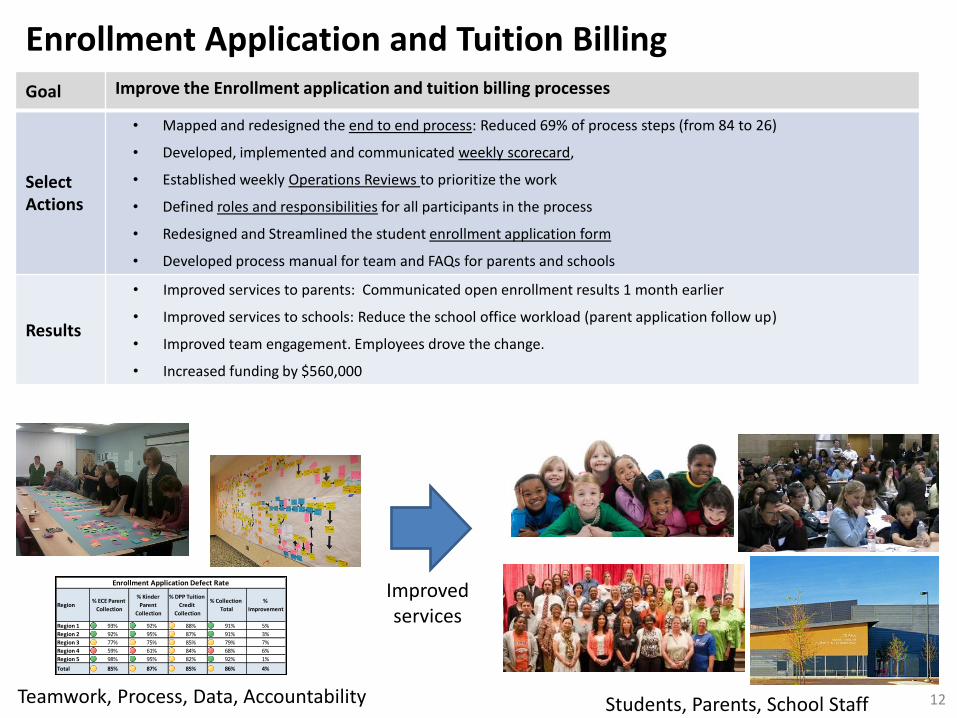
Goal Improve the Enrollment application and tuition billing processes
Select Actions
• Mapped and redesigned the end to end process: Reduced 69% of process steps (from 84 to 26)
• Developed, implemented and communicated weekly scorecard,
• Established weekly Operations Reviews to prioritize the work
• Defined roles and responsibilities for all participants in the process
• Redesigned and Streamlined the student enrollment application form
• Developed process manual for team and FAQs for parents and schools
Results
• Improved services to parents: Communicated open enrollment results 1 month earlier
• Improved services to schools: Reduce the school office workload (parent application follow up)
• Improved team engagement. Employees drove the change.
• Increased funding by $560,000
Region% ECE Parent
Collection
% Kinder
Parent
Collection
% DPP Tuition
Credit
Collection
% Collection
Total
%
Improvement
Region 1 93% 92% 88% 91% 5%
Region 2 92% 95% 87% 91% 3%
Region 3 77% 75% 85% 79% 7%
Region 4 59% 61% 84% 68% 6%
Region 5 98% 95% 82% 92% 1%
Total 85% 87% 85% 86% 4%
Enrollment Application Defect Rate
Teamwork, Process, Data, Accountability
Improved services
Students, Parents, School Staff
Enrollment Application and Tuition Billing
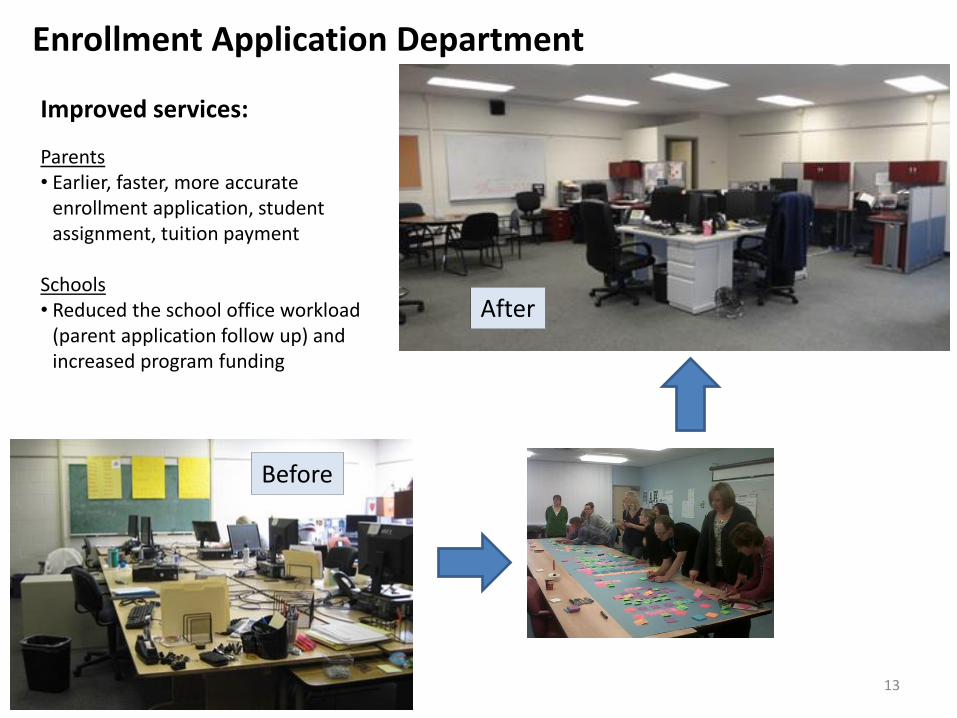
Enrollment Application Department
Improved services:
Parents • Earlier, faster, more accurate
enrollment application, student assignment, tuition payment
Schools • Reduced the school office workload
(parent application follow up) and increased program funding
Before
After
13
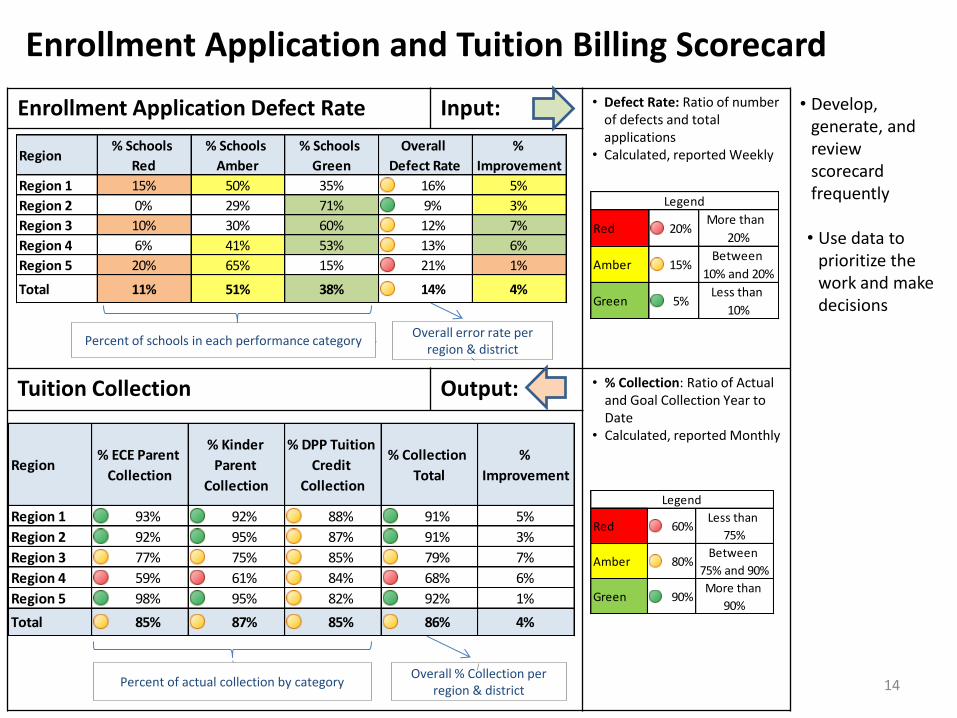
Enrollment Application Defect Rate Input: • Defect Rate: Ratio of number of defects and total applications
• Calculated, reported Weekly
Tuition Collection Output: • % Collection: Ratio of Actual and Goal Collection Year to Date
• Calculated, reported Monthly
Percent of schools in each performance category Overall error rate per
region & district
Percent of actual collection by category
Enrollment Application and Tuition Billing Scorecard
Overall % Collection per region & district
Red 20%More than
20%
Amber 15%Between
10% and 20%
Green 5%Less than
10%
Legend
• Develop, generate, and review scorecard frequently • Use data to
prioritize the work and make decisions
Red 60%Less than
75%
Amber 80%Between
75% and 90%
Green 90%More than
90%
Legend
Region% ECE Parent
Collection
% Kinder
Parent
Collection
% DPP Tuition
Credit
Collection
% Collection
Total
%
Improvement
Region 1 93% 92% 88% 91% 5%
Region 2 92% 95% 87% 91% 3%
Region 3 77% 75% 85% 79% 7%
Region 4 59% 61% 84% 68% 6%
Region 5 98% 95% 82% 92% 1%
Total 85% 87% 85% 86% 4%
Region% Schools
Red
% Schools
Amber
% Schools
Green
Overall
Defect Rate
%
Improvement
Region 1 15% 50% 35% 16% 5%
Region 2 0% 29% 71% 9% 3%
Region 3 10% 30% 60% 12% 7%
Region 4 6% 41% 53% 13% 6%
Region 5 20% 65% 15% 21% 1%
Total 11% 51% 38% 14% 4%
14
Summary
• We believe that process improvement is essential to our ability to enable district staff to serve every student in every classroom with the right services and supports on a daily basis. It will be a key component of our Strategic Plan Goal 2: Improving Systems Districtwide to Meet Students Needs and Improve Academic Outcomes and shoring up our basic operations
• We believe Lean is a methodology that is proven to empower employees to improve services for their customers
• We believe that Lean would help us improve services to our families
• There is a strong Lean community of practice in King County and at the State level that we can learn from as we begin our journey. There is also an emerging K-12 education process improvement initiative led by the American Society for Quality
• We believe school board member understanding and support is critical to the long-term success of the district’s process improvement efforts
15


