Embed Size (px)
Citation preview
2016 Annual Statistical Bulletin
For further enquires and comments, please contact us at:
E-mail: [email protected] Website: www.nnpcgroup.com
This publication presents information on the oil and
gas industry. Its content reflects individual as well as
general analysis and trend of activities that
characterized the industry within the country for the
year 2016. Although NNPC endeavours to ensure
accuracy of information in these documents, it
cannot guarantee 100% accuracy nor can it be held
liable for errors that may occur. Users are to note
that use of any information herein is purely at their
discretion.
DIS
CL
AIM
ER
NNPC ASB 2016– 1st Edition i
TABLE OF CONTENTS Page No
Report and Analysis .. .. .. .. .. .. …………………………………. .. .. .. .. …………………………………………………………………………… iii
List of Tables Table 1: Proven Crude Oil and Natural Gas Reserves……………………………………………………………………… 1
Table 2.0 : Seismic Activities …………………………. .. .. .. .. .. .. .. .. .. .. .. .. .. .. .. .. .. .. .. .. .. .. ………………... 1 Table 2.01 : Drilling Summary by Company .. .. .. .. .. .. .. .. .. .. .. .. .... ... ... ... ……………………………………. 1
Table 3.0 : Summary of Crude Oil Field Production by Companies... … ... ... … … .. ... ………………………… 2 Table 3.01 : Monthly Crude Oil Field Production By Companies. …. ……... .. .. ……………...……………………..3 Table 4.0 : Terminal Crude Oil Production ……. .. .. .. .. … … … .. … … .. .. ………………………………………. 4
Table 4.01 : Monthly Terminal Crude Oil Production by Companies .. .. .. .. .. .. .. .. … ……………………….. 5 Table 4.02 : Monthly Terminal Crude Oil Production by Streams … … … …. ………………………………………. 6 Table 5.0 : 10 – Year Crude Oil Production by Companies … … … … … … . ………………………………………. 7
Table 5.01 : 10– Year Monthly Crude Oil Production ……… … … … … …… ………………………………………. 8 Table 5.02 : 10 – Year Crude Oil Production by Regime … … … … … … … .. ………………………………………. 8
Table 6 : Crude Oil Lifting (Domestic & Export) .. … … … … … … … … ………………………………………………. 9 Table 7 : Crude Oil Exports by Destination ... … … … … … … … …………………………………………………….. 10 Table 8 : Crude Oil Lifting by Accounts Types … … … … … … … … … ……………………………………………….. 11
Table 9 : 10 – Year Crude Oil Export … … … … … … … … … … … … …………………………………………………... 11 Table 10 : 10 – Year Crude Oil Delivery to local Refineries… … … … … ... …………………………………….. 12
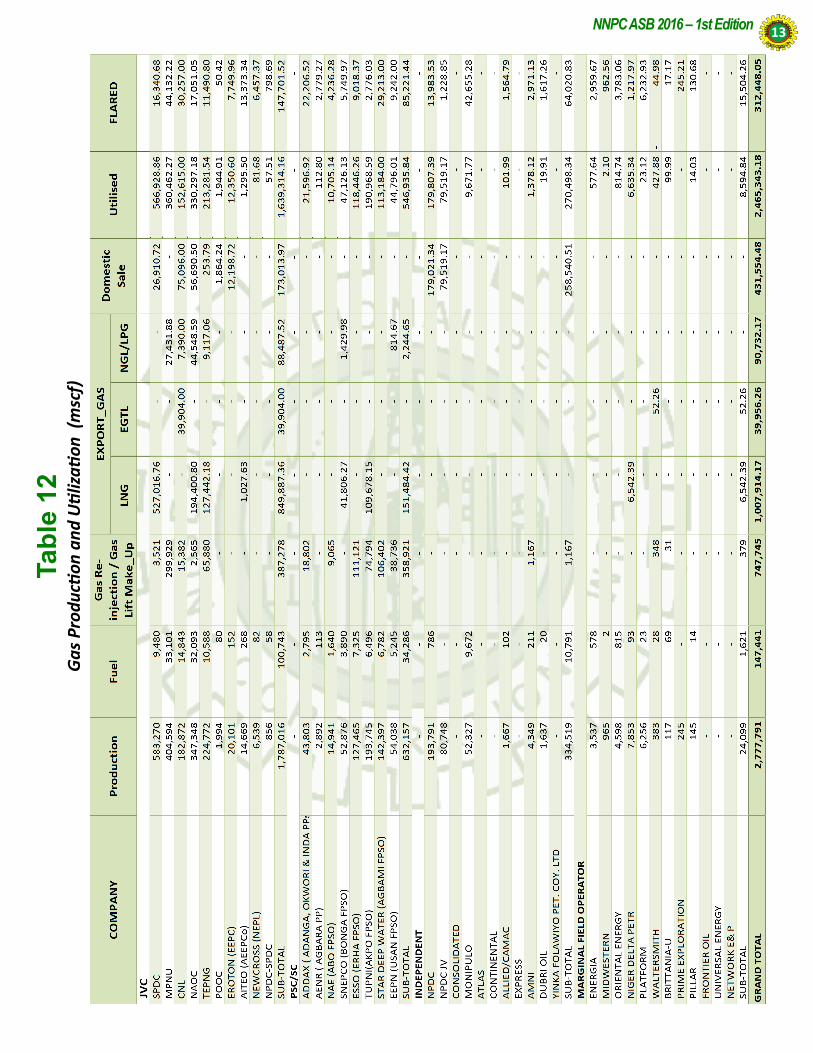
Table 11 : 10 – Year Crude Oil Export by Region … … … … … … … … … ……………………………………………... 12 Table 12 : Gas Production and Utilization … … … … … … … … … … … ………………………………………………... 13 Table 13.0: Monthly Gas Production verse Flared … … … … ……………………………………………………………… 14
Table 13.01: 10 – Year Gas Production and Utilization … … … … … … … ………………………………………………. 15 Table 14:0 National Natural Gas Liquid (NGL) Production and Export… … ... ... … ……………… ………….. 15 Table 14.01: Mobile Natural Gas Liquid (NGL) Production and Export… … ... ... … … ……………………….. 16
Table 14.02: Chevron Natural Gas Liquid (NGL) Production and Export… … ... ... … ... ……………………….. 16 Table 14.03 : NLNG Natural Gas Liquid (NGL) Production and Export… … ... ... … ………………………………. 17
Table 15.0 : Quarterly Domestic Refining Crude Oil Balance … … … … … ……………………………………………. 18 Table 15.01 : Domestic Refining Crude Oil Balance ... ... ... ... … … … … …… ………………………………………... 18 Table 15.02 : Monthly Domestic Refining Crude Oil Receipt ... ... ... ... .… … … … … … … ………………………. 19
Table 15.03 : Domestic Refining Crude Oil Processed ... … … … … … ... … … ………………………………... ... 19
Table 15.04 : 10 –Year Domestic Crude Oil Refining … … … … … … … … … … …………………………………….. 19
Table 16.0 : Domestic Refining Capacity Utilization (%) ... ... ... … … … … … ……………………………………... 20
Table 16.01 : 10 –Year Domestic Refining Capacity Utilization (%)… … … … … …………………………………….. 20
Table 17.0 : Monthly Domestic Product Yield ... ... ... ... … ... … … … … … … ……………………………………….. 20
Table 17.01 : 10 –Year Domestic Major Product Yield ... ... ... … … … … … … ………………………………………. 20
Table 18.0 : Domestic Production and Evacuation ... … … … … … … … … … ... ……………………………………... 21
Table 19.0 : Domestic Refining Fuel and Loss Statistics ... .. .. .. .. … … … … ……………………………………... 21
Table 20.0 : Petroleum Products Distribution by NNPC Retail Ltd… … … … ………………………………………... 21
Table 20.01 : Petroleum Products Distribution by Zones ... ... .… … … … … … ……………………………………... 22
Table 20.02 : 10 – Year Average Daily Petroleum Product Distribution … … … … ……………………………….. 22
Table 21.0 : PPMC Products Sales.. .. … … … … … … … … … … … … … ………………………………………………... 22
Table 21.01 : 10 – Year PPMC Products Sales ... ... ... ... ... … … … … … … …………………………………………….. 23
Table 22.0 : 10 – Year PPMC Products Import … … ... ... ... ... .... ... ... … … ... ……………………………………. 23
Table 23.0 : PPMC’s Products Export ... .. .. ... .. .. .. .. .. .. ... … … … … … … …………………………………….. 23
Table 23.01 : 10 – Year PPMC’s Products Exports ... ... ... ... … … … … … … ………………………………………... 23
Table 24 : 10 – Year Pipeline Products Loss ... ... ... ... ... ... ... ... ... ... … … ………………………………………. 24
Table 25: 10 – Year Pipeline Incidences ... ... ... ... ... ... ... … … … … … … ... ……………………………………... 24
Table 26 : 10 – Year Fire Out-Break Incidences … … … … … … … … … … ... ……………………………………… 24
Table 27: 5 – Year Pipeline Crude Oil Loss … … … … … … … … … … … ………………………………………………. 24
Petroleum Products Distribution Zones in Nigeria … … … … … … …………………………………….. 25
Glossary of Terms and Abbreviations … … … … … … … … … … … …………………………………….. 26
NNPC ASB 2016 – 1st Edition ii
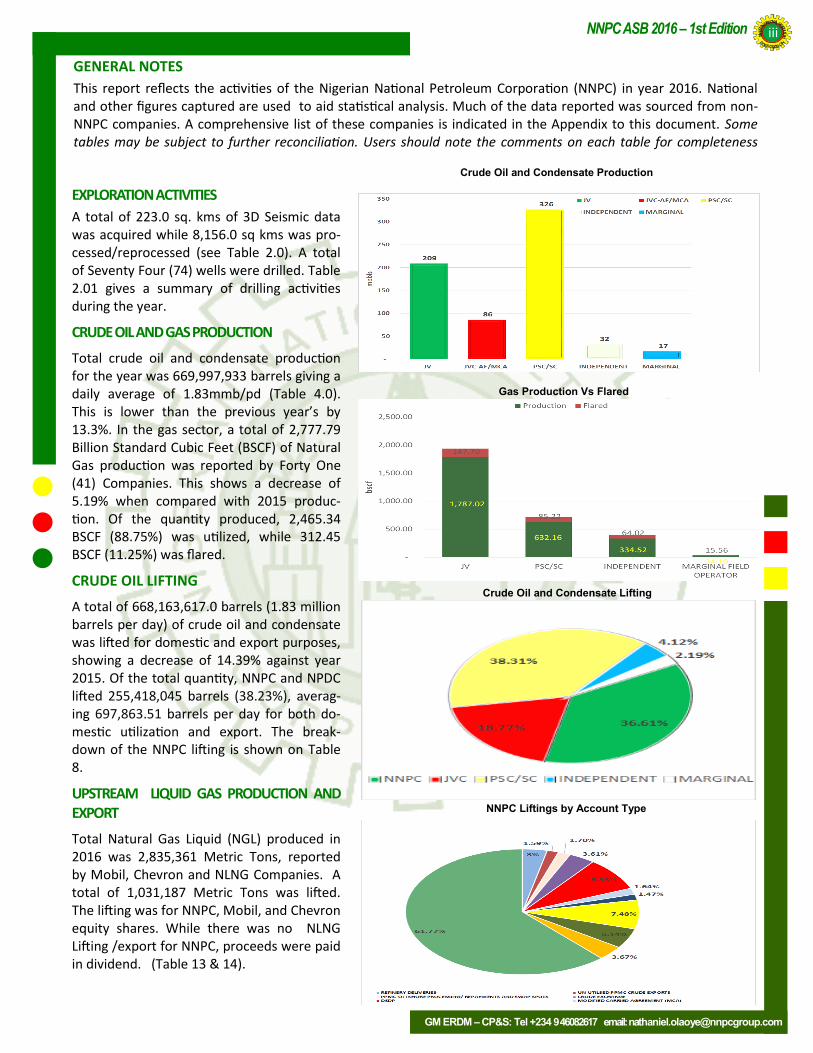
EXPLORATION ACTIVITIES
A total of 223.0 sq. kms of 3D Seismic data was acquired while 8,156.0 sq kms was pro-cessed/reprocessed (see Table 2.0). A total of Seventy Four (74) wells were drilled. Table 2.01 gives a summary of drilling activities during the year.
CRUDE OIL AND GAS PRODUCTION
Total crude oil and condensate production for the year was 669,997,933 barrels giving a daily average of 1.83mmb/pd (Table 4.0). This is lower than the previous year’s by 13.3%. In the gas sector, a total of 2,777.79 Billion Standard Cubic Feet (BSCF) of Natural Gas production was reported by Forty One (41) Companies. This shows a decrease of 5.19% when compared with 2015 produc-tion. Of the quantity produced, 2,465.34 BSCF (88.75%) was utilized, while 312.45 BSCF (11.25%) was flared.
CRUDE OIL LIFTING
A total of 668,163,617.0 barrels (1.83 million barrels per day) of crude oil and condensate was lifted for domestic and export purposes, showing a decrease of 14.39% against year 2015. Of the total quantity, NNPC and NPDC lifted 255,418,045 barrels (38.23%), averag-ing 697,863.51 barrels per day for both do-mestic utilization and export. The break-down of the NNPC lifting is shown on Table 8.
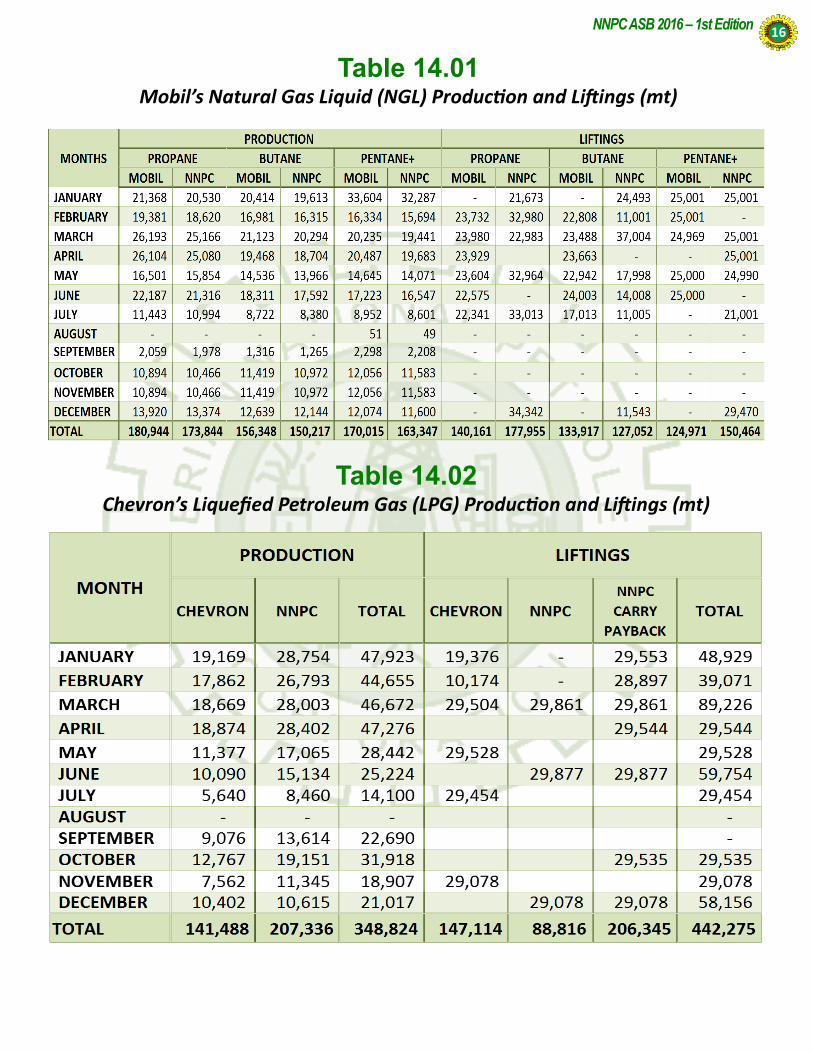
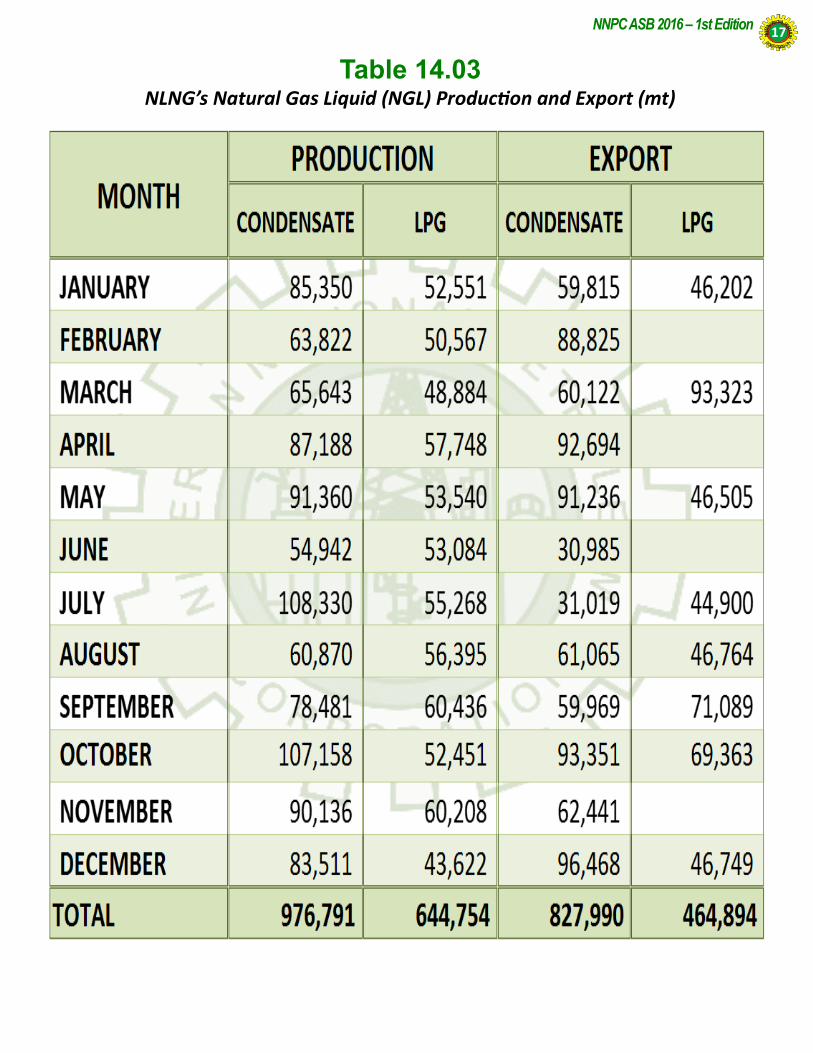
UPSTREAM LIQUID GAS PRODUCTION AND EXPORT
Total Natural Gas Liquid (NGL) produced in 2016 was 2,835,361 Metric Tons, reported by Mobil, Chevron and NLNG Companies. A total of 1,031,187 Metric Tons was lifted. The lifting was for NNPC, Mobil, and Chevron equity shares. While there was no NLNG Lifting /export for NNPC, proceeds were paid in dividend. (Table 13 & 14).
GENERAL NOTES
This report reflects the activities of the Nigerian National Petroleum Corporation (NNPC) in year 2016. National and other figures captured are used to aid statistical analysis. Much of the data reported was sourced from non-NNPC companies. A comprehensive list of these companies is indicated in the Appendix to this document. Some tables may be subject to further reconciliation. Users should note the comments on each table for completeness
Crude Oil and Condensate Production
Crude Oil and Condensate Lifting
NNPC Liftings by Account Type
NNPC ASB 2016 – 1st Edition iii
GM ERDM – CP&S: Tel +234 9 46082617 email: [email protected]
Gas Production Vs Flared
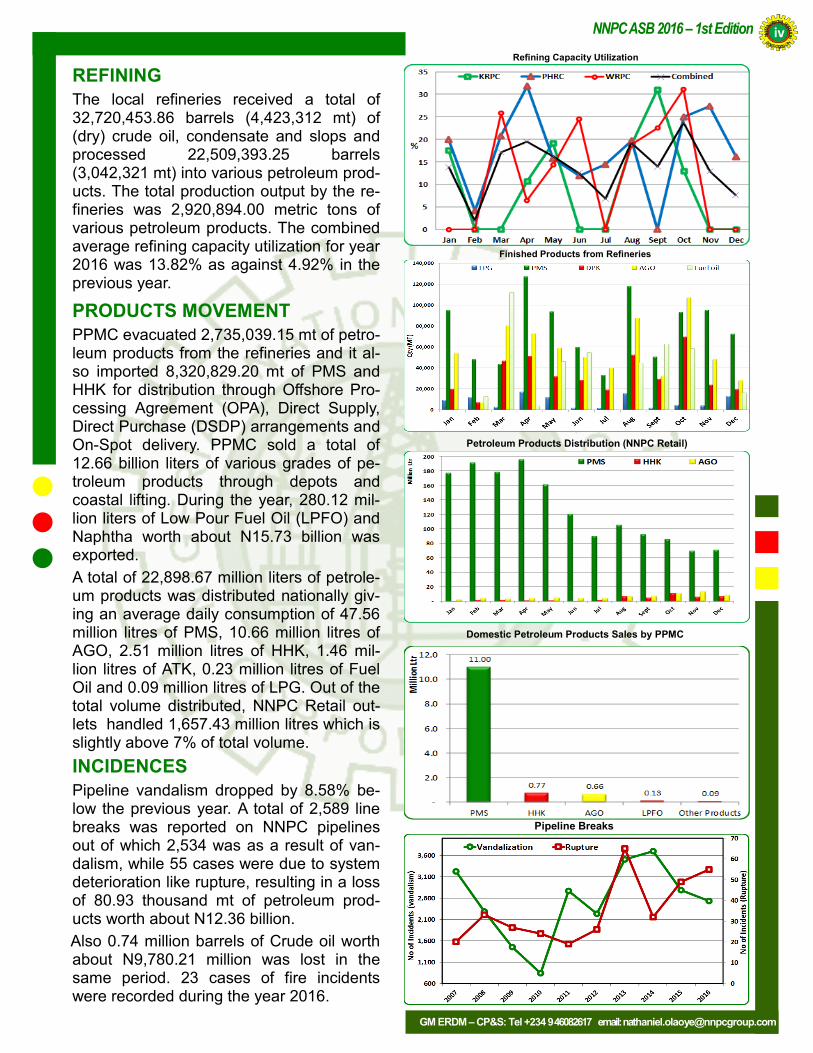
REFINING The local refineries received a total of
32,720,453.86 barrels (4,423,312 mt) of (dry) crude oil, condensate and slops and processed 22,509,393.25 barrels (3,042,321 mt) into various petroleum prod-ucts. The total production output by the re-fineries was 2,920,894.00 metric tons of various petroleum products. The combined average refining capacity utilization for year 2016 was 13.82% as against 4.92% in the previous year.
PRODUCTS MOVEMENT
PPMC evacuated 2,735,039.15 mt of petro-leum products from the refineries and it al-so imported 8,320,829.20 mt of PMS and HHK for distribution through Offshore Pro-cessing Agreement (OPA), Direct Supply, Direct Purchase (DSDP) arrangements and On-Spot delivery. PPMC sold a total of 12.66 billion liters of various grades of pe-troleum products through depots and coastal lifting. During the year, 280.12 mil-lion liters of Low Pour Fuel Oil (LPFO) and Naphtha worth about N15.73 billion was exported.
A total of 22,898.67 million liters of petrole-um products was distributed nationally giv-ing an average daily consumption of 47.56 million litres of PMS, 10.66 million litres of AGO, 2.51 million litres of HHK, 1.46 mil-lion litres of ATK, 0.23 million litres of Fuel Oil and 0.09 million litres of LPG. Out of the total volume distributed, NNPC Retail out-lets handled 1,657.43 million litres which is slightly above 7% of total volume.
INCIDENCES
Pipeline vandalism dropped by 8.58% be-low the previous year. A total of 2,589 line breaks was reported on NNPC pipelines out of which 2,534 was as a result of van-dalism, while 55 cases were due to system deterioration like rupture, resulting in a loss of 80.93 thousand mt of petroleum prod-ucts worth about N12.36 billion.
Also 0.74 million barrels of Crude oil worth about N9,780.21 million was lost in the same period. 23 cases of fire incidents were recorded during the year 2016.
Refining Capacity Utilization
Finished Products from Refineries
Pipeline Breaks
Petroleum Products Distribution (NNPC Retail)
Domestic Petroleum Products Sales by PPMC
NNPC ASB 2016 – 1st Edition iv
GM ERDM – CP&S: Tel +234 9 46082617 email: [email protected]
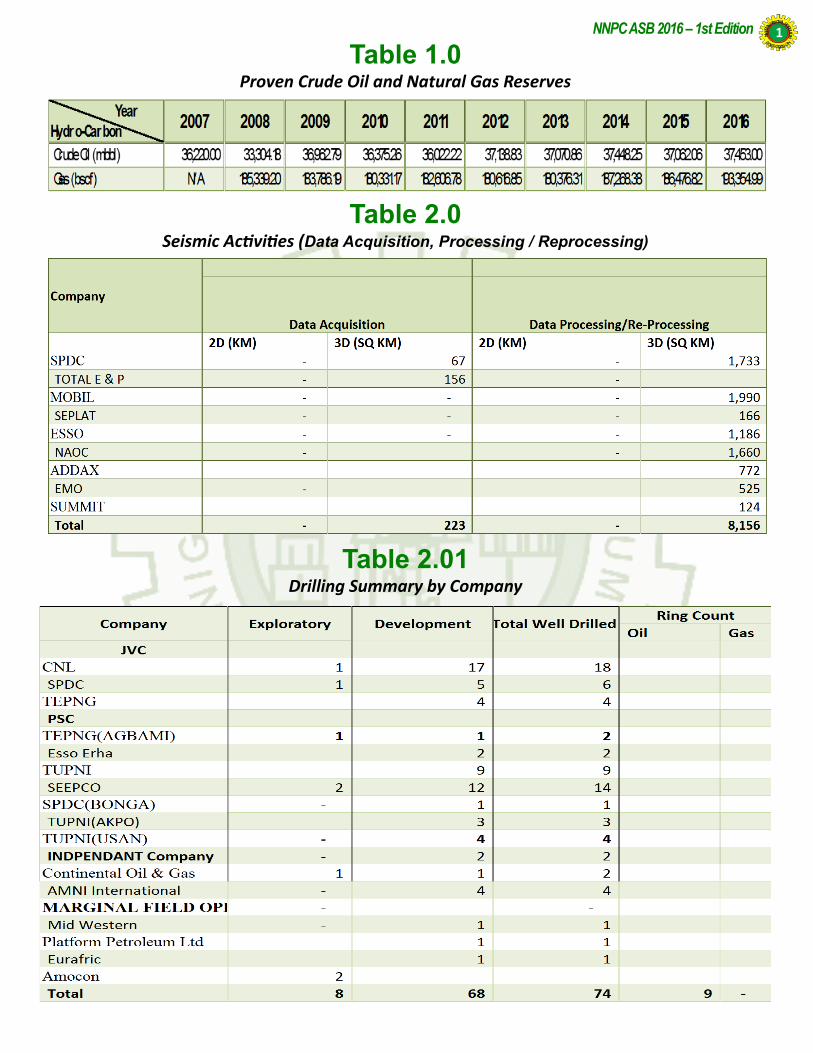
Table 1.0 Proven Crude Oil and Natural Gas Reserves
NNPC ASB 2016 – 1st Edition 1
Table 2.01 Drilling Summary by Company
FIGURES WERE NOT AVAILABLE AS AT THE TIME OF THIS REPORT
Table 2.0 Seismic Activities (Data Acquisition, Processing / Reprocessing)
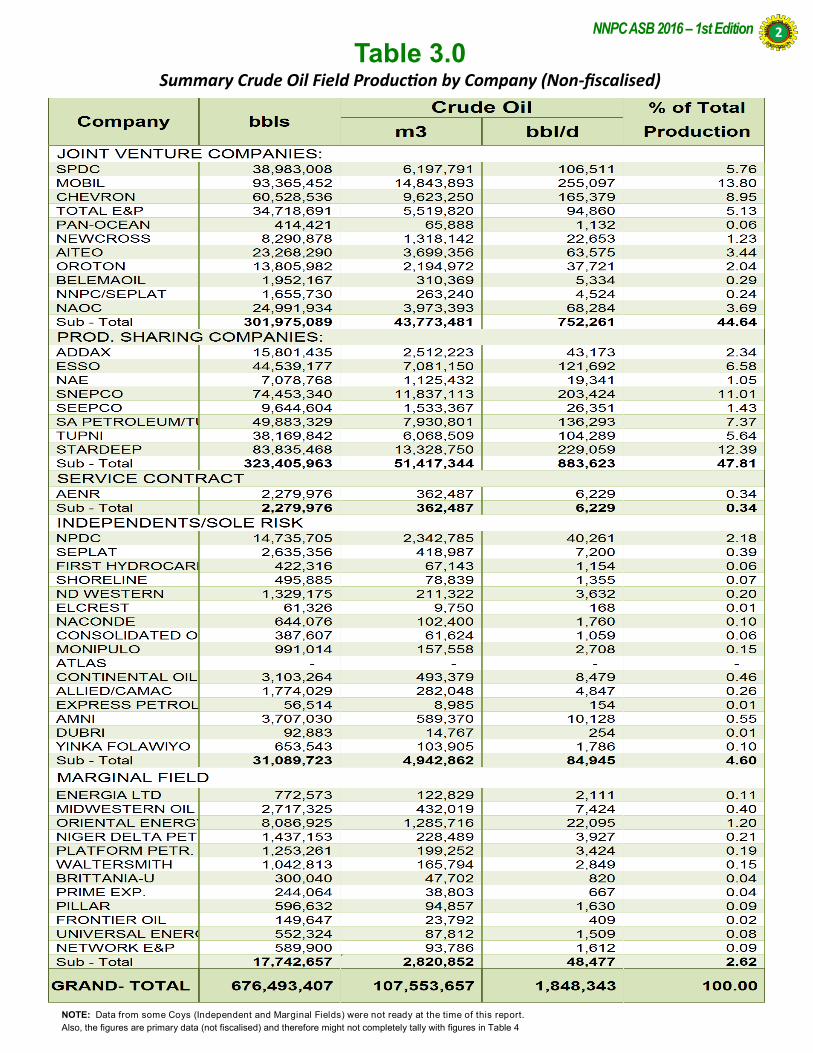
Table 3.0 Summary Crude Oil Field Production by Company (Non-fiscalised)
NNPC ASB 2016 – 1st Edition 2
NOTE: Data from some Coys (Independent and Marginal Fields) were not ready at the time of this report.
Also, the figures are primary data (not fiscalised) and therefore might not completely tally with figures in Table 4
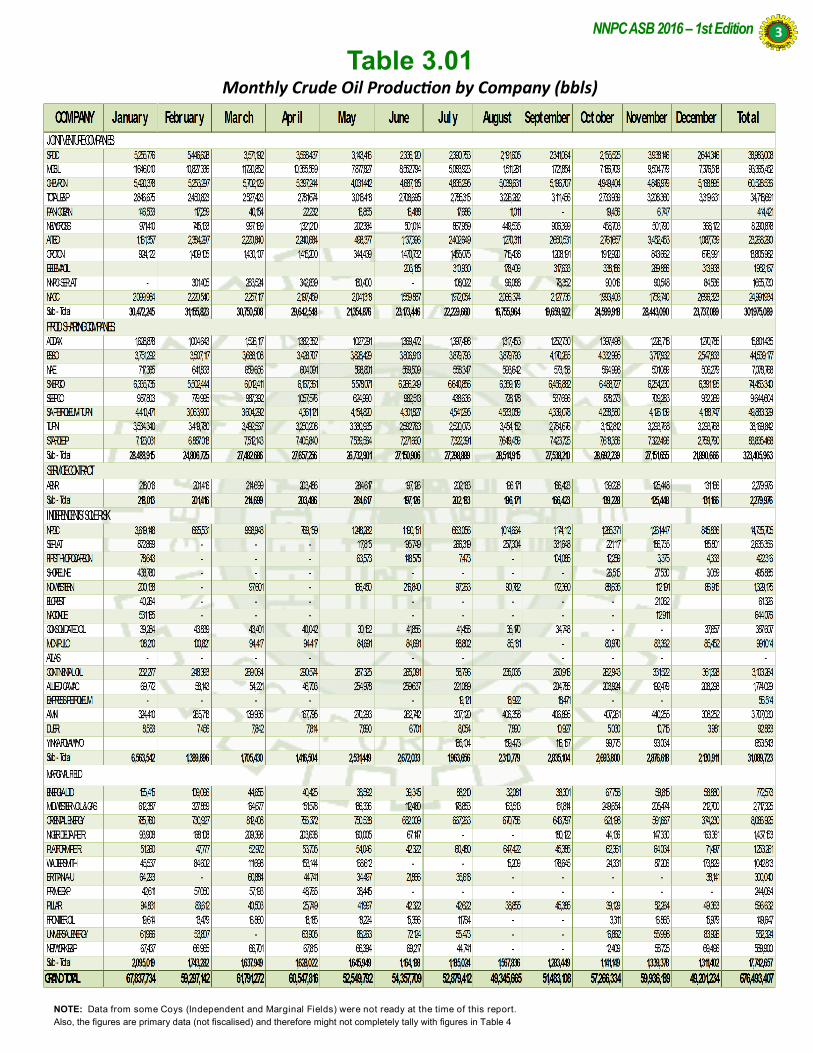
Table 3.01 Monthly Crude Oil Production by Company (bbls)
NNPC ASB 2016 – 1st Edition 3
NOTE: Data from some Coys (Independent and Marginal Fields) were not ready at the time of this report.
Also, the figures are primary data (not fiscalised) and therefore might not completely tally with figures in Table 4
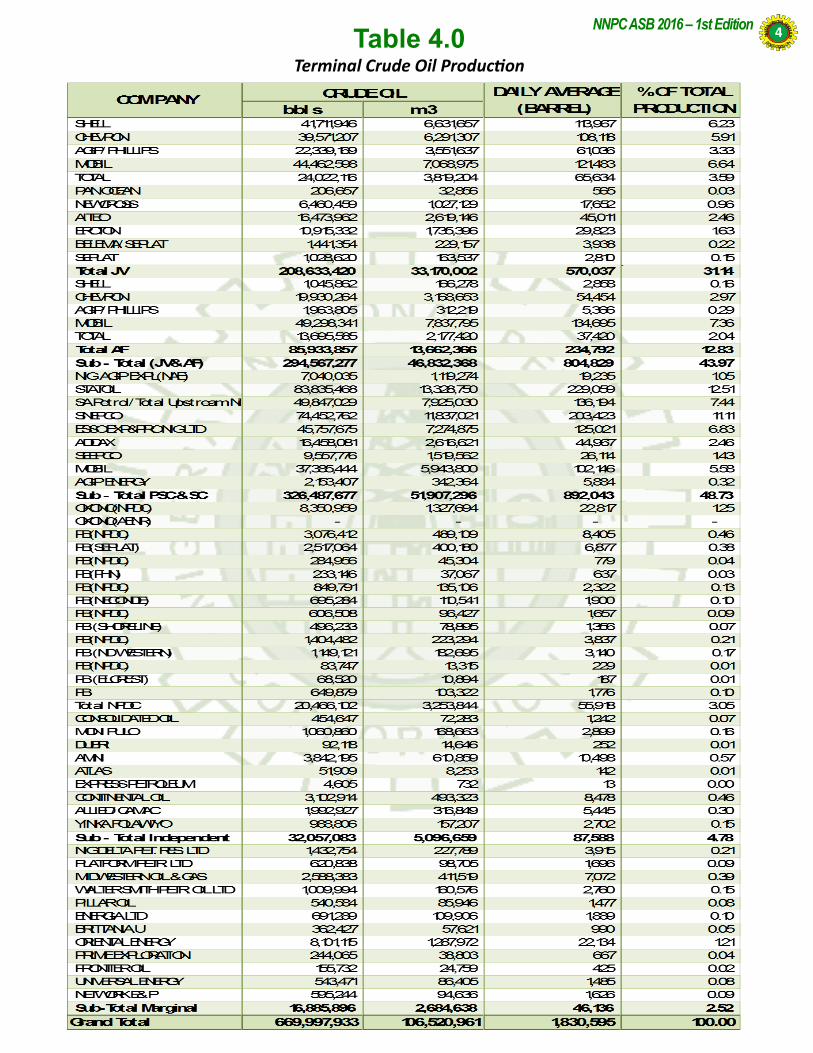
Table 4.0 Terminal Crude Oil Production
NNPC ASB 2016 – 1st Edition 4
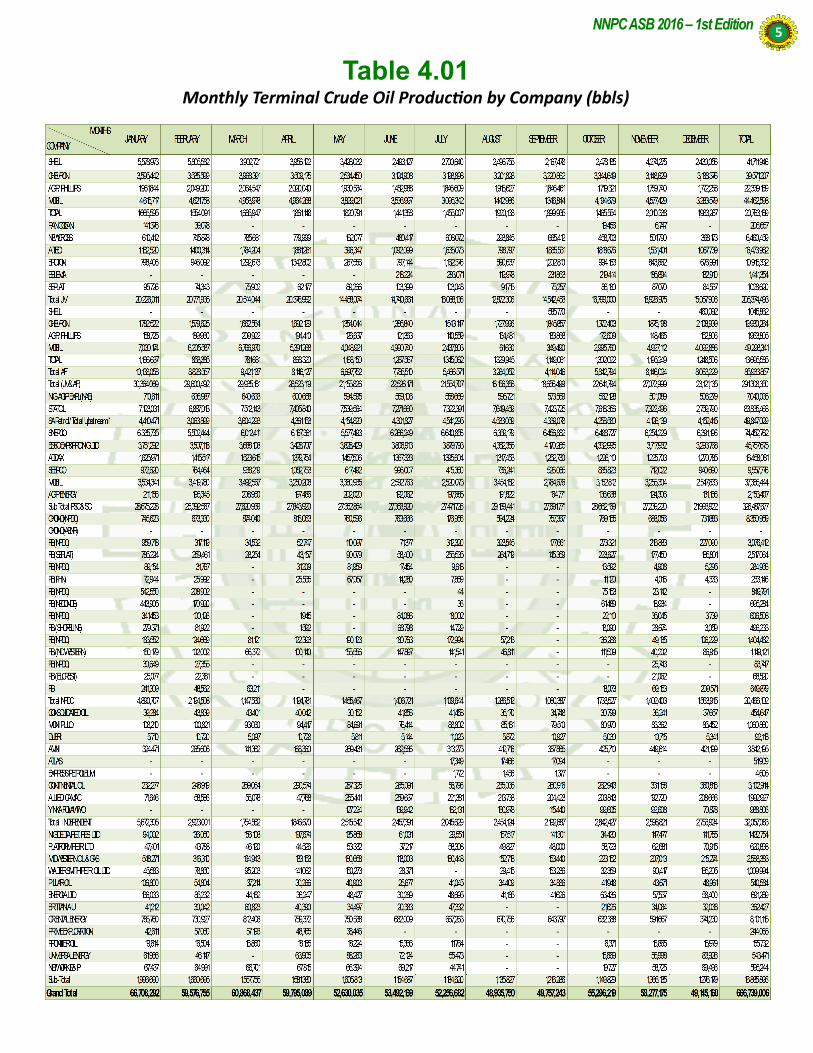
Table 4.01 Monthly Terminal Crude Oil Production by Company (bbls)
NNPC ASB 2016 – 1st Edition 5
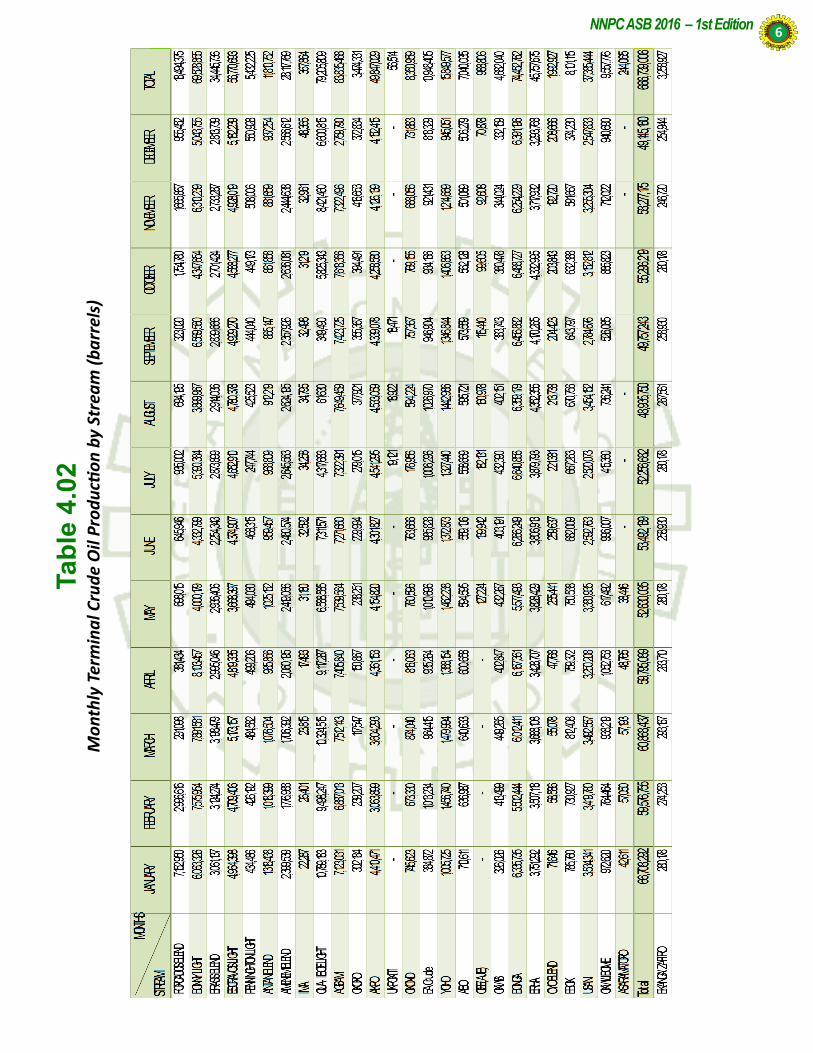
Tab
le 4
.02
Mo
nth
ly T
erm
ina
l Cru
de
Oil
Pro
du
ctio
n b
y St
rea
m (
ba
rrel
s)
NNPC ASB 2016 – 1st Edition 6
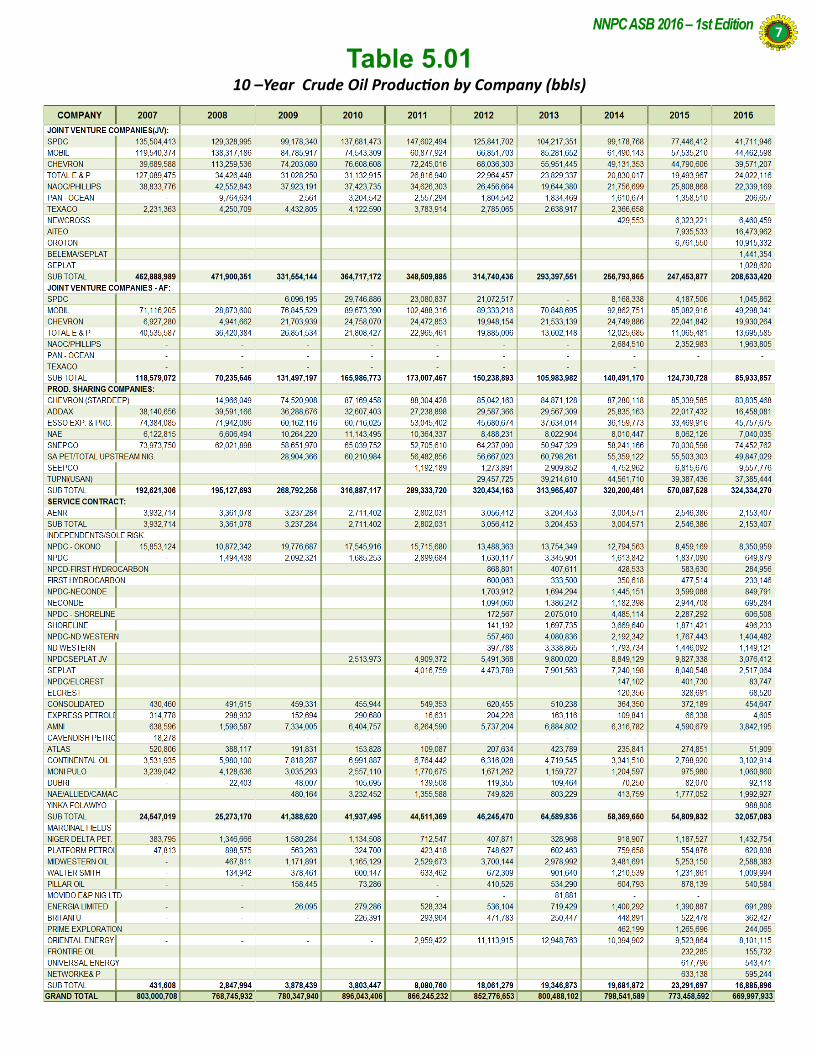
Table 5.01 10 –Year Crude Oil Production by Company (bbls)
NNPC ASB 2016 – 1st Edition 7

Table 5.02 10 –Year Monthly Crude Oil Production (bbls)
Table 5.03 10–Year Crude Oil Production by Regime (bbls)
NNPC ASB 2016 – 1st Edition 8
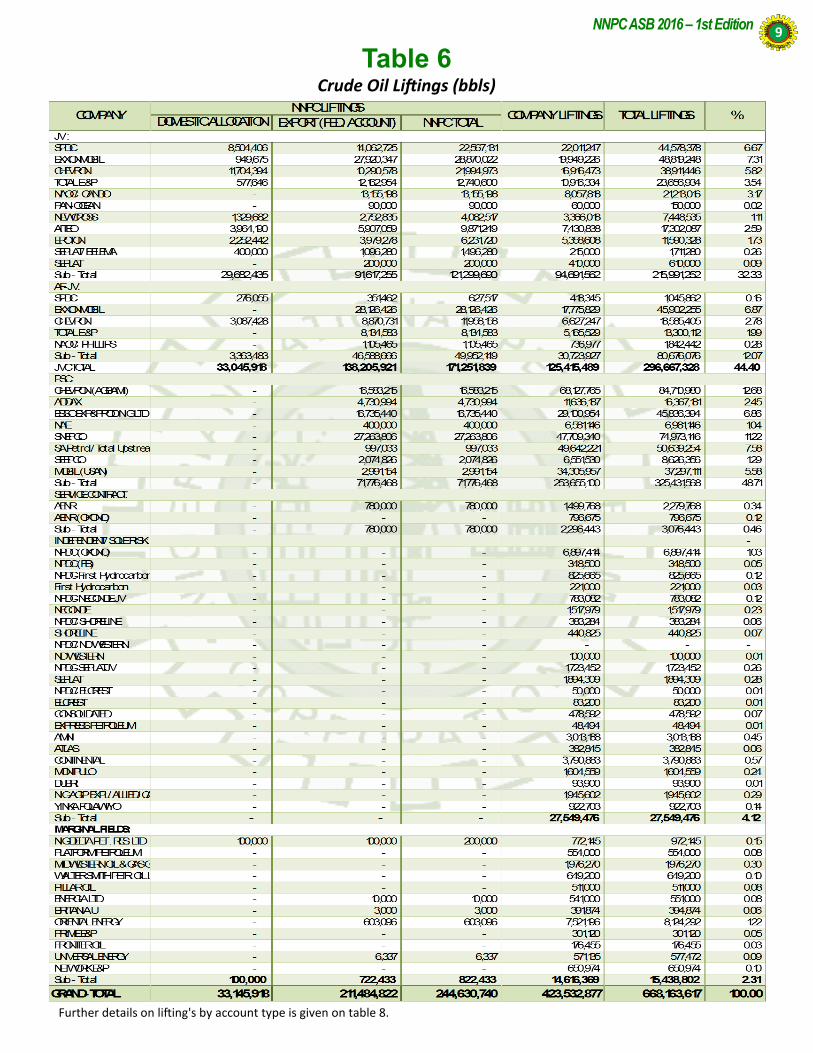
Table 6 Crude Oil Liftings (bbls)
NNPC ASB 2016 – 1st Edition 9
Further details on lifting's by account type is given on table 8.
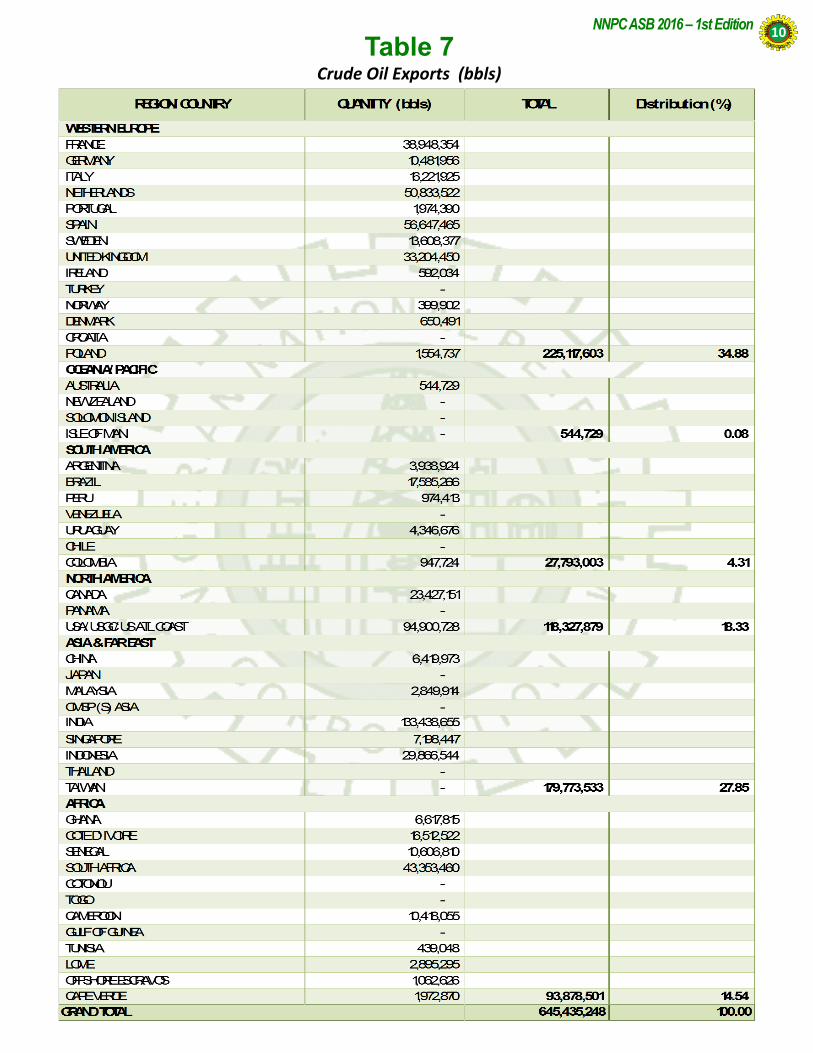
Table 7 Crude Oil Exports (bbls)
NNPC ASB 2016 – 1st Edition 10
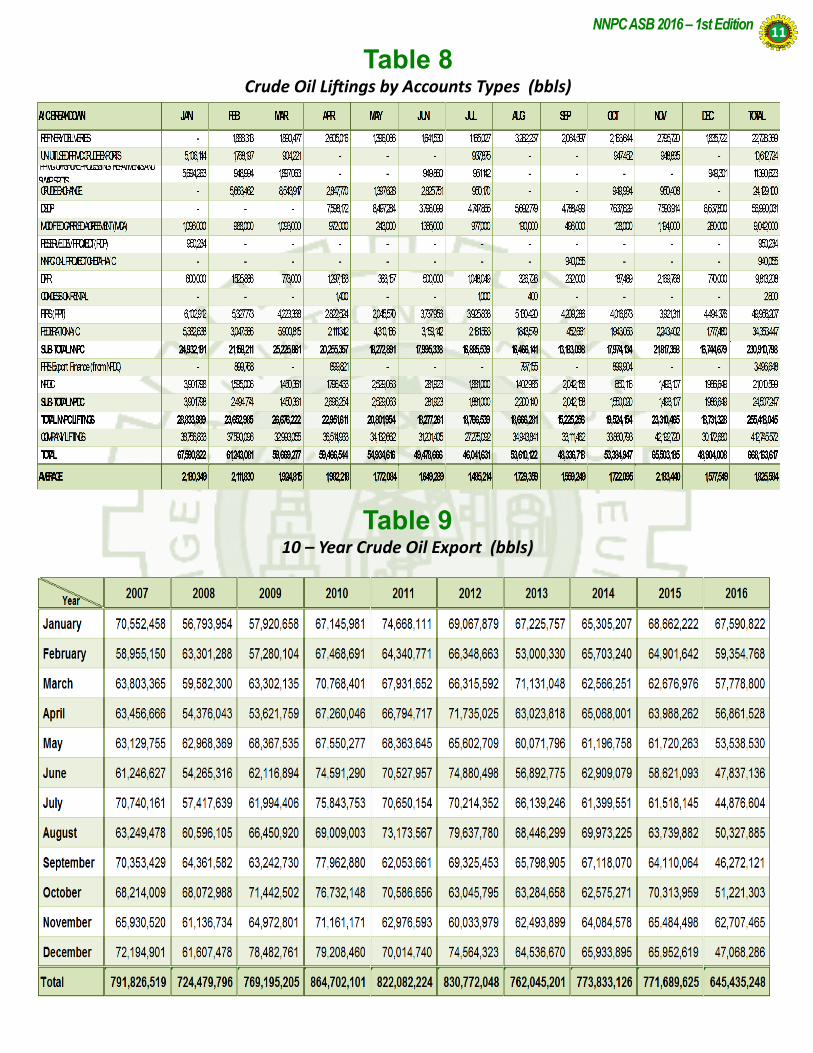
Table 8 Crude Oil Liftings by Accounts Types (bbls)
Table 9 10 – Year Crude Oil Export (bbls)
NNPC ASB 2016 – 1st Edition 11
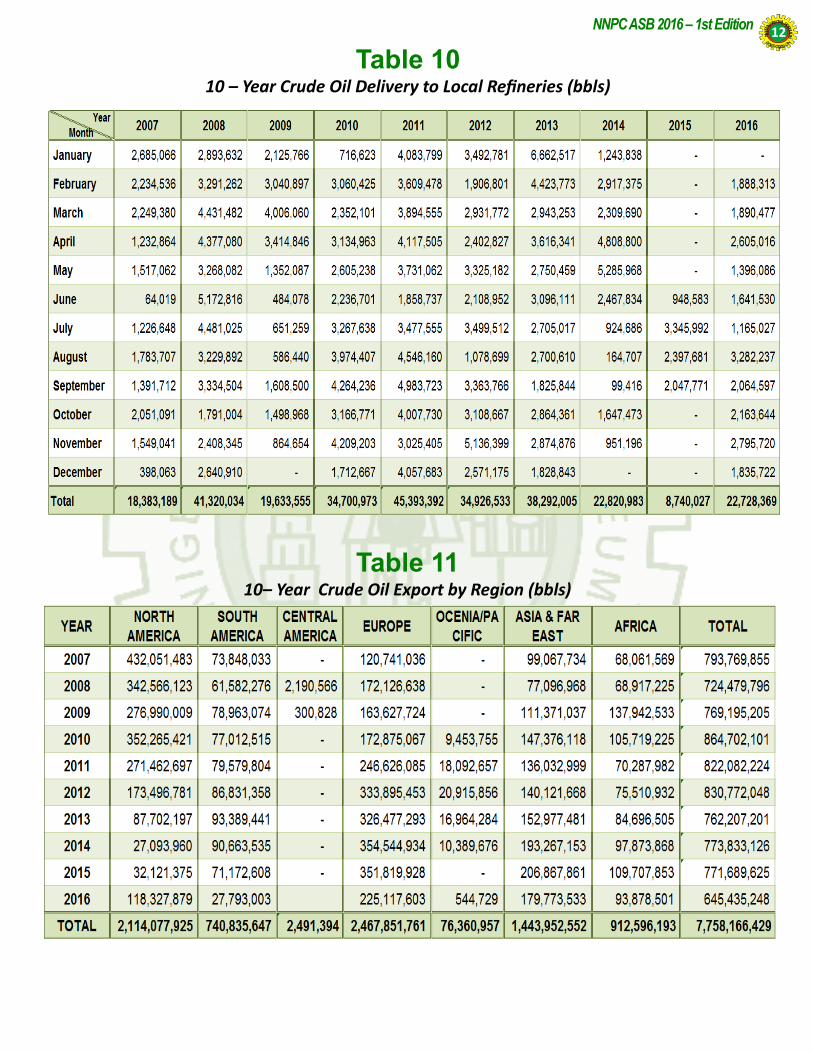
Table 10 10 – Year Crude Oil Delivery to Local Refineries (bbls)
Table 11 10– Year Crude Oil Export by Region (bbls)
NNPC ASB 2016 – 1st Edition 12
Ta
ble
12
Ga
s P
rod
ucti
on
an
d U
tiliz
ati
on
(m
scf)
NNPC ASB 2016 – 1st Edition 13
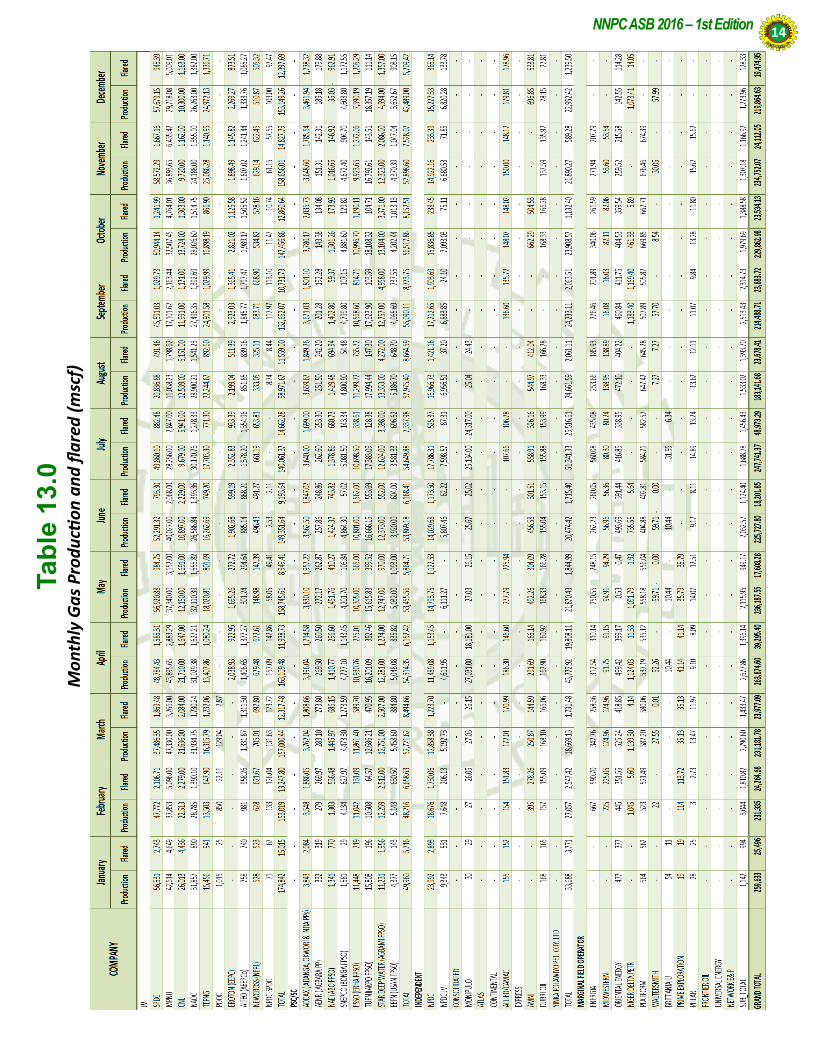
Ta
ble
13
.0
Mo
nth
ly G
as
Pro
du
ctio
n a
nd
fla
red
(m
scf)
NNPC ASB 2016 – 1st Edition 14
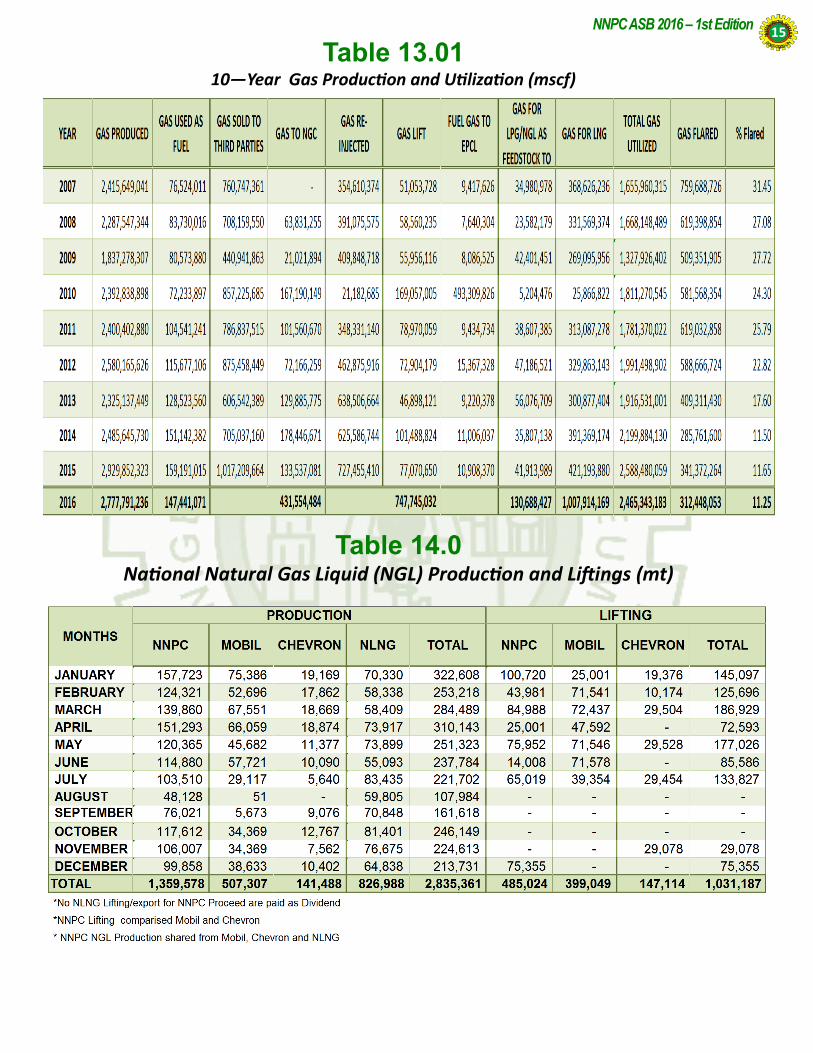
Table 13.01 10—Year Gas Production and Utilization (mscf)
NNPC ASB 2016 – 1st Edition 15
Table 14.0 National Natural Gas Liquid (NGL) Production and Liftings (mt)
NNPC ASB 2016 – 1st Edition 16
Table 14.01 Mobil’s Natural Gas Liquid (NGL) Production and Liftings (mt)
Table 14.02 Chevron’s Liquefied Petroleum Gas (LPG) Production and Liftings (mt)
NNPC ASB 2016 – 1st Edition 17
Table 14.03 NLNG’s Natural Gas Liquid (NGL) Production and Export (mt)
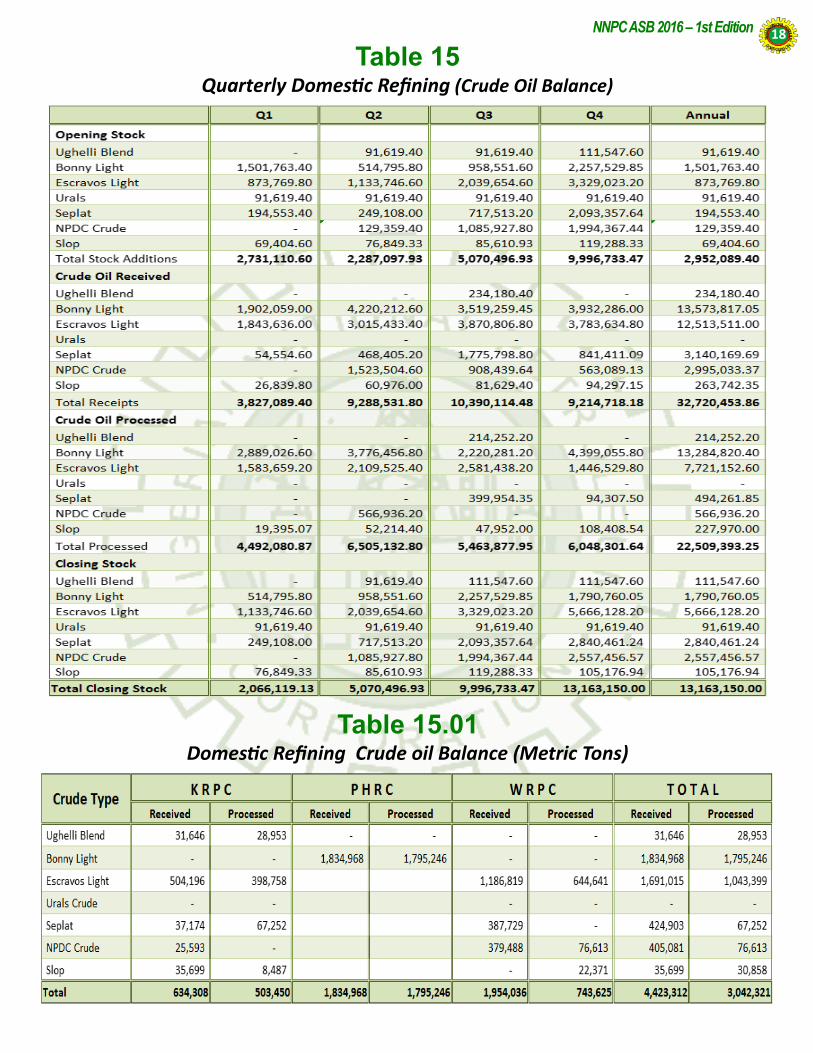
Table 15.01 Domestic Refining Crude oil Balance (Metric Tons)
Table 15 Quarterly Domestic Refining (Crude Oil Balance)
NNPC ASB 2016 – 1st Edition 18
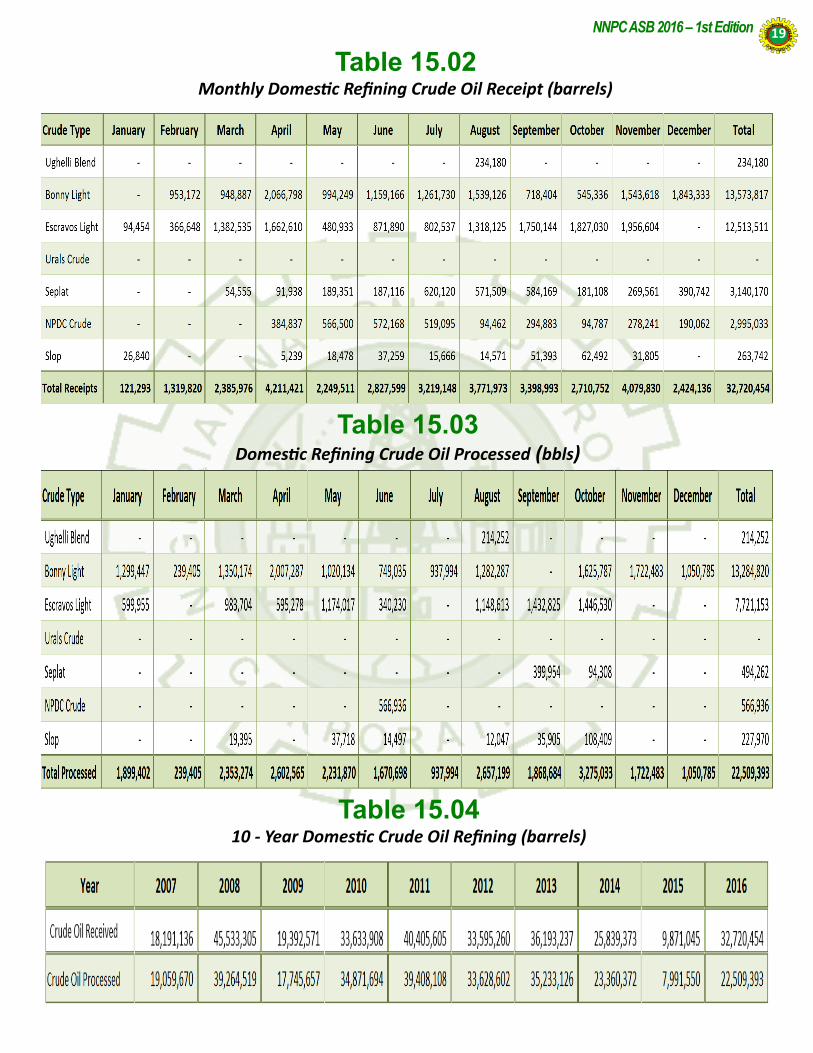
Table 15.04 10 - Year Domestic Crude Oil Refining (barrels)
Table 15.02 Monthly Domestic Refining Crude Oil Receipt (barrels)
Table 15.03 Domestic Refining Crude Oil Processed (bbls)
NNPC ASB 2016 – 1st Edition 19
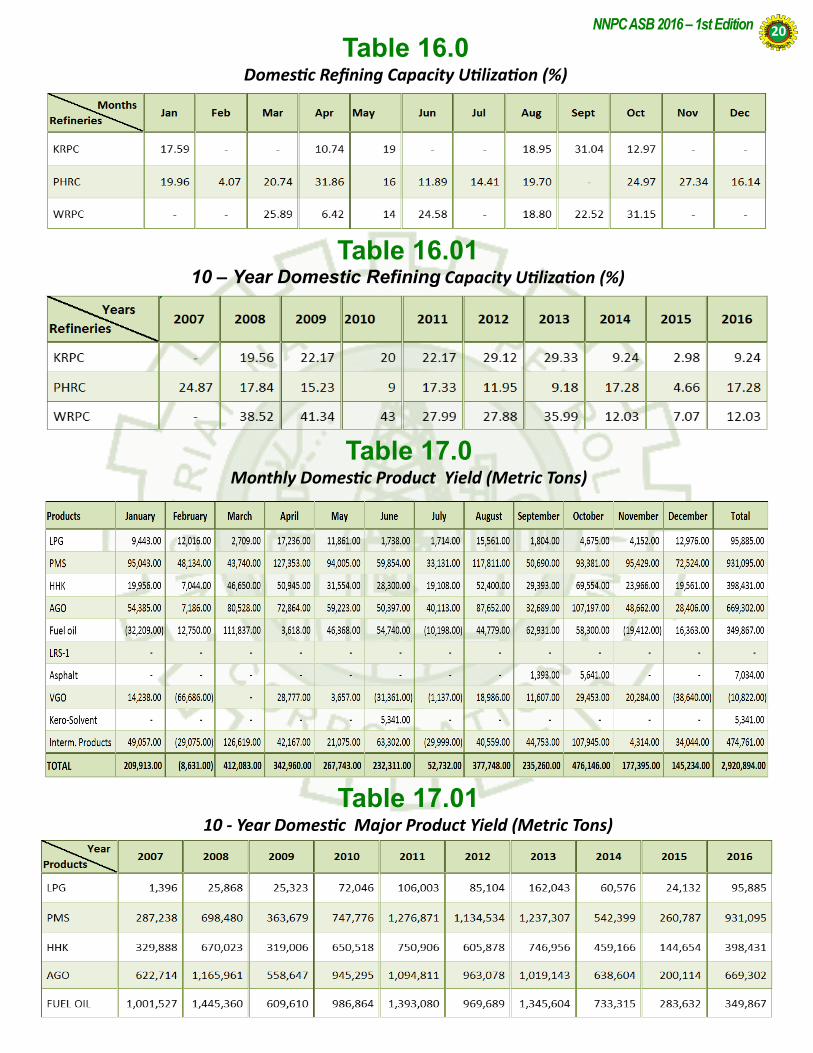
Table 17.0 Monthly Domestic Product Yield (Metric Tons)
Table 16.0 Domestic Refining Capacity Utilization (%)
Table 16.01 10 – Year Domestic Refining Capacity Utilization (%)
Table 17.01 10 - Year Domestic Major Product Yield (Metric Tons)
NNPC ASB 2016 – 1st Edition 20
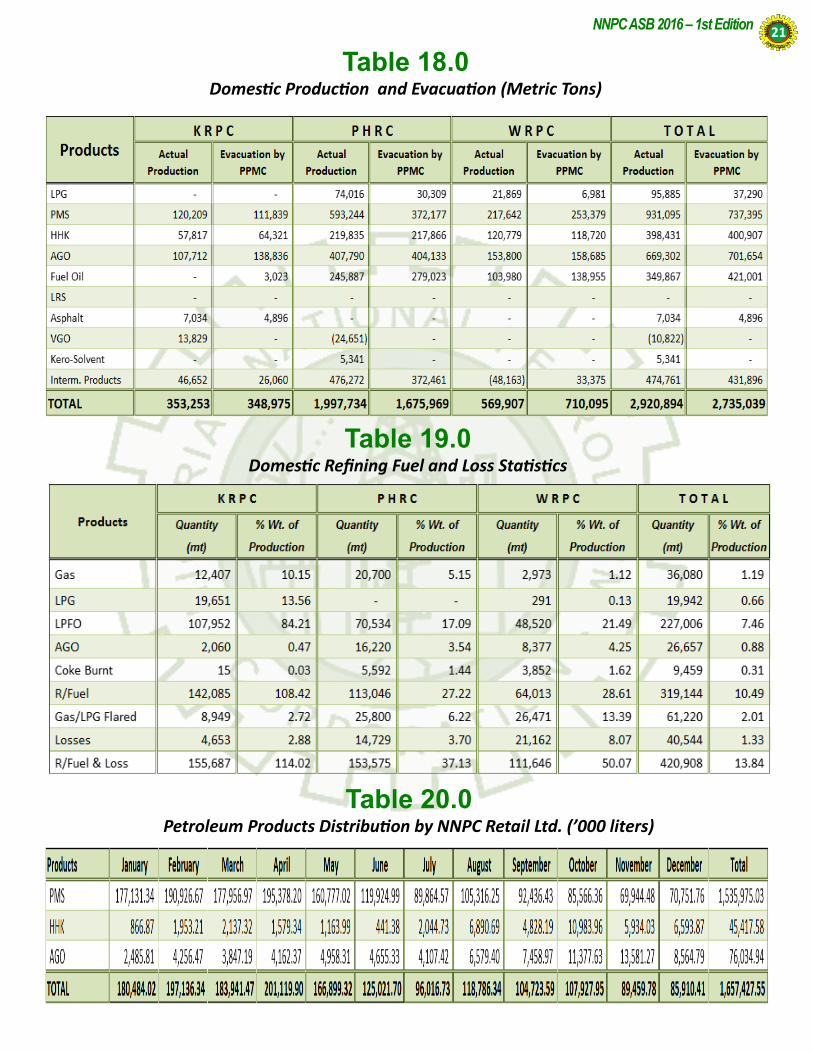
Table 20.0 Petroleum Products Distribution by NNPC Retail Ltd. (’000 liters)
Table 18.0 Domestic Production and Evacuation (Metric Tons)
Table 19.0 Domestic Refining Fuel and Loss Statistics
NNPC ASB 2016 – 1st Edition 21
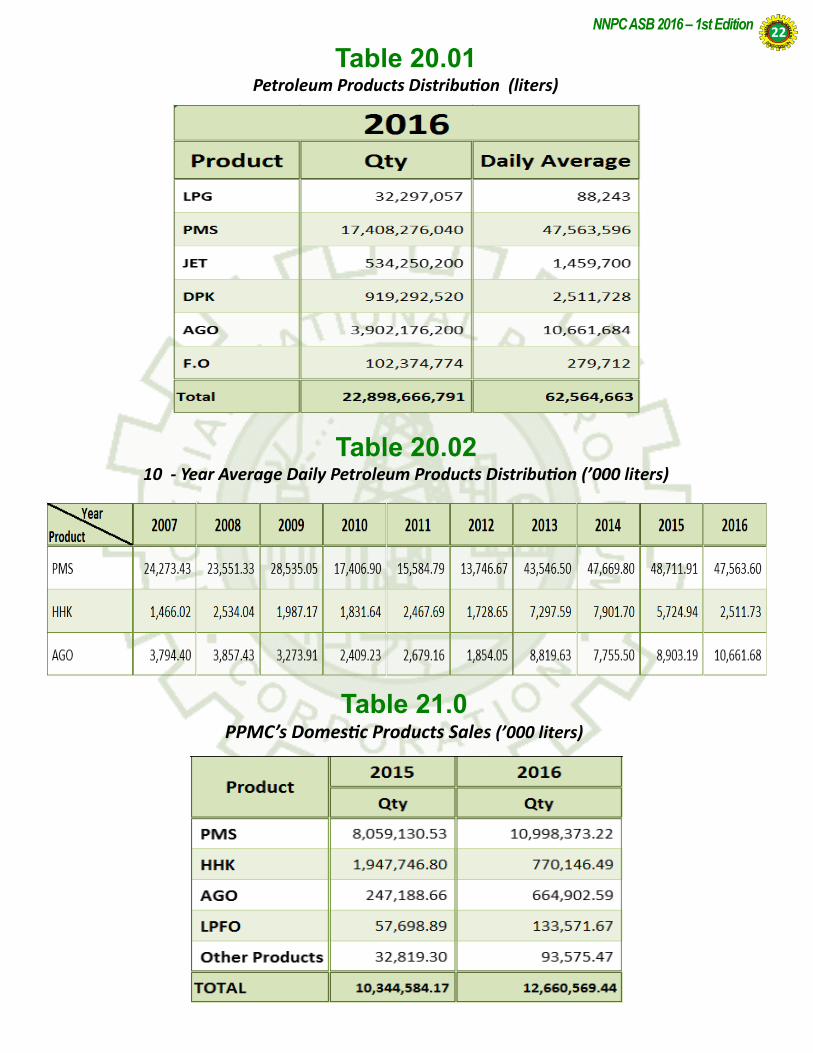
Table 20.01 Petroleum Products Distribution (liters)
NNPC ASB 2016 – 1st Edition 22
Table 20.02 10 - Year Average Daily Petroleum Products Distribution (’000 liters)
Table 21.0 PPMC’s Domestic Products Sales (’000 liters)
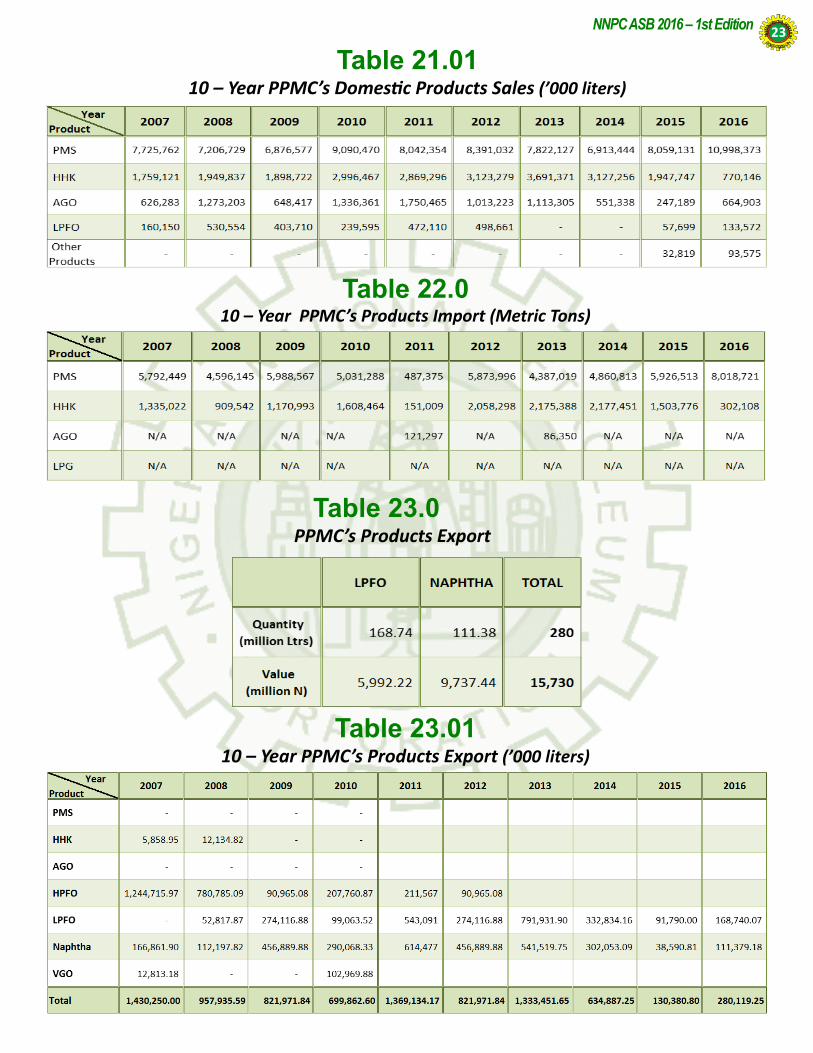
Table 23.0
PPMC’s Products Export
Table 22.0 10 – Year PPMC’s Products Import (Metric Tons)
Table 23.01 10 – Year PPMC’s Products Export (’000 liters)
NNPC ASB 2016 – 1st Edition 23
Table 21.01 10 – Year PPMC’s Domestic Products Sales (’000 liters)
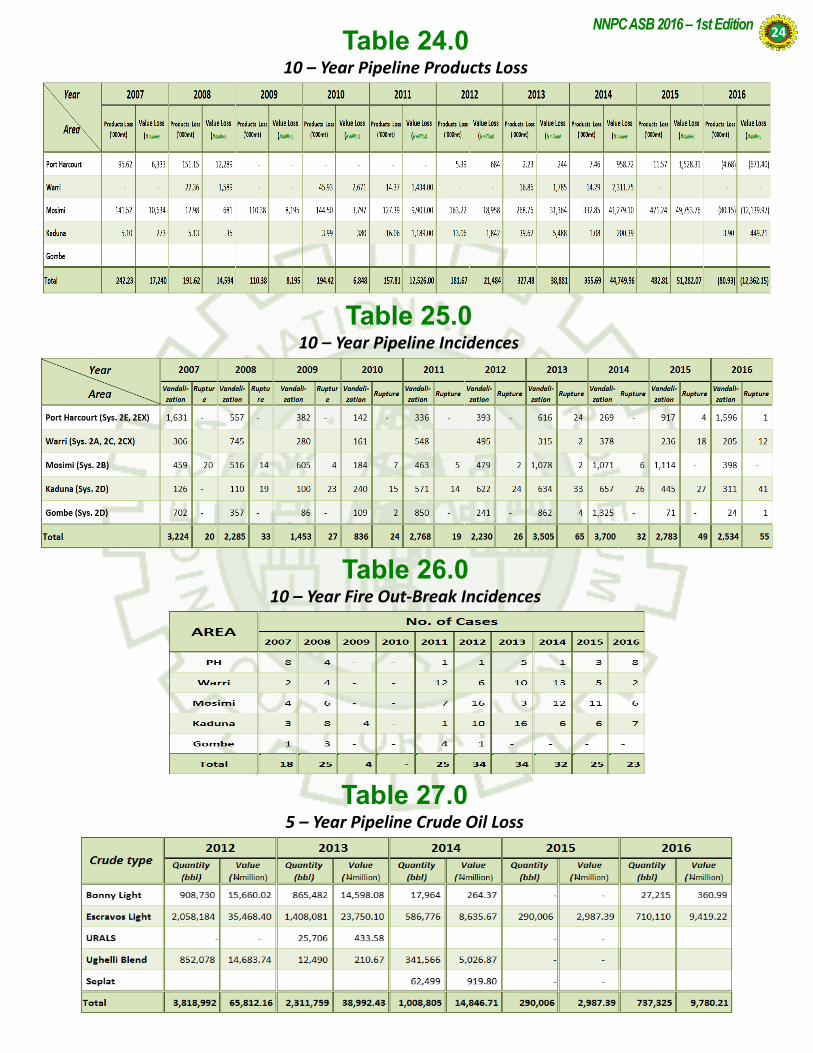
Table 25.0 10 – Year Pipeline Incidences
Table 24.0 10 – Year Pipeline Products Loss
Table 26.0 10 – Year Fire Out-Break Incidences
Table 27.0 5 – Year Pipeline Crude Oil Loss
NNPC ASB 2016 – 1st Edition 24
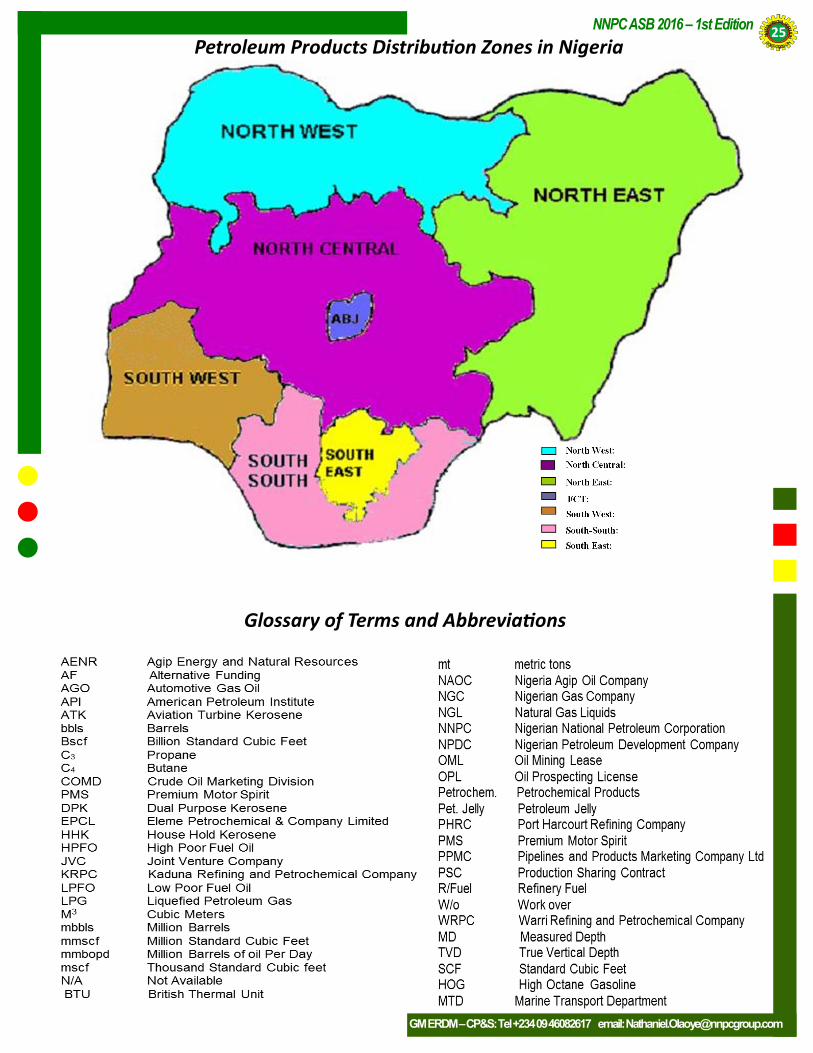
Petroleum Products Distribution Zones in Nigeria
Glossary of Terms and Abbreviations
NNPC ASB 2016 – 1st Edition 25
GM ERDM – CP&S: Tel +234 09 46082617 email: [email protected]