Embed Size (px)
Citation preview
2016 Disaster Recovery Survey
Disaster Recovery Challenges and Best Practices
CloudEndure 2016 © 2
Executive Summary
This benchmark survey reviews the challenges and best practices of companies using or looking to implement disaster recovery. The results are based on responses from 141 IT professionals from around the world, collected through an online survey conducted in January 2016. Some of the key findings of the survey include:
• The #1 risk to system availability remains human errors, followed by networks failures and application bugs. Cloud provider downtime has moved down from being risk #3 in 2015 to #6 in 2016.
• While the majority of organizations surveyed (77%) have a service availability goal of 99.9% or better (“three nines” or less than 9 hours of downtime a year), more than half of the companies (57%) had at least one outage in the past 3 months, and almost a third (31%) had an outage in the past week or month.
• The cost of downtime for over a third (36%) of the organization surveyed is a $100,000 per day or higher.
• When it comes to service availability, there is a clear gap between how organizations perceive their track records and the reality of their capabilities. While 90% of respondents claim they meet their availability goals consistently (38%) or most of the time (52%), 22% of the organizations surveyed don’t measure service availability at all. It is hard to tell how these organizations claim to meet their goals when they are not able to measure them.
• The top challenges in meeting availability goals are insufficient IT resources, budget limitations and lack of in-house expertise.
• There is a strong correlation between the cost of downtime and the average hours per week invested in
backup/disaster recovery.
CloudEndure 2016 © 3
Table of Contents
Production Infrastructure Provider ................................................................................................................................................................................................. 4 Disaster Recovery Target Infrastructure Provider .......................................................................................................................................................................... 5 Source vs. Target Platforms ............................................................................................................................................................................................................ 6 Production Machines with Disaster Recovery (Today and Next Year) ............................................................................................................................................ 7 Importance of Service Availability .................................................................................................................................................................................................. 8 Service Availability Goals ................................................................................................................................................................................................................ 9 What is Downtime? ........................................................................................................................................................................................................................ 10 Meeting Service Availability Goals ................................................................................................................................................................................................ 11 Last Downtime Event ..................................................................................................................................................................................................................... 12 Service Availability Measurement Tools and Services .................................................................................................................................................................. 13 Communicating System Availability Statistics to Customers ........................................................................................................................................................ 14 RPO (Recovery Point Objective) and RTO (Recovery Time Objective) ........................................................................................................................................ 15 Meeting RPO and RTO Goals .......................................................................................................................................................................................................... 16 How Frequent is the System Down for Scheduled Maintenance? .................................................................................................................................................. 17 Average Monthly Planned Downtime ............................................................................................................................................................................................. 18 Primary Risks to System Availability ............................................................................................................................................................................................. 19 Primary Challenges in Meeting Availability Goals ......................................................................................................................................................................... 20 Strategies and Technologies to Ensure System Availability and Data Protection ........................................................................................................................ 21 Frequency of Backup/Replication Application Data ..................................................................................................................................................................... 22 Who is Responsible for Disaster Recovery? ................................................................................................................................................................................... 23 Average of Hours a Week Invested in Backup/Disaster Recovery ................................................................................................................................................ 24 Annual Cost of Backup/Disaster Recovery .................................................................................................................................................................................... 25 Cost of Downtime .......................................................................................................................................................................................................................... 26 Annual Budget for Backup/Disaster Recovery vs. Cost of Downtime ........................................................................................................................................... 27 Average Hours per Week Invested in Backup/Disaster Recovery vs. Cost of Downtime .............................................................................................................. 28 Respondent Demographics: Customers ......................................................................................................................................................................................... 29 Respondent Demographics ............................................................................................................................................................................................................ 30 Respondent Demographics ............................................................................................................................................................................................................ 31 Table of Figures ............................................................................................................................................................................................................................. 32
CloudEndure 2016 © 4
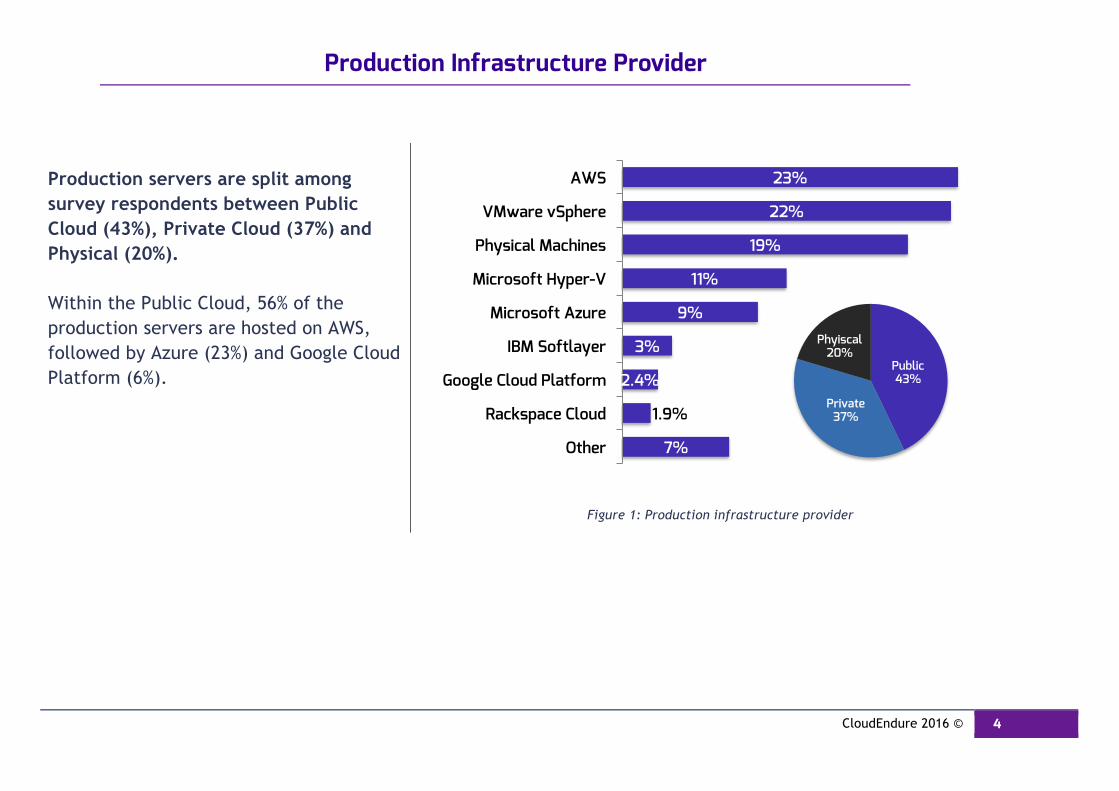
Production Infrastructure Provider
Production servers are split among survey respondents between Public Cloud (43%), Private Cloud (37%) and Physical (20%). Within the Public Cloud, 56% of the production servers are hosted on AWS, followed by Azure (23%) and Google Cloud Platform (6%).
Figure 1: Production infrastructure provider
23%
22%
19%
11%
9%
3%
2.4%
1.9%
7%
AWS
VMware vSphere
Physical Machines
Microsoft Hyper-V
Microsoft Azure
IBM Softlayer
Google Cloud Platform
Rackspace Cloud
Other
Public 43%
Private 37%
Phyiscal 20%
CloudEndure 2016 © 5
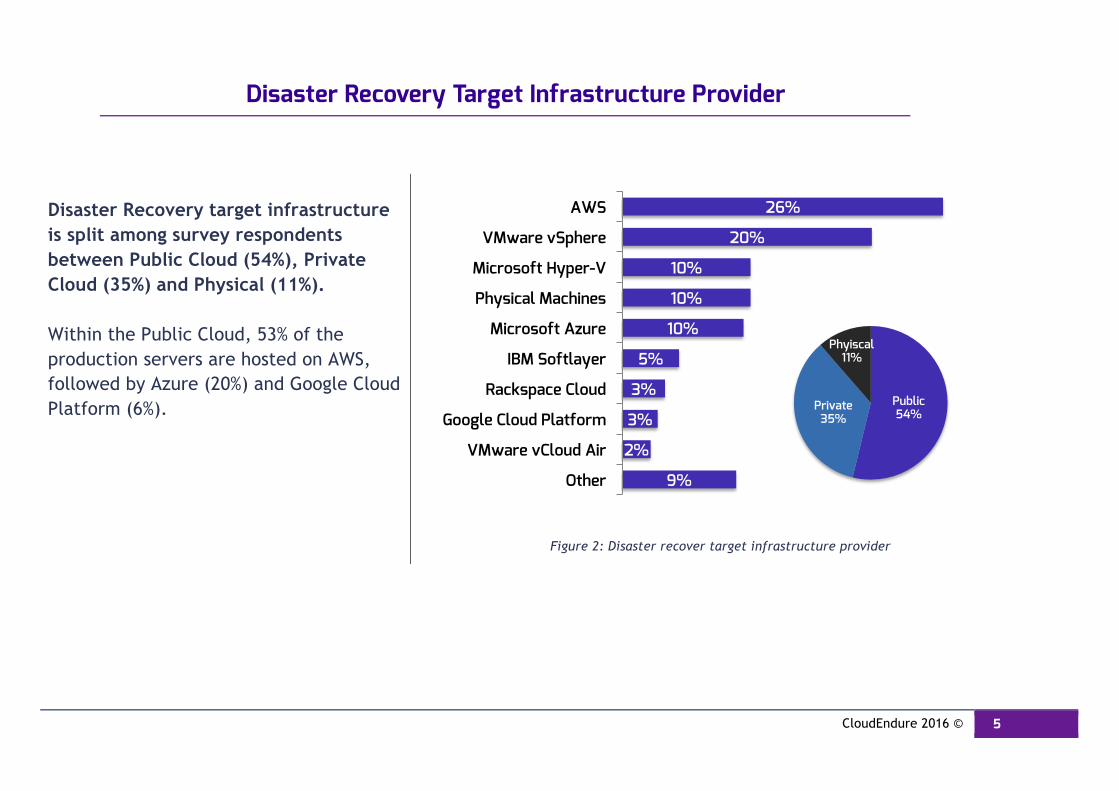
Disaster Recovery Target Infrastructure Provider
Disaster Recovery target infrastructure is split among survey respondents between Public Cloud (54%), Private Cloud (35%) and Physical (11%). Within the Public Cloud, 53% of the production servers are hosted on AWS, followed by Azure (20%) and Google Cloud Platform (6%).
Figure 2: Disaster recover target infrastructure provider
26%
20%
10%
10%
10%
5%
3%
3%
2%
9%
AWS
VMware vSphere
Microsoft Hyper-V
Physical Machines
Microsoft Azure
IBM Softlayer
Rackspace Cloud
Google Cloud Platform
VMware vCloud Air
Other
Public 54%
Private 35%
Phyiscal 11%
CloudEndure 2016 © 6
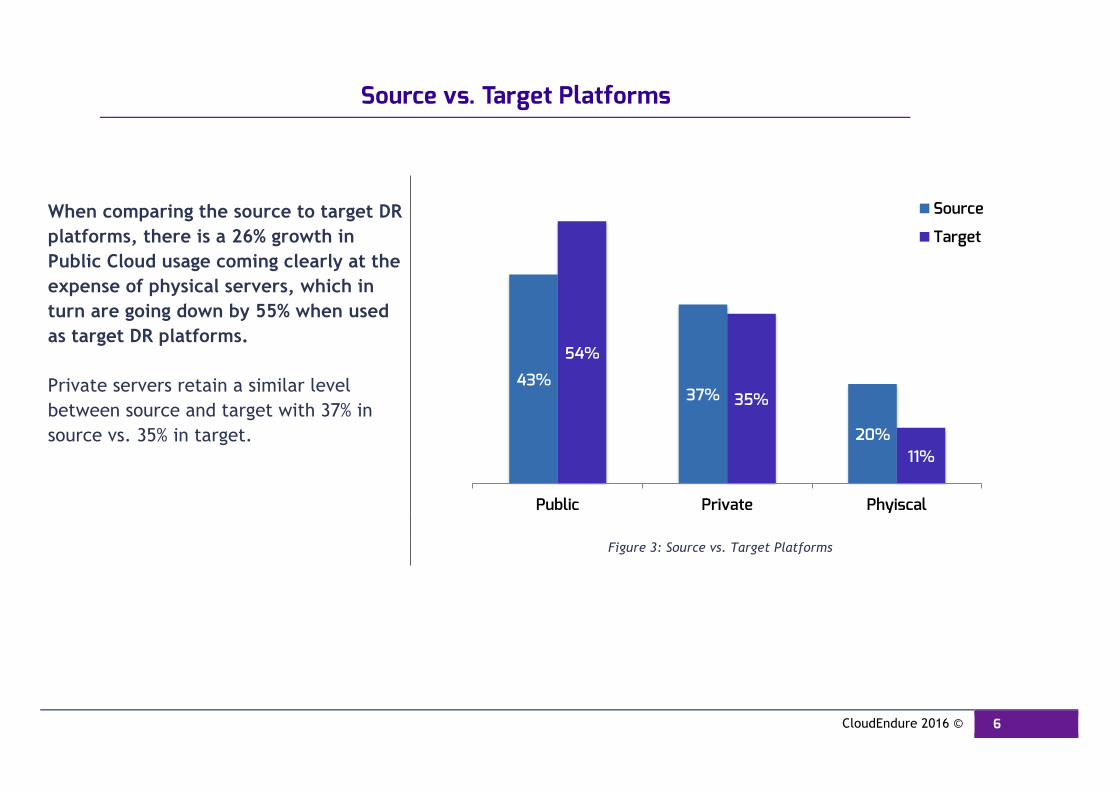
Source vs. Target Platforms
When comparing the source to target DR platforms, there is a 26% growth in Public Cloud usage coming clearly at the expense of physical servers, which in turn are going down by 55% when used as target DR platforms. Private servers retain a similar level between source and target with 37% in source vs. 35% in target.
Figure 3: Source vs. Target Platforms
43% 37%
20%
54%
35%
11%
Public Private Phyiscal
Source
Target
CloudEndure 2016 © 7
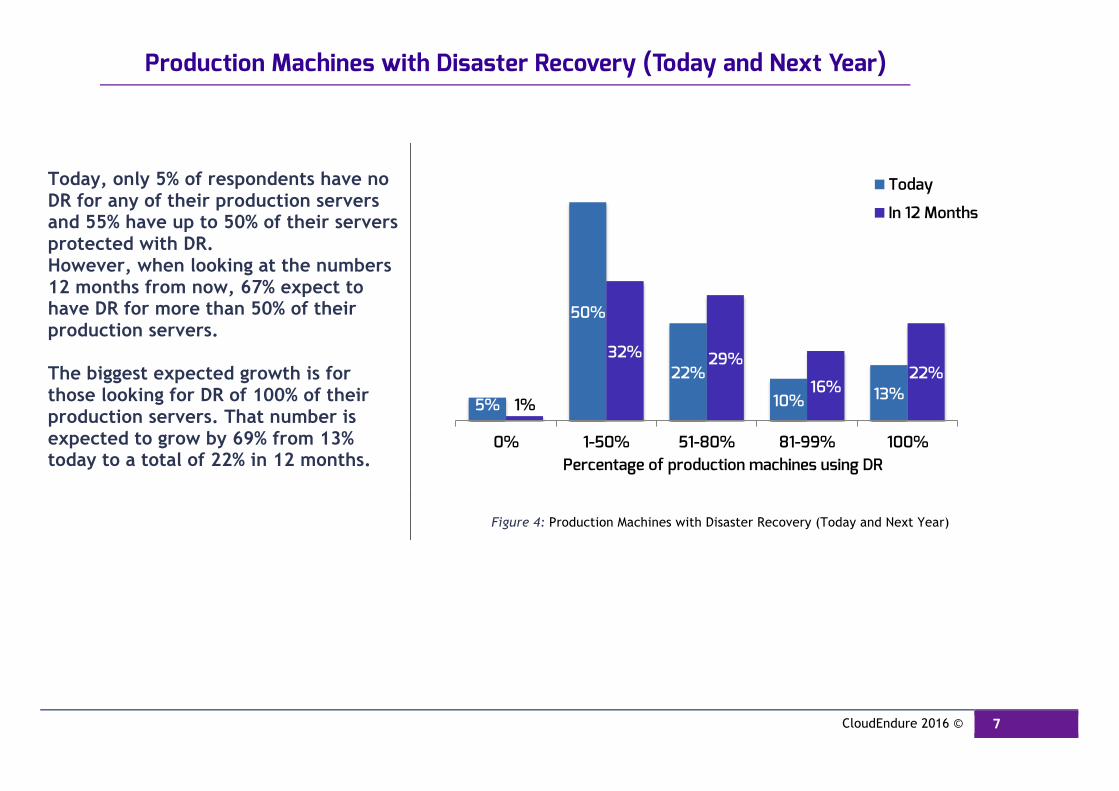
Production Machines with Disaster Recovery (Today and Next Year)
Today, only 5% of respondents have no DR for any of their production servers and 55% have up to 50% of their servers protected with DR. However, when looking at the numbers 12 months from now, 67% expect to have DR for more than 50% of their production servers. The biggest expected growth is for those looking for DR of 100% of their production servers. That number is expected to grow by 69% from 13% today to a total of 22% in 12 months.
Figure 4: Production Machines with Disaster Recovery (Today and Next Year)
5%
50%
22%
10% 13% 1%
32% 29%
16% 22%
0% 1-50% 51-80% 81-99% 100%
Today
In 12 Months
Percentage of production machines using DR
CloudEndure 2016 © 8
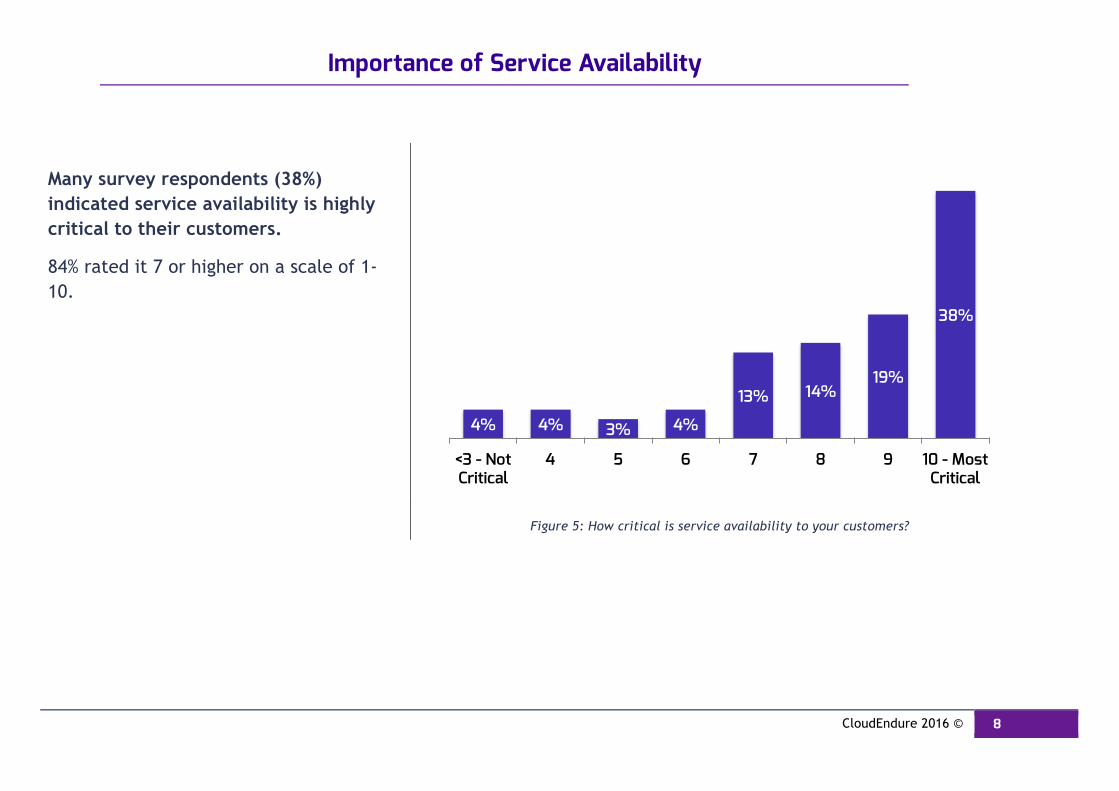
Importance of Service Availability
Many survey respondents (38%) indicated service availability is highly critical to their customers.
84% rated it 7 or higher on a scale of 1-10.
Figure 5: How critical is service availability to your customers?
4% 4% 3% 4%
13% 14% 19%
38%
<3 - Not Critical
4 5 6 7 8 9 10 - Most Critical
CloudEndure 2016 © 9
Service Availability Goals
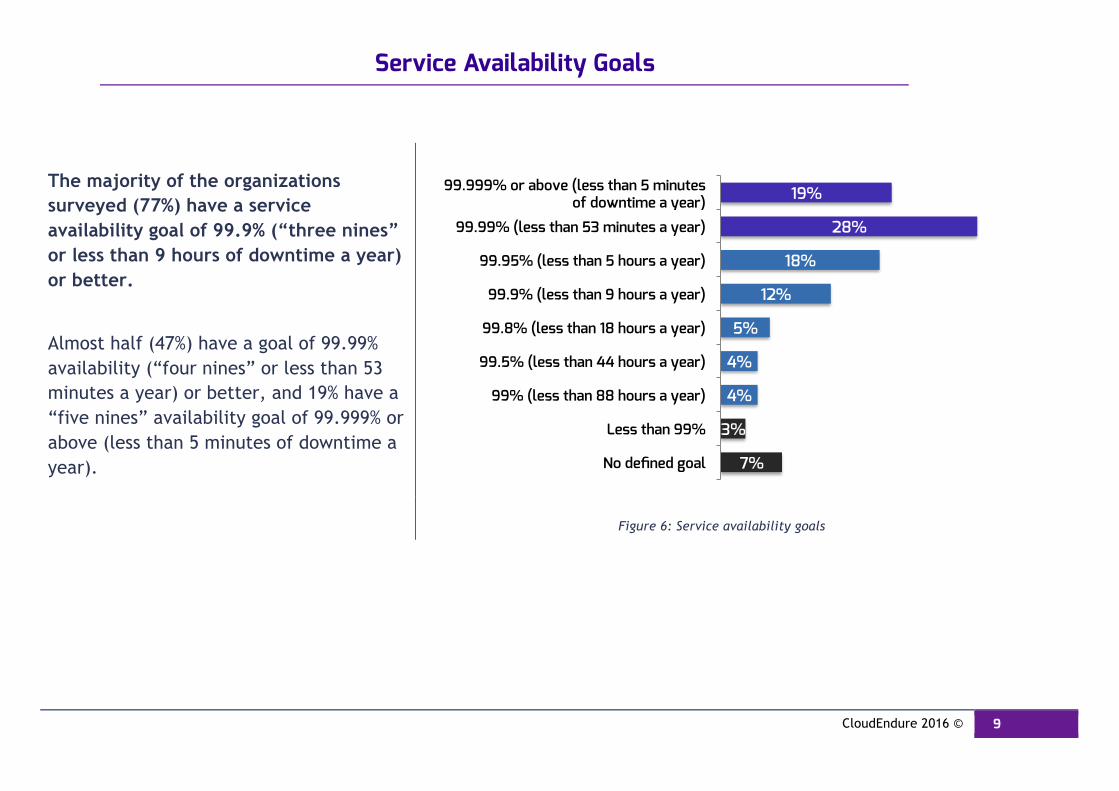
The majority of the organizations surveyed (77%) have a service availability goal of 99.9% (“three nines” or less than 9 hours of downtime a year) or better.
Almost half (47%) have a goal of 99.99% availability (“four nines” or less than 53 minutes a year) or better, and 19% have a “five nines” availability goal of 99.999% or above (less than 5 minutes of downtime a year).
Figure 6: Service availability goals
19%
28%
18%
12%
5%
4%
4%
3%
7%
99.999% or above (less than 5 minutes of downtime a year)
99.99% (less than 53 minutes a year)
99.95% (less than 5 hours a year)
99.9% (less than 9 hours a year)
99.8% (less than 18 hours a year)
99.5% (less than 44 hours a year)
99% (less than 88 hours a year)
Less than 99%
No defined goal
CloudEndure 2016 © 10
What is Downtime?
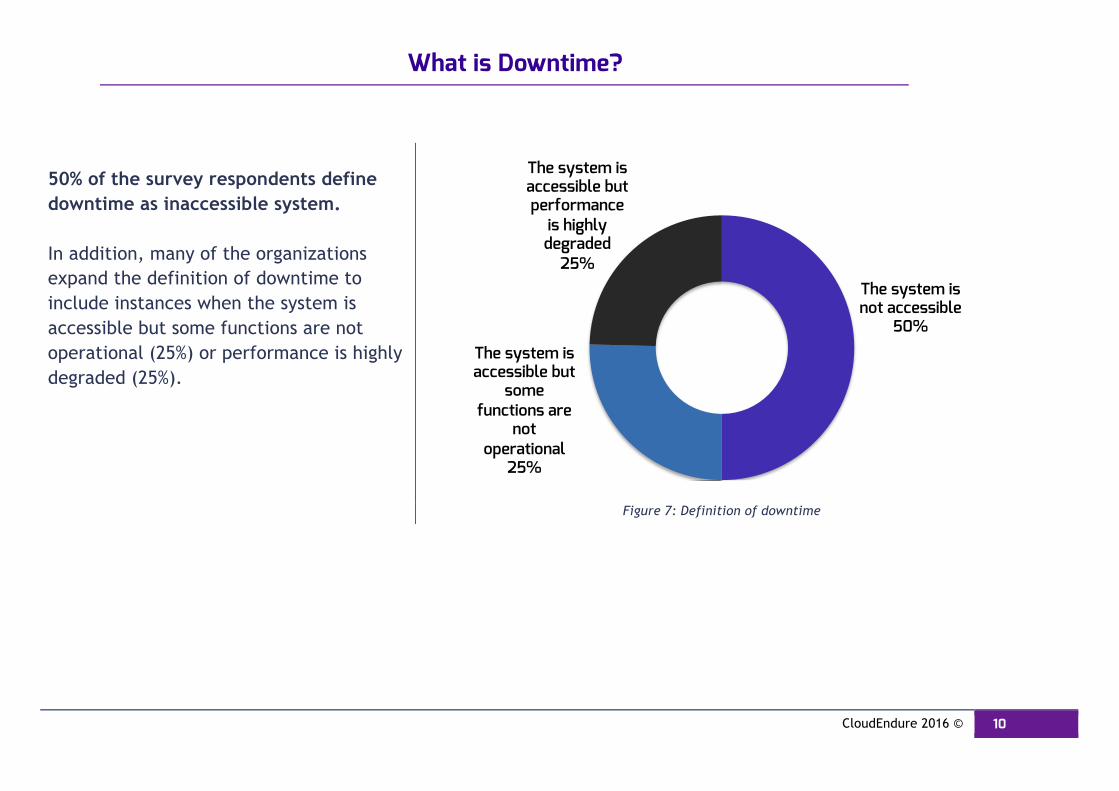
50% of the survey respondents define downtime as inaccessible system. In addition, many of the organizations expand the definition of downtime to include instances when the system is accessible but some functions are not operational (25%) or performance is highly degraded (25%).
Figure 7: Definition of downtime
The system is not accessible
50%
The system is accessible but
some functions are
not operational
25%
The system is accessible but performance
is highly degraded
25%
CloudEndure 2016 © 11
Meeting Service Availability Goals
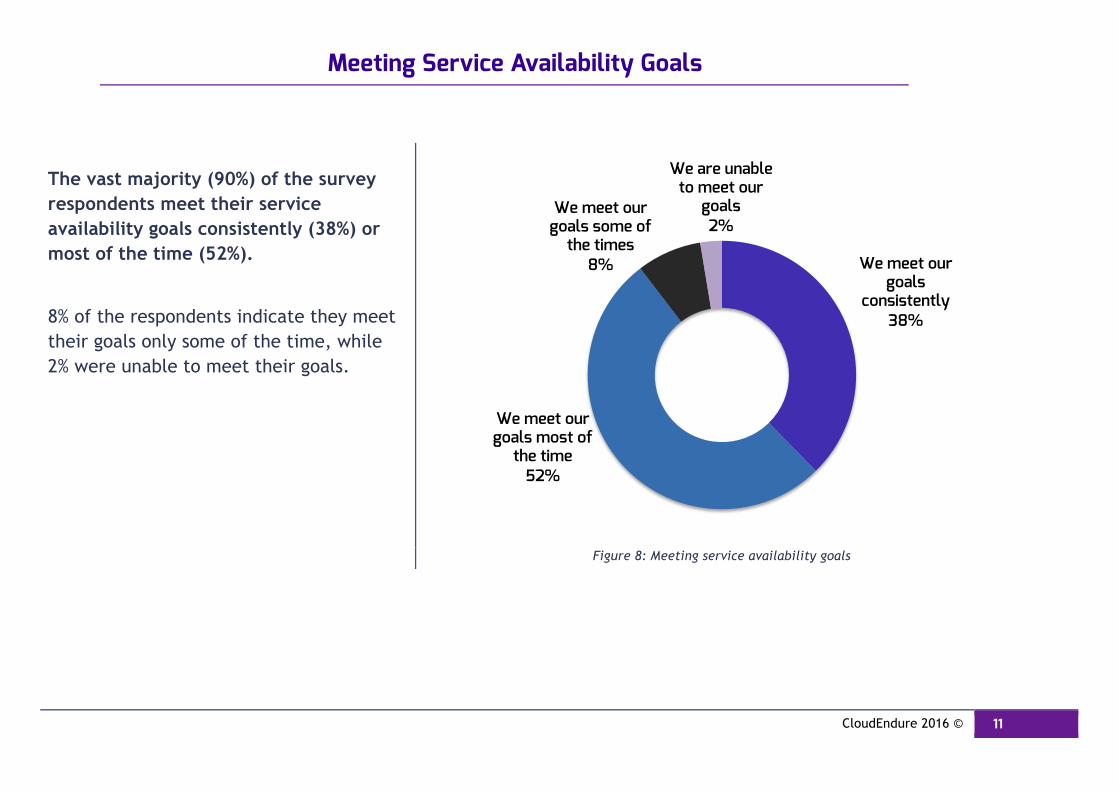
The vast majority (90%) of the survey respondents meet their service availability goals consistently (38%) or most of the time (52%).
8% of the respondents indicate they meet their goals only some of the time, while 2% were unable to meet their goals.
Figure 8: Meeting service availability goals
We meet our goals
consistently 38%
We meet our goals most of
the time 52%
We meet our goals some of
the times 8%
We are unable to meet our
goals 2%
CloudEndure 2016 © 12
Last Downtime Event
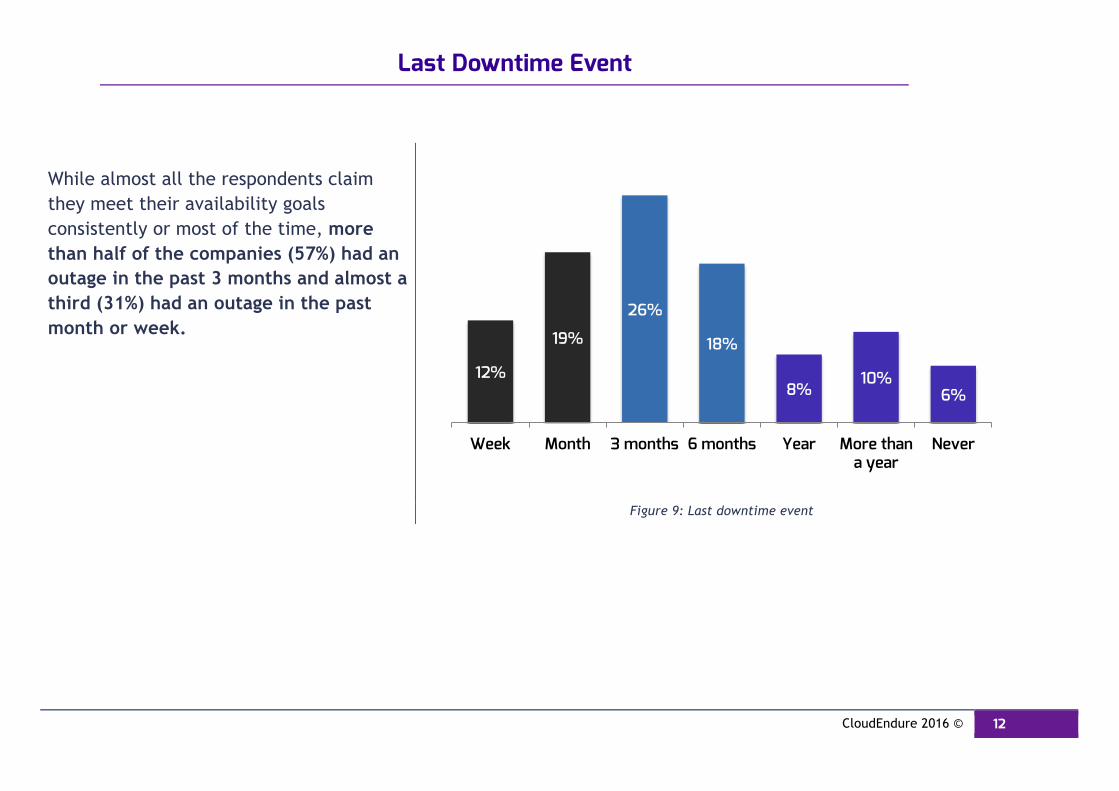
While almost all the respondents claim they meet their availability goals consistently or most of the time, more than half of the companies (57%) had an outage in the past 3 months and almost a third (31%) had an outage in the past month or week.
Figure 9: Last downtime event
12%
19%
26%
18%
8% 10%
6%
Week Month 3 months 6 months Year More than a year
Never
CloudEndure 2016 © 13
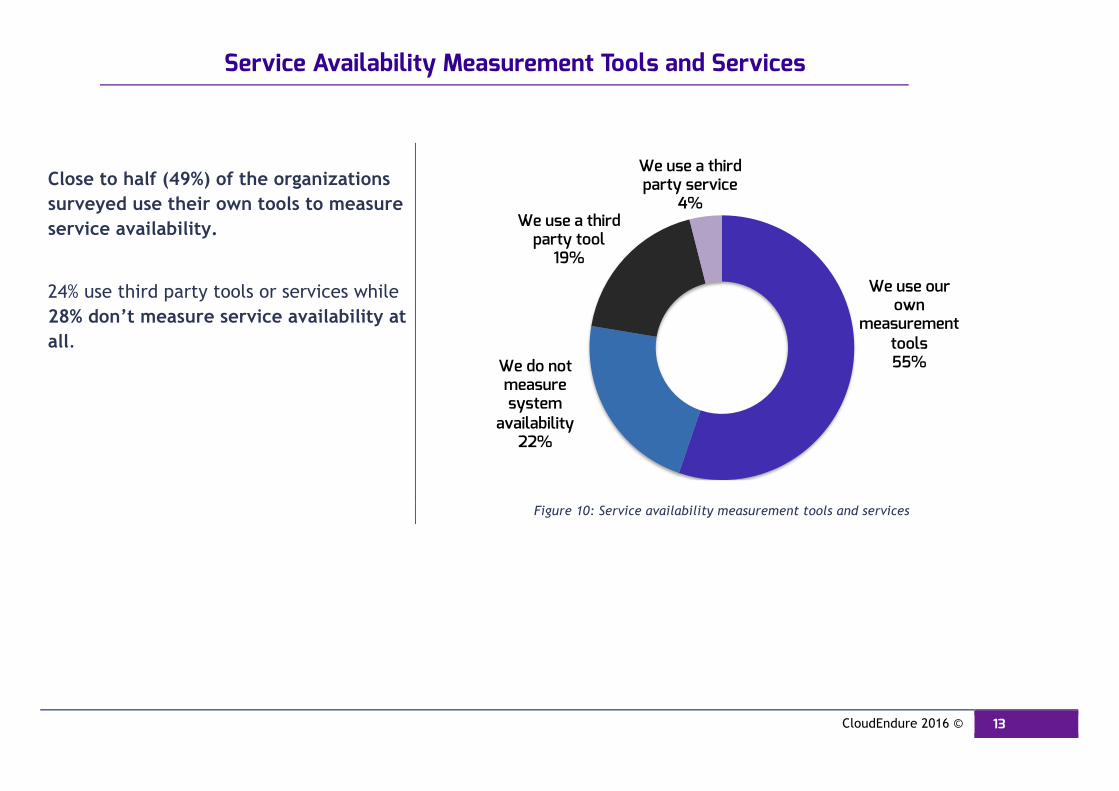
Service Availability Measurement Tools and Services
Close to half (49%) of the organizations surveyed use their own tools to measure service availability.
24% use third party tools or services while 28% don’t measure service availability at all.
Figure 10: Service availability measurement tools and services
We use our own
measurement tools 55% We do not
measure system
availability 22%
We use a third party tool
19%
We use a third party service
4%
CloudEndure 2016 © 14
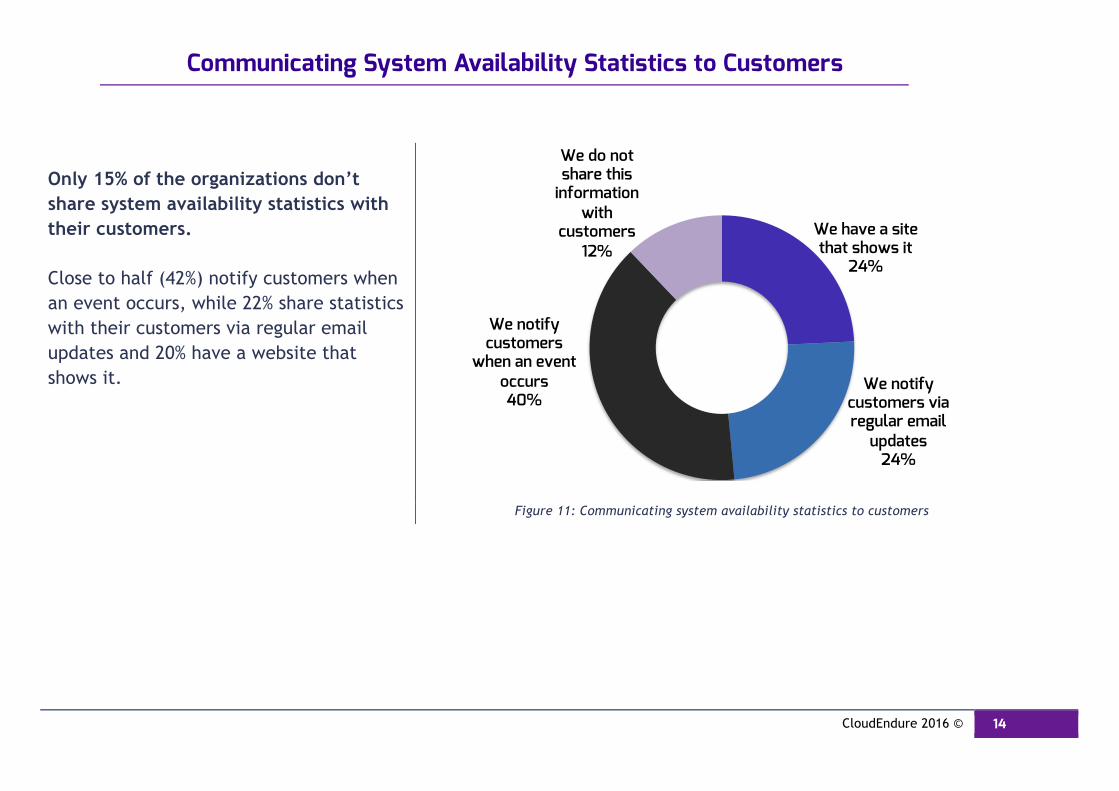
Communicating System Availability Statistics to Customers
Only 15% of the organizations don’t share system availability statistics with their customers. Close to half (42%) notify customers when an event occurs, while 22% share statistics with their customers via regular email updates and 20% have a website that shows it.
Figure 11: Communicating system availability statistics to customers
We have a site that shows it
24%
We notify customers via regular email
updates 24%
We notify customers
when an event occurs 40%
We do not share this
information with
customers 12%
CloudEndure 2016 © 15
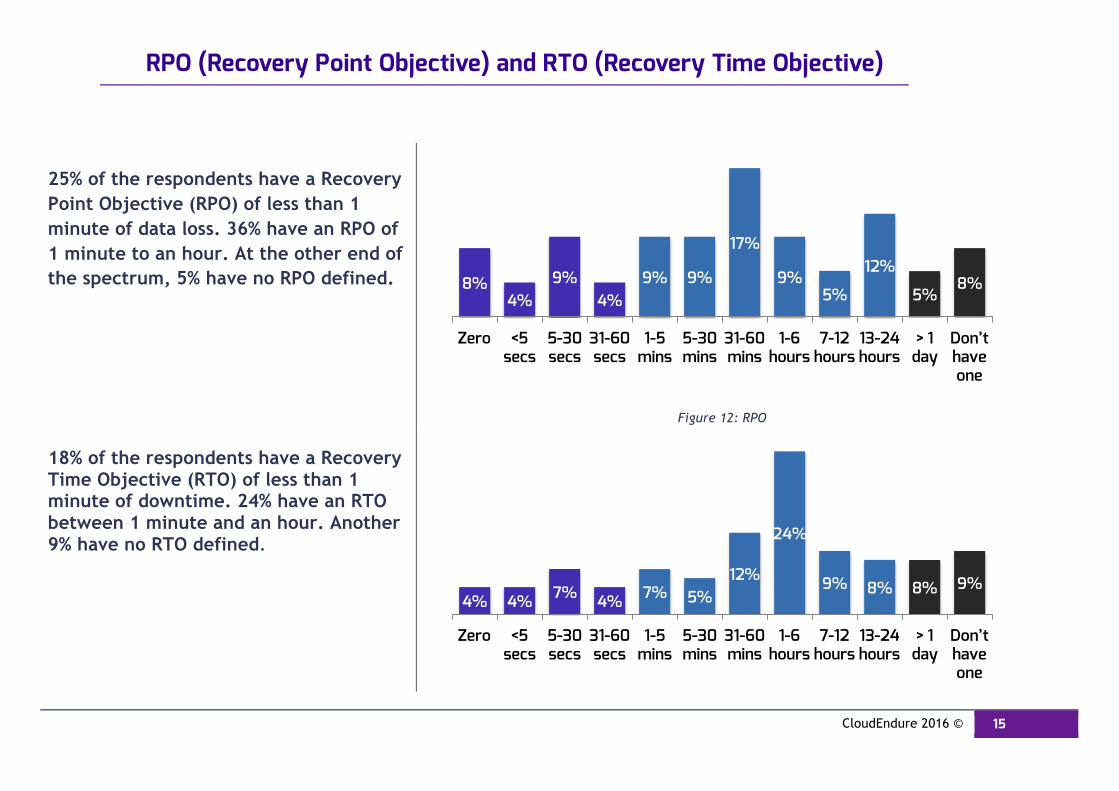
RPO (Recovery Point Objective) and RTO (Recovery Time Objective)
25% of the respondents have a Recovery Point Objective (RPO) of less than 1 minute of data loss. 36% have an RPO of 1 minute to an hour. At the other end of the spectrum, 5% have no RPO defined.
Figure 12: RPO
18% of the respondents have a Recovery Time Objective (RTO) of less than 1 minute of downtime. 24% have an RTO between 1 minute and an hour. Another 9% have no RTO defined.
8% 4%
9% 4%
9% 9%
17%
9% 5%
12%
5% 8%
Zero <5 secs
5-30 secs
31-60 secs
1-5 mins
5-30 mins
31-60 mins
1-6 hours
7-12 hours
13-24 hours
> 1 day
Don’t have one
4% 4% 7% 4% 7% 5% 12%
24%
9% 8% 8% 9%
Zero <5 secs
5-30 secs
31-60 secs
1-5 mins
5-30 mins
31-60 mins
1-6 hours
7-12 hours
13-24 hours
> 1 day
Don’t have one
CloudEndure 2016 © 16
Figure 13: RTO
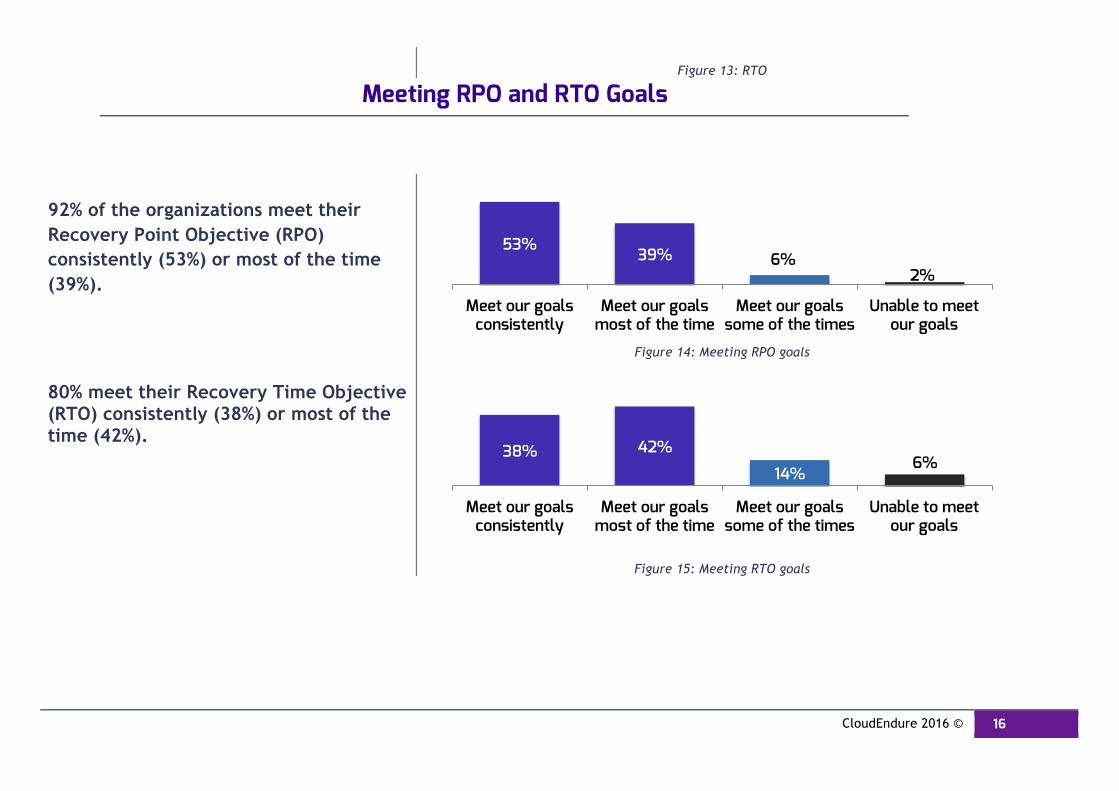
Meeting RPO and RTO Goals
92% of the organizations meet their Recovery Point Objective (RPO) consistently (53%) or most of the time (39%).
Figure 14: Meeting RPO goals
80% meet their Recovery Time Objective (RTO) consistently (38%) or most of the time (42%).
Figure 15: Meeting RTO goals
53% 39% 6%
2%
Meet our goals consistently
Meet our goals most of the time
Meet our goals some of the times
Unable to meet our goals
38% 42%
14% 6%
Meet our goals consistently
Meet our goals most of the time
Meet our goals some of the times
Unable to meet our goals
CloudEndure 2016 © 17
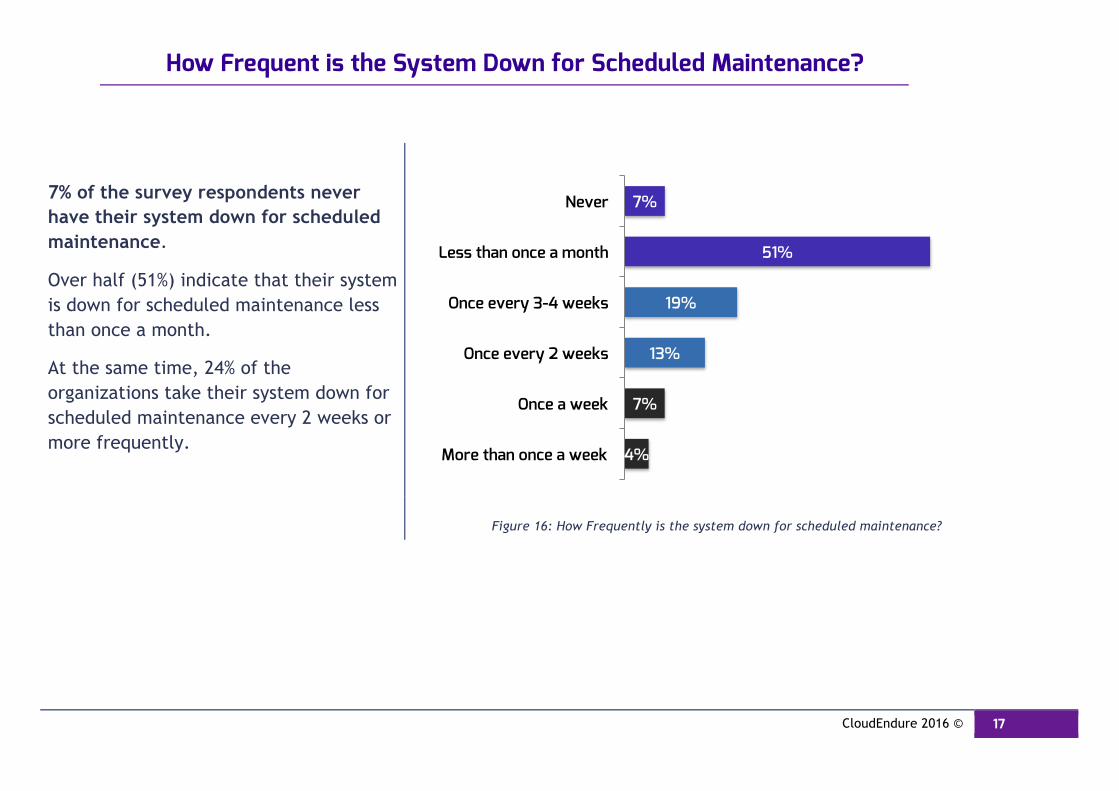
How Frequent is the System Down for Scheduled Maintenance?
7% of the survey respondents never have their system down for scheduled maintenance.
Over half (51%) indicate that their system is down for scheduled maintenance less than once a month.
At the same time, 24% of the organizations take their system down for scheduled maintenance every 2 weeks or more frequently.
Figure 16: How Frequently is the system down for scheduled maintenance?
4%
7%
13%
19%
51%
7%
More than once a week
Once a week
Once every 2 weeks
Once every 3-4 weeks
Less than once a month
Never
CloudEndure 2016 © 18
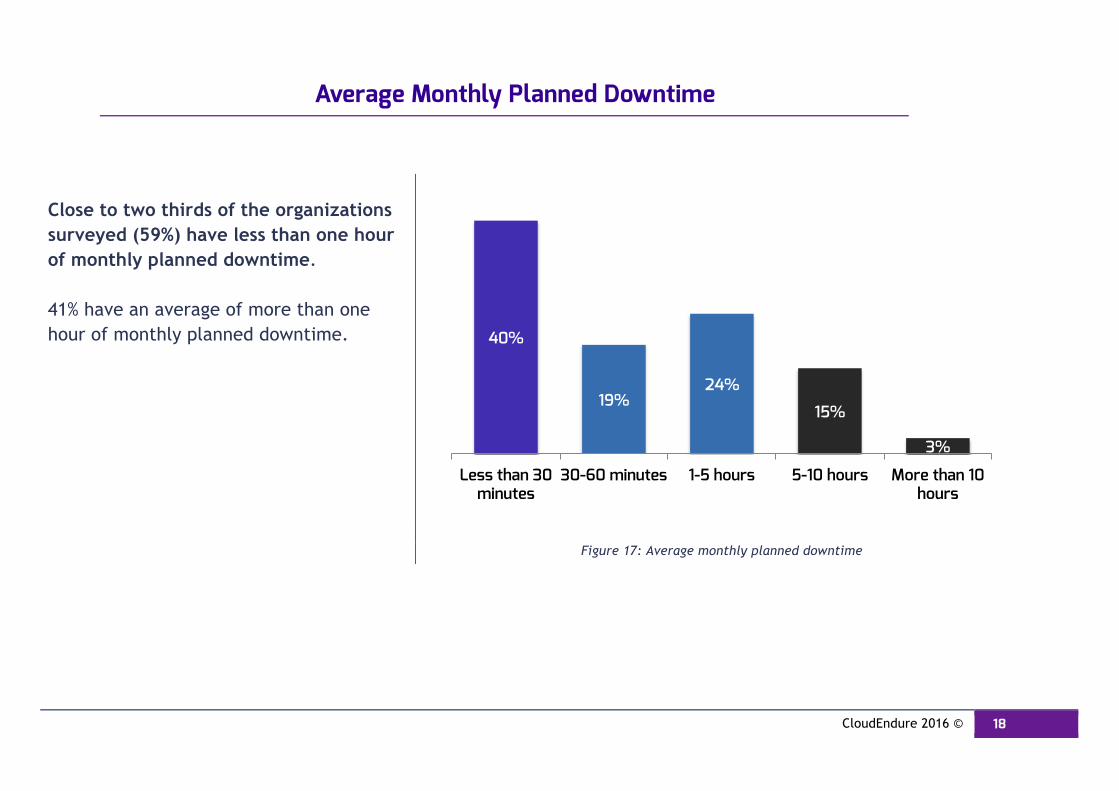
Average Monthly Planned Downtime
Close to two thirds of the organizations surveyed (59%) have less than one hour of monthly planned downtime. 41% have an average of more than one hour of monthly planned downtime.
Figure 17: Average monthly planned downtime
40%
19% 24%
15%
3%
Less than 30 minutes
30-60 minutes 1-5 hours 5-10 hours More than 10 hours
CloudEndure 2016 © 19
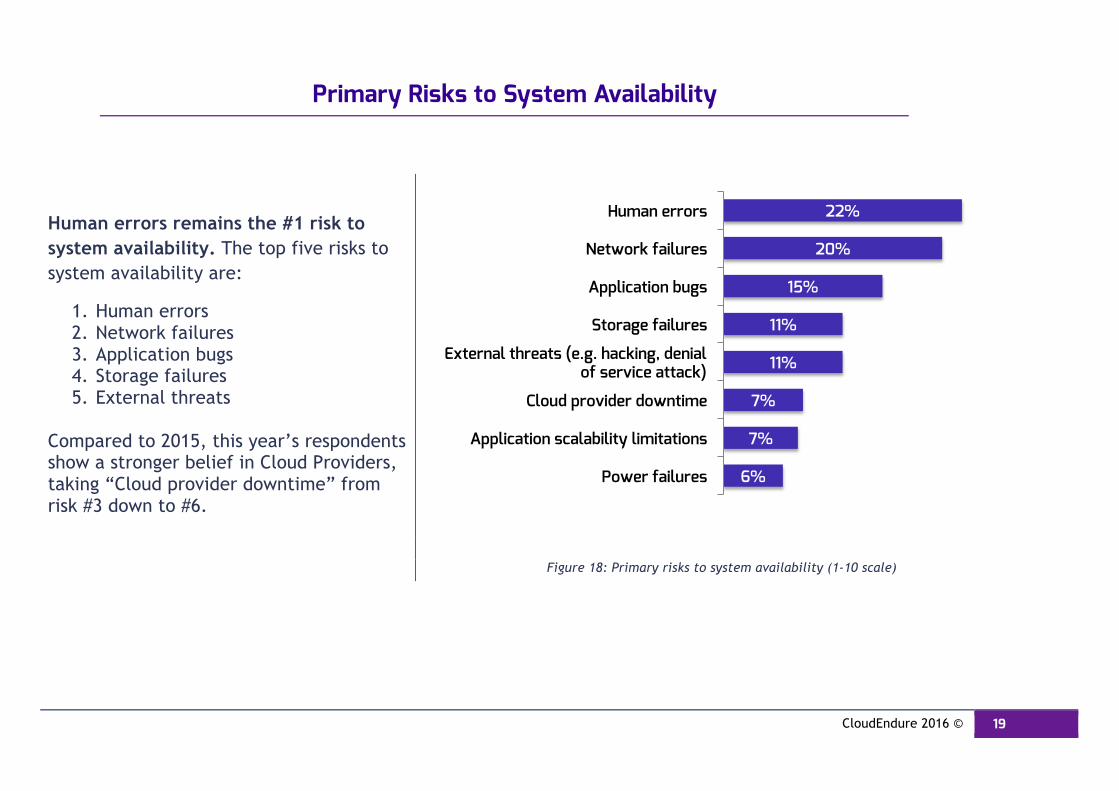
Primary Risks to System Availability
Human errors remains the #1 risk to system availability. The top five risks to system availability are:
1. Human errors 2. Network failures 3. Application bugs 4. Storage failures 5. External threats
Compared to 2015, this year’s respondents show a stronger belief in Cloud Providers, taking “Cloud provider downtime” from risk #3 down to #6.
Figure 18: Primary risks to system availability (1-10 scale)
22%
20%
15%
11%
11%
7%
7%
6%
Human errors
Network failures
Application bugs
Storage failures
External threats (e.g. hacking, denial of service attack)
Cloud provider downtime
Application scalability limitations
Power failures
CloudEndure 2016 © 20
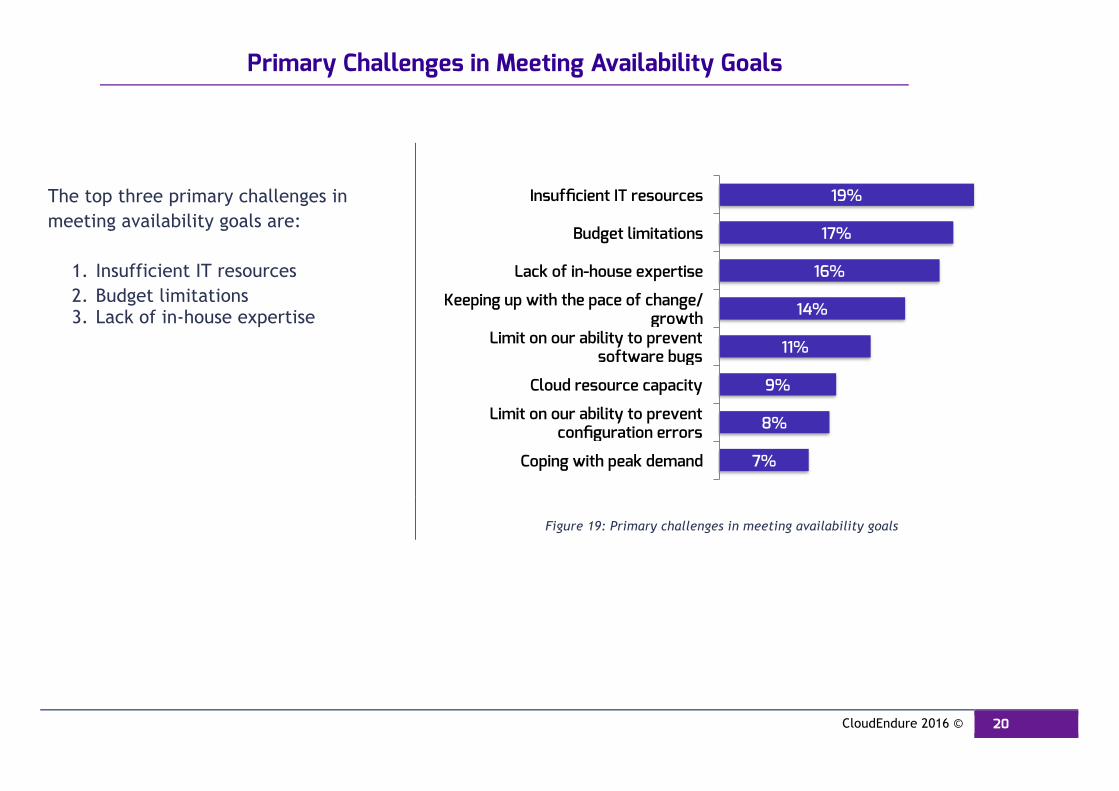
Primary Challenges in Meeting Availability Goals
The top three primary challenges in meeting availability goals are:
1. Insufficient IT resources 2. Budget limitations 3. Lack of in-house expertise
Figure 19: Primary challenges in meeting availability goals
19%
17%
16%
14%
11%
9%
8%
7%
Insufficient IT resources
Budget limitations
Lack of in-house expertise
Keeping up with the pace of change/growth
Limit on our ability to prevent software bugs
Cloud resource capacity
Limit on our ability to prevent configuration errors
Coping with peak demand
CloudEndure 2016 © 21
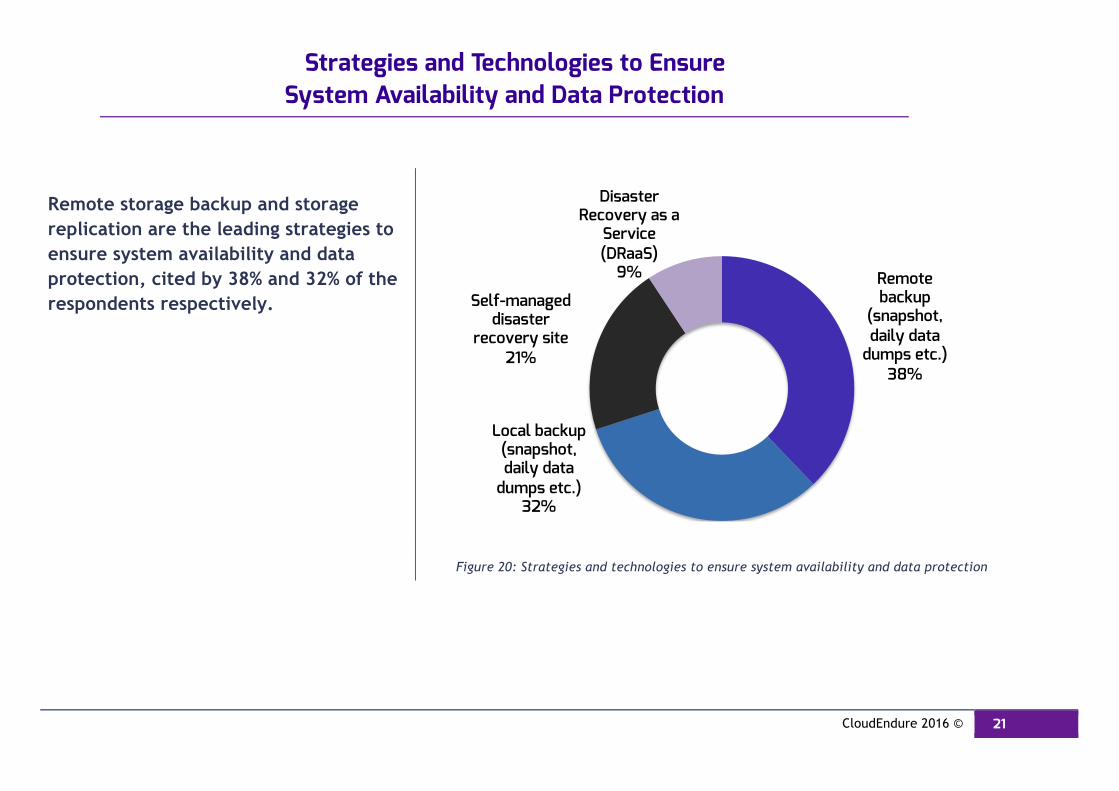
Strategies and Technologies to Ensure System Availability and Data Protection
Remote storage backup and storage replication are the leading strategies to ensure system availability and data protection, cited by 38% and 32% of the respondents respectively.
Figure 20: Strategies and technologies to ensure system availability and data protection
Remote backup
(snapshot, daily data
dumps etc.) 38%
Local backup (snapshot, daily data
dumps etc.) 32%
Self-managed disaster
recovery site 21%
Disaster Recovery as a
Service (DRaaS)
9%
CloudEndure 2016 © 22
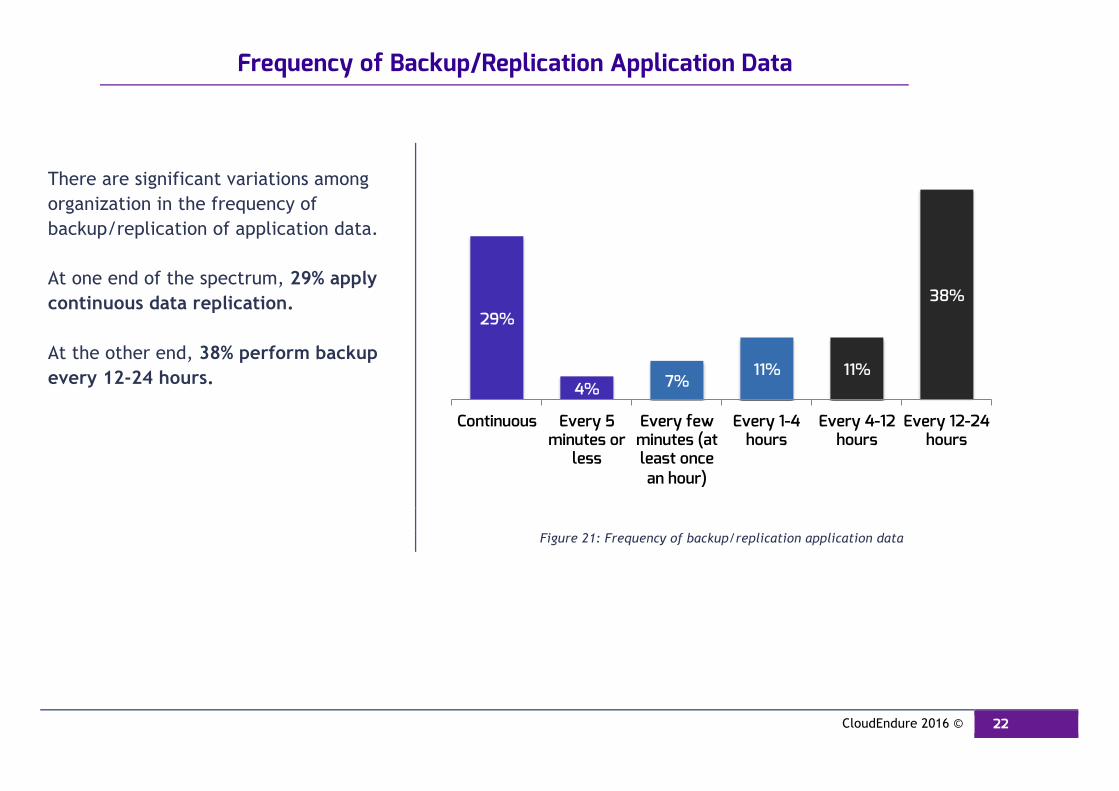
Frequency of Backup/Replication Application Data
There are significant variations among organization in the frequency of backup/replication of application data. At one end of the spectrum, 29% apply continuous data replication. At the other end, 38% perform backup every 12-24 hours.
Figure 21: Frequency of backup/replication application data
29%
4% 7% 11% 11%
38%
Continuous Every 5 minutes or
less
Every few minutes (at least once an hour)
Every 1-4 hours
Every 4-12 hours
Every 12-24 hours
CloudEndure 2016 © 23
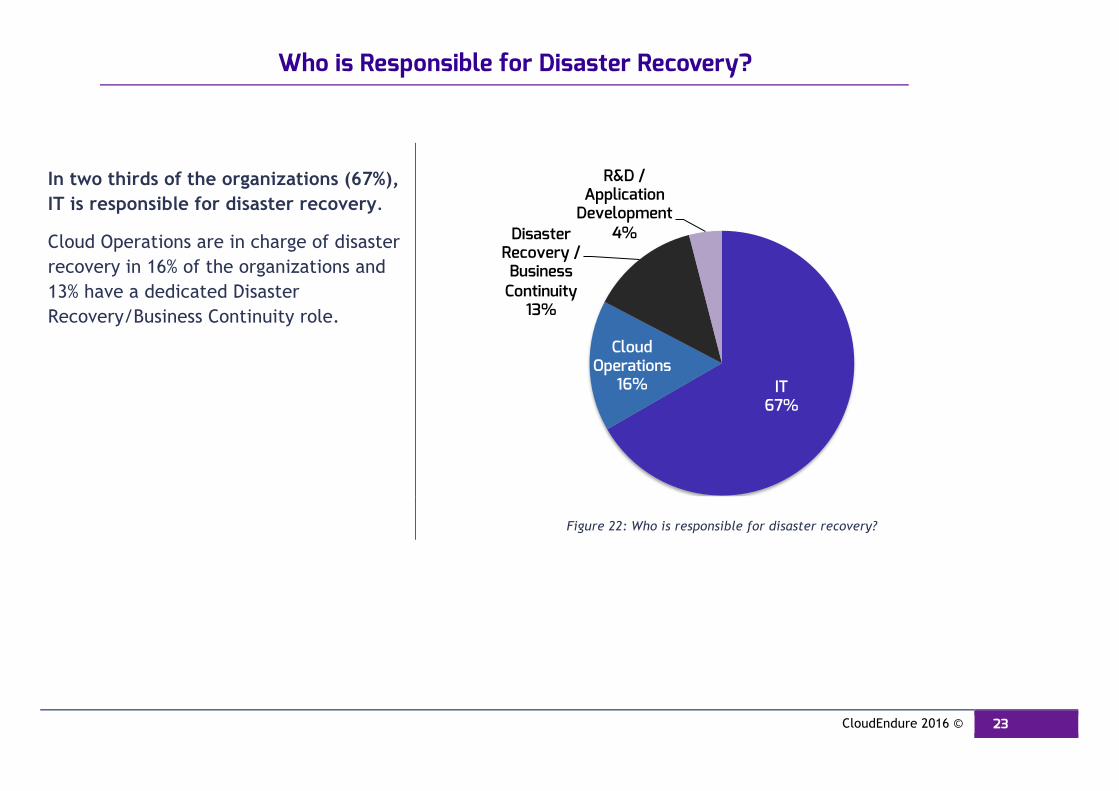
Who is Responsible for Disaster Recovery?
In two thirds of the organizations (67%), IT is responsible for disaster recovery.
Cloud Operations are in charge of disaster recovery in 16% of the organizations and 13% have a dedicated Disaster Recovery/Business Continuity role.
Figure 22: Who is responsible for disaster recovery?
IT 67%
Cloud Operations
16%
Disaster Recovery / Business
Continuity 13%
R&D / Application
Development 4%
CloudEndure 2016 © 24
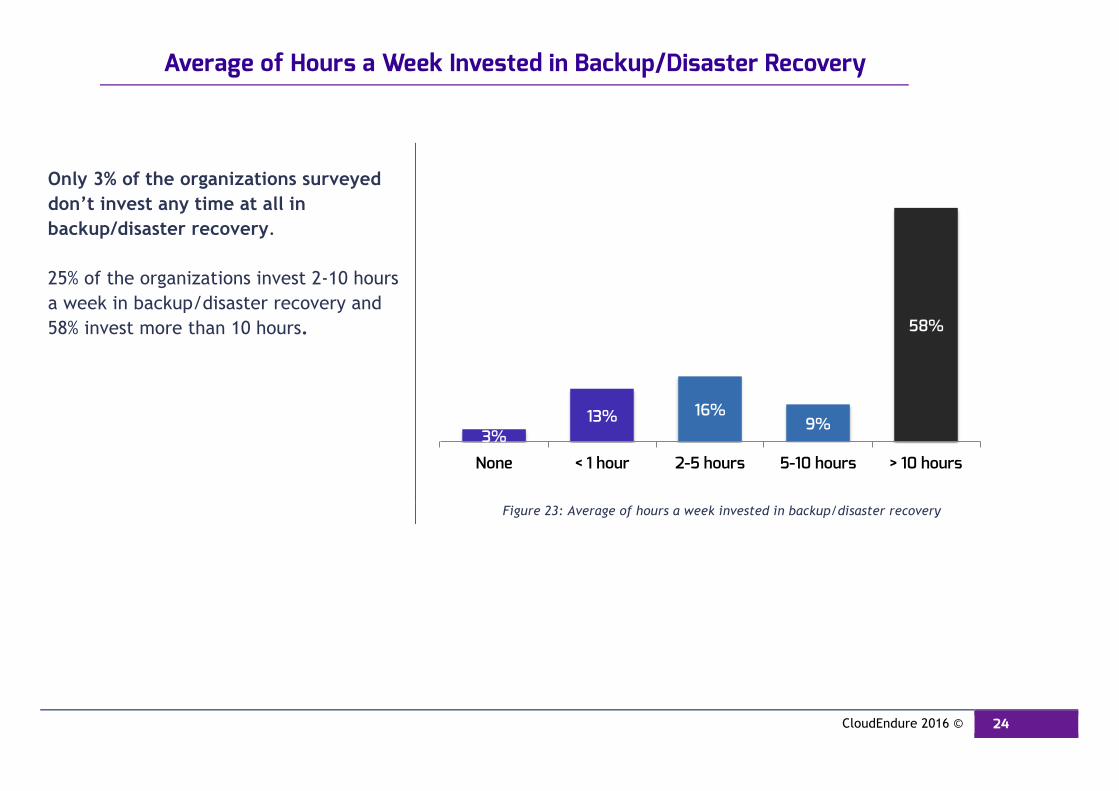
Average of Hours a Week Invested in Backup/Disaster Recovery
Only 3% of the organizations surveyed don’t invest any time at all in backup/disaster recovery. 25% of the organizations invest 2-10 hours a week in backup/disaster recovery and 58% invest more than 10 hours.
Figure 23: Average of hours a week invested in backup/disaster recovery
3% 13% 16%
9%
58%
None < 1 hour 2-5 hours 5-10 hours > 10 hours
CloudEndure 2016 © 25
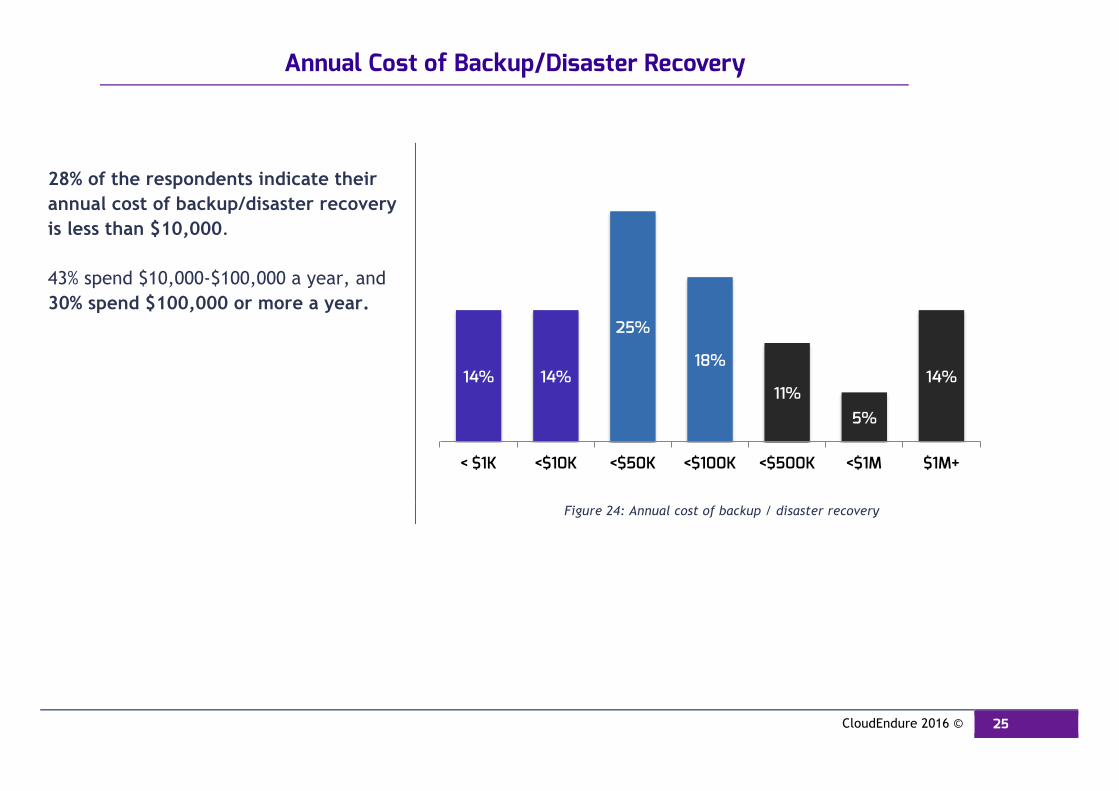
Annual Cost of Backup/Disaster Recovery
28% of the respondents indicate their annual cost of backup/disaster recovery is less than $10,000. 43% spend $10,000-$100,000 a year, and 30% spend $100,000 or more a year.
Figure 24: Annual cost of backup / disaster recovery
14% 14%
25%
18%
11% 5%
14%
< $1K <$10K <$50K <$100K <$500K <$1M $1M+
CloudEndure 2016 © 26
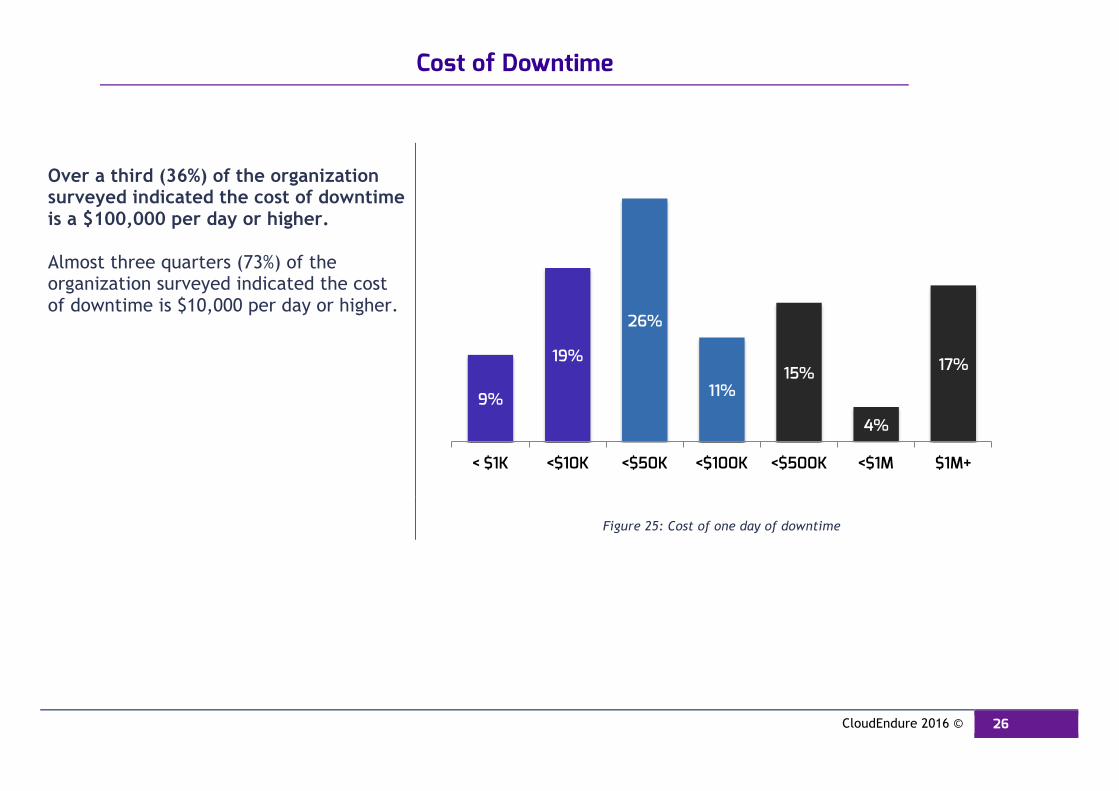
Cost of Downtime
Over a third (36%) of the organization surveyed indicated the cost of downtime is a $100,000 per day or higher. Almost three quarters (73%) of the organization surveyed indicated the cost of downtime is $10,000 per day or higher.
Figure 25: Cost of one day of downtime
9%
19%
26%
11% 15%
4%
17%
< $1K <$10K <$50K <$100K <$500K <$1M $1M+
CloudEndure 2016 © 27
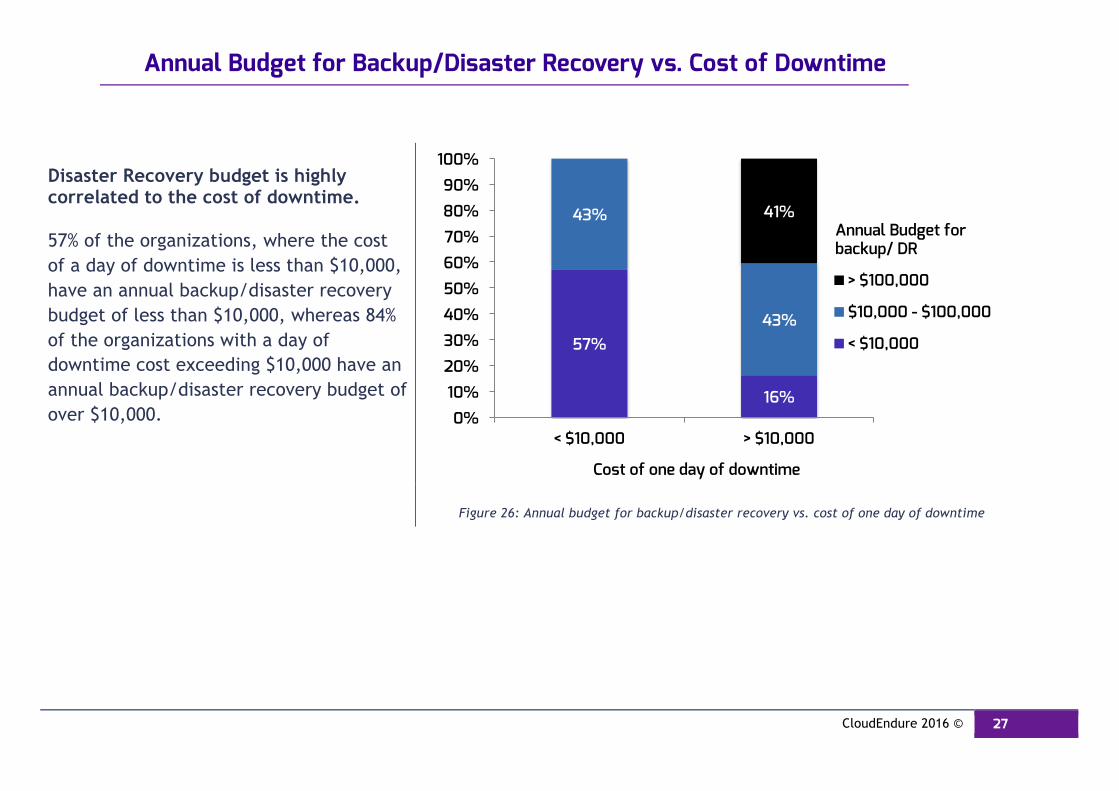
Annual Budget for Backup/Disaster Recovery vs. Cost of Downtime
Disaster Recovery budget is highly correlated to the cost of downtime. 57% of the organizations, where the cost of a day of downtime is less than $10,000, have an annual backup/disaster recovery budget of less than $10,000, whereas 84% of the organizations with a day of downtime cost exceeding $10,000 have an annual backup/disaster recovery budget of over $10,000.
Figure 26: Annual budget for backup/disaster recovery vs. cost of one day of downtime
57%
16%
43%
43%
41%
0%
10%
20%
30%
40%
50%
60%
70%
80%
90%
100%
< $10,000 > $10,000
> $100,000
$10,000 - $100,000
< $10,000
Annual Budget for backup/ DR
Cost of one day of downtime
CloudEndure 2016 © 28
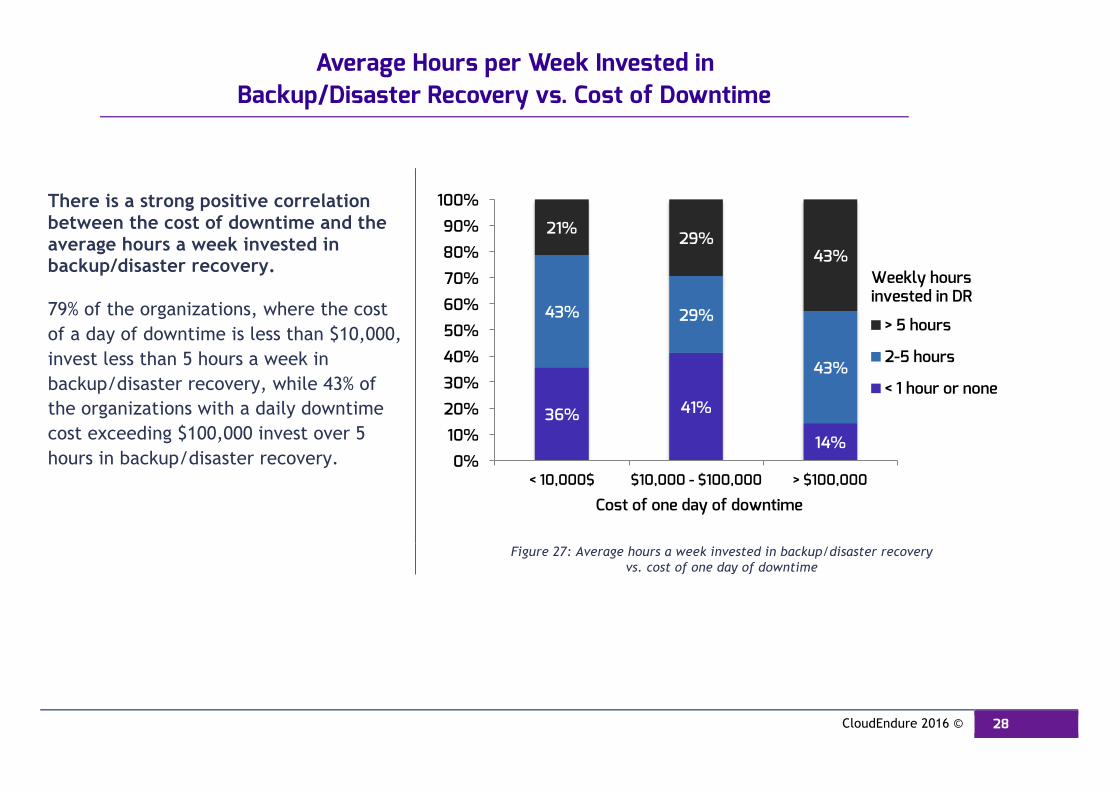
Average Hours per Week Invested in Backup/Disaster Recovery vs. Cost of Downtime
There is a strong positive correlation between the cost of downtime and the average hours a week invested in backup/disaster recovery. 79% of the organizations, where the cost of a day of downtime is less than $10,000, invest less than 5 hours a week in backup/disaster recovery, while 43% of the organizations with a daily downtime cost exceeding $100,000 invest over 5 hours in backup/disaster recovery.
Figure 27: Average hours a week invested in backup/disaster recovery vs. cost of one day of downtime
36% 41%
14%
43% 29%
43%
21% 29%
43%
0%
10%
20%
30%
40%
50%
60%
70%
80%
90%
100%
< 10,000$ $10,000 - $100,000 > $100,000
> 5 hours
2-5 hours
< 1 hour or none
Weekly hours invested in DR
Cost of one day of downtime
CloudEndure 2016 © 29
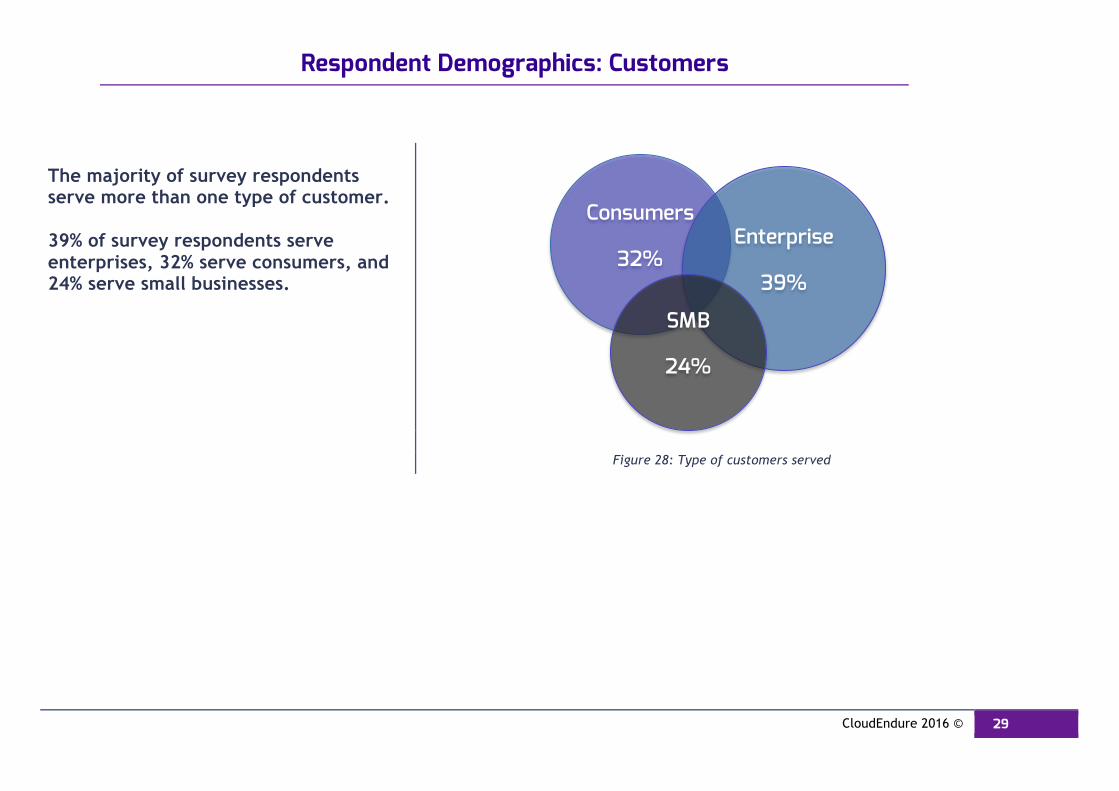
Respondent Demographics: Customers
The majority of survey respondents serve more than one type of customer. 39% of survey respondents serve enterprises, 32% serve consumers, and 24% serve small businesses.
Figure 28: Type of customers served
Consumers
32% Enterprise
39%
SMB
24%
CloudEndure 2016 © 30
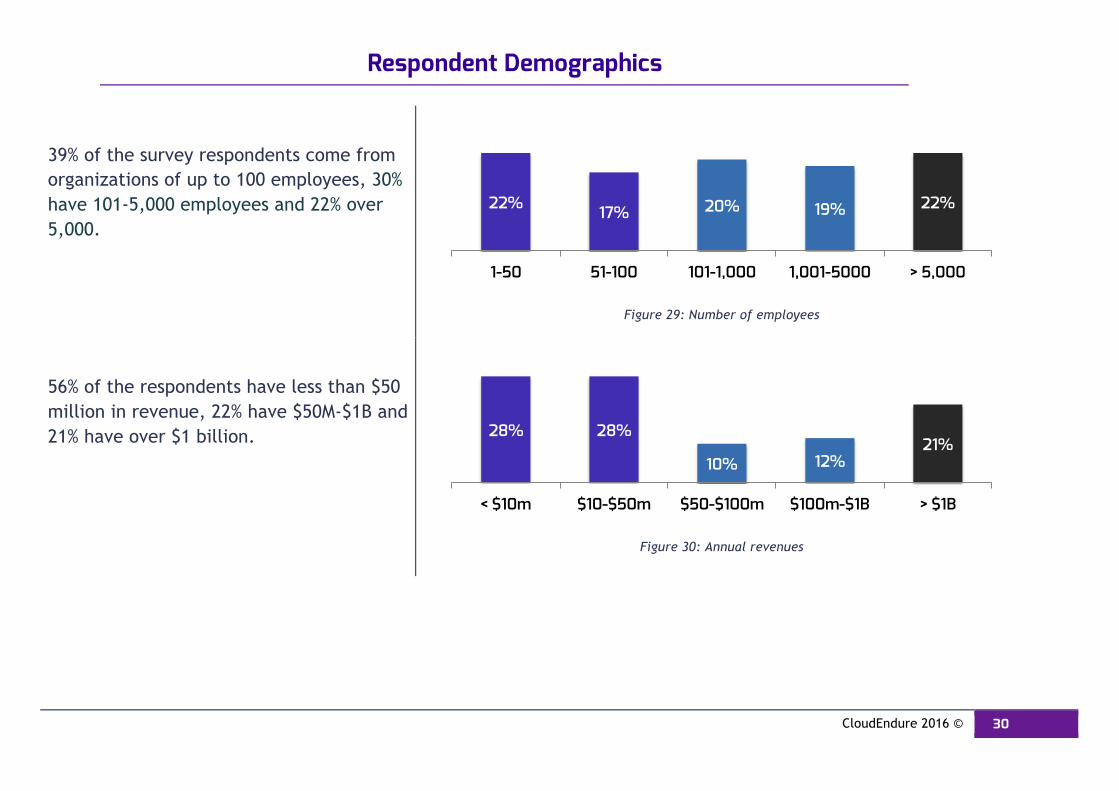
Respondent Demographics
39% of the survey respondents come from organizations of up to 100 employees, 30% have 101-5,000 employees and 22% over 5,000.
Figure 29: Number of employees
56% of the respondents have less than $50 million in revenue, 22% have $50M-$1B and 21% have over $1 billion.
Figure 30: Annual revenues
22% 17% 20% 19% 22%
1-50 51-100 101-1,000 1,001-5000 > 5,000
28% 28%
10% 12% 21%
< $10m $10-$50m $50-$100m $100m-$1B > $1B
CloudEndure 2016 © 31
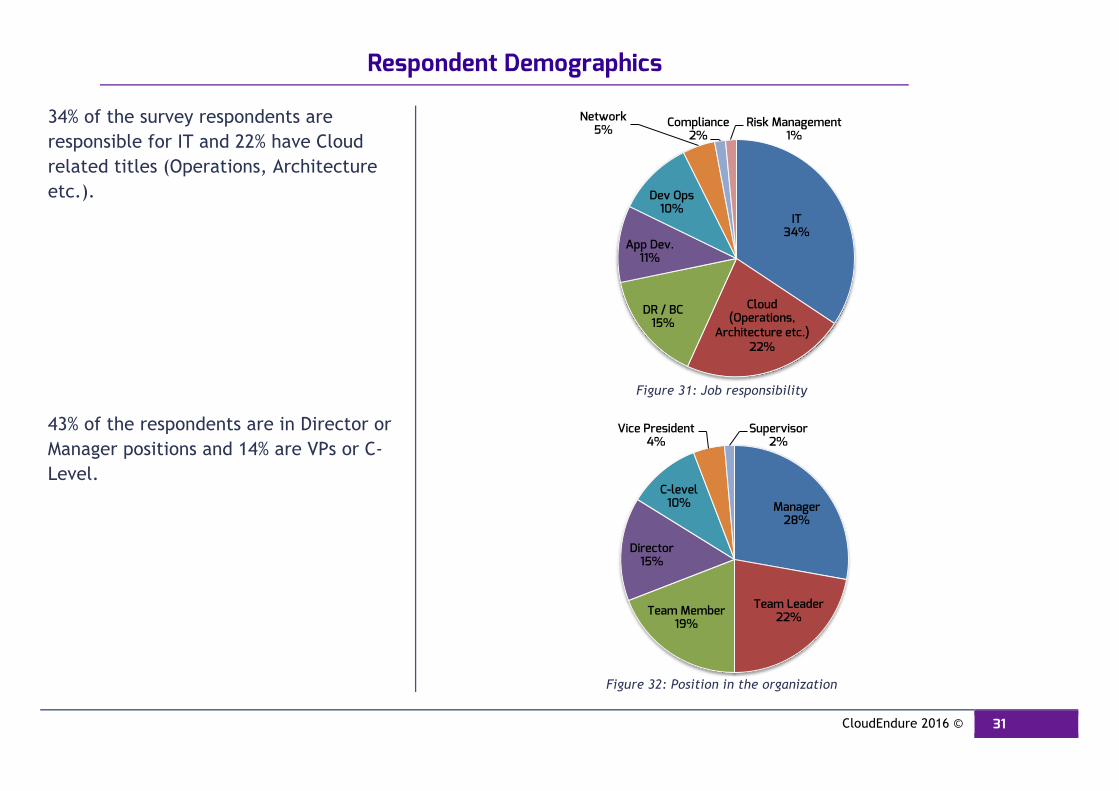
Respondent Demographics
34% of the survey respondents are responsible for IT and 22% have Cloud related titles (Operations, Architecture etc.).
Figure 31: Job responsibility
43% of the respondents are in Director or Manager positions and 14% are VPs or C-Level.
Figure 32: Position in the organization
IT 34%
Cloud (Operations,
Architecture etc.) 22%
DR / BC 15%
App Dev. 11%
Dev Ops 10%
Network 5% Compliance
2% Risk Management
1%
Manager 28%
Team Leader 22% Team Member
19%
Director 15%
C-level 10%
Vice President 4%
Supervisor 2%
CloudEndure 2016 © 32
Table of Figures
Figure 1: Production infrastructure provider ........................................................................................................................................................ 4 Figure 2: Disaster recover target infrastructure provider ......................................................................................................................................... 5 Figure 3: Source vs. Target Platforms ................................................................................................................................................................. 6 Figure 4: Production Machines with Disaster Recovery (Today and Next Year) ................................................................................................................. 7 Figure 5: How critical is service availability to your customers? ................................................................................................................................. 8 Figure 6: Service availability goals .................................................................................................................................................................... 9 Figure 7: Definition of downtime ..................................................................................................................................................................... 10 Figure 8: Meeting service availability goals ......................................................................................................................................................... 11 Figure 9: Last downtime event ........................................................................................................................................................................ 12 Figure 10: Service availability measurement tools and services ................................................................................................................................. 13 Figure 11: Communicating system availability statistics to customers ......................................................................................................................... 14 Figure 12: RPO ............................................................................................................................................................................................ 15 Figure 13: RTO ........................................................................................................................................................................................... 16 Figure 14: Meeting RPO goals .......................................................................................................................................................................... 16 Figure 15: Meeting RTO goals .......................................................................................................................................................................... 16 Figure 16: How Frequently is the system down for scheduled maintenance? .................................................................................................................. 17 Figure 17: Average monthly planned downtime .................................................................................................................................................... 18 Figure 18: Primary risks to system availability (1-10 scale) ...................................................................................................................................... 19 Figure 19: Primary challenges in meeting availability goals ..................................................................................................................................... 20 Figure 20: Strategies and technologies to ensure system availability and data protection ................................................................................................. 21 Figure 21: Frequency of backup/replication application data ................................................................................................................................... 22 Figure 22: Who is responsible for disaster recovery? .............................................................................................................................................. 23 Figure 23: Average of hours a week invested in backup/disaster recovery .................................................................................................................... 24 Figure 24: Annual cost of backup / disaster recovery ............................................................................................................................................. 25 Figure 25: Cost of one day of downtime ............................................................................................................................................................. 26 Figure 26: Annual budget for backup/disaster recovery vs. cost of one day of downtime .................................................................................................. 27 Figure 27: Average hours a week invested in backup/disaster recovery vs. cost of one day of downtime .............................................................................. 28 Figure 28: Type of customers served ................................................................................................................................................................. 29 Figure 29: Number of employees ...................................................................................................................................................................... 30 Figure 30: Annual revenues ............................................................................................................................................................................ 30 Figure 31: Job responsibility ........................................................................................................................................................................... 31
CloudEndure 2016 © 33
Figure 32: Position in the organization .............................................................................................................................................................. 31
About CloudEndure Business as Usual. Always.
CloudEndure provides Cloud Migration and Cloud Disaster Recovery for any application, allowing companies to mobilize entire applications with their data to and across clouds with near zero downtime and no data loss. CloudEndure enables truly consistent, block-level, real-time replication using continuous data protection (CDP). Founded in 2012, CloudEndure’s Cloud Workload Mobility technology creates an exact copy of the entire application at an alternative cloud location – at the touch of a button, within minutes, and with the latest data. CloudEndure supports physical, virtualized or cloud-based applications as the source and Amazon Web Services (AWS), Google Cloud Platform (GCP), Microsoft’s Azure and OpenStack as target cloud locations. For more information, visit www.CloudEndure.com.