Embed Size (px)
Citation preview
24/08/2016
2016 INTERIM RESULTS CORPORATE PRESENTATION
This presentation and subsequent discussions may contain forward-looking
statements that involve risks and uncertainties. These statements are generally
indicated by the use of forward-looking terminology such as believe, expect,
anticipate, estimate, plan, project, target, may, will or may be expressed to be
results of actions that may or are expected to occur in the future. You should
not place undue reliance on these forward-looking statements, which reflect
our belief only as of the date of this presentation. These forward-looking
statements are based on our own information and on information from other
sources we believe to be reliable. Our actual results may be materially less
favorable than those expressed or implied by these forward-looking statements
which could depress the market price of our shares.
Forward-Looking Statement Disclaimer
1
2016 Interim Results Macro Economy and Industries
Highlights of 1H2016
Business Review
Financial Review
Contents
2
Prospects Challenges and Opportunities
Development Strategies
MACRO ECONOMY
AND INDUSTRIES
3
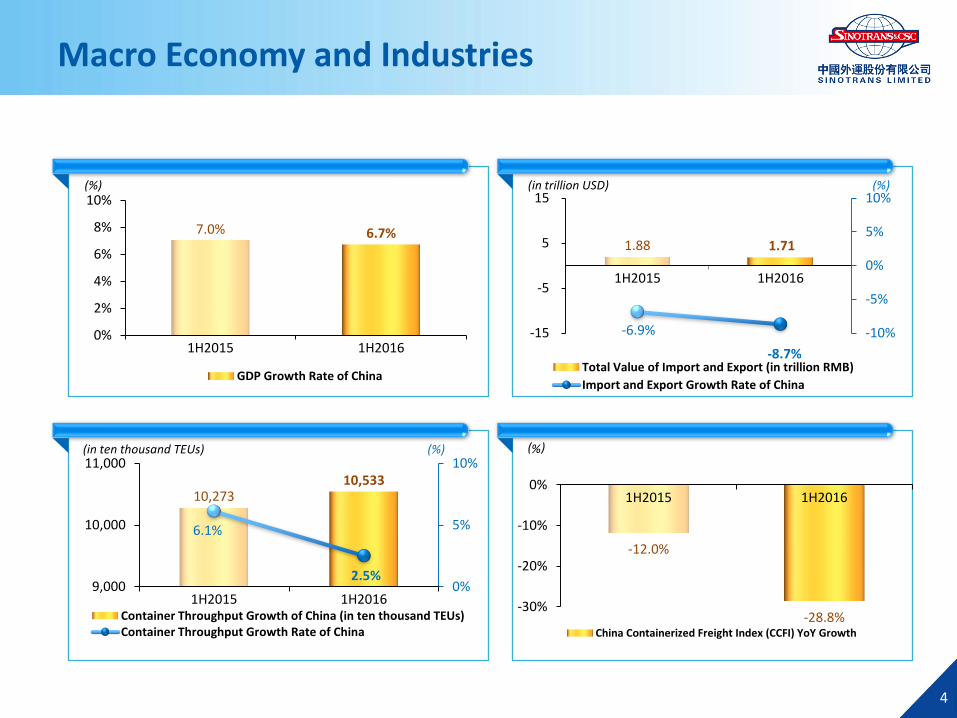
Macro Economy and Industries
10,273 10,533
6.1%
2.5% 0%
5%
10%
9,000
10,000
11,000
1H2015 1H2016 Container Throughput Growth of China (in ten thousand TEUs) Container Throughput Growth Rate of China
(%) (in ten thousand TEUs)
(%)
7.0% 6.7%
0%
2%
4%
6%
8%
10%
1H2015 1H2016
GDP Growth Rate of China
1.88 1.71
-6.9%
-8.7%
-10%
-5%
0%
5%
10%
-15
-5
5
15
1H2015 1H2016
Total Value of Import and Export (in trillion RMB)
Import and Export Growth Rate of China
(%) (in trillion USD)
4
(%)
-12.0%
-28.8% -30%
-20%
-10%
0% 1H2015 1H2016
China Containerized Freight Index (CCFI) YoY Growth
HIGHLIGHTS OF 1H2016
5
Achievements
6 6
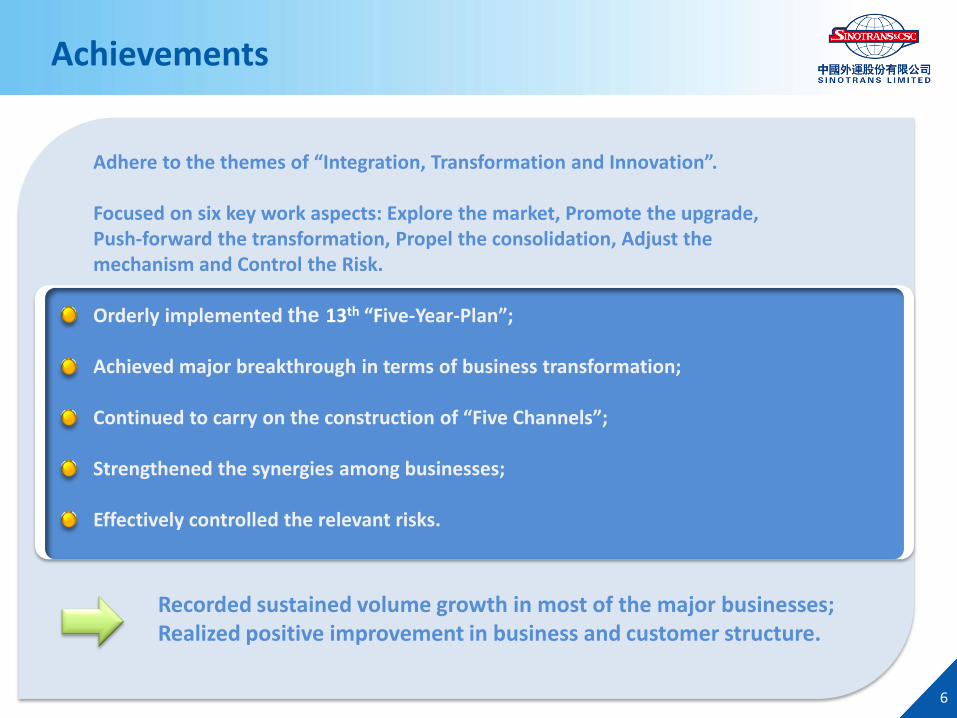
Adhere to the themes of “Integration, Transformation and Innovation”. Focused on six key work aspects: Explore the market, Promote the upgrade, Push-forward the transformation, Propel the consolidation, Adjust the mechanism and Control the Risk. Orderly implemented the 13th “Five-Year-Plan”; Achieved major breakthrough in terms of business transformation; Continued to carry on the construction of “Five Channels”; Strengthened the synergies among businesses; Effectively controlled the relevant risks.
Recorded sustained volume growth in most of the major businesses; Realized positive improvement in business and customer structure.
Financial Highlights
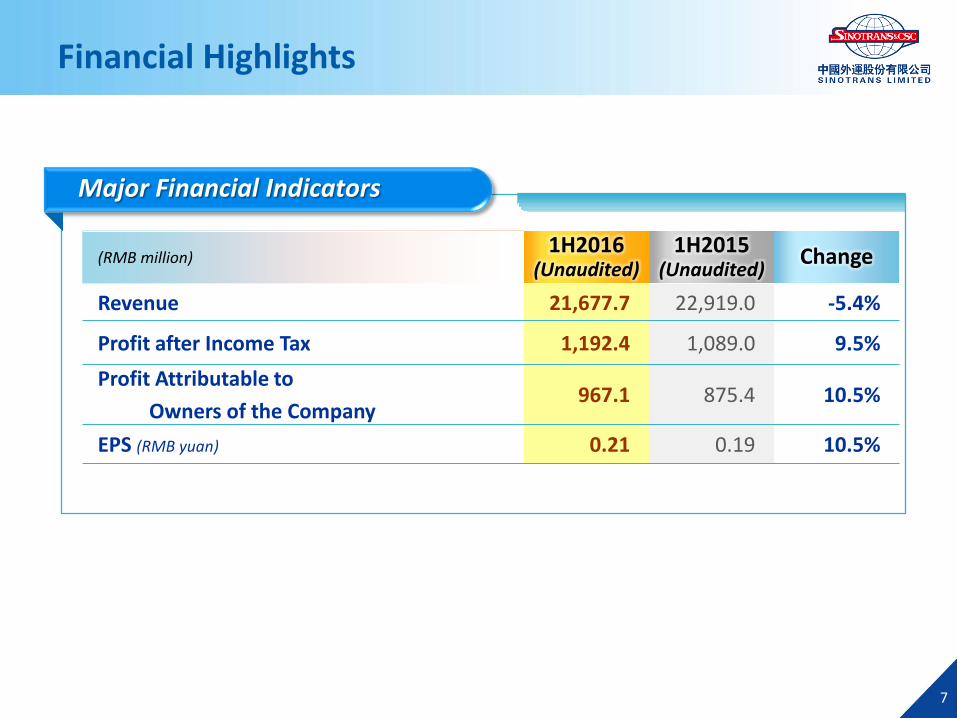
(RMB million) 1H2016
(Unaudited) 1H2015
(Unaudited) Change
Revenue 21,677.7 22,919.0 -5.4%
Profit after Income Tax 1,192.4 1,089.0 9.5%
Profit Attributable to
Owners of the Company 967.1 875.4 10.5%
EPS (RMB yuan) 0.21 0.19 10.5%
Major Financial Indicators
7
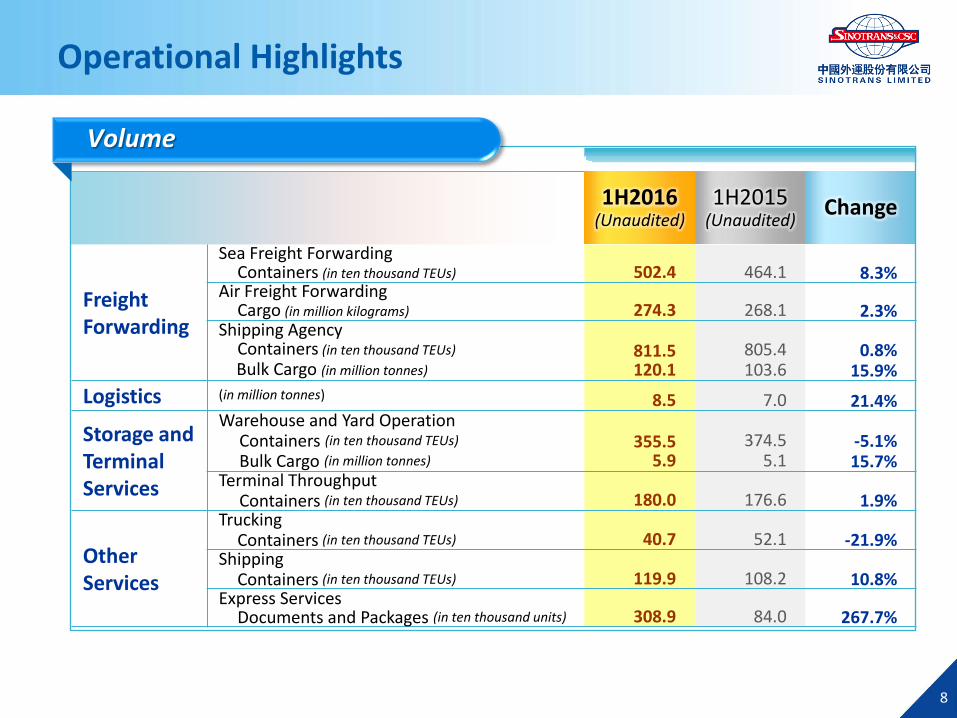
Operational Highlights
1H2016 (Unaudited)
1H2015 (Unaudited)
Change
Freight Forwarding
Sea Freight Forwarding Containers (in ten thousand TEUs) 502.4 464.1 8.3%
Air Freight Forwarding Cargo (in million kilograms) 274.3 268.1 2.3%
Shipping Agency Containers (in ten thousand TEUs)
Bulk Cargo (in million tonnes)
811.5 120.1
805.4 103.6
0.8% 15.9%
Logistics (in million tonnes) 8.5 7.0 21.4%
Storage and Terminal Services
Warehouse and Yard Operation Containers (in ten thousand TEUs)
Bulk Cargo (in million tonnes) 355.5
5.9
374.5
5.1 -5.1% 15.7%
Terminal Throughput Containers (in ten thousand TEUs) 180.0 176.6 1.9%
Other Services
Trucking Containers (in ten thousand TEUs) 40.7 52.1 -21.9% Shipping Containers (in ten thousand TEUs)
119.9 108.2 10.8%
Express Services Documents and Packages (in ten thousand units) 308.9
84.0 267.7%
Volume
8
BUSINESS REVIEW
9
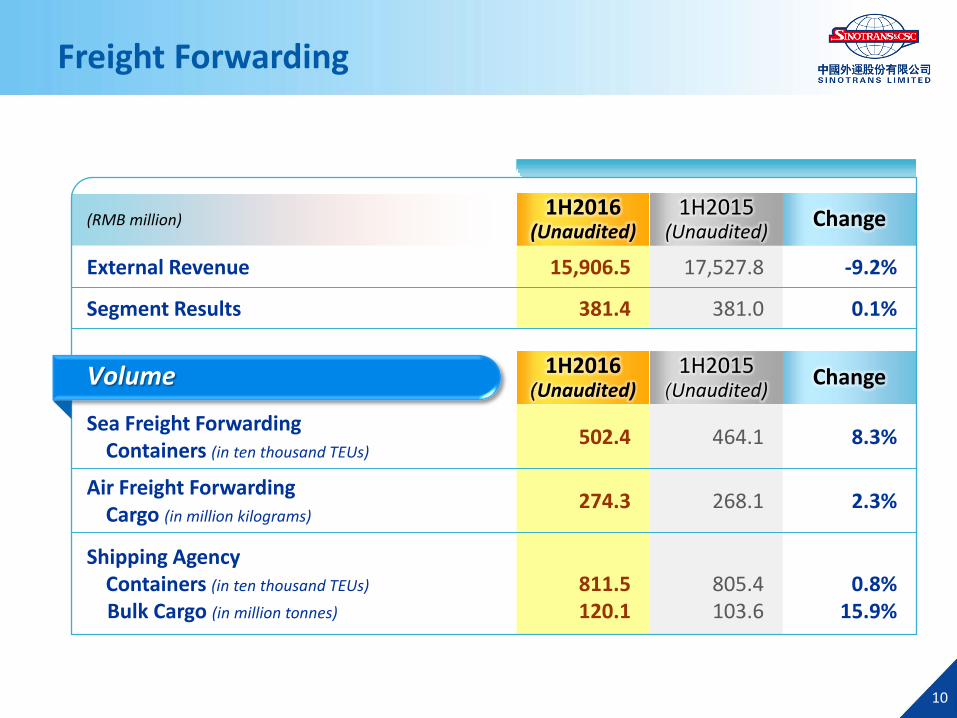
Freight Forwarding
1H2016 (Unaudited)
1H2015 (Unaudited)
Change
Sea Freight Forwarding Containers (in ten thousand TEUs)
502.4 464.1 8.3%
Air Freight Forwarding Cargo (in million kilograms)
274.3 268.1 2.3%
Shipping Agency Containers (in ten thousand TEUs)
Bulk Cargo (in million tonnes)
811.5 120.1
805.4 103.6
0.8%
15.9%
(RMB million) 1H2016
(Unaudited) 1H2015
(Unaudited) Change
External Revenue 15,906.5 17,527.8 -9.2%
Segment Results 381.4 381.0 0.1%
Volume
10
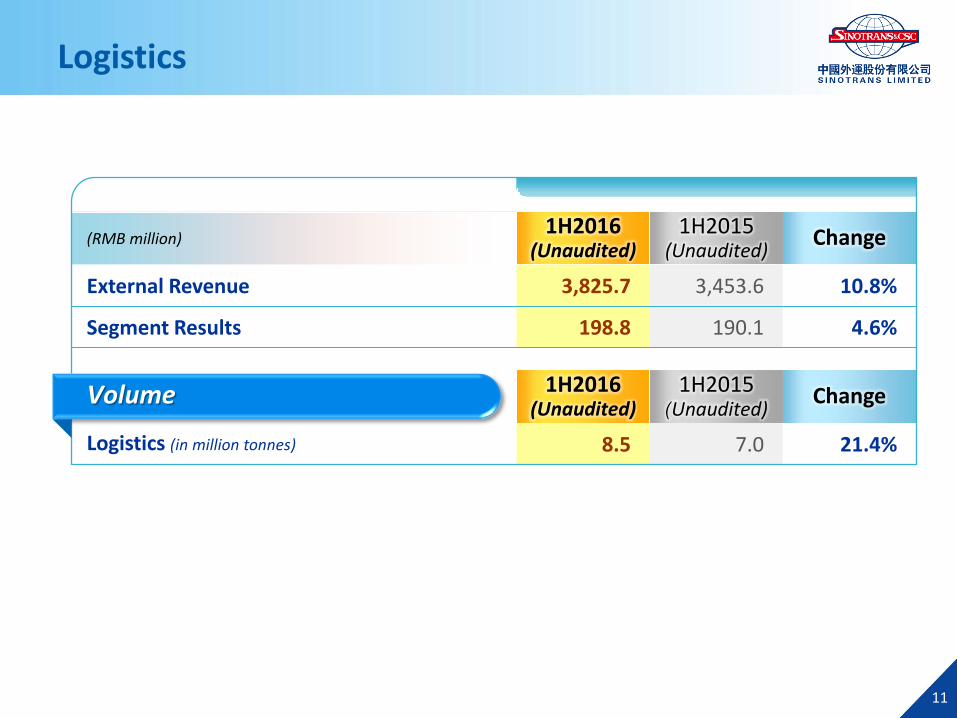
Logistics
1H2016 (Unaudited)
1H2015 (Unaudited)
Change
Logistics (in million tonnes) 8.5 7.0 21.4%
(RMB million) 1H2016
(Unaudited) 1H2015
(Unaudited) Change
External Revenue 3,825.7 3,453.6 10.8%
Segment Results 198.8 190.1 4.6%
Volume
11
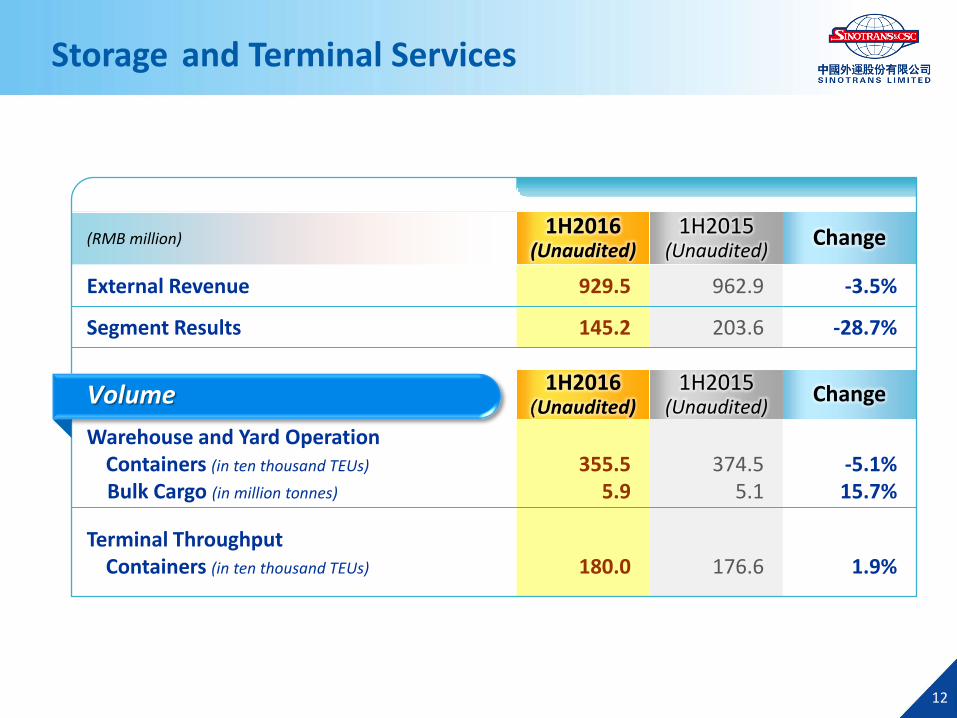
Storage and Terminal Services
1H2016 (Unaudited)
1H2015 (Unaudited)
Change
Warehouse and Yard Operation Containers (in ten thousand TEUs) Bulk Cargo (in million tonnes)
355.5
5.9
374.5
5.1
-5.1% 15.7%
Terminal Throughput Containers (in ten thousand TEUs)
180.0
176.6
1.9%
(RMB million) 1H2016
(Unaudited) 1H2015
(Unaudited) Change
External Revenue 929.5 962.9 -3.5%
Segment Results 145.2 203.6 -28.7%
Volume
12
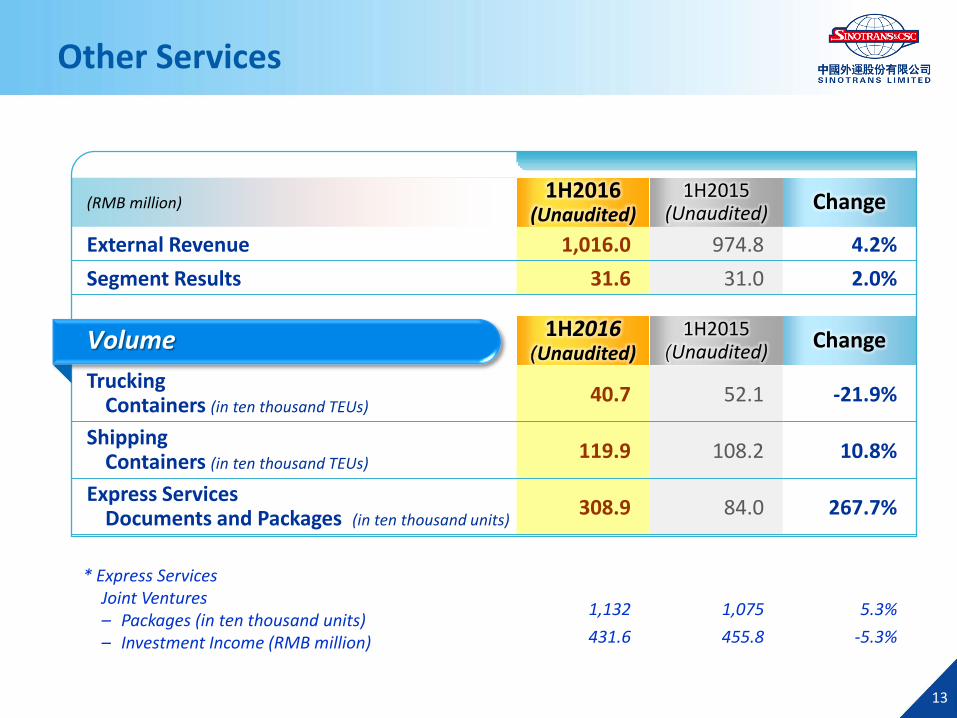
Other Services
* Express Services Joint Ventures – Packages (in ten thousand units) – Investment Income (RMB million)
1,132
431.6
1,075
455.8
5.3%
-5.3%
1H2016 (Unaudited)
1H2015 (Unaudited)
Change
Trucking Containers (in ten thousand TEUs)
40.7 52.1 -21.9%
Shipping Containers (in ten thousand TEUs)
119.9 108.2 10.8%
Express Services Documents and Packages (in ten thousand units)
308.9 84.0 267.7%
(RMB million) 1H2016
(Unaudited) 1H2015
(Unaudited) Change
External Revenue 1,016.0 974.8 4.2%
Segment Results 31.6 31.0 2.0%
Volume
13

FINANCIAL REVIEW
14
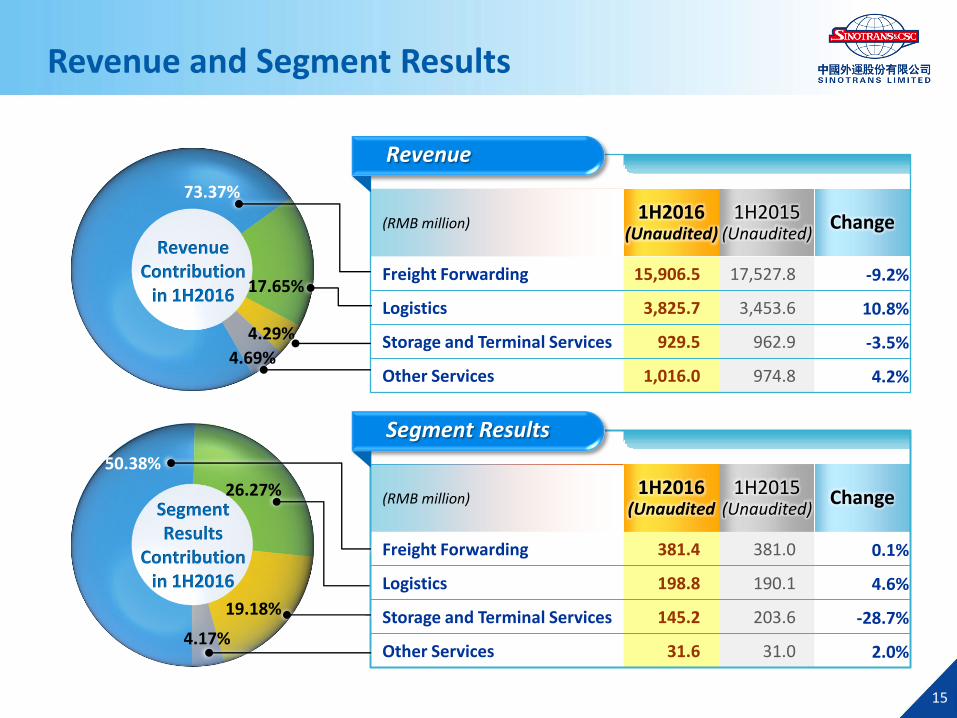
Revenue and Segment Results
(RMB million) 1H2016
(Unaudited) 1H2015
(Unaudited) Change
Freight Forwarding 15,906.5 17,527.8 -9.2%
Logistics 3,825.7 3,453.6 10.8%
Storage and Terminal Services 929.5 962.9 -3.5%
Other Services 1,016.0 974.8 4.2%
Revenue
(RMB million) 1H2016
(Unaudited 1H2015
(Unaudited) Change
Freight Forwarding 381.4 381.0 0.1%
Logistics 198.8 190.1 4.6%
Storage and Terminal Services 145.2 203.6 -28.7%
Other Services 31.6 31.0 2.0%
Segment Results
73.37%
17.65%
4.29%
4.69%
26.27%
19.18%
4.17%
Revenue Contribution
in 1H2016
50.38%
Segment Results
Contribution in 1H2016
15
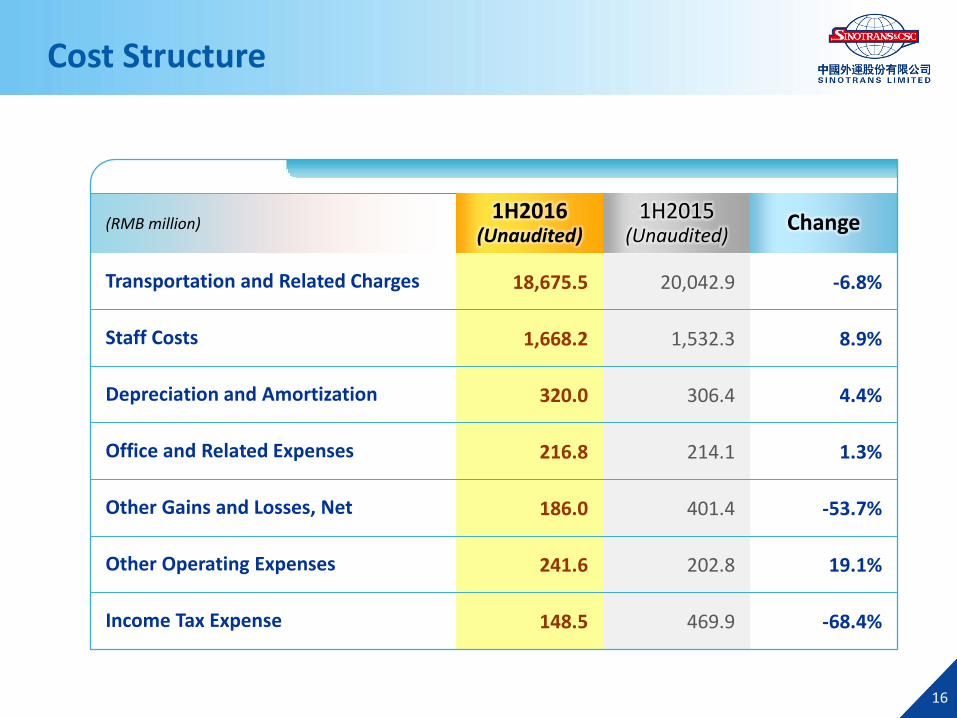
Cost Structure
(RMB million) 1H2016
(Unaudited) 1H2015
(Unaudited) Change
Transportation and Related Charges 18,675.5 20,042.9 -6.8%
Staff Costs 1,668.2 1,532.3 8.9%
Depreciation and Amortization 320.0 306.4 4.4%
Office and Related Expenses 216.8 214.1 1.3%
Other Gains and Losses, Net 186.0 401.4 -53.7%
Other Operating Expenses 241.6 202.8 19.1%
Income Tax Expense 148.5 469.9 -68.4%
16
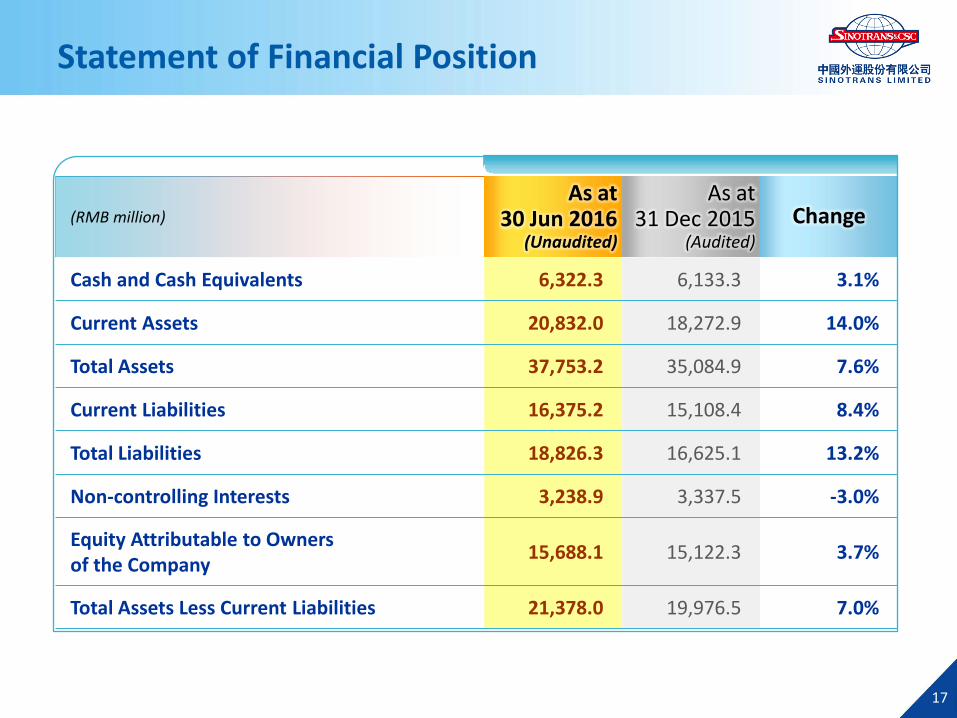
Statement of Financial Position
17
(RMB million)
As at 30 Jun 2016
(Unaudited)
As at 31 Dec 2015
(Audited)
Change
Cash and Cash Equivalents 6,322.3 6,133.3 3.1%
Current Assets 20,832.0 18,272.9 14.0%
Total Assets 37,753.2 35,084.9 7.6%
Current Liabilities 16,375.2 15,108.4 8.4%
Total Liabilities 18,826.3 16,625.1 13.2%
Non-controlling Interests 3,238.9 3,337.5 -3.0%
Equity Attributable to Owners of the Company
15,688.1 15,122.3 3.7%
Total Assets Less Current Liabilities 21,378.0 19,976.5 7.0%
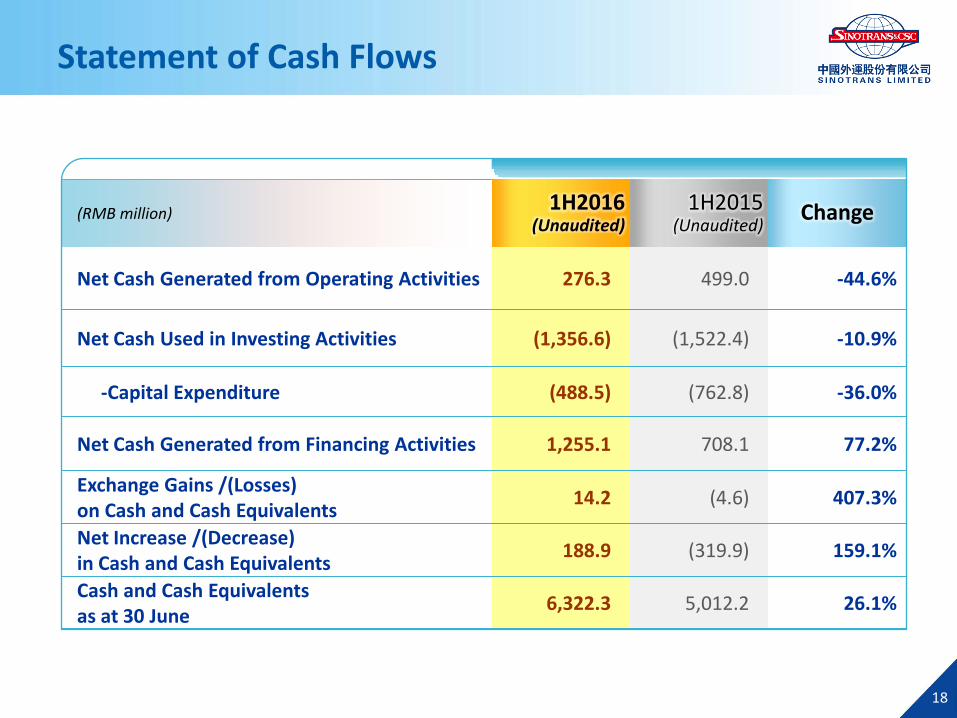
Statement of Cash Flows
(RMB million) 1H2016
(Unaudited) 1H2015
(Unaudited) Change
Net Cash Generated from Operating Activities 276.3 499.0 -44.6%
Net Cash Used in Investing Activities (1,356.6) (1,522.4) -10.9%
-Capital Expenditure (488.5) (762.8) -36.0%
Net Cash Generated from Financing Activities 1,255.1 708.1 77.2%
Exchange Gains /(Losses) on Cash and Cash Equivalents
14.2 (4.6) 407.3%
Net Increase /(Decrease) in Cash and Cash Equivalents
188.9 (319.9) 159.1%
Cash and Cash Equivalents as at 30 June
6,322.3 5,012.2 26.1%
18
PROSPECTS
19
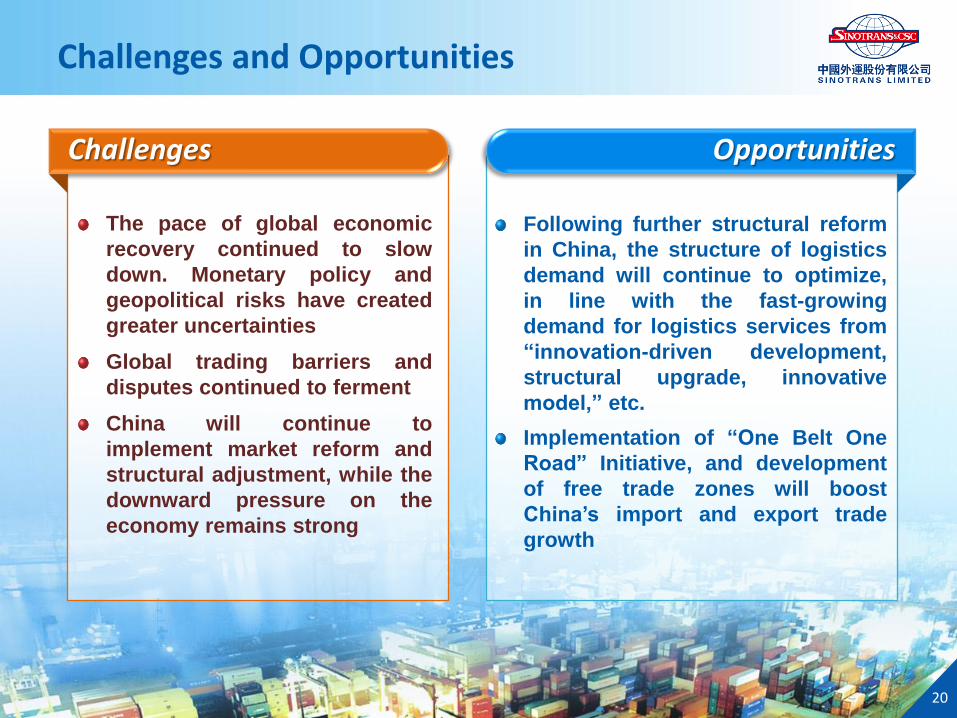
Challenges and Opportunities
20
The pace of global economic
recovery continued to slow
down. Monetary policy and
geopolitical risks have created
greater uncertainties
Global trading barriers and
disputes continued to ferment
China will continue to
implement market reform and
structural adjustment, while the
downward pressure on the
economy remains strong
Following further structural reform
in China, the structure of logistics
demand will continue to optimize,
in line with the fast-growing
demand for logistics services from
“innovation-driven development,
structural upgrade, innovative
model,” etc.
Implementation of “One Belt One
Road” Initiative, and development
of free trade zones will boost
China’s import and export trade
growth
Opportunities Challenges
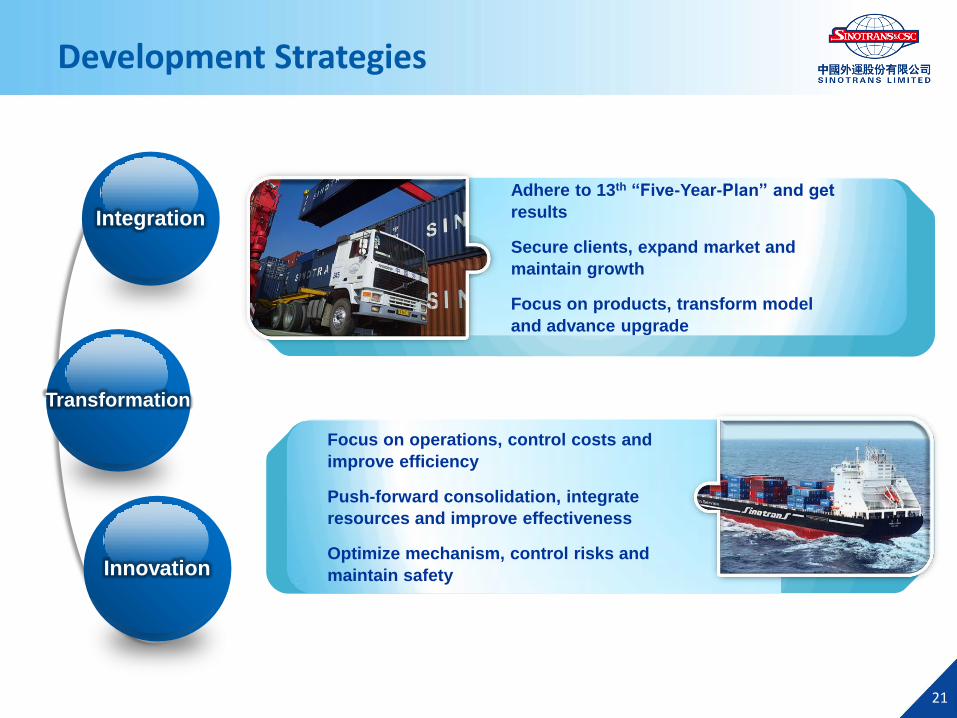
Development Strategies
Innovation
21
Integration
Focus on operations, control costs and
improve efficiency
Push-forward consolidation, integrate
resources and improve effectiveness
Optimize mechanism, control risks and
maintain safety
Adhere to 13th “Five-Year-Plan” and get
results
Secure clients, expand market and
maintain growth
Focus on products, transform model
and advance upgrade
Integration
Transformation
22
Securities and Legal Affairs Dept Sinotrans Limited
Tel : +8610 5229 6667 Fax : +8610 5229 6655 Email : [email protected] Website : www.sinotrans.com
IR Contact