Embed Size (px)
Citation preview
Overview of MarylandLocal Governments
Finances and Demographic Information
DEPARTMENT OF LEGISLATIVE SERVICES 2016
Overview of Maryland Local Governments
Finances and Demographic Information
Department of Legislative Services
Office of Policy Analysis
Annapolis, Maryland
January 2016
For further information concerning this document contact: Library and Information Services
Office of Policy Analysis
Department of Legislative Services
90 State Circle
Annapolis, Maryland 21401
Baltimore Area: 410-946-5400 • Washington Area: 301-970-5400
Other Areas: 1-800-492-7122, Extension 5400
TDD: 410-946-5401 • 301-970-5401
Maryland Relay Service: 1-800-735-2258
E-mail: [email protected]
Home Page: http://mgaleg.maryland.gov
The Department of Legislative Services does not discriminate on the basis of age, ancestry, color, creed, marital status, national origin,
race, religion, gender, gender identity, sexual orientation, or disability in the admission or access to its programs, services, or
activities. The Department's Information Officer has been designated to coordinate compliance with the nondiscrimination
requirements contained in Section 35.107 of the Department of Justice Regulations. Requests for assistance should be directed to the
Information Officer at the telephone numbers shown above.
ii
Warren G. Deschenaux Executive Director
DEPARTMENT OF LEGISLATIVE SERVICES OFFICE OF POLICY ANALYSIS
MARYLAND GENERAL ASSEMBLY
January 25, 2016
The Honorable Thomas V. Mike Miller, Jr. , President of the Senate The Honorable Michael E. Busch, Speaker of the House of Delegates Honorable Members of the Maryland General Assembly
Ladies and Gentlemen:
The Department of Legislative Services has prepared this overview document to provide legislators and the public with a better understanding of the fiscal and social issues confronting local governments in Maryland. Topics discussed in this report include the following:
• Structure of Local Governments • County Salary Actions
• Demographic Indicators • Public School Funding and Student Enrollment
• Local Government Finances • Local General Fund Balances
• Tax Rates for Local Governments • Local Debt Measures
• Local Revenue Growth • Balance of State Payments
This report was prepared by Scott Gates, Trevor Owen, Gail Renborg, Charity Scott, and Stanford Ward, and was reviewed by Hiram Burch, Scott Kennedy, and Michael Sanelli. The manuscript was prepared by Karen Belton and Mya Dempsey. The Department of Legislative Services trusts that this report will be useful to individuals interested in local government fiscal issues.
WGD/kmb
\Ki Sincerely, ~
~~ Deschenaux Executive Director
lll

iv
v
Contents
Letter of Transmittal ........................................................................................................................................................................... iii
Executive Summary ............................................................................................................................................................................ ix
Chapter 1. Structure of Local Governments ....................................................................................................................................... 1
County Governments ............................................................................................................................................................... 2
Baltimore City .......................................................................................................................................................................... 3
Municipalities .......................................................................................................................................................................... 4
Special Taxing Districts ........................................................................................................................................................... 5
Townships and Independent School Districts ......................................................................................................................... 5
Chapter 2. Demographic Indicators .................................................................................................................................................... 7
Land Area and Population ....................................................................................................................................................... 7
Racial Composition .................................................................................................................................................................. 7
Population Growth ................................................................................................................................................................... 8
Washington and Baltimore Metropolitan Areas ...................................................................................................................... 8
Social and Economic Indicators............................................................................................................................................... 9
Chapter 3. Local Government Finances ............................................................................................................................................ 27
County Level .......................................................................................................................................................................... 27
Municipal Level ..................................................................................................................................................................... 31
Chapter 4. Tax Rates for Local Governments .................................................................................................................................. 45
County Taxes ......................................................................................................................................................................... 45
Property Tax Limitation Measures ........................................................................................................................................ 47
vi
Municipal Property Tax Rates ............................................................................................................................................... 48
Property Tax Differentials and Rebates ................................................................................................................................. 48
Development Impact Fees and Excise Taxes......................................................................................................................... 49
Chapter 5. Local Revenue Growth.................................................................................................................................................... 61
Property Taxation................................................................................................................................................................... 62
Assessable Base Growth ........................................................................................................................................................ 62
One-cent Yield on the Property Tax Rate .............................................................................................................................. 63
Property Tax Relief Measures ............................................................................................................................................... 63
Homestead Tax Credit Program ............................................................................................................................................. 63
Net Taxable Income ............................................................................................................................................................... 65
Chapter 6. County Salary Actions .................................................................................................................................................... 79
Chapter 7. Public School Funding and Student Enrollment ............................................................................................................. 87
State Commitment to Public Schools .................................................................................................................................... 87
Per Pupil Funding .................................................................................................................................................................. 87
Local Appropriations ............................................................................................................................................................. 88
Public School Construction.................................................................................................................................................... 88
Student Enrollment and Local Wealth .................................................................................................................................. 88
Chapter 8. Local General Fund Balances ....................................................................................................................................... 105
Chapter 9. Local Debt Measures ..................................................................................................................................................... 111
County Debt ......................................................................................................................................................................... 111
Comparative Measures......................................................................................................................................................... 112
Local Debt Limitations ........................................................................................................................................................ 112
Bond Ratings ........................................................................................................................................................................ 113
vii
Chapter 10. Balance of State Payments .......................................................................................................................................... 119
Calculating the Index ........................................................................................................................................................... 119
Findings................................................................................................................................................................................ 120
Appendices ....................................................................................................................................................................................... 129
1. Number of Local Governments in the United States by Type ........................................................................................ 131
2. Incorporated Cities and Towns in Maryland .................................................................................................................. 133
3. Residents Residing in Municipalities.............................................................................................................................. 137
4. Racial Composition of the United States ........................................................................................................................ 139
5. Washington and Baltimore Metropolitan Statistical Areas ............................................................................................ 141
6. Special County Property Tax Rates ................................................................................................................................ 143
7. County and Municipal Real Property Tax Rates ............................................................................................................ 145

viii
ix
Executive Summary
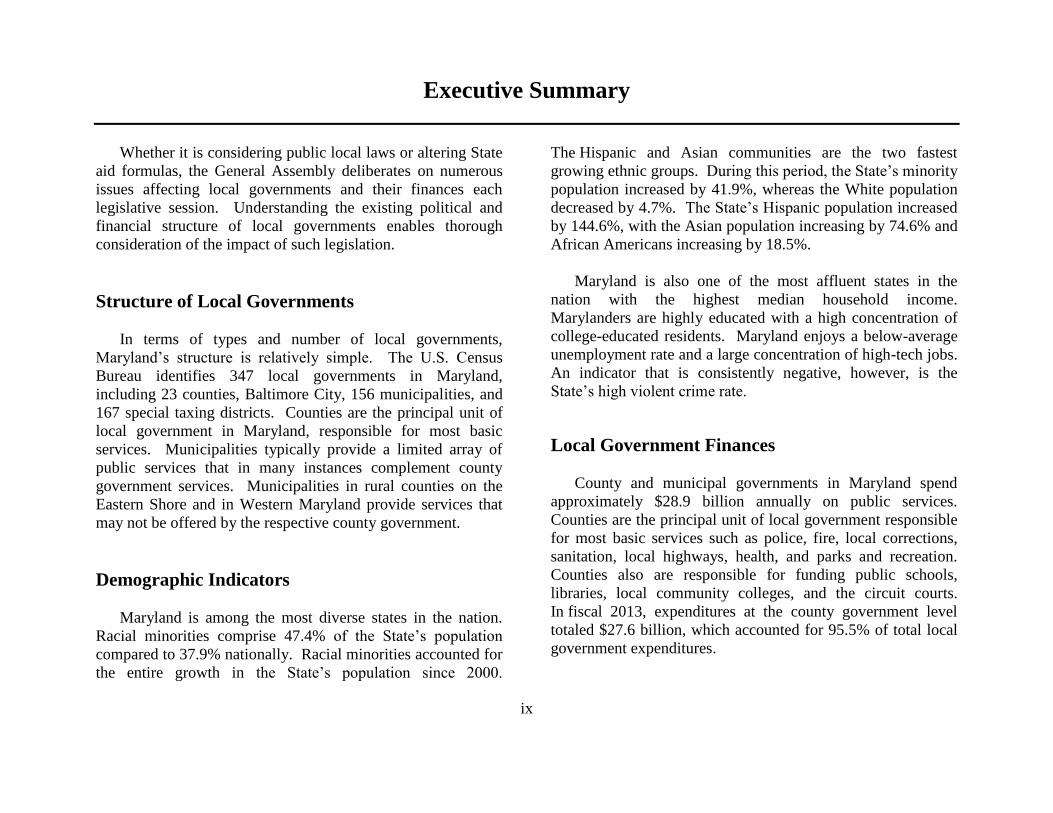
Whether it is considering public local laws or altering State
aid formulas, the General Assembly deliberates on numerous
issues affecting local governments and their finances each
legislative session. Understanding the existing political and
financial structure of local governments enables thorough
consideration of the impact of such legislation.
Structure of Local Governments
In terms of types and number of local governments,
Maryland’s structure is relatively simple. The U.S. Census
Bureau identifies 347 local governments in Maryland,
including 23 counties, Baltimore City, 156 municipalities, and
167 special taxing districts. Counties are the principal unit of
local government in Maryland, responsible for most basic
services. Municipalities typically provide a limited array of
public services that in many instances complement county
government services. Municipalities in rural counties on the
Eastern Shore and in Western Maryland provide services that
may not be offered by the respective county government.
Demographic Indicators
Maryland is among the most diverse states in the nation.
Racial minorities comprise 47.4% of the State’s population
compared to 37.9% nationally. Racial minorities accounted for
the entire growth in the State’s population since 2000.
The Hispanic and Asian communities are the two fastest
growing ethnic groups. During this period, the State’s minority
population increased by 41.9%, whereas the White population
decreased by 4.7%. The State’s Hispanic population increased
by 144.6%, with the Asian population increasing by 74.6% and
African Americans increasing by 18.5%.
Maryland is also one of the most affluent states in the
nation with the highest median household income.
Marylanders are highly educated with a high concentration of
college-educated residents. Maryland enjoys a below-average
unemployment rate and a large concentration of high-tech jobs.
An indicator that is consistently negative, however, is the
State’s high violent crime rate.
Local Government Finances
County and municipal governments in Maryland spend
approximately $28.9 billion annually on public services.
Counties are the principal unit of local government responsible
for most basic services such as police, fire, local corrections,
sanitation, local highways, health, and parks and recreation.
Counties also are responsible for funding public schools,
libraries, local community colleges, and the circuit courts.
In fiscal 2013, expenditures at the county government level
totaled $27.6 billion, which accounted for 95.5% of total local
government expenditures.
x
Municipal governments spent $1.3 billion, which accounted
for 4.5% of total local government expenditures in fiscal 2013.
The services delivered by municipalities are less uniform than
those provided by the counties. The most comprehensive array
of services is provided by Annapolis, Cumberland, Frederick,
Gaithersburg, and Rockville.
Tax Rates for Local Governments
Nine counties changed their local property tax rates in
fiscal 2016, with five counties increasing their rates and
four counties decreasing their rates. Local income tax rates
remained relatively constant for tax year 2016, with only
two counties altering their tax rate. No county altered its
recordation tax rate, but a few counties increased their transfer,
admissions and amusement, and hotel rental tax rates.
Individuals and businesses residing in incorporated areas
are subject to municipal property taxes in addition to county
property taxes. To compensate municipalities for providing
services in lieu of similar county services or programs and to
address the effect of double taxation in municipalities (when
residents pay both county and municipal property taxes),
18 counties provided property tax set-offs totaling
$101.6 million in fiscal 2015, through either a tax rate
differential or tax rebate.
Fourteen counties impose either a development impact fee
or excise tax, which generated approximately $131.5 million in
revenues in fiscal 2016. The primary services funded by these
charges include public school construction, libraries,
community colleges, transportation, public safety, parks and
recreation, and water/sewer utilities.
Local Revenue Growth
The up-turn in the housing market is slowly being reflected
in property assessments across Maryland. County assessable
base will increase by 2.9% in fiscal 2016 and is projected to
increase by 3.3% in fiscal 2017 and by 3.1% in fiscal 2018.
Net taxable income will increase by 5.9% in tax year 2014 after
decreasing by 0.3% in tax year 2013. Local recordation and
transfer tax revenues have stabilized compared to the past few
years. County governments collected $743.3 million in local
recordation and transfer taxes in fiscal 2015 and are expected
to collect $748.1 million in fiscal 2016.
The Homestead Tax Credit Program (assessment caps)
provides tax credits against State, county, and municipal real
property taxes for owner-occupied residential properties for the
amount of real property taxes resulting from an annual
assessment increase that exceeds a certain percentage or “cap”
in any given year. However, as property tax assessments have
declined over the past couple of years, the amount of property
tax relief provided by the Homestead Tax Credit Program has
declined accordingly. In fiscal 2017, assessment caps are
projected to reduce the amount of the county assessable base
that is taxable by almost 2.5% compared to 8.0% in fiscal 2012
and 17.6% in fiscal 2010.
xi
County Salary Actions
The majority of county governments and boards of
education provided salary enhancements to their employees in
fiscal 2016. Moreover, no jurisdiction planned to implement
furloughs or broad salary reduction plans.
Public School Funding
Public schools are funded from federal, State, and local
sources. Approximately 47% of public school funding in
Maryland comes from local sources, and 48.5% comes from
the State. The federal government provides only 4.5% of
public school funding. Public schools in Maryland receive
about $14,917 in total funding for each pupil in fiscal 2016.
Worcester County has the highest per pupil revenues at
$17,606, while Baltimore City has the second highest at
$16,713. Somerset County has the third highest at $16,304.
Harford and Talbot counties have the lowest per pupil revenues
at $13,236 and $12,847, respectively.
Local General Fund Balances
Local governments ended fiscal 2015 with total
unrestricted general fund balances, including “rainy day”
accounts, totaling $2.3 billion. A county’s unrestricted
general fund balance as a percent of general fund revenues is
one indicator of a county’s fiscal health and the county’s ability
to withstand an economic downturn. In addition, many
counties have designated “rainy day” funds set aside in the
event of an economic downturn. In fiscal 2015, these funds
total approximately $897.8 million or 6.5% of total
general fund revenues.
Local Debt Measures
As of June 30, 2014, Maryland counties and Baltimore City
had $19.8 billion in outstanding debt, including general
obligation bonds, revenue and enterprise debt, federal loans,
State loans, capital leases, and short-term debt. Between
fiscal 2010 and 2014, local debt for counties and
Baltimore City increased by $3.7 billion or 22.8%. This
represents a 5.3% average annual increase over the four-year
period. The Washington Suburban Sanitary Commission
accounted for 10.0% of the total debt in fiscal 2014.
Balance of State Payments
In fiscal 2013, State revenue collections allocated in the
Balance Sheet totaled $15.6 billion, while State aid payments
to local governments totaled $6.6 billion. The individual
income tax accounted for 47.7% of the State revenues allocated
in the report, while sales taxes accounted for 26.5% of
revenues. On average, local governments received $0.42 in
State aid for each $1.00 in taxes paid by county residents and
businesses. This illustrates that local governments received
42% of the State revenues that were allocated on a
county-by-county basis in the report. The remaining revenues
funded State programs such as higher education, medical
xii
assistance, health, social services, corrections, and the
judiciary.
The share of State revenues provided to local governments
has fluctuated since 2004, ranging from a low of 37% in
fiscal 2004, 2005, and 2006 to a high of 47% in fiscal 2010.
During this 10-year period, the “balance sheet index” as a
percent of the statewide average increased in 3 jurisdictions,
decreased in 4 jurisdictions, and remained relatively constant in
17 jurisdictions.
1
Chapter 1. Structure of Local Governments
When Lord Calvert and his group of English settlers landed
on St. Clement’s Island in 1634, they brought with them the
familiar forms of English government, which included
governance on the local level in counties and villages. The
settlers immediately set about establishing civil boundaries as
they had known them in England with the establishment of
St. Mary’s City. Just three years later, in 1637, the settlers
established St. Mary’s County. Since that time, local
government has evolved, changing as the times and needs of
local communities have changed. Likewise, the law governing
local government has developed to address such change. The
differences among local governments and the relationship
among different levels of government may be best understood in
this historical context.
There is no mention of local government in the
U.S. Constitution, and local governments are generally
considered creatures of the state. Yet often it is with their local
government that citizens most closely identify. Local
government units in the United States take on different forms to
include counties, municipalities, townships, and special taxing
districts. Nationwide there are over 90,000 units of local
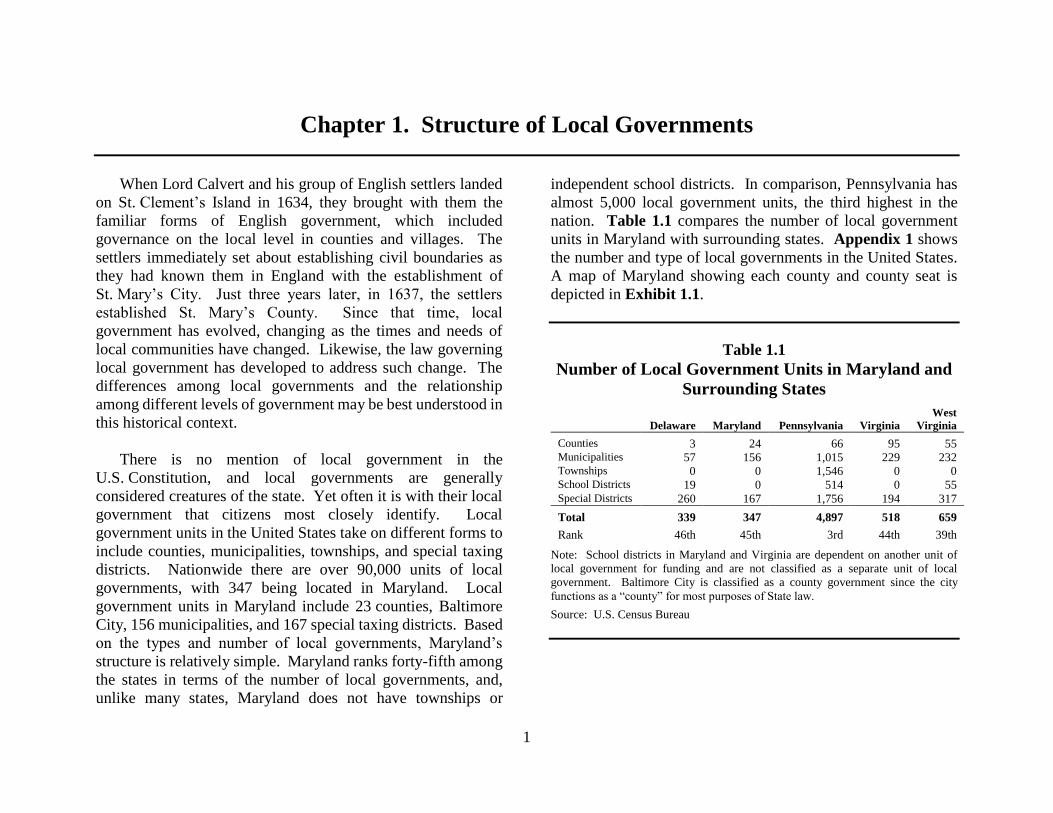
governments, with 347 being located in Maryland. Local
government units in Maryland include 23 counties, Baltimore
City, 156 municipalities, and 167 special taxing districts. Based
on the types and number of local governments, Maryland’s
structure is relatively simple. Maryland ranks forty-fifth among
the states in terms of the number of local governments, and,
unlike many states, Maryland does not have townships or
independent school districts. In comparison, Pennsylvania has
almost 5,000 local government units, the third highest in the
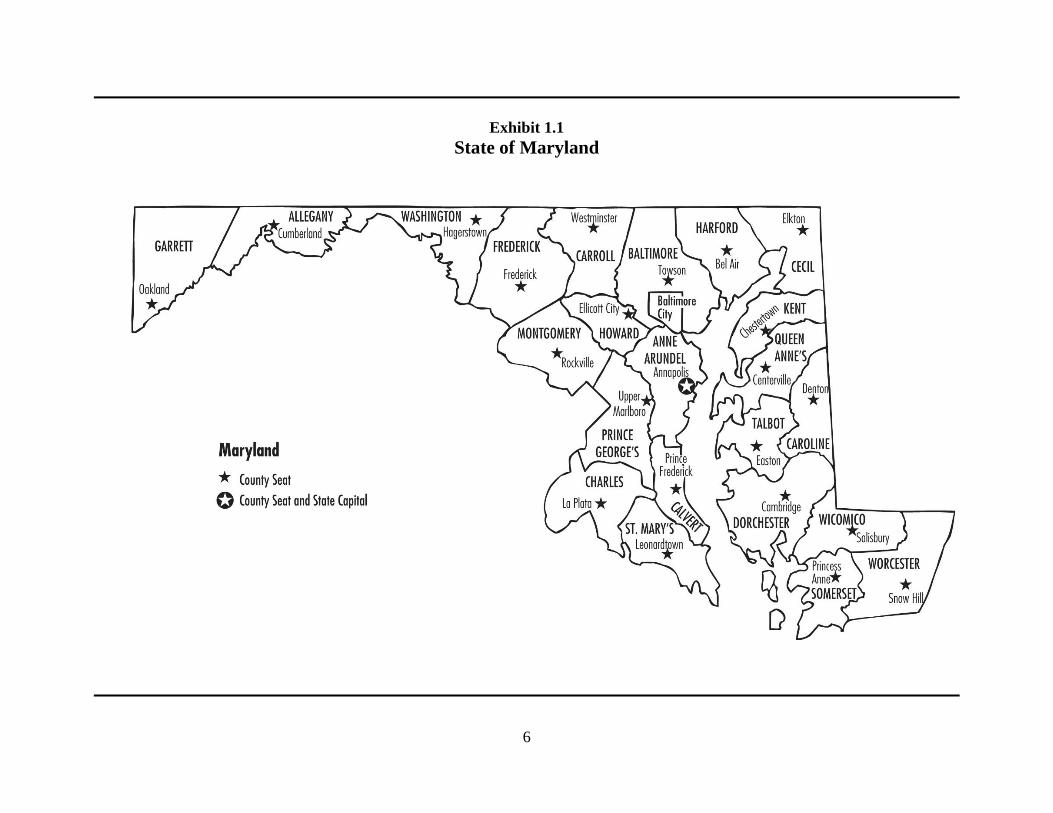
nation. Table 1.1 compares the number of local government
units in Maryland with surrounding states. Appendix 1 shows
the number and type of local governments in the United States.
A map of Maryland showing each county and county seat is
depicted in Exhibit 1.1.
Table 1.1
Number of Local Government Units in Maryland and
Surrounding States
Delaware
Maryland
Pennsylvania
Virginia
West
Virginia
Counties 3 24 66 95 55 Municipalities 57 156 1,015 229 232 Townships 0 0 1,546 0 0 School Districts 19 0 514 0 55 Special Districts 260 167 1,756 194 317
Total 339 347 4,897 518 659
Rank 46th 45th 3rd 44th 39th
Note: School districts in Maryland and Virginia are dependent on another unit of
local government for funding and are not classified as a separate unit of local
government. Baltimore City is classified as a county government since the city
functions as a “county” for most purposes of State law.
Source: U.S. Census Bureau
2
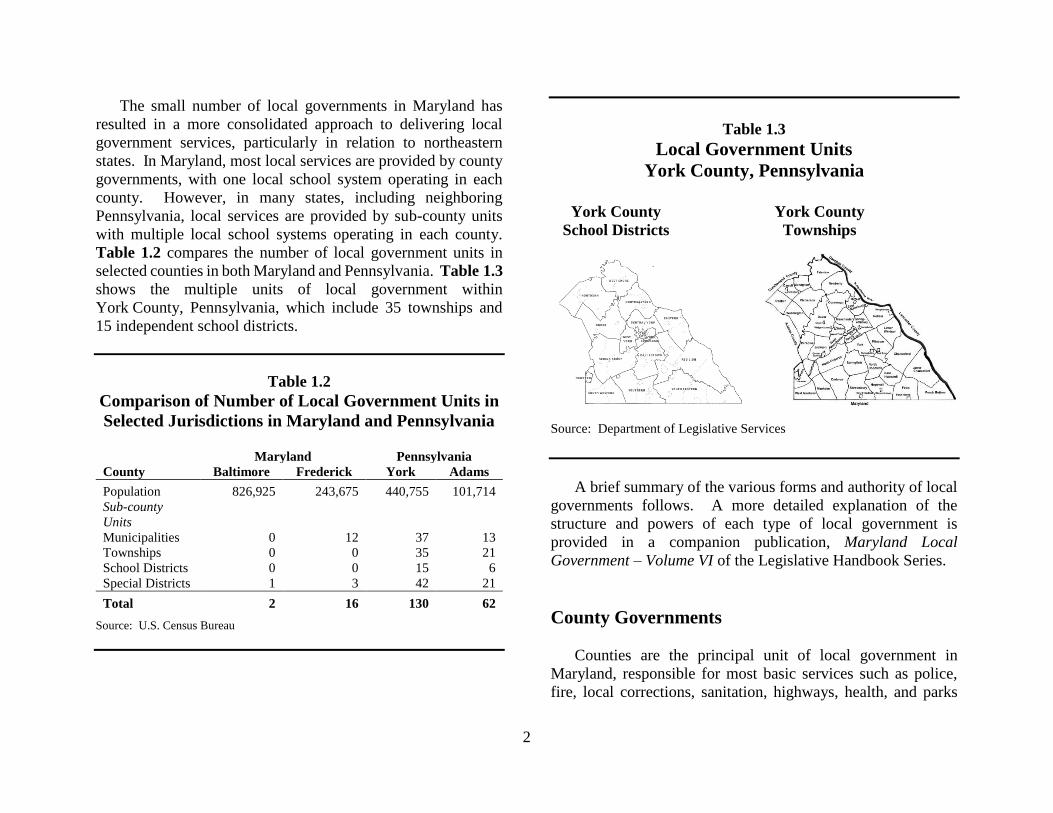
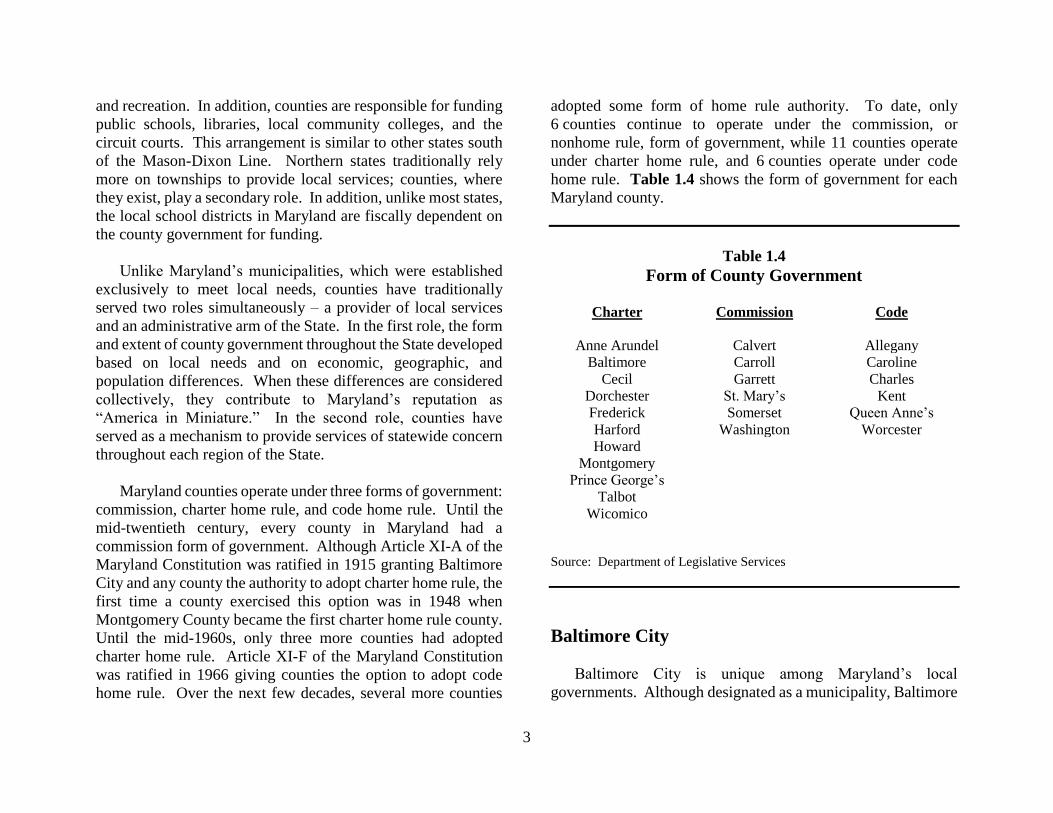
The small number of local governments in Maryland has
resulted in a more consolidated approach to delivering local
government services, particularly in relation to northeastern
states. In Maryland, most local services are provided by county
governments, with one local school system operating in each
county. However, in many states, including neighboring
Pennsylvania, local services are provided by sub-county units
with multiple local school systems operating in each county.
Table 1.2 compares the number of local government units in
selected counties in both Maryland and Pennsylvania. Table 1.3
shows the multiple units of local government within
York County, Pennsylvania, which include 35 townships and
15 independent school districts.
Table 1.2
Comparison of Number of Local Government Units in
Selected Jurisdictions in Maryland and Pennsylvania
Maryland Pennsylvania
County Baltimore Frederick York Adams
Population 826,925 243,675 440,755 101,714
Sub-county
Units
Municipalities 0 12 37 13
Townships 0 0 35 21
School Districts 0 0 15 6
Special Districts 1 3 42 21
Total 2 16 130 62
Source: U.S. Census Bureau
Table 1.3
Local Government Units
York County, Pennsylvania
York County
School Districts
York County
Townships
Source: Department of Legislative Services
A brief summary of the various forms and authority of local
governments follows. A more detailed explanation of the
structure and powers of each type of local government is
provided in a companion publication, Maryland Local
Government – Volume VI of the Legislative Handbook Series.
County Governments
Counties are the principal unit of local government in
Maryland, responsible for most basic services such as police,
fire, local corrections, sanitation, highways, health, and parks
3
and recreation. In addition, counties are responsible for funding
public schools, libraries, local community colleges, and the
circuit courts. This arrangement is similar to other states south
of the Mason-Dixon Line. Northern states traditionally rely
more on townships to provide local services; counties, where
they exist, play a secondary role. In addition, unlike most states,
the local school districts in Maryland are fiscally dependent on
the county government for funding.
Unlike Maryland’s municipalities, which were established
exclusively to meet local needs, counties have traditionally
served two roles simultaneously – a provider of local services
and an administrative arm of the State. In the first role, the form
and extent of county government throughout the State developed
based on local needs and on economic, geographic, and
population differences. When these differences are considered
collectively, they contribute to Maryland’s reputation as
“America in Miniature.” In the second role, counties have
served as a mechanism to provide services of statewide concern
throughout each region of the State.
Maryland counties operate under three forms of government:
commission, charter home rule, and code home rule. Until the
mid-twentieth century, every county in Maryland had a
commission form of government. Although Article XI-A of the
Maryland Constitution was ratified in 1915 granting Baltimore
City and any county the authority to adopt charter home rule, the
first time a county exercised this option was in 1948 when
Montgomery County became the first charter home rule county.
Until the mid-1960s, only three more counties had adopted
charter home rule. Article XI-F of the Maryland Constitution
was ratified in 1966 giving counties the option to adopt code
home rule. Over the next few decades, several more counties
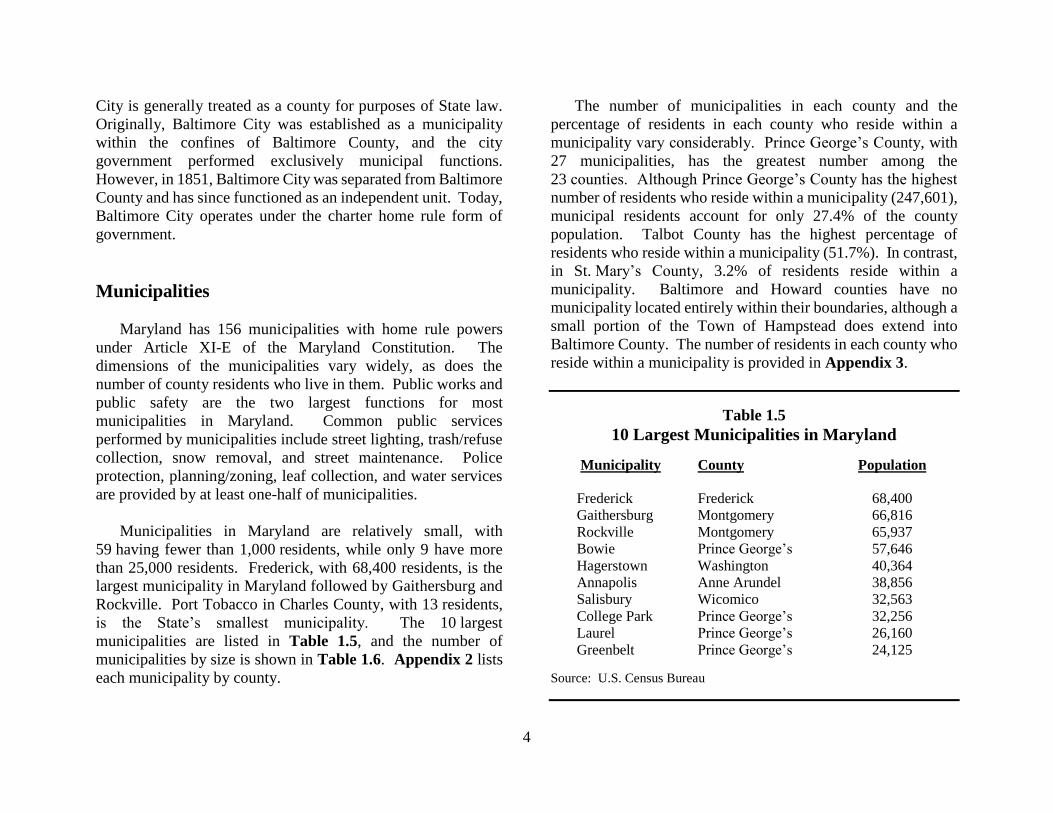
adopted some form of home rule authority. To date, only
6 counties continue to operate under the commission, or
nonhome rule, form of government, while 11 counties operate
under charter home rule, and 6 counties operate under code
home rule. Table 1.4 shows the form of government for each
Maryland county.
Table 1.4
Form of County Government
Charter Commission Code
Anne Arundel Calvert Allegany
Baltimore Carroll Caroline
Cecil Garrett Charles
Dorchester St. Mary’s Kent
Frederick Somerset Queen Anne’s
Harford Washington Worcester
Howard
Montgomery
Prince George’s
Talbot
Wicomico
Source: Department of Legislative Services
Baltimore City
Baltimore City is unique among Maryland’s local
governments. Although designated as a municipality, Baltimore
4
City is generally treated as a county for purposes of State law.
Originally, Baltimore City was established as a municipality
within the confines of Baltimore County, and the city
government performed exclusively municipal functions.
However, in 1851, Baltimore City was separated from Baltimore
County and has since functioned as an independent unit. Today,
Baltimore City operates under the charter home rule form of
government.
Municipalities
Maryland has 156 municipalities with home rule powers
under Article XI-E of the Maryland Constitution. The
dimensions of the municipalities vary widely, as does the
number of county residents who live in them. Public works and
public safety are the two largest functions for most
municipalities in Maryland. Common public services
performed by municipalities include street lighting, trash/refuse
collection, snow removal, and street maintenance. Police
protection, planning/zoning, leaf collection, and water services
are provided by at least one-half of municipalities.
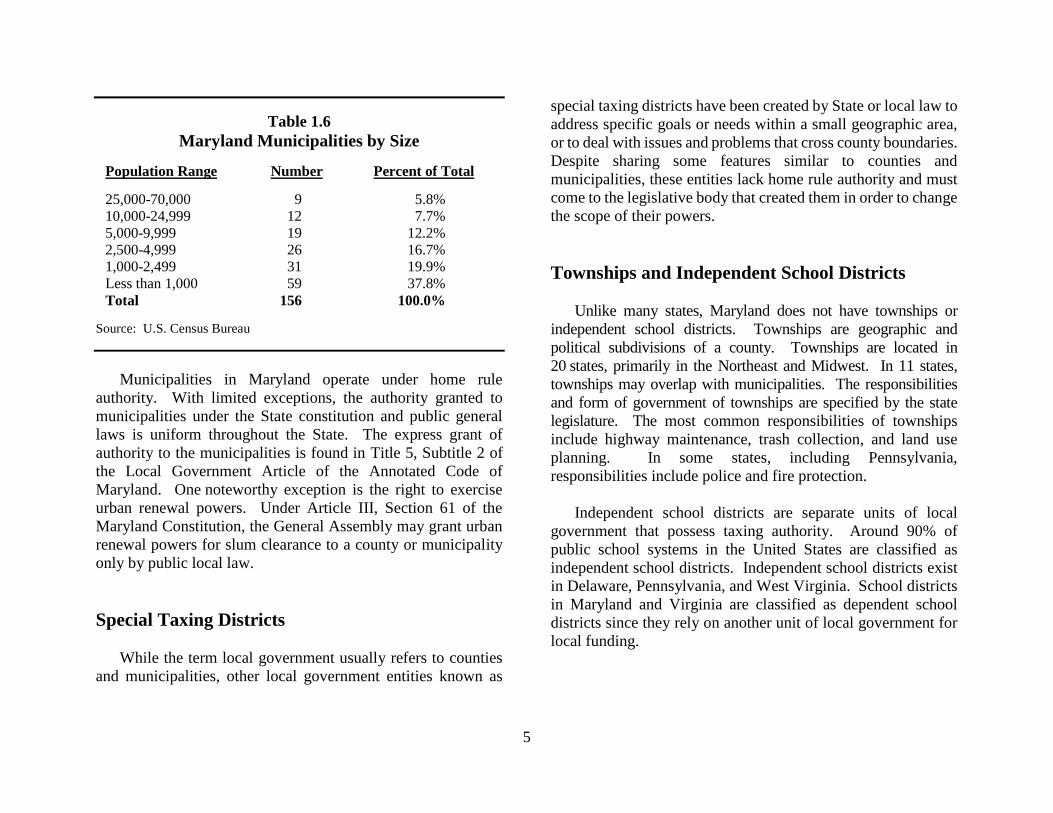
Municipalities in Maryland are relatively small, with
59 having fewer than 1,000 residents, while only 9 have more
than 25,000 residents. Frederick, with 68,400 residents, is the
largest municipality in Maryland followed by Gaithersburg and
Rockville. Port Tobacco in Charles County, with 13 residents,
is the State’s smallest municipality. The 10 largest
municipalities are listed in Table 1.5, and the number of
municipalities by size is shown in Table 1.6. Appendix 2 lists
each municipality by county.
The number of municipalities in each county and the
percentage of residents in each county who reside within a
municipality vary considerably. Prince George’s County, with
27 municipalities, has the greatest number among the
23 counties. Although Prince George’s County has the highest
number of residents who reside within a municipality (247,601),
municipal residents account for only 27.4% of the county
population. Talbot County has the highest percentage of
residents who reside within a municipality (51.7%). In contrast,
in St. Mary’s County, 3.2% of residents reside within a
municipality. Baltimore and Howard counties have no
municipality located entirely within their boundaries, although a
small portion of the Town of Hampstead does extend into
Baltimore County. The number of residents in each county who
reside within a municipality is provided in Appendix 3.
Table 1.5
10 Largest Municipalities in Maryland
Municipality County Population
Frederick Frederick 68,400
Gaithersburg Montgomery 66,816
Rockville Montgomery 65,937
Bowie Prince George’s 57,646
Hagerstown Washington 40,364
Annapolis Anne Arundel 38,856
Salisbury Wicomico 32,563
College Park Prince George’s 32,256
Laurel Prince George’s 26,160
Greenbelt Prince George’s 24,125
Source: U.S. Census Bureau
5
Table 1.6
Maryland Municipalities by Size
Population Range Number Percent of Total
25,000-70,000 9 5.8%
10,000-24,999 12 7.7%
5,000-9,999 19 12.2%
2,500-4,999 26 16.7%
1,000-2,499 31 19.9%
Less than 1,000 59 37.8%
Total 156 100.0%
Source: U.S. Census Bureau
Municipalities in Maryland operate under home rule
authority. With limited exceptions, the authority granted to
municipalities under the State constitution and public general
laws is uniform throughout the State. The express grant of
authority to the municipalities is found in Title 5, Subtitle 2 of
the Local Government Article of the Annotated Code of
Maryland. One noteworthy exception is the right to exercise
urban renewal powers. Under Article III, Section 61 of the
Maryland Constitution, the General Assembly may grant urban
renewal powers for slum clearance to a county or municipality
only by public local law.
Special Taxing Districts
While the term local government usually refers to counties
and municipalities, other local government entities known as
special taxing districts have been created by State or local law to
address specific goals or needs within a small geographic area,
or to deal with issues and problems that cross county boundaries.
Despite sharing some features similar to counties and
municipalities, these entities lack home rule authority and must
come to the legislative body that created them in order to change
the scope of their powers.
Townships and Independent School Districts
Unlike many states, Maryland does not have townships or
independent school districts. Townships are geographic and
political subdivisions of a county. Townships are located in
20 states, primarily in the Northeast and Midwest. In 11 states,
townships may overlap with municipalities. The responsibilities
and form of government of townships are specified by the state
legislature. The most common responsibilities of townships
include highway maintenance, trash collection, and land use
planning. In some states, including Pennsylvania,
responsibilities include police and fire protection.
Independent school districts are separate units of local
government that possess taxing authority. Around 90% of
public school systems in the United States are classified as
independent school districts. Independent school districts exist
in Delaware, Pennsylvania, and West Virginia. School districts
in Maryland and Virginia are classified as dependent school
districts since they rely on another unit of local government for
local funding.
6
Exhibit 1.1
State of Maryland
7
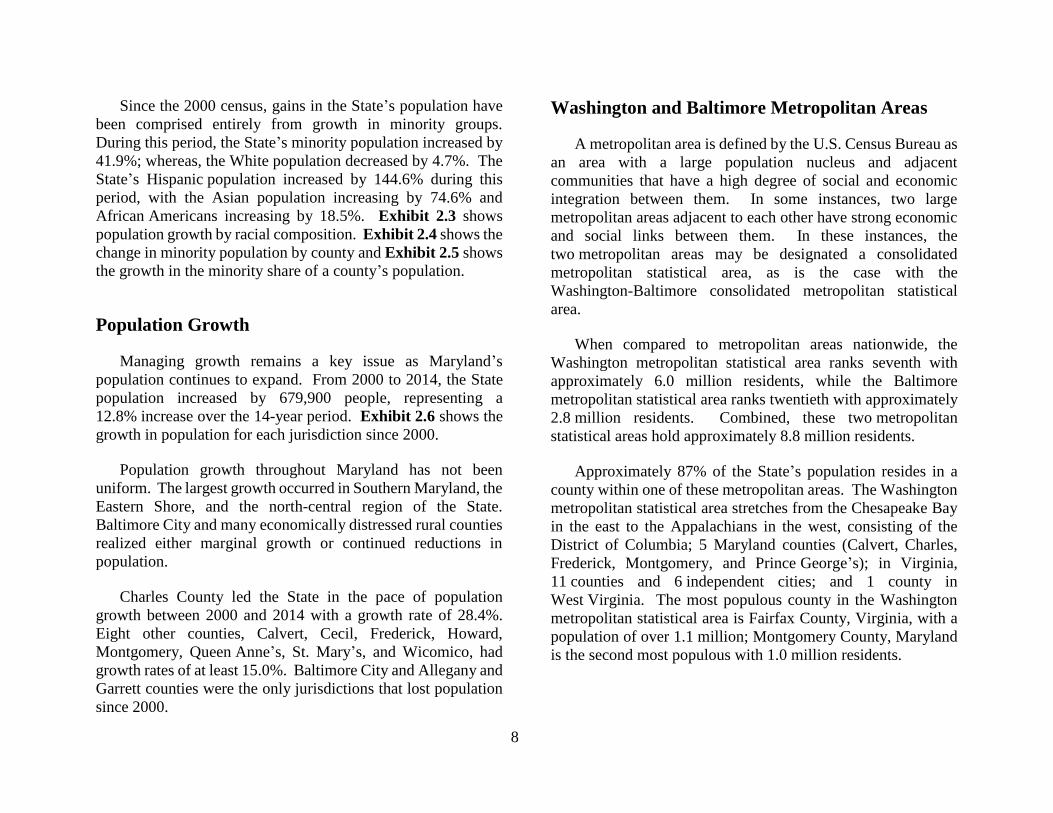
Chapter 2. Demographic Indicators
Maryland is a diverse State encompassing the mountainous
regions of Western Maryland, waterfront communities along the
Chesapeake Bay, historic towns, rolling hills and horse farms in
the north-central region of the State, and the urban center along
the Baltimore-Washington corridor. This diversity is also
reflected in the State’s people and families. Maryland is today
a dynamic and culturally enriched State comprising people from
approximately 160 different countries speaking over
100 languages.
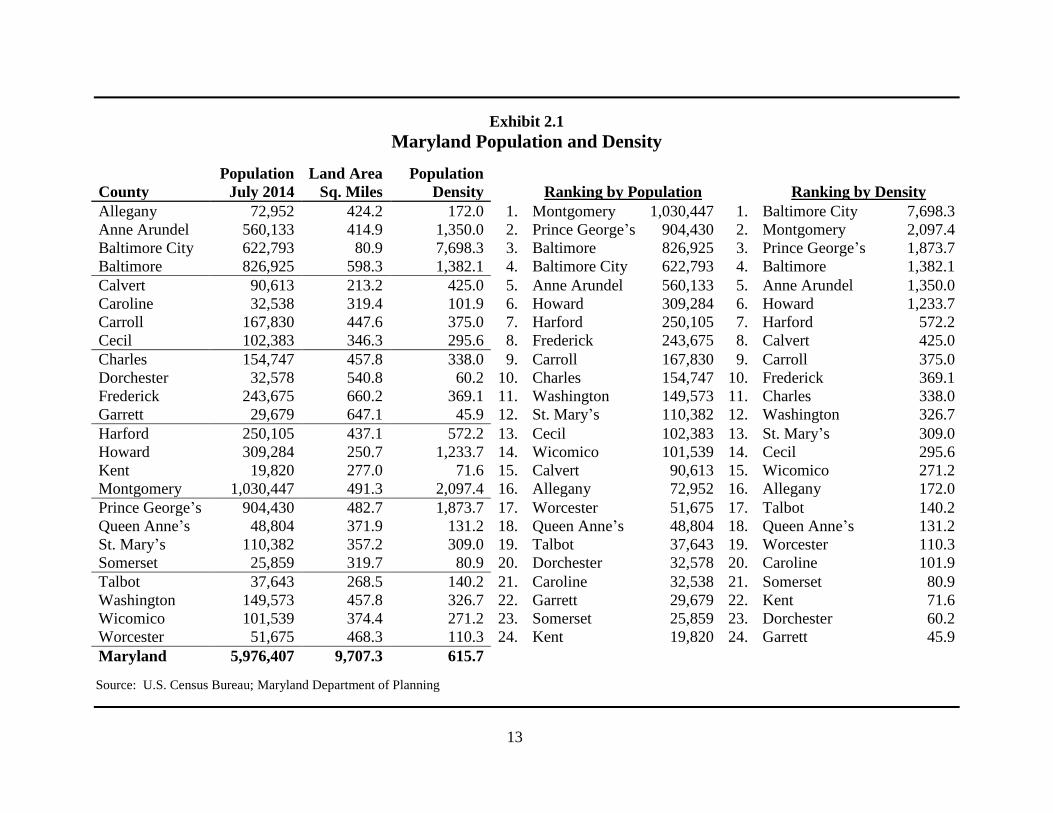
Land Area and Population
Maryland, consisting of 9,707 square miles, ranks as the
forty-second state in terms of land mass. Maryland’s counties
range in size from Calvert County with 213 square miles to
Frederick County with 660 square miles. Baltimore City
comprises 81 square miles.
Approximately 6.0 million people live in Maryland.
Montgomery County is the State’s largest jurisdiction with over
1 million residents, and Kent County is the smallest with
19,800 residents. Baltimore City, although fourth in total
population, has the highest population density in the State.
Montgomery County is second in terms of population density,
while Garrett County has the lowest population density.
Exhibit 2.1 shows the land area, population, and population
density for all Maryland jurisdictions.
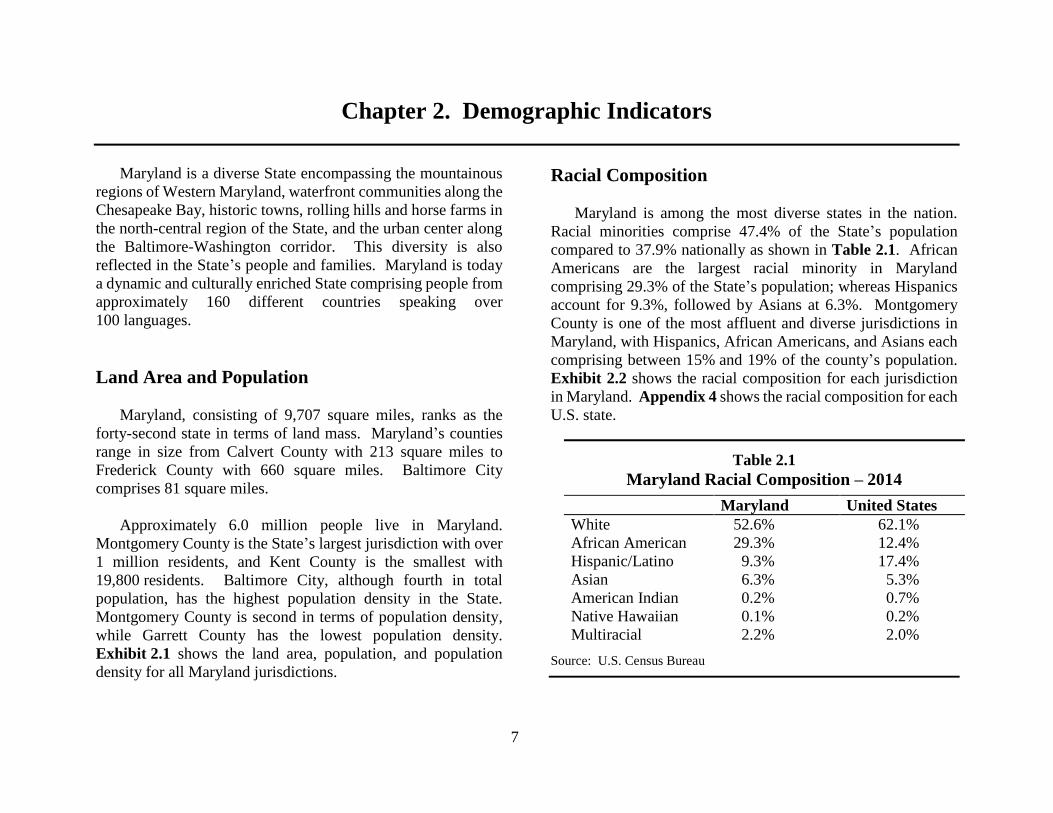
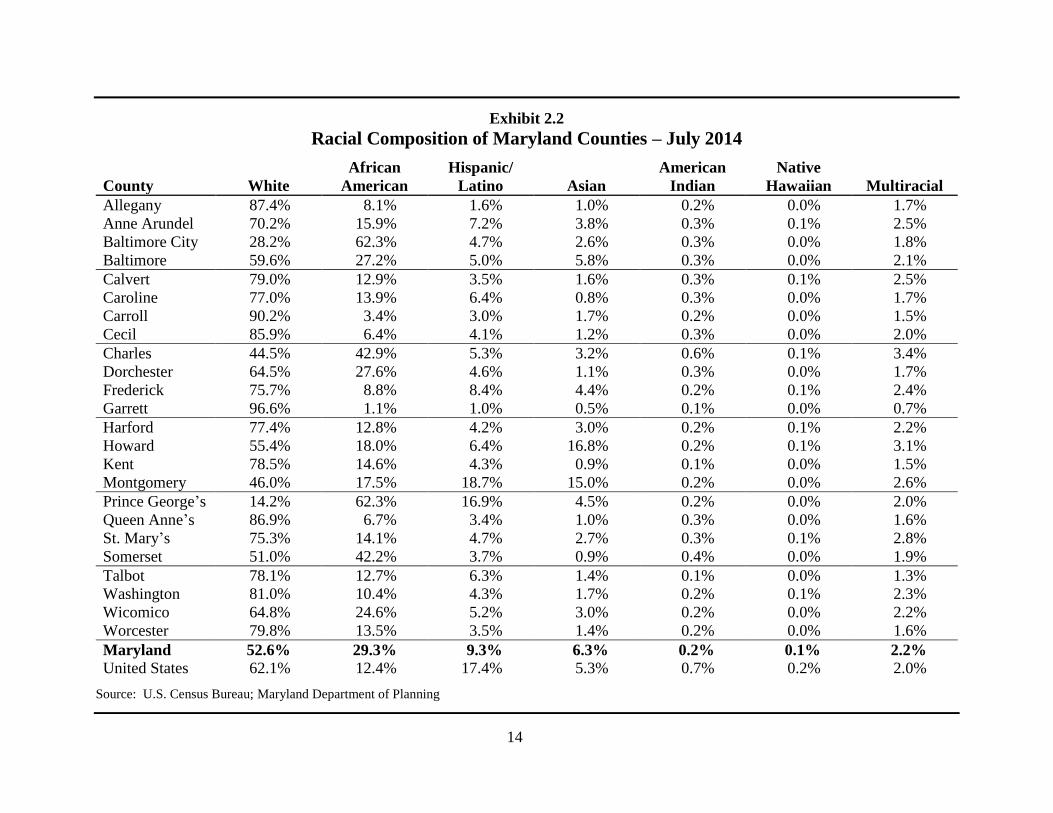
Racial Composition
Maryland is among the most diverse states in the nation.
Racial minorities comprise 47.4% of the State’s population
compared to 37.9% nationally as shown in Table 2.1. African
Americans are the largest racial minority in Maryland
comprising 29.3% of the State’s population; whereas Hispanics
account for 9.3%, followed by Asians at 6.3%. Montgomery
County is one of the most affluent and diverse jurisdictions in
Maryland, with Hispanics, African Americans, and Asians each
comprising between 15% and 19% of the county’s population.
Exhibit 2.2 shows the racial composition for each jurisdiction
in Maryland. Appendix 4 shows the racial composition for each
U.S. state.
Table 2.1
Maryland Racial Composition – 2014
Maryland United States
White 52.6% 62.1%
African American 29.3% 12.4%
Hispanic/Latino 9.3% 17.4%
Asian 6.3% 5.3%
American Indian 0.2% 0.7%
Native Hawaiian 0.1% 0.2%
Multiracial 2.2% 2.0%
Source: U.S. Census Bureau
8
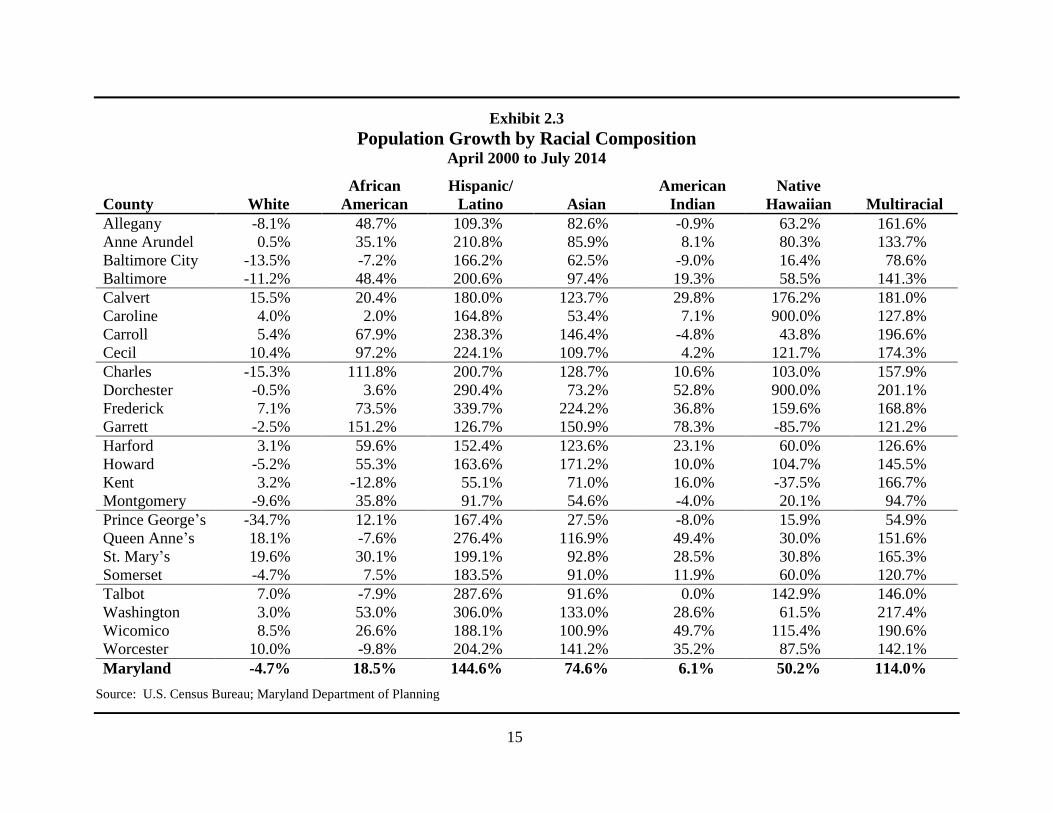
Since the 2000 census, gains in the State’s population have
been comprised entirely from growth in minority groups.
During this period, the State’s minority population increased by
41.9%; whereas, the White population decreased by 4.7%. The
State’s Hispanic population increased by 144.6% during this
period, with the Asian population increasing by 74.6% and
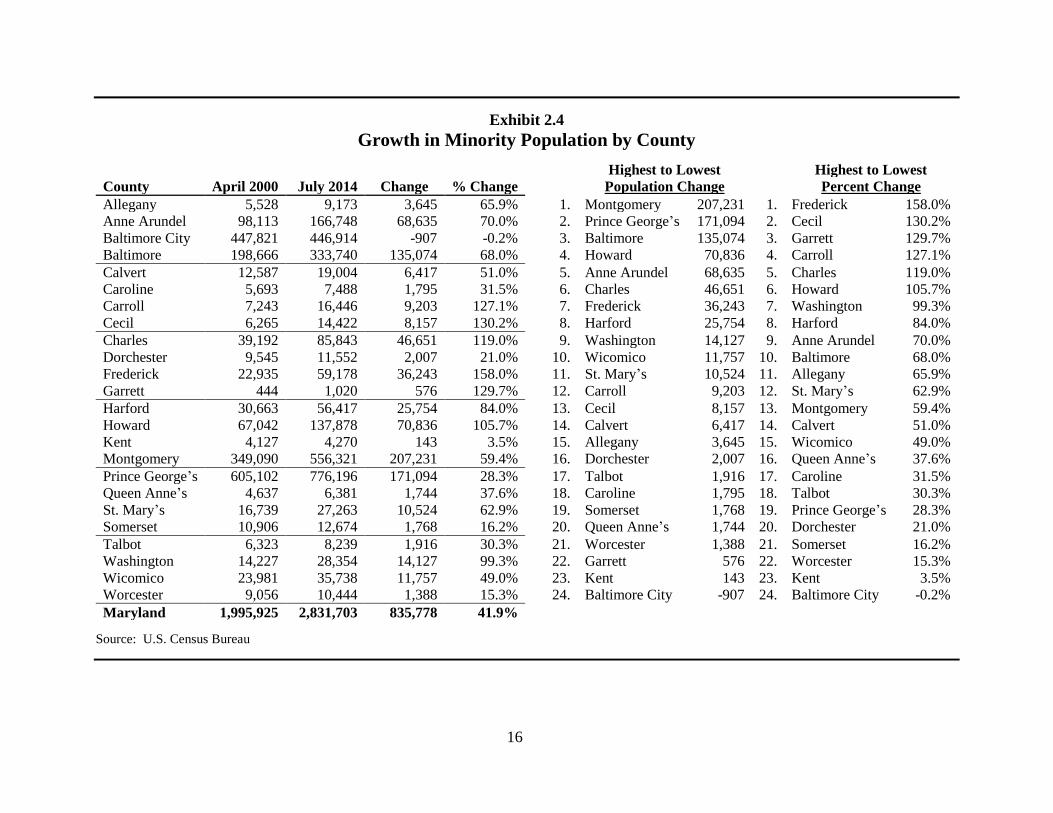
African Americans increasing by 18.5%. Exhibit 2.3 shows
population growth by racial composition. Exhibit 2.4 shows the
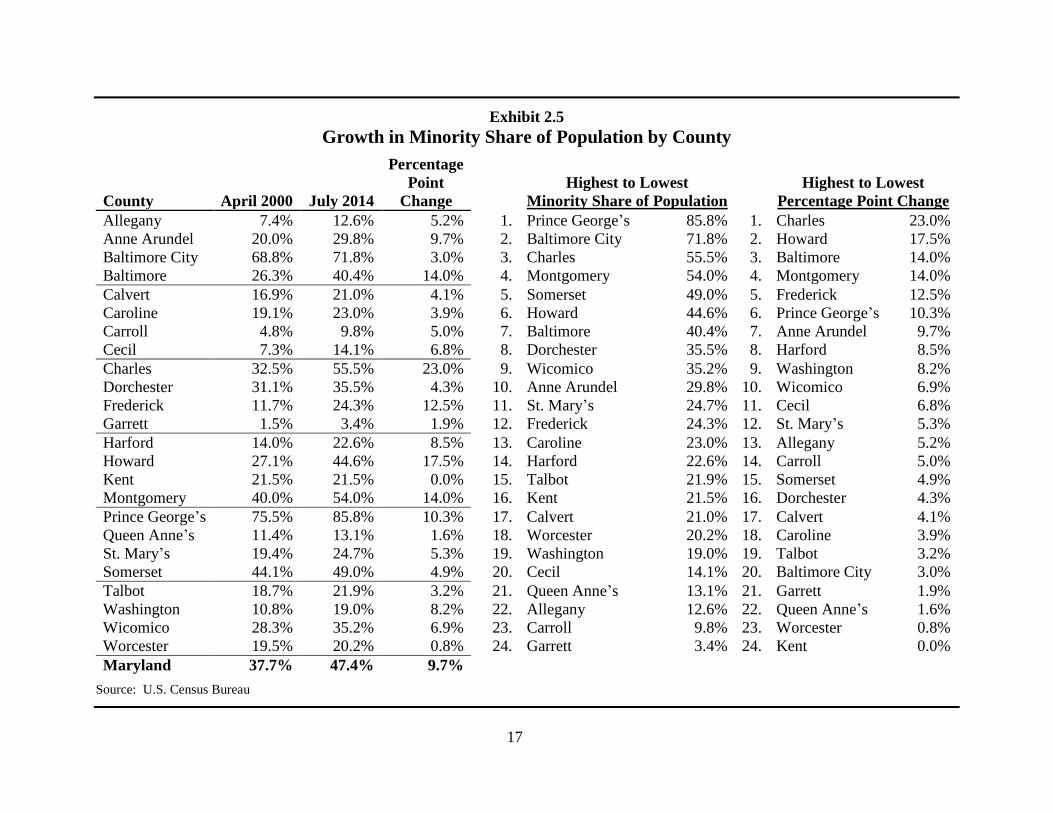
change in minority population by county and Exhibit 2.5 shows
the growth in the minority share of a county’s population.
Population Growth
Managing growth remains a key issue as Maryland’s
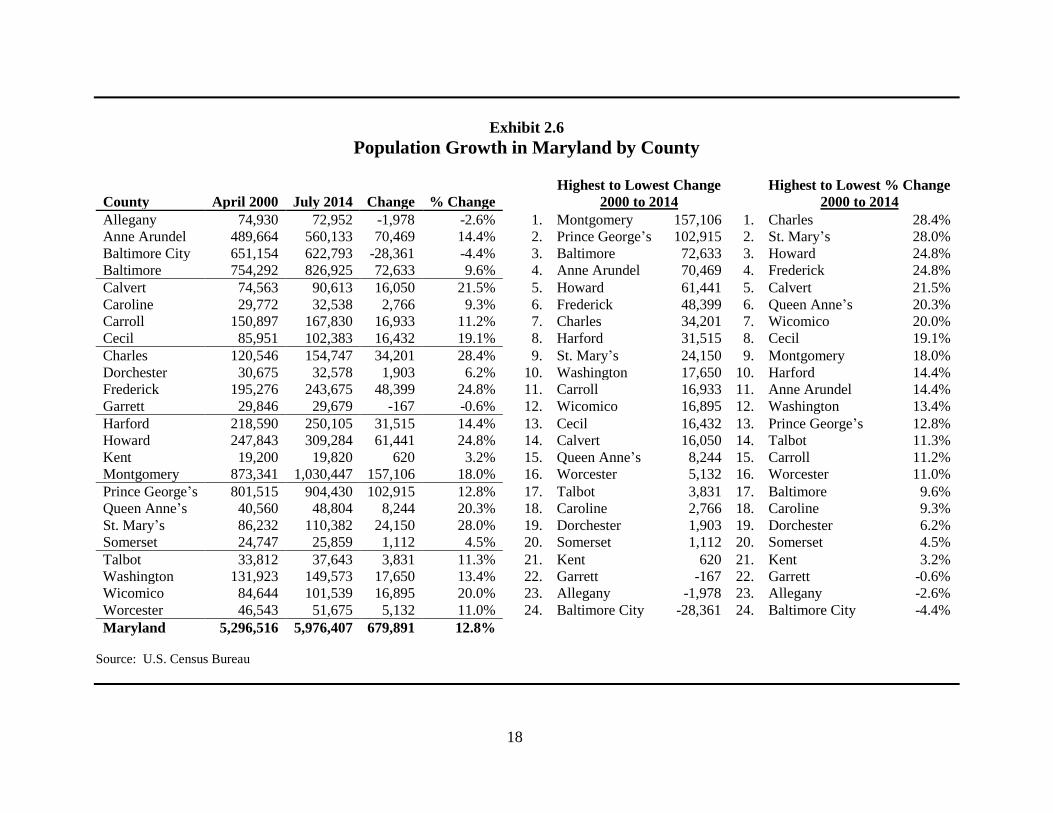
population continues to expand. From 2000 to 2014, the State
population increased by 679,900 people, representing a
12.8% increase over the 14-year period. Exhibit 2.6 shows the
growth in population for each jurisdiction since 2000.
Population growth throughout Maryland has not been
uniform. The largest growth occurred in Southern Maryland, the
Eastern Shore, and the north-central region of the State.
Baltimore City and many economically distressed rural counties
realized either marginal growth or continued reductions in
population.
Charles County led the State in the pace of population
growth between 2000 and 2014 with a growth rate of 28.4%.
Eight other counties, Calvert, Cecil, Frederick, Howard,
Montgomery, Queen Anne’s, St. Mary’s, and Wicomico, had
growth rates of at least 15.0%. Baltimore City and Allegany and
Garrett counties were the only jurisdictions that lost population
since 2000.
Washington and Baltimore Metropolitan Areas
A metropolitan area is defined by the U.S. Census Bureau as
an area with a large population nucleus and adjacent
communities that have a high degree of social and economic
integration between them. In some instances, two large
metropolitan areas adjacent to each other have strong economic
and social links between them. In these instances, the
two metropolitan areas may be designated a consolidated
metropolitan statistical area, as is the case with the
Washington-Baltimore consolidated metropolitan statistical
area.
When compared to metropolitan areas nationwide, the
Washington metropolitan statistical area ranks seventh with
approximately 6.0 million residents, while the Baltimore
metropolitan statistical area ranks twentieth with approximately
2.8 million residents. Combined, these two metropolitan
statistical areas hold approximately 8.8 million residents.
Approximately 87% of the State’s population resides in a
county within one of these metropolitan areas. The Washington
metropolitan statistical area stretches from the Chesapeake Bay
in the east to the Appalachians in the west, consisting of the
District of Columbia; 5 Maryland counties (Calvert, Charles,
Frederick, Montgomery, and Prince George’s); in Virginia,
11 counties and 6 independent cities; and 1 county in
West Virginia. The most populous county in the Washington
metropolitan statistical area is Fairfax County, Virginia, with a
population of over 1.1 million; Montgomery County, Maryland
is the second most populous with 1.0 million residents.
9
The Baltimore metropolitan statistical area is composed of
Baltimore City and six Maryland counties – Anne Arundel,
Baltimore, Carroll, Harford, Howard, and Queen Anne’s.
Baltimore County is the most populous jurisdiction within the
Baltimore metropolitan statistical area with a population of
826,900 residents; Baltimore City is the second most populous
jurisdiction with 622,800 residents.
Since the 1960s, in both the Washington and Baltimore
metropolitan statistical areas, the population of the central city
has been declining while the population of the surrounding
counties has increased dramatically. However, recently the
population of the District of Columbia has been increasing.
Appendix 5 compares the population of each jurisdiction within
the Washington and Baltimore metropolitan statistical areas.
Social and Economic Indicators
Maryland continues to be one of the most affluent states in
the nation with a high median household income. Maryland
enjoys a below-average unemployment rate and a large
concentration of high-tech jobs. A continuing negative indicator
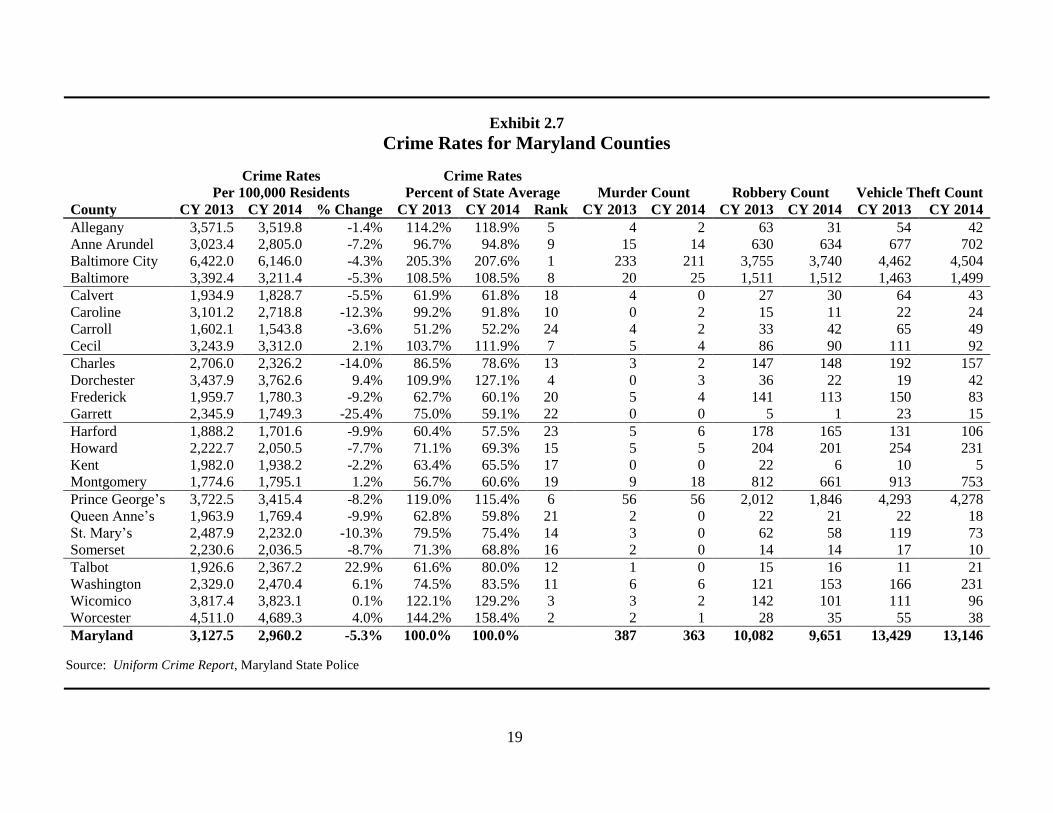
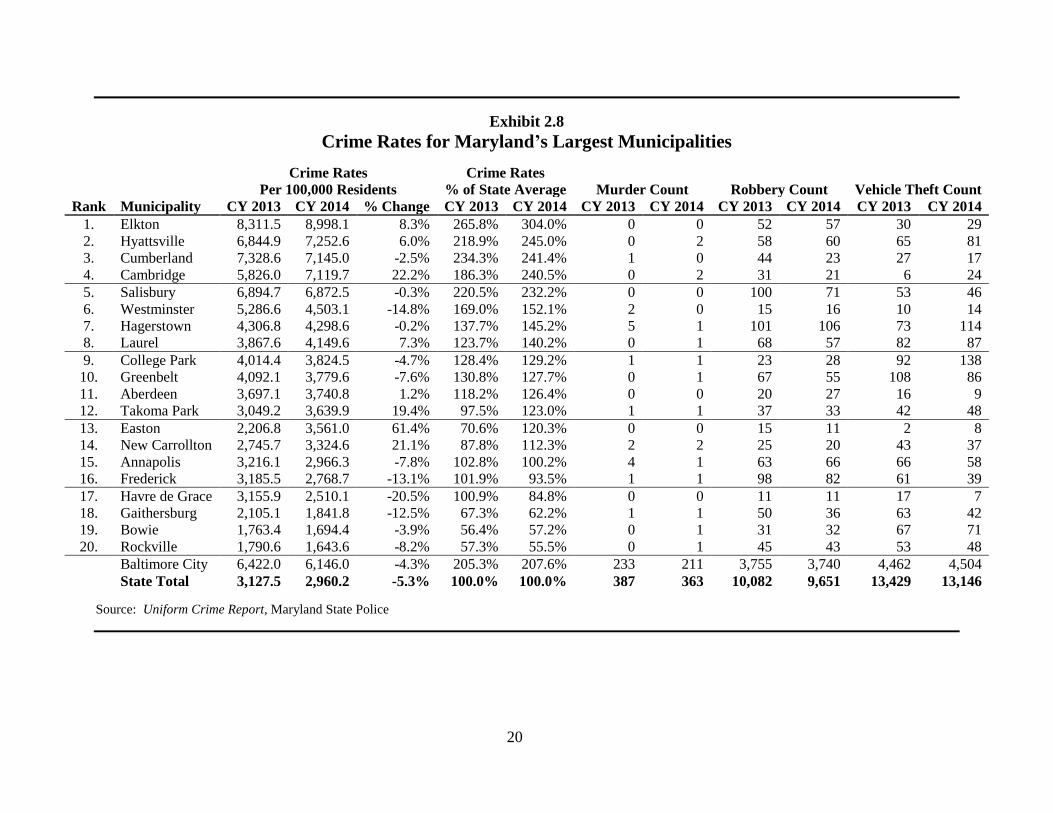
is the State’s high violent crime rate. Crime rate statistics for
counties and the 20 largest municipalities in the State are
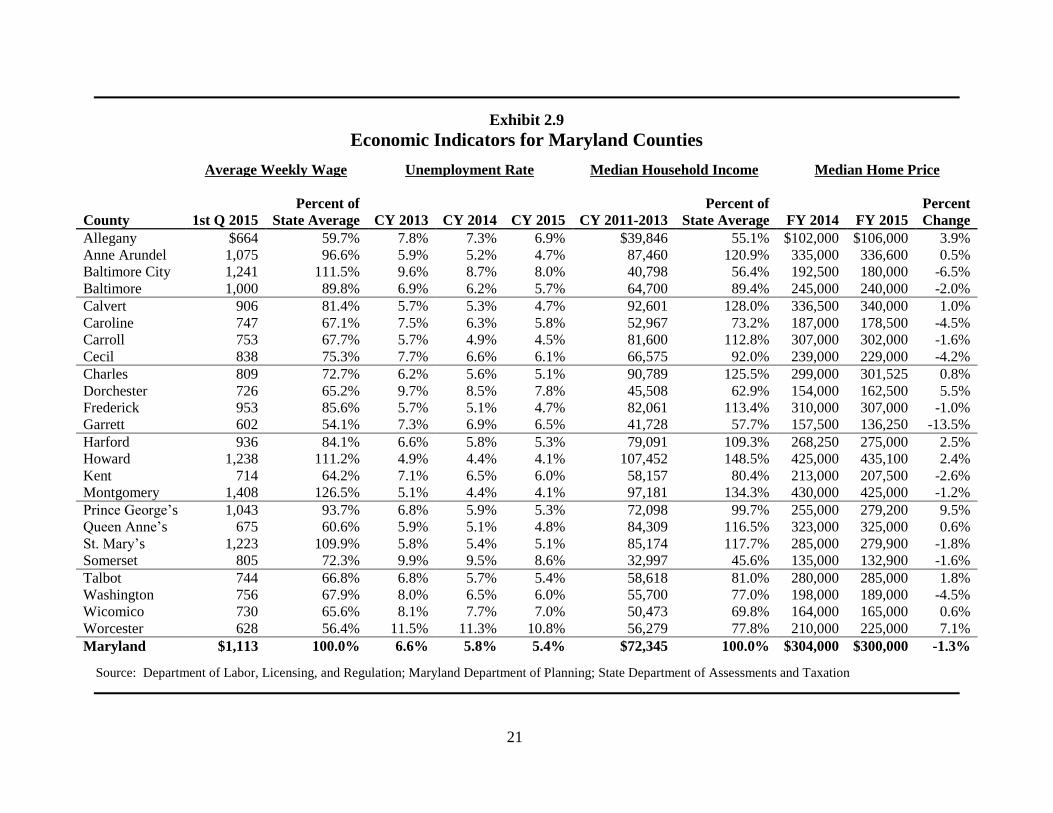
provided in Exhibits 2.7 and 2.8. Information on average
weekly wage, unemployment rate, median household income,
and median home prices is provided in Exhibit 2.9.
Exhibits 2.10 through 2.13 provide information on county
employment by sector and employment growth.
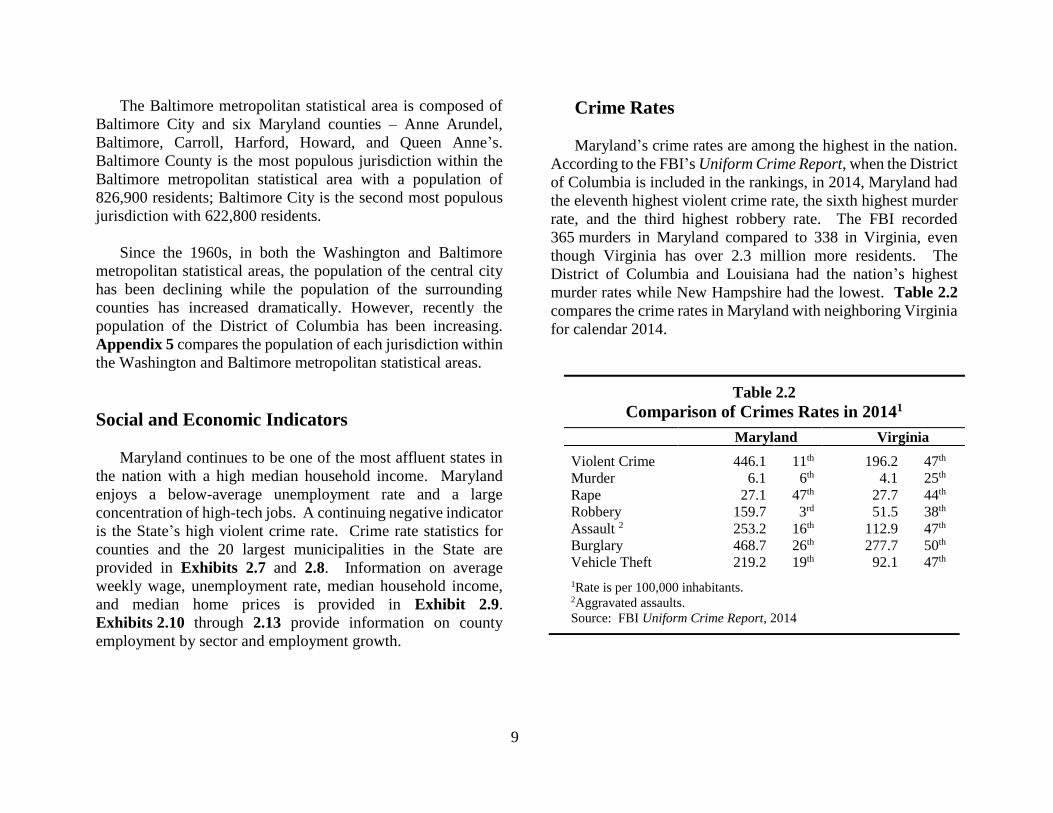
Crime Rates
Maryland’s crime rates are among the highest in the nation.
According to the FBI’s Uniform Crime Report, when the District
of Columbia is included in the rankings, in 2014, Maryland had
the eleventh highest violent crime rate, the sixth highest murder
rate, and the third highest robbery rate. The FBI recorded
365 murders in Maryland compared to 338 in Virginia, even
though Virginia has over 2.3 million more residents. The
District of Columbia and Louisiana had the nation’s highest
murder rates while New Hampshire had the lowest. Table 2.2
compares the crime rates in Maryland with neighboring Virginia
for calendar 2014.
Table 2.2
Comparison of Crimes Rates in 20141
Maryland Virginia
Violent Crime 446.1 11th 196.2 47th
Murder 6.1 6th 4.1 25th
Rape 27.1 47th 27.7 44th
Robbery 159.7 3rd 51.5 38th
Assault 2 253.2 16th 112.9 47th
Burglary 468.7 26th 277.7 50th
Vehicle Theft 219.2 19th 92.1 47th
1Rate is per 100,000 inhabitants. 2Aggravated assaults.
Source: FBI Uniform Crime Report, 2014
10
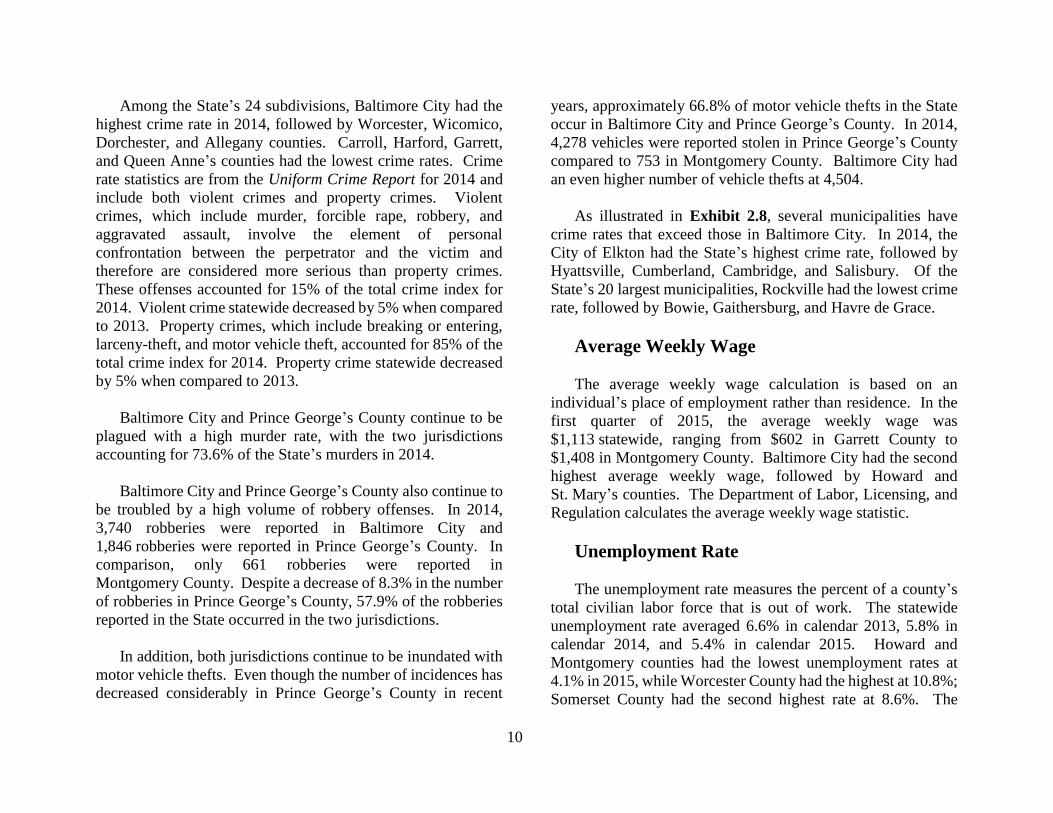
Among the State’s 24 subdivisions, Baltimore City had the
highest crime rate in 2014, followed by Worcester, Wicomico,
Dorchester, and Allegany counties. Carroll, Harford, Garrett,
and Queen Anne’s counties had the lowest crime rates. Crime
rate statistics are from the Uniform Crime Report for 2014 and
include both violent crimes and property crimes. Violent
crimes, which include murder, forcible rape, robbery, and
aggravated assault, involve the element of personal
confrontation between the perpetrator and the victim and
therefore are considered more serious than property crimes.
These offenses accounted for 15% of the total crime index for
2014. Violent crime statewide decreased by 5% when compared
to 2013. Property crimes, which include breaking or entering,
larceny-theft, and motor vehicle theft, accounted for 85% of the
total crime index for 2014. Property crime statewide decreased
by 5% when compared to 2013.
Baltimore City and Prince George’s County continue to be
plagued with a high murder rate, with the two jurisdictions
accounting for 73.6% of the State’s murders in 2014.
Baltimore City and Prince George’s County also continue to
be troubled by a high volume of robbery offenses. In 2014,
3,740 robberies were reported in Baltimore City and
1,846 robberies were reported in Prince George’s County. In
comparison, only 661 robberies were reported in
Montgomery County. Despite a decrease of 8.3% in the number
of robberies in Prince George’s County, 57.9% of the robberies
reported in the State occurred in the two jurisdictions.
In addition, both jurisdictions continue to be inundated with
motor vehicle thefts. Even though the number of incidences has
decreased considerably in Prince George’s County in recent
years, approximately 66.8% of motor vehicle thefts in the State
occur in Baltimore City and Prince George’s County. In 2014,
4,278 vehicles were reported stolen in Prince George’s County
compared to 753 in Montgomery County. Baltimore City had
an even higher number of vehicle thefts at 4,504.
As illustrated in Exhibit 2.8, several municipalities have
crime rates that exceed those in Baltimore City. In 2014, the
City of Elkton had the State’s highest crime rate, followed by
Hyattsville, Cumberland, Cambridge, and Salisbury. Of the
State’s 20 largest municipalities, Rockville had the lowest crime
rate, followed by Bowie, Gaithersburg, and Havre de Grace.
Average Weekly Wage
The average weekly wage calculation is based on an
individual’s place of employment rather than residence. In the
first quarter of 2015, the average weekly wage was
$1,113 statewide, ranging from $602 in Garrett County to
$1,408 in Montgomery County. Baltimore City had the second
highest average weekly wage, followed by Howard and
St. Mary’s counties. The Department of Labor, Licensing, and
Regulation calculates the average weekly wage statistic.
Unemployment Rate
The unemployment rate measures the percent of a county’s
total civilian labor force that is out of work. The statewide
unemployment rate averaged 6.6% in calendar 2013, 5.8% in
calendar 2014, and 5.4% in calendar 2015. Howard and
Montgomery counties had the lowest unemployment rates at
4.1% in 2015, while Worcester County had the highest at 10.8%;
Somerset County had the second highest rate at 8.6%. The
11
unemployment rate in Maryland continues to be below the
national average. The national unemployment rate averaged
7.4% in calendar 2013, 6.2% in calendar 2014, and 5.5% in
calendar 2015.
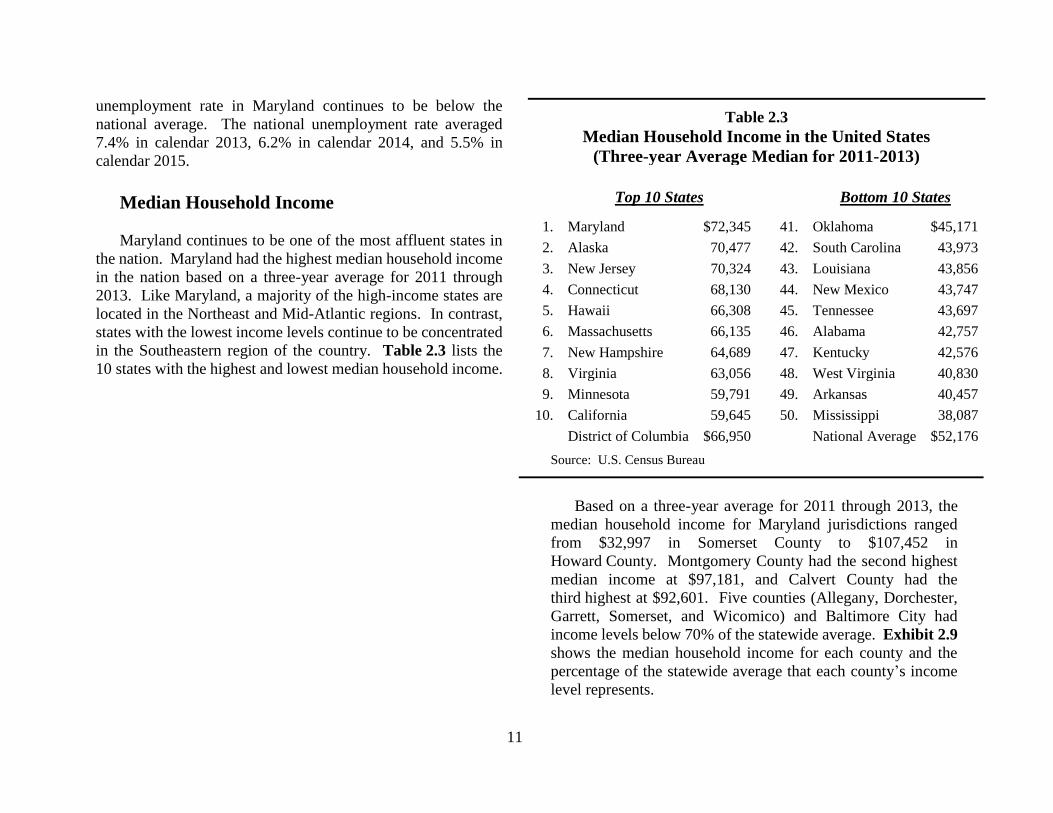
Median Household Income
Maryland continues to be one of the most affluent states in
the nation. Maryland had the highest median household income
in the nation based on a three-year average for 2011 through
2013. Like Maryland, a majority of the high-income states are
located in the Northeast and Mid-Atlantic regions. In contrast,
states with the lowest income levels continue to be concentrated
in the Southeastern region of the country. Table 2.3 lists the
10 states with the highest and lowest median household income.
Table 2.3
Median Household Income in the United States (Three-year Average Median for 2011-2013)
Top 10 States Bottom 10 States
1. Maryland $72,345 41. Oklahoma $45,171
2. Alaska 70,477 42. South Carolina 43,973
3. New Jersey 70,324 43. Louisiana 43,856
4. Connecticut 68,130 44. New Mexico 43,747
5. Hawaii 66,308 45. Tennessee 43,697
6. Massachusetts 66,135 46. Alabama 42,757
7. New Hampshire 64,689 47. Kentucky 42,576
8. Virginia 63,056 48. West Virginia 40,830
9. Minnesota 59,791 49. Arkansas 40,457
10. California 59,645 50. Mississippi 38,087
District of Columbia $66,950 National Average $52,176
Source: U.S. Census Bureau
Based on a three-year average for 2011 through 2013, the
median household income for Maryland jurisdictions ranged
from $32,997 in Somerset County to $107,452 in
Howard County. Montgomery County had the second highest
median income at $97,181, and Calvert County had the
third highest at $92,601. Five counties (Allegany, Dorchester,
Garrett, Somerset, and Wicomico) and Baltimore City had
income levels below 70% of the statewide average. Exhibit 2.9
shows the median household income for each county and the
percentage of the statewide average that each county’s income
level represents.

12
Median Sale Price for Homes
The median sale price for owner-occupied real property
decreased by 1.3% in fiscal 2015. However, 12 counties
realized increases in the median sale price during this period.
The median sale price ranged from $106,000 in Allegany
County to $435,100 in Howard County. The overall annual
decrease in fiscal 2015 reversed the gains made during
fiscal 2014, when the median sale price for homes increased
statewide by 6.3%. Median sale price statistics are from the
Maryland State Department of Assessments and Taxation.
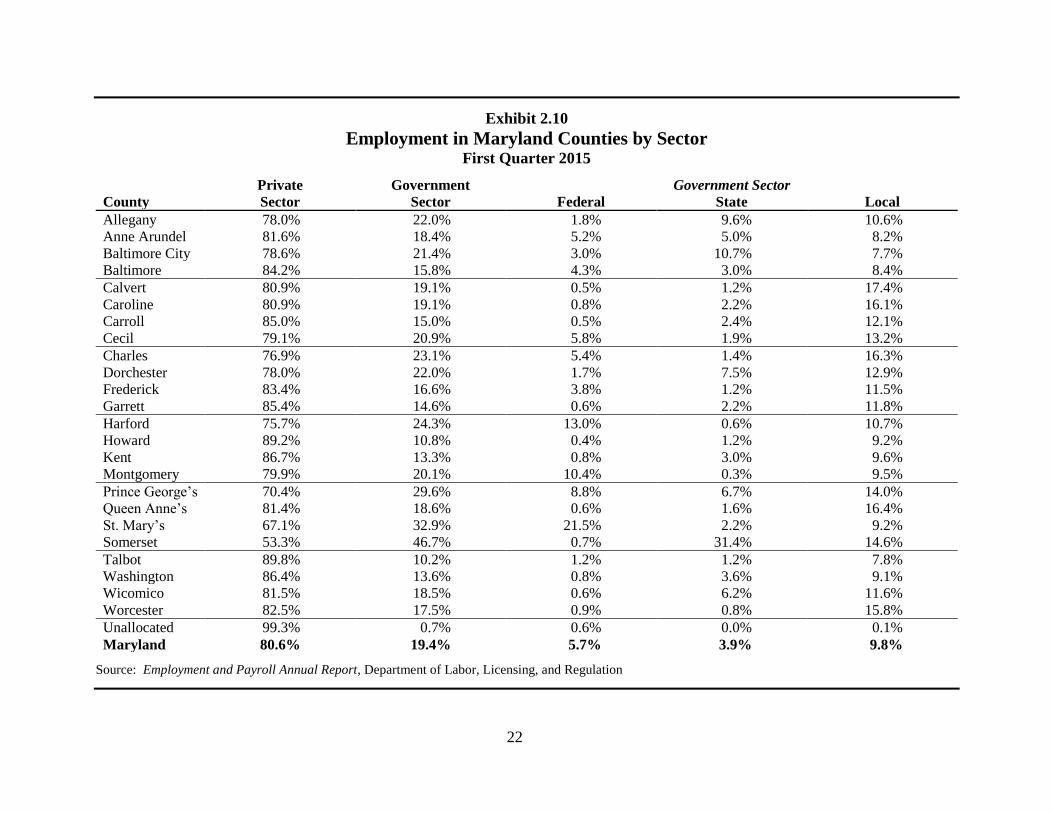
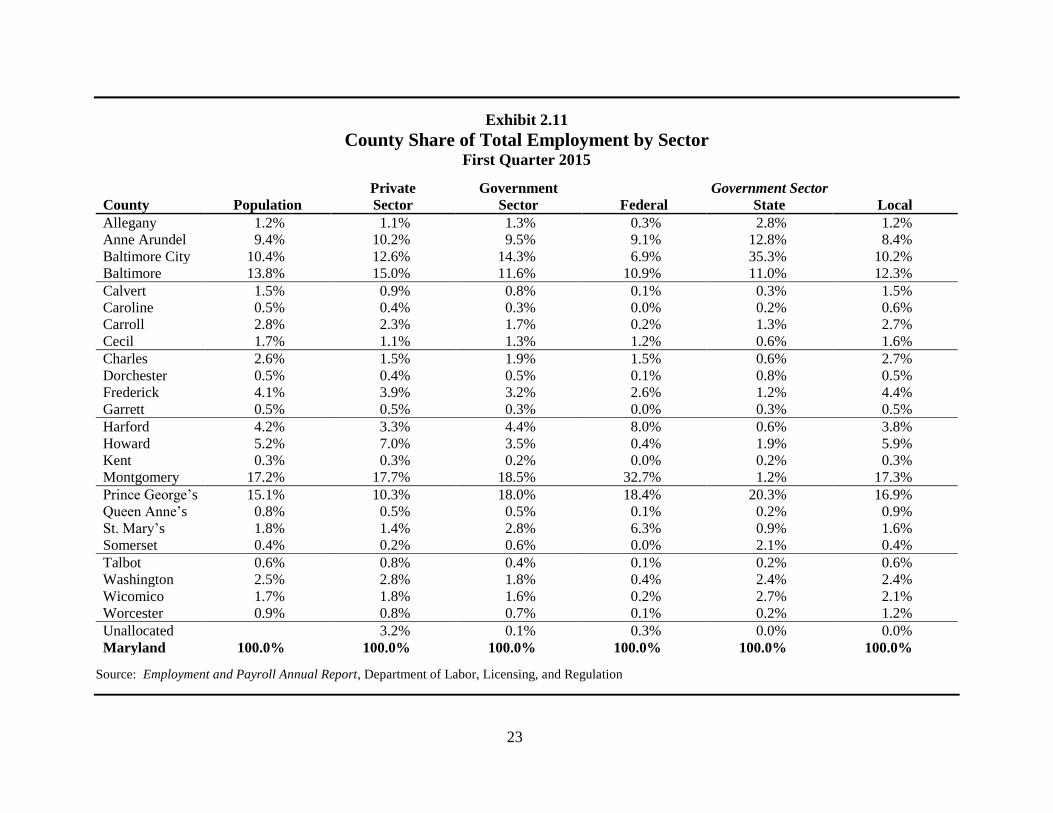
Employment
The private sector accounts for 80% of employment in
Maryland with the government sector accounting for 20%. The
reliance on government employment ranges from 10.2% in
Talbot County to 46.7% in Somerset County. The high reliance
on government employment in Somerset County is due
primarily to the location of correctional facilities in the county
as well as a major State institution of higher education. The
State government accounts for 3.9% of total employment in
Maryland, while local governments account for 9.8%. Due to
the State’s proximity to the nation’s capital, Maryland has a high
concentration of federal employment, which accounts for 5.7%
of total employment in the State. Nearly one-third of federal
positions are located in Montgomery County with an additional
18.4% located in Prince George’s County. Of the State’s
jurisdictions, St. Mary’s and Harford counties have the highest
reliance on federal employment, due to the location of federal
military installations. Exhibit 2.10 shows employment in
Maryland counties by sector and Exhibit 2.11 shows the county
share of total employment by sector.
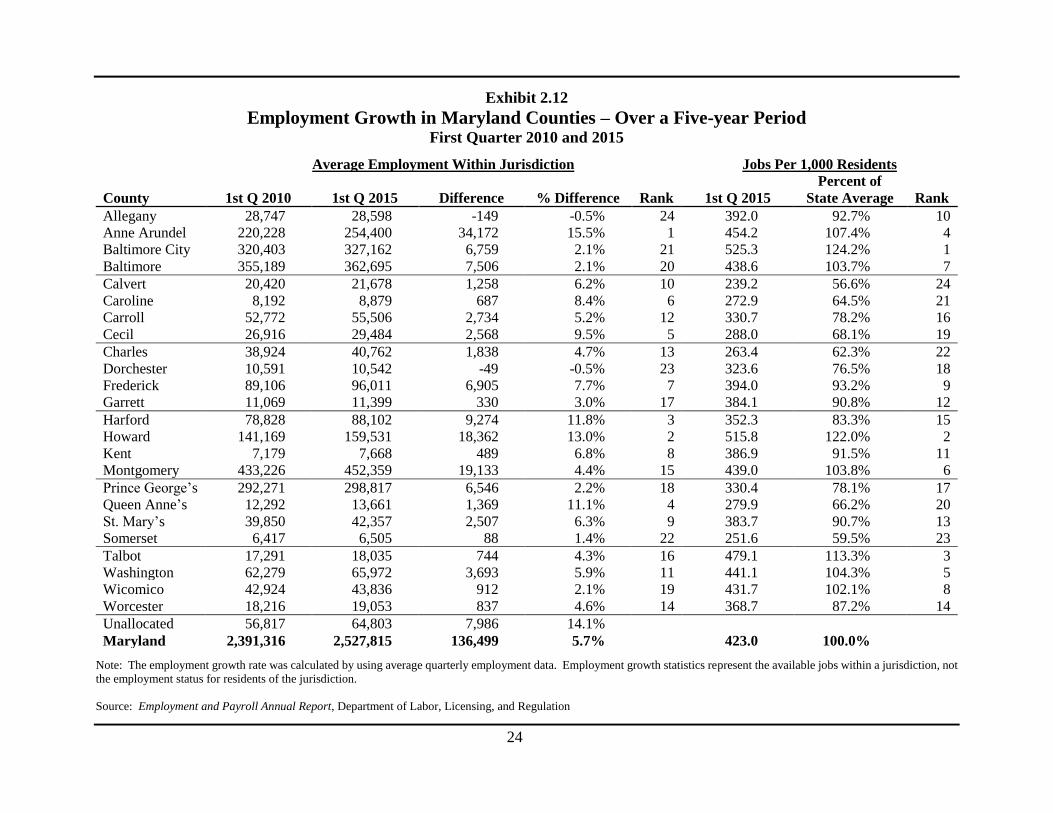
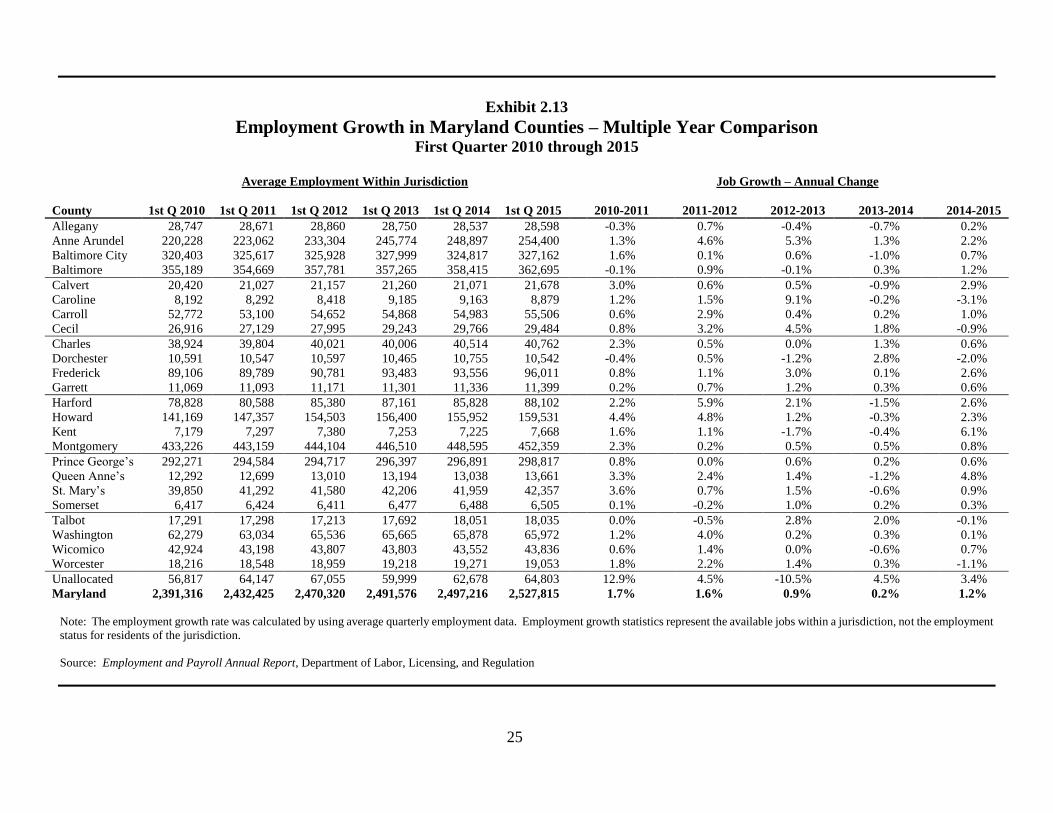
Employment growth is one indicator of an economy’s
overall health. The total number and the percent change in new
jobs created are widely used performance measures. Total
employment in Maryland from 2010 to 2015 increased by 5.7%,
resulting in a gain of 136,500 jobs. The highest employment
growth, on a percentage basis, occurred in Anne Arundel and
Howard counties. However, two counties, Allegany and
Dorchester, experienced net decreases in employment during
this period. Exhibit 2.12 shows the change in employment for
each county from the first quarter in 2010 to the first quarter in
2015. Exhibit 2.13 shows the changes in employment from the
first quarter in 2010 to the first quarter in 2015 on an annual
basis.
The employment growth rate was calculated by using
average quarterly employment data as reported by the
Department of Labor, Licensing, and Regulation. Employment
growth statistics represent the available jobs within a jurisdiction
but not the employment status for residents of the jurisdiction.
The employment status of residents within a jurisdiction is
indicated by the unemployment rate.
13
Exhibit 2.1
Maryland Population and Density
Population Land Area Population
County July 2014 Sq. Miles Density Ranking by Population Ranking by Density
Allegany 72,952 424.2 172.0 1. Montgomery 1,030,447 1. Baltimore City 7,698.3
Anne Arundel 560,133 414.9 1,350.0 2. Prince George’s 904,430 2. Montgomery 2,097.4
Baltimore City 622,793 80.9 7,698.3 3. Baltimore 826,925 3. Prince George’s 1,873.7
Baltimore 826,925 598.3 1,382.1 4. Baltimore City 622,793 4. Baltimore 1,382.1
Calvert 90,613 213.2 425.0 5. Anne Arundel 560,133 5. Anne Arundel 1,350.0
Caroline 32,538 319.4 101.9 6. Howard 309,284 6. Howard 1,233.7
Carroll 167,830 447.6 375.0 7. Harford 250,105 7. Harford 572.2
Cecil 102,383 346.3 295.6 8. Frederick 243,675 8. Calvert 425.0
Charles 154,747 457.8 338.0 9. Carroll 167,830 9. Carroll 375.0
Dorchester 32,578 540.8 60.2 10. Charles 154,747 10. Frederick 369.1
Frederick 243,675 660.2 369.1 11. Washington 149,573 11. Charles 338.0
Garrett 29,679 647.1 45.9 12. St. Mary’s 110,382 12. Washington 326.7
Harford 250,105 437.1 572.2 13. Cecil 102,383 13. St. Mary’s 309.0
Howard 309,284 250.7 1,233.7 14. Wicomico 101,539 14. Cecil 295.6
Kent 19,820 277.0 71.6 15. Calvert 90,613 15. Wicomico 271.2
Montgomery 1,030,447 491.3 2,097.4 16. Allegany 72,952 16. Allegany 172.0
Prince George’s 904,430 482.7 1,873.7 17. Worcester 51,675 17. Talbot 140.2
Queen Anne’s 48,804 371.9 131.2 18. Queen Anne’s 48,804 18. Queen Anne’s 131.2
St. Mary’s 110,382 357.2 309.0 19. Talbot 37,643 19. Worcester 110.3
Somerset 25,859 319.7 80.9 20. Dorchester 32,578 20. Caroline 101.9
Talbot 37,643 268.5 140.2 21. Caroline 32,538 21. Somerset 80.9
Washington 149,573 457.8 326.7 22. Garrett 29,679 22. Kent 71.6
Wicomico 101,539 374.4 271.2 23. Somerset 25,859 23. Dorchester 60.2
Worcester 51,675 468.3 110.3 24. Kent 19,820 24. Garrett 45.9
Maryland 5,976,407 9,707.3 615.7
Source: U.S. Census Bureau; Maryland Department of Planning
14
Exhibit 2.2
Racial Composition of Maryland Counties – July 2014
African Hispanic/ American Native
County White American Latino Asian Indian Hawaiian Multiracial
Allegany 87.4% 8.1% 1.6% 1.0% 0.2% 0.0% 1.7%
Anne Arundel 70.2% 15.9% 7.2% 3.8% 0.3% 0.1% 2.5%
Baltimore City 28.2% 62.3% 4.7% 2.6% 0.3% 0.0% 1.8%
Baltimore 59.6% 27.2% 5.0% 5.8% 0.3% 0.0% 2.1%
Calvert 79.0% 12.9% 3.5% 1.6% 0.3% 0.1% 2.5%
Caroline 77.0% 13.9% 6.4% 0.8% 0.3% 0.0% 1.7%
Carroll 90.2% 3.4% 3.0% 1.7% 0.2% 0.0% 1.5%
Cecil 85.9% 6.4% 4.1% 1.2% 0.3% 0.0% 2.0%
Charles 44.5% 42.9% 5.3% 3.2% 0.6% 0.1% 3.4%
Dorchester 64.5% 27.6% 4.6% 1.1% 0.3% 0.0% 1.7%
Frederick 75.7% 8.8% 8.4% 4.4% 0.2% 0.1% 2.4%
Garrett 96.6% 1.1% 1.0% 0.5% 0.1% 0.0% 0.7%
Harford 77.4% 12.8% 4.2% 3.0% 0.2% 0.1% 2.2%
Howard 55.4% 18.0% 6.4% 16.8% 0.2% 0.1% 3.1%
Kent 78.5% 14.6% 4.3% 0.9% 0.1% 0.0% 1.5%
Montgomery 46.0% 17.5% 18.7% 15.0% 0.2% 0.0% 2.6%
Prince George’s 14.2% 62.3% 16.9% 4.5% 0.2% 0.0% 2.0%
Queen Anne’s 86.9% 6.7% 3.4% 1.0% 0.3% 0.0% 1.6%
St. Mary’s 75.3% 14.1% 4.7% 2.7% 0.3% 0.1% 2.8%
Somerset 51.0% 42.2% 3.7% 0.9% 0.4% 0.0% 1.9%
Talbot 78.1% 12.7% 6.3% 1.4% 0.1% 0.0% 1.3%
Washington 81.0% 10.4% 4.3% 1.7% 0.2% 0.1% 2.3%
Wicomico 64.8% 24.6% 5.2% 3.0% 0.2% 0.0% 2.2%
Worcester 79.8% 13.5% 3.5% 1.4% 0.2% 0.0% 1.6%
Maryland 52.6% 29.3% 9.3% 6.3% 0.2% 0.1% 2.2%
United States 62.1% 12.4% 17.4% 5.3% 0.7% 0.2% 2.0%
Source: U.S. Census Bureau; Maryland Department of Planning
15
Exhibit 2.3
Population Growth by Racial Composition April 2000 to July 2014
African Hispanic/ American Native
County White American Latino Asian Indian Hawaiian Multiracial
Allegany -8.1% 48.7% 109.3% 82.6% -0.9% 63.2% 161.6%
Anne Arundel 0.5% 35.1% 210.8% 85.9% 8.1% 80.3% 133.7%
Baltimore City -13.5% -7.2% 166.2% 62.5% -9.0% 16.4% 78.6%
Baltimore -11.2% 48.4% 200.6% 97.4% 19.3% 58.5% 141.3%
Calvert 15.5% 20.4% 180.0% 123.7% 29.8% 176.2% 181.0%
Caroline 4.0% 2.0% 164.8% 53.4% 7.1% 900.0% 127.8%
Carroll 5.4% 67.9% 238.3% 146.4% -4.8% 43.8% 196.6%
Cecil 10.4% 97.2% 224.1% 109.7% 4.2% 121.7% 174.3%
Charles -15.3% 111.8% 200.7% 128.7% 10.6% 103.0% 157.9%
Dorchester -0.5% 3.6% 290.4% 73.2% 52.8% 900.0% 201.1%
Frederick 7.1% 73.5% 339.7% 224.2% 36.8% 159.6% 168.8%
Garrett -2.5% 151.2% 126.7% 150.9% 78.3% -85.7% 121.2%
Harford 3.1% 59.6% 152.4% 123.6% 23.1% 60.0% 126.6%
Howard -5.2% 55.3% 163.6% 171.2% 10.0% 104.7% 145.5%
Kent 3.2% -12.8% 55.1% 71.0% 16.0% -37.5% 166.7%
Montgomery -9.6% 35.8% 91.7% 54.6% -4.0% 20.1% 94.7%
Prince George’s -34.7% 12.1% 167.4% 27.5% -8.0% 15.9% 54.9%
Queen Anne’s 18.1% -7.6% 276.4% 116.9% 49.4% 30.0% 151.6%
St. Mary’s 19.6% 30.1% 199.1% 92.8% 28.5% 30.8% 165.3%
Somerset -4.7% 7.5% 183.5% 91.0% 11.9% 60.0% 120.7%
Talbot 7.0% -7.9% 287.6% 91.6% 0.0% 142.9% 146.0%
Washington 3.0% 53.0% 306.0% 133.0% 28.6% 61.5% 217.4%
Wicomico 8.5% 26.6% 188.1% 100.9% 49.7% 115.4% 190.6%
Worcester 10.0% -9.8% 204.2% 141.2% 35.2% 87.5% 142.1%
Maryland -4.7% 18.5% 144.6% 74.6% 6.1% 50.2% 114.0%
Source: U.S. Census Bureau; Maryland Department of Planning
16
Exhibit 2.4
Growth in Minority Population by County
Highest to Lowest Highest to Lowest
County April 2000 July 2014 Change % Change Population Change Percent Change
Allegany 5,528 9,173 3,645 65.9% 1. Montgomery 207,231 1. Frederick 158.0%
Anne Arundel 98,113 166,748 68,635 70.0% 2. Prince George’s 171,094 2. Cecil 130.2%
Baltimore City 447,821 446,914 -907 -0.2% 3. Baltimore 135,074 3. Garrett 129.7%
Baltimore 198,666 333,740 135,074 68.0% 4. Howard 70,836 4. Carroll 127.1%
Calvert 12,587 19,004 6,417 51.0% 5. Anne Arundel 68,635 5. Charles 119.0%
Caroline 5,693 7,488 1,795 31.5% 6. Charles 46,651 6. Howard 105.7%
Carroll 7,243 16,446 9,203 127.1% 7. Frederick 36,243 7. Washington 99.3%
Cecil 6,265 14,422 8,157 130.2% 8. Harford 25,754 8. Harford 84.0%
Charles 39,192 85,843 46,651 119.0% 9. Washington 14,127 9. Anne Arundel 70.0%
Dorchester 9,545 11,552 2,007 21.0% 10. Wicomico 11,757 10. Baltimore 68.0%
Frederick 22,935 59,178 36,243 158.0% 11. St. Mary’s 10,524 11. Allegany 65.9%
Garrett 444 1,020 576 129.7% 12. Carroll 9,203 12. St. Mary’s 62.9%
Harford 30,663 56,417 25,754 84.0% 13. Cecil 8,157 13. Montgomery 59.4%
Howard 67,042 137,878 70,836 105.7% 14. Calvert 6,417 14. Calvert 51.0%
Kent 4,127 4,270 143 3.5% 15. Allegany 3,645 15. Wicomico 49.0%
Montgomery 349,090 556,321 207,231 59.4% 16. Dorchester 2,007 16. Queen Anne’s 37.6%
Prince George’s 605,102 776,196 171,094 28.3% 17. Talbot 1,916 17. Caroline 31.5%
Queen Anne’s 4,637 6,381 1,744 37.6% 18. Caroline 1,795 18. Talbot 30.3%
St. Mary’s 16,739 27,263 10,524 62.9% 19. Somerset 1,768 19. Prince George’s 28.3%
Somerset 10,906 12,674 1,768 16.2% 20. Queen Anne’s 1,744 20. Dorchester 21.0%
Talbot 6,323 8,239 1,916 30.3% 21. Worcester 1,388 21. Somerset 16.2%
Washington 14,227 28,354 14,127 99.3% 22. Garrett 576 22. Worcester 15.3%
Wicomico 23,981 35,738 11,757 49.0% 23. Kent 143 23. Kent 3.5%
Worcester 9,056 10,444 1,388 15.3% 24. Baltimore City -907 24. Baltimore City -0.2%
Maryland 1,995,925 2,831,703 835,778 41.9%
Source: U.S. Census Bureau
17
Exhibit 2.5
Growth in Minority Share of Population by County
Percentage
Point Highest to Lowest Highest to Lowest
County April 2000 July 2014 Change Minority Share of Population Percentage Point Change
Allegany 7.4% 12.6% 5.2% 1. Prince George’s 85.8% 1. Charles 23.0%
Anne Arundel 20.0% 29.8% 9.7% 2. Baltimore City 71.8% 2. Howard 17.5%
Baltimore City 68.8% 71.8% 3.0% 3. Charles 55.5% 3. Baltimore 14.0%
Baltimore 26.3% 40.4% 14.0% 4. Montgomery 54.0% 4. Montgomery 14.0%
Calvert 16.9% 21.0% 4.1% 5. Somerset 49.0% 5. Frederick 12.5%
Caroline 19.1% 23.0% 3.9% 6. Howard 44.6% 6. Prince George’s 10.3%
Carroll 4.8% 9.8% 5.0% 7. Baltimore 40.4% 7. Anne Arundel 9.7%
Cecil 7.3% 14.1% 6.8% 8. Dorchester 35.5% 8. Harford 8.5%
Charles 32.5% 55.5% 23.0% 9. Wicomico 35.2% 9. Washington 8.2%
Dorchester 31.1% 35.5% 4.3% 10. Anne Arundel 29.8% 10. Wicomico 6.9%
Frederick 11.7% 24.3% 12.5% 11. St. Mary’s 24.7% 11. Cecil 6.8%
Garrett 1.5% 3.4% 1.9% 12. Frederick 24.3% 12. St. Mary’s 5.3%
Harford 14.0% 22.6% 8.5% 13. Caroline 23.0% 13. Allegany 5.2%
Howard 27.1% 44.6% 17.5% 14. Harford 22.6% 14. Carroll 5.0%
Kent 21.5% 21.5% 0.0% 15. Talbot 21.9% 15. Somerset 4.9%
Montgomery 40.0% 54.0% 14.0% 16. Kent 21.5% 16. Dorchester 4.3%
Prince George’s 75.5% 85.8% 10.3% 17. Calvert 21.0% 17. Calvert 4.1%
Queen Anne’s 11.4% 13.1% 1.6% 18. Worcester 20.2% 18. Caroline 3.9%
St. Mary’s 19.4% 24.7% 5.3% 19. Washington 19.0% 19. Talbot 3.2%
Somerset 44.1% 49.0% 4.9% 20. Cecil 14.1% 20. Baltimore City 3.0%
Talbot 18.7% 21.9% 3.2% 21. Queen Anne’s 13.1% 21. Garrett 1.9%
Washington 10.8% 19.0% 8.2% 22. Allegany 12.6% 22. Queen Anne’s 1.6%
Wicomico 28.3% 35.2% 6.9% 23. Carroll 9.8% 23. Worcester 0.8%
Worcester 19.5% 20.2% 0.8% 24. Garrett 3.4% 24. Kent 0.0%
Maryland 37.7% 47.4% 9.7%
Source: U.S. Census Bureau
18
Exhibit 2.6
Population Growth in Maryland by County
Highest to Lowest Change Highest to Lowest % Change
County April 2000 July 2014 Change % Change 2000 to 2014 2000 to 2014
Allegany 74,930 72,952 -1,978 -2.6% 1. Montgomery 157,106 1. Charles 28.4%
Anne Arundel 489,664 560,133 70,469 14.4% 2. Prince George’s 102,915 2. St. Mary’s 28.0%
Baltimore City 651,154 622,793 -28,361 -4.4% 3. Baltimore 72,633 3. Howard 24.8%
Baltimore 754,292 826,925 72,633 9.6% 4. Anne Arundel 70,469 4. Frederick 24.8%
Calvert 74,563 90,613 16,050 21.5% 5. Howard 61,441 5. Calvert 21.5%
Caroline 29,772 32,538 2,766 9.3% 6. Frederick 48,399 6. Queen Anne’s 20.3%
Carroll 150,897 167,830 16,933 11.2% 7. Charles 34,201 7. Wicomico 20.0%
Cecil 85,951 102,383 16,432 19.1% 8. Harford 31,515 8. Cecil 19.1%
Charles 120,546 154,747 34,201 28.4% 9. St. Mary’s 24,150 9. Montgomery 18.0%
Dorchester 30,675 32,578 1,903 6.2% 10. Washington 17,650 10. Harford 14.4%
Frederick 195,276 243,675 48,399 24.8% 11. Carroll 16,933 11. Anne Arundel 14.4%
Garrett 29,846 29,679 -167 -0.6% 12. Wicomico 16,895 12. Washington 13.4%
Harford 218,590 250,105 31,515 14.4% 13. Cecil 16,432 13. Prince George’s 12.8%
Howard 247,843 309,284 61,441 24.8% 14. Calvert 16,050 14. Talbot 11.3%
Kent 19,200 19,820 620 3.2% 15. Queen Anne’s 8,244 15. Carroll 11.2%
Montgomery 873,341 1,030,447 157,106 18.0% 16. Worcester 5,132 16. Worcester 11.0%
Prince George’s 801,515 904,430 102,915 12.8% 17. Talbot 3,831 17. Baltimore 9.6%
Queen Anne’s 40,560 48,804 8,244 20.3% 18. Caroline 2,766 18. Caroline 9.3%
St. Mary’s 86,232 110,382 24,150 28.0% 19. Dorchester 1,903 19. Dorchester 6.2%
Somerset 24,747 25,859 1,112 4.5% 20. Somerset 1,112 20. Somerset 4.5%
Talbot 33,812 37,643 3,831 11.3% 21. Kent 620 21. Kent 3.2%
Washington 131,923 149,573 17,650 13.4% 22. Garrett -167 22. Garrett -0.6%
Wicomico 84,644 101,539 16,895 20.0% 23. Allegany -1,978 23. Allegany -2.6%
Worcester 46,543 51,675 5,132 11.0% 24. Baltimore City -28,361 24. Baltimore City -4.4%
Maryland 5,296,516 5,976,407 679,891 12.8%
Source: U.S. Census Bureau
19
Exhibit 2.7
Crime Rates for Maryland Counties
Crime Rates Crime Rates
Per 100,000 Residents Percent of State Average Murder Count Robbery Count Vehicle Theft Count
County CY 2013 CY 2014 % Change CY 2013 CY 2014 Rank CY 2013 CY 2014 CY 2013 CY 2014 CY 2013 CY 2014
Allegany 3,571.5 3,519.8 -1.4% 114.2% 118.9% 5 4 2 63 31 54 42
Anne Arundel 3,023.4 2,805.0 -7.2% 96.7% 94.8% 9 15 14 630 634 677 702
Baltimore City 6,422.0 6,146.0 -4.3% 205.3% 207.6% 1 233 211 3,755 3,740 4,462 4,504
Baltimore 3,392.4 3,211.4 -5.3% 108.5% 108.5% 8 20 25 1,511 1,512 1,463 1,499
Calvert 1,934.9 1,828.7 -5.5% 61.9% 61.8% 18 4 0 27 30 64 43
Caroline 3,101.2 2,718.8 -12.3% 99.2% 91.8% 10 0 2 15 11 22 24
Carroll 1,602.1 1,543.8 -3.6% 51.2% 52.2% 24 4 2 33 42 65 49
Cecil 3,243.9 3,312.0 2.1% 103.7% 111.9% 7 5 4 86 90 111 92
Charles 2,706.0 2,326.2 -14.0% 86.5% 78.6% 13 3 2 147 148 192 157
Dorchester 3,437.9 3,762.6 9.4% 109.9% 127.1% 4 0 3 36 22 19 42
Frederick 1,959.7 1,780.3 -9.2% 62.7% 60.1% 20 5 4 141 113 150 83
Garrett 2,345.9 1,749.3 -25.4% 75.0% 59.1% 22 0 0 5 1 23 15
Harford 1,888.2 1,701.6 -9.9% 60.4% 57.5% 23 5 6 178 165 131 106
Howard 2,222.7 2,050.5 -7.7% 71.1% 69.3% 15 5 5 204 201 254 231
Kent 1,982.0 1,938.2 -2.2% 63.4% 65.5% 17 0 0 22 6 10 5
Montgomery 1,774.6 1,795.1 1.2% 56.7% 60.6% 19 9 18 812 661 913 753
Prince George’s 3,722.5 3,415.4 -8.2% 119.0% 115.4% 6 56 56 2,012 1,846 4,293 4,278
Queen Anne’s 1,963.9 1,769.4 -9.9% 62.8% 59.8% 21 2 0 22 21 22 18
St. Mary’s 2,487.9 2,232.0 -10.3% 79.5% 75.4% 14 3 0 62 58 119 73
Somerset 2,230.6 2,036.5 -8.7% 71.3% 68.8% 16 2 0 14 14 17 10
Talbot 1,926.6 2,367.2 22.9% 61.6% 80.0% 12 1 0 15 16 11 21
Washington 2,329.0 2,470.4 6.1% 74.5% 83.5% 11 6 6 121 153 166 231
Wicomico 3,817.4 3,823.1 0.1% 122.1% 129.2% 3 3 2 142 101 111 96
Worcester 4,511.0 4,689.3 4.0% 144.2% 158.4% 2 2 1 28 35 55 38
Maryland 3,127.5 2,960.2 -5.3% 100.0% 100.0% 387 363 10,082 9,651 13,429 13,146
Source: Uniform Crime Report, Maryland State Police
20
Exhibit 2.8
Crime Rates for Maryland’s Largest Municipalities
Crime Rates Crime Rates
Per 100,000 Residents % of State Average Murder Count Robbery Count Vehicle Theft Count
Rank Municipality CY 2013 CY 2014 % Change CY 2013 CY 2014 CY 2013 CY 2014 CY 2013 CY 2014 CY 2013 CY 2014
1. Elkton 8,311.5 8,998.1 8.3% 265.8% 304.0% 0 0 52 57 30 29
2. Hyattsville 6,844.9 7,252.6 6.0% 218.9% 245.0% 0 2 58 60 65 81
3. Cumberland 7,328.6 7,145.0 -2.5% 234.3% 241.4% 1 0 44 23 27 17
4. Cambridge 5,826.0 7,119.7 22.2% 186.3% 240.5% 0 2 31 21 6 24
5. Salisbury 6,894.7 6,872.5 -0.3% 220.5% 232.2% 0 0 100 71 53 46
6. Westminster 5,286.6 4,503.1 -14.8% 169.0% 152.1% 2 0 15 16 10 14
7. Hagerstown 4,306.8 4,298.6 -0.2% 137.7% 145.2% 5 1 101 106 73 114
8. Laurel 3,867.6 4,149.6 7.3% 123.7% 140.2% 0 1 68 57 82 87
9. College Park 4,014.4 3,824.5 -4.7% 128.4% 129.2% 1 1 23 28 92 138
10. Greenbelt 4,092.1 3,779.6 -7.6% 130.8% 127.7% 0 1 67 55 108 86
11. Aberdeen 3,697.1 3,740.8 1.2% 118.2% 126.4% 0 0 20 27 16 9
12. Takoma Park 3,049.2 3,639.9 19.4% 97.5% 123.0% 1 1 37 33 42 48
13. Easton 2,206.8 3,561.0 61.4% 70.6% 120.3% 0 0 15 11 2 8
14. New Carrollton 2,745.7 3,324.6 21.1% 87.8% 112.3% 2 2 25 20 43 37
15. Annapolis 3,216.1 2,966.3 -7.8% 102.8% 100.2% 4 1 63 66 66 58
16. Frederick 3,185.5 2,768.7 -13.1% 101.9% 93.5% 1 1 98 82 61 39
17. Havre de Grace 3,155.9 2,510.1 -20.5% 100.9% 84.8% 0 0 11 11 17 7
18. Gaithersburg 2,105.1 1,841.8 -12.5% 67.3% 62.2% 1 1 50 36 63 42
19. Bowie 1,763.4 1,694.4 -3.9% 56.4% 57.2% 0 1 31 32 67 71
20. Rockville 1,790.6 1,643.6 -8.2% 57.3% 55.5% 0 1 45 43 53 48
Baltimore City 6,422.0 6,146.0 -4.3% 205.3% 207.6% 233 211 3,755 3,740 4,462 4,504
State Total 3,127.5 2,960.2 -5.3% 100.0% 100.0% 387 363 10,082 9,651 13,429 13,146
Source: Uniform Crime Report, Maryland State Police
21
Exhibit 2.9
Economic Indicators for Maryland Counties
Average Weekly Wage Unemployment Rate Median Household Income Median Home Price
Percent of Percent of Percent
County 1st Q 2015 State Average CY 2013 CY 2014 CY 2015 CY 2011-2013 State Average FY 2014 FY 2015 Change
Allegany $664 59.7% 7.8% 7.3% 6.9% $39,846 55.1% $102,000 $106,000 3.9%
Anne Arundel 1,075 96.6% 5.9% 5.2% 4.7% 87,460 120.9% 335,000 336,600 0.5%
Baltimore City 1,241 111.5% 9.6% 8.7% 8.0% 40,798 56.4% 192,500 180,000 -6.5%
Baltimore 1,000 89.8% 6.9% 6.2% 5.7% 64,700 89.4% 245,000 240,000 -2.0%
Calvert 906 81.4% 5.7% 5.3% 4.7% 92,601 128.0% 336,500 340,000 1.0%
Caroline 747 67.1% 7.5% 6.3% 5.8% 52,967 73.2% 187,000 178,500 -4.5%
Carroll 753 67.7% 5.7% 4.9% 4.5% 81,600 112.8% 307,000 302,000 -1.6%
Cecil 838 75.3% 7.7% 6.6% 6.1% 66,575 92.0% 239,000 229,000 -4.2%
Charles 809 72.7% 6.2% 5.6% 5.1% 90,789 125.5% 299,000 301,525 0.8%
Dorchester 726 65.2% 9.7% 8.5% 7.8% 45,508 62.9% 154,000 162,500 5.5%
Frederick 953 85.6% 5.7% 5.1% 4.7% 82,061 113.4% 310,000 307,000 -1.0%
Garrett 602 54.1% 7.3% 6.9% 6.5% 41,728 57.7% 157,500 136,250 -13.5%
Harford 936 84.1% 6.6% 5.8% 5.3% 79,091 109.3% 268,250 275,000 2.5%
Howard 1,238 111.2% 4.9% 4.4% 4.1% 107,452 148.5% 425,000 435,100 2.4%
Kent 714 64.2% 7.1% 6.5% 6.0% 58,157 80.4% 213,000 207,500 -2.6%
Montgomery 1,408 126.5% 5.1% 4.4% 4.1% 97,181 134.3% 430,000 425,000 -1.2%
Prince George’s 1,043 93.7% 6.8% 5.9% 5.3% 72,098 99.7% 255,000 279,200 9.5%
Queen Anne’s 675 60.6% 5.9% 5.1% 4.8% 84,309 116.5% 323,000 325,000 0.6%
St. Mary’s 1,223 109.9% 5.8% 5.4% 5.1% 85,174 117.7% 285,000 279,900 -1.8%
Somerset 805 72.3% 9.9% 9.5% 8.6% 32,997 45.6% 135,000 132,900 -1.6%
Talbot 744 66.8% 6.8% 5.7% 5.4% 58,618 81.0% 280,000 285,000 1.8%
Washington 756 67.9% 8.0% 6.5% 6.0% 55,700 77.0% 198,000 189,000 -4.5%
Wicomico 730 65.6% 8.1% 7.7% 7.0% 50,473 69.8% 164,000 165,000 0.6%
Worcester 628 56.4% 11.5% 11.3% 10.8% 56,279 77.8% 210,000 225,000 7.1%
Maryland $1,113 100.0% 6.6% 5.8% 5.4% $72,345 100.0% $304,000 $300,000 -1.3%
Source: Department of Labor, Licensing, and Regulation; Maryland Department of Planning; State Department of Assessments and Taxation
22
Exhibit 2.10
Employment in Maryland Counties by Sector First Quarter 2015
Private Government Government Sector
County Sector Sector Federal State Local
Allegany 78.0% 22.0% 1.8% 9.6% 10.6%
Anne Arundel 81.6% 18.4% 5.2% 5.0% 8.2%
Baltimore City 78.6% 21.4% 3.0% 10.7% 7.7%
Baltimore 84.2% 15.8% 4.3% 3.0% 8.4%
Calvert 80.9% 19.1% 0.5% 1.2% 17.4%
Caroline 80.9% 19.1% 0.8% 2.2% 16.1%
Carroll 85.0% 15.0% 0.5% 2.4% 12.1%
Cecil 79.1% 20.9% 5.8% 1.9% 13.2%
Charles 76.9% 23.1% 5.4% 1.4% 16.3%
Dorchester 78.0% 22.0% 1.7% 7.5% 12.9%
Frederick 83.4% 16.6% 3.8% 1.2% 11.5%
Garrett 85.4% 14.6% 0.6% 2.2% 11.8%
Harford 75.7% 24.3% 13.0% 0.6% 10.7%
Howard 89.2% 10.8% 0.4% 1.2% 9.2%
Kent 86.7% 13.3% 0.8% 3.0% 9.6%
Montgomery 79.9% 20.1% 10.4% 0.3% 9.5%
Prince George’s 70.4% 29.6% 8.8% 6.7% 14.0%
Queen Anne’s 81.4% 18.6% 0.6% 1.6% 16.4%
St. Mary’s 67.1% 32.9% 21.5% 2.2% 9.2%
Somerset 53.3% 46.7% 0.7% 31.4% 14.6%
Talbot 89.8% 10.2% 1.2% 1.2% 7.8%
Washington 86.4% 13.6% 0.8% 3.6% 9.1%
Wicomico 81.5% 18.5% 0.6% 6.2% 11.6%
Worcester 82.5% 17.5% 0.9% 0.8% 15.8%
Unallocated 99.3% 0.7% 0.6% 0.0% 0.1%
Maryland 80.6% 19.4% 5.7% 3.9% 9.8%
Source: Employment and Payroll Annual Report, Department of Labor, Licensing, and Regulation
23
Exhibit 2.11
County Share of Total Employment by Sector First Quarter 2015
Private Government Government Sector
County Population Sector Sector Federal State Local
Allegany 1.2% 1.1% 1.3% 0.3% 2.8% 1.2%
Anne Arundel 9.4% 10.2% 9.5% 9.1% 12.8% 8.4%
Baltimore City 10.4% 12.6% 14.3% 6.9% 35.3% 10.2%
Baltimore 13.8% 15.0% 11.6% 10.9% 11.0% 12.3%
Calvert 1.5% 0.9% 0.8% 0.1% 0.3% 1.5%
Caroline 0.5% 0.4% 0.3% 0.0% 0.2% 0.6%
Carroll 2.8% 2.3% 1.7% 0.2% 1.3% 2.7%
Cecil 1.7% 1.1% 1.3% 1.2% 0.6% 1.6%
Charles 2.6% 1.5% 1.9% 1.5% 0.6% 2.7%
Dorchester 0.5% 0.4% 0.5% 0.1% 0.8% 0.5%
Frederick 4.1% 3.9% 3.2% 2.6% 1.2% 4.4%
Garrett 0.5% 0.5% 0.3% 0.0% 0.3% 0.5%
Harford 4.2% 3.3% 4.4% 8.0% 0.6% 3.8%
Howard 5.2% 7.0% 3.5% 0.4% 1.9% 5.9%
Kent 0.3% 0.3% 0.2% 0.0% 0.2% 0.3%
Montgomery 17.2% 17.7% 18.5% 32.7% 1.2% 17.3%
Prince George’s 15.1% 10.3% 18.0% 18.4% 20.3% 16.9%
Queen Anne’s 0.8% 0.5% 0.5% 0.1% 0.2% 0.9%
St. Mary’s 1.8% 1.4% 2.8% 6.3% 0.9% 1.6%
Somerset 0.4% 0.2% 0.6% 0.0% 2.1% 0.4%
Talbot 0.6% 0.8% 0.4% 0.1% 0.2% 0.6%
Washington 2.5% 2.8% 1.8% 0.4% 2.4% 2.4%
Wicomico 1.7% 1.8% 1.6% 0.2% 2.7% 2.1%
Worcester 0.9% 0.8% 0.7% 0.1% 0.2% 1.2%
Unallocated 3.2% 0.1% 0.3% 0.0% 0.0%
Maryland 100.0% 100.0% 100.0% 100.0% 100.0% 100.0%
Source: Employment and Payroll Annual Report, Department of Labor, Licensing, and Regulation
24
Exhibit 2.12
Employment Growth in Maryland Counties – Over a Five-year Period First Quarter 2010 and 2015
Average Employment Within Jurisdiction Jobs Per 1,000 Residents
Percent of
County 1st Q 2010 1st Q 2015 Difference % Difference Rank 1st Q 2015 State Average Rank
Allegany 28,747 28,598 -149 -0.5% 24 392.0 92.7% 10
Anne Arundel 220,228 254,400 34,172 15.5% 1 454.2 107.4% 4
Baltimore City 320,403 327,162 6,759 2.1% 21 525.3 124.2% 1
Baltimore 355,189 362,695 7,506 2.1% 20 438.6 103.7% 7
Calvert 20,420 21,678 1,258 6.2% 10 239.2 56.6% 24
Caroline 8,192 8,879 687 8.4% 6 272.9 64.5% 21
Carroll 52,772 55,506 2,734 5.2% 12 330.7 78.2% 16
Cecil 26,916 29,484 2,568 9.5% 5 288.0 68.1% 19
Charles 38,924 40,762 1,838 4.7% 13 263.4 62.3% 22
Dorchester 10,591 10,542 -49 -0.5% 23 323.6 76.5% 18
Frederick 89,106 96,011 6,905 7.7% 7 394.0 93.2% 9
Garrett 11,069 11,399 330 3.0% 17 384.1 90.8% 12
Harford 78,828 88,102 9,274 11.8% 3 352.3 83.3% 15
Howard 141,169 159,531 18,362 13.0% 2 515.8 122.0% 2
Kent 7,179 7,668 489 6.8% 8 386.9 91.5% 11
Montgomery 433,226 452,359 19,133 4.4% 15 439.0 103.8% 6
Prince George’s 292,271 298,817 6,546 2.2% 18 330.4 78.1% 17
Queen Anne’s 12,292 13,661 1,369 11.1% 4 279.9 66.2% 20
St. Mary’s 39,850 42,357 2,507 6.3% 9 383.7 90.7% 13
Somerset 6,417 6,505 88 1.4% 22 251.6 59.5% 23
Talbot 17,291 18,035 744 4.3% 16 479.1 113.3% 3
Washington 62,279 65,972 3,693 5.9% 11 441.1 104.3% 5
Wicomico 42,924 43,836 912 2.1% 19 431.7 102.1% 8
Worcester 18,216 19,053 837 4.6% 14 368.7 87.2% 14
Unallocated 56,817 64,803 7,986 14.1%
Maryland 2,391,316 2,527,815 136,499 5.7% 423.0 100.0%
Note: The employment growth rate was calculated by using average quarterly employment data. Employment growth statistics represent the available jobs within a jurisdiction, not
the employment status for residents of the jurisdiction.
Source: Employment and Payroll Annual Report, Department of Labor, Licensing, and Regulation
25
Exhibit 2.13
Employment Growth in Maryland Counties – Multiple Year Comparison First Quarter 2010 through 2015
Average Employment Within Jurisdiction Job Growth – Annual Change
County 1st Q 2010 1st Q 2011 1st Q 2012 1st Q 2013 1st Q 2014 1st Q 2015 2010-2011 2011-2012 2012-2013 2013-2014 2014-2015
Allegany 28,747 28,671 28,860 28,750 28,537 28,598 -0.3% 0.7% -0.4% -0.7% 0.2%
Anne Arundel 220,228 223,062 233,304 245,774 248,897 254,400 1.3% 4.6% 5.3% 1.3% 2.2%
Baltimore City 320,403 325,617 325,928 327,999 324,817 327,162 1.6% 0.1% 0.6% -1.0% 0.7%
Baltimore 355,189 354,669 357,781 357,265 358,415 362,695 -0.1% 0.9% -0.1% 0.3% 1.2%
Calvert 20,420 21,027 21,157 21,260 21,071 21,678 3.0% 0.6% 0.5% -0.9% 2.9%
Caroline 8,192 8,292 8,418 9,185 9,163 8,879 1.2% 1.5% 9.1% -0.2% -3.1%
Carroll 52,772 53,100 54,652 54,868 54,983 55,506 0.6% 2.9% 0.4% 0.2% 1.0%
Cecil 26,916 27,129 27,995 29,243 29,766 29,484 0.8% 3.2% 4.5% 1.8% -0.9%
Charles 38,924 39,804 40,021 40,006 40,514 40,762 2.3% 0.5% 0.0% 1.3% 0.6%
Dorchester 10,591 10,547 10,597 10,465 10,755 10,542 -0.4% 0.5% -1.2% 2.8% -2.0%
Frederick 89,106 89,789 90,781 93,483 93,556 96,011 0.8% 1.1% 3.0% 0.1% 2.6%
Garrett 11,069 11,093 11,171 11,301 11,336 11,399 0.2% 0.7% 1.2% 0.3% 0.6%
Harford 78,828 80,588 85,380 87,161 85,828 88,102 2.2% 5.9% 2.1% -1.5% 2.6%
Howard 141,169 147,357 154,503 156,400 155,952 159,531 4.4% 4.8% 1.2% -0.3% 2.3%
Kent 7,179 7,297 7,380 7,253 7,225 7,668 1.6% 1.1% -1.7% -0.4% 6.1%
Montgomery 433,226 443,159 444,104 446,510 448,595 452,359 2.3% 0.2% 0.5% 0.5% 0.8%
Prince George’s 292,271 294,584 294,717 296,397 296,891 298,817 0.8% 0.0% 0.6% 0.2% 0.6%
Queen Anne’s 12,292 12,699 13,010 13,194 13,038 13,661 3.3% 2.4% 1.4% -1.2% 4.8%
St. Mary’s 39,850 41,292 41,580 42,206 41,959 42,357 3.6% 0.7% 1.5% -0.6% 0.9%
Somerset 6,417 6,424 6,411 6,477 6,488 6,505 0.1% -0.2% 1.0% 0.2% 0.3%
Talbot 17,291 17,298 17,213 17,692 18,051 18,035 0.0% -0.5% 2.8% 2.0% -0.1%
Washington 62,279 63,034 65,536 65,665 65,878 65,972 1.2% 4.0% 0.2% 0.3% 0.1%
Wicomico 42,924 43,198 43,807 43,803 43,552 43,836 0.6% 1.4% 0.0% -0.6% 0.7%
Worcester 18,216 18,548 18,959 19,218 19,271 19,053 1.8% 2.2% 1.4% 0.3% -1.1%
Unallocated 56,817 64,147 67,055 59,999 62,678 64,803 12.9% 4.5% -10.5% 4.5% 3.4%
Maryland 2,391,316 2,432,425 2,470,320 2,491,576 2,497,216 2,527,815 1.7% 1.6% 0.9% 0.2% 1.2%
Note: The employment growth rate was calculated by using average quarterly employment data. Employment growth statistics represent the available jobs within a jurisdiction, not the employment
status for residents of the jurisdiction.
Source: Employment and Payroll Annual Report, Department of Labor, Licensing, and Regulation

26
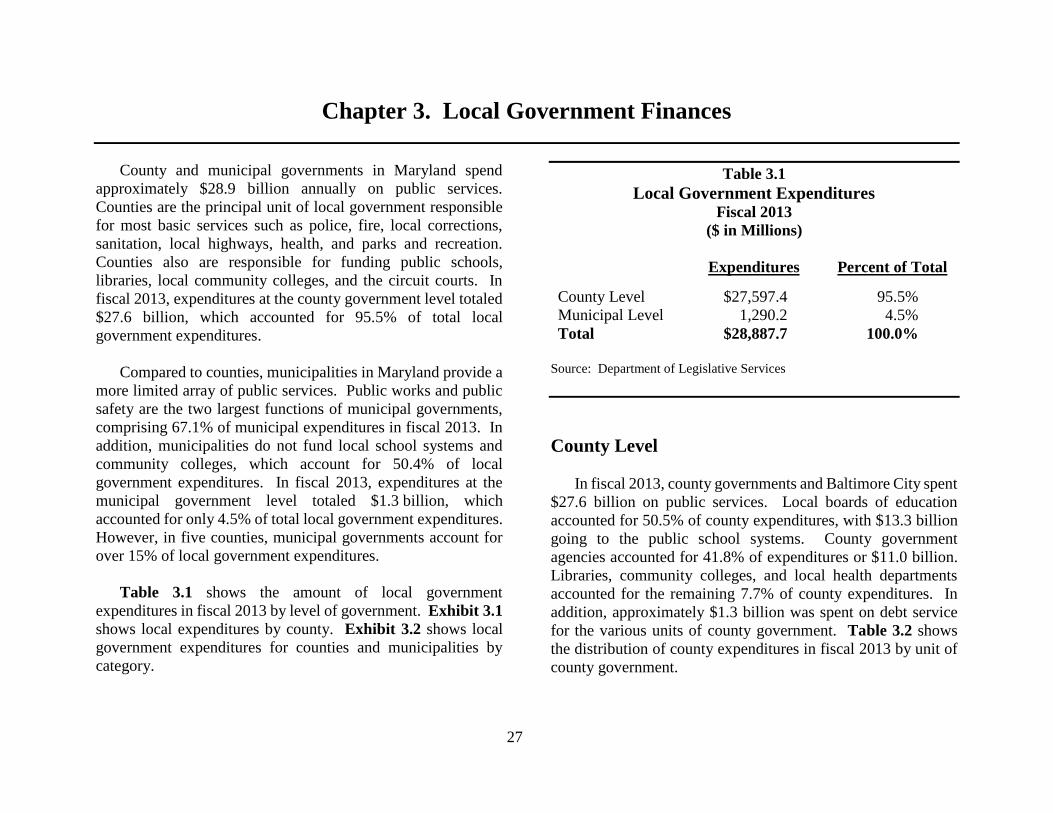
27
Chapter 3. Local Government Finances
County and municipal governments in Maryland spend
approximately $28.9 billion annually on public services.
Counties are the principal unit of local government responsible
for most basic services such as police, fire, local corrections,
sanitation, local highways, health, and parks and recreation.
Counties also are responsible for funding public schools,
libraries, local community colleges, and the circuit courts. In
fiscal 2013, expenditures at the county government level totaled
$27.6 billion, which accounted for 95.5% of total local
government expenditures.
Compared to counties, municipalities in Maryland provide a
more limited array of public services. Public works and public
safety are the two largest functions of municipal governments,
comprising 67.1% of municipal expenditures in fiscal 2013. In
addition, municipalities do not fund local school systems and
community colleges, which account for 50.4% of local
government expenditures. In fiscal 2013, expenditures at the
municipal government level totaled $1.3 billion, which
accounted for only 4.5% of total local government expenditures.
However, in five counties, municipal governments account for
over 15% of local government expenditures.
Table 3.1 shows the amount of local government
expenditures in fiscal 2013 by level of government. Exhibit 3.1
shows local expenditures by county. Exhibit 3.2 shows local
government expenditures for counties and municipalities by
category.
Table 3.1
Local Government Expenditures Fiscal 2013
($ in Millions)
Expenditures Percent of Total
County Level $27,597.4 95.5%
Municipal Level 1,290.2 4.5%
Total $28,887.7 100.0%
Source: Department of Legislative Services
County Level
In fiscal 2013, county governments and Baltimore City spent
$27.6 billion on public services. Local boards of education
accounted for 50.5% of county expenditures, with $13.3 billion
going to the public school systems. County government
agencies accounted for 41.8% of expenditures or $11.0 billion.
Libraries, community colleges, and local health departments
accounted for the remaining 7.7% of county expenditures. In
addition, approximately $1.3 billion was spent on debt service
for the various units of county government. Table 3.2 shows
the distribution of county expenditures in fiscal 2013 by unit of
county government.
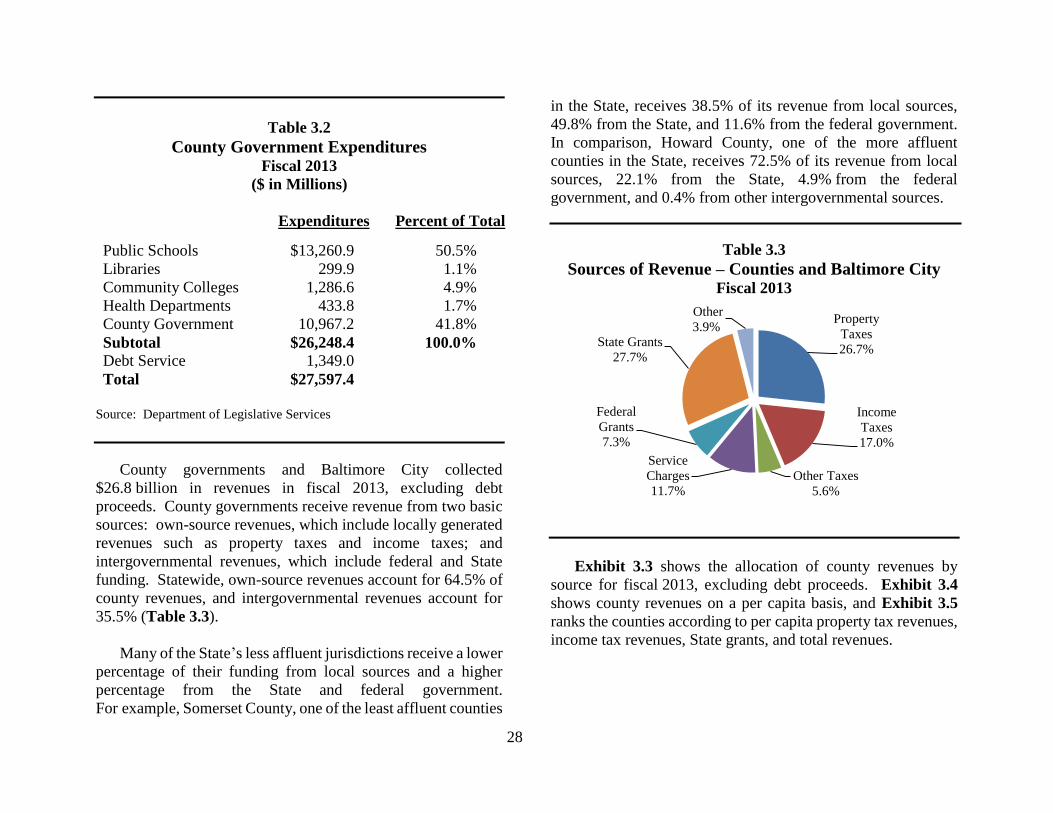
28
Table 3.2
County Government Expenditures Fiscal 2013
($ in Millions)
Expenditures Percent of Total
Public Schools $13,260.9 50.5%
Libraries 299.9 1.1%
Community Colleges 1,286.6 4.9%
Health Departments 433.8 1.7%
County Government 10,967.2 41.8%
Subtotal $26,248.4 100.0%
Debt Service 1,349.0
Total $27,597.4
Source: Department of Legislative Services
County governments and Baltimore City collected
$26.8 billion in revenues in fiscal 2013, excluding debt
proceeds. County governments receive revenue from two basic
sources: own-source revenues, which include locally generated
revenues such as property taxes and income taxes; and
intergovernmental revenues, which include federal and State
funding. Statewide, own-source revenues account for 64.5% of
county revenues, and intergovernmental revenues account for
35.5% (Table 3.3).
Many of the State’s less affluent jurisdictions receive a lower
percentage of their funding from local sources and a higher
percentage from the State and federal government.
For example, Somerset County, one of the least affluent counties
in the State, receives 38.5% of its revenue from local sources,
49.8% from the State, and 11.6% from the federal government.
In comparison, Howard County, one of the more affluent
counties in the State, receives 72.5% of its revenue from local
sources, 22.1% from the State, 4.9% from the federal
government, and 0.4% from other intergovernmental sources.
Table 3.3
Sources of Revenue – Counties and Baltimore City Fiscal 2013
Exhibit 3.3 shows the allocation of county revenues by
source for fiscal 2013, excluding debt proceeds. Exhibit 3.4
shows county revenues on a per capita basis, and Exhibit 3.5
ranks the counties according to per capita property tax revenues,
income tax revenues, State grants, and total revenues.
Property
Taxes
26.7%
Income
Taxes
17.0%
Other Taxes
5.6%
Service
Charges
11.7%
Federal
Grants
7.3%
State Grants
27.7%
Other
3.9%
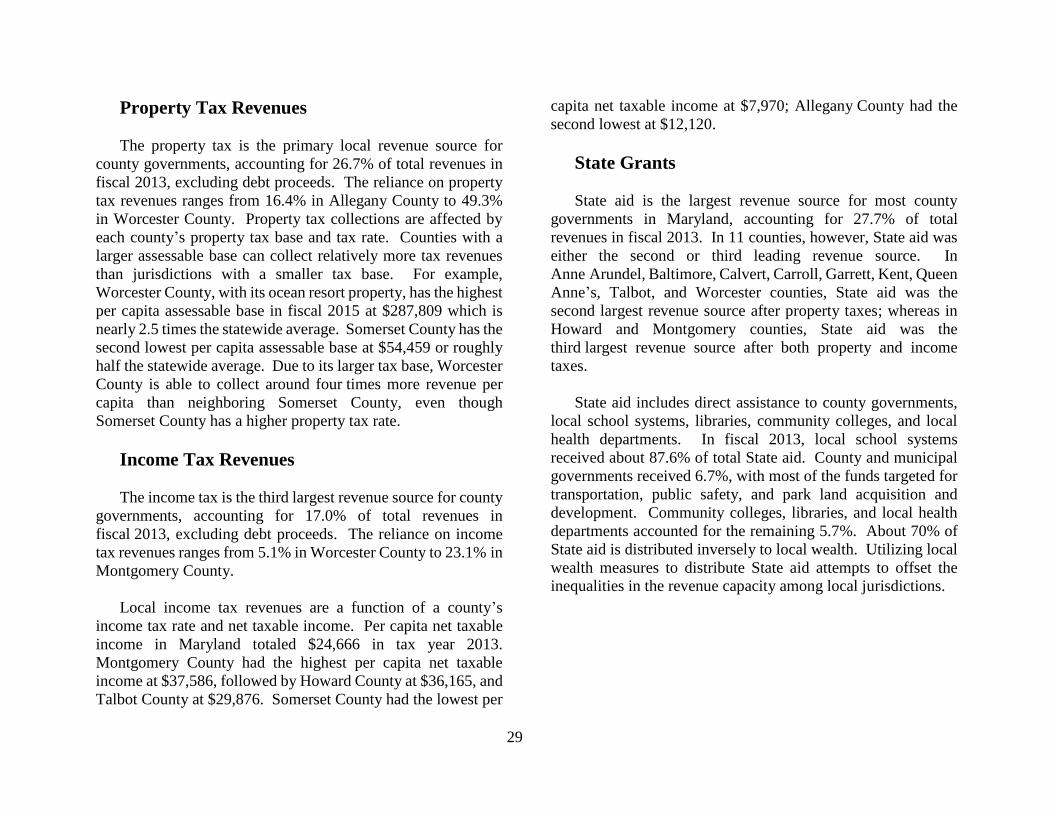
29
Property Tax Revenues
The property tax is the primary local revenue source for
county governments, accounting for 26.7% of total revenues in
fiscal 2013, excluding debt proceeds. The reliance on property
tax revenues ranges from 16.4% in Allegany County to 49.3%
in Worcester County. Property tax collections are affected by
each county’s property tax base and tax rate. Counties with a
larger assessable base can collect relatively more tax revenues
than jurisdictions with a smaller tax base. For example,
Worcester County, with its ocean resort property, has the highest
per capita assessable base in fiscal 2015 at $287,809 which is
nearly 2.5 times the statewide average. Somerset County has the
second lowest per capita assessable base at $54,459 or roughly
half the statewide average. Due to its larger tax base, Worcester
County is able to collect around four times more revenue per
capita than neighboring Somerset County, even though
Somerset County has a higher property tax rate.
Income Tax Revenues
The income tax is the third largest revenue source for county
governments, accounting for 17.0% of total revenues in
fiscal 2013, excluding debt proceeds. The reliance on income
tax revenues ranges from 5.1% in Worcester County to 23.1% in
Montgomery County.
Local income tax revenues are a function of a county’s
income tax rate and net taxable income. Per capita net taxable
income in Maryland totaled $24,666 in tax year 2013.
Montgomery County had the highest per capita net taxable
income at $37,586, followed by Howard County at $36,165, and
Talbot County at $29,876. Somerset County had the lowest per
capita net taxable income at $7,970; Allegany County had the
second lowest at $12,120.
State Grants
State aid is the largest revenue source for most county
governments in Maryland, accounting for 27.7% of total
revenues in fiscal 2013. In 11 counties, however, State aid was
either the second or third leading revenue source. In
Anne Arundel, Baltimore, Calvert, Carroll, Garrett, Kent, Queen
Anne’s, Talbot, and Worcester counties, State aid was the
second largest revenue source after property taxes; whereas in
Howard and Montgomery counties, State aid was the
third largest revenue source after both property and income
taxes.
State aid includes direct assistance to county governments,
local school systems, libraries, community colleges, and local
health departments. In fiscal 2013, local school systems
received about 87.6% of total State aid. County and municipal
governments received 6.7%, with most of the funds targeted for
transportation, public safety, and park land acquisition and
development. Community colleges, libraries, and local health
departments accounted for the remaining 5.7%. About 70% of
State aid is distributed inversely to local wealth. Utilizing local
wealth measures to distribute State aid attempts to offset the
inequalities in the revenue capacity among local jurisdictions.
30
Federal Grants
Federal grants accounted for 7.3% of total county revenues
in fiscal 2013, excluding debt proceeds. The reliance on federal
grants ranged from 4.1% in Calvert County to 11.8% in
Baltimore City. The major areas in which local governments
receive federal funds include primary and secondary education,
community colleges, health and human services, housing and
community development, public safety, and transportation.
Expenditure Categories
County governments and Baltimore City spent $27.6 billion
on public services in fiscal 2013. On a per capita basis, county
expenditures averaged $4,690. Montgomery County led the
State with per capita expenditures totaling $5,874, followed by
Baltimore City with per capita expenditures totaling $5,862.
Somerset County had the lowest per capita expenditures at
$2,959. Exhibit 3.6 shows the allocation of county expenditures
by category. Exhibit 3.7 shows county expenditures on a per
capita basis. Exhibit 3.8 ranks the counties according to per
capita expenditures for education/libraries, public works, public
safety, and total expenditures.
Educational services (public schools, libraries, and
community colleges) continue to be the largest function of
county government, accounting for 53.8% of total county
spending in fiscal 2013. Education spending ranged from 40.7%
of total spending in Baltimore City to 70.6% in
Washington County. Baltimore City is the only jurisdiction
which devoted less than 50% of its expenditures to education.
The smaller percentage of spending targeted to education in
Baltimore City was, in part, a result of the greater need for public
safety and public works services. Public safety accounted for
17.1% of Baltimore City’s spending, the highest percentage in
the State. In addition, public works functions accounted for
17.3% of total spending in the city, the second highest
percentage in the State. Also, Baltimore City is not responsible
for funding the local community college since the Baltimore
City Community College is a State agency.
Public works is the second largest function of county
governments, accounting for 11.6% of total spending.
Garrett County, which spends a considerable amount for snow
removal, led the State in the percentage of expenditures targeted
to public works (21.2%); followed by Baltimore City (17.3%).
Public safety is the third largest function of county
governments, accounting for 11.4% of total spending. As noted
earlier, Baltimore City led the State in the percentage expended
on public safety with 17.1%. Baltimore City was followed by
Charles (13.8%) and Worcester (13.1%) counties.
The composition of county expenditures has changed
slightly since fiscal 1999. Funding for educational services and
public safety are now accounting for a higher percentage of
county spending, whereas public works functions, health/social
services, general government, and debt service are accounting
for a lower percentage. Table 3.4 shows the change in the
composition of county expenditures over a 15-year period.
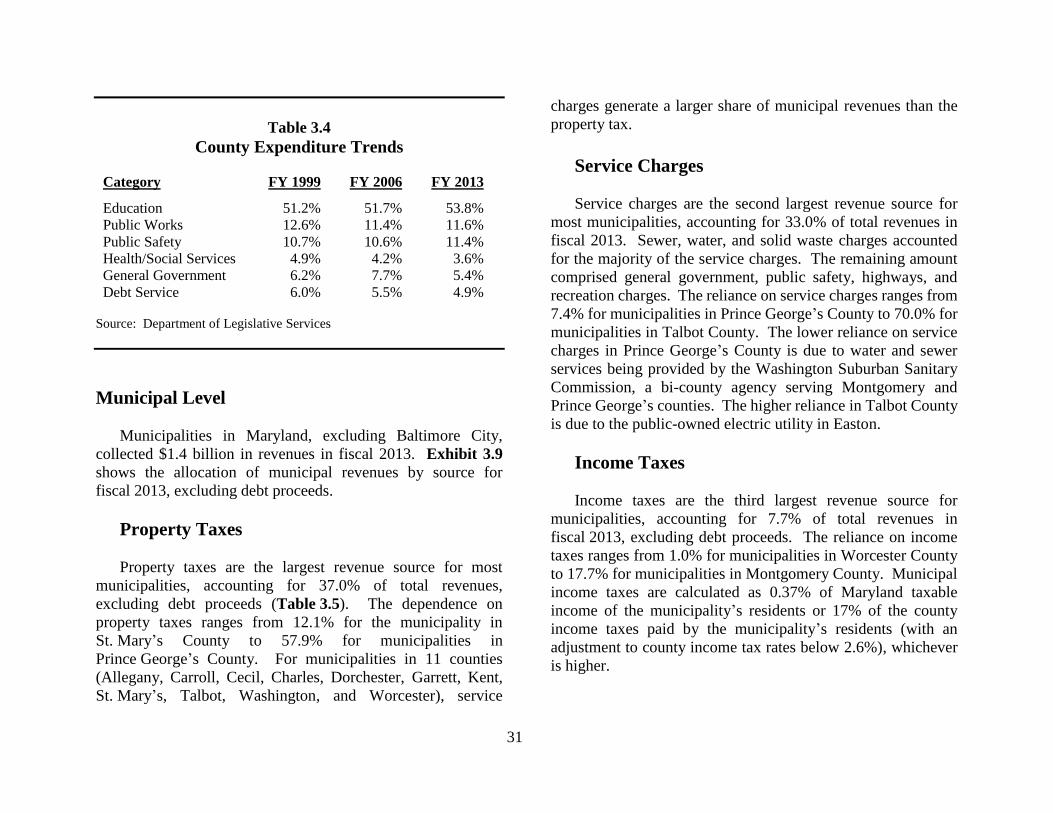
31
Table 3.4
County Expenditure Trends
Category FY 1999 FY 2006 FY 2013
Education 51.2% 51.7% 53.8%
Public Works 12.6% 11.4% 11.6%
Public Safety 10.7% 10.6% 11.4%
Health/Social Services 4.9% 4.2% 3.6%
General Government 6.2% 7.7% 5.4%
Debt Service 6.0% 5.5% 4.9%
Source: Department of Legislative Services
Municipal Level
Municipalities in Maryland, excluding Baltimore City,
collected $1.4 billion in revenues in fiscal 2013. Exhibit 3.9
shows the allocation of municipal revenues by source for
fiscal 2013, excluding debt proceeds.
Property Taxes
Property taxes are the largest revenue source for most
municipalities, accounting for 37.0% of total revenues,
excluding debt proceeds (Table 3.5). The dependence on
property taxes ranges from 12.1% for the municipality in
St. Mary’s County to 57.9% for municipalities in
Prince George’s County. For municipalities in 11 counties
(Allegany, Carroll, Cecil, Charles, Dorchester, Garrett, Kent,
St. Mary’s, Talbot, Washington, and Worcester), service
charges generate a larger share of municipal revenues than the
property tax.
Service Charges
Service charges are the second largest revenue source for
most municipalities, accounting for 33.0% of total revenues in
fiscal 2013. Sewer, water, and solid waste charges accounted
for the majority of the service charges. The remaining amount
comprised general government, public safety, highways, and
recreation charges. The reliance on service charges ranges from
7.4% for municipalities in Prince George’s County to 70.0% for
municipalities in Talbot County. The lower reliance on service
charges in Prince George’s County is due to water and sewer
services being provided by the Washington Suburban Sanitary
Commission, a bi-county agency serving Montgomery and
Prince George’s counties. The higher reliance in Talbot County
is due to the public-owned electric utility in Easton.
Income Taxes
Income taxes are the third largest revenue source for
municipalities, accounting for 7.7% of total revenues in
fiscal 2013, excluding debt proceeds. The reliance on income
taxes ranges from 1.0% for municipalities in Worcester County
to 17.7% for municipalities in Montgomery County. Municipal
income taxes are calculated as 0.37% of Maryland taxable
income of the municipality’s residents or 17% of the county
income taxes paid by the municipality’s residents (with an
adjustment to county income tax rates below 2.6%), whichever
is higher.
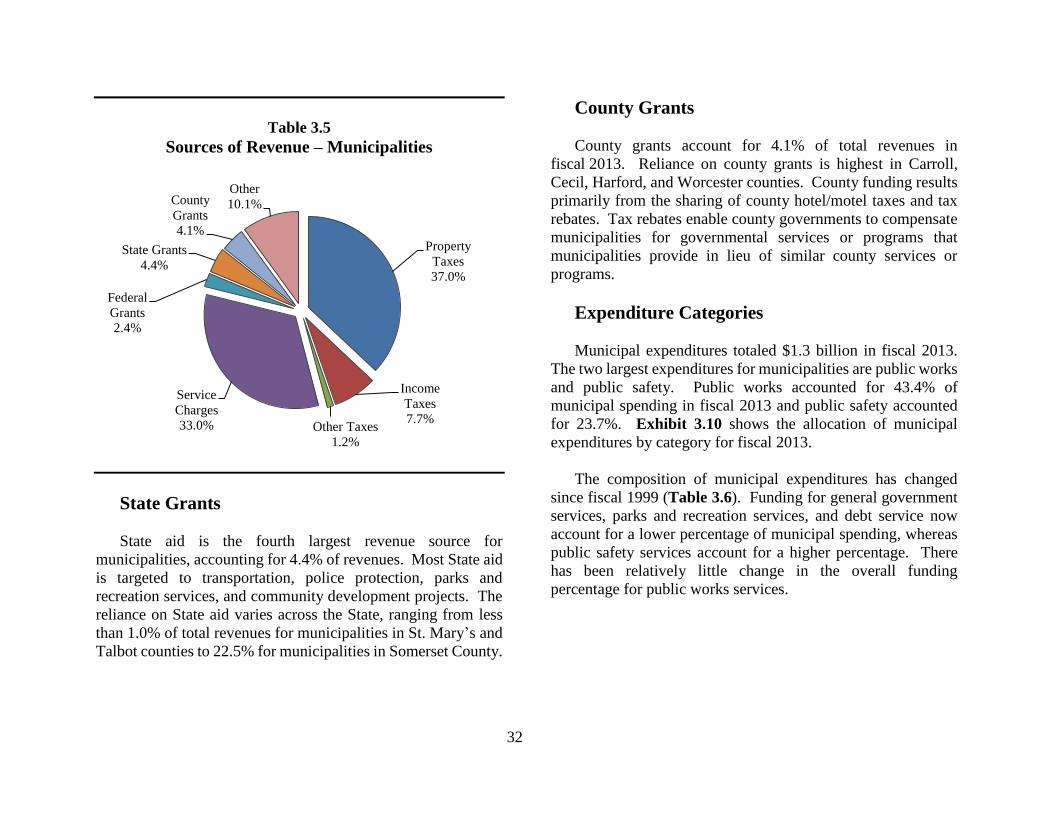
32
Table 3.5
Sources of Revenue – Municipalities
State Grants
State aid is the fourth largest revenue source for
municipalities, accounting for 4.4% of revenues. Most State aid
is targeted to transportation, police protection, parks and
recreation services, and community development projects. The
reliance on State aid varies across the State, ranging from less
than 1.0% of total revenues for municipalities in St. Mary’s and
Talbot counties to 22.5% for municipalities in Somerset County.
County Grants
County grants account for 4.1% of total revenues in
fiscal 2013. Reliance on county grants is highest in Carroll,
Cecil, Harford, and Worcester counties. County funding results
primarily from the sharing of county hotel/motel taxes and tax
rebates. Tax rebates enable county governments to compensate
municipalities for governmental services or programs that
municipalities provide in lieu of similar county services or
programs.
Expenditure Categories
Municipal expenditures totaled $1.3 billion in fiscal 2013.
The two largest expenditures for municipalities are public works
and public safety. Public works accounted for 43.4% of
municipal spending in fiscal 2013 and public safety accounted
for 23.7%. Exhibit 3.10 shows the allocation of municipal
expenditures by category for fiscal 2013.
The composition of municipal expenditures has changed
since fiscal 1999 (Table 3.6). Funding for general government
services, parks and recreation services, and debt service now
account for a lower percentage of municipal spending, whereas
public safety services account for a higher percentage. There
has been relatively little change in the overall funding
percentage for public works services.
Property
Taxes
37.0%
Income
Taxes
7.7%Other Taxes
1.2%
Service
Charges
33.0%
Federal
Grants
2.4%
State Grants
4.4%
County
Grants
4.1%
Other
10.1%
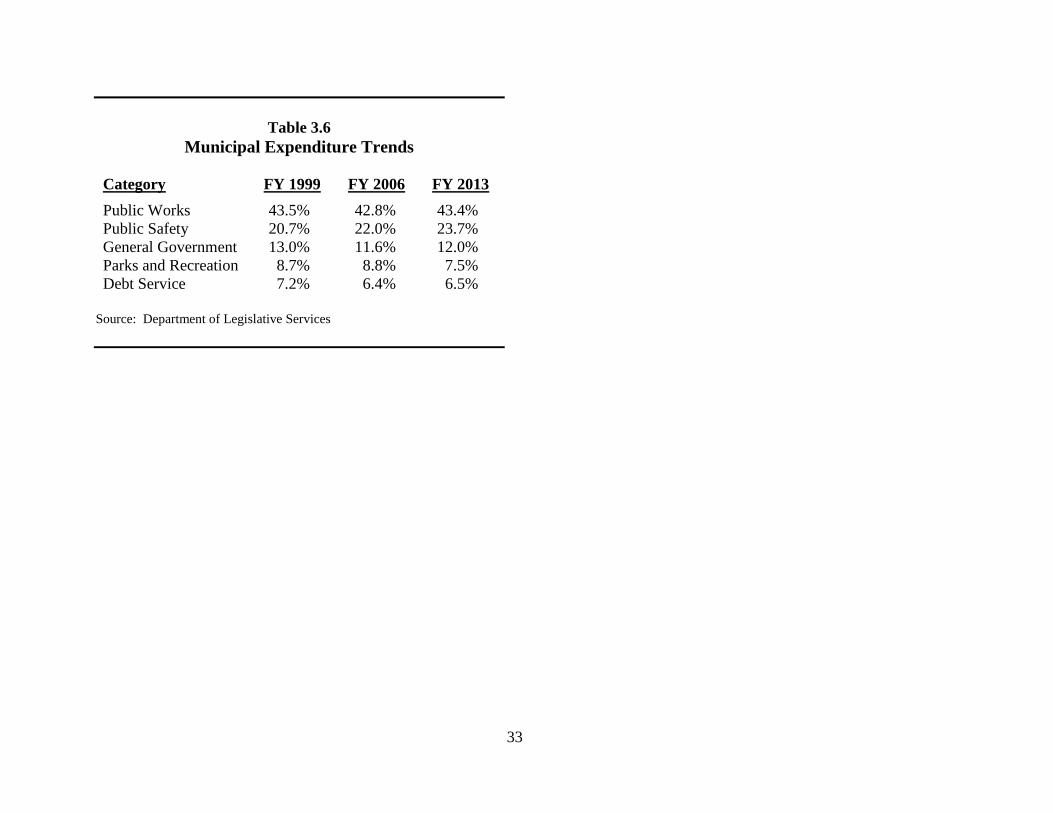
33
Table 3.6
Municipal Expenditure Trends
Category FY 1999 FY 2006 FY 2013
Public Works 43.5% 42.8% 43.4%
Public Safety 20.7% 22.0% 23.7%
General Government 13.0% 11.6% 12.0%
Parks and Recreation 8.7% 8.8% 7.5%
Debt Service 7.2% 6.4% 6.5%
Source: Department of Legislative Services
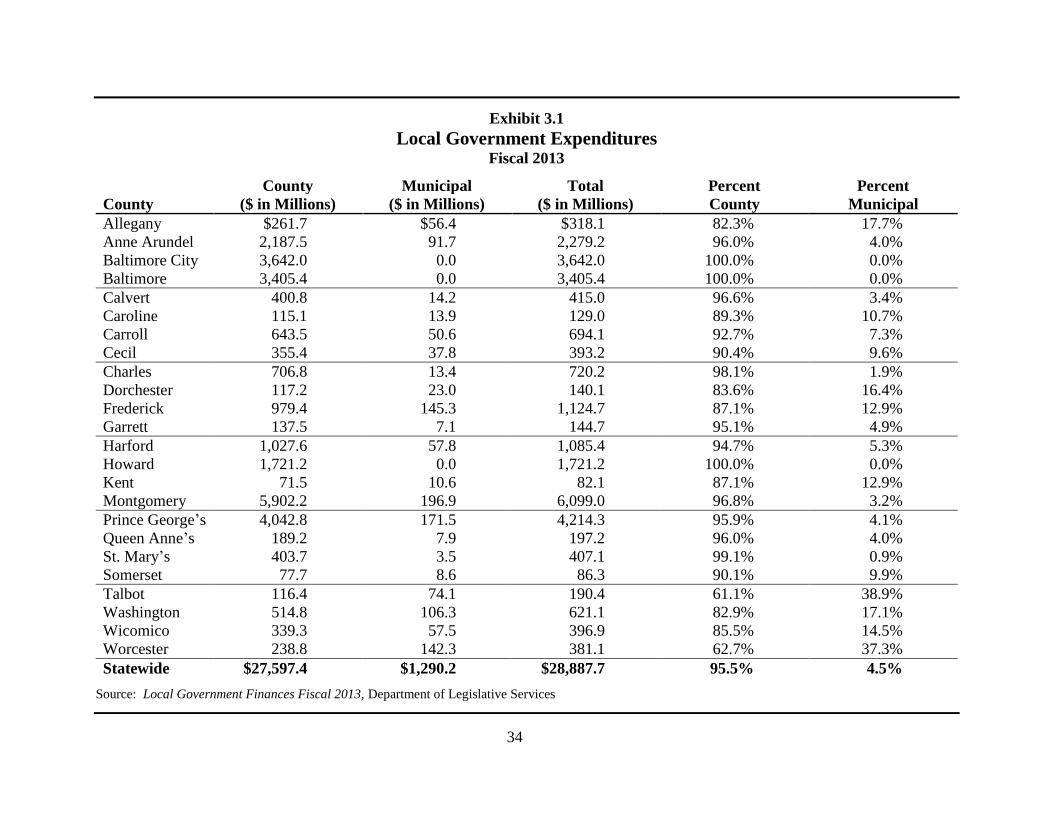
34
Exhibit 3.1
Local Government Expenditures Fiscal 2013
County Municipal Total Percent Percent
County ($ in Millions) ($ in Millions) ($ in Millions) County Municipal
Allegany $261.7 $56.4 $318.1 82.3% 17.7%
Anne Arundel 2,187.5 91.7 2,279.2 96.0% 4.0%
Baltimore City 3,642.0 0.0 3,642.0 100.0% 0.0%
Baltimore 3,405.4 0.0 3,405.4 100.0% 0.0%
Calvert 400.8 14.2 415.0 96.6% 3.4%
Caroline 115.1 13.9 129.0 89.3% 10.7%
Carroll 643.5 50.6 694.1 92.7% 7.3%
Cecil 355.4 37.8 393.2 90.4% 9.6%
Charles 706.8 13.4 720.2 98.1% 1.9%
Dorchester 117.2 23.0 140.1 83.6% 16.4%
Frederick 979.4 145.3 1,124.7 87.1% 12.9%
Garrett 137.5 7.1 144.7 95.1% 4.9%
Harford 1,027.6 57.8 1,085.4 94.7% 5.3%
Howard 1,721.2 0.0 1,721.2 100.0% 0.0%
Kent 71.5 10.6 82.1 87.1% 12.9%
Montgomery 5,902.2 196.9 6,099.0 96.8% 3.2%
Prince George’s 4,042.8 171.5 4,214.3 95.9% 4.1%
Queen Anne’s 189.2 7.9 197.2 96.0% 4.0%
St. Mary’s 403.7 3.5 407.1 99.1% 0.9%
Somerset 77.7 8.6 86.3 90.1% 9.9%
Talbot 116.4 74.1 190.4 61.1% 38.9%
Washington 514.8 106.3 621.1 82.9% 17.1%
Wicomico 339.3 57.5 396.9 85.5% 14.5%
Worcester 238.8 142.3 381.1 62.7% 37.3%
Statewide $27,597.4 $1,290.2 $28,887.7 95.5% 4.5%
Source: Local Government Finances Fiscal 2013, Department of Legislative Services
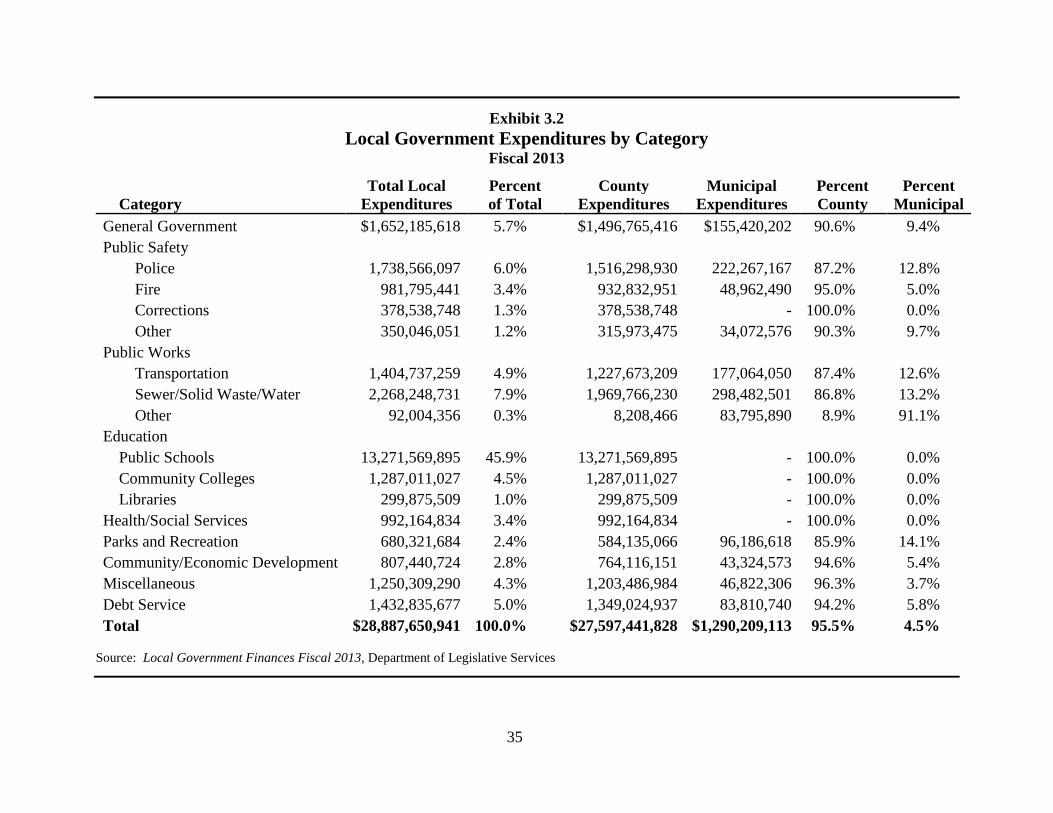
35
Exhibit 3.2
Local Government Expenditures by Category Fiscal 2013
Total Local Percent County Municipal Percent Percent
Category Expenditures of Total Expenditures Expenditures County Municipal
General Government $1,652,185,618 5.7% $1,496,765,416 $155,420,202 90.6% 9.4%
Public Safety
Police 1,738,566,097 6.0% 1,516,298,930 222,267,167 87.2% 12.8%
Fire 981,795,441 3.4% 932,832,951 48,962,490 95.0% 5.0%
Corrections 378,538,748 1.3% 378,538,748 - 100.0% 0.0%
Other 350,046,051 1.2% 315,973,475 34,072,576 90.3% 9.7%
Public Works
Transportation 1,404,737,259 4.9% 1,227,673,209 177,064,050 87.4% 12.6%
Sewer/Solid Waste/Water 2,268,248,731 7.9% 1,969,766,230 298,482,501 86.8% 13.2%
Other 92,004,356 0.3% 8,208,466 83,795,890 8.9% 91.1%
Education
Public Schools 13,271,569,895 45.9% 13,271,569,895 - 100.0% 0.0%
Community Colleges 1,287,011,027 4.5% 1,287,011,027 - 100.0% 0.0%
Libraries 299,875,509 1.0% 299,875,509 - 100.0% 0.0%
Health/Social Services 992,164,834 3.4% 992,164,834 - 100.0% 0.0%
Parks and Recreation 680,321,684 2.4% 584,135,066 96,186,618 85.9% 14.1%
Community/Economic Development 807,440,724 2.8% 764,116,151 43,324,573 94.6% 5.4%
Miscellaneous 1,250,309,290 4.3% 1,203,486,984 46,822,306 96.3% 3.7%
Debt Service 1,432,835,677 5.0% 1,349,024,937 83,810,740 94.2% 5.8%
Total $28,887,650,941 100.0% $27,597,441,828 $1,290,209,113 95.5% 4.5%
Source: Local Government Finances Fiscal 2013, Department of Legislative Services
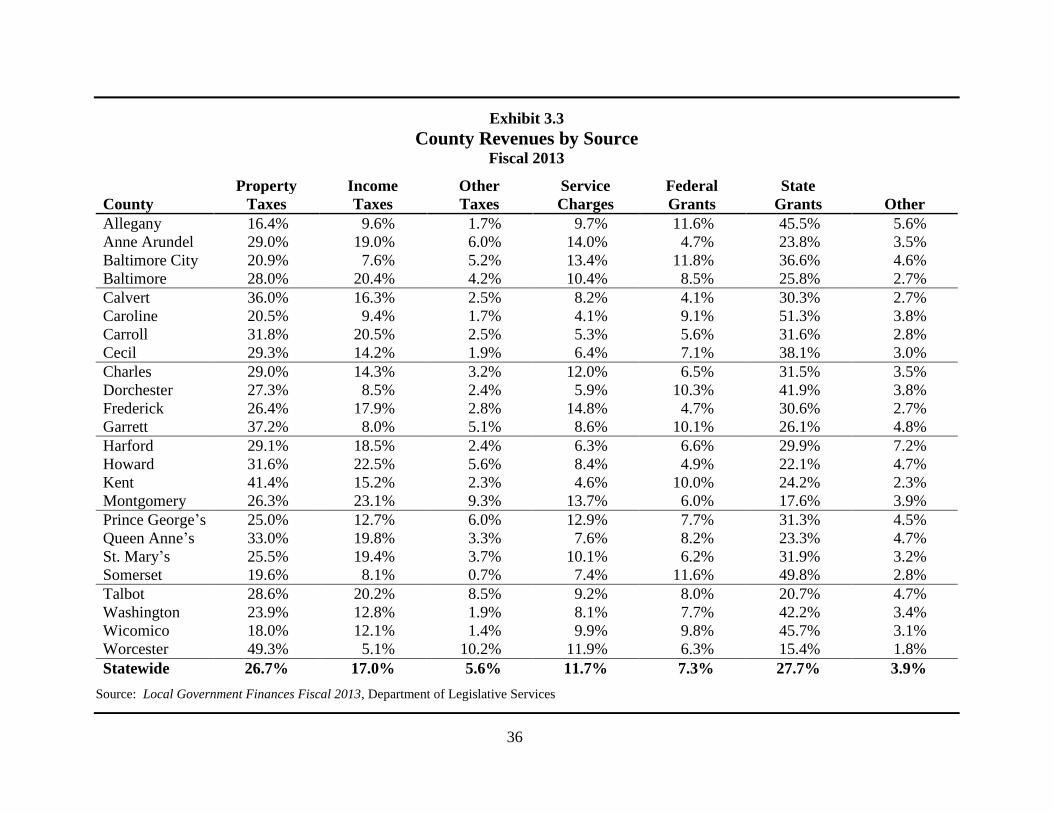
36
Exhibit 3.3
County Revenues by Source Fiscal 2013
Property Income Other Service Federal State
County Taxes Taxes Taxes Charges Grants Grants Other
Allegany 16.4% 9.6% 1.7% 9.7% 11.6% 45.5% 5.6%
Anne Arundel 29.0% 19.0% 6.0% 14.0% 4.7% 23.8% 3.5%
Baltimore City 20.9% 7.6% 5.2% 13.4% 11.8% 36.6% 4.6%
Baltimore 28.0% 20.4% 4.2% 10.4% 8.5% 25.8% 2.7%
Calvert 36.0% 16.3% 2.5% 8.2% 4.1% 30.3% 2.7%
Caroline 20.5% 9.4% 1.7% 4.1% 9.1% 51.3% 3.8%
Carroll 31.8% 20.5% 2.5% 5.3% 5.6% 31.6% 2.8%
Cecil 29.3% 14.2% 1.9% 6.4% 7.1% 38.1% 3.0%
Charles 29.0% 14.3% 3.2% 12.0% 6.5% 31.5% 3.5%
Dorchester 27.3% 8.5% 2.4% 5.9% 10.3% 41.9% 3.8%
Frederick 26.4% 17.9% 2.8% 14.8% 4.7% 30.6% 2.7%
Garrett 37.2% 8.0% 5.1% 8.6% 10.1% 26.1% 4.8%
Harford 29.1% 18.5% 2.4% 6.3% 6.6% 29.9% 7.2%
Howard 31.6% 22.5% 5.6% 8.4% 4.9% 22.1% 4.7%
Kent 41.4% 15.2% 2.3% 4.6% 10.0% 24.2% 2.3%
Montgomery 26.3% 23.1% 9.3% 13.7% 6.0% 17.6% 3.9%
Prince George’s 25.0% 12.7% 6.0% 12.9% 7.7% 31.3% 4.5%
Queen Anne’s 33.0% 19.8% 3.3% 7.6% 8.2% 23.3% 4.7%
St. Mary’s 25.5% 19.4% 3.7% 10.1% 6.2% 31.9% 3.2%
Somerset 19.6% 8.1% 0.7% 7.4% 11.6% 49.8% 2.8%
Talbot 28.6% 20.2% 8.5% 9.2% 8.0% 20.7% 4.7%
Washington 23.9% 12.8% 1.9% 8.1% 7.7% 42.2% 3.4%
Wicomico 18.0% 12.1% 1.4% 9.9% 9.8% 45.7% 3.1%
Worcester 49.3% 5.1% 10.2% 11.9% 6.3% 15.4% 1.8%
Statewide 26.7% 17.0% 5.6% 11.7% 7.3% 27.7% 3.9%
Source: Local Government Finances Fiscal 2013, Department of Legislative Services
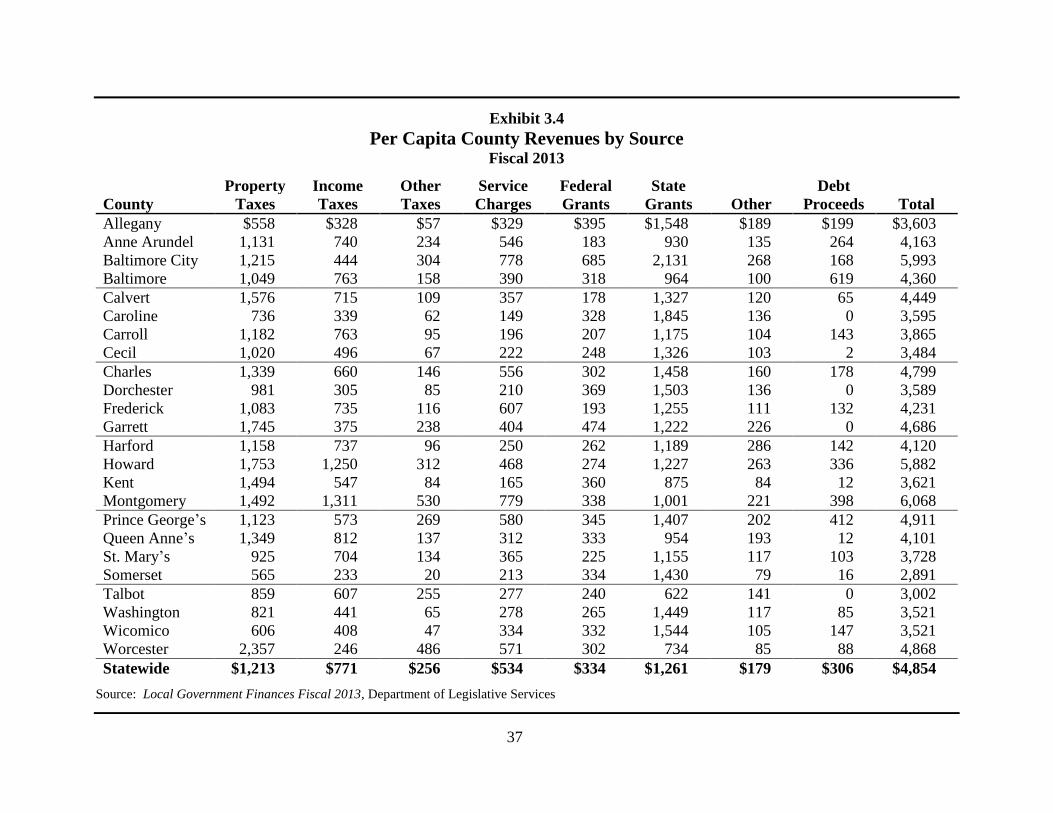
37
Exhibit 3.4
Per Capita County Revenues by Source Fiscal 2013
Property Income Other Service Federal State Debt
County Taxes Taxes Taxes Charges Grants Grants Other Proceeds Total
Allegany $558 $328 $57 $329 $395 $1,548 $189 $199 $3,603
Anne Arundel 1,131 740 234 546 183 930 135 264 4,163
Baltimore City 1,215 444 304 778 685 2,131 268 168 5,993
Baltimore 1,049 763 158 390 318 964 100 619 4,360
Calvert 1,576 715 109 357 178 1,327 120 65 4,449
Caroline 736 339 62 149 328 1,845 136 0 3,595
Carroll 1,182 763 95 196 207 1,175 104 143 3,865
Cecil 1,020 496 67 222 248 1,326 103 2 3,484
Charles 1,339 660 146 556 302 1,458 160 178 4,799
Dorchester 981 305 85 210 369 1,503 136 0 3,589
Frederick 1,083 735 116 607 193 1,255 111 132 4,231
Garrett 1,745 375 238 404 474 1,222 226 0 4,686
Harford 1,158 737 96 250 262 1,189 286 142 4,120
Howard 1,753 1,250 312 468 274 1,227 263 336 5,882
Kent 1,494 547 84 165 360 875 84 12 3,621
Montgomery 1,492 1,311 530 779 338 1,001 221 398 6,068
Prince George’s 1,123 573 269 580 345 1,407 202 412 4,911
Queen Anne’s 1,349 812 137 312 333 954 193 12 4,101
St. Mary’s 925 704 134 365 225 1,155 117 103 3,728
Somerset 565 233 20 213 334 1,430 79 16 2,891
Talbot 859 607 255 277 240 622 141 0 3,002
Washington 821 441 65 278 265 1,449 117 85 3,521
Wicomico 606 408 47 334 332 1,544 105 147 3,521
Worcester 2,357 246 486 571 302 734 85 88 4,868
Statewide $1,213 $771 $256 $534 $334 $1,261 $179 $306 $4,854
Source: Local Government Finances Fiscal 2013, Department of Legislative Services
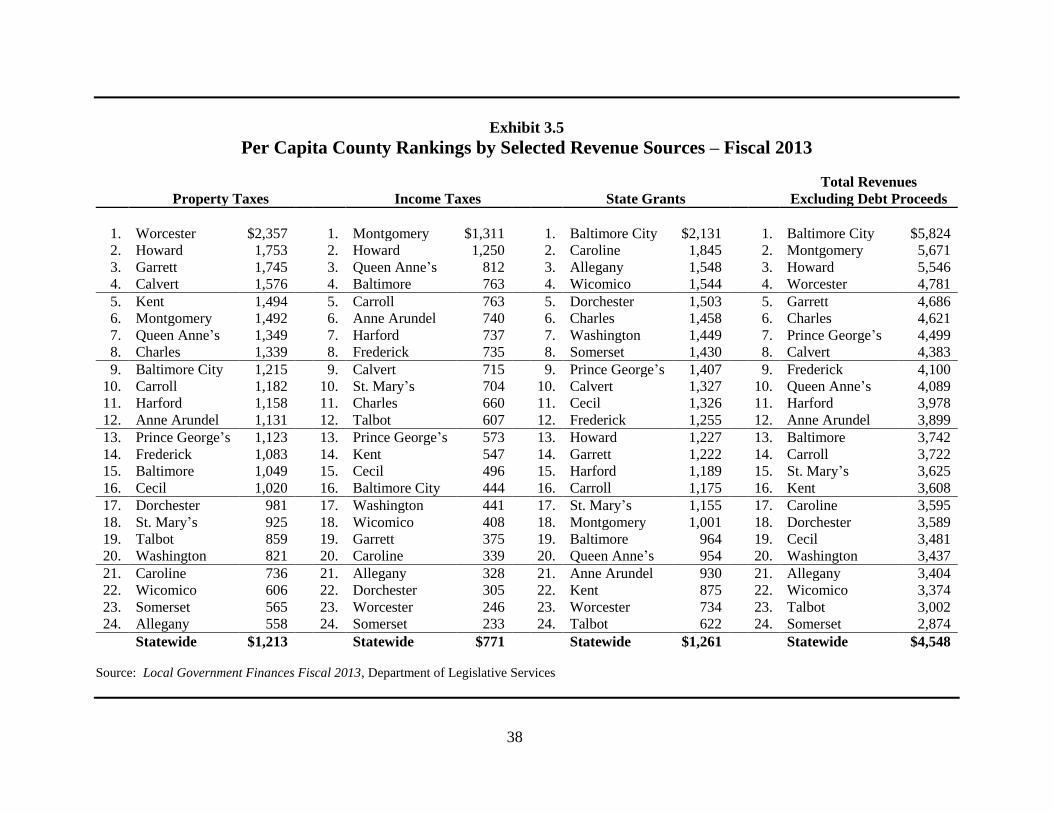
38
Exhibit 3.5
Per Capita County Rankings by Selected Revenue Sources – Fiscal 2013
Total Revenues
Property Taxes Income Taxes State Grants Excluding Debt Proceeds
1. Worcester $2,357 1. Montgomery $1,311 1. Baltimore City $2,131 1. Baltimore City $5,824
2. Howard 1,753 2. Howard 1,250 2. Caroline 1,845 2. Montgomery 5,671
3. Garrett 1,745 3. Queen Anne’s 812 3. Allegany 1,548 3. Howard 5,546
4. Calvert 1,576 4. Baltimore 763 4. Wicomico 1,544 4. Worcester 4,781
5. Kent 1,494 5. Carroll 763 5. Dorchester 1,503 5. Garrett 4,686
6. Montgomery 1,492 6. Anne Arundel 740 6. Charles 1,458 6. Charles 4,621
7. Queen Anne’s 1,349 7. Harford 737 7. Washington 1,449 7. Prince George’s 4,499
8. Charles 1,339 8. Frederick 735 8. Somerset 1,430 8. Calvert 4,383
9. Baltimore City 1,215 9. Calvert 715 9. Prince George’s 1,407 9. Frederick 4,100
10. Carroll 1,182 10. St. Mary’s 704 10. Calvert 1,327 10. Queen Anne’s 4,089
11. Harford 1,158 11. Charles 660 11. Cecil 1,326 11. Harford 3,978
12. Anne Arundel 1,131 12. Talbot 607 12. Frederick 1,255 12. Anne Arundel 3,899
13. Prince George’s 1,123 13. Prince George’s 573 13. Howard 1,227 13. Baltimore 3,742
14. Frederick 1,083 14. Kent 547 14. Garrett 1,222 14. Carroll 3,722
15. Baltimore 1,049 15. Cecil 496 15. Harford 1,189 15. St. Mary’s 3,625
16. Cecil 1,020 16. Baltimore City 444 16. Carroll 1,175 16. Kent 3,608
17. Dorchester 981 17. Washington 441 17. St. Mary’s 1,155 17. Caroline 3,595
18. St. Mary’s 925 18. Wicomico 408 18. Montgomery 1,001 18. Dorchester 3,589
19. Talbot 859 19. Garrett 375 19. Baltimore 964 19. Cecil 3,481
20. Washington 821 20. Caroline 339 20. Queen Anne’s 954 20. Washington 3,437
21. Caroline 736 21. Allegany 328 21. Anne Arundel 930 21. Allegany 3,404
22. Wicomico 606 22. Dorchester 305 22. Kent 875 22. Wicomico 3,374
23. Somerset 565 23. Worcester 246 23. Worcester 734 23. Talbot 3,002
24. Allegany 558 24. Somerset 233 24. Talbot 622 24. Somerset 2,874
Statewide $1,213 Statewide $771 Statewide $1,261 Statewide $4,548
Source: Local Government Finances Fiscal 2013, Department of Legislative Services
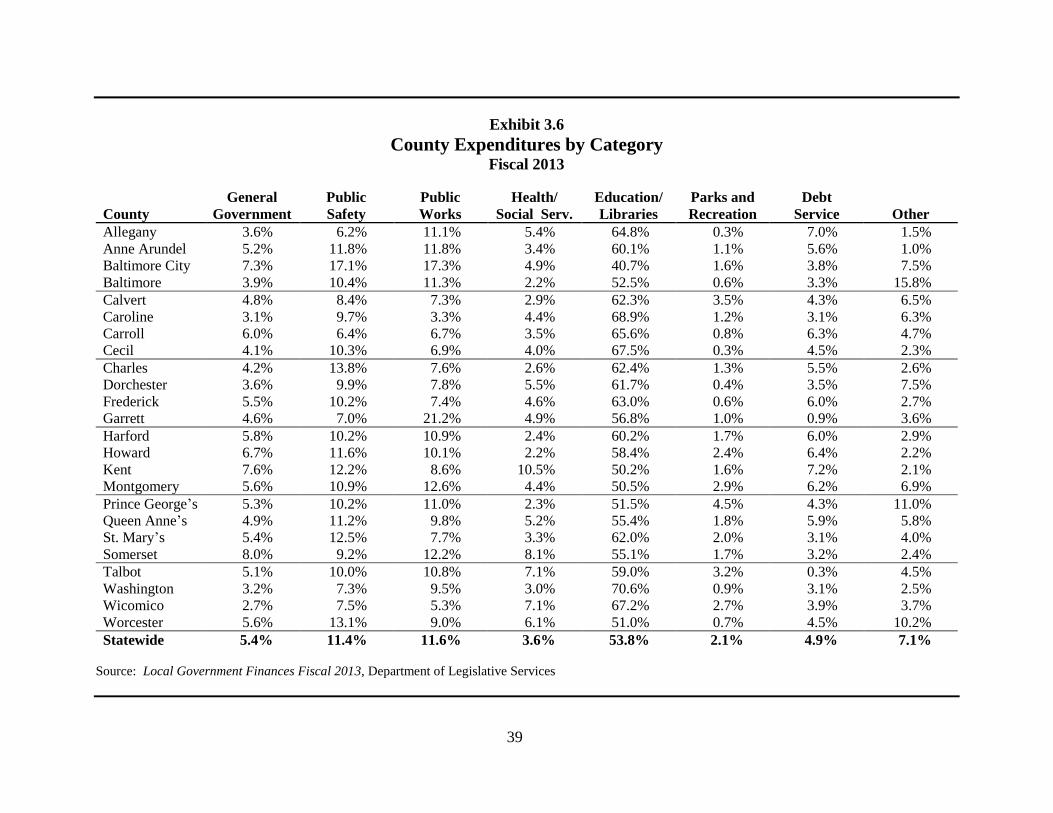
39
Exhibit 3.6
County Expenditures by Category Fiscal 2013
General Public Public Health/ Education/ Parks and Debt
County Government Safety Works Social Serv. Libraries Recreation Service Other
Allegany 3.6% 6.2% 11.1% 5.4% 64.8% 0.3% 7.0% 1.5%
Anne Arundel 5.2% 11.8% 11.8% 3.4% 60.1% 1.1% 5.6% 1.0%
Baltimore City 7.3% 17.1% 17.3% 4.9% 40.7% 1.6% 3.8% 7.5%
Baltimore 3.9% 10.4% 11.3% 2.2% 52.5% 0.6% 3.3% 15.8%
Calvert 4.8% 8.4% 7.3% 2.9% 62.3% 3.5% 4.3% 6.5%
Caroline 3.1% 9.7% 3.3% 4.4% 68.9% 1.2% 3.1% 6.3%
Carroll 6.0% 6.4% 6.7% 3.5% 65.6% 0.8% 6.3% 4.7%
Cecil 4.1% 10.3% 6.9% 4.0% 67.5% 0.3% 4.5% 2.3%
Charles 4.2% 13.8% 7.6% 2.6% 62.4% 1.3% 5.5% 2.6%
Dorchester 3.6% 9.9% 7.8% 5.5% 61.7% 0.4% 3.5% 7.5%
Frederick 5.5% 10.2% 7.4% 4.6% 63.0% 0.6% 6.0% 2.7%
Garrett 4.6% 7.0% 21.2% 4.9% 56.8% 1.0% 0.9% 3.6%
Harford 5.8% 10.2% 10.9% 2.4% 60.2% 1.7% 6.0% 2.9%
Howard 6.7% 11.6% 10.1% 2.2% 58.4% 2.4% 6.4% 2.2%
Kent 7.6% 12.2% 8.6% 10.5% 50.2% 1.6% 7.2% 2.1%
Montgomery 5.6% 10.9% 12.6% 4.4% 50.5% 2.9% 6.2% 6.9%
Prince George’s 5.3% 10.2% 11.0% 2.3% 51.5% 4.5% 4.3% 11.0%
Queen Anne’s 4.9% 11.2% 9.8% 5.2% 55.4% 1.8% 5.9% 5.8%
St. Mary’s 5.4% 12.5% 7.7% 3.3% 62.0% 2.0% 3.1% 4.0%
Somerset 8.0% 9.2% 12.2% 8.1% 55.1% 1.7% 3.2% 2.4%
Talbot 5.1% 10.0% 10.8% 7.1% 59.0% 3.2% 0.3% 4.5%
Washington 3.2% 7.3% 9.5% 3.0% 70.6% 0.9% 3.1% 2.5%
Wicomico 2.7% 7.5% 5.3% 7.1% 67.2% 2.7% 3.9% 3.7%
Worcester 5.6% 13.1% 9.0% 6.1% 51.0% 0.7% 4.5% 10.2%
Statewide 5.4% 11.4% 11.6% 3.6% 53.8% 2.1% 4.9% 7.1%
Source: Local Government Finances Fiscal 2013, Department of Legislative Services
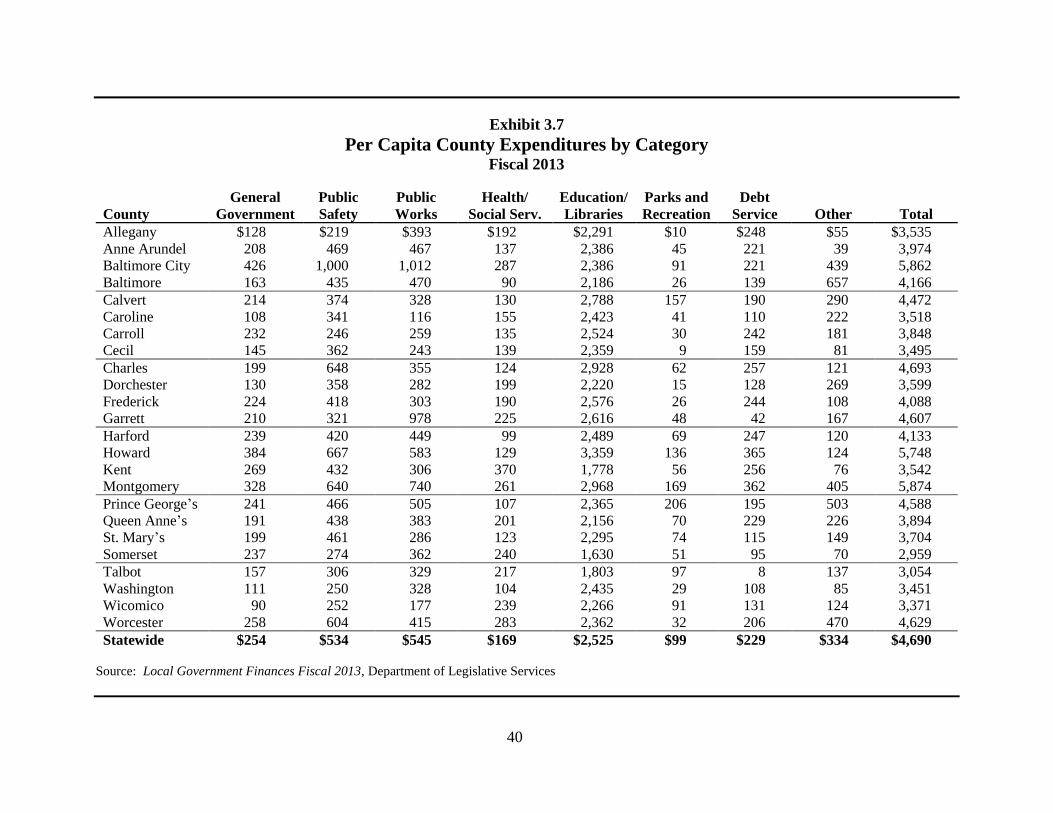
40
Exhibit 3.7
Per Capita County Expenditures by Category Fiscal 2013
County
General
Government
Public
Safety
Public
Works
Health/
Social Serv.
Education/
Libraries
Parks and
Recreation
Debt
Service Other Total
Allegany $128 $219 $393 $192 $2,291 $10 $248 $55 $3,535
Anne Arundel 208 469 467 137 2,386 45 221 39 3,974
Baltimore City 426 1,000 1,012 287 2,386 91 221 439 5,862
Baltimore 163 435 470 90 2,186 26 139 657 4,166
Calvert 214 374 328 130 2,788 157 190 290 4,472
Caroline 108 341 116 155 2,423 41 110 222 3,518
Carroll 232 246 259 135 2,524 30 242 181 3,848
Cecil 145 362 243 139 2,359 9 159 81 3,495
Charles 199 648 355 124 2,928 62 257 121 4,693
Dorchester 130 358 282 199 2,220 15 128 269 3,599
Frederick 224 418 303 190 2,576 26 244 108 4,088
Garrett 210 321 978 225 2,616 48 42 167 4,607
Harford 239 420 449 99 2,489 69 247 120 4,133
Howard 384 667 583 129 3,359 136 365 124 5,748
Kent 269 432 306 370 1,778 56 256 76 3,542
Montgomery 328 640 740 261 2,968 169 362 405 5,874
Prince George’s 241 466 505 107 2,365 206 195 503 4,588
Queen Anne’s 191 438 383 201 2,156 70 229 226 3,894
St. Mary’s 199 461 286 123 2,295 74 115 149 3,704
Somerset 237 274 362 240 1,630 51 95 70 2,959
Talbot 157 306 329 217 1,803 97 8 137 3,054
Washington 111 250 328 104 2,435 29 108 85 3,451
Wicomico 90 252 177 239 2,266 91 131 124 3,371
Worcester 258 604 415 283 2,362 32 206 470 4,629
Statewide $254 $534 $545 $169 $2,525 $99 $229 $334 $4,690
Source: Local Government Finances Fiscal 2013, Department of Legislative Services
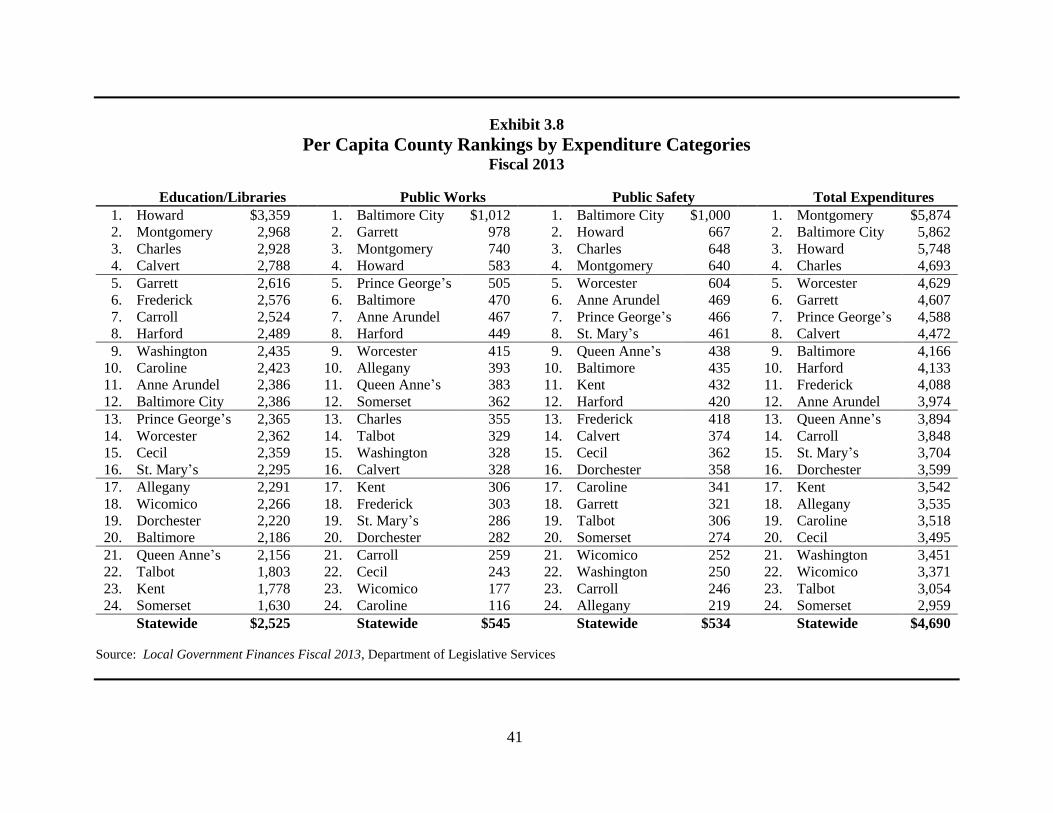
41
Exhibit 3.8
Per Capita County Rankings by Expenditure Categories Fiscal 2013
Education/Libraries Public Works Public Safety Total Expenditures
1. Howard $3,359 1. Baltimore City $1,012 1. Baltimore City $1,000 1. Montgomery $5,874
2. Montgomery 2,968 2. Garrett 978 2. Howard 667 2. Baltimore City 5,862
3. Charles 2,928 3. Montgomery 740 3. Charles 648 3. Howard 5,748
4. Calvert 2,788 4. Howard 583 4. Montgomery 640 4. Charles 4,693
5. Garrett 2,616 5. Prince George’s 505 5. Worcester 604 5. Worcester 4,629
6. Frederick 2,576 6. Baltimore 470 6. Anne Arundel 469 6. Garrett 4,607
7. Carroll 2,524 7. Anne Arundel 467 7. Prince George’s 466 7. Prince George’s 4,588
8. Harford 2,489 8. Harford 449 8. St. Mary’s 461 8. Calvert 4,472
9. Washington 2,435 9. Worcester 415 9. Queen Anne’s 438 9. Baltimore 4,166
10. Caroline 2,423 10. Allegany 393 10. Baltimore 435 10. Harford 4,133
11. Anne Arundel 2,386 11. Queen Anne’s 383 11. Kent 432 11. Frederick 4,088
12. Baltimore City 2,386 12. Somerset 362 12. Harford 420 12. Anne Arundel 3,974
13. Prince George’s 2,365 13. Charles 355 13. Frederick 418 13. Queen Anne’s 3,894
14. Worcester 2,362 14. Talbot 329 14. Calvert 374 14. Carroll 3,848
15. Cecil 2,359 15. Washington 328 15. Cecil 362 15. St. Mary’s 3,704
16. St. Mary’s 2,295 16. Calvert 328 16. Dorchester 358 16. Dorchester 3,599
17. Allegany 2,291 17. Kent 306 17. Caroline 341 17. Kent 3,542
18. Wicomico 2,266 18. Frederick 303 18. Garrett 321 18. Allegany 3,535
19. Dorchester 2,220 19. St. Mary’s 286 19. Talbot 306 19. Caroline 3,518
20. Baltimore 2,186 20. Dorchester 282 20. Somerset 274 20. Cecil 3,495
21. Queen Anne’s 2,156 21. Carroll 259 21. Wicomico 252 21. Washington 3,451
22. Talbot 1,803 22. Cecil 243 22. Washington 250 22. Wicomico 3,371
23. Kent 1,778 23. Wicomico 177 23. Carroll 246 23. Talbot 3,054
24. Somerset 1,630 24. Caroline 116 24. Allegany 219 24. Somerset 2,959
Statewide $2,525 Statewide $545 Statewide $534 Statewide $4,690
Source: Local Government Finances Fiscal 2013, Department of Legislative Services
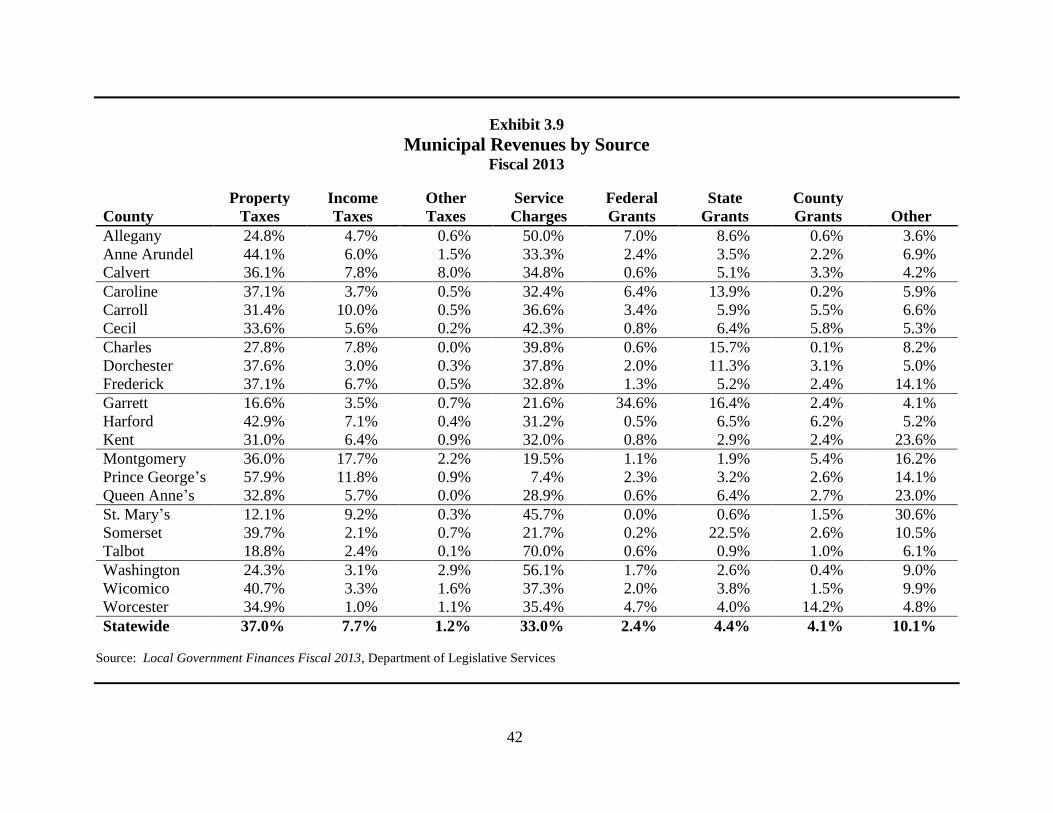
42
Exhibit 3.9
Municipal Revenues by Source Fiscal 2013
Property Income Other Service Federal State County
County Taxes Taxes Taxes Charges Grants Grants Grants Other
Allegany 24.8% 4.7% 0.6% 50.0% 7.0% 8.6% 0.6% 3.6%
Anne Arundel 44.1% 6.0% 1.5% 33.3% 2.4% 3.5% 2.2% 6.9%
Calvert 36.1% 7.8% 8.0% 34.8% 0.6% 5.1% 3.3% 4.2%
Caroline 37.1% 3.7% 0.5% 32.4% 6.4% 13.9% 0.2% 5.9%
Carroll 31.4% 10.0% 0.5% 36.6% 3.4% 5.9% 5.5% 6.6%
Cecil 33.6% 5.6% 0.2% 42.3% 0.8% 6.4% 5.8% 5.3%
Charles 27.8% 7.8% 0.0% 39.8% 0.6% 15.7% 0.1% 8.2%
Dorchester 37.6% 3.0% 0.3% 37.8% 2.0% 11.3% 3.1% 5.0%
Frederick 37.1% 6.7% 0.5% 32.8% 1.3% 5.2% 2.4% 14.1%
Garrett 16.6% 3.5% 0.7% 21.6% 34.6% 16.4% 2.4% 4.1%
Harford 42.9% 7.1% 0.4% 31.2% 0.5% 6.5% 6.2% 5.2%
Kent 31.0% 6.4% 0.9% 32.0% 0.8% 2.9% 2.4% 23.6%
Montgomery 36.0% 17.7% 2.2% 19.5% 1.1% 1.9% 5.4% 16.2%
Prince George’s 57.9% 11.8% 0.9% 7.4% 2.3% 3.2% 2.6% 14.1%
Queen Anne’s 32.8% 5.7% 0.0% 28.9% 0.6% 6.4% 2.7% 23.0%
St. Mary’s 12.1% 9.2% 0.3% 45.7% 0.0% 0.6% 1.5% 30.6%
Somerset 39.7% 2.1% 0.7% 21.7% 0.2% 22.5% 2.6% 10.5%
Talbot 18.8% 2.4% 0.1% 70.0% 0.6% 0.9% 1.0% 6.1%
Washington 24.3% 3.1% 2.9% 56.1% 1.7% 2.6% 0.4% 9.0%
Wicomico 40.7% 3.3% 1.6% 37.3% 2.0% 3.8% 1.5% 9.9%
Worcester 34.9% 1.0% 1.1% 35.4% 4.7% 4.0% 14.2% 4.8%
Statewide 37.0% 7.7% 1.2% 33.0% 2.4% 4.4% 4.1% 10.1%
Source: Local Government Finances Fiscal 2013, Department of Legislative Services
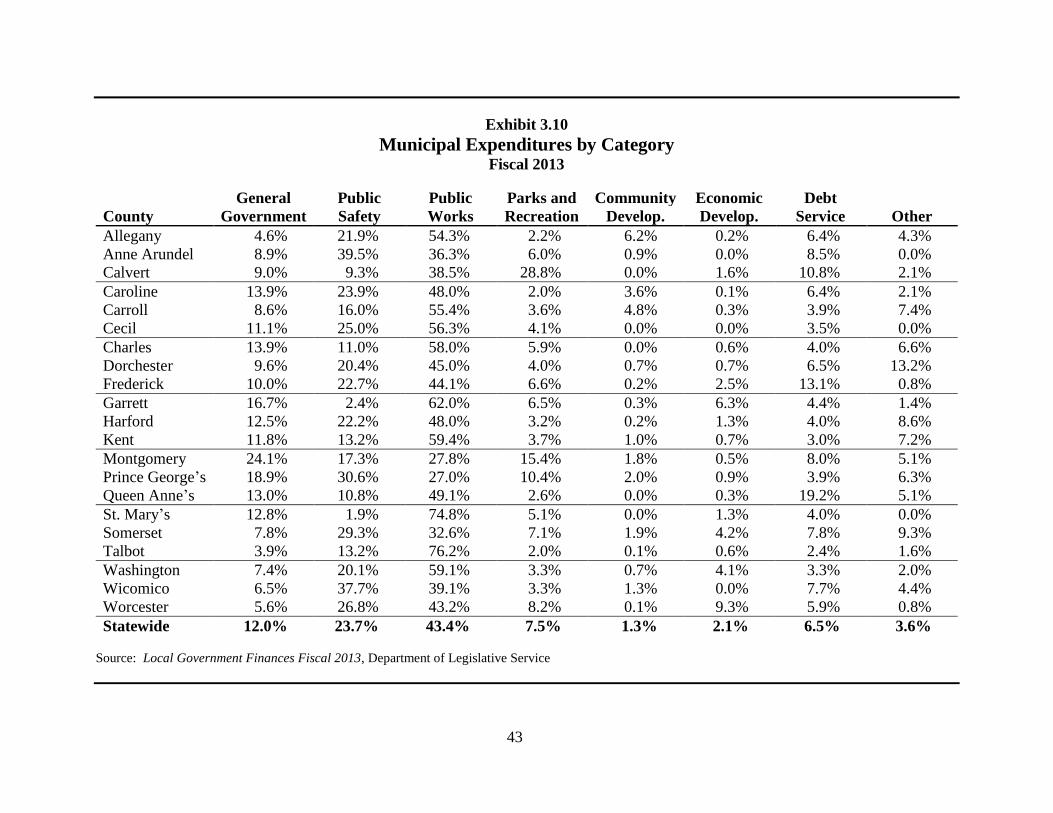
43
Exhibit 3.10
Municipal Expenditures by Category Fiscal 2013
General Public Public Parks and Community Economic Debt
County Government Safety Works Recreation Develop. Develop. Service Other
Allegany 4.6% 21.9% 54.3% 2.2% 6.2% 0.2% 6.4% 4.3%
Anne Arundel 8.9% 39.5% 36.3% 6.0% 0.9% 0.0% 8.5% 0.0%
Calvert 9.0% 9.3% 38.5% 28.8% 0.0% 1.6% 10.8% 2.1%
Caroline 13.9% 23.9% 48.0% 2.0% 3.6% 0.1% 6.4% 2.1%
Carroll 8.6% 16.0% 55.4% 3.6% 4.8% 0.3% 3.9% 7.4%
Cecil 11.1% 25.0% 56.3% 4.1% 0.0% 0.0% 3.5% 0.0%
Charles 13.9% 11.0% 58.0% 5.9% 0.0% 0.6% 4.0% 6.6%
Dorchester 9.6% 20.4% 45.0% 4.0% 0.7% 0.7% 6.5% 13.2%
Frederick 10.0% 22.7% 44.1% 6.6% 0.2% 2.5% 13.1% 0.8%
Garrett 16.7% 2.4% 62.0% 6.5% 0.3% 6.3% 4.4% 1.4%
Harford 12.5% 22.2% 48.0% 3.2% 0.2% 1.3% 4.0% 8.6%
Kent 11.8% 13.2% 59.4% 3.7% 1.0% 0.7% 3.0% 7.2%
Montgomery 24.1% 17.3% 27.8% 15.4% 1.8% 0.5% 8.0% 5.1%
Prince George’s 18.9% 30.6% 27.0% 10.4% 2.0% 0.9% 3.9% 6.3%
Queen Anne’s 13.0% 10.8% 49.1% 2.6% 0.0% 0.3% 19.2% 5.1%
St. Mary’s 12.8% 1.9% 74.8% 5.1% 0.0% 1.3% 4.0% 0.0%
Somerset 7.8% 29.3% 32.6% 7.1% 1.9% 4.2% 7.8% 9.3%
Talbot 3.9% 13.2% 76.2% 2.0% 0.1% 0.6% 2.4% 1.6%
Washington 7.4% 20.1% 59.1% 3.3% 0.7% 4.1% 3.3% 2.0%
Wicomico 6.5% 37.7% 39.1% 3.3% 1.3% 0.0% 7.7% 4.4%
Worcester 5.6% 26.8% 43.2% 8.2% 0.1% 9.3% 5.9% 0.8%
Statewide 12.0% 23.7% 43.4% 7.5% 1.3% 2.1% 6.5% 3.6%
Source: Local Government Finances Fiscal 2013, Department of Legislative Service

44
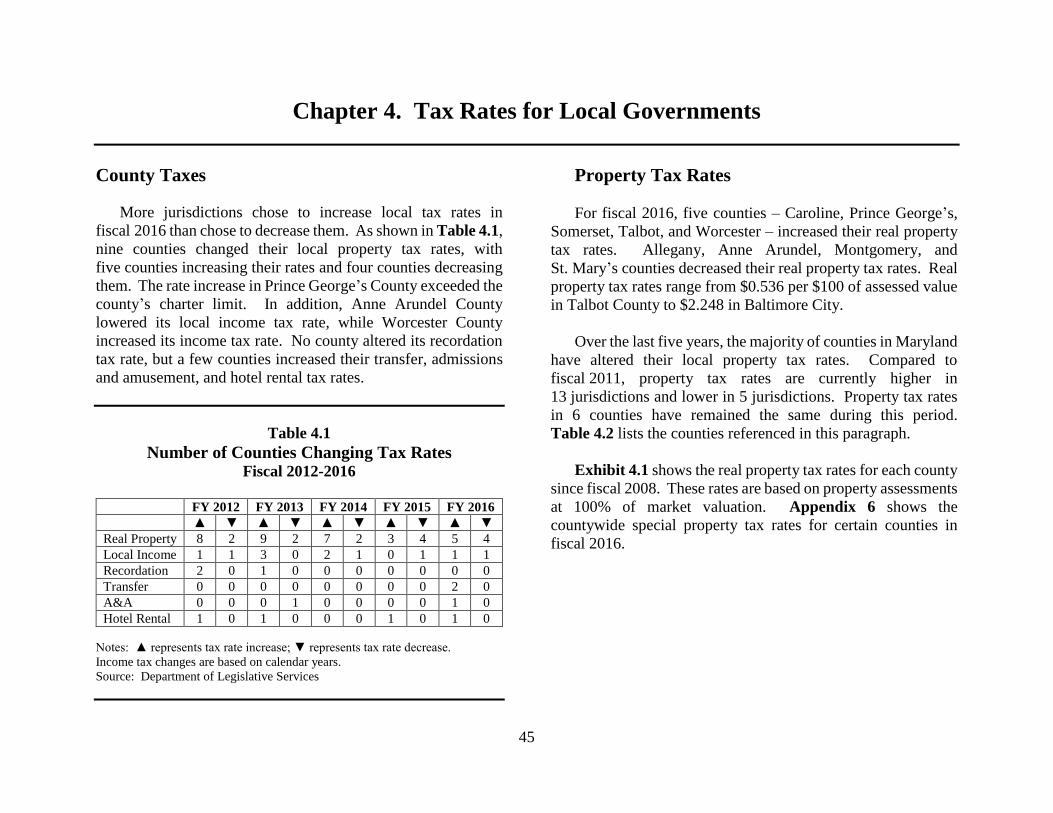
45
Chapter 4. Tax Rates for Local Governments
County Taxes
More jurisdictions chose to increase local tax rates in
fiscal 2016 than chose to decrease them. As shown in Table 4.1,
nine counties changed their local property tax rates, with
five counties increasing their rates and four counties decreasing
them. The rate increase in Prince George’s County exceeded the
county’s charter limit. In addition, Anne Arundel County
lowered its local income tax rate, while Worcester County
increased its income tax rate. No county altered its recordation
tax rate, but a few counties increased their transfer, admissions
and amusement, and hotel rental tax rates.
Table 4.1
Number of Counties Changing Tax Rates Fiscal 2012-2016
FY 2012 FY 2013 FY 2014 FY 2015 FY 2016
▲ ▼ ▲ ▼ ▲ ▼ ▲ ▼ ▲ ▼
Real Property 8 2 9 2 7 2 3 4 5 4
Local Income 1 1 3 0 2 1 0 1 1 1
Recordation 2 0 1 0 0 0 0 0 0 0
Transfer 0 0 0 0 0 0 0 0 2 0
A&A 0 0 0 1 0 0 0 0 1 0
Hotel Rental 1 0 1 0 0 0 1 0 1 0
Notes: ▲ represents tax rate increase; ▼ represents tax rate decrease.
Income tax changes are based on calendar years.
Source: Department of Legislative Services
Property Tax Rates
For fiscal 2016, five counties – Caroline, Prince George’s,
Somerset, Talbot, and Worcester – increased their real property
tax rates. Allegany, Anne Arundel, Montgomery, and
St. Mary’s counties decreased their real property tax rates. Real
property tax rates range from $0.536 per $100 of assessed value
in Talbot County to $2.248 in Baltimore City.
Over the last five years, the majority of counties in Maryland
have altered their local property tax rates. Compared to
fiscal 2011, property tax rates are currently higher in
13 jurisdictions and lower in 5 jurisdictions. Property tax rates
in 6 counties have remained the same during this period.
Table 4.2 lists the counties referenced in this paragraph.
Exhibit 4.1 shows the real property tax rates for each county
since fiscal 2008. These rates are based on property assessments
at 100% of market valuation. Appendix 6 shows the
countywide special property tax rates for certain counties in
fiscal 2016.
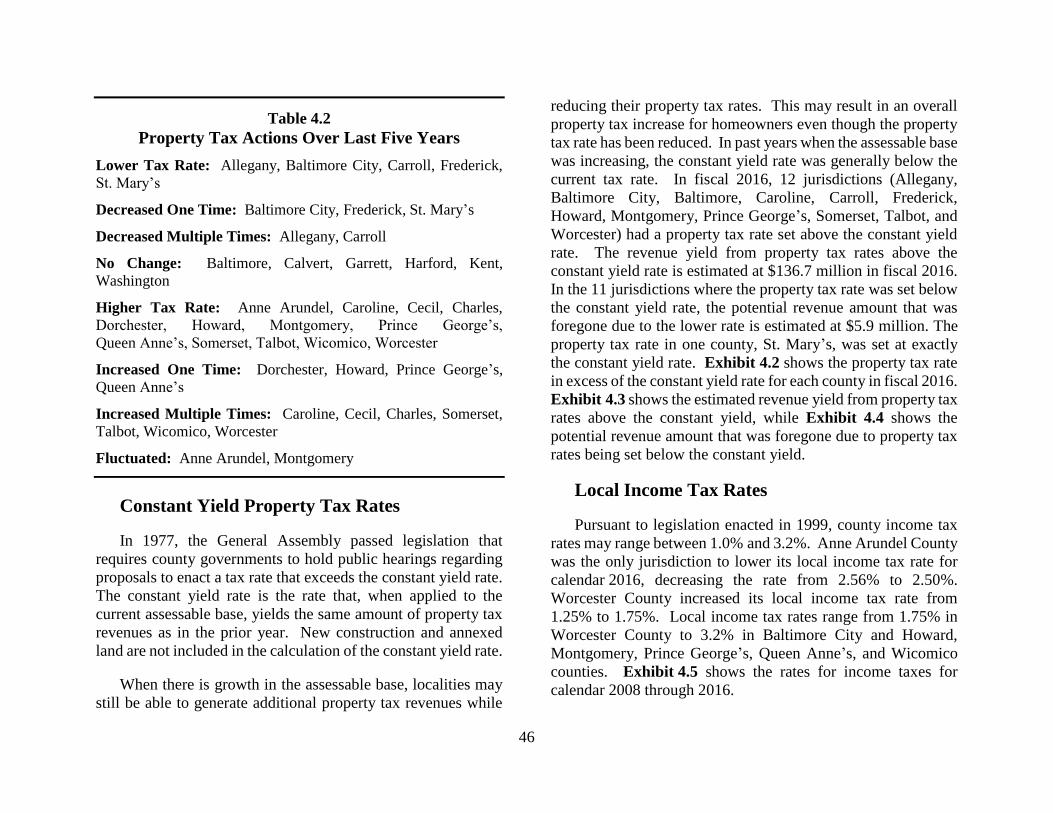
46
Table 4.2
Property Tax Actions Over Last Five Years
Lower Tax Rate: Allegany, Baltimore City, Carroll, Frederick,
St. Mary’s
Decreased One Time: Baltimore City, Frederick, St. Mary’s
Decreased Multiple Times: Allegany, Carroll
No Change: Baltimore, Calvert, Garrett, Harford, Kent,
Washington
Higher Tax Rate: Anne Arundel, Caroline, Cecil, Charles,
Dorchester, Howard, Montgomery, Prince George’s,
Queen Anne’s, Somerset, Talbot, Wicomico, Worcester
Increased One Time: Dorchester, Howard, Prince George’s,
Queen Anne’s
Increased Multiple Times: Caroline, Cecil, Charles, Somerset,
Talbot, Wicomico, Worcester
Fluctuated: Anne Arundel, Montgomery
Constant Yield Property Tax Rates
In 1977, the General Assembly passed legislation that
requires county governments to hold public hearings regarding
proposals to enact a tax rate that exceeds the constant yield rate.
The constant yield rate is the rate that, when applied to the
current assessable base, yields the same amount of property tax
revenues as in the prior year. New construction and annexed
land are not included in the calculation of the constant yield rate.
When there is growth in the assessable base, localities may
still be able to generate additional property tax revenues while
reducing their property tax rates. This may result in an overall
property tax increase for homeowners even though the property
tax rate has been reduced. In past years when the assessable base
was increasing, the constant yield rate was generally below the
current tax rate. In fiscal 2016, 12 jurisdictions (Allegany,
Baltimore City, Baltimore, Caroline, Carroll, Frederick,
Howard, Montgomery, Prince George’s, Somerset, Talbot, and
Worcester) had a property tax rate set above the constant yield
rate. The revenue yield from property tax rates above the
constant yield rate is estimated at $136.7 million in fiscal 2016.
In the 11 jurisdictions where the property tax rate was set below
the constant yield rate, the potential revenue amount that was
foregone due to the lower rate is estimated at $5.9 million. The
property tax rate in one county, St. Mary’s, was set at exactly
the constant yield rate. Exhibit 4.2 shows the property tax rate
in excess of the constant yield rate for each county in fiscal 2016.
Exhibit 4.3 shows the estimated revenue yield from property tax
rates above the constant yield, while Exhibit 4.4 shows the
potential revenue amount that was foregone due to property tax
rates being set below the constant yield.
Local Income Tax Rates
Pursuant to legislation enacted in 1999, county income tax
rates may range between 1.0% and 3.2%. Anne Arundel County
was the only jurisdiction to lower its local income tax rate for
calendar 2016, decreasing the rate from 2.56% to 2.50%.
Worcester County increased its local income tax rate from
1.25% to 1.75%. Local income tax rates range from 1.75% in
Worcester County to 3.2% in Baltimore City and Howard,
Montgomery, Prince George’s, Queen Anne’s, and Wicomico
counties. Exhibit 4.5 shows the rates for income taxes for
calendar 2008 through 2016.
47
Recordation Tax Rates
No county changed its recordation tax rate for fiscal 2016.
Recordation tax rates range from $2.50 per $500 of transaction
in Baltimore and Howard counties to $6.00 per $500 of
transaction in Frederick and Talbot counties. Exhibit 4.6 shows
the recordation, transfer, admissions and amusement, and hotel
rental tax rates by county for fiscal 2015 and 2016.
Transfer Tax Rates
Two counties, Cecil and Charles, began imposing a transfer
tax at a 0.5% rate in fiscal 2016. No other county altered its
transfer tax rate. Local transfer tax rates range from 0.5% in
eight counties (Allegany, Caroline, Cecil, Charles, Kent, Queen
Anne’s, Washington, and Worcester) to 1.5% in Baltimore City
and Baltimore County. Five counties (Calvert, Carroll,
Frederick, Somerset, and Wicomico) do not impose a tax on
property transfers.
Admissions and Amusement Tax Rates
One county, Garrett, increased its admissions and
amusement tax rate in fiscal 2016, from 4.5% to 6.0%. No other
county altered its admissions and amusement tax rate. Caroline
and Frederick counties are the only jurisdictions that do not
impose an admissions and amusement tax. Currently,
admissions and amusement tax rates range from 0.5% in
Dorchester County to 10.0% in six jurisdictions – Baltimore City
and Anne Arundel, Baltimore, Carroll, Charles, and Prince
George’s counties.
Hotel Rental Tax Rates
One county, Prince George’s, increased its hotel rental tax
rate in fiscal 2016, from 5% to 7%. No other county altered its
hotel rental tax rate. Hotel rental tax rates range from 3.0% in
Cecil and Frederick counties to 9.5% in Baltimore City.
Property Tax Limitation Measures
Five charter counties (Anne Arundel, Montgomery, Prince
George’s, Talbot, and Wicomico) have amended their charters
to limit property tax rates or revenues. In Anne Arundel County,
the total annual increase in property tax revenues is limited to
the lesser of 4.5% or the increase in the Consumer Price Index
(CPI). In Montgomery County, the growth in property tax
revenues is limited to the increase in CPI; however, this
limitation does not apply to new construction. In addition, the
limitation may be overridden by a unanimous vote of all
nine county council members. In Prince George’s County, the
general property tax rate is capped at $0.96 per $100 of assessed
value. Special taxing districts, such as the Maryland-National
Capital Park and Planning Commission, are not included under
the tax cap. In Talbot and Wicomico counties, the total annual
increase in property tax revenues is limited to the lesser of 2%
or the increase in CPI.
The counties may exceed the charter limitations on local
property taxes for the purpose of funding the approved budget
of the local board of education. If a local property tax rate is set
above the charter limit, the county governing body may not
reduce funding provided to the local board of education from
any other local source and must appropriate to the local board of
education all of the revenues generated from any increase
48
beyond the existing charter limit. Any use of this authority must
be reported annually to the Governor and the General Assembly.
This authority was adopted at the 2012 session in order to ensure
that counties have the fiscal ability to meet new maintenance of
effort requirements. In fiscal 2013, Talbot County became the
first jurisdiction to exercise this new authority by establishing a
2.6 cent supplemental property tax rate for the local board of
education. No jurisdiction exercised this authority in fiscal 2014
or 2015. In fiscal 2016, Prince George’s County became the
second county to exercise this authority by enacting a 4 cent
supplemental property tax rate to fund its schools.
Municipal Property Tax Rates
Individuals and businesses residing in incorporated areas are
subject to municipal property taxes in addition to county
property taxes. Municipal real property tax rates range from
$0.02 in Chevy Chase, Section 3 (Montgomery County) to
$1.31 in Colmar Manor (Prince George’s County). Only Chevy
Chase and Chevy Chase, Section 5 (Montgomery County) did
not impose a local property tax in fiscal 2016. While only 15.5%
of the State’s population resides in incorporated areas (excluding
Baltimore City), there are nine counties where over 30% of
residents live in municipalities. Exhibit 4.7 shows the
municipal property tax rates for the 20 largest municipalities and
Baltimore City, ranked by the combined county and municipal
property tax rates. Appendix 7 shows the real property tax rates
for each municipality.
Property Tax Differentials and Rebates
To compensate municipalities for providing services in lieu
of similar county services or programs and to address the effect
of double taxation in municipalities (when residents pay both
county and municipal property taxes), 18 counties provided
property tax set-offs in fiscal 2015, through either a tax rate
differential or tax rebate. A municipal tax rate differential takes
the form of a reduced county property tax rate within the
boundaries of a municipality. A tax rebate is a direct grant to
municipalities for providing services that are similar to county
services. These services include police protection, highway and
street maintenance, sanitation and waste collection, planning
and zoning, and recreation and parks. In fiscal 2015, municipal
tax differentials and rebates totaled approximately
$101.6 million, a 0.05% increase compared to the prior year.
Exhibit 4.8 shows the amount of tax set-offs provided in
fiscal 2014 by county.
Even with such tax set-off programs, many municipal
residents face relatively high property tax rates. For example,
residents in Princess Anne are subject to a $2.10 combined
county/municipal property tax rate, which is more than twice the
amount of the Somerset County rate. Table 4.3 lists the
municipalities with the highest combined county/municipal
property tax rates for fiscal 2016.
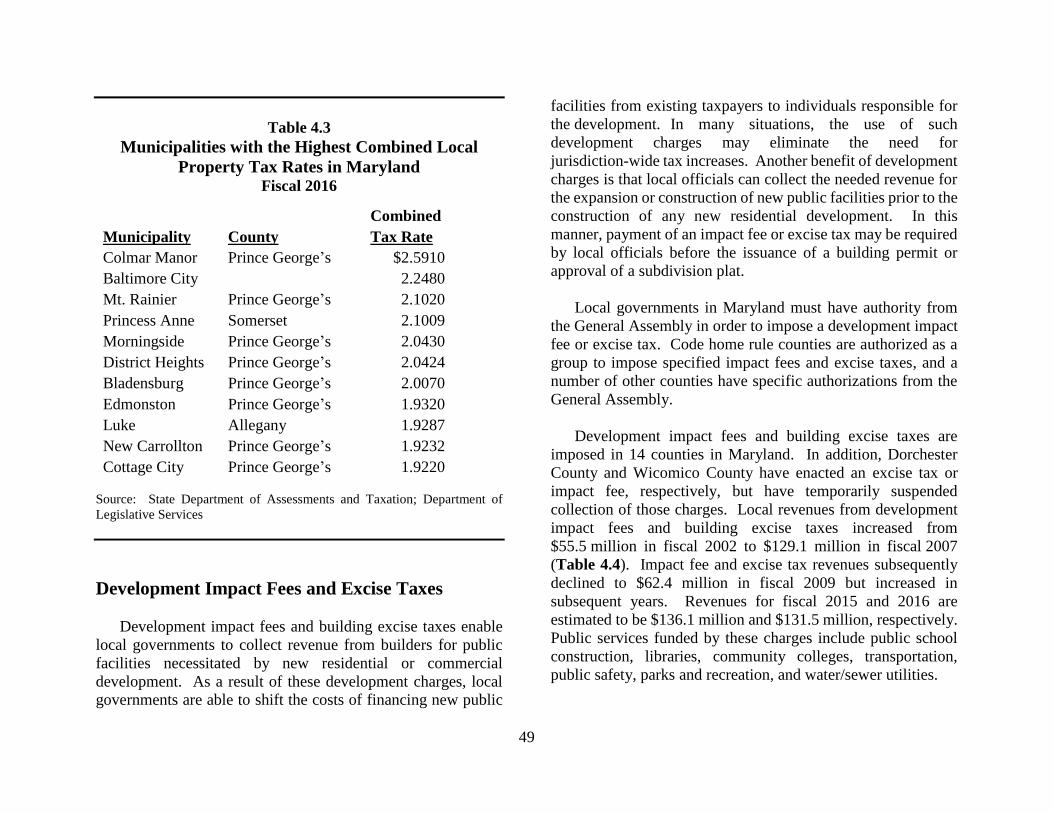
49
Table 4.3
Municipalities with the Highest Combined Local
Property Tax Rates in Maryland Fiscal 2016
Combined
Municipality County Tax Rate
Colmar Manor Prince George’s $2.5910
Baltimore City 2.2480
Mt. Rainier Prince George’s 2.1020
Princess Anne Somerset 2.1009
Morningside Prince George’s 2.0430
District Heights Prince George’s 2.0424
Bladensburg Prince George’s 2.0070
Edmonston Prince George’s 1.9320
Luke Allegany 1.9287
New Carrollton Prince George’s 1.9232
Cottage City Prince George’s 1.9220
Source: State Department of Assessments and Taxation; Department of
Legislative Services
Development Impact Fees and Excise Taxes
Development impact fees and building excise taxes enable
local governments to collect revenue from builders for public
facilities necessitated by new residential or commercial
development. As a result of these development charges, local
governments are able to shift the costs of financing new public
facilities from existing taxpayers to individuals responsible for
the development. In many situations, the use of such
development charges may eliminate the need for
jurisdiction-wide tax increases. Another benefit of development
charges is that local officials can collect the needed revenue for
the expansion or construction of new public facilities prior to the
construction of any new residential development. In this
manner, payment of an impact fee or excise tax may be required
by local officials before the issuance of a building permit or
approval of a subdivision plat.
Local governments in Maryland must have authority from
the General Assembly in order to impose a development impact
fee or excise tax. Code home rule counties are authorized as a
group to impose specified impact fees and excise taxes, and a
number of other counties have specific authorizations from the
General Assembly.
Development impact fees and building excise taxes are
imposed in 14 counties in Maryland. In addition, Dorchester
County and Wicomico County have enacted an excise tax or
impact fee, respectively, but have temporarily suspended
collection of those charges. Local revenues from development
impact fees and building excise taxes increased from
$55.5 million in fiscal 2002 to $129.1 million in fiscal 2007
(Table 4.4). Impact fee and excise tax revenues subsequently
declined to $62.4 million in fiscal 2009 but increased in
subsequent years. Revenues for fiscal 2015 and 2016 are
estimated to be $136.1 million and $131.5 million, respectively.
Public services funded by these charges include public school
construction, libraries, community colleges, transportation,
public safety, parks and recreation, and water/sewer utilities.
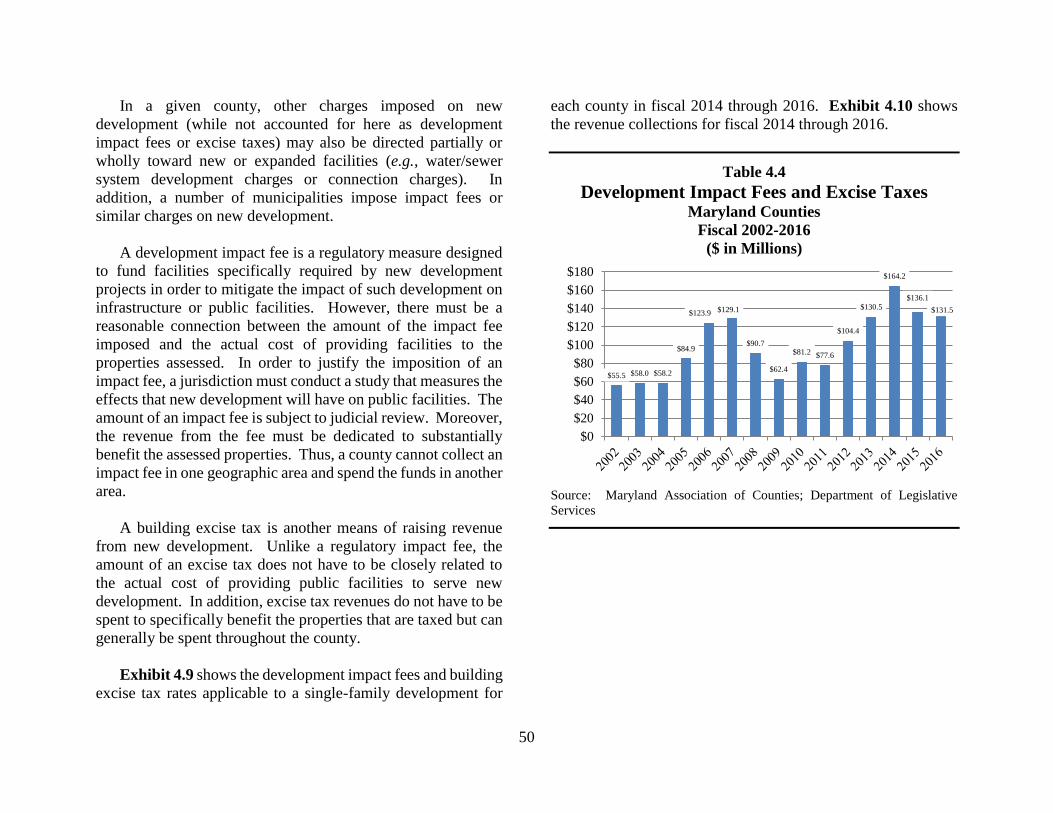
50
In a given county, other charges imposed on new
development (while not accounted for here as development
impact fees or excise taxes) may also be directed partially or
wholly toward new or expanded facilities (e.g., water/sewer
system development charges or connection charges). In
addition, a number of municipalities impose impact fees or
similar charges on new development.
A development impact fee is a regulatory measure designed
to fund facilities specifically required by new development
projects in order to mitigate the impact of such development on
infrastructure or public facilities. However, there must be a
reasonable connection between the amount of the impact fee
imposed and the actual cost of providing facilities to the
properties assessed. In order to justify the imposition of an
impact fee, a jurisdiction must conduct a study that measures the
effects that new development will have on public facilities. The
amount of an impact fee is subject to judicial review. Moreover,
the revenue from the fee must be dedicated to substantially
benefit the assessed properties. Thus, a county cannot collect an
impact fee in one geographic area and spend the funds in another
area.
A building excise tax is another means of raising revenue
from new development. Unlike a regulatory impact fee, the
amount of an excise tax does not have to be closely related to
the actual cost of providing public facilities to serve new
development. In addition, excise tax revenues do not have to be
spent to specifically benefit the properties that are taxed but can
generally be spent throughout the county.
Exhibit 4.9 shows the development impact fees and building
excise tax rates applicable to a single-family development for
each county in fiscal 2014 through 2016. Exhibit 4.10 shows
the revenue collections for fiscal 2014 through 2016.
Table 4.4
Development Impact Fees and Excise Taxes Maryland Counties
Fiscal 2002-2016
($ in Millions)
Source: Maryland Association of Counties; Department of Legislative
Services
$55.5 $58.0 $58.2
$84.9
$123.9 $129.1
$90.7
$62.4
$81.2 $77.6
$104.4
$130.5
$164.2
$136.1
$131.5
$0
$20
$40
$60
$80
$100
$120
$140
$160
$180
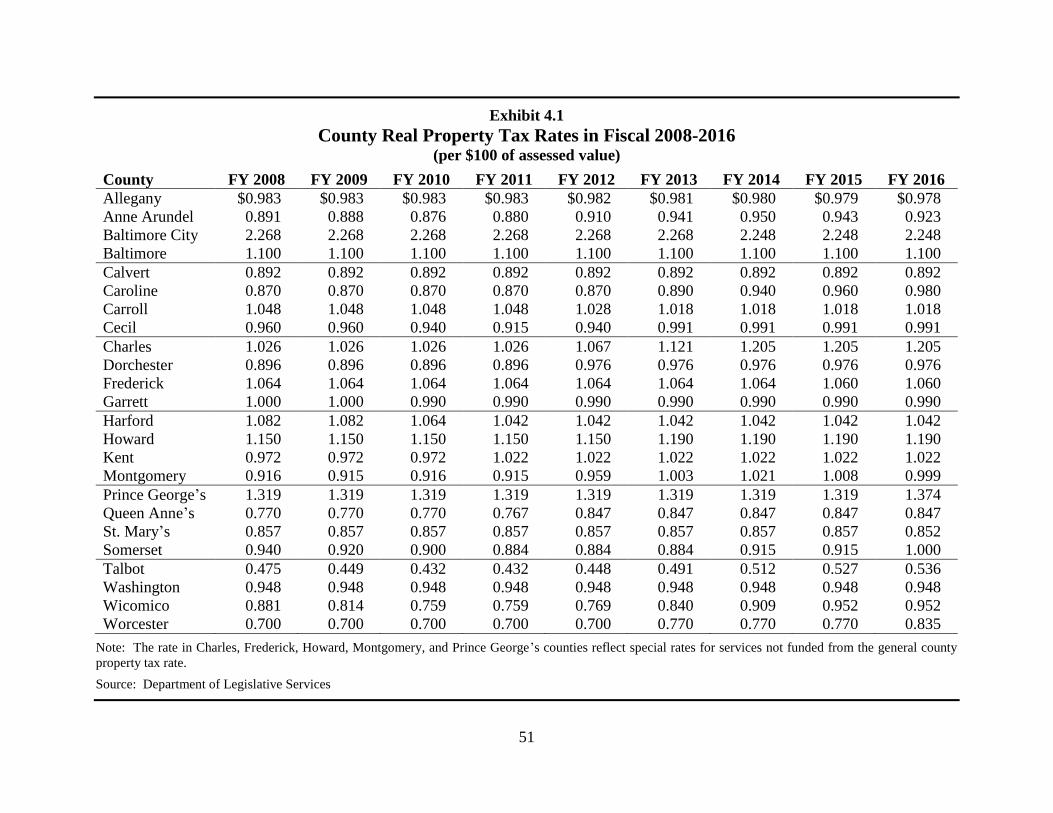
51
Exhibit 4.1
County Real Property Tax Rates in Fiscal 2008-2016
(per $100 of assessed value)
County FY 2008 FY 2009 FY 2010 FY 2011 FY 2012 FY 2013 FY 2014 FY 2015 FY 2016
Allegany $0.983 $0.983 $0.983 $0.983 $0.982 $0.981 $0.980 $0.979 $0.978
Anne Arundel 0.891 0.888 0.876 0.880 0.910 0.941 0.950 0.943 0.923
Baltimore City 2.268 2.268 2.268 2.268 2.268 2.268 2.248 2.248 2.248
Baltimore 1.100 1.100 1.100 1.100 1.100 1.100 1.100 1.100 1.100
Calvert 0.892 0.892 0.892 0.892 0.892 0.892 0.892 0.892 0.892
Caroline 0.870 0.870 0.870 0.870 0.870 0.890 0.940 0.960 0.980
Carroll 1.048 1.048 1.048 1.048 1.028 1.018 1.018 1.018 1.018
Cecil 0.960 0.960 0.940 0.915 0.940 0.991 0.991 0.991 0.991
Charles 1.026 1.026 1.026 1.026 1.067 1.121 1.205 1.205 1.205
Dorchester 0.896 0.896 0.896 0.896 0.976 0.976 0.976 0.976 0.976
Frederick 1.064 1.064 1.064 1.064 1.064 1.064 1.064 1.060 1.060
Garrett 1.000 1.000 0.990 0.990 0.990 0.990 0.990 0.990 0.990
Harford 1.082 1.082 1.064 1.042 1.042 1.042 1.042 1.042 1.042
Howard 1.150 1.150 1.150 1.150 1.150 1.190 1.190 1.190 1.190
Kent 0.972 0.972 0.972 1.022 1.022 1.022 1.022 1.022 1.022
Montgomery 0.916 0.915 0.916 0.915 0.959 1.003 1.021 1.008 0.999
Prince George’s 1.319 1.319 1.319 1.319 1.319 1.319 1.319 1.319 1.374
Queen Anne’s 0.770 0.770 0.770 0.767 0.847 0.847 0.847 0.847 0.847
St. Mary’s 0.857 0.857 0.857 0.857 0.857 0.857 0.857 0.857 0.852
Somerset 0.940 0.920 0.900 0.884 0.884 0.884 0.915 0.915 1.000
Talbot 0.475 0.449 0.432 0.432 0.448 0.491 0.512 0.527 0.536
Washington 0.948 0.948 0.948 0.948 0.948 0.948 0.948 0.948 0.948
Wicomico 0.881 0.814 0.759 0.759 0.769 0.840 0.909 0.952 0.952
Worcester 0.700 0.700 0.700 0.700 0.700 0.770 0.770 0.770 0.835
Note: The rate in Charles, Frederick, Howard, Montgomery, and Prince George’s counties reflect special rates for services not funded from the general county
property tax rate.
Source: Department of Legislative Services
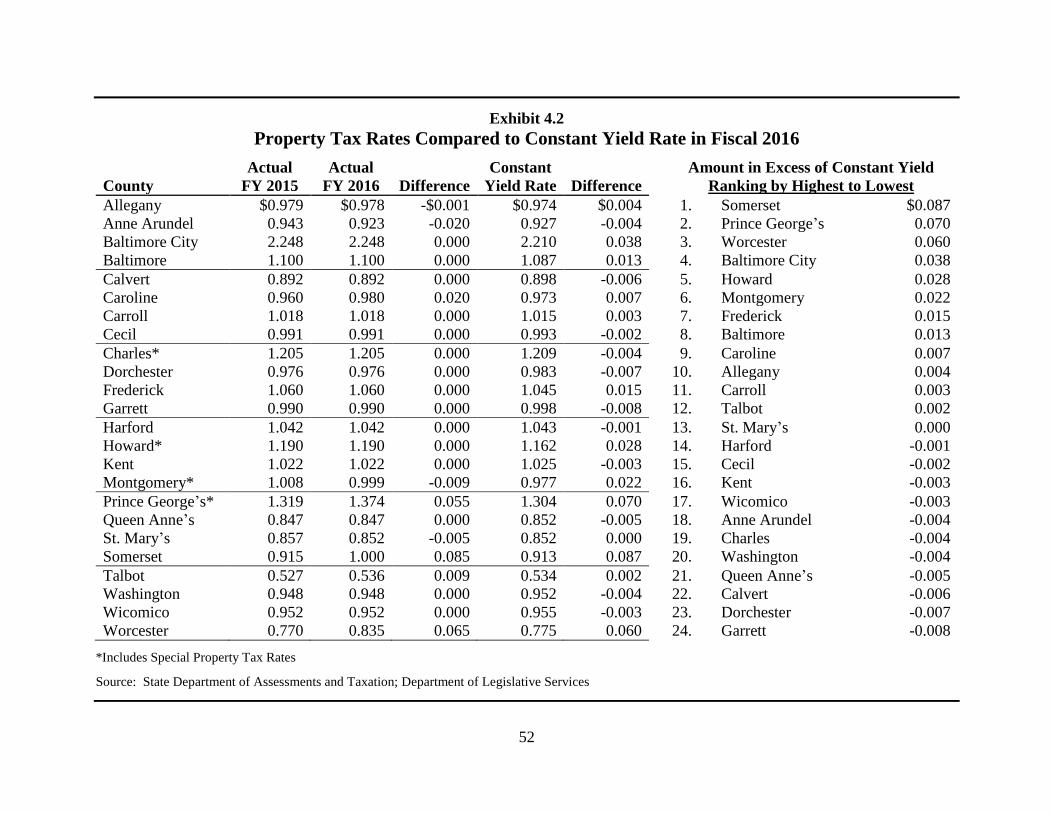
52
Exhibit 4.2
Property Tax Rates Compared to Constant Yield Rate in Fiscal 2016
Actual Actual Constant Amount in Excess of Constant Yield
County FY 2015 FY 2016 Difference Yield Rate Difference Ranking by Highest to Lowest
Allegany $0.979 $0.978 -$0.001 $0.974 $0.004 1. Somerset $0.087
Anne Arundel 0.943 0.923 -0.020 0.927 -0.004 2. Prince George’s 0.070
Baltimore City 2.248 2.248 0.000 2.210 0.038 3. Worcester 0.060
Baltimore 1.100 1.100 0.000 1.087 0.013 4. Baltimore City 0.038
Calvert 0.892 0.892 0.000 0.898 -0.006 5. Howard 0.028
Caroline 0.960 0.980 0.020 0.973 0.007 6. Montgomery 0.022
Carroll 1.018 1.018 0.000 1.015 0.003 7. Frederick 0.015
Cecil 0.991 0.991 0.000 0.993 -0.002 8. Baltimore 0.013
Charles* 1.205 1.205 0.000 1.209 -0.004 9. Caroline 0.007
Dorchester 0.976 0.976 0.000 0.983 -0.007 10. Allegany 0.004
Frederick 1.060 1.060 0.000 1.045 0.015 11. Carroll 0.003
Garrett 0.990 0.990 0.000 0.998 -0.008 12. Talbot 0.002
Harford 1.042 1.042 0.000 1.043 -0.001 13. St. Mary’s 0.000
Howard* 1.190 1.190 0.000 1.162 0.028 14. Harford -0.001
Kent 1.022 1.022 0.000 1.025 -0.003 15. Cecil -0.002
Montgomery* 1.008 0.999 -0.009 0.977 0.022 16. Kent -0.003
Prince George’s* 1.319 1.374 0.055 1.304 0.070 17. Wicomico -0.003
Queen Anne’s 0.847 0.847 0.000 0.852 -0.005 18. Anne Arundel -0.004
St. Mary’s 0.857 0.852 -0.005 0.852 0.000 19. Charles -0.004
Somerset 0.915 1.000 0.085 0.913 0.087 20. Washington -0.004
Talbot 0.527 0.536 0.009 0.534 0.002 21. Queen Anne’s -0.005
Washington 0.948 0.948 0.000 0.952 -0.004 22. Calvert -0.006
Wicomico 0.952 0.952 0.000 0.955 -0.003 23. Dorchester -0.007
Worcester 0.770 0.835 0.065 0.775 0.060 24. Garrett -0.008
*Includes Special Property Tax Rates
Source: State Department of Assessments and Taxation; Department of Legislative Services
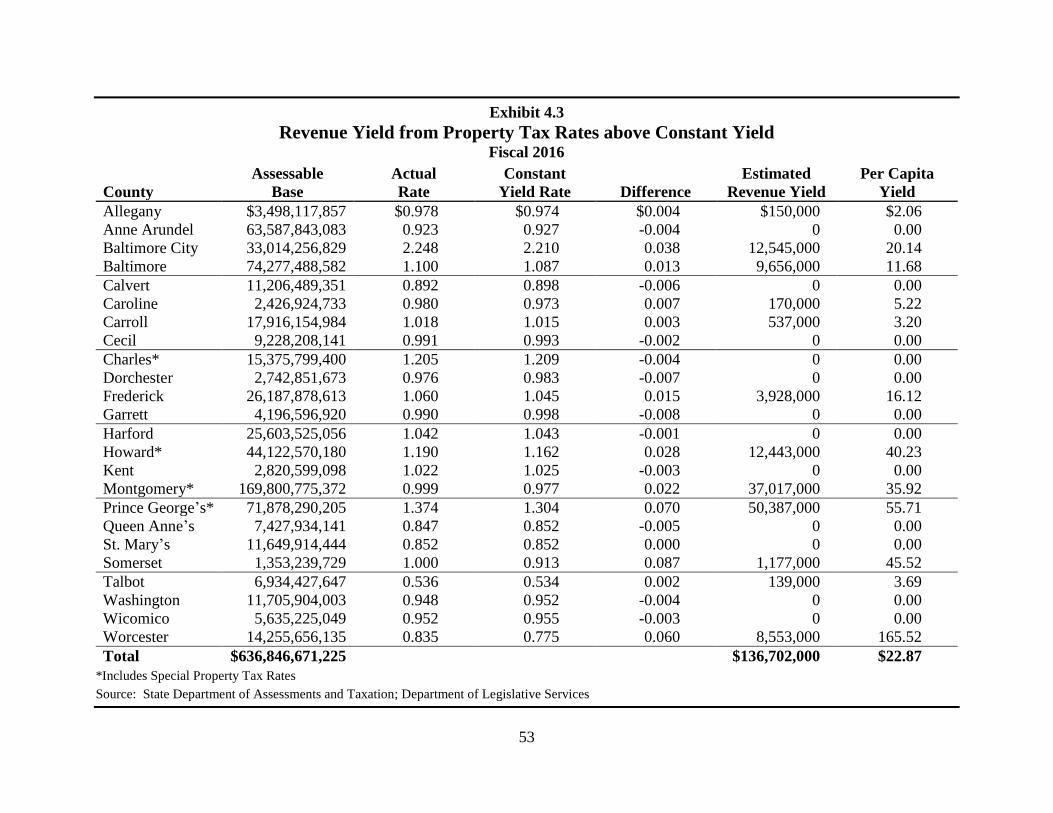
53
Exhibit 4.3
Revenue Yield from Property Tax Rates above Constant Yield Fiscal 2016
Assessable Actual Constant Estimated Per Capita
County Base Rate Yield Rate Difference Revenue Yield Yield
Allegany $3,498,117,857 $0.978 $0.974 $0.004 $150,000 $2.06
Anne Arundel 63,587,843,083 0.923 0.927 -0.004 0 0.00
Baltimore City 33,014,256,829 2.248 2.210 0.038 12,545,000 20.14
Baltimore 74,277,488,582 1.100 1.087 0.013 9,656,000 11.68
Calvert 11,206,489,351 0.892 0.898 -0.006 0 0.00
Caroline 2,426,924,733 0.980 0.973 0.007 170,000 5.22
Carroll 17,916,154,984 1.018 1.015 0.003 537,000 3.20
Cecil 9,228,208,141 0.991 0.993 -0.002 0 0.00
Charles* 15,375,799,400 1.205 1.209 -0.004 0 0.00
Dorchester 2,742,851,673 0.976 0.983 -0.007 0 0.00
Frederick 26,187,878,613 1.060 1.045 0.015 3,928,000 16.12
Garrett 4,196,596,920 0.990 0.998 -0.008 0 0.00
Harford 25,603,525,056 1.042 1.043 -0.001 0 0.00
Howard* 44,122,570,180 1.190 1.162 0.028 12,443,000 40.23
Kent 2,820,599,098 1.022 1.025 -0.003 0 0.00
Montgomery* 169,800,775,372 0.999 0.977 0.022 37,017,000 35.92
Prince George’s* 71,878,290,205 1.374 1.304 0.070 50,387,000 55.71
Queen Anne’s 7,427,934,141 0.847 0.852 -0.005 0 0.00
St. Mary’s 11,649,914,444 0.852 0.852 0.000 0 0.00
Somerset 1,353,239,729 1.000 0.913 0.087 1,177,000 45.52
Talbot 6,934,427,647 0.536 0.534 0.002 139,000 3.69
Washington 11,705,904,003 0.948 0.952 -0.004 0 0.00
Wicomico 5,635,225,049 0.952 0.955 -0.003 0 0.00
Worcester 14,255,656,135 0.835 0.775 0.060 8,553,000 165.52
Total $636,846,671,225 $136,702,000 $22.87
*Includes Special Property Tax Rates
Source: State Department of Assessments and Taxation; Department of Legislative Services
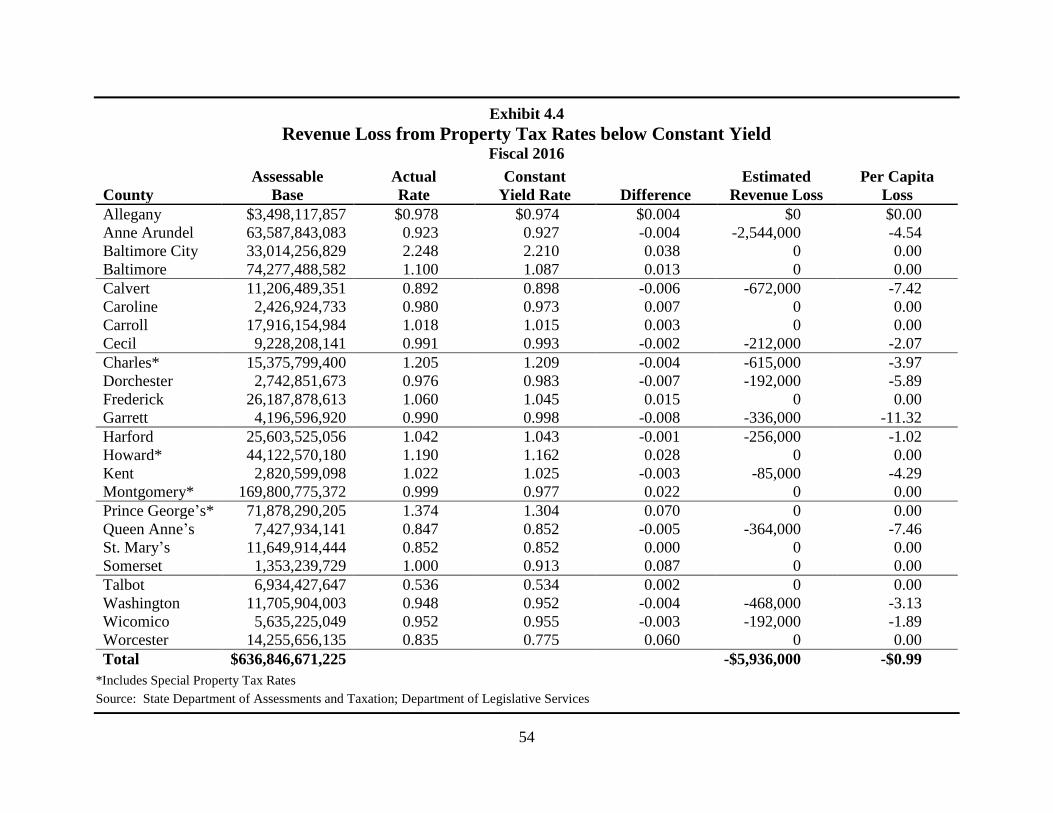
54
Exhibit 4.4
Revenue Loss from Property Tax Rates below Constant Yield
Fiscal 2016
Assessable Actual Constant Estimated Per Capita
County Base Rate Yield Rate Difference Revenue Loss Loss
Allegany $3,498,117,857 $0.978 $0.974 $0.004 $0 $0.00
Anne Arundel 63,587,843,083 0.923 0.927 -0.004 -2,544,000 -4.54
Baltimore City 33,014,256,829 2.248 2.210 0.038 0 0.00
Baltimore 74,277,488,582 1.100 1.087 0.013 0 0.00
Calvert 11,206,489,351 0.892 0.898 -0.006 -672,000 -7.42
Caroline 2,426,924,733 0.980 0.973 0.007 0 0.00
Carroll 17,916,154,984 1.018 1.015 0.003 0 0.00
Cecil 9,228,208,141 0.991 0.993 -0.002 -212,000 -2.07
Charles* 15,375,799,400 1.205 1.209 -0.004 -615,000 -3.97
Dorchester 2,742,851,673 0.976 0.983 -0.007 -192,000 -5.89
Frederick 26,187,878,613 1.060 1.045 0.015 0 0.00
Garrett 4,196,596,920 0.990 0.998 -0.008 -336,000 -11.32
Harford 25,603,525,056 1.042 1.043 -0.001 -256,000 -1.02
Howard* 44,122,570,180 1.190 1.162 0.028 0 0.00
Kent 2,820,599,098 1.022 1.025 -0.003 -85,000 -4.29
Montgomery* 169,800,775,372 0.999 0.977 0.022 0 0.00
Prince George’s* 71,878,290,205 1.374 1.304 0.070 0 0.00
Queen Anne’s 7,427,934,141 0.847 0.852 -0.005 -364,000 -7.46
St. Mary’s 11,649,914,444 0.852 0.852 0.000 0 0.00
Somerset 1,353,239,729 1.000 0.913 0.087 0 0.00
Talbot 6,934,427,647 0.536 0.534 0.002 0 0.00
Washington 11,705,904,003 0.948 0.952 -0.004 -468,000 -3.13
Wicomico 5,635,225,049 0.952 0.955 -0.003 -192,000 -1.89
Worcester 14,255,656,135 0.835 0.775 0.060 0 0.00
Total $636,846,671,225 -$5,936,000 -$0.99
*Includes Special Property Tax Rates
Source: State Department of Assessments and Taxation; Department of Legislative Services
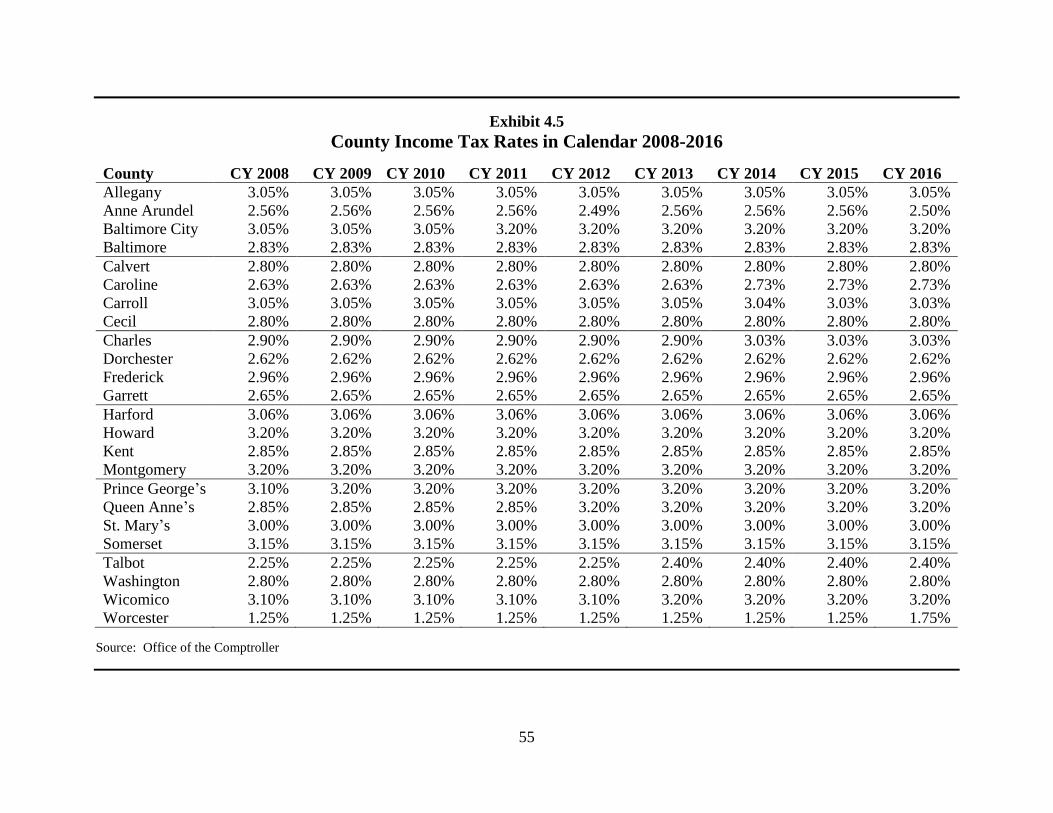
55
Exhibit 4.5
County Income Tax Rates in Calendar 2008-2016
County CY 2008 CY 2009 CY 2010 CY 2011 CY 2012 CY 2013 CY 2014 CY 2015 CY 2016
Allegany 3.05% 3.05% 3.05% 3.05% 3.05% 3.05% 3.05% 3.05% 3.05%
Anne Arundel 2.56% 2.56% 2.56% 2.56% 2.49% 2.56% 2.56% 2.56% 2.50%
Baltimore City 3.05% 3.05% 3.05% 3.20% 3.20% 3.20% 3.20% 3.20% 3.20%
Baltimore 2.83% 2.83% 2.83% 2.83% 2.83% 2.83% 2.83% 2.83% 2.83%
Calvert 2.80% 2.80% 2.80% 2.80% 2.80% 2.80% 2.80% 2.80% 2.80%
Caroline 2.63% 2.63% 2.63% 2.63% 2.63% 2.63% 2.73% 2.73% 2.73%
Carroll 3.05% 3.05% 3.05% 3.05% 3.05% 3.05% 3.04% 3.03% 3.03%
Cecil 2.80% 2.80% 2.80% 2.80% 2.80% 2.80% 2.80% 2.80% 2.80%
Charles 2.90% 2.90% 2.90% 2.90% 2.90% 2.90% 3.03% 3.03% 3.03%
Dorchester 2.62% 2.62% 2.62% 2.62% 2.62% 2.62% 2.62% 2.62% 2.62%
Frederick 2.96% 2.96% 2.96% 2.96% 2.96% 2.96% 2.96% 2.96% 2.96%
Garrett 2.65% 2.65% 2.65% 2.65% 2.65% 2.65% 2.65% 2.65% 2.65%
Harford 3.06% 3.06% 3.06% 3.06% 3.06% 3.06% 3.06% 3.06% 3.06%
Howard 3.20% 3.20% 3.20% 3.20% 3.20% 3.20% 3.20% 3.20% 3.20%
Kent 2.85% 2.85% 2.85% 2.85% 2.85% 2.85% 2.85% 2.85% 2.85%
Montgomery 3.20% 3.20% 3.20% 3.20% 3.20% 3.20% 3.20% 3.20% 3.20%
Prince George’s 3.10% 3.20% 3.20% 3.20% 3.20% 3.20% 3.20% 3.20% 3.20%
Queen Anne’s 2.85% 2.85% 2.85% 2.85% 3.20% 3.20% 3.20% 3.20% 3.20%
St. Mary’s 3.00% 3.00% 3.00% 3.00% 3.00% 3.00% 3.00% 3.00% 3.00%
Somerset 3.15% 3.15% 3.15% 3.15% 3.15% 3.15% 3.15% 3.15% 3.15%
Talbot 2.25% 2.25% 2.25% 2.25% 2.25% 2.40% 2.40% 2.40% 2.40%
Washington 2.80% 2.80% 2.80% 2.80% 2.80% 2.80% 2.80% 2.80% 2.80%
Wicomico 3.10% 3.10% 3.10% 3.10% 3.10% 3.20% 3.20% 3.20% 3.20%
Worcester 1.25% 1.25% 1.25% 1.25% 1.25% 1.25% 1.25% 1.25% 1.75%
Source: Office of the Comptroller
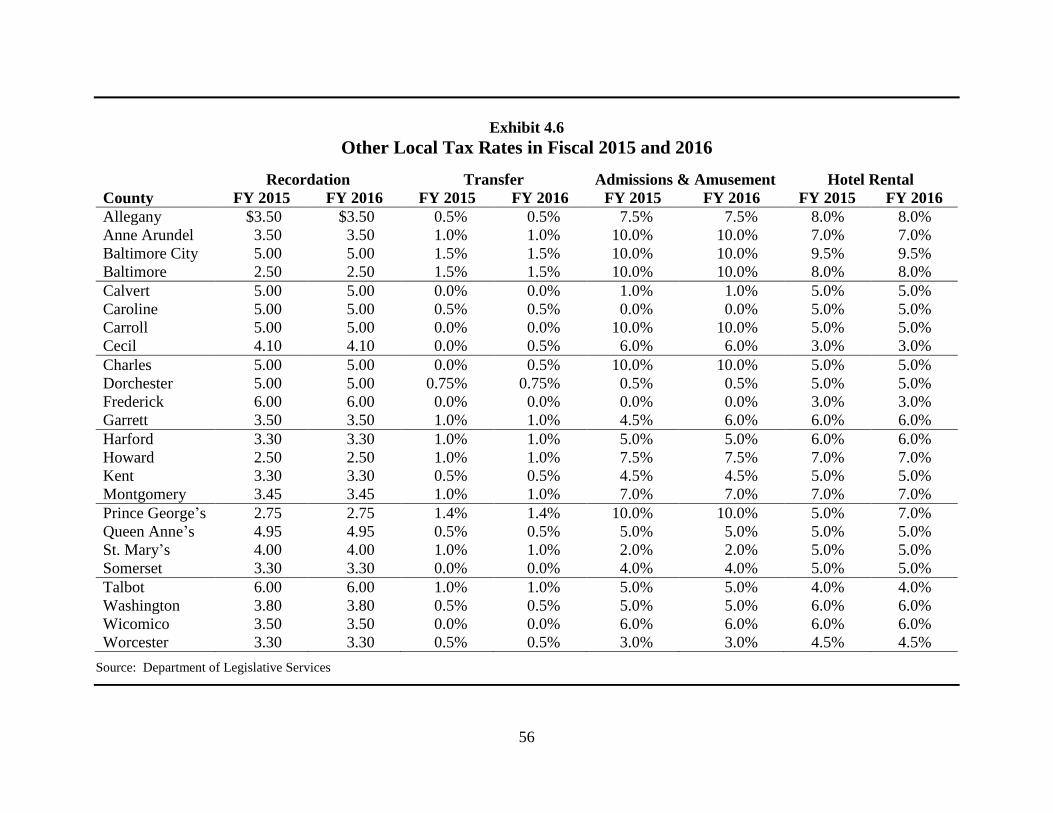
56
Exhibit 4.6
Other Local Tax Rates in Fiscal 2015 and 2016
Recordation Transfer Admissions & Amusement Hotel Rental
County FY 2015 FY 2016 FY 2015 FY 2016 FY 2015 FY 2016 FY 2015 FY 2016
Allegany $3.50 $3.50 0.5% 0.5% 7.5% 7.5% 8.0% 8.0%
Anne Arundel 3.50 3.50 1.0% 1.0% 10.0% 10.0% 7.0% 7.0%
Baltimore City 5.00 5.00 1.5% 1.5% 10.0% 10.0% 9.5% 9.5%
Baltimore 2.50 2.50 1.5% 1.5% 10.0% 10.0% 8.0% 8.0%
Calvert 5.00 5.00 0.0% 0.0% 1.0% 1.0% 5.0% 5.0%
Caroline 5.00 5.00 0.5% 0.5% 0.0% 0.0% 5.0% 5.0%
Carroll 5.00 5.00 0.0% 0.0% 10.0% 10.0% 5.0% 5.0%
Cecil 4.10 4.10 0.0% 0.5% 6.0% 6.0% 3.0% 3.0%
Charles 5.00 5.00 0.0% 0.5% 10.0% 10.0% 5.0% 5.0%
Dorchester 5.00 5.00 0.75% 0.75% 0.5% 0.5% 5.0% 5.0%
Frederick 6.00 6.00 0.0% 0.0% 0.0% 0.0% 3.0% 3.0%
Garrett 3.50 3.50 1.0% 1.0% 4.5% 6.0% 6.0% 6.0%
Harford 3.30 3.30 1.0% 1.0% 5.0% 5.0% 6.0% 6.0%
Howard 2.50 2.50 1.0% 1.0% 7.5% 7.5% 7.0% 7.0%
Kent 3.30 3.30 0.5% 0.5% 4.5% 4.5% 5.0% 5.0%
Montgomery 3.45 3.45 1.0% 1.0% 7.0% 7.0% 7.0% 7.0%
Prince George’s 2.75 2.75 1.4% 1.4% 10.0% 10.0% 5.0% 7.0%
Queen Anne’s 4.95 4.95 0.5% 0.5% 5.0% 5.0% 5.0% 5.0%
St. Mary’s 4.00 4.00 1.0% 1.0% 2.0% 2.0% 5.0% 5.0%
Somerset 3.30 3.30 0.0% 0.0% 4.0% 4.0% 5.0% 5.0%
Talbot 6.00 6.00 1.0% 1.0% 5.0% 5.0% 4.0% 4.0%
Washington 3.80 3.80 0.5% 0.5% 5.0% 5.0% 6.0% 6.0%
Wicomico 3.50 3.50 0.0% 0.0% 6.0% 6.0% 6.0% 6.0%
Worcester 3.30 3.30 0.5% 0.5% 3.0% 3.0% 4.5% 4.5%
Source: Department of Legislative Services
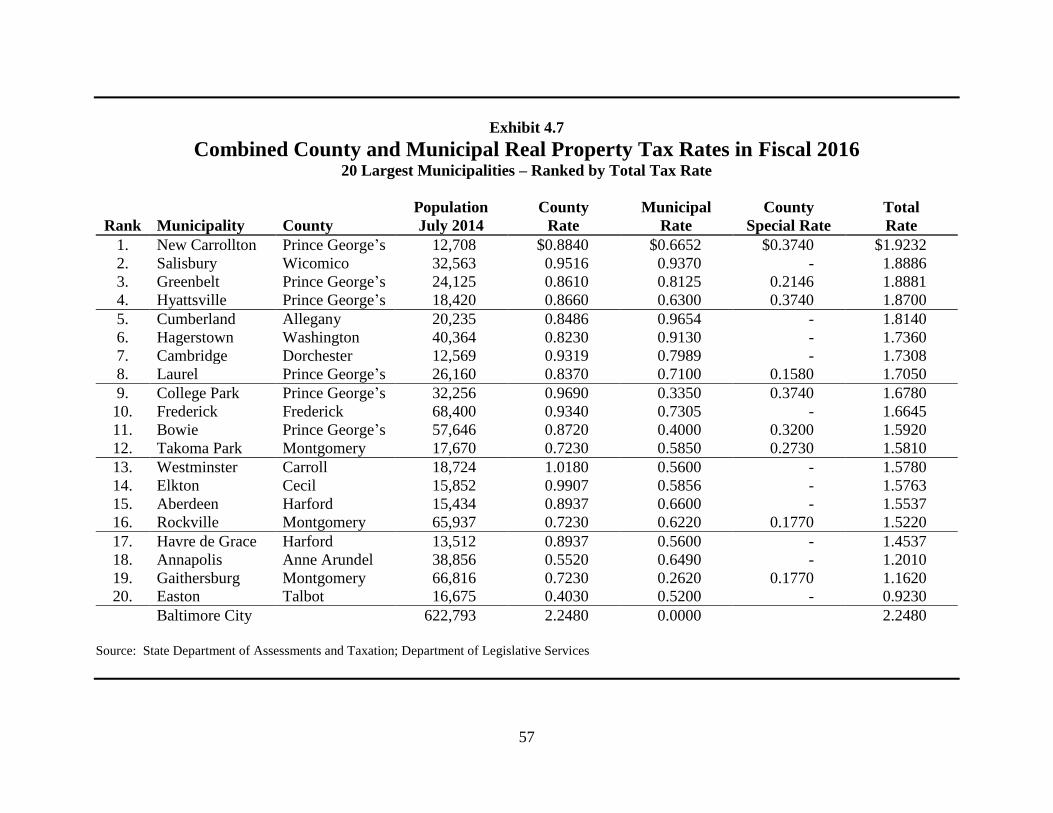
57
Exhibit 4.7
Combined County and Municipal Real Property Tax Rates in Fiscal 2016 20 Largest Municipalities – Ranked by Total Tax Rate
Population County Municipal County Total
Rank Municipality County July 2014 Rate Rate Special Rate Rate
1. New Carrollton Prince George’s 12,708 $0.8840 $0.6652 $0.3740 $1.9232
2. Salisbury Wicomico 32,563 0.9516 0.9370 - 1.8886
3. Greenbelt Prince George’s 24,125 0.8610 0.8125 0.2146 1.8881
4. Hyattsville Prince George’s 18,420 0.8660 0.6300 0.3740 1.8700
5. Cumberland Allegany 20,235 0.8486 0.9654 - 1.8140
6. Hagerstown Washington 40,364 0.8230 0.9130 - 1.7360
7. Cambridge Dorchester 12,569 0.9319 0.7989 - 1.7308
8. Laurel Prince George’s 26,160 0.8370 0.7100 0.1580 1.7050
9. College Park Prince George’s 32,256 0.9690 0.3350 0.3740 1.6780
10. Frederick Frederick 68,400 0.9340 0.7305 - 1.6645
11. Bowie Prince George’s 57,646 0.8720 0.4000 0.3200 1.5920
12. Takoma Park Montgomery 17,670 0.7230 0.5850 0.2730 1.5810
13. Westminster Carroll 18,724 1.0180 0.5600 - 1.5780
14. Elkton Cecil 15,852 0.9907 0.5856 - 1.5763
15. Aberdeen Harford 15,434 0.8937 0.6600 - 1.5537
16. Rockville Montgomery 65,937 0.7230 0.6220 0.1770 1.5220
17. Havre de Grace Harford 13,512 0.8937 0.5600 - 1.4537
18. Annapolis Anne Arundel 38,856 0.5520 0.6490 - 1.2010
19. Gaithersburg Montgomery 66,816 0.7230 0.2620 0.1770 1.1620
20. Easton Talbot 16,675 0.4030 0.5200 - 0.9230
Baltimore City 622,793 2.2480 0.0000 2.2480
Source: State Department of Assessments and Taxation; Department of Legislative Services
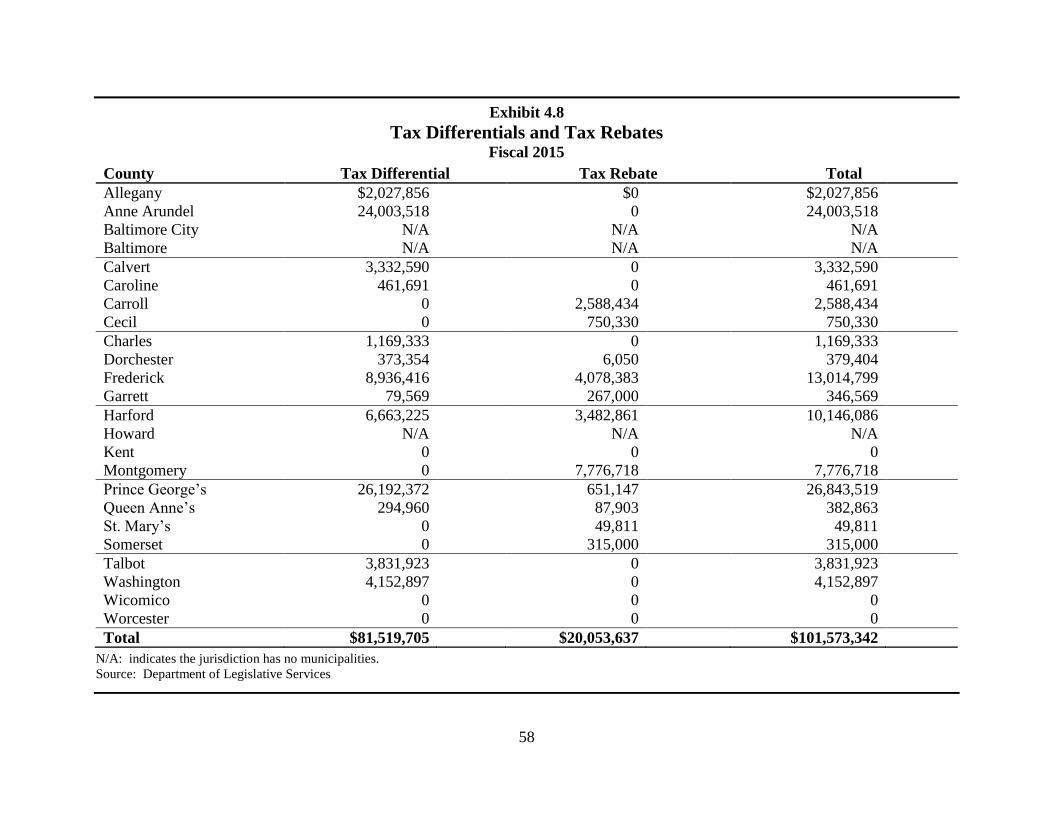
58
Exhibit 4.8
Tax Differentials and Tax Rebates Fiscal 2015
County Tax Differential Tax Rebate Total
Allegany $2,027,856 $0 $2,027,856
Anne Arundel 24,003,518 0 24,003,518
Baltimore City N/A N/A N/A
Baltimore N/A N/A N/A
Calvert 3,332,590 0 3,332,590
Caroline 461,691 0 461,691
Carroll 0 2,588,434 2,588,434
Cecil 0 750,330 750,330
Charles 1,169,333 0 1,169,333
Dorchester 373,354 6,050 379,404
Frederick 8,936,416 4,078,383 13,014,799
Garrett 79,569 267,000 346,569
Harford 6,663,225 3,482,861 10,146,086
Howard N/A N/A N/A
Kent 0 0 0
Montgomery 0 7,776,718 7,776,718
Prince George’s 26,192,372 651,147 26,843,519
Queen Anne’s 294,960 87,903 382,863
St. Mary’s 0 49,811 49,811
Somerset 0 315,000 315,000
Talbot 3,831,923 0 3,831,923
Washington 4,152,897 0 4,152,897
Wicomico 0 0 0
Worcester 0 0 0
Total $81,519,705 $20,053,637 $101,573,342
N/A: indicates the jurisdiction has no municipalities.
Source: Department of Legislative Services
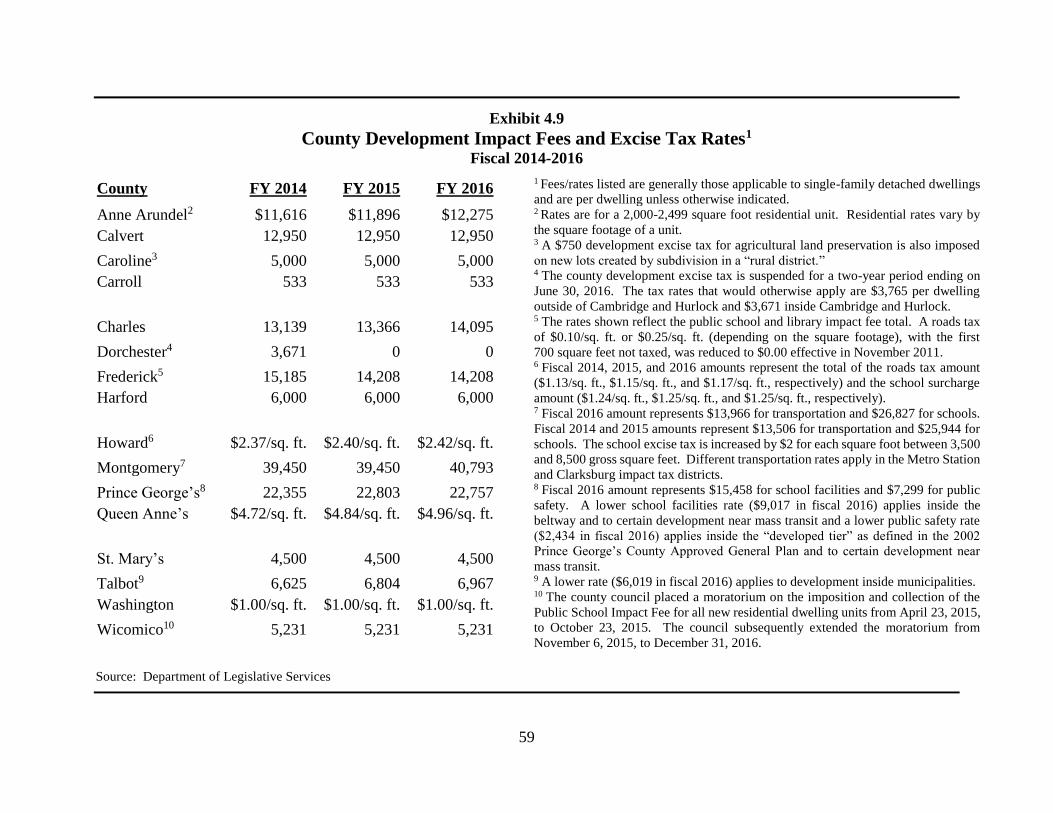
59
Exhibit 4.9
County Development Impact Fees and Excise Tax Rates1
Fiscal 2014-2016
County FY 2014 FY 2015 FY 2016
Anne Arundel2 $11,616 $11,896 $12,275
Calvert 12,950 12,950 12,950
Caroline3 5,000 5,000 5,000
Carroll 533 533 533
Charles 13,139 13,366 14,095
Dorchester4 3,671 0 0
Frederick5 15,185 14,208 14,208
Harford 6,000 6,000 6,000
Howard6 $2.37/sq. ft. $2.40/sq. ft. $2.42/sq. ft.
Montgomery7 39,450 39,450 40,793
Prince George’s8 22,355 22,803 22,757
Queen Anne’s $4.72/sq. ft. $4.84/sq. ft. $4.96/sq. ft.
St. Mary’s 4,500 4,500 4,500
Talbot9 6,625 6,804 6,967
Washington $1.00/sq. ft. $1.00/sq. ft. $1.00/sq. ft.
Wicomico10 5,231 5,231 5,231
1 Fees/rates listed are generally those applicable to single-family detached dwellings
and are per dwelling unless otherwise indicated. 2 Rates are for a 2,000-2,499 square foot residential unit. Residential rates vary by
the square footage of a unit. 3 A $750 development excise tax for agricultural land preservation is also imposed
on new lots created by subdivision in a “rural district.” 4 The county development excise tax is suspended for a two-year period ending on
June 30, 2016. The tax rates that would otherwise apply are $3,765 per dwelling
outside of Cambridge and Hurlock and $3,671 inside Cambridge and Hurlock. 5 The rates shown reflect the public school and library impact fee total. A roads tax
of $0.10/sq. ft. or $0.25/sq. ft. (depending on the square footage), with the first
700 square feet not taxed, was reduced to $0.00 effective in November 2011. 6 Fiscal 2014, 2015, and 2016 amounts represent the total of the roads tax amount
($1.13/sq. ft., $1.15/sq. ft., and $1.17/sq. ft., respectively) and the school surcharge
amount ($1.24/sq. ft., $1.25/sq. ft., and $1.25/sq. ft., respectively). 7 Fiscal 2016 amount represents $13,966 for transportation and $26,827 for schools.
Fiscal 2014 and 2015 amounts represent $13,506 for transportation and $25,944 for
schools. The school excise tax is increased by $2 for each square foot between 3,500
and 8,500 gross square feet. Different transportation rates apply in the Metro Station
and Clarksburg impact tax districts. 8 Fiscal 2016 amount represents $15,458 for school facilities and $7,299 for public
safety. A lower school facilities rate ($9,017 in fiscal 2016) applies inside the
beltway and to certain development near mass transit and a lower public safety rate
($2,434 in fiscal 2016) applies inside the “developed tier” as defined in the 2002
Prince George’s County Approved General Plan and to certain development near
mass transit. 9 A lower rate ($6,019 in fiscal 2016) applies to development inside municipalities. 10 The county council placed a moratorium on the imposition and collection of the
Public School Impact Fee for all new residential dwelling units from April 23, 2015,
to October 23, 2015. The council subsequently extended the moratorium from
November 6, 2015, to December 31, 2016.
Source: Department of Legislative Services
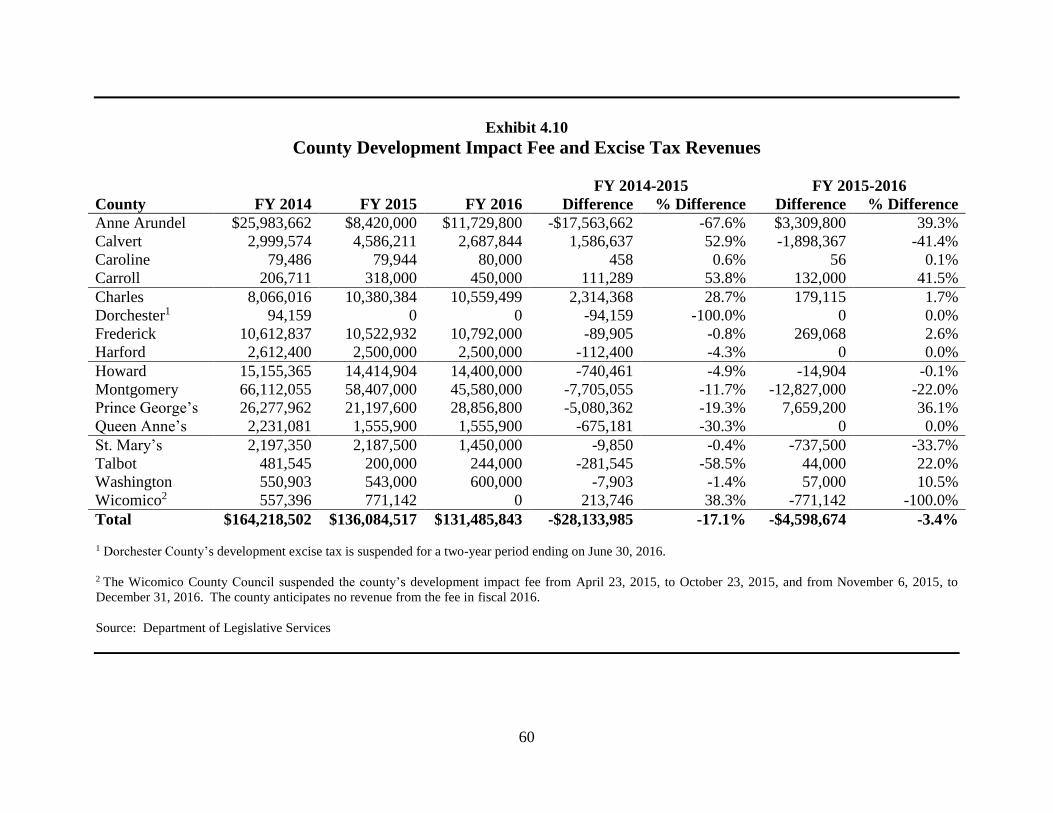
60
Exhibit 4.10
County Development Impact Fee and Excise Tax Revenues
FY 2014-2015 FY 2015-2016
County FY 2014 FY 2015 FY 2016 Difference % Difference Difference % Difference
Anne Arundel $25,983,662 $8,420,000 $11,729,800 -$17,563,662 -67.6% $3,309,800 39.3%
Calvert 2,999,574 4,586,211 2,687,844 1,586,637 52.9% -1,898,367 -41.4%
Caroline 79,486 79,944 80,000 458 0.6% 56 0.1%
Carroll 206,711 318,000 450,000 111,289 53.8% 132,000 41.5%
Charles 8,066,016 10,380,384 10,559,499 2,314,368 28.7% 179,115 1.7%
Dorchester1 94,159 0 0 -94,159 -100.0% 0 0.0%
Frederick 10,612,837 10,522,932 10,792,000 -89,905 -0.8% 269,068 2.6%
Harford 2,612,400 2,500,000 2,500,000 -112,400 -4.3% 0 0.0%
Howard 15,155,365 14,414,904 14,400,000 -740,461 -4.9% -14,904 -0.1%
Montgomery 66,112,055 58,407,000 45,580,000 -7,705,055 -11.7% -12,827,000 -22.0%
Prince George’s 26,277,962 21,197,600 28,856,800 -5,080,362 -19.3% 7,659,200 36.1%
Queen Anne’s 2,231,081 1,555,900 1,555,900 -675,181 -30.3% 0 0.0%
St. Mary’s 2,197,350 2,187,500 1,450,000 -9,850 -0.4% -737,500 -33.7%
Talbot 481,545 200,000 244,000 -281,545 -58.5% 44,000 22.0%
Washington 550,903 543,000 600,000 -7,903 -1.4% 57,000 10.5%
Wicomico2 557,396 771,142 0 213,746 38.3% -771,142 -100.0%
Total $164,218,502 $136,084,517 $131,485,843 -$28,133,985 -17.1% -$4,598,674 -3.4% 1 Dorchester County’s development excise tax is suspended for a two-year period ending on June 30, 2016.
2 The Wicomico County Council suspended the county’s development impact fee from April 23, 2015, to October 23, 2015, and from November 6, 2015, to
December 31, 2016. The county anticipates no revenue from the fee in fiscal 2016.
Source: Department of Legislative Services
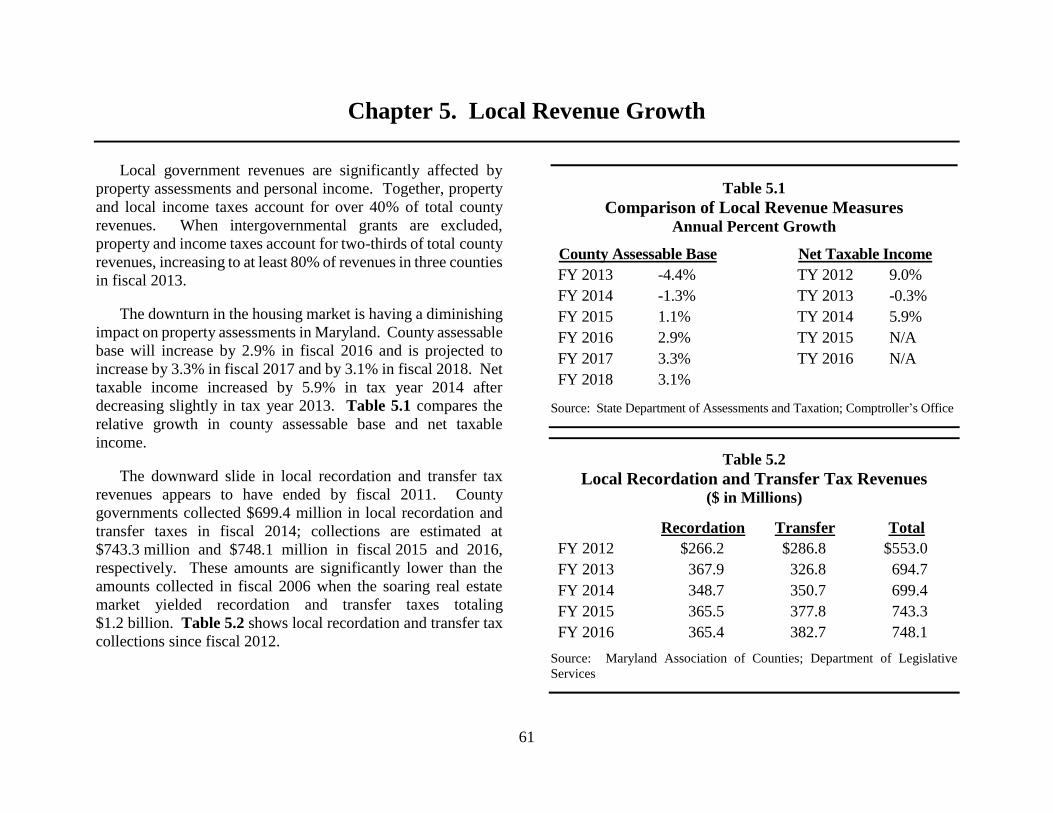
61
Chapter 5. Local Revenue Growth
Local government revenues are significantly affected by
property assessments and personal income. Together, property
and local income taxes account for over 40% of total county
revenues. When intergovernmental grants are excluded,
property and income taxes account for two-thirds of total county
revenues, increasing to at least 80% of revenues in three counties
in fiscal 2013.
The downturn in the housing market is having a diminishing
impact on property assessments in Maryland. County assessable
base will increase by 2.9% in fiscal 2016 and is projected to
increase by 3.3% in fiscal 2017 and by 3.1% in fiscal 2018. Net
taxable income increased by 5.9% in tax year 2014 after
decreasing slightly in tax year 2013. Table 5.1 compares the
relative growth in county assessable base and net taxable
income.
The downward slide in local recordation and transfer tax
revenues appears to have ended by fiscal 2011. County
governments collected $699.4 million in local recordation and
transfer taxes in fiscal 2014; collections are estimated at
$743.3 million and $748.1 million in fiscal 2015 and 2016,
respectively. These amounts are significantly lower than the
amounts collected in fiscal 2006 when the soaring real estate
market yielded recordation and transfer taxes totaling
$1.2 billion. Table 5.2 shows local recordation and transfer tax
collections since fiscal 2012.
Table 5.1
Comparison of Local Revenue Measures Annual Percent Growth
County Assessable Base Net Taxable Income
FY 2013 -4.4% TY 2012 9.0%
FY 2014 -1.3% TY 2013 -0.3%
FY 2015 1.1% TY 2014 5.9%
FY 2016 2.9% TY 2015 N/A
FY 2017 3.3% TY 2016 N/A
FY 2018 3.1%
Source: State Department of Assessments and Taxation; Comptroller’s Office
Table 5.2
Local Recordation and Transfer Tax Revenues ($ in Millions)
Recordation Transfer Total
FY 2012 $266.2 $286.8 $553.0
FY 2013 367.9 326.8 694.7
FY 2014 348.7 350.7 699.4
FY 2015 365.5 377.8 743.3
FY 2016 365.4 382.7 748.1
Source: Maryland Association of Counties; Department of Legislative
Services
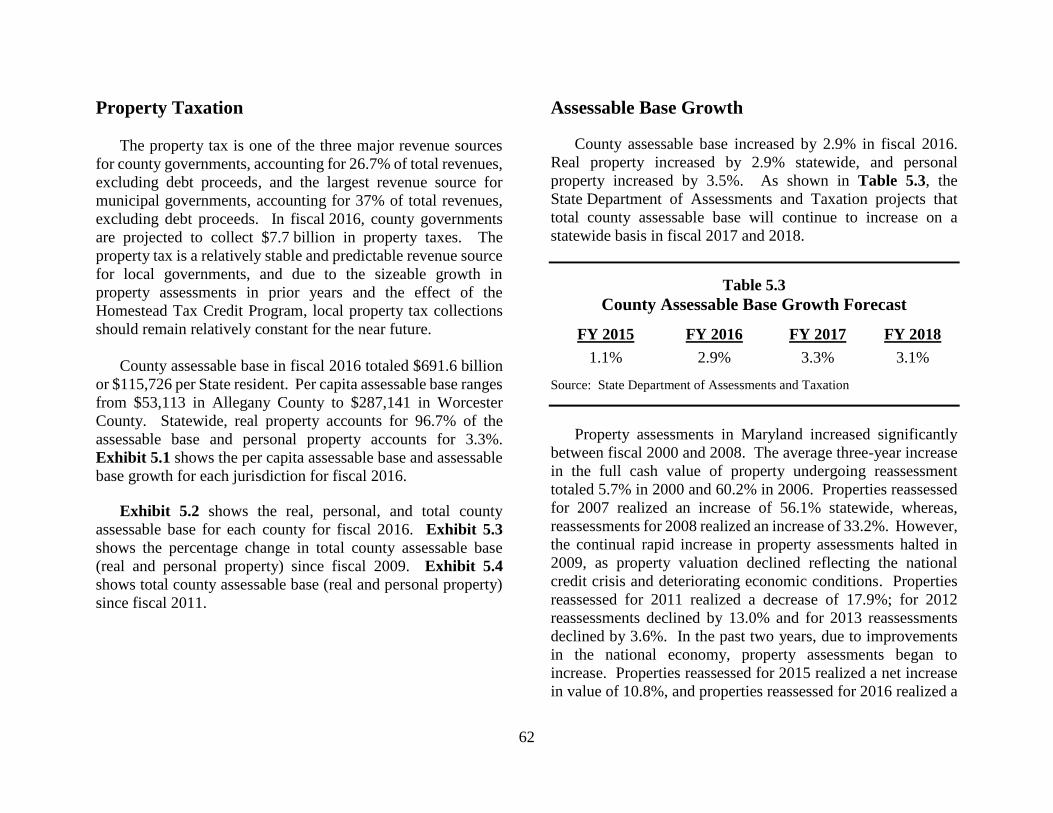
62
Property Taxation
The property tax is one of the three major revenue sources
for county governments, accounting for 26.7% of total revenues,
excluding debt proceeds, and the largest revenue source for
municipal governments, accounting for 37% of total revenues,
excluding debt proceeds. In fiscal 2016, county governments
are projected to collect $7.7 billion in property taxes. The
property tax is a relatively stable and predictable revenue source
for local governments, and due to the sizeable growth in
property assessments in prior years and the effect of the
Homestead Tax Credit Program, local property tax collections
should remain relatively constant for the near future.
County assessable base in fiscal 2016 totaled $691.6 billion
or $115,726 per State resident. Per capita assessable base ranges
from $53,113 in Allegany County to $287,141 in Worcester
County. Statewide, real property accounts for 96.7% of the
assessable base and personal property accounts for 3.3%.
Exhibit 5.1 shows the per capita assessable base and assessable
base growth for each jurisdiction for fiscal 2016.
Exhibit 5.2 shows the real, personal, and total county
assessable base for each county for fiscal 2016. Exhibit 5.3
shows the percentage change in total county assessable base
(real and personal property) since fiscal 2009. Exhibit 5.4
shows total county assessable base (real and personal property)
since fiscal 2011.
Assessable Base Growth
County assessable base increased by 2.9% in fiscal 2016.
Real property increased by 2.9% statewide, and personal
property increased by 3.5%. As shown in Table 5.3, the
State Department of Assessments and Taxation projects that
total county assessable base will continue to increase on a
statewide basis in fiscal 2017 and 2018.
Table 5.3
County Assessable Base Growth Forecast
FY 2015 FY 2016 FY 2017 FY 2018
1.1% 2.9% 3.3% 3.1%
Source: State Department of Assessments and Taxation
Property assessments in Maryland increased significantly
between fiscal 2000 and 2008. The average three-year increase
in the full cash value of property undergoing reassessment
totaled 5.7% in 2000 and 60.2% in 2006. Properties reassessed
for 2007 realized an increase of 56.1% statewide, whereas,
reassessments for 2008 realized an increase of 33.2%. However,
the continual rapid increase in property assessments halted in
2009, as property valuation declined reflecting the national
credit crisis and deteriorating economic conditions. Properties
reassessed for 2011 realized a decrease of 17.9%; for 2012
reassessments declined by 13.0% and for 2013 reassessments
declined by 3.6%. In the past two years, due to improvements
in the national economy, property assessments began to
increase. Properties reassessed for 2015 realized a net increase
in value of 10.8%, and properties reassessed for 2016 realized a
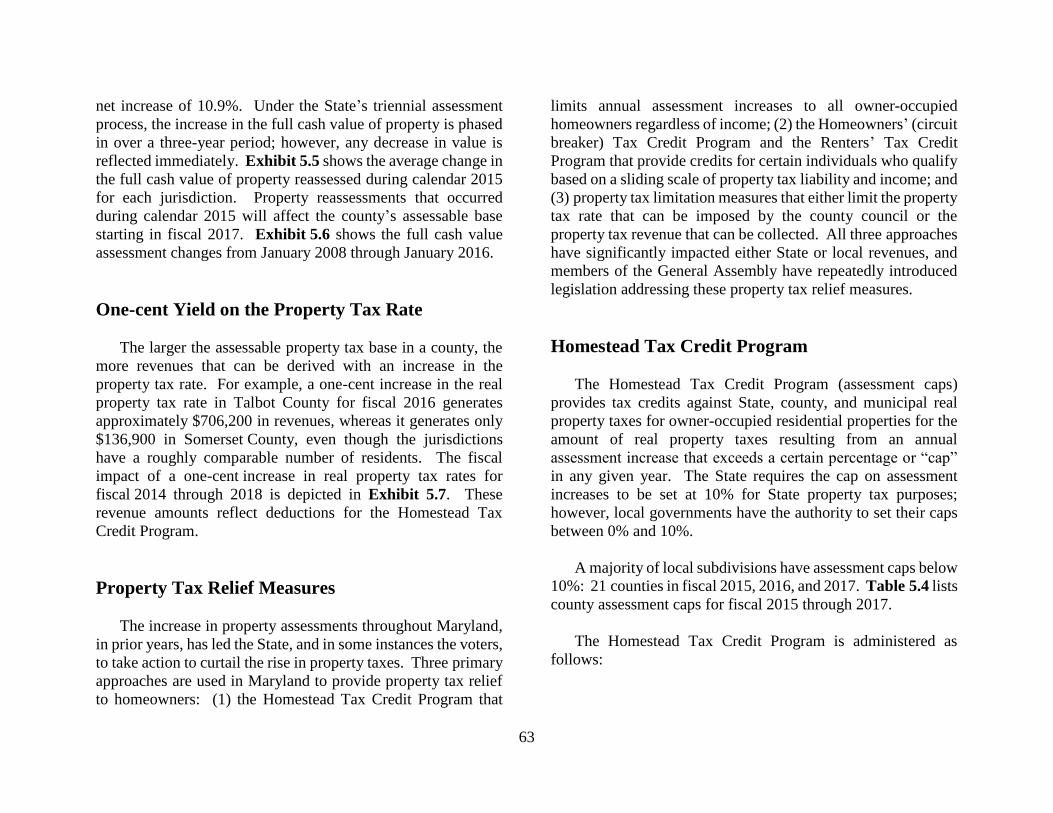
63
net increase of 10.9%. Under the State’s triennial assessment
process, the increase in the full cash value of property is phased
in over a three-year period; however, any decrease in value is
reflected immediately. Exhibit 5.5 shows the average change in
the full cash value of property reassessed during calendar 2015
for each jurisdiction. Property reassessments that occurred
during calendar 2015 will affect the county’s assessable base
starting in fiscal 2017. Exhibit 5.6 shows the full cash value
assessment changes from January 2008 through January 2016.
One-cent Yield on the Property Tax Rate
The larger the assessable property tax base in a county, the
more revenues that can be derived with an increase in the
property tax rate. For example, a one-cent increase in the real
property tax rate in Talbot County for fiscal 2016 generates
approximately $706,200 in revenues, whereas it generates only
$136,900 in Somerset County, even though the jurisdictions
have a roughly comparable number of residents. The fiscal
impact of a one-cent increase in real property tax rates for
fiscal 2014 through 2018 is depicted in Exhibit 5.7. These
revenue amounts reflect deductions for the Homestead Tax
Credit Program.
Property Tax Relief Measures
The increase in property assessments throughout Maryland,
in prior years, has led the State, and in some instances the voters,
to take action to curtail the rise in property taxes. Three primary
approaches are used in Maryland to provide property tax relief
to homeowners: (1) the Homestead Tax Credit Program that
limits annual assessment increases to all owner-occupied
homeowners regardless of income; (2) the Homeowners’ (circuit
breaker) Tax Credit Program and the Renters’ Tax Credit
Program that provide credits for certain individuals who qualify
based on a sliding scale of property tax liability and income; and
(3) property tax limitation measures that either limit the property
tax rate that can be imposed by the county council or the
property tax revenue that can be collected. All three approaches
have significantly impacted either State or local revenues, and
members of the General Assembly have repeatedly introduced
legislation addressing these property tax relief measures.
Homestead Tax Credit Program
The Homestead Tax Credit Program (assessment caps)
provides tax credits against State, county, and municipal real
property taxes for owner-occupied residential properties for the
amount of real property taxes resulting from an annual
assessment increase that exceeds a certain percentage or “cap”
in any given year. The State requires the cap on assessment
increases to be set at 10% for State property tax purposes;
however, local governments have the authority to set their caps
between 0% and 10%.
A majority of local subdivisions have assessment caps below
10%: 21 counties in fiscal 2015, 2016, and 2017. Table 5.4 lists
county assessment caps for fiscal 2015 through 2017.
The Homestead Tax Credit Program is administered as
follows:
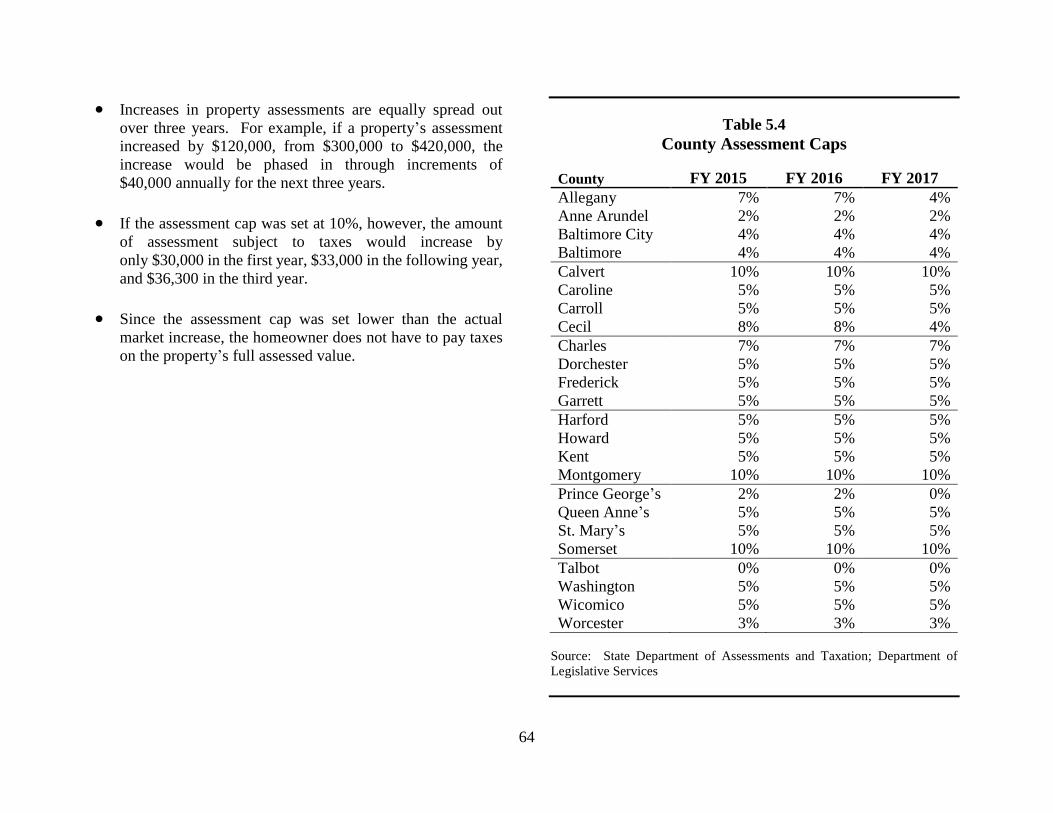
64
Increases in property assessments are equally spread out
over three years. For example, if a property’s assessment
increased by $120,000, from $300,000 to $420,000, the
increase would be phased in through increments of
$40,000 annually for the next three years.
If the assessment cap was set at 10%, however, the amount
of assessment subject to taxes would increase by
only $30,000 in the first year, $33,000 in the following year,
and $36,300 in the third year.
Since the assessment cap was set lower than the actual
market increase, the homeowner does not have to pay taxes
on the property’s full assessed value.
Table 5.4
County Assessment Caps
County FY 2015 FY 2016 FY 2017
Allegany 7% 7% 4%
Anne Arundel 2% 2% 2%
Baltimore City 4% 4% 4%
Baltimore 4% 4% 4%
Calvert 10% 10% 10%
Caroline 5% 5% 5%
Carroll 5% 5% 5%
Cecil 8% 8% 4%
Charles 7% 7% 7%
Dorchester 5% 5% 5%
Frederick 5% 5% 5%
Garrett 5% 5% 5%
Harford 5% 5% 5%
Howard 5% 5% 5%
Kent 5% 5% 5%
Montgomery 10% 10% 10%
Prince George’s 2% 2% 0%
Queen Anne’s 5% 5% 5%
St. Mary’s 5% 5% 5%
Somerset 10% 10% 10%
Talbot 0% 0% 0%
Washington 5% 5% 5%
Wicomico 5% 5% 5%
Worcester 3% 3% 3%
Source: State Department of Assessments and Taxation; Department of
Legislative Services
65
The extent to which the Homestead Tax Credit Program may
actually restrict the ability of a county to raise property tax
revenues depends on the county’s need for revenues from the
property tax and other legal and practical limitations. For
example, a county impacted by a charter-imposed property tax
limitation measure would presumably reduce tax rates to offset
the impact of rising assessments in the absence of the homestead
credit. Exhibits 5.8 and 5.9 show the impact that assessment
caps have had on the counties’ assessable base and local
property tax revenues.
Net Taxable Income
Income tax revenue is the third largest revenue source for
county governments, accounting for 17% of total revenue in
fiscal 2013, excluding debt proceeds. The reliance on income
tax revenue ranges from 5.1% of total revenues in
Worcester County to 23.1% in Montgomery County. Local
income tax revenues are a function of a county’s income tax rate
and the net taxable income base. Net taxable income represents
taxable income after exemptions and deductions have been
subtracted from gross salary and benefits.
Net taxable income for Maryland jurisdictions totaled
$154.8 billion in tax year 2014, ranging from $219.6 million in
Somerset County to $41.1 billion in Montgomery County.
Statewide, net taxable income increased by 5.9% in
tax year 2014, with Baltimore City experiencing the greatest
increase at 10.2%.
Montgomery County has the highest per capita net taxable
income at $39,881 followed by Howard County at $38,362 and
Talbot County at $30,579. Somerset County has the lowest
per capita net taxable income at $8,493. Exhibit 5.10 ranks
local jurisdictions according to per capita net taxable income and
net taxable income growth. Exhibit 5.11 shows the growth in
net taxable income since tax year 2008, while Exhibit 5.12
shows the net taxable income by county for the last seven years.
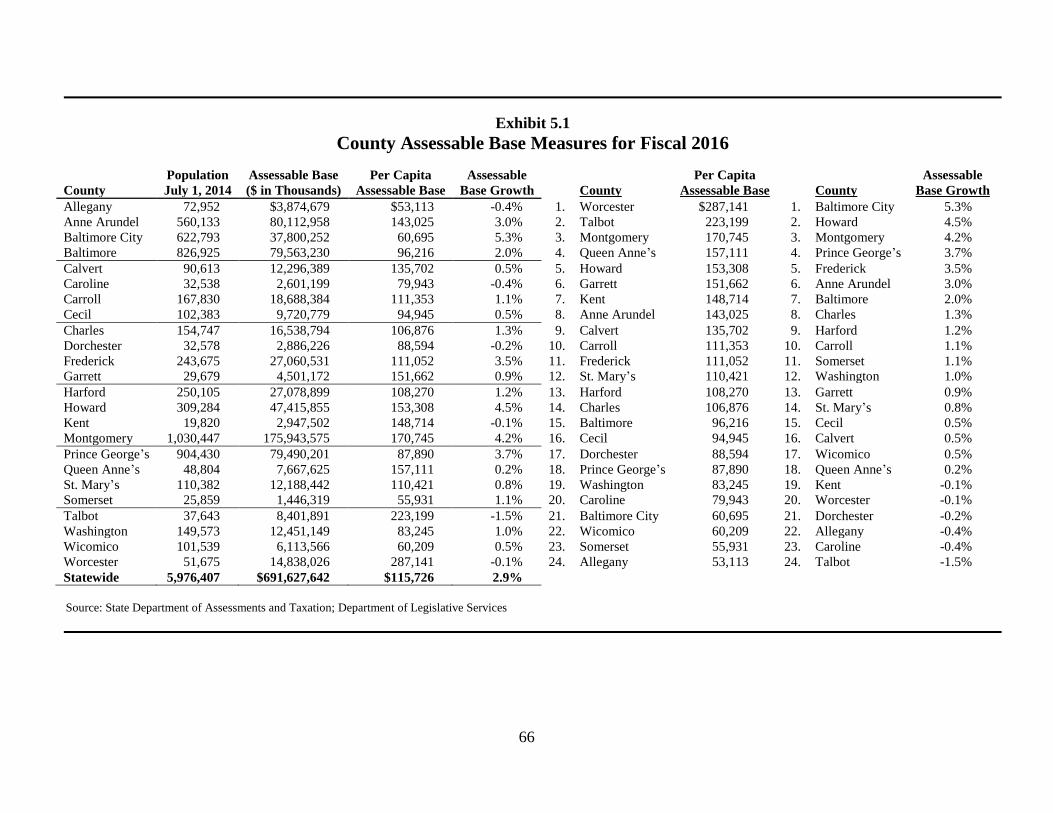
66
Exhibit 5.1
County Assessable Base Measures for Fiscal 2016
Population Assessable Base Per Capita Assessable Per Capita Assessable
County July 1, 2014 ($ in Thousands) Assessable Base Base Growth County Assessable Base County Base Growth
Allegany 72,952 $3,874,679 $53,113 -0.4% 1. Worcester $287,141 1. Baltimore City 5.3%
Anne Arundel 560,133 80,112,958 143,025 3.0% 2. Talbot 223,199 2. Howard 4.5%
Baltimore City 622,793 37,800,252 60,695 5.3% 3. Montgomery 170,745 3. Montgomery 4.2%
Baltimore 826,925 79,563,230 96,216 2.0% 4. Queen Anne’s 157,111 4. Prince George’s 3.7%
Calvert 90,613 12,296,389 135,702 0.5% 5. Howard 153,308 5. Frederick 3.5%
Caroline 32,538 2,601,199 79,943 -0.4% 6. Garrett 151,662 6. Anne Arundel 3.0%
Carroll 167,830 18,688,384 111,353 1.1% 7. Kent 148,714 7. Baltimore 2.0%
Cecil 102,383 9,720,779 94,945 0.5% 8. Anne Arundel 143,025 8. Charles 1.3%
Charles 154,747 16,538,794 106,876 1.3% 9. Calvert 135,702 9. Harford 1.2%
Dorchester 32,578 2,886,226 88,594 -0.2% 10. Carroll 111,353 10. Carroll 1.1%
Frederick 243,675 27,060,531 111,052 3.5% 11. Frederick 111,052 11. Somerset 1.1%
Garrett 29,679 4,501,172 151,662 0.9% 12. St. Mary’s 110,421 12. Washington 1.0%
Harford 250,105 27,078,899 108,270 1.2% 13. Harford 108,270 13. Garrett 0.9%
Howard 309,284 47,415,855 153,308 4.5% 14. Charles 106,876 14. St. Mary’s 0.8%
Kent 19,820 2,947,502 148,714 -0.1% 15. Baltimore 96,216 15. Cecil 0.5%
Montgomery 1,030,447 175,943,575 170,745 4.2% 16. Cecil 94,945 16. Calvert 0.5%
Prince George’s 904,430 79,490,201 87,890 3.7% 17. Dorchester 88,594 17. Wicomico 0.5%
Queen Anne’s 48,804 7,667,625 157,111 0.2% 18. Prince George’s 87,890 18. Queen Anne’s 0.2%
St. Mary’s 110,382 12,188,442 110,421 0.8% 19. Washington 83,245 19. Kent -0.1%
Somerset 25,859 1,446,319 55,931 1.1% 20. Caroline 79,943 20. Worcester -0.1%
Talbot 37,643 8,401,891 223,199 -1.5% 21. Baltimore City 60,695 21. Dorchester -0.2%
Washington 149,573 12,451,149 83,245 1.0% 22. Wicomico 60,209 22. Allegany -0.4%
Wicomico 101,539 6,113,566 60,209 0.5% 23. Somerset 55,931 23. Caroline -0.4%
Worcester 51,675 14,838,026 287,141 -0.1% 24. Allegany 53,113 24. Talbot -1.5%
Statewide 5,976,407 $691,627,642 $115,726 2.9%
Source: State Department of Assessments and Taxation; Department of Legislative Services
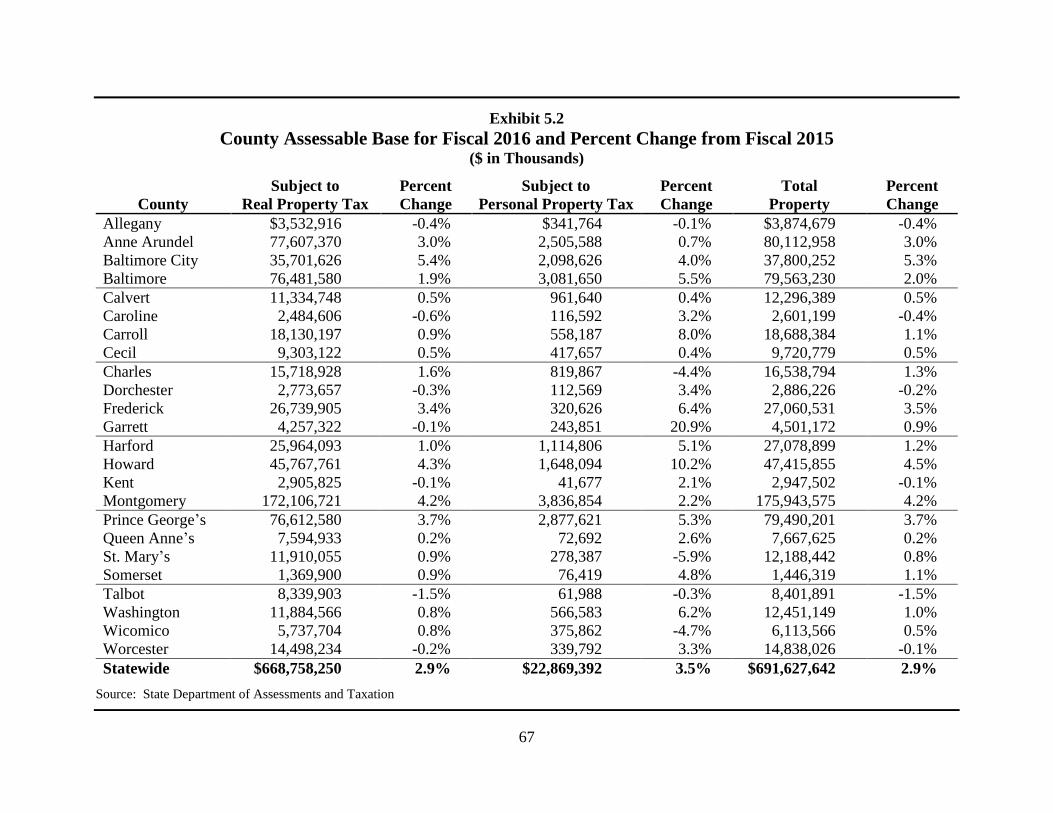
67
Exhibit 5.2
County Assessable Base for Fiscal 2016 and Percent Change from Fiscal 2015 ($ in Thousands)
Subject to Percent Subject to Percent Total Percent
County Real Property Tax Change Personal Property Tax Change Property Change
Allegany $3,532,916 -0.4% $341,764 -0.1% $3,874,679 -0.4%
Anne Arundel 77,607,370 3.0% 2,505,588 0.7% 80,112,958 3.0%
Baltimore City 35,701,626 5.4% 2,098,626 4.0% 37,800,252 5.3%
Baltimore 76,481,580 1.9% 3,081,650 5.5% 79,563,230 2.0%
Calvert 11,334,748 0.5% 961,640 0.4% 12,296,389 0.5%
Caroline 2,484,606 -0.6% 116,592 3.2% 2,601,199 -0.4%
Carroll 18,130,197 0.9% 558,187 8.0% 18,688,384 1.1%
Cecil 9,303,122 0.5% 417,657 0.4% 9,720,779 0.5%
Charles 15,718,928 1.6% 819,867 -4.4% 16,538,794 1.3%
Dorchester 2,773,657 -0.3% 112,569 3.4% 2,886,226 -0.2%
Frederick 26,739,905 3.4% 320,626 6.4% 27,060,531 3.5%
Garrett 4,257,322 -0.1% 243,851 20.9% 4,501,172 0.9%
Harford 25,964,093 1.0% 1,114,806 5.1% 27,078,899 1.2%
Howard 45,767,761 4.3% 1,648,094 10.2% 47,415,855 4.5%
Kent 2,905,825 -0.1% 41,677 2.1% 2,947,502 -0.1%
Montgomery 172,106,721 4.2% 3,836,854 2.2% 175,943,575 4.2%
Prince George’s 76,612,580 3.7% 2,877,621 5.3% 79,490,201 3.7%
Queen Anne’s 7,594,933 0.2% 72,692 2.6% 7,667,625 0.2%
St. Mary’s 11,910,055 0.9% 278,387 -5.9% 12,188,442 0.8%
Somerset 1,369,900 0.9% 76,419 4.8% 1,446,319 1.1%
Talbot 8,339,903 -1.5% 61,988 -0.3% 8,401,891 -1.5%
Washington 11,884,566 0.8% 566,583 6.2% 12,451,149 1.0%
Wicomico 5,737,704 0.8% 375,862 -4.7% 6,113,566 0.5%
Worcester 14,498,234 -0.2% 339,792 3.3% 14,838,026 -0.1%
Statewide $668,758,250 2.9% $22,869,392 3.5% $691,627,642 2.9%
Source: State Department of Assessments and Taxation
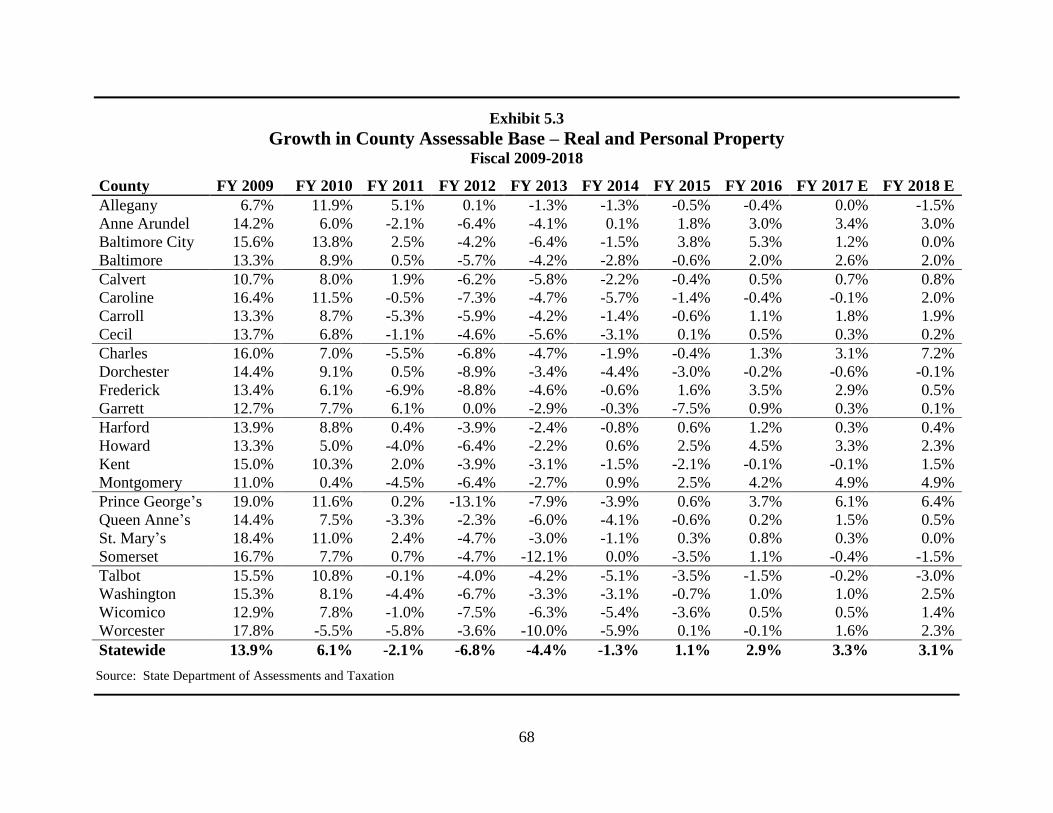
68
Exhibit 5.3
Growth in County Assessable Base – Real and Personal Property Fiscal 2009-2018
County FY 2009 FY 2010 FY 2011 FY 2012 FY 2013 FY 2014 FY 2015 FY 2016 FY 2017 E FY 2018 E
Allegany 6.7% 11.9% 5.1% 0.1% -1.3% -1.3% -0.5% -0.4% 0.0% -1.5%
Anne Arundel 14.2% 6.0% -2.1% -6.4% -4.1% 0.1% 1.8% 3.0% 3.4% 3.0%
Baltimore City 15.6% 13.8% 2.5% -4.2% -6.4% -1.5% 3.8% 5.3% 1.2% 0.0%
Baltimore 13.3% 8.9% 0.5% -5.7% -4.2% -2.8% -0.6% 2.0% 2.6% 2.0%
Calvert 10.7% 8.0% 1.9% -6.2% -5.8% -2.2% -0.4% 0.5% 0.7% 0.8%
Caroline 16.4% 11.5% -0.5% -7.3% -4.7% -5.7% -1.4% -0.4% -0.1% 2.0%
Carroll 13.3% 8.7% -5.3% -5.9% -4.2% -1.4% -0.6% 1.1% 1.8% 1.9%
Cecil 13.7% 6.8% -1.1% -4.6% -5.6% -3.1% 0.1% 0.5% 0.3% 0.2%
Charles 16.0% 7.0% -5.5% -6.8% -4.7% -1.9% -0.4% 1.3% 3.1% 7.2%
Dorchester 14.4% 9.1% 0.5% -8.9% -3.4% -4.4% -3.0% -0.2% -0.6% -0.1%
Frederick 13.4% 6.1% -6.9% -8.8% -4.6% -0.6% 1.6% 3.5% 2.9% 0.5%
Garrett 12.7% 7.7% 6.1% 0.0% -2.9% -0.3% -7.5% 0.9% 0.3% 0.1%
Harford 13.9% 8.8% 0.4% -3.9% -2.4% -0.8% 0.6% 1.2% 0.3% 0.4%
Howard 13.3% 5.0% -4.0% -6.4% -2.2% 0.6% 2.5% 4.5% 3.3% 2.3%
Kent 15.0% 10.3% 2.0% -3.9% -3.1% -1.5% -2.1% -0.1% -0.1% 1.5%
Montgomery 11.0% 0.4% -4.5% -6.4% -2.7% 0.9% 2.5% 4.2% 4.9% 4.9%
Prince George’s 19.0% 11.6% 0.2% -13.1% -7.9% -3.9% 0.6% 3.7% 6.1% 6.4%
Queen Anne’s 14.4% 7.5% -3.3% -2.3% -6.0% -4.1% -0.6% 0.2% 1.5% 0.5%
St. Mary’s 18.4% 11.0% 2.4% -4.7% -3.0% -1.1% 0.3% 0.8% 0.3% 0.0%
Somerset 16.7% 7.7% 0.7% -4.7% -12.1% 0.0% -3.5% 1.1% -0.4% -1.5%
Talbot 15.5% 10.8% -0.1% -4.0% -4.2% -5.1% -3.5% -1.5% -0.2% -3.0%
Washington 15.3% 8.1% -4.4% -6.7% -3.3% -3.1% -0.7% 1.0% 1.0% 2.5%
Wicomico 12.9% 7.8% -1.0% -7.5% -6.3% -5.4% -3.6% 0.5% 0.5% 1.4%
Worcester 17.8% -5.5% -5.8% -3.6% -10.0% -5.9% 0.1% -0.1% 1.6% 2.3%
Statewide 13.9% 6.1% -2.1% -6.8% -4.4% -1.3% 1.1% 2.9% 3.3% 3.1%
Source: State Department of Assessments and Taxation
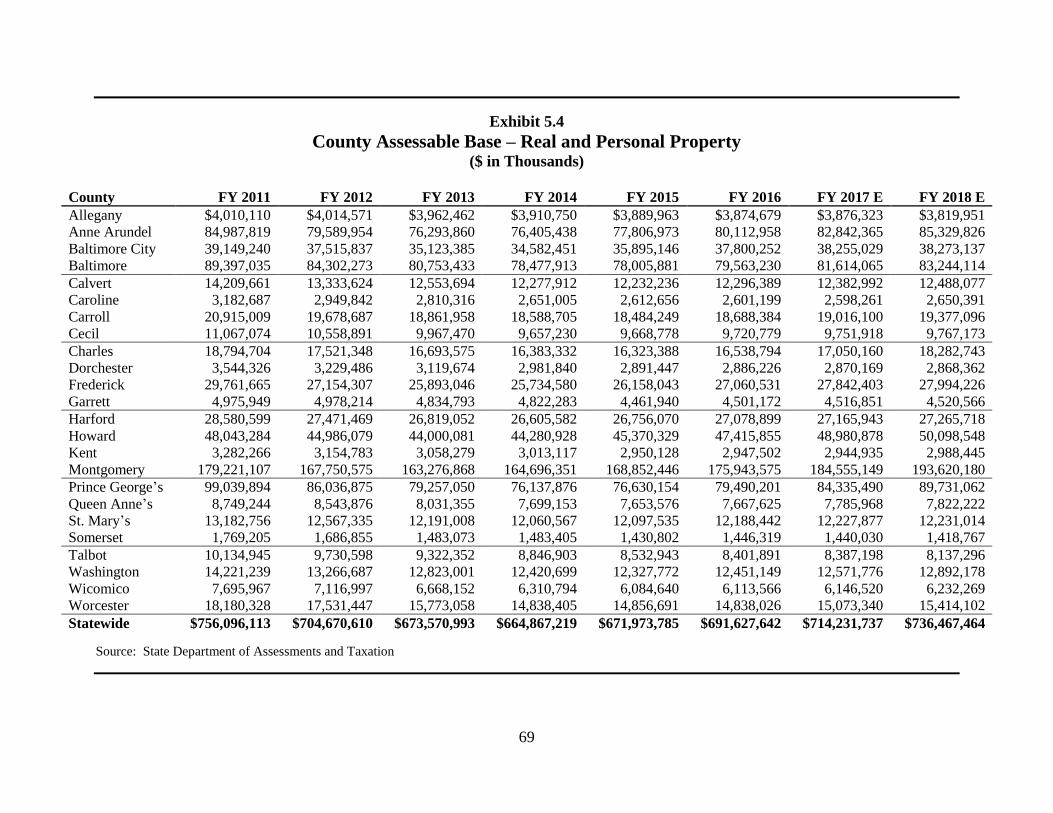
69
Exhibit 5.4
County Assessable Base – Real and Personal Property ($ in Thousands)
County FY 2011 FY 2012 FY 2013 FY 2014 FY 2015 FY 2016 FY 2017 E FY 2018 E
Allegany $4,010,110 $4,014,571 $3,962,462 $3,910,750 $3,889,963 $3,874,679 $3,876,323 $3,819,951
Anne Arundel 84,987,819 79,589,954 76,293,860 76,405,438 77,806,973 80,112,958 82,842,365 85,329,826
Baltimore City 39,149,240 37,515,837 35,123,385 34,582,451 35,895,146 37,800,252 38,255,029 38,273,137
Baltimore 89,397,035 84,302,273 80,753,433 78,477,913 78,005,881 79,563,230 81,614,065 83,244,114
Calvert 14,209,661 13,333,624 12,553,694 12,277,912 12,232,236 12,296,389 12,382,992 12,488,077
Caroline 3,182,687 2,949,842 2,810,316 2,651,005 2,612,656 2,601,199 2,598,261 2,650,391
Carroll 20,915,009 19,678,687 18,861,958 18,588,705 18,484,249 18,688,384 19,016,100 19,377,096
Cecil 11,067,074 10,558,891 9,967,470 9,657,230 9,668,778 9,720,779 9,751,918 9,767,173
Charles 18,794,704 17,521,348 16,693,575 16,383,332 16,323,388 16,538,794 17,050,160 18,282,743
Dorchester 3,544,326 3,229,486 3,119,674 2,981,840 2,891,447 2,886,226 2,870,169 2,868,362
Frederick 29,761,665 27,154,307 25,893,046 25,734,580 26,158,043 27,060,531 27,842,403 27,994,226
Garrett 4,975,949 4,978,214 4,834,793 4,822,283 4,461,940 4,501,172 4,516,851 4,520,566
Harford 28,580,599 27,471,469 26,819,052 26,605,582 26,756,070 27,078,899 27,165,943 27,265,718
Howard 48,043,284 44,986,079 44,000,081 44,280,928 45,370,329 47,415,855 48,980,878 50,098,548
Kent 3,282,266 3,154,783 3,058,279 3,013,117 2,950,128 2,947,502 2,944,935 2,988,445
Montgomery 179,221,107 167,750,575 163,276,868 164,696,351 168,852,446 175,943,575 184,555,149 193,620,180
Prince George’s 99,039,894 86,036,875 79,257,050 76,137,876 76,630,154 79,490,201 84,335,490 89,731,062
Queen Anne’s 8,749,244 8,543,876 8,031,355 7,699,153 7,653,576 7,667,625 7,785,968 7,822,222
St. Mary’s 13,182,756 12,567,335 12,191,008 12,060,567 12,097,535 12,188,442 12,227,877 12,231,014
Somerset 1,769,205 1,686,855 1,483,073 1,483,405 1,430,802 1,446,319 1,440,030 1,418,767
Talbot 10,134,945 9,730,598 9,322,352 8,846,903 8,532,943 8,401,891 8,387,198 8,137,296
Washington 14,221,239 13,266,687 12,823,001 12,420,699 12,327,772 12,451,149 12,571,776 12,892,178
Wicomico 7,695,967 7,116,997 6,668,152 6,310,794 6,084,640 6,113,566 6,146,520 6,232,269
Worcester 18,180,328 17,531,447 15,773,058 14,838,405 14,856,691 14,838,026 15,073,340 15,414,102
Statewide $756,096,113 $704,670,610 $673,570,993 $664,867,219 $671,973,785 $691,627,642 $714,231,737 $736,467,464
Source: State Department of Assessments and Taxation
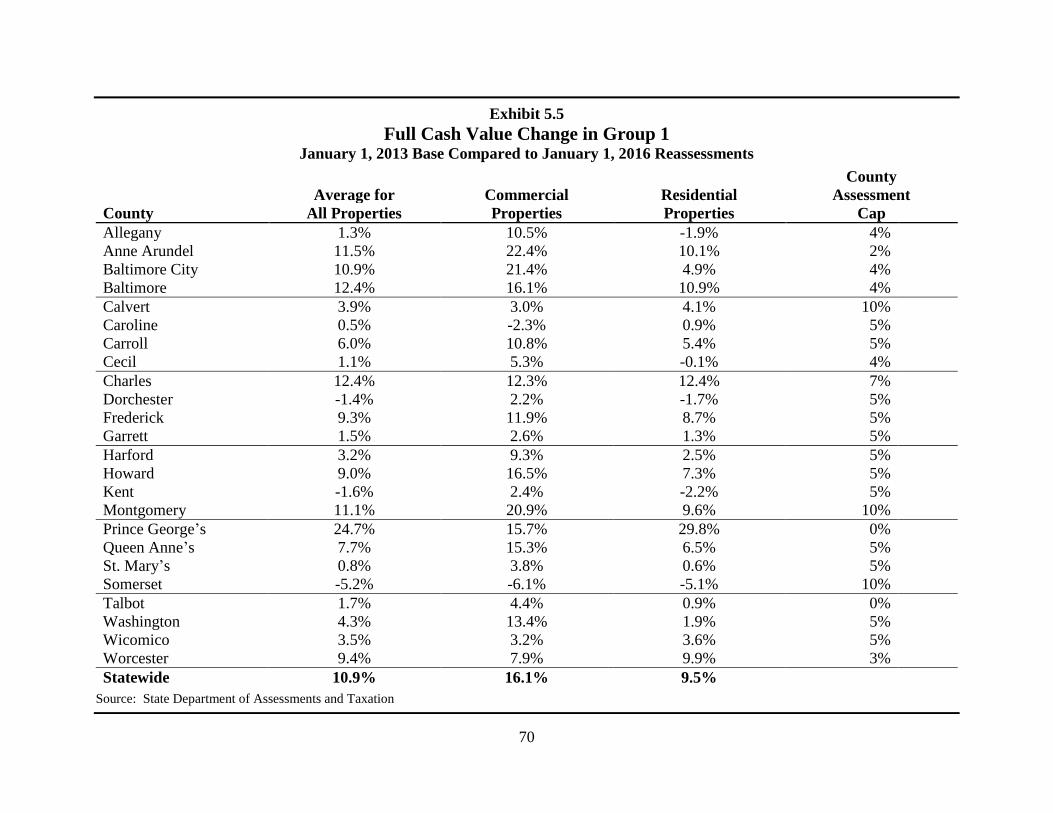
70
Exhibit 5.5
Full Cash Value Change in Group 1
January 1, 2013 Base Compared to January 1, 2016 Reassessments
County
Average for Commercial Residential Assessment
County All Properties Properties Properties Cap
Allegany 1.3% 10.5% -1.9% 4%
Anne Arundel 11.5% 22.4% 10.1% 2%
Baltimore City 10.9% 21.4% 4.9% 4%
Baltimore 12.4% 16.1% 10.9% 4%
Calvert 3.9% 3.0% 4.1% 10%
Caroline 0.5% -2.3% 0.9% 5%
Carroll 6.0% 10.8% 5.4% 5%
Cecil 1.1% 5.3% -0.1% 4%
Charles 12.4% 12.3% 12.4% 7%
Dorchester -1.4% 2.2% -1.7% 5%
Frederick 9.3% 11.9% 8.7% 5%
Garrett 1.5% 2.6% 1.3% 5%
Harford 3.2% 9.3% 2.5% 5%
Howard 9.0% 16.5% 7.3% 5%
Kent -1.6% 2.4% -2.2% 5%
Montgomery 11.1% 20.9% 9.6% 10%
Prince George’s 24.7% 15.7% 29.8% 0%
Queen Anne’s 7.7% 15.3% 6.5% 5%
St. Mary’s 0.8% 3.8% 0.6% 5%
Somerset -5.2% -6.1% -5.1% 10%
Talbot 1.7% 4.4% 0.9% 0%
Washington 4.3% 13.4% 1.9% 5%
Wicomico 3.5% 3.2% 3.6% 5%
Worcester 9.4% 7.9% 9.9% 3%
Statewide 10.9% 16.1% 9.5%
Source: State Department of Assessments and Taxation
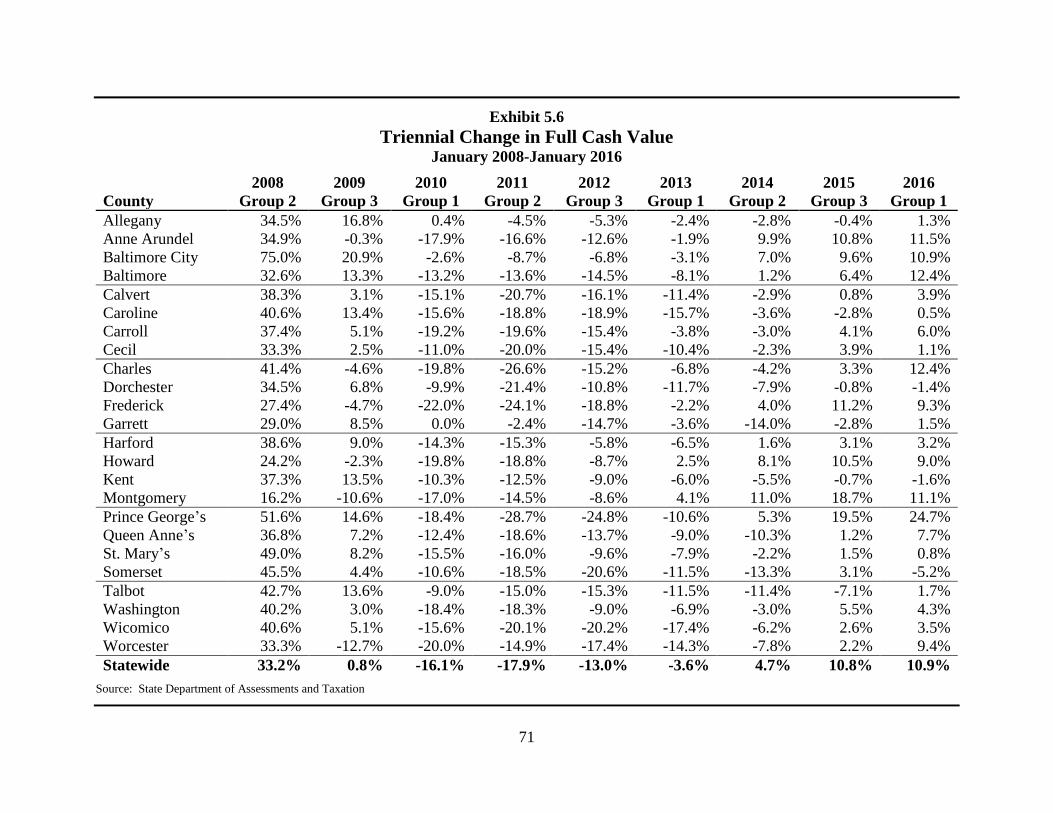
71
Exhibit 5.6
Triennial Change in Full Cash Value January 2008-January 2016
2008 2009 2010 2011 2012 2013 2014 2015 2016
County Group 2 Group 3 Group 1 Group 2 Group 3 Group 1 Group 2 Group 3 Group 1
Allegany 34.5% 16.8% 0.4% -4.5% -5.3% -2.4% -2.8% -0.4% 1.3%
Anne Arundel 34.9% -0.3% -17.9% -16.6% -12.6% -1.9% 9.9% 10.8% 11.5%
Baltimore City 75.0% 20.9% -2.6% -8.7% -6.8% -3.1% 7.0% 9.6% 10.9%
Baltimore 32.6% 13.3% -13.2% -13.6% -14.5% -8.1% 1.2% 6.4% 12.4%
Calvert 38.3% 3.1% -15.1% -20.7% -16.1% -11.4% -2.9% 0.8% 3.9%
Caroline 40.6% 13.4% -15.6% -18.8% -18.9% -15.7% -3.6% -2.8% 0.5%
Carroll 37.4% 5.1% -19.2% -19.6% -15.4% -3.8% -3.0% 4.1% 6.0%
Cecil 33.3% 2.5% -11.0% -20.0% -15.4% -10.4% -2.3% 3.9% 1.1%
Charles 41.4% -4.6% -19.8% -26.6% -15.2% -6.8% -4.2% 3.3% 12.4%
Dorchester 34.5% 6.8% -9.9% -21.4% -10.8% -11.7% -7.9% -0.8% -1.4%
Frederick 27.4% -4.7% -22.0% -24.1% -18.8% -2.2% 4.0% 11.2% 9.3%
Garrett 29.0% 8.5% 0.0% -2.4% -14.7% -3.6% -14.0% -2.8% 1.5%
Harford 38.6% 9.0% -14.3% -15.3% -5.8% -6.5% 1.6% 3.1% 3.2%
Howard 24.2% -2.3% -19.8% -18.8% -8.7% 2.5% 8.1% 10.5% 9.0%
Kent 37.3% 13.5% -10.3% -12.5% -9.0% -6.0% -5.5% -0.7% -1.6%
Montgomery 16.2% -10.6% -17.0% -14.5% -8.6% 4.1% 11.0% 18.7% 11.1%
Prince George’s 51.6% 14.6% -18.4% -28.7% -24.8% -10.6% 5.3% 19.5% 24.7%
Queen Anne’s 36.8% 7.2% -12.4% -18.6% -13.7% -9.0% -10.3% 1.2% 7.7%
St. Mary’s 49.0% 8.2% -15.5% -16.0% -9.6% -7.9% -2.2% 1.5% 0.8%
Somerset 45.5% 4.4% -10.6% -18.5% -20.6% -11.5% -13.3% 3.1% -5.2%
Talbot 42.7% 13.6% -9.0% -15.0% -15.3% -11.5% -11.4% -7.1% 1.7%
Washington 40.2% 3.0% -18.4% -18.3% -9.0% -6.9% -3.0% 5.5% 4.3%
Wicomico 40.6% 5.1% -15.6% -20.1% -20.2% -17.4% -6.2% 2.6% 3.5%
Worcester 33.3% -12.7% -20.0% -14.9% -17.4% -14.3% -7.8% 2.2% 9.4%
Statewide 33.2% 0.8% -16.1% -17.9% -13.0% -3.6% 4.7% 10.8% 10.9%
Source: State Department of Assessments and Taxation
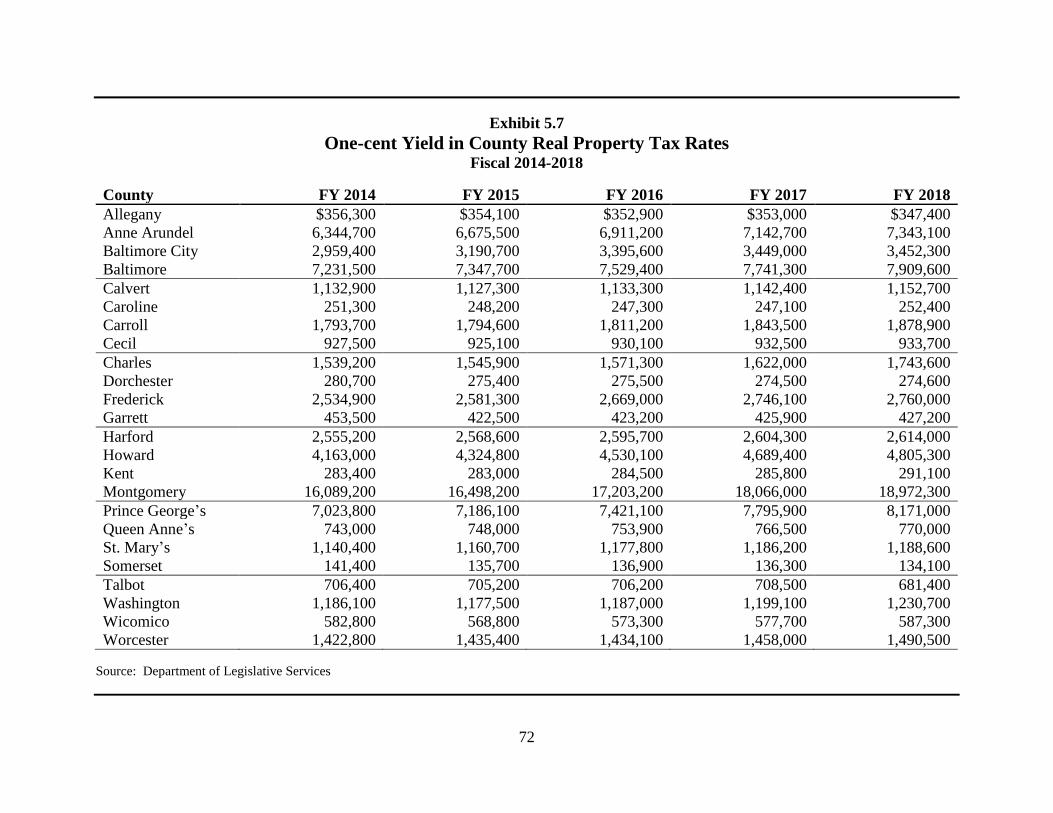
72
Exhibit 5.7
One-cent Yield in County Real Property Tax Rates Fiscal 2014-2018
County FY 2014 FY 2015 FY 2016 FY 2017 FY 2018
Allegany $356,300 $354,100 $352,900 $353,000 $347,400
Anne Arundel 6,344,700 6,675,500 6,911,200 7,142,700 7,343,100
Baltimore City 2,959,400 3,190,700 3,395,600 3,449,000 3,452,300
Baltimore 7,231,500 7,347,700 7,529,400 7,741,300 7,909,600
Calvert 1,132,900 1,127,300 1,133,300 1,142,400 1,152,700
Caroline 251,300 248,200 247,300 247,100 252,400
Carroll 1,793,700 1,794,600 1,811,200 1,843,500 1,878,900
Cecil 927,500 925,100 930,100 932,500 933,700
Charles 1,539,200 1,545,900 1,571,300 1,622,000 1,743,600
Dorchester 280,700 275,400 275,500 274,500 274,600
Frederick 2,534,900 2,581,300 2,669,000 2,746,100 2,760,000
Garrett 453,500 422,500 423,200 425,900 427,200
Harford 2,555,200 2,568,600 2,595,700 2,604,300 2,614,000
Howard 4,163,000 4,324,800 4,530,100 4,689,400 4,805,300
Kent 283,400 283,000 284,500 285,800 291,100
Montgomery 16,089,200 16,498,200 17,203,200 18,066,000 18,972,300
Prince George’s 7,023,800 7,186,100 7,421,100 7,795,900 8,171,000
Queen Anne’s 743,000 748,000 753,900 766,500 770,000
St. Mary’s 1,140,400 1,160,700 1,177,800 1,186,200 1,188,600
Somerset 141,400 135,700 136,900 136,300 134,100
Talbot 706,400 705,200 706,200 708,500 681,400
Washington 1,186,100 1,177,500 1,187,000 1,199,100 1,230,700
Wicomico 582,800 568,800 573,300 577,700 587,300
Worcester 1,422,800 1,435,400 1,434,100 1,458,000 1,490,500
Source: Department of Legislative Services
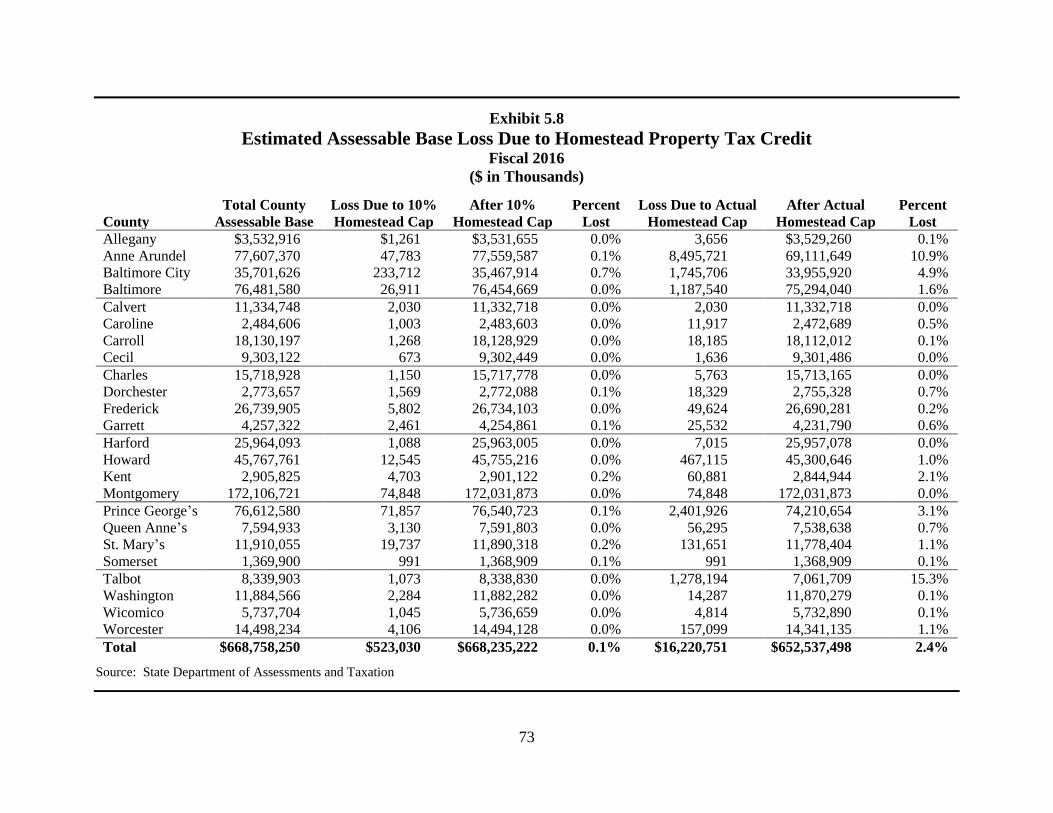
73
Exhibit 5.8
Estimated Assessable Base Loss Due to Homestead Property Tax Credit Fiscal 2016
($ in Thousands)
Total County Loss Due to 10% After 10% Percent Loss Due to Actual After Actual Percent
County Assessable Base Homestead Cap Homestead Cap Lost Homestead Cap Homestead Cap Lost
Allegany $3,532,916 $1,261 $3,531,655 0.0% 3,656 $3,529,260 0.1%
Anne Arundel 77,607,370 47,783 77,559,587 0.1% 8,495,721 69,111,649 10.9%
Baltimore City 35,701,626 233,712 35,467,914 0.7% 1,745,706 33,955,920 4.9%
Baltimore 76,481,580 26,911 76,454,669 0.0% 1,187,540 75,294,040 1.6%
Calvert 11,334,748 2,030 11,332,718 0.0% 2,030 11,332,718 0.0%
Caroline 2,484,606 1,003 2,483,603 0.0% 11,917 2,472,689 0.5%
Carroll 18,130,197 1,268 18,128,929 0.0% 18,185 18,112,012 0.1%
Cecil 9,303,122 673 9,302,449 0.0% 1,636 9,301,486 0.0%
Charles 15,718,928 1,150 15,717,778 0.0% 5,763 15,713,165 0.0%
Dorchester 2,773,657 1,569 2,772,088 0.1% 18,329 2,755,328 0.7%
Frederick 26,739,905 5,802 26,734,103 0.0% 49,624 26,690,281 0.2%
Garrett 4,257,322 2,461 4,254,861 0.1% 25,532 4,231,790 0.6%
Harford 25,964,093 1,088 25,963,005 0.0% 7,015 25,957,078 0.0%
Howard 45,767,761 12,545 45,755,216 0.0% 467,115 45,300,646 1.0%
Kent 2,905,825 4,703 2,901,122 0.2% 60,881 2,844,944 2.1%
Montgomery 172,106,721 74,848 172,031,873 0.0% 74,848 172,031,873 0.0%
Prince George’s 76,612,580 71,857 76,540,723 0.1% 2,401,926 74,210,654 3.1%
Queen Anne’s 7,594,933 3,130 7,591,803 0.0% 56,295 7,538,638 0.7%
St. Mary’s 11,910,055 19,737 11,890,318 0.2% 131,651 11,778,404 1.1%
Somerset 1,369,900 991 1,368,909 0.1% 991 1,368,909 0.1%
Talbot 8,339,903 1,073 8,338,830 0.0% 1,278,194 7,061,709 15.3%
Washington 11,884,566 2,284 11,882,282 0.0% 14,287 11,870,279 0.1%
Wicomico 5,737,704 1,045 5,736,659 0.0% 4,814 5,732,890 0.1%
Worcester 14,498,234 4,106 14,494,128 0.0% 157,099 14,341,135 1.1%
Total $668,758,250 $523,030 $668,235,222 0.1% $16,220,751 $652,537,498 2.4%
Source: State Department of Assessments and Taxation
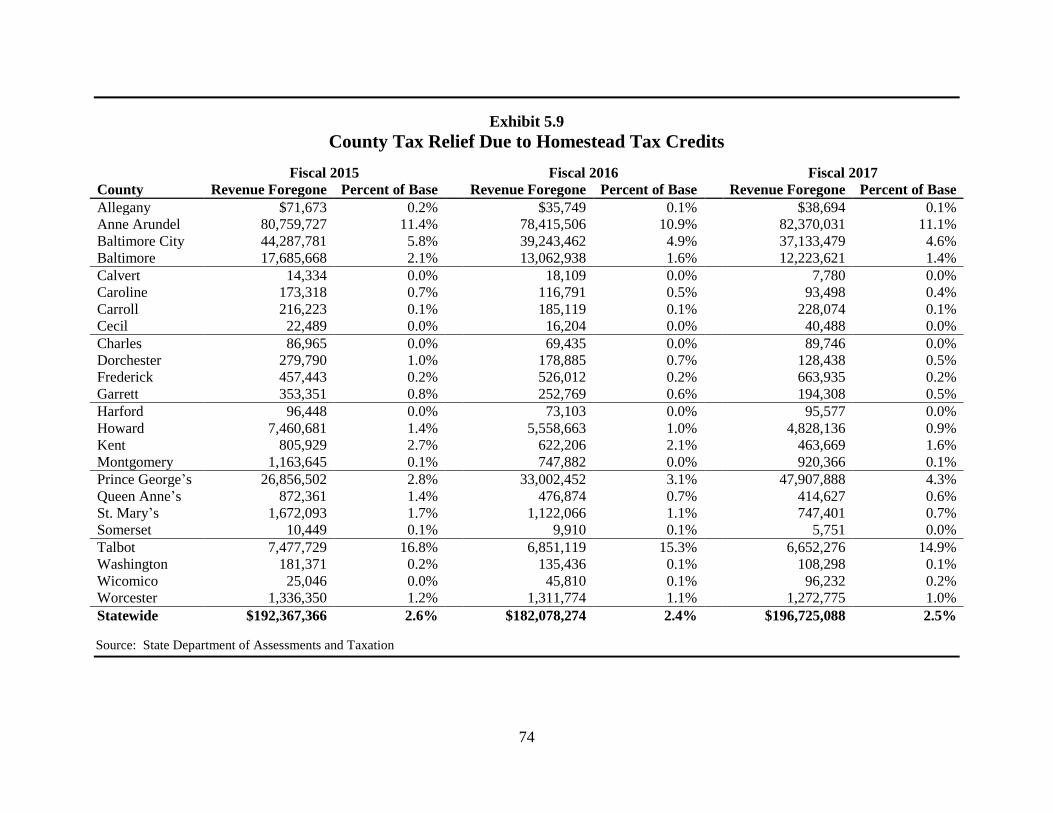
74
Exhibit 5.9
County Tax Relief Due to Homestead Tax Credits
Fiscal 2015 Fiscal 2016 Fiscal 2017
County Revenue Foregone Percent of Base Revenue Foregone Percent of Base Revenue Foregone Percent of Base
Allegany $71,673 0.2% $35,749 0.1% $38,694 0.1%
Anne Arundel 80,759,727 11.4% 78,415,506 10.9% 82,370,031 11.1%
Baltimore City 44,287,781 5.8% 39,243,462 4.9% 37,133,479 4.6%
Baltimore 17,685,668 2.1% 13,062,938 1.6% 12,223,621 1.4%
Calvert 14,334 0.0% 18,109 0.0% 7,780 0.0%
Caroline 173,318 0.7% 116,791 0.5% 93,498 0.4%
Carroll 216,223 0.1% 185,119 0.1% 228,074 0.1%
Cecil 22,489 0.0% 16,204 0.0% 40,488 0.0%
Charles 86,965 0.0% 69,435 0.0% 89,746 0.0%
Dorchester 279,790 1.0% 178,885 0.7% 128,438 0.5%
Frederick 457,443 0.2% 526,012 0.2% 663,935 0.2%
Garrett 353,351 0.8% 252,769 0.6% 194,308 0.5%
Harford 96,448 0.0% 73,103 0.0% 95,577 0.0%
Howard 7,460,681 1.4% 5,558,663 1.0% 4,828,136 0.9%
Kent 805,929 2.7% 622,206 2.1% 463,669 1.6%
Montgomery 1,163,645 0.1% 747,882 0.0% 920,366 0.1%
Prince George’s 26,856,502 2.8% 33,002,452 3.1% 47,907,888 4.3%
Queen Anne’s 872,361 1.4% 476,874 0.7% 414,627 0.6%
St. Mary’s 1,672,093 1.7% 1,122,066 1.1% 747,401 0.7%
Somerset 10,449 0.1% 9,910 0.1% 5,751 0.0%
Talbot 7,477,729 16.8% 6,851,119 15.3% 6,652,276 14.9%
Washington 181,371 0.2% 135,436 0.1% 108,298 0.1%
Wicomico 25,046 0.0% 45,810 0.1% 96,232 0.2%
Worcester 1,336,350 1.2% 1,311,774 1.1% 1,272,775 1.0%
Statewide $192,367,366 2.6% $182,078,274 2.4% $196,725,088 2.5%
Source: State Department of Assessments and Taxation
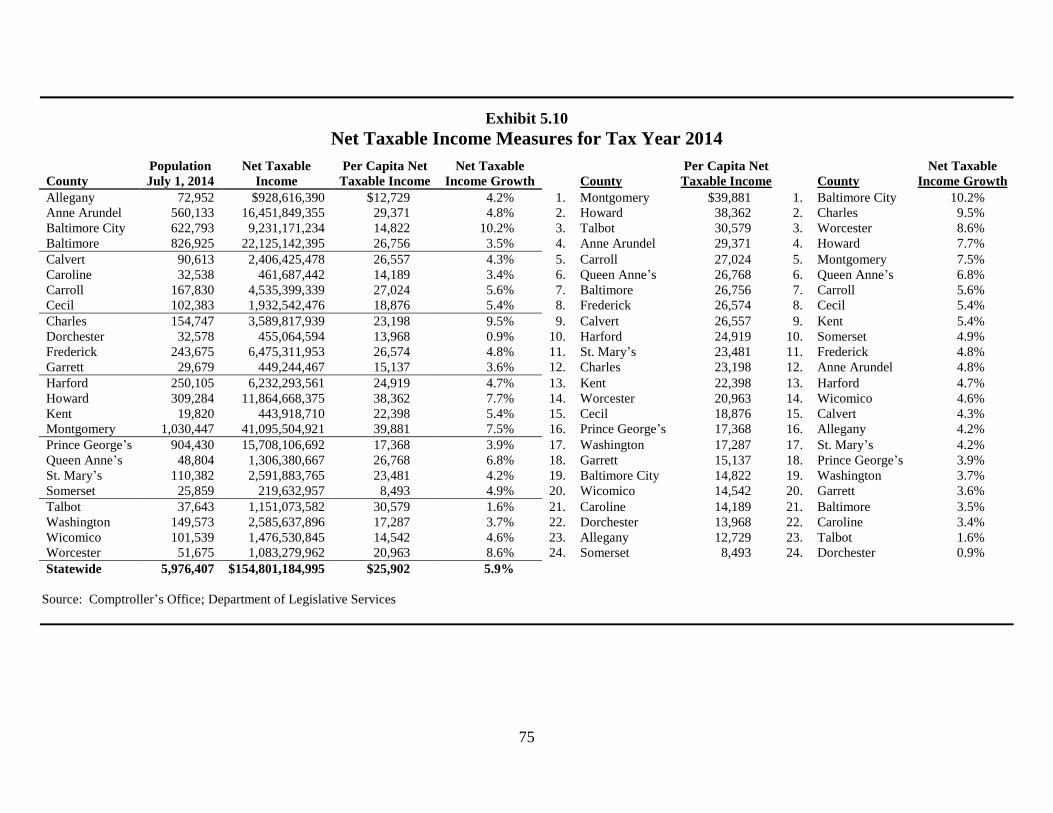
75
Exhibit 5.10
Net Taxable Income Measures for Tax Year 2014
Population Net Taxable Per Capita Net Net Taxable Per Capita Net Net Taxable
County July 1, 2014 Income Taxable Income Income Growth County Taxable Income County Income Growth
Allegany 72,952 $928,616,390 $12,729 4.2% 1. Montgomery $39,881 1. Baltimore City 10.2%
Anne Arundel 560,133 16,451,849,355 29,371 4.8% 2. Howard 38,362 2. Charles 9.5%
Baltimore City 622,793 9,231,171,234 14,822 10.2% 3. Talbot 30,579 3. Worcester 8.6%
Baltimore 826,925 22,125,142,395 26,756 3.5% 4. Anne Arundel 29,371 4. Howard 7.7%
Calvert 90,613 2,406,425,478 26,557 4.3% 5. Carroll 27,024 5. Montgomery 7.5%
Caroline 32,538 461,687,442 14,189 3.4% 6. Queen Anne’s 26,768 6. Queen Anne’s 6.8%
Carroll 167,830 4,535,399,339 27,024 5.6% 7. Baltimore 26,756 7. Carroll 5.6%
Cecil 102,383 1,932,542,476 18,876 5.4% 8. Frederick 26,574 8. Cecil 5.4%
Charles 154,747 3,589,817,939 23,198 9.5% 9. Calvert 26,557 9. Kent 5.4%
Dorchester 32,578 455,064,594 13,968 0.9% 10. Harford 24,919 10. Somerset 4.9%
Frederick 243,675 6,475,311,953 26,574 4.8% 11. St. Mary’s 23,481 11. Frederick 4.8%
Garrett 29,679 449,244,467 15,137 3.6% 12. Charles 23,198 12. Anne Arundel 4.8%
Harford 250,105 6,232,293,561 24,919 4.7% 13. Kent 22,398 13. Harford 4.7%
Howard 309,284 11,864,668,375 38,362 7.7% 14. Worcester 20,963 14. Wicomico 4.6%
Kent 19,820 443,918,710 22,398 5.4% 15. Cecil 18,876 15. Calvert 4.3%
Montgomery 1,030,447 41,095,504,921 39,881 7.5% 16. Prince George’s 17,368 16. Allegany 4.2%
Prince George’s 904,430 15,708,106,692 17,368 3.9% 17. Washington 17,287 17. St. Mary’s 4.2%
Queen Anne’s 48,804 1,306,380,667 26,768 6.8% 18. Garrett 15,137 18. Prince George’s 3.9%
St. Mary’s 110,382 2,591,883,765 23,481 4.2% 19. Baltimore City 14,822 19. Washington 3.7%
Somerset 25,859 219,632,957 8,493 4.9% 20. Wicomico 14,542 20. Garrett 3.6%
Talbot 37,643 1,151,073,582 30,579 1.6% 21. Caroline 14,189 21. Baltimore 3.5%
Washington 149,573 2,585,637,896 17,287 3.7% 22. Dorchester 13,968 22. Caroline 3.4%
Wicomico 101,539 1,476,530,845 14,542 4.6% 23. Allegany 12,729 23. Talbot 1.6%
Worcester 51,675 1,083,279,962 20,963 8.6% 24. Somerset 8,493 24. Dorchester 0.9%
Statewide 5,976,407 $154,801,184,995 $25,902 5.9%
Source: Comptroller’s Office; Department of Legislative Services
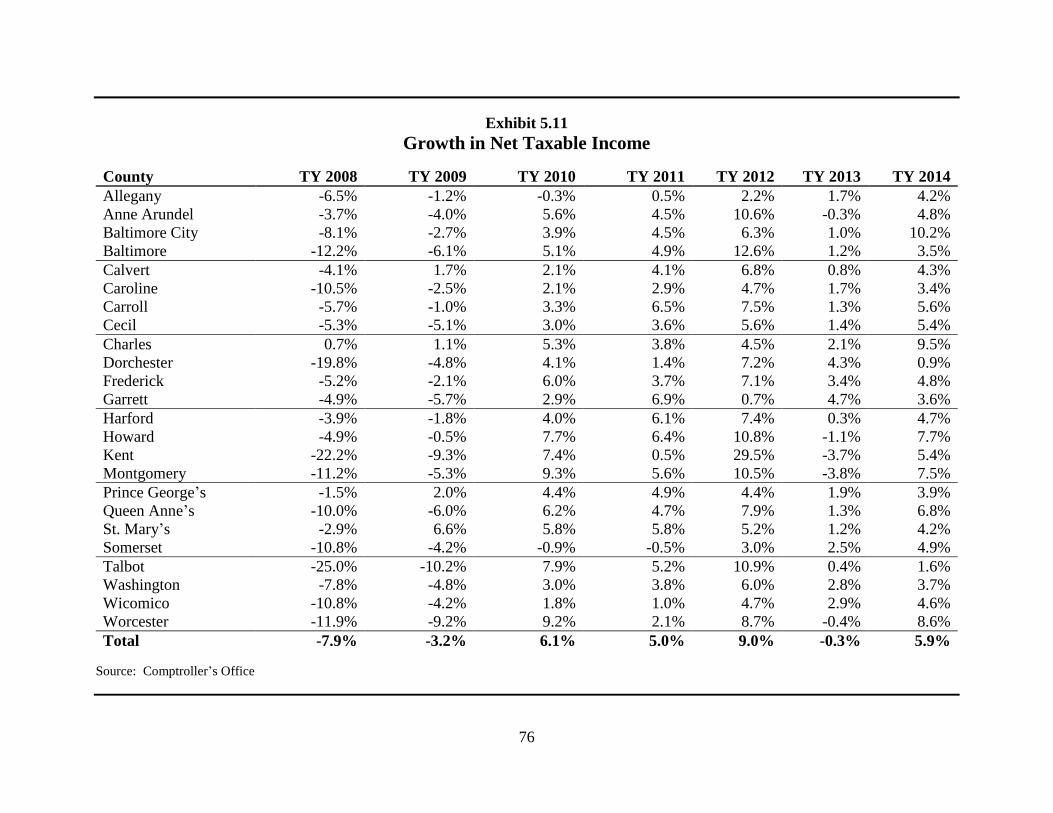
76
Exhibit 5.11
Growth in Net Taxable Income
County TY 2008 TY 2009 TY 2010 TY 2011 TY 2012 TY 2013 TY 2014
Allegany -6.5% -1.2% -0.3% 0.5% 2.2% 1.7% 4.2%
Anne Arundel -3.7% -4.0% 5.6% 4.5% 10.6% -0.3% 4.8%
Baltimore City -8.1% -2.7% 3.9% 4.5% 6.3% 1.0% 10.2%
Baltimore -12.2% -6.1% 5.1% 4.9% 12.6% 1.2% 3.5%
Calvert -4.1% 1.7% 2.1% 4.1% 6.8% 0.8% 4.3%
Caroline -10.5% -2.5% 2.1% 2.9% 4.7% 1.7% 3.4%
Carroll -5.7% -1.0% 3.3% 6.5% 7.5% 1.3% 5.6%
Cecil -5.3% -5.1% 3.0% 3.6% 5.6% 1.4% 5.4%
Charles 0.7% 1.1% 5.3% 3.8% 4.5% 2.1% 9.5%
Dorchester -19.8% -4.8% 4.1% 1.4% 7.2% 4.3% 0.9%
Frederick -5.2% -2.1% 6.0% 3.7% 7.1% 3.4% 4.8%
Garrett -4.9% -5.7% 2.9% 6.9% 0.7% 4.7% 3.6%
Harford -3.9% -1.8% 4.0% 6.1% 7.4% 0.3% 4.7%
Howard -4.9% -0.5% 7.7% 6.4% 10.8% -1.1% 7.7%
Kent -22.2% -9.3% 7.4% 0.5% 29.5% -3.7% 5.4%
Montgomery -11.2% -5.3% 9.3% 5.6% 10.5% -3.8% 7.5%
Prince George’s -1.5% 2.0% 4.4% 4.9% 4.4% 1.9% 3.9%
Queen Anne’s -10.0% -6.0% 6.2% 4.7% 7.9% 1.3% 6.8%
St. Mary’s -2.9% 6.6% 5.8% 5.8% 5.2% 1.2% 4.2%
Somerset -10.8% -4.2% -0.9% -0.5% 3.0% 2.5% 4.9%
Talbot -25.0% -10.2% 7.9% 5.2% 10.9% 0.4% 1.6%
Washington -7.8% -4.8% 3.0% 3.8% 6.0% 2.8% 3.7%
Wicomico -10.8% -4.2% 1.8% 1.0% 4.7% 2.9% 4.6%
Worcester -11.9% -9.2% 9.2% 2.1% 8.7% -0.4% 8.6%
Total -7.9% -3.2% 6.1% 5.0% 9.0% -0.3% 5.9%
Source: Comptroller’s Office
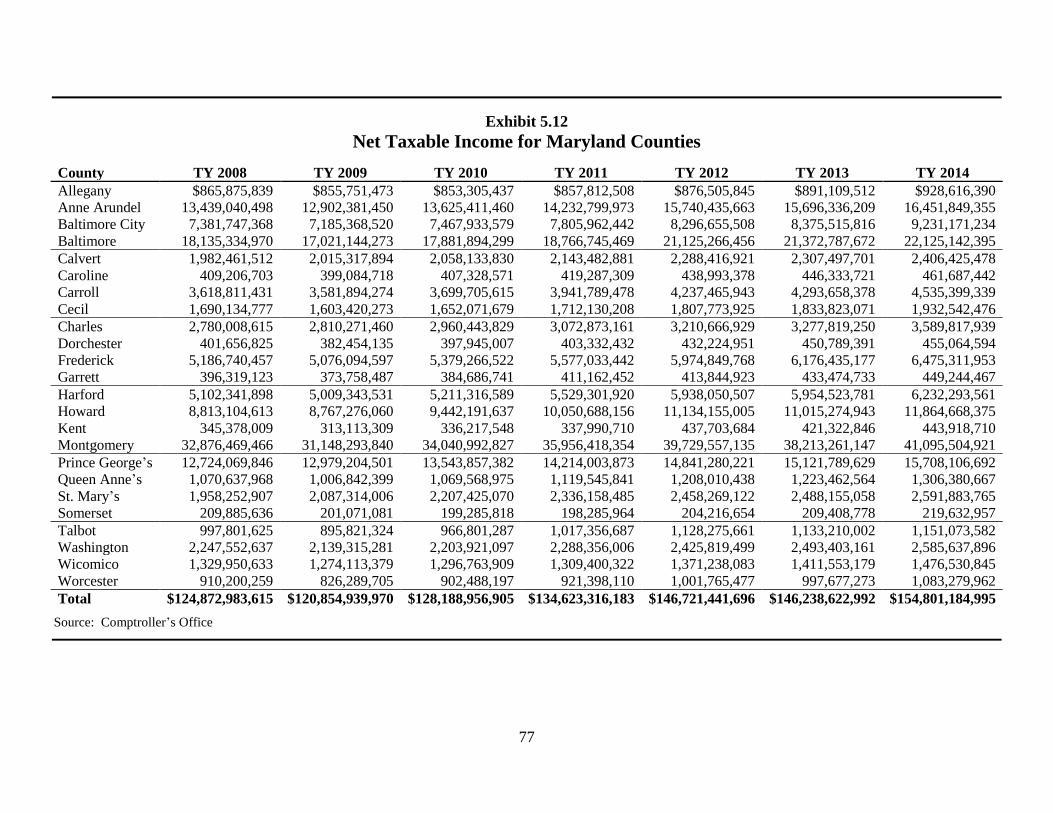
77
Exhibit 5.12
Net Taxable Income for Maryland Counties
County TY 2008 TY 2009 TY 2010 TY 2011 TY 2012 TY 2013 TY 2014
Allegany $865,875,839 $855,751,473 $853,305,437 $857,812,508 $876,505,845 $891,109,512 $928,616,390
Anne Arundel 13,439,040,498 12,902,381,450 13,625,411,460 14,232,799,973 15,740,435,663 15,696,336,209 16,451,849,355
Baltimore City 7,381,747,368 7,185,368,520 7,467,933,579 7,805,962,442 8,296,655,508 8,375,515,816 9,231,171,234
Baltimore 18,135,334,970 17,021,144,273 17,881,894,299 18,766,745,469 21,125,266,456 21,372,787,672 22,125,142,395
Calvert 1,982,461,512 2,015,317,894 2,058,133,830 2,143,482,881 2,288,416,921 2,307,497,701 2,406,425,478
Caroline 409,206,703 399,084,718 407,328,571 419,287,309 438,993,378 446,333,721 461,687,442
Carroll 3,618,811,431 3,581,894,274 3,699,705,615 3,941,789,478 4,237,465,943 4,293,658,378 4,535,399,339
Cecil 1,690,134,777 1,603,420,273 1,652,071,679 1,712,130,208 1,807,773,925 1,833,823,071 1,932,542,476
Charles 2,780,008,615 2,810,271,460 2,960,443,829 3,072,873,161 3,210,666,929 3,277,819,250 3,589,817,939
Dorchester 401,656,825 382,454,135 397,945,007 403,332,432 432,224,951 450,789,391 455,064,594
Frederick 5,186,740,457 5,076,094,597 5,379,266,522 5,577,033,442 5,974,849,768 6,176,435,177 6,475,311,953
Garrett 396,319,123 373,758,487 384,686,741 411,162,452 413,844,923 433,474,733 449,244,467
Harford 5,102,341,898 5,009,343,531 5,211,316,589 5,529,301,920 5,938,050,507 5,954,523,781 6,232,293,561
Howard 8,813,104,613 8,767,276,060 9,442,191,637 10,050,688,156 11,134,155,005 11,015,274,943 11,864,668,375
Kent 345,378,009 313,113,309 336,217,548 337,990,710 437,703,684 421,322,846 443,918,710
Montgomery 32,876,469,466 31,148,293,840 34,040,992,827 35,956,418,354 39,729,557,135 38,213,261,147 41,095,504,921
Prince George’s 12,724,069,846 12,979,204,501 13,543,857,382 14,214,003,873 14,841,280,221 15,121,789,629 15,708,106,692
Queen Anne’s 1,070,637,968 1,006,842,399 1,069,568,975 1,119,545,841 1,208,010,438 1,223,462,564 1,306,380,667
St. Mary’s 1,958,252,907 2,087,314,006 2,207,425,070 2,336,158,485 2,458,269,122 2,488,155,058 2,591,883,765
Somerset 209,885,636 201,071,081 199,285,818 198,285,964 204,216,654 209,408,778 219,632,957
Talbot 997,801,625 895,821,324 966,801,287 1,017,356,687 1,128,275,661 1,133,210,002 1,151,073,582
Washington 2,247,552,637 2,139,315,281 2,203,921,097 2,288,356,006 2,425,819,499 2,493,403,161 2,585,637,896
Wicomico 1,329,950,633 1,274,113,379 1,296,763,909 1,309,400,322 1,371,238,083 1,411,553,179 1,476,530,845
Worcester 910,200,259 826,289,705 902,488,197 921,398,110 1,001,765,477 997,677,273 1,083,279,962
Total $124,872,983,615 $120,854,939,970 $128,188,956,905 $134,623,316,183 $146,721,441,696 $146,238,622,992 $154,801,184,995
Source: Comptroller’s Office

78
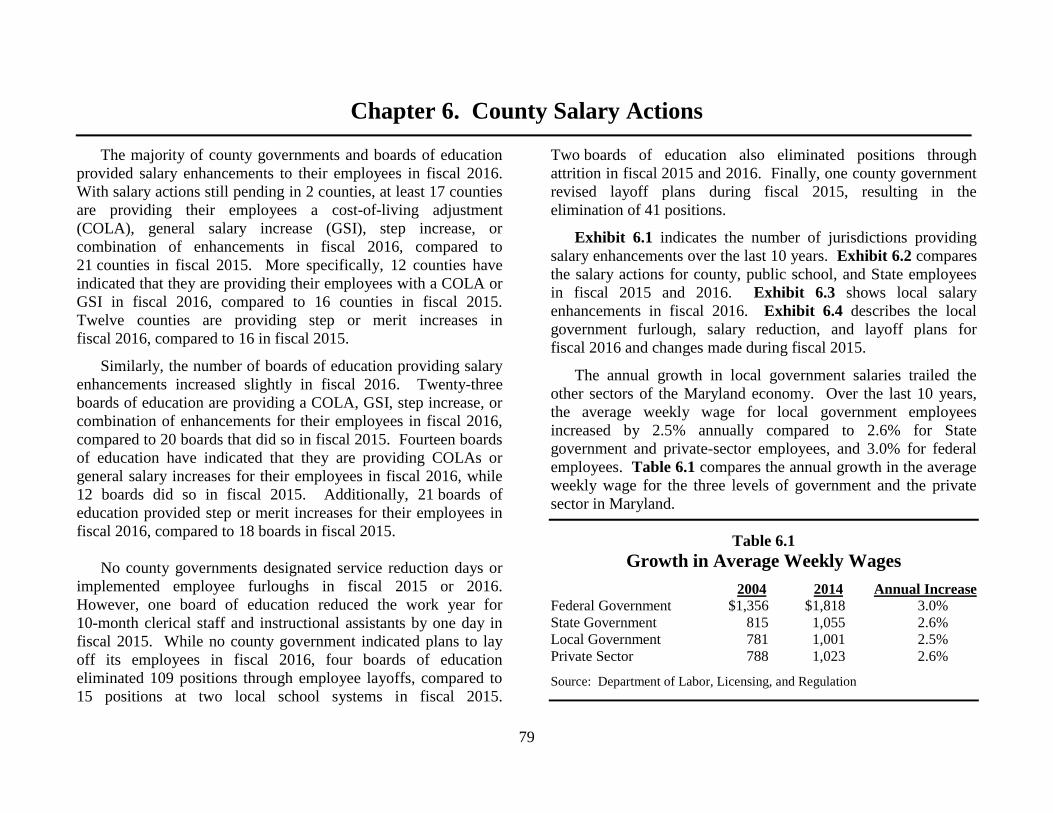
79
Chapter 6. County Salary Actions
The majority of county governments and boards of education
provided salary enhancements to their employees in fiscal 2016.
With salary actions still pending in 2 counties, at least 17 counties
are providing their employees a cost-of-living adjustment
(COLA), general salary increase (GSI), step increase, or
combination of enhancements in fiscal 2016, compared to
21 counties in fiscal 2015. More specifically, 12 counties have
indicated that they are providing their employees with a COLA or
GSI in fiscal 2016, compared to 16 counties in fiscal 2015.
Twelve counties are providing step or merit increases in
fiscal 2016, compared to 16 in fiscal 2015.
Similarly, the number of boards of education providing salary
enhancements increased slightly in fiscal 2016. Twenty-three
boards of education are providing a COLA, GSI, step increase, or
combination of enhancements for their employees in fiscal 2016,
compared to 20 boards that did so in fiscal 2015. Fourteen boards
of education have indicated that they are providing COLAs or
general salary increases for their employees in fiscal 2016, while
12 boards did so in fiscal 2015. Additionally, 21 boards of
education provided step or merit increases for their employees in
fiscal 2016, compared to 18 boards in fiscal 2015.
No county governments designated service reduction days or
implemented employee furloughs in fiscal 2015 or 2016.
However, one board of education reduced the work year for
10-month clerical staff and instructional assistants by one day in
fiscal 2015. While no county government indicated plans to lay
off its employees in fiscal 2016, four boards of education
eliminated 109 positions through employee layoffs, compared to
15 positions at two local school systems in fiscal 2015.
Two boards of education also eliminated positions through
attrition in fiscal 2015 and 2016. Finally, one county government
revised layoff plans during fiscal 2015, resulting in the
elimination of 41 positions.
Exhibit 6.1 indicates the number of jurisdictions providing
salary enhancements over the last 10 years. Exhibit 6.2 compares
the salary actions for county, public school, and State employees
in fiscal 2015 and 2016. Exhibit 6.3 shows local salary
enhancements in fiscal 2016. Exhibit 6.4 describes the local
government furlough, salary reduction, and layoff plans for
fiscal 2016 and changes made during fiscal 2015.
The annual growth in local government salaries trailed the
other sectors of the Maryland economy. Over the last 10 years,
the average weekly wage for local government employees
increased by 2.5% annually compared to 2.6% for State
government and private-sector employees, and 3.0% for federal
employees. Table 6.1 compares the annual growth in the average
weekly wage for the three levels of government and the private
sector in Maryland.
Table 6.1
Growth in Average Weekly Wages
2004 2014 Annual Increase
Federal Government $1,356 $1,818 3.0%
State Government 815 1,055 2.6%
Local Government 781 1,001 2.5%
Private Sector 788 1,023 2.6%
Source: Department of Labor, Licensing, and Regulation
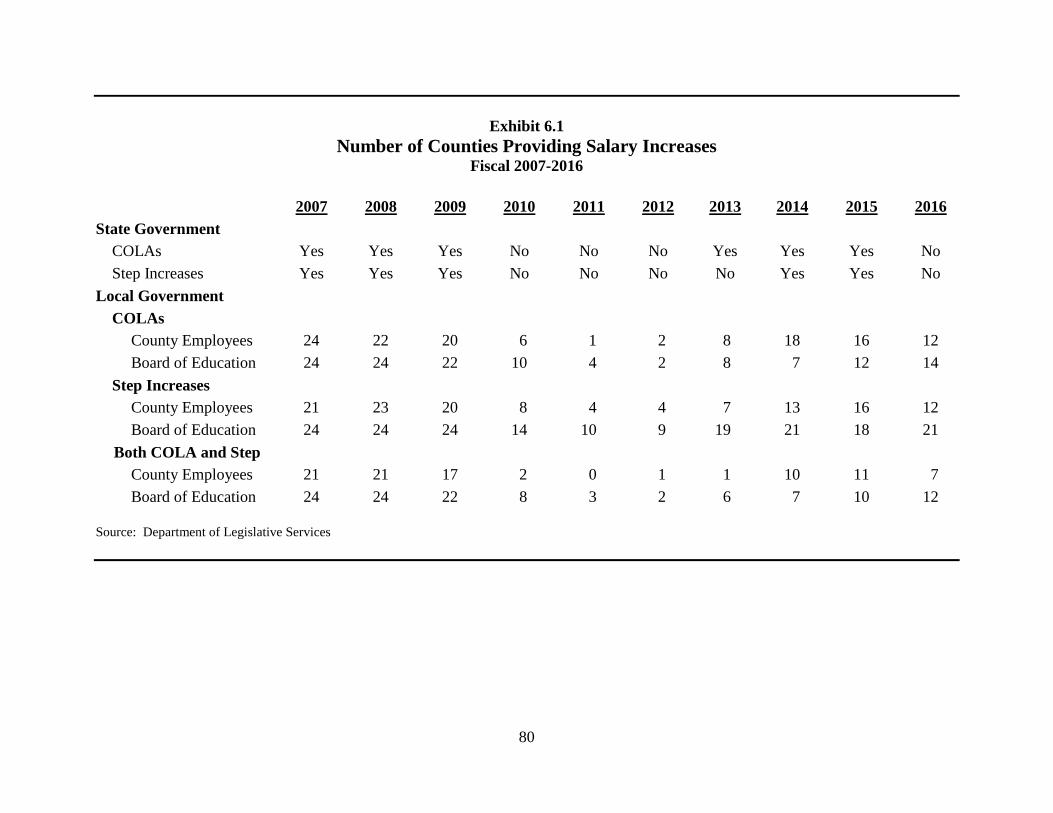
80
Exhibit 6.1
Number of Counties Providing Salary Increases Fiscal 2007-2016
2007 2008 2009 2010 2011 2012 2013 2014 2015 2016
State Government
COLAs Yes Yes Yes No No No Yes Yes Yes No
Step Increases Yes Yes Yes No No No No Yes Yes No
Local Government
COLAs
County Employees 24 22 20 6 1 2 8 18 16 12
Board of Education 24 24 22 10 4 2 8 7 12 14
Step Increases
County Employees 21 23 20 8 4 4 7 13 16 12
Board of Education 24 24 24 14 10 9 19 21 18 21
Both COLA and Step
County Employees 21 21 17 2 0 1 1 10 11 7
Board of Education 24 24 22 8 3 2 6 7 10 12
Source: Department of Legislative Services
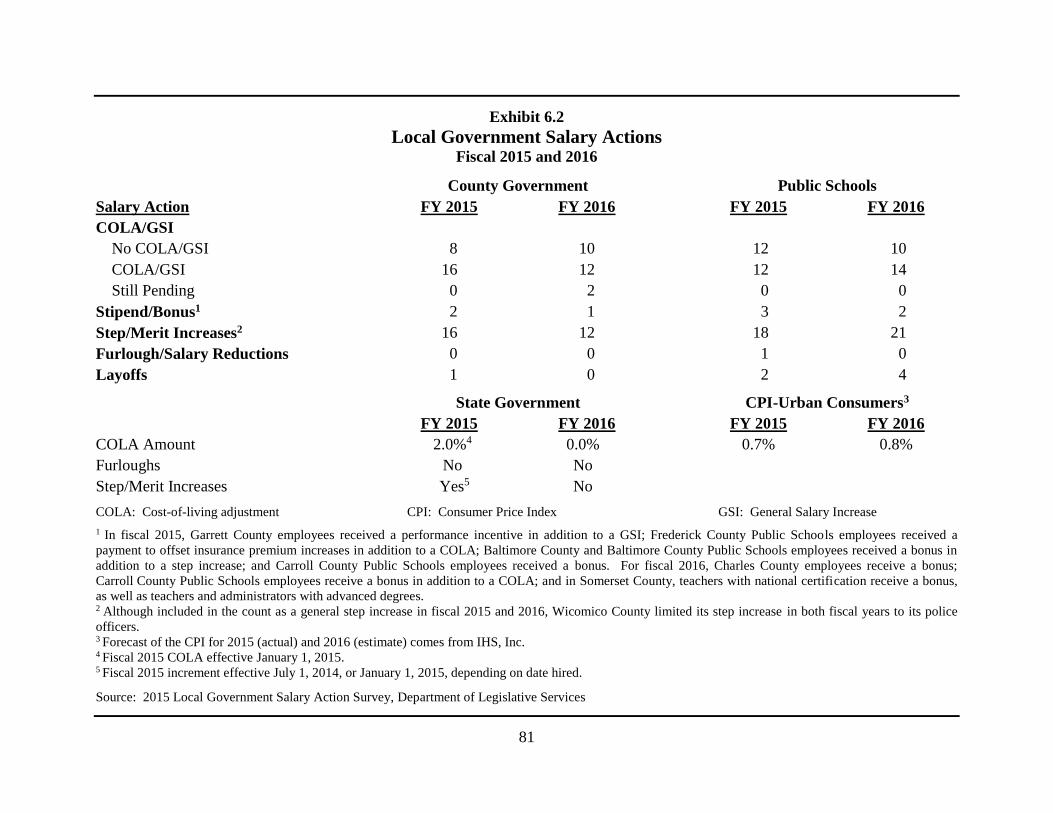
81
Exhibit 6.2
Local Government Salary Actions Fiscal 2015 and 2016
County Government
Public Schools
Salary Action FY 2015 FY 2016
FY 2015 FY 2016
COLA/GSI
No COLA/GSI 8 10
12 10
COLA/GSI 16 12
12 14
Still Pending 0 2
0 0
Stipend/Bonus1 2 1
3 2
Step/Merit Increases2 16 12
18 21
Furlough/Salary Reductions 0 0
1 0
Layoffs 1 0
2 4
State Government
CPI-Urban Consumers3
FY 2015 FY 2016
FY 2015 FY 2016
COLA Amount 2.0%4 0.0%
0.7% 0.8%
Furloughs No No
Step/Merit Increases Yes5 No
COLA: Cost-of-living adjustment CPI: Consumer Price Index GSI: General Salary Increase
1 In fiscal 2015, Garrett County employees received a performance incentive in addition to a GSI; Frederick County Public Schools employees received a
payment to offset insurance premium increases in addition to a COLA; Baltimore County and Baltimore County Public Schools employees received a bonus in
addition to a step increase; and Carroll County Public Schools employees received a bonus. For fiscal 2016, Charles County employees receive a bonus;
Carroll County Public Schools employees receive a bonus in addition to a COLA; and in Somerset County, teachers with national certification receive a bonus,
as well as teachers and administrators with advanced degrees. 2 Although included in the count as a general step increase in fiscal 2015 and 2016, Wicomico County limited its step increase in both fiscal years to its police
officers. 3 Forecast of the CPI for 2015 (actual) and 2016 (estimate) comes from IHS, Inc. 4 Fiscal 2015 COLA effective January 1, 2015. 5 Fiscal 2015 increment effective July 1, 2014, or January 1, 2015, depending on date hired.
Source: 2015 Local Government Salary Action Survey, Department of Legislative Services
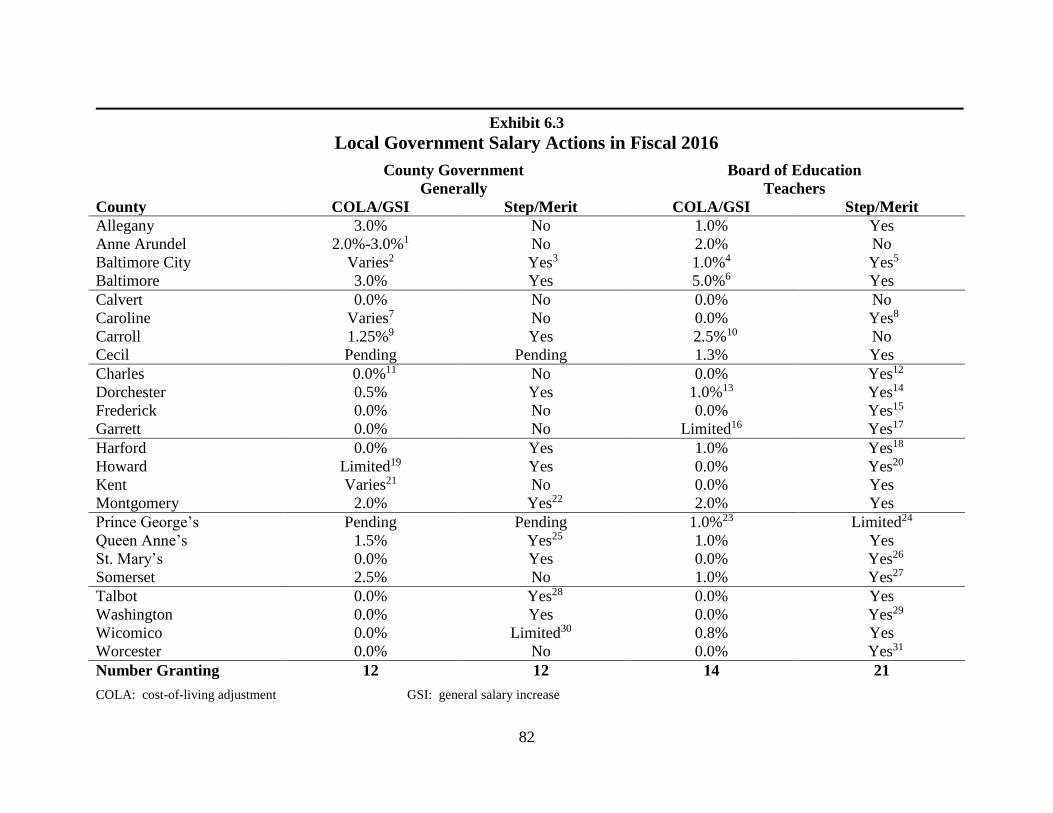
82
Exhibit 6.3
Local Government Salary Actions in Fiscal 2016
County Government Board of Education
Generally Teachers
County COLA/GSI Step/Merit COLA/GSI Step/Merit
Allegany 3.0% No 1.0% Yes
Anne Arundel 2.0%-3.0%1 No 2.0% No
Baltimore City Varies2 Yes3 1.0%4 Yes5
Baltimore 3.0% Yes 5.0%6 Yes
Calvert 0.0% No 0.0% No
Caroline Varies7 No 0.0% Yes8
Carroll 1.25%9 Yes 2.5%10 No
Cecil Pending Pending 1.3% Yes
Charles 0.0%11 No 0.0% Yes12
Dorchester 0.5% Yes 1.0%13 Yes14
Frederick 0.0% No 0.0% Yes15
Garrett 0.0% No Limited16 Yes17
Harford 0.0% Yes 1.0% Yes18
Howard Limited19 Yes 0.0% Yes20
Kent Varies21 No 0.0% Yes
Montgomery 2.0% Yes22 2.0% Yes
Prince George’s Pending Pending 1.0%23 Limited24
Queen Anne’s 1.5% Yes25 1.0% Yes
St. Mary’s 0.0% Yes 0.0% Yes26
Somerset 2.5% No 1.0% Yes27
Talbot 0.0% Yes28 0.0% Yes
Washington 0.0% Yes 0.0% Yes29
Wicomico 0.0% Limited30 0.8% Yes
Worcester 0.0% No 0.0% Yes31
Number Granting 12 12 14 21
COLA: cost-of-living adjustment GSI: general salary increase
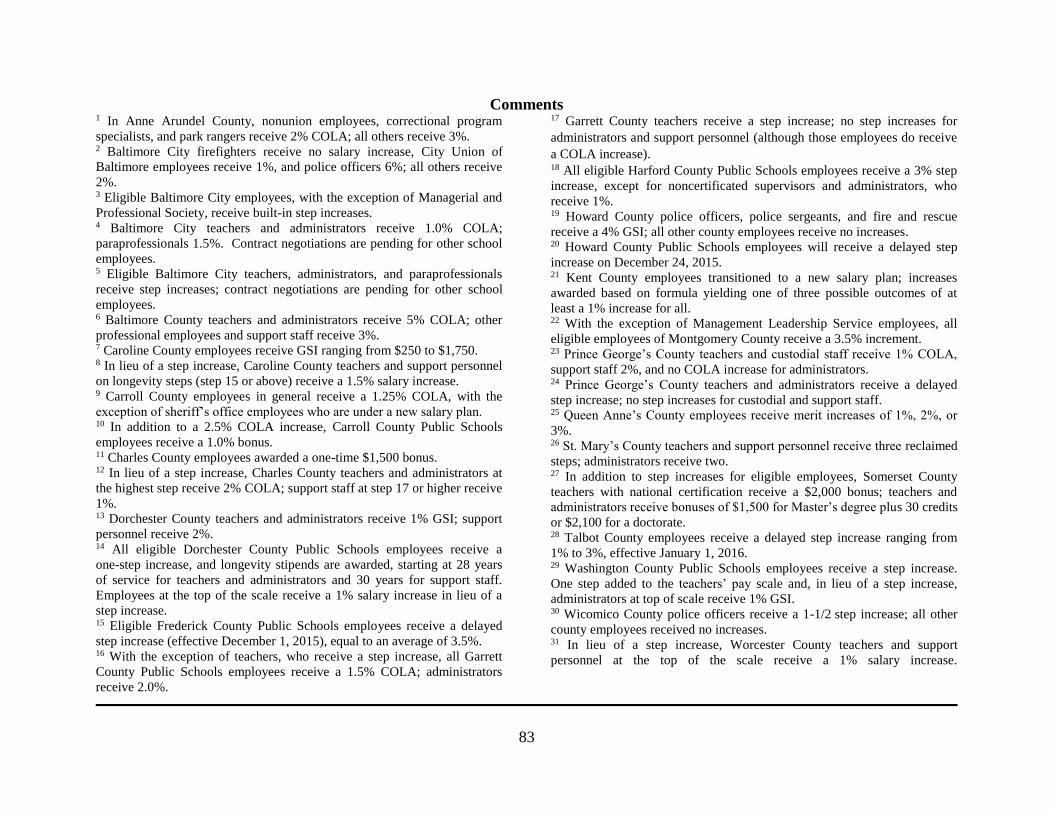
83
Comments 1 In Anne Arundel County, nonunion employees, correctional program
specialists, and park rangers receive 2% COLA; all others receive 3%. 2 Baltimore City firefighters receive no salary increase, City Union of
Baltimore employees receive 1%, and police officers 6%; all others receive
2%. 3 Eligible Baltimore City employees, with the exception of Managerial and
Professional Society, receive built-in step increases. 4 Baltimore City teachers and administrators receive 1.0% COLA;
paraprofessionals 1.5%. Contract negotiations are pending for other school
employees. 5 Eligible Baltimore City teachers, administrators, and paraprofessionals
receive step increases; contract negotiations are pending for other school
employees. 6 Baltimore County teachers and administrators receive 5% COLA; other
professional employees and support staff receive 3%. 7 Caroline County employees receive GSI ranging from $250 to $1,750. 8 In lieu of a step increase, Caroline County teachers and support personnel
on longevity steps (step 15 or above) receive a 1.5% salary increase. 9 Carroll County employees in general receive a 1.25% COLA, with the
exception of sheriff’s office employees who are under a new salary plan. 10 In addition to a 2.5% COLA increase, Carroll County Public Schools
employees receive a 1.0% bonus. 11 Charles County employees awarded a one-time $1,500 bonus. 12 In lieu of a step increase, Charles County teachers and administrators at
the highest step receive 2% COLA; support staff at step 17 or higher receive
1%. 13 Dorchester County teachers and administrators receive 1% GSI; support
personnel receive 2%. 14 All eligible Dorchester County Public Schools employees receive a
one-step increase, and longevity stipends are awarded, starting at 28 years
of service for teachers and administrators and 30 years for support staff.
Employees at the top of the scale receive a 1% salary increase in lieu of a
step increase. 15 Eligible Frederick County Public Schools employees receive a delayed
step increase (effective December 1, 2015), equal to an average of 3.5%. 16 With the exception of teachers, who receive a step increase, all Garrett
County Public Schools employees receive a 1.5% COLA; administrators
receive 2.0%.
17 Garrett County teachers receive a step increase; no step increases for
administrators and support personnel (although those employees do receive
a COLA increase). 18 All eligible Harford County Public Schools employees receive a 3% step
increase, except for noncertificated supervisors and administrators, who
receive 1%. 19 Howard County police officers, police sergeants, and fire and rescue
receive a 4% GSI; all other county employees receive no increases. 20 Howard County Public Schools employees will receive a delayed step
increase on December 24, 2015. 21 Kent County employees transitioned to a new salary plan; increases
awarded based on formula yielding one of three possible outcomes of at
least a 1% increase for all. 22 With the exception of Management Leadership Service employees, all
eligible employees of Montgomery County receive a 3.5% increment. 23 Prince George’s County teachers and custodial staff receive 1% COLA,
support staff 2%, and no COLA increase for administrators. 24 Prince George’s County teachers and administrators receive a delayed
step increase; no step increases for custodial and support staff. 25 Queen Anne’s County employees receive merit increases of 1%, 2%, or
3%. 26 St. Mary’s County teachers and support personnel receive three reclaimed
steps; administrators receive two. 27 In addition to step increases for eligible employees, Somerset County
teachers with national certification receive a $2,000 bonus; teachers and
administrators receive bonuses of $1,500 for Master’s degree plus 30 credits
or $2,100 for a doctorate. 28 Talbot County employees receive a delayed step increase ranging from
1% to 3%, effective January 1, 2016. 29 Washington County Public Schools employees receive a step increase.
One step added to the teachers’ pay scale and, in lieu of a step increase,
administrators at top of scale receive 1% GSI. 30 Wicomico County police officers receive a 1-1/2 step increase; all other
county employees received no increases. 31 In lieu of a step increase, Worcester County teachers and support
personnel at the top of the scale receive a 1% salary increase.
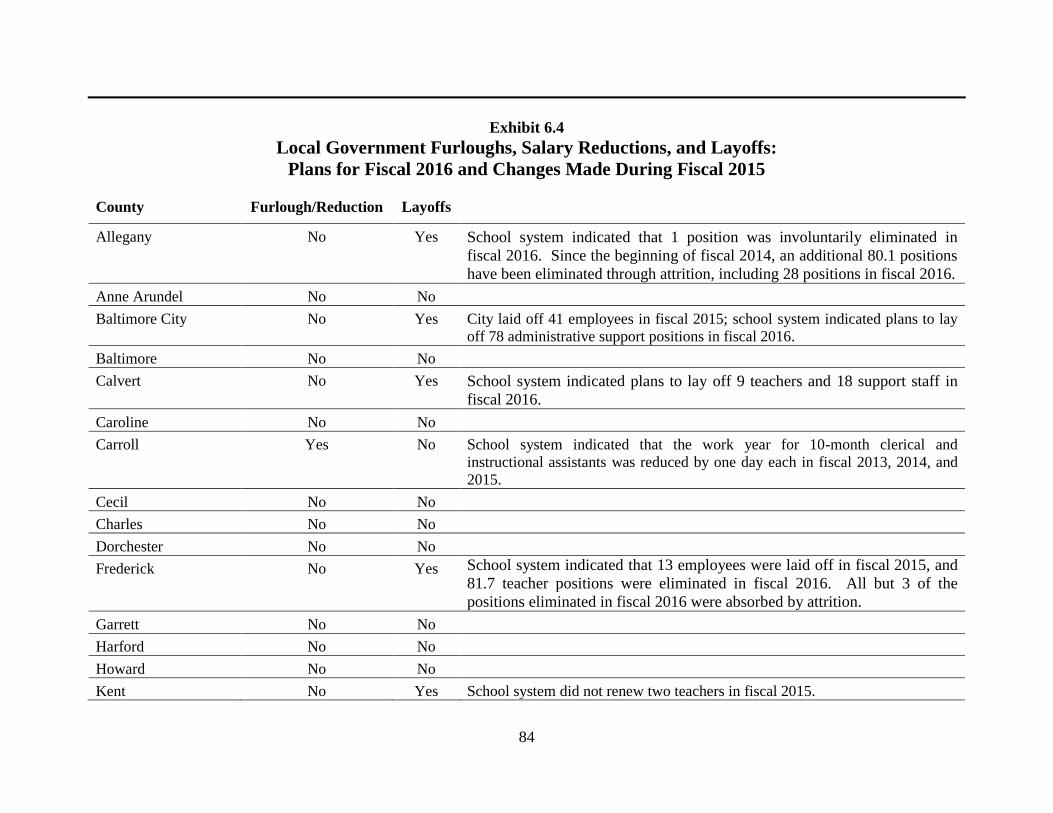
84
Exhibit 6.4
Local Government Furloughs, Salary Reductions, and Layoffs:
Plans for Fiscal 2016 and Changes Made During Fiscal 2015
County Furlough/Reduction Layoffs
Allegany No Yes School system indicated that 1 position was involuntarily eliminated in
fiscal 2016. Since the beginning of fiscal 2014, an additional 80.1 positions
have been eliminated through attrition, including 28 positions in fiscal 2016.
Anne Arundel No No
Baltimore City No Yes City laid off 41 employees in fiscal 2015; school system indicated plans to lay
off 78 administrative support positions in fiscal 2016.
Baltimore No No
Calvert No Yes School system indicated plans to lay off 9 teachers and 18 support staff in
fiscal 2016.
Caroline No No
Carroll Yes No School system indicated that the work year for 10-month clerical and
instructional assistants was reduced by one day each in fiscal 2013, 2014, and
2015.
Cecil No No
Charles No No
Dorchester No No
Frederick No Yes School system indicated that 13 employees were laid off in fiscal 2015, and
81.7 teacher positions were eliminated in fiscal 2016. All but 3 of the
positions eliminated in fiscal 2016 were absorbed by attrition.
Garrett No No
Harford No No
Howard No No
Kent No Yes School system did not renew two teachers in fiscal 2015.
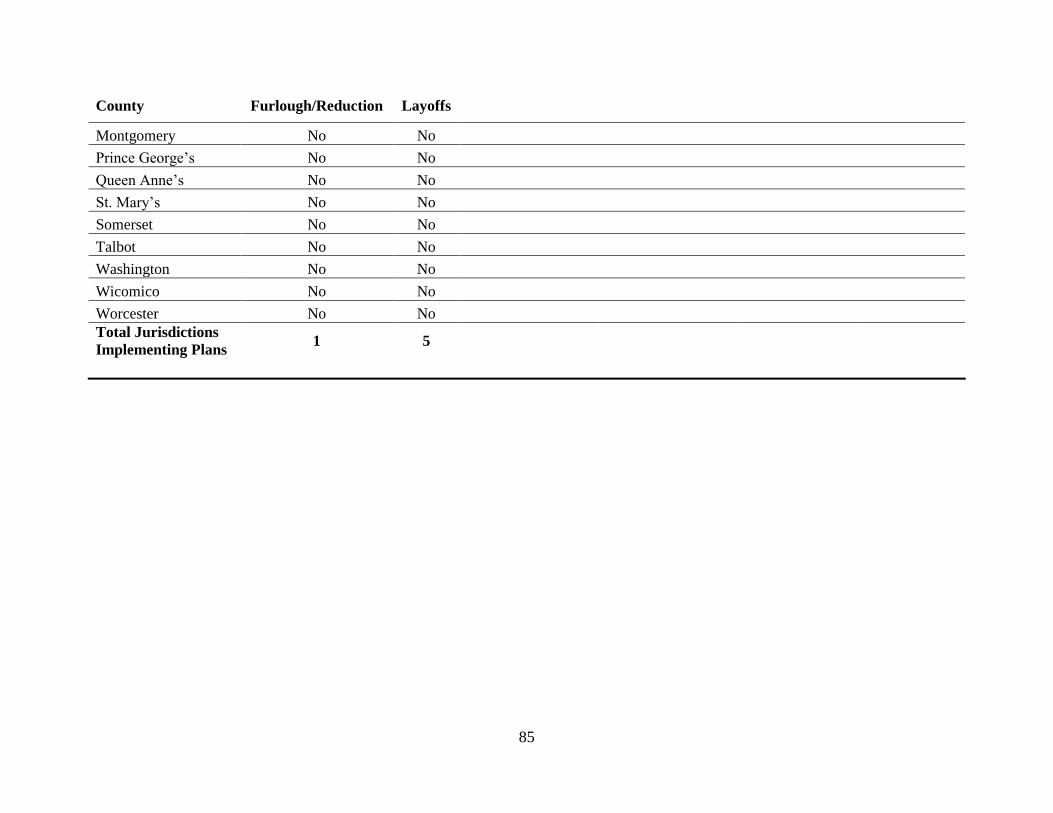
85
County Furlough/Reduction Layoffs
Montgomery No No
Prince George’s No No
Queen Anne’s No No
St. Mary’s No No
Somerset No No
Talbot No No
Washington No No
Wicomico No No
Worcester No No
Total Jurisdictions
Implementing Plans 1 5

86
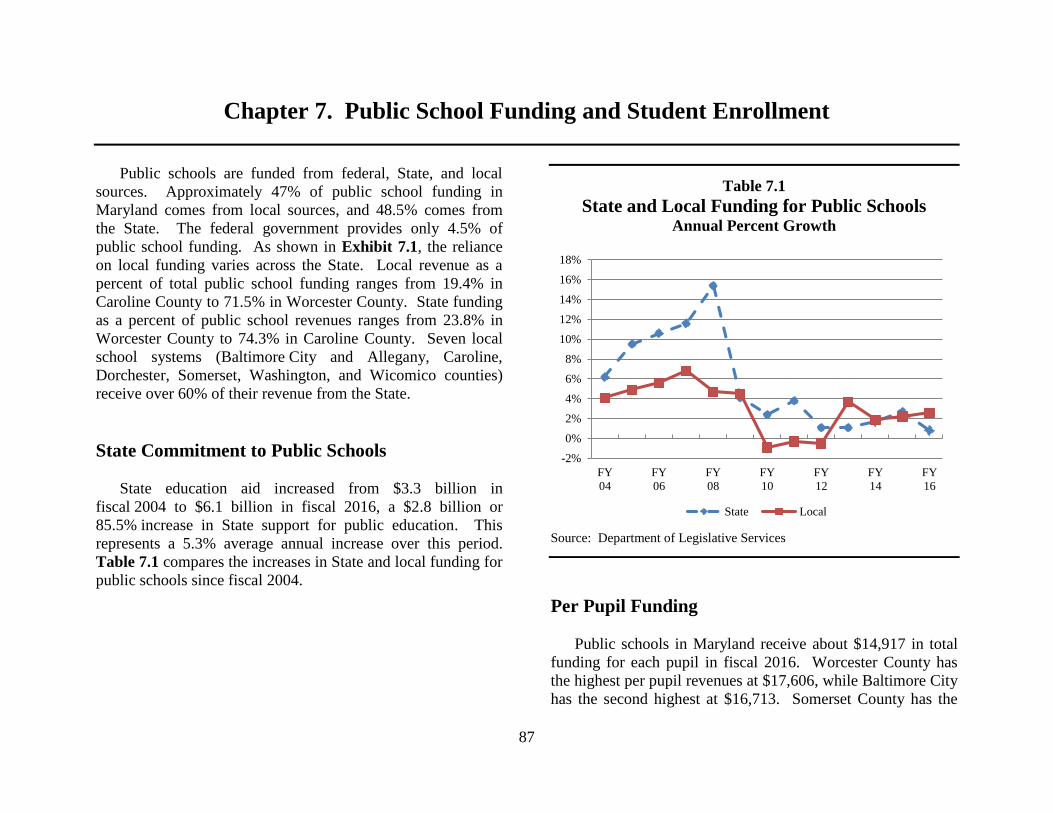
87
Chapter 7. Public School Funding and Student Enrollment
Public schools are funded from federal, State, and local
sources. Approximately 47% of public school funding in
Maryland comes from local sources, and 48.5% comes from
the State. The federal government provides only 4.5% of
public school funding. As shown in Exhibit 7.1, the reliance
on local funding varies across the State. Local revenue as a
percent of total public school funding ranges from 19.4% in
Caroline County to 71.5% in Worcester County. State funding
as a percent of public school revenues ranges from 23.8% in
Worcester County to 74.3% in Caroline County. Seven local
school systems (Baltimore City and Allegany, Caroline,
Dorchester, Somerset, Washington, and Wicomico counties)
receive over 60% of their revenue from the State.
State Commitment to Public Schools
State education aid increased from $3.3 billion in
fiscal 2004 to $6.1 billion in fiscal 2016, a $2.8 billion or
85.5% increase in State support for public education. This
represents a 5.3% average annual increase over this period.
Table 7.1 compares the increases in State and local funding for
public schools since fiscal 2004.
Table 7.1
State and Local Funding for Public Schools Annual Percent Growth
Source: Department of Legislative Services
Per Pupil Funding
Public schools in Maryland receive about $14,917 in total
funding for each pupil in fiscal 2016. Worcester County has
the highest per pupil revenues at $17,606, while Baltimore City
has the second highest at $16,713. Somerset County has the
-2%
0%
2%
4%
6%
8%
10%
12%
14%
16%
18%
FY
04
FY
06
FY
08
FY
10
FY
12
FY
14
FY
16
State Local
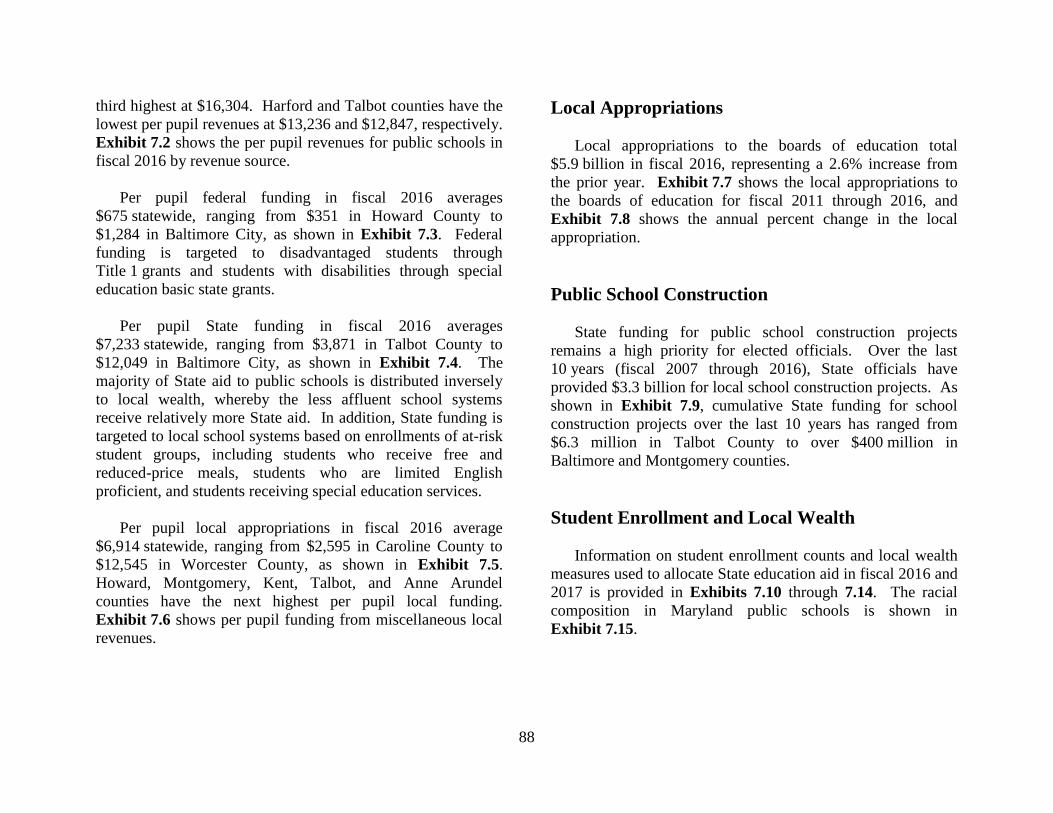
88
third highest at $16,304. Harford and Talbot counties have the
lowest per pupil revenues at $13,236 and $12,847, respectively.
Exhibit 7.2 shows the per pupil revenues for public schools in
fiscal 2016 by revenue source.
Per pupil federal funding in fiscal 2016 averages
$675 statewide, ranging from $351 in Howard County to
$1,284 in Baltimore City, as shown in Exhibit 7.3. Federal
funding is targeted to disadvantaged students through
Title 1 grants and students with disabilities through special
education basic state grants.
Per pupil State funding in fiscal 2016 averages
$7,233 statewide, ranging from $3,871 in Talbot County to
$12,049 in Baltimore City, as shown in Exhibit 7.4. The
majority of State aid to public schools is distributed inversely
to local wealth, whereby the less affluent school systems
receive relatively more State aid. In addition, State funding is
targeted to local school systems based on enrollments of at-risk
student groups, including students who receive free and
reduced-price meals, students who are limited English
proficient, and students receiving special education services.
Per pupil local appropriations in fiscal 2016 average
$6,914 statewide, ranging from $2,595 in Caroline County to
$12,545 in Worcester County, as shown in Exhibit 7.5.
Howard, Montgomery, Kent, Talbot, and Anne Arundel
counties have the next highest per pupil local funding.
Exhibit 7.6 shows per pupil funding from miscellaneous local
revenues.
Local Appropriations
Local appropriations to the boards of education total
$5.9 billion in fiscal 2016, representing a 2.6% increase from
the prior year. Exhibit 7.7 shows the local appropriations to
the boards of education for fiscal 2011 through 2016, and
Exhibit 7.8 shows the annual percent change in the local
appropriation.
Public School Construction
State funding for public school construction projects
remains a high priority for elected officials. Over the last
10 years (fiscal 2007 through 2016), State officials have
provided $3.3 billion for local school construction projects. As
shown in Exhibit 7.9, cumulative State funding for school
construction projects over the last 10 years has ranged from
$6.3 million in Talbot County to over $400 million in
Baltimore and Montgomery counties.
Student Enrollment and Local Wealth
Information on student enrollment counts and local wealth
measures used to allocate State education aid in fiscal 2016 and
2017 is provided in Exhibits 7.10 through 7.14. The racial
composition in Maryland public schools is shown in
Exhibit 7.15.
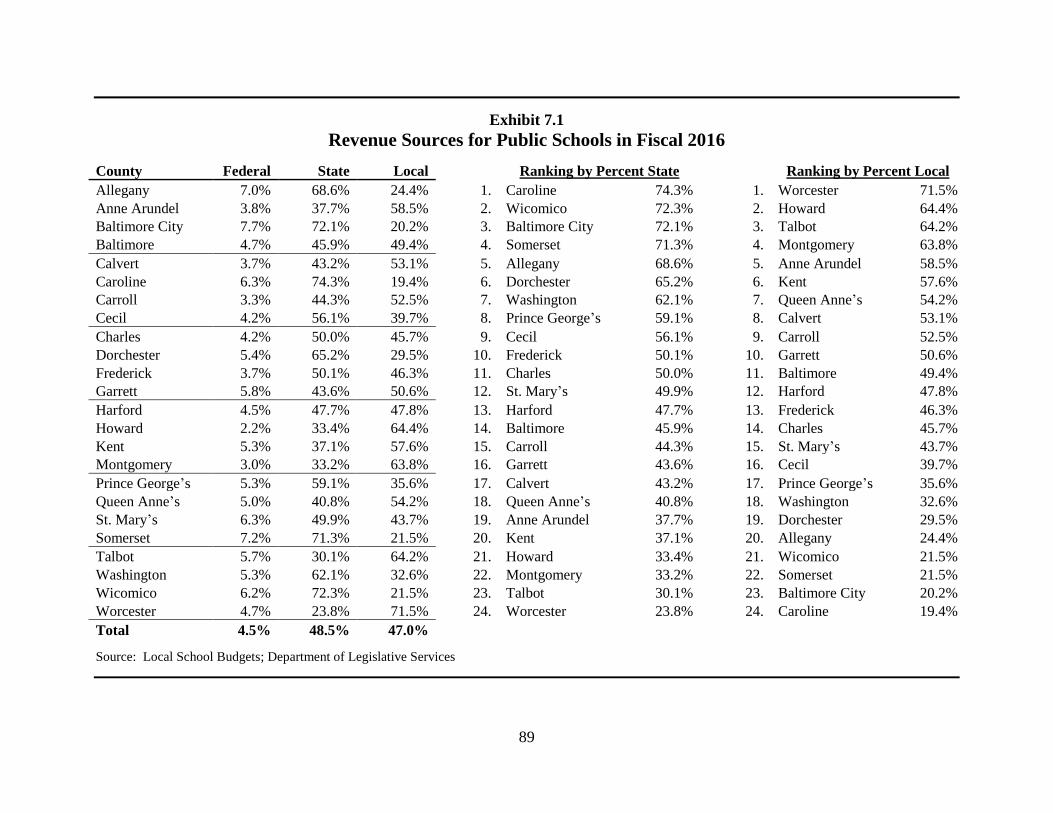
89
Exhibit 7.1
Revenue Sources for Public Schools in Fiscal 2016
County Federal State Local
Ranking by Percent State
Ranking by Percent Local
Allegany 7.0% 68.6% 24.4%
1. Caroline 74.3%
1. Worcester 71.5%
Anne Arundel 3.8% 37.7% 58.5%
2. Wicomico 72.3%
2. Howard 64.4%
Baltimore City 7.7% 72.1% 20.2%
3. Baltimore City 72.1%
3. Talbot 64.2%
Baltimore 4.7% 45.9% 49.4%
4. Somerset 71.3%
4. Montgomery 63.8%
Calvert 3.7% 43.2% 53.1%
5. Allegany 68.6%
5. Anne Arundel 58.5%
Caroline 6.3% 74.3% 19.4%
6. Dorchester 65.2%
6. Kent 57.6%
Carroll 3.3% 44.3% 52.5%
7. Washington 62.1%
7. Queen Anne’s 54.2%
Cecil 4.2% 56.1% 39.7%
8. Prince George’s 59.1%
8. Calvert 53.1%
Charles 4.2% 50.0% 45.7%
9. Cecil 56.1%
9. Carroll 52.5%
Dorchester 5.4% 65.2% 29.5%
10. Frederick 50.1%
10. Garrett 50.6%
Frederick 3.7% 50.1% 46.3%
11. Charles 50.0%
11. Baltimore 49.4%
Garrett 5.8% 43.6% 50.6%
12. St. Mary’s 49.9%
12. Harford 47.8%
Harford 4.5% 47.7% 47.8%
13. Harford 47.7%
13. Frederick 46.3%
Howard 2.2% 33.4% 64.4%
14. Baltimore 45.9%
14. Charles 45.7%
Kent 5.3% 37.1% 57.6%
15. Carroll 44.3%
15. St. Mary’s 43.7%
Montgomery 3.0% 33.2% 63.8%
16. Garrett 43.6%
16. Cecil 39.7%
Prince George’s 5.3% 59.1% 35.6%
17. Calvert 43.2%
17. Prince George’s 35.6%
Queen Anne’s 5.0% 40.8% 54.2%
18. Queen Anne’s 40.8%
18. Washington 32.6%
St. Mary’s 6.3% 49.9% 43.7%
19. Anne Arundel 37.7%
19. Dorchester 29.5%
Somerset 7.2% 71.3% 21.5%
20. Kent 37.1%
20. Allegany 24.4%
Talbot 5.7% 30.1% 64.2%
21. Howard 33.4%
21. Wicomico 21.5%
Washington 5.3% 62.1% 32.6%
22. Montgomery 33.2%
22. Somerset 21.5%
Wicomico 6.2% 72.3% 21.5%
23. Talbot 30.1%
23. Baltimore City 20.2%
Worcester 4.7% 23.8% 71.5%
24. Worcester 23.8%
24. Caroline 19.4%
Total 4.5% 48.5% 47.0%
Source: Local School Budgets; Department of Legislative Services
90
Exhibit 7.2
Per Pupil Revenues for Public Schools in Fiscal 2016
County Federal State Local Misc. Total
Ranking by Total Per Pupil Funding
Allegany $1,038 $10,246 $3,588 $54 $14,926
1. Worcester $17,606
Anne Arundel 515 5,143 7,932 39 13,629
2. Baltimore City 16,713
Baltimore City 1,284 12,049 3,262 118 16,713
3. Somerset 16,304
Baltimore 677 6,564 6,974 97 14,312
4. Kent 15,981
Calvert 508 6,011 7,361 25 13,905
5. Howard 15,931
Caroline 868 10,282 2,595 88 13,833
6. Prince George’s 15,691
Carroll 441 6,005 6,998 121 13,566
7. Montgomery 15,663
Cecil 567 7,505 5,281 30 13,383
8. Allegany 14,926
Charles 610 7,211 6,521 67 14,409
9. Dorchester 14,858
Dorchester 797 9,682 4,200 179 14,858
10. Garrett 14,831
Frederick 490 6,695 6,060 124 13,369
11. Charles 14,409
Garrett 859 6,465 7,222 285 14,831
12. Baltimore 14,312
Harford 595 6,310 6,228 103 13,236
13. Calvert 13,905
Howard 351 5,320 10,138 122 15,931
14. Caroline 13,833
Kent 854 5,924 9,117 85 15,981
15. Wicomico 13,667
Montgomery 473 5,203 9,916 71 15,663
16. Anne Arundel 13,629
Prince George’s 835 9,276 5,433 148 15,691
17. Carroll 13,566
Queen Anne’s 673 5,451 7,083 151 13,358
18. Washington 13,535
St. Mary’s 844 6,649 5,783 45 13,322
19. Cecil 13,383
Somerset 1,175 11,631 3,459 38 16,304
20. Frederick 13,369
Talbot 732 3,871 8,229 15 12,847
21. Queen Anne’s 13,358
Washington 713 8,409 4,366 48 13,535
22. St. Mary’s 13,322
Wicomico 842 9,883 2,798 144 13,667
23. Harford 13,236
Worcester 829 4,197 12,545 36 17,606
24. Talbot 12,847
Total $675 $7,233 $6,914 $95 $14,917
Source: Local School Budgets; Department of Legislative Services
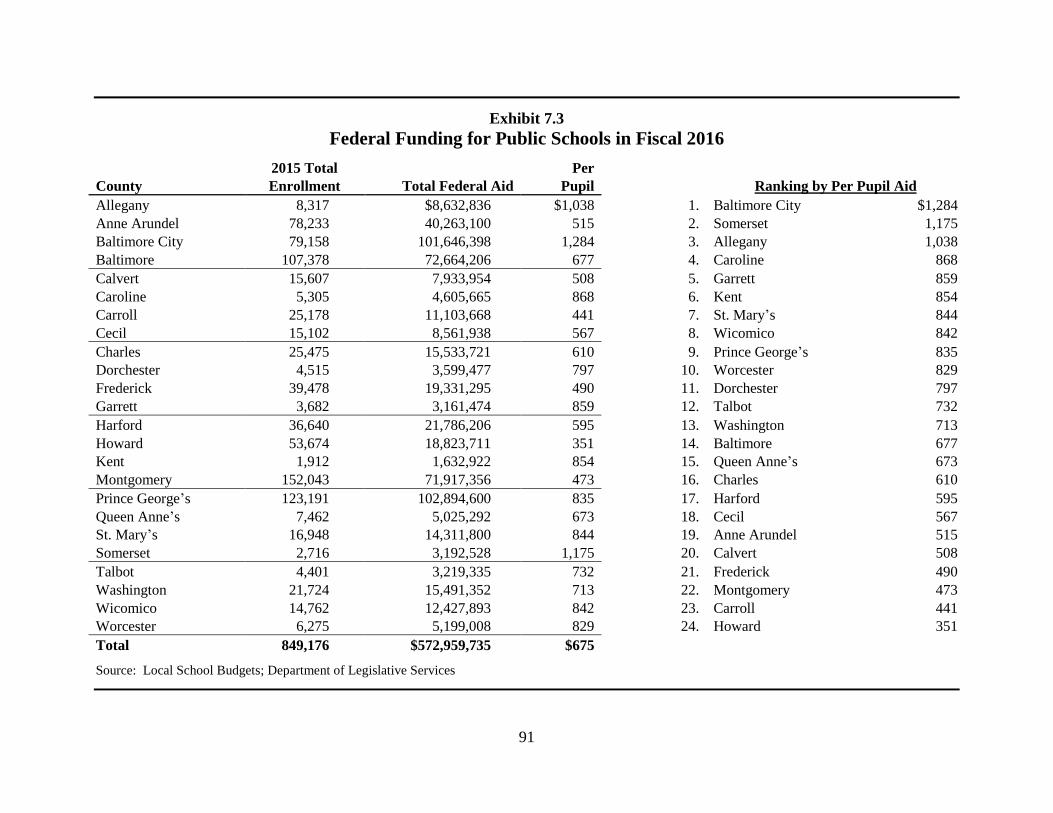
91
Exhibit 7.3
Federal Funding for Public Schools in Fiscal 2016
2015 Total
Per
County Enrollment Total Federal Aid Pupil
Ranking by Per Pupil Aid
Allegany 8,317 $8,632,836 $1,038
1. Baltimore City $1,284
Anne Arundel 78,233 40,263,100 515
2. Somerset 1,175
Baltimore City 79,158 101,646,398 1,284
3. Allegany 1,038
Baltimore 107,378 72,664,206 677
4. Caroline 868
Calvert 15,607 7,933,954 508
5. Garrett 859
Caroline 5,305 4,605,665 868
6. Kent 854
Carroll 25,178 11,103,668 441
7. St. Mary’s 844
Cecil 15,102 8,561,938 567
8. Wicomico 842
Charles 25,475 15,533,721 610
9. Prince George’s 835
Dorchester 4,515 3,599,477 797
10. Worcester 829
Frederick 39,478 19,331,295 490
11. Dorchester 797
Garrett 3,682 3,161,474 859
12. Talbot 732
Harford 36,640 21,786,206 595
13. Washington 713
Howard 53,674 18,823,711 351
14. Baltimore 677
Kent 1,912 1,632,922 854
15. Queen Anne’s 673
Montgomery 152,043 71,917,356 473
16. Charles 610
Prince George’s 123,191 102,894,600 835
17. Harford 595
Queen Anne’s 7,462 5,025,292 673
18. Cecil 567
St. Mary’s 16,948 14,311,800 844
19. Anne Arundel 515
Somerset 2,716 3,192,528 1,175
20. Calvert 508
Talbot 4,401 3,219,335 732
21. Frederick 490
Washington 21,724 15,491,352 713
22. Montgomery 473
Wicomico 14,762 12,427,893 842
23. Carroll 441
Worcester 6,275 5,199,008 829
24. Howard 351
Total 849,176 $572,959,735 $675
Source: Local School Budgets; Department of Legislative Services
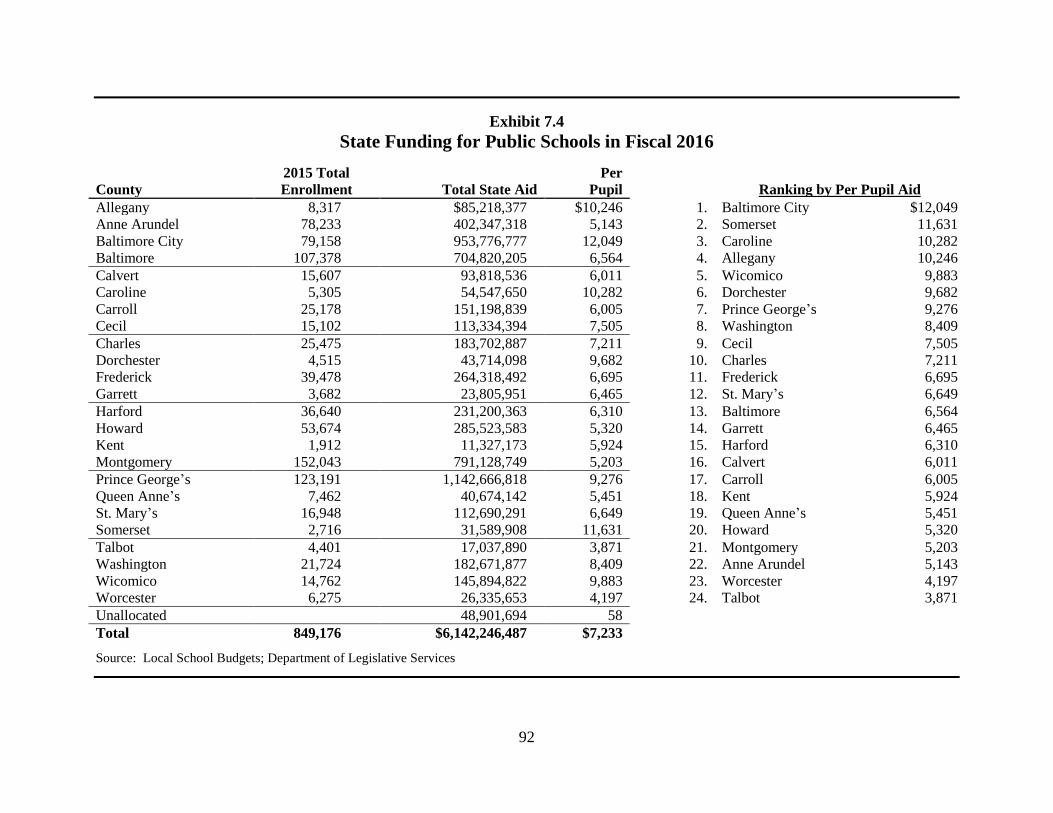
92
Exhibit 7.4
State Funding for Public Schools in Fiscal 2016
2015 Total
Per
County Enrollment Total State Aid Pupil
Ranking by Per Pupil Aid
Allegany 8,317 $85,218,377 $10,246
1. Baltimore City $12,049
Anne Arundel 78,233 402,347,318 5,143
2. Somerset 11,631
Baltimore City 79,158 953,776,777 12,049
3. Caroline 10,282
Baltimore 107,378 704,820,205 6,564
4. Allegany 10,246
Calvert 15,607 93,818,536 6,011
5. Wicomico 9,883
Caroline 5,305 54,547,650 10,282
6. Dorchester 9,682
Carroll 25,178 151,198,839 6,005
7. Prince George’s 9,276
Cecil 15,102 113,334,394 7,505
8. Washington 8,409
Charles 25,475 183,702,887 7,211
9. Cecil 7,505
Dorchester 4,515 43,714,098 9,682
10. Charles 7,211
Frederick 39,478 264,318,492 6,695
11. Frederick 6,695
Garrett 3,682 23,805,951 6,465
12. St. Mary’s 6,649
Harford 36,640 231,200,363 6,310
13. Baltimore 6,564
Howard 53,674 285,523,583 5,320
14. Garrett 6,465
Kent 1,912 11,327,173 5,924
15. Harford 6,310
Montgomery 152,043 791,128,749 5,203
16. Calvert 6,011
Prince George’s 123,191 1,142,666,818 9,276
17. Carroll 6,005
Queen Anne’s 7,462 40,674,142 5,451
18. Kent 5,924
St. Mary’s 16,948 112,690,291 6,649
19. Queen Anne’s 5,451
Somerset 2,716 31,589,908 11,631
20. Howard 5,320
Talbot 4,401 17,037,890 3,871
21. Montgomery 5,203
Washington 21,724 182,671,877 8,409
22. Anne Arundel 5,143
Wicomico 14,762 145,894,822 9,883
23. Worcester 4,197
Worcester 6,275 26,335,653 4,197
24. Talbot 3,871
Unallocated 48,901,694 58
Total 849,176 $6,142,246,487 $7,233
Source: Local School Budgets; Department of Legislative Services
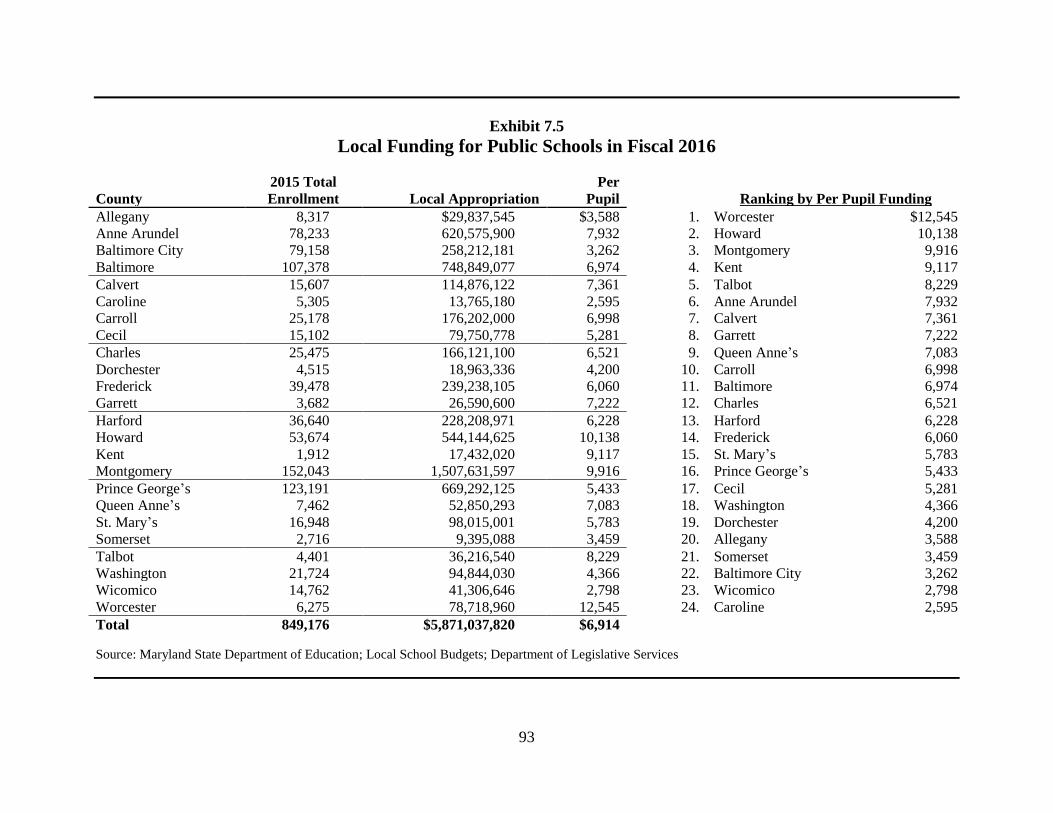
93
Exhibit 7.5
Local Funding for Public Schools in Fiscal 2016
2015 Total
Per
County Enrollment Local Appropriation Pupil
Ranking by Per Pupil Funding
Allegany 8,317 $29,837,545 $3,588
1. Worcester $12,545
Anne Arundel 78,233 620,575,900 7,932
2. Howard 10,138
Baltimore City 79,158 258,212,181 3,262
3. Montgomery 9,916
Baltimore 107,378 748,849,077 6,974
4. Kent 9,117
Calvert 15,607 114,876,122 7,361
5. Talbot 8,229
Caroline 5,305 13,765,180 2,595
6. Anne Arundel 7,932
Carroll 25,178 176,202,000 6,998
7. Calvert 7,361
Cecil 15,102 79,750,778 5,281
8. Garrett 7,222
Charles 25,475 166,121,100 6,521
9. Queen Anne’s 7,083
Dorchester 4,515 18,963,336 4,200
10. Carroll 6,998
Frederick 39,478 239,238,105 6,060
11. Baltimore 6,974
Garrett 3,682 26,590,600 7,222
12. Charles 6,521
Harford 36,640 228,208,971 6,228
13. Harford 6,228
Howard 53,674 544,144,625 10,138
14. Frederick 6,060
Kent 1,912 17,432,020 9,117
15. St. Mary’s 5,783
Montgomery 152,043 1,507,631,597 9,916
16. Prince George’s 5,433
Prince George’s 123,191 669,292,125 5,433
17. Cecil 5,281
Queen Anne’s 7,462 52,850,293 7,083
18. Washington 4,366
St. Mary’s 16,948 98,015,001 5,783
19. Dorchester 4,200
Somerset 2,716 9,395,088 3,459
20. Allegany 3,588
Talbot 4,401 36,216,540 8,229
21. Somerset 3,459
Washington 21,724 94,844,030 4,366
22. Baltimore City 3,262
Wicomico 14,762 41,306,646 2,798
23. Wicomico 2,798
Worcester 6,275 78,718,960 12,545
24. Caroline 2,595
Total 849,176 $5,871,037,820 $6,914
Source: Maryland State Department of Education; Local School Budgets; Department of Legislative Services
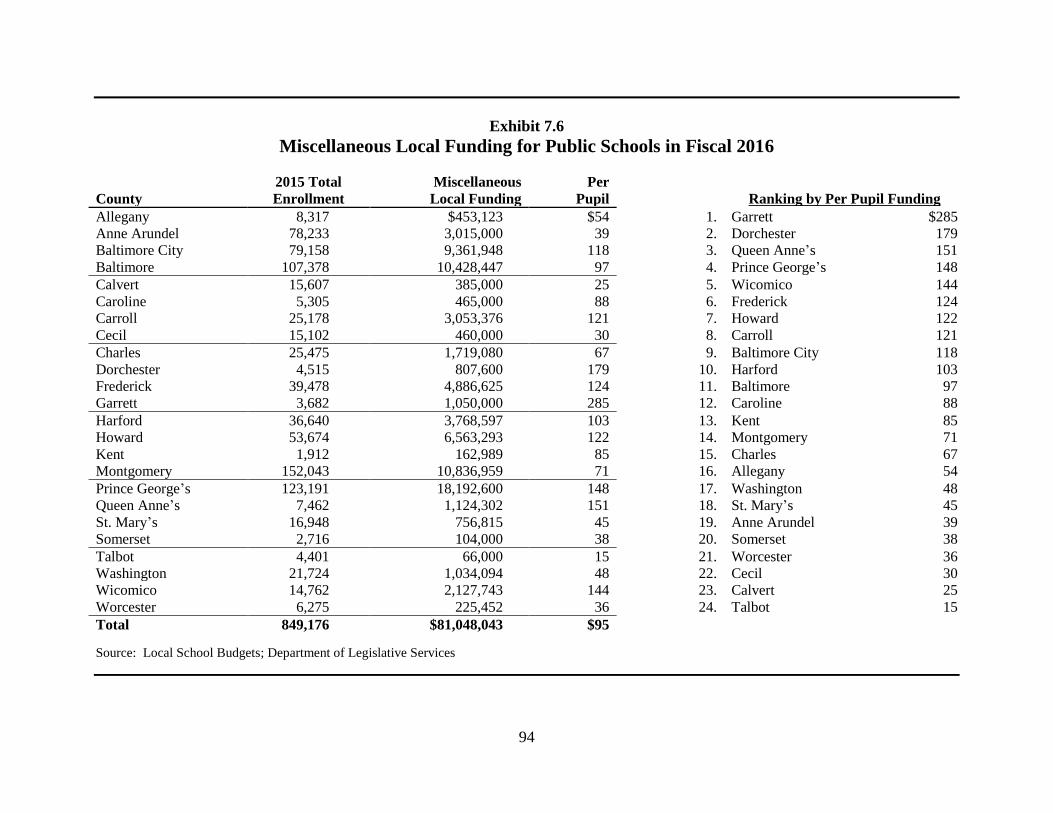
94
Exhibit 7.6
Miscellaneous Local Funding for Public Schools in Fiscal 2016
2015 Total Miscellaneous Per
County Enrollment Local Funding Pupil
Ranking by Per Pupil Funding
Allegany 8,317 $453,123 $54
1. Garrett $285
Anne Arundel 78,233 3,015,000 39
2. Dorchester 179
Baltimore City 79,158 9,361,948 118
3. Queen Anne’s 151
Baltimore 107,378 10,428,447 97
4. Prince George’s 148
Calvert 15,607 385,000 25
5. Wicomico 144
Caroline 5,305 465,000 88
6. Frederick 124
Carroll 25,178 3,053,376 121
7. Howard 122
Cecil 15,102 460,000 30
8. Carroll 121
Charles 25,475 1,719,080 67
9. Baltimore City 118
Dorchester 4,515 807,600 179
10. Harford 103
Frederick 39,478 4,886,625 124
11. Baltimore 97
Garrett 3,682 1,050,000 285
12. Caroline 88
Harford 36,640 3,768,597 103
13. Kent 85
Howard 53,674 6,563,293 122
14. Montgomery 71
Kent 1,912 162,989 85
15. Charles 67
Montgomery 152,043 10,836,959 71
16. Allegany 54
Prince George’s 123,191 18,192,600 148
17. Washington 48
Queen Anne’s 7,462 1,124,302 151
18. St. Mary’s 45
St. Mary’s 16,948 756,815 45
19. Anne Arundel 39
Somerset 2,716 104,000 38
20. Somerset 38
Talbot 4,401 66,000 15
21. Worcester 36
Washington 21,724 1,034,094 48
22. Cecil 30
Wicomico 14,762 2,127,743 144
23. Calvert 25
Worcester 6,275 225,452 36
24. Talbot 15
Total 849,176 $81,048,043 $95
Source: Local School Budgets; Department of Legislative Services
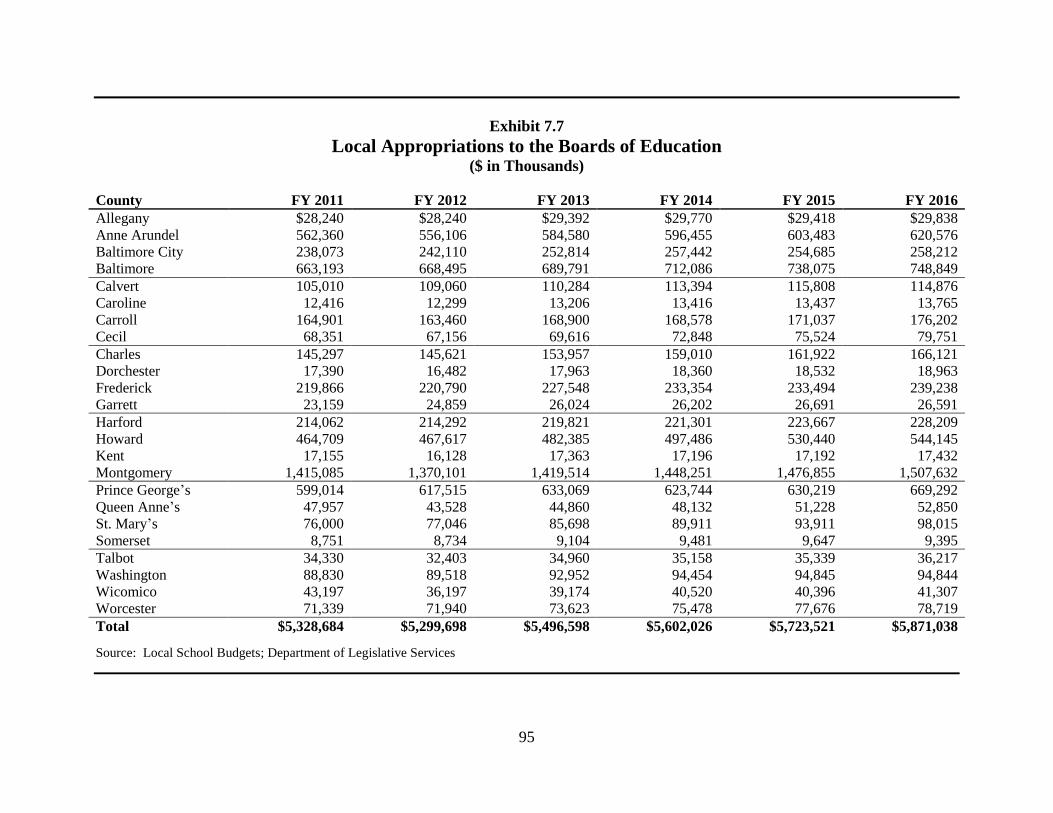
95
Exhibit 7.7
Local Appropriations to the Boards of Education ($ in Thousands)
County FY 2011 FY 2012 FY 2013 FY 2014 FY 2015 FY 2016
Allegany $28,240 $28,240 $29,392 $29,770 $29,418 $29,838
Anne Arundel 562,360 556,106 584,580 596,455 603,483 620,576
Baltimore City 238,073 242,110 252,814 257,442 254,685 258,212
Baltimore 663,193 668,495 689,791 712,086 738,075 748,849
Calvert 105,010 109,060 110,284 113,394 115,808 114,876
Caroline 12,416 12,299 13,206 13,416 13,437 13,765
Carroll 164,901 163,460 168,900 168,578 171,037 176,202
Cecil 68,351 67,156 69,616 72,848 75,524 79,751
Charles 145,297 145,621 153,957 159,010 161,922 166,121
Dorchester 17,390 16,482 17,963 18,360 18,532 18,963
Frederick 219,866 220,790 227,548 233,354 233,494 239,238
Garrett 23,159 24,859 26,024 26,202 26,691 26,591
Harford 214,062 214,292 219,821 221,301 223,667 228,209
Howard 464,709 467,617 482,385 497,486 530,440 544,145
Kent 17,155 16,128 17,363 17,196 17,192 17,432
Montgomery 1,415,085 1,370,101 1,419,514 1,448,251 1,476,855 1,507,632
Prince George’s 599,014 617,515 633,069 623,744 630,219 669,292
Queen Anne’s 47,957 43,528 44,860 48,132 51,228 52,850
St. Mary’s 76,000 77,046 85,698 89,911 93,911 98,015
Somerset 8,751 8,734 9,104 9,481 9,647 9,395
Talbot 34,330 32,403 34,960 35,158 35,339 36,217
Washington 88,830 89,518 92,952 94,454 94,845 94,844
Wicomico 43,197 36,197 39,174 40,520 40,396 41,307
Worcester 71,339 71,940 73,623 75,478 77,676 78,719
Total $5,328,684 $5,299,698 $5,496,598 $5,602,026 $5,723,521 $5,871,038
Source: Local School Budgets; Department of Legislative Services
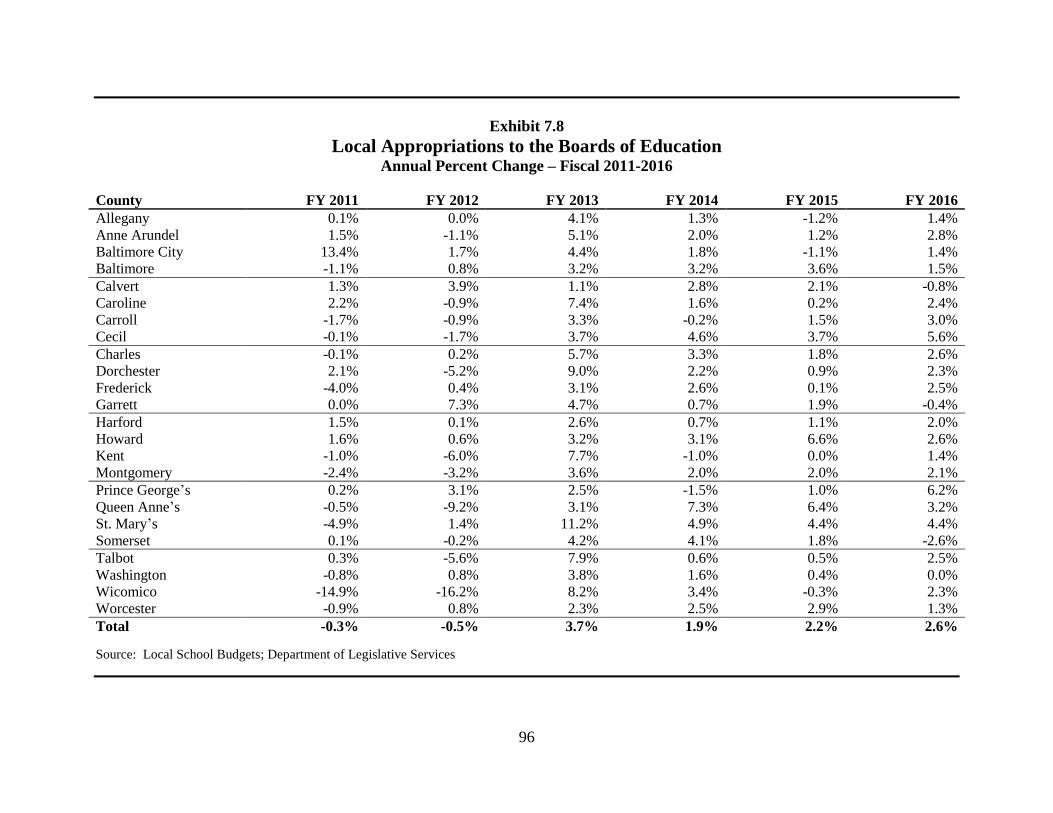
96
Exhibit 7.8
Local Appropriations to the Boards of Education Annual Percent Change – Fiscal 2011-2016
County FY 2011 FY 2012 FY 2013 FY 2014 FY 2015 FY 2016
Allegany 0.1% 0.0% 4.1% 1.3% -1.2% 1.4%
Anne Arundel 1.5% -1.1% 5.1% 2.0% 1.2% 2.8%
Baltimore City 13.4% 1.7% 4.4% 1.8% -1.1% 1.4%
Baltimore -1.1% 0.8% 3.2% 3.2% 3.6% 1.5%
Calvert 1.3% 3.9% 1.1% 2.8% 2.1% -0.8%
Caroline 2.2% -0.9% 7.4% 1.6% 0.2% 2.4%
Carroll -1.7% -0.9% 3.3% -0.2% 1.5% 3.0%
Cecil -0.1% -1.7% 3.7% 4.6% 3.7% 5.6%
Charles -0.1% 0.2% 5.7% 3.3% 1.8% 2.6%
Dorchester 2.1% -5.2% 9.0% 2.2% 0.9% 2.3%
Frederick -4.0% 0.4% 3.1% 2.6% 0.1% 2.5%
Garrett 0.0% 7.3% 4.7% 0.7% 1.9% -0.4%
Harford 1.5% 0.1% 2.6% 0.7% 1.1% 2.0%
Howard 1.6% 0.6% 3.2% 3.1% 6.6% 2.6%
Kent -1.0% -6.0% 7.7% -1.0% 0.0% 1.4%
Montgomery -2.4% -3.2% 3.6% 2.0% 2.0% 2.1%
Prince George’s 0.2% 3.1% 2.5% -1.5% 1.0% 6.2%
Queen Anne’s -0.5% -9.2% 3.1% 7.3% 6.4% 3.2%
St. Mary’s -4.9% 1.4% 11.2% 4.9% 4.4% 4.4%
Somerset 0.1% -0.2% 4.2% 4.1% 1.8% -2.6%
Talbot 0.3% -5.6% 7.9% 0.6% 0.5% 2.5%
Washington -0.8% 0.8% 3.8% 1.6% 0.4% 0.0%
Wicomico -14.9% -16.2% 8.2% 3.4% -0.3% 2.3%
Worcester -0.9% 0.8% 2.3% 2.5% 2.9% 1.3%
Total -0.3% -0.5% 3.7% 1.9% 2.2% 2.6%
Source: Local School Budgets; Department of Legislative Services
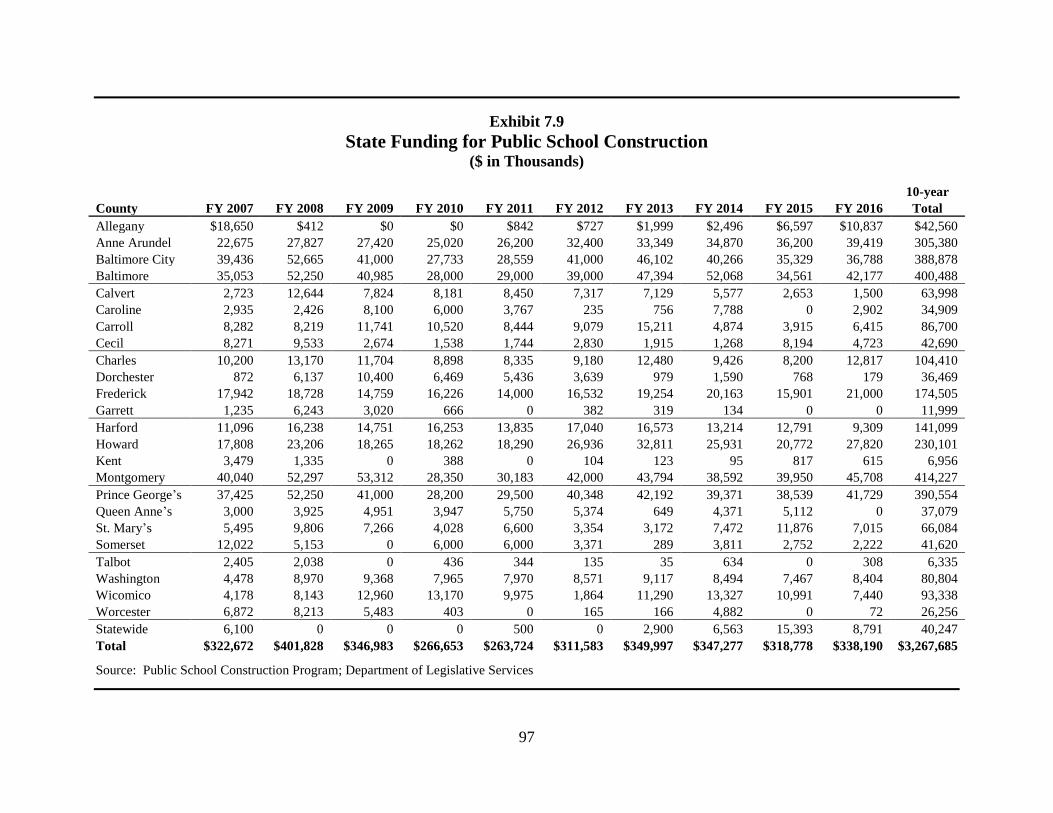
97
Exhibit 7.9
State Funding for Public School Construction ($ in Thousands)
10-year
County FY 2007 FY 2008 FY 2009 FY 2010 FY 2011 FY 2012 FY 2013 FY 2014 FY 2015 FY 2016 Total
Allegany $18,650 $412 $0 $0 $842 $727 $1,999 $2,496 $6,597 $10,837 $42,560
Anne Arundel 22,675 27,827 27,420 25,020 26,200 32,400 33,349 34,870 36,200 39,419 305,380
Baltimore City 39,436 52,665 41,000 27,733 28,559 41,000 46,102 40,266 35,329 36,788 388,878
Baltimore 35,053 52,250 40,985 28,000 29,000 39,000 47,394 52,068 34,561 42,177 400,488
Calvert 2,723 12,644 7,824 8,181 8,450 7,317 7,129 5,577 2,653 1,500 63,998
Caroline 2,935 2,426 8,100 6,000 3,767 235 756 7,788 0 2,902 34,909
Carroll 8,282 8,219 11,741 10,520 8,444 9,079 15,211 4,874 3,915 6,415 86,700
Cecil 8,271 9,533 2,674 1,538 1,744 2,830 1,915 1,268 8,194 4,723 42,690
Charles 10,200 13,170 11,704 8,898 8,335 9,180 12,480 9,426 8,200 12,817 104,410
Dorchester 872 6,137 10,400 6,469 5,436 3,639 979 1,590 768 179 36,469
Frederick 17,942 18,728 14,759 16,226 14,000 16,532 19,254 20,163 15,901 21,000 174,505
Garrett 1,235 6,243 3,020 666 0 382 319 134 0 0 11,999
Harford 11,096 16,238 14,751 16,253 13,835 17,040 16,573 13,214 12,791 9,309 141,099
Howard 17,808 23,206 18,265 18,262 18,290 26,936 32,811 25,931 20,772 27,820 230,101
Kent 3,479 1,335 0 388 0 104 123 95 817 615 6,956
Montgomery 40,040 52,297 53,312 28,350 30,183 42,000 43,794 38,592 39,950 45,708 414,227
Prince George’s 37,425 52,250 41,000 28,200 29,500 40,348 42,192 39,371 38,539 41,729 390,554
Queen Anne’s 3,000 3,925 4,951 3,947 5,750 5,374 649 4,371 5,112 0 37,079
St. Mary’s 5,495 9,806 7,266 4,028 6,600 3,354 3,172 7,472 11,876 7,015 66,084
Somerset 12,022 5,153 0 6,000 6,000 3,371 289 3,811 2,752 2,222 41,620
Talbot 2,405 2,038 0 436 344 135 35 634 0 308 6,335
Washington 4,478 8,970 9,368 7,965 7,970 8,571 9,117 8,494 7,467 8,404 80,804
Wicomico 4,178 8,143 12,960 13,170 9,975 1,864 11,290 13,327 10,991 7,440 93,338
Worcester 6,872 8,213 5,483 403 0 165 166 4,882 0 72 26,256
Statewide 6,100 0 0 0 500 0 2,900 6,563 15,393 8,791 40,247
Total $322,672 $401,828 $346,983 $266,653 $263,724 $311,583 $349,997 $347,277 $318,778 $338,190 $3,267,685
Source: Public School Construction Program; Department of Legislative Services
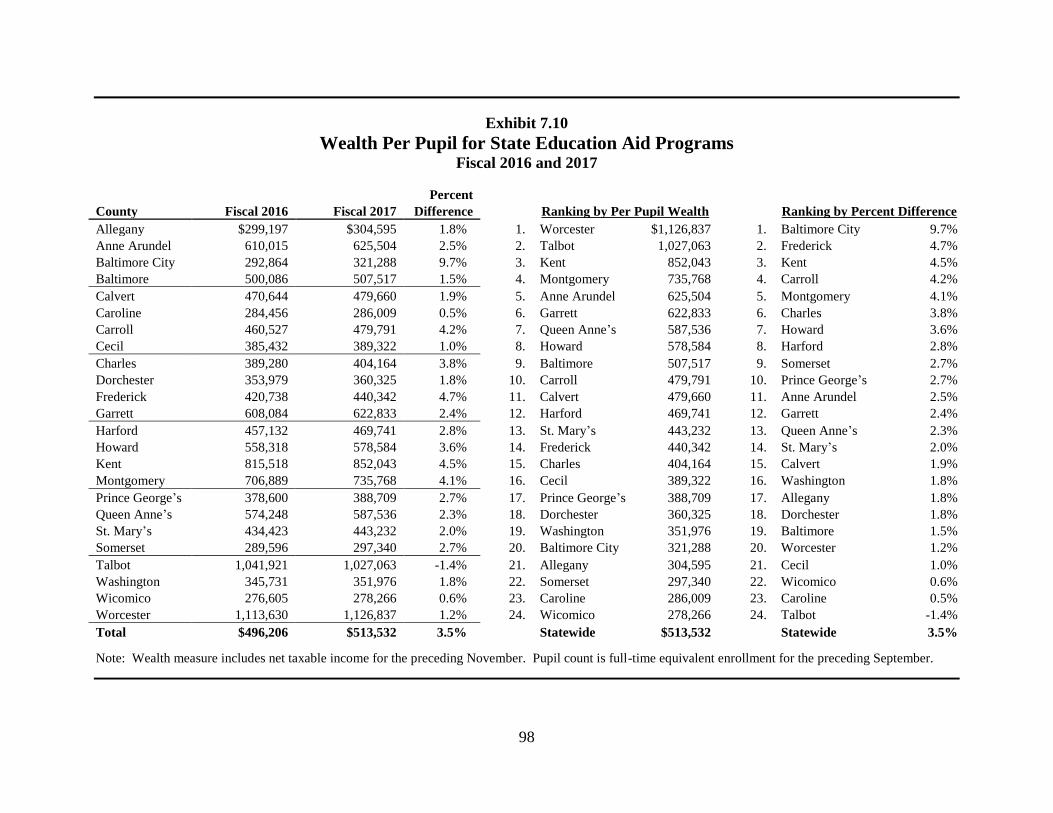
98
Exhibit 7.10
Wealth Per Pupil for State Education Aid Programs Fiscal 2016 and 2017
Percent
County Fiscal 2016 Fiscal 2017 Difference
Ranking by Per Pupil Wealth
Ranking by Percent Difference
Allegany $299,197 $304,595 1.8% 1. Worcester $1,126,837 1. Baltimore City 9.7%
Anne Arundel 610,015 625,504 2.5% 2. Talbot 1,027,063 2. Frederick 4.7%
Baltimore City 292,864 321,288 9.7% 3. Kent 852,043 3. Kent 4.5%
Baltimore 500,086 507,517 1.5% 4. Montgomery 735,768 4. Carroll 4.2%
Calvert 470,644 479,660 1.9% 5. Anne Arundel 625,504 5. Montgomery 4.1%
Caroline 284,456 286,009 0.5% 6. Garrett 622,833 6. Charles 3.8%
Carroll 460,527 479,791 4.2% 7. Queen Anne’s 587,536 7. Howard 3.6%
Cecil 385,432 389,322 1.0% 8. Howard 578,584 8. Harford 2.8%
Charles 389,280 404,164 3.8% 9. Baltimore 507,517 9. Somerset 2.7%
Dorchester 353,979 360,325 1.8% 10. Carroll 479,791 10. Prince George’s 2.7%
Frederick 420,738 440,342 4.7% 11. Calvert 479,660 11. Anne Arundel 2.5%
Garrett 608,084 622,833 2.4% 12. Harford 469,741 12. Garrett 2.4%
Harford 457,132 469,741 2.8% 13. St. Mary’s 443,232 13. Queen Anne’s 2.3%
Howard 558,318 578,584 3.6% 14. Frederick 440,342 14. St. Mary’s 2.0%
Kent 815,518 852,043 4.5% 15. Charles 404,164 15. Calvert 1.9%
Montgomery 706,889 735,768 4.1% 16. Cecil 389,322 16. Washington 1.8%
Prince George’s 378,600 388,709 2.7% 17. Prince George’s 388,709 17. Allegany 1.8%
Queen Anne’s 574,248 587,536 2.3% 18. Dorchester 360,325 18. Dorchester 1.8%
St. Mary’s 434,423 443,232 2.0% 19. Washington 351,976 19. Baltimore 1.5%
Somerset 289,596 297,340 2.7% 20. Baltimore City 321,288 20. Worcester 1.2%
Talbot 1,041,921 1,027,063 -1.4% 21. Allegany 304,595 21. Cecil 1.0%
Washington 345,731 351,976 1.8% 22. Somerset 297,340 22. Wicomico 0.6%
Wicomico 276,605 278,266 0.6% 23. Caroline 286,009 23. Caroline 0.5%
Worcester 1,113,630 1,126,837 1.2% 24. Wicomico 278,266 24. Talbot -1.4%
Total $496,206 $513,532 3.5%
Statewide $513,532
Statewide 3.5%
Note: Wealth measure includes net taxable income for the preceding November. Pupil count is full-time equivalent enrollment for the preceding September.
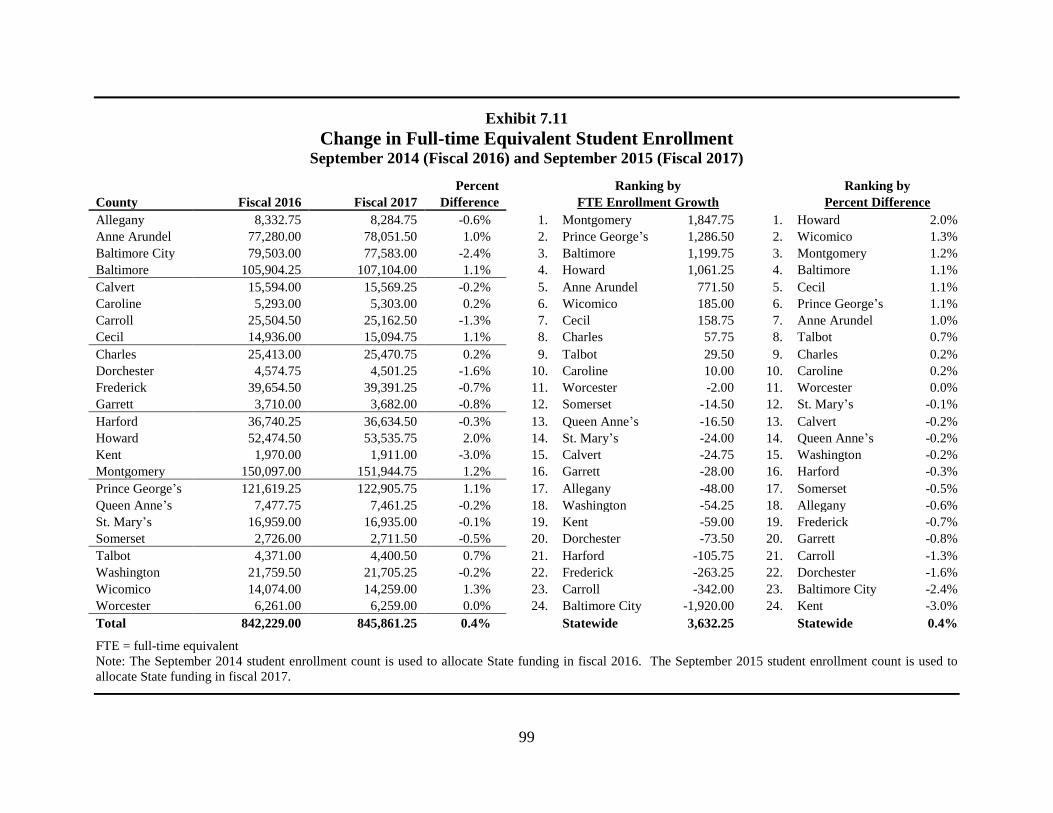
99
Exhibit 7.11
Change in Full-time Equivalent Student Enrollment September 2014 (Fiscal 2016) and September 2015 (Fiscal 2017)
Percent
Ranking by
Ranking by
County Fiscal 2016 Fiscal 2017 Difference
FTE Enrollment Growth
Percent Difference
Allegany 8,332.75 8,284.75 -0.6% 1. Montgomery 1,847.75 1. Howard 2.0%
Anne Arundel 77,280.00 78,051.50 1.0% 2. Prince George’s 1,286.50 2. Wicomico 1.3%
Baltimore City 79,503.00 77,583.00 -2.4% 3. Baltimore 1,199.75 3. Montgomery 1.2%
Baltimore 105,904.25 107,104.00 1.1% 4. Howard 1,061.25 4. Baltimore 1.1%
Calvert 15,594.00 15,569.25 -0.2% 5. Anne Arundel 771.50 5. Cecil 1.1%
Caroline 5,293.00 5,303.00 0.2% 6. Wicomico 185.00 6. Prince George’s 1.1%
Carroll 25,504.50 25,162.50 -1.3% 7. Cecil 158.75 7. Anne Arundel 1.0%
Cecil 14,936.00 15,094.75 1.1% 8. Charles 57.75 8. Talbot 0.7%
Charles 25,413.00 25,470.75 0.2% 9. Talbot 29.50 9. Charles 0.2%
Dorchester 4,574.75 4,501.25 -1.6% 10. Caroline 10.00 10. Caroline 0.2%
Frederick 39,654.50 39,391.25 -0.7% 11. Worcester -2.00 11. Worcester 0.0%
Garrett 3,710.00 3,682.00 -0.8% 12. Somerset -14.50 12. St. Mary’s -0.1%
Harford 36,740.25 36,634.50 -0.3% 13. Queen Anne’s -16.50 13. Calvert -0.2%
Howard 52,474.50 53,535.75 2.0% 14. St. Mary’s -24.00 14. Queen Anne’s -0.2%
Kent 1,970.00 1,911.00 -3.0% 15. Calvert -24.75 15. Washington -0.2%
Montgomery 150,097.00 151,944.75 1.2% 16. Garrett -28.00 16. Harford -0.3%
Prince George’s 121,619.25 122,905.75 1.1% 17. Allegany -48.00 17. Somerset -0.5%
Queen Anne’s 7,477.75 7,461.25 -0.2% 18. Washington -54.25 18. Allegany -0.6%
St. Mary’s 16,959.00 16,935.00 -0.1% 19. Kent -59.00 19. Frederick -0.7%
Somerset 2,726.00 2,711.50 -0.5% 20. Dorchester -73.50 20. Garrett -0.8%
Talbot 4,371.00 4,400.50 0.7% 21. Harford -105.75 21. Carroll -1.3%
Washington 21,759.50 21,705.25 -0.2% 22. Frederick -263.25 22. Dorchester -1.6%
Wicomico 14,074.00 14,259.00 1.3% 23. Carroll -342.00 23. Baltimore City -2.4%
Worcester 6,261.00 6,259.00 0.0% 24. Baltimore City -1,920.00 24. Kent -3.0%
Total 842,229.00 845,861.25 0.4%
Statewide 3,632.25
Statewide 0.4%
FTE = full-time equivalent
Note: The September 2014 student enrollment count is used to allocate State funding in fiscal 2016. The September 2015 student enrollment count is used to
allocate State funding in fiscal 2017.
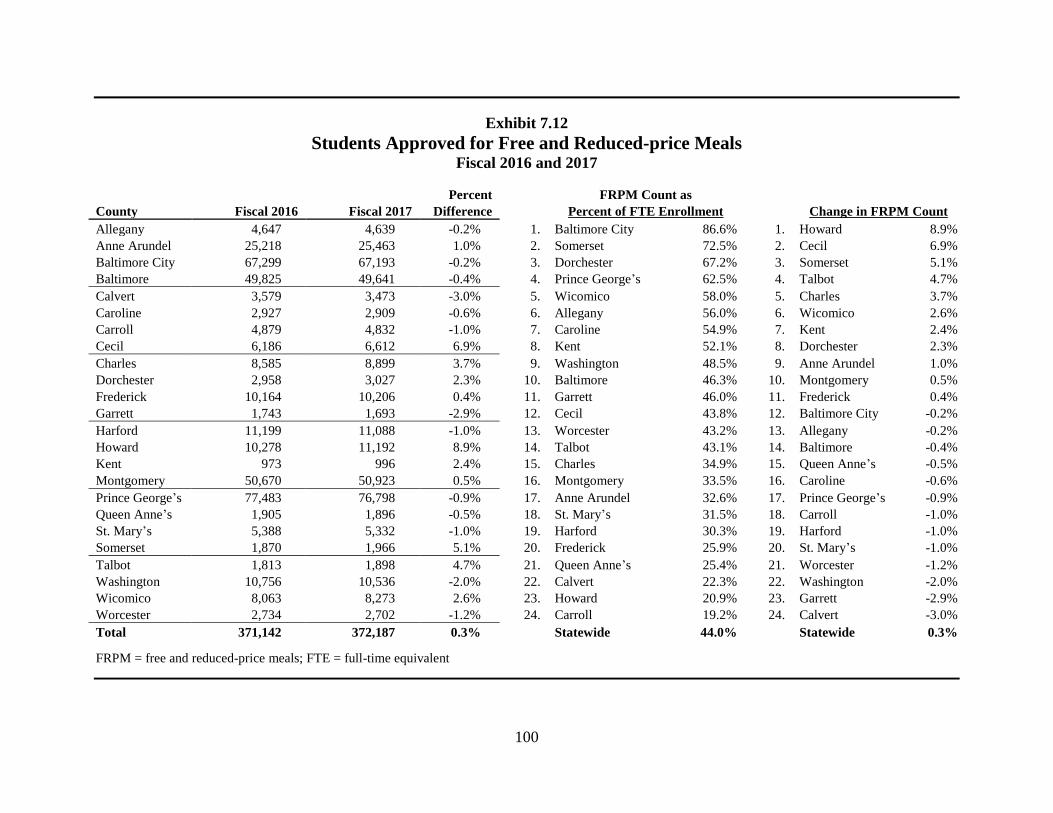
100
Exhibit 7.12
Students Approved for Free and Reduced-price Meals Fiscal 2016 and 2017
Percent
FRPM Count as
County Fiscal 2016 Fiscal 2017 Difference
Percent of FTE Enrollment
Change in FRPM Count
Allegany 4,647 4,639 -0.2% 1. Baltimore City 86.6% 1. Howard 8.9%
Anne Arundel 25,218 25,463 1.0% 2. Somerset 72.5% 2. Cecil 6.9%
Baltimore City 67,299 67,193 -0.2% 3. Dorchester 67.2% 3. Somerset 5.1%
Baltimore 49,825 49,641 -0.4% 4. Prince George’s 62.5% 4. Talbot 4.7%
Calvert 3,579 3,473 -3.0% 5. Wicomico 58.0% 5. Charles 3.7%
Caroline 2,927 2,909 -0.6% 6. Allegany 56.0% 6. Wicomico 2.6%
Carroll 4,879 4,832 -1.0% 7. Caroline 54.9% 7. Kent 2.4%
Cecil 6,186 6,612 6.9% 8. Kent 52.1% 8. Dorchester 2.3%
Charles 8,585 8,899 3.7% 9. Washington 48.5% 9. Anne Arundel 1.0%
Dorchester 2,958 3,027 2.3% 10. Baltimore 46.3% 10. Montgomery 0.5%
Frederick 10,164 10,206 0.4% 11. Garrett 46.0% 11. Frederick 0.4%
Garrett 1,743 1,693 -2.9% 12. Cecil 43.8% 12. Baltimore City -0.2%
Harford 11,199 11,088 -1.0% 13. Worcester 43.2% 13. Allegany -0.2%
Howard 10,278 11,192 8.9% 14. Talbot 43.1% 14. Baltimore -0.4%
Kent 973 996 2.4% 15. Charles 34.9% 15. Queen Anne’s -0.5%
Montgomery 50,670 50,923 0.5% 16. Montgomery 33.5% 16. Caroline -0.6%
Prince George’s 77,483 76,798 -0.9% 17. Anne Arundel 32.6% 17. Prince George’s -0.9%
Queen Anne’s 1,905 1,896 -0.5% 18. St. Mary’s 31.5% 18. Carroll -1.0%
St. Mary’s 5,388 5,332 -1.0% 19. Harford 30.3% 19. Harford -1.0%
Somerset 1,870 1,966 5.1% 20. Frederick 25.9% 20. St. Mary’s -1.0%
Talbot 1,813 1,898 4.7% 21. Queen Anne’s 25.4% 21. Worcester -1.2%
Washington 10,756 10,536 -2.0% 22. Calvert 22.3% 22. Washington -2.0%
Wicomico 8,063 8,273 2.6% 23. Howard 20.9% 23. Garrett -2.9%
Worcester 2,734 2,702 -1.2% 24. Carroll 19.2% 24. Calvert -3.0%
Total 371,142 372,187 0.3%
Statewide 44.0%
Statewide 0.3%
FRPM = free and reduced-price meals; FTE = full-time equivalent
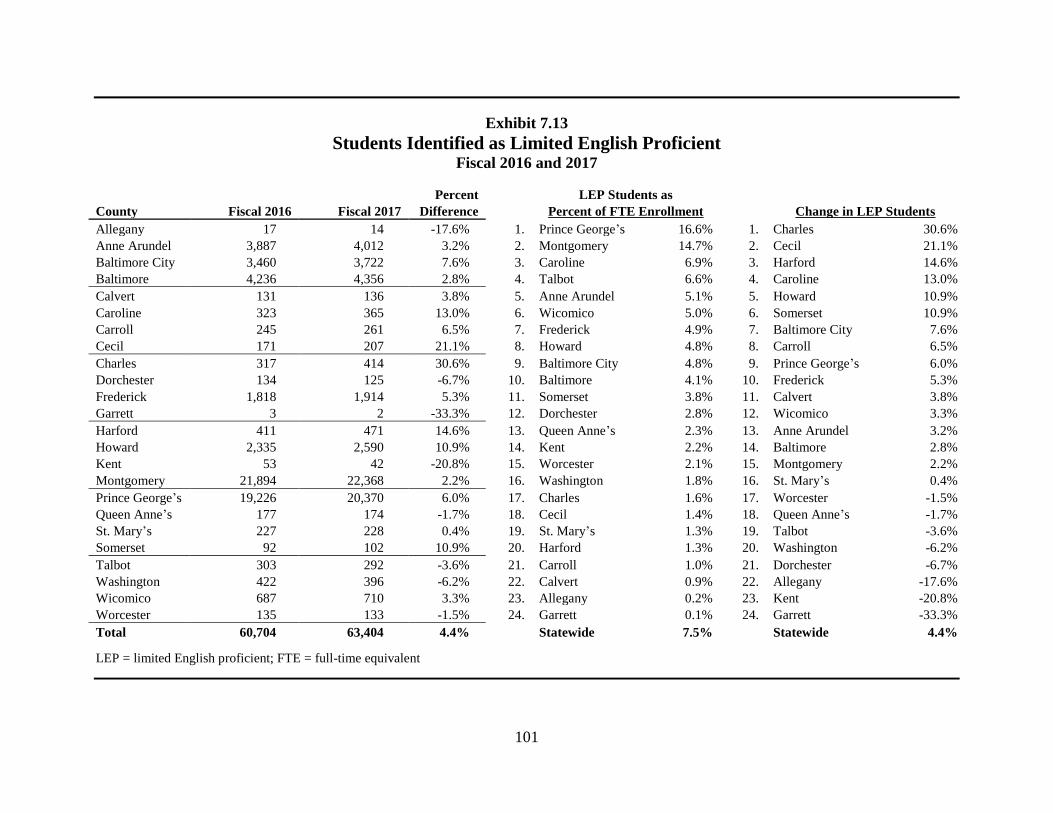
101
Exhibit 7.13
Students Identified as Limited English Proficient Fiscal 2016 and 2017
Percent
LEP Students as
County Fiscal 2016 Fiscal 2017 Difference
Percent of FTE Enrollment
Change in LEP Students
Allegany 17 14 -17.6% 1. Prince George’s 16.6% 1. Charles 30.6%
Anne Arundel 3,887 4,012 3.2% 2. Montgomery 14.7% 2. Cecil 21.1%
Baltimore City 3,460 3,722 7.6% 3. Caroline 6.9% 3. Harford 14.6%
Baltimore 4,236 4,356 2.8% 4. Talbot 6.6% 4. Caroline 13.0%
Calvert 131 136 3.8% 5. Anne Arundel 5.1% 5. Howard 10.9%
Caroline 323 365 13.0% 6. Wicomico 5.0% 6. Somerset 10.9%
Carroll 245 261 6.5% 7. Frederick 4.9% 7. Baltimore City 7.6%
Cecil 171 207 21.1% 8. Howard 4.8% 8. Carroll 6.5%
Charles 317 414 30.6% 9. Baltimore City 4.8% 9. Prince George’s 6.0%
Dorchester 134 125 -6.7% 10. Baltimore 4.1% 10. Frederick 5.3%
Frederick 1,818 1,914 5.3% 11. Somerset 3.8% 11. Calvert 3.8%
Garrett 3 2 -33.3% 12. Dorchester 2.8% 12. Wicomico 3.3%
Harford 411 471 14.6% 13. Queen Anne’s 2.3% 13. Anne Arundel 3.2%
Howard 2,335 2,590 10.9% 14. Kent 2.2% 14. Baltimore 2.8%
Kent 53 42 -20.8% 15. Worcester 2.1% 15. Montgomery 2.2%
Montgomery 21,894 22,368 2.2% 16. Washington 1.8% 16. St. Mary’s 0.4%
Prince George’s 19,226 20,370 6.0% 17. Charles 1.6% 17. Worcester -1.5%
Queen Anne’s 177 174 -1.7% 18. Cecil 1.4% 18. Queen Anne’s -1.7%
St. Mary’s 227 228 0.4% 19. St. Mary’s 1.3% 19. Talbot -3.6%
Somerset 92 102 10.9% 20. Harford 1.3% 20. Washington -6.2%
Talbot 303 292 -3.6% 21. Carroll 1.0% 21. Dorchester -6.7%
Washington 422 396 -6.2% 22. Calvert 0.9% 22. Allegany -17.6%
Wicomico 687 710 3.3% 23. Allegany 0.2% 23. Kent -20.8%
Worcester 135 133 -1.5% 24. Garrett 0.1% 24. Garrett -33.3%
Total 60,704 63,404 4.4%
Statewide 7.5%
Statewide 4.4%
LEP = limited English proficient; FTE = full-time equivalent
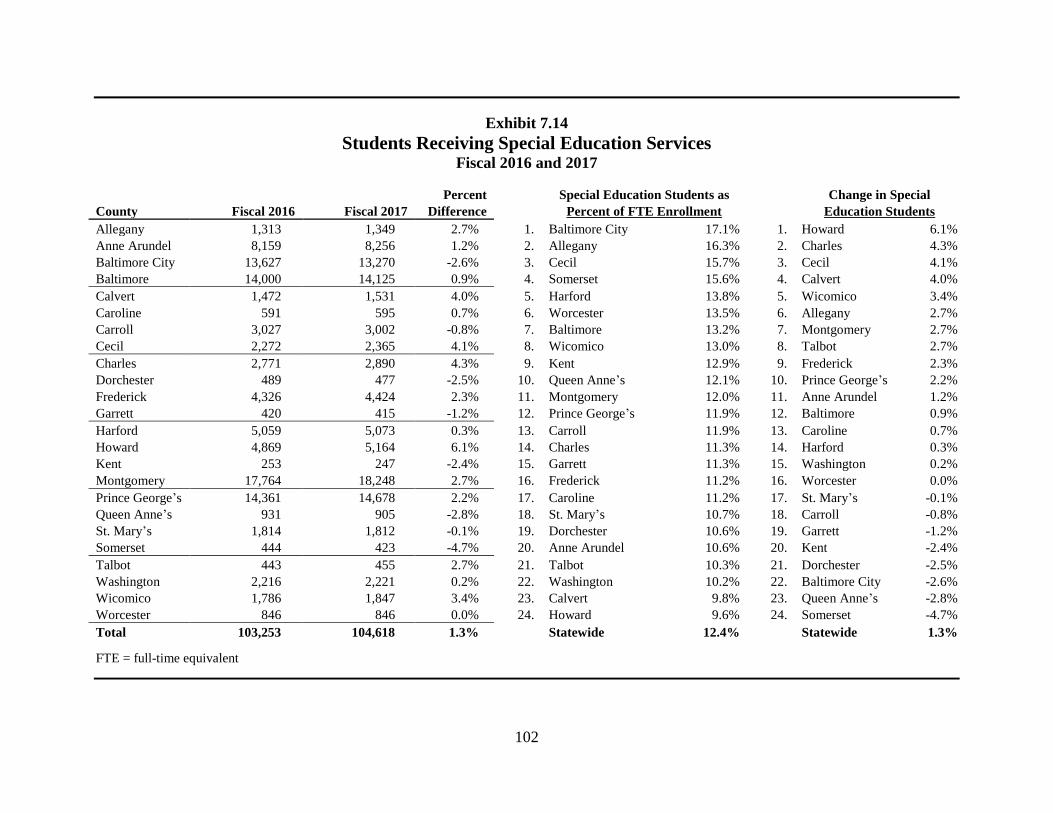
102
Exhibit 7.14
Students Receiving Special Education Services Fiscal 2016 and 2017
Percent
Special Education Students as
Change in Special
County Fiscal 2016 Fiscal 2017 Difference
Percent of FTE Enrollment
Education Students
Allegany 1,313 1,349 2.7% 1. Baltimore City 17.1% 1. Howard 6.1%
Anne Arundel 8,159 8,256 1.2% 2. Allegany 16.3% 2. Charles 4.3%
Baltimore City 13,627 13,270 -2.6% 3. Cecil 15.7% 3. Cecil 4.1%
Baltimore 14,000 14,125 0.9% 4. Somerset 15.6% 4. Calvert 4.0%
Calvert 1,472 1,531 4.0% 5. Harford 13.8% 5. Wicomico 3.4%
Caroline 591 595 0.7% 6. Worcester 13.5% 6. Allegany 2.7%
Carroll 3,027 3,002 -0.8% 7. Baltimore 13.2% 7. Montgomery 2.7%
Cecil 2,272 2,365 4.1% 8. Wicomico 13.0% 8. Talbot 2.7%
Charles 2,771 2,890 4.3% 9. Kent 12.9% 9. Frederick 2.3%
Dorchester 489 477 -2.5% 10. Queen Anne’s 12.1% 10. Prince George’s 2.2%
Frederick 4,326 4,424 2.3% 11. Montgomery 12.0% 11. Anne Arundel 1.2%
Garrett 420 415 -1.2% 12. Prince George’s 11.9% 12. Baltimore 0.9%
Harford 5,059 5,073 0.3% 13. Carroll 11.9% 13. Caroline 0.7%
Howard 4,869 5,164 6.1% 14. Charles 11.3% 14. Harford 0.3%
Kent 253 247 -2.4% 15. Garrett 11.3% 15. Washington 0.2%
Montgomery 17,764 18,248 2.7% 16. Frederick 11.2% 16. Worcester 0.0%
Prince George’s 14,361 14,678 2.2% 17. Caroline 11.2% 17. St. Mary’s -0.1%
Queen Anne’s 931 905 -2.8% 18. St. Mary’s 10.7% 18. Carroll -0.8%
St. Mary’s 1,814 1,812 -0.1% 19. Dorchester 10.6% 19. Garrett -1.2%
Somerset 444 423 -4.7% 20. Anne Arundel 10.6% 20. Kent -2.4%
Talbot 443 455 2.7% 21. Talbot 10.3% 21. Dorchester -2.5%
Washington 2,216 2,221 0.2% 22. Washington 10.2% 22. Baltimore City -2.6%
Wicomico 1,786 1,847 3.4% 23. Calvert 9.8% 23. Queen Anne’s -2.8%
Worcester 846 846 0.0% 24. Howard 9.6% 24. Somerset -4.7%
Total 103,253 104,618 1.3%
Statewide 12.4%
Statewide 1.3%
FTE = full-time equivalent
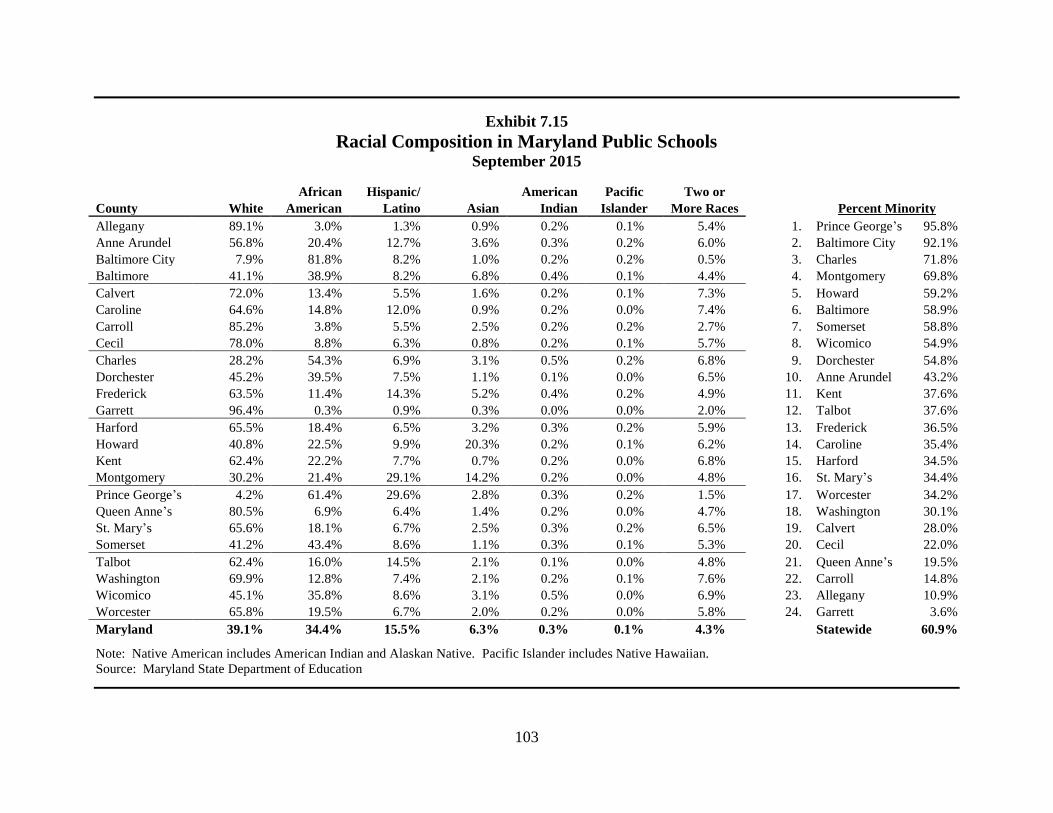
103
Exhibit 7.15
Racial Composition in Maryland Public Schools September 2015
African Hispanic/
American Pacific Two or
Percent Minority County White American Latino Asian Indian Islander More Races
Allegany 89.1% 3.0% 1.3% 0.9% 0.2% 0.1% 5.4% 1. Prince George’s 95.8%
Anne Arundel 56.8% 20.4% 12.7% 3.6% 0.3% 0.2% 6.0% 2. Baltimore City 92.1%
Baltimore City 7.9% 81.8% 8.2% 1.0% 0.2% 0.2% 0.5% 3. Charles 71.8%
Baltimore 41.1% 38.9% 8.2% 6.8% 0.4% 0.1% 4.4% 4. Montgomery 69.8%
Calvert 72.0% 13.4% 5.5% 1.6% 0.2% 0.1% 7.3% 5. Howard 59.2%
Caroline 64.6% 14.8% 12.0% 0.9% 0.2% 0.0% 7.4% 6. Baltimore 58.9%
Carroll 85.2% 3.8% 5.5% 2.5% 0.2% 0.2% 2.7% 7. Somerset 58.8%
Cecil 78.0% 8.8% 6.3% 0.8% 0.2% 0.1% 5.7% 8. Wicomico 54.9%
Charles 28.2% 54.3% 6.9% 3.1% 0.5% 0.2% 6.8% 9. Dorchester 54.8%
Dorchester 45.2% 39.5% 7.5% 1.1% 0.1% 0.0% 6.5% 10. Anne Arundel 43.2%
Frederick 63.5% 11.4% 14.3% 5.2% 0.4% 0.2% 4.9% 11. Kent 37.6%
Garrett 96.4% 0.3% 0.9% 0.3% 0.0% 0.0% 2.0% 12. Talbot 37.6%
Harford 65.5% 18.4% 6.5% 3.2% 0.3% 0.2% 5.9% 13. Frederick 36.5%
Howard 40.8% 22.5% 9.9% 20.3% 0.2% 0.1% 6.2% 14. Caroline 35.4%
Kent 62.4% 22.2% 7.7% 0.7% 0.2% 0.0% 6.8% 15. Harford 34.5%
Montgomery 30.2% 21.4% 29.1% 14.2% 0.2% 0.0% 4.8% 16. St. Mary’s 34.4%
Prince George’s 4.2% 61.4% 29.6% 2.8% 0.3% 0.2% 1.5% 17. Worcester 34.2%
Queen Anne’s 80.5% 6.9% 6.4% 1.4% 0.2% 0.0% 4.7% 18. Washington 30.1%
St. Mary’s 65.6% 18.1% 6.7% 2.5% 0.3% 0.2% 6.5% 19. Calvert 28.0%
Somerset 41.2% 43.4% 8.6% 1.1% 0.3% 0.1% 5.3% 20. Cecil 22.0%
Talbot 62.4% 16.0% 14.5% 2.1% 0.1% 0.0% 4.8% 21. Queen Anne’s 19.5%
Washington 69.9% 12.8% 7.4% 2.1% 0.2% 0.1% 7.6% 22. Carroll 14.8%
Wicomico 45.1% 35.8% 8.6% 3.1% 0.5% 0.0% 6.9% 23. Allegany 10.9%
Worcester 65.8% 19.5% 6.7% 2.0% 0.2% 0.0% 5.8% 24. Garrett 3.6%
Maryland 39.1% 34.4% 15.5% 6.3% 0.3% 0.1% 4.3%
Statewide 60.9%
Note: Native American includes American Indian and Alaskan Native. Pacific Islander includes Native Hawaiian.
Source: Maryland State Department of Education

104
105
Chapter 8. Local General Fund Balances
The Comprehensive Annual Financial Reports prepared by
the counties show their general fund balances for a given
fiscal year. These fund balances are currently divided into
five categories based upon the requirements of GASB 54,
which first took effect in fiscal 2011. Exhibit 8.1 shows how
county governments reported their general fund balances in
fiscal 2015. Descriptions of the five fund balance categories
are provided below.
Nonspendable includes funds that cannot be spent either
because they are in a nonspendable form (e.g., prepaid items
and inventories of supplies) or because they are legally or
contractually required to be maintained intact (e.g., the
principal of an endowment or the capital of a revolving loan
fund).
Restricted includes funds with limitations imposed by
creditors, grantors, contributors, or laws or regulations of other
governments, or limitations imposed by law through
constitutional provisions or enabling legislation.
Committed includes unrestricted funds with limitations
imposed at the highest level of county decision-making
authority.
Assigned includes unrestricted funds that are constrained by
the county government’s intent to be used for specific
purposes, but meet neither the restricted nor committed forms
of constraint.
Unassigned includes all unrestricted funds that cannot be
assigned to any of the other fund balance categories.
The five fund balance categories serve to distinguish the
extent to which the county government is bound to honor
constraints on the specific purposes for which amounts can be
spent. The total of the last three fund balance categories
(committed, assigned, and unassigned) are often grouped
together with the term unrestricted fund balance. Unrestricted
fund balances include only those resources without a constraint
on spending or for which the constraint on spending is imposed
by the government itself. Many counties have requirements to
maintain a “rainy day” fund. “Rainy day” funds are those
funds counties set aside for use in the event of an economic
downturn, and these funds are frequently reported within a
county’s unrestricted fund balances.
As shown in Exhibit 8.2, county governments ended
fiscal 2015 with total unrestricted general fund balances,
including “rainy day” accounts, totaling $2.3 billion. A
county’s unrestricted general fund balance as a percent of
general fund revenues is one indicator of a county’s fiscal
health and a county’s ability to withstand an economic
downturn. Additionally, credit rating agencies will frequently
monitor levels of general fund balance and unrestricted fund
balance in their evaluation of a local government’s
creditworthiness. In fiscal 2015, unrestricted general fund
balance, including “rainy day” funds, as a percent of general
fund revenues averages 16.4% across county governments,
ranging from 9.4% in Anne Arundel County to 37.3% in
106
Wicomico County. In fiscal 2015, 21 counties reported
“rainy day” funds totaling approximately $897.8 million or
6.5% of total general fund revenues.
Exhibit 8.3 shows the combined unrestricted general
fund/“rainy day” balances over the last four fiscal years.
Between fiscal 2014 and 2015, 12 counties reported an increase
in their unrestricted general fund/“rainy day” balances, while
12 counties experienced decreases in their general fund
balances over this period.
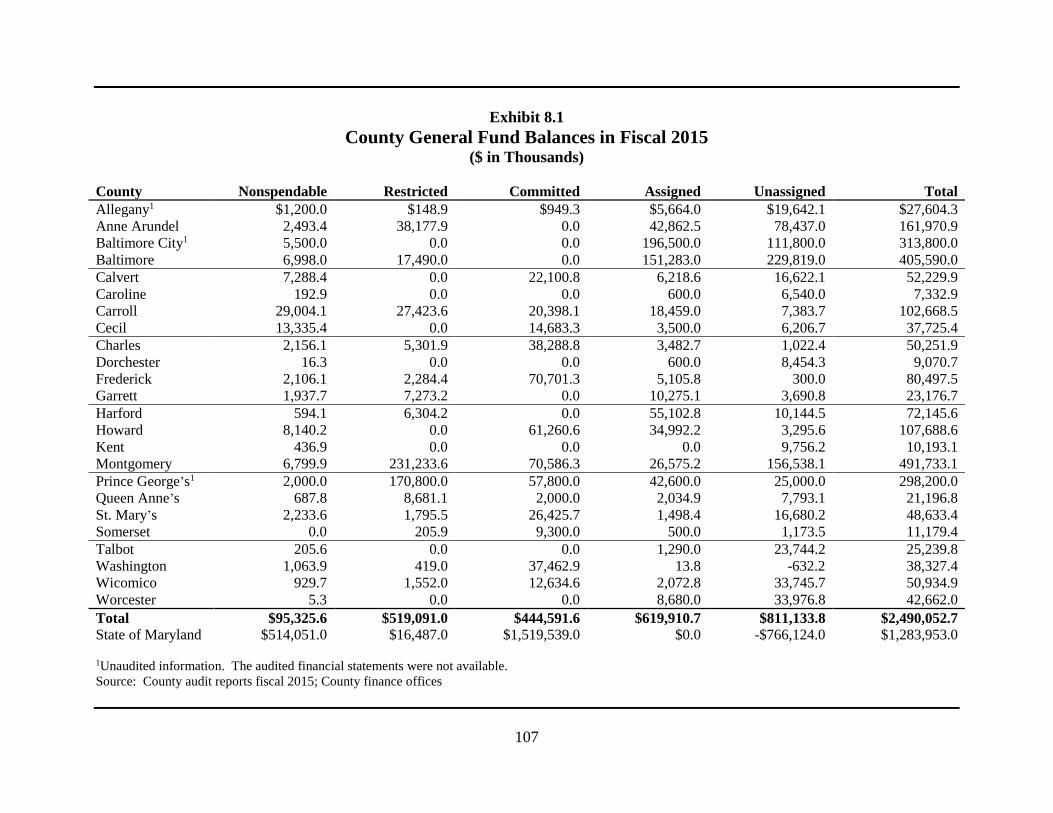
107
Exhibit 8.1
County General Fund Balances in Fiscal 2015 ($ in Thousands)
County Nonspendable Restricted Committed Assigned Unassigned Total
Allegany1 $1,200.0 $148.9 $949.3 $5,664.0 $19,642.1 $27,604.3
Anne Arundel 2,493.4 38,177.9 0.0 42,862.5 78,437.0 161,970.9
Baltimore City1 5,500.0 0.0 0.0 196,500.0 111,800.0 313,800.0
Baltimore 6,998.0 17,490.0 0.0 151,283.0 229,819.0 405,590.0
Calvert 7,288.4 0.0 22,100.8 6,218.6 16,622.1 52,229.9
Caroline 192.9 0.0 0.0 600.0 6,540.0 7,332.9
Carroll 29,004.1 27,423.6 20,398.1 18,459.0 7,383.7 102,668.5
Cecil 13,335.4 0.0 14,683.3 3,500.0 6,206.7 37,725.4
Charles 2,156.1 5,301.9 38,288.8 3,482.7 1,022.4 50,251.9
Dorchester 16.3 0.0 0.0 600.0 8,454.3 9,070.7
Frederick 2,106.1 2,284.4 70,701.3 5,105.8 300.0 80,497.5
Garrett 1,937.7 7,273.2 0.0 10,275.1 3,690.8 23,176.7
Harford 594.1 6,304.2 0.0 55,102.8 10,144.5 72,145.6
Howard 8,140.2 0.0 61,260.6 34,992.2 3,295.6 107,688.6
Kent 436.9 0.0 0.0 0.0 9,756.2 10,193.1
Montgomery 6,799.9 231,233.6 70,586.3 26,575.2 156,538.1 491,733.1
Prince George’s1 2,000.0 170,800.0 57,800.0 42,600.0 25,000.0 298,200.0
Queen Anne’s 687.8 8,681.1 2,000.0 2,034.9 7,793.1 21,196.8
St. Mary’s 2,233.6 1,795.5 26,425.7 1,498.4 16,680.2 48,633.4
Somerset 0.0 205.9 9,300.0 500.0 1,173.5 11,179.4
Talbot 205.6 0.0 0.0 1,290.0 23,744.2 25,239.8
Washington 1,063.9 419.0 37,462.9 13.8 -632.2 38,327.4
Wicomico 929.7 1,552.0 12,634.6 2,072.8 33,745.7 50,934.9
Worcester 5.3 0.0 0.0 8,680.0 33,976.8 42,662.0
Total $95,325.6 $519,091.0 $444,591.6 $619,910.7 $811,133.8 $2,490,052.7
State of Maryland $514,051.0 $16,487.0 $1,519,539.0 $0.0 -$766,124.0 $1,283,953.0 1Unaudited information. The audited financial statements were not available.
Source: County audit reports fiscal 2015; County finance offices
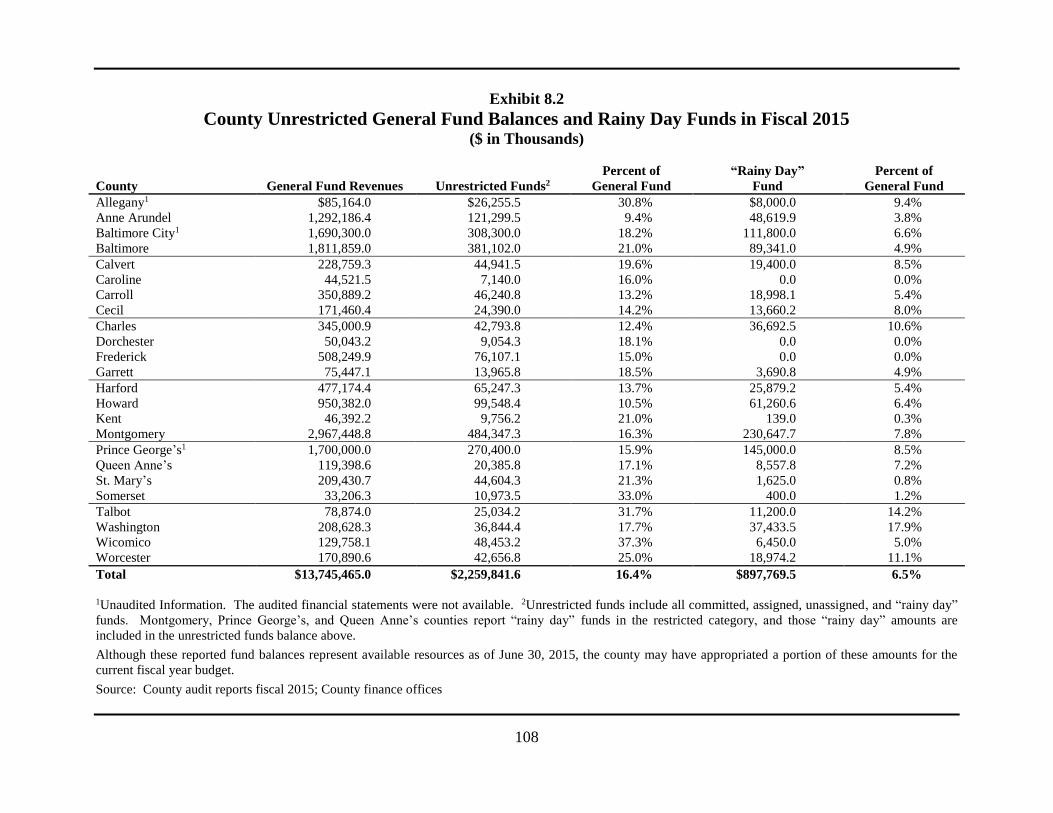
108
Exhibit 8.2
County Unrestricted General Fund Balances and Rainy Day Funds in Fiscal 2015 ($ in Thousands)
County General Fund Revenues Unrestricted Funds2
Percent of
General Fund
“Rainy Day”
Fund
Percent of
General Fund
Allegany1 $85,164.0 $26,255.5 30.8% $8,000.0 9.4%
Anne Arundel 1,292,186.4 121,299.5 9.4% 48,619.9 3.8%
Baltimore City1 1,690,300.0 308,300.0 18.2% 111,800.0 6.6%
Baltimore 1,811,859.0 381,102.0 21.0% 89,341.0 4.9%
Calvert 228,759.3 44,941.5 19.6% 19,400.0 8.5%
Caroline 44,521.5 7,140.0 16.0% 0.0 0.0%
Carroll 350,889.2 46,240.8 13.2% 18,998.1 5.4%
Cecil 171,460.4 24,390.0 14.2% 13,660.2 8.0%
Charles 345,000.9 42,793.8 12.4% 36,692.5 10.6%
Dorchester 50,043.2 9,054.3 18.1% 0.0 0.0%
Frederick 508,249.9 76,107.1 15.0% 0.0 0.0%
Garrett 75,447.1 13,965.8 18.5% 3,690.8 4.9%
Harford 477,174.4 65,247.3 13.7% 25,879.2 5.4%
Howard 950,382.0 99,548.4 10.5% 61,260.6 6.4%
Kent 46,392.2 9,756.2 21.0% 139.0 0.3%
Montgomery 2,967,448.8 484,347.3 16.3% 230,647.7 7.8%
Prince George’s1 1,700,000.0 270,400.0 15.9% 145,000.0 8.5%
Queen Anne’s 119,398.6 20,385.8 17.1% 8,557.8 7.2%
St. Mary’s 209,430.7 44,604.3 21.3% 1,625.0 0.8%
Somerset 33,206.3 10,973.5 33.0% 400.0 1.2%
Talbot 78,874.0 25,034.2 31.7% 11,200.0 14.2%
Washington 208,628.3 36,844.4 17.7% 37,433.5 17.9%
Wicomico 129,758.1 48,453.2 37.3% 6,450.0 5.0%
Worcester 170,890.6 42,656.8 25.0% 18,974.2 11.1%
Total $13,745,465.0 $2,259,841.6 16.4% $897,769.5 6.5%
1Unaudited Information. The audited financial statements were not available. 2Unrestricted funds include all committed, assigned, unassigned, and “rainy day”
funds. Montgomery, Prince George’s, and Queen Anne’s counties report “rainy day” funds in the restricted category, and those “rainy day” amounts are
included in the unrestricted funds balance above.
Although these reported fund balances represent available resources as of June 30, 2015, the county may have appropriated a portion of these amounts for the
current fiscal year budget.
Source: County audit reports fiscal 2015; County finance offices
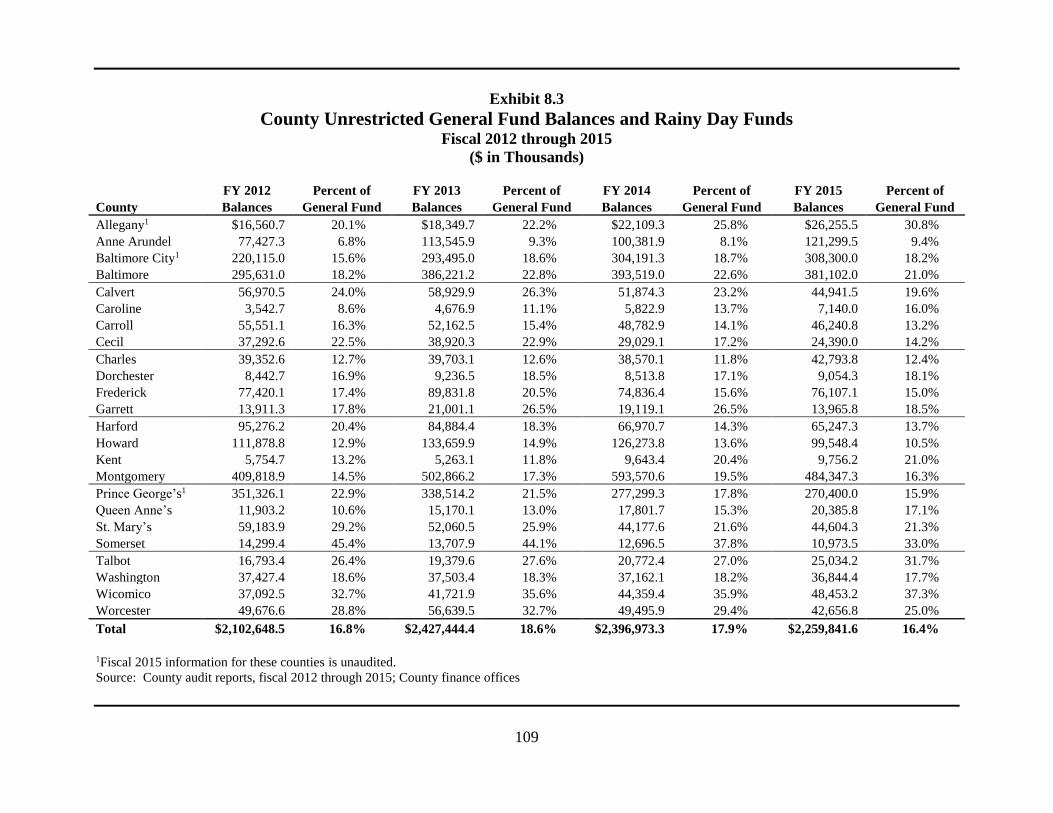
109
Exhibit 8.3
County Unrestricted General Fund Balances and Rainy Day Funds Fiscal 2012 through 2015
($ in Thousands)
FY 2012 Percent of FY 2013 Percent of FY 2014 Percent of FY 2015 Percent of
County Balances General Fund Balances General Fund Balances General Fund Balances General Fund
Allegany1 $16,560.7 20.1% $18,349.7 22.2% $22,109.3 25.8% $26,255.5 30.8%
Anne Arundel 77,427.3 6.8% 113,545.9 9.3% 100,381.9 8.1% 121,299.5 9.4%
Baltimore City1 220,115.0 15.6% 293,495.0 18.6% 304,191.3 18.7% 308,300.0 18.2%
Baltimore 295,631.0 18.2% 386,221.2 22.8% 393,519.0 22.6% 381,102.0 21.0%
Calvert 56,970.5 24.0% 58,929.9 26.3% 51,874.3 23.2% 44,941.5 19.6%
Caroline 3,542.7 8.6% 4,676.9 11.1% 5,822.9 13.7% 7,140.0 16.0%
Carroll 55,551.1 16.3% 52,162.5 15.4% 48,782.9 14.1% 46,240.8 13.2%
Cecil 37,292.6 22.5% 38,920.3 22.9% 29,029.1 17.2% 24,390.0 14.2%
Charles 39,352.6 12.7% 39,703.1 12.6% 38,570.1 11.8% 42,793.8 12.4%
Dorchester 8,442.7 16.9% 9,236.5 18.5% 8,513.8 17.1% 9,054.3 18.1%
Frederick 77,420.1 17.4% 89,831.8 20.5% 74,836.4 15.6% 76,107.1 15.0%
Garrett 13,911.3 17.8% 21,001.1 26.5% 19,119.1 26.5% 13,965.8 18.5%
Harford 95,276.2 20.4% 84,884.4 18.3% 66,970.7 14.3% 65,247.3 13.7%
Howard 111,878.8 12.9% 133,659.9 14.9% 126,273.8 13.6% 99,548.4 10.5%
Kent 5,754.7 13.2% 5,263.1 11.8% 9,643.4 20.4% 9,756.2 21.0%
Montgomery 409,818.9 14.5% 502,866.2 17.3% 593,570.6 19.5% 484,347.3 16.3%
Prince George’s1 351,326.1 22.9% 338,514.2 21.5% 277,299.3 17.8% 270,400.0 15.9%
Queen Anne’s 11,903.2 10.6% 15,170.1 13.0% 17,801.7 15.3% 20,385.8 17.1%
St. Mary’s 59,183.9 29.2% 52,060.5 25.9% 44,177.6 21.6% 44,604.3 21.3%
Somerset 14,299.4 45.4% 13,707.9 44.1% 12,696.5 37.8% 10,973.5 33.0%
Talbot 16,793.4 26.4% 19,379.6 27.6% 20,772.4 27.0% 25,034.2 31.7%
Washington 37,427.4 18.6% 37,503.4 18.3% 37,162.1 18.2% 36,844.4 17.7%
Wicomico 37,092.5 32.7% 41,721.9 35.6% 44,359.4 35.9% 48,453.2 37.3%
Worcester 49,676.6 28.8% 56,639.5 32.7% 49,495.9 29.4% 42,656.8 25.0%
Total $2,102,648.5 16.8% $2,427,444.4 18.6% $2,396,973.3 17.9% $2,259,841.6 16.4%
1Fiscal 2015 information for these counties is unaudited.
Source: County audit reports, fiscal 2012 through 2015; County finance offices

110
111
Chapter 9. Local Debt Measures
County Debt
As of June 30, 2014, Maryland counties and Baltimore City
had $19.8 billion in outstanding debt, including general
obligation bonds, revenue and enterprise debt, federal loans,
State loans, capital leases, and short-term debt. Long-term debt
generally serves as a funding source for capital projects such as
highways, school facilities, sewer and water facilities, parking
facilities, parks and recreation facilities, housing and urban
development projects, and county buildings. Short-term debt
usually serves as a cash management tool. Exhibit 9.1 shows
outstanding debt for each jurisdiction for fiscal 2010 through
2014.
Between fiscal 2010 and 2014, local debt for counties and
Baltimore City increased by $3.7 billion or 22.8%. This
represents a 5.3% average annual increase over the four-year
period. The Washington Suburban Sanitary Commission
(WSSC) accounted for 10.0% of the total debt in fiscal 2014. In
the exhibits, WSSC debt is apportioned equally between
Montgomery and Prince George’s counties. Montgomery
County had $5.0 billion in outstanding debt, while
Prince George’s County had $2.6 billion in debt. In
comparison, Dorchester and Kent counties were the smallest
borrowers. Dorchester County had $26.8 million in outstanding
debt, while Kent County had $30.5 million in debt.
As expected, a majority of the debt was attributable to areas
having greater infrastructure needs and greater populations.
With 71% of the State’s population, Baltimore City and
Anne Arundel, Baltimore, Howard, Montgomery, and
Prince George’s counties accounted for approximately 83% of
the total debt. One reason certain counties have less debt than
other larger counties is the interrelationship between a county
and its municipalities. Some municipalities incur the burden of
maintaining a large portion of the infrastructure needs such as
water and sewer systems.
Municipalities and State-created special taxing districts had
$1.2 billion in outstanding debt as of June 30, 2014, while the
State of Maryland had $18.5 billion in debt. Municipal and
special taxing district debt includes the same categories of debt
as the counties and Baltimore City. State debt includes general
obligation bonds, transportation bonds, Maryland
Transportation Authority bonds, capital leases, and agency debt
(Community Development Administration, and Higher
Education Fund). Accrued workers’ compensation and accrued
annual leave costs are excluded from the figures.
112
Comparative Measures
Exhibits 9.2 and 9.3 present comparisons by jurisdiction
through the utilization of common analytical measures:
assessable base and population. Exhibit 9.2 compares county
debt to real and personal property assessable base for
fiscal 2004, 2009, and 2014. In fiscal 2014, the ratio of county
debt to assessable base is the same as it was in fiscal 2004.
The high ratio in Baltimore City (9.3%) reflects
slower-than-average assessable base growth and debt for
financing urban renewal and development projects,
transportation projects, water projects, and wastewater
facilities. Only four counties have remained below 1.5% in
fiscal 2004, 2009, and 2014 (Garrett, Kent, Talbot, and
Worcester). For comparative purposes, in fiscal 2014 the State
had a debt-to-assessable-base ratio of 2.9% that increased from
2.8% in 2004. The municipalities/special taxing districts had a
ratio of 1.2% in 2014.
Exhibit 9.3 shows debt per capita for the counties and
Baltimore City. Based on U.S. Census Bureau population
estimates, debt per capita increased from $2,096 in fiscal 2004
to $3,332 in fiscal 2014, a 59.0% increase over the decade.
The largest increases in per capita debt were in Baltimore,
Cecil, Somerset, and Worcester counties. Baltimore City and
Howard and Montgomery counties had the highest debt
per capita.
The high ratios in Montgomery and Prince George’s
counties were attributed to the inclusion of WSSC’s debt.
Howard County’s high ratio resulted from debt for financing
general county improvement projects, storm drain projects,
housing projects, community renewal projects, and parks and
recreation projects. Allegany, Dorchester, and
Wicomico counties had the lowest debt per capita. For
comparative purposes, the State’s debt in fiscal 2014 amounted
to $3,121 per capita, a 71.5% increase from the
$1,820 per capita amount in 2004. The municipalities/special
taxing districts had a ratio of $1,359 per capita in 2014.
Local Debt Limitations
State and local laws provide several limitations on county
debt. These limitations depend, to an extent, on the form of
county government: charter, code, or commission.
Commission counties do not have statutory debt limitations.
However, the necessity for General Assembly authorization to
create debt serves as a limitation on commission county debt
creation.
Under State law, charter county debt is limited to 6% of
real property assessable base and 15% of personal property and
operating real property assessable base of the county. Certain
types of debt, however, are excluded from this limitation: tax
anticipation bonds and notes having a maturity not in excess of
12 months; special taxing district debt; and self-liquidating
debt. In addition, charter counties may adopt lower limitations,
and five have done so:
Anne Arundel – 5.6% of real property and 14.0% of
personal property and certain operating real property for
water and sewer bonds, and 5.2% of real property and
13.0% of personal property and certain operating real
property for other debt;
113
Baltimore – 4% of real property and 4% of personal
property;
Frederick – 5% of real property and 15% of personal
property;
Howard – 4.8% of real property and 4.8% of personal
property; and
Wicomico – 3.2% of real property and 8.0% of personal
property.
Unlike charter counties, code counties do not have statutory
debt limitations although the General Assembly may limit their
property tax rates and regulate the maximum amount of
indebtedness. To date, the General Assembly has not exercised
these powers for any code county.
While Baltimore City does not have a statutory general
obligation debt limitation, the General Assembly may fix a
limit on the amount of debt the city has outstanding at any one
time. To date, the General Assembly has not set a limitation on
the city’s debt.
Municipal debt limitations may be set under
two provisions. The General Assembly may adopt, amend, or
repeal a local law regulating the maximum amount of debt a
municipality may create. The voters of the applicable
municipality must subsequently approve this limitation. In
addition, through its legislative powers, a municipality may
establish a debt limitation in its charter, provided that the
voters approve this limitation.
Bond Ratings
Nearly all local debt is given a credit rating by the major
rating agencies. Exhibit 9.4 shows the credit rating for each
county for general obligation bonds by the three major rating
agencies: Standard & Poor’s, Moody’s Investors Service, and
Fitch Ratings, as of July 1, 2015. Bond ratings range from
“AAA” for the best quality and smallest investment risk to “C”
for the poorest quality and highest risk. Specific classifications
are used by each of the rating agencies, but the letter grade
systems generally follow these norms. The ratings are assigned
based upon the overall creditworthiness of the issuer. For
county government, measurements such as size and growth in
tax bases are key factors in determining the bond rating.
The highest bond rating issued by Moody’s to Maryland
counties is Aaa while the lowest is A3. For Standard & Poor’s,
the highest rating among Maryland counties is AAA while the
lowest is A+, and for Fitch, the highest rating is AAA and the
lowest is AA.
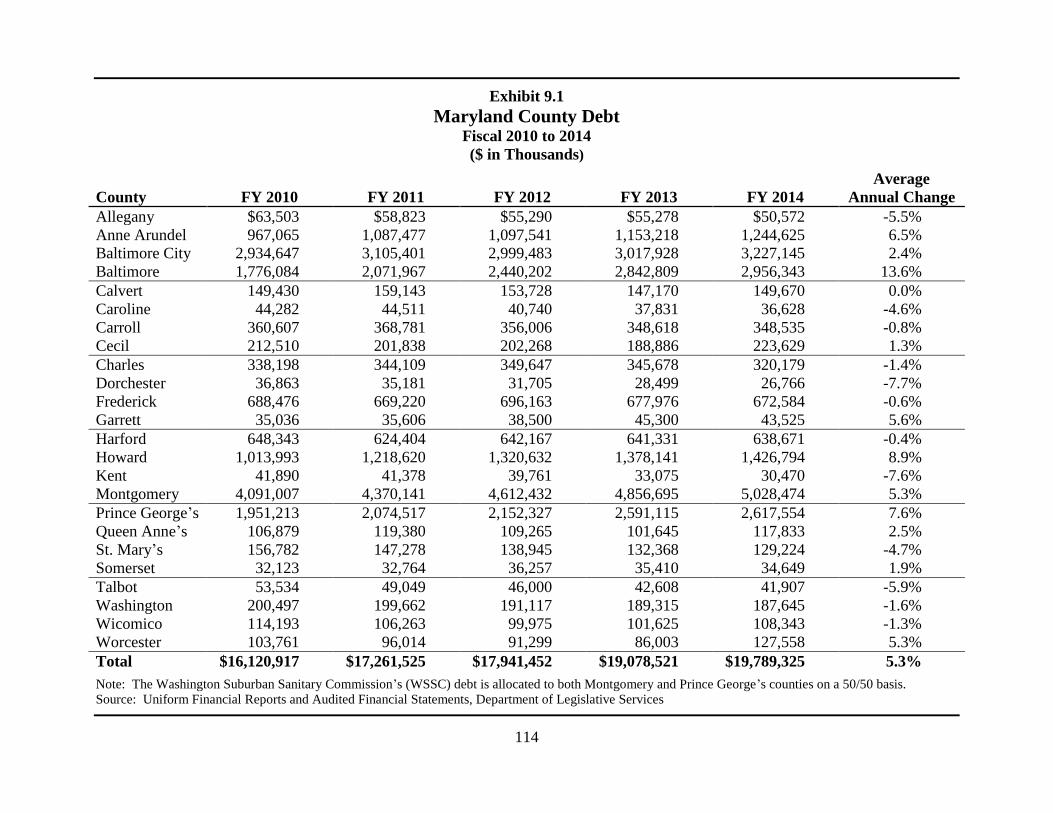
114
Exhibit 9.1
Maryland County Debt Fiscal 2010 to 2014
($ in Thousands)
County FY 2010 FY 2011 FY 2012 FY 2013 FY 2014
Average
Annual Change
Allegany $63,503 $58,823 $55,290 $55,278 $50,572 -5.5%
Anne Arundel 967,065 1,087,477 1,097,541 1,153,218 1,244,625 6.5%
Baltimore City 2,934,647 3,105,401 2,999,483 3,017,928 3,227,145 2.4%
Baltimore 1,776,084 2,071,967 2,440,202 2,842,809 2,956,343 13.6%
Calvert 149,430 159,143 153,728 147,170 149,670 0.0%
Caroline 44,282 44,511 40,740 37,831 36,628 -4.6%
Carroll 360,607 368,781 356,006 348,618 348,535 -0.8%
Cecil 212,510 201,838 202,268 188,886 223,629 1.3%
Charles 338,198 344,109 349,647 345,678 320,179 -1.4%
Dorchester 36,863 35,181 31,705 28,499 26,766 -7.7%
Frederick 688,476 669,220 696,163 677,976 672,584 -0.6%
Garrett 35,036 35,606 38,500 45,300 43,525 5.6%
Harford 648,343 624,404 642,167 641,331 638,671 -0.4%
Howard 1,013,993 1,218,620 1,320,632 1,378,141 1,426,794 8.9%
Kent 41,890 41,378 39,761 33,075 30,470 -7.6%
Montgomery 4,091,007 4,370,141 4,612,432 4,856,695 5,028,474 5.3%
Prince George’s 1,951,213 2,074,517 2,152,327 2,591,115 2,617,554 7.6%
Queen Anne’s 106,879 119,380 109,265 101,645 117,833 2.5%
St. Mary’s 156,782 147,278 138,945 132,368 129,224 -4.7%
Somerset 32,123 32,764 36,257 35,410 34,649 1.9%
Talbot 53,534 49,049 46,000 42,608 41,907 -5.9%
Washington 200,497 199,662 191,117 189,315 187,645 -1.6%
Wicomico 114,193 106,263 99,975 101,625 108,343 -1.3%
Worcester 103,761 96,014 91,299 86,003 127,558 5.3%
Total $16,120,917 $17,261,525 $17,941,452 $19,078,521 $19,789,325 5.3%
Note: The Washington Suburban Sanitary Commission’s (WSSC) debt is allocated to both Montgomery and Prince George’s counties on a 50/50 basis.
Source: Uniform Financial Reports and Audited Financial Statements, Department of Legislative Services
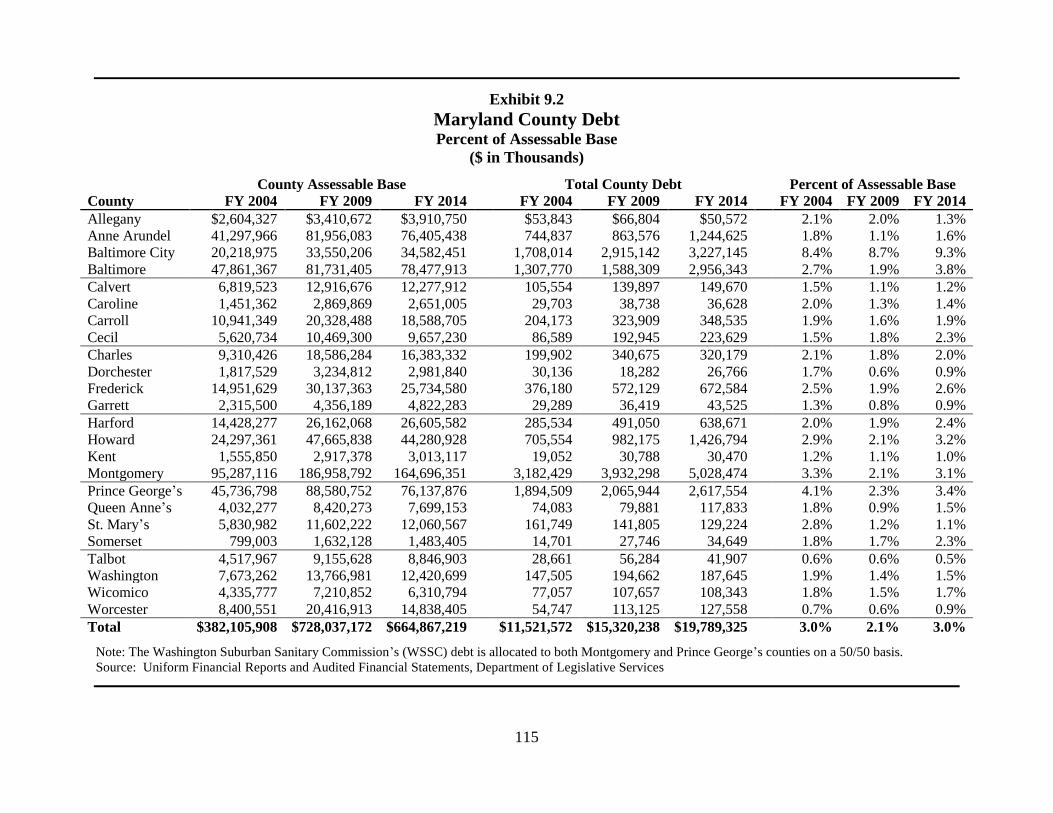
115
Exhibit 9.2
Maryland County Debt Percent of Assessable Base
($ in Thousands)
County Assessable Base
Total County Debt
Percent of Assessable Base
County FY 2004 FY 2009 FY 2014 FY 2004 FY 2009 FY 2014 FY 2004 FY 2009 FY 2014
Allegany $2,604,327 $3,410,672 $3,910,750
$53,843 $66,804 $50,572
2.1% 2.0% 1.3%
Anne Arundel 41,297,966 81,956,083 76,405,438
744,837 863,576 1,244,625
1.8% 1.1% 1.6%
Baltimore City 20,218,975 33,550,206 34,582,451
1,708,014 2,915,142 3,227,145
8.4% 8.7% 9.3%
Baltimore 47,861,367 81,731,405 78,477,913 1,307,770 1,588,309 2,956,343 2.7% 1.9% 3.8%
Calvert 6,819,523 12,916,676 12,277,912
105,554 139,897 149,670
1.5% 1.1% 1.2%
Caroline 1,451,362 2,869,869 2,651,005
29,703 38,738 36,628
2.0% 1.3% 1.4%
Carroll 10,941,349 20,328,488 18,588,705
204,173 323,909 348,535
1.9% 1.6% 1.9%
Cecil 5,620,734 10,469,300 9,657,230 86,589 192,945 223,629 1.5% 1.8% 2.3%
Charles 9,310,426 18,586,284 16,383,332
199,902 340,675 320,179
2.1% 1.8% 2.0%
Dorchester 1,817,529 3,234,812 2,981,840
30,136 18,282 26,766
1.7% 0.6% 0.9%
Frederick 14,951,629 30,137,363 25,734,580
376,180 572,129 672,584
2.5% 1.9% 2.6%
Garrett 2,315,500 4,356,189 4,822,283 29,289 36,419 43,525 1.3% 0.8% 0.9%
Harford 14,428,277 26,162,068 26,605,582
285,534 491,050 638,671
2.0% 1.9% 2.4%
Howard 24,297,361 47,665,838 44,280,928
705,554 982,175 1,426,794
2.9% 2.1% 3.2%
Kent 1,555,850 2,917,378 3,013,117
19,052 30,788 30,470
1.2% 1.1% 1.0%
Montgomery 95,287,116 186,958,792 164,696,351 3,182,429 3,932,298 5,028,474 3.3% 2.1% 3.1%
Prince George’s 45,736,798 88,580,752 76,137,876
1,894,509 2,065,944 2,617,554
4.1% 2.3% 3.4%
Queen Anne’s 4,032,277 8,420,273 7,699,153
74,083 79,881 117,833
1.8% 0.9% 1.5%
St. Mary’s 5,830,982 11,602,222 12,060,567
161,749 141,805 129,224
2.8% 1.2% 1.1%
Somerset 799,003 1,632,128 1,483,405 14,701 27,746 34,649 1.8% 1.7% 2.3%
Talbot 4,517,967 9,155,628 8,846,903
28,661 56,284 41,907
0.6% 0.6% 0.5%
Washington 7,673,262 13,766,981 12,420,699
147,505 194,662 187,645
1.9% 1.4% 1.5%
Wicomico 4,335,777 7,210,852 6,310,794
77,057 107,657 108,343
1.8% 1.5% 1.7%
Worcester 8,400,551 20,416,913 14,838,405 54,747 113,125 127,558 0.7% 0.6% 0.9%
Total $382,105,908 $728,037,172 $664,867,219
$11,521,572 $15,320,238 $19,789,325
3.0% 2.1% 3.0%
Note: The Washington Suburban Sanitary Commission’s (WSSC) debt is allocated to both Montgomery and Prince George’s counties on a 50/50 basis.
Source: Uniform Financial Reports and Audited Financial Statements, Department of Legislative Services
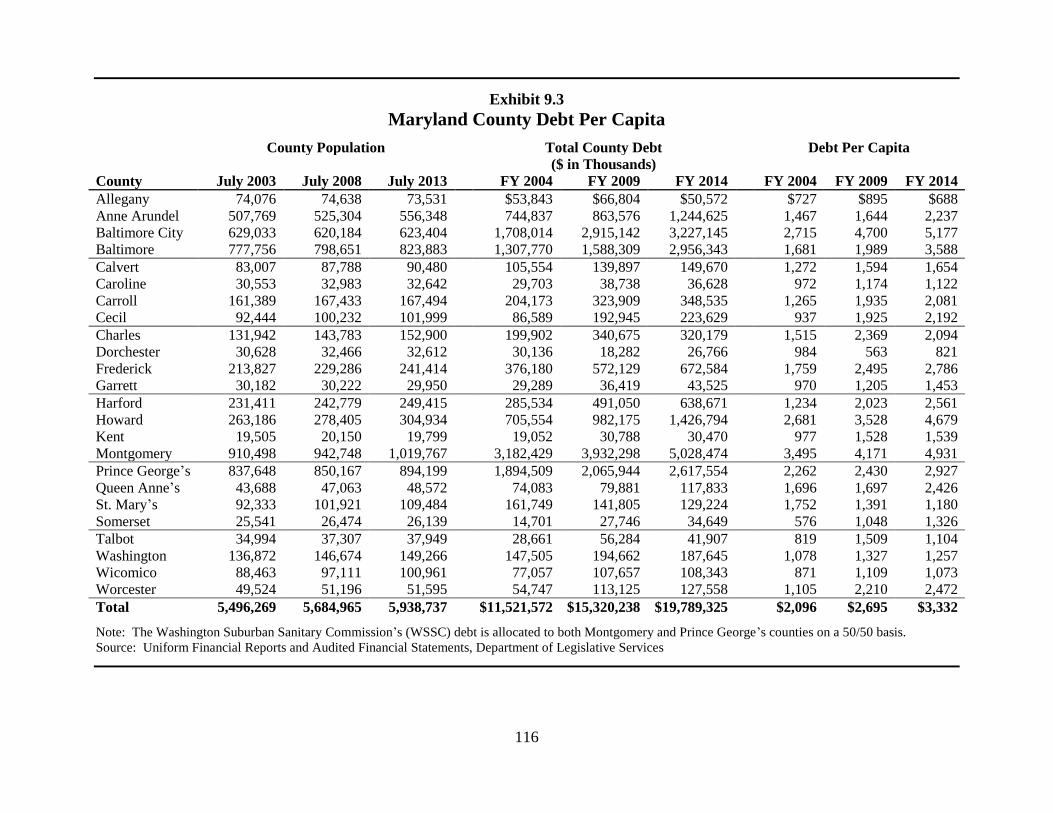
116
Exhibit 9.3
Maryland County Debt Per Capita
County Population
Total County Debt
Debt Per Capita
($ in Thousands)
County July 2003 July 2008 July 2013 FY 2004 FY 2009 FY 2014 FY 2004 FY 2009 FY 2014
Allegany 74,076 74,638 73,531
$53,843 $66,804 $50,572
$727 $895 $688
Anne Arundel 507,769 525,304 556,348
744,837 863,576 1,244,625
1,467 1,644 2,237
Baltimore City 629,033 620,184 623,404
1,708,014 2,915,142 3,227,145
2,715 4,700 5,177
Baltimore 777,756 798,651 823,883 1,307,770 1,588,309 2,956,343 1,681 1,989 3,588
Calvert 83,007 87,788 90,480
105,554 139,897 149,670
1,272 1,594 1,654
Caroline 30,553 32,983 32,642
29,703 38,738 36,628
972 1,174 1,122
Carroll 161,389 167,433 167,494
204,173 323,909 348,535
1,265 1,935 2,081
Cecil 92,444 100,232 101,999 86,589 192,945 223,629 937 1,925 2,192
Charles 131,942 143,783 152,900
199,902 340,675 320,179
1,515 2,369 2,094
Dorchester 30,628 32,466 32,612
30,136 18,282 26,766
984 563 821
Frederick 213,827 229,286 241,414
376,180 572,129 672,584
1,759 2,495 2,786
Garrett 30,182 30,222 29,950 29,289 36,419 43,525 970 1,205 1,453
Harford 231,411 242,779 249,415
285,534 491,050 638,671
1,234 2,023 2,561
Howard 263,186 278,405 304,934
705,554 982,175 1,426,794
2,681 3,528 4,679
Kent 19,505 20,150 19,799
19,052 30,788 30,470
977 1,528 1,539
Montgomery 910,498 942,748 1,019,767 3,182,429 3,932,298 5,028,474 3,495 4,171 4,931
Prince George’s 837,648 850,167 894,199
1,894,509 2,065,944 2,617,554
2,262 2,430 2,927
Queen Anne’s 43,688 47,063 48,572
74,083 79,881 117,833
1,696 1,697 2,426
St. Mary’s 92,333 101,921 109,484
161,749 141,805 129,224
1,752 1,391 1,180
Somerset 25,541 26,474 26,139 14,701 27,746 34,649 576 1,048 1,326
Talbot 34,994 37,307 37,949
28,661 56,284 41,907
819 1,509 1,104
Washington 136,872 146,674 149,266
147,505 194,662 187,645
1,078 1,327 1,257
Wicomico 88,463 97,111 100,961
77,057 107,657 108,343
871 1,109 1,073
Worcester 49,524 51,196 51,595 54,747 113,125 127,558 1,105 2,210 2,472
Total 5,496,269 5,684,965 5,938,737
$11,521,572 $15,320,238 $19,789,325
$2,096 $2,695 $3,332
Note: The Washington Suburban Sanitary Commission’s (WSSC) debt is allocated to both Montgomery and Prince George’s counties on a 50/50 basis.
Source: Uniform Financial Reports and Audited Financial Statements, Department of Legislative Services
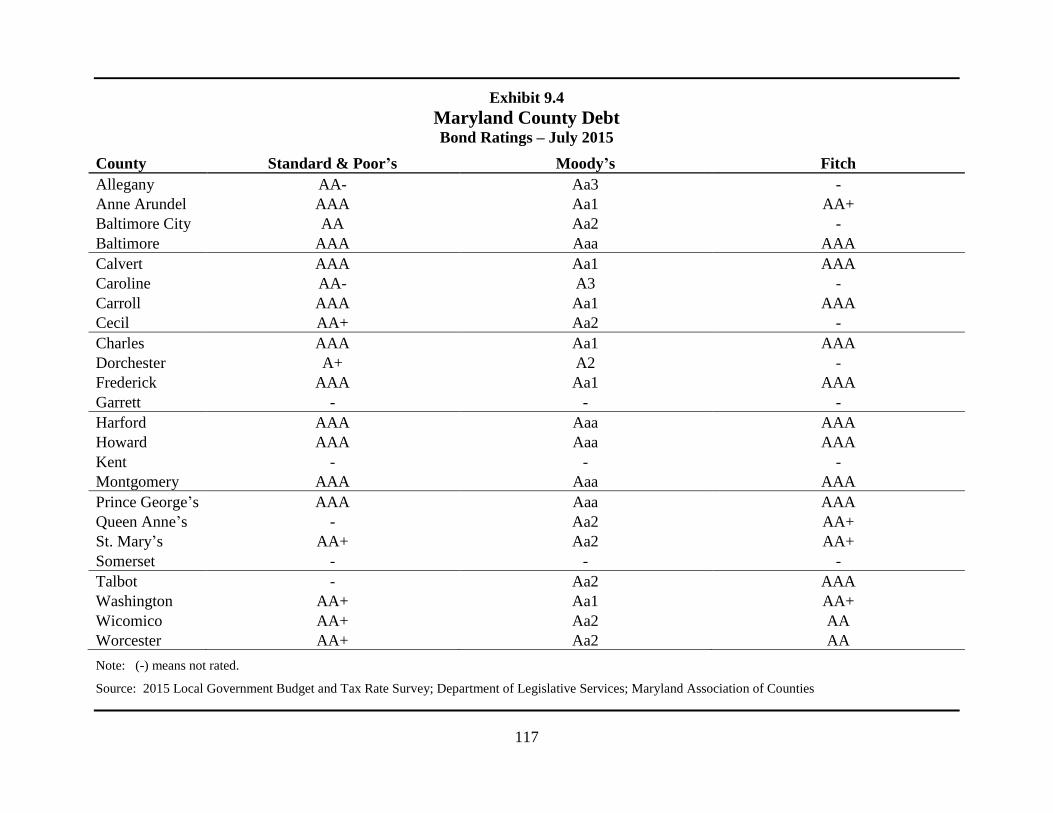
117
Exhibit 9.4
Maryland County Debt Bond Ratings – July 2015
County Standard & Poor’s Moody’s Fitch
Allegany AA- Aa3 -
Anne Arundel AAA Aa1 AA+
Baltimore City AA Aa2 -
Baltimore AAA Aaa AAA
Calvert AAA Aa1 AAA
Caroline AA- A3 -
Carroll AAA Aa1 AAA
Cecil AA+ Aa2 -
Charles AAA Aa1 AAA
Dorchester A+ A2 -
Frederick AAA Aa1 AAA
Garrett - - -
Harford AAA Aaa AAA
Howard AAA Aaa AAA
Kent - - -
Montgomery AAA Aaa AAA
Prince George’s AAA Aaa AAA
Queen Anne’s - Aa2 AA+
St. Mary’s AA+ Aa2 AA+
Somerset - - -
Talbot - Aa2 AAA
Washington AA+ Aa1 AA+
Wicomico AA+ Aa2 AA
Worcester AA+ Aa2 AA
Note: (-) means not rated.
Source: 2015 Local Government Budget and Tax Rate Survey; Department of Legislative Services; Maryland Association of Counties

118
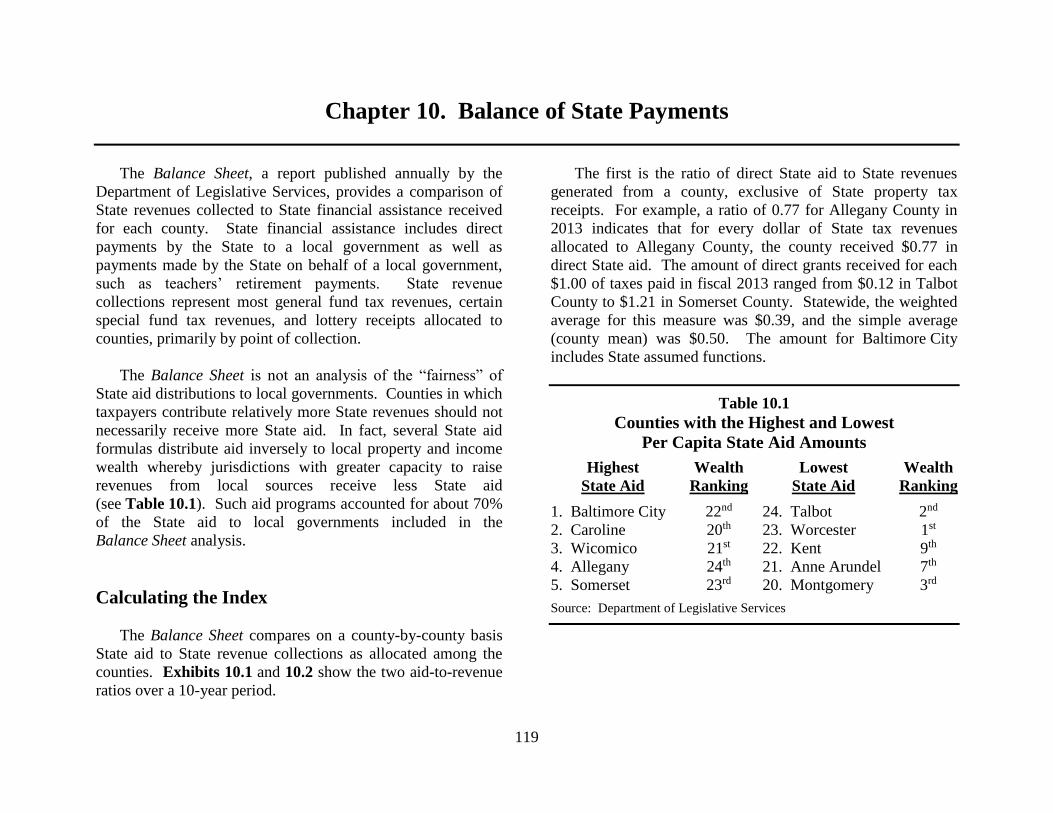
119
Chapter 10. Balance of State Payments
The Balance Sheet, a report published annually by the
Department of Legislative Services, provides a comparison of
State revenues collected to State financial assistance received
for each county. State financial assistance includes direct
payments by the State to a local government as well as
payments made by the State on behalf of a local government,
such as teachers’ retirement payments. State revenue
collections represent most general fund tax revenues, certain
special fund tax revenues, and lottery receipts allocated to
counties, primarily by point of collection.
The Balance Sheet is not an analysis of the “fairness” of
State aid distributions to local governments. Counties in which
taxpayers contribute relatively more State revenues should not
necessarily receive more State aid. In fact, several State aid
formulas distribute aid inversely to local property and income
wealth whereby jurisdictions with greater capacity to raise
revenues from local sources receive less State aid
(see Table 10.1). Such aid programs accounted for about 70%
of the State aid to local governments included in the
Balance Sheet analysis.
Calculating the Index
The Balance Sheet compares on a county-by-county basis
State aid to State revenue collections as allocated among the
counties. Exhibits 10.1 and 10.2 show the two aid-to-revenue
ratios over a 10-year period.
The first is the ratio of direct State aid to State revenues
generated from a county, exclusive of State property tax
receipts. For example, a ratio of 0.77 for Allegany County in
2013 indicates that for every dollar of State tax revenues
allocated to Allegany County, the county received $0.77 in
direct State aid. The amount of direct grants received for each
$1.00 of taxes paid in fiscal 2013 ranged from $0.12 in Talbot
County to $1.21 in Somerset County. Statewide, the weighted
average for this measure was $0.39, and the simple average
(county mean) was $0.50. The amount for Baltimore City
includes State assumed functions.
Table 10.1
Counties with the Highest and Lowest
Per Capita State Aid Amounts
Highest
State Aid
Wealth
Ranking
Lowest
State Aid
Wealth
Ranking
1. Baltimore City 22nd 24. Talbot 2nd
2. Caroline 20th 23. Worcester 1st
3. Wicomico 21st 22. Kent 9th
4. Allegany 24th 21. Anne Arundel 7th
5. Somerset 23rd 20. Montgomery 3rd
Source: Department of Legislative Services
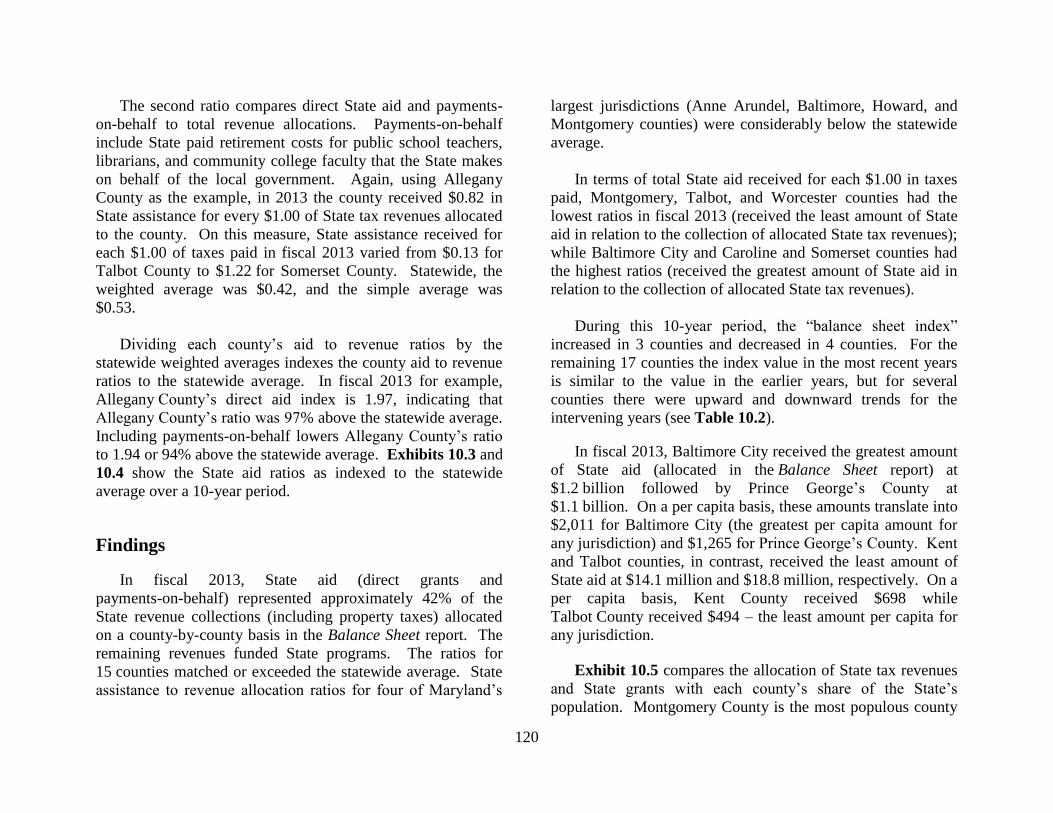
120
The second ratio compares direct State aid and payments-
on-behalf to total revenue allocations. Payments-on-behalf
include State paid retirement costs for public school teachers,
librarians, and community college faculty that the State makes
on behalf of the local government. Again, using Allegany
County as the example, in 2013 the county received $0.82 in
State assistance for every $1.00 of State tax revenues allocated
to the county. On this measure, State assistance received for
each $1.00 of taxes paid in fiscal 2013 varied from $0.13 for
Talbot County to $1.22 for Somerset County. Statewide, the
weighted average was $0.42, and the simple average was
$0.53.
Dividing each county’s aid to revenue ratios by the
statewide weighted averages indexes the county aid to revenue
ratios to the statewide average. In fiscal 2013 for example,
Allegany County’s direct aid index is 1.97, indicating that
Allegany County’s ratio was 97% above the statewide average.
Including payments-on-behalf lowers Allegany County’s ratio
to 1.94 or 94% above the statewide average. Exhibits 10.3 and
10.4 show the State aid ratios as indexed to the statewide
average over a 10-year period.
Findings
In fiscal 2013, State aid (direct grants and
payments-on-behalf) represented approximately 42% of the
State revenue collections (including property taxes) allocated
on a county-by-county basis in the Balance Sheet report. The
remaining revenues funded State programs. The ratios for
15 counties matched or exceeded the statewide average. State
assistance to revenue allocation ratios for four of Maryland’s
largest jurisdictions (Anne Arundel, Baltimore, Howard, and
Montgomery counties) were considerably below the statewide
average.
In terms of total State aid received for each $1.00 in taxes
paid, Montgomery, Talbot, and Worcester counties had the
lowest ratios in fiscal 2013 (received the least amount of State
aid in relation to the collection of allocated State tax revenues);
while Baltimore City and Caroline and Somerset counties had
the highest ratios (received the greatest amount of State aid in
relation to the collection of allocated State tax revenues).
During this 10-year period, the “balance sheet index”
increased in 3 counties and decreased in 4 counties. For the
remaining 17 counties the index value in the most recent years
is similar to the value in the earlier years, but for several
counties there were upward and downward trends for the
intervening years (see Table 10.2).
In fiscal 2013, Baltimore City received the greatest amount
of State aid (allocated in the Balance Sheet report) at
$1.2 billion followed by Prince George’s County at
$1.1 billion. On a per capita basis, these amounts translate into
$2,011 for Baltimore City (the greatest per capita amount for
any jurisdiction) and $1,265 for Prince George’s County. Kent
and Talbot counties, in contrast, received the least amount of
State aid at $14.1 million and $18.8 million, respectively. On a
per capita basis, Kent County received $698 while
Talbot County received $494 – the least amount per capita for
any jurisdiction.
Exhibit 10.5 compares the allocation of State tax revenues
and State grants with each county’s share of the State’s
population. Montgomery County is the most populous county
121
in Maryland and generates the greatest share of State tax
revenues; however, it ranks third in the amount of State aid that
it receives. Baltimore City, the fourth most populous
jurisdiction, receives the largest percentage of State aid,
followed by Prince George’s County, the second most
populous jurisdiction.
Table 10.2
Change in “Balance Sheet Index”
During 10-year Period
Higher Average Lower Average Relatively Constant
Frederick Baltimore City Allegany
Washington Calvert Anne Arundel
Wicomico Garrett Baltimore
Kent Caroline
Carroll
Cecil
Charles
Dorchester
Harford
Howard
Montgomery
Prince George’s
Queen Anne’s
St. Mary’s
Somerset
Talbot
Worcester
Exhibit 10.6 shows the allocation of State tax revenues and
State grants on a per capita basis. As shown, the five counties
that generated the most State tax revenues in fiscal 2013 as
measured on a per capita basis include Anne Arundel, Howard,
Montgomery, Talbot, and Worcester. The counties that
generated the least per capita State tax revenues include
Allegany, Caroline, Cecil, Dorchester, and Somerset counties.
It is important to note that State residents are subject to the
same State tax rates regardless of the locality in which they
reside. Jurisdictions that generate more State tax revenue per
capita typically have a greater proportion of residents with
higher incomes, or a larger overall taxbase.
Jurisdictions that received the greatest amount of State aid
in fiscal 2013 as measured on a per capita basis include
Baltimore City and Allegany, Caroline, Somerset, and
Wicomico counties. Jurisdictions receiving the least amount of
State aid per capita include Anne Arundel, Kent, Montgomery,
Talbot, and Worcester counties. As stated earlier, counties in
which taxpayers contribute relatively more State revenues
should not necessarily receive more State aid. In fact, several
State aid formulas distribute aid inversely to local property and
income wealth whereby jurisdictions with greater capacity to
raise revenues from local sources receive less State aid. Such
aid programs accounted for about 70% of State aid to local
governments included in the Balance Sheet.
.
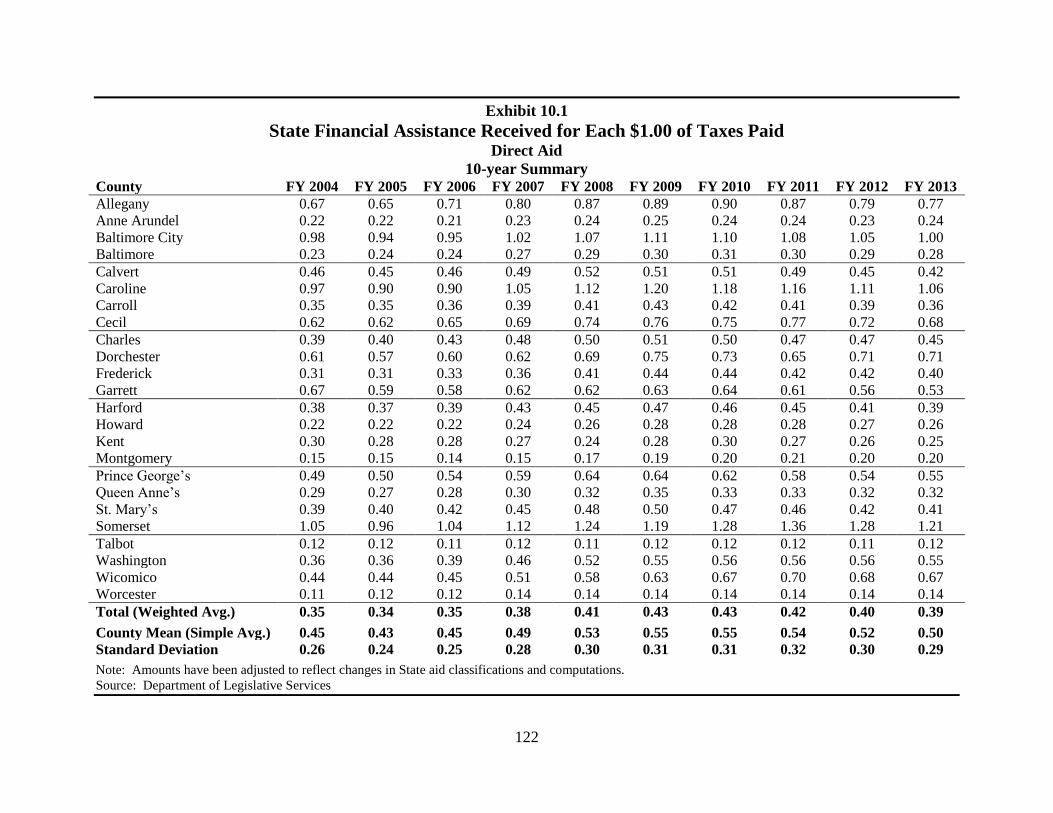
122
Exhibit 10.1
State Financial Assistance Received for Each $1.00 of Taxes Paid Direct Aid
10-year Summary County FY 2004 FY 2005 FY 2006 FY 2007 FY 2008 FY 2009 FY 2010 FY 2011 FY 2012 FY 2013
Allegany 0.67 0.65 0.71 0.80 0.87 0.89 0.90 0.87 0.79 0.77
Anne Arundel 0.22 0.22 0.21 0.23 0.24 0.25 0.24 0.24 0.23 0.24
Baltimore City 0.98 0.94 0.95 1.02 1.07 1.11 1.10 1.08 1.05 1.00
Baltimore 0.23 0.24 0.24 0.27 0.29 0.30 0.31 0.30 0.29 0.28
Calvert 0.46 0.45 0.46 0.49 0.52 0.51 0.51 0.49 0.45 0.42
Caroline 0.97 0.90 0.90 1.05 1.12 1.20 1.18 1.16 1.11 1.06
Carroll 0.35 0.35 0.36 0.39 0.41 0.43 0.42 0.41 0.39 0.36
Cecil 0.62 0.62 0.65 0.69 0.74 0.76 0.75 0.77 0.72 0.68
Charles 0.39 0.40 0.43 0.48 0.50 0.51 0.50 0.47 0.47 0.45
Dorchester 0.61 0.57 0.60 0.62 0.69 0.75 0.73 0.65 0.71 0.71
Frederick 0.31 0.31 0.33 0.36 0.41 0.44 0.44 0.42 0.42 0.40
Garrett 0.67 0.59 0.58 0.62 0.62 0.63 0.64 0.61 0.56 0.53
Harford 0.38 0.37 0.39 0.43 0.45 0.47 0.46 0.45 0.41 0.39
Howard 0.22 0.22 0.22 0.24 0.26 0.28 0.28 0.28 0.27 0.26
Kent 0.30 0.28 0.28 0.27 0.24 0.28 0.30 0.27 0.26 0.25
Montgomery 0.15 0.15 0.14 0.15 0.17 0.19 0.20 0.21 0.20 0.20
Prince George’s 0.49 0.50 0.54 0.59 0.64 0.64 0.62 0.58 0.54 0.55
Queen Anne’s 0.29 0.27 0.28 0.30 0.32 0.35 0.33 0.33 0.32 0.32
St. Mary’s 0.39 0.40 0.42 0.45 0.48 0.50 0.47 0.46 0.42 0.41
Somerset 1.05 0.96 1.04 1.12 1.24 1.19 1.28 1.36 1.28 1.21
Talbot 0.12 0.12 0.11 0.12 0.11 0.12 0.12 0.12 0.11 0.12
Washington 0.36 0.36 0.39 0.46 0.52 0.55 0.56 0.56 0.56 0.55
Wicomico 0.44 0.44 0.45 0.51 0.58 0.63 0.67 0.70 0.68 0.67
Worcester 0.11 0.12 0.12 0.14 0.14 0.14 0.14 0.14 0.14 0.14
Total (Weighted Avg.) 0.35 0.34 0.35 0.38 0.41 0.43 0.43 0.42 0.40 0.39
County Mean (Simple Avg.) 0.45 0.43 0.45 0.49 0.53 0.55 0.55 0.54 0.52 0.50
Standard Deviation 0.26 0.24 0.25 0.28 0.30 0.31 0.31 0.32 0.30 0.29
Note: Amounts have been adjusted to reflect changes in State aid classifications and computations.
Source: Department of Legislative Services
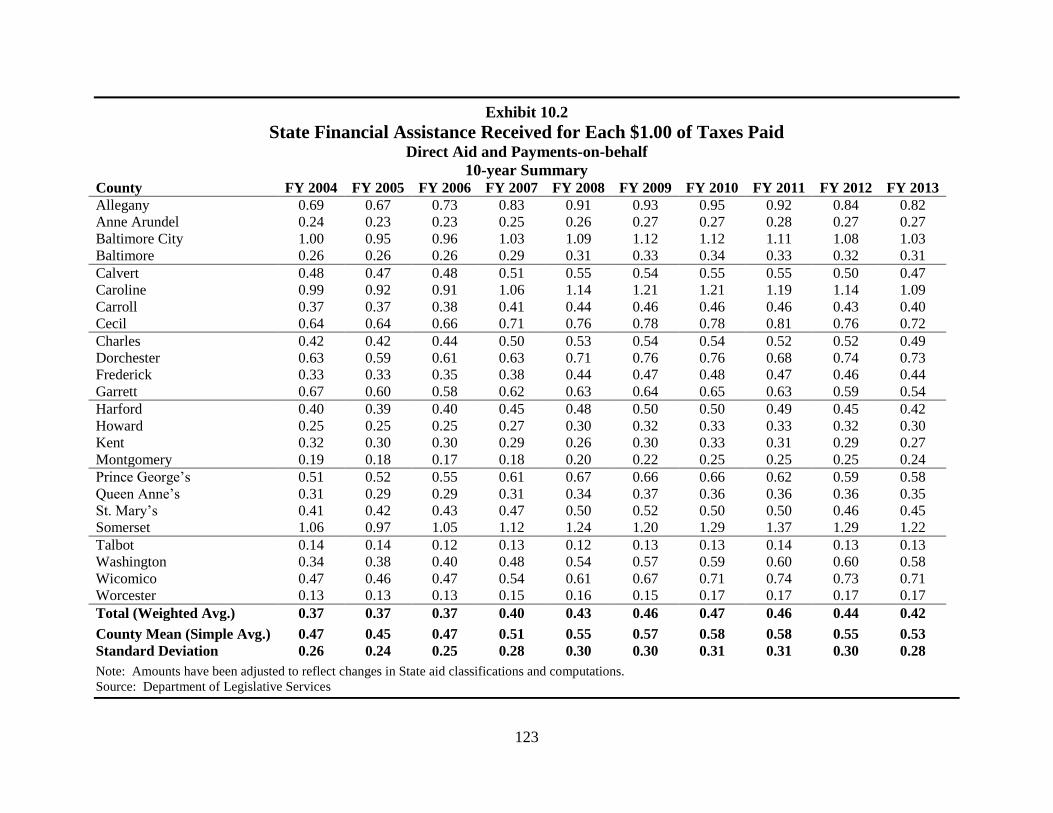
123
Exhibit 10.2
State Financial Assistance Received for Each $1.00 of Taxes Paid Direct Aid and Payments-on-behalf
10-year Summary County FY 2004 FY 2005 FY 2006 FY 2007 FY 2008 FY 2009 FY 2010 FY 2011 FY 2012 FY 2013
Allegany 0.69 0.67 0.73 0.83 0.91 0.93 0.95 0.92 0.84 0.82
Anne Arundel 0.24 0.23 0.23 0.25 0.26 0.27 0.27 0.28 0.27 0.27
Baltimore City 1.00 0.95 0.96 1.03 1.09 1.12 1.12 1.11 1.08 1.03
Baltimore 0.26 0.26 0.26 0.29 0.31 0.33 0.34 0.33 0.32 0.31
Calvert 0.48 0.47 0.48 0.51 0.55 0.54 0.55 0.55 0.50 0.47
Caroline 0.99 0.92 0.91 1.06 1.14 1.21 1.21 1.19 1.14 1.09
Carroll 0.37 0.37 0.38 0.41 0.44 0.46 0.46 0.46 0.43 0.40
Cecil 0.64 0.64 0.66 0.71 0.76 0.78 0.78 0.81 0.76 0.72
Charles 0.42 0.42 0.44 0.50 0.53 0.54 0.54 0.52 0.52 0.49
Dorchester 0.63 0.59 0.61 0.63 0.71 0.76 0.76 0.68 0.74 0.73
Frederick 0.33 0.33 0.35 0.38 0.44 0.47 0.48 0.47 0.46 0.44
Garrett 0.67 0.60 0.58 0.62 0.63 0.64 0.65 0.63 0.59 0.54
Harford 0.40 0.39 0.40 0.45 0.48 0.50 0.50 0.49 0.45 0.42
Howard 0.25 0.25 0.25 0.27 0.30 0.32 0.33 0.33 0.32 0.30
Kent 0.32 0.30 0.30 0.29 0.26 0.30 0.33 0.31 0.29 0.27
Montgomery 0.19 0.18 0.17 0.18 0.20 0.22 0.25 0.25 0.25 0.24
Prince George’s 0.51 0.52 0.55 0.61 0.67 0.66 0.66 0.62 0.59 0.58
Queen Anne’s 0.31 0.29 0.29 0.31 0.34 0.37 0.36 0.36 0.36 0.35
St. Mary’s 0.41 0.42 0.43 0.47 0.50 0.52 0.50 0.50 0.46 0.45
Somerset 1.06 0.97 1.05 1.12 1.24 1.20 1.29 1.37 1.29 1.22
Talbot 0.14 0.14 0.12 0.13 0.12 0.13 0.13 0.14 0.13 0.13
Washington 0.34 0.38 0.40 0.48 0.54 0.57 0.59 0.60 0.60 0.58
Wicomico 0.47 0.46 0.47 0.54 0.61 0.67 0.71 0.74 0.73 0.71
Worcester 0.13 0.13 0.13 0.15 0.16 0.15 0.17 0.17 0.17 0.17
Total (Weighted Avg.) 0.37 0.37 0.37 0.40 0.43 0.46 0.47 0.46 0.44 0.42
County Mean (Simple Avg.) 0.47 0.45 0.47 0.51 0.55 0.57 0.58 0.58 0.55 0.53
Standard Deviation 0.26 0.24 0.25 0.28 0.30 0.30 0.31 0.31 0.30 0.28
Note: Amounts have been adjusted to reflect changes in State aid classifications and computations.
Source: Department of Legislative Services
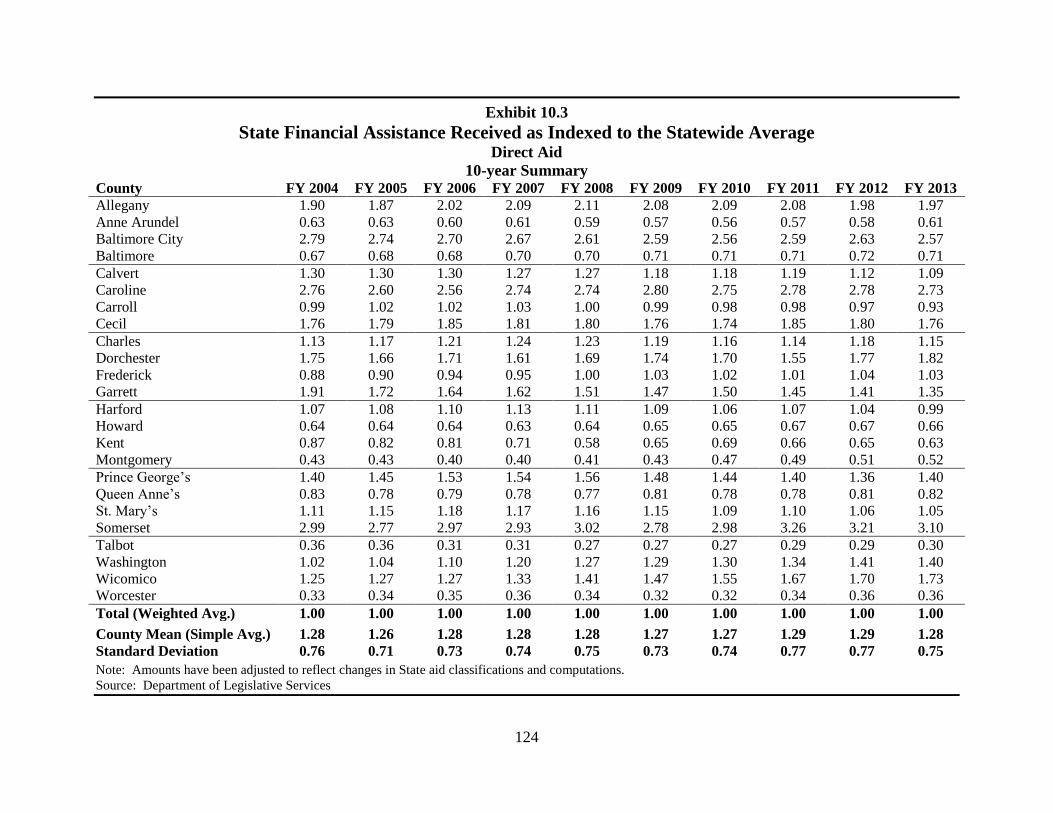
124
Exhibit 10.3
State Financial Assistance Received as Indexed to the Statewide Average Direct Aid
10-year Summary County FY 2004 FY 2005 FY 2006 FY 2007 FY 2008 FY 2009 FY 2010 FY 2011 FY 2012 FY 2013
Allegany 1.90 1.87 2.02 2.09 2.11 2.08 2.09 2.08 1.98 1.97
Anne Arundel 0.63 0.63 0.60 0.61 0.59 0.57 0.56 0.57 0.58 0.61
Baltimore City 2.79 2.74 2.70 2.67 2.61 2.59 2.56 2.59 2.63 2.57
Baltimore 0.67 0.68 0.68 0.70 0.70 0.71 0.71 0.71 0.72 0.71
Calvert 1.30 1.30 1.30 1.27 1.27 1.18 1.18 1.19 1.12 1.09
Caroline 2.76 2.60 2.56 2.74 2.74 2.80 2.75 2.78 2.78 2.73
Carroll 0.99 1.02 1.02 1.03 1.00 0.99 0.98 0.98 0.97 0.93
Cecil 1.76 1.79 1.85 1.81 1.80 1.76 1.74 1.85 1.80 1.76
Charles 1.13 1.17 1.21 1.24 1.23 1.19 1.16 1.14 1.18 1.15
Dorchester 1.75 1.66 1.71 1.61 1.69 1.74 1.70 1.55 1.77 1.82
Frederick 0.88 0.90 0.94 0.95 1.00 1.03 1.02 1.01 1.04 1.03
Garrett 1.91 1.72 1.64 1.62 1.51 1.47 1.50 1.45 1.41 1.35
Harford 1.07 1.08 1.10 1.13 1.11 1.09 1.06 1.07 1.04 0.99
Howard 0.64 0.64 0.64 0.63 0.64 0.65 0.65 0.67 0.67 0.66
Kent 0.87 0.82 0.81 0.71 0.58 0.65 0.69 0.66 0.65 0.63
Montgomery 0.43 0.43 0.40 0.40 0.41 0.43 0.47 0.49 0.51 0.52
Prince George’s 1.40 1.45 1.53 1.54 1.56 1.48 1.44 1.40 1.36 1.40
Queen Anne’s 0.83 0.78 0.79 0.78 0.77 0.81 0.78 0.78 0.81 0.82
St. Mary’s 1.11 1.15 1.18 1.17 1.16 1.15 1.09 1.10 1.06 1.05
Somerset 2.99 2.77 2.97 2.93 3.02 2.78 2.98 3.26 3.21 3.10
Talbot 0.36 0.36 0.31 0.31 0.27 0.27 0.27 0.29 0.29 0.30
Washington 1.02 1.04 1.10 1.20 1.27 1.29 1.30 1.34 1.41 1.40
Wicomico 1.25 1.27 1.27 1.33 1.41 1.47 1.55 1.67 1.70 1.73
Worcester 0.33 0.34 0.35 0.36 0.34 0.32 0.32 0.34 0.36 0.36
Total (Weighted Avg.) 1.00 1.00 1.00 1.00 1.00 1.00 1.00 1.00 1.00 1.00
County Mean (Simple Avg.) 1.28 1.26 1.28 1.28 1.28 1.27 1.27 1.29 1.29 1.28
Standard Deviation 0.76 0.71 0.73 0.74 0.75 0.73 0.74 0.77 0.77 0.75
Note: Amounts have been adjusted to reflect changes in State aid classifications and computations.
Source: Department of Legislative Services
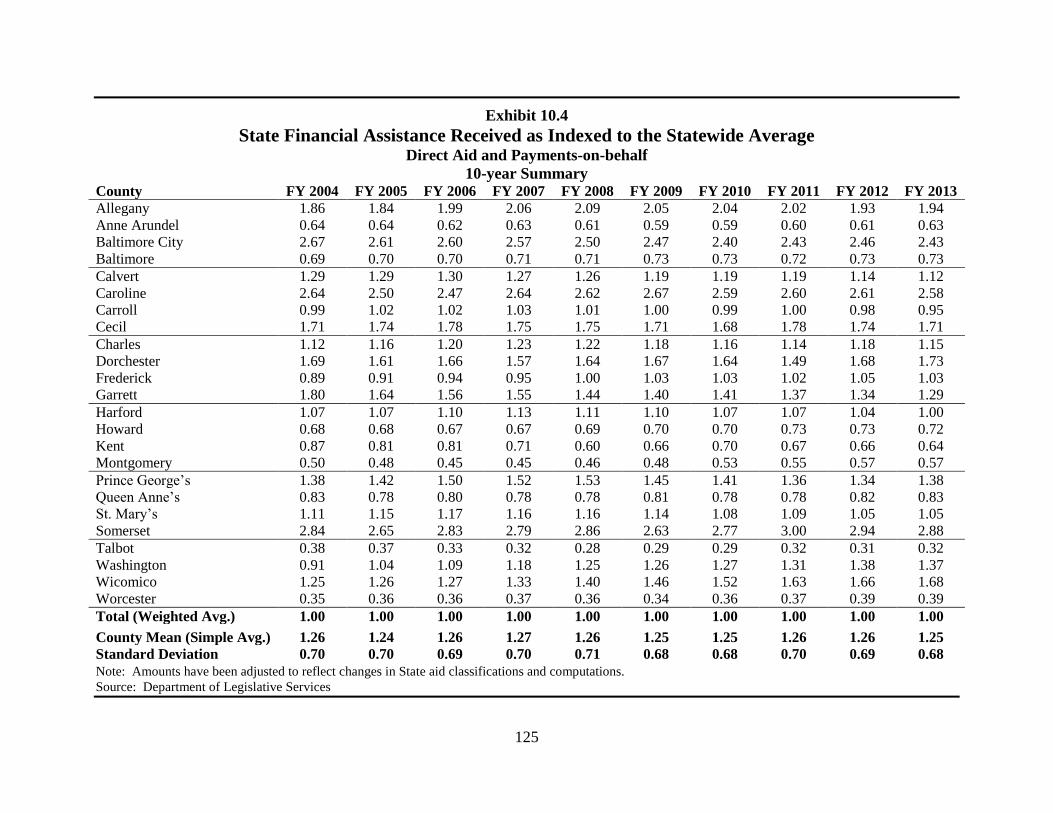
125
Exhibit 10.4
State Financial Assistance Received as Indexed to the Statewide Average Direct Aid and Payments-on-behalf
10-year Summary County FY 2004 FY 2005 FY 2006 FY 2007 FY 2008 FY 2009 FY 2010 FY 2011 FY 2012 FY 2013
Allegany 1.86 1.84 1.99 2.06 2.09 2.05 2.04 2.02 1.93 1.94
Anne Arundel 0.64 0.64 0.62 0.63 0.61 0.59 0.59 0.60 0.61 0.63
Baltimore City 2.67 2.61 2.60 2.57 2.50 2.47 2.40 2.43 2.46 2.43
Baltimore 0.69 0.70 0.70 0.71 0.71 0.73 0.73 0.72 0.73 0.73
Calvert 1.29 1.29 1.30 1.27 1.26 1.19 1.19 1.19 1.14 1.12
Caroline 2.64 2.50 2.47 2.64 2.62 2.67 2.59 2.60 2.61 2.58
Carroll 0.99 1.02 1.02 1.03 1.01 1.00 0.99 1.00 0.98 0.95
Cecil 1.71 1.74 1.78 1.75 1.75 1.71 1.68 1.78 1.74 1.71
Charles 1.12 1.16 1.20 1.23 1.22 1.18 1.16 1.14 1.18 1.15
Dorchester 1.69 1.61 1.66 1.57 1.64 1.67 1.64 1.49 1.68 1.73
Frederick 0.89 0.91 0.94 0.95 1.00 1.03 1.03 1.02 1.05 1.03
Garrett 1.80 1.64 1.56 1.55 1.44 1.40 1.41 1.37 1.34 1.29
Harford 1.07 1.07 1.10 1.13 1.11 1.10 1.07 1.07 1.04 1.00
Howard 0.68 0.68 0.67 0.67 0.69 0.70 0.70 0.73 0.73 0.72
Kent 0.87 0.81 0.81 0.71 0.60 0.66 0.70 0.67 0.66 0.64
Montgomery 0.50 0.48 0.45 0.45 0.46 0.48 0.53 0.55 0.57 0.57
Prince George’s 1.38 1.42 1.50 1.52 1.53 1.45 1.41 1.36 1.34 1.38
Queen Anne’s 0.83 0.78 0.80 0.78 0.78 0.81 0.78 0.78 0.82 0.83
St. Mary’s 1.11 1.15 1.17 1.16 1.16 1.14 1.08 1.09 1.05 1.05
Somerset 2.84 2.65 2.83 2.79 2.86 2.63 2.77 3.00 2.94 2.88
Talbot 0.38 0.37 0.33 0.32 0.28 0.29 0.29 0.32 0.31 0.32
Washington 0.91 1.04 1.09 1.18 1.25 1.26 1.27 1.31 1.38 1.37
Wicomico 1.25 1.26 1.27 1.33 1.40 1.46 1.52 1.63 1.66 1.68
Worcester 0.35 0.36 0.36 0.37 0.36 0.34 0.36 0.37 0.39 0.39
Total (Weighted Avg.) 1.00 1.00 1.00 1.00 1.00 1.00 1.00 1.00 1.00 1.00
County Mean (Simple Avg.) 1.26 1.24 1.26 1.27 1.26 1.25 1.25 1.26 1.26 1.25
Standard Deviation 0.70 0.70 0.69 0.70 0.71 0.68 0.68 0.70 0.69 0.68
Note: Amounts have been adjusted to reflect changes in State aid classifications and computations.
Source: Department of Legislative Services
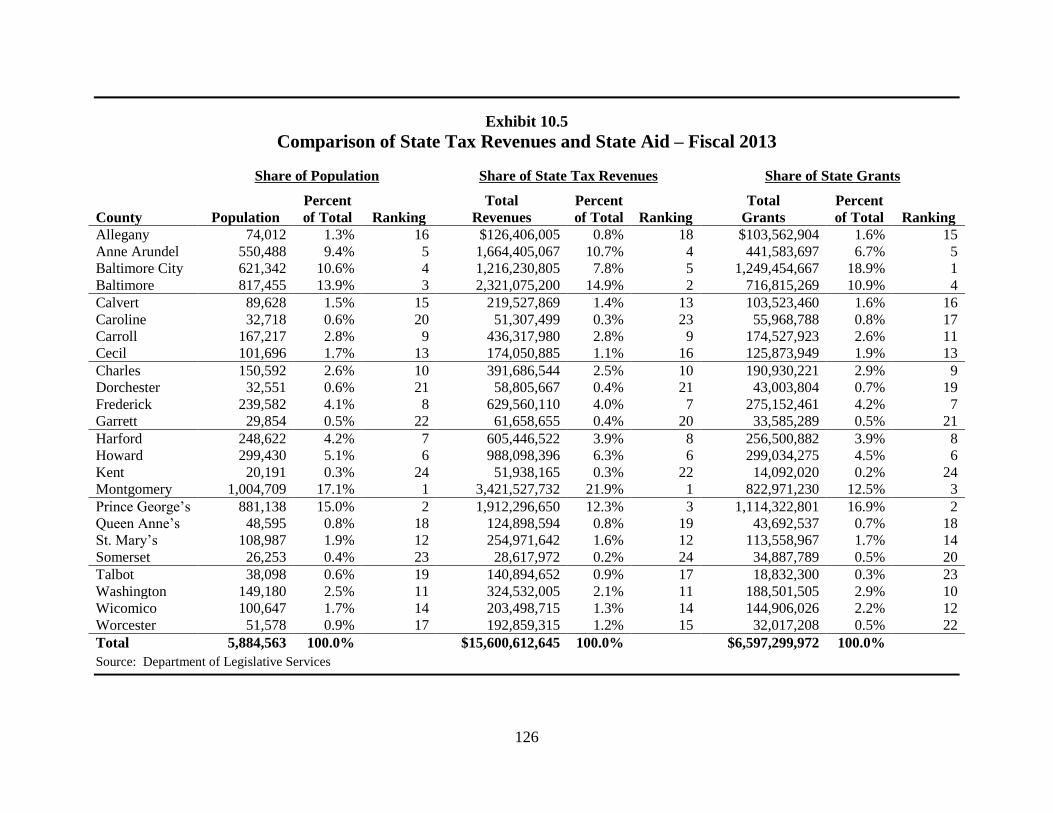
126
Exhibit 10.5
Comparison of State Tax Revenues and State Aid – Fiscal 2013
Share of Population Share of State Tax Revenues Share of State Grants
Percent
Total Percent
Total Percent
County Population of Total Ranking Revenues of Total Ranking Grants of Total Ranking
Allegany 74,012 1.3% 16 $126,406,005 0.8% 18 $103,562,904 1.6% 15
Anne Arundel 550,488 9.4% 5 1,664,405,067 10.7% 4 441,583,697 6.7% 5
Baltimore City 621,342 10.6% 4 1,216,230,805 7.8% 5 1,249,454,667 18.9% 1
Baltimore 817,455 13.9% 3 2,321,075,200 14.9% 2 716,815,269 10.9% 4
Calvert 89,628 1.5% 15 219,527,869 1.4% 13 103,523,460 1.6% 16
Caroline 32,718 0.6% 20 51,307,499 0.3% 23 55,968,788 0.8% 17
Carroll 167,217 2.8% 9 436,317,980 2.8% 9 174,527,923 2.6% 11
Cecil 101,696 1.7% 13 174,050,885 1.1% 16 125,873,949 1.9% 13
Charles 150,592 2.6% 10 391,686,544 2.5% 10 190,930,221 2.9% 9
Dorchester 32,551 0.6% 21 58,805,667 0.4% 21 43,003,804 0.7% 19
Frederick 239,582 4.1% 8 629,560,110 4.0% 7 275,152,461 4.2% 7
Garrett 29,854 0.5% 22 61,658,655 0.4% 20 33,585,289 0.5% 21
Harford 248,622 4.2% 7 605,446,522 3.9% 8 256,500,882 3.9% 8
Howard 299,430 5.1% 6 988,098,396 6.3% 6 299,034,275 4.5% 6
Kent 20,191 0.3% 24 51,938,165 0.3% 22 14,092,020 0.2% 24
Montgomery 1,004,709 17.1% 1 3,421,527,732 21.9% 1 822,971,230 12.5% 3
Prince George’s 881,138 15.0% 2 1,912,296,650 12.3% 3 1,114,322,801 16.9% 2
Queen Anne’s 48,595 0.8% 18 124,898,594 0.8% 19 43,692,537 0.7% 18
St. Mary’s 108,987 1.9% 12 254,971,642 1.6% 12 113,558,967 1.7% 14
Somerset 26,253 0.4% 23 28,617,972 0.2% 24 34,887,789 0.5% 20
Talbot 38,098 0.6% 19 140,894,652 0.9% 17 18,832,300 0.3% 23
Washington 149,180 2.5% 11 324,532,005 2.1% 11 188,501,505 2.9% 10
Wicomico 100,647 1.7% 14 203,498,715 1.3% 14 144,906,026 2.2% 12
Worcester 51,578 0.9% 17 192,859,315 1.2% 15 32,017,208 0.5% 22
Total 5,884,563 100.0%
$15,600,612,645 100.0%
$6,597,299,972 100.0%
Source: Department of Legislative Services
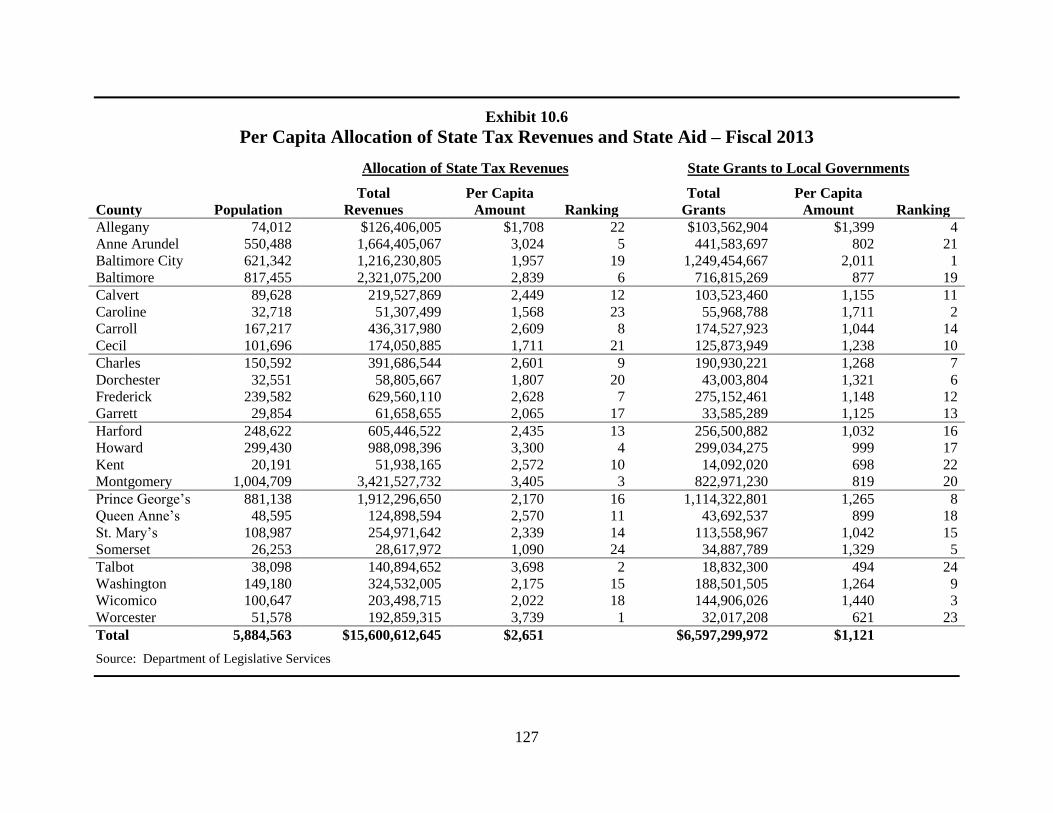
127
Exhibit 10.6
Per Capita Allocation of State Tax Revenues and State Aid – Fiscal 2013
Allocation of State Tax Revenues State Grants to Local Governments
Total Per Capita
Total Per Capita
County Population Revenues Amount Ranking Grants Amount Ranking
Allegany 74,012 $126,406,005 $1,708 22 $103,562,904 $1,399 4
Anne Arundel 550,488 1,664,405,067 3,024 5 441,583,697 802 21
Baltimore City 621,342 1,216,230,805 1,957 19 1,249,454,667 2,011 1
Baltimore 817,455 2,321,075,200 2,839 6 716,815,269 877 19
Calvert 89,628 219,527,869 2,449 12 103,523,460 1,155 11
Caroline 32,718 51,307,499 1,568 23 55,968,788 1,711 2
Carroll 167,217 436,317,980 2,609 8 174,527,923 1,044 14
Cecil 101,696 174,050,885 1,711 21 125,873,949 1,238 10
Charles 150,592 391,686,544 2,601 9 190,930,221 1,268 7
Dorchester 32,551 58,805,667 1,807 20 43,003,804 1,321 6
Frederick 239,582 629,560,110 2,628 7 275,152,461 1,148 12
Garrett 29,854 61,658,655 2,065 17 33,585,289 1,125 13
Harford 248,622 605,446,522 2,435 13 256,500,882 1,032 16
Howard 299,430 988,098,396 3,300 4 299,034,275 999 17
Kent 20,191 51,938,165 2,572 10 14,092,020 698 22
Montgomery 1,004,709 3,421,527,732 3,405 3 822,971,230 819 20
Prince George’s 881,138 1,912,296,650 2,170 16 1,114,322,801 1,265 8
Queen Anne’s 48,595 124,898,594 2,570 11 43,692,537 899 18
St. Mary’s 108,987 254,971,642 2,339 14 113,558,967 1,042 15
Somerset 26,253 28,617,972 1,090 24 34,887,789 1,329 5
Talbot 38,098 140,894,652 3,698 2 18,832,300 494 24
Washington 149,180 324,532,005 2,175 15 188,501,505 1,264 9
Wicomico 100,647 203,498,715 2,022 18 144,906,026 1,440 3
Worcester 51,578 192,859,315 3,739 1 32,017,208 621 23
Total 5,884,563 $15,600,612,645 $2,651
$6,597,299,972 $1,121
Source: Department of Legislative Services

128
129
Appendices

130
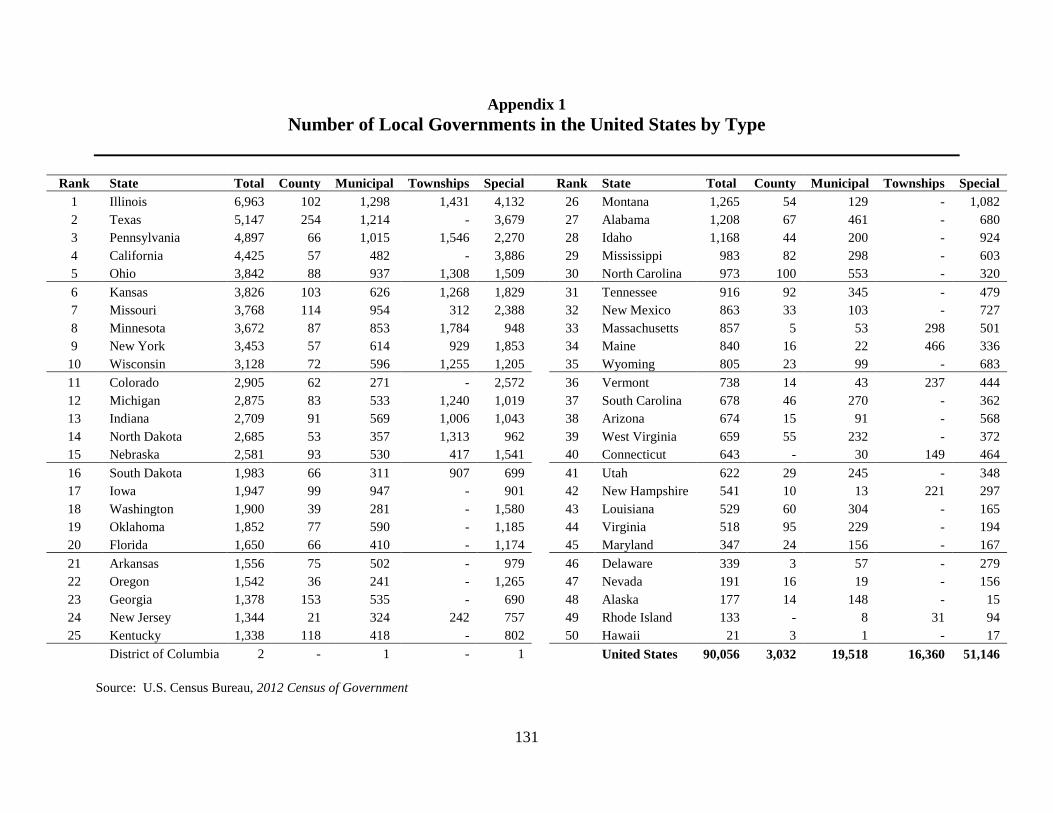
131
Appendix 1
Number of Local Governments in the United States by Type
Rank State Total County Municipal Townships Special Rank State Total County Municipal Townships Special
1 Illinois 6,963 102 1,298 1,431 4,132 26 Montana 1,265 54 129 - 1,082
2 Texas 5,147 254 1,214 - 3,679 27 Alabama 1,208 67 461 - 680
3 Pennsylvania 4,897 66 1,015 1,546 2,270 28 Idaho 1,168 44 200 - 924
4 California 4,425 57 482 - 3,886 29 Mississippi 983 82 298 - 603
5 Ohio 3,842 88 937 1,308 1,509 30 North Carolina 973 100 553 - 320
6 Kansas 3,826 103 626 1,268 1,829 31 Tennessee 916 92 345 - 479
7 Missouri 3,768 114 954 312 2,388 32 New Mexico 863 33 103 - 727
8 Minnesota 3,672 87 853 1,784 948 33 Massachusetts 857 5 53 298 501
9 New York 3,453 57 614 929 1,853 34 Maine 840 16 22 466 336
10 Wisconsin 3,128 72 596 1,255 1,205 35 Wyoming 805 23 99 - 683
11 Colorado 2,905 62 271 - 2,572 36 Vermont 738 14 43 237 444
12 Michigan 2,875 83 533 1,240 1,019 37 South Carolina 678 46 270 - 362
13 Indiana 2,709 91 569 1,006 1,043 38 Arizona 674 15 91 - 568
14 North Dakota 2,685 53 357 1,313 962 39 West Virginia 659 55 232 - 372
15 Nebraska 2,581 93 530 417 1,541 40 Connecticut 643 - 30 149 464
16 South Dakota 1,983 66 311 907 699 41 Utah 622 29 245 - 348
17 Iowa 1,947 99 947 - 901 42 New Hampshire 541 10 13 221 297
18 Washington 1,900 39 281 - 1,580 43 Louisiana 529 60 304 - 165
19 Oklahoma 1,852 77 590 - 1,185 44 Virginia 518 95 229 - 194
20 Florida 1,650 66 410 - 1,174 45 Maryland 347 24 156 - 167
21 Arkansas 1,556 75 502 - 979 46 Delaware 339 3 57 - 279
22 Oregon 1,542 36 241 - 1,265 47 Nevada 191 16 19 - 156
23 Georgia 1,378 153 535 - 690 48 Alaska 177 14 148 - 15
24 New Jersey 1,344 21 324 242 757 49 Rhode Island 133 - 8 31 94
25 Kentucky 1,338 118 418 - 802 50 Hawaii 21 3 1 - 17
District of Columbia 2 - 1 - 1 United States 90,056 3,032 19,518 16,360 51,146
Source: U.S. Census Bureau, 2012 Census of Government

132
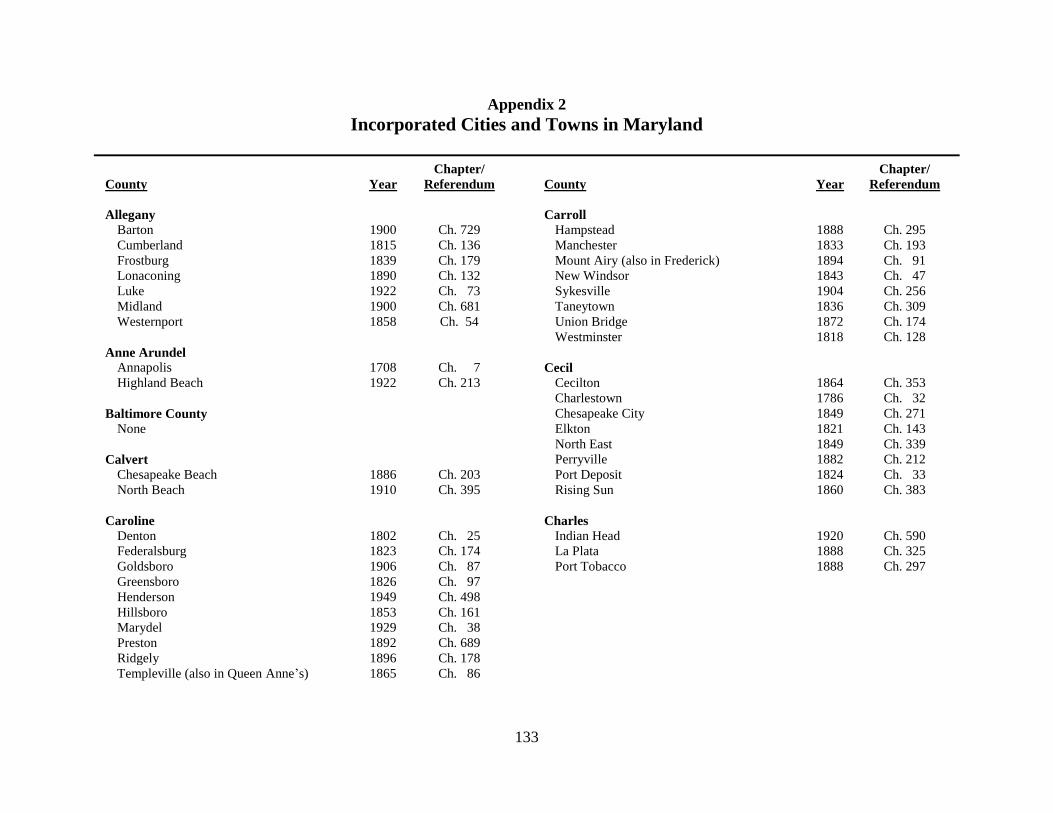
133
Appendix 2
Incorporated Cities and Towns in Maryland
County
Year
Chapter/
Referendum
County
Year
Chapter/
Referendum
Allegany Carroll
Barton 1900 Ch. 729 Hampstead 1888 Ch. 295
Cumberland 1815 Ch. 136 Manchester 1833 Ch. 193
Frostburg 1839 Ch. 179 Mount Airy (also in Frederick) 1894 Ch. 91
Lonaconing 1890 Ch. 132 New Windsor 1843 Ch. 47
Luke 1922 Ch. 73 Sykesville 1904 Ch. 256
Midland 1900 Ch. 681 Taneytown 1836 Ch. 309
Westernport 1858 Ch. 54 Union Bridge 1872 Ch. 174
Westminster 1818 Ch. 128
Anne Arundel
Annapolis 1708 Ch. 7 Cecil
Highland Beach 1922 Ch. 213 Cecilton 1864 Ch. 353
Charlestown 1786 Ch. 32
Baltimore County Chesapeake City 1849 Ch. 271
None Elkton 1821 Ch. 143
North East 1849 Ch. 339
Calvert Perryville 1882 Ch. 212
Chesapeake Beach 1886 Ch. 203 Port Deposit 1824 Ch. 33
North Beach 1910 Ch. 395 Rising Sun 1860 Ch. 383
Caroline Charles
Denton 1802 Ch. 25 Indian Head 1920 Ch. 590
Federalsburg 1823 Ch. 174 La Plata 1888 Ch. 325
Goldsboro 1906 Ch. 87 Port Tobacco 1888 Ch. 297
Greensboro 1826 Ch. 97
Henderson 1949 Ch. 498
Hillsboro 1853 Ch. 161
Marydel 1929 Ch. 38
Preston 1892 Ch. 689
Ridgely 1896 Ch. 178
Templeville (also in Queen Anne’s) 1865 Ch. 86
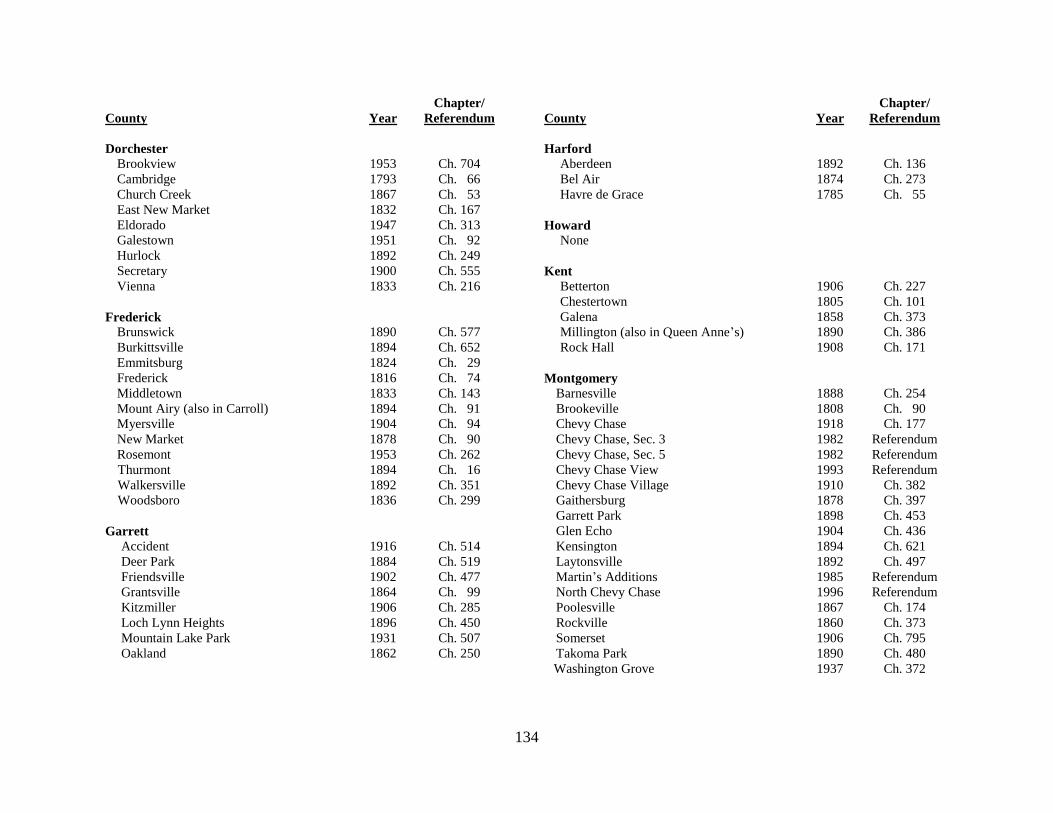
134
County
Year
Chapter/
Referendum
County
Year
Chapter/
Referendum
Dorchester Harford
Brookview 1953 Ch. 704 Aberdeen 1892 Ch. 136
Cambridge 1793 Ch. 66 Bel Air 1874 Ch. 273
Church Creek 1867 Ch. 53 Havre de Grace 1785 Ch. 55
East New Market 1832 Ch. 167
Eldorado 1947 Ch. 313 Howard
Galestown 1951 Ch. 92 None
Hurlock 1892 Ch. 249
Secretary 1900 Ch. 555 Kent
Vienna 1833 Ch. 216 Betterton 1906 Ch. 227
Chestertown 1805 Ch. 101
Frederick Galena 1858 Ch. 373
Brunswick 1890 Ch. 577 Millington (also in Queen Anne’s) 1890 Ch. 386
Burkittsville 1894 Ch. 652 Rock Hall 1908 Ch. 171
Emmitsburg 1824 Ch. 29
Frederick 1816 Ch. 74 Montgomery
Middletown 1833 Ch. 143 Barnesville 1888 Ch. 254
Mount Airy (also in Carroll) 1894 Ch. 91 Brookeville 1808 Ch. 90
Myersville 1904 Ch. 94 Chevy Chase 1918 Ch. 177
New Market 1878 Ch. 90 Chevy Chase, Sec. 3 1982 Referendum
Rosemont 1953 Ch. 262 Chevy Chase, Sec. 5 1982 Referendum
Thurmont 1894 Ch. 16 Chevy Chase View 1993 Referendum
Walkersville 1892 Ch. 351 Chevy Chase Village 1910 Ch. 382
Woodsboro 1836 Ch. 299 Gaithersburg 1878 Ch. 397
Garrett Park 1898 Ch. 453
Garrett Glen Echo 1904 Ch. 436
Accident 1916 Ch. 514 Kensington 1894 Ch. 621
Deer Park 1884 Ch. 519 Laytonsville 1892 Ch. 497
Friendsville 1902 Ch. 477 Martin’s Additions 1985 Referendum
Grantsville 1864 Ch. 99 North Chevy Chase 1996 Referendum
Kitzmiller 1906 Ch. 285 Poolesville 1867 Ch. 174
Loch Lynn Heights 1896 Ch. 450 Rockville 1860 Ch. 373
Mountain Lake Park 1931 Ch. 507 Somerset 1906 Ch. 795
Oakland 1862 Ch. 250 Takoma Park 1890 Ch. 480
Washington Grove 1937 Ch. 372
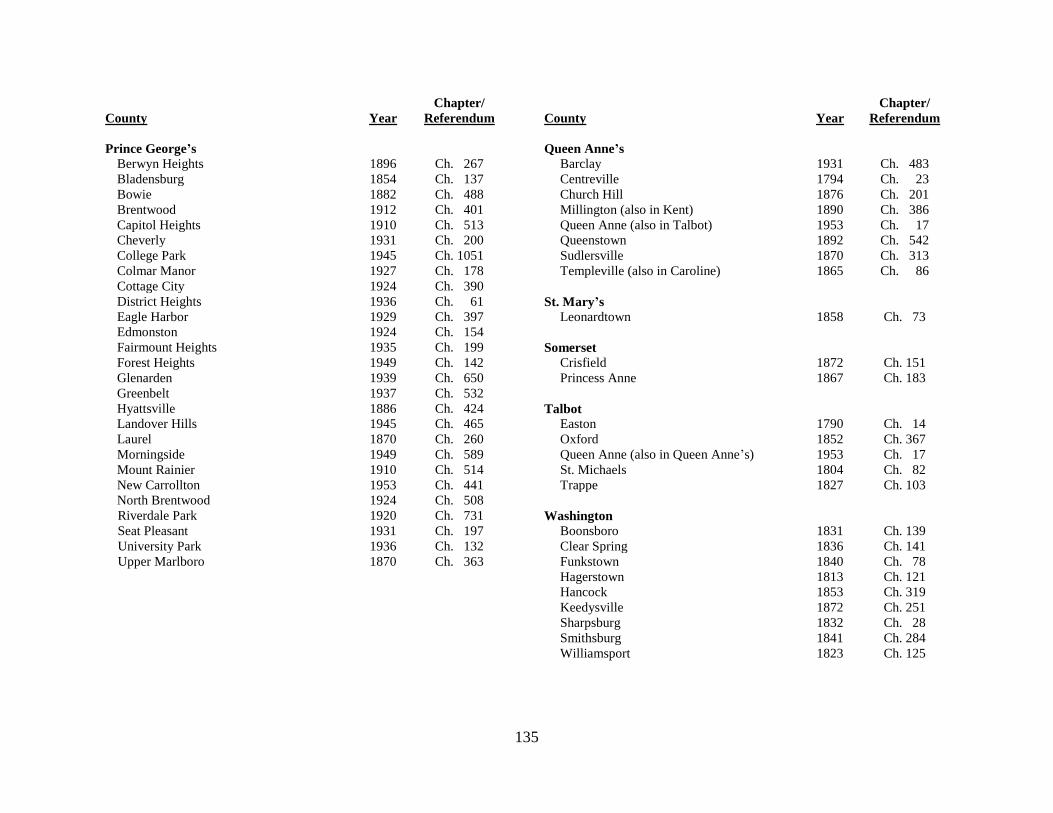
135
County
Year
Chapter/
Referendum
County
Year
Chapter/
Referendum
Prince George’s Queen Anne’s
Berwyn Heights 1896 Ch. 267 Barclay 1931 Ch. 483
Bladensburg 1854 Ch. 137 Centreville 1794 Ch. 23
Bowie 1882 Ch. 488 Church Hill 1876 Ch. 201
Brentwood 1912 Ch. 401 Millington (also in Kent) 1890 Ch. 386
Capitol Heights 1910 Ch. 513 Queen Anne (also in Talbot) 1953 Ch. 17
Cheverly 1931 Ch. 200 Queenstown 1892 Ch. 542
College Park 1945 Ch. 1051 Sudlersville 1870 Ch. 313
Colmar Manor 1927 Ch. 178 Templeville (also in Caroline) 1865 Ch. 86
Cottage City 1924 Ch. 390
District Heights 1936 Ch. 61 St. Mary’s
Eagle Harbor 1929 Ch. 397 Leonardtown 1858 Ch. 73
Edmonston 1924 Ch. 154
Fairmount Heights 1935 Ch. 199 Somerset
Forest Heights 1949 Ch. 142 Crisfield 1872 Ch. 151
Glenarden 1939 Ch. 650 Princess Anne 1867 Ch. 183
Greenbelt 1937 Ch. 532
Hyattsville 1886 Ch. 424 Talbot
Landover Hills 1945 Ch. 465 Easton 1790 Ch. 14
Laurel 1870 Ch. 260 Oxford 1852 Ch. 367
Morningside 1949 Ch. 589 Queen Anne (also in Queen Anne’s) 1953 Ch. 17
Mount Rainier 1910 Ch. 514 St. Michaels 1804 Ch. 82
New Carrollton 1953 Ch. 441 Trappe 1827 Ch. 103
North Brentwood 1924 Ch. 508
Riverdale Park 1920 Ch. 731 Washington
Seat Pleasant 1931 Ch. 197 Boonsboro 1831 Ch. 139
University Park 1936 Ch. 132 Clear Spring 1836 Ch. 141
Upper Marlboro 1870 Ch. 363 Funkstown 1840 Ch. 78
Hagerstown 1813 Ch. 121
Hancock 1853 Ch. 319
Keedysville 1872 Ch. 251
Sharpsburg 1832 Ch. 28
Smithsburg 1841 Ch. 284
Williamsport 1823 Ch. 125
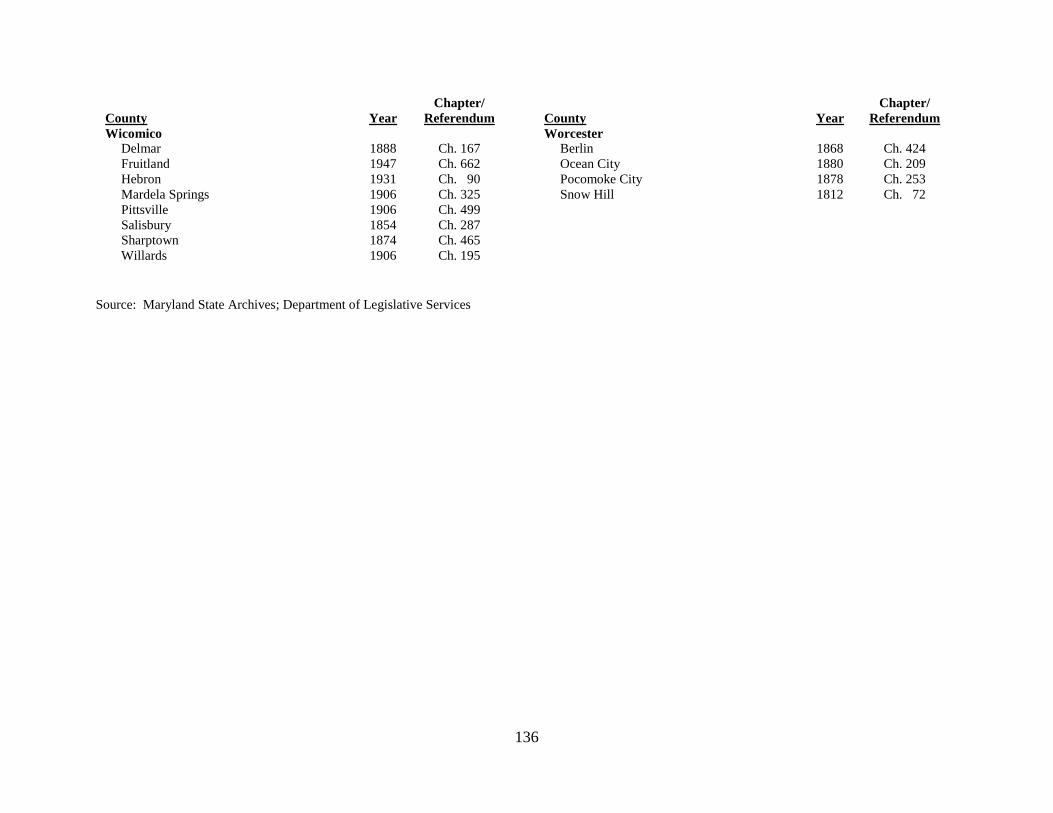
136
County
Year
Chapter/
Referendum
County
Year
Chapter/
Referendum
Wicomico Worcester
Delmar 1888 Ch. 167 Berlin 1868 Ch. 424
Fruitland 1947 Ch. 662 Ocean City 1880 Ch. 209
Hebron 1931 Ch. 90 Pocomoke City 1878 Ch. 253
Mardela Springs 1906 Ch. 325 Snow Hill 1812 Ch. 72
Pittsville 1906 Ch. 499
Salisbury 1854 Ch. 287
Sharptown 1874 Ch. 465
Willards 1906 Ch. 195
Source: Maryland State Archives; Department of Legislative Services
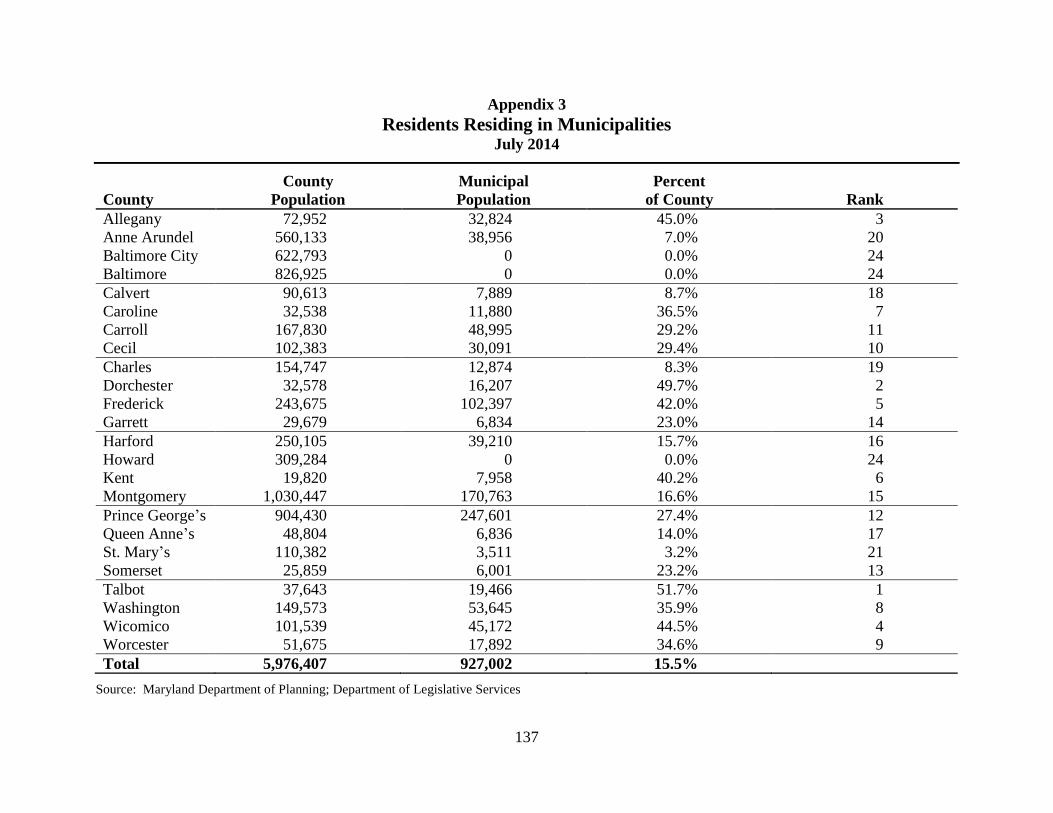
137
Appendix 3
Residents Residing in Municipalities July 2014
County Municipal Percent
County Population Population of County Rank
Allegany 72,952 32,824 45.0% 3
Anne Arundel 560,133 38,956 7.0% 20
Baltimore City 622,793 0 0.0% 24
Baltimore 826,925 0 0.0% 24
Calvert 90,613 7,889 8.7% 18
Caroline 32,538 11,880 36.5% 7
Carroll 167,830 48,995 29.2% 11
Cecil 102,383 30,091 29.4% 10
Charles 154,747 12,874 8.3% 19
Dorchester 32,578 16,207 49.7% 2
Frederick 243,675 102,397 42.0% 5
Garrett 29,679 6,834 23.0% 14
Harford 250,105 39,210 15.7% 16
Howard 309,284 0 0.0% 24
Kent 19,820 7,958 40.2% 6
Montgomery 1,030,447 170,763 16.6% 15
Prince George’s 904,430 247,601 27.4% 12
Queen Anne’s 48,804 6,836 14.0% 17
St. Mary’s 110,382 3,511 3.2% 21
Somerset 25,859 6,001 23.2% 13
Talbot 37,643 19,466 51.7% 1
Washington 149,573 53,645 35.9% 8
Wicomico 101,539 45,172 44.5% 4
Worcester 51,675 17,892 34.6% 9
Total 5,976,407 927,002 15.5%
Source: Maryland Department of Planning; Department of Legislative Services

138
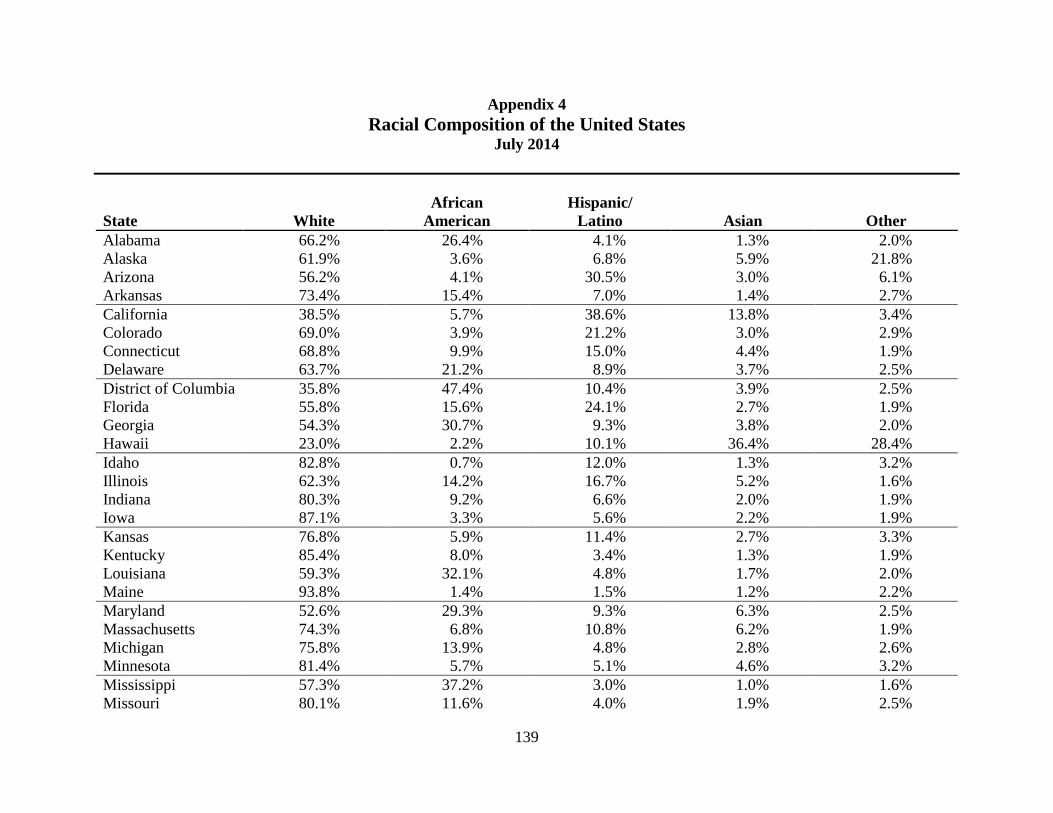
139
Appendix 4
Racial Composition of the United States July 2014
African Hispanic/
State White American Latino Asian Other
Alabama 66.2% 26.4% 4.1% 1.3% 2.0%
Alaska 61.9% 3.6% 6.8% 5.9% 21.8%
Arizona 56.2% 4.1% 30.5% 3.0% 6.1%
Arkansas 73.4% 15.4% 7.0% 1.4% 2.7%
California 38.5% 5.7% 38.6% 13.8% 3.4%
Colorado 69.0% 3.9% 21.2% 3.0% 2.9%
Connecticut 68.8% 9.9% 15.0% 4.4% 1.9%
Delaware 63.7% 21.2% 8.9% 3.7% 2.5%
District of Columbia 35.8% 47.4% 10.4% 3.9% 2.5%
Florida 55.8% 15.6% 24.1% 2.7% 1.9%
Georgia 54.3% 30.7% 9.3% 3.8% 2.0%
Hawaii 23.0% 2.2% 10.1% 36.4% 28.4%
Idaho 82.8% 0.7% 12.0% 1.3% 3.2%
Illinois 62.3% 14.2% 16.7% 5.2% 1.6%
Indiana 80.3% 9.2% 6.6% 2.0% 1.9%
Iowa 87.1% 3.3% 5.6% 2.2% 1.9%
Kansas 76.8% 5.9% 11.4% 2.7% 3.3%
Kentucky 85.4% 8.0% 3.4% 1.3% 1.9%
Louisiana 59.3% 32.1% 4.8% 1.7% 2.0%
Maine 93.8% 1.4% 1.5% 1.2% 2.2%
Maryland 52.6% 29.3% 9.3% 6.3% 2.5%
Massachusetts 74.3% 6.8% 10.8% 6.2% 1.9%
Michigan 75.8% 13.9% 4.8% 2.8% 2.6%
Minnesota 81.4% 5.7% 5.1% 4.6% 3.2%
Mississippi 57.3% 37.2% 3.0% 1.0% 1.6%
Missouri 80.1% 11.6% 4.0% 1.9% 2.5%
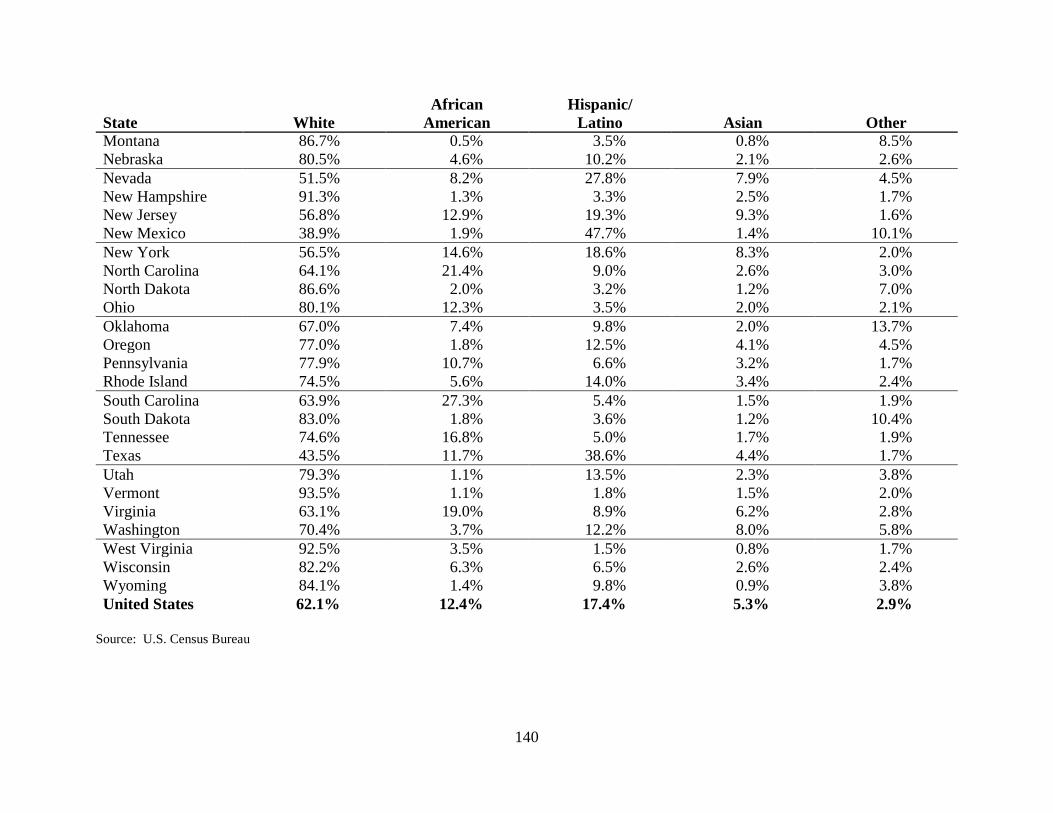
140
African Hispanic/
State White American Latino Asian Other
Montana 86.7% 0.5% 3.5% 0.8% 8.5%
Nebraska 80.5% 4.6% 10.2% 2.1% 2.6%
Nevada 51.5% 8.2% 27.8% 7.9% 4.5%
New Hampshire 91.3% 1.3% 3.3% 2.5% 1.7%
New Jersey 56.8% 12.9% 19.3% 9.3% 1.6%
New Mexico 38.9% 1.9% 47.7% 1.4% 10.1%
New York 56.5% 14.6% 18.6% 8.3% 2.0%
North Carolina 64.1% 21.4% 9.0% 2.6% 3.0%
North Dakota 86.6% 2.0% 3.2% 1.2% 7.0%
Ohio 80.1% 12.3% 3.5% 2.0% 2.1%
Oklahoma 67.0% 7.4% 9.8% 2.0% 13.7%
Oregon 77.0% 1.8% 12.5% 4.1% 4.5%
Pennsylvania 77.9% 10.7% 6.6% 3.2% 1.7%
Rhode Island 74.5% 5.6% 14.0% 3.4% 2.4%
South Carolina 63.9% 27.3% 5.4% 1.5% 1.9%
South Dakota 83.0% 1.8% 3.6% 1.2% 10.4%
Tennessee 74.6% 16.8% 5.0% 1.7% 1.9%
Texas 43.5% 11.7% 38.6% 4.4% 1.7%
Utah 79.3% 1.1% 13.5% 2.3% 3.8%
Vermont 93.5% 1.1% 1.8% 1.5% 2.0%
Virginia 63.1% 19.0% 8.9% 6.2% 2.8%
Washington 70.4% 3.7% 12.2% 8.0% 5.8%
West Virginia 92.5% 3.5% 1.5% 0.8% 1.7%
Wisconsin 82.2% 6.3% 6.5% 2.6% 2.4%
Wyoming 84.1% 1.4% 9.8% 0.9% 3.8%
United States 62.1% 12.4% 17.4% 5.3% 2.9%
Source: U.S. Census Bureau
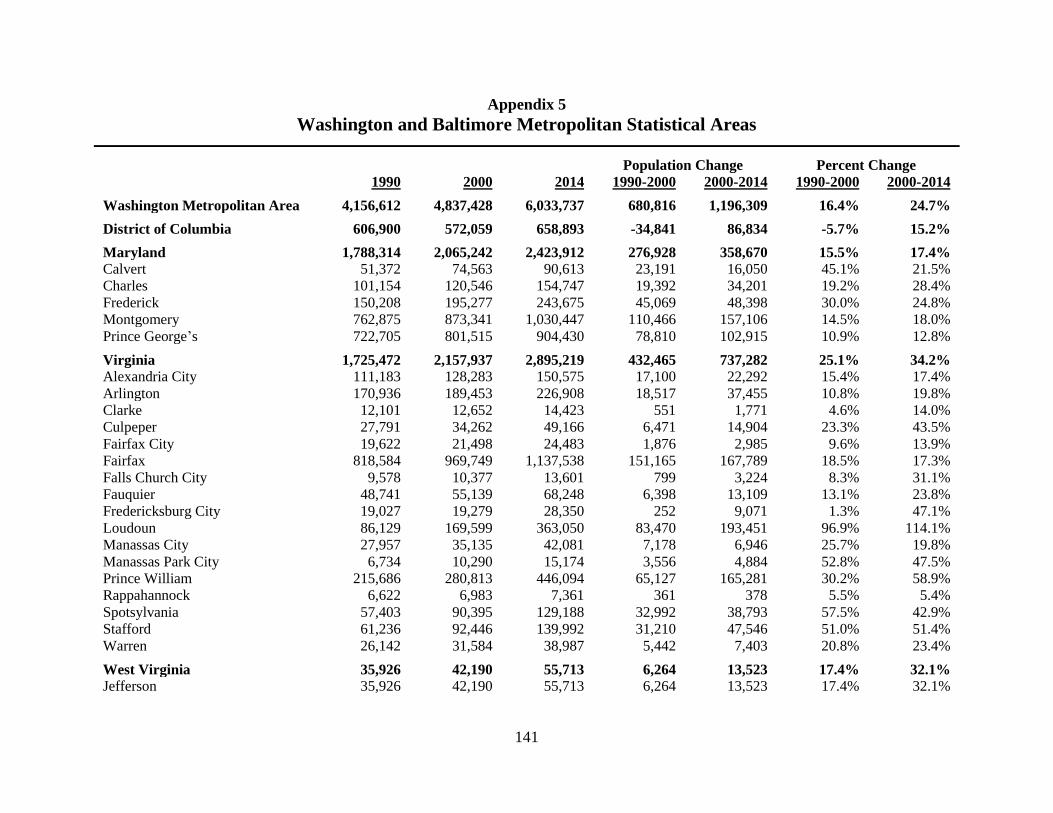
141
Appendix 5
Washington and Baltimore Metropolitan Statistical Areas
Population Change Percent Change
1990 2000 2014 1990-2000 2000-2014 1990-2000 2000-2014
Washington Metropolitan Area 4,156,612 4,837,428 6,033,737 680,816 1,196,309 16.4% 24.7%
District of Columbia 606,900 572,059 658,893 -34,841 86,834 -5.7% 15.2%
Maryland 1,788,314 2,065,242 2,423,912 276,928 358,670 15.5% 17.4%
Calvert 51,372 74,563 90,613 23,191 16,050 45.1% 21.5%
Charles 101,154 120,546 154,747 19,392 34,201 19.2% 28.4%
Frederick 150,208 195,277 243,675 45,069 48,398 30.0% 24.8%
Montgomery 762,875 873,341 1,030,447 110,466 157,106 14.5% 18.0%
Prince George’s 722,705 801,515 904,430 78,810 102,915 10.9% 12.8%
Virginia 1,725,472 2,157,937 2,895,219 432,465 737,282 25.1% 34.2%
Alexandria City 111,183 128,283 150,575 17,100 22,292 15.4% 17.4%
Arlington 170,936 189,453 226,908 18,517 37,455 10.8% 19.8%
Clarke 12,101 12,652 14,423 551 1,771 4.6% 14.0%
Culpeper 27,791 34,262 49,166 6,471 14,904 23.3% 43.5%
Fairfax City 19,622 21,498 24,483 1,876 2,985 9.6% 13.9%
Fairfax 818,584 969,749 1,137,538 151,165 167,789 18.5% 17.3%
Falls Church City 9,578 10,377 13,601 799 3,224 8.3% 31.1%
Fauquier 48,741 55,139 68,248 6,398 13,109 13.1% 23.8%
Fredericksburg City 19,027 19,279 28,350 252 9,071 1.3% 47.1%
Loudoun 86,129 169,599 363,050 83,470 193,451 96.9% 114.1%
Manassas City 27,957 35,135 42,081 7,178 6,946 25.7% 19.8%
Manassas Park City 6,734 10,290 15,174 3,556 4,884 52.8% 47.5%
Prince William 215,686 280,813 446,094 65,127 165,281 30.2% 58.9%
Rappahannock 6,622 6,983 7,361 361 378 5.5% 5.4%
Spotsylvania 57,403 90,395 129,188 32,992 38,793 57.5% 42.9%
Stafford 61,236 92,446 139,992 31,210 47,546 51.0% 51.4%
Warren 26,142 31,584 38,987 5,442 7,403 20.8% 23.4%
West Virginia 35,926 42,190 55,713 6,264 13,523 17.4% 32.1%
Jefferson 35,926 42,190 55,713 6,264 13,523 17.4% 32.1%
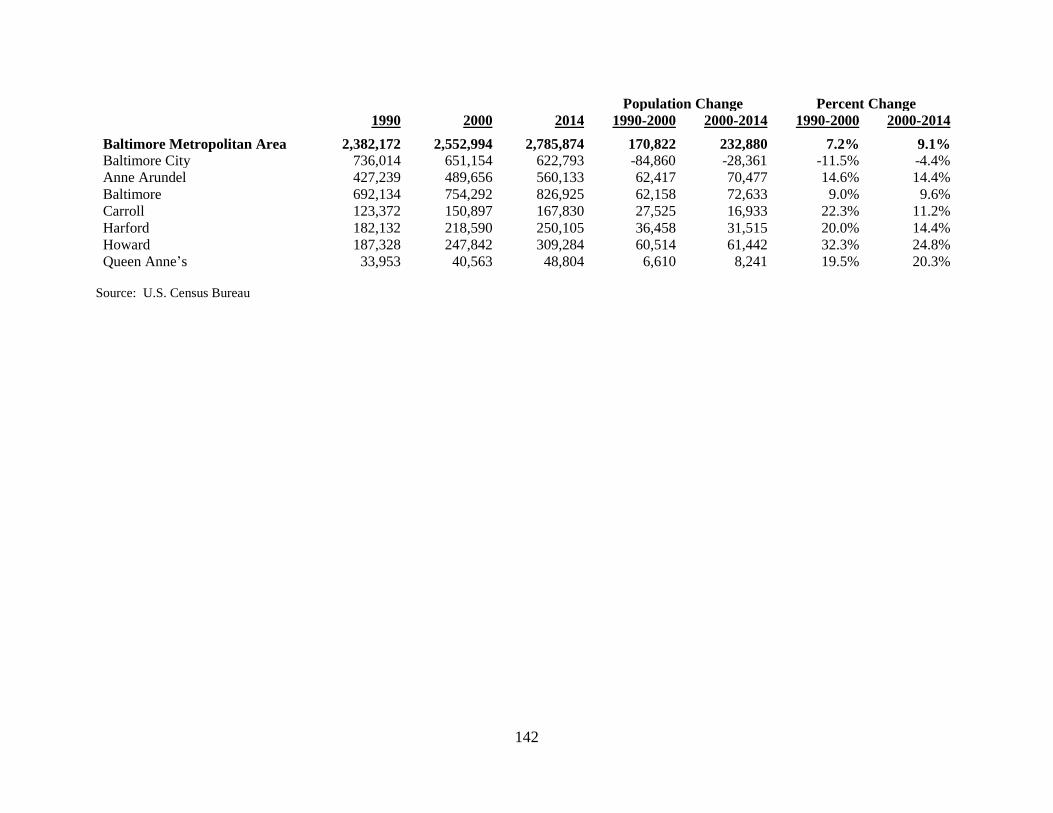
142
Population Change Percent Change
1990 2000 2014 1990-2000 2000-2014 1990-2000 2000-2014
Baltimore Metropolitan Area 2,382,172 2,552,994 2,785,874 170,822 232,880 7.2% 9.1%
Baltimore City 736,014 651,154 622,793 -84,860 -28,361 -11.5% -4.4%
Anne Arundel 427,239 489,656 560,133 62,417 70,477 14.6% 14.4%
Baltimore 692,134 754,292 826,925 62,158 72,633 9.0% 9.6%
Carroll 123,372 150,897 167,830 27,525 16,933 22.3% 11.2%
Harford 182,132 218,590 250,105 36,458 31,515 20.0% 14.4%
Howard 187,328 247,842 309,284 60,514 61,442 32.3% 24.8%
Queen Anne’s 33,953 40,563 48,804 6,610 8,241 19.5% 20.3%
Source: U.S. Census Bureau
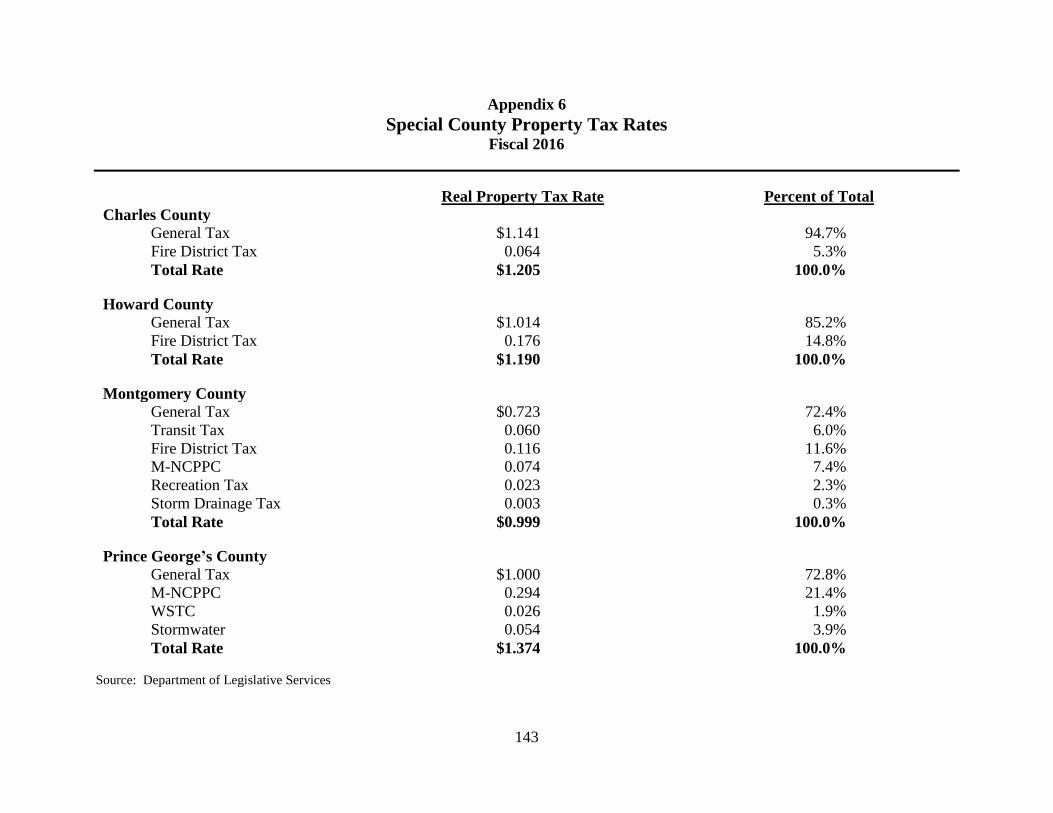
143
Appendix 6
Special County Property Tax Rates Fiscal 2016
Real Property Tax Rate Percent of Total
Charles County
General Tax $1.141 94.7%
Fire District Tax 0.064 5.3%
Total Rate $1.205 100.0%
Howard County
General Tax $1.014 85.2%
Fire District Tax 0.176 14.8%
Total Rate $1.190 100.0%
Montgomery County
General Tax $0.723 72.4%
Transit Tax 0.060 6.0%
Fire District Tax 0.116 11.6%
M-NCPPC 0.074 7.4%
Recreation Tax 0.023 2.3%
Storm Drainage Tax 0.003 0.3%
Total Rate $0.999 100.0%
Prince George’s County
General Tax $1.000 72.8%
M-NCPPC 0.294 21.4%
WSTC 0.026 1.9%
Stormwater 0.054 3.9%
Total Rate $1.374 100.0%
Source: Department of Legislative Services

144
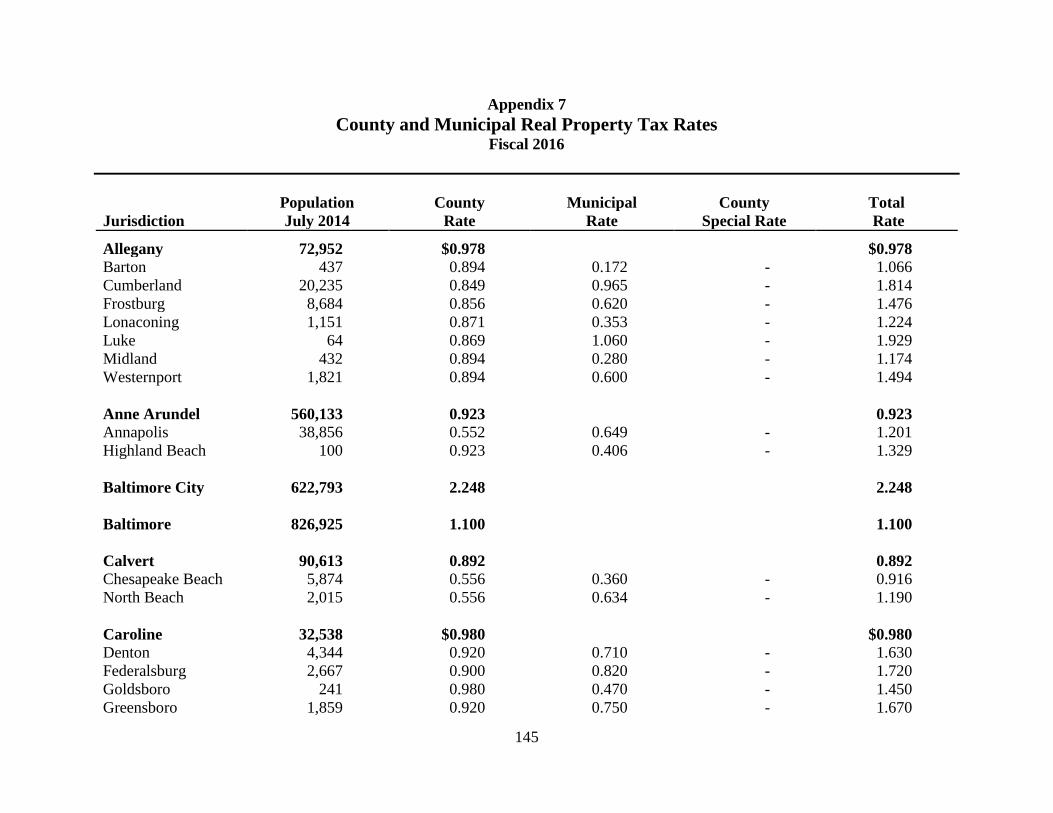
145
Appendix 7
County and Municipal Real Property Tax Rates Fiscal 2016
Population County Municipal County Total
Jurisdiction July 2014 Rate Rate Special Rate Rate
Allegany 72,952 $0.978 $0.978
Barton 437 0.894 0.172 - 1.066
Cumberland 20,235 0.849 0.965 - 1.814
Frostburg 8,684 0.856 0.620 - 1.476
Lonaconing 1,151 0.871 0.353 - 1.224
Luke 64 0.869 1.060 - 1.929
Midland 432 0.894 0.280 - 1.174
Westernport 1,821 0.894 0.600 - 1.494
Anne Arundel 560,133 0.923 0.923
Annapolis 38,856 0.552 0.649 - 1.201
Highland Beach 100 0.923 0.406 - 1.329
Baltimore City 622,793 2.248 2.248
Baltimore 826,925 1.100 1.100
Calvert 90,613 0.892 0.892
Chesapeake Beach 5,874 0.556 0.360 - 0.916
North Beach 2,015 0.556 0.634 - 1.190
Caroline 32,538 $0.980 $0.980
Denton 4,344 0.920 0.710 - 1.630
Federalsburg 2,667 0.900 0.820 - 1.720
Goldsboro 241 0.980 0.470 - 1.450
Greensboro 1,859 0.920 0.750 - 1.670
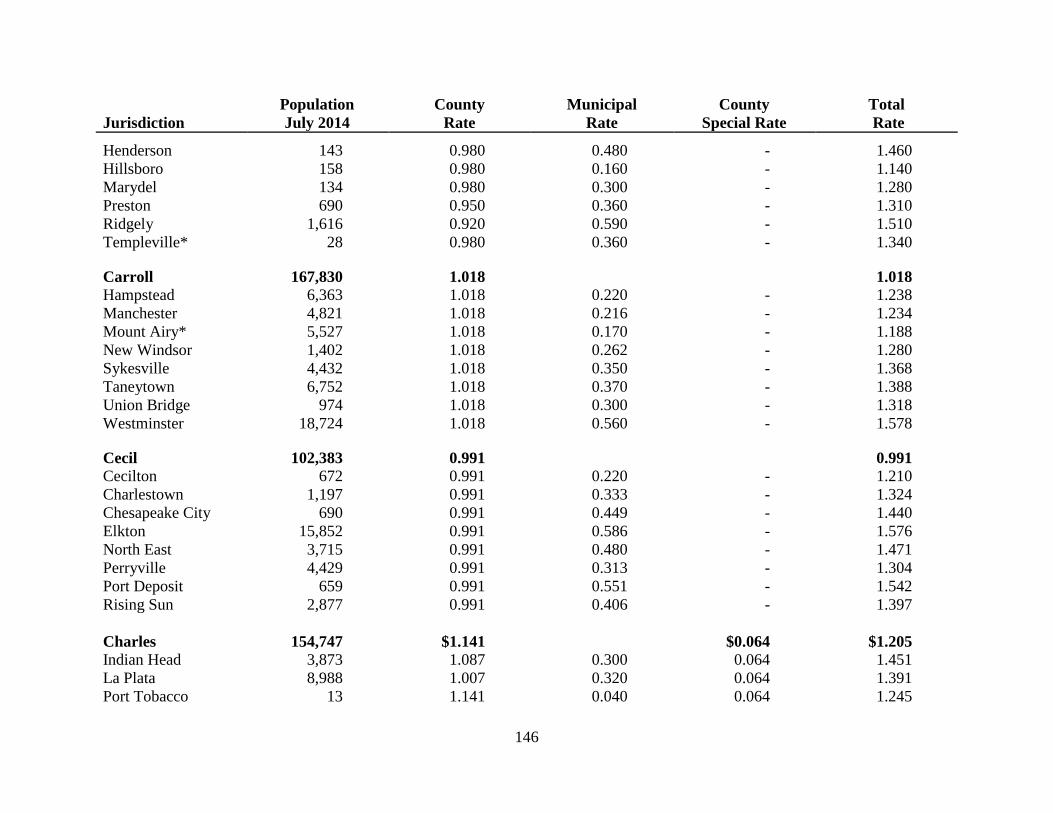
146
Population County Municipal County Total
Jurisdiction July 2014 Rate Rate Special Rate Rate
Henderson 143 0.980 0.480 - 1.460
Hillsboro 158 0.980 0.160 - 1.140
Marydel 134 0.980 0.300 - 1.280
Preston 690 0.950 0.360 - 1.310
Ridgely 1,616 0.920 0.590 - 1.510
Templeville* 28 0.980 0.360 - 1.340
Carroll 167,830 1.018 1.018
Hampstead 6,363 1.018 0.220 - 1.238
Manchester 4,821 1.018 0.216 - 1.234
Mount Airy* 5,527 1.018 0.170 - 1.188
New Windsor 1,402 1.018 0.262 - 1.280
Sykesville 4,432 1.018 0.350 - 1.368
Taneytown 6,752 1.018 0.370 - 1.388
Union Bridge 974 1.018 0.300 - 1.318
Westminster 18,724 1.018 0.560 - 1.578
Cecil 102,383 0.991 0.991
Cecilton 672 0.991 0.220 - 1.210
Charlestown 1,197 0.991 0.333 - 1.324
Chesapeake City 690 0.991 0.449 - 1.440
Elkton 15,852 0.991 0.586 - 1.576
North East 3,715 0.991 0.480 - 1.471
Perryville 4,429 0.991 0.313 - 1.304
Port Deposit 659 0.991 0.551 - 1.542
Rising Sun 2,877 0.991 0.406 - 1.397
Charles 154,747 $1.141 $0.064 $1.205
Indian Head 3,873 1.087 0.300 0.064 1.451
La Plata 8,988 1.007 0.320 0.064 1.391
Port Tobacco 13 1.141 0.040 0.064 1.245
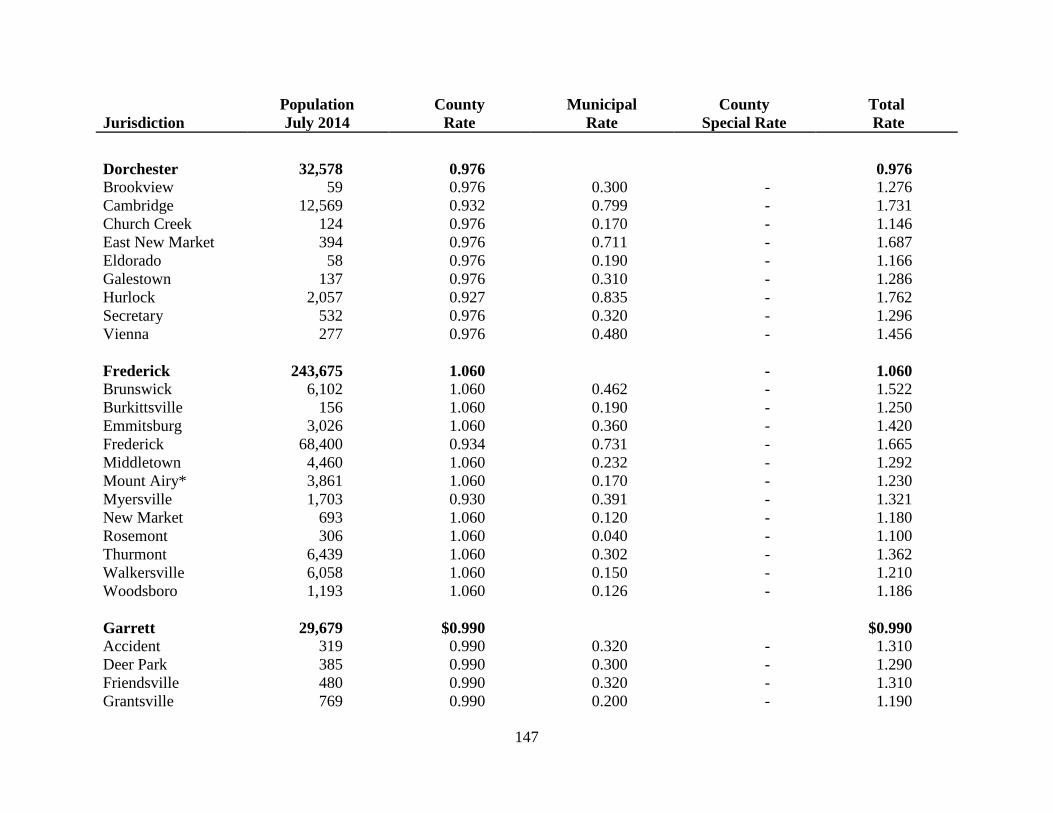
147
Population County Municipal County Total
Jurisdiction July 2014 Rate Rate Special Rate Rate
Dorchester 32,578 0.976 0.976
Brookview 59 0.976 0.300 - 1.276
Cambridge 12,569 0.932 0.799 - 1.731
Church Creek 124 0.976 0.170 - 1.146
East New Market 394 0.976 0.711 - 1.687
Eldorado 58 0.976 0.190 - 1.166
Galestown 137 0.976 0.310 - 1.286
Hurlock 2,057 0.927 0.835 - 1.762
Secretary 532 0.976 0.320 - 1.296
Vienna 277 0.976 0.480 - 1.456
Frederick 243,675 1.060 - 1.060
Brunswick 6,102 1.060 0.462 - 1.522
Burkittsville 156 1.060 0.190 - 1.250
Emmitsburg 3,026 1.060 0.360 - 1.420
Frederick 68,400 0.934 0.731 - 1.665
Middletown 4,460 1.060 0.232 - 1.292
Mount Airy* 3,861 1.060 0.170 - 1.230
Myersville 1,703 0.930 0.391 - 1.321
New Market 693 1.060 0.120 - 1.180
Rosemont 306 1.060 0.040 - 1.100
Thurmont 6,439 1.060 0.302 - 1.362
Walkersville 6,058 1.060 0.150 - 1.210
Woodsboro 1,193 1.060 0.126 - 1.186
Garrett 29,679 $0.990 $0.990
Accident 319 0.990 0.320 - 1.310
Deer Park 385 0.990 0.300 - 1.290
Friendsville 480 0.990 0.320 - 1.310
Grantsville 769 0.990 0.200 - 1.190
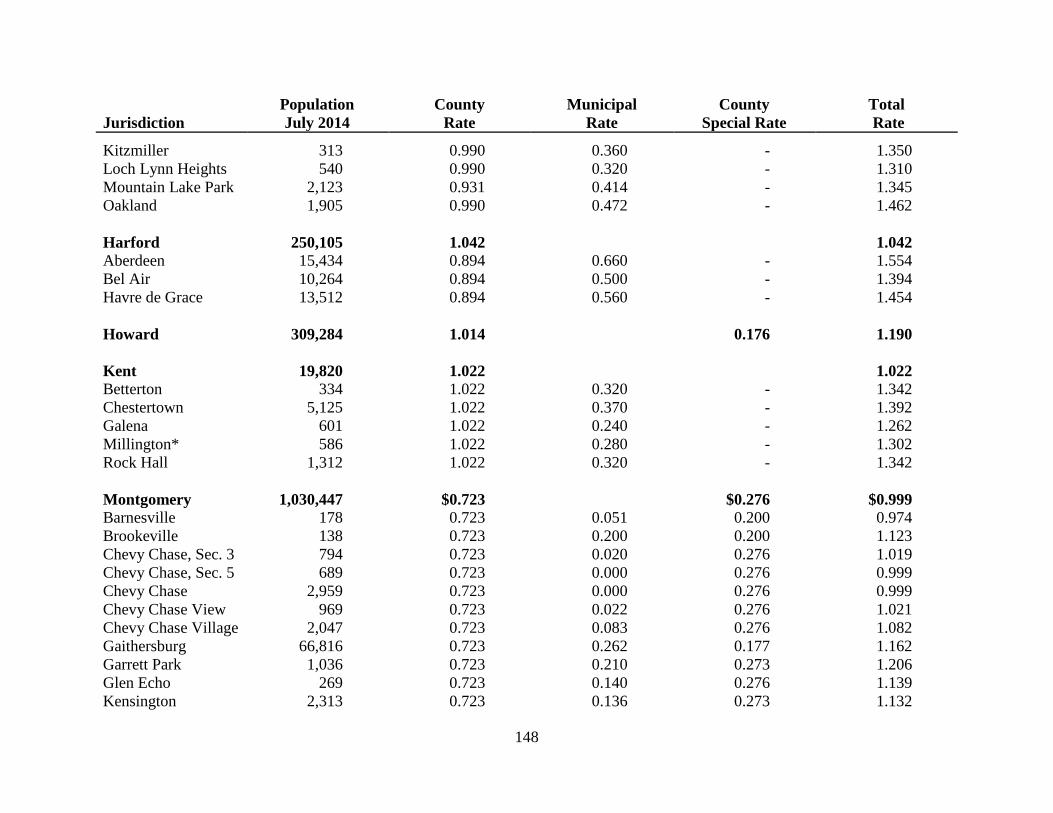
148
Population County Municipal County Total
Jurisdiction July 2014 Rate Rate Special Rate Rate
Kitzmiller 313 0.990 0.360 - 1.350
Loch Lynn Heights 540 0.990 0.320 - 1.310
Mountain Lake Park 2,123 0.931 0.414 - 1.345
Oakland 1,905 0.990 0.472 - 1.462
Harford 250,105 1.042 1.042
Aberdeen 15,434 0.894 0.660 - 1.554
Bel Air 10,264 0.894 0.500 - 1.394
Havre de Grace 13,512 0.894 0.560 - 1.454
Howard 309,284 1.014 0.176 1.190
Kent 19,820 1.022 1.022
Betterton 334 1.022 0.320 - 1.342
Chestertown 5,125 1.022 0.370 - 1.392
Galena 601 1.022 0.240 - 1.262
Millington* 586 1.022 0.280 - 1.302
Rock Hall 1,312 1.022 0.320 - 1.342
Montgomery 1,030,447 $0.723 $0.276 $0.999
Barnesville 178 0.723 0.051 0.200 0.974
Brookeville 138 0.723 0.200 0.200 1.123
Chevy Chase, Sec. 3 794 0.723 0.020 0.276 1.019
Chevy Chase, Sec. 5 689 0.723 0.000 0.276 0.999
Chevy Chase 2,959 0.723 0.000 0.276 0.999
Chevy Chase View 969 0.723 0.022 0.276 1.021
Chevy Chase Village 2,047 0.723 0.083 0.276 1.082
Gaithersburg 66,816 0.723 0.262 0.177 1.162
Garrett Park 1,036 0.723 0.210 0.273 1.206
Glen Echo 269 0.723 0.140 0.276 1.139
Kensington 2,313 0.723 0.136 0.273 1.132
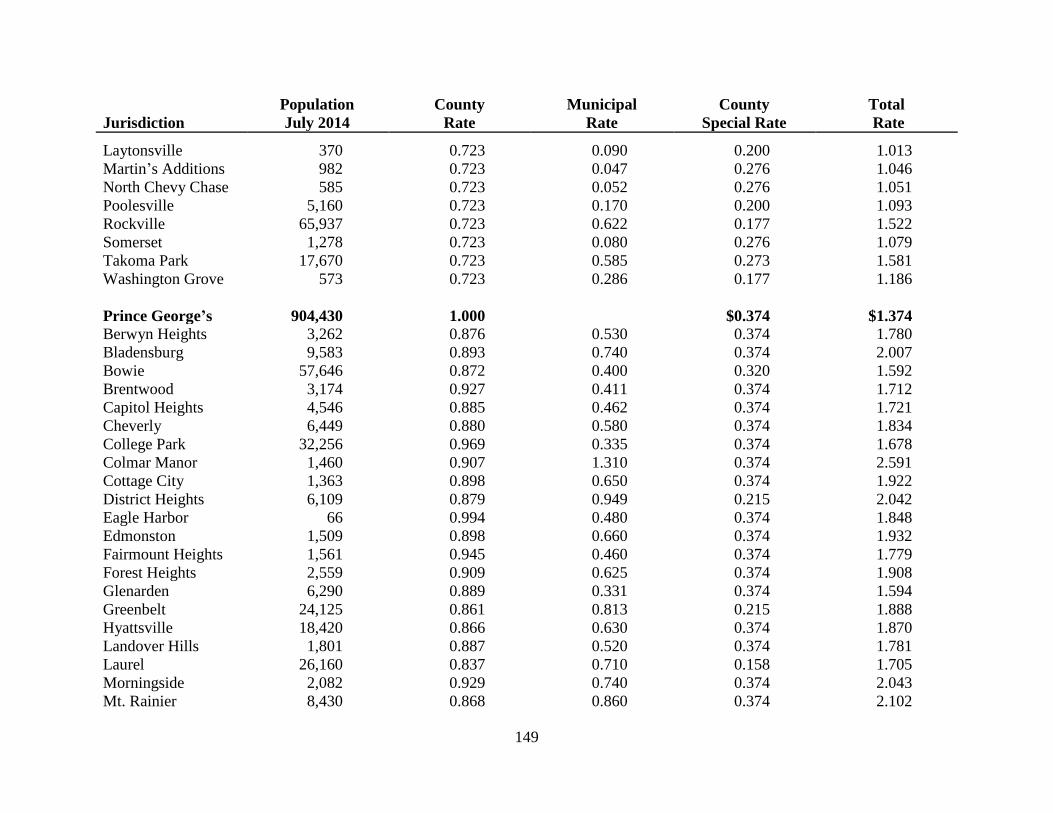
149
Population County Municipal County Total
Jurisdiction July 2014 Rate Rate Special Rate Rate
Laytonsville 370 0.723 0.090 0.200 1.013
Martin’s Additions 982 0.723 0.047 0.276 1.046
North Chevy Chase 585 0.723 0.052 0.276 1.051
Poolesville 5,160 0.723 0.170 0.200 1.093
Rockville 65,937 0.723 0.622 0.177 1.522
Somerset 1,278 0.723 0.080 0.276 1.079
Takoma Park 17,670 0.723 0.585 0.273 1.581
Washington Grove 573 0.723 0.286 0.177 1.186
Prince George’s 904,430 1.000 $0.374 $1.374
Berwyn Heights 3,262 0.876 0.530 0.374 1.780
Bladensburg 9,583 0.893 0.740 0.374 2.007
Bowie 57,646 0.872 0.400 0.320 1.592
Brentwood 3,174 0.927 0.411 0.374 1.712
Capitol Heights 4,546 0.885 0.462 0.374 1.721
Cheverly 6,449 0.880 0.580 0.374 1.834
College Park 32,256 0.969 0.335 0.374 1.678
Colmar Manor 1,460 0.907 1.310 0.374 2.591
Cottage City 1,363 0.898 0.650 0.374 1.922
District Heights 6,109 0.879 0.949 0.215 2.042
Eagle Harbor 66 0.994 0.480 0.374 1.848
Edmonston 1,509 0.898 0.660 0.374 1.932
Fairmount Heights 1,561 0.945 0.460 0.374 1.779
Forest Heights 2,559 0.909 0.625 0.374 1.908
Glenarden 6,290 0.889 0.331 0.374 1.594
Greenbelt 24,125 0.861 0.813 0.215 1.888
Hyattsville 18,420 0.866 0.630 0.374 1.870
Landover Hills 1,801 0.887 0.520 0.374 1.781
Laurel 26,160 0.837 0.710 0.158 1.705
Morningside 2,082 0.929 0.740 0.374 2.043
Mt. Rainier 8,430 0.868 0.860 0.374 2.102
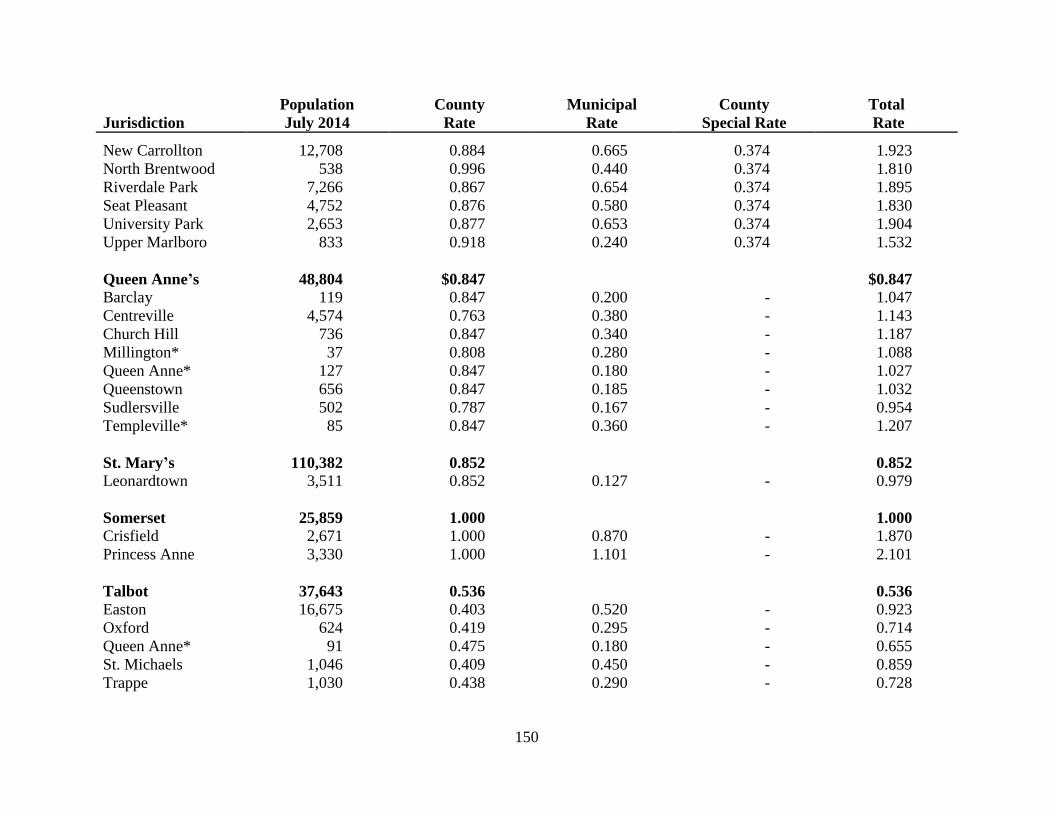
150
Population County Municipal County Total
Jurisdiction July 2014 Rate Rate Special Rate Rate
New Carrollton 12,708 0.884 0.665 0.374 1.923
North Brentwood 538 0.996 0.440 0.374 1.810
Riverdale Park 7,266 0.867 0.654 0.374 1.895
Seat Pleasant 4,752 0.876 0.580 0.374 1.830
University Park 2,653 0.877 0.653 0.374 1.904
Upper Marlboro 833 0.918 0.240 0.374 1.532
Queen Anne’s 48,804 $0.847 $0.847
Barclay 119 0.847 0.200 - 1.047
Centreville 4,574 0.763 0.380 - 1.143
Church Hill 736 0.847 0.340 - 1.187
Millington* 37 0.808 0.280 - 1.088
Queen Anne* 127 0.847 0.180 - 1.027
Queenstown 656 0.847 0.185 - 1.032
Sudlersville 502 0.787 0.167 - 0.954
Templeville* 85 0.847 0.360 - 1.207
St. Mary’s 110,382 0.852 0.852
Leonardtown 3,511 0.852 0.127 - 0.979
Somerset 25,859 1.000 1.000
Crisfield 2,671 1.000 0.870 - 1.870
Princess Anne 3,330 1.000 1.101 - 2.101
Talbot 37,643 0.536 0.536
Easton 16,675 0.403 0.520 - 0.923
Oxford 624 0.419 0.295 - 0.714
Queen Anne* 91 0.475 0.180 - 0.655
St. Michaels 1,046 0.409 0.450 - 0.859
Trappe 1,030 0.438 0.290 - 0.728
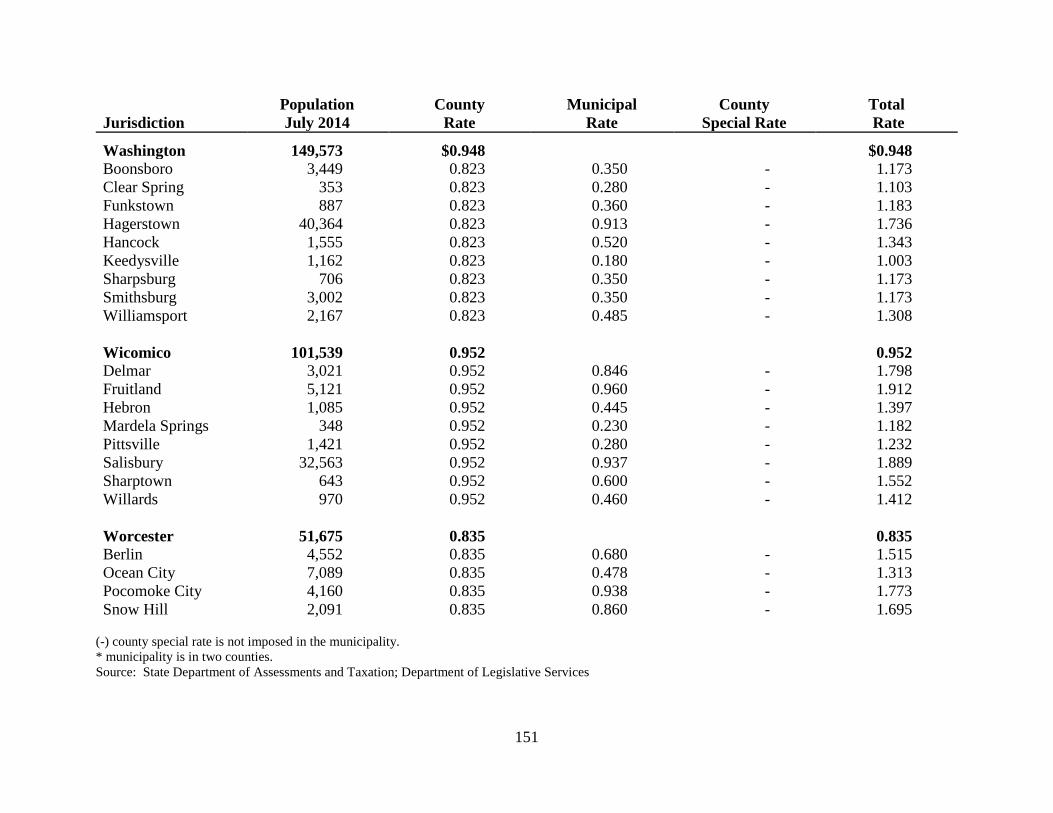
151
Population County Municipal County Total
Jurisdiction July 2014 Rate Rate Special Rate Rate
Washington 149,573 $0.948 $0.948
Boonsboro 3,449 0.823 0.350 - 1.173
Clear Spring 353 0.823 0.280 - 1.103
Funkstown 887 0.823 0.360 - 1.183
Hagerstown 40,364 0.823 0.913 - 1.736
Hancock 1,555 0.823 0.520 - 1.343
Keedysville 1,162 0.823 0.180 - 1.003
Sharpsburg 706 0.823 0.350 - 1.173
Smithsburg 3,002 0.823 0.350 - 1.173
Williamsport 2,167 0.823 0.485 - 1.308
Wicomico 101,539 0.952 0.952
Delmar 3,021 0.952 0.846 - 1.798
Fruitland 5,121 0.952 0.960 - 1.912
Hebron 1,085 0.952 0.445 - 1.397
Mardela Springs 348 0.952 0.230 - 1.182
Pittsville 1,421 0.952 0.280 - 1.232
Salisbury 32,563 0.952 0.937 - 1.889
Sharptown 643 0.952 0.600 - 1.552
Willards 970 0.952 0.460 - 1.412
Worcester 51,675 0.835 0.835
Berlin 4,552 0.835 0.680 - 1.515
Ocean City 7,089 0.835 0.478 - 1.313
Pocomoke City 4,160 0.835 0.938 - 1.773
Snow Hill 2,091 0.835 0.860 - 1.695
(-) county special rate is not imposed in the municipality.
* municipality is in two counties.
Source: State Department of Assessments and Taxation; Department of Legislative Services