Embed Size (px)
Citation preview
2 0 1 6 P L AT I N U M & PA L L A D I U M M A R K E T O U T L O O K
For more information on platinum and palladium and how specific gold, silver, palladium and platinum investments may be used to
protect yourself or profit from the events we foresee, please contact:
MONEX DEPOSIT COMPANY 4910 BIRCH STREET
NEWPORT BEACH, CA 92660(800) 949-4653(949) 752-1400
Copyright CPM Group LLC 2016. These reports are produced by CPM Group for distribution by Monex Deposit Company. The rights to distribution, reproduction, and redistribution rights are ceded to Monex Deposit Company by CPM Group for these reports. These reports are not for reproduction or retransmission without written consent of Monex Deposit Company. The intellectual content and property of these reports remain the property of CPM Group, and they are not for reproduction or retrans-mission without written consent of CPM Group. The views expressed within are solely those of CPM Group. Such infor-mation has not been verified, nor does CPM make any representation as to its accuracy or completeness. Any statements non-factual in nature constitute only current opinions, which are subject to change. While every effort has been made to ensure that the accuracy of the material contained in the reports is correct, CPM Group cannot be held liable for errors or omissions. CPM Group is not soliciting any action based on it. Information contained here should not be relied on as specific investment or market timing advice. At times the principals and associates of CPM Group may have long or short positions in some of the markets mentioned here.
Page 1 2016 PGM Market Outlook
Platinum Group Metals: A Slow Recovery The platinum and palladium markets presently offer an interesting counterpoint one to the other. Prices of both metals have fallen since the middle of 2014, but the dif-fering fundamental outlook of the two metals suggest their price trends may diverge sharply in the future. Plati-num faces some strong headwinds, from weaker fabrica-tion demand and persistently high South African mine supply. These trends suggest lower prices for platinum in the near term, until producers adjust output sharply lower to reflect the new reality of lower fabrication demand.
The very trends that suggest tough times for platinum suggest palladium may do well in the future. Platinum is losing fabrication demand markets to palladium, among other technological changes, strengthening demand for palladium. As South African platinum group metals min-ing declines in the future to accommodate lower demand for platinum, it will squeeze palladium supplies, even as demand for this metal rises.
Palladium has relatively healthier fundamentals than platinum, which was reflected in the price of the metal over the past decade. Palladium was the star performer in 2014, being the only precious metal to have risen during that year. The ongoing weakness in the entire precious metals complex caught up with palladium last year, pull-ing this metal’s price down 42% over the course of 2015.
Being primarily industrial commodities, platinum and palladium prices will continue to reflect fabrication de-mand from auto makers and other industrial users of these metals. Mine production and scrap recovery also will be important factors, with the former already having fallen for most of the past decade in South Africa, the
major producer. Investment demand and inventory pur-chases and sales by producers and users of these metals also will continue to play important roles in determining prices, as they have in the past few years.
Platinum
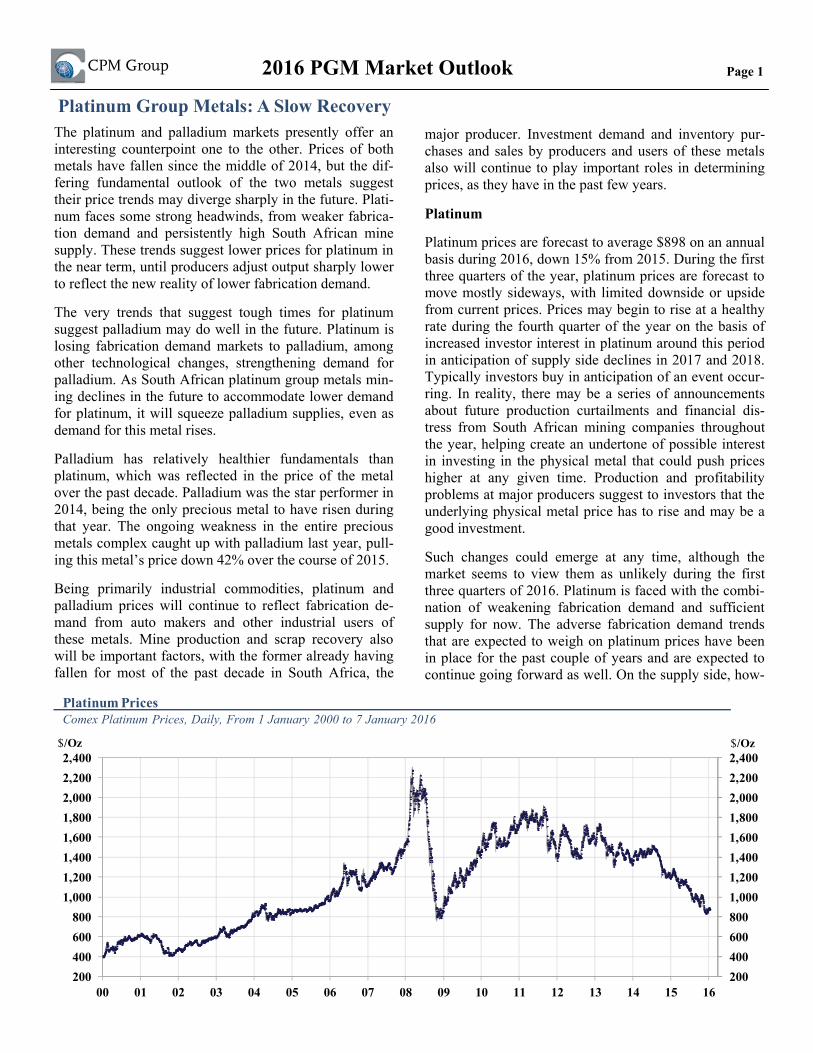
Platinum prices are forecast to average $898 on an annual basis during 2016, down 15% from 2015. During the first three quarters of the year, platinum prices are forecast to move mostly sideways, with limited downside or upside from current prices. Prices may begin to rise at a healthy rate during the fourth quarter of the year on the basis of increased investor interest in platinum around this period in anticipation of supply side declines in 2017 and 2018. Typically investors buy in anticipation of an event occur-ring. In reality, there may be a series of announcements about future production curtailments and financial dis-tress from South African mining companies throughout the year, helping create an undertone of possible interest in investing in the physical metal that could push prices higher at any given time. Production and profitability problems at major producers suggest to investors that the underlying physical metal price has to rise and may be a good investment.
Such changes could emerge at any time, although the market seems to view them as unlikely during the first three quarters of 2016. Platinum is faced with the combi-nation of weakening fabrication demand and sufficient supply for now. The adverse fabrication demand trends that are expected to weigh on platinum prices have been in place for the past couple of years and are expected to continue going forward as well. On the supply side, how-
2004006008001,0001,2001,4001,6001,8002,0002,2002,400
200400600800
1,0001,2001,4001,6001,8002,0002,2002,400
00 01 02 03 04 05 06 07 08 09 10 11 12 13 14 15 16
$/Oz
Platinum PricesComex Platinum Prices, Daily, From 1 January 2000 to 7 January 2016
$/Oz
Page 2 2016 PGM Market Outlook
ever, the market has overlooked the on-going reductions in South African and world total mine production since 2006. Mine production in 2015 was off -18% from 2006 levels. South African producers, facing enormous finan-cial and operational pressures, are projecting increased output for 2016. These production increases may not oc-cur however. Longer term South African production is expected to decline sharply, tightening supplies relative to demand to the point where prices recover to levels at which mining platinum is profitable once again.
In the short term South African producers have not cut-back in mine production since the 2014 South African strike. That will change. Meanwhile, secondary recovery of platinum, primarily from used automotive catalytic converters, has been dropping, although the market has overlooked this trend.
Platinum fabrication demand, especially from the auto sector, has been declining as European and Indian de-mand for diesel passenger vehicles declines, selective reduction catalyst technology (which uses only a fraction of the platinum used by conventional catalysts) gains popularity on commercial vehicles and high-end passen-ger cars, and a shift away from platinum toward palla-dium in conventional diesel catalysts continues.
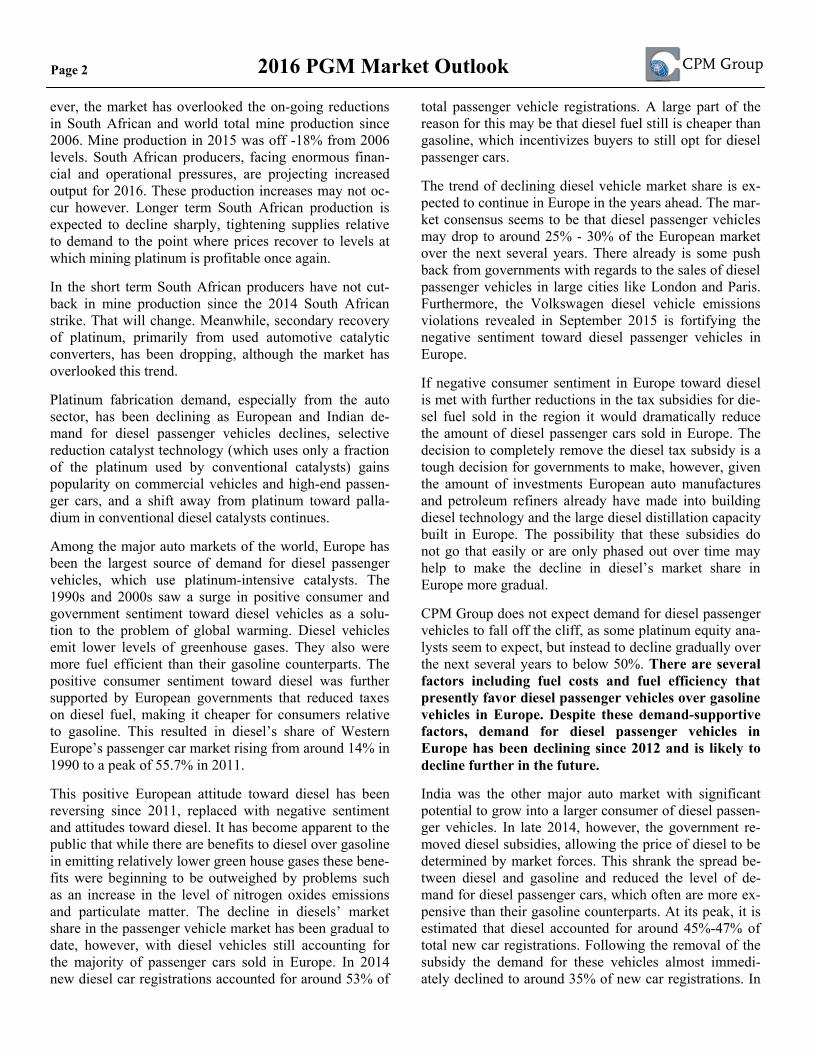
Among the major auto markets of the world, Europe has been the largest source of demand for diesel passenger vehicles, which use platinum-intensive catalysts. The 1990s and 2000s saw a surge in positive consumer and government sentiment toward diesel vehicles as a solu-tion to the problem of global warming. Diesel vehicles emit lower levels of greenhouse gases. They also were more fuel efficient than their gasoline counterparts. The positive consumer sentiment toward diesel was further supported by European governments that reduced taxes on diesel fuel, making it cheaper for consumers relative to gasoline. This resulted in diesel’s share of Western Europe’s passenger car market rising from around 14% in 1990 to a peak of 55.7% in 2011.
This positive European attitude toward diesel has been reversing since 2011, replaced with negative sentiment and attitudes toward diesel. It has become apparent to the public that while there are benefits to diesel over gasoline in emitting relatively lower green house gases these bene-fits were beginning to be outweighed by problems such as an increase in the level of nitrogen oxides emissions and particulate matter. The decline in diesels’ market share in the passenger vehicle market has been gradual to date, however, with diesel vehicles still accounting for the majority of passenger cars sold in Europe. In 2014 new diesel car registrations accounted for around 53% of
total passenger vehicle registrations. A large part of the reason for this may be that diesel fuel still is cheaper than gasoline, which incentivizes buyers to still opt for diesel passenger cars.
The trend of declining diesel vehicle market share is ex-pected to continue in Europe in the years ahead. The mar-ket consensus seems to be that diesel passenger vehicles may drop to around 25% - 30% of the European market over the next several years. There already is some push back from governments with regards to the sales of diesel passenger vehicles in large cities like London and Paris. Furthermore, the Volkswagen diesel vehicle emissions violations revealed in September 2015 is fortifying the negative sentiment toward diesel passenger vehicles in Europe.
If negative consumer sentiment in Europe toward diesel is met with further reductions in the tax subsidies for die-sel fuel sold in the region it would dramatically reduce the amount of diesel passenger cars sold in Europe. The decision to completely remove the diesel tax subsidy is a tough decision for governments to make, however, given the amount of investments European auto manufactures and petroleum refiners already have made into building diesel technology and the large diesel distillation capacity built in Europe. The possibility that these subsidies do not go that easily or are only phased out over time may help to make the decline in diesel’s market share in Europe more gradual.
CPM Group does not expect demand for diesel passenger vehicles to fall off the cliff, as some platinum equity ana-lysts seem to expect, but instead to decline gradually over the next several years to below 50%. There are several factors including fuel costs and fuel efficiency that presently favor diesel passenger vehicles over gasoline vehicles in Europe. Despite these demand-supportive factors, demand for diesel passenger vehicles in Europe has been declining since 2012 and is likely to decline further in the future.
India was the other major auto market with significant potential to grow into a larger consumer of diesel passen-ger vehicles. In late 2014, however, the government re-moved diesel subsidies, allowing the price of diesel to be determined by market forces. This shrank the spread be-tween diesel and gasoline and reduced the level of de-mand for diesel passenger cars, which often are more ex-pensive than their gasoline counterparts. At its peak, it is estimated that diesel accounted for around 45%-47% of total new car registrations. Following the removal of the subsidy the demand for these vehicles almost immedi-ately declined to around 35% of new car registrations. In
Page 3 2016 PGM Market Outlook
the future there could be periods when the spreads be-tween gasoline and diesel widen, in favor of diesel. There is no guarantee that such an increase in spreads will drive demand for diesel vehicles higher, however, as the con-sumer may remain wary of a shrinking in the spread now that the fuel price is driven by market forces.
Other major passenger vehicle markets are primarily gasoline engine markets, using more palladium than platinum. The two largest vehicle markets in the world, China and the United States, have very small diesel vehi-cle penetration, around five percent in the United States and around one percent in China, in the passenger seg-ment. China’s government has long discouraged the use of diesel passenger cars. This is in part due to deteriorat-ing air quality and in part to secure adequate diesel fuel at reasonable prices to commercial vehicles. In the United States diesel fuel is more expensive that gasoline, making it a less attractive alternative to a gasoline powered car. Furthermore, diesel has never been fully able to shake off its image, in the United States at least, of being a heavy producer of soot.
Commercial vehicles traditionally have played an impor-tant role in demand for platinum. Since around 2007 the majority of growth in platinum use in auto catalysts was for use in large diesel commercial trucks, lorries, and buses. This is primarily because these vehicles are almost always powered by diesel and their larger engine sizes usually require a larger catalyst resulting in more PGMs being loaded per catalyst.
Platinum demand from this sector has been hurt to some extent in recent years because of softness in demand for such vehicles from the large commercial vehicle markets.
Such ups and downs are typical of every market and should not be given much consideration when looking at the longer term demand fundamentals of the platinum market.
What is more concerning with regards to demand from the large commercial vehicle sector is the growing popu-larity of Selective Catalytic Reduction (SCR) systems that are being fitted on large commercial vehicles. These catalysts, using urea, have been used in stationery site catalysts since the 1980s. Meeting tightening emissions standards in developed countries is becoming increas-ingly difficult with traditional catalysts. The SCR catalyst system is more efficient at reducing toxins. It is a more expensive catalyst system, however, which has made it more popular in large commercial vehicles such as trucks and buses and high end cars. The SCR catalyst itself does not contain any PGMs, with PGMs used only in the downstream catalysts to ensure that emissions remain low even when exhaust temperatures drop. The impact of SCR catalysts is an overall reduction in the use of PGMs per vehicle.
The decline in demand for platinum from the auto sector is expected to keep a lid on prices for a while. The same weakness in prices is expected to benefit its demand from some alternate uses, however. The decline in platinum prices, which are now trading at one of their smallest pre-miums to the price of palladium and are trading at a dis-count to gold, is likely to benefit platinum fabrication demand for jewelry going forward.
An immediate benefit would be an increase in demand for platinum jewelry. Jewelry demand is typically very sensitive to the price of metals. The recent weakness in platinum prices has put the metal at a discount to gold, which is usually less expensive than platinum. The weak-ness in platinum prices, relative to gold, may help offset some of the higher fabrication costs typical of platinum jewelry. The cost of platinum jewelry fabrication is usu-ally higher because platinum is hard metal to work with, it is more expensive to hold in inventories, hedging plati-num inventories is more costly and difficult than hedging gold or silver inventories, the smaller market for platinum jewelry results in fewer benefits of scale, and finally most platinum jewelry is 95% platinum. In addition to some of these higher fabrication costs being offset by the weak-ness in platinum prices, the present discount in platinum prices may make platinum seem like a bargain, as plati-num typically trades at a premium to gold, diverting some buyers of gold jewelry toward platinum.
In the medium to longer term the sharp decline in plati-num prices and the reduced premium of the metal to pal-0%
10%
20%
30%
40%
50%
60%
1990 1993 1996 1999 2002 2005 2008 2011 2014
Western Europe
India
United States
Japan
China
Diesel's Market Share of Major Passenger Car MarketsAnnual, through 2015
Page 4 2016 PGM Market Outlook
ladium are likely to reduce the efforts made by catalysts manufacturers to substitute platinum with palladium. If the price of platinum were to fall below the price of palla-dium, however, there could be some substitution away from palladium toward platinum. Platinum is now substi-tuted one for one with palladium, and therefore if the price of platinum declines below that of palladium in a sustained fashion it could encourage substitution of palla-dium with platinum.
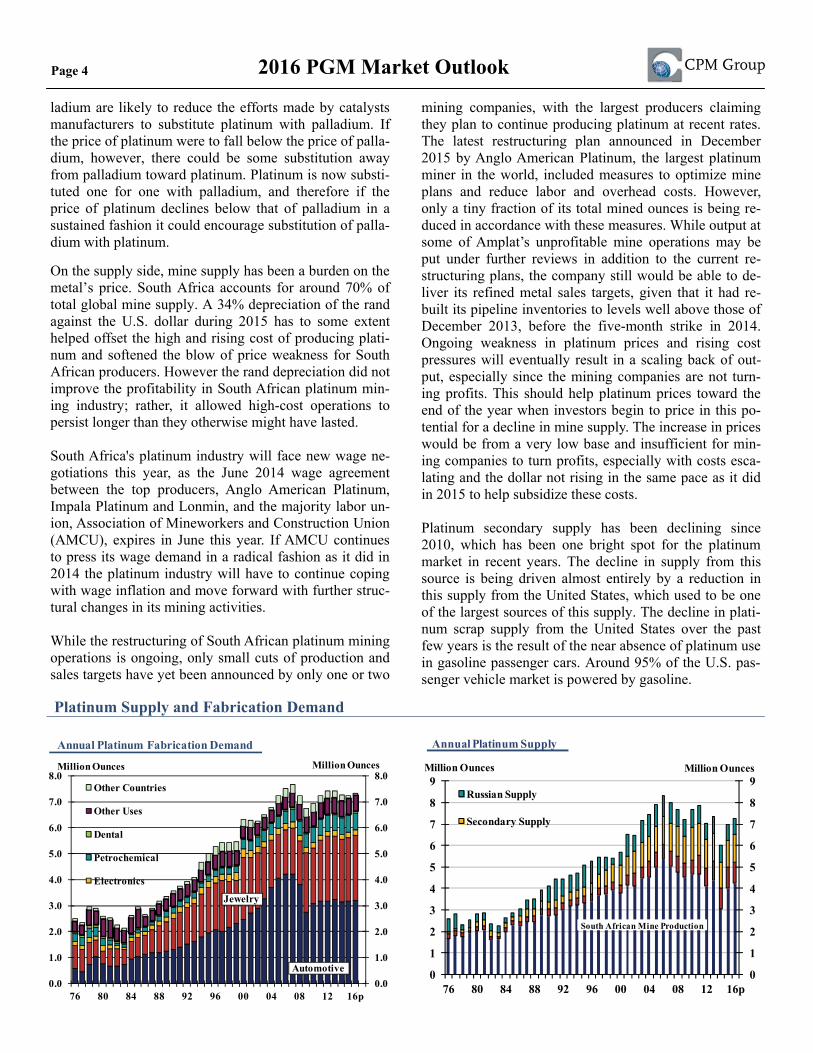
On the supply side, mine supply has been a burden on the metal’s price. South Africa accounts for around 70% of total global mine supply. A 34% depreciation of the rand against the U.S. dollar during 2015 has to some extent helped offset the high and rising cost of producing plati-num and softened the blow of price weakness for South African producers. However the rand depreciation did not improve the profitability in South African platinum min-ing industry; rather, it allowed high-cost operations to persist longer than they otherwise might have lasted.
South Africa's platinum industry will face new wage ne-gotiations this year, as the June 2014 wage agreement between the top producers, Anglo American Platinum, Impala Platinum and Lonmin, and the majority labor un-ion, Association of Mineworkers and Construction Union (AMCU), expires in June this year. If AMCU continues to press its wage demand in a radical fashion as it did in 2014 the platinum industry will have to continue coping with wage inflation and move forward with further struc-tural changes in its mining activities.
While the restructuring of South African platinum mining operations is ongoing, only small cuts of production and sales targets have yet been announced by only one or two
mining companies, with the largest producers claiming they plan to continue producing platinum at recent rates. The latest restructuring plan announced in December 2015 by Anglo American Platinum, the largest platinum miner in the world, included measures to optimize mine plans and reduce labor and overhead costs. However, only a tiny fraction of its total mined ounces is being re-duced in accordance with these measures. While output at some of Amplat’s unprofitable mine operations may be put under further reviews in addition to the current re-structuring plans, the company still would be able to de-liver its refined metal sales targets, given that it had re-built its pipeline inventories to levels well above those of December 2013, before the five-month strike in 2014. Ongoing weakness in platinum prices and rising cost pressures will eventually result in a scaling back of out-put, especially since the mining companies are not turn-ing profits. This should help platinum prices toward the end of the year when investors begin to price in this po-tential for a decline in mine supply. The increase in prices would be from a very low base and insufficient for min-ing companies to turn profits, especially with costs esca-lating and the dollar not rising in the same pace as it did in 2015 to help subsidize these costs.
Platinum secondary supply has been declining since 2010, which has been one bright spot for the platinum market in recent years. The decline in supply from this source is being driven almost entirely by a reduction in this supply from the United States, which used to be one of the largest sources of this supply. The decline in plati-num scrap supply from the United States over the past few years is the result of the near absence of platinum use in gasoline passenger cars. Around 95% of the U.S. pas-senger vehicle market is powered by gasoline.
0
1
2
3
4
5
6
7
8
9
0
1
2
3
4
5
6
7
8
9
76 80 84 88 92 96 00 04 08 12 16p
Russian Supply
Secondary Supply
South African Mine Production
Million Ounces Million Ounces
Annual Platinum Supply
Platinum Supply and Fabrication Demand
0.0
1.0
2.0
3.0
4.0
5.0
6.0
7.0
8.0
0.0
1.0
2.0
3.0
4.0
5.0
6.0
7.0
8.0
76 80 84 88 92 96 00 04 08 12 16p
Other Countries
Other Uses
Dental
Petrochemical
Electronics
Million Ounces
Jewelry
Automotive
Million Ounces
Annual Platinum Fabrication Demand
Page 5 2016 PGM Market Outlook
Palladium
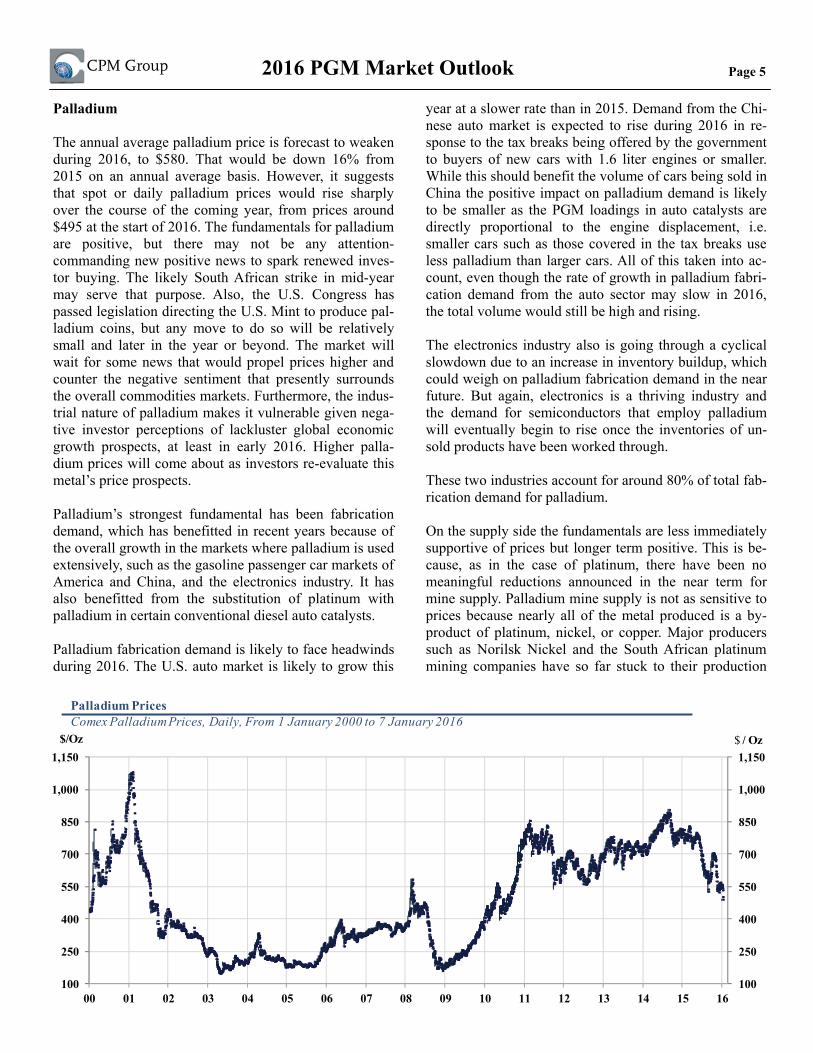
The annual average palladium price is forecast to weaken during 2016, to $580. That would be down 16% from 2015 on an annual average basis. However, it suggests that spot or daily palladium prices would rise sharply over the course of the coming year, from prices around $495 at the start of 2016. The fundamentals for palladium are positive, but there may not be any attention-commanding new positive news to spark renewed inves-tor buying. The likely South African strike in mid-year may serve that purpose. Also, the U.S. Congress has passed legislation directing the U.S. Mint to produce pal-ladium coins, but any move to do so will be relatively small and later in the year or beyond. The market will wait for some news that would propel prices higher and counter the negative sentiment that presently surrounds the overall commodities markets. Furthermore, the indus-trial nature of palladium makes it vulnerable given nega-tive investor perceptions of lackluster global economic growth prospects, at least in early 2016. Higher palla-dium prices will come about as investors re-evaluate this metal’s price prospects.
Palladium’s strongest fundamental has been fabrication demand, which has benefitted in recent years because of the overall growth in the markets where palladium is used extensively, such as the gasoline passenger car markets of America and China, and the electronics industry. It has also benefitted from the substitution of platinum with palladium in certain conventional diesel auto catalysts.
Palladium fabrication demand is likely to face headwinds during 2016. The U.S. auto market is likely to grow this
year at a slower rate than in 2015. Demand from the Chi-nese auto market is expected to rise during 2016 in re-sponse to the tax breaks being offered by the government to buyers of new cars with 1.6 liter engines or smaller. While this should benefit the volume of cars being sold in China the positive impact on palladium demand is likely to be smaller as the PGM loadings in auto catalysts are directly proportional to the engine displacement, i.e. smaller cars such as those covered in the tax breaks use less palladium than larger cars. All of this taken into ac-count, even though the rate of growth in palladium fabri-cation demand from the auto sector may slow in 2016, the total volume would still be high and rising.
The electronics industry also is going through a cyclical slowdown due to an increase in inventory buildup, which could weigh on palladium fabrication demand in the near future. But again, electronics is a thriving industry and the demand for semiconductors that employ palladium will eventually begin to rise once the inventories of un-sold products have been worked through.
These two industries account for around 80% of total fab-rication demand for palladium.
On the supply side the fundamentals are less immediately supportive of prices but longer term positive. This is be-cause, as in the case of platinum, there have been no meaningful reductions announced in the near term for mine supply. Palladium mine supply is not as sensitive to prices because nearly all of the metal produced is a by-product of platinum, nickel, or copper. Major producers such as Norilsk Nickel and the South African platinum mining companies have so far stuck to their production
100
250
400
550
700
850
1,000
1,150
100
250
400
550
700
850
1,000
1,150
00 01 02 03 04 05 06 07 08 09 10 11 12 13 14 15 16
$ / Oz$/Oz
Palladium PricesComex Palladium Prices, Daily, From 1 January 2000 to 7 January 2016
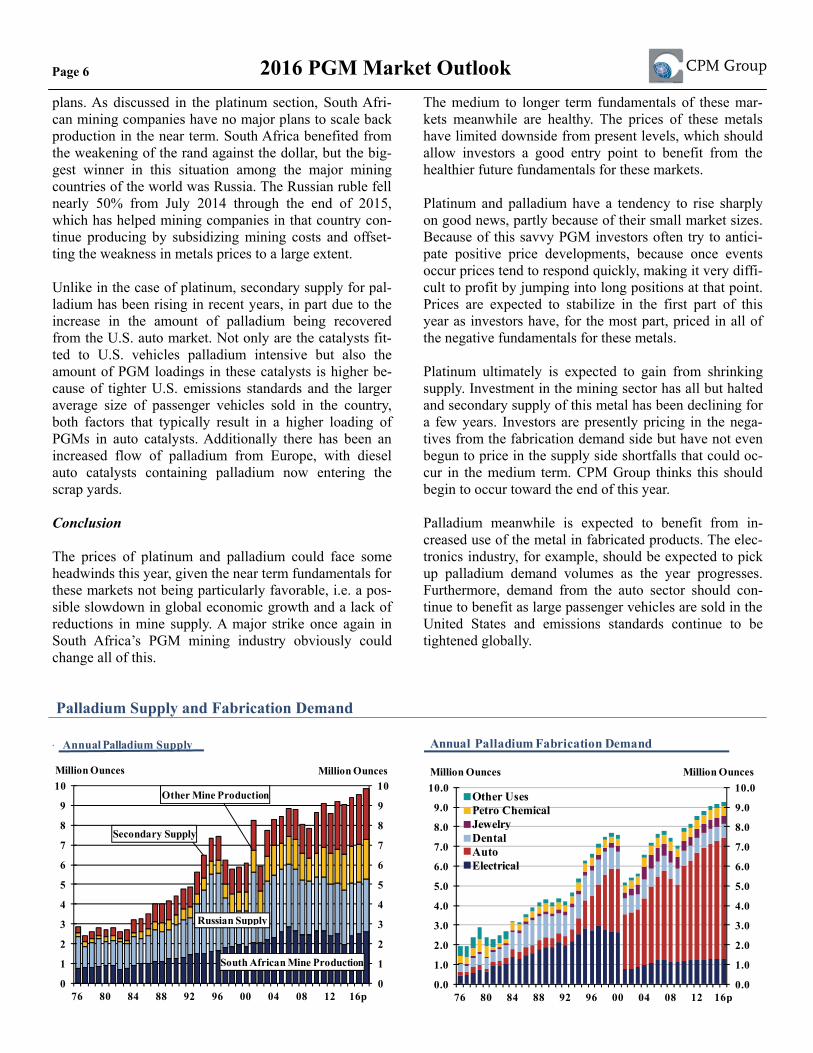
Page 6 2016 PGM Market Outlook plans. As discussed in the platinum section, South Afri-can mining companies have no major plans to scale back production in the near term. South Africa benefited from the weakening of the rand against the dollar, but the big-gest winner in this situation among the major mining countries of the world was Russia. The Russian ruble fell nearly 50% from July 2014 through the end of 2015, which has helped mining companies in that country con-tinue producing by subsidizing mining costs and offset-ting the weakness in metals prices to a large extent.
Unlike in the case of platinum, secondary supply for pal-ladium has been rising in recent years, in part due to the increase in the amount of palladium being recovered from the U.S. auto market. Not only are the catalysts fit-ted to U.S. vehicles palladium intensive but also the amount of PGM loadings in these catalysts is higher be-cause of tighter U.S. emissions standards and the larger average size of passenger vehicles sold in the country, both factors that typically result in a higher loading of PGMs in auto catalysts. Additionally there has been an increased flow of palladium from Europe, with diesel auto catalysts containing palladium now entering the scrap yards.
Conclusion
The prices of platinum and palladium could face some headwinds this year, given the near term fundamentals for these markets not being particularly favorable, i.e. a pos-sible slowdown in global economic growth and a lack of reductions in mine supply. A major strike once again in South Africa’s PGM mining industry obviously could change all of this.
The medium to longer term fundamentals of these mar-kets meanwhile are healthy. The prices of these metals have limited downside from present levels, which should allow investors a good entry point to benefit from the healthier future fundamentals for these markets.
Platinum and palladium have a tendency to rise sharply on good news, partly because of their small market sizes. Because of this savvy PGM investors often try to antici-pate positive price developments, because once events occur prices tend to respond quickly, making it very diffi-cult to profit by jumping into long positions at that point. Prices are expected to stabilize in the first part of this year as investors have, for the most part, priced in all of the negative fundamentals for these metals.
Platinum ultimately is expected to gain from shrinking supply. Investment in the mining sector has all but halted and secondary supply of this metal has been declining for a few years. Investors are presently pricing in the nega-tives from the fabrication demand side but have not even begun to price in the supply side shortfalls that could oc-cur in the medium term. CPM Group thinks this should begin to occur toward the end of this year.
Palladium meanwhile is expected to benefit from in-creased use of the metal in fabricated products. The elec-tronics industry, for example, should be expected to pick up palladium demand volumes as the year progresses. Furthermore, demand from the auto sector should con-tinue to benefit as large passenger vehicles are sold in the United States and emissions standards continue to be tightened globally.
Palladium Supply and Fabrication Demand
0
1
2
3
4
5
6
7
8
9
10
0
1
2
3
4
5
6
7
8
9
10
76 80 84 88 92 96 00 04 08 12 16p
South African Mine Production
Russian Supply
Other Mine Production
Million Ounces Million Ounces
Secondary Supply
Annual Palladium Supply
0.0
1.0
2.0
3.0
4.0
5.0
6.0
7.0
8.0
9.0
10.0
0.0
1.0
2.0
3.0
4.0
5.0
6.0
7.0
8.0
9.0
10.0
76 80 84 88 92 96 00 04 08 12 16p
Other UsesPetro ChemicalJewelryDentalAutoElectrical
Million Ounces
Annual Palladium Fabrication Demand
Million Ounces
Page 7 2016 PGM Market Outlook
Thousand Ounces
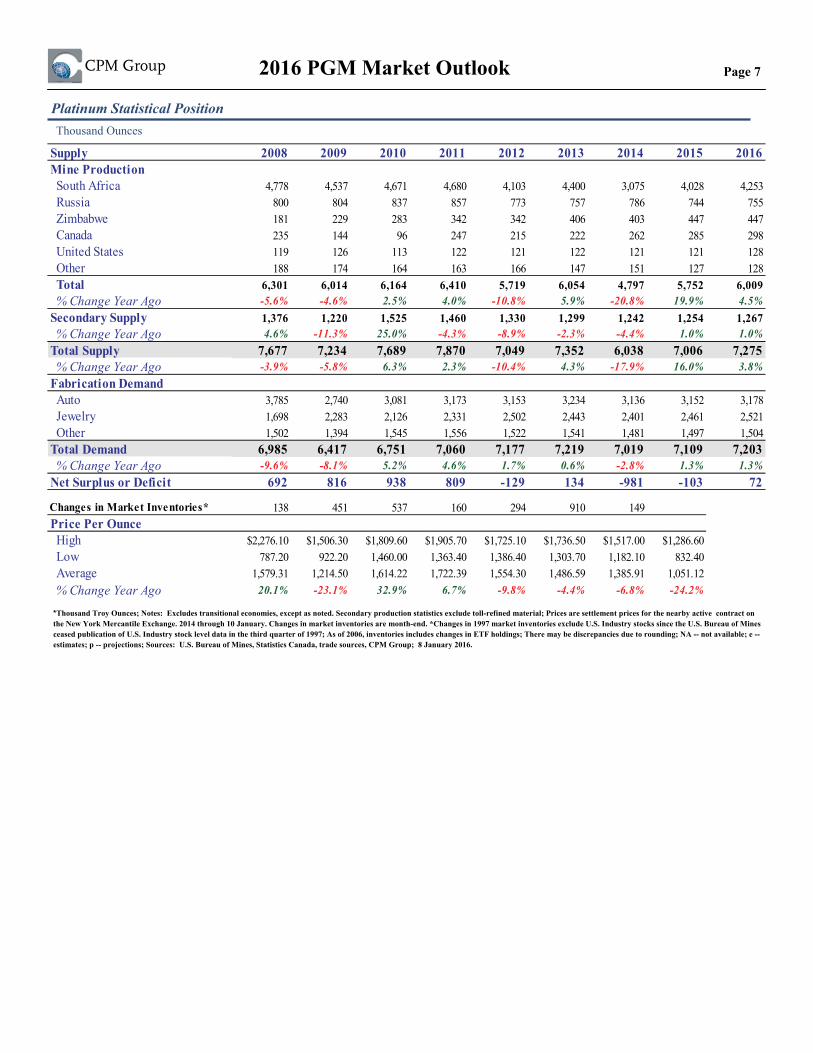
Platinum Statistical Position
*Thousand Troy Ounces; Notes: Excludes transitional economies, except as noted. Secondary production statistics exclude toll-refined material; Prices are settlement prices for the nearby active contract on the New York Mercantile Exchange. 2014 through 10 January. Changes in market inventories are month-end. *Changes in 1997 market inventories exclude U.S. Industry stocks since the U.S. Bureau of Mines ceased publication of U.S. Industry stock level data in the third quarter of 1997; As of 2006, inventories includes changes in ETF holdings; There may be discrepancies due to rounding; NA -- not available; e -- estimates; p -- projections; Sources: U.S. Bureau of Mines, Statistics Canada, trade sources, CPM Group; 8 January 2016.
Supply 2008 2009 2010 2011 2012 2013 2014 2015 2016Mine Production South Africa 4,778 4,537 4,671 4,680 4,103 4,400 3,075 4,028 4,253 Russia 800 804 837 857 773 757 786 744 755 Zimbabwe 181 229 283 342 342 406 403 447 447 Canada 235 144 96 247 215 222 262 285 298 United States 119 126 113 122 121 122 121 121 128 Other 188 174 164 163 166 147 151 127 128 Total 6,301 6,014 6,164 6,410 5,719 6,054 4,797 5,752 6,009 % Change Year Ago -5.6% -4.6% 2.5% 4.0% -10.8% 5.9% -20.8% 19.9% 4.5%Secondary Supply 1,376 1,220 1,525 1,460 1,330 1,299 1,242 1,254 1,267 % Change Year Ago 4.6% -11.3% 25.0% -4.3% -8.9% -2.3% -4.4% 1.0% 1.0%Total Supply 7,677 7,234 7,689 7,870 7,049 7,352 6,038 7,006 7,275 % Change Year Ago -3.9% -5.8% 6.3% 2.3% -10.4% 4.3% -17.9% 16.0% 3.8%Fabrication Demand Auto 3,785 2,740 3,081 3,173 3,153 3,234 3,136 3,152 3,178 Jewelry 1,698 2,283 2,126 2,331 2,502 2,443 2,401 2,461 2,521 Other 1,502 1,394 1,545 1,556 1,522 1,541 1,481 1,497 1,504Total Demand 6,985 6,417 6,751 7,060 7,177 7,219 7,019 7,109 7,203 % Change Year Ago -9.6% -8.1% 5.2% 4.6% 1.7% 0.6% -2.8% 1.3% 1.3%Net Surplus or Deficit 692 816 938 809 -129 134 -981 -103 72
Changes in Market Inventories* 138 451 537 160 294 910 149Price Per Ounce High $2,276.10 $1,506.30 $1,809.60 $1,905.70 $1,725.10 $1,736.50 $1,517.00 $1,286.60 Low 787.20 922.20 1,460.00 1,363.40 1,386.40 1,303.70 1,182.10 832.40 Average 1,579.31 1,214.50 1,614.22 1,722.39 1,554.30 1,486.59 1,385.91 1,051.12 % Change Year Ago 20.1% -23.1% 32.9% 6.7% -9.8% -4.4% -6.8% -24.2%
Page 8 2016 PGM Market Outlook
Thousand Ounces
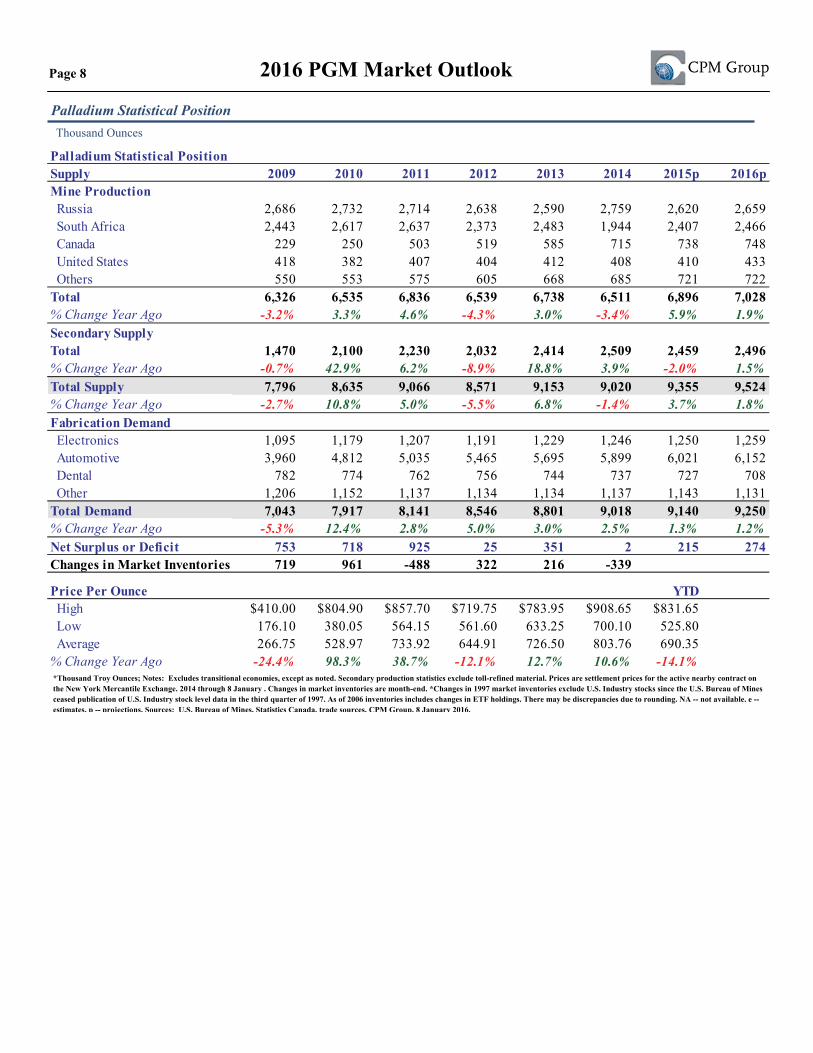
Palladium Statistical Position
*Thousand Troy Ounces; Notes: Excludes transitional economies, except as noted. Secondary production statistics exclude toll-refined material. Prices are settlement prices for the active nearby contract onthe New York Mercantile Exchange. 2014 through 8 January . Changes in market inventories are month-end. *Changes in 1997 market inventories exclude U.S. Industry stocks since the U.S. Bureau of Mines ceased publication of U.S. Industry stock level data in the third quarter of 1997. As of 2006 inventories includes changes in ETF holdings. There may be discrepancies due to rounding. NA -- not available. e -- estimates. p -- projections. Sources: U.S. Bureau of Mines, Statistics Canada, trade sources, CPM Group, 8 January 2016.
Palladium Statistical PositionSupply 2009 2010 2011 2012 2013 2014 2015p 2016pMine Production Russia 2,686 2,732 2,714 2,638 2,590 2,759 2,620 2,659 South Africa 2,443 2,617 2,637 2,373 2,483 1,944 2,407 2,466 Canada 229 250 503 519 585 715 738 748 United States 418 382 407 404 412 408 410 433 Others 550 553 575 605 668 685 721 722Total 6,326 6,535 6,836 6,539 6,738 6,511 6,896 7,028% Change Year Ago -3.2% 3.3% 4.6% -4.3% 3.0% -3.4% 5.9% 1.9%Secondary SupplyTotal 1,470 2,100 2,230 2,032 2,414 2,509 2,459 2,496% Change Year Ago -0.7% 42.9% 6.2% -8.9% 18.8% 3.9% -2.0% 1.5%Total Supply 7,796 8,635 9,066 8,571 9,153 9,020 9,355 9,524% Change Year Ago -2.7% 10.8% 5.0% -5.5% 6.8% -1.4% 3.7% 1.8%Fabrication Demand Electronics 1,095 1,179 1,207 1,191 1,229 1,246 1,250 1,259 Automotive 3,960 4,812 5,035 5,465 5,695 5,899 6,021 6,152 Dental 782 774 762 756 744 737 727 708 Other 1,206 1,152 1,137 1,134 1,134 1,137 1,143 1,131Total Demand 7,043 7,917 8,141 8,546 8,801 9,018 9,140 9,250% Change Year Ago -5.3% 12.4% 2.8% 5.0% 3.0% 2.5% 1.3% 1.2%Net Surplus or Deficit 753 718 925 25 351 2 215 274Changes in Market Inventories* 719 961 -488 322 216 -339
Price Per Ounce YTD High $410.00 $804.90 $857.70 $719.75 $783.95 $908.65 $831.65 Low 176.10 380.05 564.15 561.60 633.25 700.10 525.80 Average 266.75 528.97 733.92 644.91 726.50 803.76 690.35% Change Year Ago -24.4% 98.3% 38.7% -12.1% 12.7% 10.6% -14.1%
CPM Group LLC
CPM Group is a fundamentally based commodities research shop. We develop our own proprietary estimates of gold, silver, platinum, and palladium supply and demand on a global basis, drawing on every resource we can find, including our own extensive list of contacts involved in precious metals around the world. We have been doing this sort of research and analysis since the 1970s, far longer than anyone else in the business. We also undertake research in specialty metals, base metals, energy and agricultural commodities. We are known for our basic fundamental research, a wide range of financially oriented consulting services, and our expertise in using financial derivatives to structure financing for produc-ers, refiners, industrial users, and investors interested in either hedging or investing in commodities.
Our investment philosophy is simple: We are value investors who base our decisions on what to buy, sell, hold, or avoid on the fundamentals of each asset, and the macro-economic, financial and political environmental factors that we expect will affect that asset’s value. We have concerns, expressed in this report and elsewhere, about long-term imbalances in government deficit spending, public and private debt, and a wide range of other economic and political factors. We don’t expect the world’s financial system to collapse, however. That is not the way the world tends to work. More likely eco-nomic outcomes in the real world lie between the extremes of cataclysmic collapses and nirvana. We advise our clients – and practice what we preach – to have some of their wealth in gold and silver as an insurance policy against a catastrophic failure, but we also advise them to invest other portions of their money in precious metals and other assets based on the assumption that that sort of failure does not occur. We focus on investing based on likely scenarios, but with an eye always open to outlying events that take the world’s markets by surprise. We have watched investors who were so worried about a collapse that they missed some of the largest stock and bond market rallies of all times over the past 30 years, while watching their safe haven assets fluctuate eight-fold in value up and down, and then up and down again. We prefer our clients to buy and sell precious metals and other assets based on cyclical and other developments, while also maintaining that long-term insurance policy in case the levee breaks.
CPM Group LLC30 Broad St.37th FloorNew York, NY 10004 USA
For more information on platinum and palladium and how specific gold, silver, palladium and platinum investments may be used to
protect yourself or profit from the events we foresee, please contact:
MONEX DEPOSIT COMPANY 4910 BIRCH STREET
NEWPORT BEACH, CA 92660(800) 949-4653(949) 752-1400