Embed Size (px)
Citation preview
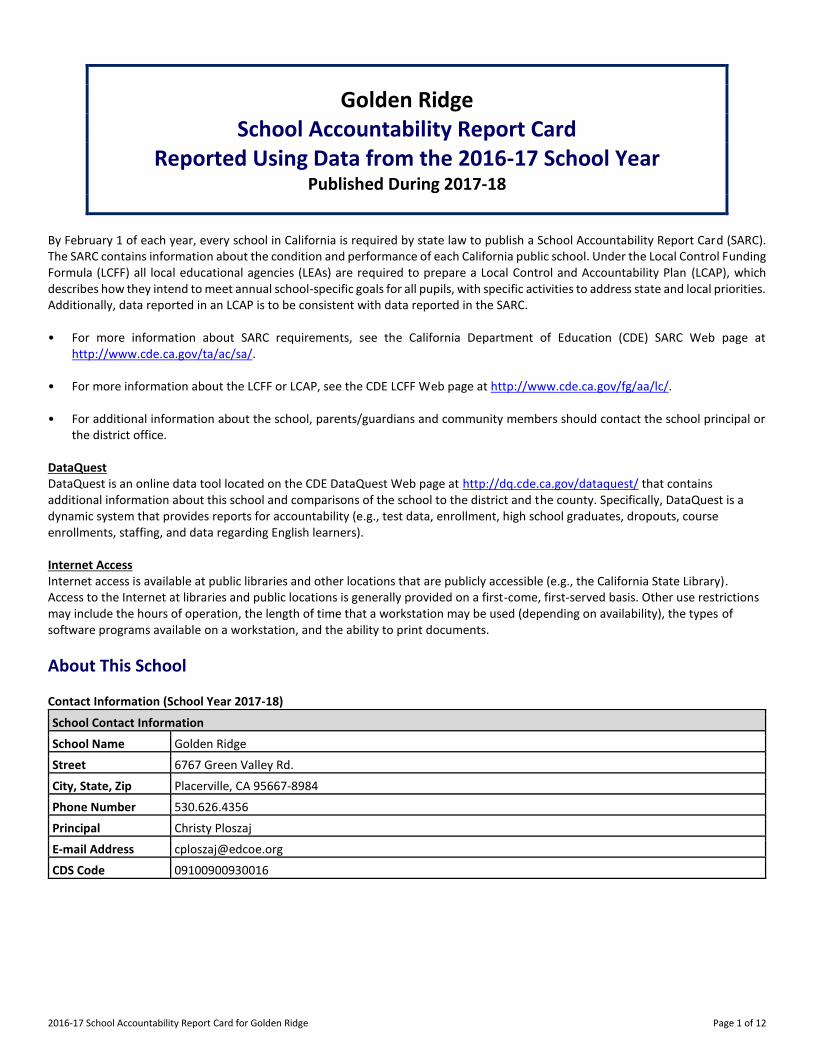
2016-17 School Accountability Report Card for Golden Ridge Page 1 of 12
Golden Ridge
School Accountability Report Card
Reported Using Data from the 2016-17 School Year
Published During 2017-18
By February 1 of each year, every school in California is required by state law to publish a School Accountability Report Card (SARC). The SARC contains information about the condition and performance of each California public school. Under the Local Control Funding Formula (LCFF) all local educational agencies (LEAs) are required to prepare a Local Control and Accountability Plan (LCAP), which describes how they intend to meet annual school-specific goals for all pupils, with specific activities to address state and local priorities. Additionally, data reported in an LCAP is to be consistent with data reported in the SARC. • For more information about SARC requirements, see the California Department of Education (CDE) SARC Web page at
http://www.cde.ca.gov/ta/ac/sa/. • For more information about the LCFF or LCAP, see the CDE LCFF Web page at http://www.cde.ca.gov/fg/aa/lc/. • For additional information about the school, parents/guardians and community members should contact the school principal or
the district office. DataQuest DataQuest is an online data tool located on the CDE DataQuest Web page at http://dq.cde.ca.gov/dataquest/ that contains additional information about this school and comparisons of the school to the district and the county. Specifically, DataQuest is a dynamic system that provides reports for accountability (e.g., test data, enrollment, high school graduates, dropouts, course enrollments, staffing, and data regarding English learners). Internet Access Internet access is available at public libraries and other locations that are publicly accessible (e.g., the California State Library). Access to the Internet at libraries and public locations is generally provided on a first-come, first-served basis. Other use restrictions may include the hours of operation, the length of time that a workstation may be used (depending on availability), the types of software programs available on a workstation, and the ability to print documents.
About This School Contact Information (School Year 2017-18)
School Contact Information
School Name------- Golden Ridge
Street------- 6767 Green Valley Rd.
City, State, Zip------- Placerville, CA 95667-8984
Phone Number------- 530.626.4356
Principal------- Christy Ploszaj
E-mail Address------- [email protected]
CDS Code 09100900930016
2016-17 School Accountability Report Card for Golden Ridge Page 2 of 12
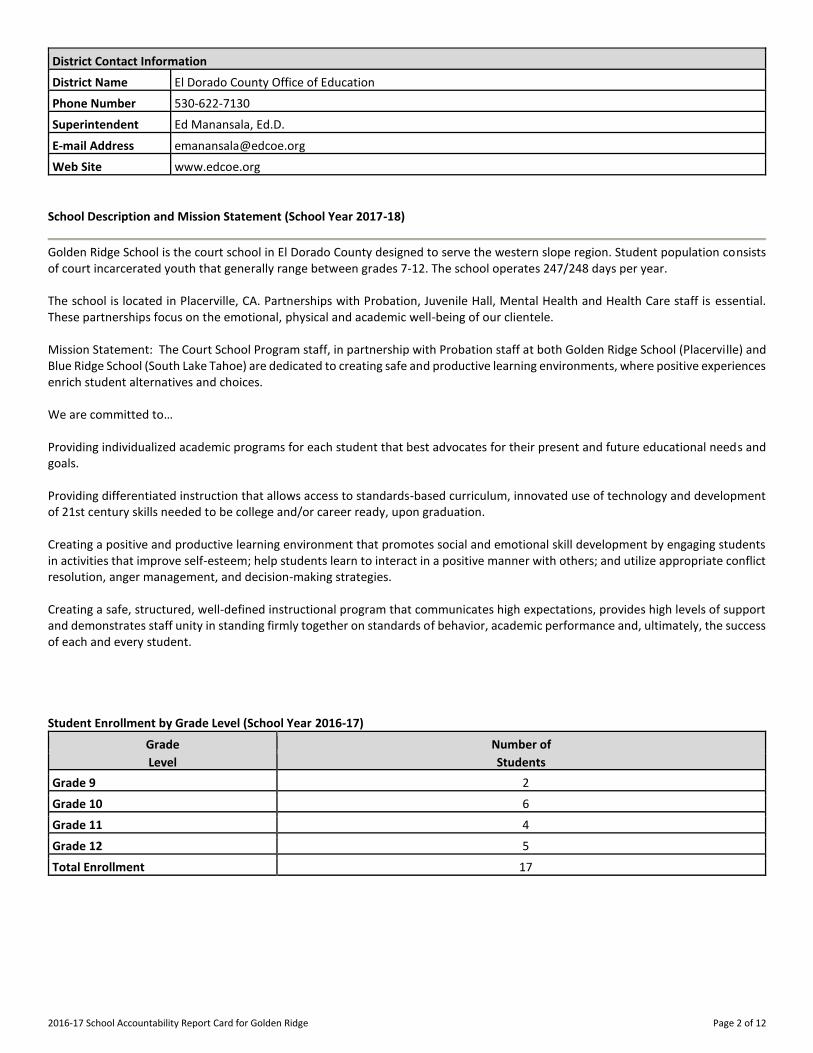
District Contact Information
District Name------- El Dorado County Office of Education
Phone Number------- 530-622-7130
Superintendent-------
Ed Manansala, Ed.D.
E-mail Address------- [email protected]
Web Site------- www.edcoe.org
School Description and Mission Statement (School Year 2017-18)
Golden Ridge School is the court school in El Dorado County designed to serve the western slope region. Student population consists of court incarcerated youth that generally range between grades 7-12. The school operates 247/248 days per year. The school is located in Placerville, CA. Partnerships with Probation, Juvenile Hall, Mental Health and Health Care staff is essential. These partnerships focus on the emotional, physical and academic well-being of our clientele. Mission Statement: The Court School Program staff, in partnership with Probation staff at both Golden Ridge School (Placerville) and Blue Ridge School (South Lake Tahoe) are dedicated to creating safe and productive learning environments, where positive experiences enrich student alternatives and choices. We are committed to… Providing individualized academic programs for each student that best advocates for their present and future educational needs and goals. Providing differentiated instruction that allows access to standards-based curriculum, innovated use of technology and development of 21st century skills needed to be college and/or career ready, upon graduation. Creating a positive and productive learning environment that promotes social and emotional skill development by engaging students in activities that improve self-esteem; help students learn to interact in a positive manner with others; and utilize appropriate conflict resolution, anger management, and decision-making strategies. Creating a safe, structured, well-defined instructional program that communicates high expectations, provides high levels of support and demonstrates staff unity in standing firmly together on standards of behavior, academic performance and, ultimately, the success of each and every student. Student Enrollment by Grade Level (School Year 2016-17)
Grade Number of
Level Students
Grade 9 2
Grade 10 6
Grade 11 4
Grade 12 5
Total Enrollment 17
2016-17 School Accountability Report Card for Golden Ridge Page 3 of 12
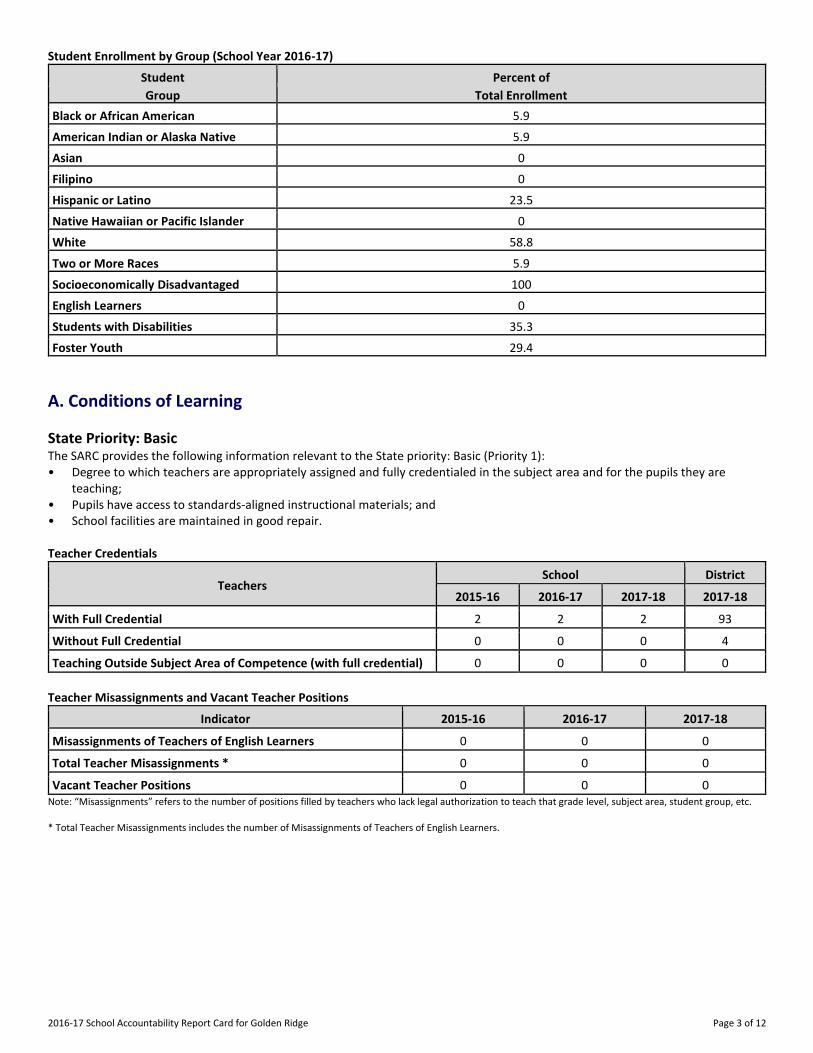
Student Enrollment by Group (School Year 2016-17)
Student Percent of
Group Total Enrollment
Black or African American 5.9
American Indian or Alaska Native 5.9
Asian 0
Filipino 0
Hispanic or Latino 23.5
Native Hawaiian or Pacific Islander 0
White 58.8
Two or More Races 5.9
Socioeconomically Disadvantaged 100
English Learners 0
Students with Disabilities 35.3
Foster Youth 29.4
A. Conditions of Learning
State Priority: Basic The SARC provides the following information relevant to the State priority: Basic (Priority 1): • Degree to which teachers are appropriately assigned and fully credentialed in the subject area and for the pupils they are
teaching; • Pupils have access to standards-aligned instructional materials; and • School facilities are maintained in good repair. Teacher Credentials
Teachers School District
2015-16 2016-17 2017-18 2017-18
With Full Credential 2 2 2 93
Without Full Credential 0 0 0 4
Teaching Outside Subject Area of Competence (with full credential) 0 0 0 0
Teacher Misassignments and Vacant Teacher Positions
Indicator 2015-16 2016-17 2017-18
Misassignments of Teachers of English Learners 0 0 0
Total Teacher Misassignments * 0 0 0
Vacant Teacher Positions 0 0 0 Note: “Misassignments” refers to the number of positions filled by teachers who lack legal authorization to teach that grade level, subject area, student group, etc. * Total Teacher Misassignments includes the number of Misassignments of Teachers of English Learners.
2016-17 School Accountability Report Card for Golden Ridge Page 4 of 12
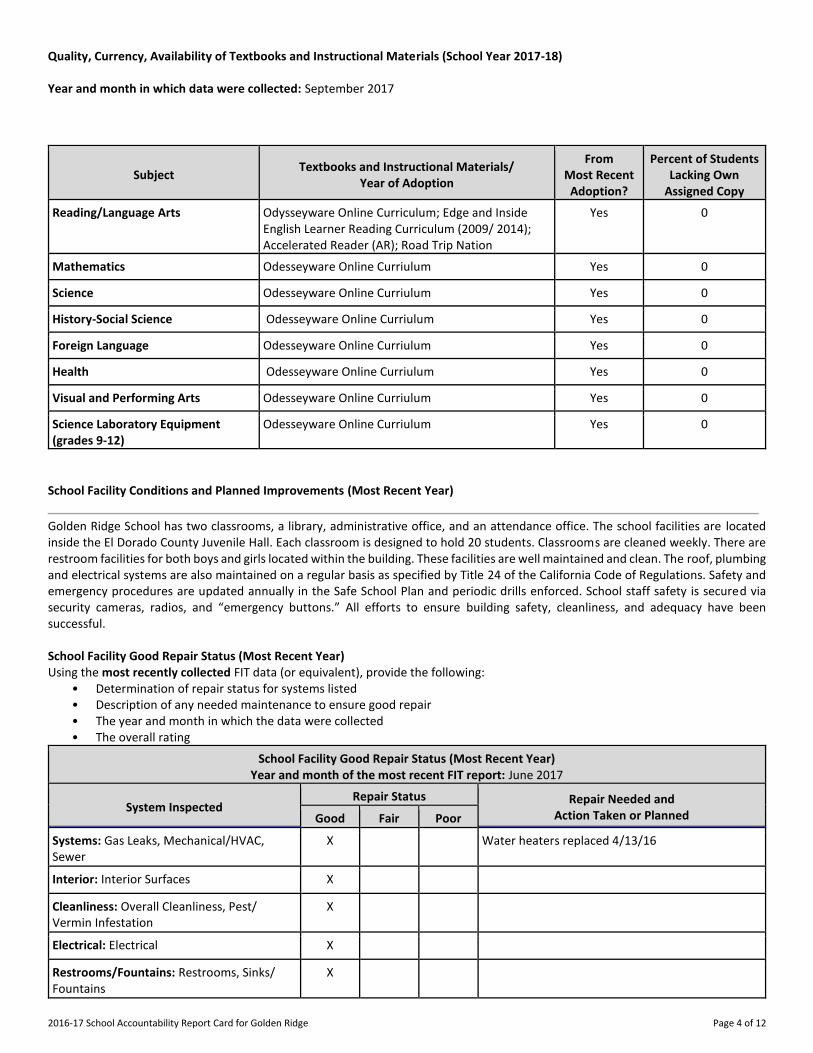
Quality, Currency, Availability of Textbooks and Instructional Materials (School Year 2017-18) Year and month in which data were collected: September 2017
Subject Textbooks and Instructional Materials/
Year of Adoption
From Most Recent
Adoption?
Percent of Students Lacking Own
Assigned Copy
Reading/Language Arts Odysseyware Online Curriculum; Edge and Inside English Learner Reading Curriculum (2009/ 2014); Accelerated Reader (AR); Road Trip Nation
Yes 0
Mathematics Odesseyware Online Curriulum Yes 0
Science Odesseyware Online Curriulum Yes 0
History-Social Science Odesseyware Online Curriulum Yes 0
Foreign Language Odesseyware Online Curriulum Yes 0
Health Odesseyware Online Curriulum Yes 0
Visual and Performing Arts Odesseyware Online Curriulum Yes 0
Science Laboratory Equipment (grades 9-12)
Odesseyware Online Curriulum Yes 0
School Facility Conditions and Planned Improvements (Most Recent Year)
Golden Ridge School has two classrooms, a library, administrative office, and an attendance office. The school facilities are located inside the El Dorado County Juvenile Hall. Each classroom is designed to hold 20 students. Classrooms are cleaned weekly. There are restroom facilities for both boys and girls located within the building. These facilities are well maintained and clean. The roof, plumbing and electrical systems are also maintained on a regular basis as specified by Title 24 of the California Code of Regulations. Safety and emergency procedures are updated annually in the Safe School Plan and periodic drills enforced. School staff safety is secured via security cameras, radios, and “emergency buttons.” All efforts to ensure building safety, cleanliness, and adequacy have been successful. School Facility Good Repair Status (Most Recent Year) Using the most recently collected FIT data (or equivalent), provide the following:
• Determination of repair status for systems listed • Description of any needed maintenance to ensure good repair • The year and month in which the data were collected • The overall rating
School Facility Good Repair Status (Most Recent Year) Year and month of the most recent FIT report: June 2017
System Inspected Repair Status Repair Needed and
Action Taken or Planned Good Fair Poor
Systems: Gas Leaks, Mechanical/HVAC, Sewer
X Water heaters replaced 4/13/16
Interior: Interior Surfaces X
Cleanliness: Overall Cleanliness, Pest/ Vermin Infestation
X
Electrical: Electrical X
Restrooms/Fountains: Restrooms, Sinks/ Fountains
X
2016-17 School Accountability Report Card for Golden Ridge Page 5 of 12
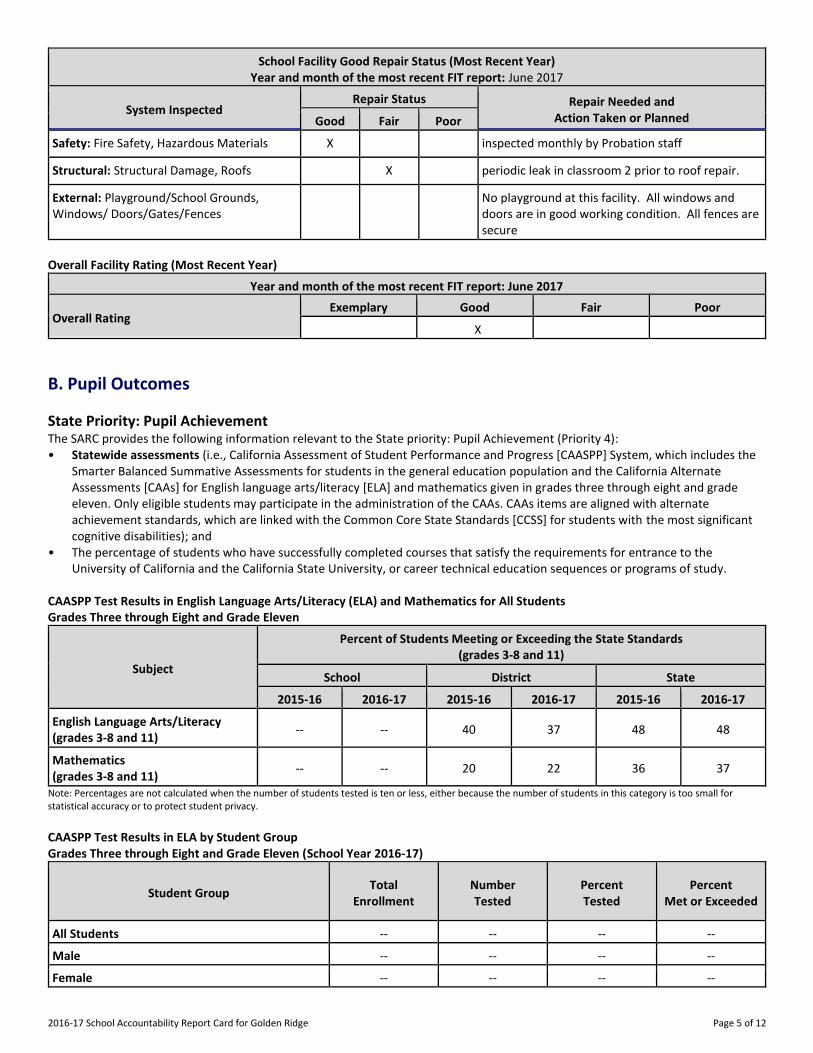
School Facility Good Repair Status (Most Recent Year) Year and month of the most recent FIT report: June 2017
System Inspected Repair Status Repair Needed and
Action Taken or Planned Good Fair Poor
Safety: Fire Safety, Hazardous Materials X inspected monthly by Probation staff
Structural: Structural Damage, Roofs X periodic leak in classroom 2 prior to roof repair.
External: Playground/School Grounds, Windows/ Doors/Gates/Fences
No playground at this facility. All windows and doors are in good working condition. All fences are secure
Overall Facility Rating (Most Recent Year)
Year and month of the most recent FIT report: June 2017
Overall Rating Exemplary Good Fair Poor
X
B. Pupil Outcomes
State Priority: Pupil Achievement The SARC provides the following information relevant to the State priority: Pupil Achievement (Priority 4): • Statewide assessments (i.e., California Assessment of Student Performance and Progress [CAASPP] System, which includes the
Smarter Balanced Summative Assessments for students in the general education population and the California Alternate Assessments [CAAs] for English language arts/literacy [ELA] and mathematics given in grades three through eight and grade eleven. Only eligible students may participate in the administration of the CAAs. CAAs items are aligned with alternate achievement standards, which are linked with the Common Core State Standards [CCSS] for students with the most significant cognitive disabilities); and
• The percentage of students who have successfully completed courses that satisfy the requirements for entrance to the University of California and the California State University, or career technical education sequences or programs of study.
CAASPP Test Results in English Language Arts/Literacy (ELA) and Mathematics for All Students Grades Three through Eight and Grade Eleven
Subject
Percent of Students Meeting or Exceeding the State Standards (grades 3-8 and 11)
School District State
2015-16 2016-17 2015-16 2016-17 2015-16 2016-17
English Language Arts/Literacy (grades 3-8 and 11)
-- -- 40 37 48 48
Mathematics (grades 3-8 and 11)
-- -- 20 22 36 37
Note: Percentages are not calculated when the number of students tested is ten or less, either because the number of students in this category is too small for statistical accuracy or to protect student privacy.
CAASPP Test Results in ELA by Student Group Grades Three through Eight and Grade Eleven (School Year 2016-17)
Student Group Total
Enrollment Number Tested
Percent Tested
Percent Met or Exceeded
All Students -- -- -- --
Male -- -- -- --
Female -- -- -- --
2016-17 School Accountability Report Card for Golden Ridge Page 6 of 12
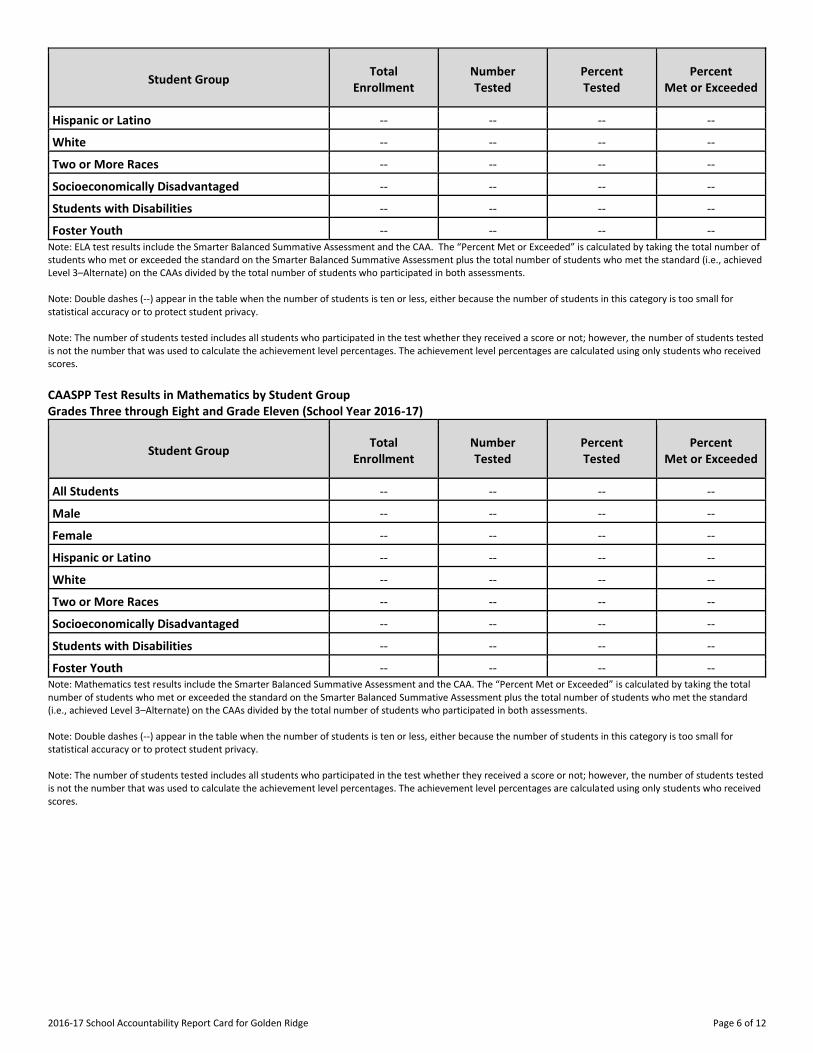
Student Group Total
Enrollment Number Tested
Percent Tested
Percent Met or Exceeded
Hispanic or Latino -- -- -- --
White -- -- -- --
Two or More Races -- -- -- --
Socioeconomically Disadvantaged -- -- -- --
Students with Disabilities -- -- -- --
Foster Youth -- -- -- -- Note: ELA test results include the Smarter Balanced Summative Assessment and the CAA. The “Percent Met or Exceeded” is calculated by taking the total number of students who met or exceeded the standard on the Smarter Balanced Summative Assessment plus the total number of students who met the standard (i.e., achieved Level 3–Alternate) on the CAAs divided by the total number of students who participated in both assessments. Note: Double dashes (--) appear in the table when the number of students is ten or less, either because the number of students in this category is too small for statistical accuracy or to protect student privacy. Note: The number of students tested includes all students who participated in the test whether they received a score or not; however, the number of students tested is not the number that was used to calculate the achievement level percentages. The achievement level percentages are calculated using only students who received scores.
CAASPP Test Results in Mathematics by Student Group Grades Three through Eight and Grade Eleven (School Year 2016-17)
Student Group Total
Enrollment Number Tested
Percent Tested
Percent Met or Exceeded
All Students -- -- -- --
Male -- -- -- --
Female -- -- -- --
Hispanic or Latino -- -- -- --
White -- -- -- --
Two or More Races -- -- -- --
Socioeconomically Disadvantaged -- -- -- --
Students with Disabilities -- -- -- --
Foster Youth -- -- -- -- Note: Mathematics test results include the Smarter Balanced Summative Assessment and the CAA. The “Percent Met or Exceeded” is calculated by taking the total number of students who met or exceeded the standard on the Smarter Balanced Summative Assessment plus the total number of students who met the standard (i.e., achieved Level 3–Alternate) on the CAAs divided by the total number of students who participated in both assessments. Note: Double dashes (--) appear in the table when the number of students is ten or less, either because the number of students in this category is too small for statistical accuracy or to protect student privacy. Note: The number of students tested includes all students who participated in the test whether they received a score or not; however, the number of students tested is not the number that was used to calculate the achievement level percentages. The achievement level percentages are calculated using only students who received scores.
2016-17 School Accountability Report Card for Golden Ridge Page 7 of 12
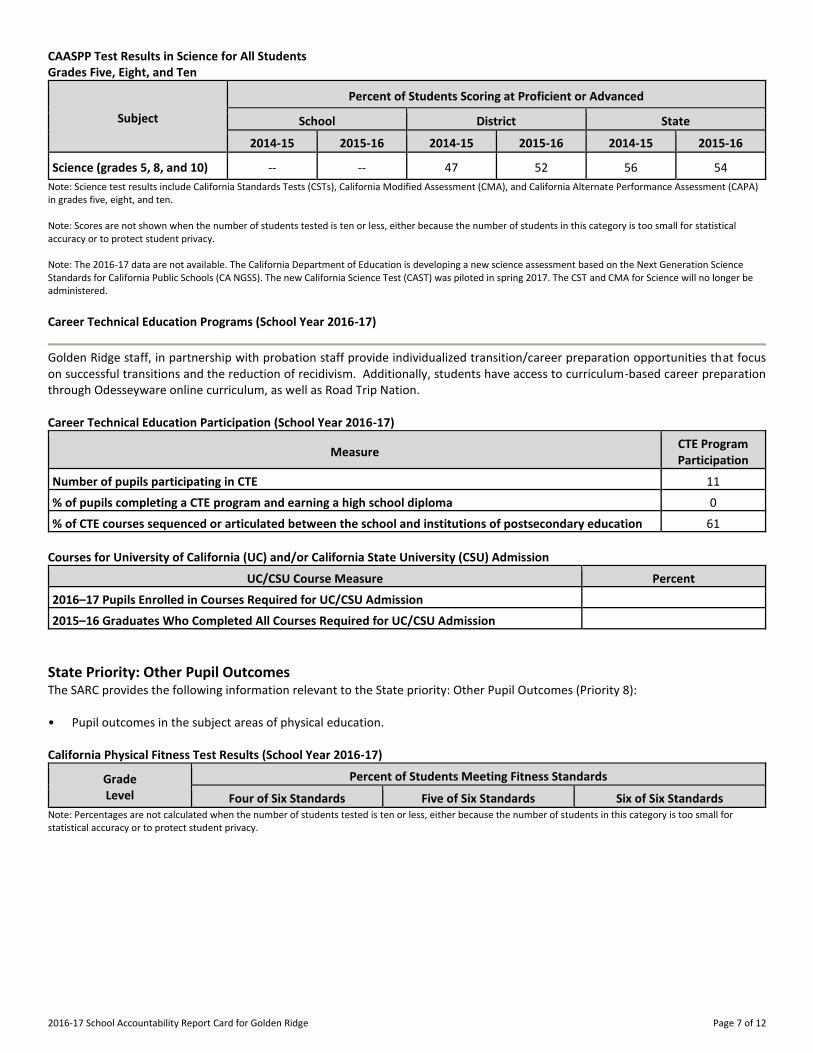
CAASPP Test Results in Science for All Students Grades Five, Eight, and Ten
Subject
Percent of Students Scoring at Proficient or Advanced
School District State
2014-15 2015-16 2014-15 2015-16 2014-15 2015-16
Science (grades 5, 8, and 10) -- -- 47 52 56 54
Note: Science test results include California Standards Tests (CSTs), California Modified Assessment (CMA), and California Alternate Performance Assessment (CAPA) in grades five, eight, and ten. Note: Scores are not shown when the number of students tested is ten or less, either because the number of students in this category is too small for statistical accuracy or to protect student privacy. Note: The 2016-17 data are not available. The California Department of Education is developing a new science assessment based on the Next Generation Science Standards for California Public Schools (CA NGSS). The new California Science Test (CAST) was piloted in spring 2017. The CST and CMA for Science will no longer be administered.
Career Technical Education Programs (School Year 2016-17)
Golden Ridge staff, in partnership with probation staff provide individualized transition/career preparation opportunities that focus on successful transitions and the reduction of recidivism. Additionally, students have access to curriculum-based career preparation through Odesseyware online curriculum, as well as Road Trip Nation. Career Technical Education Participation (School Year 2016-17)
Measure CTE Program Participation
Number of pupils participating in CTE 11
% of pupils completing a CTE program and earning a high school diploma 0
% of CTE courses sequenced or articulated between the school and institutions of postsecondary education 61
Courses for University of California (UC) and/or California State University (CSU) Admission
UC/CSU Course Measure Percent
2016–17 Pupils Enrolled in Courses Required for UC/CSU Admission
2015–16 Graduates Who Completed All Courses Required for UC/CSU Admission
State Priority: Other Pupil Outcomes The SARC provides the following information relevant to the State priority: Other Pupil Outcomes (Priority 8): • Pupil outcomes in the subject areas of physical education. California Physical Fitness Test Results (School Year 2016-17)
Grade Level
Percent of Students Meeting Fitness Standards
Four of Six Standards Five of Six Standards Six of Six Standards Note: Percentages are not calculated when the number of students tested is ten or less, either because the number of students in this category is too small for statistical accuracy or to protect student privacy.
2016-17 School Accountability Report Card for Golden Ridge Page 8 of 12
C. Engagement
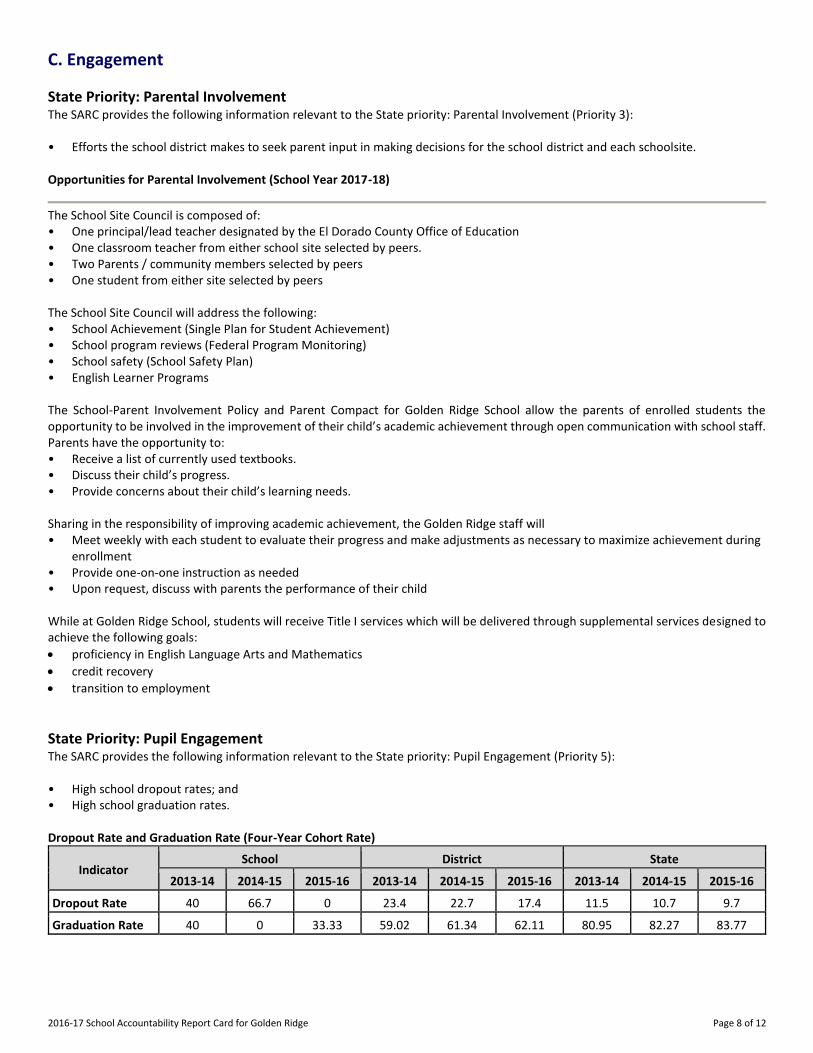
State Priority: Parental Involvement The SARC provides the following information relevant to the State priority: Parental Involvement (Priority 3): • Efforts the school district makes to seek parent input in making decisions for the school district and each schoolsite. Opportunities for Parental Involvement (School Year 2017-18)
The School Site Council is composed of: • One principal/lead teacher designated by the El Dorado County Office of Education • One classroom teacher from either school site selected by peers. • Two Parents / community members selected by peers • One student from either site selected by peers The School Site Council will address the following: • School Achievement (Single Plan for Student Achievement) • School program reviews (Federal Program Monitoring) • School safety (School Safety Plan) • English Learner Programs The School-Parent Involvement Policy and Parent Compact for Golden Ridge School allow the parents of enrolled students the opportunity to be involved in the improvement of their child’s academic achievement through open communication with school staff. Parents have the opportunity to: • Receive a list of currently used textbooks. • Discuss their child’s progress. • Provide concerns about their child’s learning needs. Sharing in the responsibility of improving academic achievement, the Golden Ridge staff will • Meet weekly with each student to evaluate their progress and make adjustments as necessary to maximize achievement during
enrollment • Provide one-on-one instruction as needed • Upon request, discuss with parents the performance of their child While at Golden Ridge School, students will receive Title I services which will be delivered through supplemental services designed to achieve the following goals:
• proficiency in English Language Arts and Mathematics
• credit recovery
• transition to employment
State Priority: Pupil Engagement The SARC provides the following information relevant to the State priority: Pupil Engagement (Priority 5): • High school dropout rates; and • High school graduation rates. Dropout Rate and Graduation Rate (Four-Year Cohort Rate)
Indicator School District State
2013-14 2014-15 2015-16 2013-14 2014-15 2015-16 2013-14 2014-15 2015-16
Dropout Rate 40 66.7 0 23.4 22.7 17.4 11.5 10.7 9.7
Graduation Rate 40 0 33.33 59.02 61.34 62.11 80.95 82.27 83.77
2016-17 School Accountability Report Card for Golden Ridge Page 9 of 12
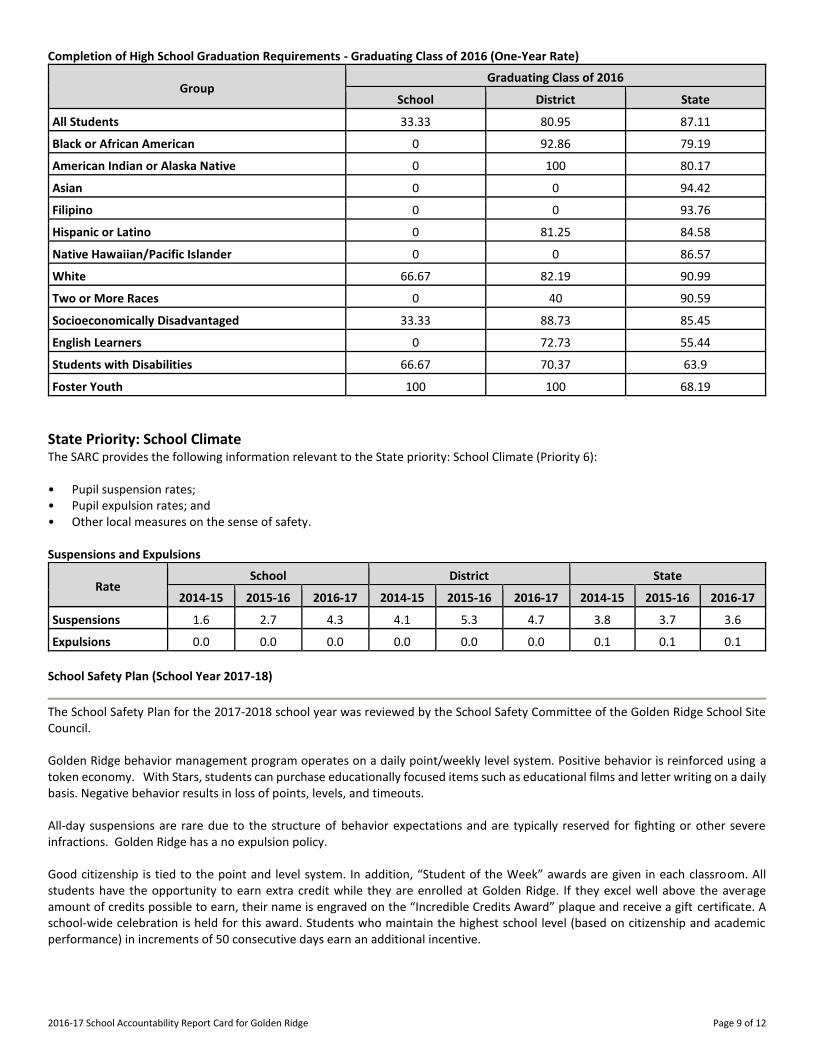
Completion of High School Graduation Requirements - Graduating Class of 2016 (One-Year Rate)
Group Graduating Class of 2016
School District State
All Students 33.33 80.95 87.11
Black or African American 0 92.86 79.19
American Indian or Alaska Native 0 100 80.17
Asian 0 0 94.42
Filipino 0 0 93.76
Hispanic or Latino 0 81.25 84.58
Native Hawaiian/Pacific Islander 0 0 86.57
White 66.67 82.19 90.99
Two or More Races 0 40 90.59
Socioeconomically Disadvantaged 33.33 88.73 85.45
English Learners 0 72.73 55.44
Students with Disabilities 66.67 70.37 63.9
Foster Youth 100 100 68.19
State Priority: School Climate The SARC provides the following information relevant to the State priority: School Climate (Priority 6): • Pupil suspension rates; • Pupil expulsion rates; and • Other local measures on the sense of safety. Suspensions and Expulsions
Rate School District State
2014-15 2015-16 2016-17 2014-15 2015-16 2016-17 2014-15 2015-16 2016-17
Suspensions------- 1.6 2.7 4.3 4.1 5.3 4.7 3.8 3.7 3.6
Expulsions------- 0.0 0.0 0.0 0.0 0.0 0.0 0.1 0.1 0.1
School Safety Plan (School Year 2017-18)
The School Safety Plan for the 2017-2018 school year was reviewed by the School Safety Committee of the Golden Ridge School Site Council. Golden Ridge behavior management program operates on a daily point/weekly level system. Positive behavior is reinforced using a token economy. With Stars, students can purchase educationally focused items such as educational films and letter writing on a daily basis. Negative behavior results in loss of points, levels, and timeouts. All-day suspensions are rare due to the structure of behavior expectations and are typically reserved for fighting or other severe infractions. Golden Ridge has a no expulsion policy. Good citizenship is tied to the point and level system. In addition, “Student of the Week” awards are given in each classroom. All students have the opportunity to earn extra credit while they are enrolled at Golden Ridge. If they excel well above the average amount of credits possible to earn, their name is engraved on the “Incredible Credits Award” plaque and receive a gift certificate. A school-wide celebration is held for this award. Students who maintain the highest school level (based on citizenship and academic performance) in increments of 50 consecutive days earn an additional incentive.
2016-17 School Accountability Report Card for Golden Ridge Page 10 of 12
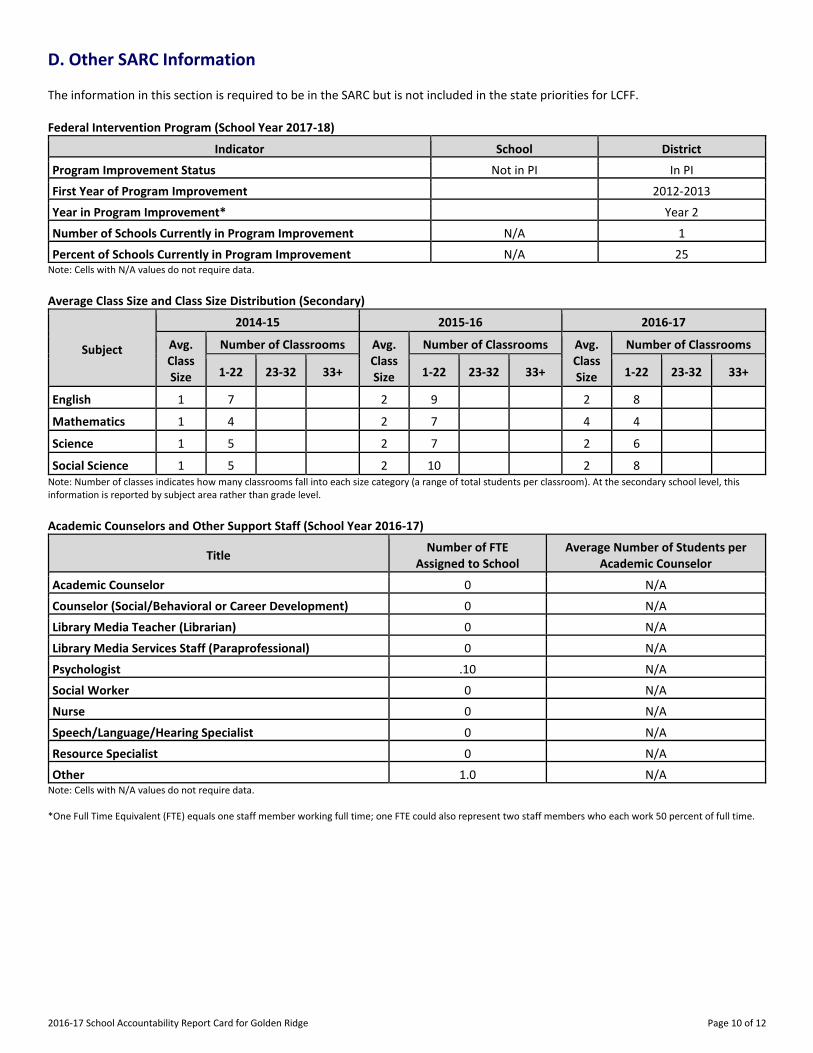
D. Other SARC Information
The information in this section is required to be in the SARC but is not included in the state priorities for LCFF. Federal Intervention Program (School Year 2017-18)
Indicator School District
Program Improvement Status Not in PI In PI
First Year of Program Improvement 2012-2013
Year in Program Improvement* Year 2
Number of Schools Currently in Program Improvement N/A 1
Percent of Schools Currently in Program Improvement N/A 25 Note: Cells with N/A values do not require data.
Average Class Size and Class Size Distribution (Secondary)
Subject
2014-15 2015-16 2016-17
Avg. Class Size
Number of Classrooms Avg. Class Size
Number of Classrooms Avg. Class Size
Number of Classrooms
1-22 23-32 33+ 1-22 23-32 33+ 1-22 23-32 33+
English------- ----------
1 7 2 9 2 8
Mathematics ----------
1 4 2 7 4 4
Science------- ----------
1 5 2 7 2 6
Social Science ----------
1 5 2 10 2 8 Note: Number of classes indicates how many classrooms fall into each size category (a range of total students per classroom). At the secondary school level, this information is reported by subject area rather than grade level. Academic Counselors and Other Support Staff (School Year 2016-17)
Title Number of FTE
Assigned to School Average Number of Students per
Academic Counselor
Academic Counselor------- 0 N/A
Counselor (Social/Behavioral or Career Development) 0 N/A
Library Media Teacher (Librarian) 0 N/A
Library Media Services Staff (Paraprofessional) 0 N/A
Psychologist------- .10 N/A
Social Worker------- 0 N/A
Nurse------- 0 N/A
Speech/Language/Hearing Specialist 0 N/A
Resource Specialist------- 0 N/A
Other------- 1.0 N/A Note: Cells with N/A values do not require data. *One Full Time Equivalent (FTE) equals one staff member working full time; one FTE could also represent two staff members who each work 50 percent of full time.
2016-17 School Accountability Report Card for Golden Ridge Page 11 of 12
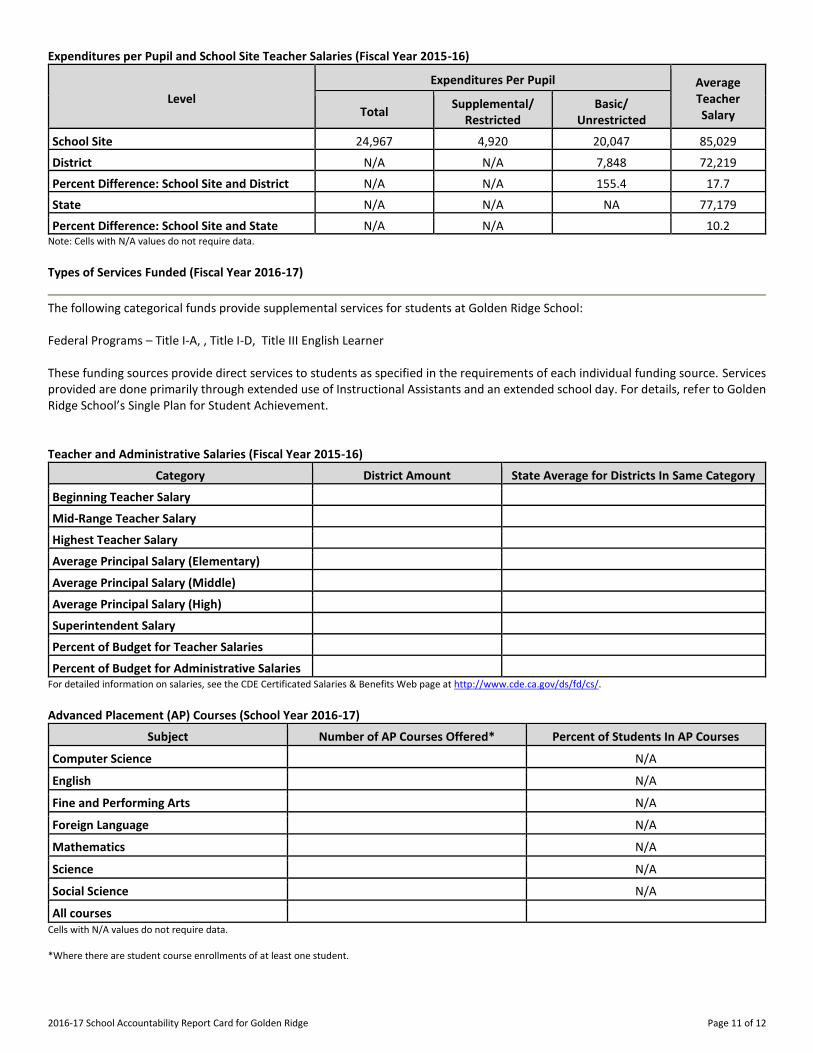
Expenditures per Pupil and School Site Teacher Salaries (Fiscal Year 2015-16)
Level
Expenditures Per Pupil Average Teacher Salary Total
Supplemental/ Restricted
Basic/ Unrestricted
School Site------- 24,967 4,920 20,047 85,029
District------- N/A N/A 7,848 72,219
Percent Difference: School Site and District N/A N/A 155.4 17.7
State------- N/A N/A NA 77,179
Percent Difference: School Site and State N/A N/A 10.2 Note: Cells with N/A values do not require data.
Types of Services Funded (Fiscal Year 2016-17)
The following categorical funds provide supplemental services for students at Golden Ridge School: Federal Programs – Title I-A, , Title I-D, Title III English Learner These funding sources provide direct services to students as specified in the requirements of each individual funding source. Services provided are done primarily through extended use of Instructional Assistants and an extended school day. For details, refer to Golden Ridge School’s Single Plan for Student Achievement. Teacher and Administrative Salaries (Fiscal Year 2015-16)
Category District Amount State Average for Districts In Same Category
Beginning Teacher Salary
Mid-Range Teacher Salary
Highest Teacher Salary
Average Principal Salary (Elementary)
Average Principal Salary (Middle)
Average Principal Salary (High)
Superintendent Salary
Percent of Budget for Teacher Salaries
Percent of Budget for Administrative Salaries For detailed information on salaries, see the CDE Certificated Salaries & Benefits Web page at http://www.cde.ca.gov/ds/fd/cs/. Advanced Placement (AP) Courses (School Year 2016-17)
Subject Number of AP Courses Offered* Percent of Students In AP Courses
Computer Science N/A
English------- N/A
Fine and Performing Arts N/A
Foreign Language N/A
Mathematics N/A
Science------- N/A
Social Science N/A
All courses Cells with N/A values do not require data. *Where there are student course enrollments of at least one student.
2016-17 School Accountability Report Card for Golden Ridge Page 12 of 12
Professional Development (Most Recent Three Years)
Determination of professional development needs is based on student achievement results; changes in legislative requirements and individual requests from the instructional staff. The School Site Council provides input regarding these decisions. It is understood that the main focus of professional development for the next two years will focus on implementation of Common Core Standards. Both Golden Ridge and Blue Ridge schools have one full day of staff development annually. All school staff annually attend mandatory training for Crisis Prevention Intervention (CPI). Special Education teachers attend professional development offered through the SELPA. All staff were required by El Dorado County Probation Department to attend a mandatory 8 hour training pertaining to the regulations and adherence of the Prison Rape Elimination Act (PREA). Staff attended trainings as they were made available. Teachers are supported during implementation of professional development by the school principal and by formal and informal collaboration with other teaching staff.