Embed Size (px)
Citation preview
2016-17 School Accountability Report Card for OUSD Community Day School Page 1 of 12
OUSD Community Day School
School Accountability Report Card
Reported Using Data from the 2016-17 School Year
Published During 2017-18
By February 1 of each year, every school in California is required by state law to publish a School Accountability Report Card (SARC). The SARC contains information about the condition and performance of each California public school. Under the Local Control Funding Formula (LCFF) all local educational agencies (LEAs) are required to prepare a Local Control and Accountability Plan (LCAP), which describes how they intend to meet annual school-specific goals for all pupils, with specific activities to address state and local priorities. Additionally, data reported in an LCAP is to be consistent with data reported in the SARC. • For more information about SARC requirements, see the California Department of Education (CDE) SARC Web page at
http://www.cde.ca.gov/ta/ac/sa/. • For more information about the LCFF or LCAP, see the CDE LCFF Web page at http://www.cde.ca.gov/fg/aa/lc/. • For additional information about the school, parents/guardians and community members should contact the school principal or
the district office. DataQuest DataQuest is an online data tool located on the CDE DataQuest Web page at http://dq.cde.ca.gov/dataquest/ that contains additional information about this school and comparisons of the school to the district and the county. Specifically, DataQuest is a dynamic system that provides reports for accountability (e.g., test data, enrollment, high school graduates, dropouts, course enrollments, staffing, and data regarding English learners). Internet Access Internet access is available at public libraries and other locations that are publicly accessible (e.g., the California State Library). Access to the Internet at libraries and public locations is generally provided on a first-come, first-served basis. Other use restrictions may include the hours of operation, the length of time that a workstation may be used (depending on availability), the types of software programs available on a workstation, and the ability to print documents.
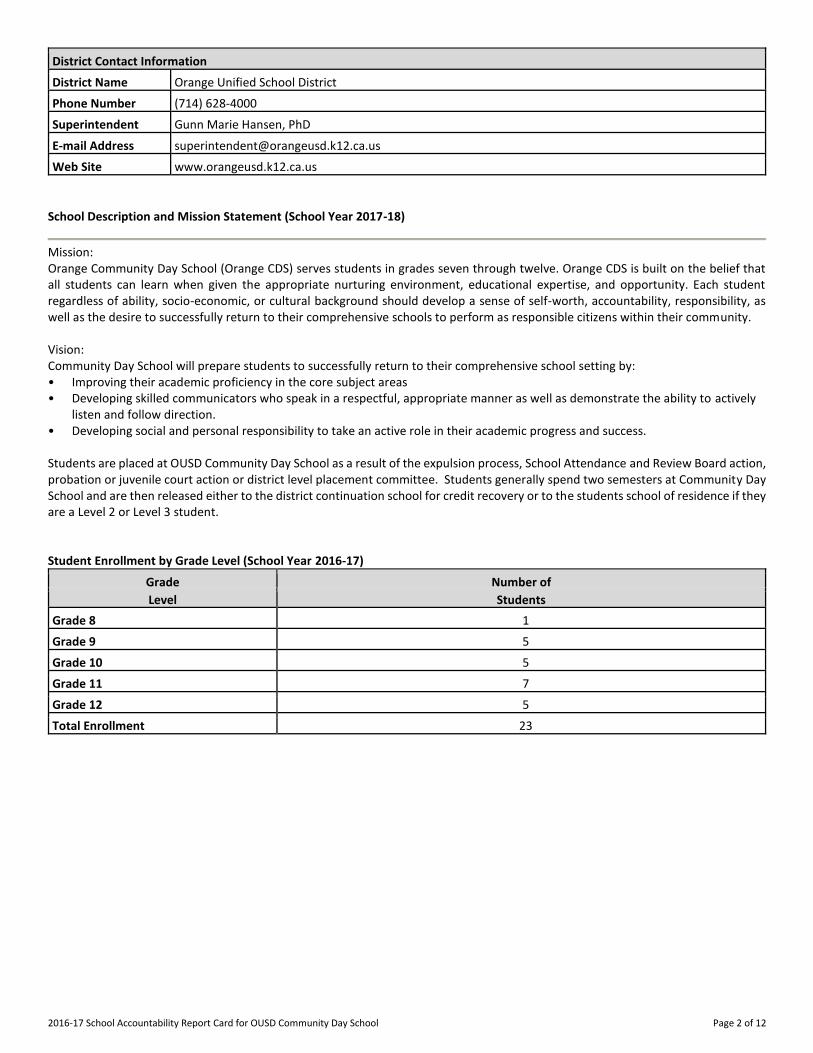
About This School Contact Information (School Year 2017-18)
School Contact Information
School Name------- OUSD Community Day School
Street------- 250 South Yorba Street
City, State, Zip------- Orange, CA 92869
Phone Number------- (714) 628-5479
Principal------- Justin Stanfield
E-mail Address------- [email protected]
Web Site------- http://www.orangeusd.k12.ca.us/CDS/index.asp
CDS Code 30-66621-0114769
2016-17 School Accountability Report Card for OUSD Community Day School Page 2 of 12
District Contact Information
District Name------- Orange Unified School District
Phone Number------- (714) 628-4000
Superintendent-------
Gunn Marie Hansen, PhD
E-mail Address------- [email protected]
Web Site------- www.orangeusd.k12.ca.us
School Description and Mission Statement (School Year 2017-18)
Mission: Orange Community Day School (Orange CDS) serves students in grades seven through twelve. Orange CDS is built on the belief that all students can learn when given the appropriate nurturing environment, educational expertise, and opportunity. Each student regardless of ability, socio-economic, or cultural background should develop a sense of self-worth, accountability, responsibility, as well as the desire to successfully return to their comprehensive schools to perform as responsible citizens within their community. Vision: Community Day School will prepare students to successfully return to their comprehensive school setting by: • Improving their academic proficiency in the core subject areas • Developing skilled communicators who speak in a respectful, appropriate manner as well as demonstrate the ability to actively
listen and follow direction. • Developing social and personal responsibility to take an active role in their academic progress and success. Students are placed at OUSD Community Day School as a result of the expulsion process, School Attendance and Review Board action, probation or juvenile court action or district level placement committee. Students generally spend two semesters at Community Day School and are then released either to the district continuation school for credit recovery or to the students school of residence if they are a Level 2 or Level 3 student. Student Enrollment by Grade Level (School Year 2016-17)
Grade Number of
Level Students
Grade 8 1
Grade 9 5
Grade 10 5
Grade 11 7
Grade 12 5
Total Enrollment 23
2016-17 School Accountability Report Card for OUSD Community Day School Page 3 of 12
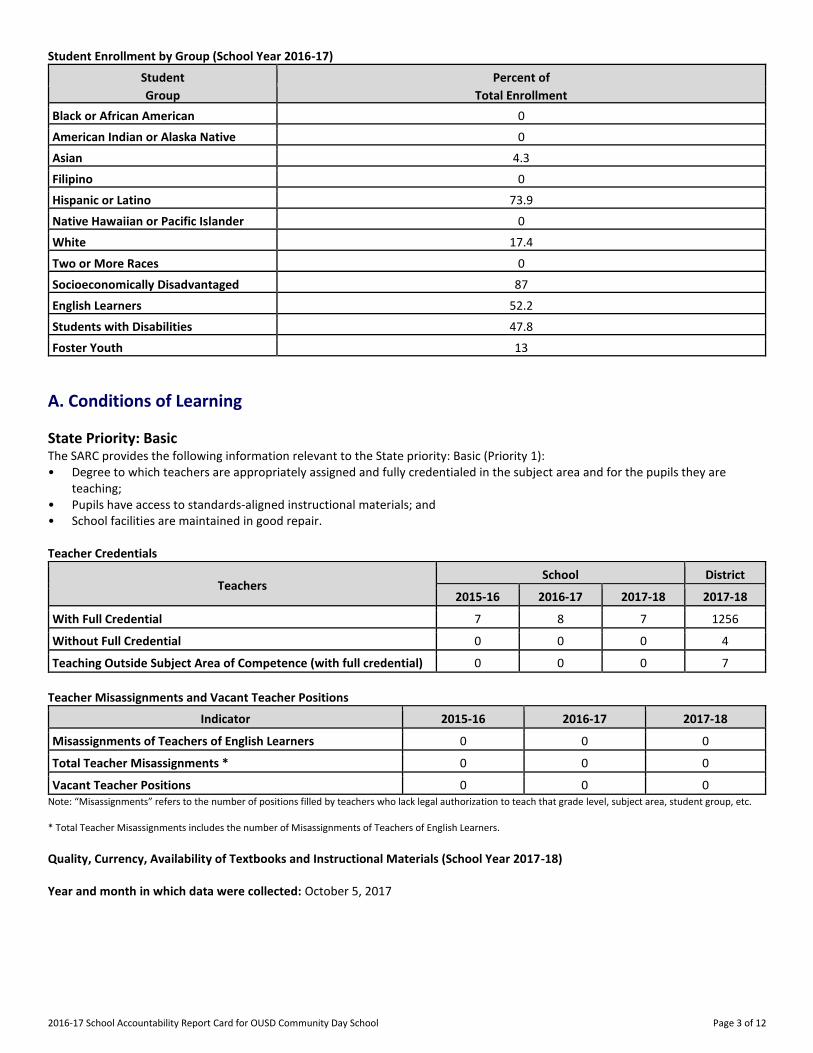
Student Enrollment by Group (School Year 2016-17)
Student Percent of
Group Total Enrollment
Black or African American 0
American Indian or Alaska Native 0
Asian 4.3
Filipino 0
Hispanic or Latino 73.9
Native Hawaiian or Pacific Islander 0
White 17.4
Two or More Races 0
Socioeconomically Disadvantaged 87
English Learners 52.2
Students with Disabilities 47.8
Foster Youth 13
A. Conditions of Learning
State Priority: Basic The SARC provides the following information relevant to the State priority: Basic (Priority 1): • Degree to which teachers are appropriately assigned and fully credentialed in the subject area and for the pupils they are
teaching; • Pupils have access to standards-aligned instructional materials; and • School facilities are maintained in good repair. Teacher Credentials
Teachers School District
2015-16 2016-17 2017-18 2017-18
With Full Credential 7 8 7 1256
Without Full Credential 0 0 0 4
Teaching Outside Subject Area of Competence (with full credential) 0 0 0 7
Teacher Misassignments and Vacant Teacher Positions
Indicator 2015-16 2016-17 2017-18
Misassignments of Teachers of English Learners 0 0 0
Total Teacher Misassignments * 0 0 0
Vacant Teacher Positions 0 0 0 Note: “Misassignments” refers to the number of positions filled by teachers who lack legal authorization to teach that grade level, subject area, student group, etc. * Total Teacher Misassignments includes the number of Misassignments of Teachers of English Learners. Quality, Currency, Availability of Textbooks and Instructional Materials (School Year 2017-18) Year and month in which data were collected: October 5, 2017
2016-17 School Accountability Report Card for OUSD Community Day School Page 4 of 12
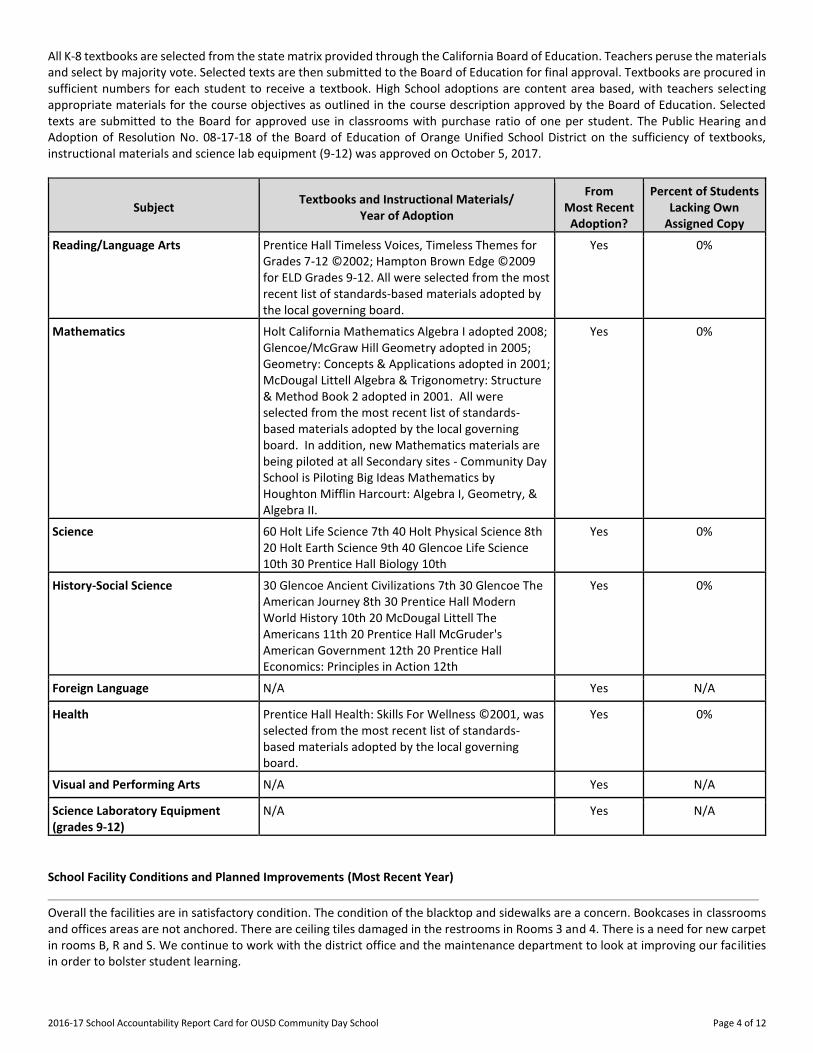
All K-8 textbooks are selected from the state matrix provided through the California Board of Education. Teachers peruse the materials and select by majority vote. Selected texts are then submitted to the Board of Education for final approval. Textbooks are procured in sufficient numbers for each student to receive a textbook. High School adoptions are content area based, with teachers selecting appropriate materials for the course objectives as outlined in the course description approved by the Board of Education. Selected texts are submitted to the Board for approved use in classrooms with purchase ratio of one per student. The Public Hearing and Adoption of Resolution No. 08-17-18 of the Board of Education of Orange Unified School District on the sufficiency of textbooks, instructional materials and science lab equipment (9-12) was approved on October 5, 2017.
Subject Textbooks and Instructional Materials/
Year of Adoption
From Most Recent
Adoption?
Percent of Students Lacking Own
Assigned Copy
Reading/Language Arts Prentice Hall Timeless Voices, Timeless Themes for Grades 7-12 ©2002; Hampton Brown Edge ©2009 for ELD Grades 9-12. All were selected from the most recent list of standards-based materials adopted by the local governing board.
Yes 0%
Mathematics Holt California Mathematics Algebra I adopted 2008; Glencoe/McGraw Hill Geometry adopted in 2005; Geometry: Concepts & Applications adopted in 2001; McDougal Littell Algebra & Trigonometry: Structure & Method Book 2 adopted in 2001. All were selected from the most recent list of standards-based materials adopted by the local governing board. In addition, new Mathematics materials are being piloted at all Secondary sites - Community Day School is Piloting Big Ideas Mathematics by Houghton Mifflin Harcourt: Algebra I, Geometry, & Algebra II.
Yes 0%
Science 60 Holt Life Science 7th 40 Holt Physical Science 8th 20 Holt Earth Science 9th 40 Glencoe Life Science 10th 30 Prentice Hall Biology 10th
Yes 0%
History-Social Science 30 Glencoe Ancient Civilizations 7th 30 Glencoe The American Journey 8th 30 Prentice Hall Modern World History 10th 20 McDougal Littell The Americans 11th 20 Prentice Hall McGruder's American Government 12th 20 Prentice Hall Economics: Principles in Action 12th
Yes 0%
Foreign Language N/A Yes N/A
Health Prentice Hall Health: Skills For Wellness ©2001, was selected from the most recent list of standards-based materials adopted by the local governing board.
Yes 0%
Visual and Performing Arts N/A Yes N/A
Science Laboratory Equipment (grades 9-12)
N/A Yes N/A
School Facility Conditions and Planned Improvements (Most Recent Year)
Overall the facilities are in satisfactory condition. The condition of the blacktop and sidewalks are a concern. Bookcases in classrooms and offices areas are not anchored. There are ceiling tiles damaged in the restrooms in Rooms 3 and 4. There is a need for new carpet in rooms B, R and S. We continue to work with the district office and the maintenance department to look at improving our facilities in order to bolster student learning.
2016-17 School Accountability Report Card for OUSD Community Day School Page 5 of 12
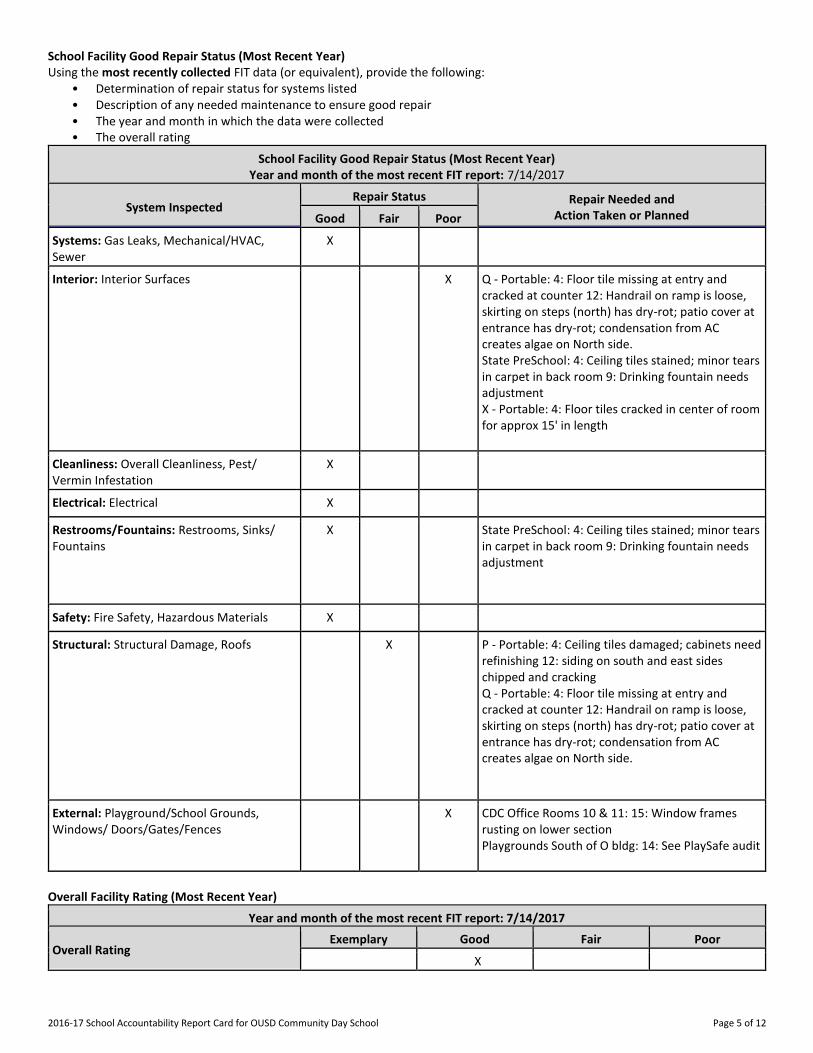
School Facility Good Repair Status (Most Recent Year) Using the most recently collected FIT data (or equivalent), provide the following:
• Determination of repair status for systems listed • Description of any needed maintenance to ensure good repair • The year and month in which the data were collected • The overall rating
School Facility Good Repair Status (Most Recent Year) Year and month of the most recent FIT report: 7/14/2017
System Inspected Repair Status Repair Needed and
Action Taken or Planned Good Fair Poor
Systems: Gas Leaks, Mechanical/HVAC, Sewer
X
Interior: Interior Surfaces X Q - Portable: 4: Floor tile missing at entry and cracked at counter 12: Handrail on ramp is loose, skirting on steps (north) has dry-rot; patio cover at entrance has dry-rot; condensation from AC creates algae on North side. State PreSchool: 4: Ceiling tiles stained; minor tears in carpet in back room 9: Drinking fountain needs adjustment X - Portable: 4: Floor tiles cracked in center of room for approx 15' in length
Cleanliness: Overall Cleanliness, Pest/ Vermin Infestation
X
Electrical: Electrical X
Restrooms/Fountains: Restrooms, Sinks/ Fountains
X State PreSchool: 4: Ceiling tiles stained; minor tears in carpet in back room 9: Drinking fountain needs adjustment
Safety: Fire Safety, Hazardous Materials X
Structural: Structural Damage, Roofs X P - Portable: 4: Ceiling tiles damaged; cabinets need refinishing 12: siding on south and east sides chipped and cracking Q - Portable: 4: Floor tile missing at entry and cracked at counter 12: Handrail on ramp is loose, skirting on steps (north) has dry-rot; patio cover at entrance has dry-rot; condensation from AC creates algae on North side.
External: Playground/School Grounds, Windows/ Doors/Gates/Fences
X CDC Office Rooms 10 & 11: 15: Window frames rusting on lower section Playgrounds South of O bldg: 14: See PlaySafe audit
Overall Facility Rating (Most Recent Year)
Year and month of the most recent FIT report: 7/14/2017
Overall Rating Exemplary Good Fair Poor
X
2016-17 School Accountability Report Card for OUSD Community Day School Page 6 of 12
B. Pupil Outcomes
State Priority: Pupil Achievement The SARC provides the following information relevant to the State priority: Pupil Achievement (Priority 4): • Statewide assessments (i.e., California Assessment of Student Performance and Progress [CAASPP] System, which includes the
Smarter Balanced Summative Assessments for students in the general education population and the California Alternate Assessments [CAAs] for English language arts/literacy [ELA] and mathematics given in grades three through eight and grade eleven. Only eligible students may participate in the administration of the CAAs. CAAs items are aligned with alternate achievement standards, which are linked with the Common Core State Standards [CCSS] for students with the most significant cognitive disabilities); and
• The percentage of students who have successfully completed courses that satisfy the requirements for entrance to the University of California and the California State University, or career technical education sequences or programs of study.
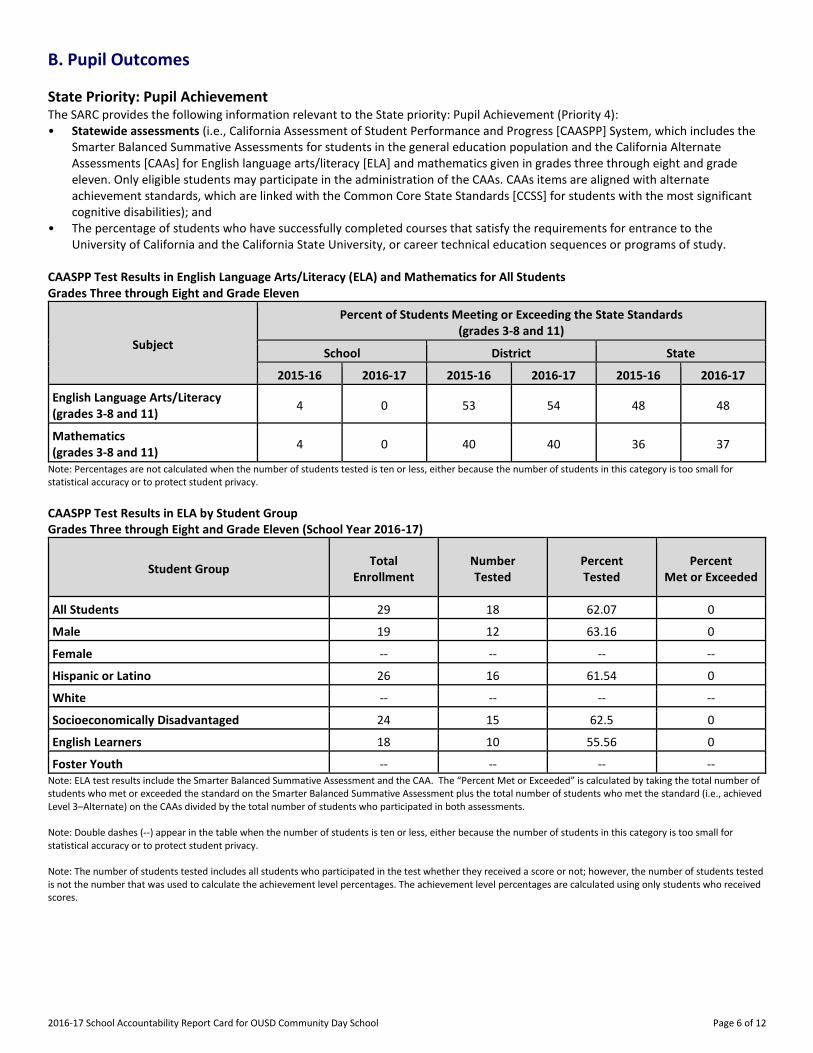
CAASPP Test Results in English Language Arts/Literacy (ELA) and Mathematics for All Students Grades Three through Eight and Grade Eleven
Subject
Percent of Students Meeting or Exceeding the State Standards (grades 3-8 and 11)
School District State
2015-16 2016-17 2015-16 2016-17 2015-16 2016-17
English Language Arts/Literacy (grades 3-8 and 11)
4 0 53 54 48 48
Mathematics (grades 3-8 and 11)
4 0 40 40 36 37
Note: Percentages are not calculated when the number of students tested is ten or less, either because the number of students in this category is too small for statistical accuracy or to protect student privacy.
CAASPP Test Results in ELA by Student Group Grades Three through Eight and Grade Eleven (School Year 2016-17)
Student Group Total
Enrollment Number Tested
Percent Tested
Percent Met or Exceeded
All Students 29 18 62.07 0
Male 19 12 63.16 0
Female -- -- -- --
Hispanic or Latino 26 16 61.54 0
White -- -- -- --
Socioeconomically Disadvantaged 24 15 62.5 0
English Learners 18 10 55.56 0
Foster Youth -- -- -- -- Note: ELA test results include the Smarter Balanced Summative Assessment and the CAA. The “Percent Met or Exceeded” is calculated by taking the total number of students who met or exceeded the standard on the Smarter Balanced Summative Assessment plus the total number of students who met the standard (i.e., achieved Level 3–Alternate) on the CAAs divided by the total number of students who participated in both assessments. Note: Double dashes (--) appear in the table when the number of students is ten or less, either because the number of students in this category is too small for statistical accuracy or to protect student privacy. Note: The number of students tested includes all students who participated in the test whether they received a score or not; however, the number of students tested is not the number that was used to calculate the achievement level percentages. The achievement level percentages are calculated using only students who received scores.
2016-17 School Accountability Report Card for OUSD Community Day School Page 7 of 12
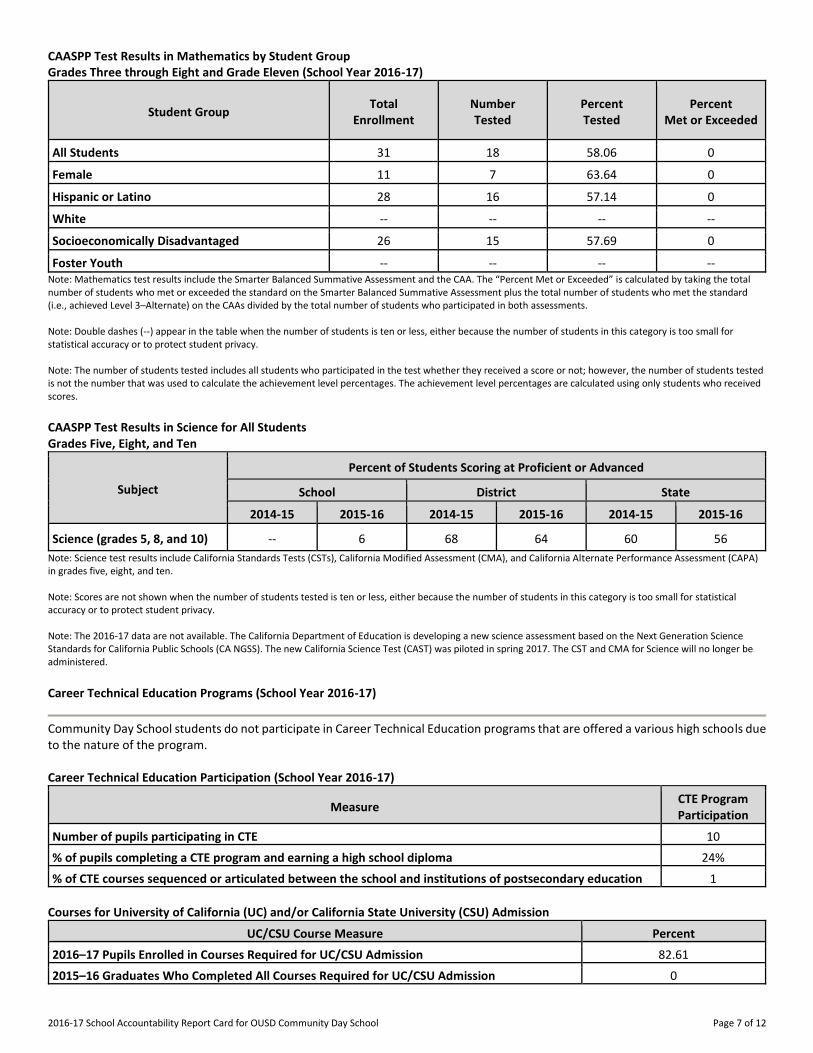
CAASPP Test Results in Mathematics by Student Group Grades Three through Eight and Grade Eleven (School Year 2016-17)
Student Group Total
Enrollment Number Tested
Percent Tested
Percent Met or Exceeded
All Students 31 18 58.06 0
Female 11 7 63.64 0
Hispanic or Latino 28 16 57.14 0
White -- -- -- --
Socioeconomically Disadvantaged 26 15 57.69 0
Foster Youth -- -- -- -- Note: Mathematics test results include the Smarter Balanced Summative Assessment and the CAA. The “Percent Met or Exceeded” is calculated by taking the total number of students who met or exceeded the standard on the Smarter Balanced Summative Assessment plus the total number of students who met the standard (i.e., achieved Level 3–Alternate) on the CAAs divided by the total number of students who participated in both assessments. Note: Double dashes (--) appear in the table when the number of students is ten or less, either because the number of students in this category is too small for statistical accuracy or to protect student privacy. Note: The number of students tested includes all students who participated in the test whether they received a score or not; however, the number of students tested is not the number that was used to calculate the achievement level percentages. The achievement level percentages are calculated using only students who received scores.
CAASPP Test Results in Science for All Students Grades Five, Eight, and Ten
Subject
Percent of Students Scoring at Proficient or Advanced
School District State
2014-15 2015-16 2014-15 2015-16 2014-15 2015-16
Science (grades 5, 8, and 10) -- 6 68 64 60 56
Note: Science test results include California Standards Tests (CSTs), California Modified Assessment (CMA), and California Alternate Performance Assessment (CAPA) in grades five, eight, and ten. Note: Scores are not shown when the number of students tested is ten or less, either because the number of students in this category is too small for statistical accuracy or to protect student privacy. Note: The 2016-17 data are not available. The California Department of Education is developing a new science assessment based on the Next Generation Science Standards for California Public Schools (CA NGSS). The new California Science Test (CAST) was piloted in spring 2017. The CST and CMA for Science will no longer be administered.
Career Technical Education Programs (School Year 2016-17)
Community Day School students do not participate in Career Technical Education programs that are offered a various high schools due to the nature of the program. Career Technical Education Participation (School Year 2016-17)
Measure CTE Program Participation
Number of pupils participating in CTE 10
% of pupils completing a CTE program and earning a high school diploma 24%
% of CTE courses sequenced or articulated between the school and institutions of postsecondary education 1
Courses for University of California (UC) and/or California State University (CSU) Admission
UC/CSU Course Measure Percent
2016–17 Pupils Enrolled in Courses Required for UC/CSU Admission 82.61
2015–16 Graduates Who Completed All Courses Required for UC/CSU Admission 0
2016-17 School Accountability Report Card for OUSD Community Day School Page 8 of 12
State Priority: Other Pupil Outcomes The SARC provides the following information relevant to the State priority: Other Pupil Outcomes (Priority 8): • Pupil outcomes in the subject areas of physical education.
C. Engagement
State Priority: Parental Involvement The SARC provides the following information relevant to the State priority: Parental Involvement (Priority 3): • Efforts the school district makes to seek parent input in making decisions for the school district and each schoolsite. Opportunities for Parental Involvement (School Year 2017-18)
Community Day School staff, students and parents find an open door policy with administration. In an ever changing and transient student population, it is imperative that communication regarding attendance and achievement take place between stakeholders. Since the school services grades 7 - 12 grade, the policies and procedures have to be fluid enough to change with the current needs and population of the school. Parents have the opportunity to meet with staff and administration five times a year including Back to School Night, 3 Parent Nights, and Open House. Input is solicited with each Principal Quarterly Newsletter. Staff meetings and the Level System allow both staff and administration to spot the obstacles for students and to increase student achievement. Administration reaches to the community using phone and email. The staff at Orange CDS is dedicated towards building solid relationships with parents, community members, and all stakeholders. We have continued our commitment to engaging in first class customer service. Not only are our doors always open, but we pride ourselves on treating our "customers" with dignity and respect.
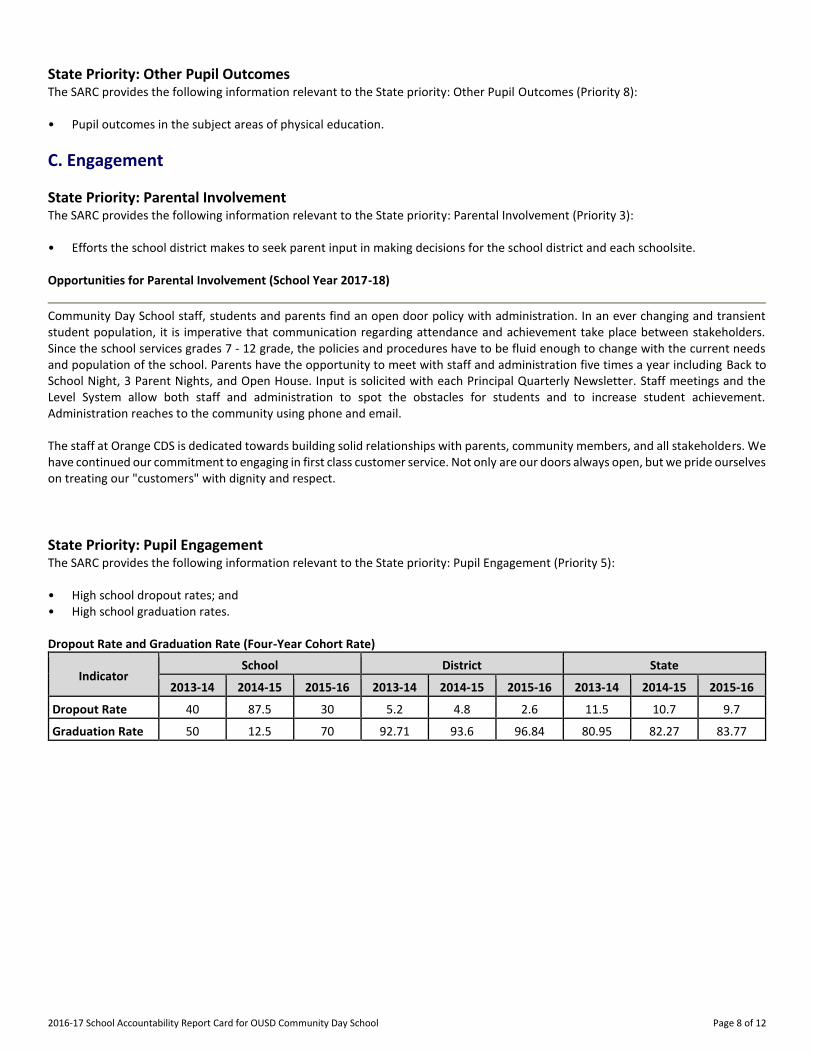
State Priority: Pupil Engagement The SARC provides the following information relevant to the State priority: Pupil Engagement (Priority 5): • High school dropout rates; and • High school graduation rates. Dropout Rate and Graduation Rate (Four-Year Cohort Rate)
Indicator School District State
2013-14 2014-15 2015-16 2013-14 2014-15 2015-16 2013-14 2014-15 2015-16
Dropout Rate 40 87.5 30 5.2 4.8 2.6 11.5 10.7 9.7
Graduation Rate 50 12.5 70 92.71 93.6 96.84 80.95 82.27 83.77
2016-17 School Accountability Report Card for OUSD Community Day School Page 9 of 12
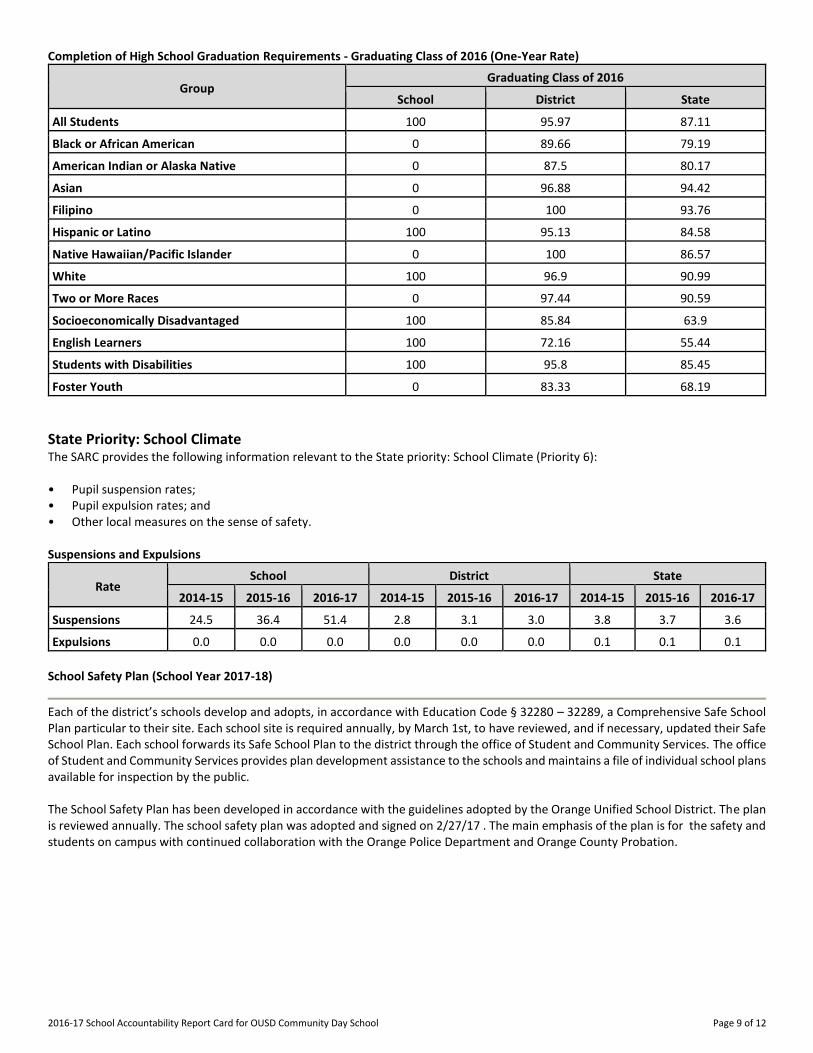
Completion of High School Graduation Requirements - Graduating Class of 2016 (One-Year Rate)
Group Graduating Class of 2016
School District State
All Students 100 95.97 87.11
Black or African American 0 89.66 79.19
American Indian or Alaska Native 0 87.5 80.17
Asian 0 96.88 94.42
Filipino 0 100 93.76
Hispanic or Latino 100 95.13 84.58
Native Hawaiian/Pacific Islander 0 100 86.57
White 100 96.9 90.99
Two or More Races 0 97.44 90.59
Socioeconomically Disadvantaged 100 85.84 63.9
English Learners 100 72.16 55.44
Students with Disabilities 100 95.8 85.45
Foster Youth 0 83.33 68.19
State Priority: School Climate The SARC provides the following information relevant to the State priority: School Climate (Priority 6): • Pupil suspension rates; • Pupil expulsion rates; and • Other local measures on the sense of safety. Suspensions and Expulsions
Rate School District State
2014-15 2015-16 2016-17 2014-15 2015-16 2016-17 2014-15 2015-16 2016-17
Suspensions------- 24.5 36.4 51.4 2.8 3.1 3.0 3.8 3.7 3.6
Expulsions------- 0.0 0.0 0.0 0.0 0.0 0.0 0.1 0.1 0.1
School Safety Plan (School Year 2017-18)
Each of the district’s schools develop and adopts, in accordance with Education Code § 32280 – 32289, a Comprehensive Safe School Plan particular to their site. Each school site is required annually, by March 1st, to have reviewed, and if necessary, updated their Safe School Plan. Each school forwards its Safe School Plan to the district through the office of Student and Community Services. The office of Student and Community Services provides plan development assistance to the schools and maintains a file of individual school plans available for inspection by the public. The School Safety Plan has been developed in accordance with the guidelines adopted by the Orange Unified School District. The plan is reviewed annually. The school safety plan was adopted and signed on 2/27/17 . The main emphasis of the plan is for the safety and students on campus with continued collaboration with the Orange Police Department and Orange County Probation.
2016-17 School Accountability Report Card for OUSD Community Day School Page 10 of 12
D. Other SARC Information
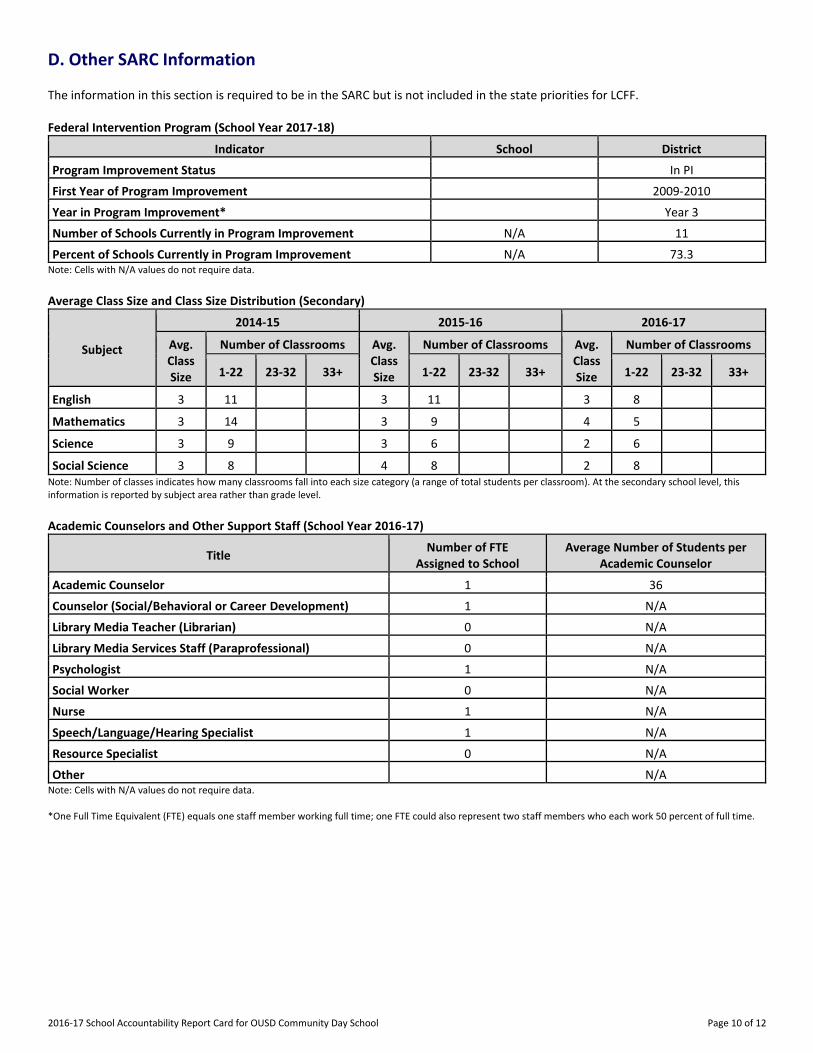
The information in this section is required to be in the SARC but is not included in the state priorities for LCFF. Federal Intervention Program (School Year 2017-18)
Indicator School District
Program Improvement Status In PI
First Year of Program Improvement 2009-2010
Year in Program Improvement* Year 3
Number of Schools Currently in Program Improvement N/A 11
Percent of Schools Currently in Program Improvement N/A 73.3 Note: Cells with N/A values do not require data.
Average Class Size and Class Size Distribution (Secondary)
Subject
2014-15 2015-16 2016-17
Avg. Class Size
Number of Classrooms Avg. Class Size
Number of Classrooms Avg. Class Size
Number of Classrooms
1-22 23-32 33+ 1-22 23-32 33+ 1-22 23-32 33+
English------- ----------
3 11 3 11 3 8
Mathematics ----------
3 14 3 9 4 5
Science------- ----------
3 9 3 6 2 6
Social Science ----------
3 8 4 8 2 8 Note: Number of classes indicates how many classrooms fall into each size category (a range of total students per classroom). At the secondary school level, this information is reported by subject area rather than grade level. Academic Counselors and Other Support Staff (School Year 2016-17)
Title Number of FTE
Assigned to School Average Number of Students per
Academic Counselor
Academic Counselor------- 1 36
Counselor (Social/Behavioral or Career Development) 1 N/A
Library Media Teacher (Librarian) 0 N/A
Library Media Services Staff (Paraprofessional) 0 N/A
Psychologist------- 1 N/A
Social Worker------- 0 N/A
Nurse------- 1 N/A
Speech/Language/Hearing Specialist 1 N/A
Resource Specialist------- 0 N/A
Other------- N/A Note: Cells with N/A values do not require data. *One Full Time Equivalent (FTE) equals one staff member working full time; one FTE could also represent two staff members who each work 50 percent of full time.
2016-17 School Accountability Report Card for OUSD Community Day School Page 11 of 12
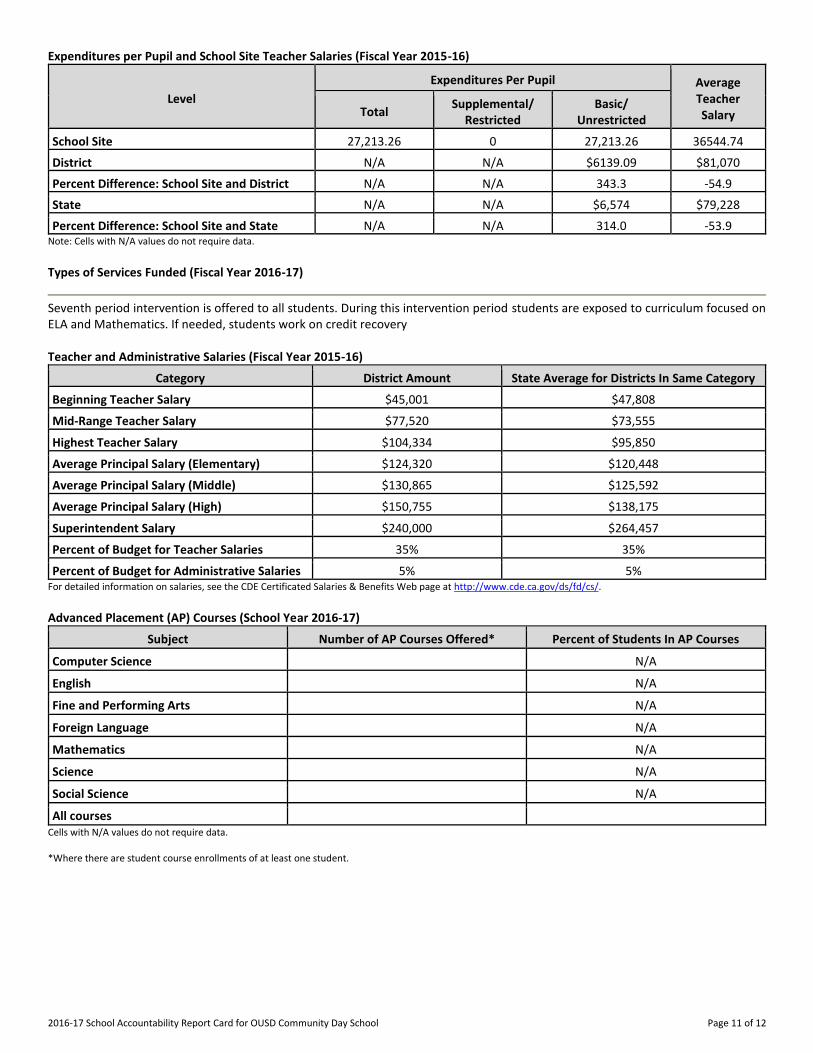
Expenditures per Pupil and School Site Teacher Salaries (Fiscal Year 2015-16)
Level
Expenditures Per Pupil Average Teacher Salary Total
Supplemental/ Restricted
Basic/ Unrestricted
School Site------- 27,213.26 0 27,213.26 36544.74
District------- N/A N/A $6139.09 $81,070
Percent Difference: School Site and District N/A N/A 343.3 -54.9
State------- N/A N/A $6,574 $79,228
Percent Difference: School Site and State N/A N/A 314.0 -53.9 Note: Cells with N/A values do not require data.
Types of Services Funded (Fiscal Year 2016-17)
Seventh period intervention is offered to all students. During this intervention period students are exposed to curriculum focused on ELA and Mathematics. If needed, students work on credit recovery Teacher and Administrative Salaries (Fiscal Year 2015-16)
Category District Amount State Average for Districts In Same Category
Beginning Teacher Salary $45,001 $47,808
Mid-Range Teacher Salary $77,520 $73,555
Highest Teacher Salary $104,334 $95,850
Average Principal Salary (Elementary) $124,320 $120,448
Average Principal Salary (Middle) $130,865 $125,592
Average Principal Salary (High) $150,755 $138,175
Superintendent Salary $240,000 $264,457
Percent of Budget for Teacher Salaries 35% 35%
Percent of Budget for Administrative Salaries 5% 5% For detailed information on salaries, see the CDE Certificated Salaries & Benefits Web page at http://www.cde.ca.gov/ds/fd/cs/. Advanced Placement (AP) Courses (School Year 2016-17)
Subject Number of AP Courses Offered* Percent of Students In AP Courses
Computer Science N/A
English------- N/A
Fine and Performing Arts N/A
Foreign Language N/A
Mathematics N/A
Science------- N/A
Social Science N/A
All courses Cells with N/A values do not require data. *Where there are student course enrollments of at least one student.
2016-17 School Accountability Report Card for OUSD Community Day School Page 12 of 12
Professional Development (Most Recent Three Years)
CDS staff will participate in professional development with the focus on 21st Century Learning. Describe the ongoing professional development at the school? How is it initiated? Staff at Community Day School meet after school at least twice a month. During those meetings, teachers discuss student behavior, achievement, and data. Each month CDS teachers will participate in PLCs that will include Smartboard Training, Working with Probation, Discipline Management, and IPads. CDS Math teacher is attending the California Mathematics Council conference. CDS Math teacher will have a prep period to mentor and support the trial of new math curriculum. He will focus on lesson development, assessment and monitor the implementation of a new program. CDS staff are encouraged to attend professional development opportunities throughout the school year including improving attendance and parental involvement. EL Coordinator works with the staff regarding supports for EL students.