Embed Size (px)
Citation preview
Institute on Disability/UCED
Disability Statistics Annual Report2017
A Publication of the Rehabilitation Research and Training Center on Disability Statistics and Demographics
AcknowledgementsSpecial thanks to the following individuals who have contributed to the success of this effort: Milan Hajek and Kiara Gonzalez Garcia from the Public Health Institute and Anna Brennan-Curry and Karen Volle from the University of New Hampshire.
Funding for this publication made possible by:
The Rehabilitation Research and Training Center on Disability Statistics and Demographics (StatsRRTC) is funded by the Department of Health and Human Services, Administration for Community Living, National Institute on Disability, Independent Living, and Rehabilitation Research (NIDILRR) – Rehabilitation Research and Training Centers (RRTCs) Program under grant number 90RT5022-02-00, from 2013 – 2018. The information developed by the StatsRRTC does not necessarily represent the policies of the United States Department of Health and Human Services, and you should not assume endorsement by the Federal Government (Edgar, 75.620 (b)).
Suggested Citation:
Kraus, L., Lauer, E., Coleman, R., and Houtenville, A. (2018). 2017 Disability Statistics Annual Report. Durham, NH: University of New Hampshire.
10 West Edge Drive, Suite 101 | Durham, NH 03824
603.862.4320 | Relay: 711 | Fax: 603.862.0555
www.iod.unh.edu
© January 2018. Institute on Disability. University of New Hampshire.
Stay Connected:
Rehabilitation Research and Training Center on Disability Statistics and Demographics
A NIDILRR-Funded Center
Disability Statistics Annual Report2017

Annual Report: 2017 | Disability Statistics & Demographics i
Introduction. . . . . . . . . . . . . . . . . . . . . . . . . . . . . . . . . . . . . . . . . . . . . . . . . . . . . . . . . . . . . . . . . . . . . . . . 1
Quick Facts. . . . . . . . . . . . . . . . . . . . . . . . . . . . . . . . . . . . . . . . . . . . . . . . . . . . . . . . . . . . . . . . . . . . . . . . . 2
Disability in the United States . . . . . . . . . . . . . . . . . . . . . . . . . . . . . . . . . . . . . . . . . . . . . . . . . . . . . . . . . 5
Percent With Disability in the US Across the Life Span . . . . . . . . . . . . . . . . . . . . . . . . . . . . . . . . . . . 7
Prevalence by Disability Type . . . . . . . . . . . . . . . . . . . . . . . . . . . . . . . . . . . . . . . . . . . . . . . . . . . . . . . . 11
Percent Employed, Ages 18-64 . . . . . . . . . . . . . . . . . . . . . . . . . . . . . . . . . . . . . . . . . . . . . . . . . . . . . . . 15
Earnings . . . . . . . . . . . . . . . . . . . . . . . . . . . . . . . . . . . . . . . . . . . . . . . . . . . . . . . . . . . . . . . . . . . . . . . . . . 19
Poverty . . . . . . . . . . . . . . . . . . . . . . . . . . . . . . . . . . . . . . . . . . . . . . . . . . . . . . . . . . . . . . . . . . . . . . . . . . . 23
Health . . . . . . . . . . . . . . . . . . . . . . . . . . . . . . . . . . . . . . . . . . . . . . . . . . . . . . . . . . . . . . . . . . . . . . . . . . . . 27
Appendix A: The Six Disability Questions in the American Community Survey . . . . . . . . . . . . . 33
Appendix B: Source Data . . . . . . . . . . . . . . . . . . . . . . . . . . . . . . . . . . . . . . . . . . . . . . . . . . . . . . . . . . . . 34
Appendix C: Glossary of Terms . . . . . . . . . . . . . . . . . . . . . . . . . . . . . . . . . . . . . . . . . . . . . . . . . . . . . . 38
About the StatsRRTC . . . . . . . . . . . . . . . . . . . . . . . . . . . . . . . . . . . . . . . . . . . . . . . . . . . . . . . . . . . . . . . 41
Table of Contents

Annual Report: 2017 | Disability Statistics & Demographics 1
The 2017 Disability Statistics Annual Report presents statistics to address the following types of questions:
• How many people with disabilities live in the United States?
• What is the percentage of people with disabilities in different age groups?
• What is the percentage of people with disabilities for different types of disability?
• To what extent are people with disabilities employed?
• What are the earnings for people with and without disabilities?
• What is the poverty percentage for people with and without disabilities?
• Is disability status associated with percentages of smoking, obesity, and binge drinking?
The Annual Report highlights state and trend data from national sources. A specific listing of source data for each figure is included in Appendix B. There is a great deal of variability in rates of people with disabilities by state and the Annual Report includes maps to highlight this information. A glossary of terms is included in Appendix C.
The Annual Report charts complement the detailed tables of data which can be found in the 2017 Annual Disability Statistics Compendium (www.disabilitycompendium.org).
Introduction
www.DisabilityCompendium.org | 866.538.9521 2
• The American Community Survey (ACS) estimates the overall rate of people with disabilities in the US population in 2016 was 12.8%.
• The percent of people with disabilities varies greatly by state, as do levels of people with disabilities in employment, poverty, earnings, and health behaviors.
• The percentage of those with a disability in the US civilian population slowly increased from 11.9% in 2010 to 12.8% in 2016.
• In 2016, the state with the lowest percentage of its population having a disability was Utah (9.9%). The state with the highest percentage of disability, West Virginia, was more than twice as high with a percentage of 20.1%.
• As the US population ages, the percentage of people with disabilities increases. In the US in 2016, less than 1.0% of the under 5 years old population had a disability. For those ages 5-17, the rate was 5.6%. For ages 18-64, the rate was 10.6%. For people ages 65 and older, 35.2% had a disability.
• In 2016, of the US population with disabilities, over half (51.0%) were people in the working-ages of 18- 64, while 41.4% were 65 and older. Disability in children and youth accounted for only 7.3% (ages 5-17) and 0.4% (under 5 years old).
• From 2008 to 2016, the percentages of people with each type of disability have remained relatively unchanged. The percentage of people with ambulatory disabilities, cognitive disabilities, and independent living disabilities rose by 0.2 to 0.3 points over the period, while people with hearing, vision, and self-care disabilities rose 0.1 point or less.
• In the US in 2016, 35.9% of people with disabilities ages 18-64 living in the community were employed. The employment percentage was more than double for people without disabilities, 76.6%.
• The employment gap, difference between the employment percentage for people with disabilities (35.9%) and people without disabilities (76.6%), was 40.7 percentage points.
• For people with disabilities, employment rates ranged from a high of 54.0% (North Dakota) to a low of 27.4% (West Virginia). For those without disabilities, the employment ranged from 70.8% (West Virginia) to 84.2% (North Dakota).
• In thirty four states, the employment percentage gap between those with a disability and those without was 40 percentage points or greater; only three states showed an employment percentage gap less than 23 percentage points.
Quick Facts
Annual Report: 2017 | Disability Statistics & Demographics 3
• Employment rates vary by type of disability. Employment percentages were highest for people with hearing disabilities (51.7%) and vision disabilities (43.5%) and lowest for independent living (17.0%) and self-care (15.5%) disabilities.
• In 2016, the median earnings of people with disabilities ages 16 and over in the US was $22,047, about two-thirds of the median earnings of people without disabilities, $32,479.
• An earnings disparity of over $10,000 in median earnings between those with and without disabilities continues a trend, which has existed since at least 2008 and has increased in magnitude since 2013.
• States varied widely in earnings gap (the difference between the median earnings for those with and without disabilities) – from a low of $5,242 in Idaho to a high of $23,144 in the District of Columbia.
• The poverty percentage gap, or the difference between the percentages of those with and without disabilities, has been between 7.4 and 8.3 percentage points over the past 8 years.
• Over the past 8 years, the highest percentage of people with disabilities who smoke was 27.0% in 2009. This has been in annual decline since 2012 (from 26.0% to 23.4%). But in 2016, the percentage moved back up to 24.6%. Over the same period, the highest percentage of people without disabilities smoking was 18.2% in 2011 and it has been in annual decline thereafter to 13.6% in 2016. The gap between the percentages for smokers with and without disabilities rose in 2016 to 11 percentage points.
• In 2016, 38.9% of people ages 18 and over with disabilities were obese. In comparison, only 26.4% of those without disabilities were obese.
• At 12.6 percentage points, 2016 had the lowest obesity gap (the difference in the percentages of obesity for people with and without disabilities) since 2009. It was also the second straight year-to-year drop.
• For states, gaps in binge drinking for those ages 18 and over ranged from 11.7 points less (thus more people without disabilities binge drinking than those with disabilities) in District of Columbia to 1.6 points less in Utah.

www.DisabilityCompendium.org | 866.538.9521 4
Annual Report: 2017 | Disability Statistics & Demographics 5
12.6% 12.8%12.6%12.6%12.2%12.1%11.9%12.0%12.1%
0%
5%
10%
15%
2014 2015 2016201320122011201020092008
Disability in the United StatesHow many people with disabilities live in the United States?
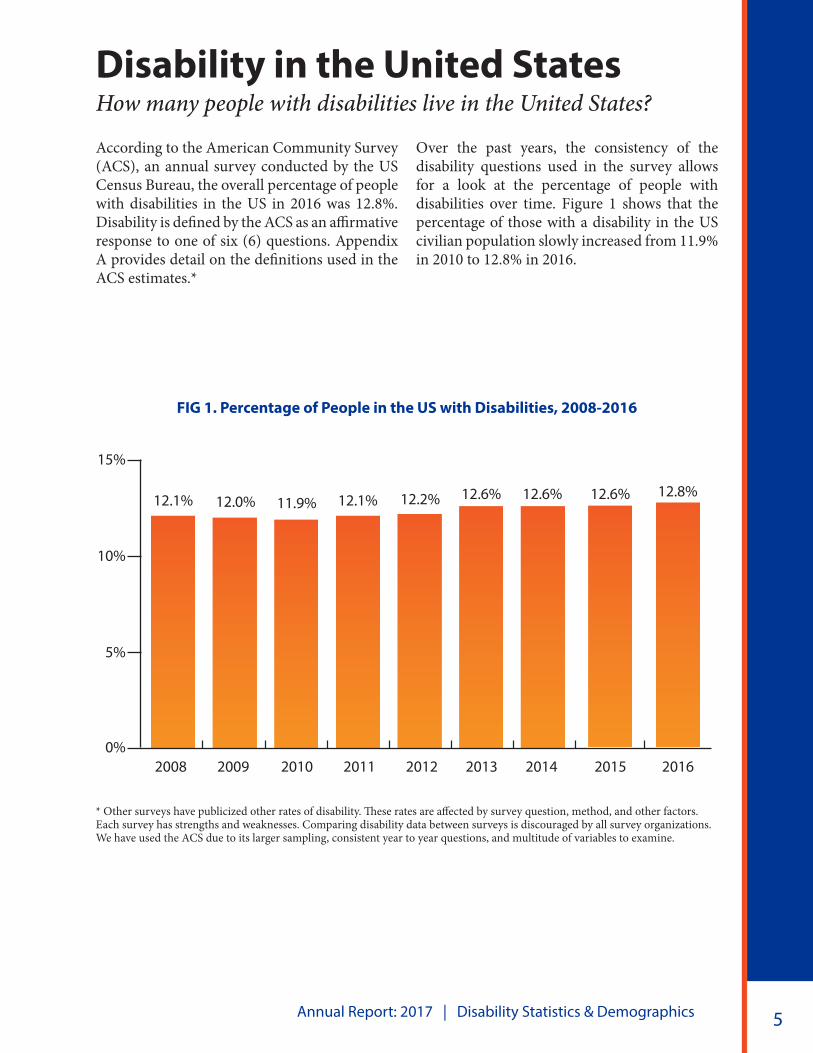
According to the American Community Survey (ACS), an annual survey conducted by the US Census Bureau, the overall percentage of people with disabilities in the US in 2016 was 12.8%. Disability is defined by the ACS as an affirmative response to one of six (6) questions. Appendix A provides detail on the definitions used in the ACS estimates.*
FIG 1. Percentage of People in the US with Disabilities, 2008-2016
* Other surveys have publicized other rates of disability. These rates are affected by survey question, method, and other factors. Each survey has strengths and weaknesses. Comparing disability data between surveys is discouraged by all survey organizations. We have used the ACS due to its larger sampling, consistent year to year questions, and multitude of variables to examine.
Over the past years, the consistency of the disability questions used in the survey allows for a look at the percentage of people with disabilities over time. Figure 1 shows that the percentage of those with a disability in the US civilian population slowly increased from 11.9% in 2010 to 12.8% in 2016.
www.DisabilityCompendium.org | 866.538.9521 6
Disability Prevalence. 2016
9.9% to 11.6%
11.7% to 13.1%
13.2% to 14.5%
14.6% to 20.1%
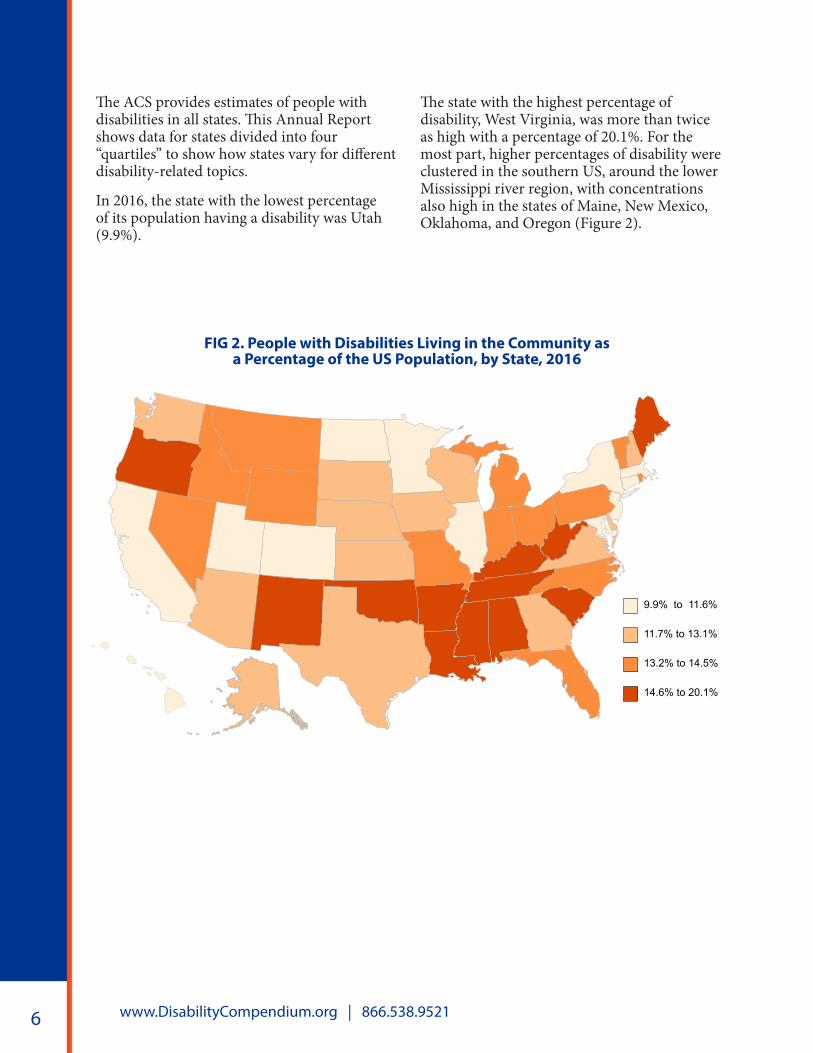
The ACS provides estimates of people with disabilities in all states. This Annual Report shows data for states divided into four “quartiles” to show how states vary for different disability-related topics.
In 2016, the state with the lowest percentage of its population having a disability was Utah (9.9%).
The state with the highest percentage of disability, West Virginia, was more than twice as high with a percentage of 20.1%. For the most part, higher percentages of disability were clustered in the southern US, around the lower Mississippi river region, with concentrations also high in the states of Maine, New Mexico, Oklahoma, and Oregon (Figure 2).
FIG 2. People with Disabilities Living in the Community as a Percentage of the US Population, by State, 2016
Annual Report: 2017 | Disability Statistics & Demographics 7
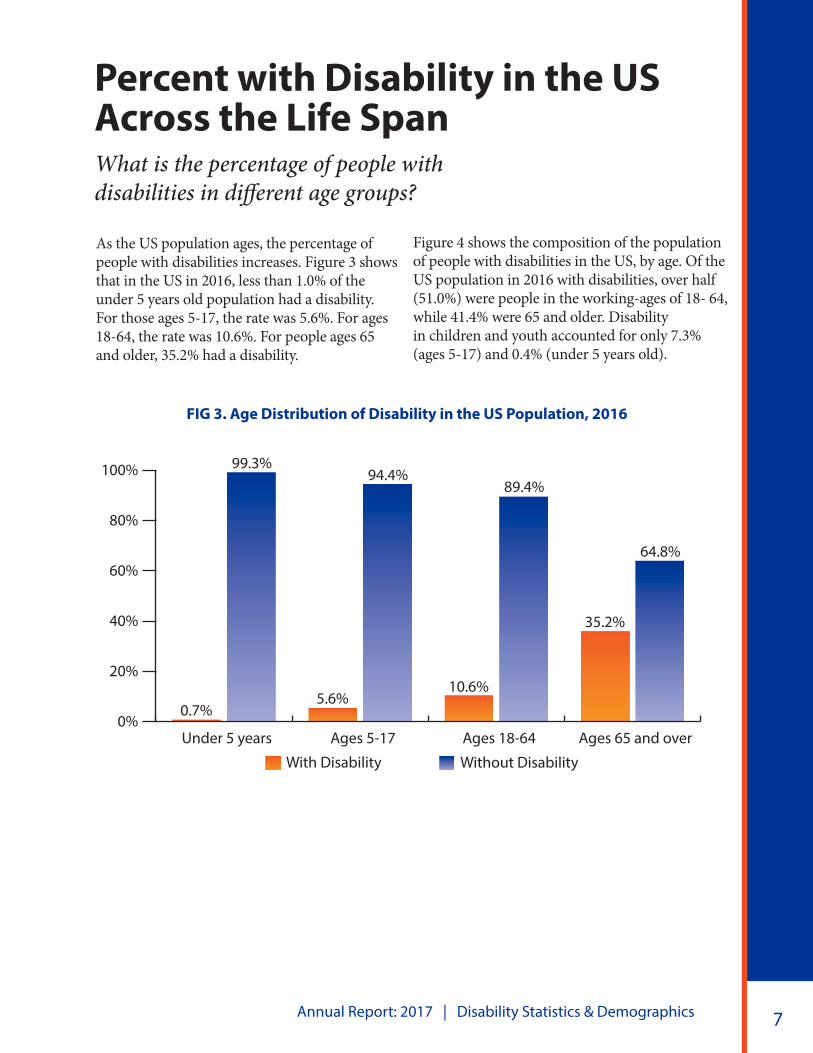
As the US population ages, the percentage of people with disabilities increases. Figure 3 shows that in the US in 2016, less than 1.0% of the under 5 years old population had a disability. For those ages 5-17, the rate was 5.6%. For ages 18-64, the rate was 10.6%. For people ages 65 and older, 35.2% had a disability.
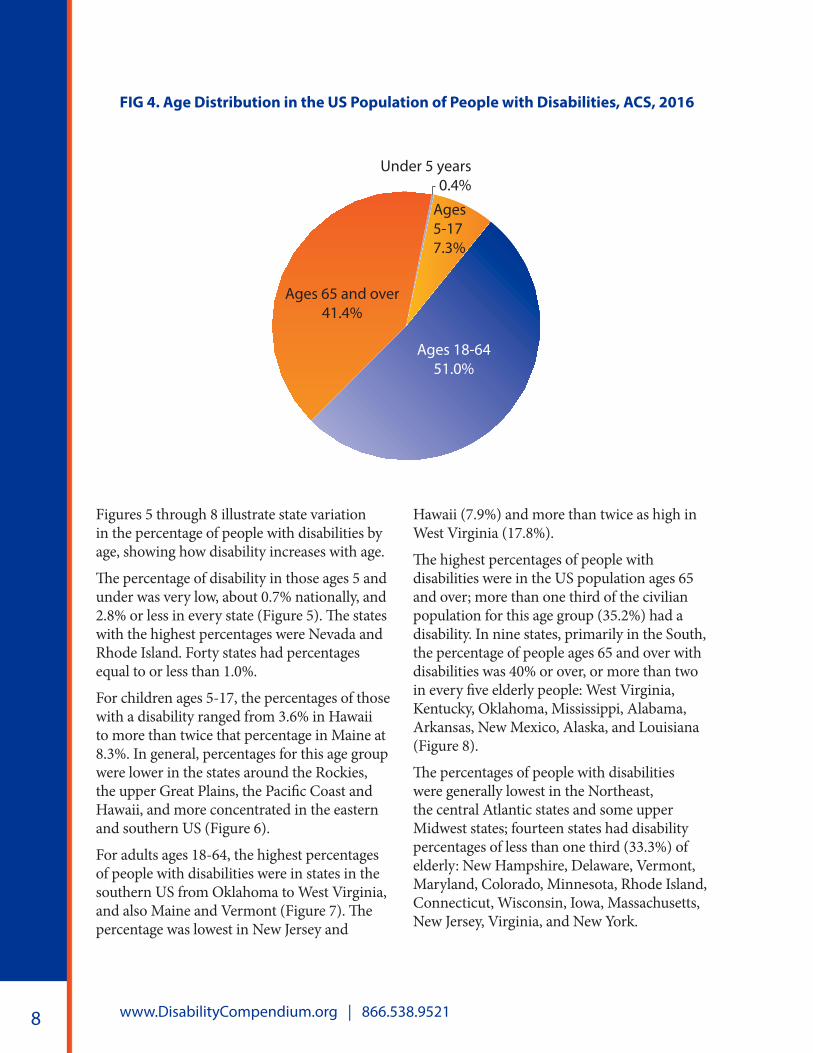
Figure 4 shows the composition of the population of people with disabilities in the US, by age. Of the US population in 2016 with disabilities, over half (51.0%) were people in the working-ages of 18- 64, while 41.4% were 65 and older. Disability in children and youth accounted for only 7.3% (ages 5-17) and 0.4% (under 5 years old).
Percent with Disability in the US Across the Life SpanWhat is the percentage of people with disabilities in different age groups?
FIG 3. Age Distribution of Disability in the US Population, 2016
0%
20%
40%
60%
80%
100%
With Disability Without Disability
Ages 65 and overAges 18-64Ages 5-17Under 5 years
35.2%
10.6%5.6%
0.7%
64.8%
89.4%94.4%
99.3%
www.DisabilityCompendium.org | 866.538.9521 8
FIG 4. Age Distribution in the US Population of People with Disabilities, ACS, 2016
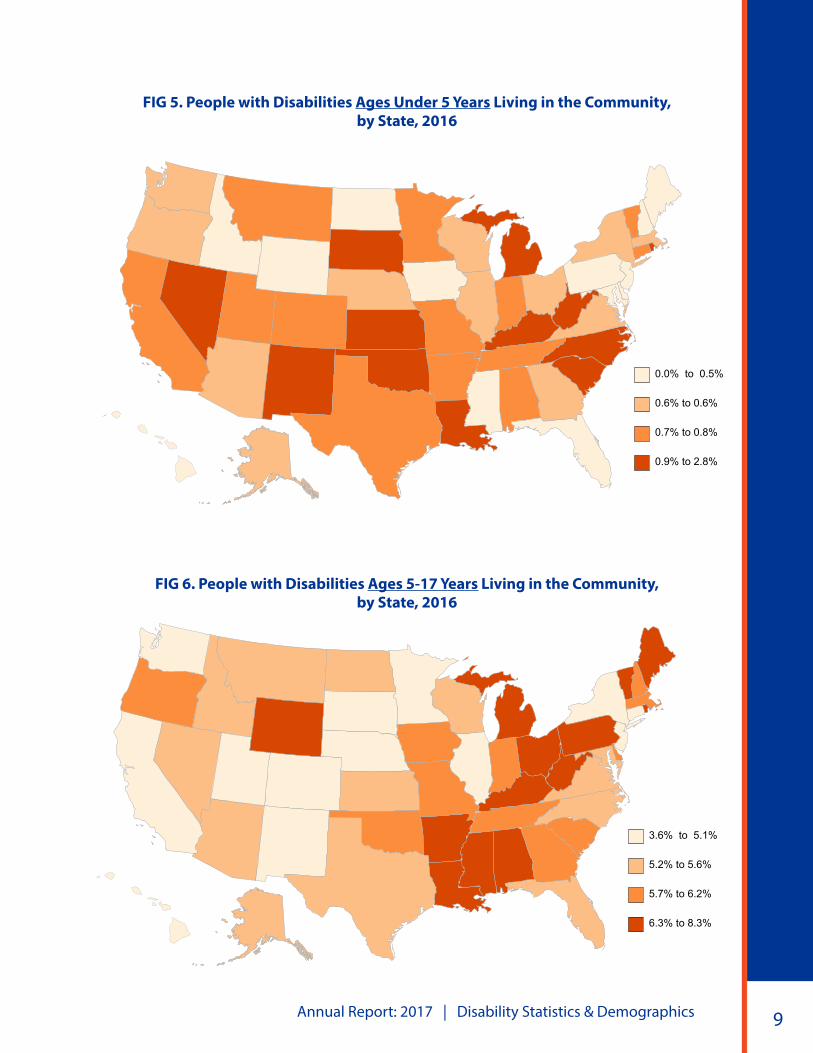
Figures 5 through 8 illustrate state variation in the percentage of people with disabilities by age, showing how disability increases with age.
The percentage of disability in those ages 5 and under was very low, about 0.7% nationally, and 2.8% or less in every state (Figure 5). The states with the highest percentages were Nevada and Rhode Island. Forty states had percentages equal to or less than 1.0%.
For children ages 5-17, the percentages of those with a disability ranged from 3.6% in Hawaii to more than twice that percentage in Maine at 8.3%. In general, percentages for this age group were lower in the states around the Rockies, the upper Great Plains, the Pacific Coast and Hawaii, and more concentrated in the eastern and southern US (Figure 6).
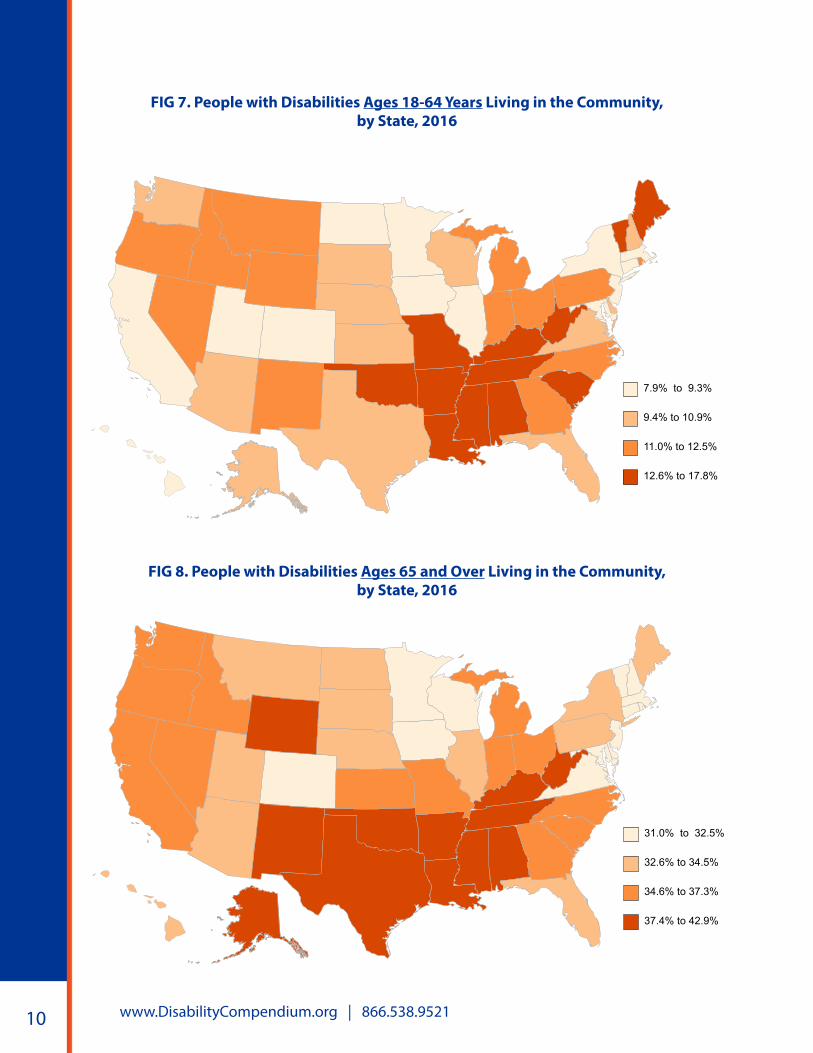
For adults ages 18-64, the highest percentages of people with disabilities were in states in the southern US from Oklahoma to West Virginia, and also Maine and Vermont (Figure 7). The percentage was lowest in New Jersey and
Hawaii (7.9%) and more than twice as high in West Virginia (17.8%).
The highest percentages of people with disabilities were in the US population ages 65 and over; more than one third of the civilian population for this age group (35.2%) had a disability. In nine states, primarily in the South, the percentage of people ages 65 and over with disabilities was 40% or over, or more than two in every five elderly people: West Virginia, Kentucky, Oklahoma, Mississippi, Alabama, Arkansas, New Mexico, Alaska, and Louisiana (Figure 8).
The percentages of people with disabilities were generally lowest in the Northeast, the central Atlantic states and some upper Midwest states; fourteen states had disability percentages of less than one third (33.3%) of elderly: New Hampshire, Delaware, Vermont, Maryland, Colorado, Minnesota, Rhode Island, Connecticut, Wisconsin, Iowa, Massachusetts, New Jersey, Virginia, and New York.
Ages 18-6451.0%
Ages5-177.3%
Under 5 years0.4%
Ages 65 and over41.4%
Annual Report: 2017 | Disability Statistics & Demographics 9
Disability Prevalence 5-17. 2016
3.6% to 5.1%
5.2% to 5.6%
5.7% to 6.2%
6.3% to 8.3%
Disability Prevalence 0-5. 2016
0.0% to 0.5%
0.6% to 0.6%
0.7% to 0.8%
0.9% to 2.8%
FIG 6. People with Disabilities Ages 5-17 Years Living in the Community, by State, 2016
FIG 5. People with Disabilities Ages Under 5 Years Living in the Community, by State, 2016
www.DisabilityCompendium.org | 866.538.9521 10
Disbility Prevalence 65 and Over. 2016
31.0% to 32.5%
32.6% to 34.5%
34.6% to 37.3%
37.4% to 42.9%
T1.6 Disability Prevalence 18-64. 2016
7.9% to 9.3%
9.4% to 10.9%
11.0% to 12.5%
12.6% to 17.8%
FIG 7. People with Disabilities Ages 18-64 Years Living in the Community, by State, 2016
FIG 8. People with Disabilities Ages 65 and Over Living in the Community, by State, 2016
Annual Report: 2017 | Disability Statistics & Demographics 11
2.0%
3.0%
4.0%
5.0%4.5%
6.4%
4.5% 4.5%
6.0%
7.0%
1.0%
Hearing
Vision
Cognitive
Ambulatory
Self-Care
Independent Living
2014 2015 2016201320122011201020092008
4.6% 4.6% 4.7% 4.8% 4.8% 4.8%
6.4% 6.4% 6.5% 6.5% 6.6% 6.6% 6.6%6.7%
4.5%4.4%4.4% 4.5% 4.5%3.6% 3.5%
2.5% 2.5%
2.3% 2.4%
3.6%4.4%4.3%4.2%4.3%
3.6%3.4%3.4%3.4%3.4%3.5%
2.5%
2.3%2.3%
2.5%
2.2%
2.5%2.5%2.4%2.4%2.4%
2.2%2.1%2.1%2.3%
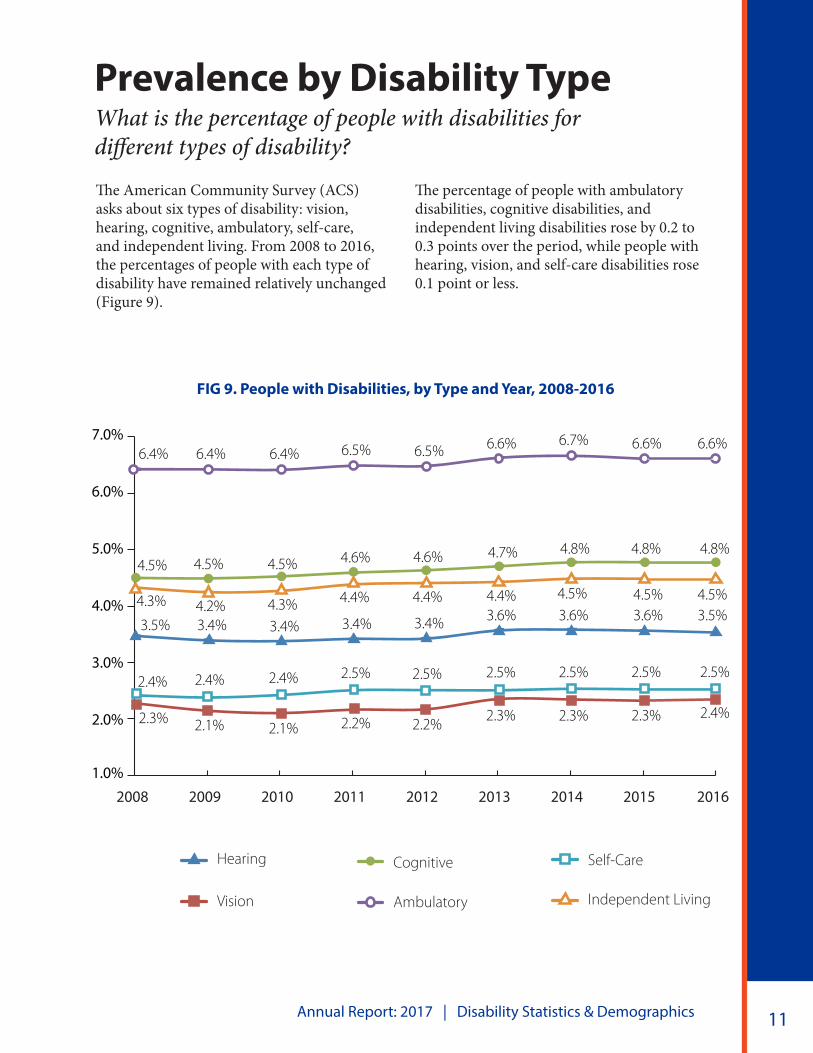
The American Community Survey (ACS) asks about six types of disability: vision, hearing, cognitive, ambulatory, self-care, and independent living. From 2008 to 2016, the percentages of people with each type of disability have remained relatively unchanged (Figure 9).
Prevalence by Disability TypeWhat is the percentage of people with disabilities for different types of disability?
The percentage of people with ambulatory disabilities, cognitive disabilities, and independent living disabilities rose by 0.2 to 0.3 points over the period, while people with hearing, vision, and self-care disabilities rose 0.1 point or less.
FIG 9. People with Disabilities, by Type and Year, 2008-2016
www.DisabilityCompendium.org | 866.538.9521 12
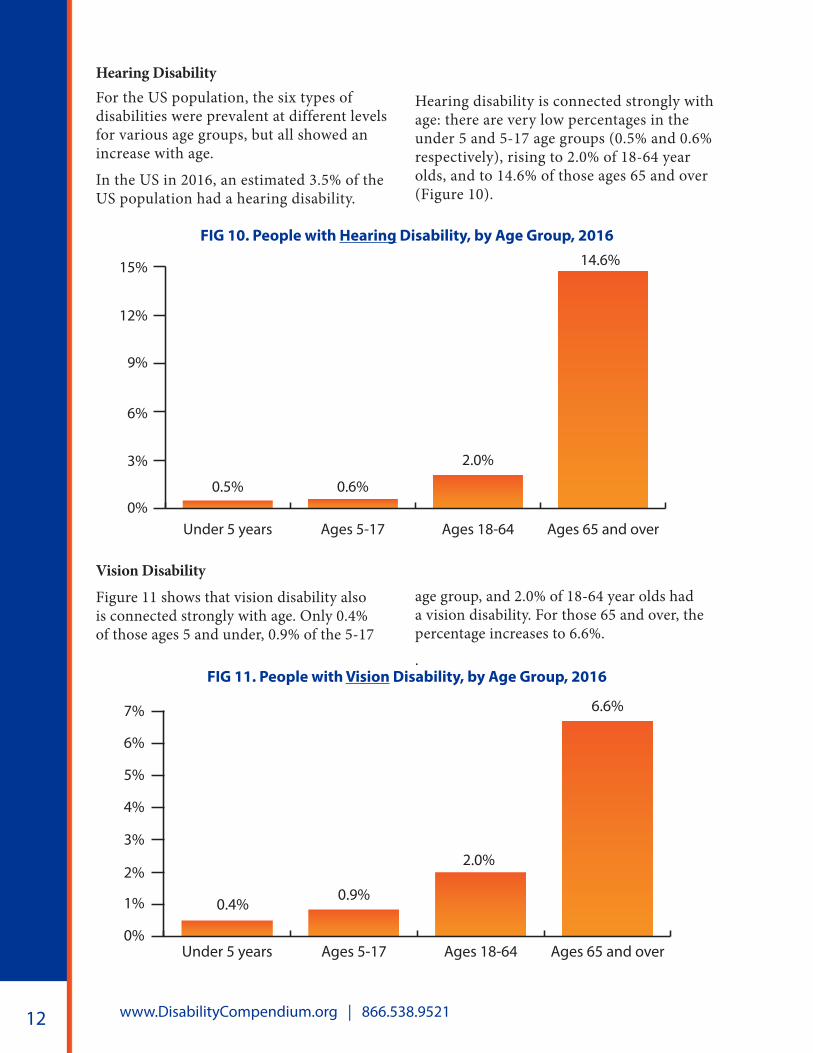
Hearing Disability For the US population, the six types of disabilities were prevalent at different levels for various age groups, but all showed an increase with age.
In the US in 2016, an estimated 3.5% of the US population had a hearing disability.
Vision Disability
Figure 11 shows that vision disability also is connected strongly with age. Only 0.4% of those ages 5 and under, 0.9% of the 5-17
FIG 10. People with Hearing Disability, by Age Group, 2016
FIG 11. People with Vision Disability, by Age Group, 2016
0%
3%
6%
9%
12%
15%
Ages 65 and overAges 18-64Ages 5-17Under 5 years
14.6%
2.0%
0.6%0.5%
Hearing disability is connected strongly with age: there are very low percentages in the under 5 and 5-17 age groups (0.5% and 0.6% respectively), rising to 2.0% of 18-64 year olds, and to 14.6% of those ages 65 and over (Figure 10).
age group, and 2.0% of 18-64 year olds had a vision disability. For those 65 and over, the percentage increases to 6.6%.
.
0%
1%
2%
3%
4%
5%
6%
7%
Ages 65 and overAges 18-64Ages 5-17Under 5 years
6.6%
2.0%
0.9%0.4%
Annual Report: 2017 | Disability Statistics & Demographics 13
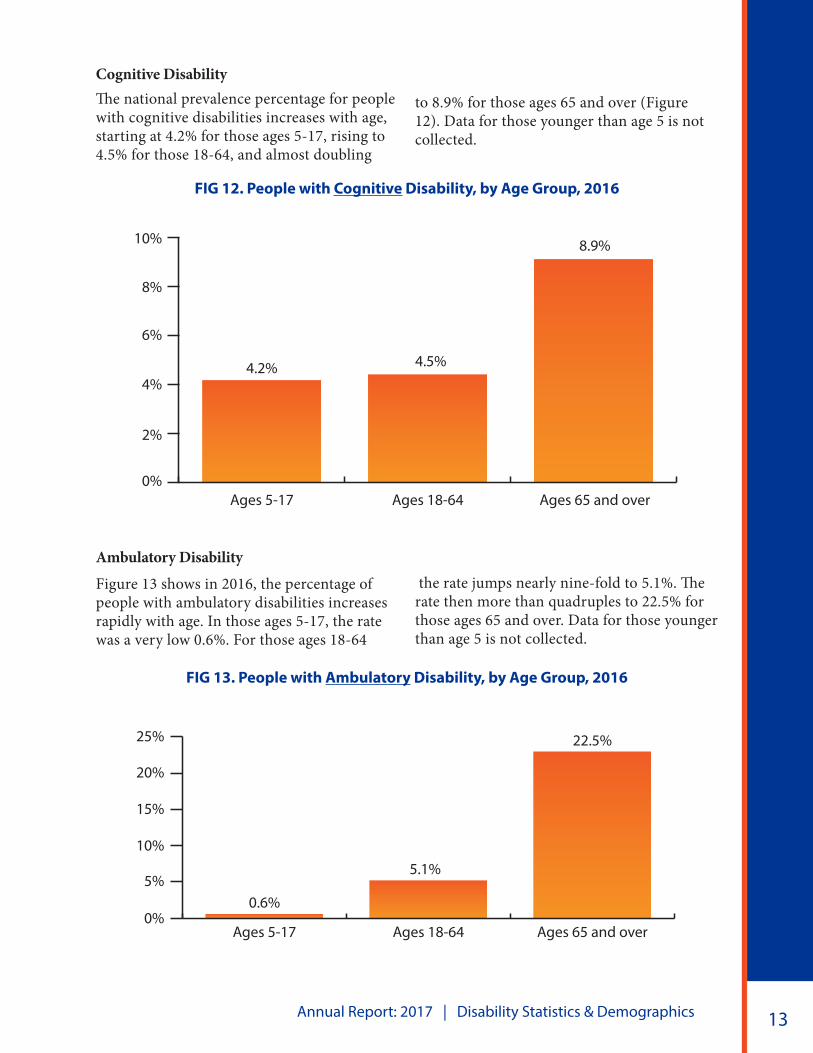
Cognitive Disability The national prevalence percentage for people with cognitive disabilities increases with age, starting at 4.2% for those ages 5-17, rising to 4.5% for those 18-64, and almost doubling
Ambulatory Disability
Figure 13 shows in 2016, the percentage of people with ambulatory disabilities increases rapidly with age. In those ages 5-17, the rate was a very low 0.6%. For those ages 18-64
FIG 12. People with Cognitive Disability, by Age Group, 2016
FIG 13. People with Ambulatory Disability, by Age Group, 2016
to 8.9% for those ages 65 and over (Figure 12). Data for those younger than age 5 is not collected.
the rate jumps nearly nine-fold to 5.1%. The rate then more than quadruples to 22.5% for those ages 65 and over. Data for those younger than age 5 is not collected.
0%
2%
4%
6%
8%
10%
Ages 65 and overAges 18-64Ages 5-17
8.9%
4.5%4.2%
0%
5%
10%
15%
20%
25%
Ages 65 and overAges 18-64Ages 5-17
22.5%
5.1%
0.6%
www.DisabilityCompendium.org | 866.538.9521 14
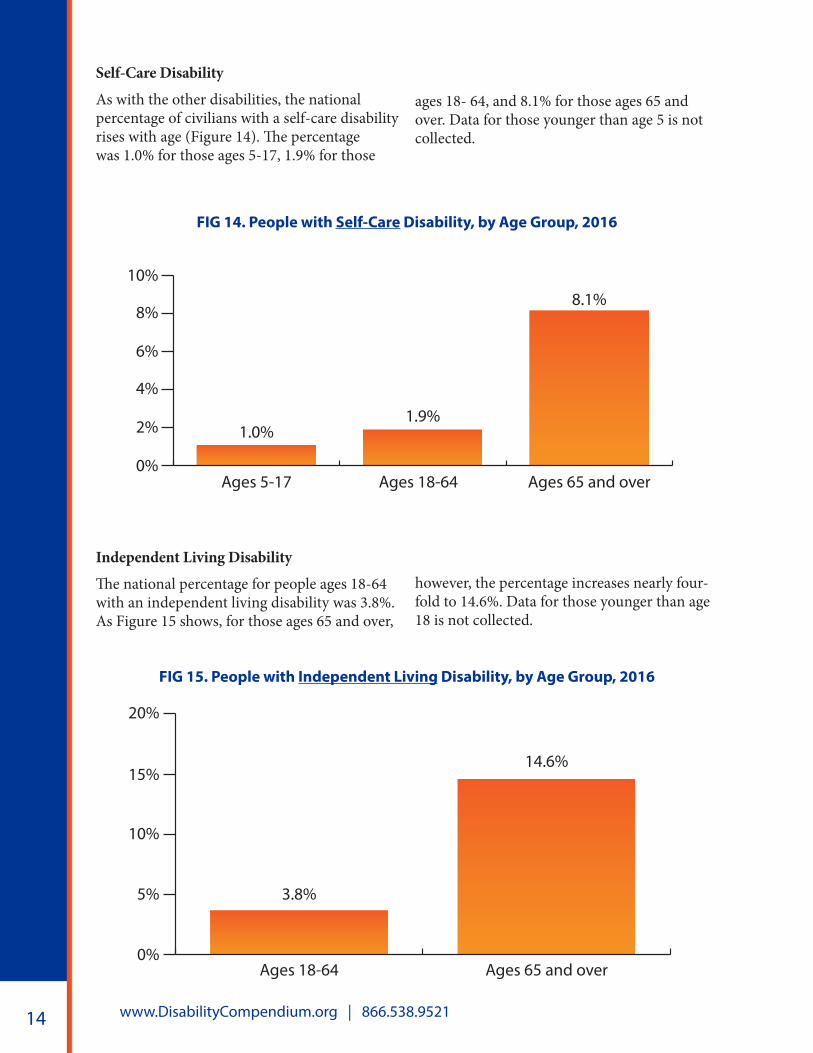
Self-Care Disability
As with the other disabilities, the national percentage of civilians with a self-care disability rises with age (Figure 14). The percentage was 1.0% for those ages 5-17, 1.9% for those
Independent Living Disability
The national percentage for people ages 18-64 with an independent living disability was 3.8%. As Figure 15 shows, for those ages 65 and over,
FIG 14. People with Self-Care Disability, by Age Group, 2016
FIG 15. People with Independent Living Disability, by Age Group, 2016
ages 18- 64, and 8.1% for those ages 65 and over. Data for those younger than age 5 is not collected.
however, the percentage increases nearly four-fold to 14.6%. Data for those younger than age 18 is not collected.
0%
2%
4%
6%
8%
10%
Ages 65 and overAges 18-64Ages 5-17
8.1%
1.9%1.0%
0%
5%
10%
15%
20%
Ages 65 and overAges 18-64
14.6%
3.8%
Annual Report: 2017 | Disability Statistics & Demographics 15
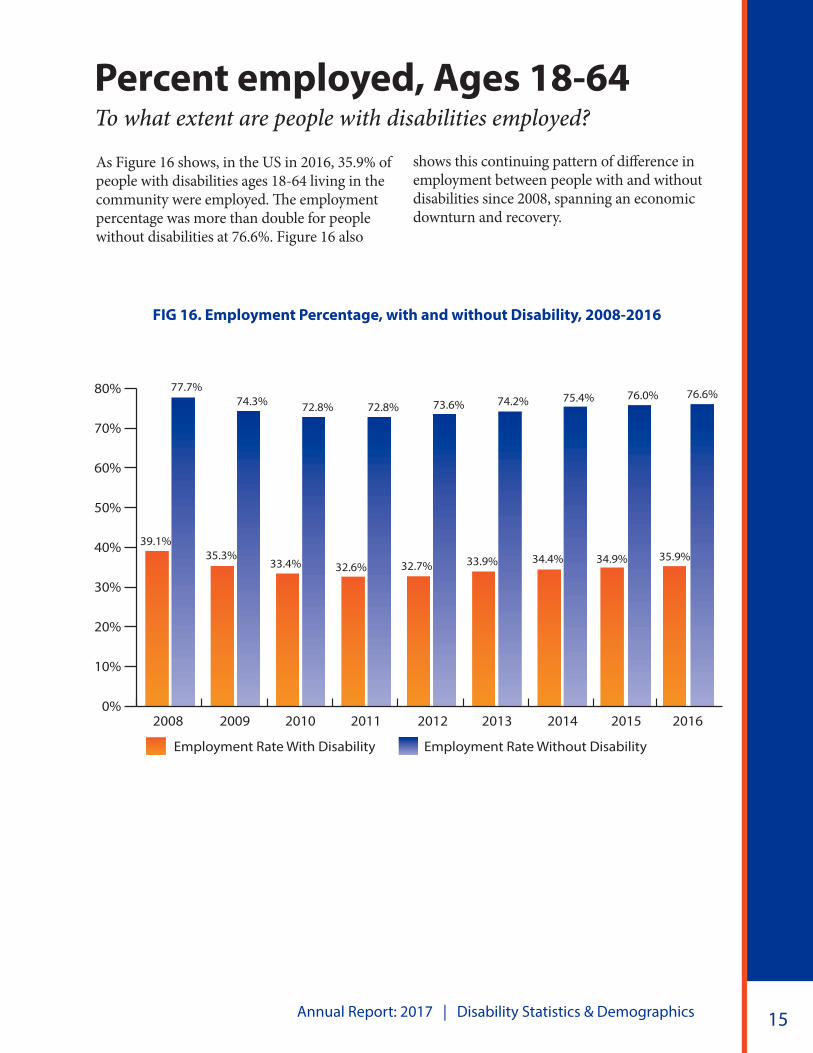
As Figure 16 shows, in the US in 2016, 35.9% of people with disabilities ages 18-64 living in the community were employed. The employment percentage was more than double for people without disabilities at 76.6%. Figure 16 also
shows this continuing pattern of difference in employment between people with and without disabilities since 2008, spanning an economic downturn and recovery.
Percent employed, Ages 18-64To what extent are people with disabilities employed?
FIG 16. Employment Percentage, with and without Disability, 2008-2016
0%
10%
20%
30%
40%
50%
60%
70%
80%
Employment Rate Without DisabilityEmployment Rate With Disability
2014 2015 2016201320122011201020092008
34.4% 34.9% 35.9%33.9%32.7%32.6%33.4%35.3%
39.1%
75.4% 76.0% 76.6%74.2%73.6%72.8%72.8%74.3%77.7%
www.DisabilityCompendium.org | 866.538.9521 16
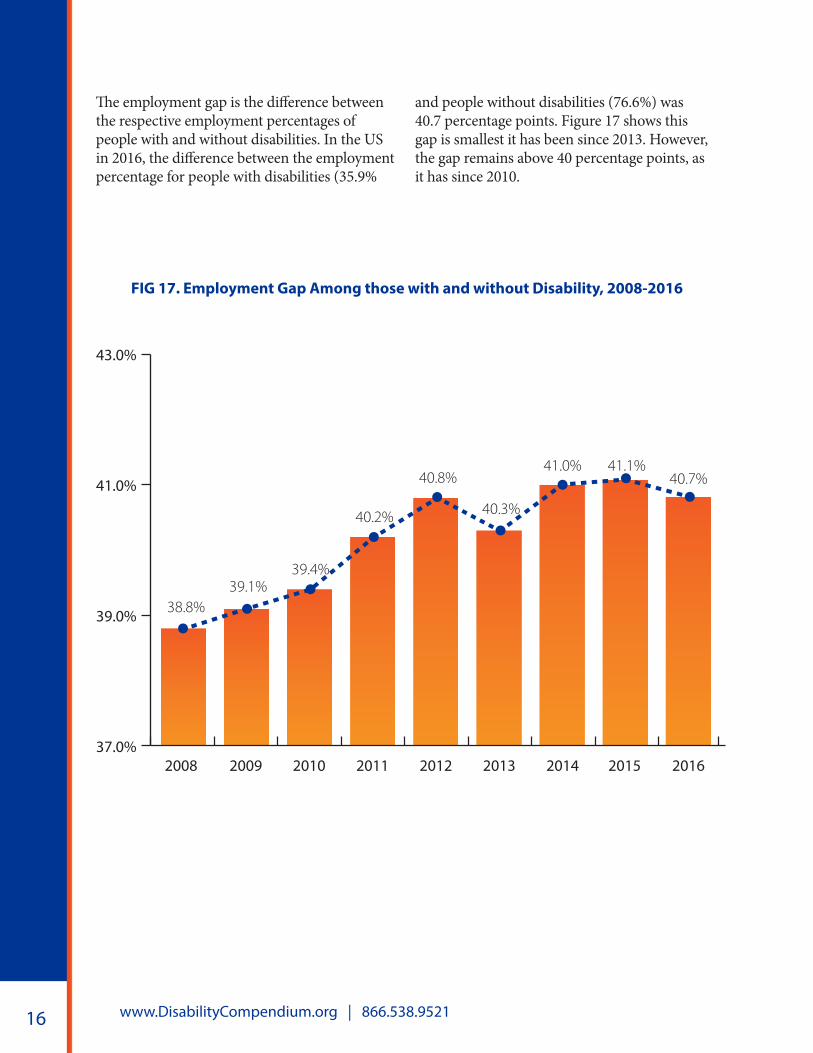
The employment gap is the difference between the respective employment percentages of people with and without disabilities. In the US in 2016, the difference between the employment percentage for people with disabilities (35.9%
FIG 17. Employment Gap Among those with and without Disability, 2008-2016
and people without disabilities (76.6%) was 40.7 percentage points. Figure 17 shows this gap is smallest it has been since 2013. However, the gap remains above 40 percentage points, as it has since 2010.
37.0%
39.0%
41.0%
43.0%
2015 20162014201320122011201020092008
39.1%39.4%
40.2%
40.8%
40.3%
41.0% 41.1%40.7%
38.8%
Annual Report: 2017 | Disability Statistics & Demographics 17
Employment-Non Disability. 2016
70.8% to 75.6%
75.7% to 77.6%
77.7% to 79.6%
79.7% to 84.2%
Employment-Disability. 2016
27.4% to 33.2%
33.3% to 36.6%
36.7% to 41.9%
42.0% to 54.0%
FIG 19. Percent Employed Among People without Disabilities, by State, 2016
FIG 18. Percent Employed Among People with Disabilities, by State, 2016
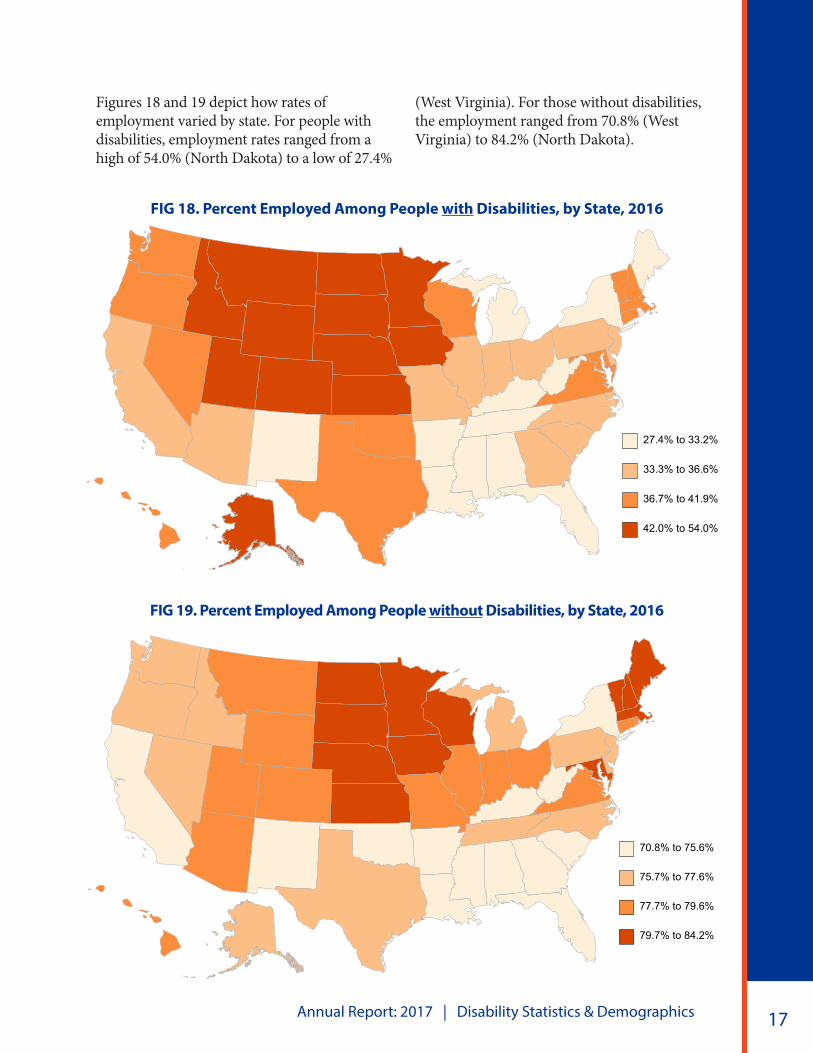
Figures 18 and 19 depict how rates of employment varied by state. For people with disabilities, employment rates ranged from a high of 54.0% (North Dakota) to a low of 27.4%
(West Virginia). For those without disabilities, the employment ranged from 70.8% (West Virginia) to 84.2% (North Dakota).
www.DisabilityCompendium.org | 866.538.9521 18
Employment Gap. 2016
19.9% to 28.3%
28.4% to 32.0%
32.1% to 33.3%
33.4% to 39.5%
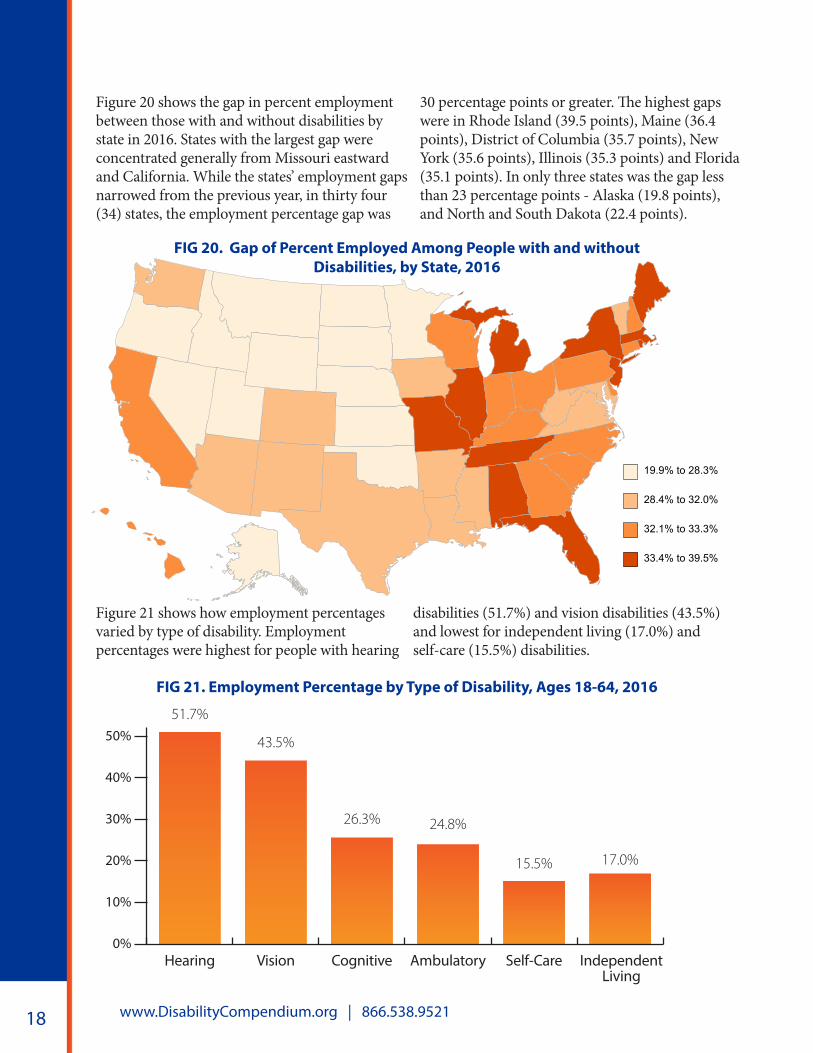
Figure 20 shows the gap in percent employment between those with and without disabilities by state in 2016. States with the largest gap were concentrated generally from Missouri eastward and California. While the states’ employment gaps narrowed from the previous year, in thirty four (34) states, the employment percentage gap was
Figure 21 shows how employment percentages varied by type of disability. Employment percentages were highest for people with hearing
30 percentage points or greater. The highest gaps were in Rhode Island (39.5 points), Maine (36.4 points), District of Columbia (35.7 points), New York (35.6 points), Illinois (35.3 points) and Florida (35.1 points). In only three states was the gap less than 23 percentage points - Alaska (19.8 points), and North and South Dakota (22.4 points).
disabilities (51.7%) and vision disabilities (43.5%) and lowest for independent living (17.0%) and self-care (15.5%) disabilities.
FIG 21. Employment Percentage by Type of Disability, Ages 18-64, 2016
FIG 20. Gap of Percent Employed Among People with and without Disabilities, by State, 2016
0%
10%
20%
30%
40%
50%
IndependentLiving
Self-CareAmbulatoryCognitiveVisionHearing
17.0%15.5%
24.8%26.3%
43.5%
51.7%
Annual Report: 2017 | Disability Statistics & Demographics 19
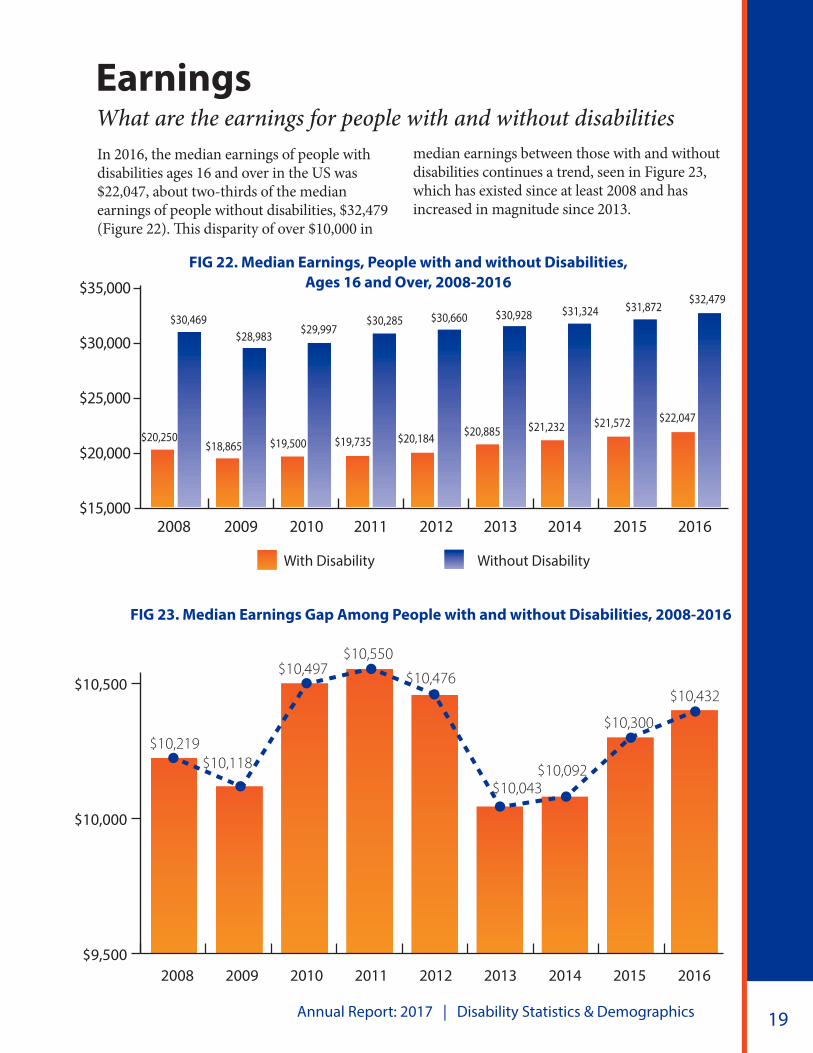
In 2016, the median earnings of people with disabilities ages 16 and over in the US was $22,047, about two-thirds of the median earnings of people without disabilities, $32,479 (Figure 22). This disparity of over $10,000 in
median earnings between those with and without disabilities continues a trend, seen in Figure 23, which has existed since at least 2008 and has increased in magnitude since 2013.
EarningsWhat are the earnings for people with and without disabilities
FIG 22. Median Earnings, People with and without Disabilities, Ages 16 and Over, 2008-2016
FIG 23. Median Earnings Gap Among People with and without Disabilities, 2008-2016
$9,500
$10,000
$10,500
$11,000
2015 20162014201320122011201020092008
$10,118
$10,497$10,550
$10,476
$10,043$10,092
$10,300
$10,432
$10,219
�g 23 gap
$15,000
$20,000
$25,000
$30,000
$35,000
$21,232 $21,572 $22,047$20,885$20,184$19,735$19,500$18,865
$20,250
$31,324 $31,872$32,479
$30,928$30,660$30,285$29,997$28,983
$30,469
Without DisabilityWith Disability
2014 2015 2016201320122011201020092008
www.DisabilityCompendium.org | 866.538.9521 20
Median Earnings with Disability. 2016
$17,480 to $20,652
$20,653 to $21,964
$21,965 to $23,873
$23,874 to $30,559
FIG 25. State Median Earnings, Past 12 Months, Ages 16 and Over without Disability, 2016
FIG 24. State Median Earnings, Past 12 Months, Ages 16 and Over with Disability, 2016
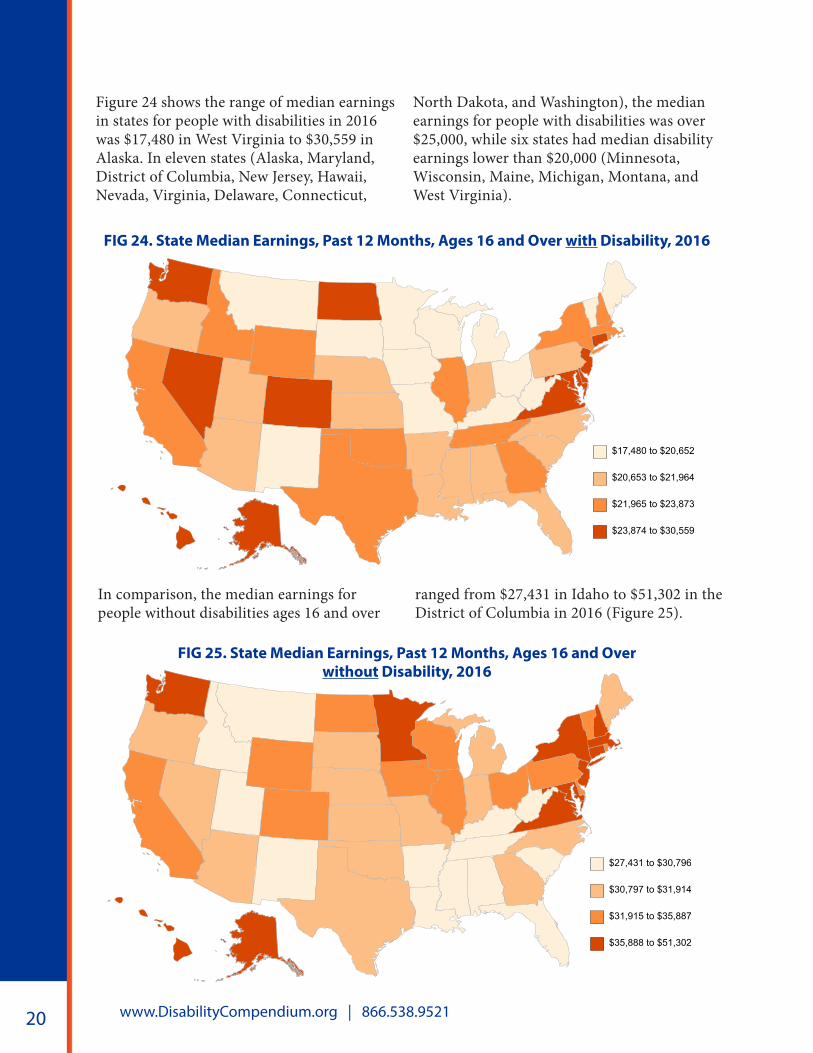
Figure 24 shows the range of median earnings in states for people with disabilities in 2016 was $17,480 in West Virginia to $30,559 in Alaska. In eleven states (Alaska, Maryland, District of Columbia, New Jersey, Hawaii, Nevada, Virginia, Delaware, Connecticut,
In comparison, the median earnings for people without disabilities ages 16 and over
North Dakota, and Washington), the median earnings for people with disabilities was over $25,000, while six states had median disability earnings lower than $20,000 (Minnesota, Wisconsin, Maine, Michigan, Montana, and West Virginia).
ranged from $27,431 in Idaho to $51,302 in the District of Columbia in 2016 (Figure 25).
Median Earnings without Disability. 2016
$27,431 to $30,796
$30,797 to $31,914
$31,915 to $35,887
$35,888 to $51,302
Annual Report: 2017 | Disability Statistics & Demographics 21
Median Earnings Gap. 2016
$5,242 to $9,057
$9,058 to $10,653
$10,654 to $12,148
$12,149 to $23,144
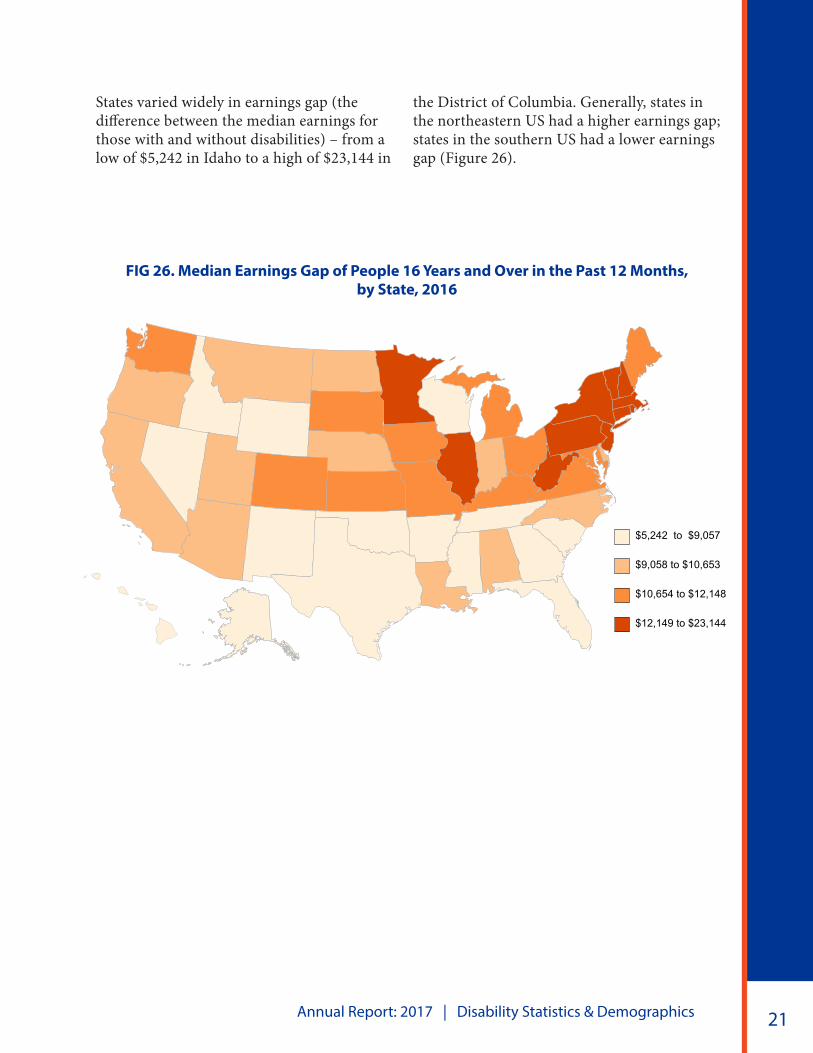
FIG 26. Median Earnings Gap of People 16 Years and Over in the Past 12 Months, by State, 2016
States varied widely in earnings gap (the difference between the median earnings for those with and without disabilities) – from a low of $5,242 in Idaho to a high of $23,144 in
the District of Columbia. Generally, states in the northeastern US had a higher earnings gap; states in the southern US had a lower earnings gap (Figure 26).

www.DisabilityCompendium.org | 866.538.9521 22
Annual Report: 2017 | Disability Statistics & Demographics 23
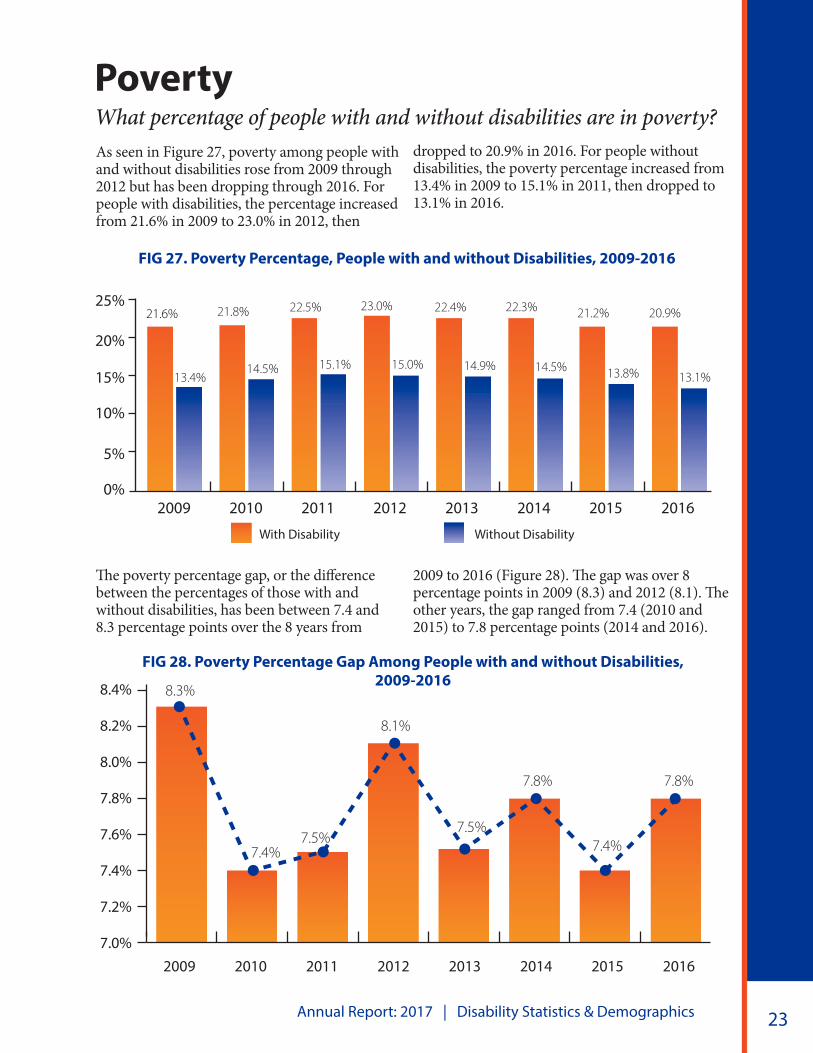
As seen in Figure 27, poverty among people with and without disabilities rose from 2009 through 2012 but has been dropping through 2016. For people with disabilities, the percentage increased from 21.6% in 2009 to 23.0% in 2012, then
dropped to 20.9% in 2016. For people without disabilities, the poverty percentage increased from 13.4% in 2009 to 15.1% in 2011, then dropped to 13.1% in 2016.
PovertyWhat percentage of people with and without disabilities are in poverty?
FIG 27. Poverty Percentage, People with and without Disabilities, 2009-2016
The poverty percentage gap, or the difference between the percentages of those with and without disabilities, has been between 7.4 and 8.3 percentage points over the 8 years from
2009 to 2016 (Figure 28). The gap was over 8 percentage points in 2009 (8.3) and 2012 (8.1). The other years, the gap ranged from 7.4 (2010 and 2015) to 7.8 percentage points (2014 and 2016).
FIG 28. Poverty Percentage Gap Among People with and without Disabilities, 2009-2016
7.0%
7.2%
7.4%
7.6%
7.8%
8.0%
8.2%
8.4%
2015 2016201420132012201120102009
7.4%7.5%
8.1%
7.5%
7.8%
7.4%
8.3%
7.8%
�g 28 gap
Without DisabilityWith Disability
2014 2015 201620132012201120102009
22.3% 21.2%22.4%23.0%22.5%21.8%21.6%
14.5% 13.8%
20.9%
13.1%14.9%15.0%15.1%14.5%
13.4%
0%
5%
10%
15%
20%
25%
www.DisabilityCompendium.org | 866.538.9521 24
Poverty Gap - Civilians with Disabilities Under Age 5. 2016
-25.5% to -5.1%
-5.0% to 6.4%
6.5% to 18.6%
18.7% to 60.3%
Poverty Gap. 2016
1.5% to 5.8%
5.9% to 7.1%
7.2% to 8.9%
9.0% to 14.0%
FIG 29. Poverty Percentage Gap Among People with and without Disabilities, by State, 2016
FIG 30. Poverty Percentage Gap Among People Ages 5 and Under with and without Disabilities, by State, 2016
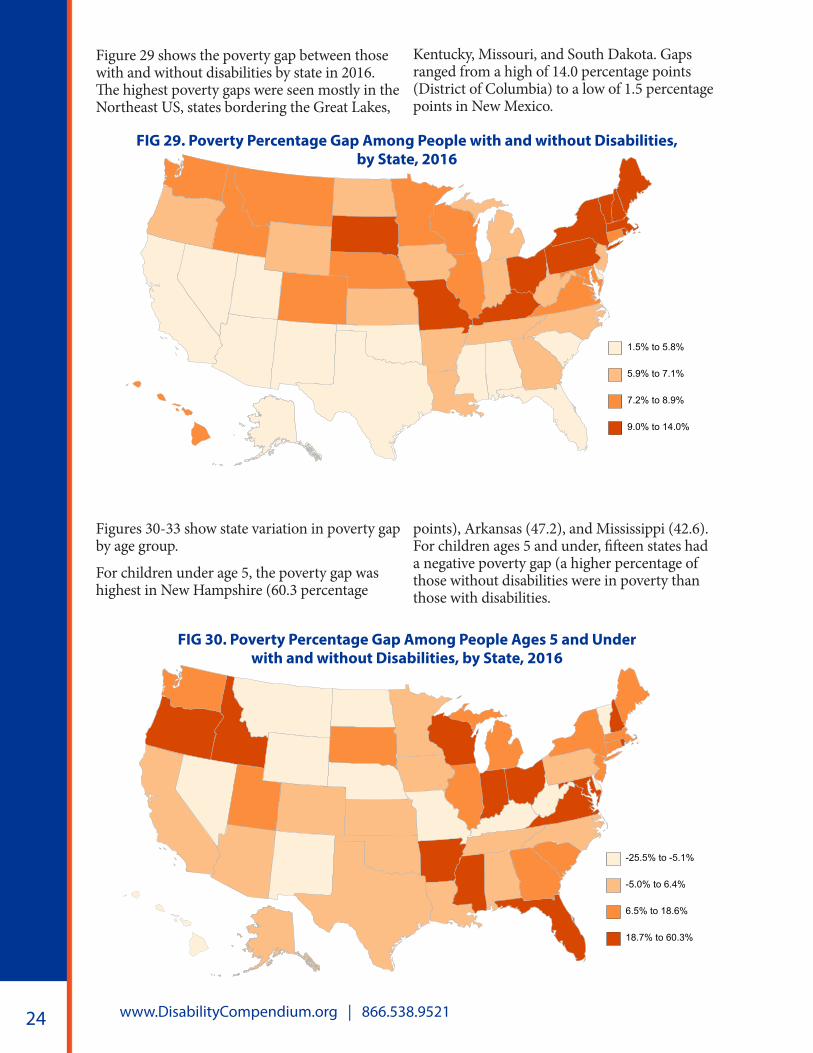
Figure 29 shows the poverty gap between those with and without disabilities by state in 2016. The highest poverty gaps were seen mostly in the Northeast US, states bordering the Great Lakes,
Kentucky, Missouri, and South Dakota. Gaps ranged from a high of 14.0 percentage points (District of Columbia) to a low of 1.5 percentage points in New Mexico.
Figures 30-33 show state variation in poverty gap by age group.
For children under age 5, the poverty gap was highest in New Hampshire (60.3 percentage
points), Arkansas (47.2), and Mississippi (42.6). For children ages 5 and under, fifteen states had a negative poverty gap (a higher percentage of those without disabilities were in poverty than those with disabilities.
Annual Report: 2017 | Disability Statistics & Demographics 25
Poverty Gap - with Disabilities Ages 18-64 Years. 2016
7.4% to 12.9%
13.0% to 14.9%
15.0% to 16.4%
16.5% to 24.8%
Poverty Gap - Civilians with Disabilities Ages 5-17 Years. 2016
1.3% to 8.3%
8.4% to 10.4%
10.5% to 13.2%
13.3% to 19.0%
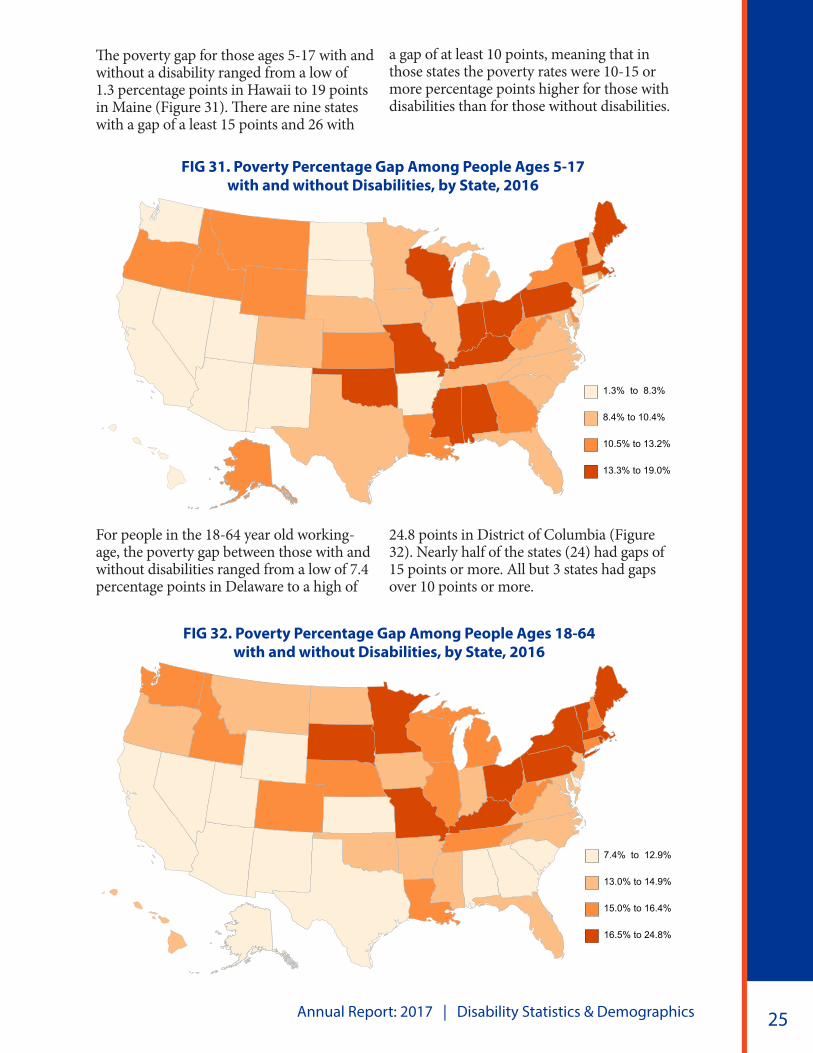
FIG 31. Poverty Percentage Gap Among People Ages 5-17 with and without Disabilities, by State, 2016
The poverty gap for those ages 5-17 with and without a disability ranged from a low of 1.3 percentage points in Hawaii to 19 points in Maine (Figure 31). There are nine states with a gap of a least 15 points and 26 with
a gap of at least 10 points, meaning that in those states the poverty rates were 10-15 or more percentage points higher for those with disabilities than for those without disabilities.
For people in the 18-64 year old working- age, the poverty gap between those with and without disabilities ranged from a low of 7.4 percentage points in Delaware to a high of
24.8 points in District of Columbia (Figure 32). Nearly half of the states (24) had gaps of 15 points or more. All but 3 states had gaps over 10 points or more.
FIG 32. Poverty Percentage Gap Among People Ages 18-64 with and without Disabilities, by State, 2016
www.DisabilityCompendium.org | 866.538.9521 26
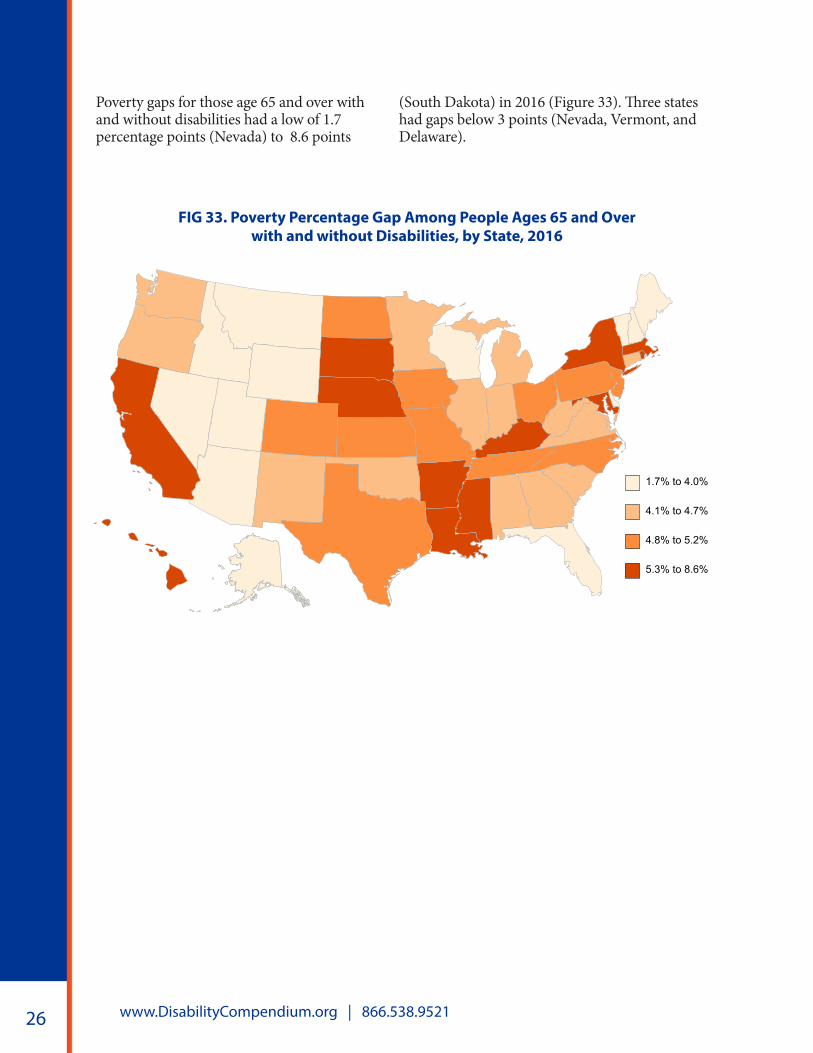
FIG 33. Poverty Percentage Gap Among People Ages 65 and Over with and without Disabilities, by State, 2016
Poverty gaps for those age 65 and over with and without disabilities had a low of 1.7 percentage points (Nevada) to 8.6 points
(South Dakota) in 2016 (Figure 33). Three states had gaps below 3 points (Nevada, Vermont, and Delaware).
Poverty Gap - with Disabilities Ages 65 and Over. 2016
1.7% to 4.0%
4.1% to 4.7%
4.8% to 5.2%
5.3% to 8.6%
Annual Report: 2017 | Disability Statistics & Demographics 27
Smoking
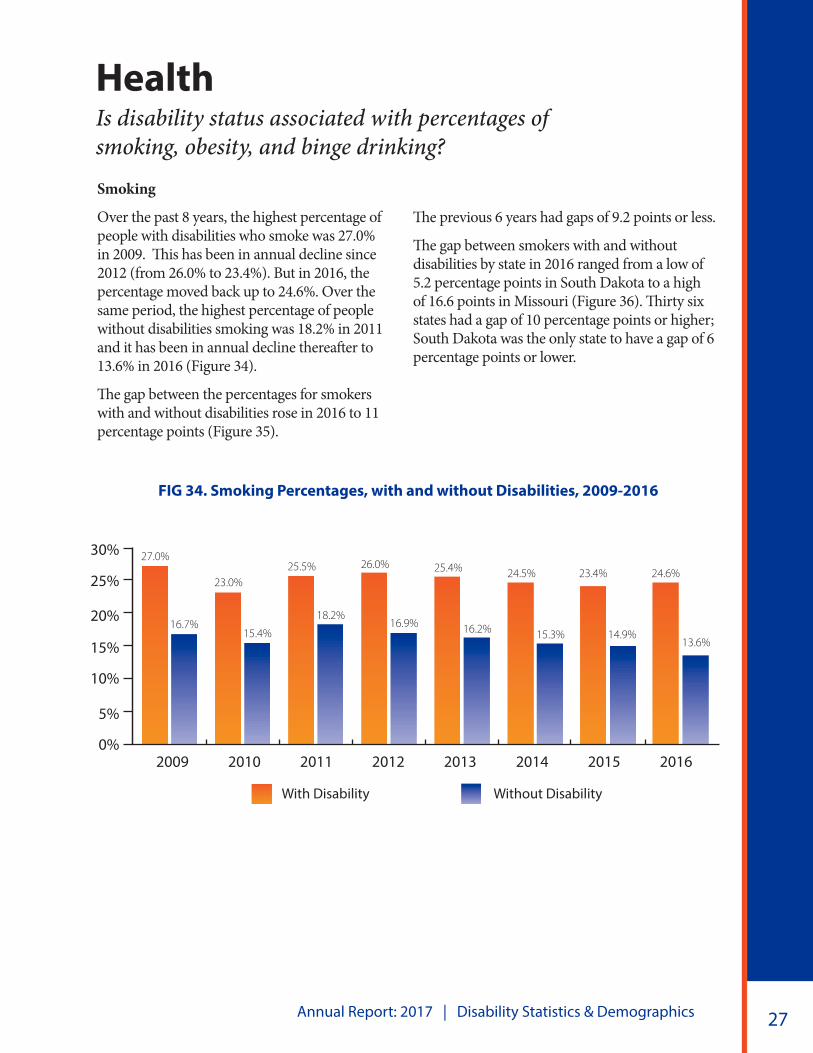
Over the past 8 years, the highest percentage of people with disabilities who smoke was 27.0% in 2009. This has been in annual decline since 2012 (from 26.0% to 23.4%). But in 2016, the percentage moved back up to 24.6%. Over the same period, the highest percentage of people without disabilities smoking was 18.2% in 2011 and it has been in annual decline thereafter to 13.6% in 2016 (Figure 34).
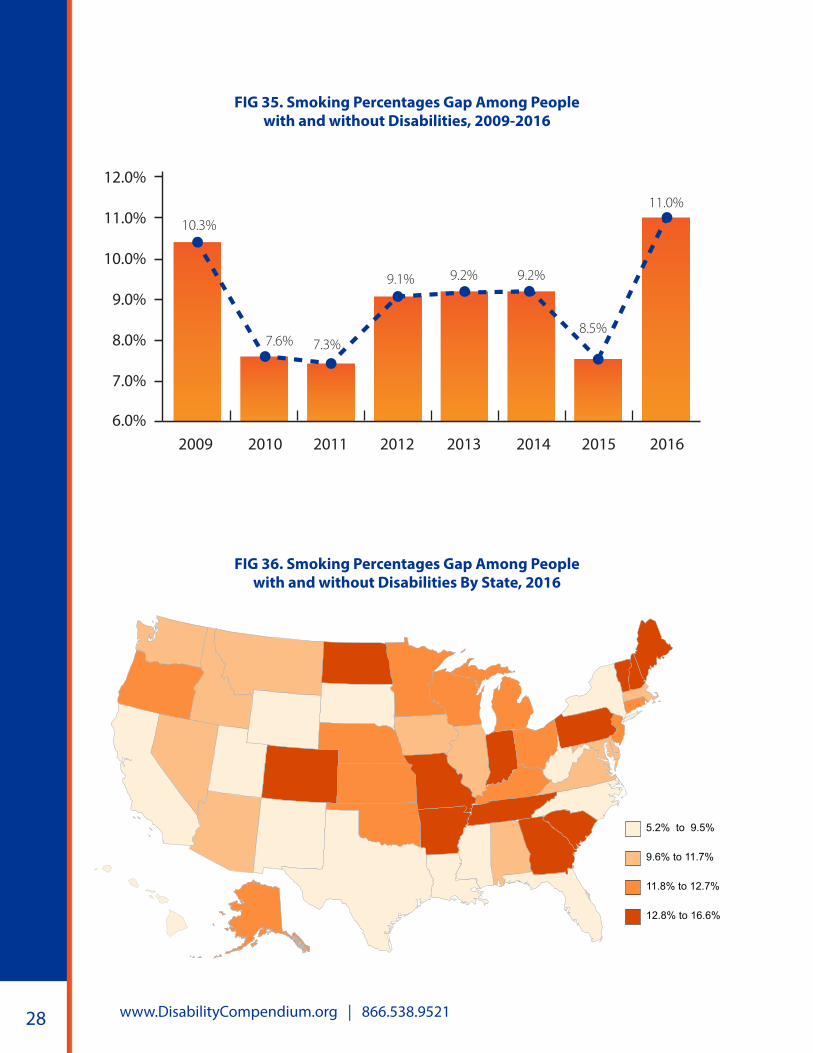
The gap between the percentages for smokers with and without disabilities rose in 2016 to 11 percentage points (Figure 35).
The previous 6 years had gaps of 9.2 points or less.
The gap between smokers with and without disabilities by state in 2016 ranged from a low of 5.2 percentage points in South Dakota to a high of 16.6 points in Missouri (Figure 36). Thirty six states had a gap of 10 percentage points or higher; South Dakota was the only state to have a gap of 6 percentage points or lower.
HealthIs disability status associated with percentages of smoking, obesity, and binge drinking?
FIG 34. Smoking Percentages, with and without Disabilities, 2009-2016
Without DisabilityWith Disability
2014 2015 201620132012201120102009
24.5% 24.6%23.4%25.4%26.0%25.5%23.0%
27.0%
15.3% 14.9%13.6%
16.2%16.9%18.2%
15.4%16.7%
0%
5%
10%
15%
20%
25%
30%
www.DisabilityCompendium.org | 866.538.9521 28
Smoking Gap, 2016
5.2% to 9.5%
9.6% to 11.7%
11.8% to 12.7%
12.8% to 16.6%
FIG 36. Smoking Percentages Gap Among People with and without Disabilities By State, 2016
FIG 35. Smoking Percentages Gap Among People with and without Disabilities, 2009-2016
6.0%
7.0%
8.0%
9.0%
10.0%
11.0%
12.0%
2015 2016201420132012201120102009
7.6% 7.3%
9.1% 9.2% 9.2%
8.5%
11.0%
10.3%
�g 35 gap
Annual Report: 2017 | Disability Statistics & Demographics 29
Obesity
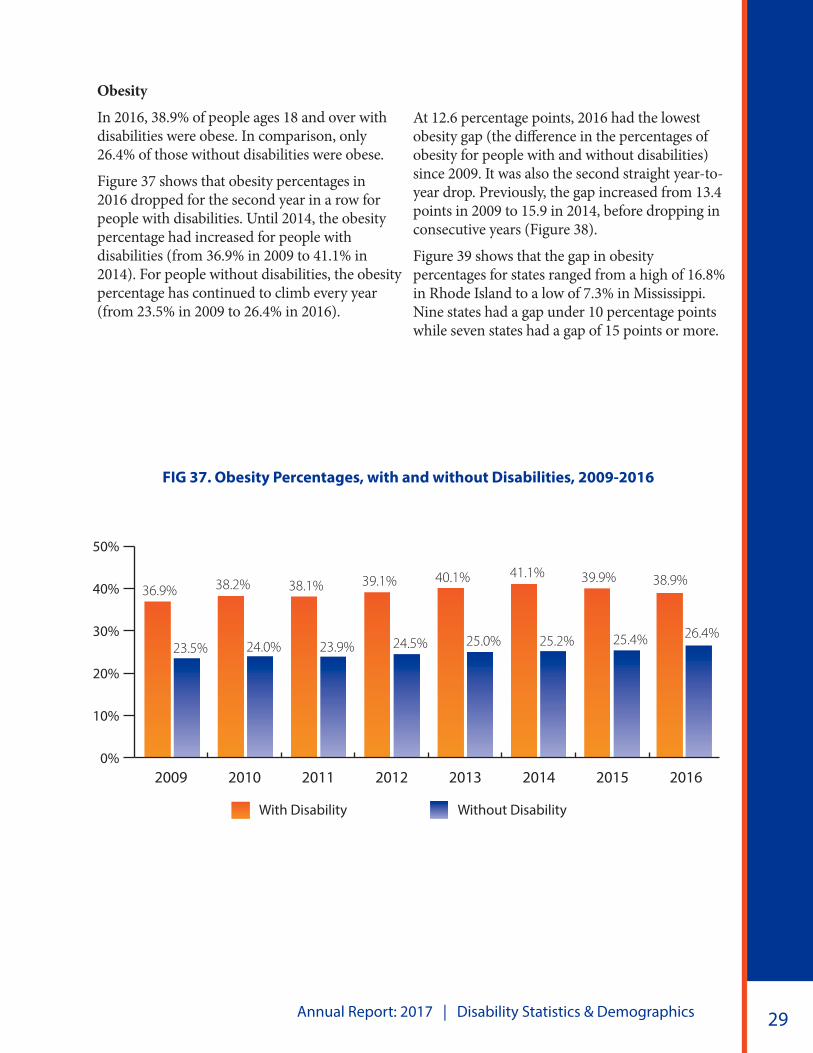
In 2016, 38.9% of people ages 18 and over with disabilities were obese. In comparison, only 26.4% of those without disabilities were obese.
Figure 37 shows that obesity percentages in 2016 dropped for the second year in a row for people with disabilities. Until 2014, the obesity percentage had increased for people with disabilities (from 36.9% in 2009 to 41.1% in 2014). For people without disabilities, the obesity percentage has continued to climb every year (from 23.5% in 2009 to 26.4% in 2016).
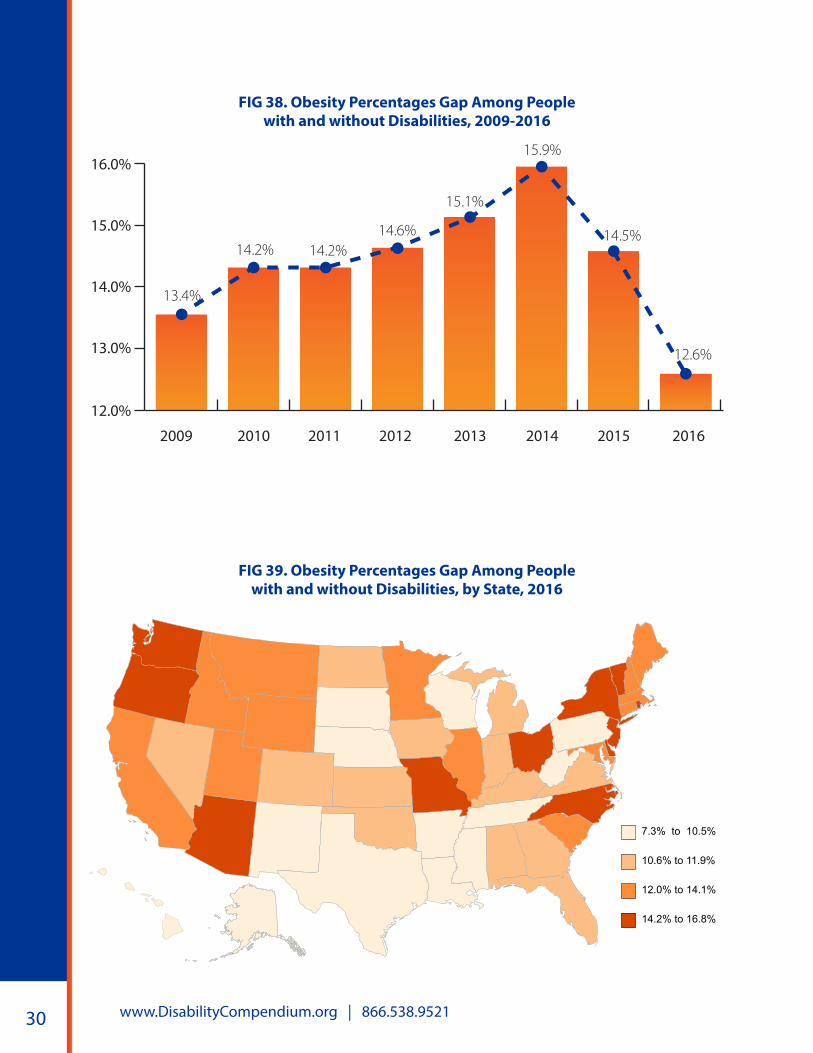
At 12.6 percentage points, 2016 had the lowest obesity gap (the difference in the percentages of obesity for people with and without disabilities) since 2009. It was also the second straight year-to-year drop. Previously, the gap increased from 13.4 points in 2009 to 15.9 in 2014, before dropping in consecutive years (Figure 38).
Figure 39 shows that the gap in obesity percentages for states ranged from a high of 16.8% in Rhode Island to a low of 7.3% in Mississippi. Nine states had a gap under 10 percentage points while seven states had a gap of 15 points or more.
FIG 37. Obesity Percentages, with and without Disabilities, 2009-2016
Without Disability
0%
10%
20%
30%
40%
50%
Without DisabilityWith Disability
2014 2016201520132012201120102009
41.1% 39.9%40.1%39.1%38.1%38.2%36.9%
25.2% 25.4%
38.9%
26.4%25.0%24.5%23.9%24.0%23.5%
www.DisabilityCompendium.org | 866.538.9521 30
Obesity Gap, 2016
7.3% to 10.5%
10.6% to 11.9%
12.0% to 14.1%
14.2% to 16.8%
FIG 39. Obesity Percentages Gap Among People with and without Disabilities, by State, 2016
FIG 38. Obesity Percentages Gap Among People with and without Disabilities, 2009-2016
13.0%
14.0%
15.0%
16.0%
12.0%
20162015201420132012201120102009
14.2% 14.2%14.6%
15.1%
15.9%
14.5%
12.6%
13.4%
�g 38 gap
Annual Report: 2017 | Disability Statistics & Demographics 31
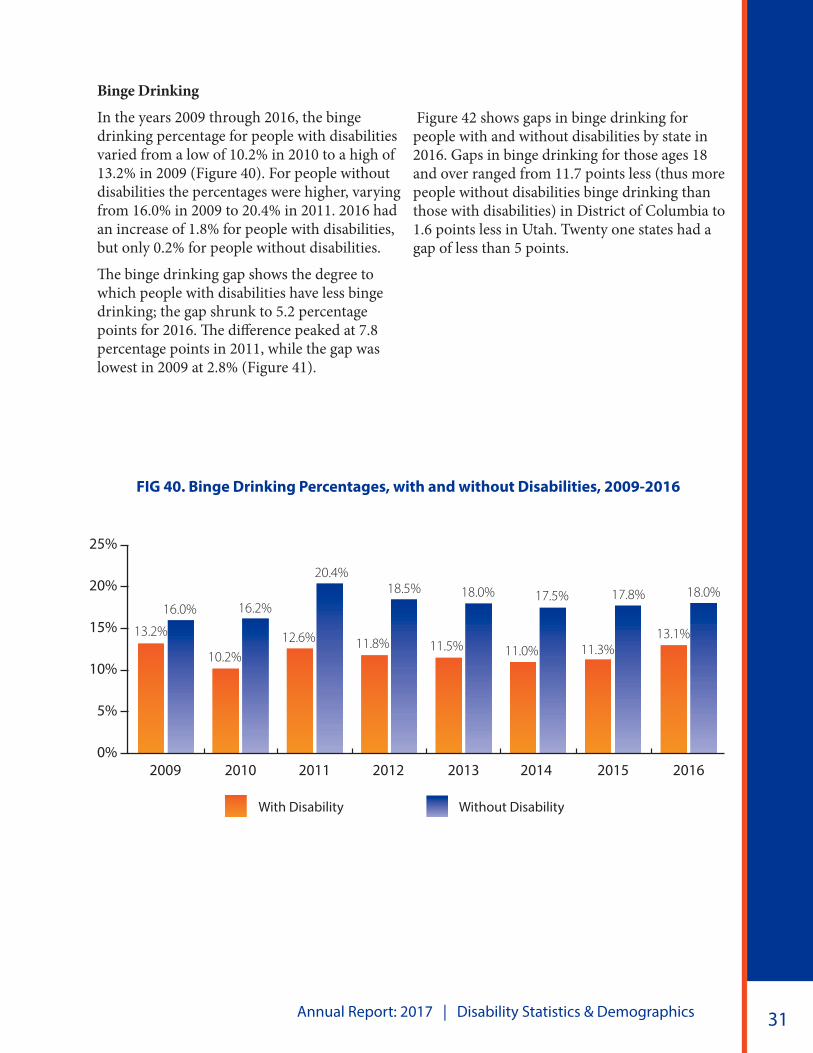
Binge Drinking
In the years 2009 through 2016, the binge drinking percentage for people with disabilities varied from a low of 10.2% in 2010 to a high of 13.2% in 2009 (Figure 40). For people without disabilities the percentages were higher, varying from 16.0% in 2009 to 20.4% in 2011. 2016 had an increase of 1.8% for people with disabilities, but only 0.2% for people without disabilities.
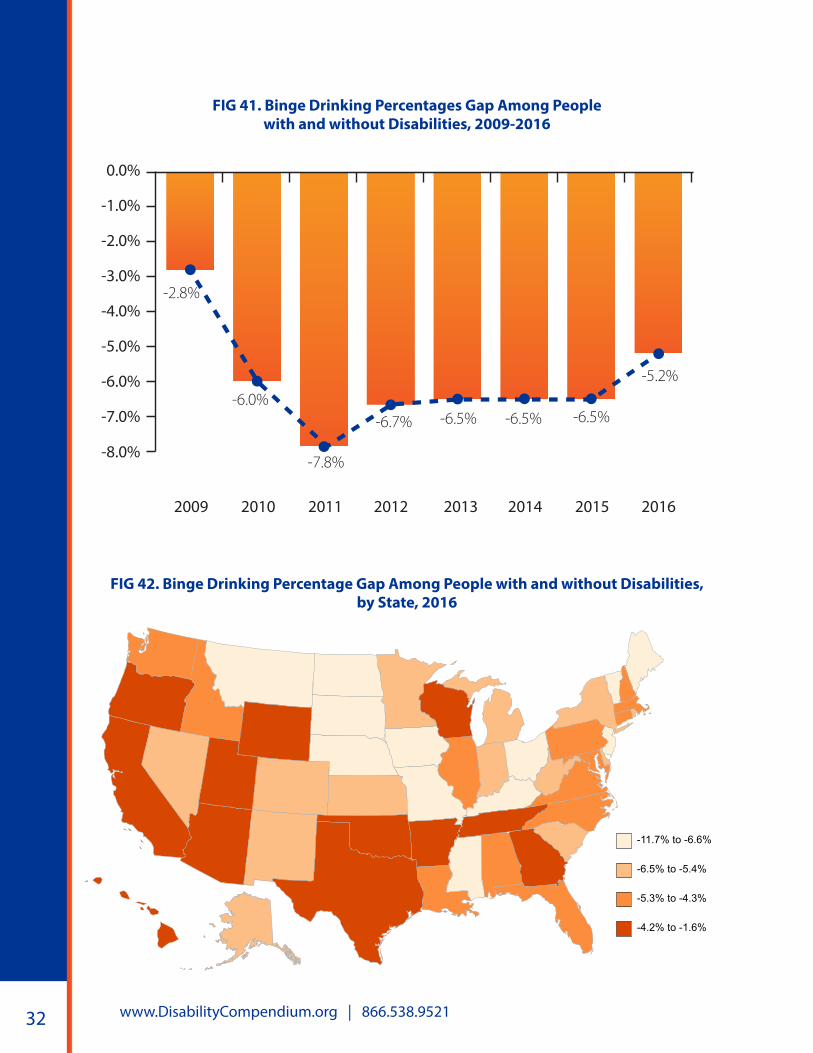
The binge drinking gap shows the degree to which people with disabilities have less binge drinking; the gap shrunk to 5.2 percentage points for 2016. The difference peaked at 7.8 percentage points in 2011, while the gap was lowest in 2009 at 2.8% (Figure 41).
Figure 42 shows gaps in binge drinking for people with and without disabilities by state in 2016. Gaps in binge drinking for those ages 18 and over ranged from 11.7 points less (thus more people without disabilities binge drinking than those with disabilities) in District of Columbia to 1.6 points less in Utah. Twenty one states had a gap of less than 5 points.
FIG 40. Binge Drinking Percentages, with and without Disabilities, 2009-2016
0%
5%
10%
15%
20%
25%
Without DisabilityWith Disability
2014 2015 201620132012201120102009
11.0% 11.3%11.5%11.8%12.6%10.2%
13.2%
17.5% 17.8%
13.1%
18.0%18.0%18.5%20.4%
16.2%16.0%
www.DisabilityCompendium.org | 866.538.9521 32
Binge Drinking Gap, 2016
-11.7% to -6.6%
-6.5% to -5.4%
-5.3% to -4.3%
-4.2% to -1.6%
FIG 41. Binge Drinking Percentages Gap Among People with and without Disabilities, 2009-2016
FIG 42. Binge Drinking Percentage Gap Among People with and without Disabilities, by State, 2016
-7.0%
-8.0%
-6.0%
-5.0%
-4.0%
-3.0%
-2.0%
-1.0%
0.0%
2015 2016201420132012201120102009
-6.0%
-7.8%
-6.7% -6.5% -6.5% -6.5%
-5.2%
-2.8%
�g 41 gap
Annual Report: 2017 | Disability Statistics & Demographics 33
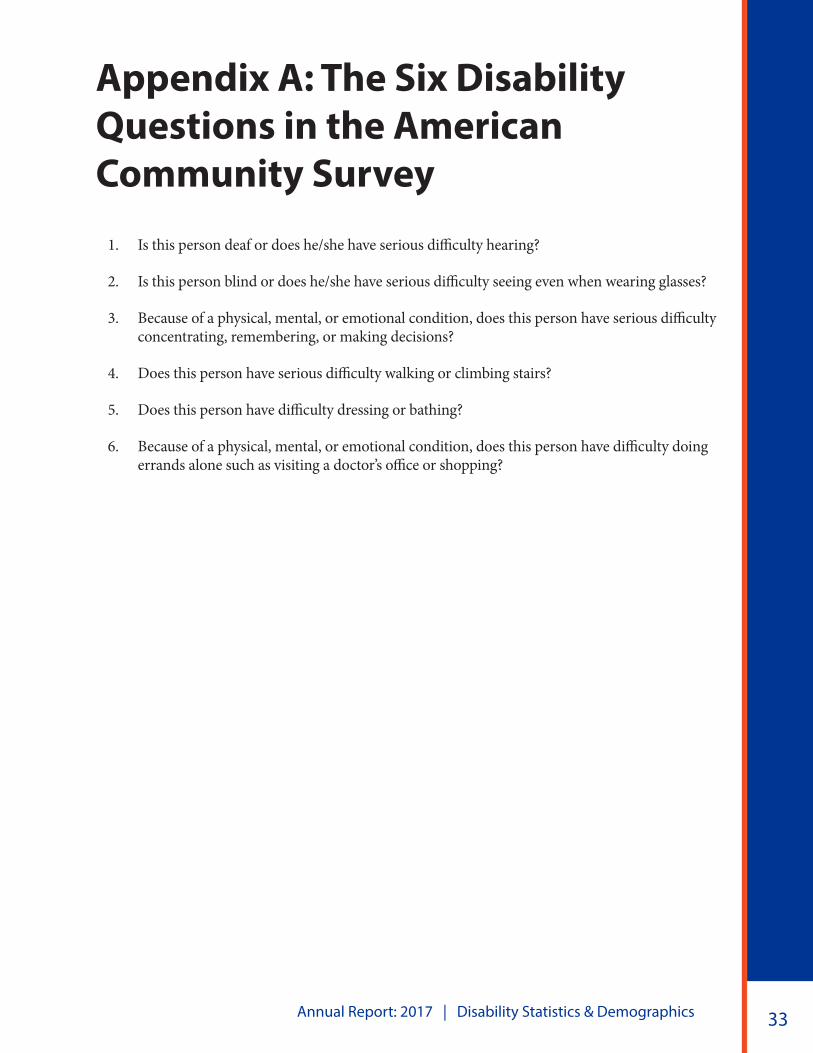
Appendix A: The Six Disability Questions in the American Community Survey
1. Is this person deaf or does he/she have serious difficulty hearing?
2. Is this person blind or does he/she have serious difficulty seeing even when wearing glasses?
3. Because of a physical, mental, or emotional condition, does this person have serious difficulty concentrating, remembering, or making decisions?
4. Does this person have serious difficulty walking or climbing stairs?
5. Does this person have difficulty dressing or bathing?
6. Because of a physical, mental, or emotional condition, does this person have difficulty doing errands alone such as visiting a doctor’s office or shopping?
www.DisabilityCompendium.org | 866.538.9521 34
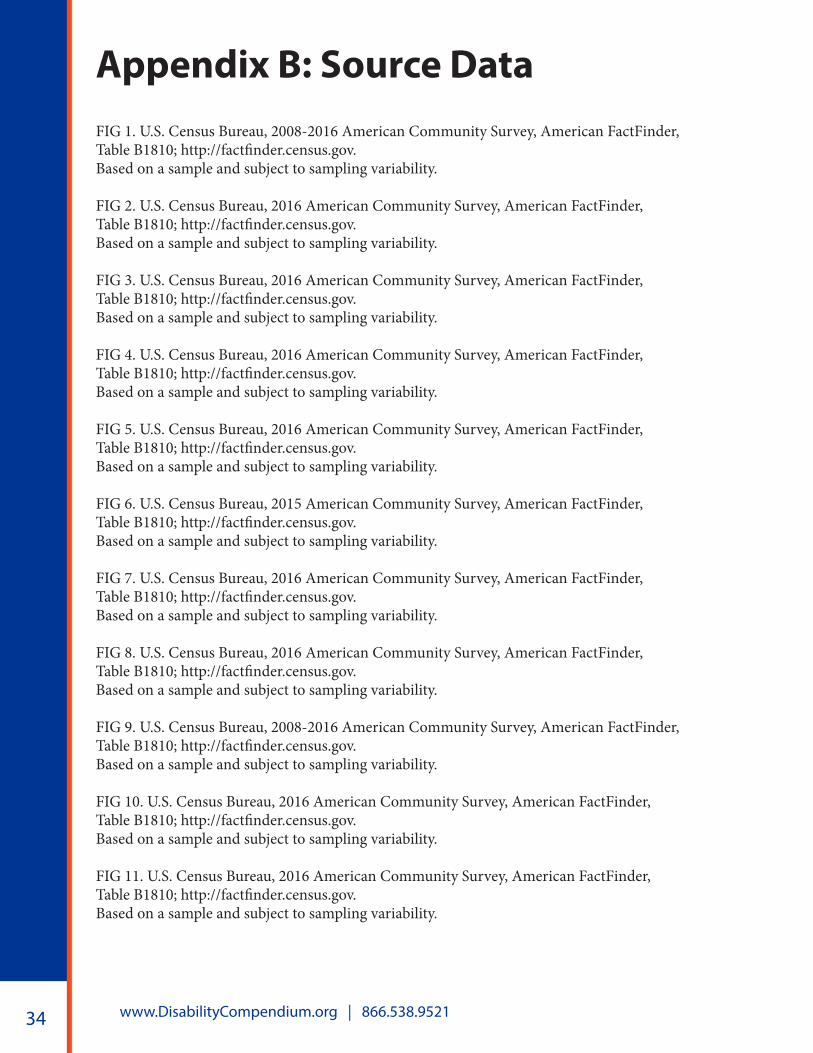
Appendix B: Source DataFIG 1. U.S. Census Bureau, 2008-2016 American Community Survey, American FactFinder,Table B1810; http://factfinder.census.gov.Based on a sample and subject to sampling variability.
FIG 2. U.S. Census Bureau, 2016 American Community Survey, American FactFinder,Table B1810; http://factfinder.census.gov.Based on a sample and subject to sampling variability.
FIG 3. U.S. Census Bureau, 2016 American Community Survey, American FactFinder,Table B1810; http://factfinder.census.gov.Based on a sample and subject to sampling variability.
FIG 4. U.S. Census Bureau, 2016 American Community Survey, American FactFinder,Table B1810; http://factfinder.census.gov.Based on a sample and subject to sampling variability.
FIG 5. U.S. Census Bureau, 2016 American Community Survey, American FactFinder,Table B1810; http://factfinder.census.gov.Based on a sample and subject to sampling variability.
FIG 6. U.S. Census Bureau, 2015 American Community Survey, American FactFinder,Table B1810; http://factfinder.census.gov.Based on a sample and subject to sampling variability.
FIG 7. U.S. Census Bureau, 2016 American Community Survey, American FactFinder,Table B1810; http://factfinder.census.gov.Based on a sample and subject to sampling variability.
FIG 8. U.S. Census Bureau, 2016 American Community Survey, American FactFinder,Table B1810; http://factfinder.census.gov.Based on a sample and subject to sampling variability.
FIG 9. U.S. Census Bureau, 2008-2016 American Community Survey, American FactFinder,Table B1810; http://factfinder.census.gov.Based on a sample and subject to sampling variability.
FIG 10. U.S. Census Bureau, 2016 American Community Survey, American FactFinder,Table B1810; http://factfinder.census.gov.Based on a sample and subject to sampling variability.
FIG 11. U.S. Census Bureau, 2016 American Community Survey, American FactFinder,Table B1810; http://factfinder.census.gov.Based on a sample and subject to sampling variability.
Annual Report: 2017 | Disability Statistics & Demographics 35
FIG 12. U.S. Census Bureau, 2016 American Community Survey, American FactFinder,Table B1810; http://factfinder.census.gov.Based on a sample and subject to sampling variability.
FIG 13. U.S. Census Bureau, 2016 American Community Survey, American FactFinder,Table B1810; http://factfinder.census.gov.Based on a sample and subject to sampling variability.
FIG 14. U.S. Census Bureau, 2016 American Community Survey, American FactFinder,Table B1810; http://factfinder.census.gov.Based on a sample and subject to sampling variability.
FIG 15. U.S. Census Bureau, 2016 American Community Survey, American FactFinder,Table B1810; http://factfinder.census.gov.Based on a sample and subject to sampling variability.
FIG 16. U.S. Census Bureau, 2008-2016 American Community Survey, American FactFinder, Table B18120; http://factfinder.census.gov. Based on a sample and subject to sampling variability.
FIG 17. U.S. Census Bureau, 2008-2016 American Community Survey, American FactFinder, Table B18120; http://factfinder.census.gov. Based on a sample and subject to sampling variability.
FIG 18. U.S. Census Bureau, 2016 American Community Survey, American FactFinder,Table B18120; http://factfinder.census.gov. Based on a sample and subject to sampling variability.
FIG 19. U.S. Census Bureau, 2016 American Community Survey, American FactFinder,Table B18120; http://factfinder.census.gov. Based on a sample and subject to sampling variability.
FIG 20. U.S. Census Bureau, 2016 American Community Survey, American FactFinder, Table B18120; http://factfinder.census.gov. Based on a sample and subject to sampling variability.
FIG 21. U.S. Census Bureau, 2016 American Community Survey, American FactFinder, Table B18120; http://factfinder.census.gov. Based on a sample and subject to sampling variability.
FIG 22. U.S. Census Bureau, 2008-2016 American Community Survey, American FactFinder, Table B18140; http://factfinder.census.gov. Based on a sample and subject to sampling variability.
www.DisabilityCompendium.org | 866.538.9521 36
FIG 23. U.S. Census Bureau, 2008-2016 American Community Survey, American FactFinder, Table B18140; http://factfinder.census.gov.Based on a sample and subject to sampling variability.
FIG 24. U.S. Census Bureau, 2016 American Community Survey, American FactFinder, Table B18140; http://factfinder.census.gov. Based on a sample and subject to sampling variability.
FIG 25. U.S. Census Bureau, 2016 American Community Survey, American FactFinder, Table B18140; http://factfinder.census.gov. Based on a sample and subject to sampling variability.
FIG 26. U.S. Census Bureau, 2016 American Community Survey, American FactFinder, Table B18140; http://factfinder.census.gov. Based on a sample and subject to sampling variability.
FIG 27. U.S. Census Bureau, 2009-2016 American Community Survey, American FactFinder, Table B18130; http://factfinder.census.gov. Based on a sample and subject to sampling variability.
FIG 28. U.S. Census Bureau, 2009-2016 American Community Survey, American FactFinder, Table B18130; http://factfinder.census.gov. Based on a sample and subject to sampling variability.
FIG 29. U.S. Census Bureau, 2016 American Community Survey, American FactFinder, Table B18130; http://factfinder.census.gov. Based on a sample and subject to sampling variability.
FIG 30. U.S. Census Bureau, 2016 American Community Survey, American FactFinder, Table B18130; http://factfinder.census.gov. Based on a sample and subject to sampling variability.
FIG 31. U.S. Census Bureau, 2016 American Community Survey, American FactFinder, Table B18130; http://factfinder.census.gov. Based on a sample and subject to sampling variability.
FIG 32. U.S. Census Bureau, 2016 American Community Survey, American FactFinder, Table B18130; http://factfinder.census.gov. Based on a sample and subject to sampling variability.
FIG 33. U.S. Census Bureau, 2016 American Community Survey, American FactFinder, Table B18130; http://factfinder.census.gov. Based on a sample and subject to sampling variability.
Annual Report: 2017 | Disability Statistics & Demographics 37
FIG 34. Authors' calculations using data from the 2009-2016 Behavioral Risk Factor Surveillance Survey BRFSS. Based on a sample and subject to sampling variability.
FIG 35. Authors' calculations using data from the 2009-2016 Behavioral Risk Factor Surveillance Survey BRFSS. Based on a sample and subject to sampling variability.
FIG 36. Authors' calculations using data from the 2016 Behavioral Risk Factor Surveillance Survey BRFSS. Based on a sample and subject to sampling variability.
FIG 37. Authors' calculations using data from the 2009-2016 Behavioral Risk Factor Surveillance Survey BRFSS. Based on a sample and subject to sampling variability.
FIG 38. Authors' calculations using data from the 2009-2016 Behavioral Risk Factor Surveillance Survey BRFSS. Based on a sample and subject to sampling variability.
FIG 39. Authors' calculations using data from the 2016 Behavioral Risk Factor Surveillance Survey BRFSS. Based on a sample and subject to sampling variability.
FIG 40. Authors' calculations using data from the 2009-2016 Behavioral Risk Factor Surveillance Survey BRFSS. Based on a sample and subject to sampling variability.
FIG 41. Authors' calculations using data from the 2009-2016 Behavioral Risk Factor Surveillance Survey BRFSS. Based on a sample and subject to sampling variability.
FIG 42. Authors' calculations using data from the 2016 Behavioral Risk Factor Surveillance Survey BRFSS. Based on a sample and subject to sampling variability.
www.DisabilityCompendium.org | 866.538.9521 38
A
Ambulatory Disability (ACS): In the ACS, individuals five or more years old who responded "yes" when asked if they had "serious difficulty walking or climbing stairs."
American Community Survey (ACS): The American Community Survey is a large, continuous demographic survey conducted by the U.S. Census Bureau that will provide accurate and up-to-date profiles of America's communities every year. Annual and multi-year estimates of population and housing data are generated for small areas, including tracts and population subgroups. This information is collected by mailing questionnaires to a sample of addresses.
B
Behavioral Risk Factor Surveillance Survey (BRFSS): The Behavioral Risk Factor Surveillance System is a state-based system of health surveys that collects information on health risk behaviors, preventive health practices, and health care access primarily related to chronic disease and injury. BRFSS was established in 1984 by the Centers for Disease Control and Prevention (CDC); currently data are collected monthly in all 50 states, the District of Columbia, Puerto Rico, the U.S. Virgin Islands, and Guam. More than 350,000 adults are interviewed each year, making the BRFSS the largest telephone health survey in the world. States use BRFSS data to identify emerging health problems, establish and track health objectives, and develop and evaluate public health policies and programs. Many states also use BRFSS data to support health-related legislative efforts.
Binge Drinking (BRFSS): Respondents were asked "considering all types of alcoholic beverages, how many times during the past 30 days did you have [5, if male respondent][4, if female respondents] or more drinks on an occasion?" Respondents who reported doing so at least one time were consider to have engaged in binge drinking.
C
Civilian: A person not in active-duty military.
Cognitive Disability (ACS): In the ACS, individuals who indicated "yes" when asked if due to a physical, mental, or emotional condition, they had "serious difficulty concentrating, remembering, or making decisions."
D
Disability Status (ACS): The U.S. Census Bureau used six questions to identify people with disabilities. A response of "yes" to any one of the questions indicates that the person in question has a disability-vision, hearing, cognitive, ambulatory, self-care, and independent living. However, the questions related to cognitive, ambulatory, self-care, and independent living are not used to identify disability in individuals less than five years old, and the question related to independent living is not used to identify disability in individuals less than 18 years old.
Disability Status (BRFSS): The 2016 BRFSS estimates are based on the six questions to identify people with disabilities used by the U.S. Census Bureau. A response of "yes" to any one of the questions indicates that the person in question has a vision, hearing, cognitive, ambulatory, self-care, and/or independent
Appendix C: Glossary of Terms
Annual Report: 2017 | Disability Statistics & Demographics 39
living disability. In previous BRFSS years’ data, an individual is classified as having a disability based on answers to the following questions: (1) Are you limited in any way in any activities because of physical, mental, or emotional problems? and (2) Do you now have any health problem that requires you to use special equipment, such as a cane, a wheelchair, a special bed, or a special telephone (include occasional use or use in certain circumstances)?
E
Earnings (ACS): Regularly received income from salaries/wages, self-employment or both, for people ages 16 or older before deductions for personal income taxes, Social Security, bond purchases, union dues, Medicare deductions, etc.
Employment Status (ACS): In the ACS, individuals were asked a series of questions designed to identify their status. Based on the answers, individuals were classified into one of five groups: (1) people who worked at any time during the reference week; (2) people on temporary layoff who were available for work; (3) people who did not work during the reference week but who had jobs or businesses from which they were temporarily absent (excluding layoff); (4) people who did not work during the reference week, but who were looking for work during the last four weeks and were available for work during the reference week; and (5) people not in the labor force. The employment status data shown in American Community Survey tabulations relate to people ages 16 or older.
H
Hearing Disability (ACS): In the ACS, individuals who indicated "yes" when asked if they were "deaf or ... [had] serious difficulty hearing."
I
Independent Living Disability (ACS): In the ACS, individuals who indicated "yes" when asked if due to a physical, mental, or emotional condition, they had difficulty "doing errands alone such as visiting a doctor's office or shopping."
O
Obese (BRFSS): The condition where a person has a body mass index greater than 30.
P
Poverty Rate: Percent of the population who are determined to be in poverty. The Office of Management and Budget in Statistical Policy Directive 14 sets the standards for which poverty is calculated. The U.S. Census Bureau uses a set of dollar value thresholds that vary by family size and composition to determine who is in poverty. If a family's total income is less than the dollar value of the appropriate threshold, then that family and every individual in it are considered to be in poverty.
www.DisabilityCompendium.org | 866.538.9521 40
S
Smoking (BRFSS): Respondents were asked about smoking: "Have you smoked at least 100 cigarettes in your entire life?" and "Do you now smoke cigarettes every day, some days, or not at all?" Respondents who reported smoking at least 100 cigarettes in their lifetime and who, at the time of survey, smoked either every day or some days were defined as a current smoker.
V
Vision Disability: In the ACS, individuals who indicated "yes" when asked if they were "blind or ... [had] serious difficulty seeing even when wearing glasses."
Annual Report: 2017 | Disability Statistics & Demographics 41
About the StatsRRTCThe mission of the Rehabilitation Research and Training Center on Disability Statistics and Demographics (StatsRRTC) is to narrow and actively bridge the divide between the producers and end users of disability statistics, thereby supporting better data collection, more accurate information, better decision-making, more effective programs, and better lives for people with disabilities.www.ResearchonDisability.org
About the CompendiumThe Annual Disability Statistics Compendium is a web-based tool that pools disability statistics published by various federal agencies together in one place.When working on legislative and other matters relating to people with disabilities, the Compendium will make finding and using disability statistics easier.
www.DisabilityCompendium.org
Center Collaborators• University of New Hampshire–Institute on Disability, a University Center of Excellence on
Disability,
• Mathematica Policy Research, a world-class employee-owned survey and research firm,
• Kessler Foundation, a leading medical rehabilitation research organization,
• Center on Disability at the Public Health Institute, a national leader in disability policy, civil rights, disability law, employment, health issues, independent living, and assistive technology.
• American Association of People with Disabilities (AAPD), the country’s largest cross-disability membership association, and
• Council of State Administrators of Vocational Rehabilitation (CSAVR), a nationally-recognized association of disability services administrators
FundingThe StatsRRTC is funded by the Department of Health and Human Services, Administration for Community Living, National Institute on Disability, Independent Living, and Rehabilitation Research (NIDILRR) – Rehabilitation Research and Training Centers (RRTCs) Program under grant number 90RT5022-02-010, from 2013 - 2018.
Contact InformationInstitute on Disability at the University of New Hampshire 10 West Edge Drive, Suite 101Durham, NH [email protected] 866.538.9521
Institute on Disability / UCED 10 West Edge Drive, Suite 101 Durham, NH 03824 603.862.4320 | relay: 711 [email protected]
iod.unh.edu © January 2018. Institute on Disability. University of New Hampshire.
Stay Connected: