Embed Size (px)
Citation preview
2018 FINANCIAL COMPENSATION SURVEY F I N D I N G S A N D R E S U LT S
NOVEMBER 2018
1
Dear Colleagues,
Since 1937, CFA Society New York (CFANY) has sought to raise the standards of the investment industry through global insight, a dynamic community of local investment management professionals, and thought leadership. Our mission is to raise the bar in investment management, wherever possible, and help establish the course for where the investment industry is headed.
We believe that ardent dedication to operate as a reliable and trustworthy source of information is part and parcel of that foundational duty. Our Society strives to serve members by providing them the insight and resources to aid in their career development and advancement.
To that end, CFANY is thrilled to announce the highly anticipated findings of the 2018 Financial Compensation Survey. The survey, which had been void in the market since 2007, provides a unique, region-specific analysis of compensation levels for investment and financial professionals. This whitepaper captures the findings of the survey, providing an overview of the survey-wide results.
For those who participated in the survey, we thank you for your contribution to this important market resource. We are confident the information contained in this document will be of value to you.
Regards,
Daniel Dagen, CFA Chief Executive Officer, CFA Society New York
2018 FINANCIAL COMPENSATION REPORTL E T T E R F R O M S O C I E T Y L E A D E R S H I P
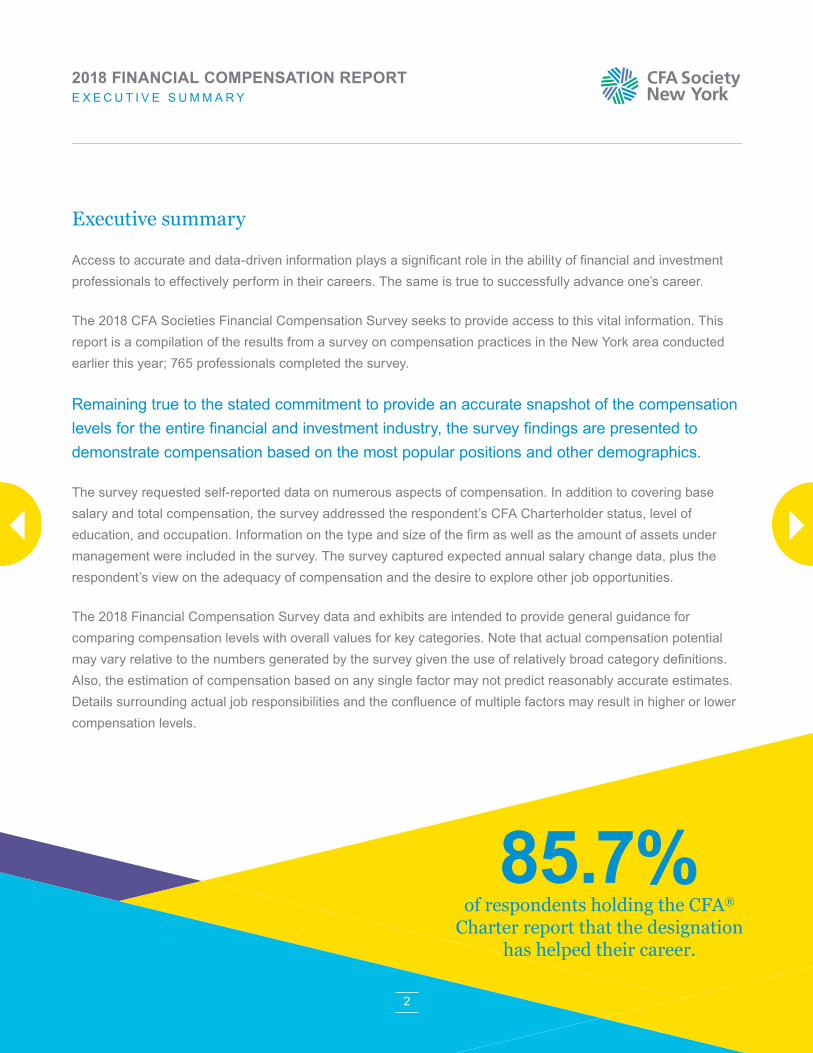
Executive summary
Access to accurate and data-driven information plays a significant role in the ability of financial and investment professionals to effectively perform in their careers. The same is true to successfully advance one’s career.
The 2018 CFA Societies Financial Compensation Survey seeks to provide access to this vital information. This report is a compilation of the results from a survey on compensation practices in the New York area conducted earlier this year; 765 professionals completed the survey.
Remaining true to the stated commitment to provide an accurate snapshot of the compensation levels for the entire financial and investment industry, the survey findings are presented to demonstrate compensation based on the most popular positions and other demographics.
The survey requested self-reported data on numerous aspects of compensation. In addition to covering base salary and total compensation, the survey addressed the respondent’s CFA Charterholder status, level of education, and occupation. Information on the type and size of the firm as well as the amount of assets under management were included in the survey. The survey captured expected annual salary change data, plus the respondent’s view on the adequacy of compensation and the desire to explore other job opportunities.
The 2018 Financial Compensation Survey data and exhibits are intended to provide general guidance for comparing compensation levels with overall values for key categories. Note that actual compensation potential may vary relative to the numbers generated by the survey given the use of relatively broad category definitions. Also, the estimation of compensation based on any single factor may not predict reasonably accurate estimates. Details surrounding actual job responsibilities and the confluence of multiple factors may result in higher or lower compensation levels.
2
85.7%of respondents holding the CFA®
Charter report that the designation has helped their career.
2018 FINANCIAL COMPENSATION REPORTE X E C U T I V E S U M M A R Y
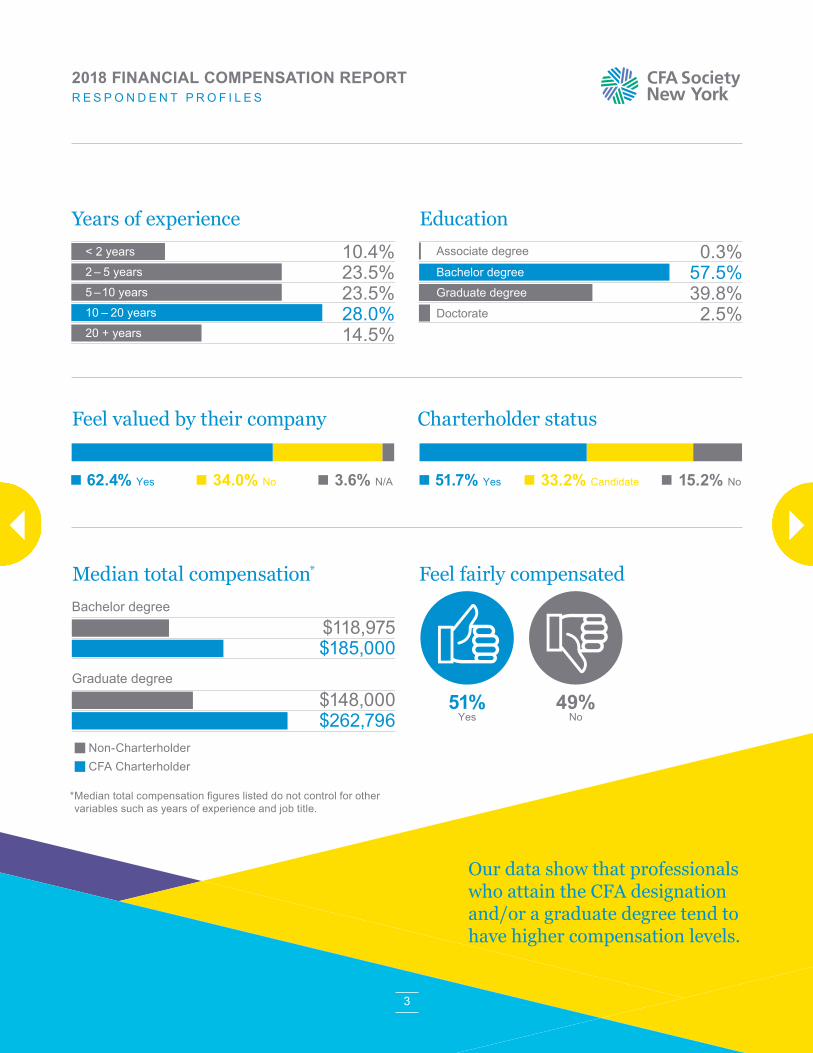
Years of experience< 2 years
2 – 5 years
5 –10 years
10 – 20 years
20 + years
10.4%23.5%23.5%28.0%14.5%
EducationAssociate degree
Bachelor degree
Graduate degree
Doctorate
0.3%57.5%39.8%2.5%
Feel fairly compensated
51%Yes
49%No
3
Median total compensation*
Non-Charterholder CFA Charterholder
$118,975$185,000
$148,000$262,796
Bachelor degree
Graduate degree
Our data show that professionals who attain the CFA designation and/or a graduate degree tend to have higher compensation levels.
* Median total compensation figures listed do not control for other variables such as years of experience and job title.
Feel valued by their company
62.4% Yes 34.0% No 3.6% N/A
Charterholder status
51.7% Yes 33.2% Candidate 15.2% No
2018 FINANCIAL COMPENSATION REPORTR E S P O N D E N T P R O F I L E S
4
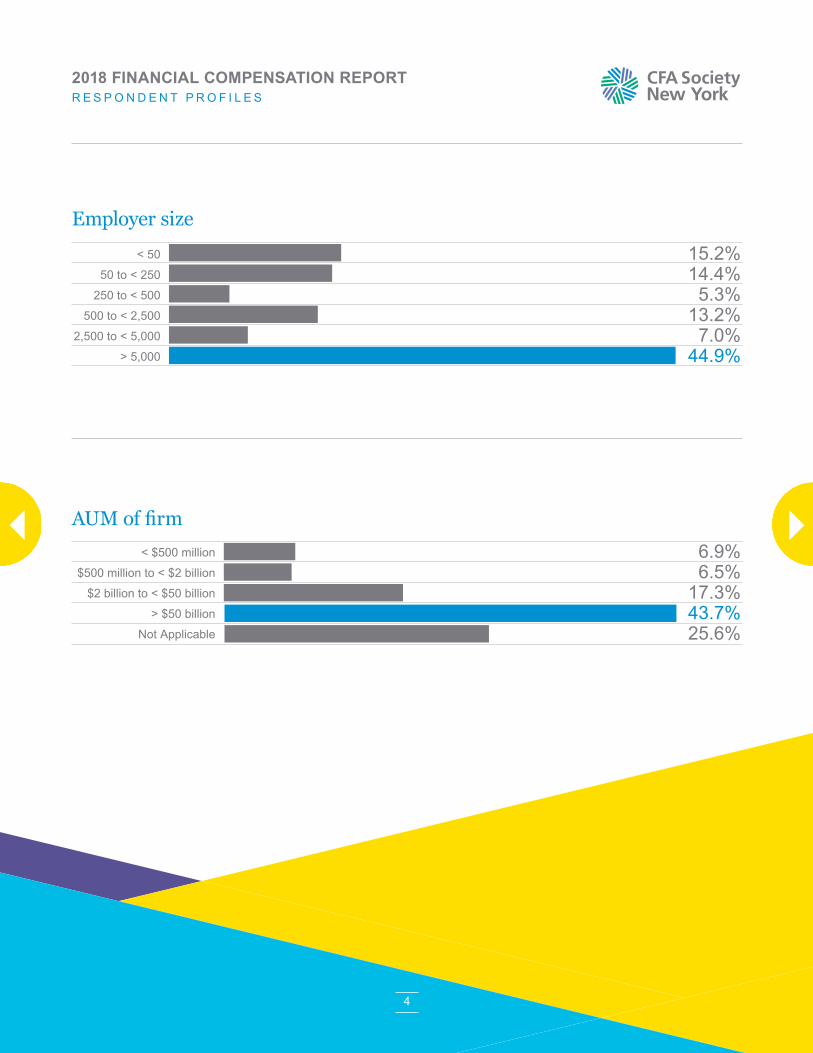
Employer size< 50
50 to < 250
250 to < 500
500 to < 2,500
2,500 to < 5,000
> 5,000
15.2%14.4%5.3%
13.2%7.0%
44.9%
AUM of firm< $500 million
$500 million to < $2 billion
$2 billion to < $50 billion
> $50 billion
Not Applicable
6.9%6.5%
17.3%43.7%25.6%
2018 FINANCIAL COMPENSATION REPORTR E S P O N D E N T P R O F I L E S
5
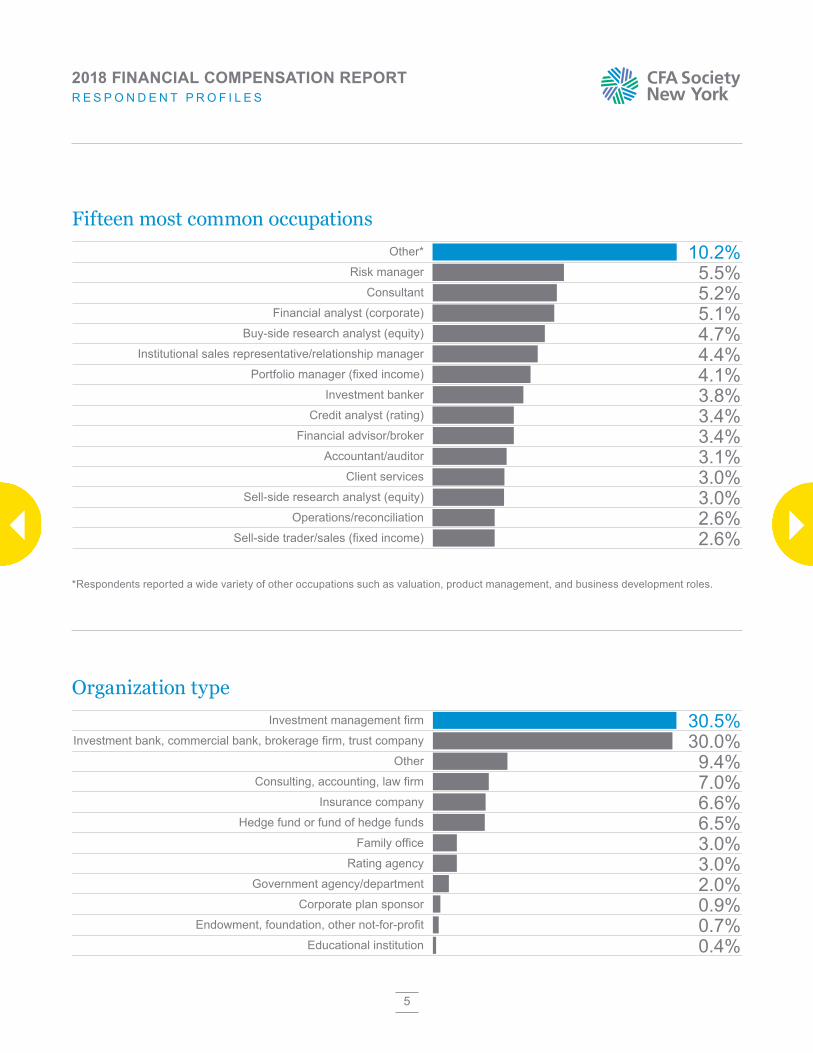
Fifteen most common occupationsOther*
Risk manager
Consultant
Financial analyst (corporate)
Buy-side research analyst (equity)
Institutional sales representative/relationship manager
Portfolio manager (fixed income)
Investment banker
Credit analyst (rating)
Financial advisor/broker
Accountant/auditor
Client services
Sell-side research analyst (equity)
Operations/reconciliation
Sell-side trader/sales (fixed income)
10.2%5.5%5.2%5.1%4.7%4.4%4.1%3.8%3.4%3.4%3.1%3.0%3.0%2.6%2.6%
Organization typeInvestment management firm
Investment bank, commercial bank, brokerage firm, trust company
Other
Consulting, accounting, law firm
Insurance company
Hedge fund or fund of hedge funds
Family office
Rating agency
Government agency/department
Corporate plan sponsor
Endowment, foundation, other not-for-profit
Educational institution
30.5%30.0%9.4%7.0%6.6%6.5%3.0%3.0%2.0%0.9%0.7%0.4%
*Respondents reported a wide variety of other occupations such as valuation, product management, and business development roles.
2018 FINANCIAL COMPENSATION REPORTR E S P O N D E N T P R O F I L E S
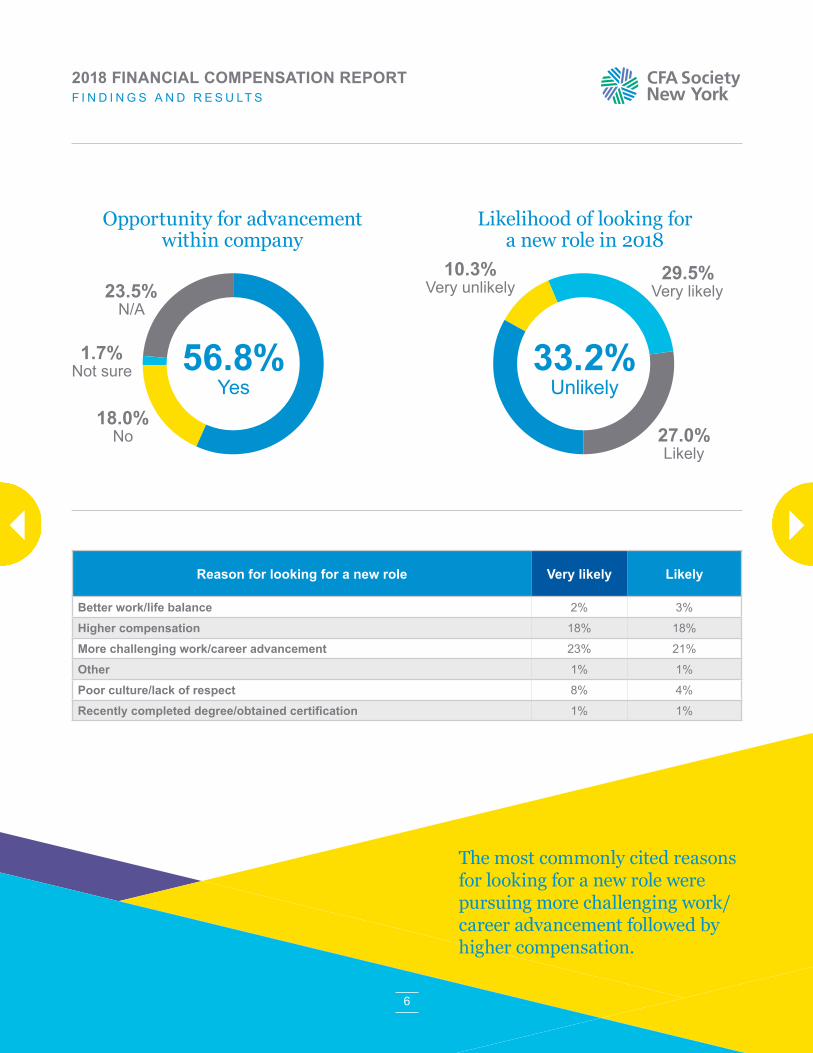
The most commonly cited reasons for looking for a new role were pursuing more challenging work/career advancement followed by higher compensation.
Reason for looking for a new role Very likely Likely
Better work/life balance 2% 3%
Higher compensation 18% 18%
More challenging work/career advancement 23% 21%
Other 1% 1%
Poor culture/lack of respect 8% 4%
Recently completed degree/obtained certification 1% 1%
6
Opportunity for advancement within company
23.5% N/A
18.0% No
1.7% Not sure 56.8%
Yes
Likelihood of looking for a new role in 2018
33.2%Unlikely
27.0% Likely
10.3% Very unlikely
29.5% Very likely
2018 FINANCIAL COMPENSATION REPORTF I N D I N G S A N D R E S U LT S
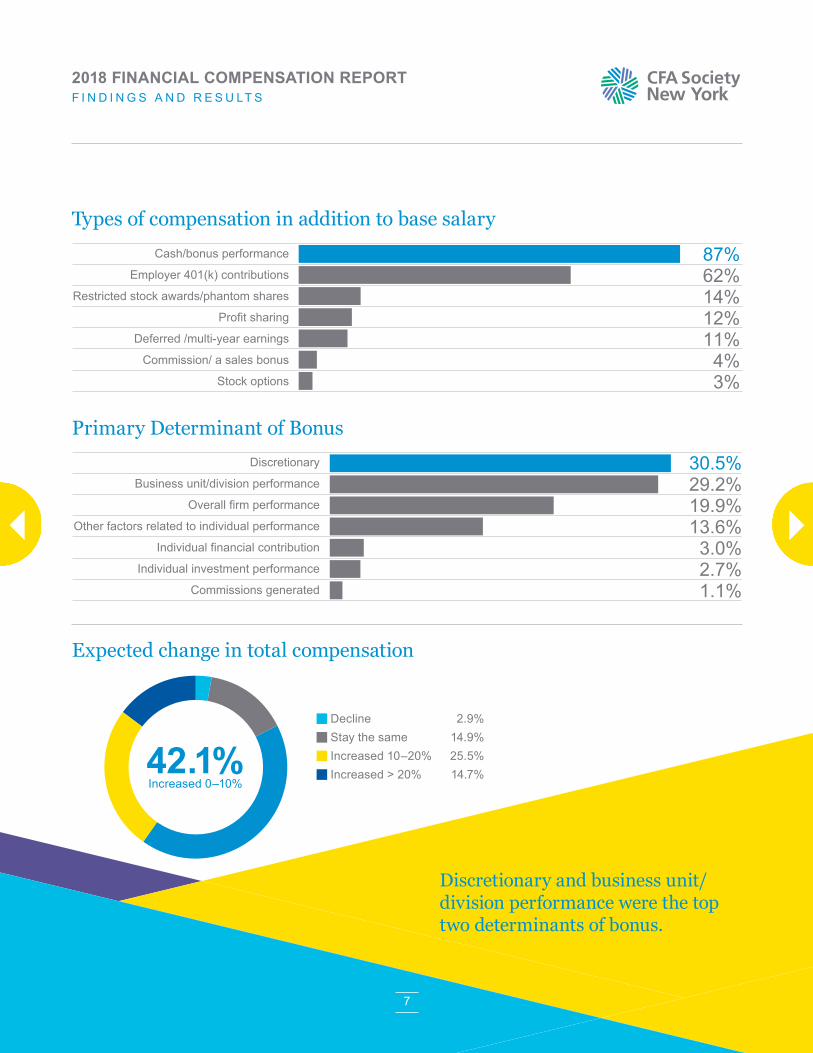
Types of compensation in addition to base salary
Primary Determinant of Bonus
Cash/bonus performance
Employer 401(k) contributions
Restricted stock awards/phantom shares
Profit sharing
Deferred /multi-year earnings
Commission/ a sales bonus
Stock options
87%62%14%12%11%4%3%
Discretionary
Business unit/division performance
Overall firm performance
Other factors related to individual performance
Individual financial contribution
Individual investment performance
Commissions generated
30.5%29.2%19.9%13.6%3.0%2.7%1.1%
Expected change in total compensation
Decline 2.9% Stay the same 14.9%
Increased 10–20% 25.5%
Increased > 20% 14.7%42.1%Increased 0–10%
Discretionary and business unit/division performance were the top two determinants of bonus.
7
2018 FINANCIAL COMPENSATION REPORTF I N D I N G S A N D R E S U LT S
8
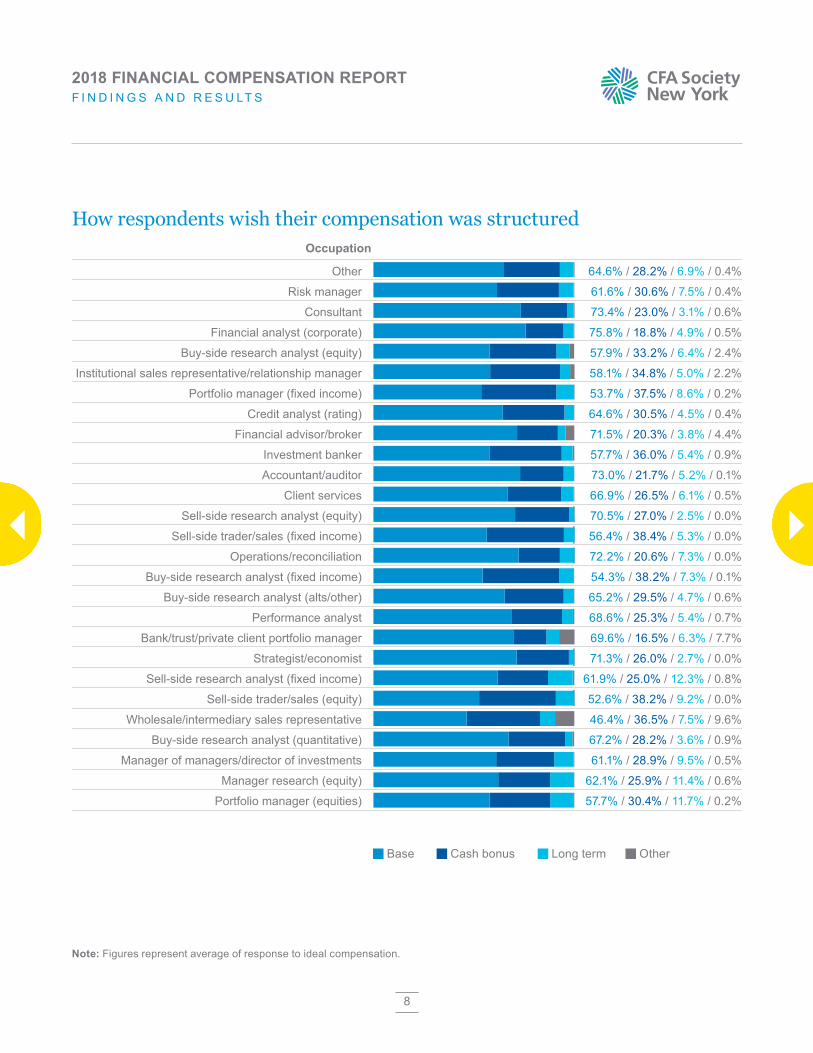
How respondents wish their compensation was structuredOccupation
Other
Risk manager
Consultant
Financial analyst (corporate)
Buy-side research analyst (equity)
Institutional sales representative/relationship manager
Portfolio manager (fixed income)
Credit analyst (rating)
Financial advisor/broker
Investment banker
Accountant/auditor
Client services
Sell-side research analyst (equity)
Sell-side trader/sales (fixed income)
Operations/reconciliation
Buy-side research analyst (fixed income)
Buy-side research analyst (alts/other)
Performance analyst
Bank/trust/private client portfolio manager
Strategist/economist
Sell-side research analyst (fixed income)
Sell-side trader/sales (equity)
Wholesale/intermediary sales representative
Buy-side research analyst (quantitative)
Manager of managers/director of investments
Manager research (equity)
Portfolio manager (equities)
64.6% / 28.2% / 6.9% / 0.4%
61.6% / 30.6% / 7.5% / 0.4%
73.4% / 23.0% / 3.1% / 0.6%
75.8% / 18.8% / 4.9% / 0.5%
57.9% / 33.2% / 6.4% / 2.4%
58.1% / 34.8% / 5.0% / 2.2%
53.7% / 37.5% / 8.6% / 0.2%
64.6% / 30.5% / 4.5% / 0.4%
71.5% / 20.3% / 3.8% / 4.4%
57.7% / 36.0% / 5.4% / 0.9%
73.0% / 21.7% / 5.2% / 0.1%
66.9% / 26.5% / 6.1% / 0.5%
70.5% / 27.0% / 2.5% / 0.0%
56.4% / 38.4% / 5.3% / 0.0%
72.2% / 20.6% / 7.3% / 0.0%
54.3% / 38.2% / 7.3% / 0.1%
65.2% / 29.5% / 4.7% / 0.6%
68.6% / 25.3% / 5.4% / 0.7%
69.6% / 16.5% / 6.3% / 7.7%
71.3% / 26.0% / 2.7% / 0.0%
61.9% / 25.0% / 12.3% / 0.8%
52.6% / 38.2% / 9.2% / 0.0%
46.4% / 36.5% / 7.5% / 9.6%
67.2% / 28.2% / 3.6% / 0.9%
61.1% / 28.9% / 9.5% / 0.5%
62.1% / 25.9% / 11.4% / 0.6%
57.7% / 30.4% / 11.7% / 0.2%
Base Cash bonus Long term Other
Note: Figures represent average of response to ideal compensation.
2018 FINANCIAL COMPENSATION REPORTF I N D I N G S A N D R E S U LT S
9
continued»
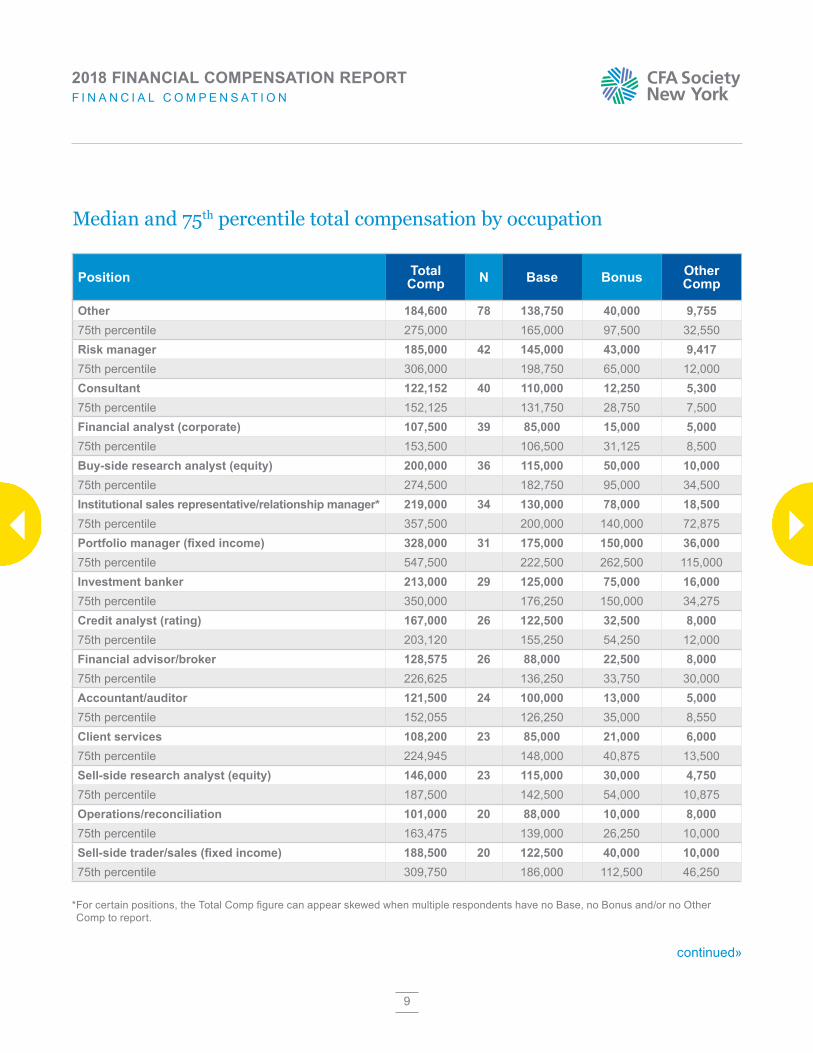
Median and 75th percentile total compensation by occupation
Position Total Comp N Base Bonus Other
Comp
Other 184,600 78 138,750 40,000 9,75575th percentile 275,000 165,000 97,500 32,550Risk manager 185,000 42 145,000 43,000 9,41775th percentile 306,000 198,750 65,000 12,000Consultant 122,152 40 110,000 12,250 5,30075th percentile 152,125 131,750 28,750 7,500Financial analyst (corporate) 107,500 39 85,000 15,000 5,00075th percentile 153,500 106,500 31,125 8,500Buy-side research analyst (equity) 200,000 36 115,000 50,000 10,00075th percentile 274,500 182,750 95,000 34,500Institutional sales representative/relationship manager* 219,000 34 130,000 78,000 18,50075th percentile 357,500 200,000 140,000 72,875Portfolio manager (fixed income) 328,000 31 175,000 150,000 36,00075th percentile 547,500 222,500 262,500 115,000Investment banker 213,000 29 125,000 75,000 16,00075th percentile 350,000 176,250 150,000 34,275Credit analyst (rating) 167,000 26 122,500 32,500 8,00075th percentile 203,120 155,250 54,250 12,000Financial advisor/broker 128,575 26 88,000 22,500 8,00075th percentile 226,625 136,250 33,750 30,000Accountant/auditor 121,500 24 100,000 13,000 5,00075th percentile 152,055 126,250 35,000 8,550Client services 108,200 23 85,000 21,000 6,00075th percentile 224,945 148,000 40,875 13,500Sell-side research analyst (equity) 146,000 23 115,000 30,000 4,75075th percentile 187,500 142,500 54,000 10,875Operations/reconciliation 101,000 20 88,000 10,000 8,00075th percentile 163,475 139,000 26,250 10,000Sell-side trader/sales (fixed income) 188,500 20 122,500 40,000 10,00075th percentile 309,750 186,000 112,500 46,250
* For certain positions, the Total Comp figure can appear skewed when multiple respondents have no Base, no Bonus and/or no Other Comp to report.
2018 FINANCIAL COMPENSATION REPORTF I N A N C I A L C O M P E N S AT I O N
10
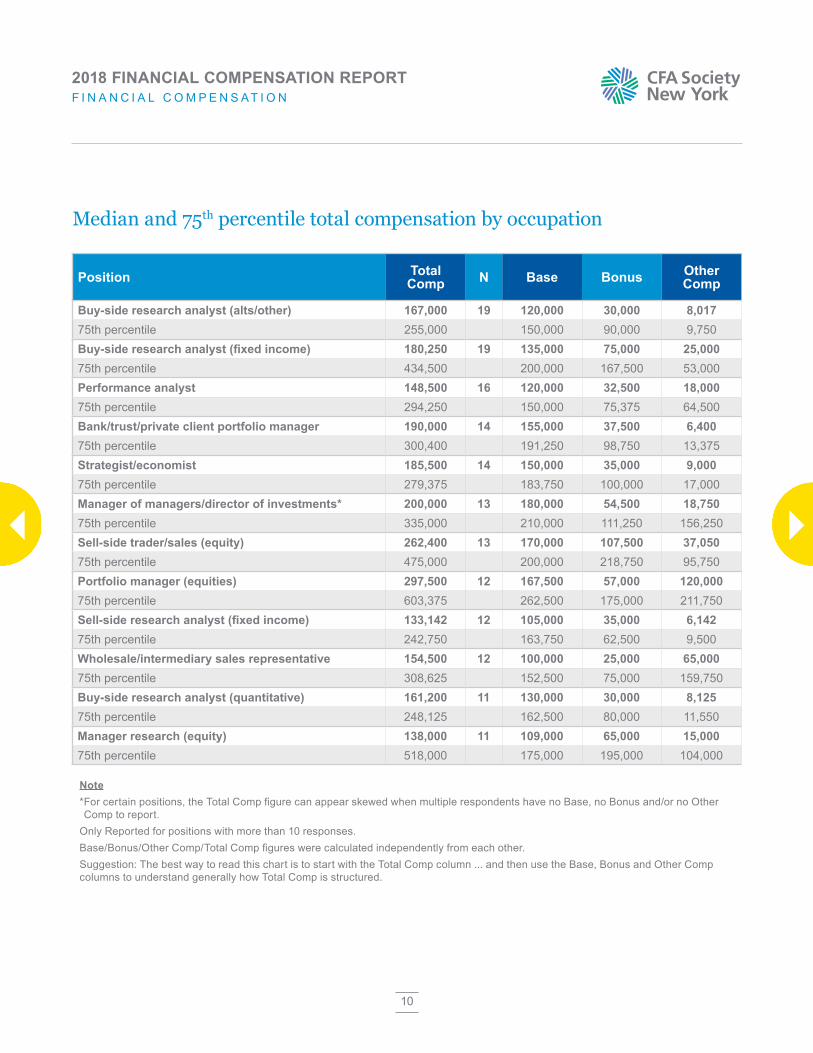
Median and 75th percentile total compensation by occupation
Position Total Comp N Base Bonus Other
Comp
Buy-side research analyst (alts/other) 167,000 19 120,000 30,000 8,01775th percentile 255,000 150,000 90,000 9,750Buy-side research analyst (fixed income) 180,250 19 135,000 75,000 25,00075th percentile 434,500 200,000 167,500 53,000Performance analyst 148,500 16 120,000 32,500 18,00075th percentile 294,250 150,000 75,375 64,500Bank/trust/private client portfolio manager 190,000 14 155,000 37,500 6,40075th percentile 300,400 191,250 98,750 13,375Strategist/economist 185,500 14 150,000 35,000 9,00075th percentile 279,375 183,750 100,000 17,000Manager of managers/director of investments* 200,000 13 180,000 54,500 18,75075th percentile 335,000 210,000 111,250 156,250Sell-side trader/sales (equity) 262,400 13 170,000 107,500 37,05075th percentile 475,000 200,000 218,750 95,750Portfolio manager (equities) 297,500 12 167,500 57,000 120,00075th percentile 603,375 262,500 175,000 211,750Sell-side research analyst (fixed income) 133,142 12 105,000 35,000 6,14275th percentile 242,750 163,750 62,500 9,500Wholesale/intermediary sales representative 154,500 12 100,000 25,000 65,00075th percentile 308,625 152,500 75,000 159,750Buy-side research analyst (quantitative) 161,200 11 130,000 30,000 8,12575th percentile 248,125 162,500 80,000 11,550Manager research (equity) 138,000 11 109,000 65,000 15,00075th percentile 518,000 175,000 195,000 104,000
Note* For certain positions, the Total Comp figure can appear skewed when multiple respondents have no Base, no Bonus and/or no Other Comp to report.
Only Reported for positions with more than 10 responses. Base/Bonus/Other Comp/Total Comp figures were calculated independently from each other.Suggestion: The best way to read this chart is to start with the Total Comp column ... and then use the Base, Bonus and Other Comp columns to understand generally how Total Comp is structured.
2018 FINANCIAL COMPENSATION REPORTF I N A N C I A L C O M P E N S AT I O N
11
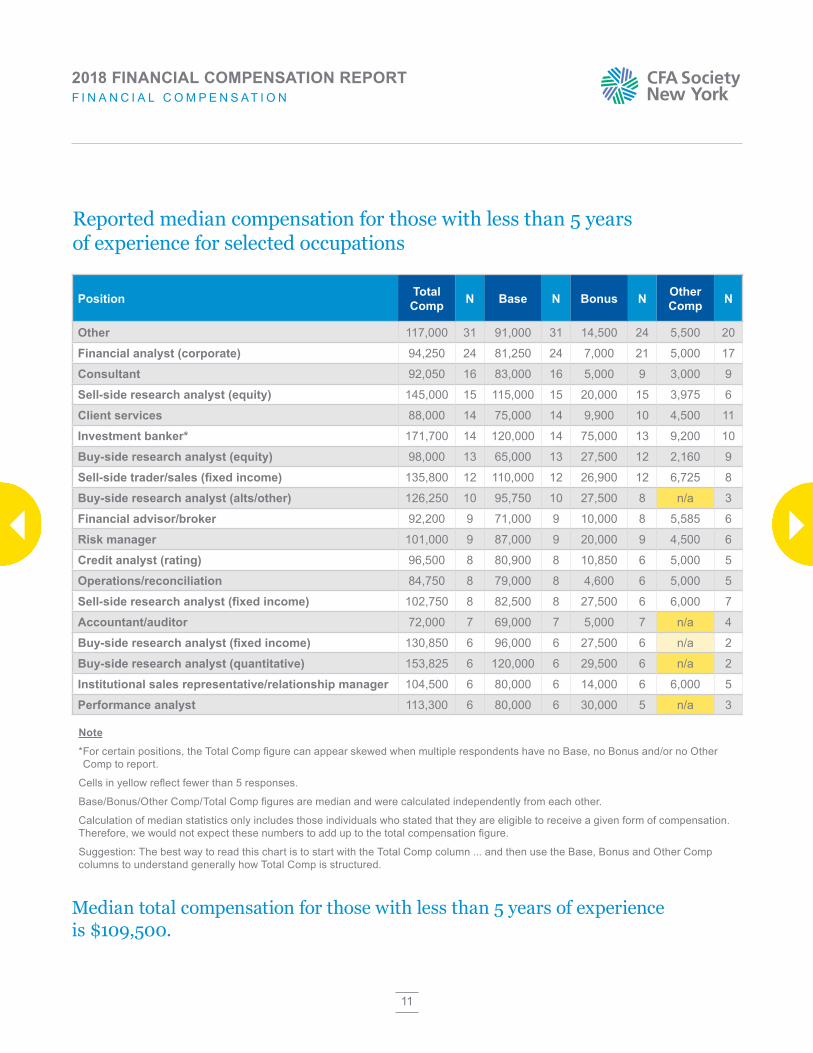
Reported median compensation for those with less than 5 years of experience for selected occupations
Position Total Comp N Base N Bonus N Other
Comp N
Other 117,000 31 91,000 31 14,500 24 5,500 20
Financial analyst (corporate) 94,250 24 81,250 24 7,000 21 5,000 17
Consultant 92,050 16 83,000 16 5,000 9 3,000 9
Sell-side research analyst (equity) 145,000 15 115,000 15 20,000 15 3,975 6
Client services 88,000 14 75,000 14 9,900 10 4,500 11
Investment banker* 171,700 14 120,000 14 75,000 13 9,200 10
Buy-side research analyst (equity) 98,000 13 65,000 13 27,500 12 2,160 9
Sell-side trader/sales (fixed income) 135,800 12 110,000 12 26,900 12 6,725 8
Buy-side research analyst (alts/other) 126,250 10 95,750 10 27,500 8 n/a 3
Financial advisor/broker 92,200 9 71,000 9 10,000 8 5,585 6
Risk manager 101,000 9 87,000 9 20,000 9 4,500 6
Credit analyst (rating) 96,500 8 80,900 8 10,850 6 5,000 5
Operations/reconciliation 84,750 8 79,000 8 4,600 6 5,000 5
Sell-side research analyst (fixed income) 102,750 8 82,500 8 27,500 6 6,000 7
Accountant/auditor 72,000 7 69,000 7 5,000 7 n/a 4
Buy-side research analyst (fixed income) 130,850 6 96,000 6 27,500 6 n/a 2
Buy-side research analyst (quantitative) 153,825 6 120,000 6 29,500 6 n/a 2
Institutional sales representative/relationship manager 104,500 6 80,000 6 14,000 6 6,000 5
Performance analyst 113,300 6 80,000 6 30,000 5 n/a 3
Median total compensation for those with less than 5 years of experience is $109,500.
Note
* For certain positions, the Total Comp figure can appear skewed when multiple respondents have no Base, no Bonus and/or no Other Comp to report.
Cells in yellow reflect fewer than 5 responses.
Base/Bonus/Other Comp/Total Comp figures are median and were calculated independently from each other.
Calculation of median statistics only includes those individuals who stated that they are eligible to receive a given form of compensation. Therefore, we would not expect these numbers to add up to the total compensation figure.
Suggestion: The best way to read this chart is to start with the Total Comp column ... and then use the Base, Bonus and Other Comp columns to understand generally how Total Comp is structured.
2018 FINANCIAL COMPENSATION REPORTF I N A N C I A L C O M P E N S AT I O N
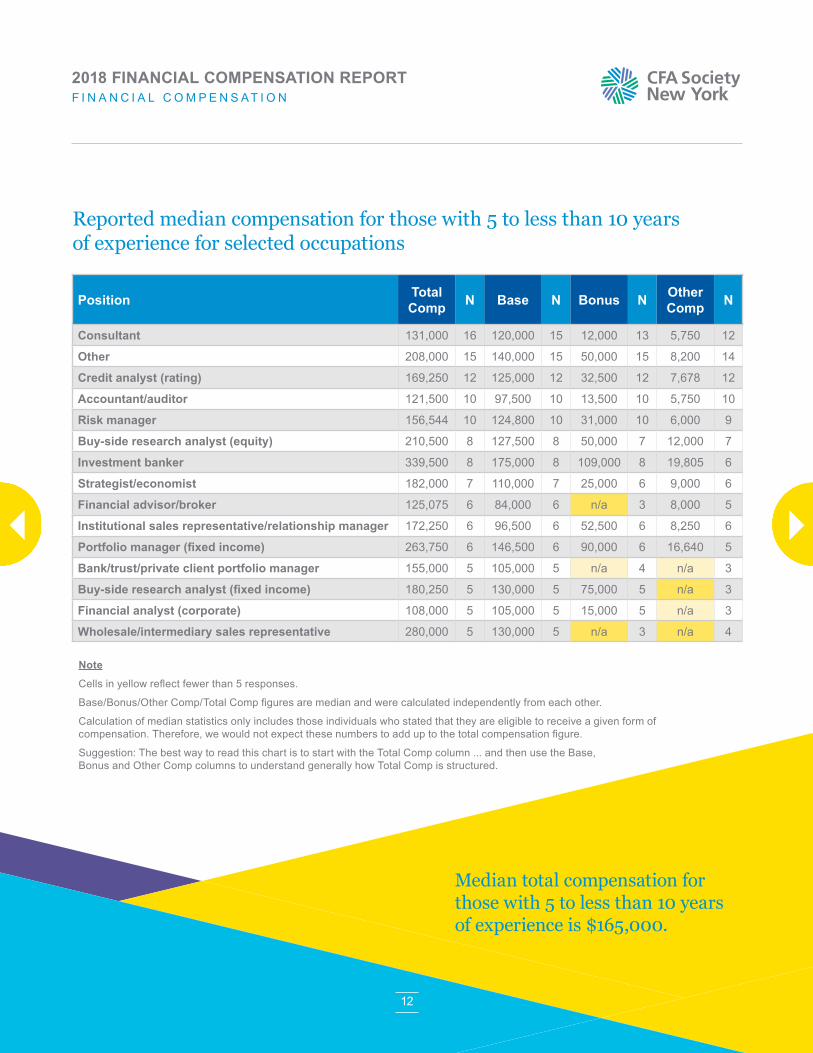
Reported median compensation for those with 5 to less than 10 years of experience for selected occupations
Position Total Comp N Base N Bonus N Other
Comp N
Consultant 131,000 16 120,000 15 12,000 13 5,750 12
Other 208,000 15 140,000 15 50,000 15 8,200 14
Credit analyst (rating) 169,250 12 125,000 12 32,500 12 7,678 12
Accountant/auditor 121,500 10 97,500 10 13,500 10 5,750 10
Risk manager 156,544 10 124,800 10 31,000 10 6,000 9
Buy-side research analyst (equity) 210,500 8 127,500 8 50,000 7 12,000 7
Investment banker 339,500 8 175,000 8 109,000 8 19,805 6
Strategist/economist 182,000 7 110,000 7 25,000 6 9,000 6
Financial advisor/broker 125,075 6 84,000 6 n/a 3 8,000 5
Institutional sales representative/relationship manager 172,250 6 96,500 6 52,500 6 8,250 6
Portfolio manager (fixed income) 263,750 6 146,500 6 90,000 6 16,640 5
Bank/trust/private client portfolio manager 155,000 5 105,000 5 n/a 4 n/a 3
Buy-side research analyst (fixed income) 180,250 5 130,000 5 75,000 5 n/a 3
Financial analyst (corporate) 108,000 5 105,000 5 15,000 5 n/a 3
Wholesale/intermediary sales representative 280,000 5 130,000 5 n/a 3 n/a 4
Median total compensation for those with 5 to less than 10 years of experience is $165,000.
12
Note
Cells in yellow reflect fewer than 5 responses.
Base/Bonus/Other Comp/Total Comp figures are median and were calculated independently from each other.
Calculation of median statistics only includes those individuals who stated that they are eligible to receive a given form of compensation. Therefore, we would not expect these numbers to add up to the total compensation figure.
Suggestion: The best way to read this chart is to start with the Total Comp column ... and then use the Base, Bonus and Other Comp columns to understand generally how Total Comp is structured.
2018 FINANCIAL COMPENSATION REPORTF I N A N C I A L C O M P E N S AT I O N
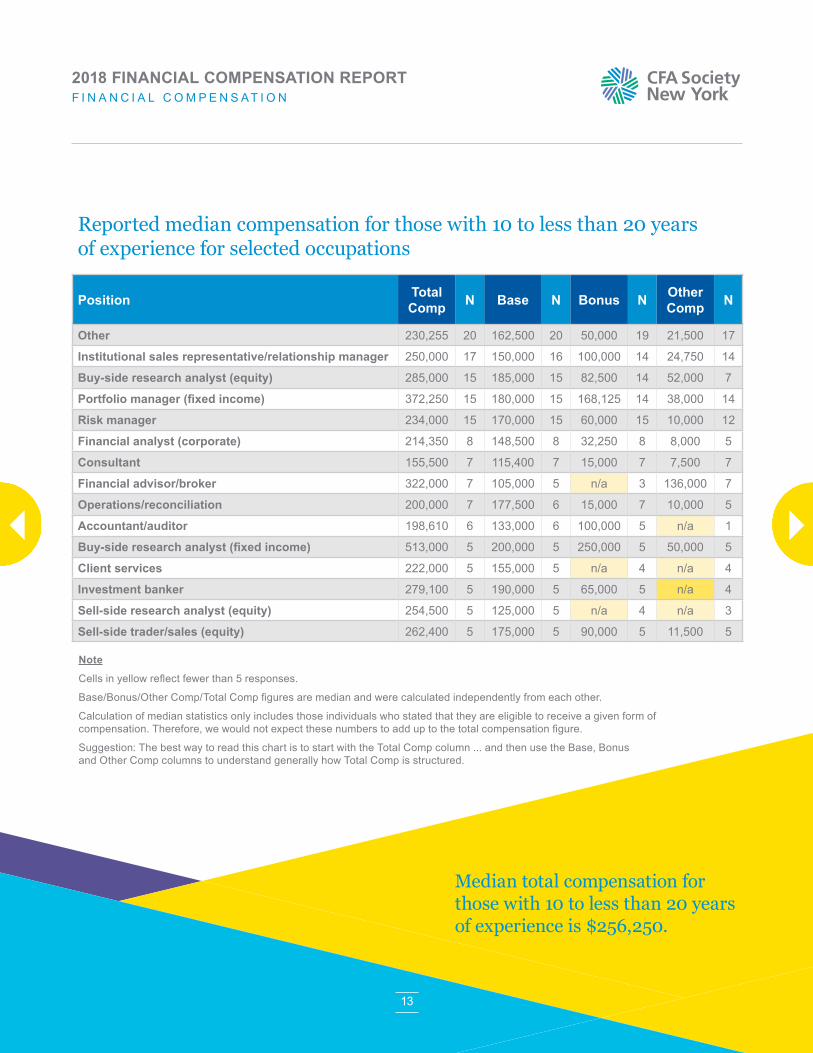
Median total compensation for those with 10 to less than 20 years of experience is $256,250.
13
Reported median compensation for those with 10 to less than 20 years of experience for selected occupations
Position Total Comp N Base N Bonus N Other
Comp N
Other 230,255 20 162,500 20 50,000 19 21,500 17
Institutional sales representative/relationship manager 250,000 17 150,000 16 100,000 14 24,750 14
Buy-side research analyst (equity) 285,000 15 185,000 15 82,500 14 52,000 7
Portfolio manager (fixed income) 372,250 15 180,000 15 168,125 14 38,000 14
Risk manager 234,000 15 170,000 15 60,000 15 10,000 12
Financial analyst (corporate) 214,350 8 148,500 8 32,250 8 8,000 5
Consultant 155,500 7 115,400 7 15,000 7 7,500 7
Financial advisor/broker 322,000 7 105,000 5 n/a 3 136,000 7
Operations/reconciliation 200,000 7 177,500 6 15,000 7 10,000 5
Accountant/auditor 198,610 6 133,000 6 100,000 5 n/a 1
Buy-side research analyst (fixed income) 513,000 5 200,000 5 250,000 5 50,000 5
Client services 222,000 5 155,000 5 n/a 4 n/a 4
Investment banker 279,100 5 190,000 5 65,000 5 n/a 4
Sell-side research analyst (equity) 254,500 5 125,000 5 n/a 4 n/a 3
Sell-side trader/sales (equity) 262,400 5 175,000 5 90,000 5 11,500 5
Note
Cells in yellow reflect fewer than 5 responses.
Base/Bonus/Other Comp/Total Comp figures are median and were calculated independently from each other.
Calculation of median statistics only includes those individuals who stated that they are eligible to receive a given form of compensation. Therefore, we would not expect these numbers to add up to the total compensation figure.
Suggestion: The best way to read this chart is to start with the Total Comp column ... and then use the Base, Bonus and Other Comp columns to understand generally how Total Comp is structured.
2018 FINANCIAL COMPENSATION REPORTF I N A N C I A L C O M P E N S AT I O N
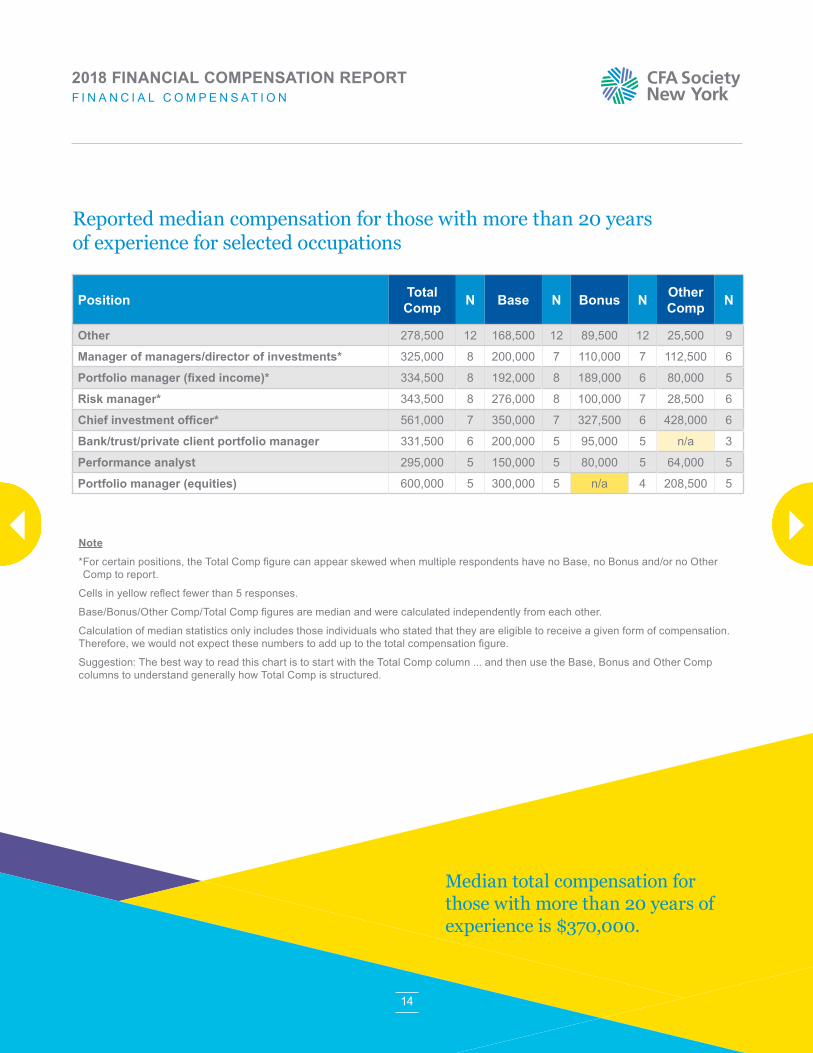
Median total compensation for those with more than 20 years of experience is $370,000.
14
Note
* For certain positions, the Total Comp figure can appear skewed when multiple respondents have no Base, no Bonus and/or no Other Comp to report.
Cells in yellow reflect fewer than 5 responses.
Base/Bonus/Other Comp/Total Comp figures are median and were calculated independently from each other.
Calculation of median statistics only includes those individuals who stated that they are eligible to receive a given form of compensation. Therefore, we would not expect these numbers to add up to the total compensation figure.
Suggestion: The best way to read this chart is to start with the Total Comp column ... and then use the Base, Bonus and Other Comp columns to understand generally how Total Comp is structured.
Reported median compensation for those with more than 20 years of experience for selected occupations
Position Total Comp N Base N Bonus N Other
Comp N
Other 278,500 12 168,500 12 89,500 12 25,500 9
Manager of managers/director of investments* 325,000 8 200,000 7 110,000 7 112,500 6
Portfolio manager (fixed income)* 334,500 8 192,000 8 189,000 6 80,000 5
Risk manager* 343,500 8 276,000 8 100,000 7 28,500 6
Chief investment officer* 561,000 7 350,000 7 327,500 6 428,000 6
Bank/trust/private client portfolio manager 331,500 6 200,000 5 95,000 5 n/a 3
Performance analyst 295,000 5 150,000 5 80,000 5 64,000 5
Portfolio manager (equities) 600,000 5 300,000 5 n/a 4 208,500 5
2018 FINANCIAL COMPENSATION REPORTF I N A N C I A L C O M P E N S AT I O N
15
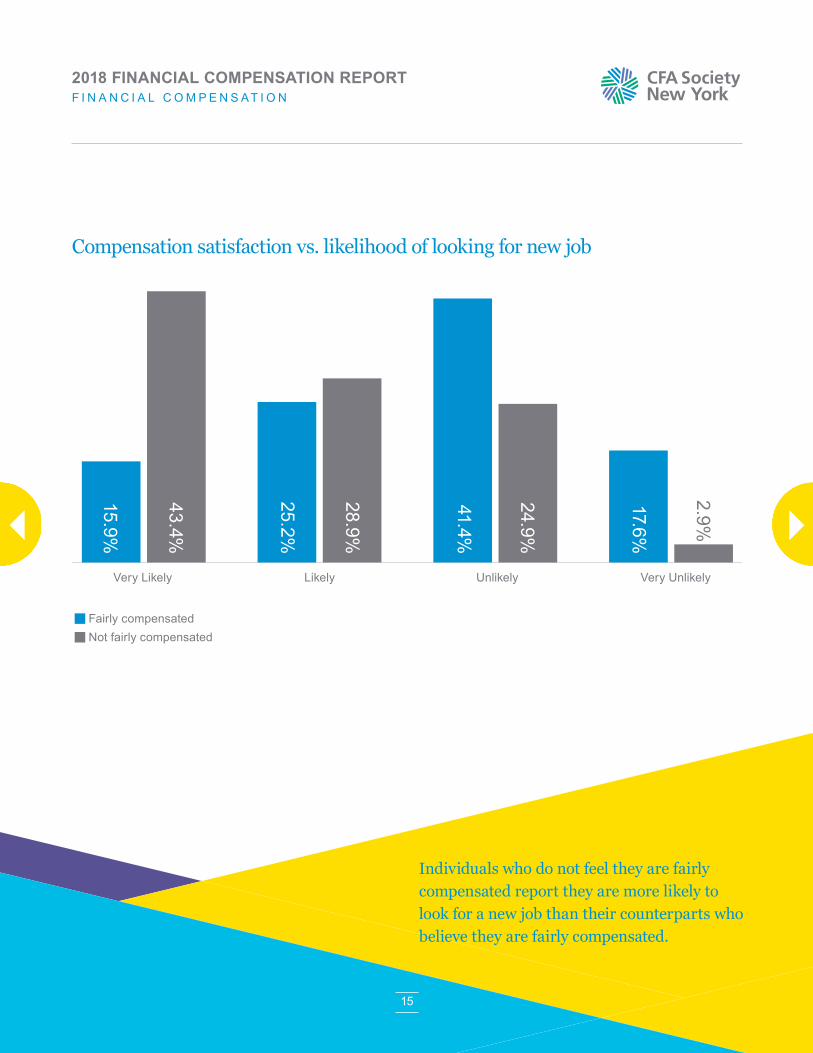
Compensation satisfaction vs. likelihood of looking for new job
Individuals who do not feel they are fairly compensated report they are more likely to look for a new job than their counterparts who believe they are fairly compensated.
Fairly compensated Not fairly compensated
15.9%
43.4%
25.2%
28.9%
41.4%
24.9%
17.6%
2.9%
Very Likely Likely Unlikely Very Unlikely
2018 FINANCIAL COMPENSATION REPORTF I N A N C I A L C O M P E N S AT I O N
16
Survey methodology
MethodAn online survey was deployed to known financial professionals in the region represented by CFA Society New York. Email subscribers of the Society and LinkedIn group members were specifically targeted. The survey was not limited to just these audiences. In addition, this survey was structured so all data gathered was anonymous, with no identifiable information requested.
RespondentsRespondents were financial and investment professionals and totaled 765 unique and completed responses.
TimingThe survey was active from May 14 – June 22, 2018.
AssumptionsThe findings from this survey were derived from self-reported data. Because the survey uses sampling methodology and broadly defined positions, survey findings are not necessarily representative of the total population; rather, the survey is designed to provide general information about pay levels within the industry. Earning any degree or professional designation is no guarantee of employment or compensation.
2018 FINANCIAL COMPENSATION REPORTS U R V E Y M E T H O D O L O G Y
17
About the CFA Society
Since 1937, CFA Society New York (CFANY) has sought to raise the standards of the investment industry through global insight, a dynamic community of local investment management professionals, and thought leadership. CFANY’s mission is to raise the bar in investment management wherever possible and help establish the course for where the investment industry is headed.
CFANY is a leading voice within a network of CFA Societies in 150 countries, representing over 145,000 CFA Institute members worldwide. CFANY works in conjunction with CFA Institute to develop the industry’s future professionals and to raise the standards of professionalism in the investment management industry.
CFANY is the largest CFA Institute member society in the world, and represents the interests of over 17,000 CFA charterholders in New York and New Jersey.
CFA Society New York has been recognized by CFA Institute, the global association of investment professionals that sets the standard for professional excellence, as the 2018 recipient of Most Outstanding Society. The 2018 Society Excellence Awards recognize CFA Institute member societies who have made an outstanding impact and contribution to delivering member value and furthering the mission of CFA Institute in their communities. The Outstanding Society award recognizes exceptional across-the-board performance in all areas, including:
• Strategic direction;
• Governance and leadership;
• Administrative, financial, and technological operations;
• Develop future professionals;
• Deliver member value;
• Build market integrity;
• Advance professionalism and professional recognition.
CFA Society New York was also bestowed the Research Foundation Award for Website and Social Media.
If you are interested in learning more about earning your charter, or to learn more about CFA Society New York, contact Mario Carias, CFA: [email protected].
Follow CFA Society New York at:
2018 FINANCIAL COMPENSATION REPORTA B O U T T H E C F A S O C I E T Y