Embed Size (px)
Citation preview

1
Prudential plc 2018 Full Year Results
2018 FULL YEAR RESULTS 2
This document may contain ‘forward-looking statements’ with respect to certain of Prudential's plans and its goals and expectations relating to its future financial condition, performance, results, strategy and objectives. Statements that are not historical facts, including statements about Prudential’s beliefs and expectations and including, without limitation, statements containing the words ‘may’, ‘will’, ‘should’, ‘continue’, ‘aims’, ‘estimates’, ‘projects’, ‘believes’, ‘intends’, ‘expects’, ‘plans’, ‘seeks’ and ‘anticipates’, and words of similar meaning, are forward-looking statements. These statements are based on plans, estimates and projections as at the time they are made, and therefore undue reliance should not be placed on them. By their nature, all forward-looking statements involve risk and uncertainty. A number of important factors could cause Prudential's actual future financial condition or performance or other indicated results to differ materially from those indicated in any forward-looking statement. Such factors include, but are not limited to, the timing, costs and successful implementation of the demerger of the M&G Prudential business; the future trading value of the shares of Prudential plc and the trading value and liquidity of the shares of the to-be-listed M&G Prudential business following such demerger; future market conditions, including fluctuations in interest rates and exchange rates the potential for a sustained low-interest rate environment, and the performance of financial markets generally; the policies and actions of regulatory authorities, including, for example, new government initiatives; the political, legal and economic effects of the UK’s decision to leave the European Union; the impact of continuing designation as a Global Systemically Important Insurer or ‘G-SII’; the impact of competition, economic uncertainty, inflation and deflation; the effect on Prudential’s business and results from, in particular, mortality and morbidity trends, lapse rates and policy renewal rates, the timing, impact and other uncertainties of future acquisitions or combinations within relevant industries; the impact of internal projects and other strategic actions failing to meet their objectives; disruption to the availability, confidentiality or integrity of Prudential’s IT systems (or those of its suppliers); the impact of changes in capital, solvency standards, accounting standards or relevant regulatory frameworks, and tax and other legislation and regulations in the jurisdictions in which Prudential and its affiliates operate; and the impact of legal and regulatory actions, investigations and disputes. These and other important factors may, for example, result in changes to assumptions used for determining results of operations or re-estimations of reserves for future policy benefits. Further discussion of these and other important factors that could cause Prudential's actual future financial condition or performance or other indicated results to differ, possibly materially, from those anticipated in Prudential's forward-looking statements can be found under the ‘Risk Factors’ heading in Prudential’s most recent Full Year Results Regulatory News Release and the ‘Risk Factors’ heading in its most recent Annual Report and the ‘Risk Factors’ heading of Prudential's most recent annual report on Form 20-F filed with the U.S. Securities and Exchange Commission, as well as under the ‘Risk Factors’ heading of any subsequent Prudential Half Year Financial Report. Prudential's most recent Annual Report, Form 20-F and any subsequent Half Year Financial Report are available on its website at www.prudential.co.uk.Any forward-looking statements contained in this document speak only as of the date on which they are made. Prudential expressly disclaims any obligation to update any of the forward-looking statements contained in this document or any other forward-looking statements it may make, whether as a result of future events, new information or otherwise except as required pursuant to the UK Prospectus Rules, the UK Listing Rules, the UK Disclosure and Transparency Rules, the Hong Kong Listing Rules, the SGX-ST listing rules or other applicable laws and regulations.
2018 FULL YEAR RESULTS 3
Asia Deep Dive
Group
Agenda
Summary
2018 FULL YEAR RESULTS 4
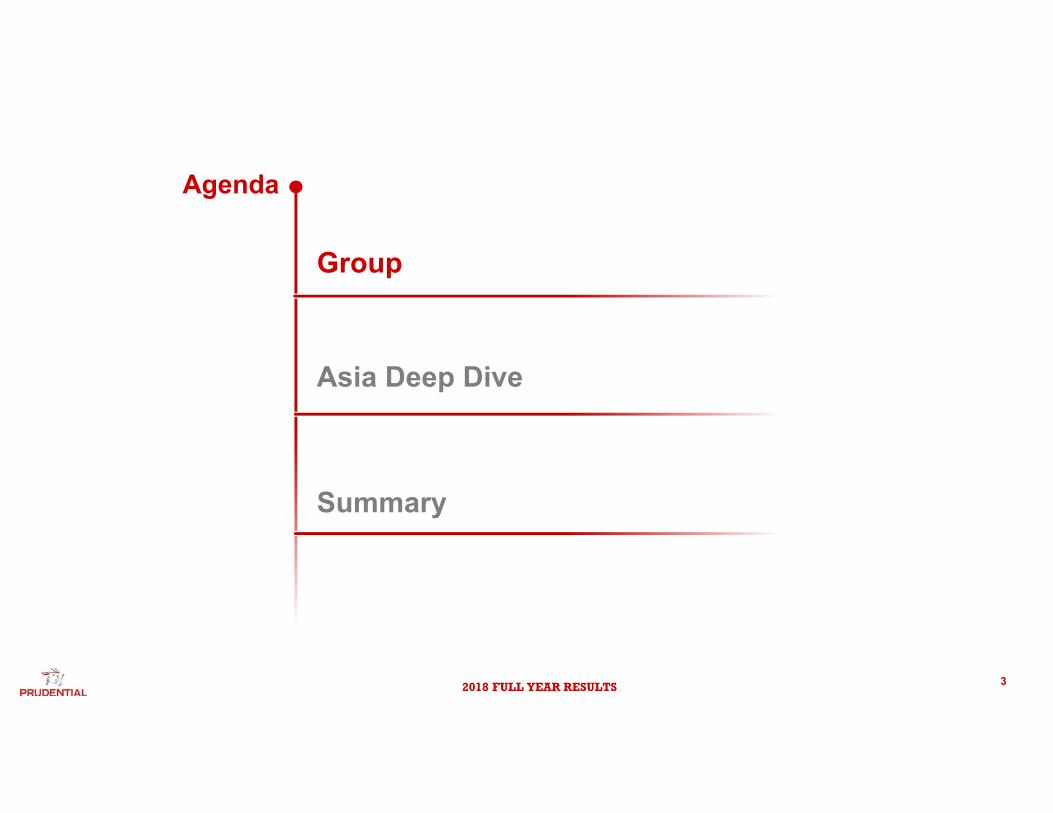
GroupKey highlights
1 Defined as constant exchange rate2 Defined as actual exchange rate
Capital
232%FY2018 Solvency II ratio
Embedded value
FY2018 Embedded value +11% vs FY2017 AER2
£50bn
Earnings
£4.8bnFY2018 IFRS operating profit
Growth
+11%FY2018 New business profit vs FY2017 CER1
Cash
FY2018 Operating free surplus generation
£4.0bn
Dividend
Growth on prior year to 49.35 pence per share
+5%
2018 FULL YEAR RESULTS 5
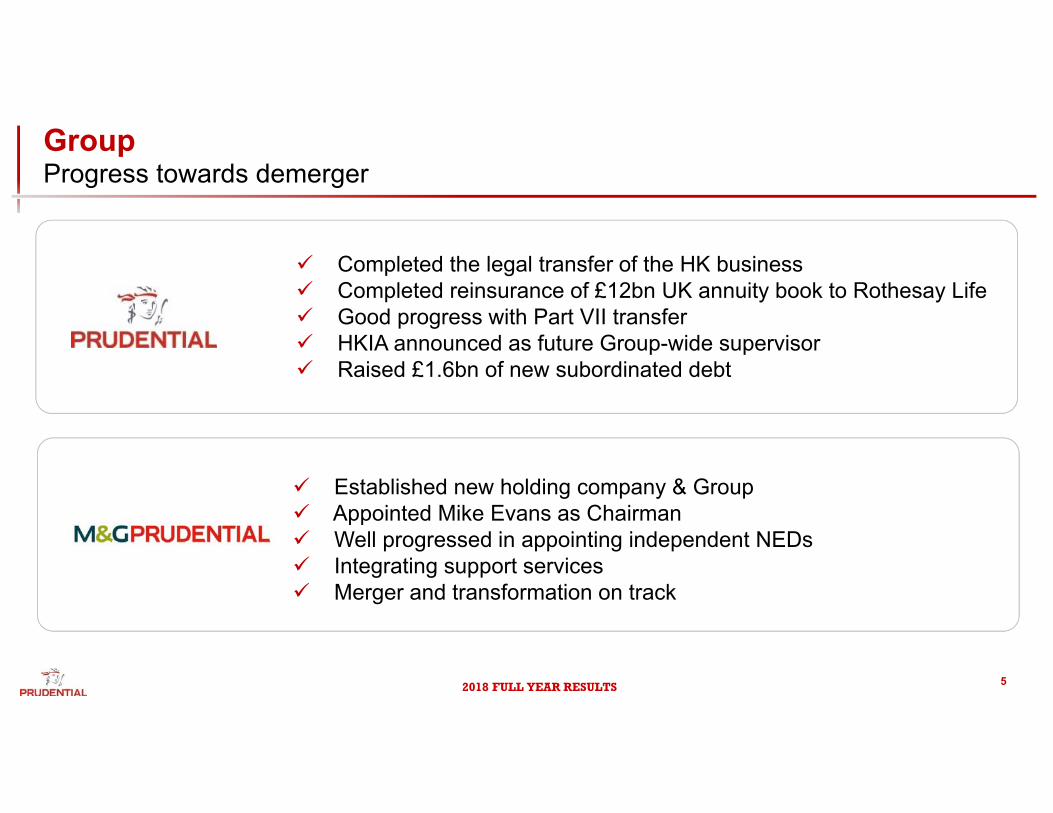
GroupProgress towards demerger
Established new holding company & Group Appointed Mike Evans as Chairman Well progressed in appointing independent NEDs Integrating support services Merger and transformation on track
Completed the legal transfer of the HK business Completed reinsurance of £12bn UK annuity book to Rothesay Life Good progress with Part VII transfer HKIA announced as future Group-wide supervisor Raised £1.6bn of new subordinated debt
2018 FULL YEAR RESULTS 6
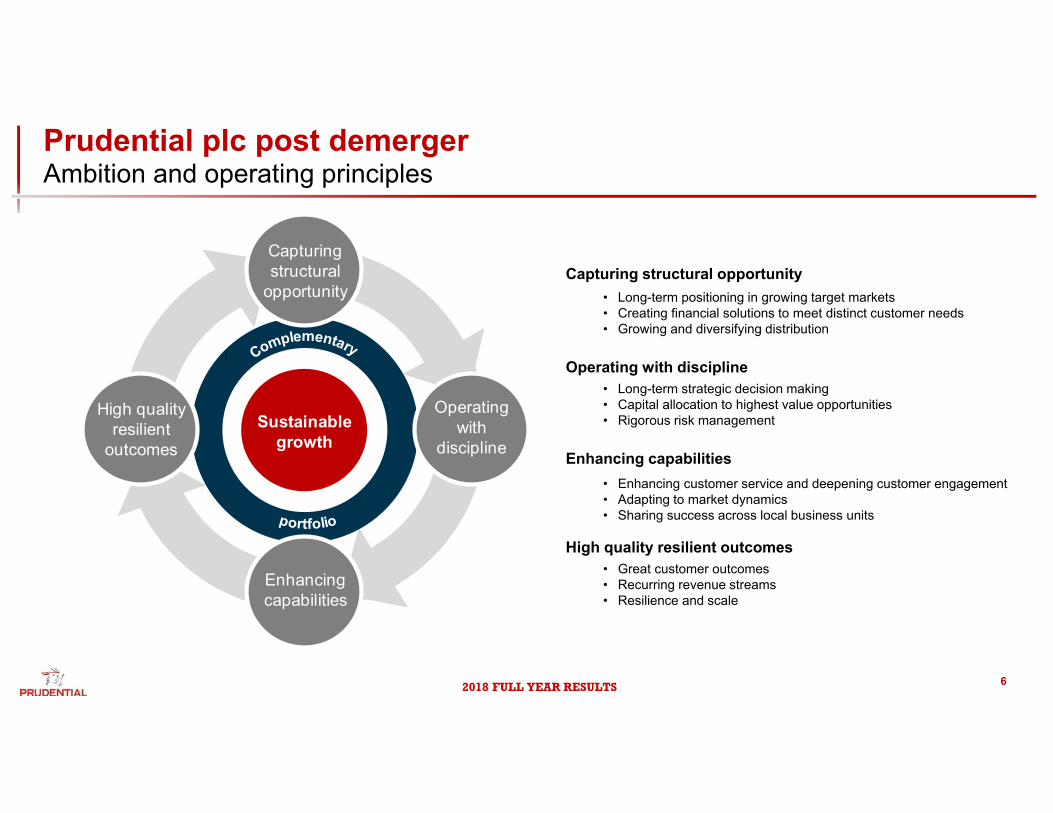
Prudential plc post demerger Ambition and operating principles
Sustainable growth
|
High qualityresilient
outcomes
Operating with
discipline
Capturingstructural
opportunity
Enhancing capabilities
Capturing structural opportunity• Long-term positioning in growing target markets• Creating financial solutions to meet distinct customer needs• Growing and diversifying distribution
Operating with discipline• Long-term strategic decision making• Capital allocation to highest value opportunities • Rigorous risk management
Enhancing capabilities• Enhancing customer service and deepening customer engagement• Adapting to market dynamics• Sharing success across local business units
High quality resilient outcomes• Great customer outcomes• Recurring revenue streams• Resilience and scale
2018 FULL YEAR RESULTS 7
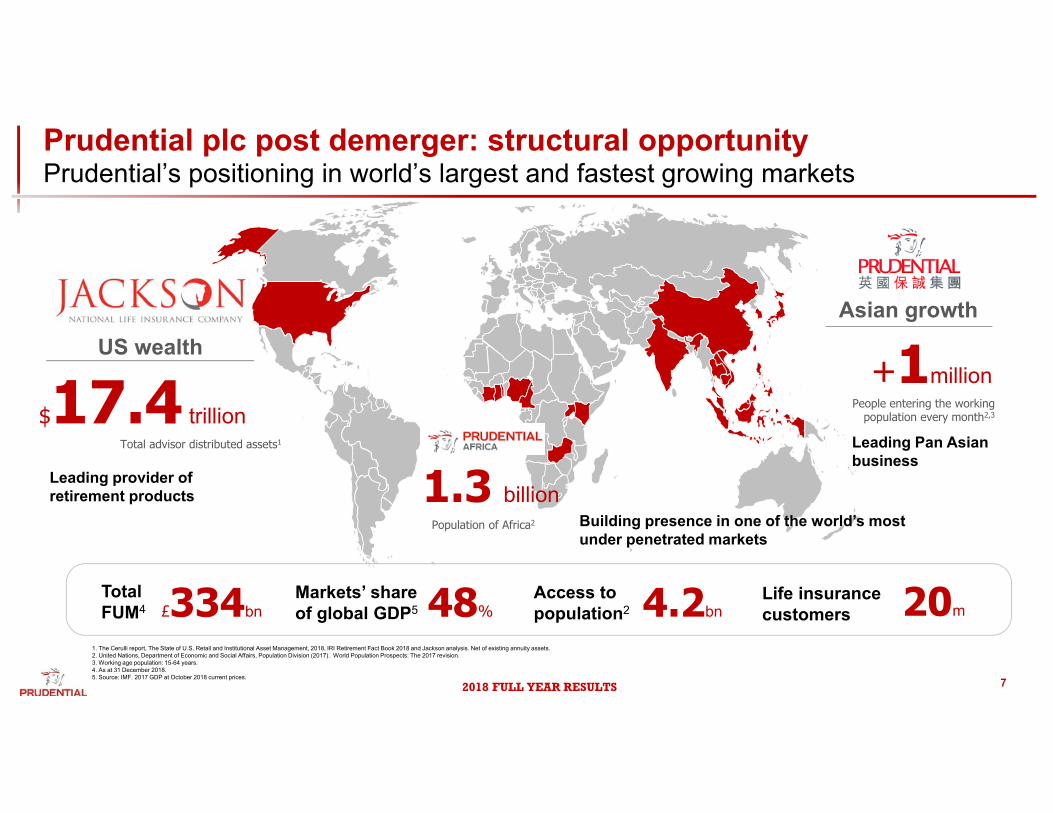
1. The Cerulli report, The State of U.S. Retail and Institutional Asset Management, 2018, IRI Retirement Fact Book 2018 and Jackson analysis. Net of existing annuity assets.2. United Nations, Department of Economic and Social Affairs, Population Division (2017). World Population Prospects: The 2017 revision.3. Working age population: 15-64 years.4. As at 31 December 2018.5. Source: IMF. 2017 GDP at October 2018 current prices.
Total FUM4
US wealth
$17.4 trillionTotal advisor distributed assets1
Asian growth
+1millionPeople entering the working
population every month2,3
Leading provider of retirement products
Leading Pan Asian business
Building presence in one of the world’s most under penetrated markets
1.3 billionPopulation of Africa2
Access to population2 4.2bn
Markets’ shareof global GDP5 48%£334bn
Life insurance customers 20m
Prudential plc post demerger: structural opportunity Prudential’s positioning in world’s largest and fastest growing markets
2018 FULL YEAR RESULTS 8
Asia Deep Dive
Group
Agenda
Summary
2018 FULL YEAR RESULTS
Thailand
69m Top 10Vietnam
97m Top 10
Laos
7m Top 3
1,354m Top 3 Top 10
Japan
127m
Korea
51mTaiwan
24m
Hong Kong
7m Top 3 Top 10Philippines
107m Top 3
Indonesia
267m Top 3 Top 10Singapore4,5
6m Top 3 Top 10
Malaysia
32m Top 3 Top 10
Cambodia6
16m Top 3
India3
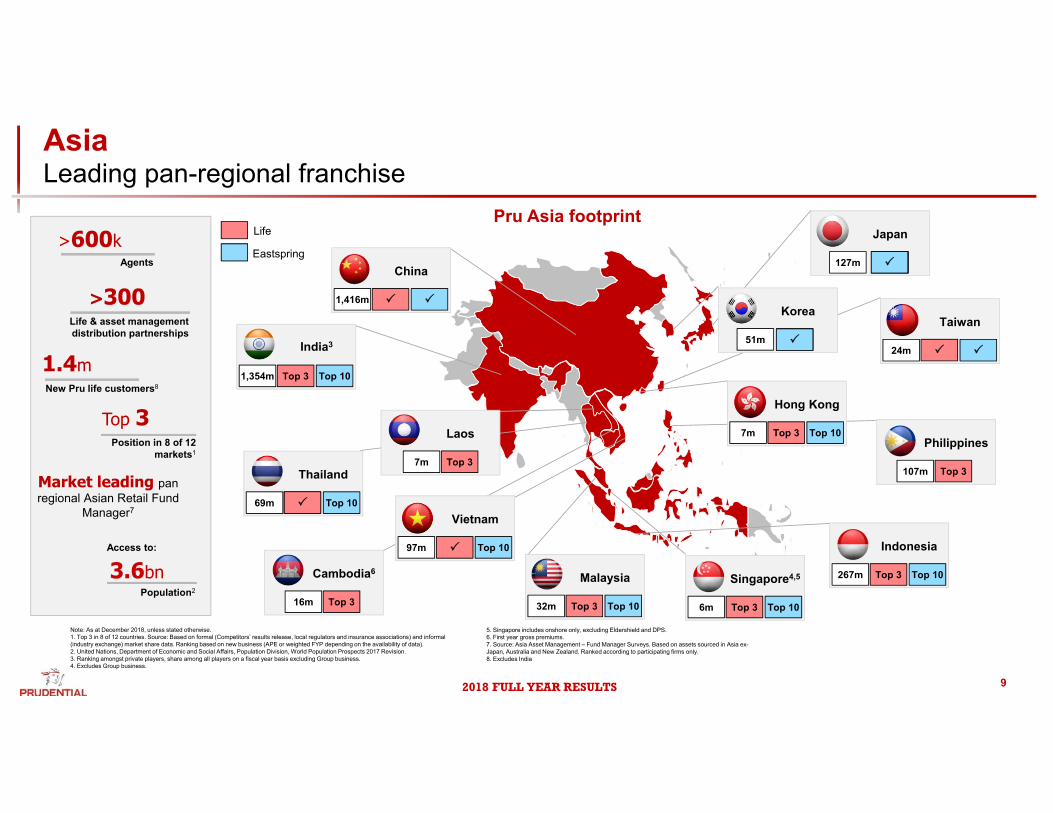
AsiaLeading pan-regional franchise
Pru Asia footprint
3.6bnPopulation2
Note: As at December 2018, unless stated otherwise.1. Top 3 in 8 of 12 countries. Source: Based on formal (Competitors’ results release, local regulators and insurance associations) and informal (industry exchange) market share data. Ranking based on new business (APE or weighted FYP depending on the availability of data).2. United Nations, Department of Economic and Social Affairs, Population Division, World Population Prospects 2017 Revision.3. Ranking amongst private players, share among all players on a fiscal year basis excluding Group business.4. Excludes Group business.
5. Singapore includes onshore only, excluding Eldershield and DPS.6. First year gross premiums.7. Source: Asia Asset Management – Fund Manager Surveys. Based on assets sourced in Asia ex-Japan, Australia and New Zealand. Ranked according to participating firms only.8. Excludes India
1.4mNew Pru life customers8
Top 3Position in 8 of 12
markets1
Market leading pan regional Asian Retail Fund
Manager7
Access to:
China
1,416m
Life
Eastspring>600k
Agents
>300Life & asset management distribution partnerships
9
2018 FULL YEAR RESULTS 10
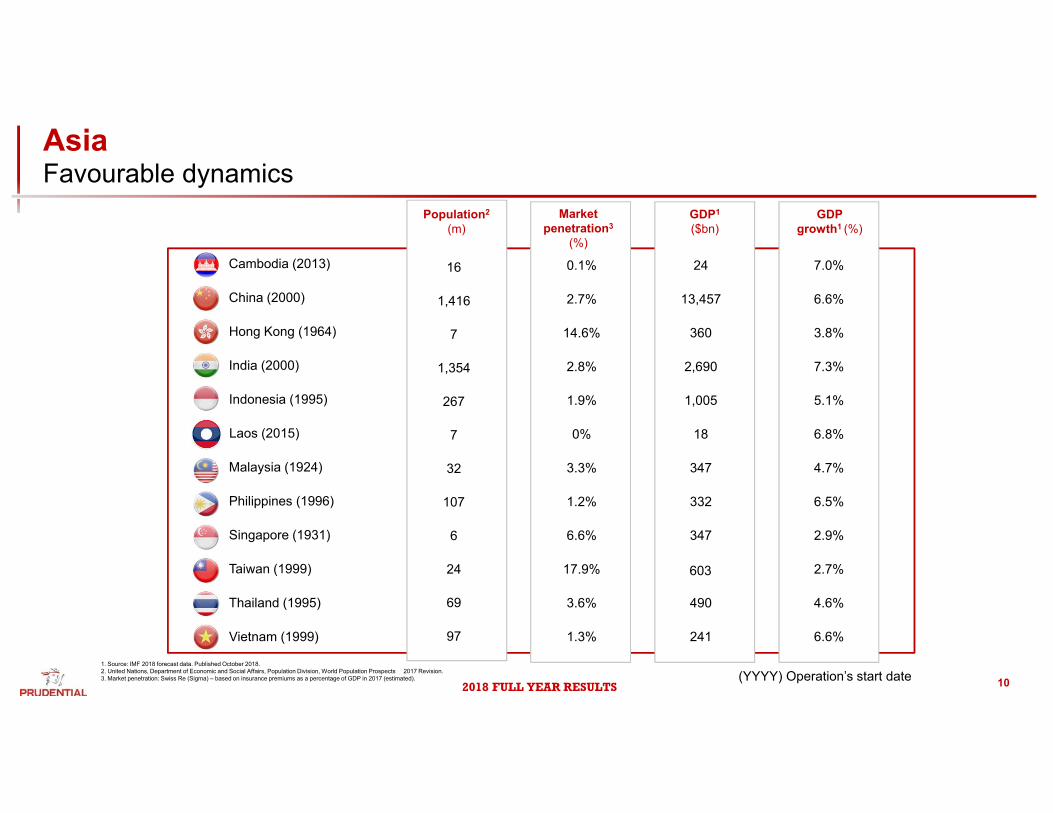
1. Source: IMF 2018 forecast data. Published October 2018.2. United Nations, Department of Economic and Social Affairs, Population Division, World Population Prospects 2017 Revision.3. Market penetration: Swiss Re (Sigma) – based on insurance premiums as a percentage of GDP in 2017 (estimated).
GDP growth1 (%)
GDP1
($bn)Population2
(m)Market
penetration3
(%)
1,005 5.1%Indonesia (1995) 267 1.9%
332 6.5%Philippines (1996) 107 1.2%
360 3.8%Hong Kong (1964) 7 14.6%
4.6%490Thailand (1995) 69 3.6%
2,690 7.3%India (2000) 1,354 2.8%
13,457 6.6%China (2000) 1,416 2.7%
603 2.7%Taiwan (1999) 24 17.9%
24 7.0%Cambodia (2013) 16 0.1%
241 6.6%Vietnam (1999) 97 1.3%
347 4.7%Malaysia (1924) 32 3.3%
347 2.9%Singapore (1931) 6 6.6%
Laos (2015) 7 0% 18 6.8%
(YYYY) Operation’s start date
AsiaFavourable dynamics
2018 FULL YEAR RESULTS
China (Top 10 provinces, GWP)
CITICPru
Par Fund3
5.74.6 4.7
5.85.0 4.4 4.2
6.0
3Y 5Y 3Y 5Y
Singapore Hong Kong
Fund
Ben
chm
ark
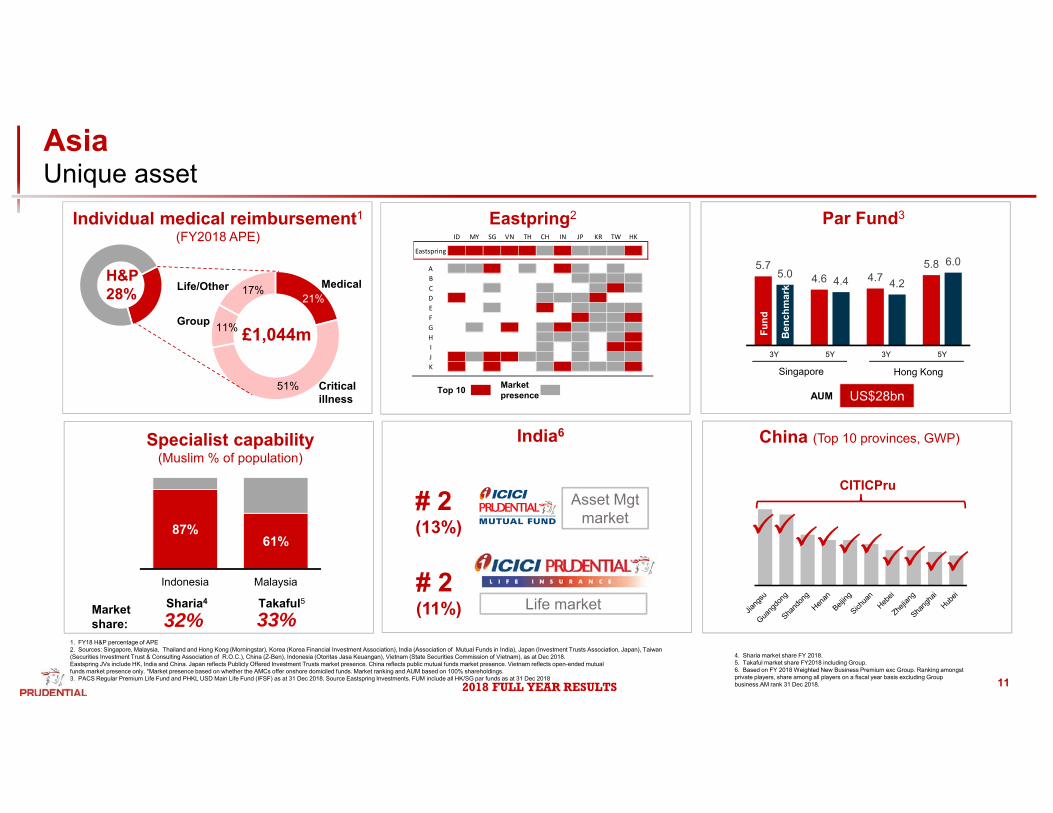
1. FY18 H&P percentage of APE2. Sources: Singapore, Malaysia, Thailand and Hong Kong (Morningstar), Korea (Korea Financial Investment Association), India (Association of Mutual Funds in India), Japan (Investment Trusts Association, Japan), Taiwan (Securities Investment Trust & Consulting Association of R.O.C.), China (Z-Ben), Indonesia (Otoritas Jasa Keuangan), Vietnam (State Securities Commission of Vietnam), as at Dec 2018.Eastspring JVs include HK, India and China. Japan reflects Publicly Offered Investment Trusts market presence. China reflects public mutual funds market presence. Vietnam reflects open-ended mutualfunds market presence only. *Market presence based on whether the AMCs offer onshore domiciled funds. Market ranking and AUM based on 100% shareholdings.3. PACS Regular Premium Life Fund and PHKL USD Main Life Fund (IFSF) as at 31 Dec 2018. Source Eastspring Investments. FUM include all HK/SG par funds as at 31 Dec 2018
AsiaUnique asset
87%61%
Indonesia Malaysia
32%
Specialist capability(Muslim % of population)
Market share: 33%
Top 10 Market presence
Eastpring2Individual medical reimbursement1
(FY2018 APE)
India6
# 2(13%)
# 2(11%) Life market
Asset Mgtmarket
H&P28%
Critical illness
Medical
Group
Life/Other
£1,044m
Sharia4 Takaful5
4. Sharia market share FY 2018.5. Takaful market share FY2018 including Group.6. Based on FY 2018 Weighted New Business Premium exc Group. Ranking amongst private players, share among all players on a fiscal year basis excluding Group business.AM rank 31 Dec 2018.
17%
11%
51%
21%
US$28bnAUM
11
ID MY SG VN TH CH IN JP KR TW HK
Eastspring
ABCDEFGHIJK
2018 FULL YEAR RESULTS
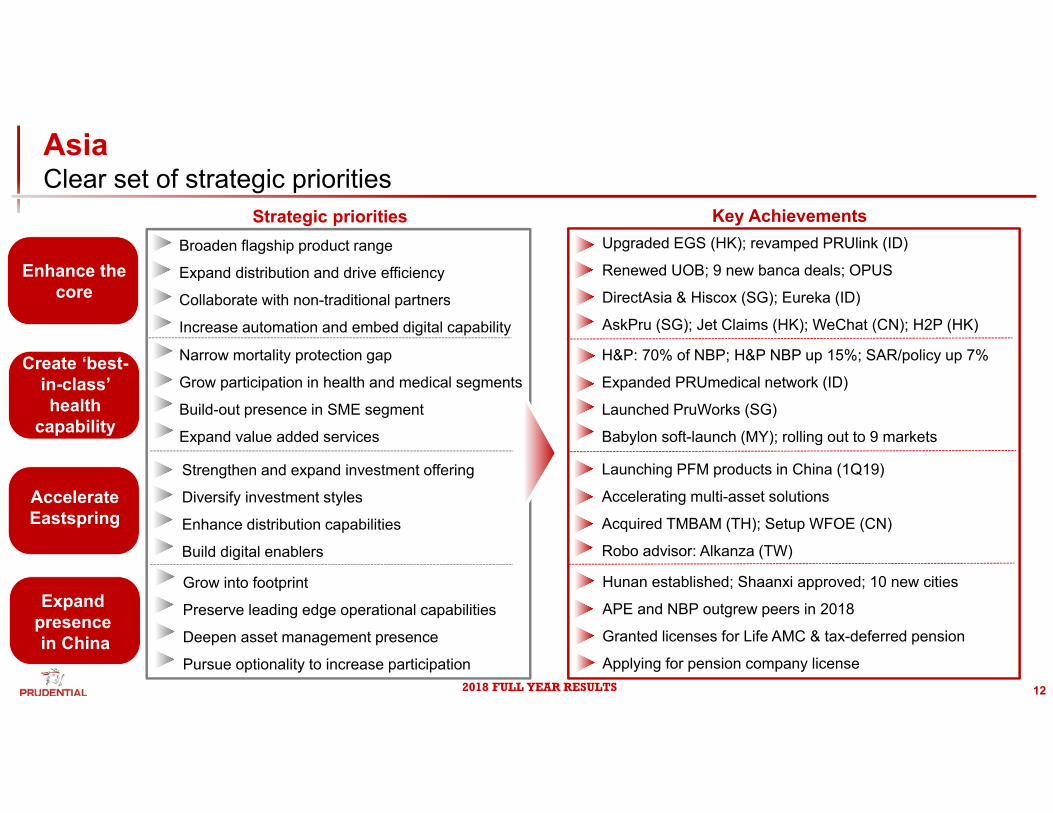
AsiaClear set of strategic priorities
Enhance the core
Accelerate Eastspring
Expand presencein China
Create ‘best-in-class’ health
capability
Narrow mortality protection gap
Grow participation in health and medical segments
Build-out presence in SME segment
Expand value added services
Strengthen and expand investment offering
Diversify investment styles
Enhance distribution capabilities
Build digital enablers
Grow into footprint
Preserve leading edge operational capabilities
Deepen asset management presence
Pursue optionality to increase participation
Broaden flagship product range
Expand distribution and drive efficiency
Collaborate with non-traditional partners
Increase automation and embed digital capability
Strategic priorities
12
Key Achievements
Hunan established; Shaanxi approved; 10 new cities
APE and NBP outgrew peers in 2018
Granted licenses for Life AMC & tax-deferred pension
Applying for pension company license
Launching PFM products in China (1Q19)
Accelerating multi-asset solutions
Acquired TMBAM (TH); Setup WFOE (CN)
Robo advisor: Alkanza (TW)
H&P: 70% of NBP; H&P NBP up 15%; SAR/policy up 7%
Expanded PRUmedical network (ID)
Launched PruWorks (SG)
Babylon soft-launch (MY); rolling out to 9 markets
Upgraded EGS (HK); revamped PRUlink (ID)
Renewed UOB; 9 new banca deals; OPUS
DirectAsia & Hiscox (SG); Eureka (ID)
AskPru (SG); Jet Claims (HK); WeChat (CN); H2P (HK)
2018 FULL YEAR RESULTS
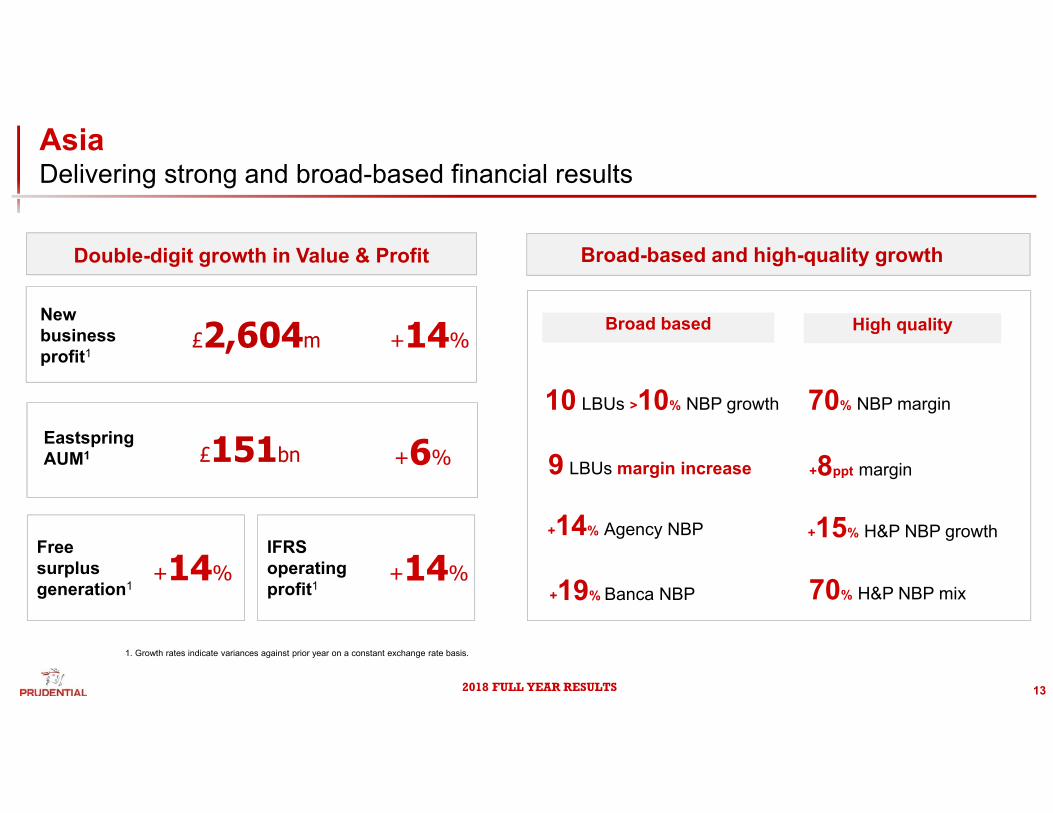
AsiaDelivering strong and broad-based financial results
1. Growth rates indicate variances against prior year on a constant exchange rate basis.
13
New business profit1
Eastspring AUM1
Free surplus generation1
£2,604m
Double-digit growth in Value & Profit
£151bn
£590m IFRS operating profit1
+14%
+6%
+14% +14%
Broad-based and high-quality growth
10 LBUs >10% NBP growth
9 LBUs margin increase
+14% Agency NBP
+19% Banca NBP
Broad based High quality
70% NBP margin
+8ppt margin
+15% H&P NBP growth
70% H&P NBP mix
2018 FULL YEAR RESULTS
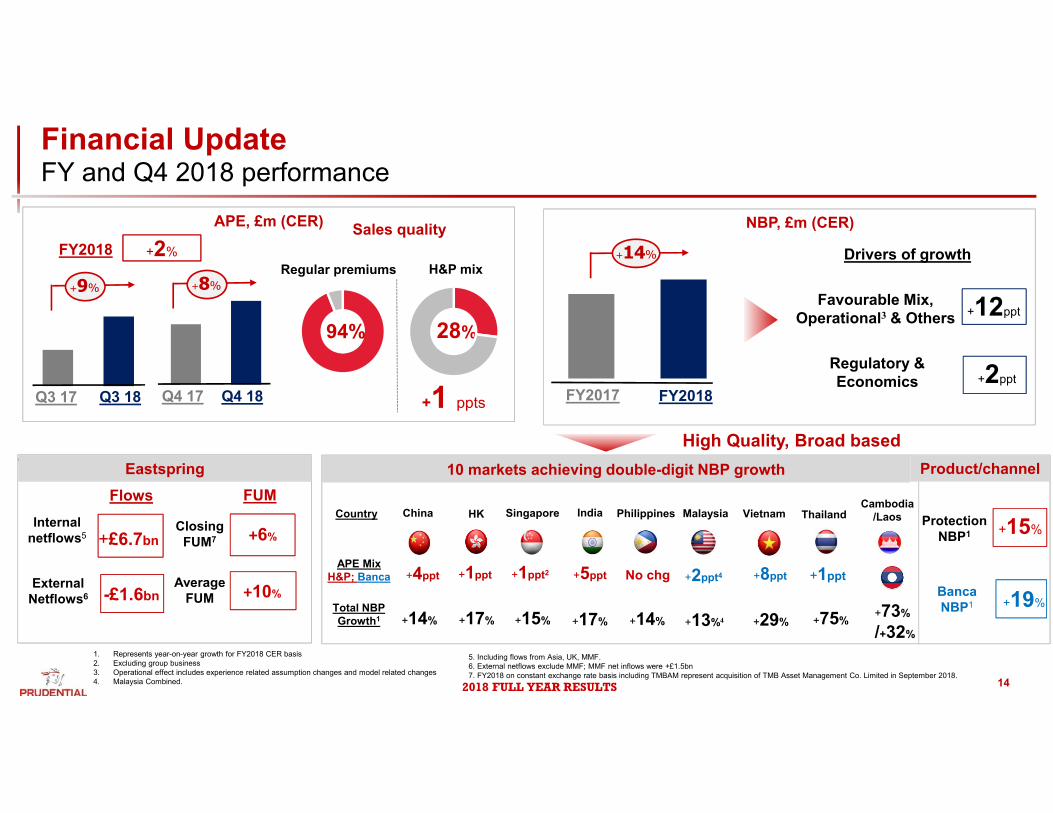
Financial UpdateFY and Q4 2018 performance
14
APE, £m (CER) Sales quality
Regular premiums
94%
H&P mix
+1 ppts
9%
+9% +8%
Q3 18Q3 17 Q4 18Q4 17
+2%FY2018
28%
NBP, £m (CER)
Regulatory & Economics
+12ppt
+2ppt
Favourable Mix, Operational3 & Others
9%
+14%
FY2018FY2017
Drivers of growth
1. Represents year-on-year growth for FY2018 CER basis2. Excluding group business3. Operational effect includes experience related assumption changes and model related changes4. Malaysia Combined.
5. Including flows from Asia, UK, MMF.6. External netflows exclude MMF; MMF net inflows were +£1.5bn7. FY2018 on constant exchange rate basis including TMBAM represent acquisition of TMB Asset Management Co. Limited in September 2018.
vEastspring
Internal netflows5 +£6.7bn
External Netflows6 -£1.6bn
Closing FUM7 +6%
Average FUM +10%
Flows FUM
High Quality, Broad based
Total NBP Growth1
Product/channel
BancaNBP1 +19%
Protection NBP1 +15%
+14%
+4ppt
China
+17%
+1ppt
HK
+15%
+1ppt2
Singapore India
+5ppt
+17%
Malaysia
+2ppt4
+13%4
+8ppt
+29%
Vietnam
+75%
+1ppt
Thailand
10 markets achieving double-digit NBP growth
Country
APE MixH&P; Banca
Philippines
+14%
No chg
Cambodia/Laos
+73%
/+32%
2018 FULL YEAR RESULTS 15
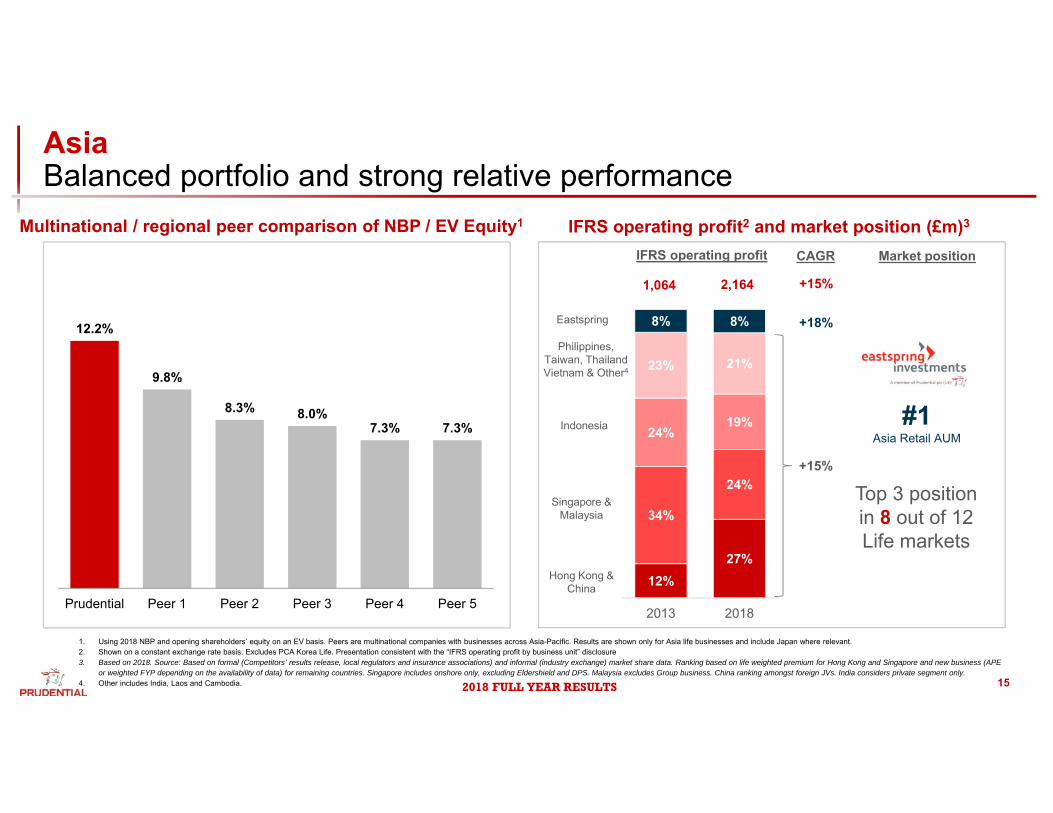
AsiaBalanced portfolio and strong relative performance
1. Using 2018 NBP and opening shareholders’ equity on an EV basis. Peers are multinational companies with businesses across Asia-Pacific. Results are shown only for Asia life businesses and include Japan where relevant. 2. Shown on a constant exchange rate basis. Excludes PCA Korea Life. Presentation consistent with the “IFRS operating profit by business unit” disclosure3. Based on 2018. Source: Based on formal (Competitors’ results release, local regulators and insurance associations) and informal (industry exchange) market share data. Ranking based on life weighted premium for Hong Kong and Singapore and new business (APE
or weighted FYP depending on the availability of data) for remaining countries. Singapore includes onshore only, excluding Eldershield and DPS. Malaysia excludes Group business. China ranking amongst foreign JVs. India considers private segment only.4. Other includes India, Laos and Cambodia.
12.2%
9.8%
8.3% 8.0%7.3% 7.3%
Prudential Peer 1 Peer 2 Peer 3 Peer 4 Peer 5
Multinational / regional peer comparison of NBP / EV Equity1
12%27%
34%
24%
24%19%
23% 21%
8% 8%
2013 2018
IFRS operating profit2 and market position (£m)3
Hong Kong & China
Singapore & Malaysia
Indonesia
Philippines, Taiwan, Thailand Vietnam & Other4
Eastspring
2,1641,064 +15%
CAGR
+18%
+15%
Market position
#1Asia Retail AUM
Top 3 position in 8 out of 12 Life markets
IFRS operating profit
2018 FULL YEAR RESULTS
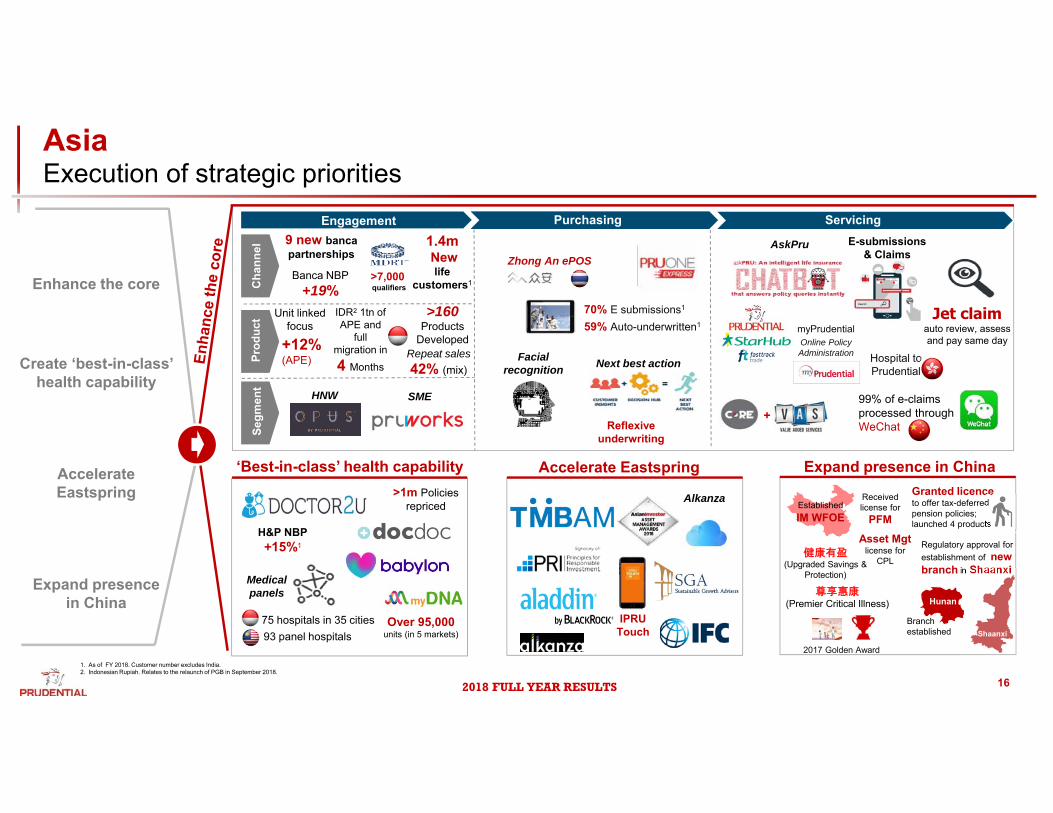
Purchasing Servicing
Zhong An ePOSAskPru E-submissions
& Claims
Next best action
Accelerate Eastspring‘Best-in-class’ health capability Expand presence in China
Facial recognition
Medical panels
75 hospitals in 35 cities93 panel hospitals
2017 Golden Award
尊享惠康(Premier Critical Illness)
Granted licenceto offer tax-deferred pension policies; launched 4 products
HunanRegulatory approval for establishment of new branch in Shaanxi
EstablishedIM WFOE
>1m Policies repriced
Asset Mgtlicense for
CPL
99% of e-claims processed through WeChat
+Reflexive
underwriting
Jet claimauto review, assess and pay same day
Hospital to Prudential
myPrudentialOnline Policy Administration
Over 95,000 units (in 5 markets)
70% E submissions1
59% Auto-underwritten1
Alkanza
IPRU Touch
Create ‘best-in-class’ health capability
Enhance the core
Expand presence in China
Accelerate Eastspring
Engagement
Cha
nnel
Prod
uct
Segm
ent
Banca NBP+19%
9 new banca partnerships
>7,000 qualifiers
Unit linked focus
+12% (APE)
HNW SME
1.4mNew life
customers1
H&P NBP+15%1
Repeat sales42% (mix)
>160Products
Developed
IDR2 1tn of APE and
full migration in 4 Months
健康有盈(Upgraded Savings &
Protection)
Received license for
PFM
1. As of FY 2018. Customer number excludes India.2. Indonesian Rupiah. Relates to the relaunch of PGB in September 2018.
16
Hunan
Branch established Shaanxi
AsiaExecution of strategic priorities
2018 FULL YEAR RESULTS
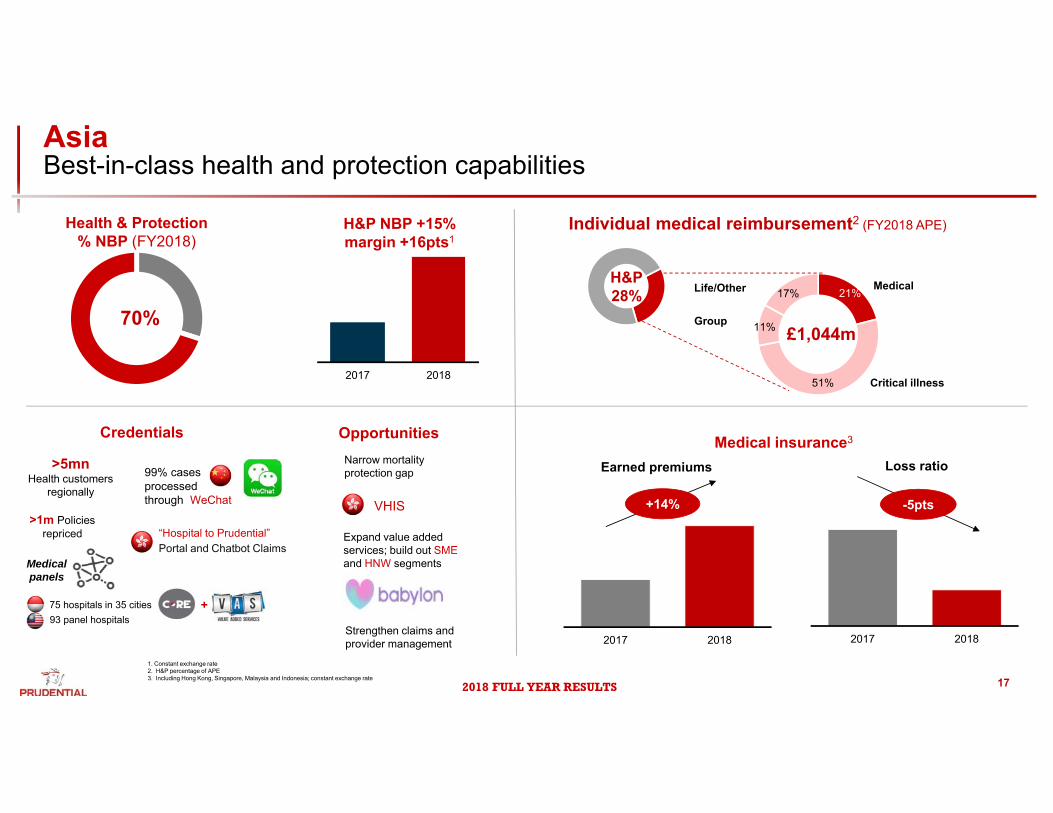
AsiaBest-in-class health and protection capabilities
17
Individual medical reimbursement2 (FY2018 APE)
H&P28%
Critical illness
Medical
Group
Life/Other
£1,044m
17%
11%
51%
21%
2017 2018
Earned premiums Loss ratio
2017 2018
+14% -5pts
Medical insurance3
Health & Protection % NBP (FY2018)
70%
2017 2018
H&P NBP +15% margin +16pts1
Medical panels
75 hospitals in 35 cities93 panel hospitals
>1m Policies repriced “Hospital to Prudential”
Portal and Chatbot Claims
>5mnHealth customers
regionally
99% cases processed through WeChat
Credentials
1. Constant exchange rate2. H&P percentage of APE3. Including Hong Kong, Singapore, Malaysia and Indonesia; constant exchange rate
+
Opportunities
VHIS
Strengthen claims and provider management
Expand value added services; build out SMEand HNW segments
Narrow mortality protection gap
2018 FULL YEAR RESULTS
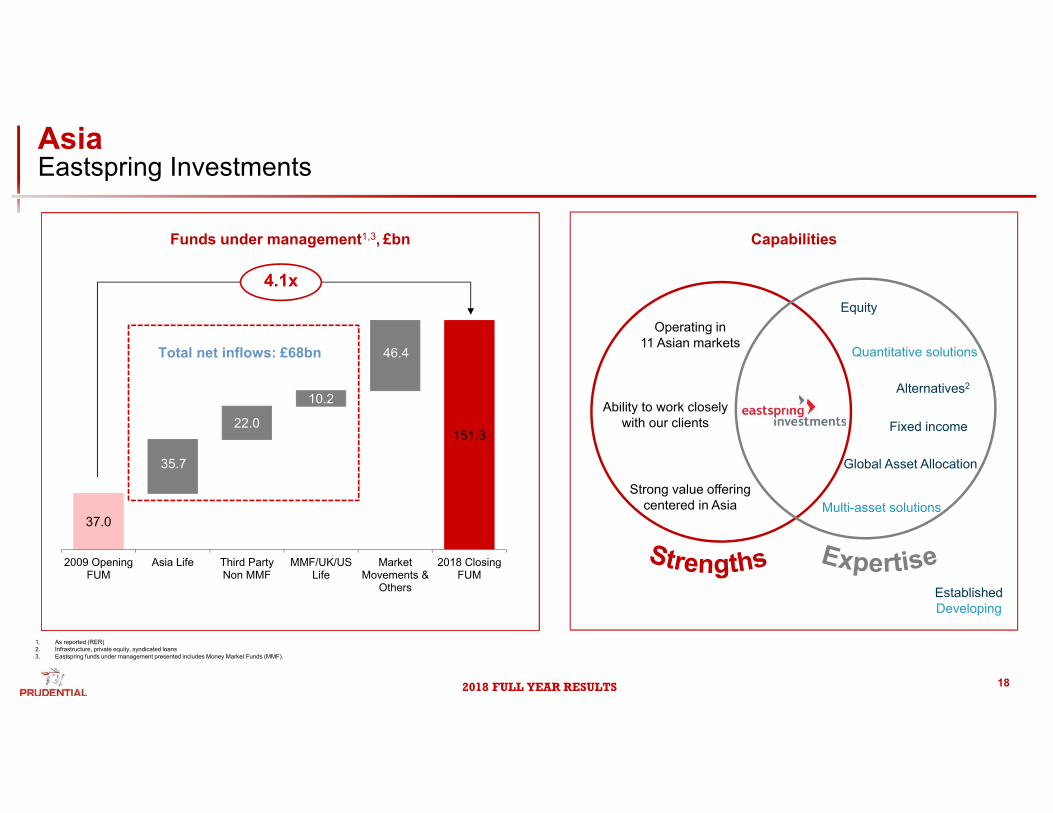
AsiaEastspring Investments
18
1. As reported (RER)2. Infrastructure, private equity, syndicated loans3. Eastspring funds under management presented includes Money Market Funds (MMF).
Equity
Fixed income
Global Asset Allocation
Quantitative solutions
Alternatives2
Multi-asset solutions
Ability to work closely with our clients
Operating in 11 Asian markets
Strong value offering centered in Asia
EstablishedDeveloping
CapabilitiesFunds under management1,3, £bn
37.0
151.3
35.7
22.0
10.2
46.4
2009 OpeningFUM
Asia Life Third PartyNon MMF
MMF/UK/USLife
MarketMovements &
Others
2018 ClosingFUM
Total net inflows: £68bn
4.1x
2018 FULL YEAR RESULTS
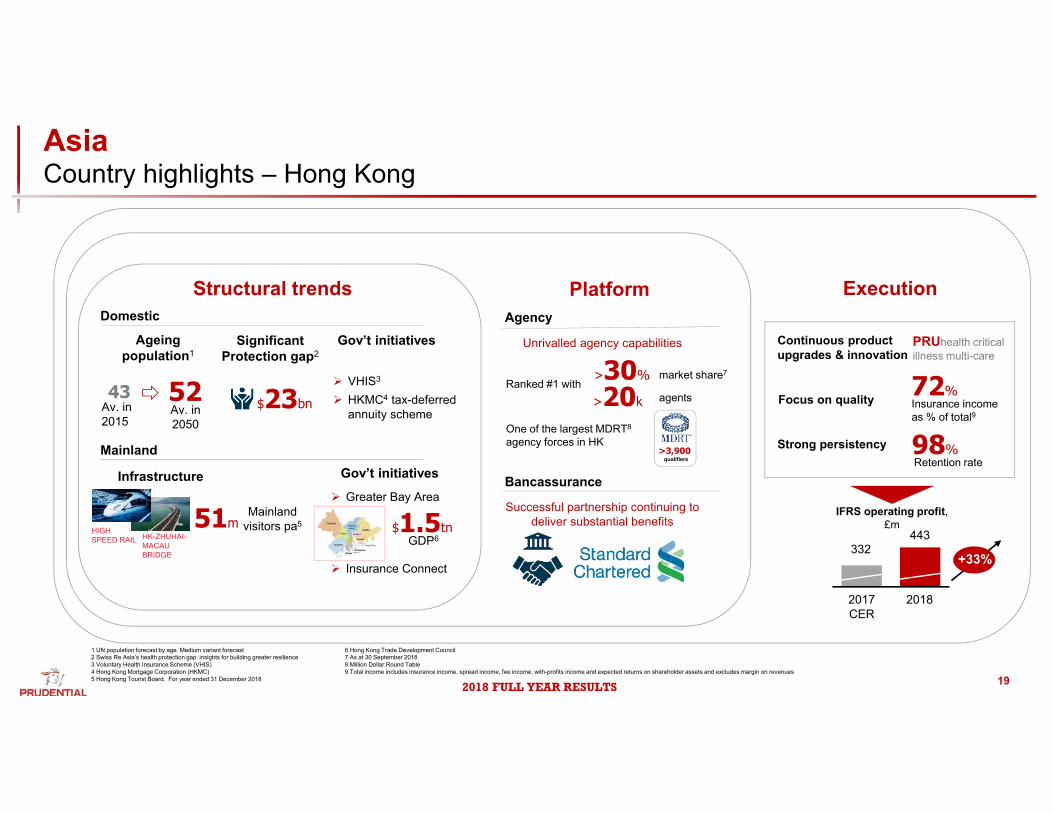
Execution
IFRS operating profit, £m
2017CER
2018
+33%
443332
Continuous product upgrades & innovation
98%Retention rate
72%Insurance incomeas % of total9
Strong persistency
Focus on quality
PRUhealth critical illness multi-care
Platform
>3,900 qualifiers
>20k agents Ranked #1 with
>30%
Agency
Bancassurance
market share7
Successful partnership continuing to deliver substantial benefits
Unrivalled agency capabilities
One of the largest MDRT8
agency forces in HK
19
1 UN population forecast by age. Medium variant forecast2 Swiss Re Asia’s health protection gap: insights for building greater resilience3 Voluntary Health Insurance Scheme (VHIS)4 Hong Kong Mortgage Corporation (HKMC)5 Hong Kong Tourist Board. For year ended 31 December 2018
Structural trends
HIGH SPEED RAIL HK-ZHUHAI-
MACAU BRIDGE
51m
Infrastructure Gov’t initiatives
Mainland visitors pa5
Mainland
Gov’t initiativesSignificant Protection gap2
Ageing population1
$23bn
Domestic
VHIS3
HKMC4 tax-deferred annuity scheme
43Av. in 2015
Av. in 2050
52
$1.5tnGDP6
Greater Bay Area
Insurance Connect
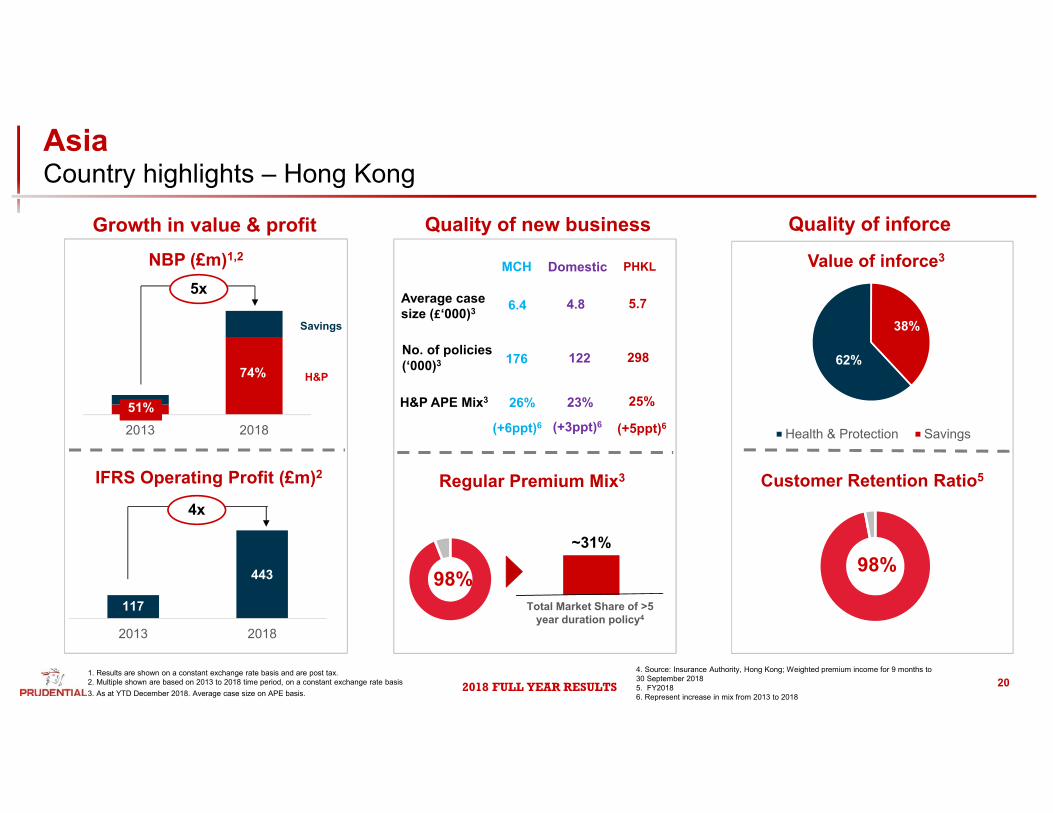
AsiaCountry highlights – Hong Kong
6 Hong Kong Trade Development Council7 As at 30 September 20188 Million Dollar Round Table9 Total income includes insurance income, spread income, fee income, with-profits income and expected returns on shareholder assets and excludes margin on revenues
2018 FULL YEAR RESULTS 204. Source: Insurance Authority, Hong Kong; Weighted premium income for 9 months to 30 September 20185. FY20186. Represent increase in mix from 2013 to 2018
Quality of inforce
Customer Retention Ratio5
Value of inforce3
98%
62%
38%
Health & Protection Savings
3. As at YTD December 2018. Average case size on APE basis.
Quality of new business
~31%
Total Market Share of >5 year duration policy4
MCH Domestic
Average case size (£‘000)3 6.4 4.8 5.7
No. of policies (‘000)3 176 122 298
H&P APE Mix3 26% 23% 25%
Regular Premium Mix3
PHKL
98%
(+6ppt)6 (+3ppt)6 (+5ppt)6
AsiaCountry highlights – Hong Kong
NBP (£m)1,2
H&P
Savings
IFRS Operating Profit (£m)2
Growth in value & profit
1. Results are shown on a constant exchange rate basis and are post tax.2. Multiple shown are based on 2013 to 2018 time period, on a constant exchange rate basis
74%
2013 2018
51%
5x
117
443
2013 2018
4x
74%
2018 FULL YEAR RESULTS
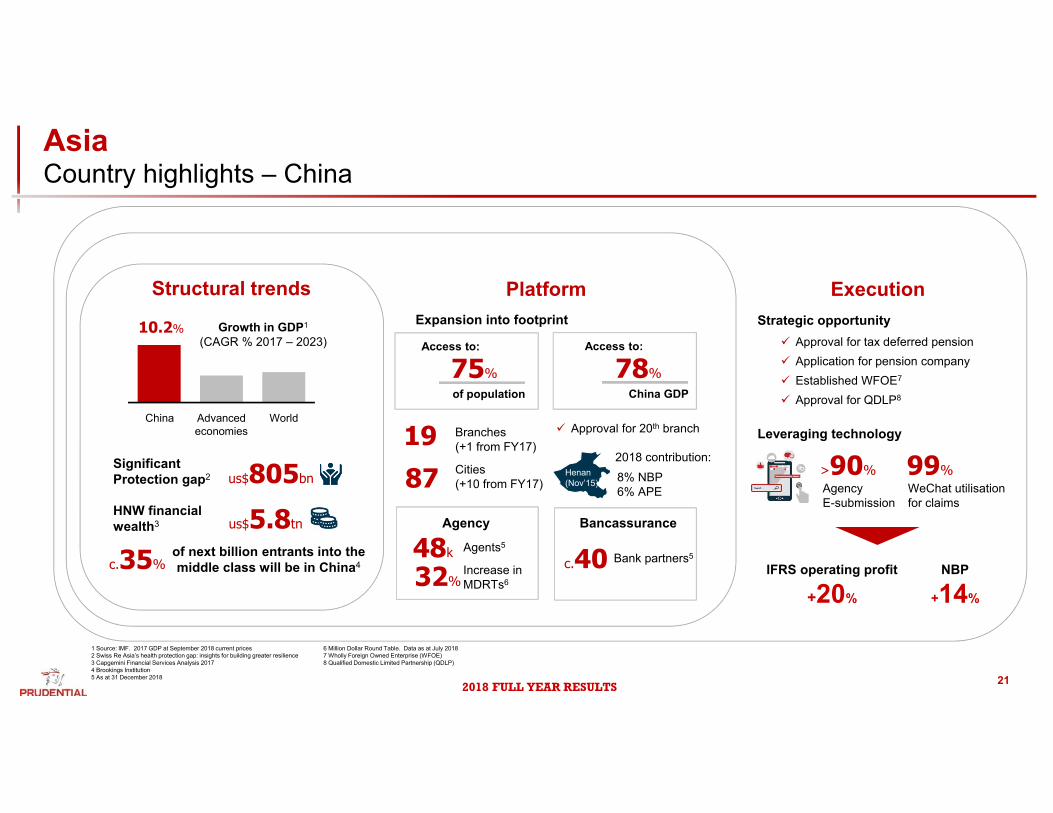
ExecutionStrategic opportunity
Approval for tax deferred pension
Established WFOE7
Approval for QDLP8
Application for pension company
Agency E-submission
WeChat utilisation for claims
99%>90%
Leveraging technology
PlatformExpansion into footprint
Access to:
75%of population
1987
Branches (+1 from FY17)
Cities (+10 from FY17)
Henan(Nov’15)
2018 contribution:8% NBP6% APE
Approval for 20th branch
48k Agents5
32%Increase in MDRTs6
Agency
c.40 Bank partners5
Bancassurance
Access to:
China GDP78%
AsiaCountry highlights – China
21
Structural trends
China WorldAdvanced economies
10.2% Growth in GDP1
(CAGR % 2017 – 2023)
Significant Protection gap2 us$805bn
HNW financial wealth3 us$5.8tn
c.35%of next billion entrants into the middle class will be in China4
1 Source: IMF. 2017 GDP at September 2018 current prices 2 Swiss Re Asia’s health protection gap: insights for building greater resilience3 Capgemini Financial Services Analysis 20174 Brookings Institution5 As at 31 December 2018
6 Million Dollar Round Table. Data as at July 20187 Wholly Foreign Owned Enterprise (WFOE)8 Qualified Domestic Limited Partnership (QDLP)
IFRS operating profit
+20%
NBP
+14%
2018 FULL YEAR RESULTS
ChinaTrack record of profitable growth of provincial branches
22
1. Top 7 branches by size of NBP in 20182. Citic Pru Life3. Constant exchange rates; NBP on post-tax basis; IFRS operating profit on pretax basis4. Willis Towers Watson
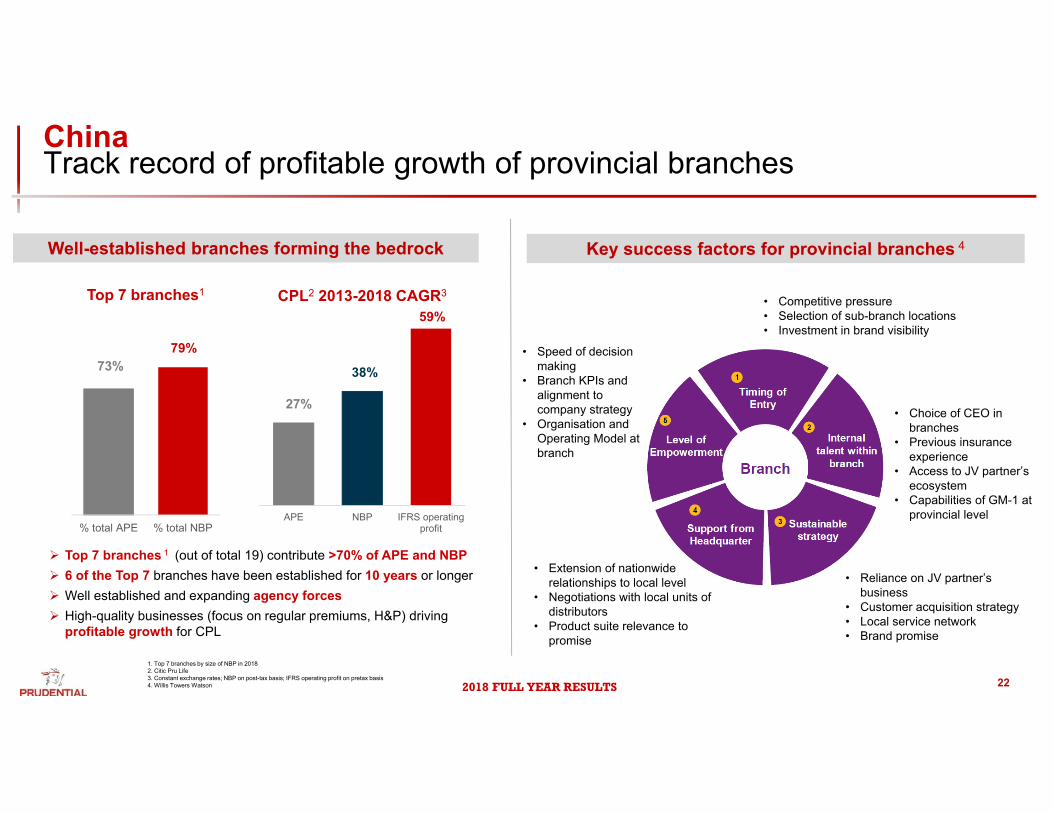
Well-established branches forming the bedrock Key success factors for provincial branches 4
Top 7 branches 1 (out of total 19) contribute >70% of APE and NBP 6 of the Top 7 branches have been established for 10 years or longer Well established and expanding agency forces High-quality businesses (focus on regular premiums, H&P) driving
profitable growth for CPL
% total APE % total NBP
Top 7 branches1
73%79%
APE NBP IFRS operatingprofit
CPL2 2013-2018 CAGR3
59%
38%
27%
• Competitive pressure• Selection of sub-branch locations• Investment in brand visibility
• Choice of CEO in branches
• Previous insurance experience
• Access to JV partner’s ecosystem
• Capabilities of GM-1 at provincial level
• Reliance on JV partner’s business
• Customer acquisition strategy• Local service network• Brand promise
• Extension of nationwide relationships to local level
• Negotiations with local units of distributors
• Product suite relevance to promise
• Speed of decision making
• Branch KPIs and alignment to company strategy
• Organisation and Operating Model at branch
2018 FULL YEAR RESULTS
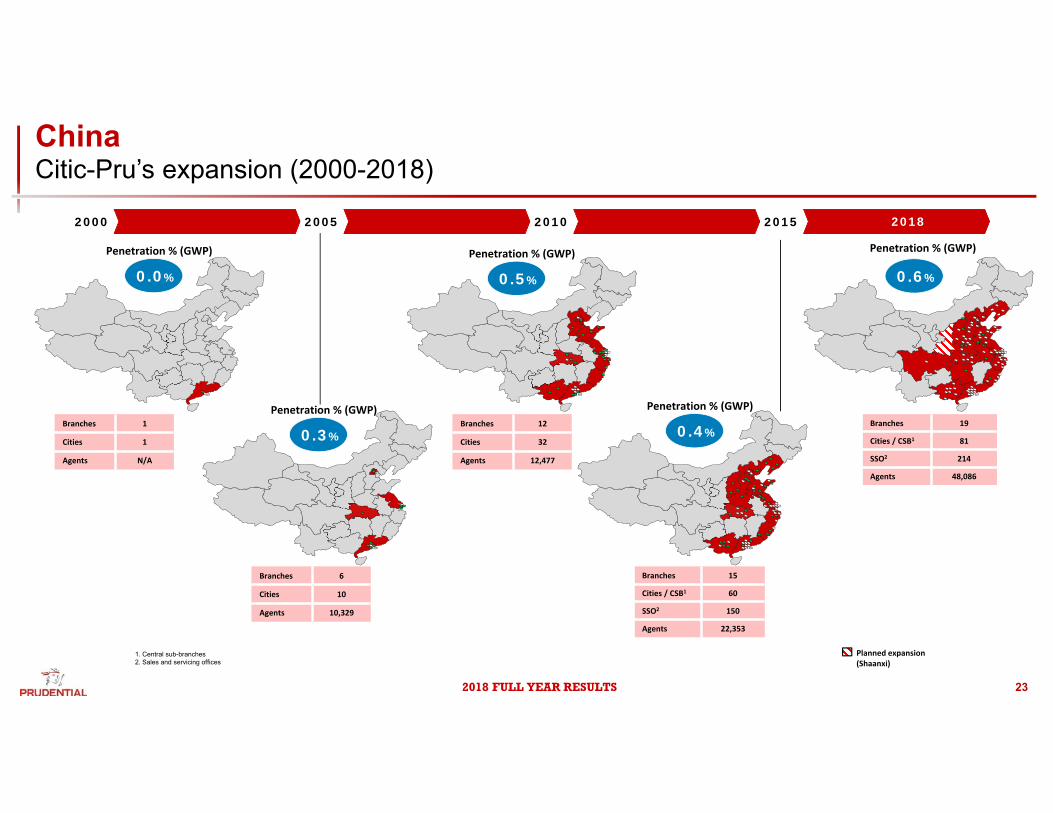
ChinaCitic-Pru’s expansion (2000-2018)
Planned expansion (Shaanxi)
2000 2005 2010 2015 2018
Branches 15
Cities / CSB1 60
SSO2 150
Agents 22,353
Branches 19
Cities / CSB1 81
SSO2 214
Agents 48,086
Branches 1
Cities 1
Agents N/A
Branches 6
Cities 10
Agents 10,329
Branches 12
Cities 32
Agents 12,477
0.0%
Penetration % (GWP)
0.3%
Penetration % (GWP)
0.4%
Penetration % (GWP)
0.6%
Penetration % (GWP)
0.5%
Penetration % (GWP)
23
1. Central sub-branches2. Sales and servicing offices
2018 FULL YEAR RESULTS
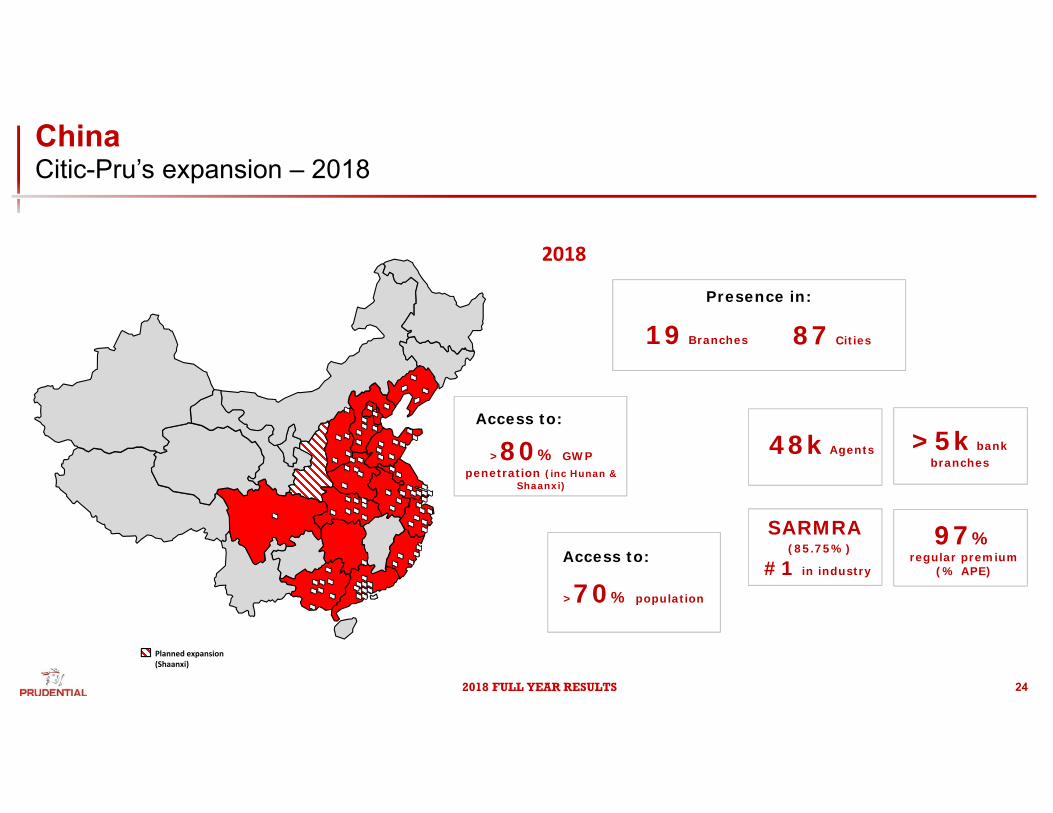
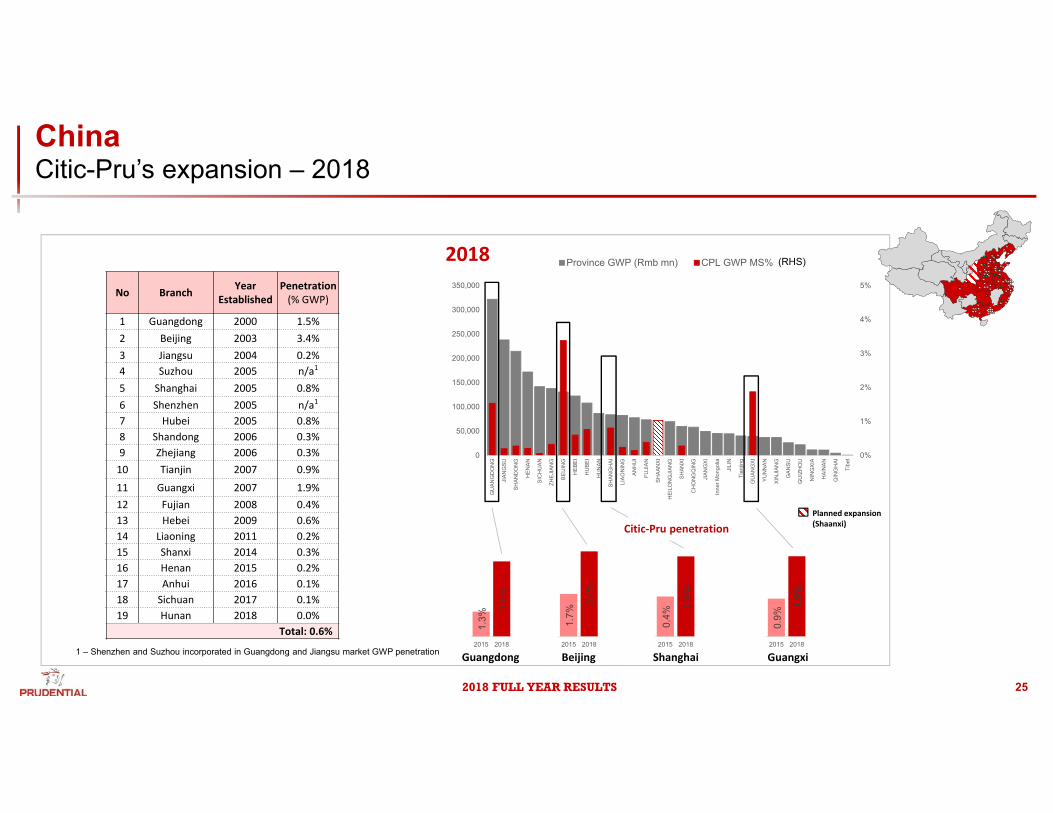
ChinaCitic-Pru’s expansion – 2018
2018
2018
>80% GWP penetration (inc Hunan &
Shaanxi)
19 Branches
>70% population
87 Cities
48k Agents
Access to:>5k bank
branches
Access to:
SARMRA
#1 in industry
Presence in:
97%regular premium
(% APE)
(85.75%)
Planned expansion (Shaanxi)
24
2018 FULL YEAR RESULTS
ChinaCitic-Pru’s expansion – 2018
2018
1.7%
3.4%
2015 2018
Beijing
1.3%
1.5%
2015 2018
Guangdong0.
4%
0.8%
2015 2018
0.9%
1.9%
2015 2018
Shanghai Guangxi
Citic‐Pru penetration
2018
No Branch Year Established
Penetration (% GWP)
1 Guangdong 2000 1.5%2 Beijing 2003 3.4%3 Jiangsu 2004 0.2%4 Suzhou 2005 n/a1
5 Shanghai 2005 0.8%6 Shenzhen 2005 n/a1
7 Hubei 2005 0.8%8 Shandong 2006 0.3%9 Zhejiang 2006 0.3%10 Tianjin 2007 0.9%
11 Guangxi 2007 1.9%12 Fujian 2008 0.4%13 Hebei 2009 0.6%14 Liaoning 2011 0.2%15 Shanxi 2014 0.3%16 Henan 2015 0.2%17 Anhui 2016 0.1%18 Sichuan 2017 0.1%19 Hunan 2018 0.0%
Total: 0.6%
1 – Shenzhen and Suzhou incorporated in Guangdong and Jiangsu market GWP penetration
25
0%
1%
2%
3%
4%
5%
0
50,000
100,000
150,000
200,000
250,000
300,000
350,000
GU
ANG
DO
NG
JIAN
GSU
SHAN
DO
NG
HEN
AN
SIC
HU
AN
ZHEJ
IAN
G
BEIJ
ING
HEB
EI
HU
BEI
HU
NAN
SHAN
GH
AI
LIAO
NIN
G
ANH
UI
FUJI
AN
SHAA
NXI
HEI
LON
GJI
ANG
SHAN
XI
CH
ON
GQ
ING
JIAN
GXI
Inne
r Mon
golia
JILI
N
Tian
jing
GU
ANG
XI
YUN
NAN
XIN
JIAN
G
GAN
SU
GU
IZH
OU
NIN
GXI
A
HAI
NAN
QIN
GH
AI
Tibe
t
Province GWP (Rmb mn) CPL GWP MS%
Planned expansion (Shaanxi)
(RHS)
2018 FULL YEAR RESULTS
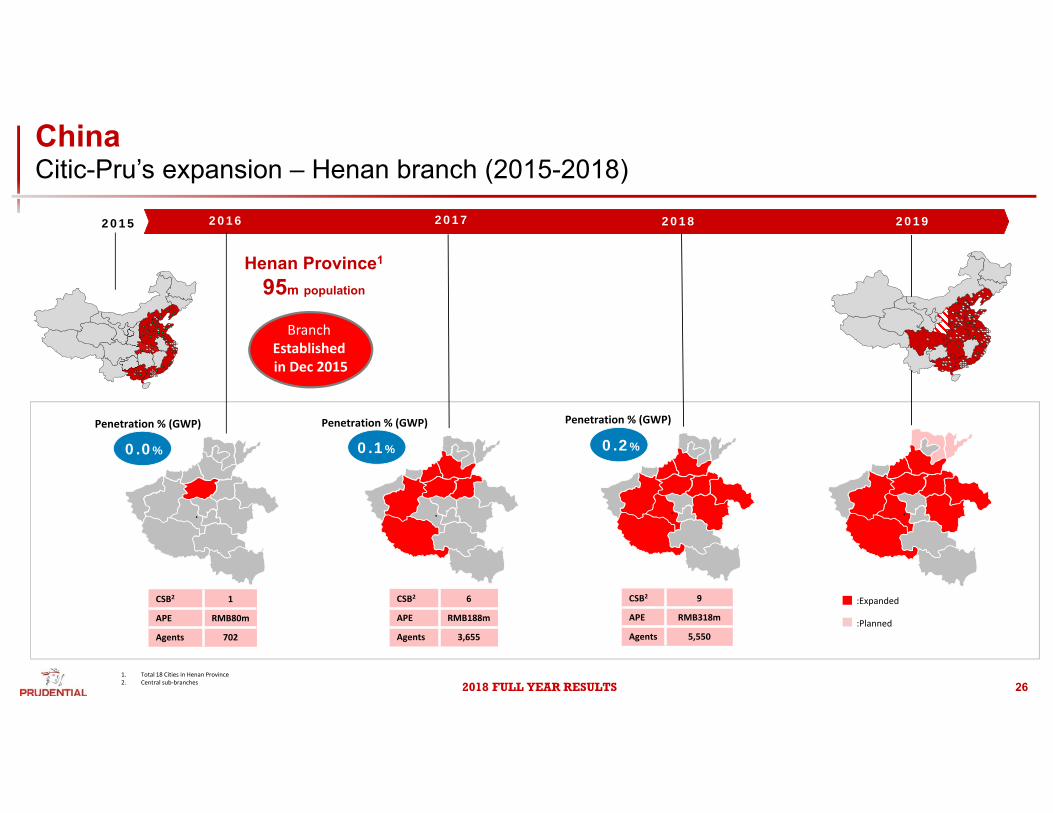
ChinaCitic-Pru’s expansion – Henan branch (2015-2018)
2015 20182016 2017
CSB2 1
APE RMB80m
Agents 702
CSB2 9
APE RMB318m
Agents 5,550
CSB2 6
APE RMB188m
Agents 3,655
BranchEstablished in Dec 2015
Henan Province1
95m population
1. Total 18 Cities in Henan Province2. Central sub‐branches
0.0%
Penetration % (GWP)
0.1%
Penetration % (GWP)
0.2%
Penetration % (GWP)
2019
:Expanded
:Planned
26
2018 FULL YEAR RESULTS
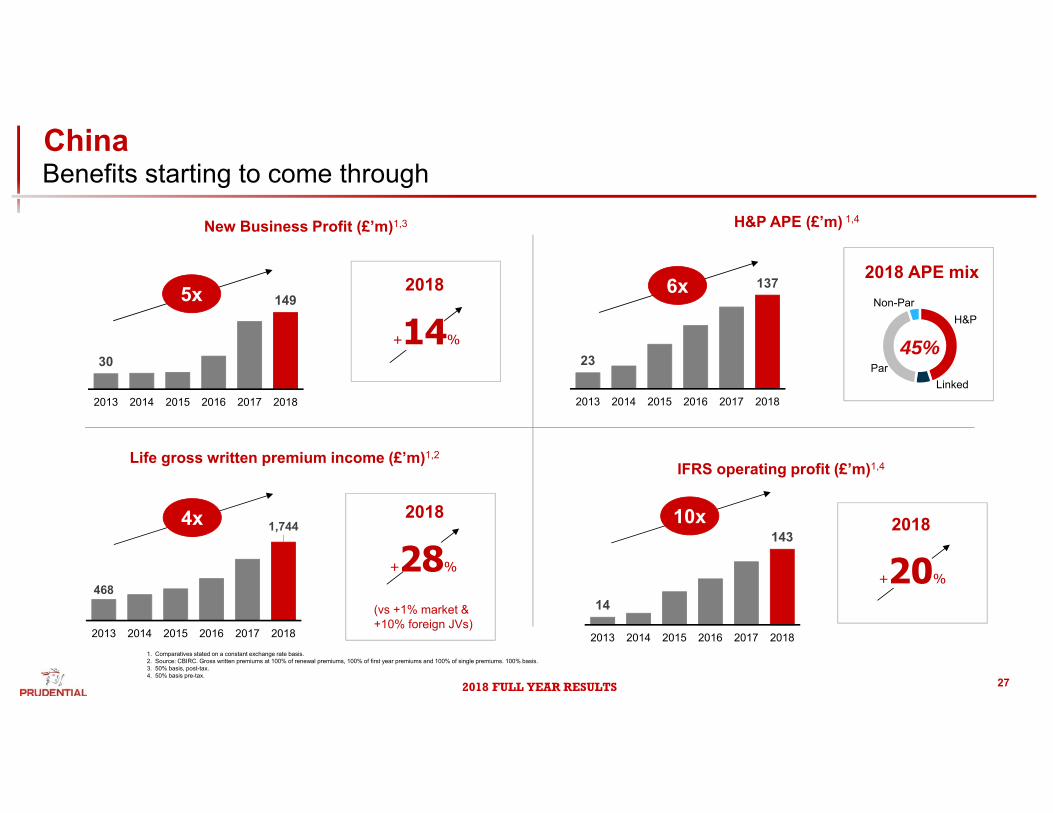
New Business Profit (£’m)1,3
30
149
2013 2014 2015 2016 2017 2018
20185x
+14%
468
1,744
2013 2014 2015 2016 2017 2018
Life gross written premium income (£’m)1,2
20184x
+28%
IFRS operating profit (£’m)1,4
14
143
2013 2014 2015 2016 2017 2018
2018
+20%
10x
ChinaBenefits starting to come through
H&P APE (£’m) 1,4
2018 APE mix
LinkedPar
Non-Par
45%H&P
H&P
Par
1. Comparatives stated on a constant exchange rate basis. 2. Source: CBIRC. Gross written premiums at 100% of renewal premiums, 100% of first year premiums and 100% of single premiums. 100% basis. 3. 50% basis, post-tax.4. 50% basis pre-tax.
(vs +1% market & +10% foreign JVs)
27
23
137
2013 2014 2015 2016 2017 2018
6x
2018 FULL YEAR RESULTS
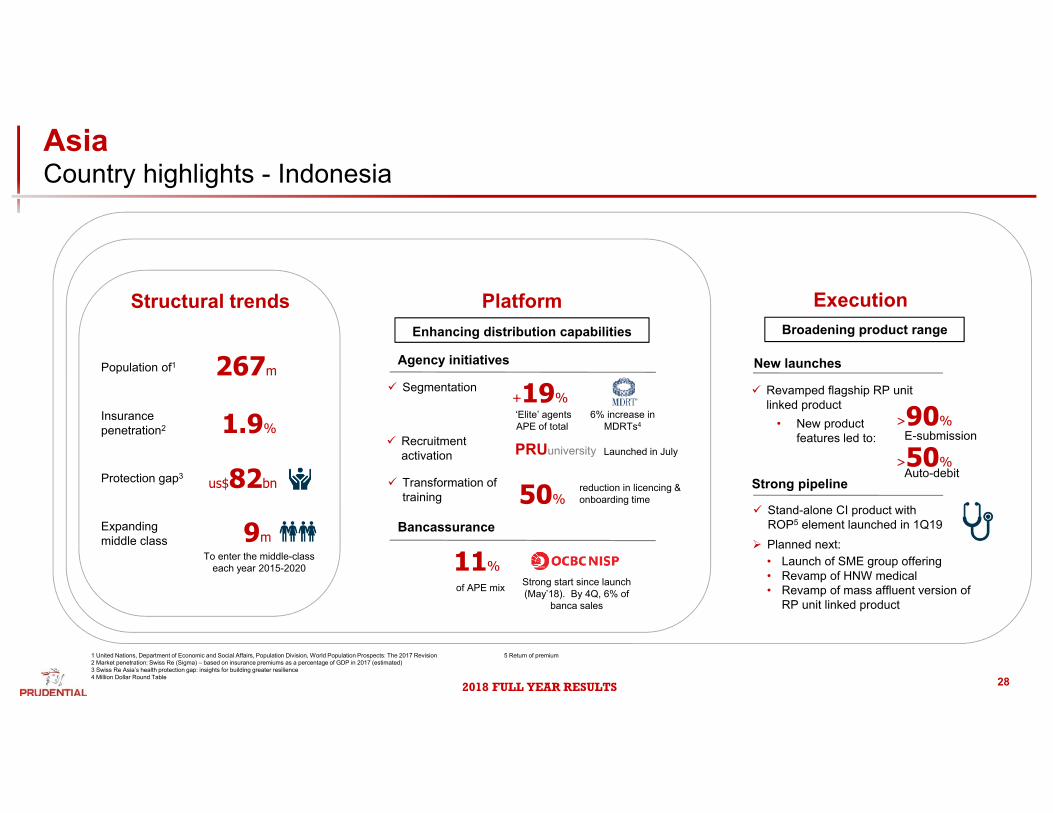
Execution
New launches
Strong pipeline
Revamped flagship RP unit linked product
• New product features led to:
>90%E-submission
>50%Auto-debit
Stand-alone CI product with ROP5 element launched in 1Q19
Planned next:• Launch of SME group offering• Revamp of HNW medical• Revamp of mass affluent version of
RP unit linked product
Broadening product range
AsiaCountry highlights - Indonesia
28
reduction in licencing & onboarding time
Strong start since launch (May’18). By 4Q, 6% of
banca sales
Bancassurance
11%of APE mix
Agency initiatives
‘Elite’ agents APE of total
6% increase in MDRTs4
Transformation of training
Segmentation
Recruitment activation
50%
Launched in July
+19%
PRUuniversity
Enhancing distribution capabilities
PlatformStructural trends
Population of1 267m
1.9%Insurance penetration2
Protection gap3 us$82bn
Expanding middle class
1 United Nations, Department of Economic and Social Affairs, Population Division, World Population Prospects: The 2017 Revision2 Market penetration: Swiss Re (Sigma) – based on insurance premiums as a percentage of GDP in 2017 (estimated)3 Swiss Re Asia’s health protection gap: insights for building greater resilience4 Million Dollar Round Table
9mTo enter the middle-class
each year 2015-2020
5 Return of premium
2018 FULL YEAR RESULTS
Successful partnership launch
>1,000 branch access
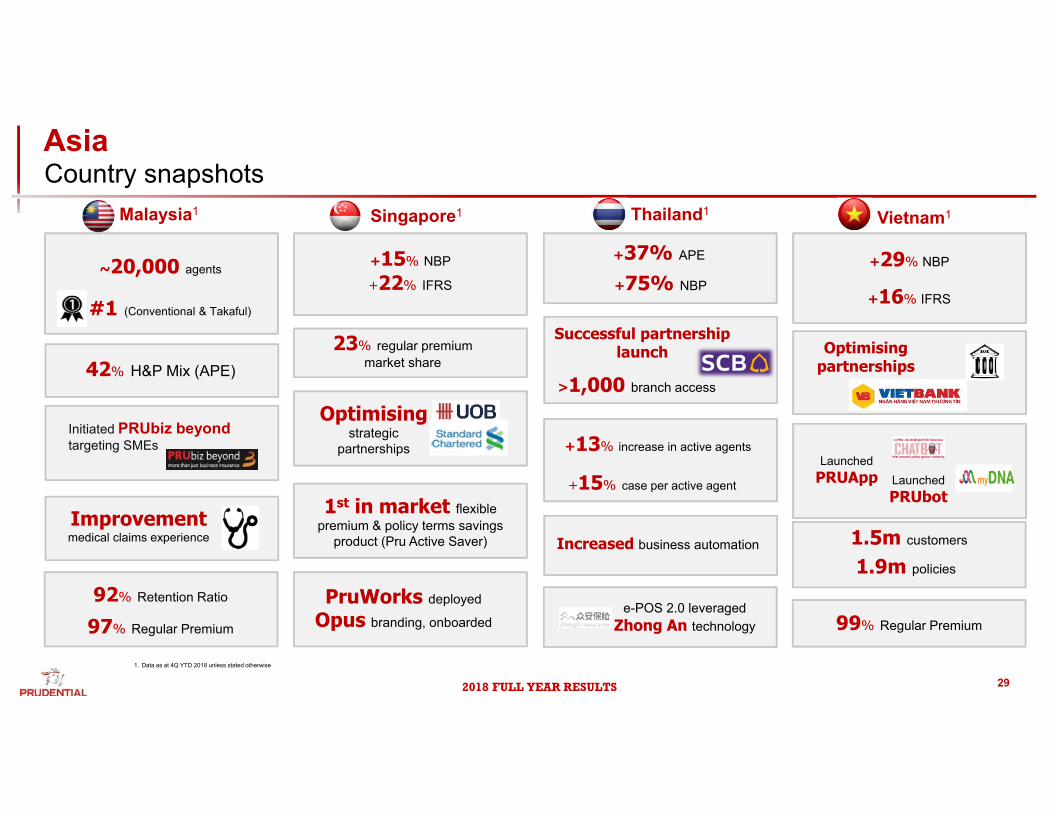
AsiaCountry snapshots
29
Malaysia1 Singapore1 Thailand1 Vietnam1
42% H&P Mix (APE)
~20,000 agents
92% Retention Ratio
97% Regular Premium
#1 (Conventional & Takaful)
1.9m policies
1.5m customers
99% Regular Premium
+16% IFRS
Optimising partnerships
Launched PRUApp Launched
PRUbot
+37% APE
Improvement medical claims experience
Initiated PRUbiz beyond targeting SMEs
e-POS 2.0 leveraged Zhong An technology
+13% increase in active agents
+15% case per active agent
Increased business automation
1. Data as at 4Q YTD 2018 unless stated otherwise
PruWorks deployed
Opus branding, onboarded
Optimising strategic
partnerships
1st in market flexible premium & policy terms savings
product (Pru Active Saver)
23% regular premium market share
+15% NBP
+22% IFRS +75% NBP
+29% NBP
2018 FULL YEAR RESULTS 30
Asia Deep Dive
Group
Agenda
Summary
2018 FULL YEAR RESULTS 31
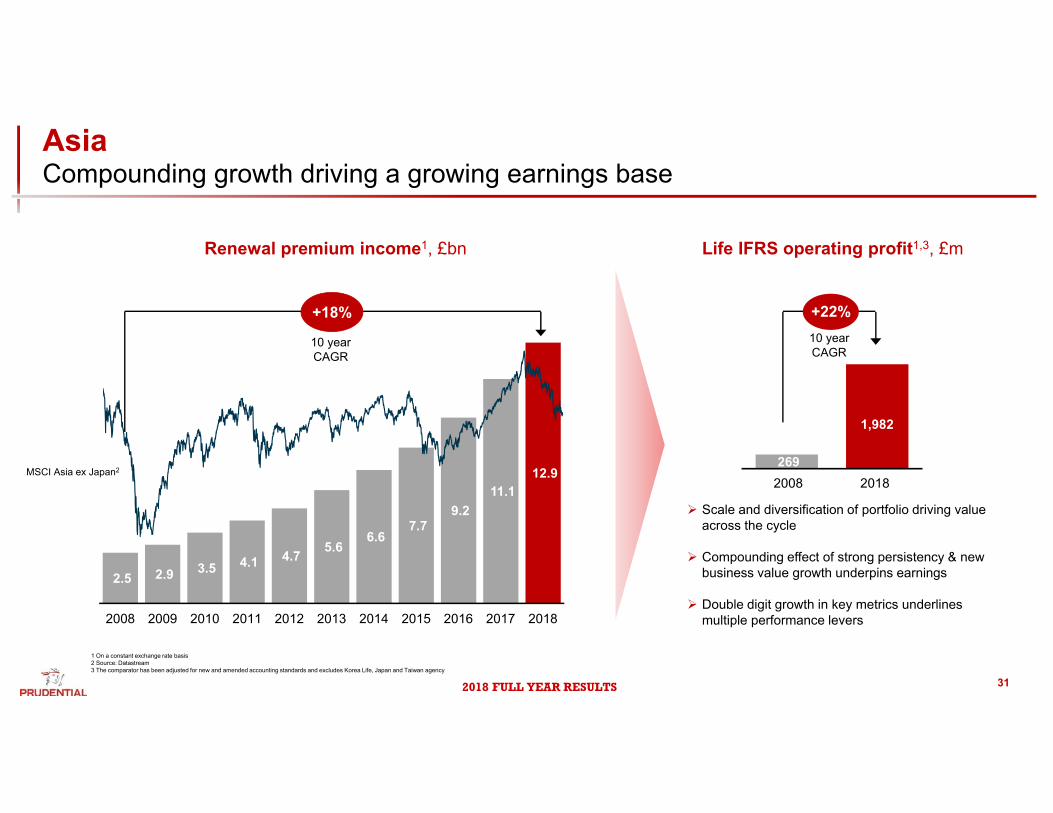
2.5 2.9 3.5 4.1 4.7 5.6 6.6
7.7 9.2
11.1 12.9
2008 2009 2010 2011 2012 2013 2014 2015 2016 2017 2018
10 year CAGR
Renewal premium income1, £bn
MSCI Asia ex Japan2
1 On a constant exchange rate basis2 Source: Datastream3 The comparator has been adjusted for new and amended accounting standards and excludes Korea Life, Japan and Taiwan agency
AsiaCompounding growth driving a growing earnings base
Scale and diversification of portfolio driving value across the cycle
Compounding effect of strong persistency & new business value growth underpins earnings
Double digit growth in key metrics underlines multiple performance levers
269
1,982
2008 2018
+22%
Life IFRS operating profit1,3, £m
10 year CAGR
+18%
2018 FULL YEAR RESULTS 32
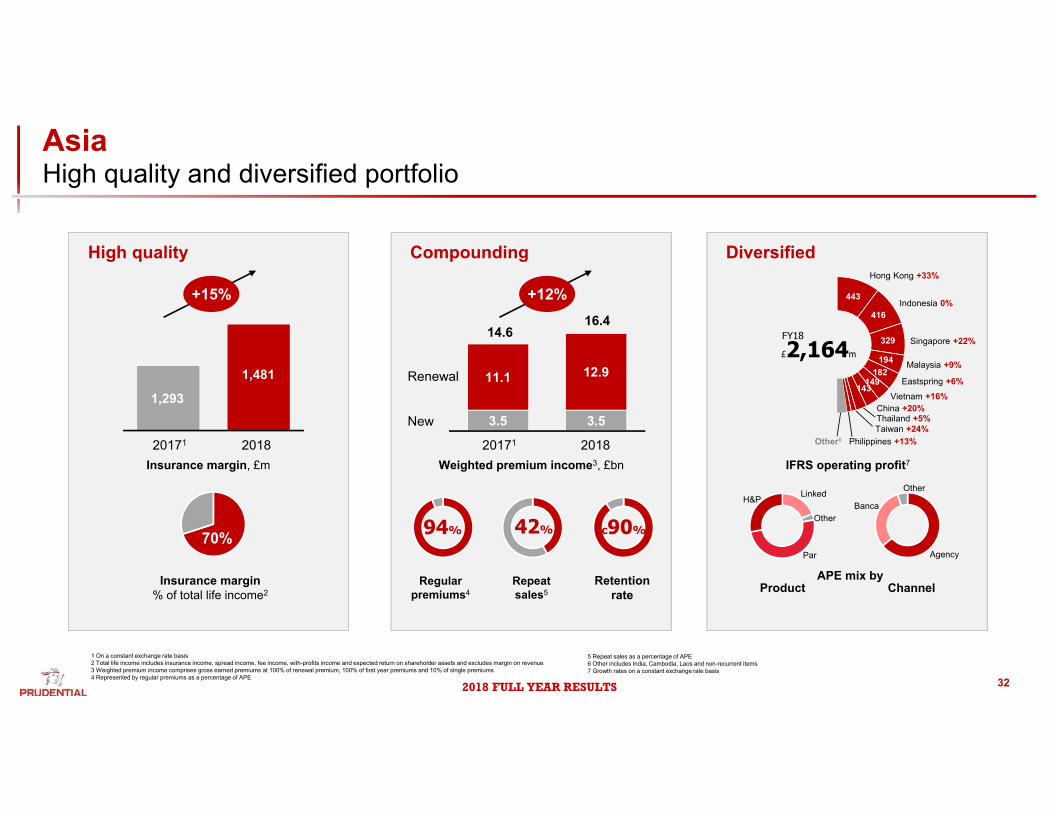
AsiaHigh quality and diversified portfolio
Diversified
7%
Taiwan +24%
China +20%
Indonesia 0%
Malaysia +9%
Singapore +22%
Hong Kong +33%
Thailand +5%
Vietnam +16%
Other6
FY18
£2,164m
CompoundingHigh quality
Regular premiums4
94% c90%
IFRS operating profit7
Product Channel
20171 2018
+12%
Weighted premium income3, £bn
Retention rate
443
416
329
194182
149143
Eastspring +6%
20171 2018
+15%
Insurance margin, £m
Insurance margin % of total life income2
70%
Repeat sales5
42%
Agency
Banca
Par
H&P Linked
Other
Other
1 On a constant exchange rate basis 2 Total life income includes insurance income, spread income, fee income, with-profits income and expected return on shareholder assets and excludes margin on revenue3 Weighted premium income comprises gross earned premiums at 100% of renewal premium, 100% of first year premiums and 10% of single premiums4 Represented by regular premiums as a percentage of APE
5 Repeat sales as a percentage of APE6 Other includes India, Cambodia, Laos and non-recurrent items7 Growth rates on a constant exchange rate basis
Philippines +13%
APE mix by
1,293
1,481
3.5 3.5
11.1 12.9
14.616.4
New
Renewal
2018 FULL YEAR RESULTS
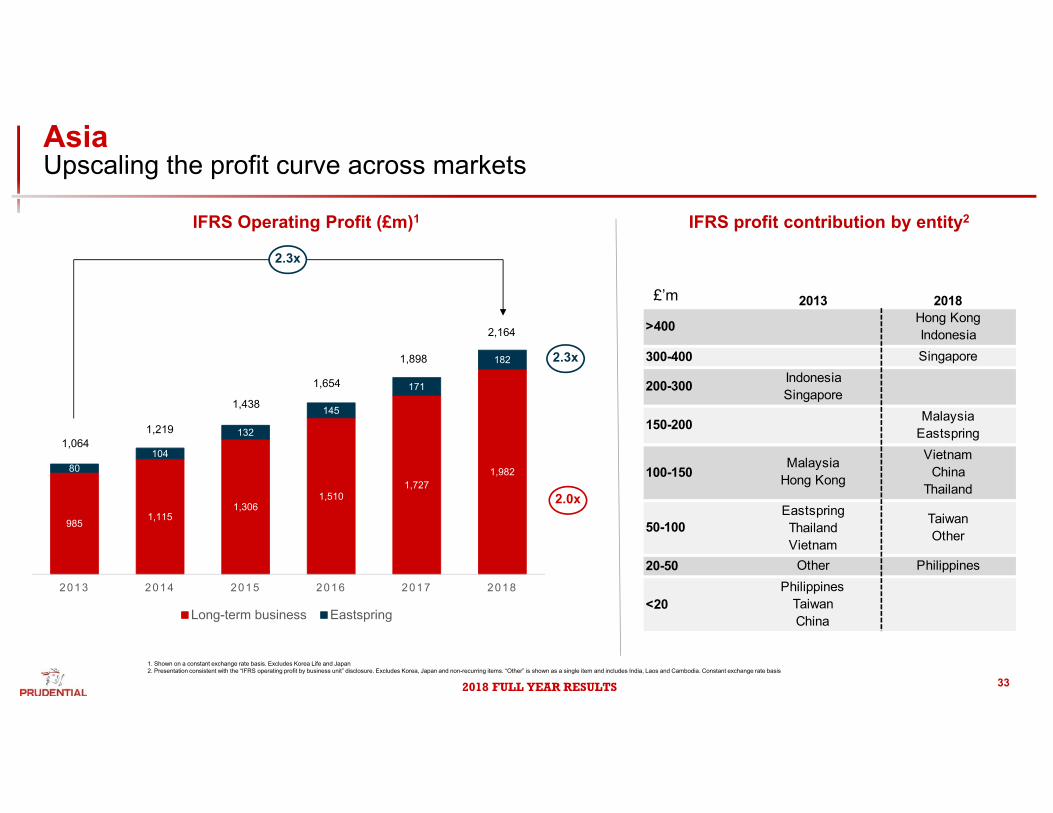
AsiaUpscaling the profit curve across markets
33
1. Shown on a constant exchange rate basis. Excludes Korea Life and Japan 2. Presentation consistent with the “IFRS operating profit by business unit” disclosure. Excludes Korea, Japan and non-recurring items. “Other” is shown as a single item and includes India, Laos and Cambodia. Constant exchange rate basis
985 1,115 1,306
1,510 1,727
1,982 80 104
132
145
171
182
2013 2014 2015 2016 2017 2018
Long-term business Eastspring
1,219
1,438
1,654
2,164
2.3x
2.0x
2.3x
1,064
1,898
IFRS profit contribution by entity2
£’m
IFRS Operating Profit (£m)1
2013 2018
>400 Hong KongIndonesia
300-400 Singapore
200-300 IndonesiaSingapore
150-200 MalaysiaEastspring
100-150Malaysia
Hong Kong
VietnamChina
Thailand
50-100EastspringThailandVietnam
TaiwanOther
20-50 Other Philippines
<20Philippines
TaiwanChina
2018 FULL YEAR RESULTS
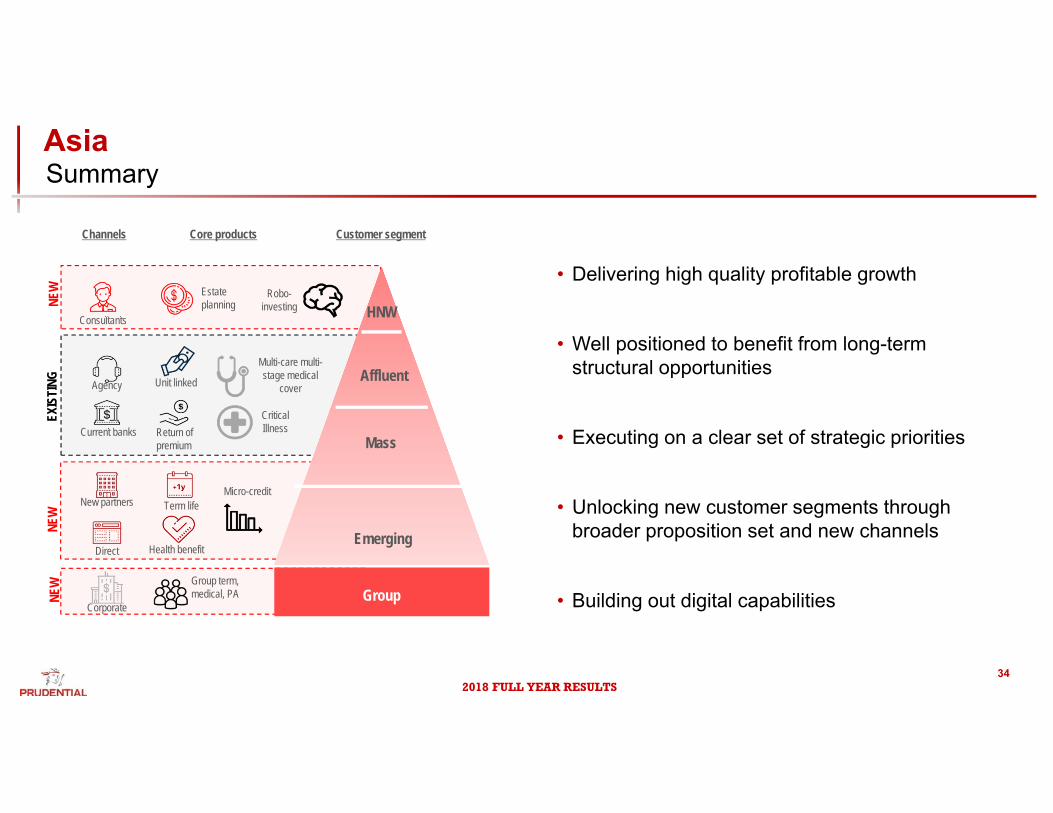
AsiaSummary
Channels Customer segment
Unit linked
Core products
Return of premium
Agency
Term life
Health benefit
New partners
Direct
Current banks
Affluent
Emerging
Mass
SME’sCorporate
Group term, medical, PA GroupGroup
EXIS
TING
NEW
NEW
NEW
HNWConsultants
Estate planning
Robo-investing
Micro-credit
Critical Illness
Multi-care multi-stage medical
cover
• Delivering high quality profitable growth
• Well positioned to benefit from long-term structural opportunities
• Executing on a clear set of strategic priorities
• Unlocking new customer segments through broader proposition set and new channels
• Building out digital capabilities
34