Embed Size (px)
Citation preview
2018 ANNUAL REPORT OF
THE BOARDS OF TRUSTEES OF THE
FEDERAL HOSPITAL INSURANCE AND
FEDERAL SUPPLEMENTARY MEDICAL INSURANCE
TRUST FUNDS
COMMUNICATION
From
THE BOARDS OF TRUSTEES,
FEDERAL HOSPITAL INSURANCE AND
FEDERAL SUPPLEMENTARY MEDICAL INSURANCE
TRUST FUNDS
Transmitting
THE 2018 ANNUAL REPORT OF
THE BOARDS OF TRUSTEES OF THE
FEDERAL HOSPITAL INSURANCE AND
FEDERAL SUPPLEMENTARY MEDICAL INSURANCE
TRUST FUNDS

LETTER OF TRANSMITTAL ____________________
BOARDS OF TRUSTEES OF THE
FEDERAL HOSPITAL INSURANCE AND
FEDERAL SUPPLEMENTARY MEDICAL INSURANCE TRUST FUNDS,
Washington, D.C., June 5, 2018
HONORABLE PAUL D. RYAN,
Speaker of the House of Representatives
HONORABLE MICHAEL R. PENCE,
President of the Senate
DEAR MR. SPEAKER AND MR. PRESIDENT:
We have the honor of transmitting to you the 2018 Annual Report of the Boards of Trustees of the
Federal Hospital Insurance Trust Fund and the Federal Supplementary Medical Insurance Trust
Fund, the 53rd such report.
Respectfully,
STEVEN T. MNUCHIN, Secretary of the Treasury, and Managing Trustee of the Trust Funds.
R. ALEXANDER ACOSTA, Secretary of Labor, and Trustee.
ALEX M. AZAR II, Secretary of Health and Human Services, and Trustee.
NANCY A. BERRYHILL, Acting Commissioner of Social Security, and Trustee.
VACANT, Public Trustee.
VACANT, Public Trustee.
SEEMA VERMA, MPH, Administrator, Centers for Medicare & Medicaid Services, and Secretary, Boards of Trustees.

CONTENTS
I. INTRODUCTION................................................................................. 1 II. OVERVIEW ........................................................................................ 7
A. Highlights ........................................................................................ 7 B. Medicare Data for Calendar Year 2017 ....................................... 11 C. Medicare Assumptions ................................................................. 13 D. Financial Outlook for the Medicare Program ............................. 19 E. Financial Status of the HI Trust Fund ....................................... 25 F. Financial Status of the SMI Trust Fund ..................................... 31 G. Conclusion ..................................................................................... 40
III. ACTUARIAL ANALYSIS ............................................................... 43 A. Introduction ................................................................................... 43 B. HI Financial Status ...................................................................... 44
1. Financial Operations in Calendar Year 2017 .......................... 44 2. 10-Year Actuarial Estimates (2018-2027) ............................... 51 3. Long-Range Estimates .............................................................. 60 4. Long-Range Sensitivity Analysis ............................................. 72
C. Part B Financial Status................................................................ 77 1. Financial Operations in Calendar Year 2017 .......................... 78 2. 10-Year Actuarial Estimates (2018-2027) ............................... 85 3. Long-Range Estimates .............................................................. 97
D. Part D Financial Status ............................................................... 99 1. Financial Operations in Calendar Year 2017 .......................... 99 2. 10-Year Actuarial Estimates (2018-2027) ............................. 103 3. Long-Range Estimates ............................................................ 111
IV. ACTUARIAL METHODOLOGY .................................................. 114 A. Hospital Insurance ..................................................................... 114 B. Supplementary Medical Insurance ............................................ 126
1. Part B ....................................................................................... 126 2. Part D ....................................................................................... 138
C. Private Health Plans .................................................................. 147 D. Long-Range Medicare Cost Growth Assumptions .................... 157
V. APPENDICES ................................................................................. 168 A. Medicare Amendments since the 2017 Report ......................... 168 B. Total Medicare Financial Projections ........................................ 176 C. Illustrative Alternative Projections ........................................... 187 D. Average Medicare Expenditures per Beneficiary ..................... 193 E. Medicare Cost-Sharing and Premium Amounts ....................... 196 F. Medicare and Social Security Trust Funds and the Federal
Budget .......................................................................................... 203 G. Infinite Horizon Projections ....................................................... 210 H. Fiscal Year Historical Data and Projections through 2027 ..... 217 I. Glossary ........................................................................................ 229 J. List of Tables ............................................................................... 249 J. List of Figures .............................................................................. 253 J. Statement of Actuarial Opinion ................................................. 254

1
I. INTRODUCTION
The Medicare program has two separate trust funds, the Hospital
Insurance Trust Fund (HI) and the Supplementary Medical Insurance
Trust Fund (SMI). HI, otherwise known as Medicare Part A, helps pay
for hospital, home health services following hospital stays, skilled
nursing facility, and hospice care for the aged and disabled. SMI
consists of Medicare Part B and Part D. Part B helps pay for physician,
outpatient hospital, home health, and other services for the aged and
disabled who have voluntarily enrolled. Part D provides subsidized
access to drug insurance coverage on a voluntary basis for all
beneficiaries and premium and cost-sharing subsidies for low-income
enrollees. Medicare also has a Part C, which serves as an alternative
to traditional Part A and Part B coverage. Under this option,
beneficiaries can choose to enroll in and receive care from private
Medicare Advantage and certain other health insurance plans.
Medicare Advantage and Program of All-Inclusive Care for the Elderly
(PACE) plans receive prospective, capitated payments for such
beneficiaries from the HI and SMI Part B trust fund accounts; the
other plans are paid from the accounts on the basis of their costs.
The Social Security Act established the Medicare Board of Trustees to
oversee the financial operations of the HI and SMI trust funds.1 The
Board has six members. Four members serve by virtue of their
positions in the Federal Government: the Secretary of the Treasury,
who is the Managing Trustee; the Secretary of Labor; the Secretary of
Health and Human Services; and the Commissioner of Social Security.
Two other members are public representatives whom the President
appoints and the Senate confirms. These positions are currently
vacant. The Administrator of the Centers for Medicare & Medicaid
Services (CMS) serves as Secretary of the Board.
The Social Security Act requires that the Board, among other duties,
report annually to the Congress on the financial and actuarial status
of the HI and SMI trust funds. The 2018 report is the 53rd that the
Board has submitted.
The projections in this year’s report, with one exception related to
Part A, are based on current law; that is, they assume that laws on the
books will be implemented and adhered to with respect to scheduled
taxes, premium revenues, and payments to providers and health plans.
The one exception is that the projections disregard payment reductions
1The Social Security Act established separate boards for HI and SMI. Both boards have
the same membership, so for convenience they are collectively referred to as the
Medicare Board of Trustees in this report.
Overview
2
that would result from the projected depletion of the Medicare Hospital
Insurance trust fund. Under current law, payments would be reduced
to levels that could be covered by incoming tax and premium revenues
when the HI trust fund was depleted. If the projections reflected such
payment reductions, then any imbalances between payments and
revenues would be automatically eliminated, and the report would not
fulfill one of its critical functions, which is to inform policy makers and
the public about the size of any trust fund deficits that would need to
be resolved to avert program insolvency. To date, lawmakers have
never allowed the assets of the Medicare HI trust fund to become
depleted.
Projections of Medicare costs are highly uncertain, especially when
looking out more than several decades. One reason for uncertainty is
that scientific advances will make possible new interventions,
procedures, and therapies. Some conditions that are untreatable today
will be handled routinely in the future. Spurred by economic
incentives, the institutions through which care is delivered will evolve,
possibly becoming more efficient. While most health care technological
advances to date have tended to increase expenditures, the health care
landscape is shifting. No one knows whether future developments will,
on balance, increase or decrease costs.
While the physician payment updates and new incentives put in place
by the Medicare Access and CHIP Reauthorization Act of 2015
(MACRA) avoid the significant short-range physician payment issues
that would have resulted from the sustainable growth rate (SGR)
system approach, they nevertheless raise important long-range
concerns. In particular, additional payments of $500 million per year
for one group of physicians and 5-percent annual bonuses for another
group are scheduled to expire in 2025, resulting in a significant one-
time payment reduction for most physicians. In addition, the law
specifies the physician payment update amounts for all years in the
future, and these amounts do not vary based on underlying economic
conditions, nor are they expected to keep pace with the average rate of
physician cost increases. The specified rate updates could be an issue
in years when levels of inflation are high and would be problematic
when the cumulative gap between the price updates and physician
costs becomes large. The gap will continue to widen throughout the
projection, and the Trustees previously estimated that physician
payment rates under current law will be lower than they would have
been under the SGR formula by 2048. Absent a change in the delivery
system or level of update by subsequent legislation, access to Medicare-
participating physicians may become a significant issue in the long
term under current law.
Introduction
3
The Patient Protection and Affordable Care Act, as amended by the
Health Care and Education Reconciliation Act of 2010, introduced
large policy changes and additional projection uncertainty. This
legislation, referred to collectively as the Affordable Care Act or ACA,
contains roughly 165 provisions affecting the Medicare program by
reducing costs, increasing revenues, improving benefits, combating
fraud and abuse, and initiating a major program of research and
development to identify alternative provider payment mechanisms,
health care delivery systems, and other changes intended to improve
the quality of health care and reduce costs. The Board assumes that
the various cost-reduction measures—the most important of which are
the reductions in the annual payment rate updates for most categories
of Medicare providers by the growth in economy-wide private nonfarm
business multifactor productivity2—will occur as the ACA requires. In
order for this outcome to be achievable, health care providers would
have to realize productivity improvements at a faster rate than
experienced historically. However, if the health sector cannot
transition to more efficient models of care delivery and achieve
productivity increases commensurate with economy-wide productivity,
and if the provider reimbursement rates paid by commercial insurers
continue to be based on the same negotiated process used to date, then
the availability and quality of health care received by Medicare
beneficiaries would, under current law, fall over time compared to that
received by those with private health insurance.
2For convenience the term economy-wide private nonfarm business multifactor
productivity will henceforth be referred to as economy-wide productivity.
Overview
4
From 1960 through 2016, U.S. national health expenditure (NHE)
growth rates typically outpaced economic growth rates, though the
magnitude of the differences has been declining. The Trustees have
long assumed that this differential would continue to narrow over the
long-term projection period and that the cost-reduction provisions of
the ACA and MACRA would further decrease this gap. Since 2008,
average annual NHE growth has been below historical averages,
though it has continued to outpace average annual growth of the
economy. There is some debate regarding whether this recent slower
growth in national health expenditures reflects the impact of economic
factors that are mostly cyclical in nature or factors that would lead to
a permanently slower growth environment. The Trustees’ outlook for
long-range NHE growth is consistent with the trajectory observed over
the past half century and has not been materially affected by this
recent experience.
Notwithstanding recent favorable developments, current-law
projections indicate that Medicare still faces a substantial financial
shortfall that will need to be addressed with further legislation. Such
legislation should be enacted sooner rather than later to minimize the
impact on beneficiaries, providers, and taxpayers.
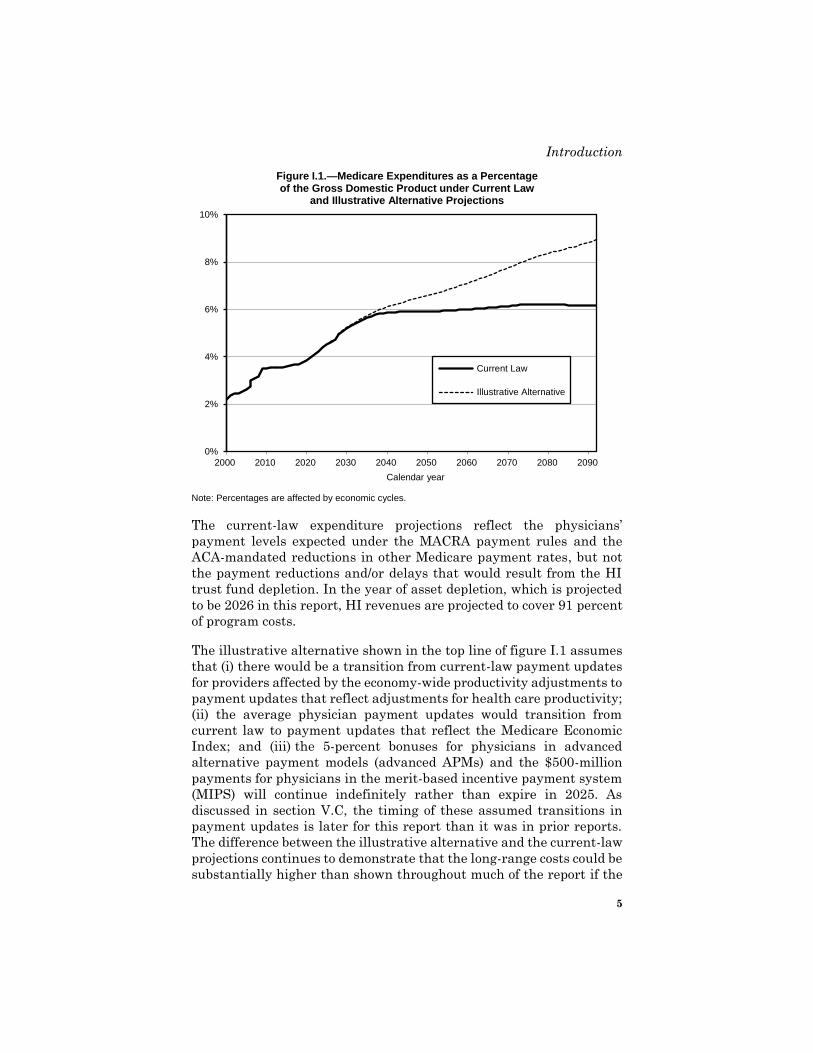
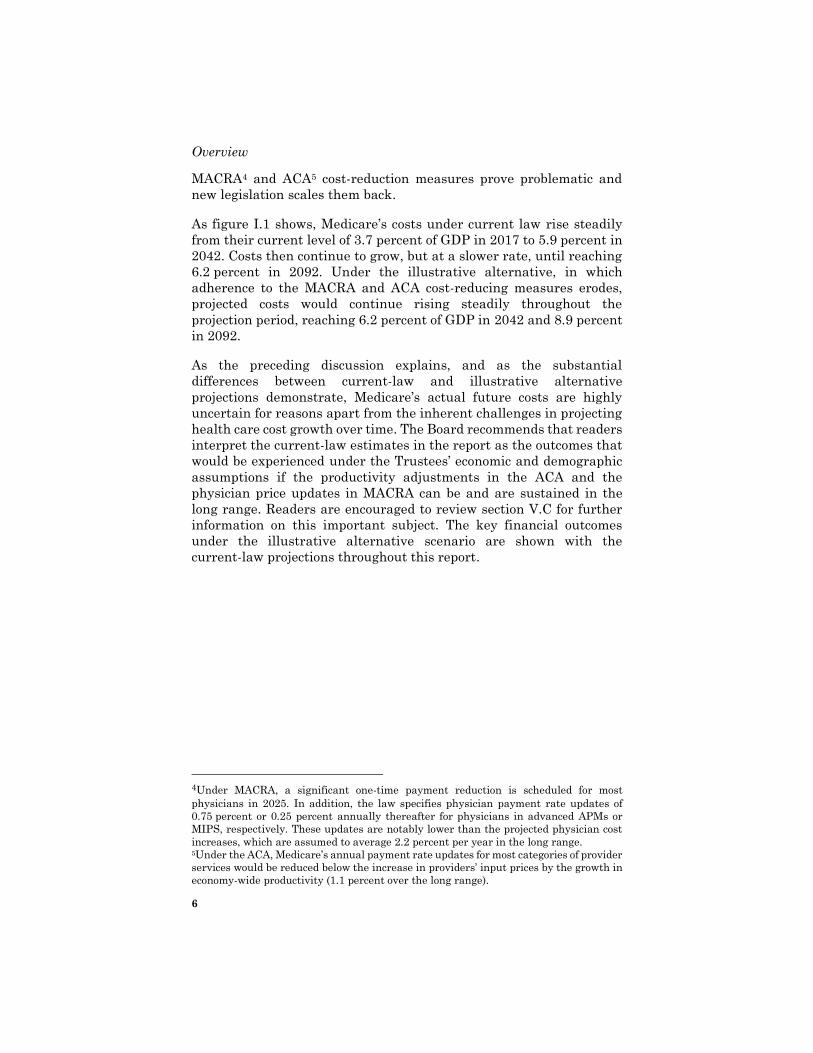
Figure I.1 shows Medicare’s projected expenditures as a percentage of
the Gross Domestic Product (GDP) under two sets of assumptions:
current law and an illustrative alternative, described below.3
3At the request of the Trustees, the Office of the Actuary at CMS has prepared a set of
illustrative Medicare projections under a hypothetical modification to current law.
A summary of the projections under the illustrative alternative is contained in
section V.C of this report, and a more detailed discussion is available at
http://www.cms.gov/Research-Statistics-Data-and-Systems/Statistics-Trends-
and-Reports/ReportsTrustFunds/Downloads/2018TRAlternativeScenario.pdf. Readers
should not infer any endorsement of the policies represented by the illustrative
alternative by the Trustees, CMS, or the Office of the Actuary. Section V.C also provides
additional information on the uncertainties associated with productivity adjustments to
specific provider payment updates and the scheduled physician updates.
Introduction
5
Figure I.1.—Medicare Expenditures as a Percentage of the Gross Domestic Product under Current Law
and Illustrative Alternative Projections
0%
2%
4%
6%
8%
10%
2000 2010 2020 2030 2040 2050 2060 2070 2080 2090
Calendar year
Current Law
Illustrative Alternative
Note: Percentages are affected by economic cycles.
The current-law expenditure projections reflect the physicians’
payment levels expected under the MACRA payment rules and the
ACA-mandated reductions in other Medicare payment rates, but not
the payment reductions and/or delays that would result from the HI
trust fund depletion. In the year of asset depletion, which is projected
to be 2026 in this report, HI revenues are projected to cover 91 percent
of program costs.
The illustrative alternative shown in the top line of figure I.1 assumes
that (i) there would be a transition from current-law payment updates
for providers affected by the economy-wide productivity adjustments to
payment updates that reflect adjustments for health care productivity;
(ii) the average physician payment updates would transition from
current law to payment updates that reflect the Medicare Economic
Index; and (iii) the 5-percent bonuses for physicians in advanced
alternative payment models (advanced APMs) and the $500-million
payments for physicians in the merit-based incentive payment system
(MIPS) will continue indefinitely rather than expire in 2025. As
discussed in section V.C, the timing of these assumed transitions in
payment updates is later for this report than it was in prior reports.
The difference between the illustrative alternative and the current-law
projections continues to demonstrate that the long-range costs could be
substantially higher than shown throughout much of the report if the
Overview
6
MACRA4 and ACA5 cost-reduction measures prove problematic and
new legislation scales them back.
As figure I.1 shows, Medicare’s costs under current law rise steadily
from their current level of 3.7 percent of GDP in 2017 to 5.9 percent in
2042. Costs then continue to grow, but at a slower rate, until reaching
6.2 percent in 2092. Under the illustrative alternative, in which
adherence to the MACRA and ACA cost-reducing measures erodes,
projected costs would continue rising steadily throughout the
projection period, reaching 6.2 percent of GDP in 2042 and 8.9 percent
in 2092.
As the preceding discussion explains, and as the substantial
differences between current-law and illustrative alternative
projections demonstrate, Medicare’s actual future costs are highly
uncertain for reasons apart from the inherent challenges in projecting
health care cost growth over time. The Board recommends that readers
interpret the current-law estimates in the report as the outcomes that
would be experienced under the Trustees’ economic and demographic
assumptions if the productivity adjustments in the ACA and the
physician price updates in MACRA can be and are sustained in the
long range. Readers are encouraged to review section V.C for further
information on this important subject. The key financial outcomes
under the illustrative alternative scenario are shown with the
current-law projections throughout this report.
4Under MACRA, a significant one-time payment reduction is scheduled for most
physicians in 2025. In addition, the law specifies physician payment rate updates of
0.75 percent or 0.25 percent annually thereafter for physicians in advanced APMs or
MIPS, respectively. These updates are notably lower than the projected physician cost
increases, which are assumed to average 2.2 percent per year in the long range. 5Under the ACA, Medicare’s annual payment rate updates for most categories of provider
services would be reduced below the increase in providers’ input prices by the growth in
economy-wide productivity (1.1 percent over the long range).
Highlights
7
II. OVERVIEW
A. HIGHLIGHTS
The major findings of this report under the intermediate set of
assumptions appear below. The balance of the Overview and the
following Actuarial Analysis section describe these findings in more
detail.
In 2017
In 2017, Medicare covered 58.4 million people: 49.5 million aged 65
and older, and 8.9 million disabled. Over 34 percent of these
beneficiaries have chosen to enroll in Part C private health plans that
contract with Medicare to provide Part A and Part B health services.
Total expenditures in 2017 were $710.2 billion, and total income was
$705.1 billion, which consisted of $694.3 billion in non-interest income
and $9.8 billion in interest earnings. Assets held in special issue U.S.
Treasury securities decreased by $5.0 billion to $289.6 billion.
Short-Range Results
The estimated depletion date for the HI trust fund is 2026, 3 years
earlier than in last year’s report. As in past years, the Trustees have
determined that the fund is not adequately financed over the next
10 years. HI income is projected to be lower than last year’s estimates
due to (i) lower payroll taxes attributable to lowered wages for 2017
and lower levels of projected GDP and (ii) lower income from the
taxation of Social Security benefits as a result of legislation. HI
expenditures are projected to be slightly higher than last year’s
estimates, mostly due to higher-than-expected spending in 2017,
legislation that increased hospital spending, and higher Medicare
Advantage payments.
In 2017, HI income exceeded expenditures by $2.8 billion. The Trustees
project deficits in all future years until the trust fund becomes depleted
in 2026. The assets were $202.0 billion at the beginning of 2018,
representing about 65 percent of expenditures during the year, which
is below the Trustees’ minimum recommended level of 100 percent.
The HI trust fund has not met the Trustees’ formal test of short-range
financial adequacy since 2003 (as discussed in section III.B). Growth
in HI expenditures has averaged 2.1 percent annually over the last
5 years, compared with non-interest income growth of 4.9 percent.
Over the next 5 years, projected annual growth rates for expenditures
and non-interest income are 6.2 percent and 5.3 percent, respectively.
Overview
8
The SMI trust fund is expected to be adequately financed over the next
10 years and beyond because premium income and general revenue
income for Parts B and D are reset each year to cover expected costs
and ensure a reserve for Part B contingencies. The Part B premium for
2018 is $134.00, the same as for 2017. However, a hold-harmless
provision limited the premium increase in 2016 and 2017 for about
70 percent of enrollees. These Part B enrollees saw an increase in their
Part B premium from about $109 in 2017, on average, to about $130,
on average, in 2018. (See sections II.F and III.C for further details.)
Part B and Part D costs have averaged annual growth of 5.5 percent
and 8.5 percent, respectively, over the last 5 years, as compared to
growth of 3.7 percent for GDP. Under current law, the Trustees project
an average annual Part B growth rate of 8.2 percent over the next
5 years; for Part D, the estimated average annual increase in
expenditures for these 5 years is 6.0 percent. The projected average
annual rate of growth for the U.S. economy is 4.7 percent during this
period, significantly slower than for Part B and Part D.
The Trustees are issuing a determination of projected excess general
revenue Medicare funding in this report because the difference between
Medicare’s total outlays and its dedicated financing sources6 is
projected to exceed 45 percent of outlays within 7 years. Since this is
the second consecutive such finding, the law specifies that a Medicare
funding warning is triggered and that the President must submit to
Congress proposed legislation to respond to the warning within 15 days
after the submission of the Fiscal Year 2020 Budget. Congress is then
required to consider the legislation on an expedited basis.
Long-Range Results
For the 75-year projection period, the HI actuarial deficit has increased
to 0.82 percent of taxable payroll from 0.64 percent in last year’s
report. (Under the illustrative alternative projections, the HI actuarial
deficit would be 1.71 percent of taxable payroll.) The 0.18 percent of
payroll increase in the actuarial deficit was primarily due to lower
projected payroll tax income, higher expenditures in 2017, higher
payments to Medicare Advantage plans, and legislation that increased
expenditures.
Part B outlays were 1.6 percent of GDP in 2017, and the Board projects
that they will grow to about 2.8 percent by 2092 under current law.
6Dedicated financing sources consist of HI payroll taxes, HI share of income taxes on
Social Security benefits, Part D State transfers, Part B drug fees, and beneficiary
premiums.
Highlights
9
The long-range projections as a percent of GDP are slightly higher than
those in last year’s report due to recent legislation and higher Medicare
Advantage spending. (Part B costs in 2092 would be 4.3 percent under
the illustrative alternative scenario.)
The Board estimates that Part D outlays will increase from 0.5 percent
of GDP in 2017 to about 1.2 percent by 2092. These long-range outlay
projections, as a percent of GDP, are about the same as those shown in
last year’s report.
Transfers from the general fund finance about three-quarters of SMI
costs and are central to the automatic financial balance of the fund’s
two accounts. Such transfers represent a large and growing
requirement for the Federal budget. SMI general revenues equal
1.5 percent of GDP in 2017 and are projected to increase to an
estimated 2.8 percent in 2092.
Conclusion
Total Medicare expenditures were $710 billion in 2017. The Board
projects that expenditures will increase in future years at a faster pace
than either aggregate workers’ earnings or the economy overall and
that, as a percentage of GDP, they will increase from 3.7 percent in
2017 to 6.2 percent by 2092 (based on the Trustees’ intermediate set of
assumptions). If the relatively low price increases for physicians and
other health services under Medicare are not sustained and do not take
full effect in the long range as in the illustrative alternative projection,
then Medicare spending would instead represent roughly 8.9 percent
of GDP in 2092. Growth under any of these scenarios, if realized, would
substantially increase the strain on the nation’s workers, the economy,
Medicare beneficiaries, and the Federal budget.
The Trustees project that HI tax income and other dedicated revenues
will fall short of HI expenditures in all future years. The HI trust fund
does not meet either the Trustees’ test of short-range financial
adequacy or their test of long-range close actuarial balance.
The Part B and Part D accounts in the SMI trust fund are expected to
be adequately financed because premium income and general revenue
income are reset each year to cover expected costs. Such financing,
however, would have to increase faster than the economy to cover
expected expenditure growth.
The financial projections in this report indicate a need for substantial
steps to address Medicare’s remaining financial challenges.
Overview
10
Consideration of further reforms should occur in the near future. The
sooner solutions are enacted, the more flexible and gradual they can
be. Moreover, the early introduction of reforms increases the time
available for affected individuals and organizations—including health
care providers, beneficiaries, and taxpayers—to adjust their
expectations and behavior. The Trustees recommend that Congress
and the executive branch work closely together with a sense of urgency
to address the depletion of the HI trust fund and the projected growth
in HI (Part A) and SMI (Parts B and D) expenditures.
Medicare Data
11
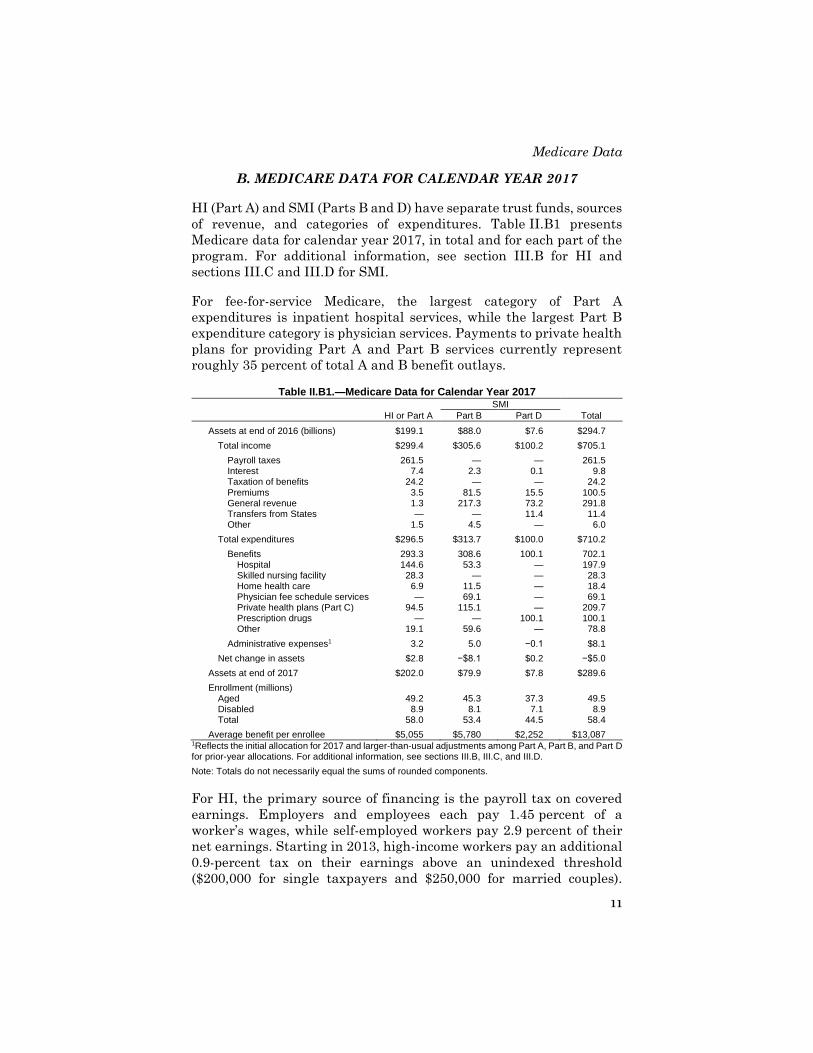
B. MEDICARE DATA FOR CALENDAR YEAR 2017
HI (Part A) and SMI (Parts B and D) have separate trust funds, sources
of revenue, and categories of expenditures. Table II.B1 presents
Medicare data for calendar year 2017, in total and for each part of the
program. For additional information, see section III.B for HI and
sections III.C and III.D for SMI.
For fee-for-service Medicare, the largest category of Part A
expenditures is inpatient hospital services, while the largest Part B
expenditure category is physician services. Payments to private health
plans for providing Part A and Part B services currently represent
roughly 35 percent of total A and B benefit outlays.
Table II.B1.—Medicare Data for Calendar Year 2017 SMI
HI or Part A Part B Part D Total
Assets at end of 2016 (billions) $199.1 $88.0 $7.6 $294.7
Total income $299.4 $305.6 $100.2 $705.1
Payroll taxes 261.5 — — 261.5 Interest 7.4 2.3 0.1 9.8 Taxation of benefits 24.2 — — 24.2 Premiums 3.5 81.5 15.5 100.5 General revenue 1.3 217.3 73.2 291.8 Transfers from States — — 11.4 11.4 Other 1.5 4.5 — 6.0
Total expenditures $296.5 $313.7 $100.0 $710.2
Benefits 293.3 308.6 100.1 702.1 Hospital 144.6 53.3 — 197.9 Skilled nursing facility 28.3 — — 28.3 Home health care 6.9 11.5 — 18.4 Physician fee schedule services — 69.1 — 69.1 Private health plans (Part C) 94.5 115.1 — 209.7 Prescription drugs — — 100.1 100.1 Other 19.1 59.6 — 78.8
Administrative expenses1 3.2 5.0 −0.1 $8.1
Net change in assets $2.8 −$8.1 $0.2 −$5.0
Assets at end of 2017 $202.0 $79.9 $7.8 $289.6
Enrollment (millions) Aged 49.2 45.3 37.3 49.5 Disabled 8.9 8.1 7.1 8.9 Total 58.0 53.4 44.5 58.4
Average benefit per enrollee $5,055 $5,780 $2,252 $13,087 1Reflects the initial allocation for 2017 and larger-than-usual adjustments among Part A, Part B, and Part D for prior-year allocations. For additional information, see sections III.B, III.C, and III.D.
Note: Totals do not necessarily equal the sums of rounded components.
For HI, the primary source of financing is the payroll tax on covered
earnings. Employers and employees each pay 1.45 percent of a
worker’s wages, while self-employed workers pay 2.9 percent of their
net earnings. Starting in 2013, high-income workers pay an additional
0.9-percent tax on their earnings above an unindexed threshold
($200,000 for single taxpayers and $250,000 for married couples).
Overview
12
Other HI revenue sources include a portion of the Federal income taxes
that Social Security recipients with incomes above certain unindexed
thresholds pay on their benefits, as well as interest paid from the
general fund on the U.S. Treasury securities held in the HI trust fund.
For SMI, transfers from the general fund of the Treasury represent the
largest source of income and covered about 70 percent of program costs
in 2017. Also, beneficiaries pay monthly premiums for Parts B and D
that finance a portion of the total cost. As with HI, the U.S. Treasury
securities held in the SMI trust fund earn interest paid from the
general fund.
Medicare Assumptions
13
C. MEDICARE ASSUMPTIONS
Future Medicare expenditures will depend on a number of factors,
including the size and composition of the population eligible for
benefits, changes in the volume and intensity of services, and increases
in the price per service. Future HI trust fund income will depend on
the size of the covered work force and the level of workers’ earnings,
and future SMI trust fund income will depend on projected program
costs. These factors will depend in turn upon future birth rates, death
rates, labor force participation rates, wage increases, and many other
economic and demographic factors affecting Medicare. To illustrate the
uncertainty and sensitivity inherent in estimates of future Medicare
trust fund operations, the Board has prepared current-law projections
under a low-cost and a high-cost set of economic and demographic
assumptions as well as under an intermediate set. In addition, the
Trustees asked the CMS Office of the Actuary to develop the
illustrative alternative projections to demonstrate the potential effect
on the Medicare financial status if certain current-law features are not
fully implemented in the future.
Table II.C1 summarizes the key assumptions used in this report. Many
of the demographic and economic variables that determine Medicare
costs and income are common to the Old-Age, Survivors, and Disability
Insurance (OASDI) program, and the OASDI annual report explains
these variables in detail. These variables include changes in the
Consumer Price Index (CPI) and wages, real interest rates, fertility
rates, mortality rates, and net immigration levels. (Real indicates that
the effects of inflation have been removed.) The assumptions vary, in
most cases, from year to year during the first 5 to 25 years before
reaching the ultimate values7 assumed for the remainder of the 75-year
projection period.
7The assumptions do not include economic cycles beyond the first 10 years.
Overview
14
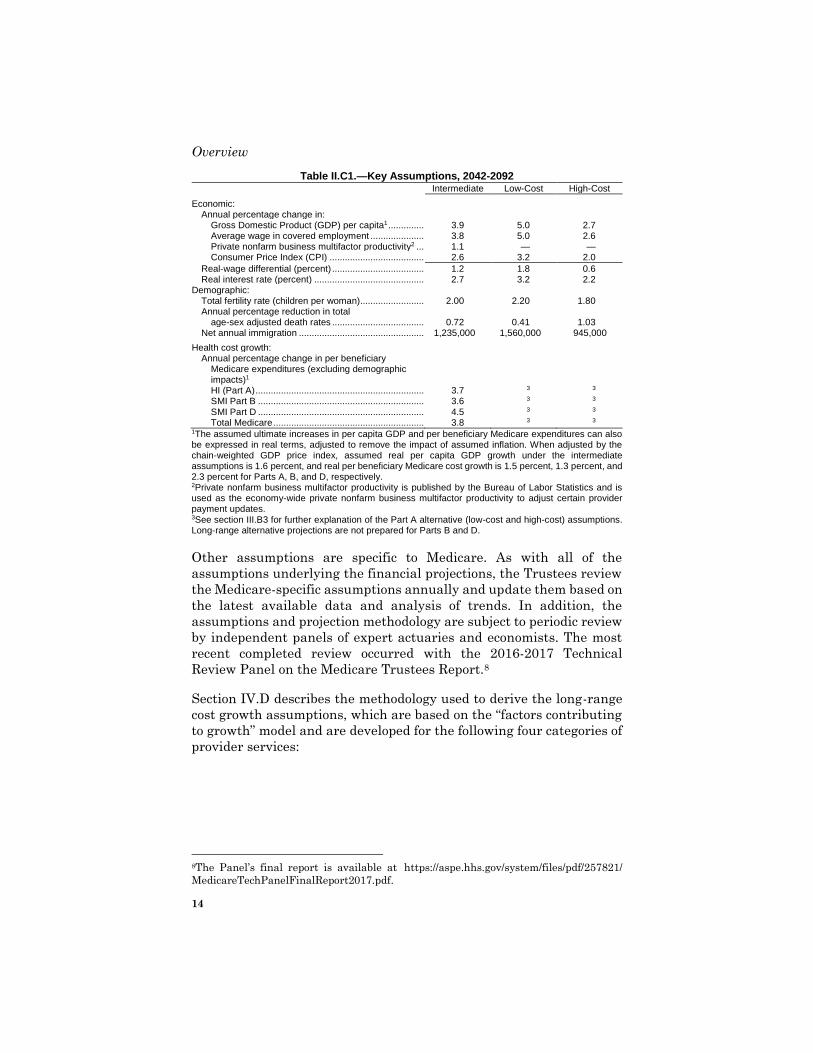
Table II.C1.—Key Assumptions, 2042-2092 Intermediate Low-Cost High-Cost
Economic: Annual percentage change in:
Gross Domestic Product (GDP) per capita1 .............. 3.9 5.0 2.7 Average wage in covered employment ..................... 3.8 5.0 2.6 Private nonfarm business multifactor productivity2 ... 1.1 — — Consumer Price Index (CPI) ..................................... 2.6 3.2 2.0
Real-wage differential (percent) .................................... 1.2 1.8 0.6 Real interest rate (percent) ........................................... 2.7 3.2 2.2
Demographic: Total fertility rate (children per woman)......................... 2.00 2.20 1.80 Annual percentage reduction in total
age-sex adjusted death rates .................................... 0.72 0.41 1.03 Net annual immigration ................................................. 1,235,000 1,560,000 945,000
Health cost growth: Annual percentage change in per beneficiary
Medicare expenditures (excluding demographic impacts)1 HI (Part A) .................................................................. 3.7 3 3
SMI Part B ................................................................. 3.6 3 3
SMI Part D ................................................................. 4.5 3 3
Total Medicare ........................................................... 3.8 3 3 1The assumed ultimate increases in per capita GDP and per beneficiary Medicare expenditures can also be expressed in real terms, adjusted to remove the impact of assumed inflation. When adjusted by the chain-weighted GDP price index, assumed real per capita GDP growth under the intermediate assumptions is 1.6 percent, and real per beneficiary Medicare cost growth is 1.5 percent, 1.3 percent, and 2.3 percent for Parts A, B, and D, respectively. 2Private nonfarm business multifactor productivity is published by the Bureau of Labor Statistics and is used as the economy-wide private nonfarm business multifactor productivity to adjust certain provider payment updates. 3See section III.B3 for further explanation of the Part A alternative (low-cost and high-cost) assumptions. Long-range alternative projections are not prepared for Parts B and D.
Other assumptions are specific to Medicare. As with all of the
assumptions underlying the financial projections, the Trustees review
the Medicare-specific assumptions annually and update them based on
the latest available data and analysis of trends. In addition, the
assumptions and projection methodology are subject to periodic review
by independent panels of expert actuaries and economists. The most
recent completed review occurred with the 2016-2017 Technical
Review Panel on the Medicare Trustees Report.8
Section IV.D describes the methodology used to derive the long-range
cost growth assumptions, which are based on the “factors contributing
to growth” model and are developed for the following four categories of
provider services:
8The Panel’s final report is available at https://aspe.hhs.gov/system/files/pdf/257821/
MedicareTechPanelFinalReport2017.pdf.
Medicare Assumptions
15
(i) All HI, and some SMI Part B, services that are updated annually
by provider input price increases less the increase in economy-wide
productivity.
HI services are inpatient hospital, skilled nursing facility, home
health, and hospice. The primary Part B services affected are
outpatient hospital, home health, and dialysis. Under the
Trustees’ intermediate economic assumptions, the year-by-year
per capita increases for these provider services start at 3.9 percent
in 2042, or GDP plus 0.0 percent, declining gradually to
3.5 percent in 2092, or GDP minus 0.3 percent.9
(ii) Physician services
Payment rate updates are 0.75 percent per year for those
physicians assumed to be participating in advanced alternative
payment models (advanced APMs) and 0.25 percent for those
assumed to be participating in the merit-based incentive payment
system (MIPS). The year-by-year per capita growth rates for
physician payments are assumed to be 3.6 percent in 2042, or
GDP minus 0.3 percent, declining to 2.8 percent in 2092, or GDP
minus 1.0 percent.
(iii) Certain SMI Part B services that are updated annually by the CPI
increase less the increase in productivity.
Such services include durable medical equipment that is not
subject to competitive bidding,10 care at ambulatory surgical
centers, ambulance services, and medical supplies. The Trustees
assume the per beneficiary year-by-year rates to be 3.1 percent in
2042, or GDP minus 0.8 percent, declining to 2.7 percent in 2092,
or GDP minus 1.1 percent.
(iv) All other Medicare services, for which payments are established
based on market processes, such as prescription drugs provided
through Part D and the remaining Part B services.
These Part B outlays constitute an estimated 17 percent of total
Part B expenditures in 2026 and consist mostly of payments for
laboratory tests, physician-administered drugs, and small facility
9These growth rate assumptions are described relative to the per capita increase in GDP
and characterized simply as GDP plus X percent. 10The portion of durable medical equipment that is subject to competitive bidding is
included with all other Medicare services since the price is determined by a competitive
bidding process.
Overview
16
services. Medicare payments to Part D plans are based on a
competitive-bidding process and are not affected by the
productivity adjustments. Similarly, payments for the other
Part B services are based on market factors.11 The long-range per
beneficiary cost growth rate for Part D and these Part B services
is assumed to equal the increase in per capita national health
expenditures as determined from the “factors contributing to
growth” model. The corresponding year-by-year per capita growth
rates for these services are 4.7 percent in 2042, or GDP plus
0.8 percent, declining to 4.3 percent by 2092, or GDP plus
0.5 percent.
After combining the rates of growth from the four long-range
assumptions, the weighted average growth rate per beneficiary for
Part B is 3.6 percent over the period 2042 through 2092, or GDP minus
0.3 percent, on average. When Parts A, B, and D are combined, the
weighted average growth rate for Medicare is 3.8 percent, or GDP
minus 0.1 percent, over this same period. Both rates are shown in
table II.C1.
As in the past, the Trustees establish detailed growth rate assumptions
for the initial 10 years (2018 through 2027) by individual type of
service (for example, inpatient hospital care and physician services).
These assumptions reflect recent trends and the impact of all
provisions of the Bipartisan Budget Act of 2018, the Bipartisan Budget
Act of 2015, the Medicare Access and CHIP Reauthorization Act of
2015, the Affordable Care Act, and other applicable statutory
provisions. For each of Parts A, B, and D, the assumed growth rates for
years 11 through 25 of the projection period (adjusted to reflect
discontinuities in yearly payment policies) are set by interpolating
between the rate at the end of the short-range projection period and
the rate at the start of the last 50 years of the long-range period
described above. The 2016-2017 Medicare Technical Review Panel
concluded that both the current length of the transition period and the
current approach to the transition are reasonable, and they
recommended that the Trustees continue to use the same approach to
transition between short-range and long-range projections for both HI
and SMI.12
The basis for the Medicare cost growth rate assumptions, described
above, has been chosen primarily to incorporate the productivity
11For example, physician-administered Part B drugs are reimbursed at the level of the
average sales price in the market plus 6 percent. 12See Findings 6-2 and 6-3 and Recommendation 6-1.
Medicare Assumptions
17
adjustments and the physician payment structure in a relatively
simple, straightforward manner and with the assumption that these
elements of current law will operate in all future years as specified.
The Trustees use this approach in part due to the uncertainty
associated with these provisions and in part due to the difficulty of
modeling such consequences as access to care, health status, and
utilization if these provisions of current law do not operate as
intended.13 They have incorporated the effects of changes in payment
mechanisms, delivery systems, and other aspects of health care that
have been implemented recently, including modest savings from
accountable care organizations. However, they have not modeled the
possible effects of future changes that could arise in response to the
payment limitations and the ACA-directed research activities, nor
have they considered the potential effects of sustained slower payment
increases on provider participation, beneficiary access to care, quality
of services, and other factors.14
Consistent with the practice in recent reports, the Trustees asked the
Office of the Actuary to develop the illustrative alternative projections.
This information is presented in section V.C. An actuarial
memorandum on the illustrative alternative is available on the CMS
website.15 The illustrative alternative projection assumes that (i) there
would be a transition from current-law payment updates for providers
affected by the economy-wide productivity adjustments to payment
updates that reflect adjustments for health care productivity; (ii) the
average physician payment updates would transition from current law
to payment updates that reflect the Medicare Economic Index; and
(iii) the 5-percent bonuses for physicians in advanced APMs and the
$500-million payments for physicians in MIPS would continue
indefinitely rather than expire in 2025. The transition from current
law to the ultimate illustrative alternative assumptions starts at later
dates than assumed in last year’s report. The year-by-year growth rate
assumptions for HI and SMI Part B under the illustrative alternative
projections are approximately 4.7 percent in 2042, or GDP plus
0.8 percent, declining to 4.3 percent by 2092, or GDP plus 0.5 percent.
On average over this period, the growth rate of per beneficiary
expenditures for these services is equal to the growth rate for per
capita national health expenditures, as described previously for Part D
13For a detailed discussion of uncertainty, see section V.C. 14The 2016-2017 Medicare Technical Review Panel considered these issues at some
length. Their final report contains a discussion of the delivery system changes to date
and the impact on the Medicare projections. 15See http://www.cms.gov/Research-Statistics-Data-and-Systems/Statistics-Trends-and-
Reports/ReportsTrustFunds/Downloads/2018TRAlternativeScenario.pdf.
Overview
18
and other Medicare services for which price updates are based on
market processes.
For the HI high-cost assumptions, the assumed annual increase in the
ratio of aggregate costs to taxable payroll (the cost rate) during the
initial 25-year period is 2 percentage points greater than under the
intermediate assumptions. Under the low-cost assumptions, the
assumed annual rate of increase in the cost rate for the initial period
is 2 percentage points less than under the intermediate assumptions.
After 25 years, the Trustees assume that the 2-percentage-point
differentials will decline gradually to zero in 2067, after which the
growth in cost rates is the same under all three sets of assumptions.
The low-cost and high-cost projections shown in this report provide an
indication of how Medicare expenditures could vary in the future as a
result of different economic, demographic, and health care trends.16
While it is possible that actual economic, demographic, and health cost-
growth experience will fall within the range defined by the three
alternative sets of assumptions, there can be no assurances that it will
do so in light of the wide variations in these factors over past decades.
In general, readers can place a greater degree of confidence in the
assumptions and estimates for the earlier years than for the later
years. Nonetheless, even for the earlier years, the estimates are only
an indication of the expected trends and the general ranges of future
Medicare experience. Also, as a result of the uncertain long-range
adequacy of physician payments and payments affected by the
statutory productivity adjustments, actual future Medicare
expenditures could exceed the intermediate projections shown in this
report, possibly by quite large amounts. Reference to key results under
the illustrative alternative projection demonstrates this potential
understatement.
16Due to the automatic financing provisions for Parts B and D, the Trustees expect that
the SMI trust fund will be adequately financed in all future years and so have not
conducted a long-range analysis using high-cost and low-cost assumptions.
Medicare Financial Outlook
19
D. FINANCIAL OUTLOOK FOR THE MEDICARE PROGRAM
This report evaluates the financial status of the HI and SMI trust
funds. For HI, the Trustees apply formal tests of financial status for
both the short range and the long range; for SMI, the Trustees assess
the ability of the trust fund to meet incurred costs over the period for
which financing has been set.
HI and SMI are financed in very different ways. Within SMI, current
law provides for the annual determination of Part B and Part D
beneficiary premiums and general revenue financing to cover expected
costs for the following year. In contrast, HI is subject to substantially
greater variation in asset growth, since employee and employer tax
rates under current law do not change or adjust to meet expenditures
except through new legislation.
Despite the significant differences in benefit provisions and financing,
the two components of Medicare are closely related. HI and SMI
operate in an interdependent health care system. Most Medicare
beneficiaries are enrolled in HI and SMI Parts B and D, and many
receive services from all three. Accordingly, efforts to improve and
reform either component must necessarily have repercussions for the
other component. In view of the anticipated growth in Medicare
expenditures, it is also important to consider the distribution among
the various sources of revenues for financing Medicare and the manner
in which this distribution will change over time.
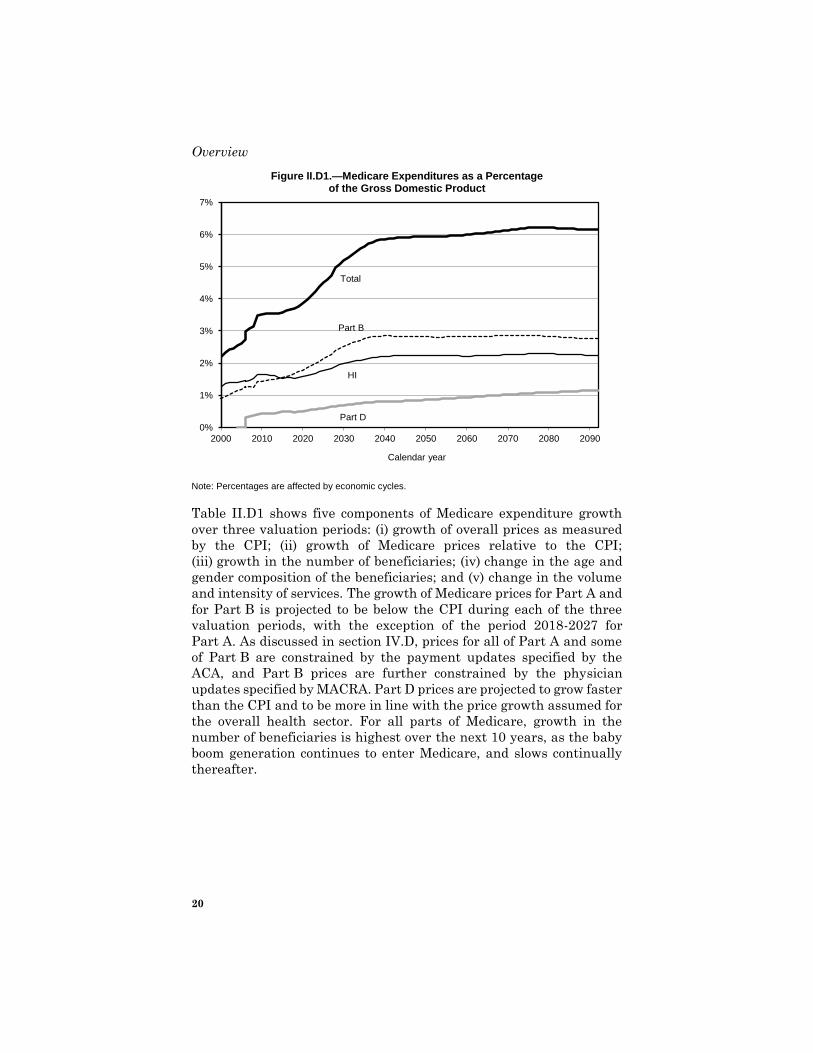
This section reviews the projected total expenditures for the Medicare
program, along with the primary sources of financing. Figure II.D1
shows projected costs as a percentage of GDP. Medicare expenditures
represented 3.7 percent of GDP in 2017. Under current law, costs
increase to 5.9 percent of GDP by 2042, largely due to the rapid growth
in the number of beneficiaries, and then to 6.2 percent of GDP in 2092,
with growth in health care cost per beneficiary becoming the larger
factor later in the valuation period, particularly for Part D costs, which
are not affected by legislated price reductions. (If the payment update
constraints were phased down as in the illustrative alternative
projections, then Medicare expenditures would reach an estimated
8.9 percent of GDP in 2092.)
Overview
20
Figure II.D1.—Medicare Expenditures as a Percentage of the Gross Domestic Product
0%
1%
2%
3%
4%
5%
6%
7%
2000 2010 2020 2030 2040 2050 2060 2070 2080 2090
Calendar year
Total
HI
Part B
Part D
Note: Percentages are affected by economic cycles.
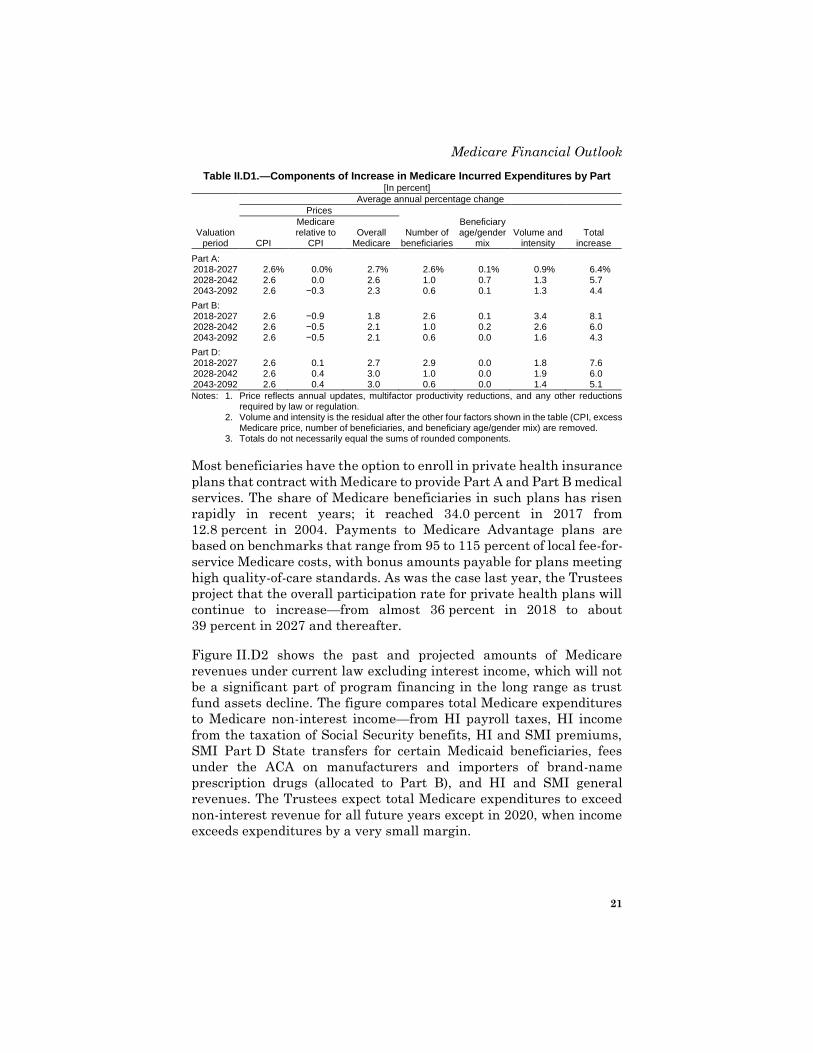
Table II.D1 shows five components of Medicare expenditure growth
over three valuation periods: (i) growth of overall prices as measured
by the CPI; (ii) growth of Medicare prices relative to the CPI;
(iii) growth in the number of beneficiaries; (iv) change in the age and
gender composition of the beneficiaries; and (v) change in the volume
and intensity of services. The growth of Medicare prices for Part A and
for Part B is projected to be below the CPI during each of the three
valuation periods, with the exception of the period 2018-2027 for
Part A. As discussed in section IV.D, prices for all of Part A and some
of Part B are constrained by the payment updates specified by the
ACA, and Part B prices are further constrained by the physician
updates specified by MACRA. Part D prices are projected to grow faster
than the CPI and to be more in line with the price growth assumed for
the overall health sector. For all parts of Medicare, growth in the
number of beneficiaries is highest over the next 10 years, as the baby
boom generation continues to enter Medicare, and slows continually
thereafter.
Medicare Financial Outlook
21
Table II.D1.—Components of Increase in Medicare Incurred Expenditures by Part [In percent]
Average annual percentage change
Prices
Valuation period CPI
Medicare relative to
CPI Overall
Medicare Number of
beneficiaries
Beneficiary age/gender
mix Volume and
intensity Total
increase
Part A: 2018-2027 2.6 % 0.0 % 2.7 % 2.6 % 0.1 % 0.9 % 6.4 % 2028-2042 2.6 0.0 2.6 1.0 0.7 1.3 5.7 2043-2092 2.6 −0.3 2.3 0.6 0.1 1.3 4.4
Part B: 2018-2027 2.6 −0.9 1.8 2.6 0.1 3.4 8.1 2028-2042 2.6 −0.5 2.1 1.0 0.2 2.6 6.0 2043-2092 2.6 −0.5 2.1 0.6 0.0 1.6 4.3
Part D: 2018-2027 2.6 0.1 2.7 2.9 0.0 1.8 7.6 2028-2042 2.6 0.4 3.0 1.0 0.0 1.9 6.0 2043-2092 2.6 0.4 3.0 0.6 0.0 1.4 5.1
Notes: 1. Price reflects annual updates, multifactor productivity reductions, and any other reductions required by law or regulation.
2. Volume and intensity is the residual after the other four factors shown in the table (CPI, excess Medicare price, number of beneficiaries, and beneficiary age/gender mix) are removed.
3. Totals do not necessarily equal the sums of rounded components.
Most beneficiaries have the option to enroll in private health insurance
plans that contract with Medicare to provide Part A and Part B medical
services. The share of Medicare beneficiaries in such plans has risen
rapidly in recent years; it reached 34.0 percent in 2017 from
12.8 percent in 2004. Payments to Medicare Advantage plans are
based on benchmarks that range from 95 to 115 percent of local fee-for-
service Medicare costs, with bonus amounts payable for plans meeting
high quality-of-care standards. As was the case last year, the Trustees
project that the overall participation rate for private health plans will
continue to increase—from almost 36 percent in 2018 to about
39 percent in 2027 and thereafter.
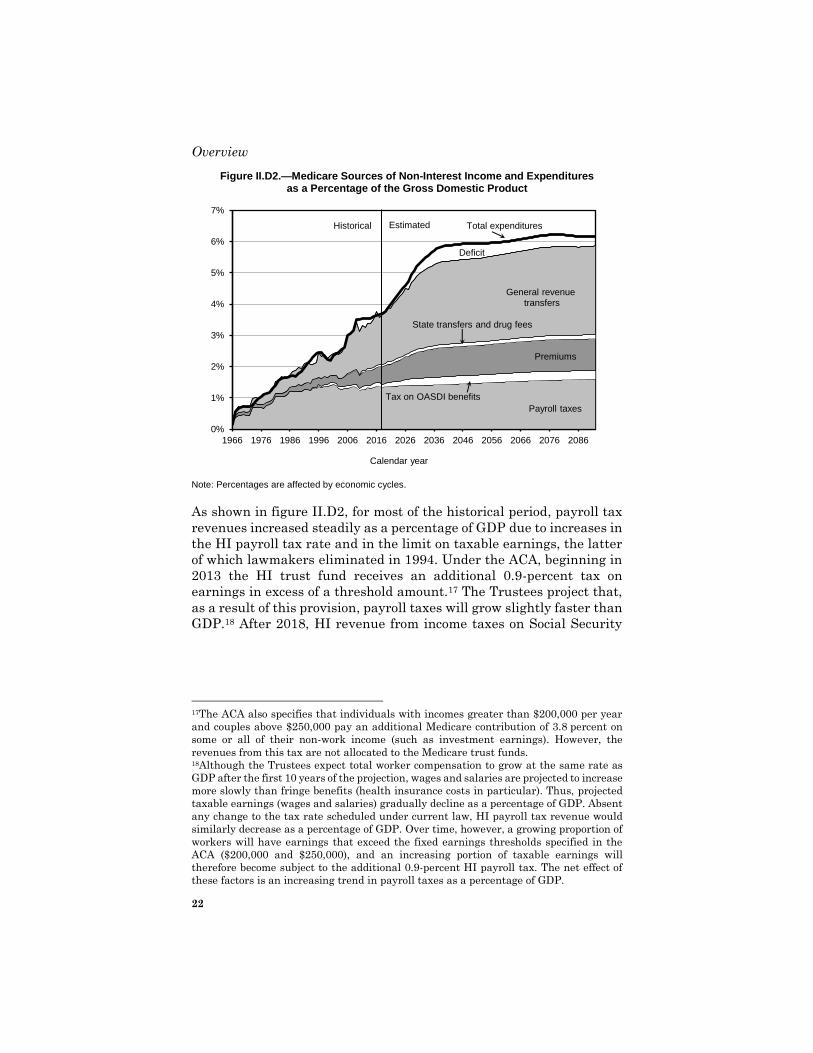
Figure II.D2 shows the past and projected amounts of Medicare
revenues under current law excluding interest income, which will not
be a significant part of program financing in the long range as trust
fund assets decline. The figure compares total Medicare expenditures
to Medicare non-interest income—from HI payroll taxes, HI income
from the taxation of Social Security benefits, HI and SMI premiums,
SMI Part D State transfers for certain Medicaid beneficiaries, fees
under the ACA on manufacturers and importers of brand-name
prescription drugs (allocated to Part B), and HI and SMI general
revenues. The Trustees expect total Medicare expenditures to exceed
non-interest revenue for all future years except in 2020, when income
exceeds expenditures by a very small margin.
Overview
22
Figure II.D2.—Medicare Sources of Non-Interest Income and Expenditures as a Percentage of the Gross Domestic Product
0%
1%
2%
3%
4%
5%
6%
7%
1966 1976 1986 1996 2006 2016 2026 2036 2046 2056 2066 2076 2086
Calendar year
Historical Estimated
Payroll taxes
Tax on OASDI benefits
Premiums
General revenuetransfers
Total expenditures
Deficit
State transfers and drug fees
Note: Percentages are affected by economic cycles.
As shown in figure II.D2, for most of the historical period, payroll tax
revenues increased steadily as a percentage of GDP due to increases in
the HI payroll tax rate and in the limit on taxable earnings, the latter
of which lawmakers eliminated in 1994. Under the ACA, beginning in
2013 the HI trust fund receives an additional 0.9-percent tax on
earnings in excess of a threshold amount.17 The Trustees project that,
as a result of this provision, payroll taxes will grow slightly faster than
GDP.18 After 2018, HI revenue from income taxes on Social Security
17The ACA also specifies that individuals with incomes greater than $200,000 per year
and couples above $250,000 pay an additional Medicare contribution of 3.8 percent on
some or all of their non-work income (such as investment earnings). However, the
revenues from this tax are not allocated to the Medicare trust funds. 18Although the Trustees expect total worker compensation to grow at the same rate as
GDP after the first 10 years of the projection, wages and salaries are projected to increase
more slowly than fringe benefits (health insurance costs in particular). Thus, projected
taxable earnings (wages and salaries) gradually decline as a percentage of GDP. Absent
any change to the tax rate scheduled under current law, HI payroll tax revenue would
similarly decrease as a percentage of GDP. Over time, however, a growing proportion of
workers will have earnings that exceed the fixed earnings thresholds specified in the
ACA ($200,000 and $250,000), and an increasing portion of taxable earnings will
therefore become subject to the additional 0.9-percent HI payroll tax. The net effect of
these factors is an increasing trend in payroll taxes as a percentage of GDP.
Medicare Financial Outlook
23
benefits will gradually increase as a share of GDP as the share of
benefits subject to such taxes increases.19
The Trustees expect growth in SMI Part B and Part D premiums and
general fund transfers to continue to outpace GDP growth and HI
payroll tax growth in the future. This phenomenon occurs primarily
because SMI revenue increases at the same rate as expenditures,
whereas HI revenue does not. Accordingly, as the HI sources of revenue
become increasingly inadequate to cover HI costs, SMI revenues will
represent a growing share of total Medicare revenues. Beginning in
2009, as HI payroll tax receipts declined due to the recession and
general revenue transfers increased, the latter income source became
the largest single source of income to the Medicare program as a whole.
General revenue transfers to the Part B account increased significantly
in 2016, as required by the Bipartisan Budget Act of 2015 to
compensate for premium revenue that was not received in 2016 due to
the hold-harmless provision, which limited the Part B premium
increase for a majority of beneficiaries. After decreasing from 2016 to
2017, general revenues will gradually increase as a share of Medicare
financing from 2018 through 2032 and grow to about 49 percent,
stabilizing thereafter. Growth in general revenue financing as a share
of GDP adds significantly to the Federal budget pressures. SMI
premiums will also grow in proportion to general revenue transfers,
placing a growing burden on beneficiaries. High-income beneficiaries
have paid an income-related premium for Part B since 2007 and for
Part D since 2011.
The interrelationship between the Medicare program and the Federal
budget is an important topic—one that will become increasingly
critical over time as the general revenue requirements for SMI
continue to grow. Transfers from the general fund are the major source
of financing for the SMI trust fund and are central to the automatic
financial balance of the fund’s two accounts, while representing a large
and growing requirement for the Federal budget. SMI general
revenues equal 1.5 percent of GDP in 2017 and will increase to an
estimated 2.8 percent in 2092 under current law. Moreover, in the
absence of legislation to address the financial imbalance, interest
earnings on trust fund assets and redemption of those assets will cover
the difference between HI dedicated revenues and expenditures until
2026.20 Both of these financial resources for the HI trust fund require
19See section V.C7 of the 2018 OASDI Trustees Report for more detailed information on
the projection of income from taxation of Social Security benefits. 20After asset depletion in 2026, as described in section II.E, no provision exists to use
general revenues or any other means to cover the HI deficit.
Overview
24
cash transfers from the general fund of the Treasury, representing a
draw on other Federal resources. In 2025, these transactions would
require general fund transfers equal to 0.2 percent of GDP. Section V.F
describes the interrelationship between the Federal budget and the
Medicare and Social Security trust funds; it illustrates the programs’
long-range financial outlook from both a trust fund perspective and a
budget perspective.
Federal law requires the Board of Trustees to test whether the
difference between program outlays and dedicated financing sources21
exceeds 45 percent of Medicare outlays under current law. If this level
is attained within the first 7 fiscal years of the projection, the law
requires the Trustees to issue a determination of projected excess
general revenue Medicare funding. For this year’s report, the
difference between program outlays and dedicated revenues is
expected to exceed 45 percent in fiscal year 2022, and therefore the
Trustees are issuing this determination. (Section V.B contains
additional details on these tests.) Since this is the second consecutive
such finding, the law specifies that a Medicare funding warning is
triggered and that the President must submit to Congress proposed
legislation to respond to the warning within 15 days after the
submission of the Fiscal Year 2020 Budget. Congress is then required
to consider the legislation on an expedited basis. Such funding
warnings were previously made in each of the 2007 through 2013
reports.
This section has summarized the total financial obligation posed by
Medicare and the manner in which it is financed. However, the HI and
SMI components of Medicare have separate and distinct trust funds,
each with its own sources of revenues and mandated expenditures.
Accordingly, it is necessary to assess the financial status of each
Medicare trust fund separately. Sections II.E and II.F present such
assessments for the HI trust fund and the SMI trust fund, respectively.
21The dedicated financing sources are HI payroll taxes, the HI share of income taxes on
Social Security benefits, Part B receipts from the new fees on manufacturers and
importers of brand-name prescription drugs, Part D State transfers, and beneficiary
premiums. These sources are the first four layers depicted in figure II.D2.
HI Financial Status
25
E. FINANCIAL STATUS OF THE HI TRUST FUND
1. 10-Year Actuarial Estimates (2018-2027)
Expenditures from the HI trust fund exceeded income each year from
2008 through 2015. In 2016 and 2017, however, there was a fund
surplus amounting to $5.4 billion and $2.8 billion, respectively.
Deficits are projected to return beginning in 2018 and to persist for the
remainder of the projection period. Beginning in 2018, payment of
expenditures in full and on time will require redemption of trust fund
assets until the trust fund’s depletion in 2026.
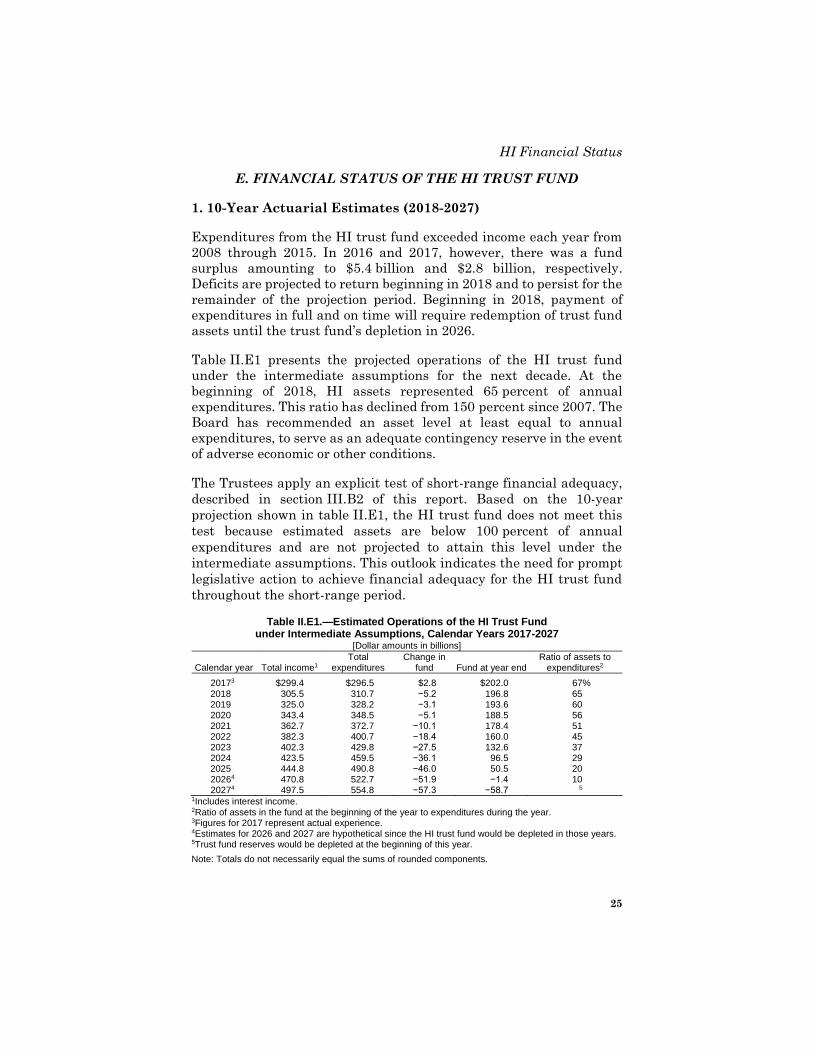
Table II.E1 presents the projected operations of the HI trust fund
under the intermediate assumptions for the next decade. At the
beginning of 2018, HI assets represented 65 percent of annual
expenditures. This ratio has declined from 150 percent since 2007. The
Board has recommended an asset level at least equal to annual
expenditures, to serve as an adequate contingency reserve in the event
of adverse economic or other conditions.
The Trustees apply an explicit test of short-range financial adequacy,
described in section III.B2 of this report. Based on the 10-year
projection shown in table II.E1, the HI trust fund does not meet this
test because estimated assets are below 100 percent of annual
expenditures and are not projected to attain this level under the
intermediate assumptions. This outlook indicates the need for prompt
legislative action to achieve financial adequacy for the HI trust fund
throughout the short-range period.
Table II.E1.—Estimated Operations of the HI Trust Fund under Intermediate Assumptions, Calendar Years 2017-2027
[Dollar amounts in billions]
Calendar year Total income1 Total
expenditures Change in
fund Fund at year end Ratio of assets to
expenditures2
2017 3 $299.4 $296.5 $2.8 $202.0 67% 2018 305.5 310.7 −5.2 196.8 65 2019 325.0 328.2 −3.1 193.6 60 2020 343.4 348.5 −5.1 188.5 56 2021 362.7 372.7 −10.1 178.4 51 2022 382.3 400.7 −18.4 160.0 45 2023 402.3 429.8 −27.5 132.6 37 2024 423.5 459.5 −36.1 96.5 29 2025 444.8 490.8 −46.0 50.5 20 2026 4 470.8 522.7 −51.9 −1.4 10 2027 4 497.5 554.8 −57.3 −58.7 5
1Includes interest income. 2Ratio of assets in the fund at the beginning of the year to expenditures during the year. 3Figures for 2017 represent actual experience. 4Estimates for 2026 and 2027 are hypothetical since the HI trust fund would be depleted in those years. 5Trust fund reserves would be depleted at the beginning of this year.
Note: Totals do not necessarily equal the sums of rounded components.
Overview
26
The short-range financial outlook for the HI trust fund has
deteriorated as compared to the projections in last year’s annual
report. This result is largely due to (i) lower income from payroll taxes
attributable to lowered wages for 2017 and lower levels of projected
GDP, (ii) lower income from the taxation of Social Security benefits as
a result of legislation, (iii) higher expenditures in 2017, (iv) legislation
that raised hospital expenditures, and (v) higher Medicare Advantage
(MA) payments attributable to higher risk scores for beneficiaries
enrolled in MA plans.
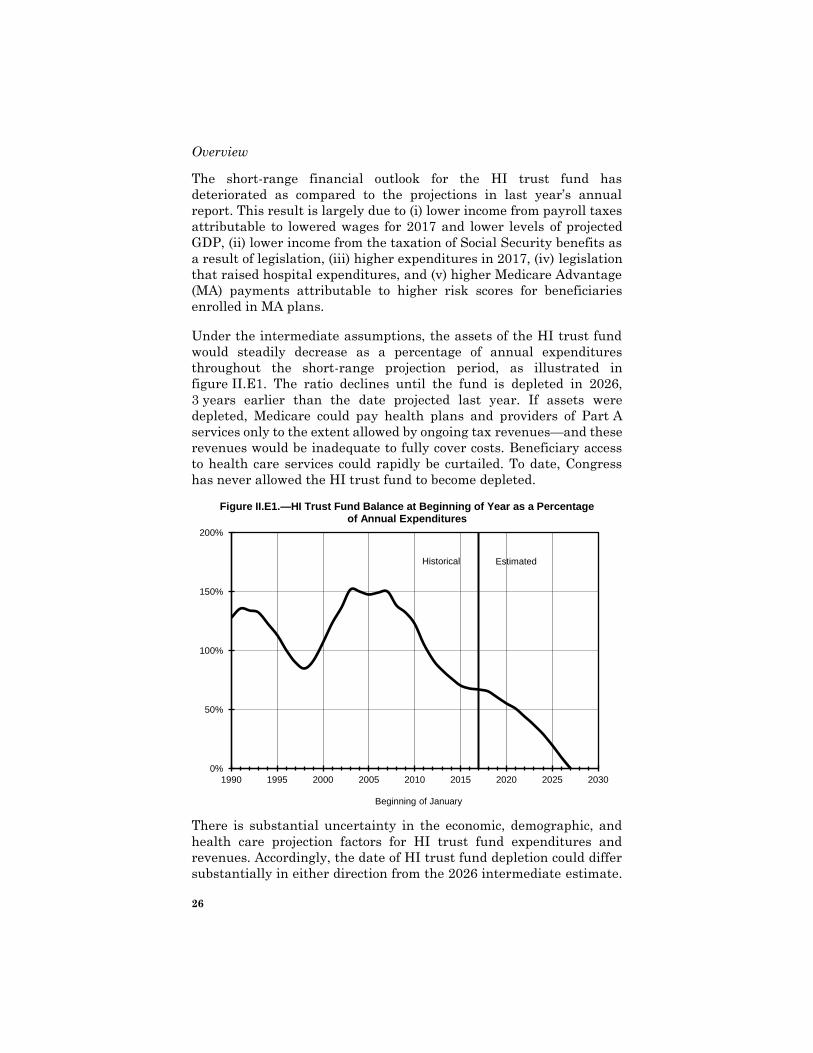
Under the intermediate assumptions, the assets of the HI trust fund
would steadily decrease as a percentage of annual expenditures
throughout the short-range projection period, as illustrated in
figure II.E1. The ratio declines until the fund is depleted in 2026,
3 years earlier than the date projected last year. If assets were
depleted, Medicare could pay health plans and providers of Part A
services only to the extent allowed by ongoing tax revenues—and these
revenues would be inadequate to fully cover costs. Beneficiary access
to health care services could rapidly be curtailed. To date, Congress
has never allowed the HI trust fund to become depleted.
Figure II.E1.—HI Trust Fund Balance at Beginning of Year as a Percentage of Annual Expenditures
0%
50%
100%
150%
200%
1990 1995 2000 2005 2010 2015 2020 2025 2030
Beginning of January
EstimatedHistorical
There is substantial uncertainty in the economic, demographic, and
health care projection factors for HI trust fund expenditures and
revenues. Accordingly, the date of HI trust fund depletion could differ
substantially in either direction from the 2026 intermediate estimate.
HI Financial Status
27
As shown in greater detail in section III.B, trust fund assets would
increase throughout the entire projection period under the low-cost
assumptions. Under the high-cost assumptions, however, asset
depletion would occur in 2023.
2. 75-Year Actuarial Estimates (2018-2092)
Each year, the Board prepares 75-year estimates of the financial and
actuarial status of the HI trust fund. Although financial outcomes are
inherently uncertain, particularly over periods as long as 75 years,
such estimates are helpful for assessing the trust fund’s long-term
financial condition.
Due to the difficulty in comparing dollar values for different periods
without some type of relative scale, the Trustees show income and
expenditure amounts relative to the earnings in covered employment
that are taxable under HI (referred to as taxable payroll). The ratio of
HI income (including payroll taxes, income from taxation of Social
Security benefits, premiums, general revenue transfers for uninsured
beneficiaries, and monies from fraud and abuse control activities, but
excluding interest income) to taxable payroll is called the income rate,
and the ratio of expenditures to taxable payroll is the cost rate.22
The standard HI payroll tax rate is scheduled to remain constant at
2.90 percent (for employees and employers, combined). In addition,
starting in 2013, high-income workers pay an additional 0.9 percent of
their earnings above $200,000 (for single workers) or $250,000 (for
married couples filing joint income tax returns). Since these income
thresholds are not indexed, over time an increasing proportion of
workers and their earnings will become subject to the additional HI tax
rate. (By the end of the long-range projection period, an estimated
79 percent of workers would be subject to this tax.) Thus, HI payroll
tax revenues will increase steadily as a percentage of taxable payroll.
Similarly, after 2019, HI income from taxation of Social Security
benefits will also increase faster than taxable payroll because the
income thresholds determining taxable benefits are not indexed for
price inflation.
The cost rate has mostly been declining since 2010, and it is projected
to continue to decline in 2018, largely due to (i) expenditure growth
that was constrained in part by low utilization and low payment
updates and (ii) a rebound of taxable payroll growth from 2007-2009
recession levels. After 2018 the cost rate is projected to rise primarily
22The Trustees estimate these costs on an incurred basis.
Overview
28
due to the continued retirements of those in the baby boom generation
and partly due to a projected return to modest health services cost
growth. This cost rate increase is moderated by the accumulating effect
of the productivity adjustments to provider price updates, which are
estimated to reduce annual HI per capita cost growth by an average of
0.8 percent through 2027 and 1.1 percent thereafter. After 25, 50, and
75 years, for example, the prices paid to HI providers under current
law would be 21 percent, 40 percent, and 55 percent lower,
respectively, than prices absent the productivity reductions.
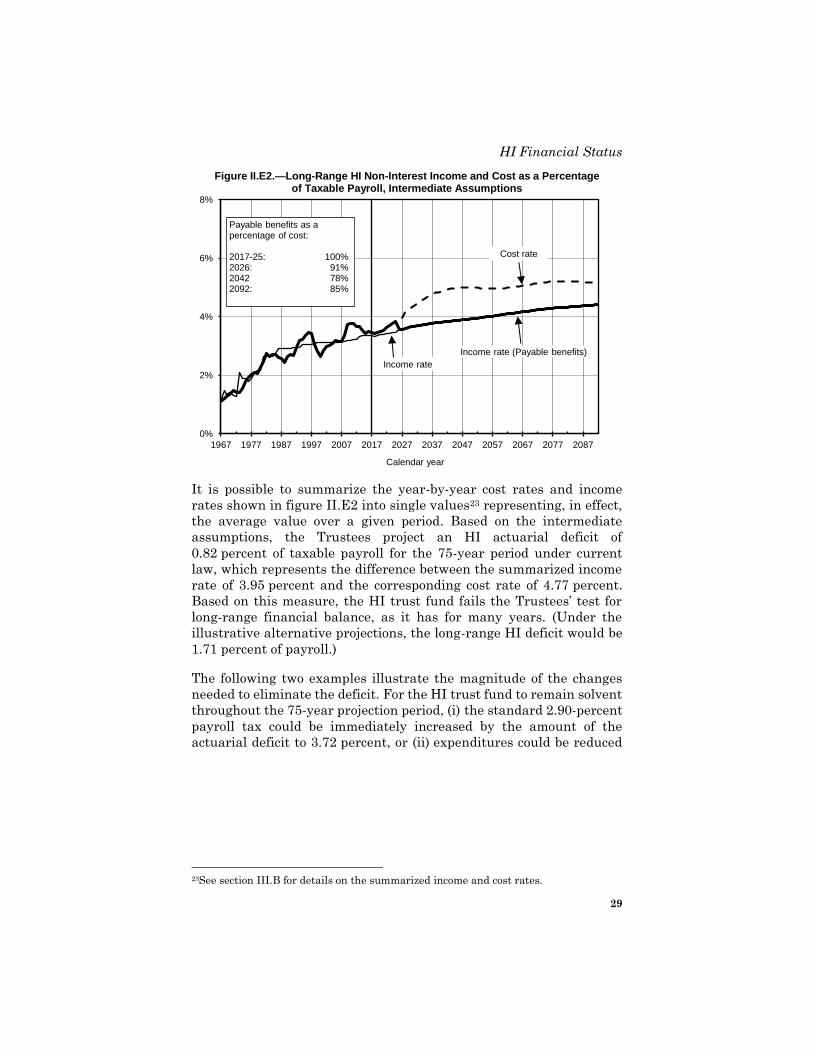
Figure II.E2 shows projected income and cost rates under the
intermediate assumptions. As indicated, estimated HI expenditures
continue to exceed non-interest income for all projected years. (The
projected excess of costs over non-interest income until 2026 is covered
by interest earnings and the redemption of trust fund assets. Both of
these sources of trust fund financing require transfers from the general
fund of the Treasury.)
The HI cost rate increases more rapidly than the income rate through
about 2045. The projected annual deficits expressed as a share of
taxable payroll increase from 0.08 percent in 2018 to a high of
1.12 percent in 2045 and then gradually decrease to 0.75 percent by
the end of the projection period. The convergence of growth rates for
income and costs reflects the continuing effects of the slower payment
rate updates under the ACA, assumed decelerating growth in the
volume and intensity of services, and the increasing portion of earnings
that are subjected to the additional 0.9-percent payroll tax. The
percentage of expenditures covered by non-interest income is projected
to decrease from 91 percent in 2026 to 78 percent in 2042 and then to
increase to about 85 percent by the end of the projection period. (Under
the illustrative alternative, the expenditures covered by non-interest
income are projected to decline from 91 percent in 2026 to 73 percent
in 2042 and then to decrease to about 55 percent by the end of the
projection period.)
HI Financial Status
29
Figure II.E2.—Long-Range HI Non-Interest Income and Cost as a Percentage of Taxable Payroll, Intermediate Assumptions
0%
2%
4%
6%
8%
1967 1977 1987 1997 2007 2017 2027 2037 2047 2057 2067 2077 2087
Calendar year
Cost rate
Income rate
Income rate (Payable benefits)
Payable benefits as a percentage of cost:
2017-25: 100%2026: 91%2042 78%2092: 85%
It is possible to summarize the year-by-year cost rates and income
rates shown in figure II.E2 into single values23 representing, in effect,
the average value over a given period. Based on the intermediate
assumptions, the Trustees project an HI actuarial deficit of
0.82 percent of taxable payroll for the 75-year period under current
law, which represents the difference between the summarized income
rate of 3.95 percent and the corresponding cost rate of 4.77 percent.
Based on this measure, the HI trust fund fails the Trustees’ test for
long-range financial balance, as it has for many years. (Under the
illustrative alternative projections, the long-range HI deficit would be
1.71 percent of payroll.)
The following two examples illustrate the magnitude of the changes
needed to eliminate the deficit. For the HI trust fund to remain solvent
throughout the 75-year projection period, (i) the standard 2.90-percent
payroll tax could be immediately increased by the amount of the
actuarial deficit to 3.72 percent, or (ii) expenditures could be reduced
23See section III.B for details on the summarized income and cost rates.
Overview
30
immediately by 17 percent.24,25 More realistically, the tax and/or
benefit changes could occur gradually but would require ultimate
adjustments that would be higher than adjustments that were done
immediately. Lawmakers have many options to address the long-range
financial imbalance.
The projected HI cost rates shown in this report are higher than those
from the 2017 report for all years largely due to higher spending and
lower taxable payroll in all projected years.
24Under the illustrative alternative projection, the corresponding immediate changes
would be (i) an increase from 2.90 percent to 4.61 percent in the standard tax rate or
(ii) a decrease in expenditure levels of 30 percent. 25Under the two examples for addressing the long-range financial imbalance, tax income
would initially be substantially greater than expenditures, and trust fund assets would
accumulate rapidly. Subsequently, however, tax income would be inadequate, and assets
would be drawn down to cover the difference. This example illustrates that if lawmakers
designed legislative solutions to eliminate only the 75-year actuarial deficit, without
consideration of such year-by-year patterns, then a substantial financial imbalance could
still remain at the end of the period, and the long-range sustainability of the program
could still be in doubt.
SMI Financial Status
31
F. FINANCIAL STATUS OF THE SMI TRUST FUND
SMI differs fundamentally from HI in regard to the nature of its
financing and the method by which its financial status is evaluated.
SMI comprises two parts, Part B and Part D, each with its own
separate account within the SMI trust fund. The Trustees must
determine the financial status of the SMI trust fund by evaluating the
financial status of each account separately, since there is no provision
in the law for transferring assets or income between the Part B and
Part D accounts. The nature of the financing for both parts of SMI is
similar in that the law establishes a mechanism by which income from
the Part B premium and the Part D premium, and the corresponding
transfers from general revenues for each part, are sufficient to cover
the following year’s estimated expenditures. Accordingly, each account
within SMI is automatically in financial balance under current law.
This result contrasts with OASDI and HI, for which financing
established many years earlier may prove significantly higher or lower
than subsequent actual costs. Moreover, Part B and Part D are
voluntary (whereas OASDI and HI are generally compulsory), and
payroll taxes are not the source of income for these programs. The
financial assessment described in this section differs in important
ways from that for OASDI or HI.
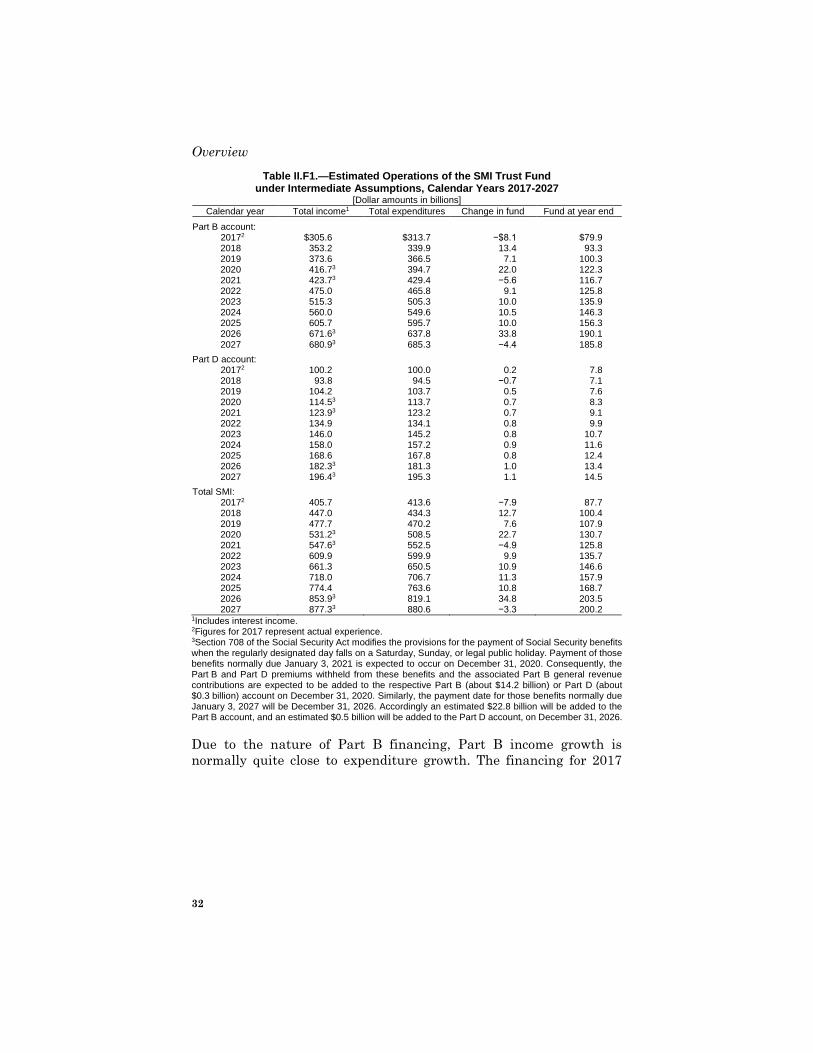
1. 10-Year Actuarial Estimates (2018-2027)
Table II.F1 shows the estimated operations of the Part B account, the
Part D account, and the total SMI trust fund under the intermediate
assumptions during calendar years 2017 through 2027. For Part B,
expenditures grew at an average annual rate of 5.5 percent over the
past 5 years, exceeding GDP growth by 1.8 percentage points annually,
on average. Estimated Part B cost increases average about 8.2 percent
for the 5-year period 2018 to 2022, faster than the GDP growth rate of
4.7 percent for the same 5-year period.
Overview
32
Table II.F1.—Estimated Operations of the SMI Trust Fund under Intermediate Assumptions, Calendar Years 2017-2027
[Dollar amounts in billions]
Calendar year Total income1 Total expenditures Change in fund Fund at year end
Part B account: 2017 2 $305.6 $313.7 −$8.1 $79.9 2018 353.2 339.9 13.4 93.3 2019 373.6 366.5 7.1 100.3 2020 416.7 3 394.7 22.0 122.3 2021 423.7 3 429.4 −5.6 116.7 2022 475.0 465.8 9.1 125.8 2023 515.3 505.3 10.0 135.9 2024 560.0 549.6 10.5 146.3 2025 605.7 595.7 10.0 156.3 2026 671.6 3 637.8 33.8 190.1
2027 680.9 3 685.3 −4.4 185.8
Part D account: 2017 2 100.2 100.0 0.2 7.8 2018 93.8 94.5 −0.7 7.1 2019 104.2 103.7 0.5 7.6 2020 114.5 3 113.7 0.7 8.3 2021 123.9 3 123.2 0.7 9.1 2022 134.9 134.1 0.8 9.9 2023 146.0 145.2 0.8 10.7 2024 158.0 157.2 0.9 11.6 2025 168.6 167.8 0.8 12.4 2026 182.3 3 181.3 1.0 13.4 2027 196.4 3 195.3 1.1 14.5
Total SMI: 2017 2 405.7 413.6 −7.9 87.7 2018 447.0 434.3 12.7 100.4 2019 477.7 470.2 7.6 107.9 2020 531.2 3 508.5 22.7 130.7 2021 547.6 3 552.5 −4.9 125.8 2022 609.9 599.9 9.9 135.7 2023 661.3 650.5 10.9 146.6 2024 718.0 706.7 11.3 157.9 2025 774.4 763.6 10.8 168.7 2026 853.9 3 819.1 34.8 203.5 2027 877.3 3 880.6 −3.3 200.2
1Includes interest income. 2Figures for 2017 represent actual experience. 3Section 708 of the Social Security Act modifies the provisions for the payment of Social Security benefits when the regularly designated day falls on a Saturday, Sunday, or legal public holiday. Payment of those benefits normally due January 3, 2021 is expected to occur on December 31, 2020. Consequently, the Part B and Part D premiums withheld from these benefits and the associated Part B general revenue contributions are expected to be added to the respective Part B (about $14.2 billion) or Part D (about $0.3 billion) account on December 31, 2020. Similarly, the payment date for those benefits normally due January 3, 2027 will be December 31, 2026. Accordingly an estimated $22.8 billion will be added to the Part B account, and an estimated $0.5 billion will be added to the Part D account, on December 31, 2026.
Due to the nature of Part B financing, Part B income growth is
normally quite close to expenditure growth. The financing for 2017
SMI Financial Status
33
reduced the assets held in the Part B account below the customary
range by the end of 2017.26
The 2018 monthly Part B premium rate is $134.00, which is the same
as the 2017 monthly premium. For determining an individual’s
monthly premium rate, there is a hold-harmless provision in the law
that limits the dollar increase in the premium to the dollar increase in
an individual’s Social Security benefit. This provision applies to most
beneficiaries who have their premiums deducted from their Social
Security benefits, or roughly 70 percent of Part B enrollees in 2016 and
2017.27 Because the cost-of-living adjustment (COLA) for Social
Security benefits was 0.0 percent for 2016, premiums did not increase
from the 2015 level of $104.90 for those beneficiaries to whom the
provision applies. For 2017, the COLA was 0.3 percent, which limited
the Part B premium increase for beneficiaries who were held harmless.
Because roughly 70 percent of beneficiaries had their premium
increase limited, the remaining minority of beneficiaries paid (or had
paid on their behalf) a higher-than-normal premium to offset the
financial effects of this premium restriction. In order to limit the
premium increase for those not held harmless, the financing for 2017
was set to target a contingency reserve below the minimally adequate
level. As a result, Part B assets decreased in 2017. For 2018, financing
rates were set to restore the Part B assets to an adequate level. The
financing rates for 2019 and later are expected to maintain an
adequate contingency reserve.
The projected short-range Part B expenditures shown in table II.F1 are
higher than the corresponding amounts in the 2017 Trustees Report.
The main reasons are (i) the Bipartisan Budget Act of 2018, which
eliminated the Independent Payment Advisory Board and removed
payment caps for certain therapy services, and (ii) higher Medicare
Advantage spending.
26The traditional measure used to evaluate the status of the Part B account of the SMI
trust fund is defined as the ratio of the excess of Part B assets over Part B liabilities to
the next year’s Part B incurred expenditures. The customary range for this ratio is 15 to
20 percent, and the minimally financially adequate level is 14 percent; the CMS Office
of the Actuary developed these amounts based on private health insurance standards
and past studies indicating that this asset reserve level is sufficient to protect against
adverse events. 27About 30 percent of Part B enrollees are not eligible for the hold-harmless provision.
This group consists of new enrollees during the year, enrollees who do not receive Social
Security benefit checks, enrollees with high incomes who are subject to the income-
related premium adjustment, and dual Medicare-Medicaid beneficiaries (whose
premiums are paid by State Medicaid programs).
Overview
34
For the Part D account, the Trustees project that income and
expenditures will grow at an average annual rate of 6.9 percent over
the 10-year period 2018 to 2027, due to expected increases in
enrollment and growth in per capita drug costs. As with Part B, income
and outgo would remain in balance as a result of the annual
adjustment of premium and general revenue income to cover costs. The
appropriation for Part D general revenues has generally been set such
that amounts can be transferred to the Part D account on an as-needed
basis; under this process, there is no need to maintain a contingency
reserve. The Part D account reflects a policy implemented in
September 2015 to transfer amounts from the Treasury into the
account 5 business days before the benefit payments to the plans.
After 2017, the projected Part D costs shown in table II.F1 and
elsewhere in this report are lower than those in the 2017 report. The
difference is primarily attributable to higher manufacturer rebates, a
decline in spending for hepatitis C drugs, and a slowdown in spending
growth for diabetes drugs.
The primary test of financial adequacy for Parts B and D pertains to
the level of the financing established for a given period (normally,
through the end of the current calendar year). The financing for each
part of SMI is considered satisfactory if it is sufficient to fund all
services, including benefits and administrative expenses, provided
through a given period. In addition, to protect against the possibility
that cost increases under either part of SMI will be higher than
expected, the accounts of the trust fund would normally need assets
adequate to cover a reasonable degree of variation between actual and
projected costs. For Part B, the Trustees estimate that the financing
established through December 2018 will be sufficient to cover benefits
and administrative costs incurred through that time period, and they
estimate that assets will be adequate to cover potential variations in
costs as a result of new legislation or cost growth factors that exceed
expectations. The estimated financing established for Part D, together
with the flexible appropriation authority for this trust fund account,
would be sufficient to cover benefits and administrative costs incurred
through 2018.
The amount of the contingency reserve needed in Part B is normally
much smaller (both in absolute dollars and as a fraction of annual
costs) than in HI or OASDI. A smaller reserve is adequate because the
premium rate and corresponding general revenue transfers for Part B
are determined annually based on estimated future costs, while the HI
and OASDI payroll tax rates are fixed under law and are therefore
much more difficult to adjust should circumstances change. A statutory
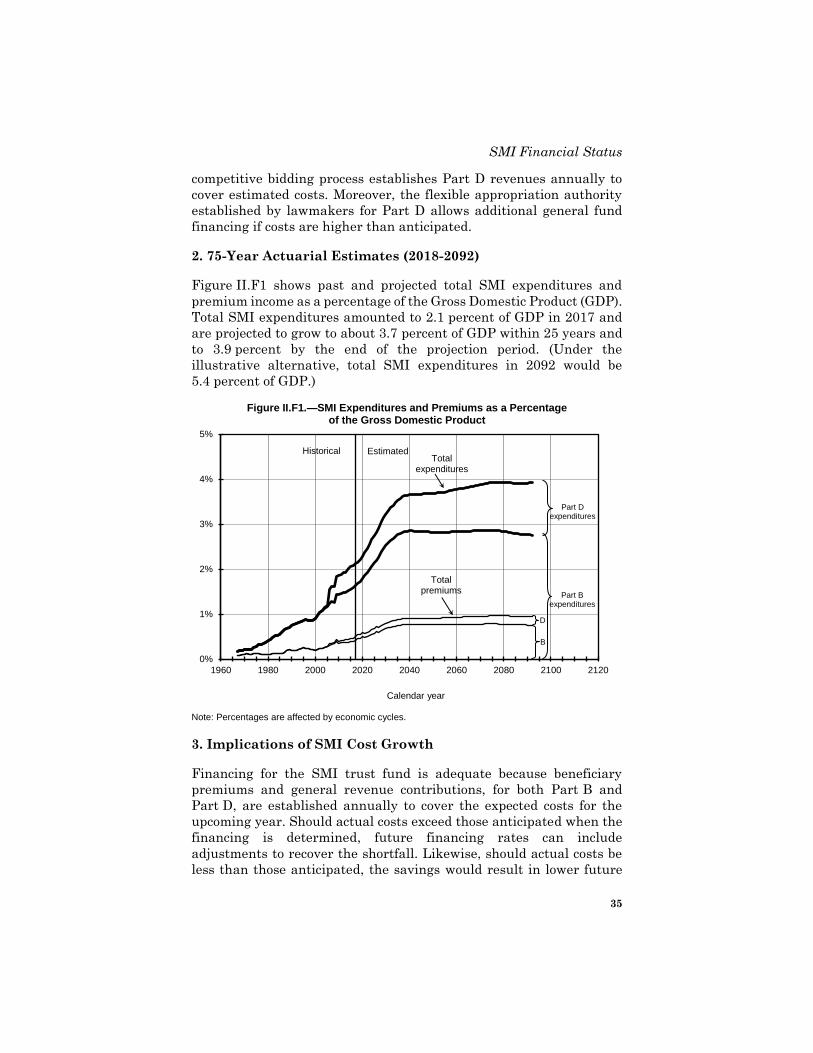
SMI Financial Status
35
competitive bidding process establishes Part D revenues annually to
cover estimated costs. Moreover, the flexible appropriation authority
established by lawmakers for Part D allows additional general fund
financing if costs are higher than anticipated.
2. 75-Year Actuarial Estimates (2018-2092)
Figure II.F1 shows past and projected total SMI expenditures and
premium income as a percentage of the Gross Domestic Product (GDP).
Total SMI expenditures amounted to 2.1 percent of GDP in 2017 and
are projected to grow to about 3.7 percent of GDP within 25 years and
to 3.9 percent by the end of the projection period. (Under the
illustrative alternative, total SMI expenditures in 2092 would be
5.4 percent of GDP.)
Figure II.F1.—SMI Expenditures and Premiums as a Percentage of the Gross Domestic Product
0%
1%
2%
3%
4%
5%
1960 1980 2000 2020 2040 2060 2080 2100 2120
Calendar year
Total expenditures
Historical Estimated
B
Totalpremiums
Part B expenditures
Part D expenditures
D
Note: Percentages are affected by economic cycles.
3. Implications of SMI Cost Growth
Financing for the SMI trust fund is adequate because beneficiary
premiums and general revenue contributions, for both Part B and
Part D, are established annually to cover the expected costs for the
upcoming year. Should actual costs exceed those anticipated when the
financing is determined, future financing rates can include
adjustments to recover the shortfall. Likewise, should actual costs be
less than those anticipated, the savings would result in lower future
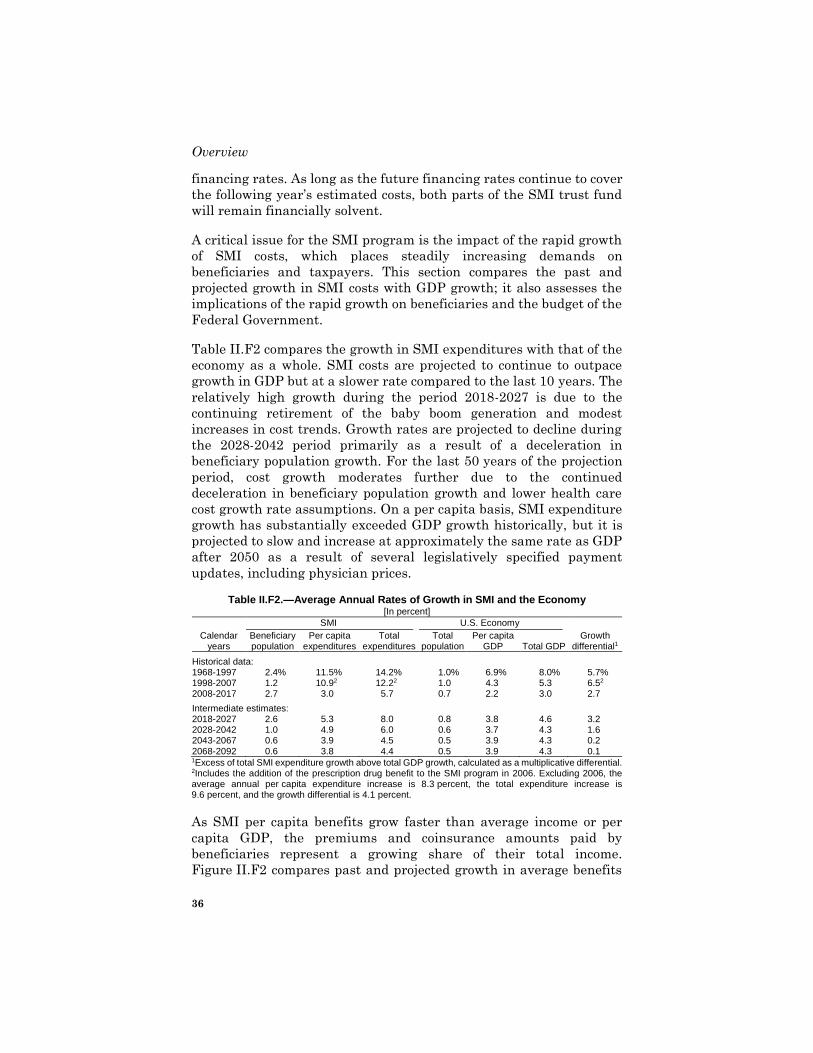
Overview
36
financing rates. As long as the future financing rates continue to cover
the following year’s estimated costs, both parts of the SMI trust fund
will remain financially solvent.
A critical issue for the SMI program is the impact of the rapid growth
of SMI costs, which places steadily increasing demands on
beneficiaries and taxpayers. This section compares the past and
projected growth in SMI costs with GDP growth; it also assesses the
implications of the rapid growth on beneficiaries and the budget of the
Federal Government.
Table II.F2 compares the growth in SMI expenditures with that of the
economy as a whole. SMI costs are projected to continue to outpace
growth in GDP but at a slower rate compared to the last 10 years. The
relatively high growth during the period 2018-2027 is due to the
continuing retirement of the baby boom generation and modest
increases in cost trends. Growth rates are projected to decline during
the 2028-2042 period primarily as a result of a deceleration in
beneficiary population growth. For the last 50 years of the projection
period, cost growth moderates further due to the continued
deceleration in beneficiary population growth and lower health care
cost growth rate assumptions. On a per capita basis, SMI expenditure
growth has substantially exceeded GDP growth historically, but it is
projected to slow and increase at approximately the same rate as GDP
after 2050 as a result of several legislatively specified payment
updates, including physician prices.
Table II.F2.—Average Annual Rates of Growth in SMI and the Economy [In percent]
SMI U.S. Economy Calendar
years Beneficiary population
Per capita expenditures
Total expenditures
Total population
Per capita GDP Total GDP
Growth differential1
Historical data: 1968-1997 2.4 % 11.5 % 14.2 % 1.0 % 6.9 % 8.0 % 5.7 % 1998-2007 1.2 10.9 2 12.2 2 1.0 4.3 5.3 6.5 2 2008-2017 2.7 3.0 5.7 0.7 2.2 3.0 2.7
Intermediate estimates: 2018-2027 2.6 5.3 8.0 0.8 3.8 4.6 3.2 2028-2042 1.0 4.9 6.0 0.6 3.7 4.3 1.6 2043-2067 0.6 3.9 4.5 0.5 3.9 4.3 0.2 2068-2092 0.6 3.8 4.4 0.5 3.9 4.3 0.1 1Excess of total SMI expenditure growth above total GDP growth, calculated as a multiplicative differential. 2Includes the addition of the prescription drug benefit to the SMI program in 2006. Excluding 2006, the average annual per capita expenditure increase is 8.3 percent, the total expenditure increase is 9.6 percent, and the growth differential is 4.1 percent.
As SMI per capita benefits grow faster than average income or per
capita GDP, the premiums and coinsurance amounts paid by
beneficiaries represent a growing share of their total income.
Figure II.F2 compares past and projected growth in average benefits
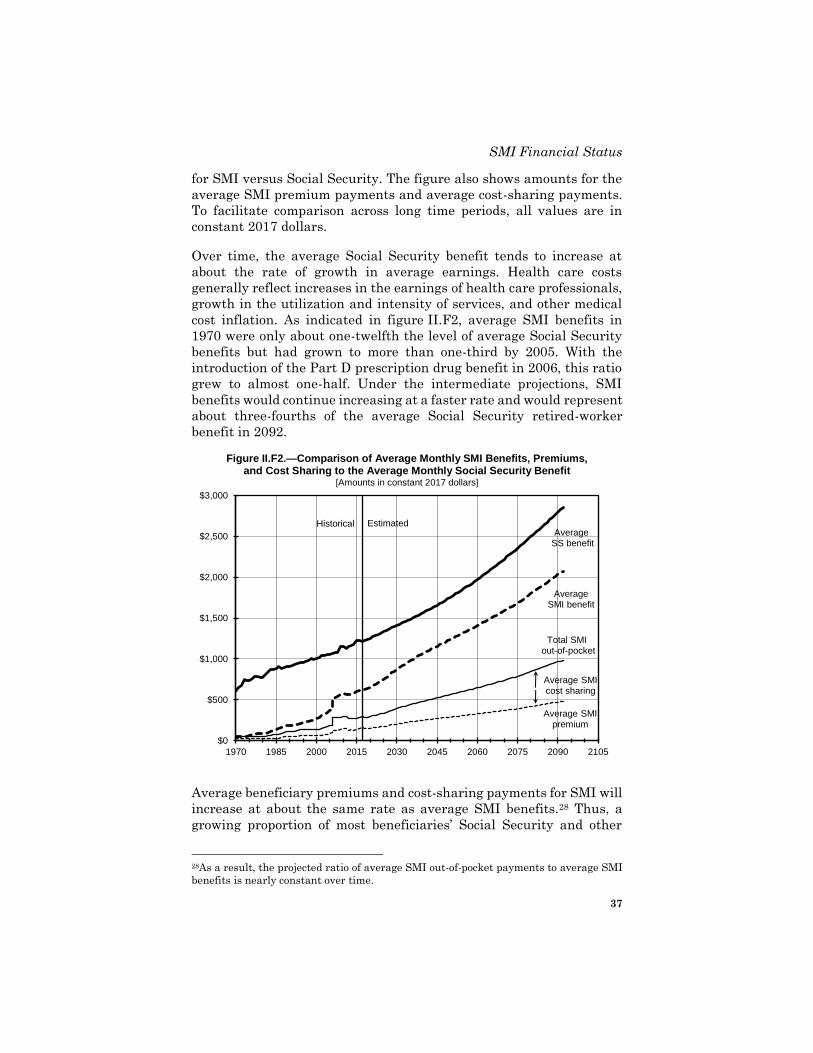
SMI Financial Status
37
for SMI versus Social Security. The figure also shows amounts for the
average SMI premium payments and average cost-sharing payments.
To facilitate comparison across long time periods, all values are in
constant 2017 dollars.
Over time, the average Social Security benefit tends to increase at
about the rate of growth in average earnings. Health care costs
generally reflect increases in the earnings of health care professionals,
growth in the utilization and intensity of services, and other medical
cost inflation. As indicated in figure II.F2, average SMI benefits in
1970 were only about one-twelfth the level of average Social Security
benefits but had grown to more than one-third by 2005. With the
introduction of the Part D prescription drug benefit in 2006, this ratio
grew to almost one-half. Under the intermediate projections, SMI
benefits would continue increasing at a faster rate and would represent
about three-fourths of the average Social Security retired-worker
benefit in 2092.
Figure II.F2.—Comparison of Average Monthly SMI Benefits, Premiums, and Cost Sharing to the Average Monthly Social Security Benefit
[Amounts in constant 2017 dollars]
$0
$500
$1,000
$1,500
$2,000
$2,500
$3,000
1970 1985 2000 2015 2030 2045 2060 2075 2090 2105
Historical Estimated
AverageSMI benefit
AverageSS benefit
Total SMI out-of-pocket
Average SMIpremium
Average SMIcost sharing
Average beneficiary premiums and cost-sharing payments for SMI will
increase at about the same rate as average SMI benefits.28 Thus, a
growing proportion of most beneficiaries’ Social Security and other
28As a result, the projected ratio of average SMI out-of-pocket payments to average SMI
benefits is nearly constant over time.
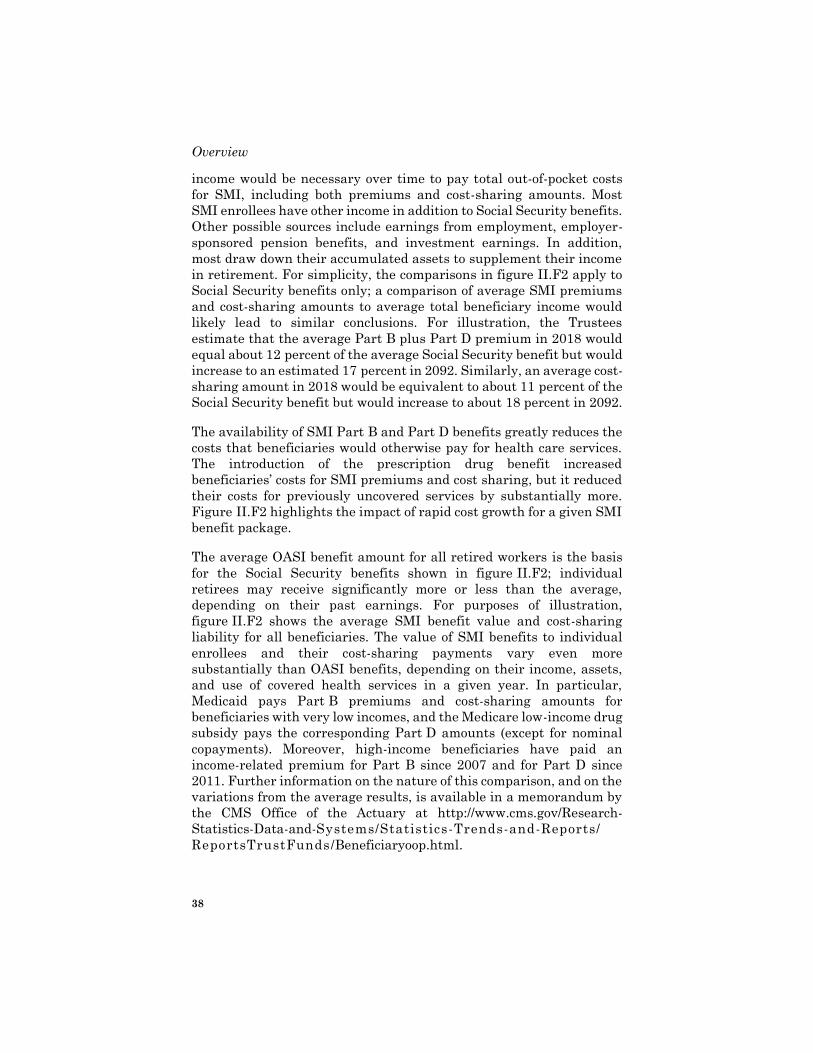
Overview
38
income would be necessary over time to pay total out-of-pocket costs
for SMI, including both premiums and cost-sharing amounts. Most
SMI enrollees have other income in addition to Social Security benefits.
Other possible sources include earnings from employment, employer-
sponsored pension benefits, and investment earnings. In addition,
most draw down their accumulated assets to supplement their income
in retirement. For simplicity, the comparisons in figure II.F2 apply to
Social Security benefits only; a comparison of average SMI premiums
and cost-sharing amounts to average total beneficiary income would
likely lead to similar conclusions. For illustration, the Trustees
estimate that the average Part B plus Part D premium in 2018 would
equal about 12 percent of the average Social Security benefit but would
increase to an estimated 17 percent in 2092. Similarly, an average cost-
sharing amount in 2018 would be equivalent to about 11 percent of the
Social Security benefit but would increase to about 18 percent in 2092.
The availability of SMI Part B and Part D benefits greatly reduces the
costs that beneficiaries would otherwise pay for health care services.
The introduction of the prescription drug benefit increased
beneficiaries’ costs for SMI premiums and cost sharing, but it reduced
their costs for previously uncovered services by substantially more.
Figure II.F2 highlights the impact of rapid cost growth for a given SMI
benefit package.
The average OASI benefit amount for all retired workers is the basis
for the Social Security benefits shown in figure II.F2; individual
retirees may receive significantly more or less than the average,
depending on their past earnings. For purposes of illustration,
figure II.F2 shows the average SMI benefit value and cost-sharing
liability for all beneficiaries. The value of SMI benefits to individual
enrollees and their cost-sharing payments vary even more
substantially than OASI benefits, depending on their income, assets,
and use of covered health services in a given year. In particular,
Medicaid pays Part B premiums and cost-sharing amounts for
beneficiaries with very low incomes, and the Medicare low-income drug
subsidy pays the corresponding Part D amounts (except for nominal
copayments). Moreover, high-income beneficiaries have paid an
income-related premium for Part B since 2007 and for Part D since
2011. Further information on the nature of this comparison, and on the
variations from the average results, is available in a memorandum by
the CMS Office of the Actuary at http://www.cms.gov/Research-
Statistics-Data-and-Systems/Statistics-Trends-and-Reports/
ReportsTrustFunds/Beneficiaryoop.html.
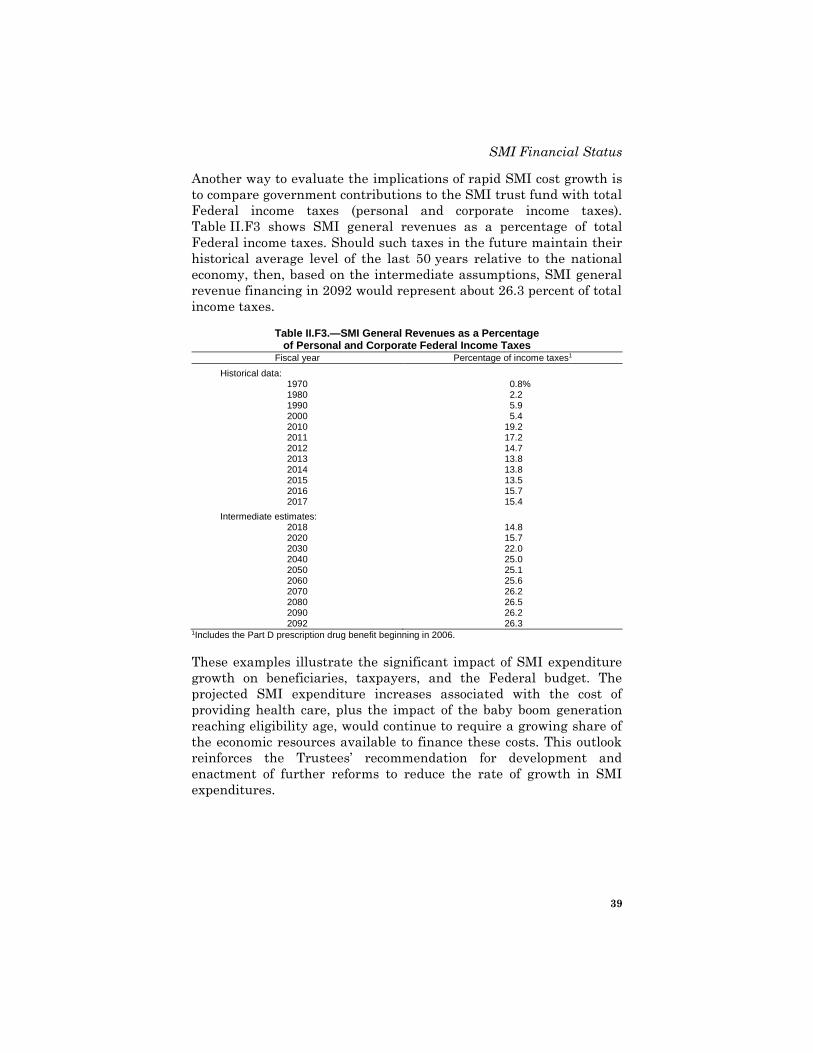
SMI Financial Status
39
Another way to evaluate the implications of rapid SMI cost growth is
to compare government contributions to the SMI trust fund with total
Federal income taxes (personal and corporate income taxes).
Table II.F3 shows SMI general revenues as a percentage of total
Federal income taxes. Should such taxes in the future maintain their
historical average level of the last 50 years relative to the national
economy, then, based on the intermediate assumptions, SMI general
revenue financing in 2092 would represent about 26.3 percent of total
income taxes.
Table II.F3.—SMI General Revenues as a Percentage of Personal and Corporate Federal Income Taxes
Fiscal year Percentage of income taxes1
Historical data: 1970 0.8 % 1980 2.2 1990 5.9 2000 5.4 2010 19.2 2011 17.2 2012 14.7 2013 13.8 2014 13.8 2015 13.5 2016 15.7 2017 15.4
Intermediate estimates: 2018 14.8 2020 15.7 2030 22.0 2040 25.0 2050 25.1 2060 25.6 2070 26.2 2080 26.5 2090 26.2 2092 26.3
1Includes the Part D prescription drug benefit beginning in 2006.
These examples illustrate the significant impact of SMI expenditure
growth on beneficiaries, taxpayers, and the Federal budget. The
projected SMI expenditure increases associated with the cost of
providing health care, plus the impact of the baby boom generation
reaching eligibility age, would continue to require a growing share of
the economic resources available to finance these costs. This outlook
reinforces the Trustees’ recommendation for development and
enactment of further reforms to reduce the rate of growth in SMI
expenditures.
Overview
40
G. CONCLUSION
Total Medicare expenditures were $710 billion in 2017, and the Board
projects that they will increase in most future years at a somewhat
faster pace than either aggregate workers’ earnings or the economy
overall. The faster increase is primarily due to the number of
beneficiaries increasing more rapidly than the number of workers,
coupled with a continued increase in the volume and intensity of
services delivered. Based on the intermediate set of assumptions under
current law, expenditures as a percentage of GDP would increase from
the current 3.7 percent to a projected 6.2 percent by 2092.
The HI trust fund fails to meet the Board of Trustees’ short-range test
of financial adequacy. In addition, as in past reports, the HI trust fund
fails to meet the Trustees’ long-range test of close actuarial balance.
HI experienced small surpluses in 2016 and 2017 after having deficits
from 2008 through 2015, and deficits are expected for the remainder of
the 75-year projection period. The projected trust fund depletion date
is 2026, 3 years earlier than estimated in last year’s report. HI income
is projected to be lower than last year’s estimates due to (i) lower
payroll taxes attributable to lowered wages for 2017 and lower levels
of projected GDP and (ii) lower income from the taxation of Social
Security benefits as a result of legislation. Actual HI expenditures in
2017 were slightly higher than the previous estimate. The expenditure
projections are slightly higher for the short-range period due to higher
spending in 2017, legislation that increased hospital spending, and
higher Medicare Advantage payments.
The HI actuarial deficit in this year’s report is 0.82 percent of taxable
payroll, up from 0.64 percent in last year’s report. This result is due
primarily to the same factors described above.
The financial outlook for SMI is fundamentally different than for HI
due to the statutory differences in the methods of financing for these
two components of Medicare.
The Trustees project that both the Part B and Part D accounts of the
SMI trust fund will remain in financial balance for all future years
because beneficiary premiums and general revenue transfers are
assumed to be set at a level to meet expected costs each year. However,
SMI costs are projected to increase significantly as a share of GDP over
the next 75 years, from 2.1 percent to 4.0 percent under current law.
The projected Part B costs in this report are higher than those in the
previous report due to recent legislation and higher Medicare
Conclusion
41
Advantage spending. The short-range Part D projections are lower
than in last year’s report, largely due to the increase in drug
manufacturer rebate assumptions, a decline in spending for
hepatitis C drugs, and a slowdown in spending growth for diabetes
drugs, but they are similar to last year’s long-range projections due to
slightly higher growth rate assumptions.
The financial projections shown for the Medicare program in this
report reflect substantial, but very uncertain, cost savings deriving
from provisions of the ACA and MACRA that lower increases in
Medicare payment rates to most categories of health care providers.
Without fundamental change in the current delivery system, these
adjustments would probably not be viable indefinitely.
In view of these issues with provider payment rates, the Trustees note
that the actual future costs for Medicare could exceed those shown in
this report. Projections under an alternative scenario, as provided in
section V.C and in a memorandum from the Office of the Actuary,29 can
help illustrate the potential magnitude of the understatement. For
example, the total cost of Medicare in 2092 would be 8.9 percent of GDP
under the alternative projections (versus 6.2 percent under current
law), and the HI actuarial deficit would be 1.71 percent of taxable
payroll (versus 0.82 percent). (The projected depletion date for the HI
trust fund would be the same year.) Readers should interpret the
projections shown in this report as illustrations of the very favorable
impact of permanently slower growth in health care costs, if such
slower growth is achievable. The illustrative alternative projections
show the higher costs if not for these elements of current law.
Policy makers should determine effective solutions to the long-range
HI financial imbalance. Even assuming that the provider payment
rates will be adequate, the HI program does not meet either the
Trustees’ short-range test of financial adequacy or long-range test of
close actuarial balance. HI revenues would cover only 91 percent of
estimated expenditures in 2026 and 79 percent in 2050. By the end of
the 75-year projection period, HI revenues could pay 85 percent of HI
costs. Policy makers should also consider the likelihood that the price
adjustments in current law may prove difficult to adhere to fully and
may require even more changes to address the financial imbalance.
The projections in this year’s report continue to demonstrate the need
for timely and effective action to address Medicare’s remaining
29See http://www.cms.gov/Research-Statistics-Data-and-Systems/Statistics-Trends-and-
Reports/ReportsTrustFunds/Downloads/2018TRAlternativeScenario.pdf.
Overview
42
financial challenges—including the projected depletion of the HI trust
fund, this fund’s long-range financial imbalance, and the rapid growth
in Medicare expenditures. Furthermore, if the growth in Medicare
costs is comparable to growth under the illustrative alternative
projections, then these further policy reforms will have to address
much larger financial challenges than those assumed under current
law. The Board of Trustees believes that solutions can and must be
found to ensure the financial integrity of HI in the short and long term
and to reduce the rate of growth in Medicare costs through viable
means. Consideration of such reforms should not be delayed. The
sooner the solutions are enacted, the more flexible and gradual they
can be. Moreover, the early introduction of reforms increases the time
available for affected individuals and organizations—including health
care providers, beneficiaries, and taxpayers—to adjust their
expectations and behavior. The Board recommends that Congress and
the executive branch work closely together with a sense of urgency to
address these challenges.
43
III. ACTUARIAL ANALYSIS
A. INTRODUCTION
The Actuarial Analysis section focuses on the costs and financing of the
individual HI and SMI trust fund accounts. The Trustees perform an
analysis for each trust fund individually, to determine whether each
account’s income and expenditures are balanced as necessary to
maintain solvency. (It is also valuable to consider Medicare’s total
expenditures and the sources and relative magnitudes of the program’s
revenues. Section V.B presents such information for Medicare overall.)
For this report, projections are shown in two different ways. The cash
basis reflects the date when payment for the service was made,
whereas the incurred basis reflects the date when the service was
performed. The projections are first prepared on an incurred basis, and
then adjustments are made to account for costs on a cash basis.
Generally, trust fund operations show the actual or projected income
and expenditures on a cash basis, while analysis and methodology are
presented on an incurred basis.
The HI and SMI trust funds are separate and distinct, each with its
own sources of financing. There are no provisions for using HI revenues
to finance SMI expenditures, or vice versa, or for lending assets
between the two trust funds. Moreover, the benefit provisions,
financing methods, and, to a lesser degree, eligibility rules are very
different between these Medicare components. In particular, both
accounts of the SMI trust fund are automatically in financial balance,
whereas the HI fund is not.
For these reasons, the Trustees can evaluate the financial status of the
Medicare trust funds only by separately assessing the status of each
fund. Sections III.B, III.C, and III.D of this report present such
assessments for HI (Part A), SMI Part B, and SMI Part D, respectively.
The Trustees also provide key results based on an illustrative
alternative scenario in section V.C.
Actuarial Analysis
44
B. HI FINANCIAL STATUS
This section presents actual HI trust fund operations in 2017 and HI
trust fund projections for the next 75 years. Section III.B1 discusses HI
financial results for 2017, and sections III.B2 and III.B3 discuss the
short-range HI projections and the long-range projections,
respectively. The projections shown in sections III.B2 and III.B3
assume no changes will occur in the statutory provisions and
regulations under which HI now operates.30
1. Financial Operations in Calendar Year 2017
On July 30, 1965, the Social Security Act established the Federal
Hospital Insurance Trust Fund as a separate account in the U.S.
Treasury. All the HI financial operations occur within this fund.
Table III.B1 presents a statement of the revenue and expenditures of
the fund in calendar year 2017, and of its assets at the beginning and
end of the calendar year.
The total assets of the trust fund amounted to $199.1 billion on
December 31, 2016. During calendar year 2017, total revenue
amounted to $299.4 billion, and total expenditures were $296.5 billion.
Total assets thus increased by $2.8 billion during the year to
$202.0 billion on December 31, 2017.
30The one exception is that the projections disregard payment reductions that would
result from the projected depletion of the HI trust fund.
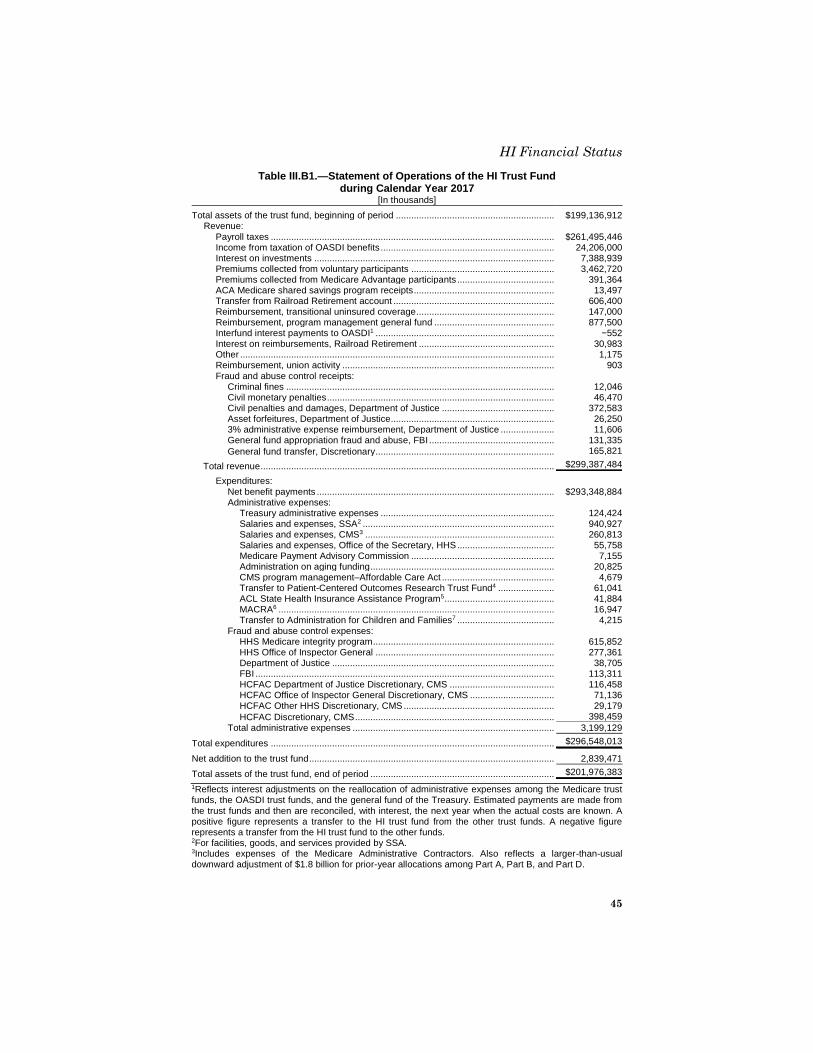
HI Financial Status
45
Table III.B1.—Statement of Operations of the HI Trust Fund during Calendar Year 2017
[In thousands]
Total assets of the trust fund, beginning of period .............................................................. $199,136,912 Revenue:
Payroll taxes ............................................................................................................... $261,495,446 Income from taxation of OASDI benefits .................................................................... 24,206,000 Interest on investments .............................................................................................. 7,388,939 Premiums collected from voluntary participants ........................................................ 3,462,720 Premiums collected from Medicare Advantage participants ...................................... 391,364 ACA Medicare shared savings program receipts ....................................................... 13,497 Transfer from Railroad Retirement account ............................................................... 606,400 Reimbursement, transitional uninsured coverage ...................................................... 147,000 Reimbursement, program management general fund ............................................... 877,500 Interfund interest payments to OASDI1 ...................................................................... −552 Interest on reimbursements, Railroad Retirement ..................................................... 30,983 Other ........................................................................................................................... 1,175 Reimbursement, union activity ................................................................................... 903 Fraud and abuse control receipts:
Criminal fines ......................................................................................................... 12,046 Civil monetary penalties ......................................................................................... 46,470 Civil penalties and damages, Department of Justice ............................................ 372,583 Asset forfeitures, Department of Justice ................................................................ 26,250 3% administrative expense reimbursement, Department of Justice ..................... 11,606 General fund appropriation fraud and abuse, FBI ................................................. 131,335
General fund transfer, Discretionary ...................................................................... 165,821
Total revenue ................................................................................................................... $299,387,484
Expenditures: Net benefit payments ............................................................................................. $293,348,884 Administrative expenses:
Treasury administrative expenses .................................................................... 124,424 Salaries and expenses, SSA2 ........................................................................... 940,927 Salaries and expenses, CMS3 .......................................................................... 260,813 Salaries and expenses, Office of the Secretary, HHS ...................................... 55,758 Medicare Payment Advisory Commission ........................................................ 7,155 Administration on aging funding ........................................................................ 20,825 CMS program management–Affordable Care Act ............................................ 4,679 Transfer to Patient-Centered Outcomes Research Trust Fund4 ...................... 61,041 ACL State Health Insurance Assistance Program5 ........................................... 41,884 MACRA6 ............................................................................................................ 16,947 Transfer to Administration for Children and Families7 ...................................... 4,215
Fraud and abuse control expenses: HHS Medicare integrity program ....................................................................... 615,852 HHS Office of Inspector General ...................................................................... 277,361 Department of Justice ....................................................................................... 38,705 FBI ..................................................................................................................... 113,311 HCFAC Department of Justice Discretionary, CMS ......................................... 116,458 HCFAC Office of Inspector General Discretionary, CMS ................................. 71,136 HCFAC Other HHS Discretionary, CMS ........................................................... 29,179
HCFAC Discretionary, CMS .............................................................................. 398,459
Total administrative expenses ............................................................................... 3,199,129
Total expenditures ............................................................................................................... $296,548,013
Net addition to the trust fund ................................................................................................ 2,839,471
Total assets of the trust fund, end of period ........................................................................ $201,976,383 1Reflects interest adjustments on the reallocation of administrative expenses among the Medicare trust funds, the OASDI trust funds, and the general fund of the Treasury. Estimated payments are made from
the trust funds and then are reconciled, with interest, the next year when the actual costs are known. A positive figure represents a transfer to the HI trust fund from the other trust funds. A negative figure represents a transfer from the HI trust fund to the other funds. 2For facilities, goods, and services provided by SSA. 3Includes expenses of the Medicare Administrative Contractors. Also reflects a larger-than-usual downward adjustment of $1.8 billion for prior-year allocations among Part A, Part B, and Part D.
Actuarial Analysis
46
4Reflects amount transferred from the HI trust fund to the Patient-Centered Outcomes Research trust fund, as authorized by the Patient Protection and Affordable Care Act of 2010. 5Reflects amount transferred from the HI trust fund to the Administration for Community Living (ACL) for administration of the State Health Insurance Assistance program, as authorized by the Consolidated Appropriations Act of 2014. 6Represents amounts transferred from the HI trust fund for administration of provisions of the Medicare Access and CHIP Reauthorization Act of 2015 (MACRA). 7Reflects amount transferred from the HI trust fund to the Administration for Children and Families, as authorized by the Patient Protection and Affordable Care Act of 2010.
Note: Totals do not necessarily equal the sums of rounded components.
a. Revenues
The trust fund’s primary source of income consists of amounts
appropriated to it, under permanent authority, on the basis of taxes
paid by workers, their employers, and individuals with
self-employment earnings, in work covered by HI. Included in HI are
workers covered under the OASDI program, those covered under the
Railroad Retirement program, and certain Federal, State, and local
employees not otherwise covered under the OASDI program.
HI taxes are payable without limit on a covered individual’s total
wages and self-employment earnings. For calendar years prior to 1994,
taxes were computed on a person’s annual earnings up to a specified
maximum annual amount called the maximum tax base. Table III.B2
presents the maximum tax bases for 1966-1993. Legislation enacted in
1993 removed the limit on taxable income beginning in calendar
year 1994.
Table III.B2 also shows the HI tax rates applicable in each of calendar
years 1966 and later. For 2019 and thereafter, the tax rates shown are
the rates scheduled in current law. As indicated in the footnote to the
table, in 2013 and later employees and self-employed individuals pay
an additional HI tax of 0.9 percent on their earnings above certain
thresholds.
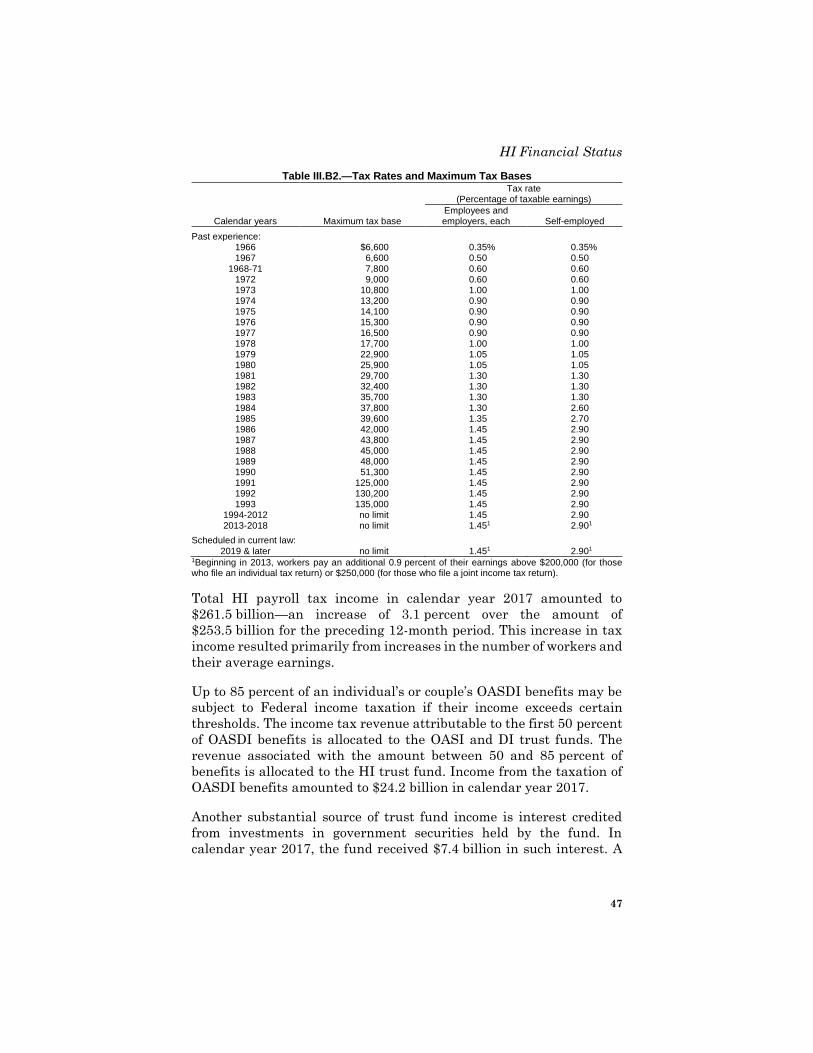
HI Financial Status
47
Table III.B2.—Tax Rates and Maximum Tax Bases
Tax rate
(Percentage of taxable earnings)
Calendar years Maximum tax base Employees and employers, each Self-employed
Past experience: 1966 $6,600 0.35% 0.35% 1967 6,600 0.50 0.50
1968-71 7,800 0.60 0.60 1972 9,000 0.60 0.60 1973 10,800 1.00 1.00 1974 13,200 0.90 0.90 1975 14,100 0.90 0.90 1976 15,300 0.90 0.90 1977 16,500 0.90 0.90 1978 17,700 1.00 1.00 1979 22,900 1.05 1.05 1980 25,900 1.05 1.05 1981 29,700 1.30 1.30 1982 32,400 1.30 1.30 1983 35,700 1.30 1.30 1984 37,800 1.30 2.60 1985 39,600 1.35 2.70 1986 42,000 1.45 2.90 1987 43,800 1.45 2.90 1988 45,000 1.45 2.90 1989 48,000 1.45 2.90 1990 51,300 1.45 2.90 1991 125,000 1.45 2.90 1992 130,200 1.45 2.90 1993 135,000 1.45 2.90
1994-2012 no limit 1.45 2.90 2013-2018 no limit 1.451 2.901
Scheduled in current law: 2019 & later no limit 1.451 2.901
1Beginning in 2013, workers pay an additional 0.9 percent of their earnings above $200,000 (for those who file an individual tax return) or $250,000 (for those who file a joint income tax return).
Total HI payroll tax income in calendar year 2017 amounted to
$261.5 billion—an increase of 3.1 percent over the amount of
$253.5 billion for the preceding 12-month period. This increase in tax
income resulted primarily from increases in the number of workers and
their average earnings.
Up to 85 percent of an individual’s or couple’s OASDI benefits may be
subject to Federal income taxation if their income exceeds certain
thresholds. The income tax revenue attributable to the first 50 percent
of OASDI benefits is allocated to the OASI and DI trust funds. The
revenue associated with the amount between 50 and 85 percent of
benefits is allocated to the HI trust fund. Income from the taxation of
OASDI benefits amounted to $24.2 billion in calendar year 2017.
Another substantial source of trust fund income is interest credited
from investments in government securities held by the fund. In
calendar year 2017, the fund received $7.4 billion in such interest. A
Actuarial Analysis
48
description of the trust fund’s investment procedures appears later in
this section.
Section 1818 of the Social Security Act provides that certain persons
not otherwise eligible for HI protection may obtain coverage by
enrolling in HI and paying a monthly premium. In 2017, premiums
collected from such voluntary participants (or paid on their behalf by
Medicaid) amounted to about $3.5 billion.
The Railroad Retirement Act provides for a system of coordination and
financial interchange between the Railroad Retirement program and
the HI trust fund. This financial interchange requires a transfer that
would place the HI trust fund in the same position in which it would
have been if the Social Security Act had always covered railroad
employment. In accordance with these provisions, a transfer of
$606 million in principal and about $21 million in interest from the
Railroad Retirement program’s Social Security Equivalent Benefit
Account to the HI trust fund balanced the two systems as of
September 30, 2016. The trust fund received this transfer, together
with interest to the date of transfer totaling about $10 million, in
June 2017.
Legislation in 1982 added transitional entitlement for those Federal
employees who retire before having had a chance to earn sufficient
quarters of Medicare-qualified Federal employment. The general fund
of the Treasury provides reimbursement for the costs of this coverage,
including administrative expenses. In calendar year 2017, such
reimbursement amounted to $147 million for estimated benefit
payments for these beneficiaries.
The Health Insurance Portability and Accountability Act of 1996
established a health care fraud and abuse control account within the
HI trust fund. Monies derived from the fraud and abuse control
program are transferred from the general fund of the Treasury to the
HI trust fund. During calendar year 2017, the trust fund received
about $0.8 billion from this program.
b. Expenditures
The HI trust fund pays expenditures for HI benefit payments and
administrative expenses. All HI administrative expenses incurred by
the Department of Health and Human Services, the Social Security
Administration, the Department of the Treasury (including the
Internal Revenue Service), and the Department of Justice in
administering HI are charged to the trust fund. Such administrative
HI Financial Status
49
duties include payment of benefits, the collection of taxes, fraud and
abuse control activities, and experiments and demonstration projects
designed to determine various methods of increasing efficiency and
economy in providing health care services, while maintaining the
quality of such services, under HI and SMI.
In addition, Congress has authorized expenditures from the trust
funds for construction, rental and lease, or purchase contracts of office
buildings and related facilities for use in connection with the
administration of HI. Although trust fund expenditures include these
costs, the statement of trust fund assets presented in this report does
not carry the net worth of facilities and other fixed capital assets
because the proceeds of sales of such assets revert to the General
Services Administration. Since the value of fixed capital assets does
not represent funds available for benefit or administrative
expenditures, the Trustees do not consider it in assessing the actuarial
status of the funds.
Of the $296.5 billion in total HI expenditures, $293.3 billion
represented net benefits paid from the trust fund for health services.31
Net benefit payments increased 4.6 percent in calendar year 2017 over
the corresponding amount of $280.5 billion paid during the preceding
calendar year. Enrollment increased by 2.3 percent, and per capita
costs increased by 2.2 percent. This small per capita increase was due
to the continuing effects of implementation of certain provisions of the
ACA and to a reduction in the utilization of services. Further
information on HI benefits by type of service is available in
section IV.A.
The remaining $3.2 billion in expenditures was for net HI
administrative expenses, after adjustments to the preliminary
allocation of administrative costs among the Social Security and
Medicare trust funds and the general fund of the Treasury. The
adjustments this year were larger than usual, lowering these
expenditures by $1.8 billion. The $3.2 billion also included $1.7 billion
for the health care fraud and abuse control program.
c. Actual experience versus prior estimates
Table III.B3 compares the actual experience in calendar year 2017
with the estimates presented in the 2016 and 2017 annual reports. A
number of factors can contribute to differences between estimates and
31Net benefits equal the total gross amounts initially paid from the trust fund during the
year, less recoveries of overpayments identified through fraud and abuse control
activities.
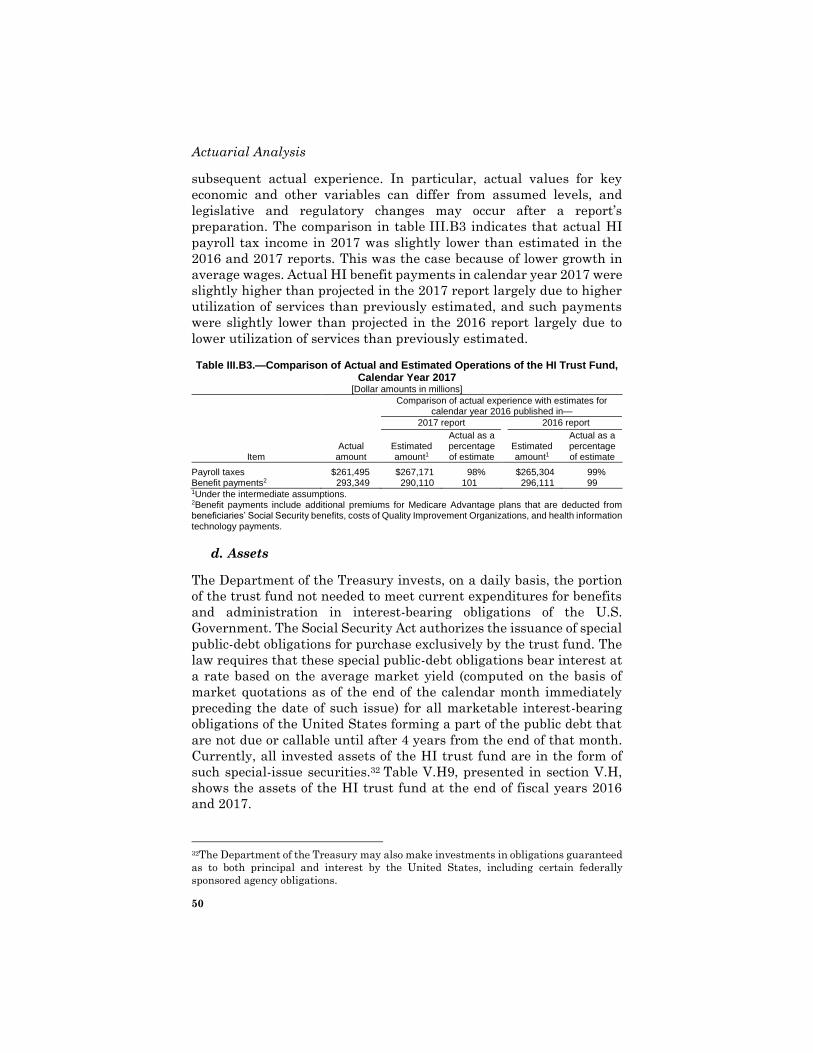
Actuarial Analysis
50
subsequent actual experience. In particular, actual values for key
economic and other variables can differ from assumed levels, and
legislative and regulatory changes may occur after a report’s
preparation. The comparison in table III.B3 indicates that actual HI
payroll tax income in 2017 was slightly lower than estimated in the
2016 and 2017 reports. This was the case because of lower growth in
average wages. Actual HI benefit payments in calendar year 2017 were
slightly higher than projected in the 2017 report largely due to higher
utilization of services than previously estimated, and such payments
were slightly lower than projected in the 2016 report largely due to
lower utilization of services than previously estimated.
Table III.B3.—Comparison of Actual and Estimated Operations of the HI Trust Fund, Calendar Year 2017
[Dollar amounts in millions]
Comparison of actual experience with estimates for calendar year 2016 published in—
2017 report 2016 report
Item Actual
amount Estimated amount1
Actual as a percentage of estimate
Estimated amount1
Actual as a percentage of estimate
Payroll taxes $261,495 $267,171 98% $265,304 99% Benefit payments2 293,349 290,110 101 296,111 99 1Under the intermediate assumptions. 2Benefit payments include additional premiums for Medicare Advantage plans that are deducted from beneficiaries’ Social Security benefits, costs of Quality Improvement Organizations, and health information technology payments.
d. Assets
The Department of the Treasury invests, on a daily basis, the portion
of the trust fund not needed to meet current expenditures for benefits
and administration in interest-bearing obligations of the U.S.
Government. The Social Security Act authorizes the issuance of special
public-debt obligations for purchase exclusively by the trust fund. The
law requires that these special public-debt obligations bear interest at
a rate based on the average market yield (computed on the basis of
market quotations as of the end of the calendar month immediately
preceding the date of such issue) for all marketable interest-bearing
obligations of the United States forming a part of the public debt that
are not due or callable until after 4 years from the end of that month.
Currently, all invested assets of the HI trust fund are in the form of
such special-issue securities.32 Table V.H9, presented in section V.H,
shows the assets of the HI trust fund at the end of fiscal years 2016
and 2017.
32The Department of the Treasury may also make investments in obligations guaranteed
as to both principal and interest by the United States, including certain federally
sponsored agency obligations.
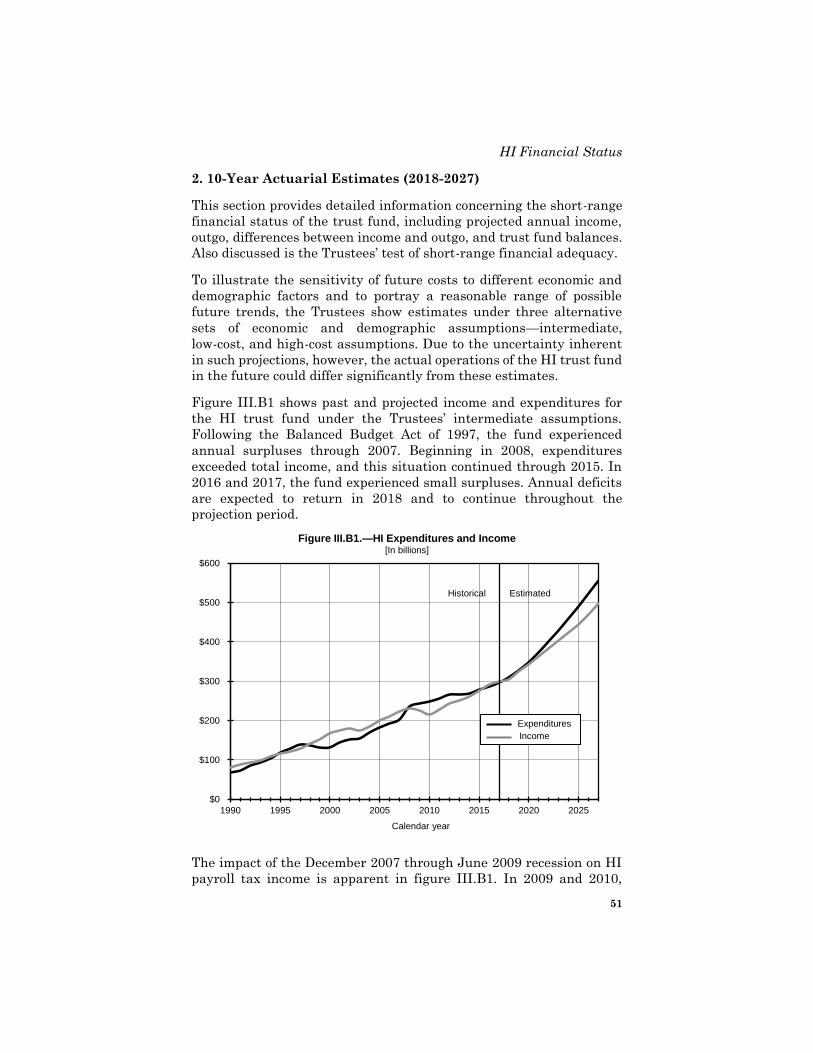
HI Financial Status
51
2. 10-Year Actuarial Estimates (2018-2027)
This section provides detailed information concerning the short-range
financial status of the trust fund, including projected annual income,
outgo, differences between income and outgo, and trust fund balances.
Also discussed is the Trustees’ test of short-range financial adequacy.
To illustrate the sensitivity of future costs to different economic and
demographic factors and to portray a reasonable range of possible
future trends, the Trustees show estimates under three alternative
sets of economic and demographic assumptions—intermediate,
low-cost, and high-cost assumptions. Due to the uncertainty inherent
in such projections, however, the actual operations of the HI trust fund
in the future could differ significantly from these estimates.
Figure III.B1 shows past and projected income and expenditures for
the HI trust fund under the Trustees’ intermediate assumptions.
Following the Balanced Budget Act of 1997, the fund experienced
annual surpluses through 2007. Beginning in 2008, expenditures
exceeded total income, and this situation continued through 2015. In
2016 and 2017, the fund experienced small surpluses. Annual deficits
are expected to return in 2018 and to continue throughout the
projection period.
Figure III.B1.—HI Expenditures and Income [In billions]
$0
$100
$200
$300
$400
$500
$600
1990 1995 2000 2005 2010 2015 2020 2025
Calendar year
Expenditures
Income
Historical Estimated
The impact of the December 2007 through June 2009 recession on HI
payroll tax income is apparent in figure III.B1. In 2009 and 2010,
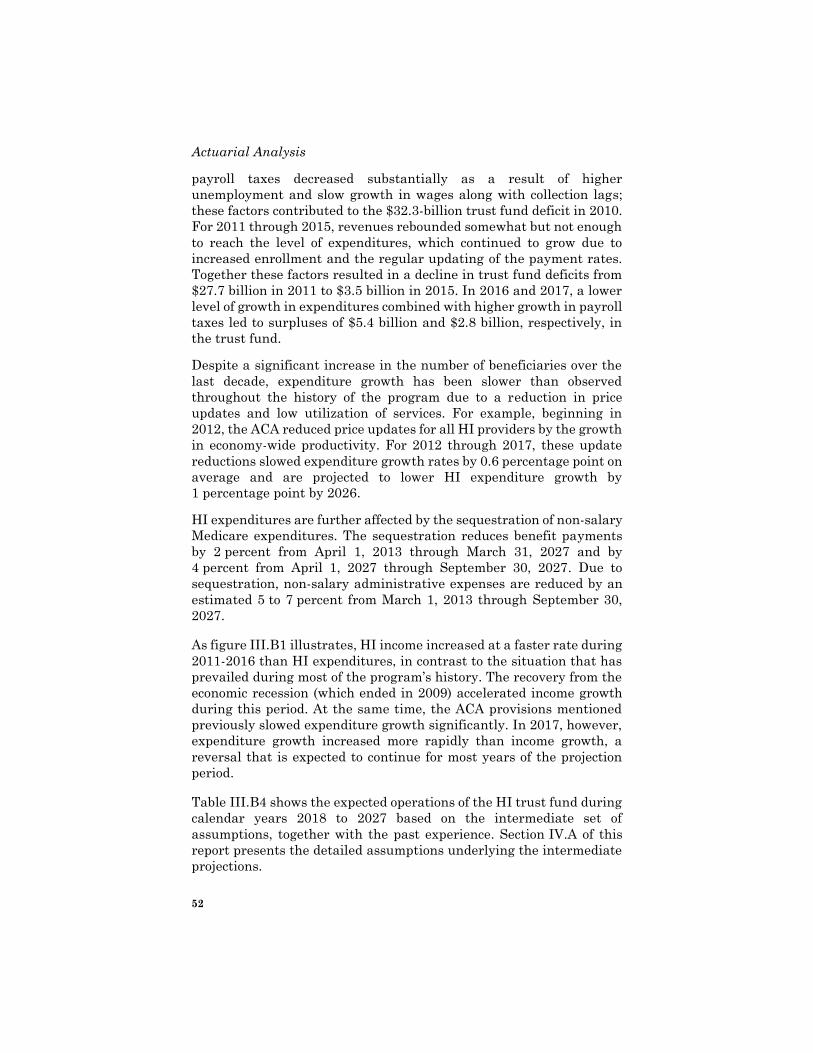
Actuarial Analysis
52
payroll taxes decreased substantially as a result of higher
unemployment and slow growth in wages along with collection lags;
these factors contributed to the $32.3-billion trust fund deficit in 2010.
For 2011 through 2015, revenues rebounded somewhat but not enough
to reach the level of expenditures, which continued to grow due to
increased enrollment and the regular updating of the payment rates.
Together these factors resulted in a decline in trust fund deficits from
$27.7 billion in 2011 to $3.5 billion in 2015. In 2016 and 2017, a lower
level of growth in expenditures combined with higher growth in payroll
taxes led to surpluses of $5.4 billion and $2.8 billion, respectively, in
the trust fund.
Despite a significant increase in the number of beneficiaries over the
last decade, expenditure growth has been slower than observed
throughout the history of the program due to a reduction in price
updates and low utilization of services. For example, beginning in
2012, the ACA reduced price updates for all HI providers by the growth
in economy-wide productivity. For 2012 through 2017, these update
reductions slowed expenditure growth rates by 0.6 percentage point on
average and are projected to lower HI expenditure growth by
1 percentage point by 2026.
HI expenditures are further affected by the sequestration of non-salary
Medicare expenditures. The sequestration reduces benefit payments
by 2 percent from April 1, 2013 through March 31, 2027 and by
4 percent from April 1, 2027 through September 30, 2027. Due to
sequestration, non-salary administrative expenses are reduced by an
estimated 5 to 7 percent from March 1, 2013 through September 30,
2027.
As figure III.B1 illustrates, HI income increased at a faster rate during
2011-2016 than HI expenditures, in contrast to the situation that has
prevailed during most of the program’s history. The recovery from the
economic recession (which ended in 2009) accelerated income growth
during this period. At the same time, the ACA provisions mentioned
previously slowed expenditure growth significantly. In 2017, however,
expenditure growth increased more rapidly than income growth, a
reversal that is expected to continue for most years of the projection
period.
Table III.B4 shows the expected operations of the HI trust fund during
calendar years 2018 to 2027 based on the intermediate set of
assumptions, together with the past experience. Section IV.A of this
report presents the detailed assumptions underlying the intermediate
projections.
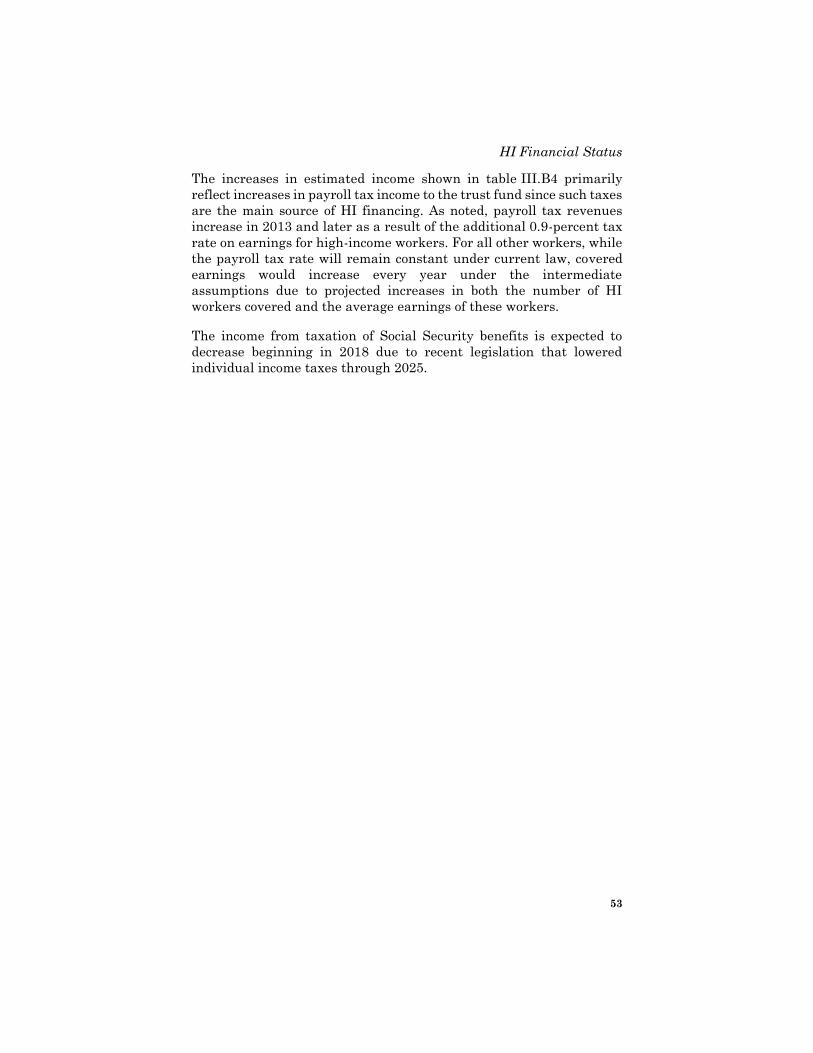
HI Financial Status
53
The increases in estimated income shown in table III.B4 primarily
reflect increases in payroll tax income to the trust fund since such taxes
are the main source of HI financing. As noted, payroll tax revenues
increase in 2013 and later as a result of the additional 0.9-percent tax
rate on earnings for high-income workers. For all other workers, while
the payroll tax rate will remain constant under current law, covered
earnings would increase every year under the intermediate
assumptions due to projected increases in both the number of HI
workers covered and the average earnings of these workers.
The income from taxation of Social Security benefits is expected to
decrease beginning in 2018 due to recent legislation that lowered
individual income taxes through 2025.
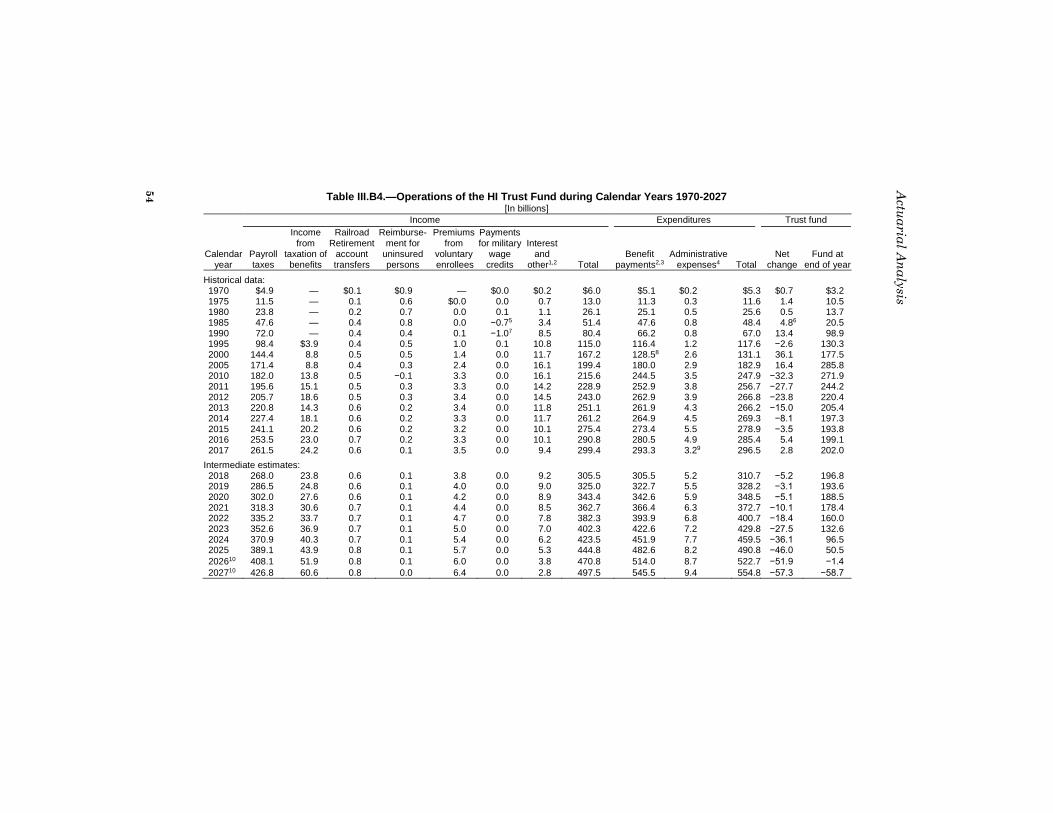
Table III.B4.—Operations of the HI Trust Fund during Calendar Years 1970-2027 [In billions]
Income Expenditures Trust fund
Calendar year
Payroll taxes
Income from
taxation of benefits
Railroad Retirement
account transfers
Reimburse-ment for
uninsured persons
Premiums from
voluntary enrollees
Payments for military
wage credits
Interest and
other1,2 Total Benefit
payments2,3 Administrative
expenses4 Total Net
change Fund at
end of year
Historical data: 1970 $4.9 — $0.1 $0.9 — $0.0 $0.2 $6.0 $5.1 $0.2 $5.3 $0.7 $3.2 1975 11.5 — 0.1 0.6 $0.0 0.0 0.7 13.0 11.3 0.3 11.6 1.4 10.5 1980 23.8 — 0.2 0.7 0.0 0.1 1.1 26.1 25.1 0.5 25.6 0.5 13.7 1985 47.6 — 0.4 0.8 0.0 −0.75 3.4 51.4 47.6 0.8 48.4 4.86
20.5
1990 72.0 — 0.4 0.4 0.1 −1.07 8.5 80.4 66.2 0.8 67.0 13.4 98.9 1995 98.4 $3.9 0.4 0.5 1.0 0.1 10.8 115.0 116.4 1.2 117.6 −2.6 130.3 2000 144.4 8.8 0.5 0.5 1.4 0.0 11.7 167.2 128.58 2.6 131.1 36.1 177.5 2005 171.4 8.8 0.4 0.3 2.4 0.0 16.1 199.4 180.0 2.9 182.9 16.4 285.8 2010 182.0 13.8 0.5 −0.1 3.3 0.0 16.1 215.6 244.5 3.5 247.9 −32.3 271.9 2011 195.6 15.1 0.5 0.3 3.3 0.0 14.2 228.9 252.9 3.8 256.7 −27.7 244.2 2012 205.7 18.6 0.5 0.3 3.4 0.0 14.5 243.0 262.9 3.9 266.8 −23.8 220.4 2013 220.8 14.3 0.6 0.2 3.4 0.0 11.8 251.1 261.9 4.3 266.2 −15.0 205.4 2014 227.4 18.1 0.6 0.2 3.3 0.0 11.7 261.2 264.9 4.5 269.3 −8.1 197.3 2015 241.1 20.2 0.6 0.2 3.2 0.0 10.1 275.4 273.4 5.5 278.9 −3.5 193.8 2016 253.5 23.0 0.7 0.2 3.3 0.0 10.1 290.8 280.5 4.9 285.4 5.4 199.1 2017 261.5 24.2 0.6 0.1 3.5 0.0 9.4 299.4 293.3 3.29 296.5 2.8 202.0
Intermediate estimates: 2018 268.0 23.8 0.6 0.1 3.8 0.0 9.2 305.5 305.5 5.2 310.7 −5.2 196.8 2019 286.5 24.8 0.6 0.1 4.0 0.0 9.0 325.0 322.7 5.5 328.2 −3.1 193.6 2020 302.0 27.6 0.6 0.1 4.2 0.0 8.9 343.4 342.6 5.9 348.5 −5.1 188.5 2021 318.3 30.6 0.7 0.1 4.4 0.0 8.5 362.7 366.4 6.3 372.7 −10.1 178.4 2022 335.2 33.7 0.7 0.1 4.7 0.0 7.8 382.3 393.9 6.8 400.7 −18.4 160.0 2023 352.6 36.9 0.7 0.1 5.0 0.0 7.0 402.3 422.6 7.2 429.8 −27.5 132.6 2024 370.9 40.3 0.7 0.1 5.4 0.0 6.2 423.5 451.9 7.7 459.5 −36.1 96.5 2025 389.1 43.9 0.8 0.1 5.7 0.0 5.3 444.8 482.6 8.2 490.8 −46.0 50.5
202610 408.1 51.9 0.8 0.1 6.0 0.0 3.8 470.8 514.0 8.7 522.7 −51.9 −1.4
202710 426.8 60.6 0.8 0.0 6.4 0.0 2.8 497.5 545.5 9.4 554.8 −57.3 −58.7
54
Actu
aria
l An
aly
sis
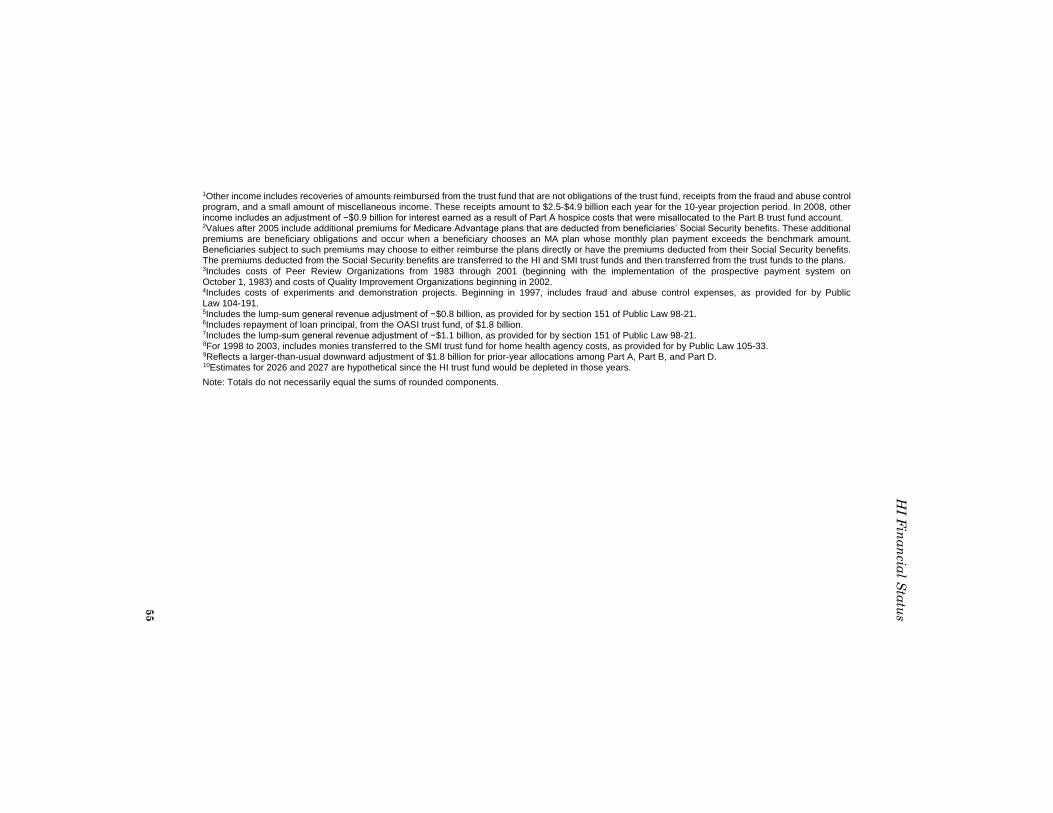
1Other income includes recoveries of amounts reimbursed from the trust fund that are not obligations of the trust fund, receipts from the fraud and abuse control program, and a small amount of miscellaneous income. These receipts amount to $2.5-$4.9 billion each year for the 10-year projection period. In 2008, other income includes an adjustment of −$0.9 billion for interest earned as a result of Part A hospice costs that were misallocated to the Part B trust fund account. 2Values after 2005 include additional premiums for Medicare Advantage plans that are deducted from beneficiaries’ Social Security benefits. These additional premiums are beneficiary obligations and occur when a beneficiary chooses an MA plan whose monthly plan payment exceeds the benchmark amount. Beneficiaries subject to such premiums may choose to either reimburse the plans directly or have the premiums deducted from their Social Security benefits. The premiums deducted from the Social Security benefits are transferred to the HI and SMI trust funds and then transferred from the trust funds to the plans. 3Includes costs of Peer Review Organizations from 1983 through 2001 (beginning with the implementation of the prospective payment system on October 1, 1983) and costs of Quality Improvement Organizations beginning in 2002. 4Includes costs of experiments and demonstration projects. Beginning in 1997, includes fraud and abuse control expenses, as provided for by Public Law 104-191. 5Includes the lump-sum general revenue adjustment of −$0.8 billion, as provided for by section 151 of Public Law 98-21. 6Includes repayment of loan principal, from the OASI trust fund, of $1.8 billion. 7Includes the lump-sum general revenue adjustment of −$1.1 billion, as provided for by section 151 of Public Law 98-21. 8For 1998 to 2003, includes monies transferred to the SMI trust fund for home health agency costs, as provided for by Public Law 105-33. 9Reflects a larger-than-usual downward adjustment of $1.8 billion for prior-year allocations among Part A, Part B, and Part D. 10Estimates for 2026 and 2027 are hypothetical since the HI trust fund would be depleted in those years.
Note: Totals do not necessarily equal the sums of rounded components.
55
HI F
ina
ncia
l Sta
tus
Actuarial Analysis
56
The Trustees project that over the next 10 years most of the smaller
sources of financing for the HI trust fund will increase as well. More
detailed descriptions of these sources of income were discussed earlier
in this section.
Interest earnings have been a significant source of income to the trust
fund for many years, surpassed only by payroll taxes and, recently,
income from the taxation of OASDI benefits. As the trust fund balance
decreases, interest earnings would follow the same pattern.
The Trustees have recommended maintenance of HI trust fund assets
at a level of at least 100 percent of annual expenditures throughout the
projection period. Such a level would provide a cushion of several years
in the event that income falls short of expenditures, thereby allowing
time for policy makers to implement legislative corrections. The trust
fund balance has been below 1 year’s expenditures in every year since
2012 and is not projected to reach that level under the intermediate
assumptions.
The Trustees have also prepared projections using two alternative sets
of assumptions. Table III.B5 summarizes the estimated operations
under all three alternatives. Section IV.A presents in substantial
detail the assumptions underlying the intermediate assumptions, as
well as the assumptions used in preparing estimates under the low-cost
and high-cost alternatives.
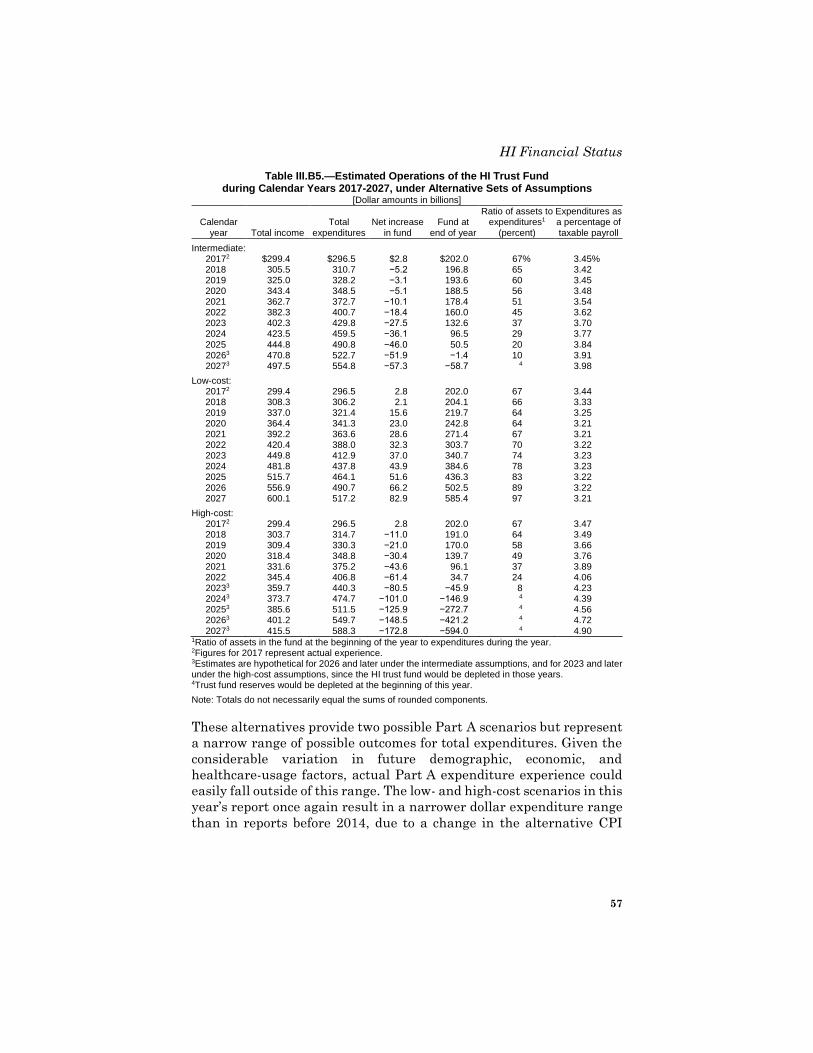
HI Financial Status
57
Table III.B5.—Estimated Operations of the HI Trust Fund during Calendar Years 2017-2027, under Alternative Sets of Assumptions
[Dollar amounts in billions]
Calendar year Total income
Total expenditures
Net increase in fund
Fund at end of year
Ratio of assets to expenditures1
(percent)
Expenditures as a percentage of taxable payroll
Intermediate: 2017 2 $299.4 $296.5 $2.8 $202.0 67% 3.45% 2018 305.5 310.7 −5.2 196.8 65 3.42 2019 325.0 328.2 −3.1 193.6 60 3.45 2020 343.4 348.5 −5.1 188.5 56 3.48 2021 362.7 372.7 −10.1 178.4 51 3.54 2022 382.3 400.7 −18.4 160.0 45 3.62 2023 402.3 429.8 −27.5 132.6 37 3.70 2024 423.5 459.5 −36.1 96.5 29 3.77
2025 444.8 490.8 −46.0 50.5 20 3.84 2026 3 470.8 522.7 −51.9 −1.4 10 3.91 2027 3 497.5 554.8 −57.3 −58.7 4 3.98
Low-cost: 2017 2 299.4 296.5 2.8 202.0 67 3.44 2018 308.3 306.2 2.1 204.1 66 3.33 2019 337.0 321.4 15.6 219.7 64 3.25 2020 364.4 341.3 23.0 242.8 64 3.21 2021 392.2 363.6 28.6 271.4 67 3.21 2022 420.4 388.0 32.3 303.7 70 3.22 2023 449.8 412.9 37.0 340.7 74 3.23 2024 481.8 437.8 43.9 384.6 78 3.23 2025 515.7 464.1 51.6 436.3 83 3.22 2026 556.9 490.7 66.2 502.5 89 3.22 2027 600.1 517.2 82.9 585.4 97 3.21
High-cost: 2017 2 299.4 296.5 2.8 202.0 67 3.47 2018 303.7 314.7 −11.0 191.0 64 3.49 2019 309.4 330.3 −21.0 170.0 58 3.66 2020 318.4 348.8 −30.4 139.7 49 3.76 2021 331.6 375.2 −43.6 96.1 37 3.89 2022 345.4 406.8 −61.4 34.7 24 4.06 2023 3 359.7 440.3 −80.5 −45.9 8 4.23 2024 3 373.7 474.7 −101.0 −146.9 4 4.39 2025 3 385.6 511.5 −125.9 −272.7 4 4.56 2026 3 401.2 549.7 −148.5 −421.2 4 4.72 2027 3 415.5 588.3 −172.8 −594.0 4 4.90
1Ratio of assets in the fund at the beginning of the year to expenditures during the year. 2Figures for 2017 represent actual experience. 3Estimates are hypothetical for 2026 and later under the intermediate assumptions, and for 2023 and later under the high-cost assumptions, since the HI trust fund would be depleted in those years. 4Trust fund reserves would be depleted at the beginning of this year.
Note: Totals do not necessarily equal the sums of rounded components.
These alternatives provide two possible Part A scenarios but represent
a narrow range of possible outcomes for total expenditures. Given the
considerable variation in future demographic, economic, and
healthcare-usage factors, actual Part A expenditure experience could
easily fall outside of this range. The low- and high-cost scenarios in this
year’s report once again result in a narrower dollar expenditure range
than in reports before 2014, due to a change in the alternative CPI
Actuarial Analysis
58
assumptions.33 The taxable payroll assumptions for the alternative
scenarios are also affected by the assumption change. Therefore,
spending as a percentage of taxable payroll provides better insight into
the variability of spending than the nominal dollar amounts, as shown
in table III.B5.
The Board of Trustees has established an explicit test of short-range
financial adequacy. The requirements of this test are as follows: (i) if
the HI trust fund ratio is at least 100 percent at the beginning of the
projection period, then it must remain at or above 100 percent
throughout the 10-year projection period; (ii) alternatively, if the fund
ratio is initially less than 100 percent, it must reach a level of at least
100 percent within 5 years (with no depletion of the trust fund at any
time during this period) and then remain at or above 100 percent
throughout the rest of the 10-year period. The Trustees apply this test
based on the intermediate projections.
The HI trust fund does not meet this short-range test. Failure of the
trust fund to meet this test is an indication that HI solvency over the
next 10 years is in question and that action is necessary to improve the
short-range financial adequacy of the fund. While the short-range test
is stringent, its purpose is to ensure that health care benefits continue
to be available without interruption to the millions of aged and
disabled Americans who rely on such coverage. Table III.B6 shows the
ratios of assets in the HI trust fund at the beginning of a calendar year
to total expenditures during that year. As table III.B6 shows, the
Trustees project that the trust fund ratio, which was below the
100-percent level at the beginning of 2018, will decrease for the entire
projection period until the fund is depleted in 2026. Accordingly, the
financing for HI is not considered adequate in the short range
(2018-2027).
The projected trust fund depletion date is 2026, 3 years earlier than
estimated in last year’s report. HI income is projected to be lower than
last year’s estimates due to (i) lower payroll taxes attributable to
lowered wages for 2017 and lower levels of projected GDP and (ii) lower
income from the taxation of Social Security benefits as a result of
legislation. Actual HI expenditures in 2017 were slightly higher than
the previous estimate. The expenditure projections are slightly higher
for the short-range period due to higher spending in 2017, legislation
33Starting with the 2014 report, the Trustees’ alternative CPI assumptions are reversed
compared with those in previous reports, so that the high-cost assumptions are now the
low-cost assumptions, and vice versa. Inflation rates are now ordered across alternatives
according to their effect on the OASDI actuarial balance. This change resulted in a
narrow range of impacts.
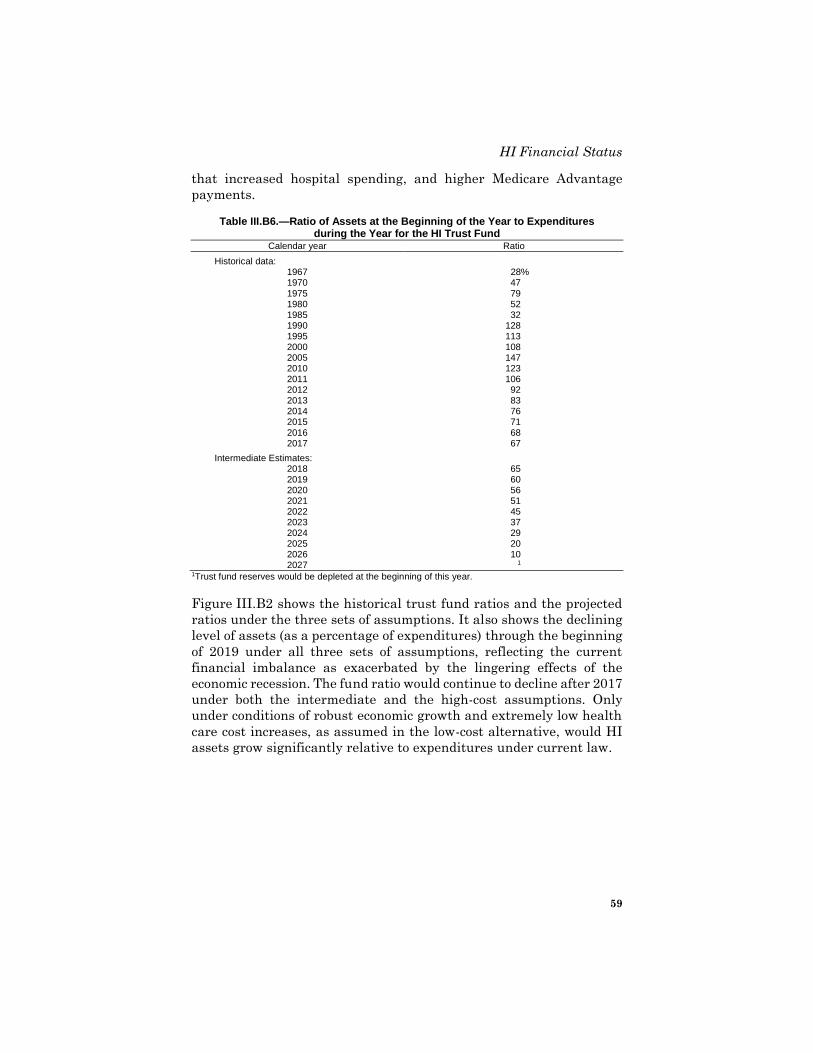
HI Financial Status
59
that increased hospital spending, and higher Medicare Advantage
payments.
Table III.B6.—Ratio of Assets at the Beginning of the Year to Expenditures during the Year for the HI Trust Fund
Calendar year Ratio
Historical data: 1967 28% 1970 47 1975 79 1980 52 1985 32 1990 128 1995 113 2000 108 2005 147 2010 123 2011 106 2012 92 2013 83 2014 76 2015 71 2016 68 2017 67
Intermediate Estimates: 2018 65 2019 60 2020 56 2021 51 2022 45 2023 37 2024 29 2025 20 2026 10 2027 1
1Trust fund reserves would be depleted at the beginning of this year.
Figure III.B2 shows the historical trust fund ratios and the projected
ratios under the three sets of assumptions. It also shows the declining
level of assets (as a percentage of expenditures) through the beginning
of 2019 under all three sets of assumptions, reflecting the current
financial imbalance as exacerbated by the lingering effects of the
economic recession. The fund ratio would continue to decline after 2017
under both the intermediate and the high-cost assumptions. Only
under conditions of robust economic growth and extremely low health
care cost increases, as assumed in the low-cost alternative, would HI
assets grow significantly relative to expenditures under current law.
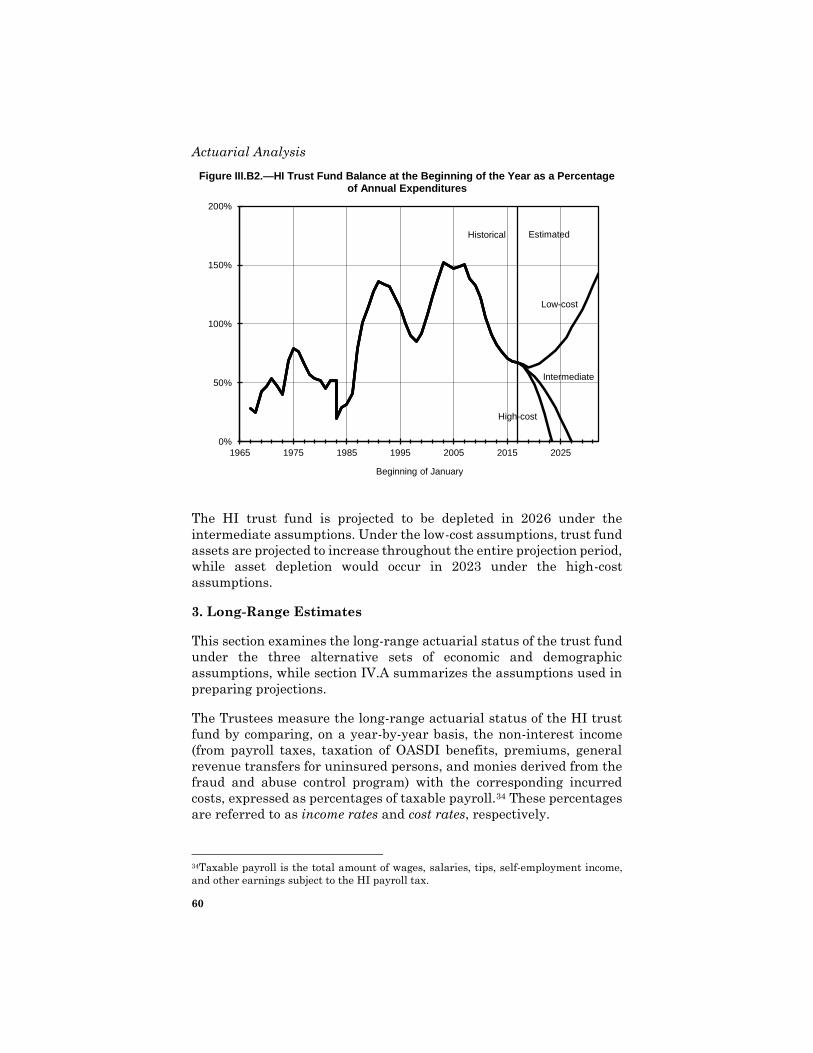
Actuarial Analysis
60
Figure III.B2.—HI Trust Fund Balance at the Beginning of the Year as a Percentage of Annual Expenditures
0%
50%
100%
150%
200%
1965 1975 1985 1995 2005 2015 2025
Beginning of January
Historical
Low-cost
Estimated
Intermediate
High-cost
The HI trust fund is projected to be depleted in 2026 under the
intermediate assumptions. Under the low-cost assumptions, trust fund
assets are projected to increase throughout the entire projection period,
while asset depletion would occur in 2023 under the high-cost
assumptions.
3. Long-Range Estimates
This section examines the long-range actuarial status of the trust fund
under the three alternative sets of economic and demographic
assumptions, while section IV.A summarizes the assumptions used in
preparing projections.
The Trustees measure the long-range actuarial status of the HI trust
fund by comparing, on a year-by-year basis, the non-interest income
(from payroll taxes, taxation of OASDI benefits, premiums, general
revenue transfers for uninsured persons, and monies derived from the
fraud and abuse control program) with the corresponding incurred
costs, expressed as percentages of taxable payroll.34 These percentages
are referred to as income rates and cost rates, respectively.
34Taxable payroll is the total amount of wages, salaries, tips, self-employment income,
and other earnings subject to the HI payroll tax.
HI Financial Status
61
Table III.B7 shows historical and projected HI costs and income under
the intermediate assumptions, expressed as percentages of taxable
payroll. The ratio of expenditures to taxable payroll has generally
increased over time; it rose from 1.10 percent in 1967 to 3.46 percent
in 1996, an increase that reflected rapid growth in HI expenditures,
which more than offset growth in average earnings per worker, and
increases in (and eventual elimination of) the maximum taxable wage
base for HI. Cost rates declined significantly between 1996 and 2000
to 2.65 percent due to favorable economic performance, the impact of
the Balanced Budget Act of 1997, and efforts to curb fraud and abuse
in the Medicare program. The cost rate increased to 3.17 percent by
2005 as a result of legislation and, after remaining about level through
2007, increased rapidly to 3.73 percent in 2009, reflecting the impact
of the recession, which lowered taxable payroll. The resulting deficit in
2009 as a percentage of taxable payroll was the largest since the
program began (0.54 percent). Cost rates have generally decreased
since 2011 as the economy has recovered, while health care cost growth
rates have been low.
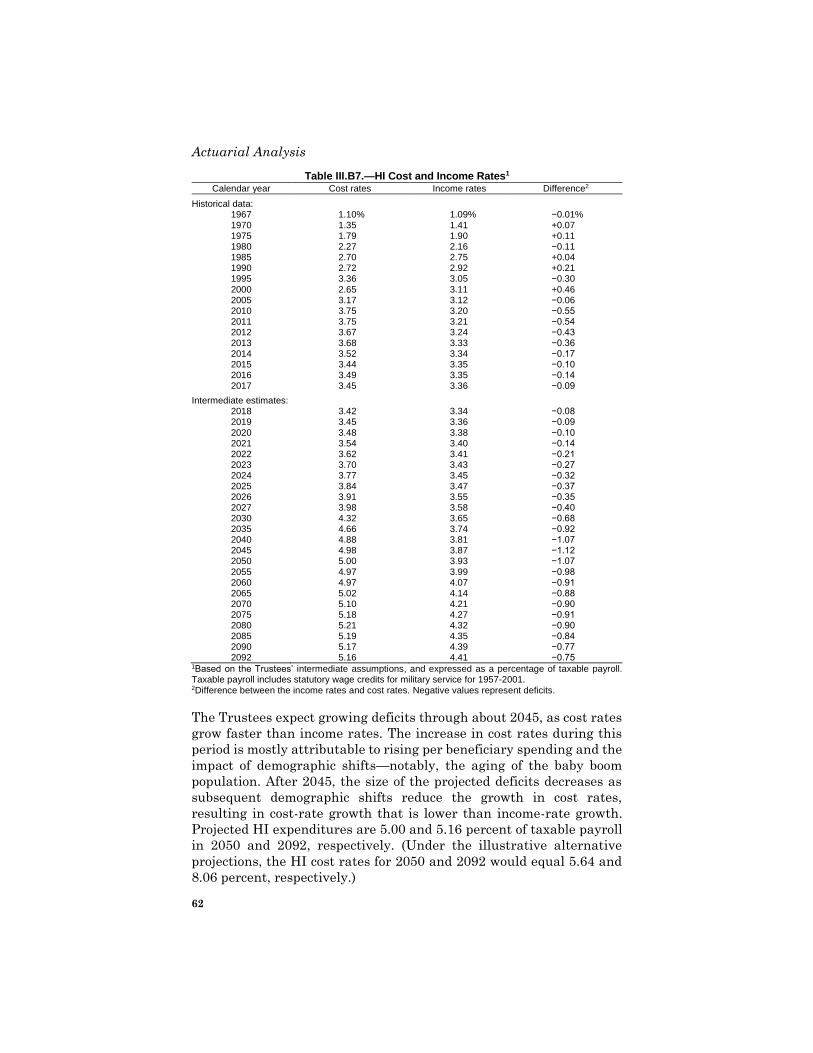
Actuarial Analysis
62
Table III.B7.—HI Cost and Income Rates1 Calendar year Cost rates Income rates Difference2
Historical data: 1967 1.10% 1.09% −0.01% 1970 1.35 1.41 +0.07 1975 1.79 1.90 +0.11 1980 2.27 2.16 −0.11 1985 2.70 2.75 +0.04 1990 2.72 2.92 +0.21 1995 3.36 3.05 −0.30 2000 2.65 3.11 +0.46 2005 3.17 3.12 −0.06 2010 3.75 3.20 −0.55 2011 3.75 3.21 −0.54 2012 3.67 3.24 −0.43 2013 3.68 3.33 −0.36 2014 3.52 3.34 −0.17 2015 3.44 3.35 −0.10 2016 3.49 3.35 −0.14 2017 3.45 3.36 −0.09
Intermediate estimates: 2018 3.42 3.34 −0.08 2019 3.45 3.36 −0.09 2020 3.48 3.38 −0.10 2021 3.54 3.40 −0.14 2022 3.62 3.41 −0.21 2023 3.70 3.43 −0.27 2024 3.77 3.45 −0.32 2025 3.84 3.47 −0.37 2026 3.91 3.55 −0.35 2027 3.98 3.58 −0.40 2030 4.32 3.65 −0.68 2035 4.66 3.74 −0.92 2040 4.88 3.81 −1.07 2045 4.98 3.87 −1.12 2050 5.00 3.93 −1.07 2055 4.97 3.99 −0.98 2060 4.97 4.07 −0.91 2065 5.02 4.14 −0.88 2070 5.10 4.21 −0.90 2075 5.18 4.27 −0.91 2080 5.21 4.32 −0.90 2085 5.19 4.35 −0.84 2090 5.17 4.39 −0.77 2092 5.16 4.41 −0.75
1Based on the Trustees’ intermediate assumptions, and expressed as a percentage of taxable payroll. Taxable payroll includes statutory wage credits for military service for 1957-2001. 2Difference between the income rates and cost rates. Negative values represent deficits.
The Trustees expect growing deficits through about 2045, as cost rates
grow faster than income rates. The increase in cost rates during this
period is mostly attributable to rising per beneficiary spending and the
impact of demographic shifts—notably, the aging of the baby boom
population. After 2045, the size of the projected deficits decreases as
subsequent demographic shifts reduce the growth in cost rates,
resulting in cost-rate growth that is lower than income-rate growth.
Projected HI expenditures are 5.00 and 5.16 percent of taxable payroll
in 2050 and 2092, respectively. (Under the illustrative alternative
projections, the HI cost rates for 2050 and 2092 would equal 5.64 and
8.06 percent, respectively.)
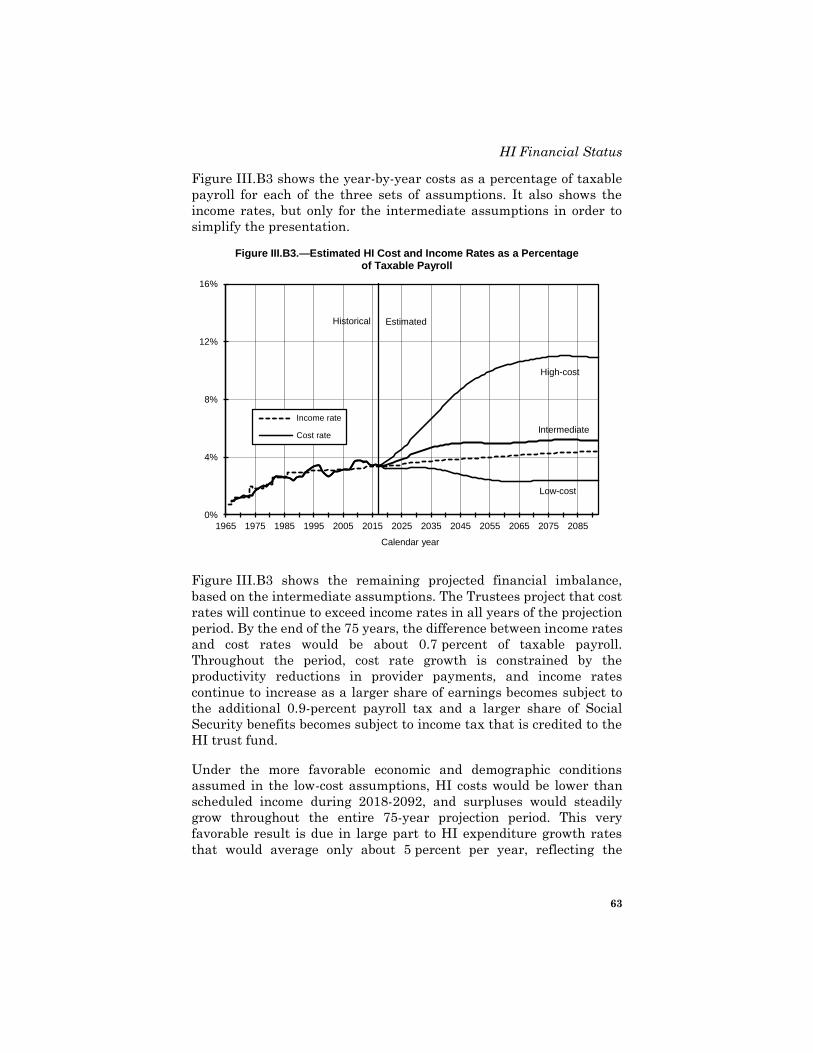
HI Financial Status
63
Figure III.B3 shows the year-by-year costs as a percentage of taxable
payroll for each of the three sets of assumptions. It also shows the
income rates, but only for the intermediate assumptions in order to
simplify the presentation.
Figure III.B3.—Estimated HI Cost and Income Rates as a Percentage of Taxable Payroll
0%
4%
8%
12%
16%
1965 1975 1985 1995 2005 2015 2025 2035 2045 2055 2065 2075 2085
Calendar year
Income rate
Cost rate
Historical Estimated
Low-cost
Intermediate
High-cost
Figure III.B3 shows the remaining projected financial imbalance,
based on the intermediate assumptions. The Trustees project that cost
rates will continue to exceed income rates in all years of the projection
period. By the end of the 75 years, the difference between income rates
and cost rates would be about 0.7 percent of taxable payroll.
Throughout the period, cost rate growth is constrained by the
productivity reductions in provider payments, and income rates
continue to increase as a larger share of earnings becomes subject to
the additional 0.9-percent payroll tax and a larger share of Social
Security benefits becomes subject to income tax that is credited to the
HI trust fund.
Under the more favorable economic and demographic conditions
assumed in the low-cost assumptions, HI costs would be lower than
scheduled income during 2018-2092, and surpluses would steadily
grow throughout the entire 75-year projection period. This very
favorable result is due in large part to HI expenditure growth rates
that would average only about 5 percent per year, reflecting the
Actuarial Analysis
64
combined effects of slower growth in utilization and intensity of
services, and slower improvement in beneficiary life expectancies.
The high-cost projections illustrate the large financial imbalance that
could occur if future economic conditions resemble those of the 1973-95
period, if HI expenditure growth accelerates toward pre-1997 levels,
and if fertility rates decline.35
The Trustees project costs beyond the initial 25-year period for the
intermediate estimate based on the assumption that average HI
expenditures per beneficiary will increase at a rate determined by the
economic model described in sections II.C and IV.D, less the price
update adjustments based on economy-wide productivity gains. This
net rate is about equal to the increase in Gross Domestic Product
(GDP) per capita in 2042 and declines to about 0.3 percentage point
slower than the growth in GDP by 2092. Beyond the initial 25-year
projection period, the low-cost and high-cost alternatives assume that
HI cost increases, relative to taxable payroll increases, are initially
2 percentage points less rapid and 2 percentage points more rapid,
respectively, than the results under the intermediate assumptions.
The assumed initial 2-percentage-point differentials decrease
gradually until the year 2067, when HI cost increases (relative to
taxable payroll) are assumed to be the same as under the intermediate
assumptions.
Figure III.B3 shows the cost rates over a 75-year valuation period in
order to present fully the future economic and demographic
developments that one may reasonably expect to occur, such as the
impact of the large increase in the number of people over age 65 that
began to take place in 2011. Growth occurs in part because the ratio of
workers to beneficiaries will decrease as persons born during the
period between the end of World War II and the mid-1960s (known as
the baby boom generation) reach eligibility age and begin to receive
benefits.
Figure III.B4 shows the projected ratio of workers per HI beneficiary
from 1980 to 2092. As figure III.B4 indicates, the ratio was about
4 workers per beneficiary from 1980 through 2008. It began to decline
initially due to the recession but then declined further due to the
retirement of the baby boom generation.
35Actual experience during these periods was similar on average to the high-cost
economic and programmatic assumptions for the future.
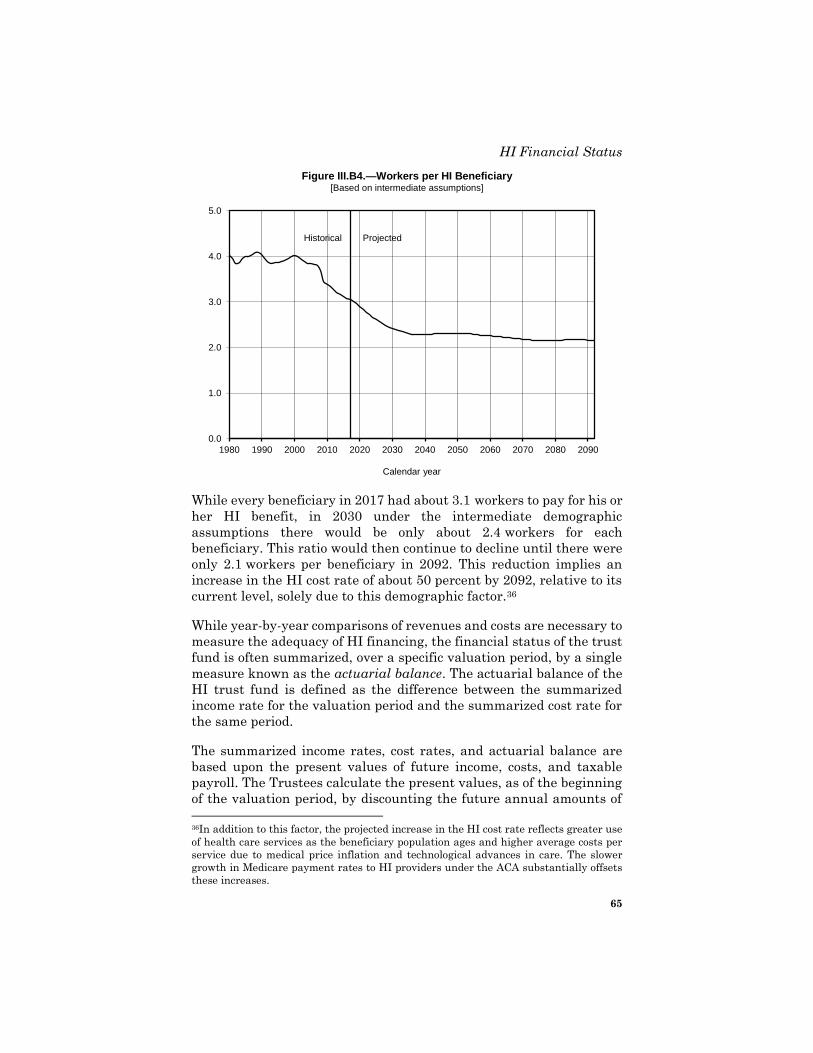
HI Financial Status
65
Figure III.B4.—Workers per HI Beneficiary [Based on intermediate assumptions]
0.0
1.0
2.0
3.0
4.0
5.0
1980 1990 2000 2010 2020 2030 2040 2050 2060 2070 2080 2090
Calendar year
Historical Projected
While every beneficiary in 2017 had about 3.1 workers to pay for his or
her HI benefit, in 2030 under the intermediate demographic
assumptions there would be only about 2.4 workers for each
beneficiary. This ratio would then continue to decline until there were
only 2.1 workers per beneficiary in 2092. This reduction implies an
increase in the HI cost rate of about 50 percent by 2092, relative to its
current level, solely due to this demographic factor.36
While year-by-year comparisons of revenues and costs are necessary to
measure the adequacy of HI financing, the financial status of the trust
fund is often summarized, over a specific valuation period, by a single
measure known as the actuarial balance. The actuarial balance of the
HI trust fund is defined as the difference between the summarized
income rate for the valuation period and the summarized cost rate for
the same period.
The summarized income rates, cost rates, and actuarial balance are
based upon the present values of future income, costs, and taxable
payroll. The Trustees calculate the present values, as of the beginning
of the valuation period, by discounting the future annual amounts of
36In addition to this factor, the projected increase in the HI cost rate reflects greater use
of health care services as the beneficiary population ages and higher average costs per
service due to medical price inflation and technological advances in care. The slower
growth in Medicare payment rates to HI providers under the ACA substantially offsets
these increases.
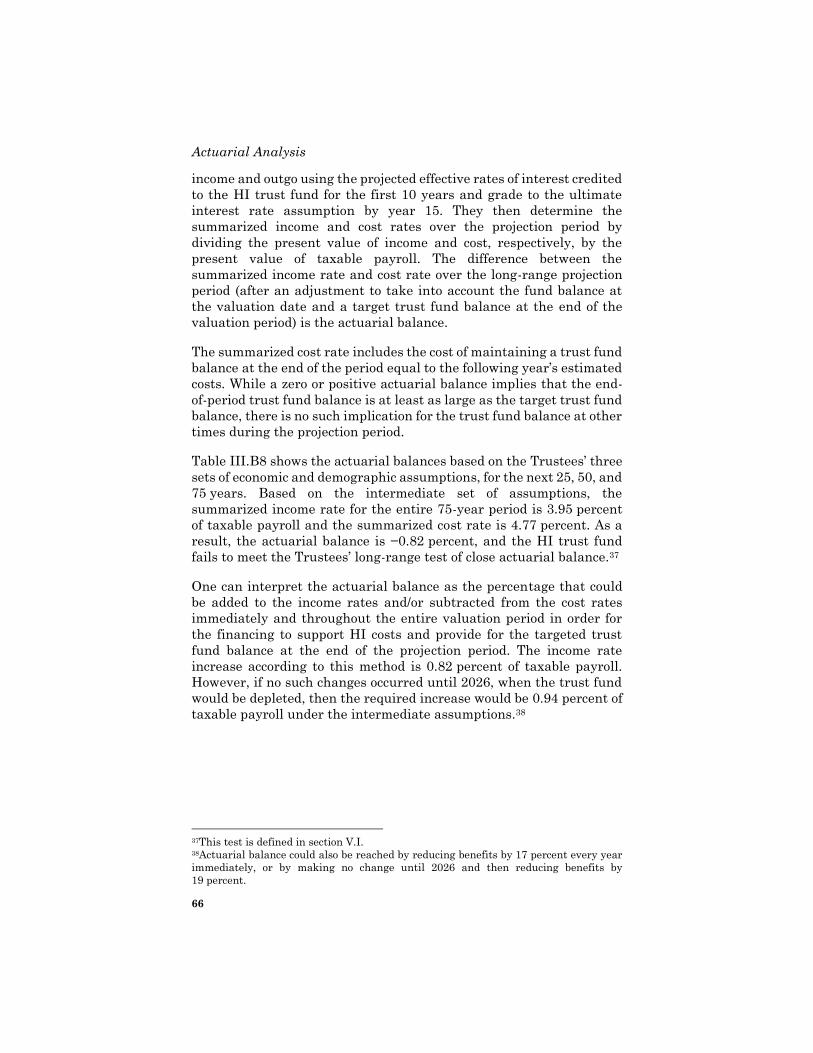
Actuarial Analysis
66
income and outgo using the projected effective rates of interest credited
to the HI trust fund for the first 10 years and grade to the ultimate
interest rate assumption by year 15. They then determine the
summarized income and cost rates over the projection period by
dividing the present value of income and cost, respectively, by the
present value of taxable payroll. The difference between the
summarized income rate and cost rate over the long-range projection
period (after an adjustment to take into account the fund balance at
the valuation date and a target trust fund balance at the end of the
valuation period) is the actuarial balance.
The summarized cost rate includes the cost of maintaining a trust fund
balance at the end of the period equal to the following year’s estimated
costs. While a zero or positive actuarial balance implies that the end-
of-period trust fund balance is at least as large as the target trust fund
balance, there is no such implication for the trust fund balance at other
times during the projection period.
Table III.B8 shows the actuarial balances based on the Trustees’ three
sets of economic and demographic assumptions, for the next 25, 50, and
75 years. Based on the intermediate set of assumptions, the
summarized income rate for the entire 75-year period is 3.95 percent
of taxable payroll and the summarized cost rate is 4.77 percent. As a
result, the actuarial balance is −0.82 percent, and the HI trust fund
fails to meet the Trustees’ long-range test of close actuarial balance.37
One can interpret the actuarial balance as the percentage that could
be added to the income rates and/or subtracted from the cost rates
immediately and throughout the entire valuation period in order for
the financing to support HI costs and provide for the targeted trust
fund balance at the end of the projection period. The income rate
increase according to this method is 0.82 percent of taxable payroll.
However, if no such changes occurred until 2026, when the trust fund
would be depleted, then the required increase would be 0.94 percent of
taxable payroll under the intermediate assumptions.38
37This test is defined in section V.I. 38Actuarial balance could also be reached by reducing benefits by 17 percent every year
immediately, or by making no change until 2026 and then reducing benefits by
19 percent.
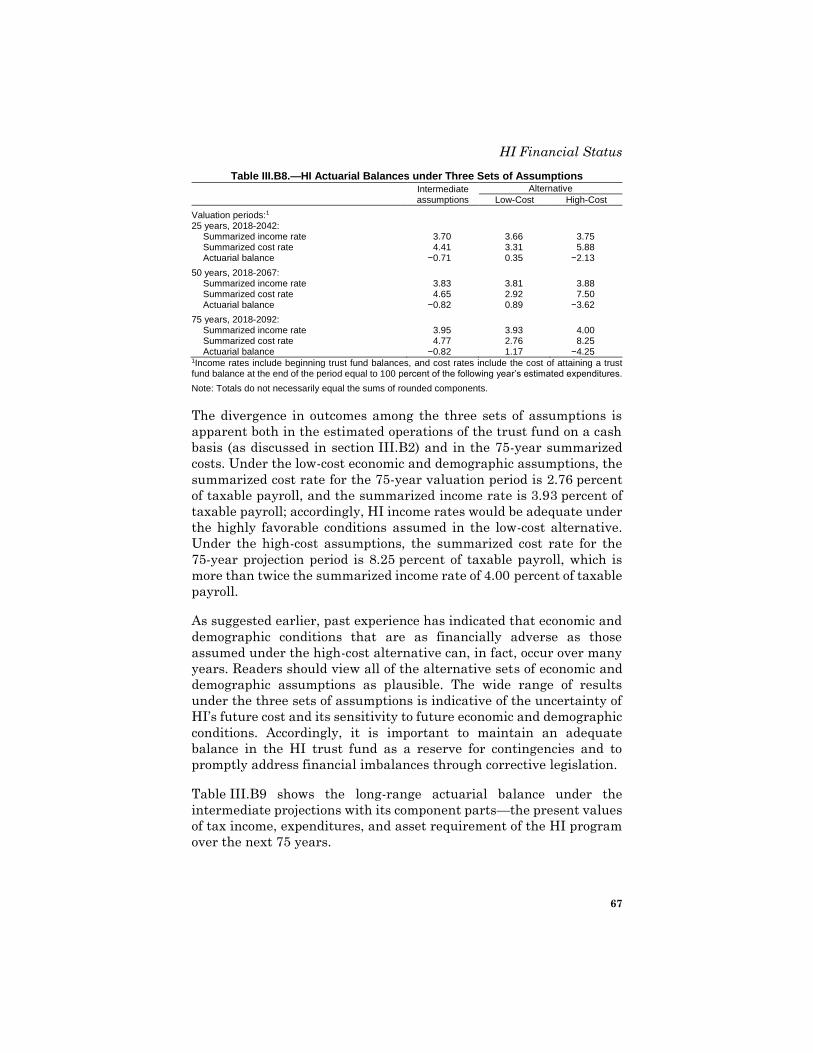
HI Financial Status
67
Table III.B8.—HI Actuarial Balances under Three Sets of Assumptions Intermediate
assumptions
Alternative
Low-Cost High-Cost
Valuation periods:1 25 years, 2018-2042:
Summarized income rate 3.70 3.66 3.75 Summarized cost rate 4.41 3.31 5.88 Actuarial balance −0.71 0.35 −2.13
50 years, 2018-2067: Summarized income rate 3.83 3.81 3.88 Summarized cost rate 4.65 2.92 7.50 Actuarial balance −0.82 0.89 −3.62
75 years, 2018-2092: Summarized income rate 3.95 3.93 4.00 Summarized cost rate 4.77 2.76 8.25 Actuarial balance −0.82 1.17 −4.25
1Income rates include beginning trust fund balances, and cost rates include the cost of attaining a trust fund balance at the end of the period equal to 100 percent of the following year’s estimated expenditures.
Note: Totals do not necessarily equal the sums of rounded components.
The divergence in outcomes among the three sets of assumptions is
apparent both in the estimated operations of the trust fund on a cash
basis (as discussed in section III.B2) and in the 75-year summarized
costs. Under the low-cost economic and demographic assumptions, the
summarized cost rate for the 75-year valuation period is 2.76 percent
of taxable payroll, and the summarized income rate is 3.93 percent of
taxable payroll; accordingly, HI income rates would be adequate under
the highly favorable conditions assumed in the low-cost alternative.
Under the high-cost assumptions, the summarized cost rate for the
75-year projection period is 8.25 percent of taxable payroll, which is
more than twice the summarized income rate of 4.00 percent of taxable
payroll.
As suggested earlier, past experience has indicated that economic and
demographic conditions that are as financially adverse as those
assumed under the high-cost alternative can, in fact, occur over many
years. Readers should view all of the alternative sets of economic and
demographic assumptions as plausible. The wide range of results
under the three sets of assumptions is indicative of the uncertainty of
HI’s future cost and its sensitivity to future economic and demographic
conditions. Accordingly, it is important to maintain an adequate
balance in the HI trust fund as a reserve for contingencies and to
promptly address financial imbalances through corrective legislation.
Table III.B9 shows the long-range actuarial balance under the
intermediate projections with its component parts—the present values
of tax income, expenditures, and asset requirement of the HI program
over the next 75 years.
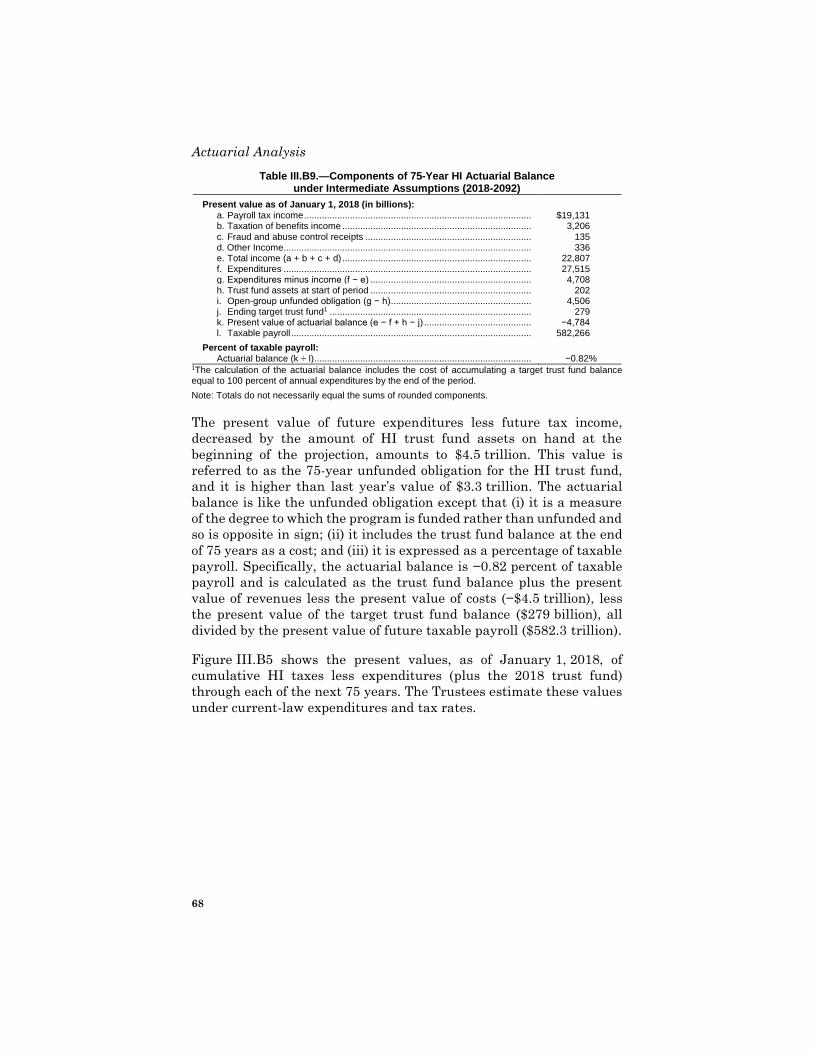
Actuarial Analysis
68
Table III.B9.—Components of 75-Year HI Actuarial Balance under Intermediate Assumptions (2018-2092)
Present value as of January 1, 2018 (in billions): a. Payroll tax income ......................................................................................... $19,131 b. Taxation of benefits income .......................................................................... 3,206 c. Fraud and abuse control receipts ................................................................. 135 d. Other Income................................................................................................. 336 e. Total income (a + b + c + d) .......................................................................... 22,807 f. Expenditures ................................................................................................. 27,515 g. Expenditures minus income (f − e) ............................................................... 4,708 h. Trust fund assets at start of period ............................................................... 202 i. Open-group unfunded obligation (g − h) ....................................................... 4,506 j. Ending target trust fund1 ............................................................................... 279 k. Present value of actuarial balance (e − f + h − j) .......................................... −4,784 l. Taxable payroll .............................................................................................. 582,266
Percent of taxable payroll: Actuarial balance (k ÷ l) ..................................................................................... −0.82%
1The calculation of the actuarial balance includes the cost of accumulating a target trust fund balance equal to 100 percent of annual expenditures by the end of the period.
Note: Totals do not necessarily equal the sums of rounded components.
The present value of future expenditures less future tax income,
decreased by the amount of HI trust fund assets on hand at the
beginning of the projection, amounts to $4.5 trillion. This value is
referred to as the 75-year unfunded obligation for the HI trust fund,
and it is higher than last year’s value of $3.3 trillion. The actuarial
balance is like the unfunded obligation except that (i) it is a measure
of the degree to which the program is funded rather than unfunded and
so is opposite in sign; (ii) it includes the trust fund balance at the end
of 75 years as a cost; and (iii) it is expressed as a percentage of taxable
payroll. Specifically, the actuarial balance is −0.82 percent of taxable
payroll and is calculated as the trust fund balance plus the present
value of revenues less the present value of costs (−$4.5 trillion), less
the present value of the target trust fund balance ($279 billion), all
divided by the present value of future taxable payroll ($582.3 trillion).
Figure III.B5 shows the present values, as of January 1, 2018, of
cumulative HI taxes less expenditures (plus the 2018 trust fund)
through each of the next 75 years. The Trustees estimate these values
under current-law expenditures and tax rates.
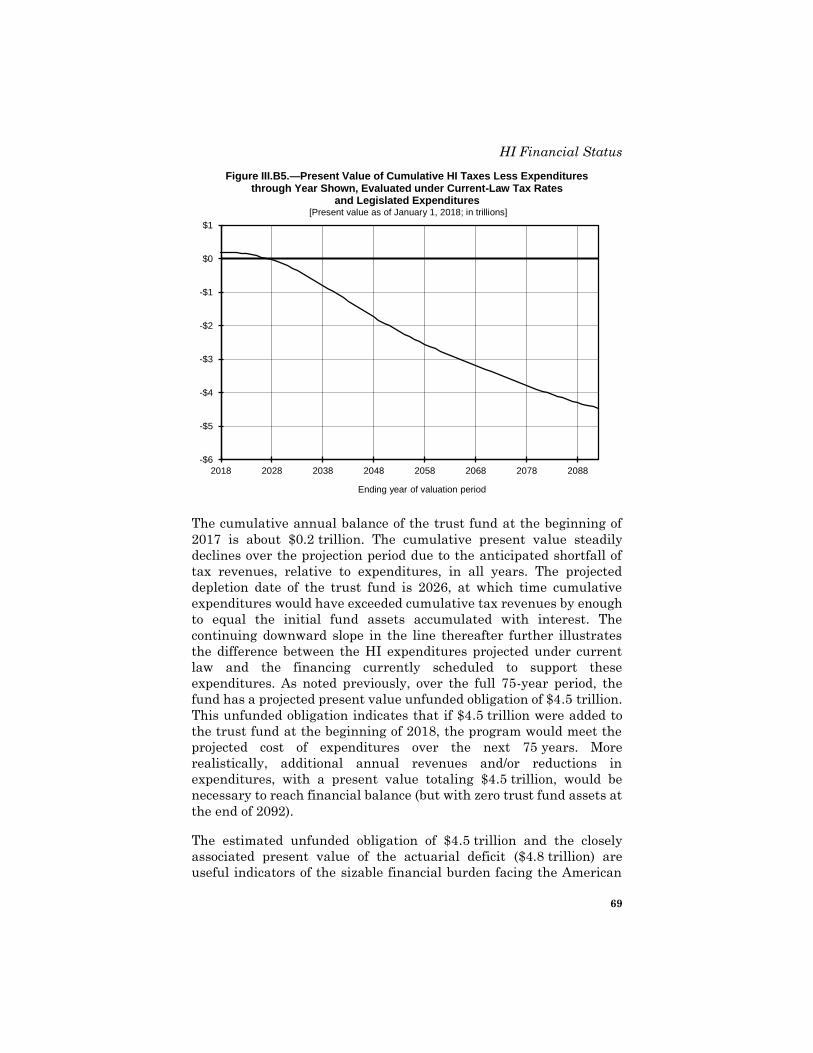
HI Financial Status
69
Figure III.B5.—Present Value of Cumulative HI Taxes Less Expenditures through Year Shown, Evaluated under Current-Law Tax Rates
and Legislated Expenditures [Present value as of January 1, 2018; in trillions]
-$6
-$5
-$4
-$3
-$2
-$1
$0
$1
2018 2028 2038 2048 2058 2068 2078 2088
Ending year of valuation period
The cumulative annual balance of the trust fund at the beginning of
2017 is about $0.2 trillion. The cumulative present value steadily
declines over the projection period due to the anticipated shortfall of
tax revenues, relative to expenditures, in all years. The projected
depletion date of the trust fund is 2026, at which time cumulative
expenditures would have exceeded cumulative tax revenues by enough
to equal the initial fund assets accumulated with interest. The
continuing downward slope in the line thereafter further illustrates
the difference between the HI expenditures projected under current
law and the financing currently scheduled to support these
expenditures. As noted previously, over the full 75-year period, the
fund has a projected present value unfunded obligation of $4.5 trillion.
This unfunded obligation indicates that if $4.5 trillion were added to
the trust fund at the beginning of 2018, the program would meet the
projected cost of expenditures over the next 75 years. More
realistically, additional annual revenues and/or reductions in
expenditures, with a present value totaling $4.5 trillion, would be
necessary to reach financial balance (but with zero trust fund assets at
the end of 2092).
The estimated unfunded obligation of $4.5 trillion and the closely
associated present value of the actuarial deficit ($4.8 trillion) are
useful indicators of the sizable financial burden facing the American
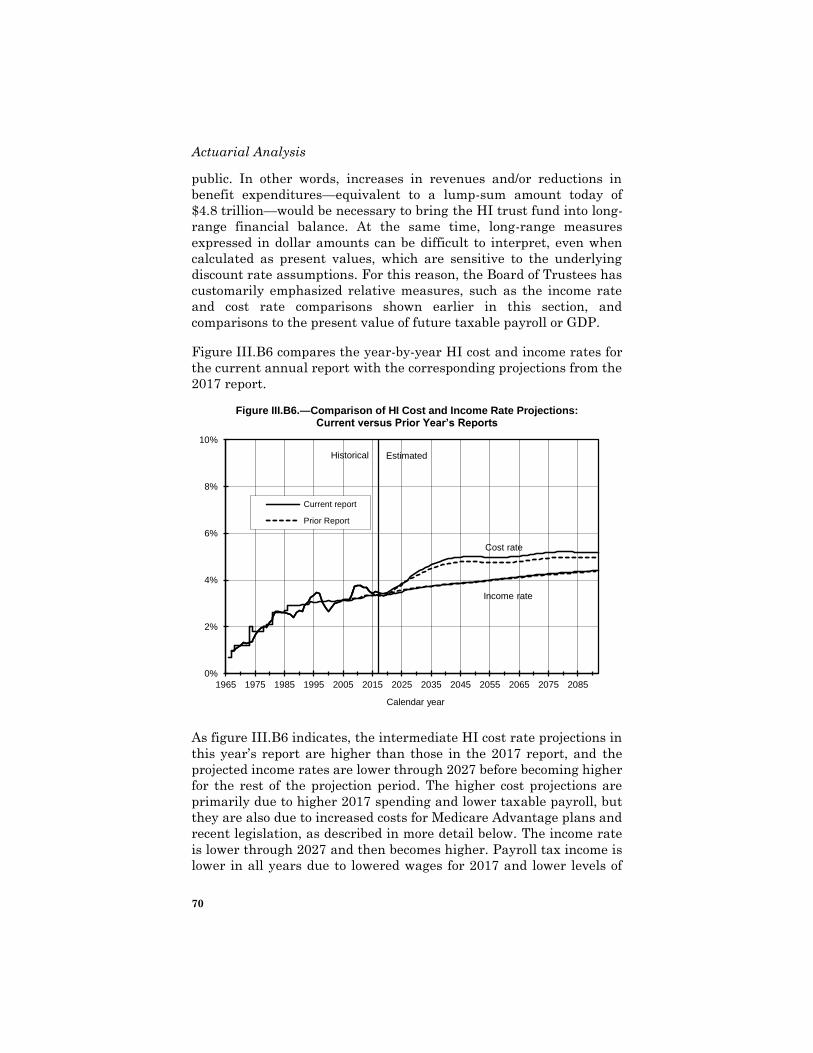
Actuarial Analysis
70
public. In other words, increases in revenues and/or reductions in
benefit expenditures—equivalent to a lump-sum amount today of
$4.8 trillion—would be necessary to bring the HI trust fund into long-
range financial balance. At the same time, long-range measures
expressed in dollar amounts can be difficult to interpret, even when
calculated as present values, which are sensitive to the underlying
discount rate assumptions. For this reason, the Board of Trustees has
customarily emphasized relative measures, such as the income rate
and cost rate comparisons shown earlier in this section, and
comparisons to the present value of future taxable payroll or GDP.
Figure III.B6 compares the year-by-year HI cost and income rates for
the current annual report with the corresponding projections from the
2017 report.
Figure III.B6.—Comparison of HI Cost and Income Rate Projections: Current versus Prior Year’s Reports
0%
2%
4%
6%
8%
10%
1965 1975 1985 1995 2005 2015 2025 2035 2045 2055 2065 2075 2085
Calendar year
Current report
Prior Report
Historical Estimated
Cost rate
Income rate
As figure III.B6 indicates, the intermediate HI cost rate projections in
this year’s report are higher than those in the 2017 report, and the
projected income rates are lower through 2027 before becoming higher
for the rest of the projection period. The higher cost projections are
primarily due to higher 2017 spending and lower taxable payroll, but
they are also due to increased costs for Medicare Advantage plans and
recent legislation, as described in more detail below. The income rate
is lower through 2027 and then becomes higher. Payroll tax income is
lower in all years due to lowered wages for 2017 and lower levels of
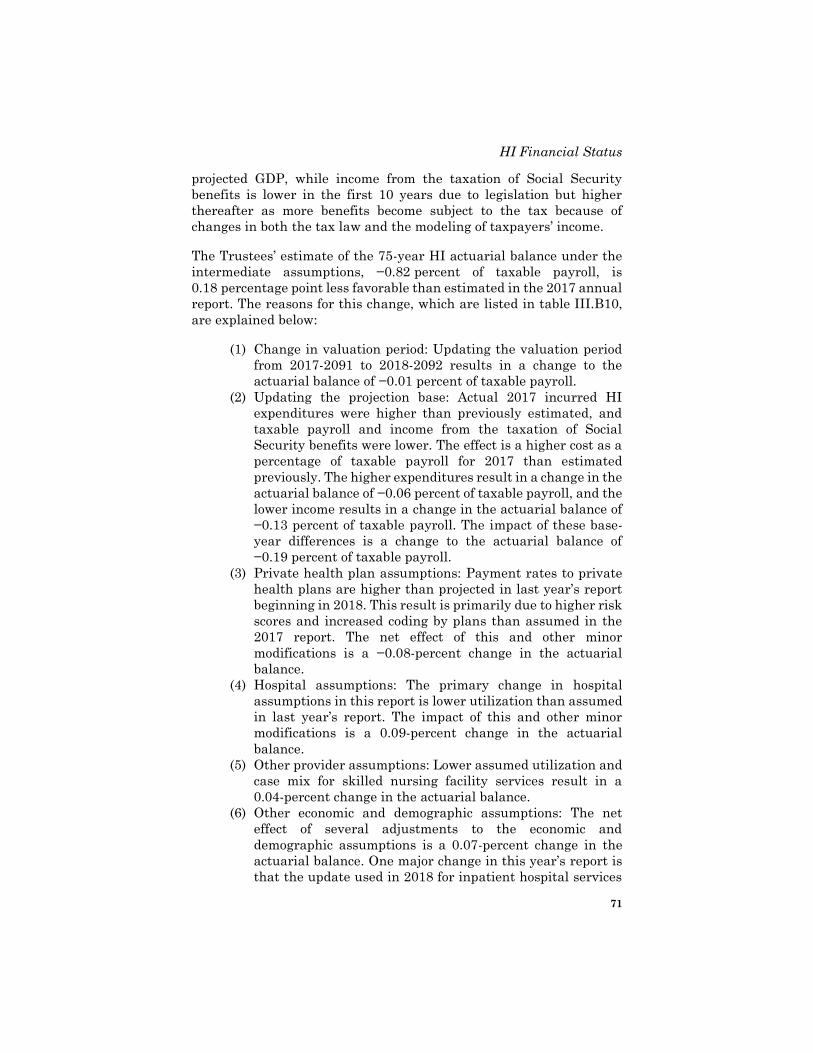
HI Financial Status
71
projected GDP, while income from the taxation of Social Security
benefits is lower in the first 10 years due to legislation but higher
thereafter as more benefits become subject to the tax because of
changes in both the tax law and the modeling of taxpayers’ income.
The Trustees’ estimate of the 75-year HI actuarial balance under the
intermediate assumptions, −0.82 percent of taxable payroll, is
0.18 percentage point less favorable than estimated in the 2017 annual
report. The reasons for this change, which are listed in table III.B10,
are explained below:
(1) Change in valuation period: Updating the valuation period
from 2017-2091 to 2018-2092 results in a change to the
actuarial balance of −0.01 percent of taxable payroll.
(2) Updating the projection base: Actual 2017 incurred HI
expenditures were higher than previously estimated, and
taxable payroll and income from the taxation of Social
Security benefits were lower. The effect is a higher cost as a
percentage of taxable payroll for 2017 than estimated
previously. The higher expenditures result in a change in the
actuarial balance of −0.06 percent of taxable payroll, and the
lower income results in a change in the actuarial balance of
−0.13 percent of taxable payroll. The impact of these base-
year differences is a change to the actuarial balance of
−0.19 percent of taxable payroll.
(3) Private health plan assumptions: Payment rates to private
health plans are higher than projected in last year’s report
beginning in 2018. This result is primarily due to higher risk
scores and increased coding by plans than assumed in the
2017 report. The net effect of this and other minor
modifications is a −0.08-percent change in the actuarial
balance.
(4) Hospital assumptions: The primary change in hospital
assumptions in this report is lower utilization than assumed
in last year’s report. The impact of this and other minor
modifications is a 0.09-percent change in the actuarial
balance.
(5) Other provider assumptions: Lower assumed utilization and
case mix for skilled nursing facility services result in a
0.04-percent change in the actuarial balance.
(6) Other economic and demographic assumptions: The net
effect of several adjustments to the economic and
demographic assumptions is a 0.07-percent change in the
actuarial balance. One major change in this year’s report is
that the update used in 2018 for inpatient hospital services
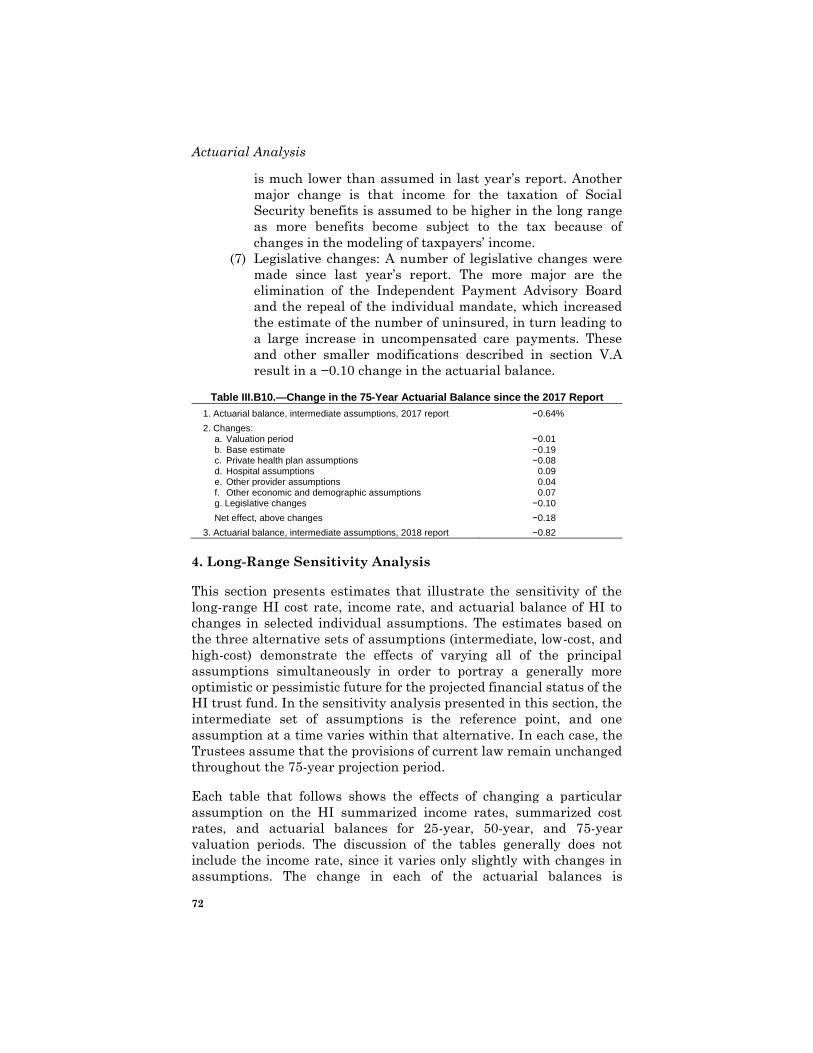
Actuarial Analysis
72
is much lower than assumed in last year’s report. Another
major change is that income for the taxation of Social
Security benefits is assumed to be higher in the long range
as more benefits become subject to the tax because of
changes in the modeling of taxpayers’ income.
(7) Legislative changes: A number of legislative changes were
made since last year’s report. The more major are the
elimination of the Independent Payment Advisory Board
and the repeal of the individual mandate, which increased
the estimate of the number of uninsured, in turn leading to
a large increase in uncompensated care payments. These
and other smaller modifications described in section V.A
result in a −0.10 change in the actuarial balance.
Table III.B10.—Change in the 75-Year Actuarial Balance since the 2017 Report
1. Actuarial balance, intermediate assumptions, 2017 report −0.64%
2. Changes: a. Valuation period −0.01 b. Base estimate −0.19 c. Private health plan assumptions −0.08 d. Hospital assumptions 0.09 e. Other provider assumptions 0.04 f. Other economic and demographic assumptions 0.07 g. Legislative changes −0.10
Net effect, above changes −0.18
3. Actuarial balance, intermediate assumptions, 2018 report −0.82
4. Long-Range Sensitivity Analysis
This section presents estimates that illustrate the sensitivity of the
long-range HI cost rate, income rate, and actuarial balance of HI to
changes in selected individual assumptions. The estimates based on
the three alternative sets of assumptions (intermediate, low-cost, and
high-cost) demonstrate the effects of varying all of the principal
assumptions simultaneously in order to portray a generally more
optimistic or pessimistic future for the projected financial status of the
HI trust fund. In the sensitivity analysis presented in this section, the
intermediate set of assumptions is the reference point, and one
assumption at a time varies within that alternative. In each case, the
Trustees assume that the provisions of current law remain unchanged
throughout the 75-year projection period.
Each table that follows shows the effects of changing a particular
assumption on the HI summarized income rates, summarized cost
rates, and actuarial balances for 25-year, 50-year, and 75-year
valuation periods. The discussion of the tables generally does not
include the income rate, since it varies only slightly with changes in
assumptions. The change in each of the actuarial balances is
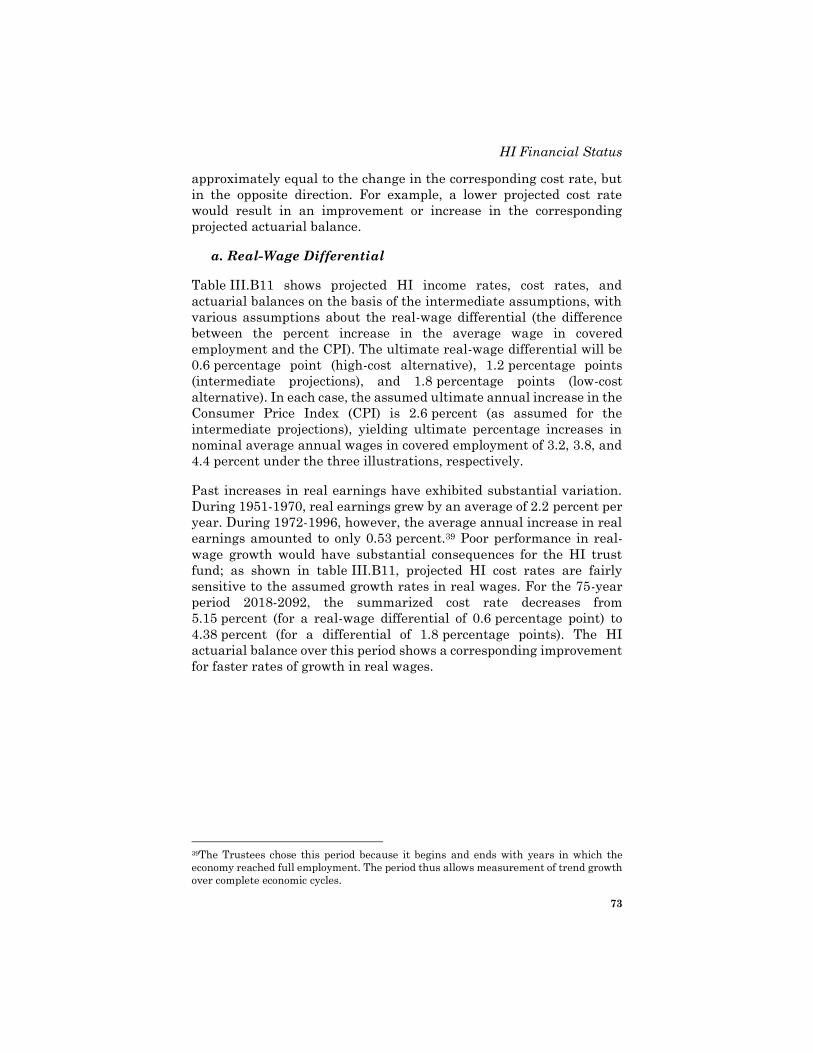
HI Financial Status
73
approximately equal to the change in the corresponding cost rate, but
in the opposite direction. For example, a lower projected cost rate
would result in an improvement or increase in the corresponding
projected actuarial balance.
a. Real-Wage Differential
Table III.B11 shows projected HI income rates, cost rates, and
actuarial balances on the basis of the intermediate assumptions, with
various assumptions about the real-wage differential (the difference
between the percent increase in the average wage in covered
employment and the CPI). The ultimate real-wage differential will be
0.6 percentage point (high-cost alternative), 1.2 percentage points
(intermediate projections), and 1.8 percentage points (low-cost
alternative). In each case, the assumed ultimate annual increase in the
Consumer Price Index (CPI) is 2.6 percent (as assumed for the
intermediate projections), yielding ultimate percentage increases in
nominal average annual wages in covered employment of 3.2, 3.8, and
4.4 percent under the three illustrations, respectively.
Past increases in real earnings have exhibited substantial variation.
During 1951-1970, real earnings grew by an average of 2.2 percent per
year. During 1972-1996, however, the average annual increase in real
earnings amounted to only 0.53 percent.39 Poor performance in real-
wage growth would have substantial consequences for the HI trust
fund; as shown in table III.B11, projected HI cost rates are fairly
sensitive to the assumed growth rates in real wages. For the 75-year
period 2018-2092, the summarized cost rate decreases from
5.15 percent (for a real-wage differential of 0.6 percentage point) to
4.38 percent (for a differential of 1.8 percentage points). The HI
actuarial balance over this period shows a corresponding improvement
for faster rates of growth in real wages.
39The Trustees chose this period because it begins and ends with years in which the
economy reached full employment. The period thus allows measurement of trend growth
over complete economic cycles.
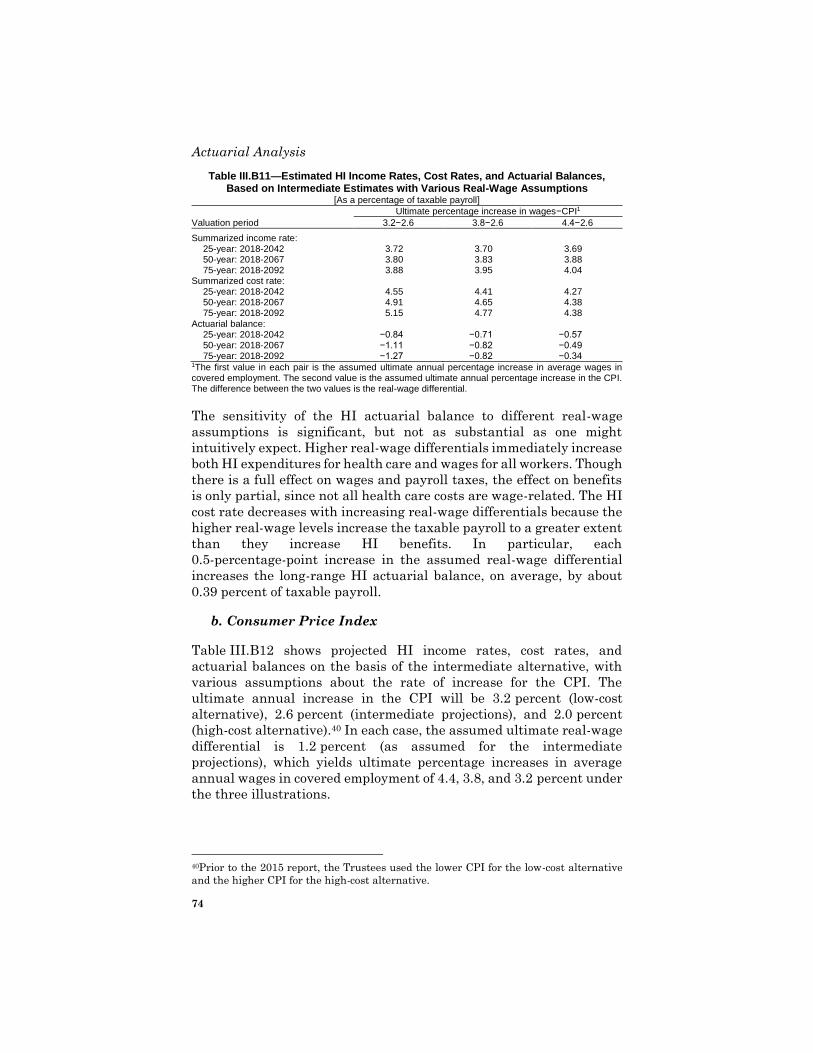
Actuarial Analysis
74
Table III.B11—Estimated HI Income Rates, Cost Rates, and Actuarial Balances, Based on Intermediate Estimates with Various Real-Wage Assumptions
[As a percentage of taxable payroll]
Ultimate percentage increase in wages−CPI1
Valuation period 3.2−2.6 3.8−2.6 4.4−2.6
Summarized income rate: 25-year: 2018-2042 3.72 3.70 3.69 50-year: 2018-2067 3.80 3.83 3.88 75-year: 2018-2092 3.88 3.95 4.04
Summarized cost rate: 25-year: 2018-2042 4.55 4.41 4.27 50-year: 2018-2067 4.91 4.65 4.38 75-year: 2018-2092 5.15 4.77 4.38
Actuarial balance: 25-year: 2018-2042 −0.84 −0.71 −0.57 50-year: 2018-2067 −1.11 −0.82 −0.49 75-year: 2018-2092 −1.27 −0.82 −0.34
1The first value in each pair is the assumed ultimate annual percentage increase in average wages in covered employment. The second value is the assumed ultimate annual percentage increase in the CPI. The difference between the two values is the real-wage differential.
The sensitivity of the HI actuarial balance to different real-wage
assumptions is significant, but not as substantial as one might
intuitively expect. Higher real-wage differentials immediately increase
both HI expenditures for health care and wages for all workers. Though
there is a full effect on wages and payroll taxes, the effect on benefits
is only partial, since not all health care costs are wage-related. The HI
cost rate decreases with increasing real-wage differentials because the
higher real-wage levels increase the taxable payroll to a greater extent
than they increase HI benefits. In particular, each
0.5-percentage-point increase in the assumed real-wage differential
increases the long-range HI actuarial balance, on average, by about
0.39 percent of taxable payroll.
b. Consumer Price Index
Table III.B12 shows projected HI income rates, cost rates, and
actuarial balances on the basis of the intermediate alternative, with
various assumptions about the rate of increase for the CPI. The
ultimate annual increase in the CPI will be 3.2 percent (low-cost
alternative), 2.6 percent (intermediate projections), and 2.0 percent
(high-cost alternative).40 In each case, the assumed ultimate real-wage
differential is 1.2 percent (as assumed for the intermediate
projections), which yields ultimate percentage increases in average
annual wages in covered employment of 4.4, 3.8, and 3.2 percent under
the three illustrations.
40Prior to the 2015 report, the Trustees used the lower CPI for the low-cost alternative
and the higher CPI for the high-cost alternative.
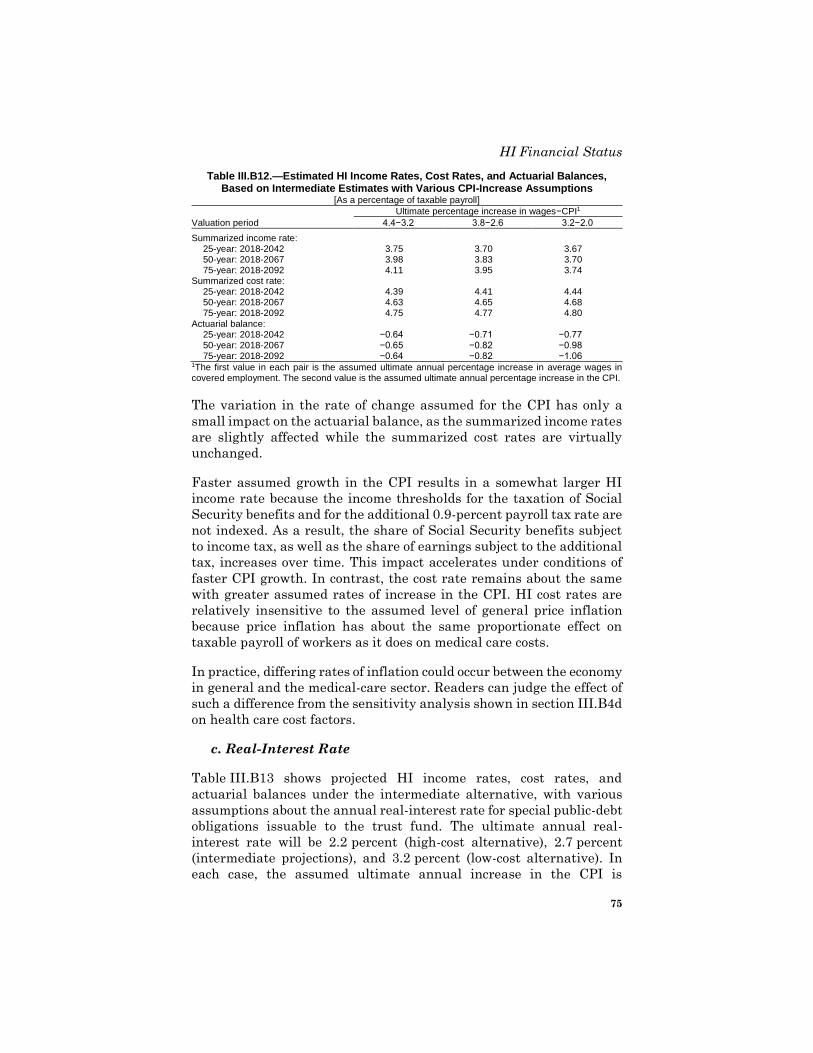
HI Financial Status
75
Table III.B12.—Estimated HI Income Rates, Cost Rates, and Actuarial Balances, Based on Intermediate Estimates with Various CPI-Increase Assumptions
[As a percentage of taxable payroll]
Ultimate percentage increase in wages−CPI1
Valuation period 4.4−3.2 3.8−2.6 3.2−2.0
Summarized income rate: 25-year: 2018-2042 3.75 3.70 3.67 50-year: 2018-2067 3.98 3.83 3.70 75-year: 2018-2092 4.11 3.95 3.74
Summarized cost rate: 25-year: 2018-2042 4.39 4.41 4.44 50-year: 2018-2067 4.63 4.65 4.68 75-year: 2018-2092 4.75 4.77 4.80
Actuarial balance: 25-year: 2018-2042 −0.64 −0.71 −0.77 50-year: 2018-2067 −0.65 −0.82 −0.98 75-year: 2018-2092 −0.64 −0.82 −1.06
1The first value in each pair is the assumed ultimate annual percentage increase in average wages in covered employment. The second value is the assumed ultimate annual percentage increase in the CPI.
The variation in the rate of change assumed for the CPI has only a
small impact on the actuarial balance, as the summarized income rates
are slightly affected while the summarized cost rates are virtually
unchanged.
Faster assumed growth in the CPI results in a somewhat larger HI
income rate because the income thresholds for the taxation of Social
Security benefits and for the additional 0.9-percent payroll tax rate are
not indexed. As a result, the share of Social Security benefits subject
to income tax, as well as the share of earnings subject to the additional
tax, increases over time. This impact accelerates under conditions of
faster CPI growth. In contrast, the cost rate remains about the same
with greater assumed rates of increase in the CPI. HI cost rates are
relatively insensitive to the assumed level of general price inflation
because price inflation has about the same proportionate effect on
taxable payroll of workers as it does on medical care costs.
In practice, differing rates of inflation could occur between the economy
in general and the medical-care sector. Readers can judge the effect of
such a difference from the sensitivity analysis shown in section III.B4d
on health care cost factors.
c. Real-Interest Rate
Table III.B13 shows projected HI income rates, cost rates, and
actuarial balances under the intermediate alternative, with various
assumptions about the annual real-interest rate for special public-debt
obligations issuable to the trust fund. The ultimate annual real-
interest rate will be 2.2 percent (high-cost alternative), 2.7 percent
(intermediate projections), and 3.2 percent (low-cost alternative). In
each case, the assumed ultimate annual increase in the CPI is
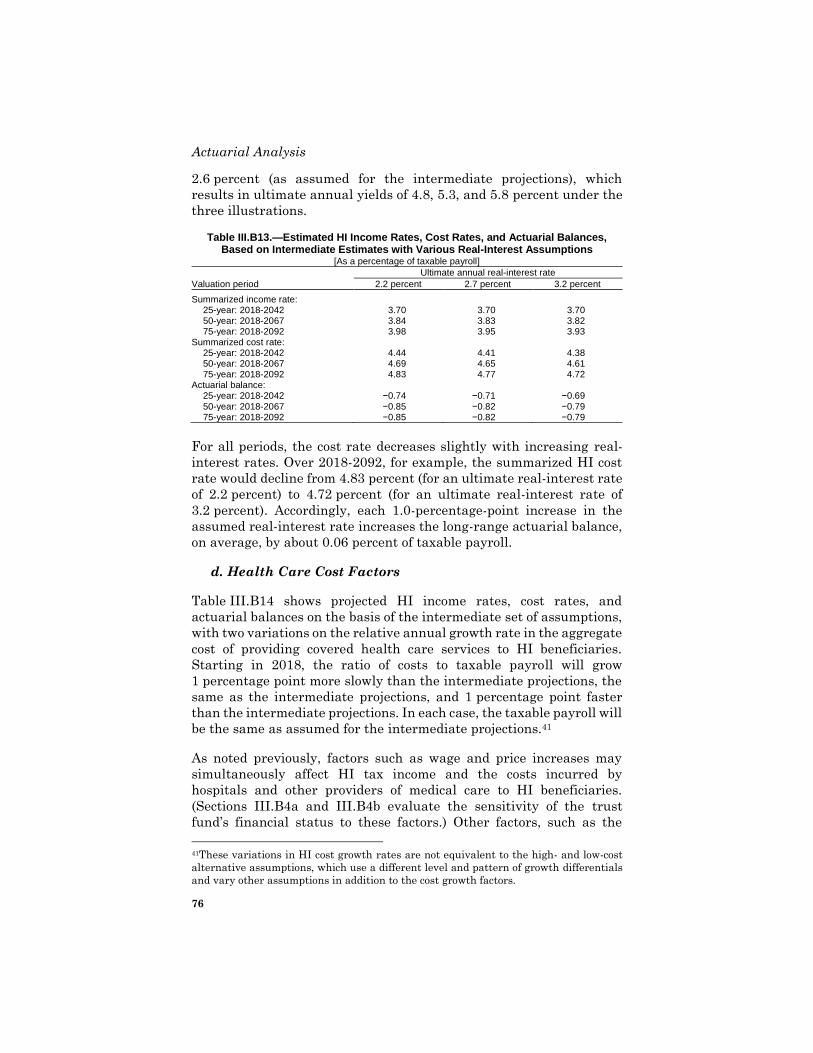
Actuarial Analysis
76
2.6 percent (as assumed for the intermediate projections), which
results in ultimate annual yields of 4.8, 5.3, and 5.8 percent under the
three illustrations.
Table III.B13.—Estimated HI Income Rates, Cost Rates, and Actuarial Balances, Based on Intermediate Estimates with Various Real-Interest Assumptions
[As a percentage of taxable payroll]
Ultimate annual real-interest rate
Valuation period 2.2 percent 2.7 percent 3.2 percent
Summarized income rate: 25-year: 2018-2042 3.70 3.70 3.70 50-year: 2018-2067 3.84 3.83 3.82 75-year: 2018-2092 3.98 3.95 3.93
Summarized cost rate: 25-year: 2018-2042 4.44 4.41 4.38 50-year: 2018-2067 4.69 4.65 4.61 75-year: 2018-2092 4.83 4.77 4.72
Actuarial balance: 25-year: 2018-2042 −0.74 −0.71 −0.69 50-year: 2018-2067 −0.85 −0.82 −0.79 75-year: 2018-2092 −0.85 −0.82 −0.79
For all periods, the cost rate decreases slightly with increasing real-
interest rates. Over 2018-2092, for example, the summarized HI cost
rate would decline from 4.83 percent (for an ultimate real-interest rate
of 2.2 percent) to 4.72 percent (for an ultimate real-interest rate of
3.2 percent). Accordingly, each 1.0-percentage-point increase in the
assumed real-interest rate increases the long-range actuarial balance,
on average, by about 0.06 percent of taxable payroll.
d. Health Care Cost Factors
Table III.B14 shows projected HI income rates, cost rates, and
actuarial balances on the basis of the intermediate set of assumptions,
with two variations on the relative annual growth rate in the aggregate
cost of providing covered health care services to HI beneficiaries.
Starting in 2018, the ratio of costs to taxable payroll will grow
1 percentage point more slowly than the intermediate projections, the
same as the intermediate projections, and 1 percentage point faster
than the intermediate projections. In each case, the taxable payroll will
be the same as assumed for the intermediate projections.41
As noted previously, factors such as wage and price increases may
simultaneously affect HI tax income and the costs incurred by
hospitals and other providers of medical care to HI beneficiaries.
(Sections III.B4a and III.B4b evaluate the sensitivity of the trust
fund’s financial status to these factors.) Other factors, such as the
41These variations in HI cost growth rates are not equivalent to the high- and low-cost
alternative assumptions, which use a different level and pattern of growth differentials
and vary other assumptions in addition to the cost growth factors.
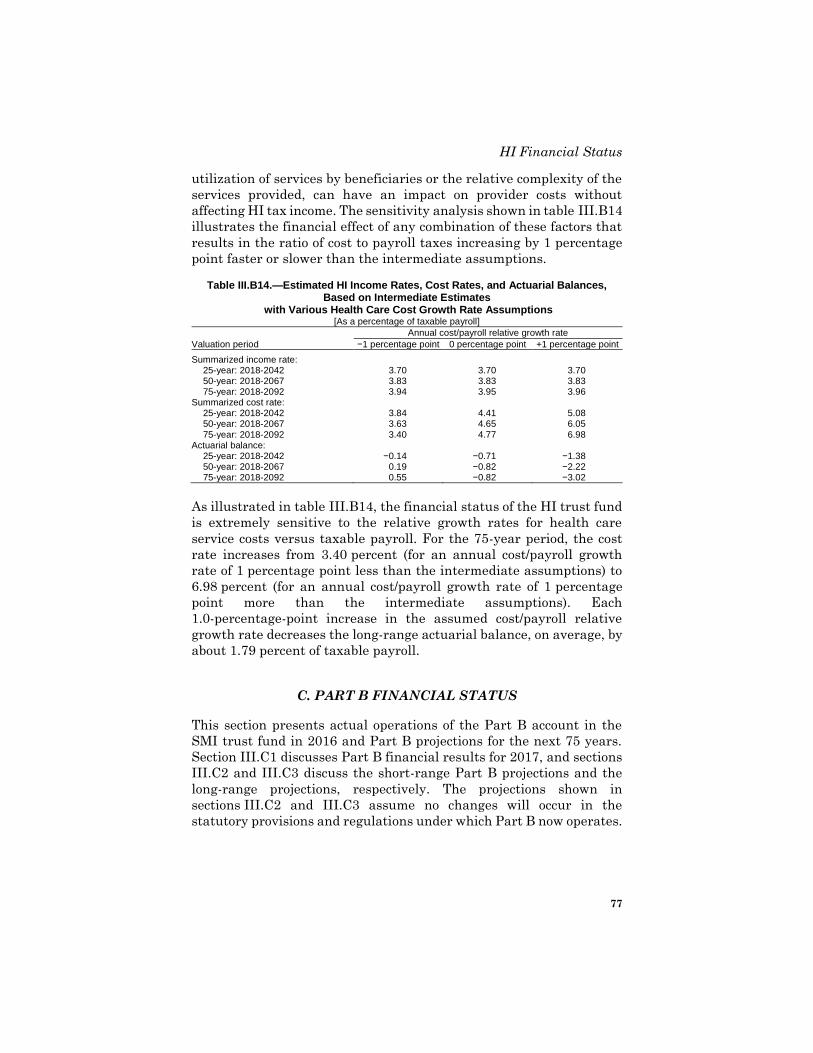
HI Financial Status
77
utilization of services by beneficiaries or the relative complexity of the
services provided, can have an impact on provider costs without
affecting HI tax income. The sensitivity analysis shown in table III.B14
illustrates the financial effect of any combination of these factors that
results in the ratio of cost to payroll taxes increasing by 1 percentage
point faster or slower than the intermediate assumptions.
Table III.B14.—Estimated HI Income Rates, Cost Rates, and Actuarial Balances, Based on Intermediate Estimates
with Various Health Care Cost Growth Rate Assumptions [As a percentage of taxable payroll]
Annual cost/payroll relative growth rate
Valuation period −1 percentage point 0 percentage point +1 percentage point
Summarized income rate: 25-year: 2018-2042 3.70 3.70 3.70 50-year: 2018-2067 3.83 3.83 3.83 75-year: 2018-2092 3.94 3.95 3.96
Summarized cost rate: 25-year: 2018-2042 3.84 4.41 5.08 50-year: 2018-2067 3.63 4.65 6.05 75-year: 2018-2092 3.40 4.77 6.98
Actuarial balance: 25-year: 2018-2042 −0.14 −0.71 −1.38 50-year: 2018-2067 0.19 −0.82 −2.22 75-year: 2018-2092 0.55 −0.82 −3.02
As illustrated in table III.B14, the financial status of the HI trust fund
is extremely sensitive to the relative growth rates for health care
service costs versus taxable payroll. For the 75-year period, the cost
rate increases from 3.40 percent (for an annual cost/payroll growth
rate of 1 percentage point less than the intermediate assumptions) to
6.98 percent (for an annual cost/payroll growth rate of 1 percentage
point more than the intermediate assumptions). Each
1.0-percentage-point increase in the assumed cost/payroll relative
growth rate decreases the long-range actuarial balance, on average, by
about 1.79 percent of taxable payroll.
C. PART B FINANCIAL STATUS
This section presents actual operations of the Part B account in the
SMI trust fund in 2016 and Part B projections for the next 75 years.
Section III.C1 discusses Part B financial results for 2017, and sections
III.C2 and III.C3 discuss the short-range Part B projections and the
long-range projections, respectively. The projections shown in
sections III.C2 and III.C3 assume no changes will occur in the
statutory provisions and regulations under which Part B now operates.
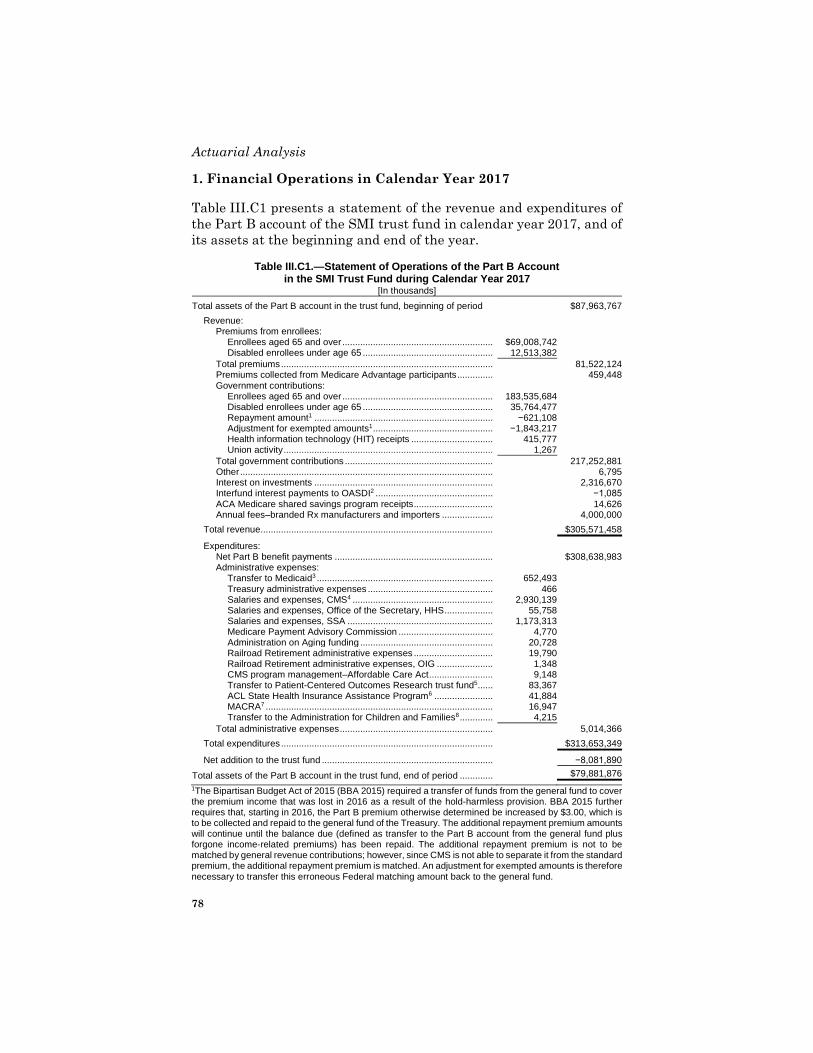
Actuarial Analysis
78
1. Financial Operations in Calendar Year 2017
Table III.C1 presents a statement of the revenue and expenditures of
the Part B account of the SMI trust fund in calendar year 2017, and of
its assets at the beginning and end of the year.
Table III.C1.—Statement of Operations of the Part B Account in the SMI Trust Fund during Calendar Year 2017
[In thousands]
Total assets of the Part B account in the trust fund, beginning of period $87,963,767
Revenue: Premiums from enrollees:
Enrollees aged 65 and over ........................................................... $69,008,742 Disabled enrollees under age 65 ................................................... 12,513,382
Total premiums ................................................................................... 81,522,124 Premiums collected from Medicare Advantage participants .............. 459,448 Government contributions:
Enrollees aged 65 and over ........................................................... 183,535,684 Disabled enrollees under age 65 ................................................... 35,764,477 Repayment amount1 ...................................................................... −621,108 Adjustment for exempted amounts1 ............................................... −1,843,217 Health information technology (HIT) receipts ................................ 415,777 Union activity .................................................................................. 1,267
Total government contributions .......................................................... 217,252,881 Other ................................................................................................... 6,795 Interest on investments ...................................................................... 2,316,670 Interfund interest payments to OASDI2 .............................................. −1,085 ACA Medicare shared savings program receipts ............................... 14,626 Annual fees–branded Rx manufacturers and importers .................... 4,000,000
Total revenue........................................................................................... $305,571,458
Expenditures: Net Part B benefit payments .............................................................. $308,638,983 Administrative expenses:
Transfer to Medicaid3 ..................................................................... 652,493 Treasury administrative expenses ................................................. 466 Salaries and expenses, CMS4 ....................................................... 2,930,139 Salaries and expenses, Office of the Secretary, HHS ................... 55,758 Salaries and expenses, SSA ......................................................... 1,173,313 Medicare Payment Advisory Commission ..................................... 4,770 Administration on Aging funding .................................................... 20,728 Railroad Retirement administrative expenses ............................... 19,790 Railroad Retirement administrative expenses, OIG ...................... 1,348 CMS program management–Affordable Care Act ......................... 9,148 Transfer to Patient-Centered Outcomes Research trust fund5...... 83,367 ACL State Health Insurance Assistance Program6 ....................... 41,884 MACRA7 ......................................................................................... 16,947 Transfer to the Administration for Children and Families8 ............. 4,215
Total administrative expenses ............................................................ 5,014,366
Total expenditures ................................................................................... $313,653,349
Net addition to the trust fund ................................................................... −8,081,890
Total assets of the Part B account in the trust fund, end of period ............. $79,881,876
1The Bipartisan Budget Act of 2015 (BBA 2015) required a transfer of funds from the general fund to cover the premium income that was lost in 2016 as a result of the hold-harmless provision. BBA 2015 further requires that, starting in 2016, the Part B premium otherwise determined be increased by $3.00, which is to be collected and repaid to the general fund of the Treasury. The additional repayment premium amounts will continue until the balance due (defined as transfer to the Part B account from the general fund plus forgone income-related premiums) has been repaid. The additional repayment premium is not to be matched by general revenue contributions; however, since CMS is not able to separate it from the standard premium, the additional repayment premium is matched. An adjustment for exempted amounts is therefore necessary to transfer this erroneous Federal matching amount back to the general fund.
Part B Financial Status
79
2Reflects interest adjustments on the reallocation of administrative expenses among the Medicare trust funds, the OASDI trust funds, and the general fund of the Treasury. Estimated payments are made from the trust funds and then are reconciled, with interest, the next year when the actual costs are known. A positive figure represents a transfer to the Part B account in the SMI trust fund from the other trust funds. A negative figure represents a transfer from the Part B account of the SMI trust fund to the other funds. 3Represents amount transferred from the Part B account in the SMI trust fund to Medicaid to pay the Part B premium for certain qualified individuals, as legislated by the Balanced Budget Act of 1997. 4Includes expenses of the Medicare Administrative Contractors. Also reflects a larger-than-usual upward adjustment of $1.7 billion for prior-year allocations among Part A, Part B, and Part D. 5Reflects amount transferred from the Part B account of the SMI trust fund to the Patient-Centered Outcomes Research trust fund, as authorized by the Patient Protection and Affordable Care Act of 2010. 6Reflects amount transferred from the Part B account of the SMI trust fund to the Administration for Community Living (ACL) for administration of the State Health Insurance Assistance program, as authorized by the Consolidated Appropriations Act of 2014. 7Represents amounts transferred from the Part B account of the SMI trust fund for administration of provisions of the Medicare Access and CHIP Reauthorization Act of 2015 (MACRA). 8Reflects amount transferred from the Part B account of the SMI trust fund to the Administration for Children and Families as authorized by the Patient Protection and Affordable Care Act of 2010.
Note: Totals do not necessarily equal the sums of rounded components.
The total assets of the account amounted to $88.0 billion on
December 31, 2016. During calendar year 2017, total revenue
amounted to $305.6 billion, and total expenditures were $313.7 billion.
Total assets were $79.9 billion as of December 31, 2017. The asset level
decreased during 2017 by approximately $8.1 billion.
a. Revenues
The major sources of revenue for the Part B account are
(i) contributions of the Federal Government that the law authorizes to
be appropriated and transferred from the general fund of the Treasury
and (ii) premiums paid by eligible persons who voluntarily enroll.
Another source of revenue is the annual fees assessed on
manufacturers and importers of brand-name prescription drugs.
Eligible persons aged 65 and over have been able to enroll in Part B
since its inception in July 1966. Since July 1973, disabled persons who
are under age 65 and who have met certain eligibility requirements
have also been able to enroll.
Of the total Part B revenue, $81.5 billion represented premium
payments by (or on behalf of) aged and disabled enrollees—an increase
of 13.1 percent over the amount of $72.1 billion for the preceding year.
Government contributions matched the premiums paid for fiscal years
1967 through 1973 dollar for dollar. Beginning July 1973, the amount
of government contributions corresponding to premiums paid by each
of the two groups of enrollees is determined by applying a matching
rate, prescribed in the law for each group, to the amount of premiums
Actuarial Analysis
80
received from that group.42 This ratio is equal to twice the monthly
actuarial rate applicable to the particular group of enrollees, minus the
standard monthly premium rate, divided by the standard monthly
premium rate.
The Secretary of Health and Human Services promulgates standard
monthly premium rates and actuarial rates each year. Table III.C2
shows past monthly premium rates and actuarial rates together with
the corresponding percentages of Part B costs covered by the premium
rate. Estimated future premium amounts under the intermediate set
of assumptions appear in tables V.E2 and V.E3.
42For 2016 through 2021, under the intermediate assumptions, the standard premium
includes an additional amount ($3.00 through 2020 and $2.20 in 2021) to repay the
balance due resulting from a 2016 general revenue transfer to the Part B account of the
SMI trust fund, in accordance with the Bipartisan Budget Act of 2015. This additional
amount is not included in the determination of the matching rates and is not to be
matched by general revenue contributions.
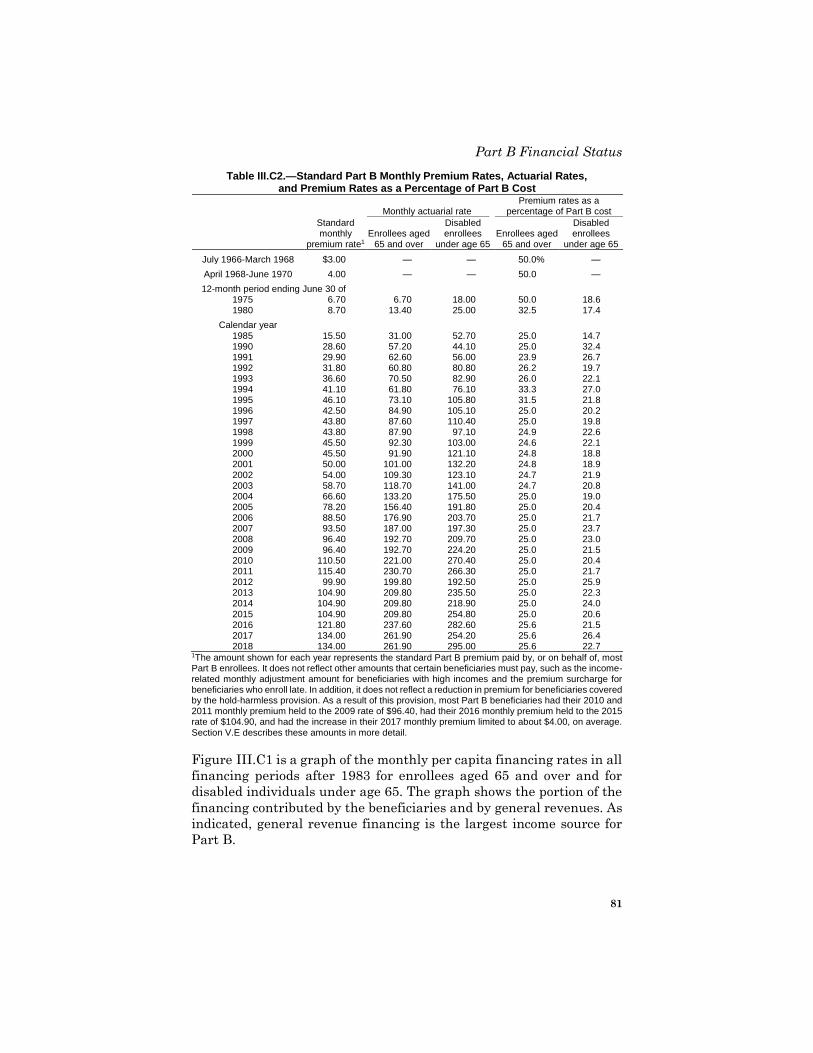
Part B Financial Status
81
Table III.C2.—Standard Part B Monthly Premium Rates, Actuarial Rates, and Premium Rates as a Percentage of Part B Cost
Monthly actuarial rate Premium rates as a
percentage of Part B cost
Standard monthly
premium rate1 Enrollees aged
65 and over
Disabled enrollees
under age 65 Enrollees aged
65 and over
Disabled enrollees
under age 65
July 1966-March 1968 $3.00 — — 50.0% —
April 1968-June 1970 4.00 — — 50.0 —
12-month period ending June 30 of 1975 6.70 6.70 18.00 50.0 18.6 1980 8.70 13.40 25.00 32.5 17.4
Calendar year 1985 15.50 31.00 52.70 25.0 14.7 1990 28.60 57.20 44.10 25.0 32.4 1991 29.90 62.60 56.00 23.9 26.7 1992 31.80 60.80 80.80 26.2 19.7 1993 36.60 70.50 82.90 26.0 22.1 1994 41.10 61.80 76.10 33.3 27.0 1995 46.10 73.10 105.80 31.5 21.8 1996 42.50 84.90 105.10 25.0 20.2 1997 43.80 87.60 110.40 25.0 19.8 1998 43.80 87.90 97.10 24.9 22.6 1999 45.50 92.30 103.00 24.6 22.1 2000 45.50 91.90 121.10 24.8 18.8 2001 50.00 101.00 132.20 24.8 18.9 2002 54.00 109.30 123.10 24.7 21.9 2003 58.70 118.70 141.00 24.7 20.8 2004 66.60 133.20 175.50 25.0 19.0 2005 78.20 156.40 191.80 25.0 20.4 2006 88.50 176.90 203.70 25.0 21.7 2007 93.50 187.00 197.30 25.0 23.7 2008 96.40 192.70 209.70 25.0 23.0 2009 96.40 192.70 224.20 25.0 21.5 2010 110.50 221.00 270.40 25.0 20.4 2011 115.40 230.70 266.30 25.0 21.7 2012 99.90 199.80 192.50 25.0 25.9 2013 104.90 209.80 235.50 25.0 22.3 2014 104.90 209.80 218.90 25.0 24.0 2015 104.90 209.80 254.80 25.0 20.6 2016 121.80 237.60 282.60 25.6 21.5 2017 134.00 261.90 254.20 25.6 26.4 2018 134.00 261.90 295.00 25.6 22.7
1The amount shown for each year represents the standard Part B premium paid by, or on behalf of, most Part B enrollees. It does not reflect other amounts that certain beneficiaries must pay, such as the income-related monthly adjustment amount for beneficiaries with high incomes and the premium surcharge for beneficiaries who enroll late. In addition, it does not reflect a reduction in premium for beneficiaries covered by the hold-harmless provision. As a result of this provision, most Part B beneficiaries had their 2010 and 2011 monthly premium held to the 2009 rate of $96.40, had their 2016 monthly premium held to the 2015 rate of $104.90, and had the increase in their 2017 monthly premium limited to about $4.00, on average. Section V.E describes these amounts in more detail.
Figure III.C1 is a graph of the monthly per capita financing rates in all
financing periods after 1983 for enrollees aged 65 and over and for
disabled individuals under age 65. The graph shows the portion of the
financing contributed by the beneficiaries and by general revenues. As
indicated, general revenue financing is the largest income source for
Part B.
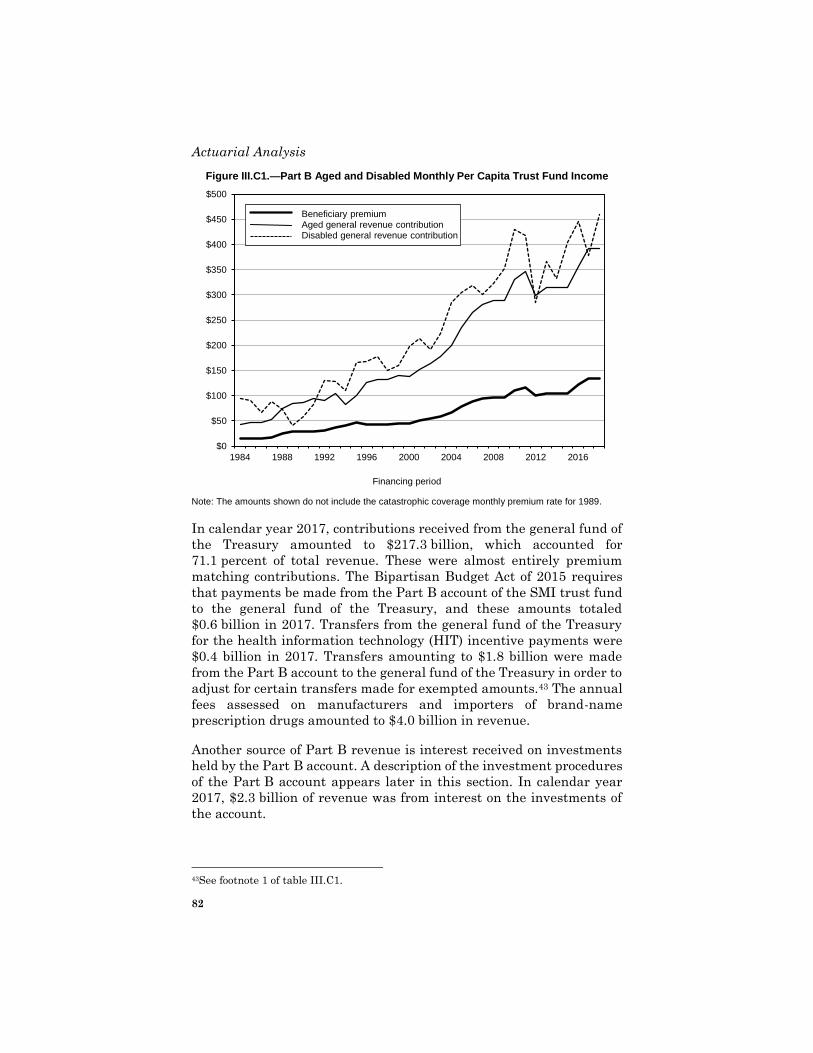
Actuarial Analysis
82
Figure III.C1.—Part B Aged and Disabled Monthly Per Capita Trust Fund Income
$0
$50
$100
$150
$200
$250
$300
$350
$400
$450
$500
1984 1988 1992 1996 2000 2004 2008 2012 2016
Beneficiary premiumAged general revenue contributionDisabled general revenue contribution
Financing period
Note: The amounts shown do not include the catastrophic coverage monthly premium rate for 1989.
In calendar year 2017, contributions received from the general fund of
the Treasury amounted to $217.3 billion, which accounted for
71.1 percent of total revenue. These were almost entirely premium
matching contributions. The Bipartisan Budget Act of 2015 requires
that payments be made from the Part B account of the SMI trust fund
to the general fund of the Treasury, and these amounts totaled
$0.6 billion in 2017. Transfers from the general fund of the Treasury
for the health information technology (HIT) incentive payments were
$0.4 billion in 2017. Transfers amounting to $1.8 billion were made
from the Part B account to the general fund of the Treasury in order to
adjust for certain transfers made for exempted amounts.43 The annual
fees assessed on manufacturers and importers of brand-name
prescription drugs amounted to $4.0 billion in revenue.
Another source of Part B revenue is interest received on investments
held by the Part B account. A description of the investment procedures
of the Part B account appears later in this section. In calendar year
2017, $2.3 billion of revenue was from interest on the investments of
the account.
43See footnote 1 of table III.C1.
Part B Financial Status
83
The Department of the Treasury may accept and deposit in the Part B
account unconditional money gifts or bequests made for the benefit of
the fund. The Part B account received contributions in the amount of
$7 million in calendar year 2017.
b. Expenditures
The account pays expenditures for Part B benefit payments and
administrative expenses. All expenses incurred by the Department of
Health and Human Services, the Social Security Administration, and
the Department of the Treasury in administering Part B are charged
to the account. Such administrative duties include payment of benefits,
fraud and abuse control activities, and experiments and demonstration
projects designed to determine various methods of increasing efficiency
and economy in providing health care services while maintaining the
quality of these services.
In addition, Congress has authorized expenditures from the trust
funds for construction, rental and lease, or purchase contracts of office
buildings and related facilities for use in connection with the
administration of Part B. The account expenditures include such costs.
The net worth of facilities and other fixed capital assets, however, does
not appear in the statement of Part B assets presented in this report,
since the value of fixed capital assets does not represent funds
available for benefit or administrative expenditures and is not,
therefore, pertinent in assessing the actuarial status of the funds.
Of total Part B expenditures, $308.6 billion represented net benefits
paid from the account for health services.44 Net benefits increased
6.6 percent over the corresponding amount of $289.5 billion paid
during the preceding calendar year. This spending growth reflects the
net change in both the number of beneficiaries and the price, volume,
and intensity of services. Additional information on Part B benefits by
type of service is available in section IV.B1.
The remaining $5.0 billion of expenditures was for administrative
expenses and represented 1.6 percent of total Part B expenditures in
2017. Administrative expenses are shown on a net basis, after
adjustments to the preliminary allocation of such costs among the
Social Security and Medicare trust funds and the general fund of the
44Net benefits equal the total gross amounts initially paid from the trust fund during the
year less recoveries of overpayments identified through fraud and abuse control
activities.
Actuarial Analysis
84
Treasury. The adjustments this year were larger than usual,
increasing these expenditures by $1.3 billion.
c. Actual experience versus prior estimates
Table III.C3 compares the actual experience in calendar year
2017 with the estimates presented in the 2016 and 2017 annual
reports. A number of factors can contribute to differences between
estimates and subsequent actual experience. In particular, actual
values for key economic and other variables can differ from assumed
levels, and lawmakers may adopt legislative and regulatory changes
after a report’s preparation. Table III.C3 indicates that actual Part B
benefit payments were similar to the estimate in the 2017 report and
slightly higher than estimated in the 2016 report. Actual premiums
and government contributions were slightly higher than estimated in
2017, while premiums were slightly lower than, and government
contributions close to, the estimates in 2016.
Table III.C3.—Comparison of Actual and Estimated Operations of the Part B Account in the SMI Trust Fund, Calendar Year 2017
[Dollar amounts in millions]
Comparison of actual experience with estimates for
calendar year 2017 published in:
2017 report 2016 report
Item Actual
amount Estimated amount1
Actual as a percentage of estimate
Estimated amount1
Actual as a percentage of estimate
Premiums from enrollees $81,522 $80,722 101% $83,222 98% Government contributions 217,253 215,463 101 216,364 100 Benefit payments2 308,639 309,668 100 306,288 101 1Under the intermediate assumptions. 2Benefit payments include additional premiums for Medicare Advantage plans that are deducted from beneficiaries’ Social Security benefits, costs of Quality Improvement Organizations, and health information technology payments.
d. Assets
The Department of the Treasury invests the portion of the Part B
account not needed to meet current expenditures for benefits and
administration in interest-bearing obligations of the U.S. Government.
The Social Security Act authorizes the issuance of special public-debt
obligations for purchase exclusively by the account. The law requires
that these special public-debt obligations shall bear interest at a rate
based on the average market yield (computed on the basis of market
quotations as of the end of the calendar month immediately preceding
the date of such issue) for all marketable interest-bearing obligations
of the United States forming a part of the public debt that are not due
or callable until after 4 years from the end of that month. Since the
inception of the SMI trust fund, the Department of the Treasury has
Part B Financial Status
85
always invested the assets in special public-debt obligations.45
Table V.H10, presented in section V.H, shows the assets of the SMI
trust fund (Parts B and D) at the end of fiscal years 2016 and 2017.
2. 10-Year Actuarial Estimates (2018-2027)
Section III.C2 provides detailed information concerning the short-
range financial status of the Part B account, including projected
annual income, outgo, differences between income and outgo, and trust
fund balances. The bases of the projected future operations of the
Part B account are the Trustees’ economic and demographic
assumptions, as detailed in the OASDI Trustees Report, as well as
other assumptions unique to Part B. Section IV.B1 presents an
explanation of the effects of these assumptions on the estimates in this
report. The Trustees also assume that financing for future periods will
be determined according to the statutory provisions described in
section III.C1a, although Part B financing rates have been set only
through December 31, 2018.
In 2018 the monthly Part B premium rate is $134.00, which is the same
as the 2017 monthly premium. For determining an individual’s
monthly premium rate, there is a hold-harmless provision in the law
that limits the dollar increase in the premium to the dollar increase in
an individual’s Social Security benefit. This provision applies to most
beneficiaries who have their premiums deducted from their Social
Security benefits, or roughly 70 percent of Part B enrollees.46 Because
the cost-of-living adjustment (COLA) for Social Security benefits was
0.3 percent for 2017, the average monthly premium paid in 2017 was
limited to $109, rather than the full premium of $134, for those
beneficiaries to whom the provision applied in 2016 and 2017. For
2018, these same beneficiaries will pay an average premium of $130
because the Social Security COLA is larger (2.0 percent). In other
words, even though the 2018 premium of $134.00 is the same as the
2017 premium, beneficiaries who were held harmless in 2017 will pay
a higher premium in 2018 than they paid in 2017 because of the hold-
harmless provision.
45The Department of the Treasury may also make investments in obligations guaranteed
as to both principal and interest by the United States, including certain federally
sponsored agency obligations. 46About 30 percent of Part B enrollees are not eligible for the hold-harmless provision.
This group consists of new enrollees during the year, enrollees who do not receive Social
Security benefit checks, enrollees with high incomes who are subject to the income-
related premium adjustment, and dual Medicare-Medicaid beneficiaries (whose
premiums are paid by State Medicaid programs).
Actuarial Analysis
86
In 2016, the COLA for Social Security benefits was 0 percent, and
premiums did not increase from the 2015 level for beneficiaries to
whom the hold-harmless provision applies. Without the Bipartisan
Budget Act of 2015 (BBA 2015), Part B premiums for other
beneficiaries would have been raised substantially to offset premiums
forgone as a result of the hold-harmless provision. However, BBA 2015
specified that the Part B premium for 2016 be determined as if the
hold-harmless provision did not apply and that a transfer be made from
the general fund of the Treasury to the Part B account of the SMI trust
fund in the amount of the estimated forgone premiums (and that the
transfer be treated as premiums for matching purposes).
BBA 2015 further requires that, starting in 2016, the Part B premium
otherwise determined be increased by $3.00, which is to be collected
and repaid to the general fund of the Treasury. The additional
repayment premium amounts will continue until the balance due
(defined in BBA 2015 as the transfer to the Part B account from the
general fund plus forgone income-related premiums) has been repaid.47
The 2018 premium of $134.00 includes $3.00 for this purpose.
The initial amount transferred to the Part B account in 2016, including
the estimated forgone income-related premiums, was $9.1 billion. The
balance due on January 1, 2017 was $8.4 billion, and on January 1,
2018 it was $7.6 billion. The Trustees estimate that the full amount
will be repaid by December 31, 2021.
MACRA and the Bipartisan Budget Act of 2018 specified physician
payment updates for every future year. The physician payment update
will be 0.5 percent for 2018 and 0.25 percent for 2019. For 2020 through
2025, the update will be 0.0 percent. Additional payments of
$500 million per year for physicians in the merit-based incentive
payment system and 5-percent annual bonuses for those in advanced
alternative payment models (advanced APMs) are payable in 2019
through 2025. For 2026 and later, there will be two payment rates: for
providers paid through an advanced APM, payment rates will be
increased by 0.75 percent each year, while payment rates for all other
providers will be increased each year by 0.25 percent. The income,
expenditures, and assets for Part B reflect these provisions.
Projected Part B expenditures are further affected by the sequestration
of Medicare expenditures required by current law. The sequestration
reduces benefit payments by 2 percent from April 1, 2013 through
47In the final repayment year, the additional amount may be less than $3.00 in order to
avoid overpayments.
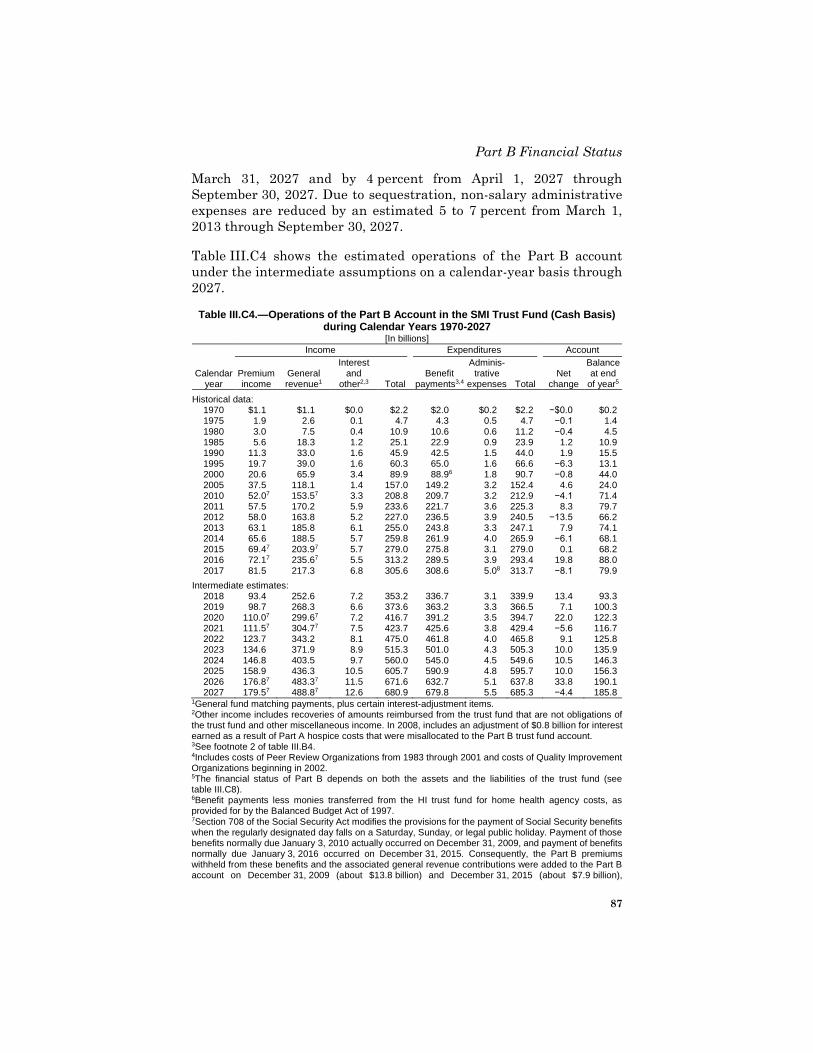
Part B Financial Status
87
March 31, 2027 and by 4 percent from April 1, 2027 through
September 30, 2027. Due to sequestration, non-salary administrative
expenses are reduced by an estimated 5 to 7 percent from March 1,
2013 through September 30, 2027.
Table III.C4 shows the estimated operations of the Part B account
under the intermediate assumptions on a calendar-year basis through
2027.
Table III.C4.—Operations of the Part B Account in the SMI Trust Fund (Cash Basis) during Calendar Years 1970-2027
[In billions]
Income Expenditures Account
Calendar year
Premium income
General revenue1
Interest and
other2,3 Total Benefit
payments3,4
Adminis-trative
expenses Total Net
change
Balance at end
of year5
Historical data: 1970 $1.1 $1.1 $0.0 $2.2 $2.0 $0.2 $2.2 −$0.0 $0.2 1975 1.9 2.6 0.1 4.7 4.3 0.5 4.7 −0.1 1.4 1980 3.0 7.5 0.4 10.9 10.6 0.6 11.2 −0.4 4.5 1985 5.6 18.3 1.2 25.1 22.9 0.9 23.9 1.2 10.9 1990 11.3 33.0 1.6 45.9 42.5 1.5 44.0 1.9 15.5 1995 19.7 39.0 1.6 60.3 65.0 1.6 66.6 −6.3 13.1 2000 20.6 65.9 3.4 89.9 88.9 6 1.8 90.7 −0.8 44.0 2005 37.5 118.1 1.4 157.0 149.2 3.2 152.4 4.6 24.0 2010 52.0 7 153.5 7 3.3 208.8 209.7 3.2 212.9 −4.1 71.4 2011 57.5 170.2 5.9 233.6 221.7 3.6 225.3 8.3 79.7 2012 58.0 163.8 5.2 227.0 236.5 3.9 240.5 −13.5 66.2 2013 63.1 185.8 6.1 255.0 243.8 3.3 247.1 7.9 74.1 2014 65.6 188.5 5.7 259.8 261.9 4.0 265.9 −6.1 68.1 2015 69.4 7 203.9 7 5.7 279.0 275.8 3.1 279.0 0.1 68.2 2016 72.1 7 235.6 7 5.5 313.2 289.5 3.9 293.4 19.8 88.0 2017 81.5 217.3 6.8 305.6 308.6 5.0 8 313.7 −8.1 79.9
Intermediate estimates: 2018 93.4 252.6 7.2 353.2 336.7 3.1 339.9 13.4 93.3 2019 98.7 268.3 6.6 373.6 363.2 3.3 366.5 7.1 100.3 2020 110.0 7 299.6 7 7.2 416.7 391.2 3.5 394.7 22.0 122.3 2021 111.5 7 304.7 7 7.5 423.7 425.6 3.8 429.4 −5.6 116.7 2022 123.7 343.2 8.1 475.0 461.8 4.0 465.8 9.1 125.8 2023 134.6 371.9 8.9 515.3 501.0 4.3 505.3 10.0 135.9 2024 146.8 403.5 9.7 560.0 545.0 4.5 549.6 10.5 146.3 2025 158.9 436.3 10.5 605.7 590.9 4.8 595.7 10.0 156.3 2026 176.8 7 483.3 7 11.5 671.6 632.7 5.1 637.8 33.8 190.1 2027 179.5 7 488.8 7 12.6 680.9 679.8 5.5 685.3 −4.4 185.8
1General fund matching payments, plus certain interest-adjustment items. 2Other income includes recoveries of amounts reimbursed from the trust fund that are not obligations of the trust fund and other miscellaneous income. In 2008, includes an adjustment of $0.8 billion for interest earned as a result of Part A hospice costs that were misallocated to the Part B trust fund account. 3See footnote 2 of table III.B4. 4Includes costs of Peer Review Organizations from 1983 through 2001 and costs of Quality Improvement Organizations beginning in 2002. 5The financial status of Part B depends on both the assets and the liabilities of the trust fund (see table III.C8). 6Benefit payments less monies transferred from the HI trust fund for home health agency costs, as provided for by the Balanced Budget Act of 1997. 7Section 708 of the Social Security Act modifies the provisions for the payment of Social Security benefits when the regularly designated day falls on a Saturday, Sunday, or legal public holiday. Payment of those benefits normally due January 3, 2010 actually occurred on December 31, 2009, and payment of benefits normally due January 3, 2016 occurred on December 31, 2015. Consequently, the Part B premiums withheld from these benefits and the associated general revenue contributions were added to the Part B account on December 31, 2009 (about $13.8 billion) and December 31, 2015 (about $7.9 billion),
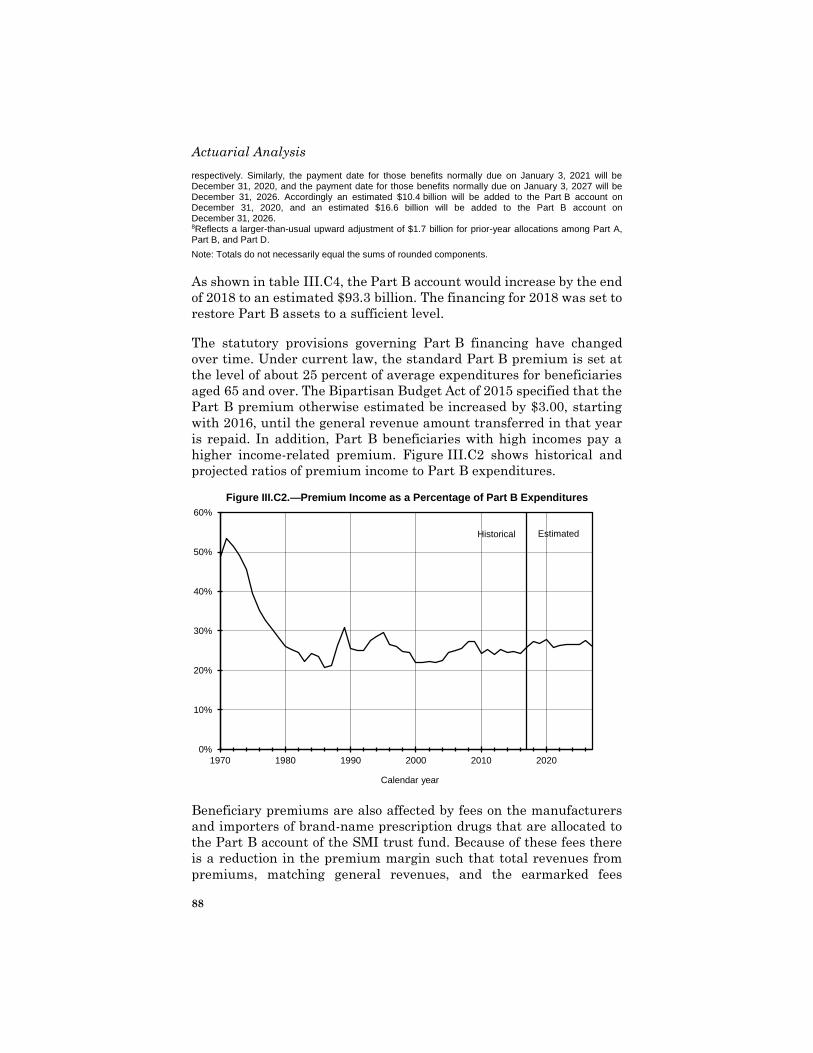
Actuarial Analysis
88
respectively. Similarly, the payment date for those benefits normally due on January 3, 2021 will be December 31, 2020, and the payment date for those benefits normally due on January 3, 2027 will be December 31, 2026. Accordingly an estimated $10.4 billion will be added to the Part B account on December 31, 2020, and an estimated $16.6 billion will be added to the Part B account on December 31, 2026. 8Reflects a larger-than-usual upward adjustment of $1.7 billion for prior-year allocations among Part A, Part B, and Part D.
Note: Totals do not necessarily equal the sums of rounded components.
As shown in table III.C4, the Part B account would increase by the end
of 2018 to an estimated $93.3 billion. The financing for 2018 was set to
restore Part B assets to a sufficient level.
The statutory provisions governing Part B financing have changed
over time. Under current law, the standard Part B premium is set at
the level of about 25 percent of average expenditures for beneficiaries
aged 65 and over. The Bipartisan Budget Act of 2015 specified that the
Part B premium otherwise estimated be increased by $3.00, starting
with 2016, until the general revenue amount transferred in that year
is repaid. In addition, Part B beneficiaries with high incomes pay a
higher income-related premium. Figure III.C2 shows historical and
projected ratios of premium income to Part B expenditures.
Figure III.C2.—Premium Income as a Percentage of Part B Expenditures
0%
10%
20%
30%
40%
50%
60%
1970 1980 1990 2000 2010 2020
Calendar year
Historical Estimated
Beneficiary premiums are also affected by fees on the manufacturers
and importers of brand-name prescription drugs that are allocated to
the Part B account of the SMI trust fund. Because of these fees there
is a reduction in the premium margin such that total revenues from
premiums, matching general revenues, and the earmarked fees
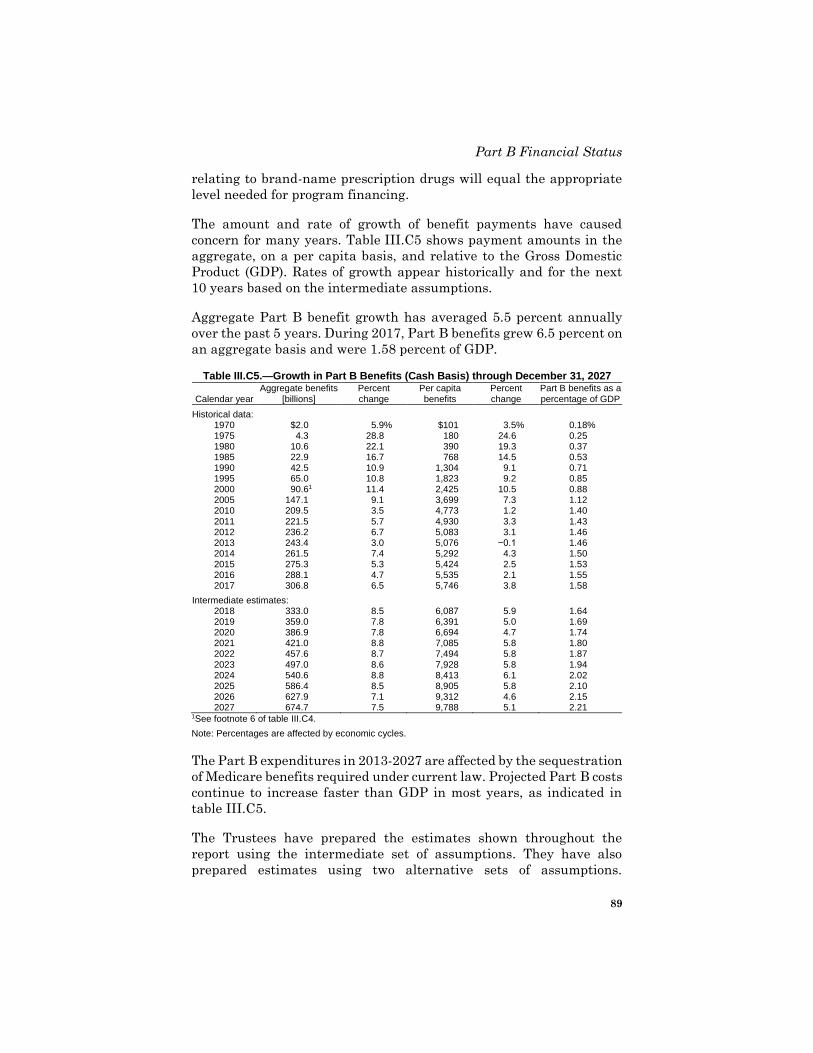
Part B Financial Status
89
relating to brand-name prescription drugs will equal the appropriate
level needed for program financing.
The amount and rate of growth of benefit payments have caused
concern for many years. Table III.C5 shows payment amounts in the
aggregate, on a per capita basis, and relative to the Gross Domestic
Product (GDP). Rates of growth appear historically and for the next
10 years based on the intermediate assumptions.
Aggregate Part B benefit growth has averaged 5.5 percent annually
over the past 5 years. During 2017, Part B benefits grew 6.5 percent on
an aggregate basis and were 1.58 percent of GDP.
Table III.C5.—Growth in Part B Benefits (Cash Basis) through December 31, 2027
Calendar year Aggregate benefits
[billions] Percent change
Per capita benefits
Percent change
Part B benefits as a percentage of GDP
Historical data: 1970 $2.0 5.9 % $101 3.5 % 0.18 % 1975 4.3 28.8 180 24.6 0.25 1980 10.6 22.1 390 19.3 0.37 1985 22.9 16.7 768 14.5 0.53 1990 42.5 10.9 1,304 9.1 0.71 1995 65.0 10.8 1,823 9.2 0.85 2000 90.6 1 11.4 2,425 10.5 0.88 2005 147.1 9.1 3,699 7.3 1.12 2010 209.5 3.5 4,773 1.2 1.40 2011 221.5 5.7 4,930 3.3 1.43 2012 236.2 6.7 5,083 3.1 1.46 2013 243.4 3.0 5,076 −0.1 1.46 2014 261.5 7.4 5,292 4.3 1.50 2015 275.3 5.3 5,424 2.5 1.53 2016 288.1 4.7 5,535 2.1 1.55 2017 306.8 6.5 5,746 3.8 1.58
Intermediate estimates: 2018 333.0 8.5 6,087 5.9 1.64 2019 359.0 7.8 6,391 5.0 1.69 2020 386.9 7.8 6,694 4.7 1.74 2021 421.0 8.8 7,085 5.8 1.80 2022 457.6 8.7 7,494 5.8 1.87 2023 497.0 8.6 7,928 5.8 1.94 2024 540.6 8.8 8,413 6.1 2.02 2025 586.4 8.5 8,905 5.8 2.10 2026 627.9 7.1 9,312 4.6 2.15 2027 674.7 7.5 9,788 5.1 2.21
1See footnote 6 of table III.C4.
Note: Percentages are affected by economic cycles.
The Part B expenditures in 2013-2027 are affected by the sequestration
of Medicare benefits required under current law. Projected Part B costs
continue to increase faster than GDP in most years, as indicated in
table III.C5.
The Trustees have prepared the estimates shown throughout the
report using the intermediate set of assumptions. They have also
prepared estimates using two alternative sets of assumptions.
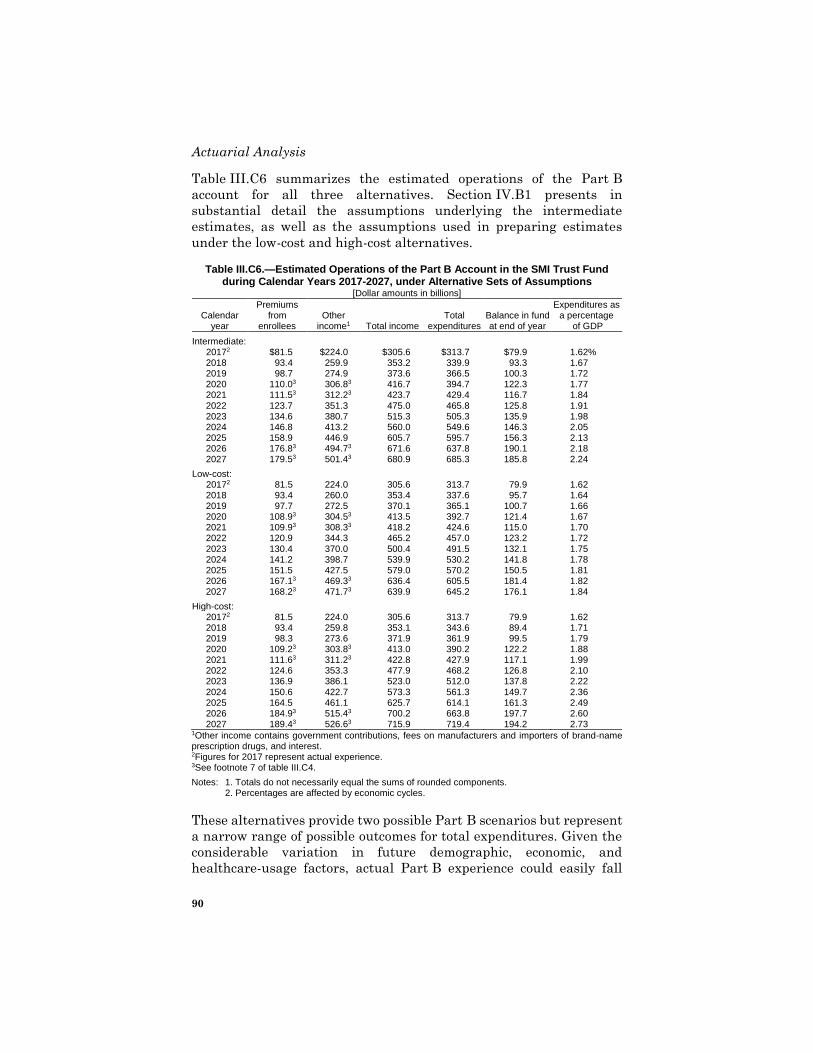
Actuarial Analysis
90
Table III.C6 summarizes the estimated operations of the Part B
account for all three alternatives. Section IV.B1 presents in
substantial detail the assumptions underlying the intermediate
estimates, as well as the assumptions used in preparing estimates
under the low-cost and high-cost alternatives.
Table III.C6.—Estimated Operations of the Part B Account in the SMI Trust Fund during Calendar Years 2017-2027, under Alternative Sets of Assumptions
[Dollar amounts in billions]
Calendar year
Premiums from
enrollees Other
income1 Total income Total
expenditures Balance in fund at end of year
Expenditures as a percentage
of GDP
Intermediate: 2017 2 $81.5 $224.0 $305.6 $313.7 $79.9 1.62 % 2018 93.4 259.9 353.2 339.9 93.3 1.67 2019 98.7 274.9 373.6 366.5 100.3 1.72 2020 110.0 3 306.8 3 416.7 394.7 122.3 1.77 2021 111.5 3 312.2 3 423.7 429.4 116.7 1.84 2022 123.7 351.3 475.0 465.8 125.8 1.91 2023 134.6 380.7 515.3 505.3 135.9 1.98 2024 146.8 413.2 560.0 549.6 146.3 2.05 2025 158.9 446.9 605.7 595.7 156.3 2.13 2026 176.8 3 494.7 3 671.6 637.8 190.1 2.18 2027 179.5 3 501.4 3 680.9 685.3 185.8 2.24
Low-cost: 2017 2 81.5 224.0 305.6 313.7 79.9 1.62 2018 93.4 260.0 353.4 337.6 95.7 1.64 2019 97.7 272.5 370.1 365.1 100.7 1.66 2020 108.9 3 304.5 3 413.5 392.7 121.4 1.67 2021 109.9 3 308.3 3 418.2 424.6 115.0 1.70 2022 120.9 344.3 465.2 457.0 123.2 1.72 2023 130.4 370.0 500.4 491.5 132.1 1.75 2024 141.2 398.7 539.9 530.2 141.8 1.78 2025 151.5 427.5 579.0 570.2 150.5 1.81 2026 167.1 3 469.3 3 636.4 605.5 181.4 1.82 2027 168.2 3 471.7 3 639.9 645.2 176.1 1.84
High-cost: 2017 2 81.5 224.0 305.6 313.7 79.9 1.62 2018 93.4 259.8 353.1 343.6 89.4 1.71 2019 98.3 273.6 371.9 361.9 99.5 1.79 2020 109.2 3 303.8 3 413.0 390.2 122.2 1.88 2021 111.6 3 311.2 3 422.8 427.9 117.1 1.99 2022 124.6 353.3 477.9 468.2 126.8 2.10 2023 136.9 386.1 523.0 512.0 137.8 2.22 2024 150.6 422.7 573.3 561.3 149.7 2.36 2025 164.5 461.1 625.7 614.1 161.3 2.49 2026 184.9 3 515.4 3 700.2 663.8 197.7 2.60 2027 189.4 3 526.6 3 715.9 719.4 194.2 2.73
1Other income contains government contributions, fees on manufacturers and importers of brand-name prescription drugs, and interest. 2Figures for 2017 represent actual experience. 3See footnote 7 of table III.C4.
Notes: 1. Totals do not necessarily equal the sums of rounded components. 2. Percentages are affected by economic cycles.
These alternatives provide two possible Part B scenarios but represent
a narrow range of possible outcomes for total expenditures. Given the
considerable variation in future demographic, economic, and
healthcare-usage factors, actual Part B experience could easily fall
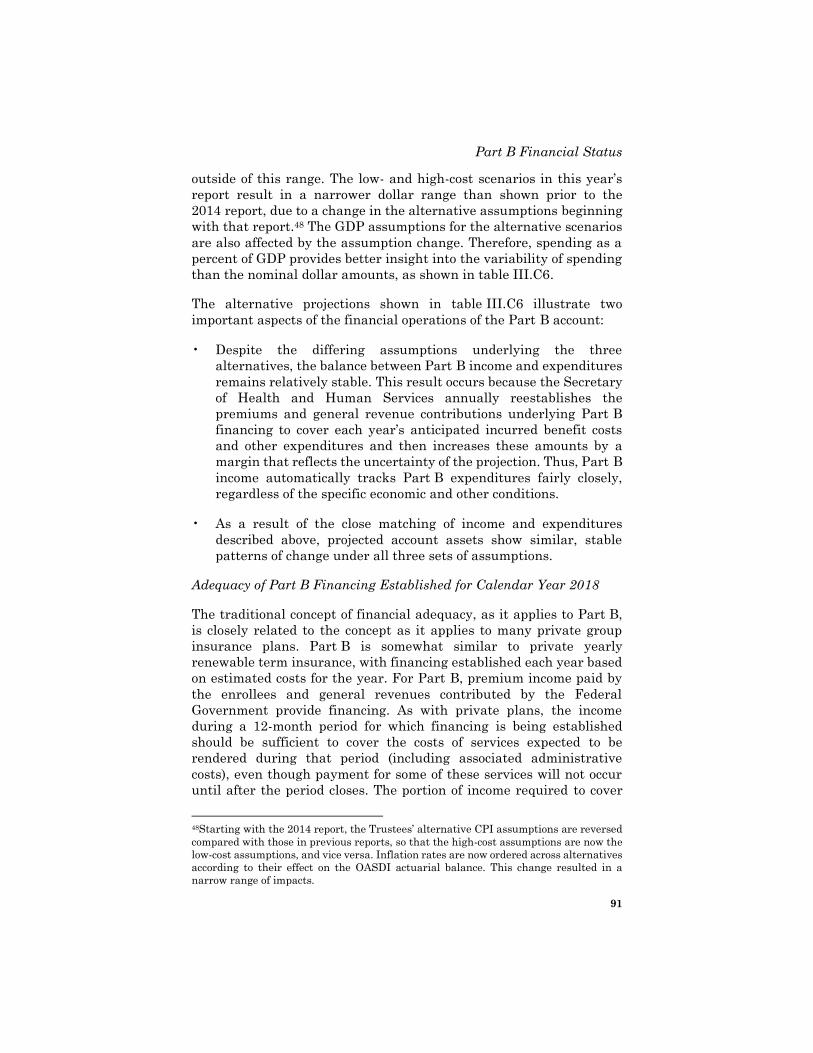
Part B Financial Status
91
outside of this range. The low- and high-cost scenarios in this year’s
report result in a narrower dollar range than shown prior to the
2014 report, due to a change in the alternative assumptions beginning
with that report.48 The GDP assumptions for the alternative scenarios
are also affected by the assumption change. Therefore, spending as a
percent of GDP provides better insight into the variability of spending
than the nominal dollar amounts, as shown in table III.C6.
The alternative projections shown in table III.C6 illustrate two
important aspects of the financial operations of the Part B account:
• Despite the differing assumptions underlying the three
alternatives, the balance between Part B income and expenditures
remains relatively stable. This result occurs because the Secretary
of Health and Human Services annually reestablishes the
premiums and general revenue contributions underlying Part B
financing to cover each year’s anticipated incurred benefit costs
and other expenditures and then increases these amounts by a
margin that reflects the uncertainty of the projection. Thus, Part B
income automatically tracks Part B expenditures fairly closely,
regardless of the specific economic and other conditions.
• As a result of the close matching of income and expenditures
described above, projected account assets show similar, stable
patterns of change under all three sets of assumptions.
Adequacy of Part B Financing Established for Calendar Year 2018
The traditional concept of financial adequacy, as it applies to Part B,
is closely related to the concept as it applies to many private group
insurance plans. Part B is somewhat similar to private yearly
renewable term insurance, with financing established each year based
on estimated costs for the year. For Part B, premium income paid by
the enrollees and general revenues contributed by the Federal
Government provide financing. As with private plans, the income
during a 12-month period for which financing is being established
should be sufficient to cover the costs of services expected to be
rendered during that period (including associated administrative
costs), even though payment for some of these services will not occur
until after the period closes. The portion of income required to cover
48Starting with the 2014 report, the Trustees’ alternative CPI assumptions are reversed
compared with those in previous reports, so that the high-cost assumptions are now the
low-cost assumptions, and vice versa. Inflation rates are now ordered across alternatives
according to their effect on the OASDI actuarial balance. This change resulted in a
narrow range of impacts.
Actuarial Analysis
92
those benefits not paid until after the end of the year is added to the
account; thus assets in the account at any time should not be less than
the costs of the benefits and the administrative expenses incurred but
not yet paid.
Since the Secretary of Health and Human Services establishes the
income per enrollee (premium plus government contribution)
prospectively each year, it is subject to projection error. Additionally,
legislation enacted after the financing has been established, but
effective for the period for which financing has been set, may affect
costs. Account assets, therefore, need to be maintained at a level that
is adequate to cover not only the value of incurred-but-unpaid expenses
but also a reasonable degree of variation between actual and projected
costs (in case actual costs exceed projected).
The Trustees traditionally evaluate the actuarial status or financial
adequacy of the Part B account over the period for which the enrollee
premium rates and level of general revenue financing have been
established. The primary tests are that (i) the assets and income for
years for which financing has been established should be sufficient to
meet the projected benefits and associated administrative expenses
incurred for that period; and (ii) the assets should be sufficient to cover
projected liabilities for benefits that have not yet been paid as of the
end of the period. If Part B does not meet these adequacy tests, it can
still continue to operate if the account remains at a level adequate to
permit the payment of claims as presented. However, to protect against
the possibility that costs will be higher than assumed, assets should be
sufficient to include contingency levels that cover a reasonable degree
of variation between actual and projected costs.
As noted above, the tests of financial adequacy for Part B rely on the
incurred experience of the account, including a liability for the costs of
services performed in a particular year but not yet paid in that year.
Table III.C7 shows the estimated transactions of the account on an
incurred basis. Readers should view the incurred experience as an
estimate, even for historical years.49
49Part B experience is substantially more difficult to determine on an incurred basis than
on a cash basis. For some services, reporting of payment occurs only on a cash basis, and
it is necessary to infer the incurred experience from the cash payment information.
Moreover, for recent time periods the tabulations of bills are incomplete due to normal
processing time lags.
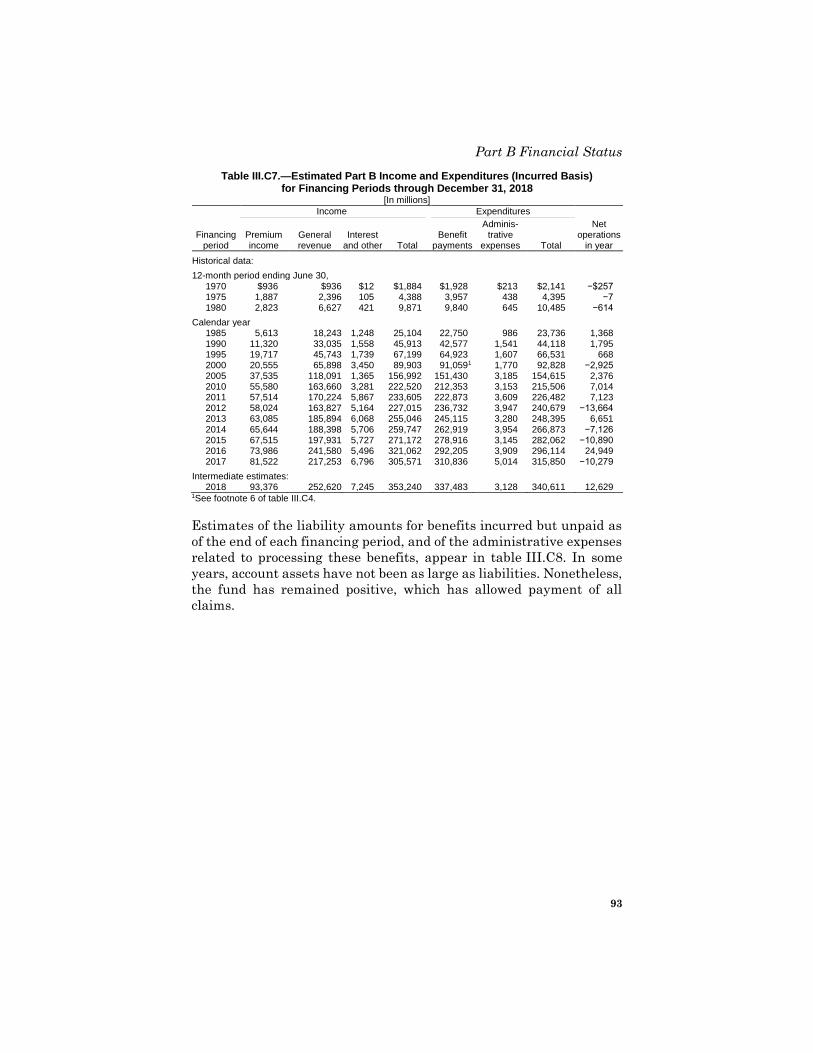
Part B Financial Status
93
Table III.C7.—Estimated Part B Income and Expenditures (Incurred Basis) for Financing Periods through December 31, 2018
[In millions]
Income Expenditures
Financing period
Premium income
General revenue
Interest and other Total
Benefit payments
Adminis-trative
expenses Total
Net operations
in year
Historical data:
12-month period ending June 30, 1970 $936 $936 $12 $1,884 $1,928 $213 $2,141 −$257 1975 1,887 2,396 105 4,388 3,957 438 4,395 −7 1980 2,823 6,627 421 9,871 9,840 645 10,485 −614
Calendar year 1985 5,613 18,243 1,248 25,104 22,750 986 23,736 1,368 1990 11,320 33,035 1,558 45,913 42,577 1,541 44,118 1,795 1995 19,717 45,743 1,739 67,199 64,923 1,607 66,531 668 2000 20,555 65,898 3,450 89,903 91,059 1 1,770 92,828 −2,925 2005 37,535 118,091 1,365 156,992 151,430 3,185 154,615 2,376 2010 55,580 163,660 3,281 222,520 212,353 3,153 215,506 7,014 2011 57,514 170,224 5,867 233,605 222,873 3,609 226,482 7,123 2012 58,024 163,827 5,164 227,015 236,732 3,947 240,679 −13,664 2013 63,085 185,894 6,068 255,046 245,115 3,280 248,395 6,651 2014 65,644 188,398 5,706 259,747 262,919 3,954 266,873 −7,126 2015 67,515 197,931 5,727 271,172 278,916 3,145 282,062 −10,890 2016 73,986 241,580 5,496 321,062 292,205 3,909 296,114 24,949 2017 81,522 217,253 6,796 305,571 310,836 5,014 315,850 −10,279
Intermediate estimates: 2018 93,376 252,620 7,245 353,240 337,483 3,128 340,611 12,629
1See footnote 6 of table III.C4.
Estimates of the liability amounts for benefits incurred but unpaid as
of the end of each financing period, and of the administrative expenses
related to processing these benefits, appear in table III.C8. In some
years, account assets have not been as large as liabilities. Nonetheless,
the fund has remained positive, which has allowed payment of all
claims.
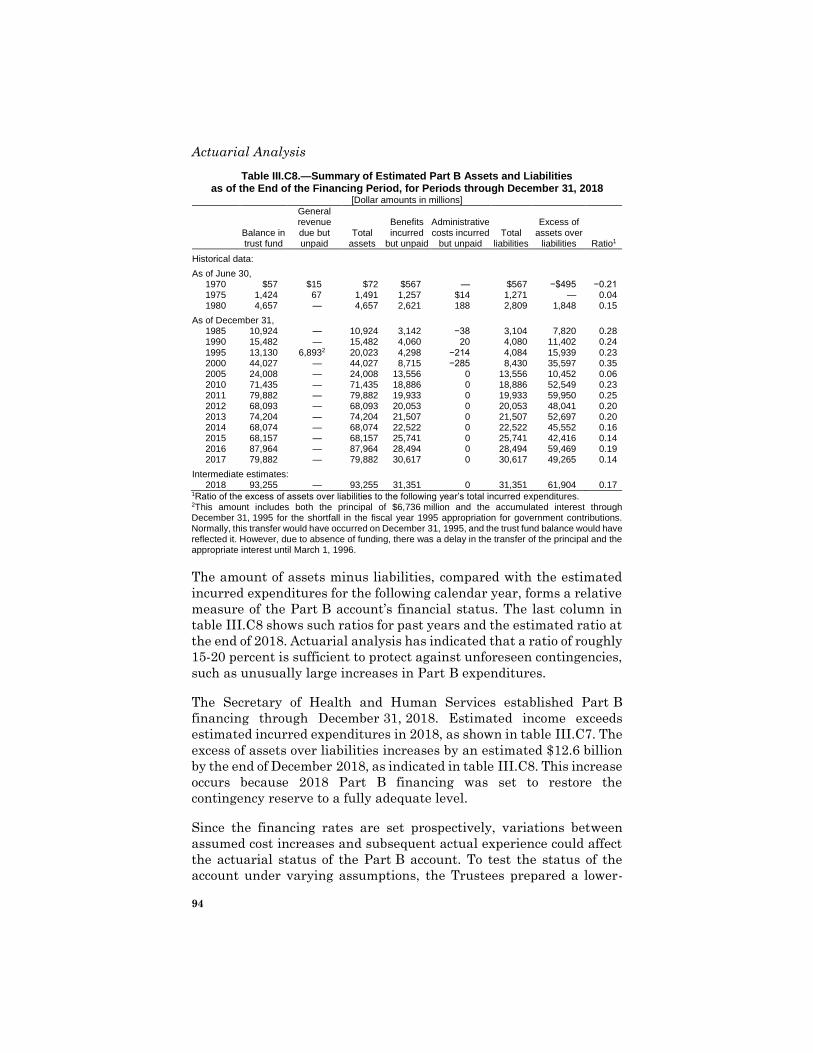
Actuarial Analysis
94
Table III.C8.—Summary of Estimated Part B Assets and Liabilities as of the End of the Financing Period, for Periods through December 31, 2018
[Dollar amounts in millions]
Balance in trust fund
General revenue due but unpaid
Total assets
Benefits incurred
but unpaid
Administrative costs incurred
but unpaid Total
liabilities
Excess of assets over
liabilities Ratio1
Historical data:
As of June 30, 1970 $57 $15 $72 $567 — $567 −$495 −0.21 1975 1,424 67 1,491 1,257 $14 1,271 — 0.04 1980 4,657 — 4,657 2,621 188 2,809 1,848 0.15
As of December 31, 1985 10,924 — 10,924 3,142 −38 3,104 7,820 0.28 1990 15,482 — 15,482 4,060 20 4,080 11,402 0.24
1995 13,130 6,893 2 20,023 4,298 −214 4,084 15,939 0.23 2000 44,027 — 44,027 8,715 −285 8,430 35,597 0.35 2005 24,008 — 24,008 13,556 0 13,556 10,452 0.06 2010 71,435 — 71,435 18,886 0 18,886 52,549 0.23 2011 79,882 — 79,882 19,933 0 19,933 59,950 0.25 2012 68,093 — 68,093 20,053 0 20,053 48,041 0.20 2013 74,204 — 74,204 21,507 0 21,507 52,697 0.20 2014 68,074 — 68,074 22,522 0 22,522 45,552 0.16 2015 68,157 — 68,157 25,741 0 25,741 42,416 0.14 2016 87,964 — 87,964 28,494 0 28,494 59,469 0.19 2017 79,882 — 79,882 30,617 0 30,617 49,265 0.14
Intermediate estimates: 2018 93,255 — 93,255 31,351 0 31,351 61,904 0.17
1Ratio of the excess of assets over liabilities to the following year’s total incurred expenditures. 2This amount includes both the principal of $6,736 million and the accumulated interest through December 31, 1995 for the shortfall in the fiscal year 1995 appropriation for government contributions. Normally, this transfer would have occurred on December 31, 1995, and the trust fund balance would have reflected it. However, due to absence of funding, there was a delay in the transfer of the principal and the appropriate interest until March 1, 1996.
The amount of assets minus liabilities, compared with the estimated
incurred expenditures for the following calendar year, forms a relative
measure of the Part B account’s financial status. The last column in
table III.C8 shows such ratios for past years and the estimated ratio at
the end of 2018. Actuarial analysis has indicated that a ratio of roughly
15-20 percent is sufficient to protect against unforeseen contingencies,
such as unusually large increases in Part B expenditures.
The Secretary of Health and Human Services established Part B
financing through December 31, 2018. Estimated income exceeds
estimated incurred expenditures in 2018, as shown in table III.C7. The
excess of assets over liabilities increases by an estimated $12.6 billion
by the end of December 2018, as indicated in table III.C8. This increase
occurs because 2018 Part B financing was set to restore the
contingency reserve to a fully adequate level.
Since the financing rates are set prospectively, variations between
assumed cost increases and subsequent actual experience could affect
the actuarial status of the Part B account. To test the status of the
account under varying assumptions, the Trustees prepared a lower-
Part B Financial Status
95
growth-range projection and an upper-growth-range projection by
varying the key assumptions for 2017 and 2018. These two alternative
sets of assumptions provide a range of financial outcomes within which
one might reasonably expect the actual experience of Part B to fall. The
Trustees determined the values for the lower- and upper-growth-range
assumptions from a statistical analysis of the historical variation in
the respective increase factors.
The methods underlying this sensitivity analysis are fundamentally
different from the methods underlying the low-cost and high-cost
projections discussed previously in this section. This sensitivity
analysis is based on stochastic modeling and is shown for the period for
which the financing has been established (through 2018 for this
report), whereas the low-cost and high-cost projections illustrate the
financial impact of slower or faster growth trends throughout the
entire short-range (10-year) projection period.
Table III.C9 indicates that, under the lower-growth-range scenario,
account assets would exceed liabilities at the end of December 2018 by
a margin equivalent to 22.6 percent of the following year’s incurred
expenditures. Under the upper-growth-range scenario, account assets
would still exceed liabilities, but by a margin of 12.0 percent of
incurred expenditures in 2018. Under the upper-growth-range
scenario, future financing rates would need to increase to provide a
fully adequate margin for adverse contingencies. Figure III.C3 shows
the reserve ratio for historical years and for 2018 under the three cost
growth scenarios.
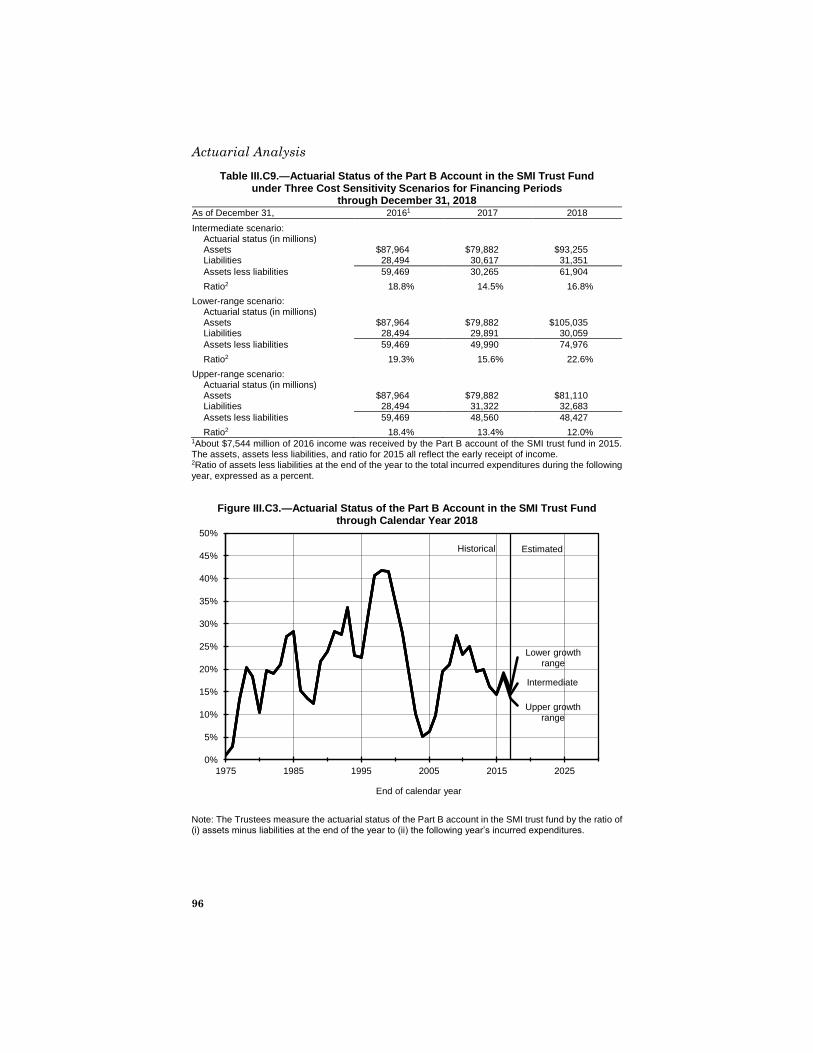
Actuarial Analysis
96
Table III.C9.—Actuarial Status of the Part B Account in the SMI Trust Fund under Three Cost Sensitivity Scenarios for Financing Periods
through December 31, 2018 As of December 31, 20161 2017 2018
Intermediate scenario: Actuarial status (in millions) Assets $87,964 $79,882 $93,255 Liabilities 28,494 30,617 31,351
Assets less liabilities 59,469 30,265 61,904
Ratio2 18.8% 14.5% 16.8%
Lower-range scenario: Actuarial status (in millions) Assets $87,964 $79,882 $105,035 Liabilities 28,494 29,891 30,059
Assets less liabilities 59,469 49,990 74,976
Ratio2 19.3% 15.6% 22.6%
Upper-range scenario: Actuarial status (in millions) Assets $87,964 $79,882 $81,110 Liabilities 28,494 31,322 32,683
Assets less liabilities 59,469 48,560 48,427
Ratio2 18.4% 13.4% 12.0% 1About $7,544 million of 2016 income was received by the Part B account of the SMI trust fund in 2015. The assets, assets less liabilities, and ratio for 2015 all reflect the early receipt of income. 2Ratio of assets less liabilities at the end of the year to the total incurred expenditures during the following year, expressed as a percent.
Figure III.C3.—Actuarial Status of the Part B Account in the SMI Trust Fund through Calendar Year 2018
0%
5%
10%
15%
20%
25%
30%
35%
40%
45%
50%
1975 1985 1995 2005 2015 2025
End of calendar year
Historical
Intermediate
Upper growthrange
Lower growthrange
Estimated
Note: The Trustees measure the actuarial status of the Part B account in the SMI trust fund by the ratio of (i) assets minus liabilities at the end of the year to (ii) the following year’s incurred expenditures.
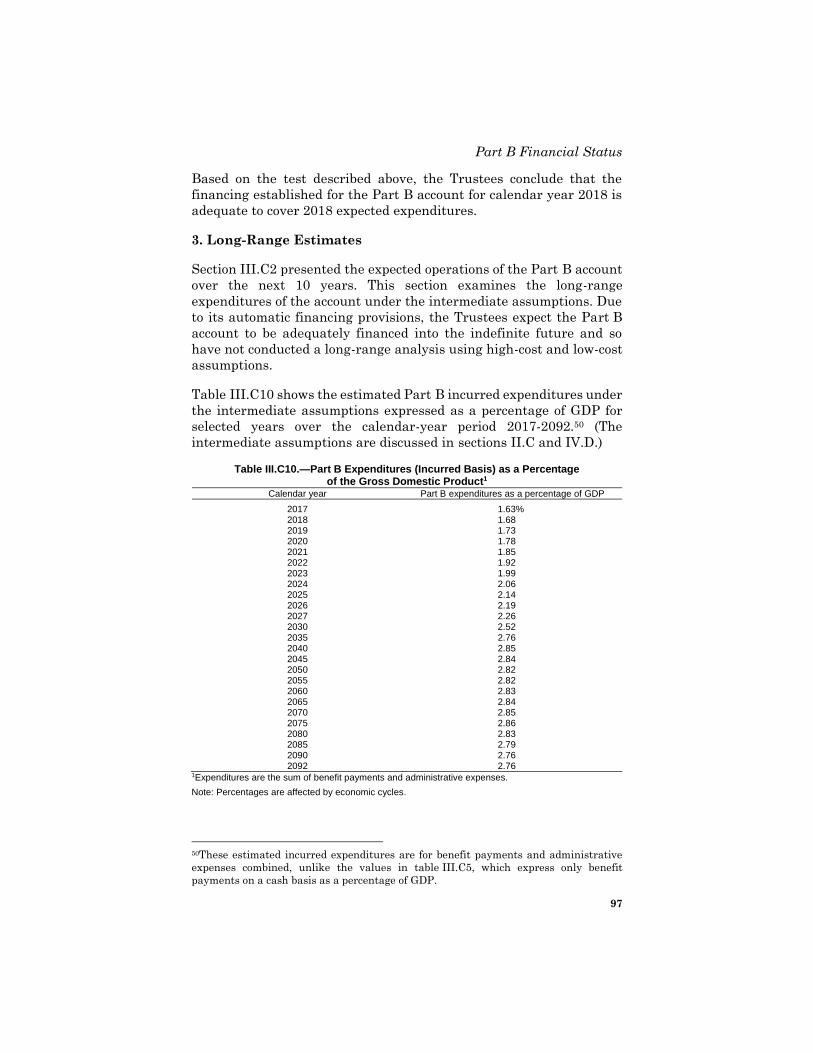
Part B Financial Status
97
Based on the test described above, the Trustees conclude that the
financing established for the Part B account for calendar year 2018 is
adequate to cover 2018 expected expenditures.
3. Long-Range Estimates
Section III.C2 presented the expected operations of the Part B account
over the next 10 years. This section examines the long-range
expenditures of the account under the intermediate assumptions. Due
to its automatic financing provisions, the Trustees expect the Part B
account to be adequately financed into the indefinite future and so
have not conducted a long-range analysis using high-cost and low-cost
assumptions.
Table III.C10 shows the estimated Part B incurred expenditures under
the intermediate assumptions expressed as a percentage of GDP for
selected years over the calendar-year period 2017-2092.50 (The
intermediate assumptions are discussed in sections II.C and IV.D.)
Table III.C10.—Part B Expenditures (Incurred Basis) as a Percentage of the Gross Domestic Product1
Calendar year Part B expenditures as a percentage of GDP
2017 1.63 % 2018 1.68 2019 1.73 2020 1.78 2021 1.85 2022 1.92 2023 1.99 2024 2.06 2025 2.14 2026 2.19 2027 2.26 2030 2.52 2035 2.76 2040 2.85 2045 2.84 2050 2.82 2055 2.82 2060 2.83 2065 2.84 2070 2.85 2075 2.86 2080 2.83 2085 2.79 2090 2.76 2092 2.76
1Expenditures are the sum of benefit payments and administrative expenses.
Note: Percentages are affected by economic cycles.
50These estimated incurred expenditures are for benefit payments and administrative
expenses combined, unlike the values in table III.C5, which express only benefit
payments on a cash basis as a percentage of GDP.
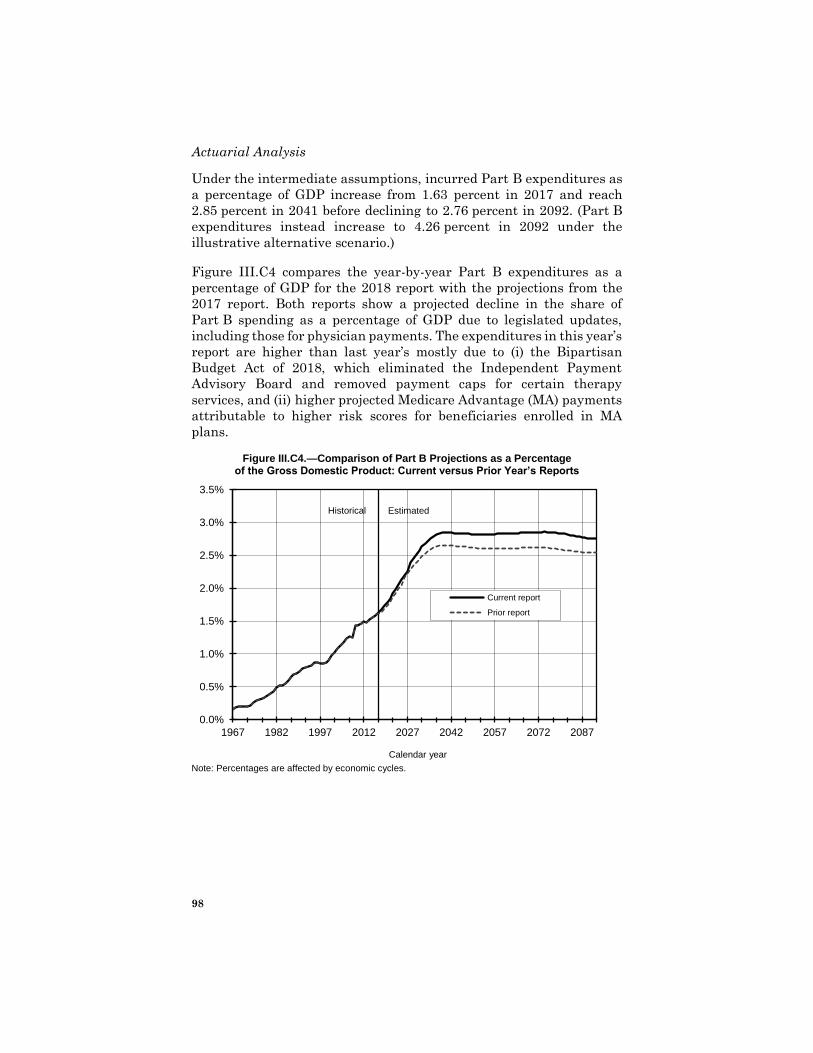
Actuarial Analysis
98
Under the intermediate assumptions, incurred Part B expenditures as
a percentage of GDP increase from 1.63 percent in 2017 and reach
2.85 percent in 2041 before declining to 2.76 percent in 2092. (Part B
expenditures instead increase to 4.26 percent in 2092 under the
illustrative alternative scenario.)
Figure III.C4 compares the year-by-year Part B expenditures as a
percentage of GDP for the 2018 report with the projections from the
2017 report. Both reports show a projected decline in the share of
Part B spending as a percentage of GDP due to legislated updates,
including those for physician payments. The expenditures in this year’s
report are higher than last year’s mostly due to (i) the Bipartisan
Budget Act of 2018, which eliminated the Independent Payment
Advisory Board and removed payment caps for certain therapy
services, and (ii) higher projected Medicare Advantage (MA) payments
attributable to higher risk scores for beneficiaries enrolled in MA
plans.
Figure III.C4.—Comparison of Part B Projections as a Percentage of the Gross Domestic Product: Current versus Prior Year’s Reports
0.0%
0.5%
1.0%
1.5%
2.0%
2.5%
3.0%
3.5%
1967 1982 1997 2012 2027 2042 2057 2072 2087
Calendar year
Current report
Prior report
Historical Estimated
Note: Percentages are affected by economic cycles.
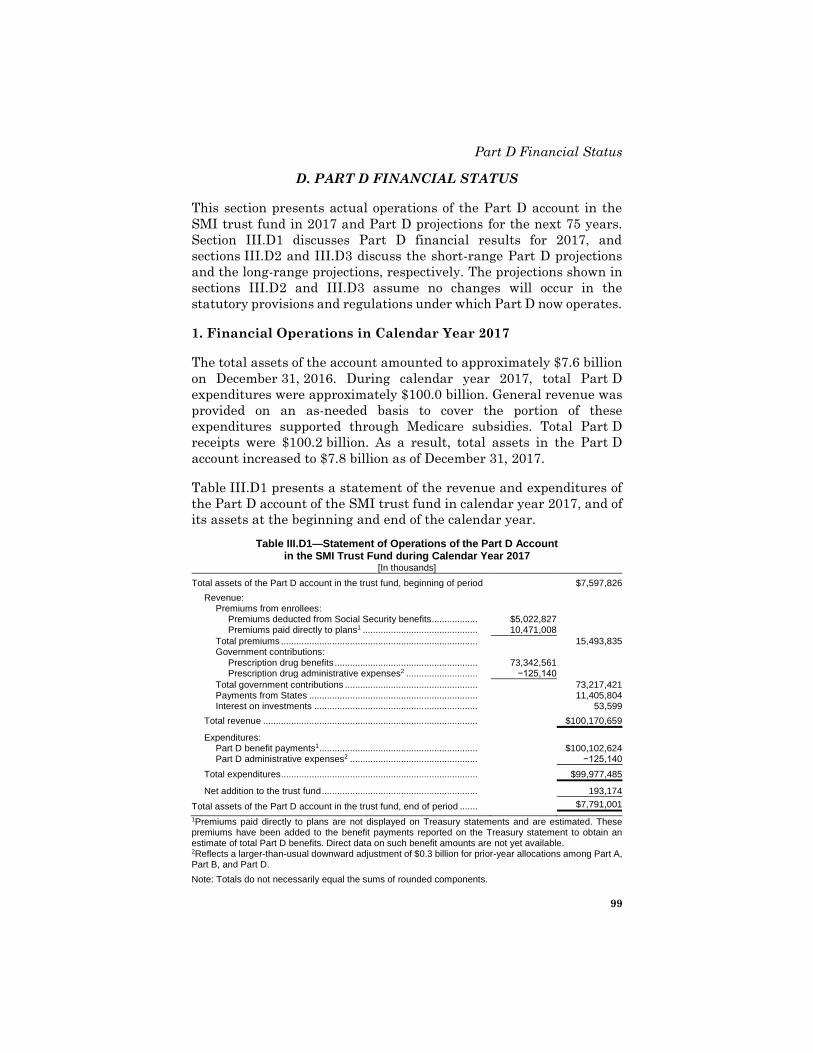
Part D Financial Status
99
D. PART D FINANCIAL STATUS
This section presents actual operations of the Part D account in the
SMI trust fund in 2017 and Part D projections for the next 75 years.
Section III.D1 discusses Part D financial results for 2017, and
sections III.D2 and III.D3 discuss the short-range Part D projections
and the long-range projections, respectively. The projections shown in
sections III.D2 and III.D3 assume no changes will occur in the
statutory provisions and regulations under which Part D now operates.
1. Financial Operations in Calendar Year 2017
The total assets of the account amounted to approximately $7.6 billion
on December 31, 2016. During calendar year 2017, total Part D
expenditures were approximately $100.0 billion. General revenue was
provided on an as-needed basis to cover the portion of these
expenditures supported through Medicare subsidies. Total Part D
receipts were $100.2 billion. As a result, total assets in the Part D
account increased to $7.8 billion as of December 31, 2017.
Table III.D1 presents a statement of the revenue and expenditures of
the Part D account of the SMI trust fund in calendar year 2017, and of
its assets at the beginning and end of the calendar year.
Table III.D1—Statement of Operations of the Part D Account in the SMI Trust Fund during Calendar Year 2017
[In thousands]
Total assets of the Part D account in the trust fund, beginning of period $7,597,826
Revenue: Premiums from enrollees:
Premiums deducted from Social Security benefits .................. $5,022,827 Premiums paid directly to plans1 ............................................. 10,471,008
Total premiums ............................................................................. 15,493,835 Government contributions:
Prescription drug benefits ........................................................ 73,342,561 Prescription drug administrative expenses2 ............................ −125,140
Total government contributions .................................................... 73,217,421 Payments from States .................................................................. 11,405,804 Interest on investments ................................................................ 53,599
Total revenue .................................................................................... $100,170,659
Expenditures: Part D benefit payments1 .............................................................. $100,102,624 Part D administrative expenses2 .................................................. −125,140
Total expenditures ............................................................................. $99,977,485
Net addition to the trust fund ............................................................. 193,174
Total assets of the Part D account in the trust fund, end of period ....... $7,791,001
1Premiums paid directly to plans are not displayed on Treasury statements and are estimated. These premiums have been added to the benefit payments reported on the Treasury statement to obtain an estimate of total Part D benefits. Direct data on such benefit amounts are not yet available. 2Reflects a larger-than-usual downward adjustment of $0.3 billion for prior-year allocations among Part A, Part B, and Part D.
Note: Totals do not necessarily equal the sums of rounded components.
Actuarial Analysis
100
a. Revenues
The major sources of revenue for the Part D account are
(i) contributions of the Federal Government authorized to be
apportioned and transferred from the general fund of the Treasury;
(ii) premiums paid by eligible persons who voluntarily enroll; and
(iii) contributions from the States.
Of the total Part D revenue, $5.0 billion represented premium
amounts withheld from Social Security benefits or other Federal
benefit payments. Total premium payments, including those paid
directly to the Part D plans, amounted to an estimated $15.5 billion or
15.5 percent of total revenue.
In calendar year 2017, contributions received from the general fund of
the Treasury amounted to $73.2 billion, which accounted for
73.1 percent of total revenue. The payments from the States were
$11.4 billion.
Another source of Part D revenue is interest received on investments
held by the Part D account. Since this account holds a very low amount
of assets, and only for brief periods of time, the interest on the
investments of the account in calendar year 2017 was negligible
($54 million).
b. Expenditures
Part D expenditures include both the costs of prescription drug benefits
provided by Part D plans to enrollees and Medicare payments to retiree
drug subsidy (RDS) plans on behalf of beneficiaries who obtain their
primary drug coverage through such plans. Unlike Parts A and B of
Medicare, the Part D account in the SMI trust fund does not directly
support all Part D expenditures. In particular, enrollee premiums that
are paid directly to Part D plans, and thus do not flow through the
Part D account, finance a portion of these expenditures. However,
these premium amounts are included in the Part D account operations
(both income and expenditures) presented in this report. Total
expenditures are characterized as either benefits (representing the
gross cost of enrollees’ prescription drug coverage plus RDS amounts)
or Federal administrative expenses.
All expenses incurred by the Department of Health and Human
Services, the Social Security Administration, and the Department of
the Treasury in administering Part D are charged to the account.
These administrative duties include making payments to Part D plans,
Part D Financial Status
101
fraud and abuse control activities, and experiments and demonstration
projects designed to improve the quality, efficiency, and economy of
health care services.
In addition, Congress has authorized expenditures from the trust
funds for construction, rental and lease, or purchase contracts of office
buildings and related facilities for use in connection with the
administration of Part D. The account expenditures include such costs.
However, the statement of Part D assets presented in this report does
not carry the net worth of facilities and other fixed capital assets,
because the value of fixed capital assets does not represent funds
available for benefit or administrative expenditures and is not,
therefore, pertinent in assessing the actuarial status of the funds.
Due to administrative cost recoveries from prior years that occurred in
2017, the gross Federal administrative expenses were slightly negative
at −$0.1 billion, as the recovery amounts more than offset the
$0.2 billion in administrative costs that were disbursed during the
year. Accordingly, of the $100.0 billion in total Part D expenditures,
$100.1 billion represented benefits, as defined above. The Medicare
direct premium subsidy and reinsurance subsidy, together with
enrollee premiums, implicitly cover administrative expenses incurred
by Part D plans.
c. Actual experience versus prior estimates
Table III.D2 compares the actual experience in calendar year
2017 with the estimates presented in the 2016 and 2017 annual
reports. A number of factors can contribute to differences between
estimates and subsequent actual experience. In particular, actual
values for key economic and other variables can differ from assumed
levels, lawmakers may adopt legislative and regulatory changes after
a report’s preparation, and new, high-impact drugs can enter the
market.
Compared to the 2017 report, actual premiums and State transfers for
calendar year 2017 were about the same as projected. Government
contributions and benefit payments were higher than projected last
year primarily because the actual manufacturer rebates for 2016 were
lower than expected, resulting in a slightly higher-than-projected
reinsurance reconciliation payment in 2017.
Compared to the 2016 report, actual premiums, government
contributions, and benefit payments for 2017 were all significantly
lower than projected primarily for three reasons: (i) the drug rebates
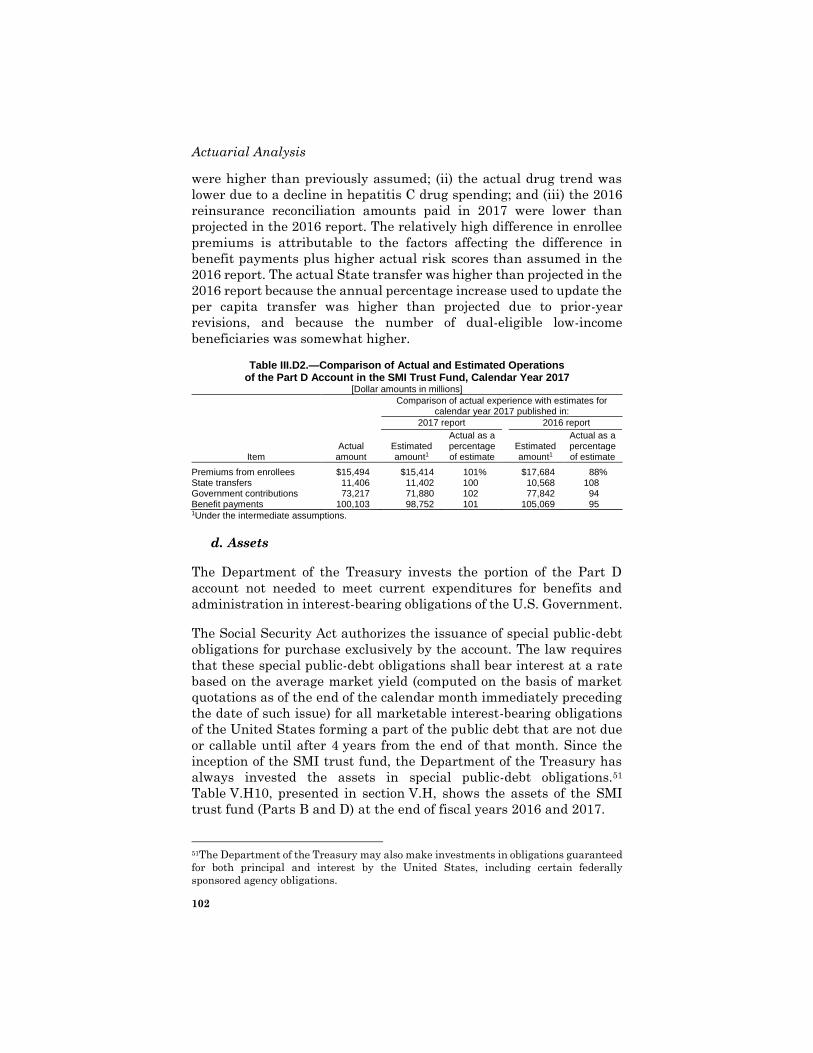
Actuarial Analysis
102
were higher than previously assumed; (ii) the actual drug trend was
lower due to a decline in hepatitis C drug spending; and (iii) the 2016
reinsurance reconciliation amounts paid in 2017 were lower than
projected in the 2016 report. The relatively high difference in enrollee
premiums is attributable to the factors affecting the difference in
benefit payments plus higher actual risk scores than assumed in the
2016 report. The actual State transfer was higher than projected in the
2016 report because the annual percentage increase used to update the
per capita transfer was higher than projected due to prior-year
revisions, and because the number of dual-eligible low-income
beneficiaries was somewhat higher.
Table III.D2.—Comparison of Actual and Estimated Operations of the Part D Account in the SMI Trust Fund, Calendar Year 2017
[Dollar amounts in millions]
Comparison of actual experience with estimates for
calendar year 2017 published in:
2017 report 2016 report
Item Actual
amount Estimated amount1
Actual as a percentage of estimate
Estimated amount1
Actual as a percentage of estimate
Premiums from enrollees $15,494 $15,414 101% $17,684 88% State transfers 11,406 11,402 100 10,568 108 Government contributions 73,217 71,880 102 77,842 94 Benefit payments 100,103 98,752 101 105,069 95 1Under the intermediate assumptions.
d. Assets
The Department of the Treasury invests the portion of the Part D
account not needed to meet current expenditures for benefits and
administration in interest-bearing obligations of the U.S. Government.
The Social Security Act authorizes the issuance of special public-debt
obligations for purchase exclusively by the account. The law requires
that these special public-debt obligations shall bear interest at a rate
based on the average market yield (computed on the basis of market
quotations as of the end of the calendar month immediately preceding
the date of such issue) for all marketable interest-bearing obligations
of the United States forming a part of the public debt that are not due
or callable until after 4 years from the end of that month. Since the
inception of the SMI trust fund, the Department of the Treasury has
always invested the assets in special public-debt obligations.51
Table V.H10, presented in section V.H, shows the assets of the SMI
trust fund (Parts B and D) at the end of fiscal years 2016 and 2017.
51The Department of the Treasury may also make investments in obligations guaranteed
for both principal and interest by the United States, including certain federally
sponsored agency obligations.
Part D Financial Status
103
As explained in section III.D2, the flexible apportionment of general
revenues for Part D eliminates the need to maintain a contingency
reserve. As a result, Part D assets are very low and are held only briefly
in anticipation of immediate expenditures.
2. 10-Year Actuarial Estimates (2018-2027)
Section III.D2 provides detailed information concerning the short-
range financial status of the Part D account, including projected
annual income, outgo, differences between income and outgo, and trust
fund balances. The projected future operations of the Part D account
are based on the Trustees’ economic and demographic assumptions, as
detailed in the OASDI Trustees Report, as well as other assumptions
unique to Part D. Section IV.B2 presents an explanation of the effects
of the Trustees’ intermediate assumptions and other assumptions
unique to Part D on the estimates in this report. This section presents
estimates of the trust fund’s operations and financial status for the
next 10 years. Section III.D3 discusses the long-range actuarial status
of the trust fund.
Generally, the income to the Part D account includes the beneficiary
premiums described above and transfers from the general fund of the
Treasury to cover each year’s incurred benefit costs and other
expenditures. The language that has generally been included in the
Part D appropriation provides, without further Congressional action,
resources for benefit payments under the Part D drug benefit program
on an as-needed basis. The transfers from the Treasury reflect the
direct premium subsidy, amounts of reinsurance payments, RDS
amounts, low-income subsidies, net risk-sharing payments,
administrative expenses, and advanced discount payments. This
income requirement is reduced by the anticipated State transfers for
the full-benefit dually eligible beneficiaries who used to be covered
under Medicaid.
Until 2015, actual cash transfers from the Treasury were made on the
day the benefit payments to plans were due, typically the first business
day of a month, causing the Part D account balance at the end of a
month to include only a modest amount from the State transfers to the
account after the benefit payments were made. A new policy was
developed prior to the end of the 2015 fiscal year52 to transfer amounts
from the Treasury into the account 5 business days before the benefit
52The new policy was applied prior to the October 2015 plan payment and again prior to
the February 2016 plan payment, and it has been consistently applied after February
2016.
Actuarial Analysis
104
payments to the plans. As a result, the Part D account includes a more
substantial balance at the end of most months to reflect this policy.
The beneficiary premiums and direct subsidy rate are calculated based
on the national average bid amounts and defined prior to each year’s
operations. The average basic premium constitutes 25.5 percent of the
expected total plan costs for basic Part D coverage. Beginning in 2011,
beneficiaries with modified adjusted gross incomes exceeding a
specified threshold pay income-related premiums in addition to the
premiums charged by the plans in which the individuals have enrolled.
The extra premiums are credited to the Part D trust fund account and
reduce the general fund financing amounts. Starting in 2011, the drug
manufacturers provide a 50-percent ingredient cost discount for brand-
name drugs in the coverage gap that reduces beneficiary out-of-pocket
expenses. Starting in 2019, the Bipartisan Budget Act of 2018
(BBA 2018) increases the brand-name drug discount in the coverage
gap to 70 percent, with a corresponding decrease in plan benefits.
Section V.A provides a complete list of Medicare amendments during
the last year, including all changes resulting from BBA 2018. Medicare
Part D pays advanced discount payments prospectively to the non-
employer Part D plans and will be reimbursed for these amounts once
the plans receive the discounts from the drug manufacturers.
Expenditures from the account include the premiums withheld from
beneficiaries’ Social Security benefits and transferred to the private
drug plans, the direct premium subsidy payments, reinsurance
payments, RDS amounts, low-income subsidy payments, net risk-
sharing payments, administrative expenses, and advanced discount
payments. As noted previously, the Trustees supplement these
expenditures to include the amount of enrollee premiums paid directly
to Part D plans, thereby providing an estimate of total Part D benefit
payments and other expenditures.
Part D expenditures on direct premium subsidy payments, RDS
amounts, advanced discount payments, and administrative expenses
are affected by the sequestration of Medicare expenditures required by
current law. Reinsurance, low-income cost-sharing subsidy amounts,
and net risk-sharing payments are not affected. The sequestration
reduces benefit payments by 2 percent from April 1, 2013 through
March 31, 2027 and by 4 percent from April 1, 2027 through
September 30, 2027. Due to sequestration, non-salary administrative
expenses are reduced by an estimated 5 to 7 percent from March 1,
2013 through September 30, 2027.
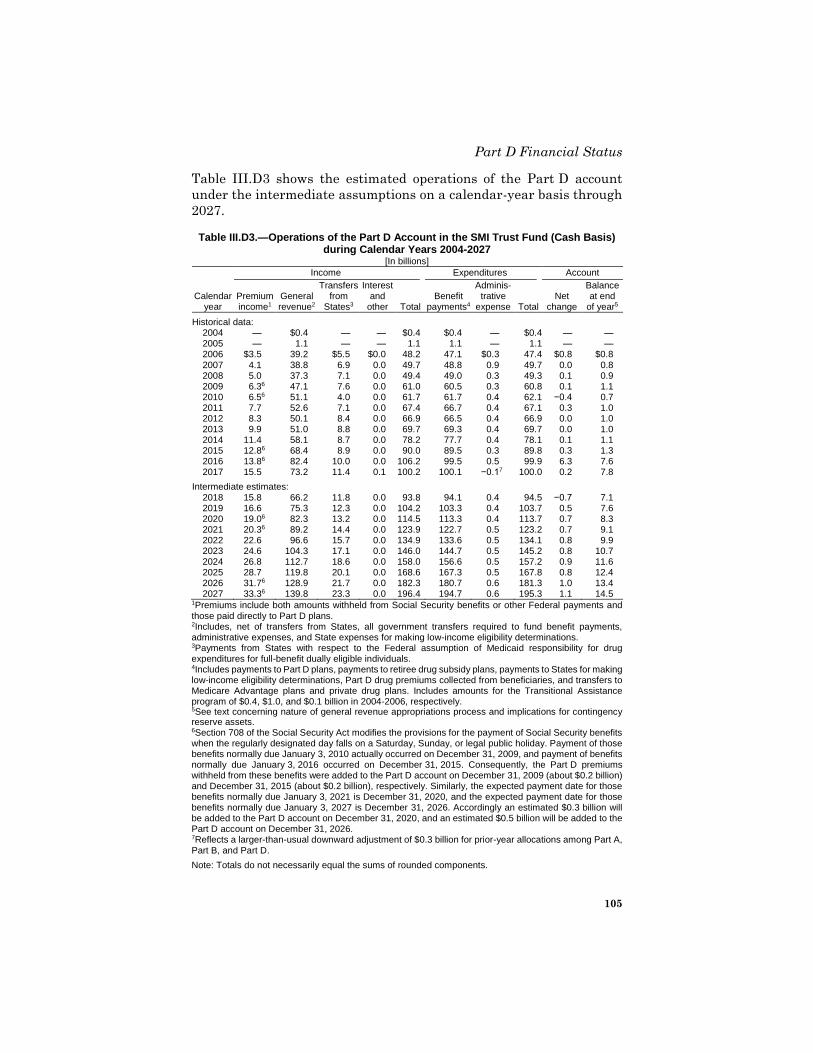
Part D Financial Status
105
Table III.D3 shows the estimated operations of the Part D account
under the intermediate assumptions on a calendar-year basis through
2027.
Table III.D3.—Operations of the Part D Account in the SMI Trust Fund (Cash Basis) during Calendar Years 2004-2027
[In billions]
Income Expenditures Account
Calendar year
Premium income1
General revenue2
Transfers from
States3
Interest and
other Total Benefit
payments4
Adminis-trative
expense Total Net
change
Balance at end
of year5
Historical data: 2004 — $0.4 — — $0.4 $0.4 — $0.4 — — 2005 — 1.1 — — 1.1 1.1 — 1.1 — — 2006 $3.5 39.2 $5.5 $0.0 48.2 47.1 $0.3 47.4 $0.8 $0.8 2007 4.1 38.8 6.9 0.0 49.7 48.8 0.9 49.7 0.0 0.8 2008 5.0 37.3 7.1 0.0 49.4 49.0 0.3 49.3 0.1 0.9 2009 6.3 6 47.1 7.6 0.0 61.0 60.5 0.3 60.8 0.1 1.1 2010 6.5 6 51.1 4.0 0.0 61.7 61.7 0.4 62.1 −0.4 0.7 2011 7.7 52.6 7.1 0.0 67.4 66.7 0.4 67.1 0.3 1.0 2012 8.3 50.1 8.4 0.0 66.9 66.5 0.4 66.9 0.0 1.0 2013 9.9 51.0 8.8 0.0 69.7 69.3 0.4 69.7 0.0 1.0 2014 11.4 58.1 8.7 0.0 78.2 77.7 0.4 78.1 0.1 1.1 2015 12.8 6 68.4 8.9 0.0 90.0 89.5 0.3 89.8 0.3 1.3 2016 13.8 6 82.4 10.0 0.0 106.2 99.5 0.5 99.9 6.3 7.6 2017 15.5 73.2 11.4 0.1 100.2 100.1 −0.1 7 100.0 0.2 7.8
Intermediate estimates: 2018 15.8 66.2 11.8 0.0 93.8 94.1 0.4 94.5 −0.7 7.1 2019 16.6 75.3 12.3 0.0 104.2 103.3 0.4 103.7 0.5 7.6 2020 19.0 6 82.3 13.2 0.0 114.5 113.3 0.4 113.7 0.7 8.3 2021 20.3 6 89.2 14.4 0.0 123.9 122.7 0.5 123.2 0.7 9.1 2022 22.6 96.6 15.7 0.0 134.9 133.6 0.5 134.1 0.8 9.9 2023 24.6 104.3 17.1 0.0 146.0 144.7 0.5 145.2 0.8 10.7 2024 26.8 112.7 18.6 0.0 158.0 156.6 0.5 157.2 0.9 11.6 2025 28.7 119.8 20.1 0.0 168.6 167.3 0.5 167.8 0.8 12.4 2026 31.7 6 128.9 21.7 0.0 182.3 180.7 0.6 181.3 1.0 13.4 2027 33.3 6 139.8 23.3 0.0 196.4 194.7 0.6 195.3 1.1 14.5
1Premiums include both amounts withheld from Social Security benefits or other Federal payments and those paid directly to Part D plans.
2Includes, net of transfers from States, all government transfers required to fund benefit payments, administrative expenses, and State expenses for making low-income eligibility determinations. 3Payments from States with respect to the Federal assumption of Medicaid responsibility for drug expenditures for full-benefit dually eligible individuals.
4Includes payments to Part D plans, payments to retiree drug subsidy plans, payments to States for making low-income eligibility determinations, Part D drug premiums collected from beneficiaries, and transfers to Medicare Advantage plans and private drug plans. Includes amounts for the Transitional Assistance program of $0.4, $1.0, and $0.1 billion in 2004-2006, respectively. 5See text concerning nature of general revenue appropriations process and implications for contingency reserve assets. 6Section 708 of the Social Security Act modifies the provisions for the payment of Social Security benefits when the regularly designated day falls on a Saturday, Sunday, or legal public holiday. Payment of those benefits normally due January 3, 2010 actually occurred on December 31, 2009, and payment of benefits normally due January 3, 2016 occurred on December 31, 2015. Consequently, the Part D premiums withheld from these benefits were added to the Part D account on December 31, 2009 (about $0.2 billion) and December 31, 2015 (about $0.2 billion), respectively. Similarly, the expected payment date for those benefits normally due January 3, 2021 is December 31, 2020, and the expected payment date for those benefits normally due January 3, 2027 is December 31, 2026. Accordingly an estimated $0.3 billion will be added to the Part D account on December 31, 2020, and an estimated $0.5 billion will be added to the Part D account on December 31, 2026. 7Reflects a larger-than-usual downward adjustment of $0.3 billion for prior-year allocations among Part A, Part B, and Part D.
Note: Totals do not necessarily equal the sums of rounded components.
Actuarial Analysis
106
Table III.D4 shows prescription drug payment amounts in the
aggregate, on a per capita basis, and relative to the Gross Domestic
Product (GDP). It also shows rates of growth for the next 10 years
based on the intermediate set of assumptions.
Over the past 10 years, Part D benefit payments have increased by an
annual rate of 7.4 percent in aggregate and by 3.8 percent on a per
enrollee basis. These results reflect the rapid growth in enrollment,
together with multiple prescription drug cost and utilization trends
that have varying effects on underlying costs. For example, there has
been a substantial increase in the proportion of prescriptions filled
with low-cost generic drugs that has helped constrain cost growth,
while there has also been a significant increase in the cost of specialty
drugs that has increased cost growth.
For 2017, per capita benefits decreased sharply as compared to recent
historical years mainly for two reasons: (i) the projected rebates in the
2017 plan bids were significantly higher than in the 2016 plan bids,
offsetting the increase in drug costs; and (ii) since the plans did not
expect the large amount of hepatitis C drug spending in their 2015
bids, there were very significant reinsurance reconciliation payments
from Part D to plans in 2016, which increased the 2016 cash benefit
payments drastically. The 2018 per capita benefits are projected to
decrease further because the rebates assumed in the 2018 plan bids
were significantly higher than assumed for the 2017 bids, and because
a significant decline in hepatitis C drug spending in 2017 will likely
result in reinsurance reconciliation receipts from plans in 2018.
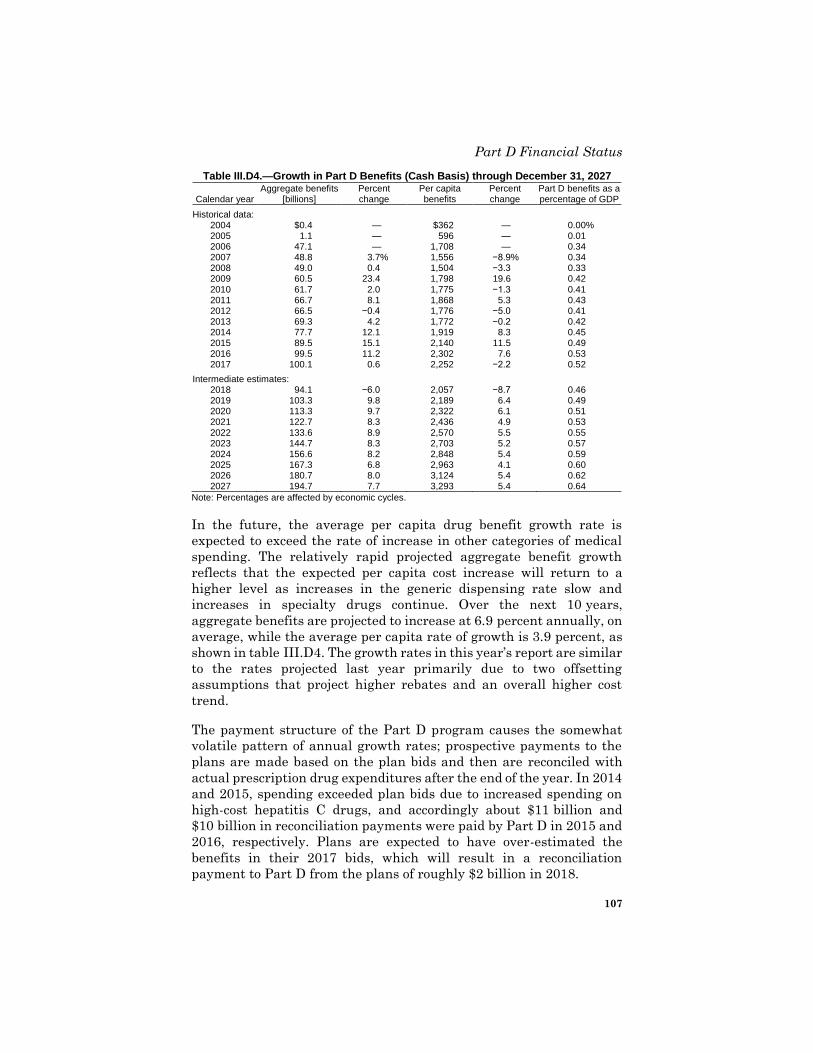
Part D Financial Status
107
Table III.D4.—Growth in Part D Benefits (Cash Basis) through December 31, 2027
Calendar year Aggregate benefits
[billions] Percent change
Per capita benefits
Percent change
Part D benefits as a percentage of GDP
Historical data: 2004 $0.4 — $362 — 0.00 % 2005 1.1 — 596 — 0.01 2006 47.1 — 1,708 — 0.34 2007 48.8 3.7 % 1,556 −8.9 % 0.34 2008 49.0 0.4 1,504 −3.3 0.33 2009 60.5 23.4 1,798 19.6 0.42 2010 61.7 2.0 1,775 −1.3 0.41 2011 66.7 8.1 1,868 5.3 0.43 2012 66.5 −0.4 1,776 −5.0 0.41 2013 69.3 4.2 1,772 −0.2 0.42 2014 77.7 12.1 1,919 8.3 0.45 2015 89.5 15.1 2,140 11.5 0.49 2016 99.5 11.2 2,302 7.6 0.53 2017 100.1 0.6 2,252 −2.2 0.52
Intermediate estimates: 2018 94.1 −6.0 2,057 −8.7 0.46 2019 103.3 9.8 2,189 6.4 0.49 2020 113.3 9.7 2,322 6.1 0.51 2021 122.7 8.3 2,436 4.9 0.53 2022 133.6 8.9 2,570 5.5 0.55 2023 144.7 8.3 2,703 5.2 0.57 2024 156.6 8.2 2,848 5.4 0.59 2025 167.3 6.8 2,963 4.1 0.60 2026 180.7 8.0 3,124 5.4 0.62 2027 194.7 7.7 3,293 5.4 0.64
Note: Percentages are affected by economic cycles.
In the future, the average per capita drug benefit growth rate is
expected to exceed the rate of increase in other categories of medical
spending. The relatively rapid projected aggregate benefit growth
reflects that the expected per capita cost increase will return to a
higher level as increases in the generic dispensing rate slow and
increases in specialty drugs continue. Over the next 10 years,
aggregate benefits are projected to increase at 6.9 percent annually, on
average, while the average per capita rate of growth is 3.9 percent, as
shown in table III.D4. The growth rates in this year’s report are similar
to the rates projected last year primarily due to two offsetting
assumptions that project higher rebates and an overall higher cost
trend.
The payment structure of the Part D program causes the somewhat
volatile pattern of annual growth rates; prospective payments to the
plans are made based on the plan bids and then are reconciled with
actual prescription drug expenditures after the end of the year. In 2014
and 2015, spending exceeded plan bids due to increased spending on
high-cost hepatitis C drugs, and accordingly about $11 billion and
$10 billion in reconciliation payments were paid by Part D in 2015 and
2016, respectively. Plans are expected to have over-estimated the
benefits in their 2017 bids, which will result in a reconciliation
payment to Part D from the plans of roughly $2 billion in 2018.
Actuarial Analysis
108
Legislation and policy also contribute to the volatility of the annual
growth rates. For example, the ACA will close the coverage gap from
2012 through 2020, a factor that will increase plan benefits and result
in higher Part D expenditures and premiums. Starting in 2019,
BBA 2018 further alters the coverage gap by increasing the
manufacturer discount from 50 percent to 70 percent for brand-name
drugs in the coverage gap and by decreasing plan benefits.
Additionally, the policy to begin paying advanced reinsurance amounts
to the employer/union-only group waiver plans in 2017 will affect the
timing of the reinsurance payments, which were previously provided
exclusively through the reconciliation process.
The Trustees have also prepared estimates using two alternative sets
of assumptions. Table III.D5 summarizes the estimated operations of
the Part D account for all three alternatives. Section IV.B2 presents
the assumptions underlying the intermediate estimates in substantial
detail, and it outlines the assumptions used in preparing estimates
under the low-cost and high-cost alternatives.
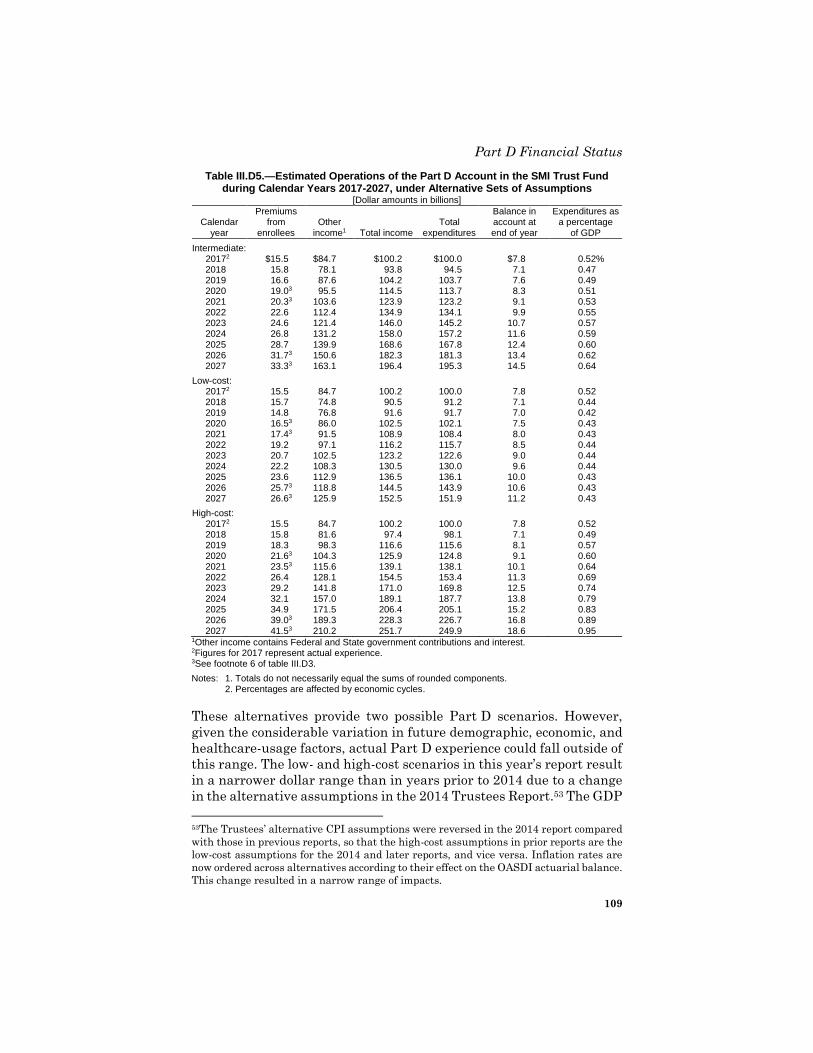
Part D Financial Status
109
Table III.D5.—Estimated Operations of the Part D Account in the SMI Trust Fund during Calendar Years 2017-2027, under Alternative Sets of Assumptions
[Dollar amounts in billions]
Calendar year
Premiums from
enrollees Other
income1 Total income Total
expenditures
Balance in account at end of year
Expenditures as a percentage
of GDP
Intermediate: 2017 2 $15.5 $84.7 $100.2 $100.0 $7.8 0.52 % 2018 15.8 78.1 93.8 94.5 7.1 0.47 2019 16.6 87.6 104.2 103.7 7.6 0.49 2020 19.0 3 95.5 114.5 113.7 8.3 0.51 2021 20.3 3 103.6 123.9 123.2 9.1 0.53 2022 22.6 112.4 134.9 134.1 9.9 0.55 2023 24.6 121.4 146.0 145.2 10.7 0.57 2024 26.8 131.2 158.0 157.2 11.6 0.59
2025 28.7 139.9 168.6 167.8 12.4 0.60 2026 31.7 3 150.6 182.3 181.3 13.4 0.62 2027 33.3 3 163.1 196.4 195.3 14.5 0.64
Low-cost: 2017 2 15.5 84.7 100.2 100.0 7.8 0.52 2018 15.7 74.8 90.5 91.2 7.1 0.44 2019 14.8 76.8 91.6 91.7 7.0 0.42 2020 16.5 3 86.0 102.5 102.1 7.5 0.43 2021 17.4 3 91.5 108.9 108.4 8.0 0.43 2022 19.2 97.1 116.2 115.7 8.5 0.44 2023 20.7 102.5 123.2 122.6 9.0 0.44 2024 22.2 108.3 130.5 130.0 9.6 0.44 2025 23.6 112.9 136.5 136.1 10.0 0.43 2026 25.7 3 118.8 144.5 143.9 10.6 0.43 2027 26.6 3 125.9 152.5 151.9 11.2 0.43
High-cost: 2017 2 15.5 84.7 100.2 100.0 7.8 0.52 2018 15.8 81.6 97.4 98.1 7.1 0.49 2019 18.3 98.3 116.6 115.6 8.1 0.57 2020 21.6 3 104.3 125.9 124.8 9.1 0.60 2021 23.5 3 115.6 139.1 138.1 10.1 0.64 2022 26.4 128.1 154.5 153.4 11.3 0.69 2023 29.2 141.8 171.0 169.8 12.5 0.74 2024 32.1 157.0 189.1 187.7 13.8 0.79 2025 34.9 171.5 206.4 205.1 15.2 0.83 2026 39.0 3 189.3 228.3 226.7 16.8 0.89 2027 41.5 3 210.2 251.7 249.9 18.6 0.95
1Other income contains Federal and State government contributions and interest. 2Figures for 2017 represent actual experience. 3See footnote 6 of table III.D3.
Notes: 1. Totals do not necessarily equal the sums of rounded components. 2. Percentages are affected by economic cycles.
These alternatives provide two possible Part D scenarios. However,
given the considerable variation in future demographic, economic, and
healthcare-usage factors, actual Part D experience could fall outside of
this range. The low- and high-cost scenarios in this year’s report result
in a narrower dollar range than in years prior to 2014 due to a change
in the alternative assumptions in the 2014 Trustees Report.53 The GDP
53The Trustees’ alternative CPI assumptions were reversed in the 2014 report compared
with those in previous reports, so that the high-cost assumptions in prior reports are the
low-cost assumptions for the 2014 and later reports, and vice versa. Inflation rates are
now ordered across alternatives according to their effect on the OASDI actuarial balance.
This change resulted in a narrow range of impacts.
Actuarial Analysis
110
assumptions for the alternative scenarios are also affected by the
assumption change. Therefore, spending as a percentage of GDP
provides better insight into the variability of spending than the
nominal dollar amounts, as shown in table III.D5.
The alternative projections shown in table III.D5 illustrate two
important aspects of the financial operations of the Part D account:
• Despite the differing assumptions underlying the three
alternatives, the balance between Part D income and expenditures
remains relatively stable. This result occurs because the premiums
and general revenue contributions underlying the Part D financing
are reestablished annually. Thus, Part D income automatically
tracks Part D expenditures fairly closely, regardless of the specific
economic and other conditions.
• As a result of the close matching of income and expenditures
described above, together with anticipated continuing flexibility in
the apportionment of general revenues, the need for a contingency
reserve to handle unanticipated fluctuations is minimal.
Adequacy of Part D Financing Established for Calendar Year 2017
As noted previously, the Part D account in the SMI trust fund will be
in financial balance indefinitely because the premiums paid by
enrollees and the amounts apportioned from the general fund of the
Treasury are determined each year so as to adequately finance Part D
expenditures. Moreover, the appropriation for Part D general revenues
has generally included an indefinite authority provision allowing for
amounts to be transferred to the Part D account on an as-needed basis.
This provision allows previously apportioned amounts to change
without additional Congressional action if those amounts are later
determined to be insufficient. Consequently, once an appropriation
with this provision has been made, no deficit will occur in the Part D
account, and no contingency fund will be necessary to cover deficits.54
As described in section III.C on the financial status of the Part B
account, it is important to maintain an appropriate level of assets to
cover the liability for claims that have been incurred but not yet
reported or paid. In the case of Part D, however, most such claims are
the responsibility of the prescription drug plans rather than the Part D
program. Accordingly, the Part D account is generally not at risk for
54The indefinite authority applies to all Part D outlays other than Federal administrative
expenses. Those amounts are specifically appropriated each year.
Part D Financial Status
111
incurred-but-unreported claim amounts, and no asset reserve is
necessary for this purpose.
Another potential Part D liability exists to the extent that Part D
reinsurance payments and low-income cost-sharing subsidy payments
are based on plan estimates.55 Since actual Part D costs, as
subsequently determined, will generally differ from the plan bids,
payment adjustments are made after the close of the year as needed to
reconcile the accounts. When the plan bids have been below actual
costs, Medicare has made such settlements in favor of the plans from
the following year’s appropriated general revenues; thus, creation of a
reserve for payment of such settlement amounts is not required.
For these reasons, the Trustees have concluded that maintenance of
Part D account assets for contingency or liability purposes is
unnecessary at this time. Accordingly, evaluation of the adequacy of
Part D assets is also unnecessary, and the Part D account is considered
to be in satisfactory financial condition for 2017 and all future years as
a consequence of its basis for financing.
3. Long-Range Estimates
Section III.D2 presented the expected operations of the Part D account
over the next 10 years. This section describes the long-range
expenditures of the account under the intermediate assumptions. Due
to its automatic financing provisions, the Trustees expect adequate
financing of the Part D account into the indefinite future and so have
not conducted a long-range analysis using high-cost and low-cost
assumptions. The 10-year projections under the alternative
assumptions are presented in section IV.B2.
Table III.D6 shows the estimated Part D incurred expenditures under
the intermediate assumptions expressed as a percentage of GDP, for
selected years over the calendar-year period 2017-2092.56 The 75-year
projection period fully allows for the presentation of likely future
trends, such as the large increase in enrollees after 2010 as the baby
boom generation begins to receive benefits.
55These estimates are subject to actuarial review by the CMS Office of the Actuary. 56These estimated incurred expenditures are for benefit payments and administrative
expenses combined, unlike the values in table III.D4, which express only benefit
payments on a cash basis as a percentage of GDP.
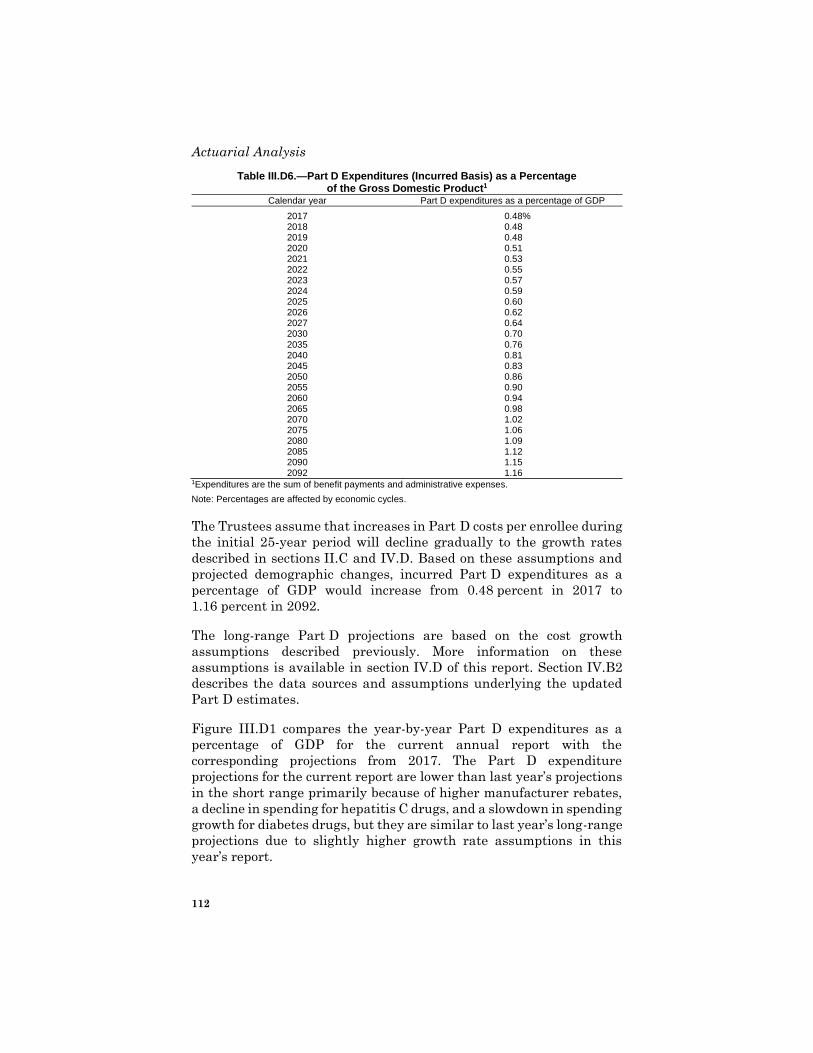
Actuarial Analysis
112
Table III.D6.—Part D Expenditures (Incurred Basis) as a Percentage of the Gross Domestic Product1
Calendar year Part D expenditures as a percentage of GDP
2017 0.48 %
2018 0.48 2019 0.48 2020 0.51 2021 0.53 2022 0.55 2023 0.57 2024 0.59 2025 0.60 2026 0.62 2027 0.64 2030 0.70
2035 0.76 2040 0.81 2045 0.83 2050 0.86 2055 0.90 2060 0.94 2065 0.98 2070 1.02 2075 1.06 2080 1.09 2085 1.12 2090 1.15 2092 1.16
1Expenditures are the sum of benefit payments and administrative expenses.
Note: Percentages are affected by economic cycles.
The Trustees assume that increases in Part D costs per enrollee during
the initial 25-year period will decline gradually to the growth rates
described in sections II.C and IV.D. Based on these assumptions and
projected demographic changes, incurred Part D expenditures as a
percentage of GDP would increase from 0.48 percent in 2017 to
1.16 percent in 2092.
The long-range Part D projections are based on the cost growth
assumptions described previously. More information on these
assumptions is available in section IV.D of this report. Section IV.B2
describes the data sources and assumptions underlying the updated
Part D estimates.
Figure III.D1 compares the year-by-year Part D expenditures as a
percentage of GDP for the current annual report with the
corresponding projections from 2017. The Part D expenditure
projections for the current report are lower than last year’s projections
in the short range primarily because of higher manufacturer rebates,
a decline in spending for hepatitis C drugs, and a slowdown in spending
growth for diabetes drugs, but they are similar to last year’s long-range
projections due to slightly higher growth rate assumptions in this
year’s report.
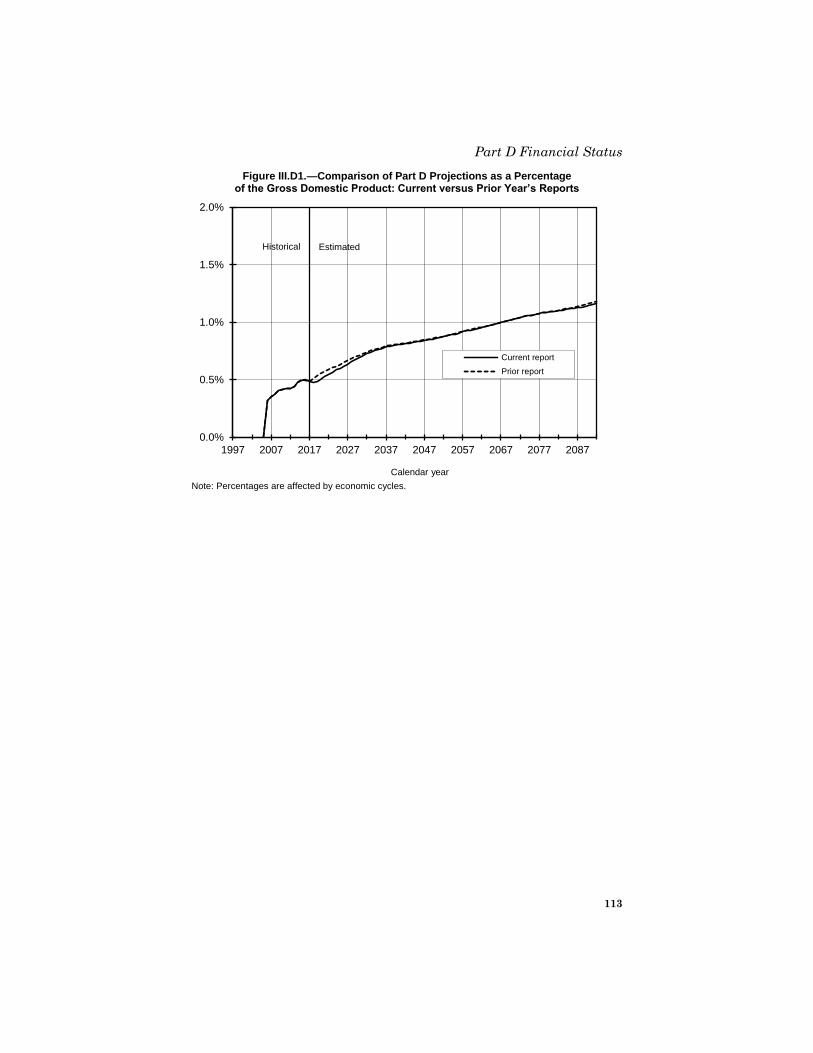
Part D Financial Status
113
Figure III.D1.—Comparison of Part D Projections as a Percentage of the Gross Domestic Product: Current versus Prior Year’s Reports
0.0%
0.5%
1.0%
1.5%
2.0%
1997 2007 2017 2027 2037 2047 2057 2067 2077 2087
Calendar year
Current report
Prior report
Historical Estimated
Note: Percentages are affected by economic cycles.
114
IV. ACTUARIAL METHODOLOGY AND PRINCIPAL
ASSUMPTIONS FOR COST ESTIMATES FOR THE HOSPITAL
INSURANCE AND SUPPLEMENTARY MEDICAL INSURANCE
TRUST FUNDS
This section describes the basic methodology and assumptions used in
the estimates for the HI and SMI trust funds under the intermediate
assumptions and presents projections of HI and SMI costs under two
alternative sets of assumptions.
The economic and demographic assumptions underlying the
projections of HI and SMI costs shown in this report are consistent with
those in the 2018 Annual Report of the Board of Trustees of the Federal
Old-Age and Survivors Insurance and Federal Disability Insurance
Trust Funds. That report describes these assumptions in more detail.
A. HOSPITAL INSURANCE
1. Cost Projection Methodology
The principal steps involved in projecting future HI costs are
(i) establishing the present cost of services provided to beneficiaries, by
type of service, to serve as a projection base; (ii) projecting increases in
HI payments for inpatient hospital services; (iii) projecting increases
in HI payments for skilled nursing, home health, and hospice services
covered; (iv) projecting increases in payments to private health plans;
and (v) projecting increases in administrative costs.
a. Projection Base
To establish a suitable base from which to project future HI costs, the
incurred payments for services provided must be constructed for the
most recent period for which a reliable determination can be made.
Accordingly, payments to providers must be attributed to dates of
service, rather than to payment dates; in addition, the nonrecurring
effects of any changes in regulations, legislation, or administration,
and of any items affecting only the timing and flow of payments to
providers, must be eliminated. As a result, the rates of increase in the
HI incurred costs differ from the increases in cash expenditures shown
in the tables in section III.B.
For those expenses still reimbursed on a reasonable-cost basis, the
costs for covered services are determined on the basis of provider cost
reports. Due to the time required to obtain cost reports from providers,
to verify these reports, and to perform audits (where appropriate), final
settlements have lagged behind the original costs by as much as
Hospital Insurance
115
several years for some providers. Additional complications arise from
legislative, regulatory, and administrative changes, the effects of
which cannot always be determined precisely.
The process of allocating the various types of HI payments made to the
proper incurred period—using incomplete data and estimates of the
impact of administrative actions—presents difficult problems, and the
solutions to these problems can be only approximate. Under the
circumstances, the best that one can expect is that the actual HI
incurred cost for a recent period can be estimated within a few percent.
This process increases the projection error directly by incorporating
any error in estimating the base year into all future years.
b. Fee-for-Service Payments for Inpatient Hospital Costs
Payment for almost all inpatient hospital services for fee-for-service
beneficiaries occurs under a prospective payment system. The law
stipulates that the annual increase in the payment rate for each
admission relate to a hospital input price index (also known as the
hospital market basket), which measures the increase in prices for
goods and services purchased by hospitals for use in providing care to
hospital inpatients. For fiscal year 2018, the prospective payment rates
have already been determined. For fiscal years 2019 and later, the
statute mandates that the annual increase in the payment rate per
admission equal the annual increase in the hospital input price index
(for those hospitals submitting required quality measure data), minus
a specified percentage. For this report, the Trustees assume that all
hospitals will submit these data.
Increases in aggregate payments for inpatient hospital care covered
under HI can be analyzed in five broad categories, presented in
table IV.A1:
(1) Hospital input price index—the increase in prices for goods
and services purchased by the hospital;
(2) Unit input intensity allowance—an amount added to or
subtracted from the input price index (generally called for in
legislation) to yield the prospective payment update factor;
(3) Volume of services—the increase in total output of units of
service (as measured by covered HI hospital admissions);
(4) Case mix—the financial effect of changes in the average
complexity of hospital admissions; and
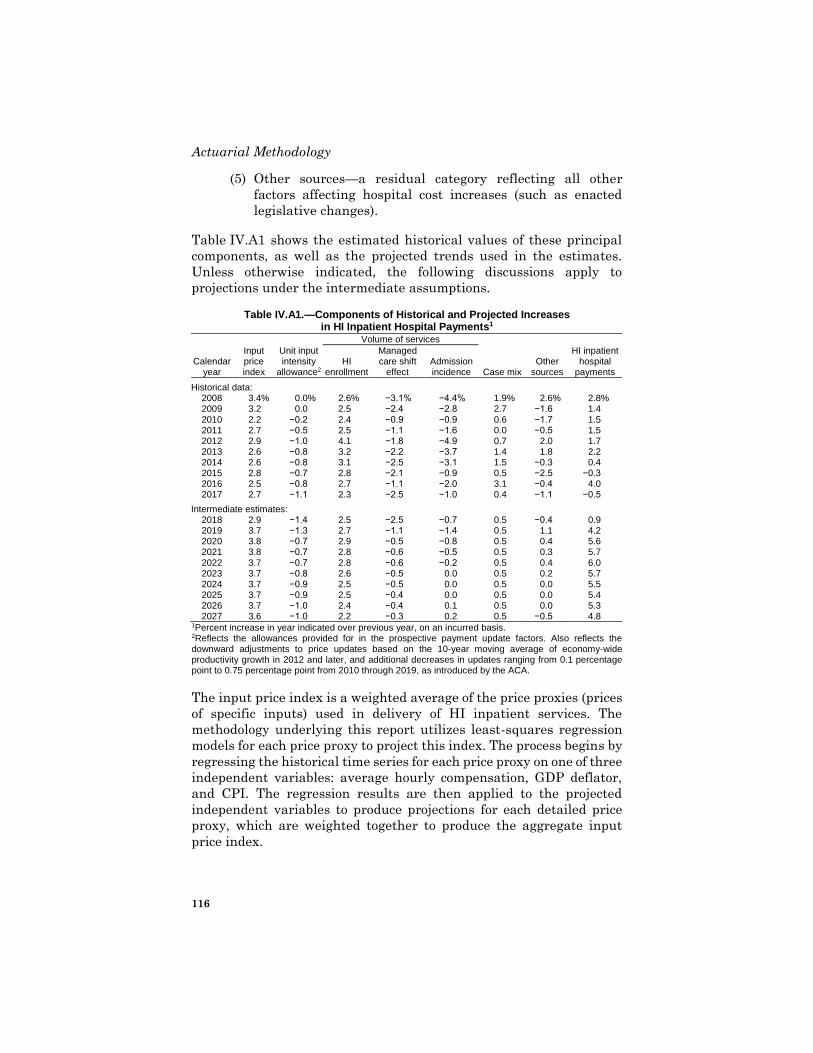
Actuarial Methodology
116
(5) Other sources—a residual category reflecting all other
factors affecting hospital cost increases (such as enacted
legislative changes).
Table IV.A1 shows the estimated historical values of these principal
components, as well as the projected trends used in the estimates.
Unless otherwise indicated, the following discussions apply to
projections under the intermediate assumptions.
Table IV.A1.—Components of Historical and Projected Increases in HI Inpatient Hospital Payments1
1Percent increase in year indicated over previous year, on an incurred basis. 2Reflects the allowances provided for in the prospective payment update factors. Also reflects the downward adjustments to price updates based on the 10-year moving average of economy-wide productivity growth in 2012 and later, and additional decreases in updates ranging from 0.1 percentage point to 0.75 percentage point from 2010 through 2019, as introduced by the ACA.
The input price index is a weighted average of the price proxies (prices
of specific inputs) used in delivery of HI inpatient services. The
methodology underlying this report utilizes least-squares regression
models for each price proxy to project this index. The process begins by
regressing the historical time series for each price proxy on one of three
independent variables: average hourly compensation, GDP deflator,
and CPI. The regression results are then applied to the projected
independent variables to produce projections for each detailed price
proxy, which are weighted together to produce the aggregate input
price index.
Volume of services
Calendar year
Input price index
Unit input intensity
allowance2 HI
enrollment
Managed care shift
effect Admission incidence Case mix
Other sources
HI inpatient hospital
payments
Historical data: 2008 3.4% 0.0% 2.6% −3.1% −4.4% 1.9% 2.6% 2.8% 2009 3.2 0.0 2.5 −2.4 −2.8 2.7 −1.6 1.4 2010 2.2 −0.2 2.4 −0.9 −0.9 0.6 −1.7 1.5 2011 2.7 −0.5 2.5 −1.1 −1.6 0.0 −0.5 1.5 2012 2.9 −1.0 4.1 −1.8 −4.9 0.7 2.0 1.7 2013 2.6 −0.8 3.2 −2.2 −3.7 1.4 1.8 2.2 2014 2.6 −0.8 3.1 −2.5 −3.1 1.5 −0.3 0.4 2015 2.8 −0.7 2.8 −2.1 −0.9 0.5 −2.5 −0.3 2016 2.5 −0.8 2.7 −1.1 −2.0 3.1 −0.4 4.0 2017 2.7 −1.1 2.3 −2.5 −1.0 0.4 −1.1 −0.5
Intermediate estimates: 2018 2.9 −1.4 2.5 −2.5 −0.7 0.5 −0.4 0.9 2019 3.7 −1.3 2.7 −1.1 −1.4 0.5 1.1 4.2 2020 3.8 −0.7 2.9 −0.5 −0.8 0.5 0.4 5.6 2021 3.8 −0.7 2.8 −0.6 −0.5 0.5 0.3 5.7 2022 3.7 −0.7 2.8 −0.6 −0.2 0.5 0.4 6.0 2023 3.7 −0.8 2.6 −0.5 0.0 0.5 0.2 5.7 2024 3.7 −0.9 2.5 −0.5 0.0 0.5 0.0 5.5 2025 3.7 −0.9 2.5 −0.4 0.0 0.5 0.0 5.4 2026 3.7 −1.0 2.4 −0.4 0.1 0.5 0.0 5.3 2027 3.6 −1.0 2.2 −0.3 0.2 0.5 −0.5 4.8
Hospital Insurance
117
The unit input intensity allowance is generally a downward
adjustment provided for by law in the prospective payment update
factor; that is, it is the amount subtracted from the input price index
to yield the update factor.57 Beginning in fiscal year 2004, the law
provides that increases in payments to prospective payment system
hospitals for covered admissions will equal the increase in the hospital
input price index for those hospitals that submit the required quality
measure data. For other hospitals, the increase will be slightly smaller.
For this report, the Trustees assume that all hospitals will submit
these data. Beginning in fiscal year 2010, the ACA mandates amounts
to be subtracted from the input price index, including the increase in
economy-wide productivity in 2012 and later, and amounts ranging
from 0.1 percentage point to 0.75 percentage point for 2010 through
2019. As a result of these adjustments, the unit input intensity
allowance, as indicated in table IV.A1, is negative throughout the first
10-year projection period.
Increases in payments for inpatient hospital services also reflect
growth in the number of inpatient hospital admissions covered under
HI fee-for-service. As shown in table IV.A1, increases in admissions are
attributable to growth in both HI enrollment and admission incidence
(admissions per beneficiary).58 The historical and projected growth in
enrollment reflects a more rapid increase in the population aged 65 and
over than in the total population of the United States, as well as
increasing numbers of disabled beneficiaries and persons with end-
stage renal disease. Growth in enrollment is expected to continue and
to mirror the ongoing demographic shift into categories of the
population eligible for HI benefits and reduced by an increasing
proportion of beneficiaries enrolling in private health plans.
The choice of more beneficiaries to join private health plans has been
an offsetting factor to the HI enrollment growth, as shown in the
“managed care shift effect” column of table IV.A1. In other words,
greater enrollment in private health plans reduced the number of
beneficiaries with fee-for-service Medicare coverage and thereby
reduced hospital admissions paid through fee-for-service. Private
57The update factors are generally prescribed on a fiscal-year basis, while table IV.A1 is
on a calendar-year basis. Calculations have therefore been performed to estimate the
unit input intensity allowance on the basis of calendar years. The sum of the input price
index and the unit input intensity allowance generally reflects the prescribed prospective
payment update factor, but on a calendar-year, rather than a fiscal-year, basis. 58This factor has recently been negative and is projected to remain that way through
2021, reflecting the influx of beneficiaries aged 65 (and the resulting reduction in the
average age of beneficiaries) due to the retirement of the baby boom generation. By the
end of the projection period, the aging of this group is expected to increase the incidence
of admissions.
Actuarial Methodology
118
Medicare health plan membership is projected to continue to grow for
most of the projection period.
Since the beginning of the prospective payment system (PPS),
inpatient hospital payments have varied based on the complexity of
admissions. These variations are primarily due to (i) the changes in
diagnosis-related group (DRG) coding as hospitals continue to adjust
to the PPS and (ii) the trend toward treating less complicated (and thus
less expensive) cases in outpatient settings, which results in an
increase in the average prospective payment per admission.
The average complexity of hospital admissions (case mix) is expected
to increase by 0.5 percent annually in fiscal years 2018 through 2027
as a result of an assumed continuation of the current trend toward
treating less complicated cases in outpatient settings, ongoing changes
in DRG coding, and the overall impact of new technology.
Hospital payments are also affected by other factors, as reflected in the
“other sources” column of table IV.A1. For example, statutory budget
neutrality adjustments offset costs from significant increases in case
mix that occurred when the new Medicare severity diagnosis-related
group (MS-DRG) system was introduced in 2008. Although the law
limited the size of these adjustments in 2008 and 2009, it allows
subsequent recovery of any extra payments that resulted. The “other
sources” column reflects all of these actual and anticipated effects and
adjustments. In addition, one can attribute part of the increase from
“other sources” to the increase in payments for certain costs, not
included in the DRG payment, that are generally growing at a rate
slower than the input price index. These other costs include capital,
medical education (both direct and indirect), disproportionate share
hospital (DSH) payments, and payments to hospitals not included in
the prospective payment system. A particularly important change
affecting these costs is the reduction in Medicare DSH payments under
the ACA. This change reflects the major coverage expansions that
began in 2014 and that continue to result in significantly fewer
uninsured hospital patients. In 2019, however, the elimination of the
individual mandate is assumed to increase the number of uninsured,
resulting in an increase in this factor.
Additional possible sources of changes in payments include (i) a shift
to higher-cost or lower-cost admissions due to changes in the
demographic characteristics of the covered population; (ii) changes in
medical practice patterns; and (iii) adjustments in the relative
payment levels for various DRGs, or addition/deletion of DRGs, in
response to changes in technology.
Hospital Insurance
119
The “other sources” column reflects, as appropriate, the impact of
certain enacted legislation, including the sequestration process. Also
reflected in this column is the impact of the estimated bonus payments
and penalties for hospitals due to the health information technology
incentives.
The increases in the input price index (less any intensity allowance
specified in the law), units of service, and other sources are
compounded to calculate the total increase in payments for inpatient
hospital services. The last column of table IV.A1 shows these overall
increases.
c. Fee-for-Service Payments for Skilled Nursing Facility,
Home Health Agency, and Hospice Services
To project fee-for-service payments for skilled nursing facilities (SNFs),
a method similar to that for inpatient hospitals is used. First, the
number of covered days is determined, and then the average
reimbursement per day is calculated. Historically, the number of days
of care covered in SNFs under HI has varied widely. This extremely
volatile experience has resulted, in part, from legislative and
regulatory changes and from judicial decisions affecting the scope of
coverage. For 2008, utilization rates increased by a fairly high amount.
This trend leveled off from 2009 to 2011, and there have been
significant decreases in utilization since 2012. The intermediate
projections assume that these increases in covered SNF days will
reflect the growth and aging of the population and an underlying trend
that gradually increases to a level of 1 percent annually by 2024.
As with hospitals, a least-squares regression model was used to
develop the market basket increases for SNFs. These market basket
increases are reduced by the increase in economy-wide productivity
beginning in 2012. Cost per day also increases by a case mix increase.
The implementation of the new resource utilization group-53 (RUG-53)
system of payment in 2006 was accompanied by increases of more than
3 percent for 2007 through 2009. In 2010, a reduction of about
3.3 percent was applied to all the rates to better match payments from
the old payment system to the new payment system. The
implementation of a new RUG system again caused a very large
increase in case mix in 2011, and a reduction of about 12.6 percent was
applied in 2012 to once again match payments. Since then, case mix
increases have dropped from 2.0 percent in 2013 to 0 percent in 2017.
For the projection, the case mix increases are assumed to gradually
increase to a level of 1.5 percent annually by 2022. The required
reduction in costs due to sequestration is also reflected in the projected
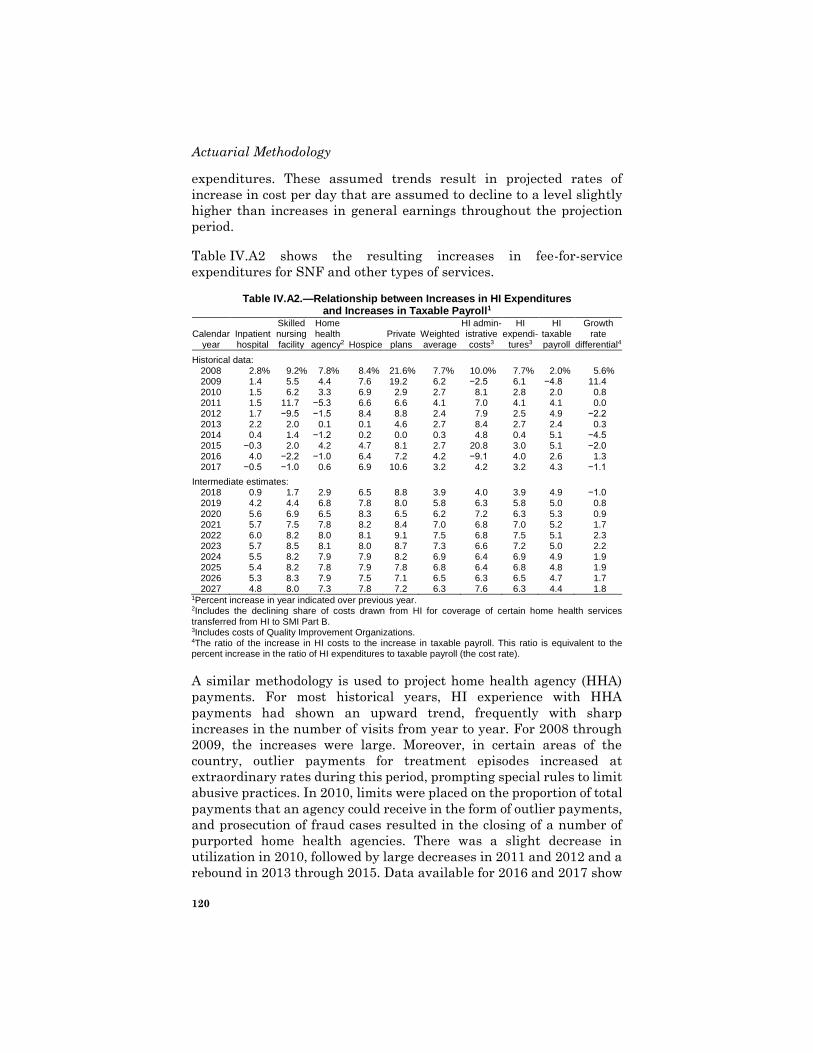
Actuarial Methodology
120
expenditures. These assumed trends result in projected rates of
increase in cost per day that are assumed to decline to a level slightly
higher than increases in general earnings throughout the projection
period.
Table IV.A2 shows the resulting increases in fee-for-service
expenditures for SNF and other types of services.
Table IV.A2.—Relationship between Increases in HI Expenditures and Increases in Taxable Payroll1
Calendar year
Inpatient hospital
Skilled nursing facility
Home health
agency2 Hospice Private plans
Weighted average
HI admin-istrative costs3
HI expendi-
tures3
HI taxable payroll
Growth rate
differential4
Historical data: 2008 2.8% 9.2% 7.8% 8.4% 21.6% 7.7% 10.0% 7.7% 2.0% 5.6% 2009 1.4 5.5 4.4 7.6 19.2 6.2 −2.5 6.1 −4.8 11.4 2010 1.5 6.2 3.3 6.9 2.9 2.7 8.1 2.8 2.0 0.8 2011 1.5 11.7 −5.3 6.6 6.6 4.1 7.0 4.1 4.1 0.0 2012 1.7 −9.5 −1.5 8.4 8.8 2.4 7.9 2.5 4.9 −2.2 2013 2.2 2.0 0.1 0.1 4.6 2.7 8.4 2.7 2.4 0.3 2014 0.4 1.4 −1.2 0.2 0.0 0.3 4.8 0.4 5.1 −4.5 2015 −0.3 2.0 4.2 4.7 8.1 2.7 20.8 3.0 5.1 −2.0 2016 4.0 −2.2 −1.0 6.4 7.2 4.2 −9.1 4.0 2.6 1.3 2017 −0.5 −1.0 0.6 6.9 10.6 3.2 4.2 3.2 4.3 −1.1
Intermediate estimates: 2018 0.9 1.7 2.9 6.5 8.8 3.9 4.0 3.9 4.9 −1.0 2019 4.2 4.4 6.8 7.8 8.0 5.8 6.3 5.8 5.0 0.8 2020 5.6 6.9 6.5 8.3 6.5 6.2 7.2 6.3 5.3 0.9 2021 5.7 7.5 7.8 8.2 8.4 7.0 6.8 7.0 5.2 1.7 2022 6.0 8.2 8.0 8.1 9.1 7.5 6.8 7.5 5.1 2.3 2023 5.7 8.5 8.1 8.0 8.7 7.3 6.6 7.2 5.0 2.2 2024 5.5 8.2 7.9 7.9 8.2 6.9 6.4 6.9 4.9 1.9 2025 5.4 8.2 7.8 7.9 7.8 6.8 6.4 6.8 4.8 1.9 2026 5.3 8.3 7.9 7.5 7.1 6.5 6.3 6.5 4.7 1.7 2027 4.8 8.0 7.3 7.8 7.2 6.3 7.6 6.3 4.4 1.8
1Percent increase in year indicated over previous year. 2Includes the declining share of costs drawn from HI for coverage of certain home health services transferred from HI to SMI Part B. 3Includes costs of Quality Improvement Organizations. 4The ratio of the increase in HI costs to the increase in taxable payroll. This ratio is equivalent to the percent increase in the ratio of HI expenditures to taxable payroll (the cost rate).
A similar methodology is used to project home health agency (HHA)
payments. For most historical years, HI experience with HHA
payments had shown an upward trend, frequently with sharp
increases in the number of visits from year to year. For 2008 through
2009, the increases were large. Moreover, in certain areas of the
country, outlier payments for treatment episodes increased at
extraordinary rates during this period, prompting special rules to limit
abusive practices. In 2010, limits were placed on the proportion of total
payments that an agency could receive in the form of outlier payments,
and prosecution of fraud cases resulted in the closing of a number of
purported home health agencies. There was a slight decrease in
utilization in 2010, followed by large decreases in 2011 and 2012 and a
rebound in 2013 through 2015. Data available for 2016 and 2017 show
Hospital Insurance
121
decreases in utilization. For 2018 and the rest of the projection period,
these utilization and intensity increases are assumed to be equal to the
growth and aging of the population plus 1 percent annually.
Reimbursement per episode of care59 is assumed to increase at a
slightly higher rate than increases in general earnings, but
adjustments to reflect statutory limits on HHA reimbursement per
episode are included where appropriate. As with other services, a least-
squares regression model was used to develop market basket increases,
which are reduced by the increase in economy-wide productivity
beginning in 2015. Costs also increase by a case mix increase factor.
Case mix increases have been modest and decreased in 2011 and 2012
before rebounding in 2013 through 2016. HHA case mix increases are
projected to increase at a rate of 1.5 percent annually beginning in
2018. CMS adjusted HHA payment levels from 2008 through 2013 to
gradually offset the financial effect of the unduly high mix of services
in the first and subsequent years. HHA payment rates were rebased
starting in 2014, with an estimated 14-percent reduction in payments
to be phased in over a 4-year period. Projected HHA costs reflect these
regulatory adjustments. As is the case for all types of Medicare
benefits, the projected home health expenditures also reflect the
specified reductions due to sequestration. Table IV.A2 shows the
resulting increases in fee-for-service expenditures for HHA services.
HI covers certain hospice care for terminally ill beneficiaries. Hospice
payments were originally very small relative to total HI benefit
payments, but they have grown rapidly in most years and now
substantially exceed the level of HI home health expenditures. This
growth rate is composed of two factors: (i) the price update, which is a
function of the hospital market basket with an adjustment for
economy-wide productivity, and (ii) a residual, which includes all other
factors. This residual grew at a rate of about 5 percent annually from
2008 to 2013, became negative in 2014, and rebounded in 2015 through
2017. For 2018 and the remainder of the projection period, it is
expected to increase at the 2008-2013 rate. Although detailed hospice
data are scant at this time, estimates for hospice benefit payment
increases are based on mandated daily payment rates and annual
payment caps, and these estimates assume a deceleration in the
growth in the number of covered days.
59Under the HHA prospective payment system, Medicare payments are made for each
episode of care, rather than for each individual home health visit.
Actuarial Methodology
122
d. Private Health Plan Costs
HI payments to private health plans have generally increased
significantly from the time that such plans began to participate in the
Medicare program in the 1970s. Most of the growth in expenditures
has been attributable to the increasing numbers of beneficiaries who
have enrolled in these plans. Section IV.C of this report contains a
description of the private health plan assumptions and methodology.
e. Administrative Expenses
Historically, the cost of administering the HI trust fund has remained
relatively small in comparison with benefit amounts. The ratio of
administrative expenses to benefit payments has generally fallen
within the range of 1 to 3 percent. The short-range projection of
administrative cost is based on estimates of workloads and approved
budgets for Medicare Administrative Contractors and CMS. In
addition, due to the sequester, the administrative costs reflect an
estimated 5- to 7-percent reduction for the period April 2013 through
September 2027. In the long range, administrative cost increases are
based on assumed increases in workloads, primarily due to growth and
aging of the population, and on assumed unit cost increases equal to
the increases in average annual covered wages.
2. Summary of Aggregate Reimbursement Amounts on an
Incurred Basis under the Intermediate Assumptions
Table IV.A3 shows aggregate historical and projected reimbursement
amounts by type of service on an incurred basis under the intermediate
assumptions.
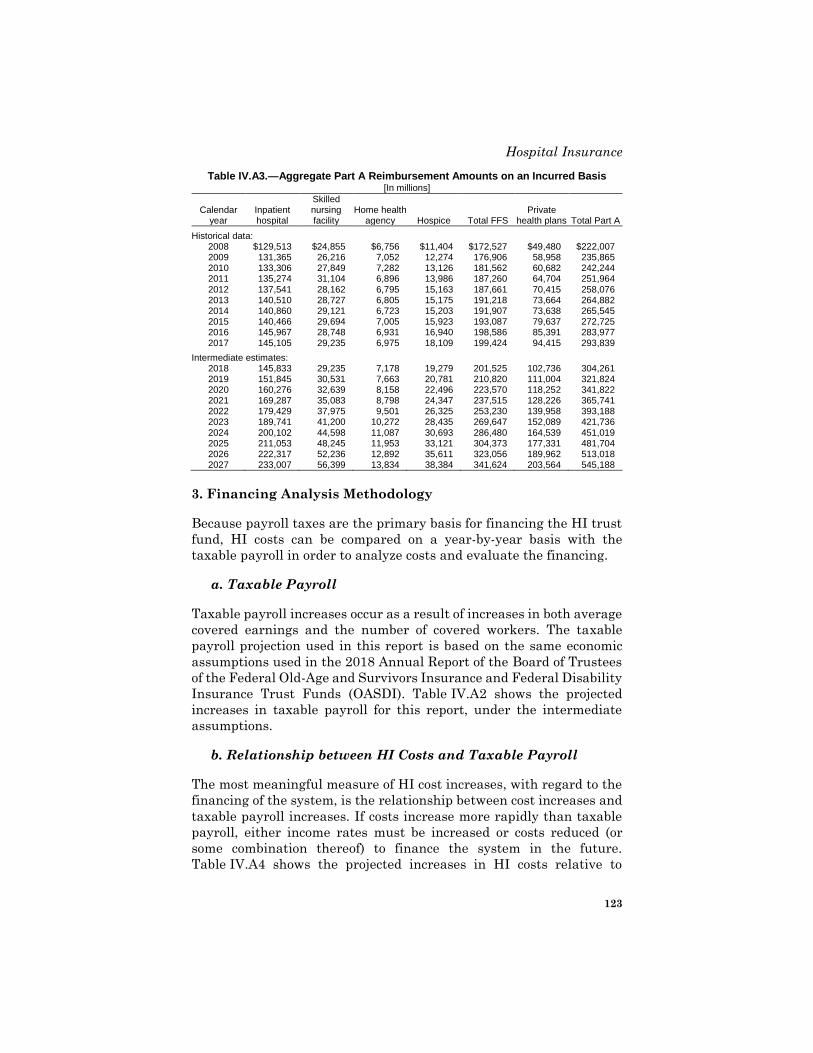
Hospital Insurance
123
Table IV.A3.—Aggregate Part A Reimbursement Amounts on an Incurred Basis [In millions]
Calendar year
Inpatient hospital
Skilled nursing facility
Home health agency Hospice Total FFS
Private health plans Total Part A
Historical data: 2008 $129,513 $24,855 $6,756 $11,404 $172,527 $49,480 $222,007 2009 131,365 26,216 7,052 12,274 176,906 58,958 235,865 2010 133,306 27,849 7,282 13,126 181,562 60,682 242,244 2011 135,274 31,104 6,896 13,986 187,260 64,704 251,964 2012 137,541 28,162 6,795 15,163 187,661 70,415 258,076 2013 140,510 28,727 6,805 15,175 191,218 73,664 264,882 2014 140,860 29,121 6,723 15,203 191,907 73,638 265,545 2015 140,466 29,694 7,005 15,923 193,087 79,637 272,725 2016 145,967 28,748 6,931 16,940 198,586 85,391 283,977 2017 145,105 29,235 6,975 18,109 199,424 94,415 293,839
Intermediate estimates: 2018 145,833 29,235 7,178 19,279 201,525 102,736 304,261 2019 151,845 30,531 7,663 20,781 210,820 111,004 321,824 2020 160,276 32,639 8,158 22,496 223,570 118,252 341,822 2021 169,287 35,083 8,798 24,347 237,515 128,226 365,741 2022 179,429 37,975 9,501 26,325 253,230 139,958 393,188 2023 189,741 41,200 10,272 28,435 269,647 152,089 421,736 2024 200,102 44,598 11,087 30,693 286,480 164,539 451,019 2025 211,053 48,245 11,953 33,121 304,373 177,331 481,704 2026 222,317 52,236 12,892 35,611 323,056 189,962 513,018 2027 233,007 56,399 13,834 38,384 341,624 203,564 545,188
3. Financing Analysis Methodology
Because payroll taxes are the primary basis for financing the HI trust
fund, HI costs can be compared on a year-by-year basis with the
taxable payroll in order to analyze costs and evaluate the financing.
a. Taxable Payroll
Taxable payroll increases occur as a result of increases in both average
covered earnings and the number of covered workers. The taxable
payroll projection used in this report is based on the same economic
assumptions used in the 2018 Annual Report of the Board of Trustees
of the Federal Old-Age and Survivors Insurance and Federal Disability
Insurance Trust Funds (OASDI). Table IV.A2 shows the projected
increases in taxable payroll for this report, under the intermediate
assumptions.
b. Relationship between HI Costs and Taxable Payroll
The most meaningful measure of HI cost increases, with regard to the
financing of the system, is the relationship between cost increases and
taxable payroll increases. If costs increase more rapidly than taxable
payroll, either income rates must be increased or costs reduced (or
some combination thereof) to finance the system in the future.
Table IV.A4 shows the projected increases in HI costs relative to
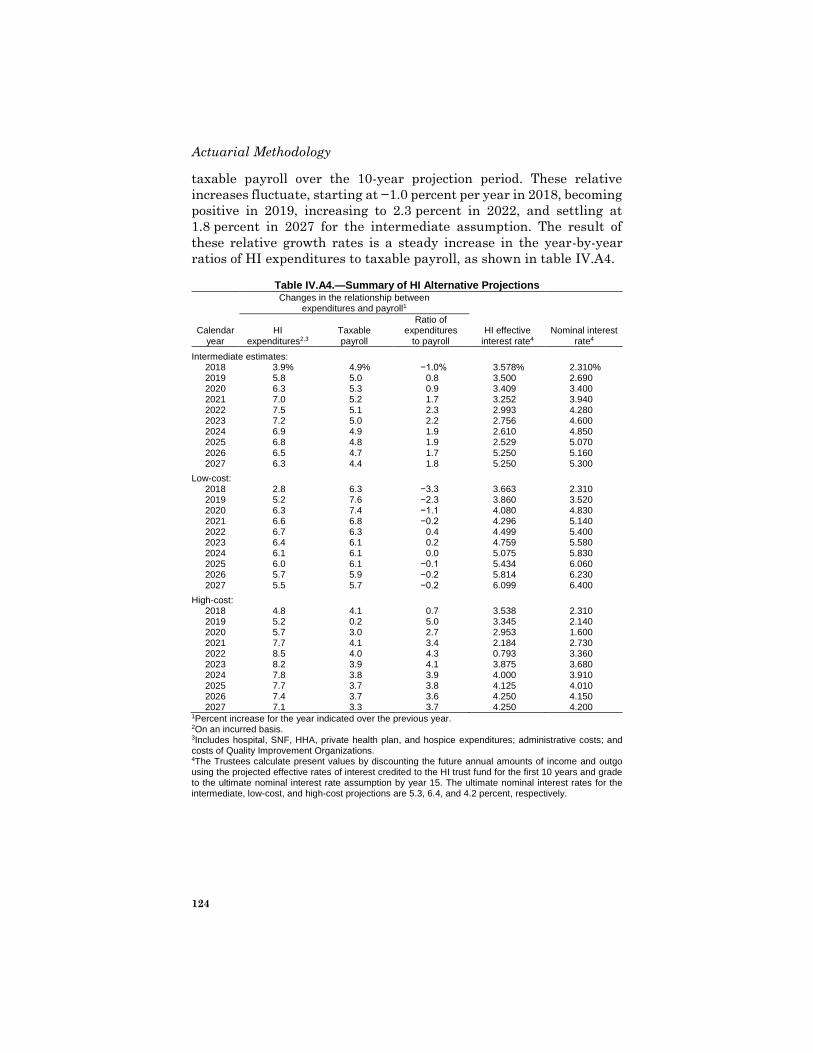
Actuarial Methodology
124
taxable payroll over the 10-year projection period. These relative
increases fluctuate, starting at −1.0 percent per year in 2018, becoming
positive in 2019, increasing to 2.3 percent in 2022, and settling at
1.8 percent in 2027 for the intermediate assumption. The result of
these relative growth rates is a steady increase in the year-by-year
ratios of HI expenditures to taxable payroll, as shown in table IV.A4.
Table IV.A4.—Summary of HI Alternative Projections
Changes in the relationship between
expenditures and payroll1
Calendar year
HI expenditures2,3
Taxable payroll
Ratio of expenditures
to payroll HI effective
interest rate4 Nominal interest
rate4
Intermediate estimates: 2018 3.9% 4.9% −1.0% 3.578% 2.310% 2019 5.8 5.0 0.8 3.500 2.690 2020 6.3 5.3 0.9 3.409 3.400 2021 7.0 5.2 1.7 3.252 3.940 2022 7.5 5.1 2.3 2.993 4.280 2023 7.2 5.0 2.2 2.756 4.600 2024 6.9 4.9 1.9 2.610 4.850 2025 6.8 4.8 1.9 2.529 5.070 2026 6.5 4.7 1.7 5.250 5.160 2027 6.3 4.4 1.8 5.250 5.300
Low-cost: 2018 2.8 6.3 −3.3 3.663 2.310 2019 5.2 7.6 −2.3 3.860 3.520 2020 6.3 7.4 −1.1 4.080 4.830 2021 6.6 6.8 −0.2 4.296 5.140 2022 6.7 6.3 0.4 4.499 5.400 2023 6.4 6.1 0.2 4.759 5.580 2024 6.1 6.1 0.0 5.075 5.830 2025 6.0 6.1 −0.1 5.434 6.060 2026 5.7 5.9 −0.2 5.814 6.230 2027 5.5 5.7 −0.2 6.099 6.400
High-cost: 2018 4.8 4.1 0.7 3.538 2.310 2019 5.2 0.2 5.0 3.345 2.140 2020 5.7 3.0 2.7 2.953 1.600 2021 7.7 4.1 3.4 2.184 2.730 2022 8.5 4.0 4.3 0.793 3.360 2023 8.2 3.9 4.1 3.875 3.680 2024 7.8 3.8 3.9 4.000 3.910 2025 7.7 3.7 3.8 4.125 4.010 2026 7.4 3.7 3.6 4.250 4.150 2027 7.1 3.3 3.7 4.250 4.200
1Percent increase for the year indicated over the previous year. 2On an incurred basis. 3Includes hospital, SNF, HHA, private health plan, and hospice expenditures; administrative costs; and costs of Quality Improvement Organizations. 4The Trustees calculate present values by discounting the future annual amounts of income and outgo using the projected effective rates of interest credited to the HI trust fund for the first 10 years and grade to the ultimate nominal interest rate assumption by year 15. The ultimate nominal interest rates for the intermediate, low-cost, and high-cost projections are 5.3, 6.4, and 4.2 percent, respectively.
Hospital Insurance
125
4. Projections under Alternative Assumptions
Projected HI expenditures under current law are subject to
considerable uncertainty. To illustrate this uncertainty, HI costs have
been projected under three alternative sets of assumptions.
Under the low-cost alternative over the 10-year projection period,
increases in HI expenditures, relative to increases in taxable payroll,
follow a pattern similar to that for the intermediate assumption, but
at a somewhat lower rate; the rate for expenditures becomes
3.3 percent less than the rate for taxable payroll by 2018 but then
increases, reaching 0.2 percent less per year than taxable payroll by
2027. Under the high-cost alternative, the ratio of expenditures to
payroll fluctuates from 0.7 percent in 2018 to 3.7 percent by 2027, as
shown in table IV.A4.
Beyond the first 25-year projection period, HI costs under the
intermediate assumptions are based on the assumption that average
per beneficiary expenditures (excluding demographic impacts) will
increase at the baseline rates determined by the economic model
described in sections II.C and IV.D less the economy-wide productivity
adjustments. This rate is about the same as the increase in the Gross
Domestic Product (GDP) per capita in 2042 but would decelerate to
0.3 percentage point slower than GDP per capita by 2092. HI
expenditures, which were 3.5 percent of taxable payroll in 2017,
increase to 4.9 percent by 2042 and to 5.2 percent by 2092 under the
intermediate assumptions. Accordingly, if all of the projection
assumptions were realized over time, the HI income rates (3.95 percent
of taxable payroll summarized over 75 years) would be inadequate to
support the HI cost.
During the first 25-year projection period, the low-cost and high-cost
alternatives contain assumptions that result in HI costs increasing,
relative to taxable payroll increases, approximately 2 percentage
points less rapidly and 2 percentage points more rapidly, respectively,
than the results under the intermediate assumptions. Costs beyond the
first 25-year projection period assume that the 2-percentage-point
differential gradually decreases until 2067, when HI cost increases
relative to taxable payroll are approximately the same as under the
intermediate assumptions.
Assumptions regarding income to the HI trust fund—including payroll
taxes, income from the taxation of benefits, interest, and other income
items—and assumptions regarding administrative costs are consistent
with those underlying the OASDI report.
Actuarial Methodology
126
B. SUPPLEMENTARY MEDICAL INSURANCE
SMI consists of Part B and, since 2004, Part D. The benefits provided
by each part are quite different. The actuarial methodologies used to
produce the estimates for each part reflect these differences and thus
appear in separate sections (IV.B1 and IV.B2).
1. Part B
a. Cost Projection Methodology
Estimates under the intermediate assumptions are calculated
separately for each category of enrollee and for each type of service.
The estimates are prepared by establishing the allowed charges or
costs incurred per enrollee for a recent year (to serve as a projection
base) and then projecting these charges through the estimation period.
The per enrollee charges are then converted to reimbursement
amounts by subtracting the per enrollee values of the deductible and
coinsurance. Aggregate reimbursement amounts are calculated by
multiplying the per enrollee reimbursement amounts by the projected
enrollment. In order to estimate cash expenditures, an allowance is
made for the delay between receipt of, and payment for, the service.
(1) Projection Base
To establish a suitable base from which to project the future Part B
costs, the incurred payments for services provided must be constructed
for the most recent period for which a reliable determination can be
made. Accordingly, payments to providers must be attributed to dates
of service, rather than to payment dates; in addition, the nonrecurring
effects of any changes in regulations, legislation, or administration,
and of any items affecting only the timing and flow of payments to
providers, must be eliminated. As a result, the rates of increase in the
Part B incurred cost differ from the increases in cash expenditures.
(a) Practitioner Services
Private contractors acting for the Centers for Medicare & Medicaid
Services (CMS) pay reimbursement amounts for services billed by
practitioners, including physician services, durable medical equipment
(DME), laboratory tests performed in physician offices and
independent laboratories, and other services (such as physician-
administered drugs, free-standing ambulatory surgical center facility
services, ambulance services, and supplies). These Medicare
Administrative Contractors (MACs) use CMS guidelines to determine
whether Part B covers billed services, establish the allowed charges for
Supplementary Medical Insurance
127
covered services, and transmit to CMS a record of the allowed charges,
the applicable deductible and coinsurance, and the amount reimbursed
after reduction for coinsurance and the deductible.
The data are tabulated on an incurred basis. As a check on the validity
of the projection base, incurred reimbursement amounts are compared
with cash expenditures.
(b) Institutional Services
The same MACs also pay reimbursement amounts for institutional
services covered under Part B. These include outpatient hospital
services, home health agency services, laboratory services performed
in hospital outpatient departments, and such services as renal dialysis
performed in free-standing dialysis facilities, services in outpatient
rehabilitation facilities, and services in rural health clinics.
Separate payment systems exist for almost all the Part B institutional
services. For these systems, the MACs determine whether Part B
covers billed services, establish the allowed payment for covered
services, and send to CMS a record of the allowed payment, the
applicable deductible and coinsurance, and the amount reimbursed
after reduction for coinsurance and the deductible.
For those services still reimbursed on a reasonable-cost basis, the costs
for covered services are determined on the basis of provider cost
reports. Reimbursement for these services occurs in two stages. First,
bills are submitted by providers to the MACs, and interim payments
are made on the basis of these bills. The second stage takes place at
the close of a provider’s accounting period, when a cost report is
submitted and lump-sum payments or recoveries are made to correct
for the difference between interim payments and final settlement
amounts for providing covered services (net of coinsurance and
deductible amounts). Tabulations of the bills are prepared by date of
service, and the lump-sum settlements, which are reported only on a
cash basis, are adjusted (using approximations) to allocate them to the
time of service.
(c) Private Health Plan Services
Private health plans with contracts to provide Part B services to
Medicare beneficiaries are reimbursed directly by CMS on either a
reasonable-cost or capitation basis. Section IV.C of this report contains
a description of the assumptions and methodology used to estimate
payments to private plans.
Actuarial Methodology
128
(2) Projected Fee-for-Service Payments for Aged Enrollees and
Disabled Enrollees without End-Stage Renal Disease (ESRD)
Part B enrollees with ESRD have per enrollee costs that are
substantially higher and quite different in nature from those of most
other beneficiaries. Accordingly, the analysis in this section excludes
their Part B costs. Those costs, as well as costs associated with
beneficiaries enrolled in private health plans, are discussed later in
this section.
(a) Practitioner Services
i. Physician Services
Medicare payments for physician services are based on a fee schedule,
which reflects the relative level of resources required for each service.
The fee schedule amount is equal to the product of the procedure’s
relative value, a conversion factor, and a geographic adjustment factor.
Payments are based on the lower of the actual charge and the fee
schedule amount.
The physician fee schedule updates are specified by law for every
future year. For 2018 the update is 0.5 percent, for 2019 the update
will be 0.25 percent, and for 2020-2025 the annual update will be
0 percent. Starting in 2026, the annual update for qualified physicians
in advanced alternative payment models (advanced APMs) will be
0.75 percent, and, for all other physicians, the update each year will be
0.25 percent.
Per capita physician charges have also changed each year as a result
of a number of other factors besides fee increases, including more
physician visits and related services per enrollee, the aging of the
Medicare population, greater use of specialists and more expensive
techniques, and certain administrative actions.
Table IV.B1 shows increases in total allowed charges per fee-for-
service enrollee for the physician fee schedule and practitioner
services. The sequestration of all Medicare payments in 2013 through
September 2027 does not affect allowed charges and therefore is not
reflected in table IV.B1; rather, that impact is included in table IV.B2.
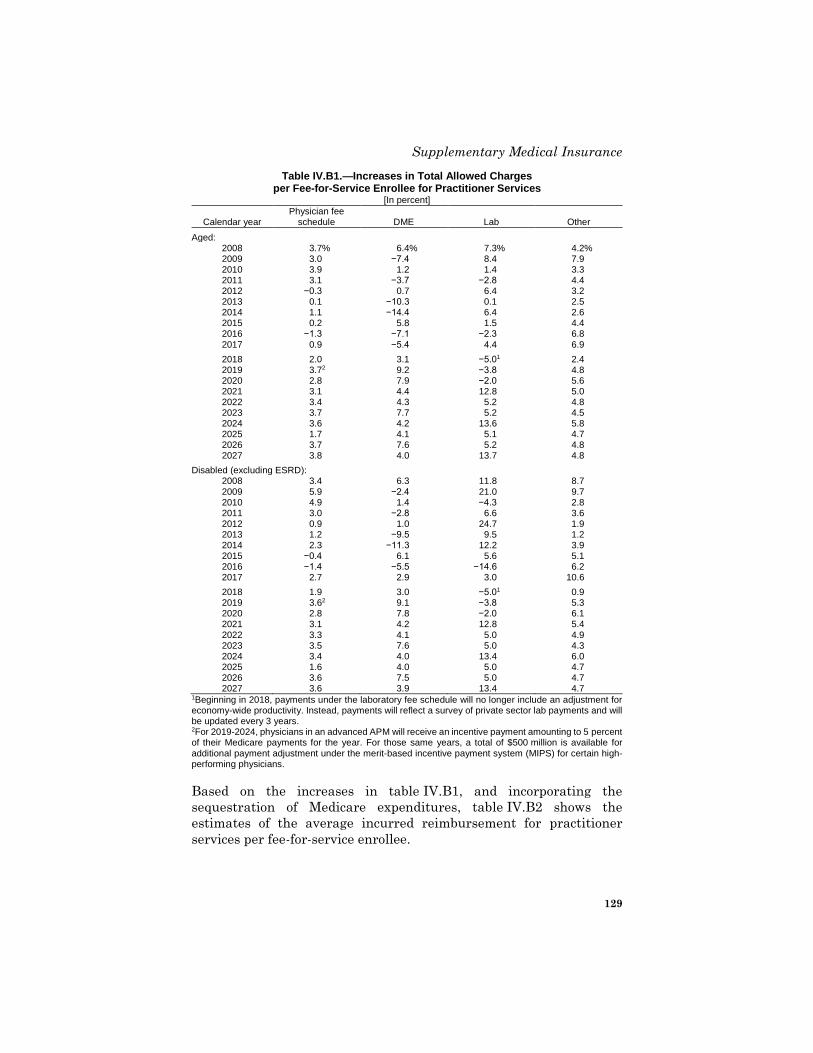
Supplementary Medical Insurance
129
Table IV.B1.—Increases in Total Allowed Charges per Fee-for-Service Enrollee for Practitioner Services
[In percent]
Calendar year Physician fee
schedule DME Lab Other
Aged: 2008 3.7 % 6.4 % 7.3 % 4.2 % 2009 3.0 −7.4 8.4 7.9 2010 3.9 1.2 1.4 3.3 2011 3.1 −3.7 −2.8 4.4 2012 −0.3 0.7 6.4 3.2 2013 0.1 −10.3 0.1 2.5 2014 1.1 −14.4 6.4 2.6 2015 0.2 5.8 1.5 4.4 2016 −1.3 −7.1 −2.3 6.8
2017 0.9 −5.4 4.4 6.9
2018 2.0 3.1 −5.0 1 2.4 2019 3.7 2 9.2 −3.8 4.8 2020 2.8 7.9 −2.0 5.6 2021 3.1 4.4 12.8 5.0 2022 3.4 4.3 5.2 4.8 2023 3.7 7.7 5.2 4.5 2024 3.6 4.2 13.6 5.8 2025 1.7 4.1 5.1 4.7 2026 3.7 7.6 5.2 4.8 2027 3.8 4.0 13.7 4.8
Disabled (excluding ESRD): 2008 3.4 6.3 11.8 8.7 2009 5.9 −2.4 21.0 9.7 2010 4.9 1.4 −4.3 2.8 2011 3.0 −2.8 6.6 3.6 2012 0.9 1.0 24.7 1.9 2013 1.2 −9.5 9.5 1.2 2014 2.3 −11.3 12.2 3.9 2015 −0.4 6.1 5.6 5.1 2016 −1.4 −5.5 −14.6 6.2 2017 2.7 2.9 3.0 10.6
2018 1.9 3.0 −5.0 1 0.9 2019 3.6 2 9.1 −3.8 5.3 2020 2.8 7.8 −2.0 6.1 2021 3.1 4.2 12.8 5.4 2022 3.3 4.1 5.0 4.9 2023 3.5 7.6 5.0 4.3 2024 3.4 4.0 13.4 6.0 2025 1.6 4.0 5.0 4.7 2026 3.6 7.5 5.0 4.7 2027 3.6 3.9 13.4 4.7
1Beginning in 2018, payments under the laboratory fee schedule will no longer include an adjustment for economy-wide productivity. Instead, payments will reflect a survey of private sector lab payments and will be updated every 3 years. 2For 2019-2024, physicians in an advanced APM will receive an incentive payment amounting to 5 percent of their Medicare payments for the year. For those same years, a total of $500 million is available for additional payment adjustment under the merit-based incentive payment system (MIPS) for certain high-performing physicians.
Based on the increases in table IV.B1, and incorporating the
sequestration of Medicare expenditures, table IV.B2 shows the
estimates of the average incurred reimbursement for practitioner
services per fee-for-service enrollee.
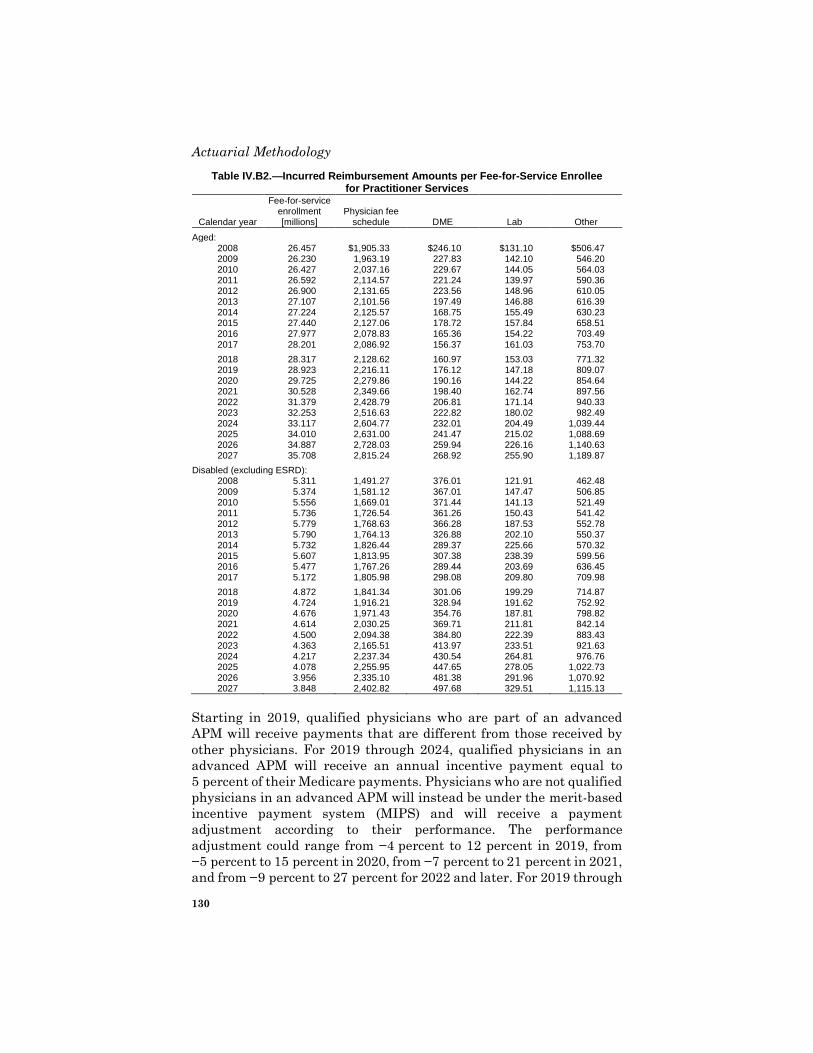
Actuarial Methodology
130
Table IV.B2.—Incurred Reimbursement Amounts per Fee-for-Service Enrollee for Practitioner Services
Calendar year
Fee-for-service enrollment [millions]
Physician fee schedule DME Lab Other
Aged: 2008 26.457 $1,905.33 $246.10 $131.10 $506.47 2009 26.230 1,963.19 227.83 142.10 546.20 2010 26.427 2,037.16 229.67 144.05 564.03 2011 26.592 2,114.57 221.24 139.97 590.36 2012 26.900 2,131.65 223.56 148.96 610.05 2013 27.107 2,101.56 197.49 146.88 616.39 2014 27.224 2,125.57 168.75 155.49 630.23 2015 27.440 2,127.06 178.72 157.84 658.51 2016 27.977 2,078.83 165.36 154.22 703.49
2017 28.201 2,086.92 156.37 161.03 753.70
2018 28.317 2,128.62 160.97 153.03 771.32 2019 28.923 2,216.11 176.12 147.18 809.07 2020 29.725 2,279.86 190.16 144.22 854.64 2021 30.528 2,349.66 198.40 162.74 897.56 2022 31.379 2,428.79 206.81 171.14 940.33 2023 32.253 2,516.63 222.82 180.02 982.49 2024 33.117 2,604.77 232.01 204.49 1,039.44 2025 34.010 2,631.00 241.47 215.02 1,088.69 2026 34.887 2,728.03 259.94 226.16 1,140.63 2027 35.708 2,815.24 268.92 255.90 1,189.87
Disabled (excluding ESRD): 2008 5.311 1,491.27 376.01 121.91 462.48 2009 5.374 1,581.12 367.01 147.47 506.85 2010 5.556 1,669.01 371.44 141.13 521.49 2011 5.736 1,726.54 361.26 150.43 541.42 2012 5.779 1,768.63 366.28 187.53 552.78 2013 5.790 1,764.13 326.88 202.10 550.37 2014 5.732 1,826.44 289.37 225.66 570.32 2015 5.607 1,813.95 307.38 238.39 599.56 2016 5.477 1,767.26 289.44 203.69 636.45 2017 5.172 1,805.98 298.08 209.80 709.98
2018 4.872 1,841.34 301.06 199.29 714.87 2019 4.724 1,916.21 328.94 191.62 752.92 2020 4.676 1,971.43 354.76 187.81 798.82 2021 4.614 2,030.25 369.71 211.81 842.14 2022 4.500 2,094.38 384.80 222.39 883.43 2023 4.363 2,165.51 413.97 233.51 921.63 2024 4.217 2,237.34 430.54 264.81 976.76 2025 4.078 2,255.95 447.65 278.05 1,022.73 2026 3.956 2,335.10 481.38 291.96 1,070.92 2027 3.848 2,402.82 497.68 329.51 1,115.13
Starting in 2019, qualified physicians who are part of an advanced
APM will receive payments that are different from those received by
other physicians. For 2019 through 2024, qualified physicians in an
advanced APM will receive an annual incentive payment equal to
5 percent of their Medicare payments. Physicians who are not qualified
physicians in an advanced APM will instead be under the merit-based
incentive payment system (MIPS) and will receive a payment
adjustment according to their performance. The performance
adjustment could range from −4 percent to 12 percent in 2019, from
−5 percent to 15 percent in 2020, from −7 percent to 21 percent in 2021,
and from −9 percent to 27 percent for 2022 and later. For 2019 through
Supplementary Medical Insurance
131
2024, MIPS physicians could receive an additional payment
adjustment for high performance of up to 10 percent. The total of all
additional payment adjustments made to MIPS physicians in a year
must not exceed $500 million. For 2026 and later, qualified physicians
in an advanced APM will receive an update of 0.75 percent while MIPS
physicians will receive a 0.25-percent update. Based on these payment
mechanisms, the existing demonstration and payment models, the
requirements for becoming an advanced APM qualified physician, and
consideration of a November 2016 final rule,60 the Trustees assume
that physician participation in advanced APMs will grow from
13.5 percent of spending in 2019 to 100 percent by 2065.
ii. Durable Medical Equipment (DME), Laboratory, and
Other Practitioner Services
Unique fee schedules or reimbursement mechanisms have been
established not only for physician services but also for virtually all
other non-physician practitioner services. Table IV.B1 shows the
increases in the allowed charges per fee-for-service enrollee for DME,
laboratory services, and other services. As noted previously, allowed
charges are not affected by the sequestration of payment. Based on the
increases in table IV.B1, table IV.B2 shows the corresponding
estimates of the average incurred reimbursement amounts for these
services per fee-for-service enrollee; these amounts are affected by the
sequestration.
Prior to 2011, DME items and laboratory services were updated by
increases in the CPI, together with any applicable legislated limits on
payment updates. Beginning in 2011, these items and services were
updated by the increase in the CPI minus the increase in the 10-year
moving average of economy-wide productivity. However, a competitive-
bidding process was implemented that year to determine Medicare
payment for a certain portion of DME items, and as a result this
portion is no longer updated by the CPI or affected by the annual
productivity adjustments. Similarly, beginning in 2018, Medicare
payments for laboratory services are linked to private payment rates,
and consequently these services are no longer updated by the CPI
60This final rule, titled “Medicare Program; Merit-Based Incentive Payment System
(MIPS) and Alternative Payment Model (APM) Incentive Under the Physician Fee
Schedule, and Criteria for Physician-Focused Payment Models,” was published in the
Federal Register on November 4, 2016 and can be found at
https://www.federalregister.gov/documents/2016/11/04/2016-25240/medicare-program-
merit-based-incentive-payment-system-mips-and-alternative-payment-model-apm.
Actuarial Methodology
132
minus the productivity adjustments.61 Per capita charges for these
expenditure categories have also grown as a result of other factors,
including increased number of services provided, the aging of the
Medicare population, more expensive services, and certain
administrative actions. This expenditure growth is projected based on
recent past trends in growth per enrollee.
(b) Institutional Services
Over the years, legislation has established new payment systems for
virtually all Part B institutional services, including a fee schedule for
tests performed in laboratories in hospital outpatient departments.
The Balanced Budget Act of 1997 implemented a prospective payment
system (PPS), which began on August 1, 2000, for services performed
in the outpatient department of a hospital. It also implemented a PPS
for home health agency services, which began on October 1, 2000.
Table IV.B3 shows the historical and projected increases in charges
and costs per fee-for-service enrollee for institutional services,
excluding the impact of sequestration.
61Under the Protecting Access to Medicare Act of 2014, these changes were to be effective
in 2017; however, CMS delayed implementation until 2018. These changes also apply to
outpatient hospital laboratory services.
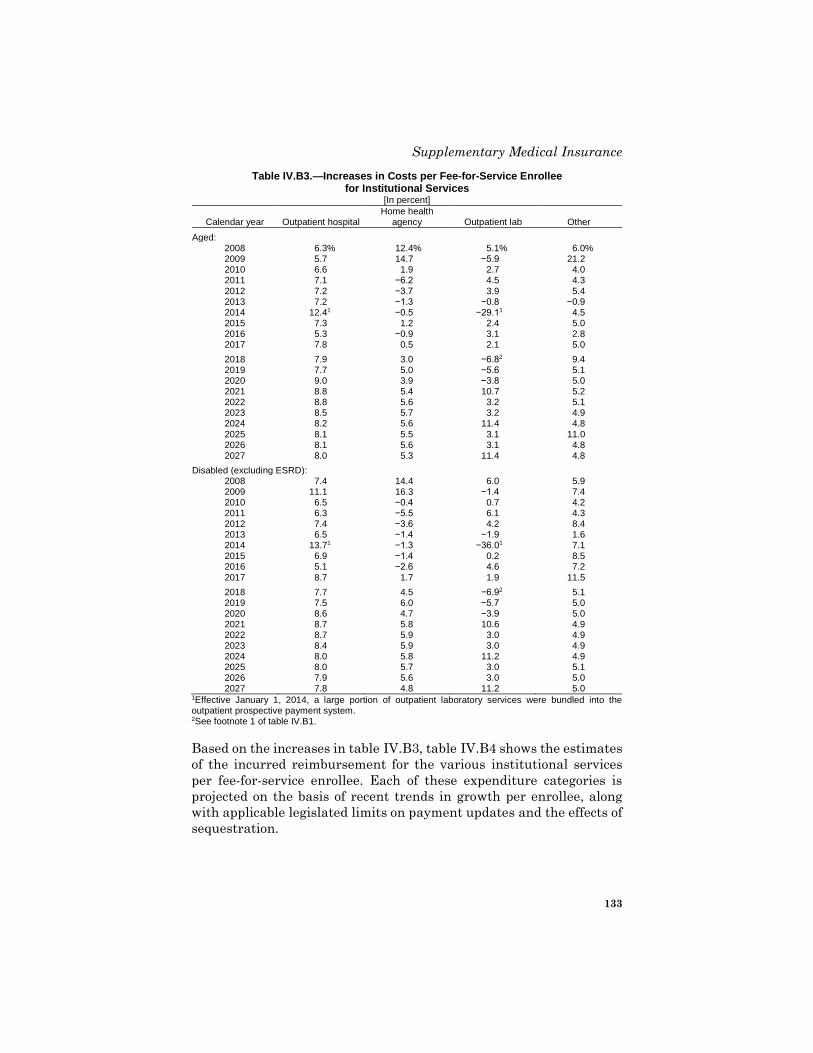
Supplementary Medical Insurance
133
Table IV.B3.—Increases in Costs per Fee-for-Service Enrollee for Institutional Services
[In percent]
Calendar year Outpatient hospital Home health
agency Outpatient lab Other
Aged: 2008 6.3 % 12.4 % 5.1 % 6.0 % 2009 5.7 14.7 −5.9 21.2 2010 6.6 1.9 2.7 4.0 2011 7.1 −6.2 4.5 4.3 2012 7.2 −3.7 3.9 5.4 2013 7.2 −1.3 −0.8 −0.9 2014 12.4 1 −0.5 −29.1 1 4.5 2015 7.3 1.2 2.4 5.0 2016 5.3 −0.9 3.1 2.8 2017 7.8 0.5 2.1 5.0
2018 7.9 3.0 −6.8 2 9.4 2019 7.7 5.0 −5.6 5.1 2020 9.0 3.9 −3.8 5.0 2021 8.8 5.4 10.7 5.2 2022 8.8 5.6 3.2 5.1 2023 8.5 5.7 3.2 4.9 2024 8.2 5.6 11.4 4.8 2025 8.1 5.5 3.1 11.0 2026 8.1 5.6 3.1 4.8 2027 8.0 5.3 11.4 4.8
Disabled (excluding ESRD): 2008 7.4 14.4 6.0 5.9 2009 11.1 16.3 −1.4 7.4 2010 6.5 −0.4 0.7 4.2 2011 6.3 −5.5 6.1 4.3 2012 7.4 −3.6 4.2 8.4 2013 6.5 −1.4 −1.9 1.6 2014 13.7 1 −1.3 −36.0 1 7.1 2015 6.9 −1.4 0.2 8.5 2016 5.1 −2.6 4.6 7.2
2017 8.7 1.7 1.9 11.5
2018 7.7 4.5 −6.9 2 5.1 2019 7.5 6.0 −5.7 5.0 2020 8.6 4.7 −3.9 5.0 2021 8.7 5.8 10.6 4.9 2022 8.7 5.9 3.0 4.9 2023 8.4 5.9 3.0 4.9 2024 8.0 5.8 11.2 4.9 2025 8.0 5.7 3.0 5.1 2026 7.9 5.6 3.0 5.0 2027 7.8 4.8 11.2 5.0
1Effective January 1, 2014, a large portion of outpatient laboratory services were bundled into the outpatient prospective payment system. 2See footnote 1 of table IV.B1.
Based on the increases in table IV.B3, table IV.B4 shows the estimates
of the incurred reimbursement for the various institutional services
per fee-for-service enrollee. Each of these expenditure categories is
projected on the basis of recent trends in growth per enrollee, along
with applicable legislated limits on payment updates and the effects of
sequestration.
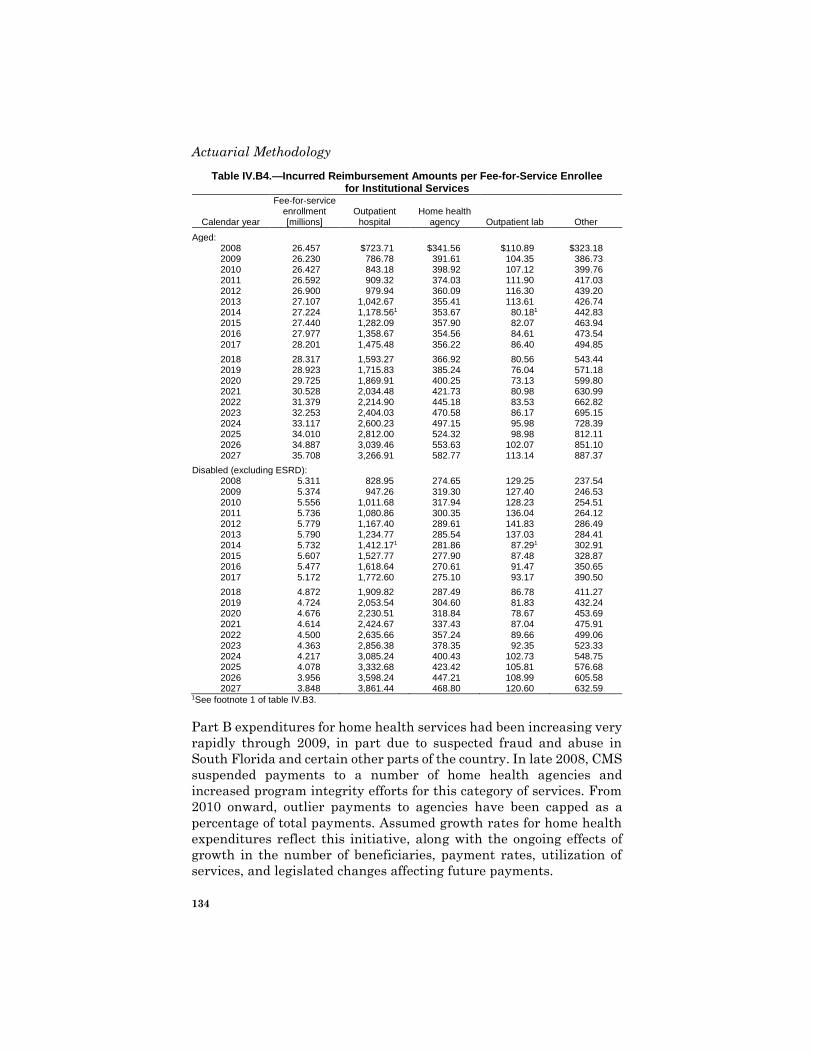
Actuarial Methodology
134
Table IV.B4.—Incurred Reimbursement Amounts per Fee-for-Service Enrollee for Institutional Services
Calendar year
Fee-for-service enrollment [millions]
Outpatient hospital
Home health agency Outpatient lab Other
Aged: 2008 26.457 $723.71 $341.56 $110.89 $323.18 2009 26.230 786.78 391.61 104.35 386.73 2010 26.427 843.18 398.92 107.12 399.76 2011 26.592 909.32 374.03 111.90 417.03 2012 26.900 979.94 360.09 116.30 439.20 2013 27.107 1,042.67 355.41 113.61 426.74 2014 27.224 1,178.56 1 353.67 80.18 1 442.83 2015 27.440 1,282.09 357.90 82.07 463.94 2016 27.977 1,358.67 354.56 84.61 473.54
2017 28.201 1,475.48 356.22 86.40 494.85
2018 28.317 1,593.27 366.92 80.56 543.44 2019 28.923 1,715.83 385.24 76.04 571.18 2020 29.725 1,869.91 400.25 73.13 599.80 2021 30.528 2,034.48 421.73 80.98 630.99 2022 31.379 2,214.90 445.18 83.53 662.82 2023 32.253 2,404.03 470.58 86.17 695.15 2024 33.117 2,600.23 497.15 95.98 728.39 2025 34.010 2,812.00 524.32 98.98 812.11 2026 34.887 3,039.46 553.63 102.07 851.10 2027 35.708 3,266.91 582.77 113.14 887.37
Disabled (excluding ESRD): 2008 5.311 828.95 274.65 129.25 237.54 2009 5.374 947.26 319.30 127.40 246.53 2010 5.556 1,011.68 317.94 128.23 254.51 2011 5.736 1,080.86 300.35 136.04 264.12 2012 5.779 1,167.40 289.61 141.83 286.49 2013 5.790 1,234.77 285.54 137.03 284.41 2014 5.732 1,412.17 1 281.86 87.29 1 302.91 2015 5.607 1,527.77 277.90 87.48 328.87 2016 5.477 1,618.64 270.61 91.47 350.65 2017 5.172 1,772.60 275.10 93.17 390.50
2018 4.872 1,909.82 287.49 86.78 411.27 2019 4.724 2,053.54 304.60 81.83 432.24 2020 4.676 2,230.51 318.84 78.67 453.69 2021 4.614 2,424.67 337.43 87.04 475.91 2022 4.500 2,635.66 357.24 89.66 499.06 2023 4.363 2,856.38 378.35 92.35 523.33 2024 4.217 3,085.24 400.43 102.73 548.75 2025 4.078 3,332.68 423.42 105.81 576.68 2026 3.956 3,598.24 447.21 108.99 605.58 2027 3.848 3,861.44 468.80 120.60 632.59
1See footnote 1 of table IV.B3.
Part B expenditures for home health services had been increasing very
rapidly through 2009, in part due to suspected fraud and abuse in
South Florida and certain other parts of the country. In late 2008, CMS
suspended payments to a number of home health agencies and
increased program integrity efforts for this category of services. From
2010 onward, outlier payments to agencies have been capped as a
percentage of total payments. Assumed growth rates for home health
expenditures reflect this initiative, along with the ongoing effects of
growth in the number of beneficiaries, payment rates, utilization of
services, and legislated changes affecting future payments.
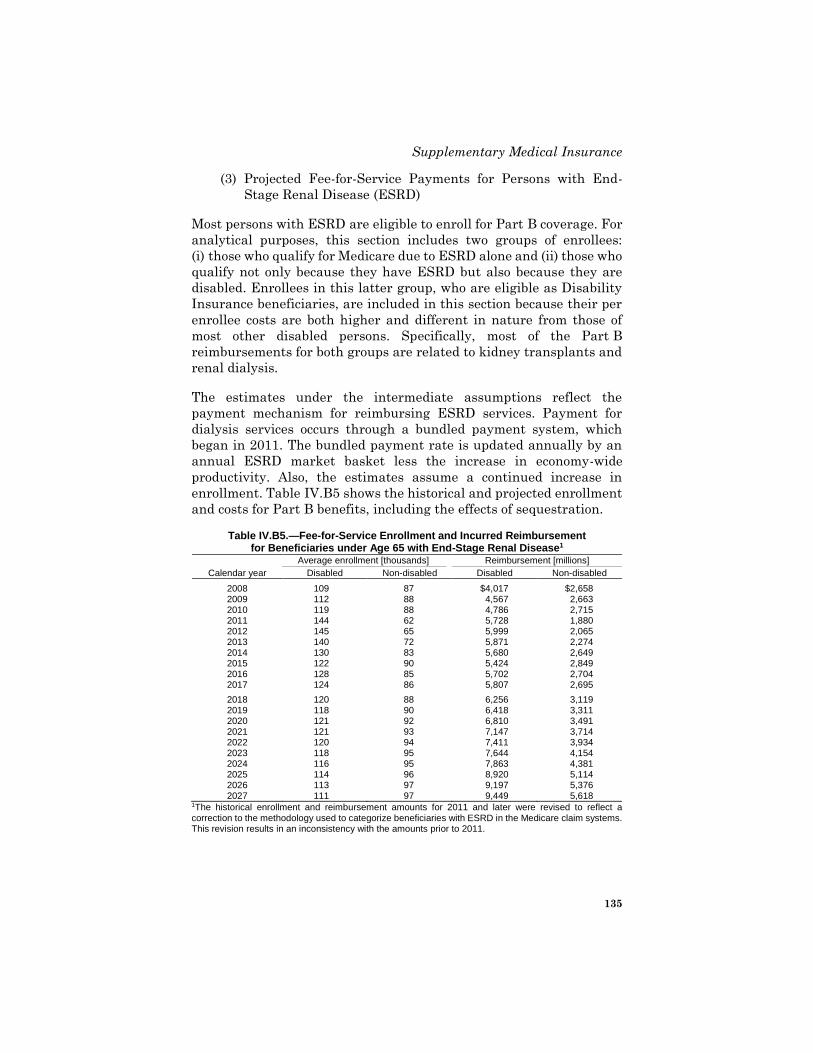
Supplementary Medical Insurance
135
(3) Projected Fee-for-Service Payments for Persons with End-
Stage Renal Disease (ESRD)
Most persons with ESRD are eligible to enroll for Part B coverage. For
analytical purposes, this section includes two groups of enrollees:
(i) those who qualify for Medicare due to ESRD alone and (ii) those who
qualify not only because they have ESRD but also because they are
disabled. Enrollees in this latter group, who are eligible as Disability
Insurance beneficiaries, are included in this section because their per
enrollee costs are both higher and different in nature from those of
most other disabled persons. Specifically, most of the Part B
reimbursements for both groups are related to kidney transplants and
renal dialysis.
The estimates under the intermediate assumptions reflect the
payment mechanism for reimbursing ESRD services. Payment for
dialysis services occurs through a bundled payment system, which
began in 2011. The bundled payment rate is updated annually by an
annual ESRD market basket less the increase in economy-wide
productivity. Also, the estimates assume a continued increase in
enrollment. Table IV.B5 shows the historical and projected enrollment
and costs for Part B benefits, including the effects of sequestration.
Table IV.B5.—Fee-for-Service Enrollment and Incurred Reimbursement for Beneficiaries under Age 65 with End-Stage Renal Disease1
Average enrollment [thousands] Reimbursement [millions]
Calendar year Disabled Non-disabled Disabled Non-disabled
2008 109 87 $4,017 $2,658 2009 112 88 4,567 2,663 2010 119 88 4,786 2,715 2011 144 62 5,728 1,880 2012 145 65 5,999 2,065 2013 140 72 5,871 2,274 2014 130 83 5,680 2,649 2015 122 90 5,424 2,849 2016 128 85 5,702 2,704 2017 124 86 5,807 2,695
2018 120 88 6,256 3,119 2019 118 90 6,418 3,311 2020 121 92 6,810 3,491 2021 121 93 7,147 3,714 2022 120 94 7,411 3,934 2023 118 95 7,644 4,154 2024 116 95 7,863 4,381 2025 114 96 8,920 5,114 2026 113 97 9,197 5,376 2027 111 97 9,449 5,618
1The historical enrollment and reimbursement amounts for 2011 and later were revised to reflect a correction to the methodology used to categorize beneficiaries with ESRD in the Medicare claim systems. This revision results in an inconsistency with the amounts prior to 2011.
Actuarial Methodology
136
(4) Private Health Plan Costs
Part B payments to private health plans have generally increased
significantly from the time that such plans began to participate in the
Medicare program in the 1970s. Most of the growth in expenditures
has been due to the increasing numbers of beneficiaries who have
enrolled in these plans. Section IV.C of this report contains a
description of the assumptions and methodology for the private health
plans that provide coverage of Part B services for certain enrollees.
(5) Administrative Expenses
The ratio of Part B administrative expenses to total expenditures has
been roughly 1.4 percent in recent years. Projections of administrative
costs are based on estimates of changes in average annual wages, fee-
for-service enrollment, and an estimated 5- to 7-percent reduction in
expenditures due to sequestration for the period April 2013 through
September 2027.
b. Summary of Aggregate Reimbursement Amounts on an
Incurred Basis under the Intermediate Assumptions
Table IV.B6 shows aggregate historical and projected reimbursement
amounts by type of service on an incurred basis under the intermediate
assumptions.
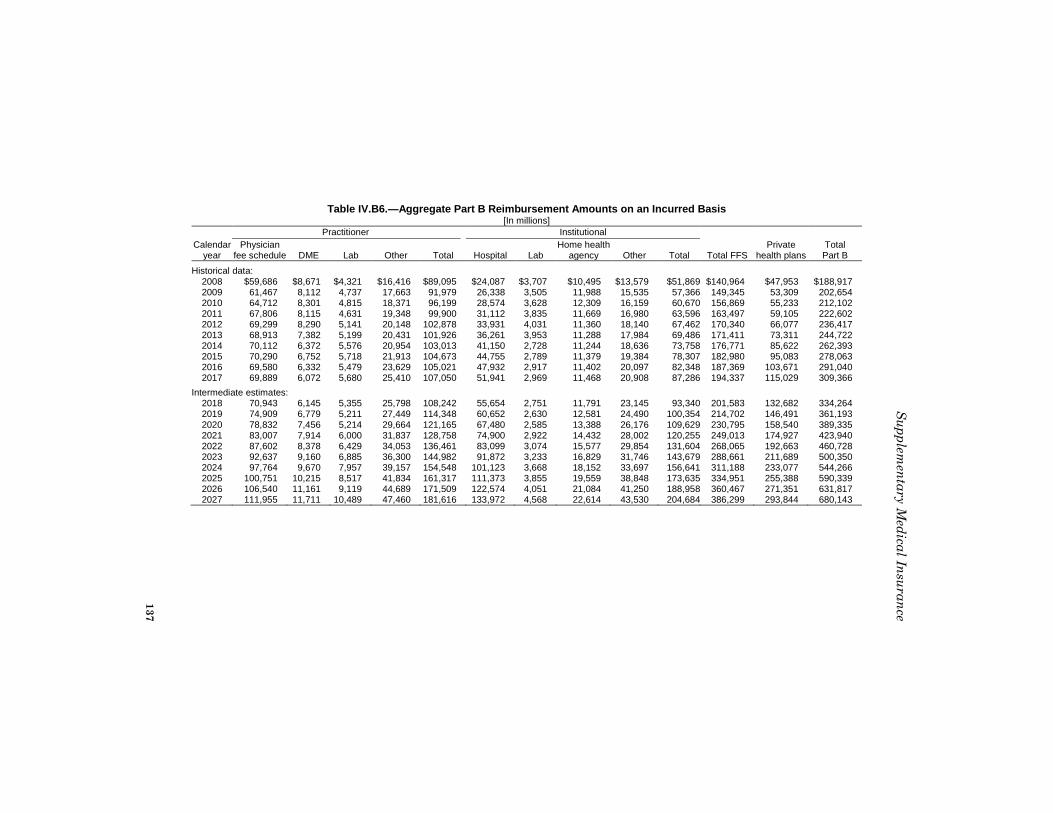
Table IV.B6.—Aggregate Part B Reimbursement Amounts on an Incurred Basis [In millions]
Practitioner Institutional Calendar
year Physician
fee schedule DME Lab Other Total Hospital Lab Home health
agency Other Total Total FFS Private
health plans Total Part B
Historical data: 2008 $59,686 $8,671 $4,321 $16,416 $89,095 $24,087 $3,707 $10,495 $13,579 $51,869 $140,964 $47,953 $188,917 2009 61,467 8,112 4,737 17,663 91,979 26,338 3,505 11,988 15,535 57,366 149,345 53,309 202,654 2010 64,712 8,301 4,815 18,371 96,199 28,574 3,628 12,309 16,159 60,670 156,869 55,233 212,102 2011 67,806 8,115 4,631 19,348 99,900 31,112 3,835 11,669 16,980 63,596 163,497 59,105 222,602 2012 69,299 8,290 5,141 20,148 102,878 33,931 4,031 11,360 18,140 67,462 170,340 66,077 236,417 2013 68,913 7,382 5,199 20,431 101,926 36,261 3,953 11,288 17,984 69,486 171,411 73,311 244,722 2014 70,112 6,372 5,576 20,954 103,013 41,150 2,728 11,244 18,636 73,758 176,771 85,622 262,393 2015 70,290 6,752 5,718 21,913 104,673 44,755 2,789 11,379 19,384 78,307 182,980 95,083 278,063 2016 69,580 6,332 5,479 23,629 105,021 47,932 2,917 11,402 20,097 82,348 187,369 103,671 291,040 2017 69,889 6,072 5,680 25,410 107,050 51,941 2,969 11,468 20,908 87,286 194,337 115,029 309,366
Intermediate estimates: 2018 70,943 6,145 5,355 25,798 108,242 55,654 2,751 11,791 23,145 93,340 201,583 132,682 334,264 2019 74,909 6,779 5,211 27,449 114,348 60,652 2,630 12,581 24,490 100,354 214,702 146,491 361,193 2020 78,832 7,456 5,214 29,664 121,165 67,480 2,585 13,388 26,176 109,629 230,795 158,540 389,335 2021 83,007 7,914 6,000 31,837 128,758 74,900 2,922 14,432 28,002 120,255 249,013 174,927 423,940 2022 87,602 8,378 6,429 34,053 136,461 83,099 3,074 15,577 29,854 131,604 268,065 192,663 460,728 2023 92,637 9,160 6,885 36,300 144,982 91,872 3,233 16,829 31,746 143,679 288,661 211,689 500,350 2024 97,764 9,670 7,957 39,157 154,548 101,123 3,668 18,152 33,697 156,641 311,188 233,077 544,266 2025 100,751 10,215 8,517 41,834 161,317 111,373 3,855 19,559 38,848 173,635 334,951 255,388 590,339 2026 106,540 11,161 9,119 44,689 171,509 122,574 4,051 21,084 41,250 188,958 360,467 271,351 631,817 2027 111,955 11,711 10,489 47,460 181,616 133,972 4,568 22,614 43,530 204,684 386,299 293,844 680,143
137
Su
pp
lemen
tary
Med
ical In
sura
nce
Actuarial Methodology
138
c. Projections under Alternative Assumptions
Projections of Part B cash expenditures under the low-cost and
high-cost alternatives were developed by modifying the growth rates
estimated under the intermediate assumptions. Beginning in calendar
year 2018, the low-cost and high-cost alternatives contain assumptions
that result in benefits increasing, relative to the Gross Domestic
Product (GDP), 2 percent less rapidly and 2 percent more rapidly,
respectively, than the results under the intermediate assumptions.
Administrative expenses under the low-cost and high-cost alternatives
are projected on the basis of their respective wage series growth.
2. Part D
Part D is a voluntary Medicare prescription drug benefit that offers
beneficiaries a choice of private drug insurance plans. Low-income
beneficiaries can receive additional assistance on the cost sharing and
premiums. Each year drug plan sponsors submit bids that include
estimated total plan costs, reinsurance payments, and low-income cost-
sharing subsidies for the coming year. Upon approval of these bids, a
national average bid amount is calculated, and the result is used to
determine the national average premium. The individual plan
premium is calculated as the difference between the plan bid and the
national average bid, which is then applied to the national average
premium.
Each drug plan receives monthly risk-adjusted direct subsidies,
prospective reinsurance payments, and prospective low-income cost-
sharing subsidies from Medicare, as well as premiums from the
beneficiaries and premium subsidies from Medicare on behalf of low-
income enrollees. At the end of the year, the prospective reinsurance
and low-income cost-sharing subsidy payments are reconciled to match
the plan’s actual experience. During the reconciliation process, if
actual experience differs from the plan’s bid beyond specified risk
corridors, Medicare shares in the plan’s gain or loss.
Expenditures for this voluntary prescription drug benefit were
determined by combining estimated Part D enrollment with
projections of per capita spending. Actual Part D spending information
for 2017 was used as the base year.
Medicare also pays special subsidies on behalf of beneficiaries
retaining primary drug coverage through retiree drug subsidy (RDS)
plans. General revenues primarily finance the various Medicare drug
subsidies. Since Medicaid is no longer the primary payer of drug costs
Supplementary Medical Insurance
139
for full-benefit dually eligible beneficiaries, States are subject to a
contribution requirement and must pay the Part D account in the SMI
trust fund a portion of their estimated forgone drug costs for this
population. From 2006 to 2015, the percentage of estimated costs paid
by States was phased down from 90 percent to 75 percent.
Beneficiaries can choose to have their drug insurance premiums
withheld from their Social Security benefits and then forwarded to the
drug plans on their behalf.62 In 2017, around 26 percent of the non-low-
income enrollees in Part D drug plans exercised this option.
a. Participation Rates
All individuals entitled to Medicare Part A or enrolled in Part B are
eligible to enroll in the voluntary prescription drug benefit.
(1) Employer-Sponsored Plans
There are two ways that employer-sponsored plans can benefit from
the Part D program. One way is the retiree drug subsidy (RDS), in
which, for qualifying employer-sponsored plans, Medicare subsidizes a
portion of their qualifying retiree drug expenses. As a result of tax
deduction changes in the ACA, RDS program participation has
declined significantly since 2012 and is assumed to decline further over
the next several years. The Trustees expect that the majority of the
retirees losing drug coverage through RDS plans will participate in
other Part D plans.
The other way that an employer-sponsored plan can benefit from
Part D is to enroll in an employer/union-only group waiver plan
(EGWP) by either wrapping around an existing Part D plan or
becoming a prescription drug plan itself. The subsidies for these types
of arrangements are generally calculated in the same way as for other
Part D plans. The Trustees expect that such plans will offer additional
benefits beyond the standard Part D benefit package. Prior to 2015,
EGWP enrollment increased significantly, primarily due to the
participation of a large percentage of the beneficiaries who lost RDS
coverage. In 2015 and 2016, EGWP enrollment did not change
considerably because of the termination of certain EGWPs, which
counteracted the continued shift from RDS plans to EGWPs. In 2017
and 2018 EGWP growth returned, with a majority of the enrollment
increase occurring in Medicare Advantage Prescription Drug Plans
(MA-PDs). Future EGWP enrollment increases are projected but at a
62The Part D income-related premium adjustment amount for each beneficiary is
deposited into the Part D account.
Actuarial Methodology
140
slower rate due to a declining number of enrollees transferring from
RDS plans.
(2) Low-Income Subsidy
Qualifying low-income beneficiaries can receive various degrees of
additional Part D subsidies based on their resource levels to help
finance premium and cost-sharing payments. The number of
low-income enrollees constitutes about 28 percent of total Part D
beneficiaries in 2018 and is assumed to grow at the same rate as that
for Medicare beneficiaries who are enrolled in Part B. The proportion
of low-income enrollees is projected to remain at approximately
28 percent of total Part D beneficiaries.
(3) Other Part D Beneficiaries
Medicare beneficiaries not covered by employer-sponsored plans and
not qualified for the low-income subsidy have the option to enroll in a
Part D plan. Once enrolled, they pay for premiums and any applicable
deductible, coinsurance, and/or copayment. In 2018, about 63 percent
of non-employer and non-low-income Medicare beneficiaries63 opted to
enroll in a Part D plan. Based on recent experience, this participation
rate is projected to gradually grow to 67 percent by 2025 and then to
level off for the remaining years of the projection period.
Table IV.B7 provides a summary of the estimated average enrollment
in Part D, by category.
63A significant portion of the remaining eligible beneficiaries who do not participate in
Part D plans receive creditable coverage through another source (such as the Federal
Employees Health Benefits Program, TRICARE for Life, the Department of Veterans
Affairs, and the Indian Health Service).
Supplementary Medical Insurance
141
Table IV.B7.—Part D Enrollment [In millions]
Low-income subsidy
Calendar year
Retiree drug
subsidy1 EGWP
Medicaid full-benefit dual
eligible Other, with full subsidy
Other, with partial
subsidy Total All others Total
Historical data: 2008 6.8 2.1 6.3 3.2 0.3 9.7 13.9 32.6 2009 6.7 2.3 6.4 3.3 0.3 10.0 14.6 33.6 2010 6.8 2.4 6.6 3.5 0.3 10.4 15.1 34.8 2011 6.2 2.8 6.6 3.7 0.3 10.6 16.0 35.7 2012 5.6 3.6 6.9 3.7 0.3 11.0 17.2 37.4 2013 3.3 5.9 7.2 4.0 0.3 11.5 18.4 39.1 2014 2.7 6.5 7.4 4.1 0.3 11.8 19.5 40.5 2015 2.3 6.5 7.5 4.2 0.3 12.1 21.0 41.8 2016 1.9 6.6 7.8 4.3 0.3 12.4 22.2 43.2 2017 1.7 6.7 7.9 4.4 0.3 12.7 23.4 44.5
Intermediate estimates: 2018 1.5 6.9 8.0 4.6 0.3 12.9 24.5 45.7 2019 1.3 7.1 8.2 4.7 0.3 13.3 25.6 47.2 2020 1.1 7.2 8.5 4.8 0.4 13.6 26.9 48.8 2021 0.9 7.4 8.7 4.9 0.4 14.0 28.1 50.4 2022 0.9 7.6 8.9 5.1 0.4 14.4 29.1 52.0 2023 1.0 7.8 9.2 5.2 0.4 14.8 30.0 53.5 2024 1.0 8.0 9.4 5.3 0.4 15.2 30.9 55.0 2025 1.0 8.2 9.6 5.5 0.4 15.5 31.7 56.5 2026 1.0 8.4 9.9 5.6 0.4 15.9 32.5 57.8 2027 1.1 8.5 10.1 5.7 0.4 16.3 33.3 59.1
1Excludes Federal Government and military retirees covered by either the Federal Employees Health Benefit Program or the TRICARE for Life program. Such programs qualify for the retiree drug subsidy, but the subsidy will not be paid since it would amount to the Federal Government subsidizing itself.
b. Cost Projection Methodology on an Incurred Basis
(1) Drug Benefit Categories
Projected drug expenses are allocated to the beneficiary premium,
direct subsidy, and reinsurance subsidy by the Part D premium
formula based on the benefit formula specifications. Meanwhile, the
additional premium and cost-sharing subsidies are projected for low-
income beneficiaries.
The statute specifies that the base beneficiary premium is equal to
25.5 percent of the sum of the national average monthly bid amount
and the estimated catastrophic reinsurance. The average premium
amount per enrollee is estimated using the base beneficiary premium
with an adjustment to reflect enrollees’ tendency to select plans with
below-average premiums. Moreover, Part D collects income-related
premiums for individuals whose modified adjusted gross income
exceeds a specified threshold. The amount of the income-related
premium depends upon the individual’s income level. Before 2019, the
extra premium amount is the difference between 35, 50, 65, or
80 percent and 25.5 percent applied to the national average monthly
bid amount adjusted for reinsurance. Starting in 2019, the Bipartisan
Actuarial Methodology
142
Budget Act of 2018 requires a portion of the beneficiaries currently in
the 80-percent group to pay the difference between 85 percent and
25.5 percent.
(2) Projections
The projections are based in part on actual Part D spending data
through 2017. These data include amounts for total prescription drug
costs, costs above the catastrophic threshold, plan payments, and low-
income cost-sharing payments.
The estimates under the intermediate assumptions are calculated by
establishing the total prescription drug costs for 2017 and then
projecting these costs with both Part D expenditure and enrollment
growth rates through the estimation period. The growth rate
assumptions for Part D costs are based on a Part D-specific short-term
trend model and the national health expenditure (NHE) growth rate
assumptions.64 This short-term model provides the 2018 through 2020
drug-specific and therapeutic-class-specific growth rate projections. A
transition factor is applied for 2021 and 2022 to converge to the NHE
projected growth rates in 2023, which are then used for the remainder
of the short-range projection period. The growth in expensive specialty
drugs has been a major factor driving the gross drug trend rates, which
in turn have resulted in fast-growing reinsurance in recent years.
Therefore, the trend rates for the catastrophic portion are also
assumed to generally grow somewhat more rapidly than the overall
growth rates. Table IV.B8 shows the historical and projected Part D
per capita growth rates along with the NHE trends.
To determine the estimated benefits for Part D, the total per capita
drug costs are adjusted for two key factors. First, Part D benefit costs
are reduced for the total amount of rebates that the prescription drug
plans receive from drug manufacturers. Second, the plans incur
administrative costs for plan operation and earn profits. Table IV.B8
displays these key factors affecting Part D expenditure estimates.
64Based on Recommendation II-28 of the 2010-2011 Medicare Technical Review Panel.
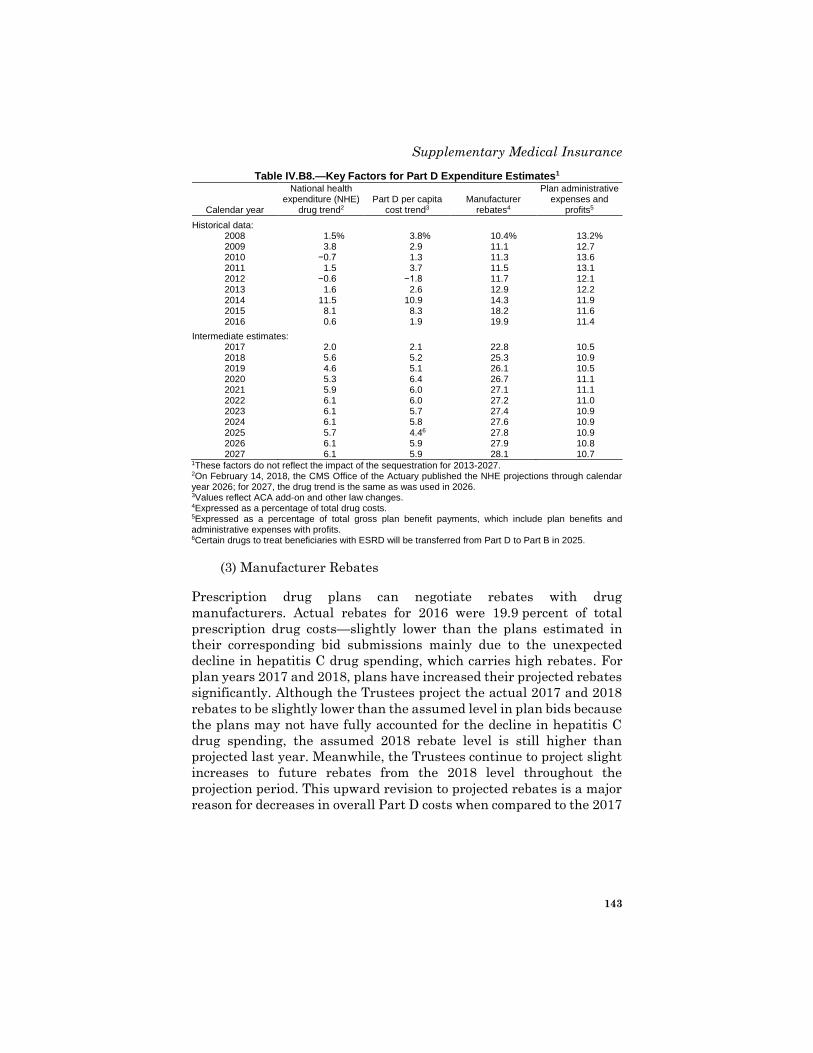
Supplementary Medical Insurance
143
Table IV.B8.—Key Factors for Part D Expenditure Estimates1
Calendar year
National health expenditure (NHE)
drug trend2 Part D per capita
cost trend3 Manufacturer
rebates4
Plan administrative expenses and
profits5
Historical data: 2008 1.5 % 3.8 % 10.4 % 13.2 % 2009 3.8 2.9 11.1 12.7 2010 −0.7 1.3 11.3 13.6 2011 1.5 3.7 11.5 13.1 2012 −0.6 −1.8 11.7 12.1 2013 1.6 2.6 12.9 12.2 2014 11.5 10.9 14.3 11.9 2015 8.1 8.3 18.2 11.6 2016 0.6 1.9 19.9 11.4
Intermediate estimates: 2017 2.0 2.1 22.8 10.5 2018 5.6 5.2 25.3 10.9 2019 4.6 5.1 26.1 10.5 2020 5.3 6.4 26.7 11.1 2021 5.9 6.0 27.1 11.1 2022 6.1 6.0 27.2 11.0 2023 6.1 5.7 27.4 10.9 2024 6.1 5.8 27.6 10.9 2025 5.7 4.4 6 27.8 10.9 2026 6.1 5.9 27.9 10.8 2027 6.1 5.9 28.1 10.7
1These factors do not reflect the impact of the sequestration for 2013-2027. 2On February 14, 2018, the CMS Office of the Actuary published the NHE projections through calendar year 2026; for 2027, the drug trend is the same as was used in 2026. 3Values reflect ACA add-on and other law changes. 4Expressed as a percentage of total drug costs. 5Expressed as a percentage of total gross plan benefit payments, which include plan benefits and administrative expenses with profits. 6Certain drugs to treat beneficiaries with ESRD will be transferred from Part D to Part B in 2025.
(3) Manufacturer Rebates
Prescription drug plans can negotiate rebates with drug
manufacturers. Actual rebates for 2016 were 19.9 percent of total
prescription drug costs—slightly lower than the plans estimated in
their corresponding bid submissions mainly due to the unexpected
decline in hepatitis C drug spending, which carries high rebates. For
plan years 2017 and 2018, plans have increased their projected rebates
significantly. Although the Trustees project the actual 2017 and 2018
rebates to be slightly lower than the assumed level in plan bids because
the plans may not have fully accounted for the decline in hepatitis C
drug spending, the assumed 2018 rebate level is still higher than
projected last year. Meanwhile, the Trustees continue to project slight
increases to future rebates from the 2018 level throughout the
projection period. This upward revision to projected rebates is a major
reason for decreases in overall Part D costs when compared to the 2017
Actuarial Methodology
144
Trustees Report. Projected manufacturer rebates are shown in
table IV.B8.65
(4) Administrative Expenses
Administrative costs and profit margins are estimated from 2018 plan
bids. Administrative expenses are projected to grow at the same rate
as wages, and profit margins are projected to grow at the same rate as
per capita benefits. Since drug expenses grow faster than
administrative costs, the administrative expenses as a percentage of
benefits slowly decrease over time even though health insurance plans
are assessed an annual insurer fee by the ACA beginning in 2014, as
shown in table IV.B8. However, under a provision of An Act Making
Further Continuing Appropriations for the Fiscal Year Ending
September 30, 2018, and for Other Purposes, which was enacted on
January 22, 2018, collection of the annual insurer fee is suspended in
2019, causing a 1-year reduction in 2019 and a subsequent increase
back to prior levels in 2020.
(5) Incurred Per Capita Reimbursements
Table IV.B9 shows estimated enrollments and average per capita
reimbursements for beneficiaries in private prescription drug plans,
low-income beneficiaries, and beneficiaries in RDS plans. The direct
subsidy and retiree drug subsidy are affected by the sequestration of
Medicare expenditures, which applies from April 1, 2013 to
September 30, 2027. Under the sequestration, Medicare benefit
payments will be reduced by a specified percentage, and
administrative expenses will be reduced by an estimated 5 to 7 percent.
65These are average rebate percentages across all prescription drugs. Generic drugs,
which represent about 88 percent of all Part D drugs dispensed and 24 percent of drug
spending in 2017, typically do not carry manufacturer rebates. Many brand-name
prescription drugs carry substantial rebates.
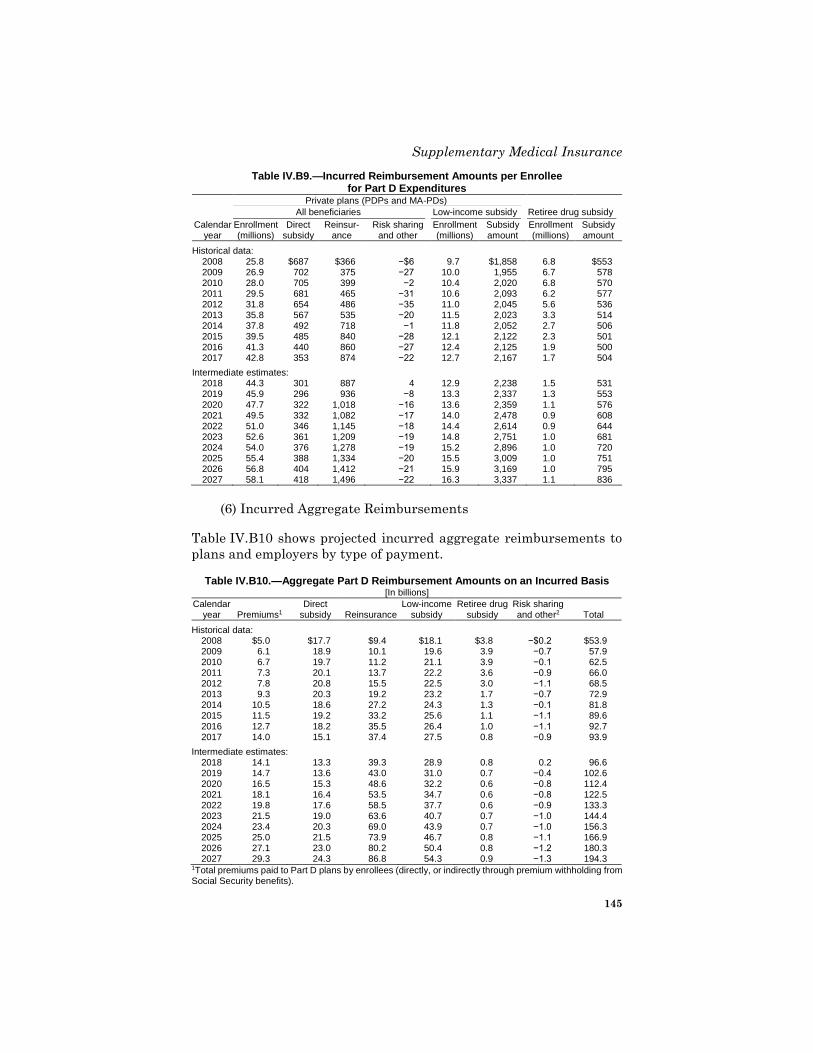
Supplementary Medical Insurance
145
Table IV.B9.—Incurred Reimbursement Amounts per Enrollee for Part D Expenditures
Private plans (PDPs and MA-PDs)
All beneficiaries Low-income subsidy Retiree drug subsidy
Calendar year
Enrollment (millions)
Direct subsidy
Reinsur-ance
Risk sharing and other
Enrollment (millions)
Subsidy amount
Enrollment (millions)
Subsidy amount
Historical data: 2008 25.8 $687 $366 −$6 9.7 $1,858 6.8 $553 2009 26.9 702 375 −27 10.0 1,955 6.7 578 2010 28.0 705 399 −2 10.4 2,020 6.8 570 2011 29.5 681 465 −31 10.6 2,093 6.2 577 2012 31.8 654 486 −35 11.0 2,045 5.6 536 2013 35.8 567 535 −20 11.5 2,023 3.3 514 2014 37.8 492 718 −1 11.8 2,052 2.7 506 2015 39.5 485 840 −28 12.1 2,122 2.3 501 2016 41.3 440 860 −27 12.4 2,125 1.9 500 2017 42.8 353 874 −22 12.7 2,167 1.7 504
Intermediate estimates: 2018 44.3 301 887 4 12.9 2,238 1.5 531 2019 45.9 296 936 −8 13.3 2,337 1.3 553 2020 47.7 322 1,018 −16 13.6 2,359 1.1 576 2021 49.5 332 1,082 −17 14.0 2,478 0.9 608 2022 51.0 346 1,145 −18 14.4 2,614 0.9 644 2023 52.6 361 1,209 −19 14.8 2,751 1.0 681 2024 54.0 376 1,278 −19 15.2 2,896 1.0 720 2025 55.4 388 1,334 −20 15.5 3,009 1.0 751 2026 56.8 404 1,412 −21 15.9 3,169 1.0 795 2027 58.1 418 1,496 −22 16.3 3,337 1.1 836
(6) Incurred Aggregate Reimbursements
Table IV.B10 shows projected incurred aggregate reimbursements to
plans and employers by type of payment.
Table IV.B10.—Aggregate Part D Reimbursement Amounts on an Incurred Basis [In billions]
Calendar year Premiums1
Direct subsidy Reinsurance
Low-income subsidy
Retiree drug subsidy
Risk sharing and other2 Total
Historical data: 2008 $5.0 $17.7 $9.4 $18.1 $3.8 −$0.2 $53.9 2009 6.1 18.9 10.1 19.6 3.9 −0.7 57.9 2010 6.7 19.7 11.2 21.1 3.9 −0.1 62.5 2011 7.3 20.1 13.7 22.2 3.6 −0.9 66.0 2012 7.8 20.8 15.5 22.5 3.0 −1.1 68.5 2013 9.3 20.3 19.2 23.2 1.7 −0.7 72.9 2014 10.5 18.6 27.2 24.3 1.3 −0.1 81.8 2015 11.5 19.2 33.2 25.6 1.1 −1.1 89.6 2016 12.7 18.2 35.5 26.4 1.0 −1.1 92.7 2017 14.0 15.1 37.4 27.5 0.8 −0.9 93.9
Intermediate estimates: 2018 14.1 13.3 39.3 28.9 0.8 0.2 96.6 2019 14.7 13.6 43.0 31.0 0.7 −0.4 102.6 2020 16.5 15.3 48.6 32.2 0.6 −0.8 112.4 2021 18.1 16.4 53.5 34.7 0.6 −0.8 122.5 2022 19.8 17.6 58.5 37.7 0.6 −0.9 133.3 2023 21.5 19.0 63.6 40.7 0.7 −1.0 144.4 2024 23.4 20.3 69.0 43.9 0.7 −1.0 156.3 2025 25.0 21.5 73.9 46.7 0.8 −1.1 166.9 2026 27.1 23.0 80.2 50.4 0.8 −1.2 180.3 2027 29.3 24.3 86.8 54.3 0.9 −1.3 194.3
1Total premiums paid to Part D plans by enrollees (directly, or indirectly through premium withholding from Social Security benefits).
Actuarial Methodology
146
2Positive amounts represent net loss-sharing payments to plans, and negative amounts are net gain-sharing receipts from plans. Other payments are one-time in nature. In addition to the risk-sharing amounts, the figures shown in 2006 and 2007 include the reimbursement of State costs under the Medicare Part D transition demonstration. The amount in 2010 includes the $250 rebate to the beneficiaries spending more than the initial coverage limit.
d. Projections under Alternative Assumptions
Part D expenditures for the low-cost and high-cost alternatives were
developed by modifying the estimates under the intermediate
assumptions. Separate modifications were applied to the assumptions
for the 2017 projection and to the assumptions for the projected years
2018-2027.
The 2017 base modifications include the following adjustments, since
final data for 2017 will not be available until later in 2018:
• ±2 percent to account for the uncertainty of the completeness of
the actual spending in 2017. The high-cost scenario increases the
spending by 2 percent, and the low-cost scenario decreases the
spending by 2 percent.
• ±2 percent for the average manufacturer rebate that drug plans
negotiate. The high-cost scenario decreases the average rebate by
2 percent, and the low-cost scenario increases the average rebate
by 2 percent.
For the projections beyond 2017, the per capita drug costs for the high-
cost and low-cost scenarios are increased, relative to GDP, 2 percent
more rapidly and 2 percent less rapidly, respectively, than under the
intermediate assumptions. In addition, for RDS participation,
participation in the low-income subsidies, and the participation rate
for Part D-eligible individuals who do not qualify for the low-income
subsidy or receive coverage through employer-sponsored plans,
assumptions vary in the alternative scenarios. Table IV.B11 compares
these varying assumptions.
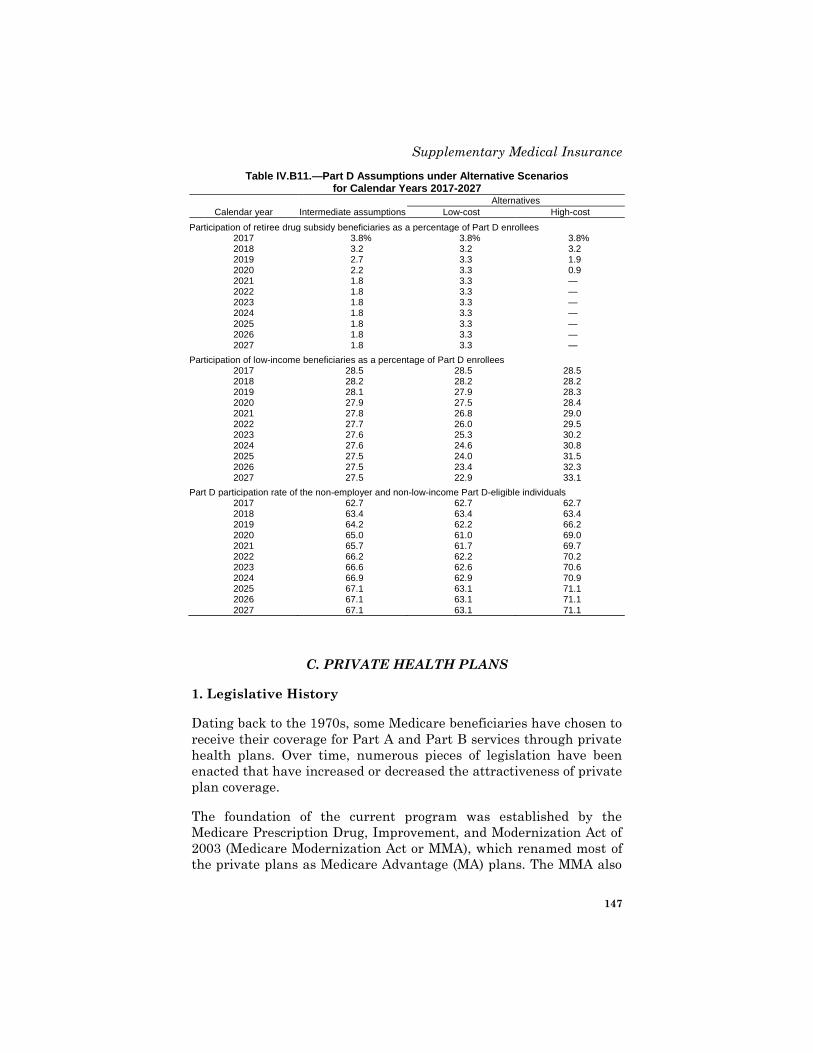
Supplementary Medical Insurance
147
Table IV.B11.—Part D Assumptions under Alternative Scenarios for Calendar Years 2017-2027
Alternatives
Calendar year Intermediate assumptions Low-cost High-cost
Participation of retiree drug subsidy beneficiaries as a percentage of Part D enrollees 2017 3.8 % 3.8 % 3.8 % 2018 3.2 3.2 3.2 2019 2.7 3.3 1.9 2020 2.2 3.3 0.9 2021 1.8 3.3 — 2022 1.8 3.3 — 2023 1.8 3.3 — 2024 1.8 3.3 — 2025 1.8 3.3 — 2026 1.8 3.3 — 2027 1.8 3.3 —
Participation of low-income beneficiaries as a percentage of Part D enrollees 2017 28.5 28.5 28.5 2018 28.2 28.2 28.2 2019 28.1 27.9 28.3 2020 27.9 27.5 28.4 2021 27.8 26.8 29.0 2022 27.7 26.0 29.5 2023 27.6 25.3 30.2 2024 27.6 24.6 30.8 2025 27.5 24.0 31.5 2026 27.5 23.4 32.3 2027 27.5 22.9 33.1
Part D participation rate of the non-employer and non-low-income Part D-eligible individuals 2017 62.7 62.7 62.7 2018 63.4 63.4 63.4 2019 64.2 62.2 66.2 2020 65.0 61.0 69.0 2021 65.7 61.7 69.7 2022 66.2 62.2 70.2 2023 66.6 62.6 70.6 2024 66.9 62.9 70.9 2025 67.1 63.1 71.1 2026 67.1 63.1 71.1 2027 67.1 63.1 71.1
C. PRIVATE HEALTH PLANS
1. Legislative History
Dating back to the 1970s, some Medicare beneficiaries have chosen to
receive their coverage for Part A and Part B services through private
health plans. Over time, numerous pieces of legislation have been
enacted that have increased or decreased the attractiveness of private
plan coverage.
The foundation of the current program was established by the
Medicare Prescription Drug, Improvement, and Modernization Act of
2003 (Medicare Modernization Act or MMA), which renamed most of
the private plans as Medicare Advantage (MA) plans. The MMA also
Actuarial Methodology
148
formally designated all private health insurance coverage options
available through Medicare as Part C.66 There has been a continuous
increase in the prevalence of MA enrollment since enactment of the
MMA.
Beginning in 2006, payments are based on competitive bids and their
relationship to corresponding benchmarks, which are based on an
annually developed ratebook. Also, rebates were introduced and are
used to provide additional benefits not covered under Medicare, reduce
cost sharing, and/or reduce Part B or Part D premiums. From 2006
through 2011, rebates were calculated as 75 percent of the difference,
if any, between the benchmark and the bid.
In addition to the plan types that already existed, the MMA provided
for the establishment of regional preferred provider organizations
(RPPOs) and special needs plans (SNPs). Unlike other MA plans,
which define their own service areas, RPPOs operate in pre-defined
service areas referred to as regions and have special rules for
capitation payment benchmarks, and they received special incentives
under the MMA.
SNPs are products designed for, and marketed to, these special
population groups: Medicaid dual-eligible beneficiaries, individuals
with specialized chronic conditions, and institutionalized beneficiaries.
The statutory authority for SNPs, which has been extended several
times previously, has now been permanently extended under the
Bipartisan Budget Act of 2018 (BBA 2018).
The ACA made fundamental changes to MA funding by linking the
benchmark rates to Medicare fee-for-service costs and by requiring the
use of quality measures to determine eligibility for bonuses and the
share of bid savings versus benchmarks to be provided as a rebate.
Beginning in 2012, the ACA requires the MA county-level benchmarks
to be based on a multiple of estimated fee-for-service costs in the
county. The factor applied for a given county is based on the ranking
of its fee-for-service cost relative to that for other counties, and the
factors are phased in. This process was completed in 2017. The
25 percent, or quartile, of counties with the highest fee-for-service costs
have a factor of 95 percent of county fee-for-service costs; the second
quartile, 100 percent; the third quartile, 107.5 percent; and the lowest
66Of Medicare beneficiaries enrolled in private plans, about 94 percent are in Medicare
Advantage plans. The remainder are in certain holdover plans reimbursed on a cost basis
rather than through capitation payments, in Program of All-Inclusive Care for the
Elderly (PACE) plans, or in Medicare-Medicaid Plans (MMPs).
Private Health Plans
149
quartile, 115 percent. Prior to the ACA, most county benchmarks were
in the range of 100-140 percent of local fee-for-service costs.
Starting in 2012, plans are eligible to receive specified increases to
their benchmark based on their quality rating scores. The statutory
provisions call for a bonus of 5 percent for plans with at least a 4-star
rating.
The bonuses are doubled for health plans in a qualifying county,
defined as a county in which (i) per capita spending in original
Medicare is lower than average; (ii) 25 percent or more of eligible67
beneficiaries enrolled in Medicare Advantage as of December 2009; and
(iii) the benchmark rate in 2004 was based on the minimum amount
applicable to an urban area. There are special bonus provisions for
newly established and low-enrollment plans.
The phase-in of the fee-for-service-based benchmarks was completed in
2017. Also, the phased-in benchmarks, including bonuses, are capped
at the pre-ACA level.
The ACA also made changes regarding the share of the excess of
benchmarks over bids to be paid to the plan sponsors as rebates, which
the legislation varies based on quality. The highest quality plans
(4.5 stars or higher) will receive a 70-percent rebate, plans with a
quality rating of at least 3.5 stars and less than 4.5 stars will receive a
65-percent rebate, and plans with a rating of less than 3.5 stars will
receive a 50-percent rebate.
Finally, the ACA requires that private insurers pay an assessment, or
fee, based on their revenues from the prior year. The fees, which were
first collected in 2014, apply to most health insurance sectors,
including the majority of Medicare private health plans. Under the
Consolidated Appropriations Act, 2016, there was a 1-year moratorium
on the annual fee in 2017. In addition, under An Act Making Further
Continuing Appropriations for the Fiscal Year Ending September 30,
2018, and for Other Purposes, which was enacted on January 22, 2018,
section 4003 of Division D, “Suspension of Certain Health-Related
Taxes,” suspends collection of the fee for the 2019 calendar year.
It is important to note that Medicare coverage provided through
private health plans, or Part C, does not have separate financing or an
67Beneficiaries are eligible for the Medicare Advantage program if they are entitled to
coverage in Medicare Part A and enrolled in Medicare Part B.
Actuarial Methodology
150
associated trust fund. Rather, the Part A and Part B trust funds are
the source for payments to such private health plans.
2. Participation Rates
a. Background
To account for the distinct benefit, enrollment, and payment
characteristics of private health plans, enrollment and spending trends
for such plans are analyzed at the product level:
• Local coordinated care plans (LCCPs), which include health
maintenance organizations (HMOs), HMOs with a point-of-service
option, and local preferred provider organizations (PPOs).
• Private fee-for-service (PFFS) plans.
• Regional PPO (RPPO) plans.
• Special needs plans (SNPs).
• Other products, which include cost plans, Program of All-Inclusive
Care for the Elderly (PACE) plans, and Medicare-Medicaid plans
(MMPs) under the capitated model.
All types of coverage except for those represented in the “other”
category are Medicare Advantage plans. Also, the values represented
in each category include enrollment not only in plans available to all
beneficiaries residing in the plan’s service area, but also in plans
available only to members of employer or union groups.
b. Historical
Table IV.C1 shows historical and projected private health plan
enrollment by type of plan. Between 2008 and 2017, private plan
enrollment grew by 9.8 million or 98 percent, compared to growth in
the overall Medicare population of 28 percent for the same period.
PFFS enrollment dropped 92 percent between 2009 and 2017 primarily
due to plan reaction to new statutory provider network requirements
beginning in 2011. Most of the enrollees in terminating PFFS plans
transferred to LCCP or RPPO plans.
The 2017 enrollment includes 3.7 million beneficiaries with coverage
through employer/union-only group waiver plans (EGWPs), the
majority of whom are in LCCPs. Beginning in 2017, the bidding
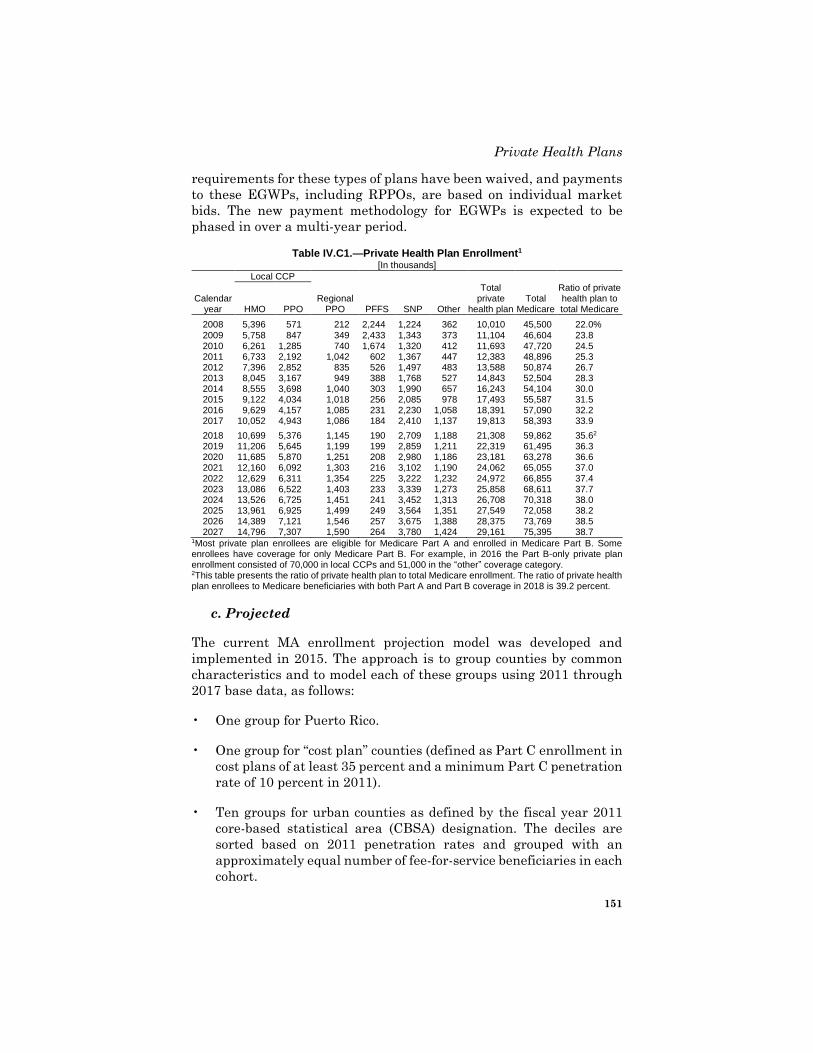
Private Health Plans
151
requirements for these types of plans have been waived, and payments
to these EGWPs, including RPPOs, are based on individual market
bids. The new payment methodology for EGWPs is expected to be
phased in over a multi-year period.
Table IV.C1.—Private Health Plan Enrollment1 [In thousands]
Local CCP
Calendar year HMO PPO
Regional PPO PFFS SNP Other
Total private
health plan Total
Medicare
Ratio of private health plan to total Medicare
2008 5,396 571 212 2,244 1,224 362 10,010 45,500 22.0 % 2009 5,758 847 349 2,433 1,343 373 11,104 46,604 23.8 2010 6,261 1,285 740 1,674 1,320 412 11,693 47,720 24.5 2011 6,733 2,192 1,042 602 1,367 447 12,383 48,896 25.3 2012 7,396 2,852 835 526 1,497 483 13,588 50,874 26.7 2013 8,045 3,167 949 388 1,768 527 14,843 52,504 28.3 2014 8,555 3,698 1,040 303 1,990 657 16,243 54,104 30.0 2015 9,122 4,034 1,018 256 2,085 978 17,493 55,587 31.5 2016 9,629 4,157 1,085 231 2,230 1,058 18,391 57,090 32.2 2017 10,052 4,943 1,086 184 2,410 1,137 19,813 58,393 33.9
2018 10,699 5,376 1,145 190 2,709 1,188 21,308 59,862 35.6 2 2019 11,206 5,645 1,199 199 2,859 1,211 22,319 61,495 36.3 2020 11,685 5,870 1,251 208 2,980 1,186 23,181 63,278 36.6 2021 12,160 6,092 1,303 216 3,102 1,190 24,062 65,055 37.0 2022 12,629 6,311 1,354 225 3,222 1,232 24,972 66,855 37.4 2023 13,086 6,522 1,403 233 3,339 1,273 25,858 68,611 37.7 2024 13,526 6,725 1,451 241 3,452 1,313 26,708 70,318 38.0 2025 13,961 6,925 1,499 249 3,564 1,351 27,549 72,058 38.2 2026 14,389 7,121 1,546 257 3,675 1,388 28,375 73,769 38.5 2027 14,796 7,307 1,590 264 3,780 1,424 29,161 75,395 38.7
1Most private plan enrollees are eligible for Medicare Part A and enrolled in Medicare Part B. Some enrollees have coverage for only Medicare Part B. For example, in 2016 the Part B-only private plan enrollment consisted of 70,000 in local CCPs and 51,000 in the “other” coverage category. 2This table presents the ratio of private health plan to total Medicare enrollment. The ratio of private health plan enrollees to Medicare beneficiaries with both Part A and Part B coverage in 2018 is 39.2 percent.
c. Projected
The current MA enrollment projection model was developed and
implemented in 2015. The approach is to group counties by common
characteristics and to model each of these groups using 2011 through
2017 base data, as follows:
• One group for Puerto Rico.
• One group for “cost plan” counties (defined as Part C enrollment in
cost plans of at least 35 percent and a minimum Part C penetration
rate of 10 percent in 2011).
• Ten groups for urban counties as defined by the fiscal year 2011
core-based statistical area (CBSA) designation. The deciles are
sorted based on 2011 penetration rates and grouped with an
approximately equal number of fee-for-service beneficiaries in each
cohort.
Actuarial Methodology
152
• Five groups for rural counties as defined by the fiscal year 2011
CBSA designation. The quintiles are sorted based on 2011
penetration rates and grouped with an approximately equal
number of fee-for-service beneficiaries in each cohort.
The private health plan enrollment projections are based on three
cohorts of beneficiaries: (i) dual-eligible beneficiaries, (ii) beneficiaries
with employer-sponsored coverage, and (iii) all others, including
individual-market enrollees.
Private plan enrollment for the individual market is projected by
calculating the penetration growth rates for individual plans in years
2011 through 2017 for each category described above and extrapolating
those results through 2027. These growth rates are applied to the
enrollment distribution for each county’s specific 2017 plan type (for
example, LCCP, PFFS, and RPPO) and are adjusted to reflect
applicable legislative changes to the program, as described in more
detail below.
Two categories of Medicare Advantage enrollees—those with employer
coverage and those who are dually eligible—are modeled at the
national level. Historically, EGWP and dual-eligible enrollment has
had much larger enrollment variation from year to year while
individual-market enrollment has trended at a more consistent level.
Because of the fluctuations in enrollment, the cohort method does not
work as well for the employer-sponsored and dual-eligible populations.
The private Medicare health plan enrollment projections for the 2018
Trustees Report are slightly higher than those in the 2017 report. As
shown in table IV.C1, the share of Medicare enrollees in private health
plans is projected to increase from 33.9 percent in 2017 to 38.7 percent
in 2027. Modest increases are expected in private plan penetration
rates between 2018 and 2027 due to higher relative bonus payments
stemming from assumed improvements in quality rating scores.
SNP enrollment is expected to grow by 12 percent in 2018 after
increasing by 8 percent in 2017. In 2019 and later years, the enrollment
growth rate for these plans is expected to slow, ranging from 6 percent
in 2019 to 3 percent in 2024.
For LCCP-HMOs, enrollment is expected to increase by 6 percent in
2018 following growth of 4 percent in 2017. For LCCP-PPOs,
enrollment is expected to increase by 9 percent in 2018 after growth of
19 percent in 2017. A large portion of the increase in 2017, and of the
expected increase in 2018, is from EGWPs.
Private Health Plans
153
The “other” category is expected to fluctuate over the next several years
mainly due to enrollment in the MMP capitated model, which
represents health plans that are capitated by CMS and States to
provide comprehensive and coordinated care for Medicare-Medicaid
enrollees. Since the introduction of MMPs in October 2013, enrollment
has grown nationally from approximately 3,400 enrollees in a single
State to over 400,000 enrollees across ten States in September 2017.
These contracts are currently set to expire by 2020. It is assumed that
once the contracts expire, the majority of the MMP enrollment will
remain in the MA program.
Enrollment in the “other” category is expected to grow by 4 percent in
2018 after increasing by 16 percent during 2016 through 2017 and by
49 percent in 2015 due to the influx of MMP enrollment. It is expected
to be flat from 2019 through 2021 before steadily increasing in 2022
and later years. Cost plans, along with MMPs, make up the majority
of the enrollment in this coverage category. The historical and
projected enrollment changes in cost plans are much more stable than
the changes in MMPs.
3. Cost Projection Methodology
a. Background
Benchmarks form the foundation for payments to Medicare Advantage
plans. Along with geographic, demographic, and risk characteristics of
plan enrollees, these values determine the monthly prospective
payments made to private health plans. Medicare Advantage
benchmarks vary substantially by county. Benchmarks range between
95 and 115 percent of fee-for-service costs, plus applicable quality
bonuses.
For non-RPPO plans, a plan’s benchmark is an average of the statutory
capitation ratebook values, weighted by projected plan enrollment in
each county in the plan’s service area. For RPPOs, the benchmark is a
blend of the weighted ratebook values for all Medicare-eligible
beneficiaries in the region and an enrollment-weighted average of
RPPO bids for the region. The weight applied to the bid component to
calculate the blended benchmark is the national Medicare Advantage
participation rate.
Plans submit bids equal to their projected per enrollee cost of providing
the standard Medicare Part A and Part B benefits. Plans with bids
below the benchmark apply the rebate share of the savings to aid plan
enrollees through coverage of Part A and Part B cost sharing, coverage
Actuarial Methodology
154
of additional non-drug benefits, and/or reduction in the Part B or
Part D premium. The rebate percentage is based on the quality rating
of the health plan and ranges from 50 to 70 percent. Beneficiaries
choosing plans with bids above the benchmark must pay for both the
full amount of the difference between the bid and the benchmark and
the projected cost of the plans’ supplemental benefits.
Medicare capitation payments to a Medicare Advantage plan are a
product of the standardized plan bid, which is equal to the bid divided
by the plan’s projected risk score, and the actual enrollee risk score,
which is based on demographic characteristics and medical diagnosis
data. The risk score for a given enrollee may be adjusted
retrospectively since CMS receives diagnosis data after the payment
date.
Rebate payments are based on the projected risk profile of the plan and
are not adjusted based on subsequent actual risk scores.
b. Incurred Basis
Private health plan expenditures are forecast on an incurred basis by
coverage type. The bid-based expenditures for each quarter are a
product of the average enrollment and the projected average per capita
bid. Similarly, the rebate expenditures are a product of enrollment and
projected average rebates.
Annual per capita benchmarks, bids, and rebates were determined on
an incurred basis for calendar years 2007-2017 for each coverage
category. These amounts include adjustments processed after the
payment due date for retroactive enrollment and risk score updates.
Benchmark growth for 2012 through 2017 was significantly lower than
it was before 2012 because of the phase-in of the fee-for-service-based
ratebook beginning in 2012, which resulted in lower benchmark rates
in most areas. Benchmark growth for years 2018 and later is estimated
to be slightly higher than the growth rate of beneficiaries enrolled in
Medicare fee-for-service. In addition, quality bonus payments are
projected to increase slightly for 2018 and later years.
Private health plan expenditures are affected by the sequestration of
non-salary Medicare expenditures. Under the sequestration, private
health plan benefit payments will be reduced by a specified percentage.
For years 2018 and later, the trend in the per capita bids is estimated
to be equal to that of beneficiaries enrolled in Medicare fee-for-service.
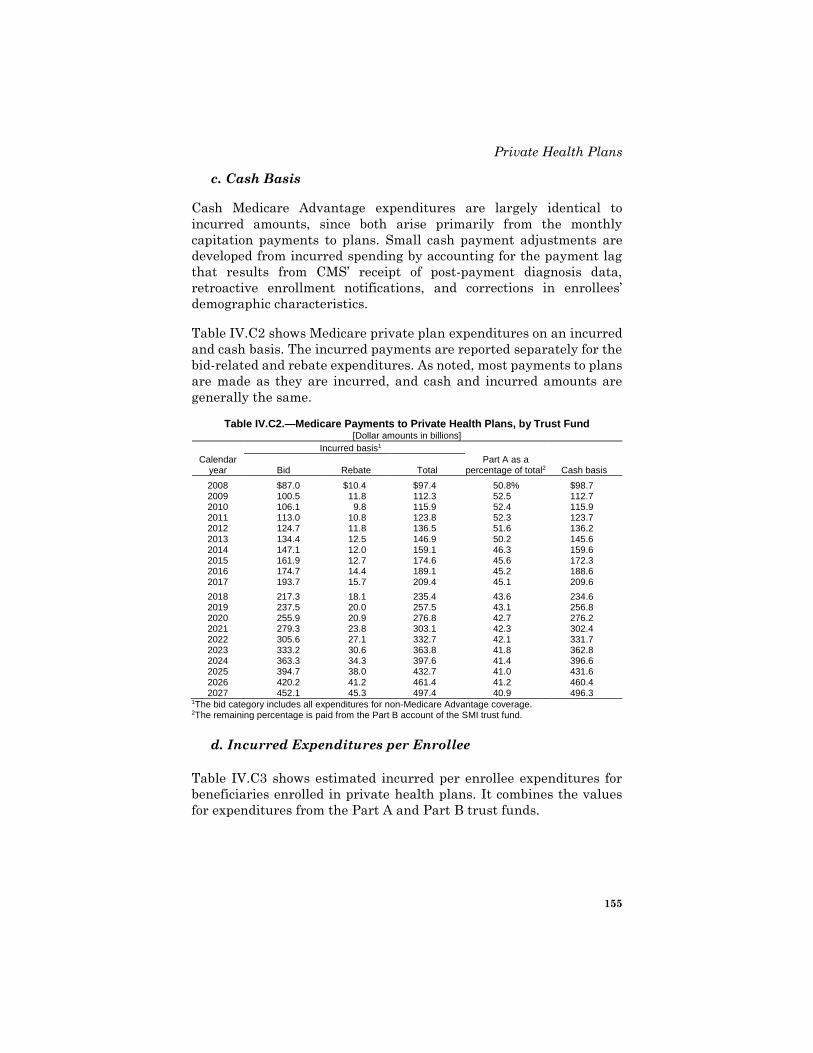
Private Health Plans
155
c. Cash Basis
Cash Medicare Advantage expenditures are largely identical to
incurred amounts, since both arise primarily from the monthly
capitation payments to plans. Small cash payment adjustments are
developed from incurred spending by accounting for the payment lag
that results from CMS’ receipt of post-payment diagnosis data,
retroactive enrollment notifications, and corrections in enrollees’
demographic characteristics.
Table IV.C2 shows Medicare private plan expenditures on an incurred
and cash basis. The incurred payments are reported separately for the
bid-related and rebate expenditures. As noted, most payments to plans
are made as they are incurred, and cash and incurred amounts are
generally the same.
Table IV.C2.—Medicare Payments to Private Health Plans, by Trust Fund [Dollar amounts in billions]
Incurred basis1
Calendar year Bid Rebate Total
Part A as a percentage of total2 Cash basis
2008 $87.0 $10.4 $97.4 50.8 % $98.7 2009 100.5 11.8 112.3 52.5 112.7 2010 106.1 9.8 115.9 52.4 115.9 2011 113.0 10.8 123.8 52.3 123.7 2012 124.7 11.8 136.5 51.6 136.2 2013 134.4 12.5 146.9 50.2 145.6 2014 147.1 12.0 159.1 46.3 159.6 2015 161.9 12.7 174.6 45.6 172.3 2016 174.7 14.4 189.1 45.2 188.6 2017 193.7 15.7 209.4 45.1 209.6
2018 217.3 18.1 235.4 43.6 234.6 2019 237.5 20.0 257.5 43.1 256.8 2020 255.9 20.9 276.8 42.7 276.2 2021 279.3 23.8 303.1 42.3 302.4 2022 305.6 27.1 332.7 42.1 331.7 2023 333.2 30.6 363.8 41.8 362.8 2024 363.3 34.3 397.6 41.4 396.6 2025 394.7 38.0 432.7 41.0 431.6 2026 420.2 41.2 461.4 41.2 460.4 2027 452.1 45.3 497.4 40.9 496.3
1The bid category includes all expenditures for non-Medicare Advantage coverage. 2The remaining percentage is paid from the Part B account of the SMI trust fund.
d. Incurred Expenditures per Enrollee
Table IV.C3 shows estimated incurred per enrollee expenditures for
beneficiaries enrolled in private health plans. It combines the values
for expenditures from the Part A and Part B trust funds.
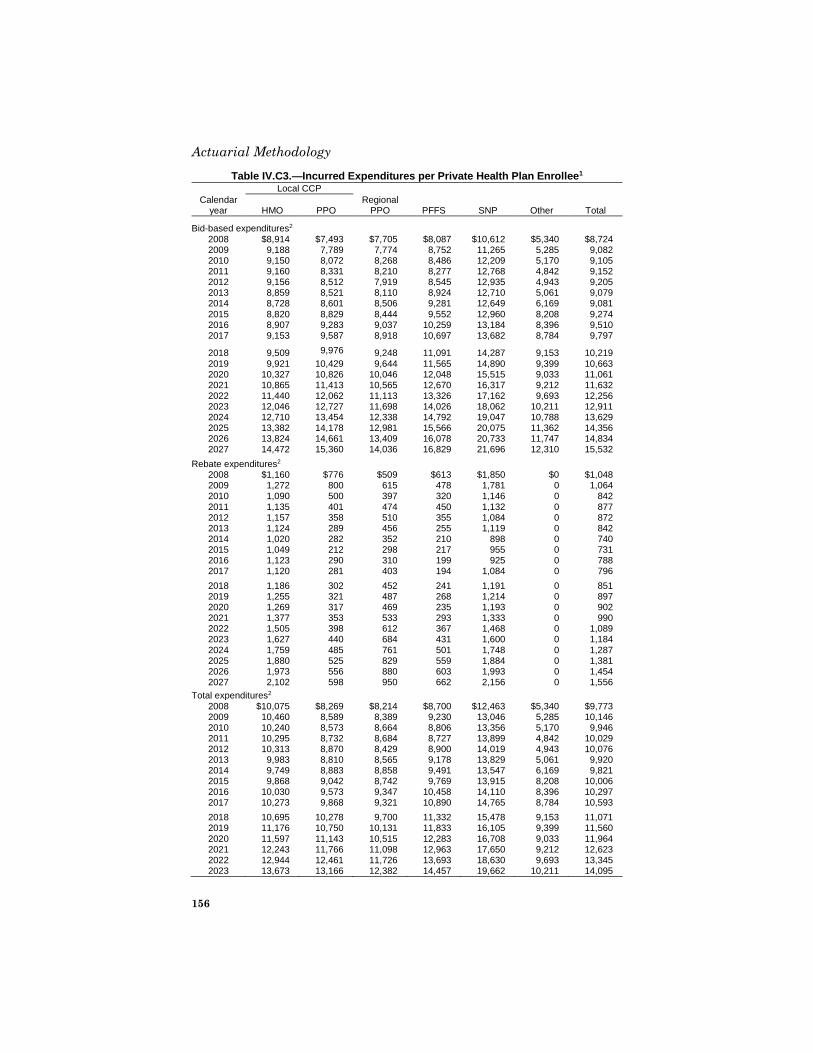
Actuarial Methodology
156
Table IV.C3.—Incurred Expenditures per Private Health Plan Enrollee1 Local CCP
Calendar year HMO PPO
Regional PPO PFFS SNP Other Total
Bid-based expenditures2 2008 $8,914 $7,493 $7,705 $8,087 $10,612 $5,340 $8,724 2009 9,188 7,789 7,774 8,752 11,265 5,285 9,082 2010 9,150 8,072 8,268 8,486 12,209 5,170 9,105 2011 9,160 8,331 8,210 8,277 12,768 4,842 9,152 2012 9,156 8,512 7,919 8,545 12,935 4,943 9,205 2013 8,859 8,521 8,110 8,924 12,710 5,061 9,079 2014 8,728 8,601 8,506 9,281 12,649 6,169 9,081 2015 8,820 8,829 8,444 9,552 12,960 8,208 9,274 2016 8,907 9,283 9,037 10,259 13,184 8,396 9,510 2017 9,153 9,587 8,918 10,697 13,682 8,784 9,797
2018 9,509 9,976 9,248 11,091 14,287 9,153 10,219 2019 9,921 10,429 9,644 11,565 14,890 9,399 10,663 2020 10,327 10,826 10,046 12,048 15,515 9,033 11,061 2021 10,865 11,413 10,565 12,670 16,317 9,212 11,632 2022 11,440 12,062 11,113 13,326 17,162 9,693 12,256 2023 12,046 12,727 11,698 14,026 18,062 10,211 12,911 2024 12,710 13,454 12,338 14,792 19,047 10,788 13,629 2025 13,382 14,178 12,981 15,566 20,075 11,362 14,356 2026 13,824 14,661 13,409 16,078 20,733 11,747 14,834 2027 14,472 15,360 14,036 16,829 21,696 12,310 15,532
Rebate expenditures2 2008 $1,160 $776 $509 $613 $1,850 $0 $1,048 2009 1,272 800 615 478 1,781 0 1,064 2010 1,090 500 397 320 1,146 0 842 2011 1,135 401 474 450 1,132 0 877 2012 1,157 358 510 355 1,084 0 872 2013 1,124 289 456 255 1,119 0 842 2014 1,020 282 352 210 898 0 740 2015 1,049 212 298 217 955 0 731 2016 1,123 290 310 199 925 0 788 2017 1,120 281 403 194 1,084 0 796
2018 1,186 302 452 241 1,191 0 851 2019 1,255 321 487 268 1,214 0 897 2020 1,269 317 469 235 1,193 0 902 2021 1,377 353 533 293 1,333 0 990 2022 1,505 398 612 367 1,468 0 1,089 2023 1,627 440 684 431 1,600 0 1,184 2024 1,759 485 761 501 1,748 0 1,287 2025 1,880 525 829 559 1,884 0 1,381 2026 1,973 556 880 603 1,993 0 1,454 2027 2,102 598 950 662 2,156 0 1,556
Total expenditures2 2008 $10,075 $8,269 $8,214 $8,700 $12,463 $5,340 $9,773 2009 10,460 8,589 8,389 9,230 13,046 5,285 10,146 2010 10,240 8,573 8,664 8,806 13,356 5,170 9,946 2011 10,295 8,732 8,684 8,727 13,899 4,842 10,029 2012 10,313 8,870 8,429 8,900 14,019 4,943 10,076 2013 9,983 8,810 8,565 9,178 13,829 5,061 9,920 2014 9,749 8,883 8,858 9,491 13,547 6,169 9,821 2015 9,868 9,042 8,742 9,769 13,915 8,208 10,006 2016 10,030 9,573 9,347 10,458 14,110 8,396 10,297 2017 10,273 9,868 9,321 10,890 14,765 8,784 10,593
2018 10,695 10,278 9,700 11,332 15,478 9,153 11,071 2019 11,176 10,750 10,131 11,833 16,105 9,399 11,560 2020 11,597 11,143 10,515 12,283 16,708 9,033 11,964 2021 12,243 11,766 11,098 12,963 17,650 9,212 12,623 2022 12,944 12,461 11,726 13,693 18,630 9,693 13,345 2023 13,673 13,166 12,382 14,457 19,662 10,211 14,095
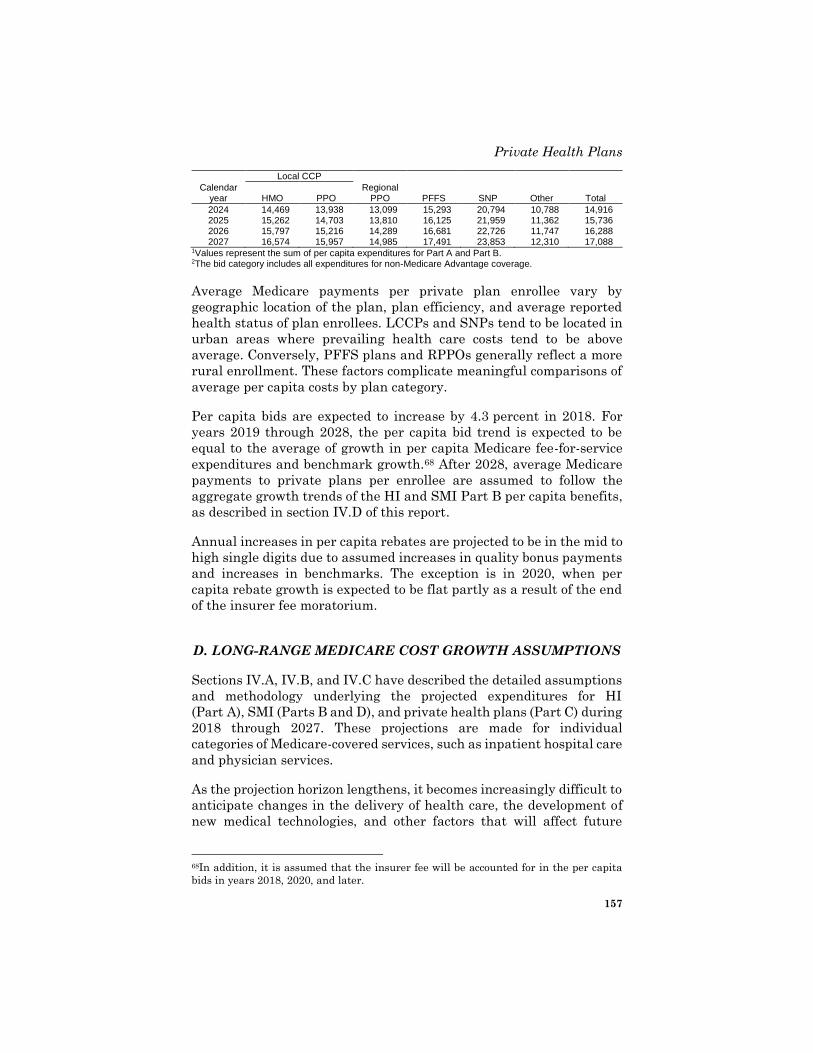
Private Health Plans
157
Local CCP
Calendar year HMO PPO
Regional PPO PFFS SNP Other Total
2024 14,469 13,938 13,099 15,293 20,794 10,788 14,916 2025 15,262 14,703 13,810 16,125 21,959 11,362 15,736 2026 15,797 15,216 14,289 16,681 22,726 11,747 16,288 2027 16,574 15,957 14,985 17,491 23,853 12,310 17,088
1Values represent the sum of per capita expenditures for Part A and Part B. 2The bid category includes all expenditures for non-Medicare Advantage coverage.
Average Medicare payments per private plan enrollee vary by
geographic location of the plan, plan efficiency, and average reported
health status of plan enrollees. LCCPs and SNPs tend to be located in
urban areas where prevailing health care costs tend to be above
average. Conversely, PFFS plans and RPPOs generally reflect a more
rural enrollment. These factors complicate meaningful comparisons of
average per capita costs by plan category.
Per capita bids are expected to increase by 4.3 percent in 2018. For
years 2019 through 2028, the per capita bid trend is expected to be
equal to the average of growth in per capita Medicare fee-for-service
expenditures and benchmark growth.68 After 2028, average Medicare
payments to private plans per enrollee are assumed to follow the
aggregate growth trends of the HI and SMI Part B per capita benefits,
as described in section IV.D of this report.
Annual increases in per capita rebates are projected to be in the mid to
high single digits due to assumed increases in quality bonus payments
and increases in benchmarks. The exception is in 2020, when per
capita rebate growth is expected to be flat partly as a result of the end
of the insurer fee moratorium.
D. LONG-RANGE MEDICARE COST GROWTH ASSUMPTIONS
Sections IV.A, IV.B, and IV.C have described the detailed assumptions
and methodology underlying the projected expenditures for HI
(Part A), SMI (Parts B and D), and private health plans (Part C) during
2018 through 2027. These projections are made for individual
categories of Medicare-covered services, such as inpatient hospital care
and physician services.
As the projection horizon lengthens, it becomes increasingly difficult to
anticipate changes in the delivery of health care, the development of
new medical technologies, and other factors that will affect future
68In addition, it is assumed that the insurer fee will be accounted for in the per capita
bids in years 2018, 2020, and later.
Actuarial Methodology
158
health care cost increases. Accordingly, rather than extending the
detailed projections by individual type of service for all future years,
the Trustees use a more aggregated basis for setting cost growth
assumptions in the long range. With enactment of the ACA and
MACRA, such increases are subject to greater uncertainty in the long
term, especially for the Medicare program.
The assumed long-range rate of growth in annual Medicare
expenditures per beneficiary for this year’s report is based on statutory
price updates and volume and intensity growth derived from the
“factors contributing to growth” model, which decomposes the major
drivers of historical and projected health spending growth into distinct
factors. The Trustees assume that the productivity reductions to
Medicare payment rate updates will reduce volume and intensity
growth by 0.1 percent below the factors model projection.69
Beginning with the 2001 Trustees Report, the Trustees assumed that
the increase in average expenditures per beneficiary for the 25th
through 75th years of the projection would equal the growth in per
capita GDP plus 1 percentage point,70 as recommended by the 2000
Medicare Technical Review Panel. Starting with the 2006 report, the
Trustees revised the methodology to provide for a more gradual
transition from historical health cost growth rates, which had been
roughly 2 to 3 percentage points above the level of GDP growth, to the
ultimate assumed level of GDP plus 0 percent just after the 75th year
and for the indefinite future. The year-by-year growth rate
assumptions for the 50 years were based on a stylized economic model,
and those relative growth rates were scaled so that the 75-year
actuarial balance for the HI trust fund was consistent with that
generated by the constant GDP plus 1 growth rate methodology.
For the 2010 and 2011 Medicare Trustees Reports, the Trustees
assumed a baseline long-range Medicare cost growth assumption,
using the methods described above, and then incorporated the effects
of the provisions of the ACA. For all HI (Part A) providers and some
SMI Part B providers (outpatient hospitals, ambulatory surgical
69The Trustees’ methodology is consistent with Finding III-2 and Recommendation III-3
of the 2010-2011 Medicare Technical Review Panel and with Finding 3-2 of the 2016-
2017 Medicare Technical Review Panel. The Panels’ final reports are available at http://
aspe.hhs.gov/health/reports/2013/MedicareTech/TechnicalPanelReport2010-2011.pdf
and at https://aspe.hhs.gov/system/files/pdf/257821/MedicareTechPanelFinalReport2017.pdf. 70This assumed increase in the average expenditures per beneficiary excludes the
impacts of the aging of the population and changes in the gender composition of the
Medicare population, which the Trustees estimated separately.
Long-Range Assumptions
159
centers, diagnostic laboratories,71 and most other non-physician
services), the annual increases in Medicare payment rates were
reduced for 2011 and later by the 10-year moving average increase in
economy-wide productivity. The resulting long-range growth
assumption averaged the increase in per capita GDP plus 1 percent,
minus the productivity factor. The sustainable growth rate formula at
that time governed increases in average physician expenditures per
beneficiary to equal the rate of per capita GDP growth. The remaining
Part B services and all Part D outlays had an assumed average growth
rate of per capita GDP plus 1 percent.
In December 2011, the 2010-2011 Medicare Technical Review Panel
unanimously recommended a new approach that builds off of the
longstanding GDP plus 1 percent assumption while incorporating
several key refinements.72 Specifically, the Panel recommended two
separate means of establishing long-range growth rates:
• The first approach is a refinement to the traditional GDP plus
1 percent growth assumption that better accounts for the level of
payment rate updates for Medicare (prior to the effects of the ACA)
compared to private health insurance and other payers of health
care in the U.S. This refinement results in an increase in the long-
range pre-ACA baseline cost growth assumption for Medicare to
GDP plus 1.4 percent.
• The “factors contributing to growth” model approach builds upon
the key considerations underlying the earlier GDP plus 1 percent
assumption. The model is based on economic research that
decomposes health spending growth into its major drivers—income
growth, relative medical price inflation, insurance coverage, and a
residual factor that primarily reflects the impact of technological
development.73 It benefits from additional information that was not
available when the 2000 Technical Panel recommended the GDP
plus 1 percent assumption.
For the 2012 report, the Trustees based the average ultimate Medicare
growth rate on the refinement recommended by the Technical Panel
71Starting in 2017, the Protecting Access to Medicare Act of 2014 links payments for
laboratory services to private payment rates. 72See Recommendation III-1. For convenience, the increase in Medicare expenditures per
beneficiary, before consideration of demographic impacts, is referred to as the Medicare
cost growth rate. Similarly, these growth rate assumptions are described relative to the
per capita increase in GDP and characterized simply as GDP plus X percent. 73Smith, Sheila, Newhouse, Joseph P., and Freeland, Mark S. “Income, Insurance, and
Technology: Why Does Health Spending Outpace Economic Growth?” Health Affairs, 28,
no. 5 (2009): 1276-1284.
Actuarial Methodology
160
and used the factors model to create the specific, year-by-year declining
growth rates during the last 50 years of the projection. Beginning with
the 2013 report, the Trustees used the statutory price updates and the
volume and intensity assumptions from the factors model to derive the
year-by-year Medicare cost growth assumptions for the last 50 years of
the projection period. The remainder of section IV.D discusses the
factors model and its role in the Medicare projections. Section V.C
explains the methods used to derive the long-range cost growth
assumptions underlying the illustrative alternative projection.
The key assumptions and factors model output used in this year’s
report are similar to those first used in the 2015 report. In subsequent
reports, the Trustees will determine if additional historical data
warrant a re-evaluation of these assumptions and a re-estimation of
the factors model output.
1. Long-Range Growth Assumptions for the Overall Health
Sector
The first step to estimate the long-range Medicare trends is to
determine the long-range assumptions affecting the overall health
sector. The Trustees use the factors model to determine the year-by-
year growth rates for the overall health sector over the last 50 years of
the projection. Based on the factors model, the Trustees assume that
the long-range per capita overall health spending growth is GDP plus
0.8 percent (or 4.7 percent) for 2042, gradually declining to GDP plus
0.5 percent by 2092 (or 4.3 percent). The per capita increase in overall
health care costs is due to the combined effects of general inflation,
medical-specific excess price inflation (above general price growth), and
changes in the utilization of services per person and the intensity or
average complexity per service. The Trustees assume that beginning
in 2042 (i) general price inflation will remain constant at 2.2 percent
per year, as measured by the GDP deflator; (ii) excess medical price
inflation will remain constant at 0.8 percent per year, as discussed in
more detail below; and (iii) the annual increase in the volume and
intensity of services per person will decline gradually from
approximately 1.7 percent in 2042 to 1.3 percent in 2092 based on the
key economic assumptions and elasticity estimates from the factors
model, as described below.
Excess medical price inflation for the overall health sector is assumed
to grow at 0.8 percent annually from 2042 through 2092. This
assumption is roughly equivalent to the difference between the growth
in the personal health care deflator over the past quarter century and
Long-Range Assumptions
161
the growth in the GDP deflator over this same period.74 Combining this
assumption with the ultimate assumed growth of 2.2 percent per year
in the GDP deflator yields the Trustees’ estimate of the long-range rate
of medical price growth of 3.0 percent annually. Using the relationship
between medical price growth and resource-based health sector
productivity growth75 allows for the determination of medical input
price growth.76 For resource-based health sector productivity, the
Trustees assume that the rate of growth will be equivalent to published
research77 of 0.4 percent per year. Hence, the Trustees’ estimate of the
long-range rate of growth of medical input prices is 3.4 percent.
As stated earlier, the factors model is based on economic research that
separates health spending growth into its major drivers—income
growth, relative medical price inflation, insurance coverage, and a
residual that primarily reflects the impact of technological
development. The factors model provides the ability to model the
expected behavioral effects associated with a continuing increase in the
share of national income devoted to consumption of health care
services. In particular, this approach is based on historically estimated
income and price elasticities and uses measurable key variables,
providing a foundation for developing the long-range growth
assumptions.78
In the factors model, the sensitivity of health cost growth to each of the
three factors must be estimated. Each sensitivity is measured as an
elasticity, which is the percentage change in cost growth that is caused
74Information on the personal health care deflator is available at
http://www.cms.gov/Research-Statistics-Data-and-Systems/Statistics-Trends-
and-Reports/NationalHealthExpendData/NationalHealthAccountsHistorical.html. 75Resource-based productivity is defined as the real value of provider goods and services
divided by the real value of the resources (inputs) used to produce the goods and services,
whereas price changes are measured across constant products—that is, defined health
services with a constant mix of inputs. Resource-based productivity is used for this
decomposition, rather than outcomes-based productivity (which incorporates the
estimated value of improvements in health resulting from the services) because Medicare
and most other payers reimburse providers based on their resource use. 76A third factor, provider profit margins, is assumed to remain constant over the long
range. 77Information on updated estimates of hospital productivity is available at
http://www.cms.gov/Research-Statistics-Data-and-Systems/Statistics-Trends-
and-Reports/ReportsTrustFunds/Downloads/ProductivityMemo2016.pdf; Fisher,
Charles. “Multifactor Productivity in Physicians’ Offices: An Exploratory Analysis.”
Health Care Financing Review, 29, no. 2 (2007): 15-32. 78Additional information on the “factors contributing to growth” model is available in a
memorandum by the Office of the Actuary titled “The Long-Term Projection
Assumptions for Medicare and Aggregate National Health Expenditures,” available at
https://www.cms.gov/Research-Statistics-Data-and-Systems/Statistics-Trends-and-
Reports/ReportsTrustFunds/Downloads/ProjectionMethodology2018.pdf.
Actuarial Methodology
162
by a 1-percent change in a factor. The first elasticity, the income-
technology elasticity, reflects the increase in demand for health care
and new medical technologies in response to growth in income. The
second elasticity, the relative medical price elasticity, reflects the
sensitivity of consumers and purchasers in consuming health care to
changes in excess medical price inflation. The final key elasticity is the
insurance elasticity, which reflects the change in demand for medical
care as the level of insurance coverage changes.
For the income-technology elasticity, the Trustees developed a time-
trend-based method for projecting the elasticity that reflects the
historical declining trend, produces results consistent with the
elasticity implied by the most recent short-range NHE projections, and
converges to 1.0 within a range of roughly 75 to 150 years. In the
resulting projection, the income-technology elasticity is 1.26 in the
25th year of the projection period (2042) and declines at a slowing pace
to 1.08 in the 75th year of the period (2092). This methodology results
in an income-technology elasticity that reaches 1.0 in 2125. These are
the same elasticity assumptions that were used for 2042 and 2092 in
the 2017 report.
For the medical price elasticity, the Trustees assume a rising
sensitivity of demand for health care to changes in relative medical
price as the share of income devoted to health care rises. The medical
price elasticity is determined for a given year by subtracting an income
effect from a pure substitution effect. The income effect is determined
by multiplying the share of income devoted to health care in that year
by the estimated yearly income-technology elasticity. The substitution
effect is assumed to be equal to −0.2 and represents the change in
demand in response to a change in the relative price of health care
holding utility constant. For the 2018 report, the Trustees project the
price elasticity to be −0.52 for the 25th year of the projection (2042) and
assume that it will follow a non-linear path until it reaches −0.59 in
the 75th year of the projection (2092). These are the same elasticity
assumptions that were used for 2042 and 2092 in the 2017 report.
Based on the RAND Health Insurance Experiment, the insurance
elasticity was estimated at −0.2 and was assumed to be unchanged
over the long range.79
79Newhouse, Joseph P., and the Insurance Experiment Group. Free for All? Lessons from
the RAND Health Insurance Experiment. Cambridge: Harvard University Press, 1993.
The coefficient of this elasticity is negative because the level of insurance coverage is
measured using individuals’ cost-sharing requirements (such as deductibles and
coinsurance).
Long-Range Assumptions
163
Two additional assumptions are required to complete the factors model
determination. First, relative medical price inflation must be
estimated over the long-range projection period. As discussed
previously, the Trustees assume that relative medical price growth is
0.8 percent per year. Second, insurance coverage is assumed to be
unchanged over the long range in order to maintain consistency with
the concept of a Medicare projection in which the Medicare benefit
package is not altered.
2. Long-Range Growth Assumptions for Medicare
The Trustees have assumed since 2001 that it is reasonable to expect
over the long range that the drivers of health spending will be similar
for the overall health sector and for the Medicare program. This view
was affirmed by the 2010-2011 Medicare Technical Review Panel,
which recommended use of the same long-range assumptions for the
increase in the volume and intensity of health care services for the total
health sector and for Medicare. Therefore, the overall health sector
long-range cost growth assumptions for volume and intensity are used
as the starting point for developing the Medicare-specific assumptions.
Prior to the ACA, Medicare payment rates for most non-physician
provider categories were updated annually by the increase in
providers’ input prices for the market basket of employee wages and
benefits, facility costs, medical supplies, energy and utility costs,
professional liability insurance, and other inputs needed to produce the
health care goods and services.80 To the extent that health care
providers can improve their productivity each year, their net costs of
production (other things being equal) will increase more slowly than
their input prices—but the Medicare payment rate updates prior to the
ACA were not adjusted for potential productivity gains. Accordingly,
Medicare costs per beneficiary would have increased somewhat faster
than for the health sector overall. In particular, the Trustees assume
that the full market basket increase would be approximately
3.4 percent annually, or about 0.4 percent greater than the net price
increase of 3.0 percent per year described above for the total health
sector. The ACA requires that many of these Medicare payment
updates be reduced by the 10-year moving average increase in
economy-wide productivity, which the Trustees assume will be
1.1 percent per year over the long range. The different statutory
provisions for updating payment rates require the development of
80Historically, lawmakers frequently reduced the payment updates below the increase in
providers’ input prices in an effort to slow Medicare cost growth or to offset unwarranted
changes in claims coding practices.
Actuarial Methodology
164
separate long-range Medicare cost growth assumptions for four
categories of health care provider services:
(i) All HI, and some SMI Part B, services that are updated annually
by provider input price increases less the increase in economy-wide
productivity.
Under the ACA, the annual increase in Medicare payment rates
for these services will be reduced by the 10-year moving average
increase in economy-wide productivity. These gains are estimated
to be 1.1 percent per year over the long-range period. Combined
with an assumed market basket increase of 3.4 percent, the
statutory price update for these services is 2.3 percent per year
over the long-range projection period. The initial projected
increase in the volume and intensity of these Medicare services is
assumed to be equivalent to the average projected growth in the
volume and intensity of services for the overall health sector. The
Trustees believe that the use of a common baseline rate of volume
and intensity growth across all Medicare services is reasonable,
as there would be only a small likelihood that one part of the
health sector could continue to grow indefinitely at significantly
faster rates of growth than do other parts.
Additionally, the Trustees assume that the growth in Medicare
payment rates will reduce the volume and intensity growth of
these services by 0.1 percent per year relative to the assumption
from the factors model. The Trustees’ assumption is based on the
work of the 2010-2011 and 2016-2017 Medicare Technical Review
Panels, both of which concluded that there would likely be a small
net negative impact on volume and intensity growth due to
reduced incentives to develop new technologies, provider exits,
and the impact of greater bundling of services for payment
purposes.81,82 For new technology that leads to new services, the
ACA will result in lower fees than would otherwise be the case,
and providers will be less likely to adopt new services and
innovations, thereby lowering the demand for, and intensity of,
the medical care provided. Regarding provider exits, as fee-for-
service fees decline relative to the pre-ACA levels, facilities of
marginal profitability are likely to exit the Medicare market,
81See Recommendation III-3 of the 2010-2011 Medicare Technical Review Panel and
Finding 3-2 of the 2016-2017 Medicare Technical Review Panel. 82Other factors, such as reduced beneficiary cost-sharing requirements, would tend to
increase the volume and intensity of services. The assumption of −0.1 percent reflects
the Technical Panel’s assessment that the overall impact would be a small net decrease
in volume and intensity growth.
Long-Range Assumptions
165
reducing capacity and volume. This change could also cause a
more bifurcated health system in which only providers that can
operate profitably under Medicare offer services to Medicare
beneficiaries, with a tendency to provide only the more basic
services not associated with new medical technologies. Finally,
the innovations being tested under the ACA, such as bundled
payments or accountable care organizations, could reduce
incentives to adopt new cost-increasing technologies and increase
incentives to adopt new cost-decreasing technologies for those
participating in these programs and/or could contribute to greater
efforts to avoid services of limited or no value within the service
bundle.
Reflecting all of these considerations, the year-by-year long-range
cost growth assumption for these HI and SMI Part B services
starts at 3.9 percent in 2042, or GDP plus 0.0 percent, and
gradually declines to 3.5 percent by 2092, or GDP minus
0.3 percent.
(ii) Physician services
Payment rate updates are 0.75 percent per year for those
physicians assumed to be participating in advanced alternative
payment models (advanced APMs) and 0.25 percent for those
assumed to be participating in the merit-based incentive payment
system (MIPS) in the long range. The year-by-year growth rates
for physician payments are assumed to be 3.6 percent in 2042, or
GDP minus 0.3 percent, declining to 2.8 percent in 2092, or GDP
minus 1.0 percent.
(iii) Certain SMI Part B services that are updated annually by the CPI
increase less the increase in productivity.
Such services include durable medical equipment (DME) that is
not subject to competitive bidding,83 care at ambulatory surgical
centers, ambulance services, and medical supplies, which are
updated by the CPI and affected by the ACA productivity
adjustment. For these services, the Trustees initially assume that
the rate of per beneficiary volume and intensity growth is
equivalent to that derived for the overall health sector using the
factors model. This volume and intensity growth is assumed to be
reduced by 0.1 percent per year to reflect the ACA impact, as
described above. The post-ACA volume and intensity assumption
83The portion of DME that is subject to competitive bidding is included with all other
Medicare services since the price is determined by a competitive bidding process.
Actuarial Methodology
166
is combined with the long-range CPI assumption (2.6 percent)
minus the productivity factor (1.1 percent) to produce a long-
range growth assumption for these SMI Part B services. The
corresponding year-by-year growth rates are 3.1 percent in 2042,
or GDP minus 0.8 percent, gradually declining to 2.7 percent in
2092, or GDP minus 1.1 percent.
(iv) All other Medicare services, for which payments are established
based on market processes, such as prescription drugs provided
through Part D and the remaining Part B services.
The Trustees assume that per beneficiary outlays for these other
Part B services, which constitute about 17 percent of total Part B
expenditures in 2026, and for all Part D services grow at the same
rate as the overall health sector as determined from the factors
model. The services are assumed to grow similarly because their
payment updates are determined by market forces, such as the
competitive-bidding process for Medicare Part D. The year-by-
year growth rates are 4.7 percent in 2042, or GDP plus
0.8 percent, gradually declining to 4.3 percent by 2092, or GDP
plus 0.5 percent.
In addition, these long-range cost growth rates must be modified to
reflect demographic impacts. For example, beneficiaries at ages 80 and
above use Part A skilled nursing and home health services much more
frequently than do younger beneficiaries. As the beneficiary population
ages, Part A costs will grow at a faster rate due to increased use of
these services. In contrast, the incidence of prescription drug use is
more evenly distributed by age, and an increase in the average age of
Part D enrollees has significantly less of an effect on Part D costs.
After combining the rates of growth from the four long-range
assumptions, the weighted average growth rate for Part B is
3.6 percent per year for the last 50 years of the projection period, or
GDP minus 0.3 percent, on average. When Parts A, B, and D are
combined, the weighted average growth rate is 3.8 percent over this
same time period, or GDP minus 0.1 percent, while the growth rate in
2092 is 3.7 percent, or GDP minus 0.1 percent.
As in the past, the Trustees have established detailed growth rate
assumptions for the initial 10 years of the projection period by
individual type of service (for example, inpatient hospital care and
physician services), reflecting recent trends and the impact of all
provisions of the ACA and other applicable statutory provisions. For
each of Parts A, B, and D, the assumed growth rates for years 11
Long-Range Assumptions
167
through 25 of the projection period are set by interpolating between the
rate at the end of the short-range period and the rate at the start of the
final 50 years of the long-range period described above. The 2016-2017
Medicare Technical Review Panel concluded that both the current
length of the transition period and the current approach to the
transition are reasonable, and they recommended that the Trustees
continue to use the same approach to transitions between short-range
and long-range projections for both HI and SMI.84
84See Findings 6-2 and 6-3 and Recommendation 6-1.
168
V. APPENDICES
A. MEDICARE AMENDMENTS SINCE THE 2017 REPORT
Since the 2017 annual report was transmitted to Congress on
July 13, 2017, four laws have been enacted that have an effect on the
Medicare trust funds. The more important provisions, from an
actuarial standpoint, are described, in brief, in the following
paragraphs. Certain provisions with a relatively minor financial
impact, but which are important from a policy perspective, are briefly
described as well.
1. The Disaster Tax Relief and Airport and Airway Extension
Act of 2017 (Public Law 115-63, enacted on September 29,
2017) included one provision that affects the HI and SMI
Part B programs.
• The funding amount of $270 million previously provided to the
Medicare Improvement Fund, for services provided during and
after fiscal year 2021, is decreased to $220 million. (This fund
was intended to be available for improvements to the original
fee-for-service program under Parts A and B.)
2. An Act to Provide for Reconciliation Pursuant to Titles II
and V of the Concurrent Resolution on the Budget for Fiscal
Year 2018 (Public Law 115-97, enacted on December 22,
2017, and also referred to as the Tax Cuts and Jobs Act of
2017) included three provisions that affect the HI program.
• Federal income tax rates for individuals are reduced, effective
for taxable years beginning after December 31, 2017 and
ceasing to apply after December 31, 2025. In addition, the
inflation index applied to the tax bracket thresholds and
standard deductions is changed, effective for taxable years
beginning after December 31, 2017, such that these amounts
will permanently grow more slowly than under prior law.
• The requirement that most individuals be covered by a health
insurance plan or pay a financial penalty, commonly referred
to as the individual mandate, is repealed, effective January 1,
2019. Accordingly, the percentage of people without health
insurance is expected to increase. Because the change in this
percentage is a factor used in determining payments to
Medicare disproportionate share hospitals for uncompensated
care, these payments are expected to increase as well. In
Medicare Amendments
169
addition, in light of this repeal, it is expected that some
individuals will drop their employer-sponsored health
insurance, thereby slightly increasing HI covered wages and
taxable payroll.
• Temporary tax changes for certain small businesses are made
that will affect reported self-employment income and, in turn,
HI covered wages and taxable payroll.
3. An Act Making Further Continuing Appropriations for the
Fiscal Year Ending September 30, 2018, and for Other
Purposes (Public Law 115-120, enacted on January 22, 2018)
included one provision that affects the HI and SMI
programs.
• A moratorium for calendar year 2019 is placed on the annual
fee to be paid by health insurance providers. This fee is
imposed on certain large health insurance providers, including
those furnishing coverage under Medicare Advantage (Part C)
and Medicare Part D.
4. The Bipartisan Budget Act of 2018 (BBA 2018; Public Law
115-123, enacted on February 9, 2018) included provisions
that affect the HI and SMI programs.
BBA 2018 Provisions Affecting All Parts of Medicare
• The sequestration process that is in place should Congress fail
to address the budget deficit by certain deadlines, as described
in previous annual reports, is extended by 2 years, through
fiscal years 2026 and 2027.
• The Independent Payment Advisory Board (IPAB) and all
related provisions are repealed, effective upon enactment. (The
IPAB was established by the Affordable Care Act to develop
and submit proposals aimed at extending the solvency of
Medicare, slowing Medicare cost growth, and improving the
quality of care delivered to Medicare beneficiaries.)
• For Medicare Advantage plans and stand-alone Part D plans
that undergo a contract consolidation approved on or after
January 1, 2019, the star rating (and any quality bonus
payment) for the surviving contract is to reflect an enrollment-
weighted average of the ratings for the continuing and closed
contracts.
Appendices
170
• The authority for Medicare Advantage Special Needs Plans
(SNPs), which was due to expire on December 31, 2018, is
permanently extended. A number of reforms to dual-eligible
SNPs and chronic-condition SNPs are also mandated.
• For Medicare Advantage plans, certain provisions are enacted,
effective January 1, 2020, which permit plans to offer to
chronically ill enrollees (i) a broader range of supplemental
benefits (which may include services that are not primarily
health care services), as long as the benefit offers a reasonable
expectation of improving or maintaining health or overall
function, and (ii) expanded telehealth services as supplemental
benefits, subject to certain specified requirements. In addition,
the Value-Based Insurance Design (VBID) Model, which is a
pilot program allowing certain plans to offer supplemental
benefits or reduced cost sharing to enrollees with certain
chronic conditions, is expanded, effective no later than
January 1, 2020, to allow plans in all States the opportunity to
participate in it. The VBID program is also made exempt,
through December 31, 2021, from certain spending and
quality-of-care testing to which it would otherwise be
subjected.
• For Medicare Accountable Care Organizations (ACOs), certain
provisions are enacted to (i) provide more opportunities for
beneficiaries to be assigned to, or voluntarily align with, ACOs;
(ii) allow for the use of beneficiary incentive programs; and
(iii) allow for expanded use of telehealth services. The specific
types of ACOs to which each of these changes apply, as well as
the effective dates, vary.
• Funding for the National Quality Forum is provided from the
HI and SMI trust funds for the remainder of fiscal year 2017
and for fiscal years 2018 and 2019.
• Funding for certain low-income outreach and assistance
programs is extended 2 years, through September 30, 2019.
• Certain existing civil and criminal penalties are substantially
increased for providers and suppliers who violate health care
fraud and abuse laws, effective upon enactment.
Medicare Amendments
171
BBA 2018 Provisions Affecting HI and Part B of SMI
• For home health agencies serving beneficiaries in rural areas,
the 3-percent add-on payment is extended 1 year, through
December 31, 2018. Then, for services furnished in rural areas
from 2019 through 2022, three separate tiers of add-on
adjustments are established, based on Medicare home health
utilization and low-population density; these adjustments
diminish over varying periods of time (and become 0 percent no
later than 2020). Also, for services furnished on or after
January 1, 2019, home health agencies are required to report
the county in which the services are furnished.
• For the Medicare home health prospective payment system
(PPS), the annual update for calendar year 2020 is set at
1.5 percent.
• Under the home health PPS, the unit of payment for home
health services is changed from a 60-day to a 30-day episode of
care, beginning in 2020. This change must be made in a budget-
neutral manner, but adjustments to offset anticipated behavior
changes that could result from the modified methodology are
allowed. Also beginning in 2020, therapy thresholds are
removed from the home health case mix adjustment.
• To demonstrate home-bound and medical-necessity status
when determining if a patient is eligible for home health
services, documentation in the medical records of home health
agencies can be used as supporting material, in addition to
documentation in the medical records of the certifying
physician, effective January 1, 2019.
• For telehealth services furnished for purposes of diagnosis,
evaluation, or treatment of symptoms of an acute stroke, the
geographic restriction that limits originating sites to rural
areas is eliminated, provided that all other Medicare telehealth
coverage requirements are satisfied. In addition, no originating
site facility fee is to be paid to sites that do not meet the current
geographic and site type requirements. This provision is
effective beginning on January 1, 2019.
• For the Medicare electronic health records incentive program,
the provision requiring more stringent measures of meaningful
use, over time, is eliminated, effective upon enactment.
Appendices
172
• The funding amount of $220 million previously provided for the
Medicare Improvement Fund (as noted above) is eliminated.
BBA 2018 Provisions Affecting HI
• The Medicare-Dependent Hospital (MDH) program is extended
for 5 fiscal years, through September 30, 2022. In addition, the
program is extended to certain rural hospitals that are located
in all-urban States and that otherwise meet the MDH criteria.
• Medicare inpatient hospital add-on payments for low-volume
hospitals are extended for 5 fiscal years, through
September 30, 2022. In addition, for fiscal years 2019 through
2022, changes are made to the qualifying criteria (which are to
be based on total discharges or Medicare discharges, depending
on the year, and on the distance from another inpatient
hospital) and to the add-on adjustments (which are to be based
on a sliding scale ranging from 25 percent to 0 percent).
• Two changes are made to the long-term care hospital (LTCH)
site-neutral provision. First, the originally mandated 2-year
transition period is extended for 2 additional years, covering
fiscal years 2018 and 2019. Second, the inpatient hospital PPS
comparable amount used in the site-neutral payment rate
calculations for fiscal years 2018 through 2026 is to be reduced
by 4.6 percent.
• For the inpatient hospital diagnosis-related groups (DRGs)
subject to the post-acute care transfer policy, hospice is added
as a setting of care, effective October 1, 2023.
• For the Medicare skilled nursing facility PPS, the annual
update for fiscal year 2019 is set at 2.4 percent.
• Physician assistants are added to the types of providers who
may serve as attending physicians for the purposes of hospice
care, effective January 1, 2019. (Previously, only physicians
and nurse practitioners could serve.) Like nurse practitioners,
physician assistants are not permitted to provide the written
certification of terminal illness required for hospice services.
Medicare Amendments
173
BBA 2018 Provisions Affecting Both Part B and Part D of
SMI
• A new income-related premium threshold is established.
Specifically, beginning in calendar year 2019, individuals with
incomes at or above $500,000 (and couples with incomes at or
above $750,000) will pay premiums covering 85 percent (rather
than 80 percent) of the average program cost for aged
beneficiaries. These new threshold levels will not be inflation-
adjusted until 2028 and later.
BBA 2018 Provisions Affecting Part B of SMI
• The 1.00 floor on the geographic index for physician work is
extended for 2 additional years, through December 31, 2019.
• The physician fee schedule update for 2019, which had been set
at 0.5 percent, is decreased to 0.25 percent.
• A number of changes are made to the merit-based incentive
payment system (MIPS) for physicians, including that it be
applied only to covered professional services instead of to items
and services (thereby excluding, most prominently, physician-
administered Part B drugs) and that its transition period be
extended by 3 years (such that the post-transition period now
begins in 2022, not 2019). Certain additional changes to the
system are mandated for the extended transition period, and
others are mandated for the period thereafter. Effective dates
vary.
• The annual payment limits on therapy services are
permanently repealed, beginning on January 1, 2018. The
threshold for the targeted manual medical review process is
lowered, from $3,700 to $3,000, effective as of the same date
and until 2028, after which the threshold is to be increased by
a specified formula.
• Outpatient physical and occupational therapy services
furnished by a therapy assistant are paid at 85 percent of the
amount that otherwise would have been paid under the fee
schedule, effective January 1, 2022.
• The freeze on coding and valuation of certain radiation therapy
services reimbursed under the fee schedule, in place for 2017
and 2018, is extended through 2019.
Appendices
174
• For qualified home infusion therapy suppliers, a temporary
transitional payment for administering home infusion therapy
is established, beginning on January 1, 2019. Payment rates in
three categories will apply during the transition period, which
will end on December 31, 2020, after which a new payment
methodology will begin.
• Certain ground ambulance add-on payments are extended
5 additional years, through December 31, 2022. (These add-on
payments include a 3-percent bonus for services originating in
rural areas, a 2-percent bonus for services originating in other
locations, and a 22.6-percent super rural bonus for rural areas
with the lowest population densities.) The development of a
system to collect certain data from providers and suppliers of
ground ambulance services is also mandated.
• For non-emergency ground ambulance transports of
beneficiaries with end-stage renal disease (ESRD) to and from
renal dialysis services, the reduction in payments is increased
from 10 percent to 23 percent for transports furnished on or
after October 1, 2018.
• For beneficiaries with ESRD who receive home dialysis, all
monthly physician visits can be provided via telehealth,
beginning on January 1, 2019, as long as the beneficiary
receives one in-person visit monthly for the initial 3 months
and at least one every 3 months thereafter. (Previously, at least
one in-person visit per month was required.) Also, the
originating site requirements are modified in several ways, and
no site facility fee is to be paid if the beneficiary’s home is the
originating site.
• Conditions are added to those that allow a beneficiary who
qualifies for cardiac rehabilitation services to qualify for the
more intensive set of services, effective upon enactment. Also,
the supervision requirements for cardiac rehabilitation,
intensive cardiac rehabilitation, and pulmonary rehabilitation
are changed to allow physician assistants, nurse practitioners,
and clinical nurse specialists (in addition to physicians) to
supervise these programs, effective January 1, 2024.
• A provision of the Steve Gleason Act of 2015, requiring that
Medicare payment for rental or lump-sum purchase of speech-
generating devices and accessories be made without a cap on
the amount, is made permanent.
Medicare Amendments
175
• Enforcement is delayed an additional year, through
December 31, 2017, for the instruction that, for outpatient
therapeutic services provided in critical access and small rural
hospitals, a physician or non-physician practitioner must
provide direct supervision throughout the performance of a
procedure. (In the 2018 outpatient hospital PPS rule, CMS
extended these non-enforcement instructions for 2018 and
2019 and noted that, for 2017, while there was not a non-
enforcement instruction in place, Medicare administrative
contractors were directed not to prioritize enforcement of this
requirement for these hospitals. This legislation provides the
non-enforcement instruction that had been lacking for 2017.)
BBA 2018 Provisions Affecting Part D of SMI
• Under the Part D standard benefit structure, the coverage gap
closes 1 year earlier than previously scheduled for brand-name
drugs only; that is, for brand-name drugs, beneficiaries in the
coverage gap (excluding low-income enrollees eligible for cost-
sharing subsidies) will pay 25 percent of drug costs beginning
on January 1, 2019 (instead of 30 percent in 2019 and
25 percent thereafter). Also beginning on that date, these
beneficiaries will receive a 70-percent manufacturer discount
(instead of 50 percent) and a 5-percent benefit (instead of
20 percent in 2019 and 25 percent thereafter) from their Part D
plans for applicable prescription drugs. (For purposes of drug
discounts while beneficiaries are in the Part D coverage gap,
applicable drugs are generally covered brand-name Part D
drugs, while non-applicable drugs are generally covered
generic Part D drugs.) For generic drugs, the law remains the
same, with beneficiaries paying 37 percent of drug costs in
2019 and 25 percent thereafter.
• For purposes of drug discounts while beneficiaries are in the
Part D coverage gap, the definition of applicable drugs is
expanded to include biosimilars, effective January 1, 2019.
(Applicable drugs previously included biologics but not
biosimilars.)
Appendices
176
B. TOTAL MEDICARE FINANCIAL PROJECTIONS
Medicare is the nation’s second largest social insurance program,
exceeded only by Social Security (OASDI). Although Medicare’s two
components—Hospital Insurance (HI) and Supplementary Medical
Insurance (SMI)—are very different from each other in many key
respects, it is important to consider the overall cost of Medicare and its
financing. By reviewing Medicare’s total expenditures, readers can
assess the financial obligation created by the program. Similarly, the
sources and relative magnitudes of HI and SMI revenues are an
important policy matter.
The issues of Medicare’s total cost to society and the means of financing
that cost are different from the question of the financial status of the
Medicare trust funds. The latter focuses on whether a specific trust
fund’s income and expenditures are in balance. The separate HI and
SMI financial projections prepared for this purpose, however, can be
usefully combined for the broader purposes outlined above. To that
end, this section presents information on combined HI and SMI costs
and revenues. Sections III.B, III.C, and III.D of this report present
detailed assessments of the financial status of the HI trust fund and
the Part B and Part D accounts of the SMI trust fund, respectively.
1. 10-Year Actuarial Estimates (2018-2027)
Table V.B1 shows past and projected Medicare income, expenditures,
and trust fund assets in dollar amounts for calendar years,85 with
projections shown under the intermediate set of assumptions for the
short-range projection period 2018 through 2027.
85The table shows amounts on a cash basis, reflecting actual expenditures made during
the year, even if the payments were for services performed in an earlier year. Similarly,
income figures represent amounts actually received during the year, even if incurred in
an earlier year.
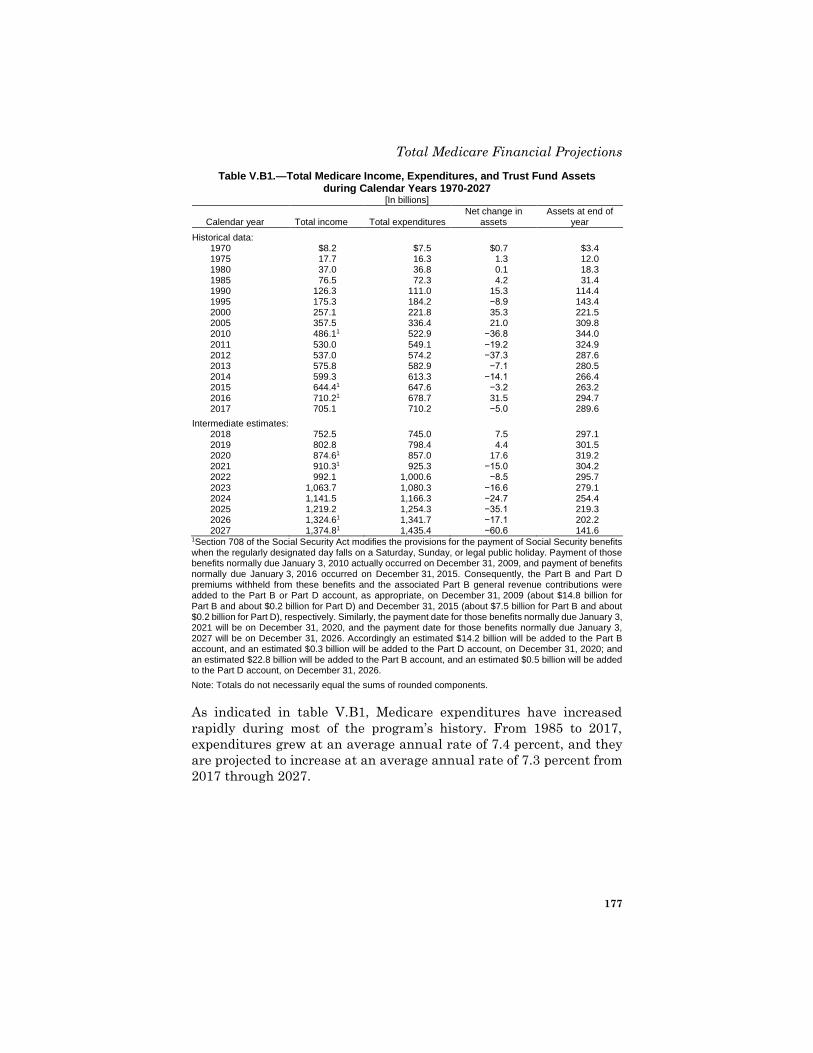
Total Medicare Financial Projections
177
Table V.B1.—Total Medicare Income, Expenditures, and Trust Fund Assets during Calendar Years 1970-2027
[In billions]
Calendar year Total income Total expenditures Net change in
assets Assets at end of
year
Historical data: 1970 $8.2 $7.5 $0.7 $3.4 1975 17.7 16.3 1.3 12.0 1980 37.0 36.8 0.1 18.3 1985 76.5 72.3 4.2 31.4 1990 126.3 111.0 15.3 114.4 1995 175.3 184.2 −8.9 143.4 2000 257.1 221.8 35.3 221.5 2005 357.5 336.4 21.0 309.8 2010 486.1 1 522.9 −36.8 344.0
2011 530.0 549.1 −19.2 324.9 2012 537.0 574.2 −37.3 287.6 2013 575.8 582.9 −7.1 280.5 2014 599.3 613.3 −14.1 266.4 2015 644.4 1 647.6 −3.2 263.2 2016 710.2 1 678.7 31.5 294.7 2017 705.1 710.2 −5.0 289.6
Intermediate estimates: 2018 752.5 745.0 7.5 297.1 2019 802.8 798.4 4.4 301.5 2020 874.6 1 857.0 17.6 319.2 2021 910.3 1 925.3 −15.0 304.2 2022 992.1 1,000.6 −8.5 295.7 2023 1,063.7 1,080.3 −16.6 279.1 2024 1,141.5 1,166.3 −24.7 254.4 2025 1,219.2 1,254.3 −35.1 219.3 2026 1,324.6 1 1,341.7 −17.1 202.2 2027 1,374.8 1 1,435.4 −60.6 141.6
1Section 708 of the Social Security Act modifies the provisions for the payment of Social Security benefits when the regularly designated day falls on a Saturday, Sunday, or legal public holiday. Payment of those benefits normally due January 3, 2010 actually occurred on December 31, 2009, and payment of benefits normally due January 3, 2016 occurred on December 31, 2015. Consequently, the Part B and Part D premiums withheld from these benefits and the associated Part B general revenue contributions were added to the Part B or Part D account, as appropriate, on December 31, 2009 (about $14.8 billion for Part B and about $0.2 billion for Part D) and December 31, 2015 (about $7.5 billion for Part B and about $0.2 billion for Part D), respectively. Similarly, the payment date for those benefits normally due January 3, 2021 will be on December 31, 2020, and the payment date for those benefits normally due January 3, 2027 will be on December 31, 2026. Accordingly an estimated $14.2 billion will be added to the Part B account, and an estimated $0.3 billion will be added to the Part D account, on December 31, 2020; and an estimated $22.8 billion will be added to the Part B account, and an estimated $0.5 billion will be added to the Part D account, on December 31, 2026.
Note: Totals do not necessarily equal the sums of rounded components.
As indicated in table V.B1, Medicare expenditures have increased
rapidly during most of the program’s history. From 1985 to 2017,
expenditures grew at an average annual rate of 7.4 percent, and they
are projected to increase at an average annual rate of 7.3 percent from
2017 through 2027.
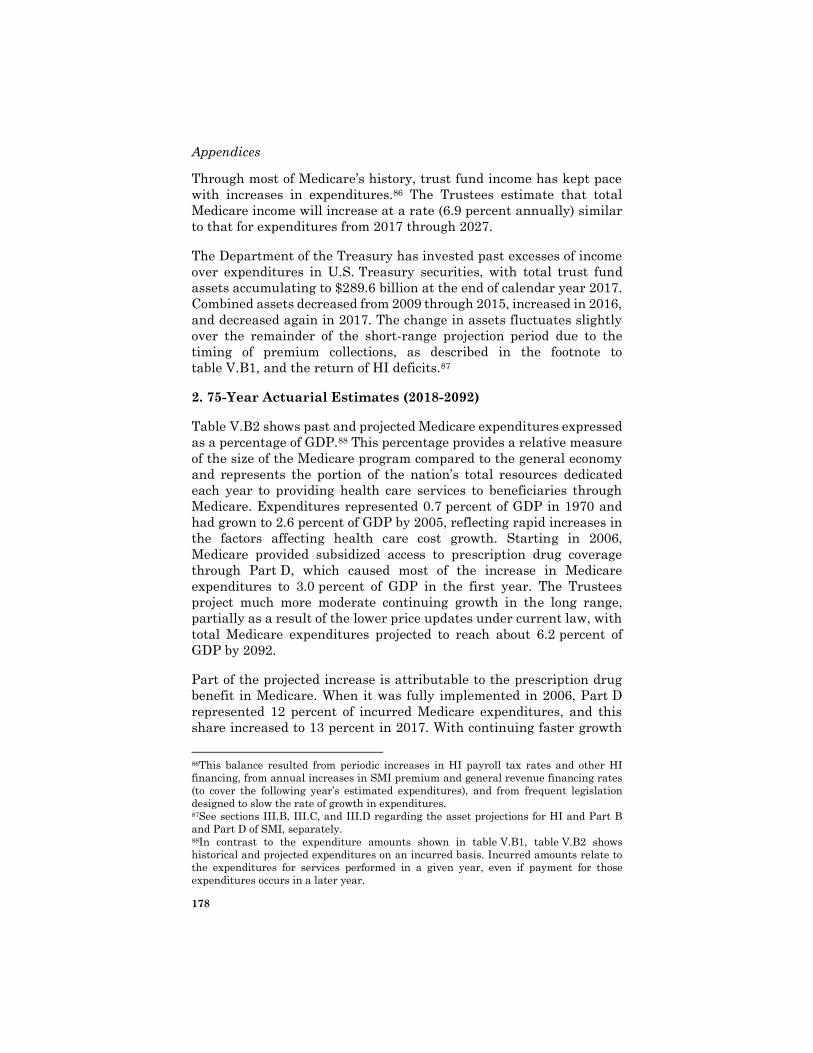
Appendices
178
Through most of Medicare’s history, trust fund income has kept pace
with increases in expenditures.86 The Trustees estimate that total
Medicare income will increase at a rate (6.9 percent annually) similar
to that for expenditures from 2017 through 2027.
The Department of the Treasury has invested past excesses of income
over expenditures in U.S. Treasury securities, with total trust fund
assets accumulating to $289.6 billion at the end of calendar year 2017.
Combined assets decreased from 2009 through 2015, increased in 2016,
and decreased again in 2017. The change in assets fluctuates slightly
over the remainder of the short-range projection period due to the
timing of premium collections, as described in the footnote to
table V.B1, and the return of HI deficits.87
2. 75-Year Actuarial Estimates (2018-2092)
Table V.B2 shows past and projected Medicare expenditures expressed
as a percentage of GDP.88 This percentage provides a relative measure
of the size of the Medicare program compared to the general economy
and represents the portion of the nation’s total resources dedicated
each year to providing health care services to beneficiaries through
Medicare. Expenditures represented 0.7 percent of GDP in 1970 and
had grown to 2.6 percent of GDP by 2005, reflecting rapid increases in
the factors affecting health care cost growth. Starting in 2006,
Medicare provided subsidized access to prescription drug coverage
through Part D, which caused most of the increase in Medicare
expenditures to 3.0 percent of GDP in the first year. The Trustees
project much more moderate continuing growth in the long range,
partially as a result of the lower price updates under current law, with
total Medicare expenditures projected to reach about 6.2 percent of
GDP by 2092.
Part of the projected increase is attributable to the prescription drug
benefit in Medicare. When it was fully implemented in 2006, Part D
represented 12 percent of incurred Medicare expenditures, and this
share increased to 13 percent in 2017. With continuing faster growth
86This balance resulted from periodic increases in HI payroll tax rates and other HI
financing, from annual increases in SMI premium and general revenue financing rates
(to cover the following year’s estimated expenditures), and from frequent legislation
designed to slow the rate of growth in expenditures. 87See sections III.B, III.C, and III.D regarding the asset projections for HI and Part B
and Part D of SMI, separately. 88In contrast to the expenditure amounts shown in table V.B1, table V.B2 shows
historical and projected expenditures on an incurred basis. Incurred amounts relate to
the expenditures for services performed in a given year, even if payment for those
expenditures occurs in a later year.
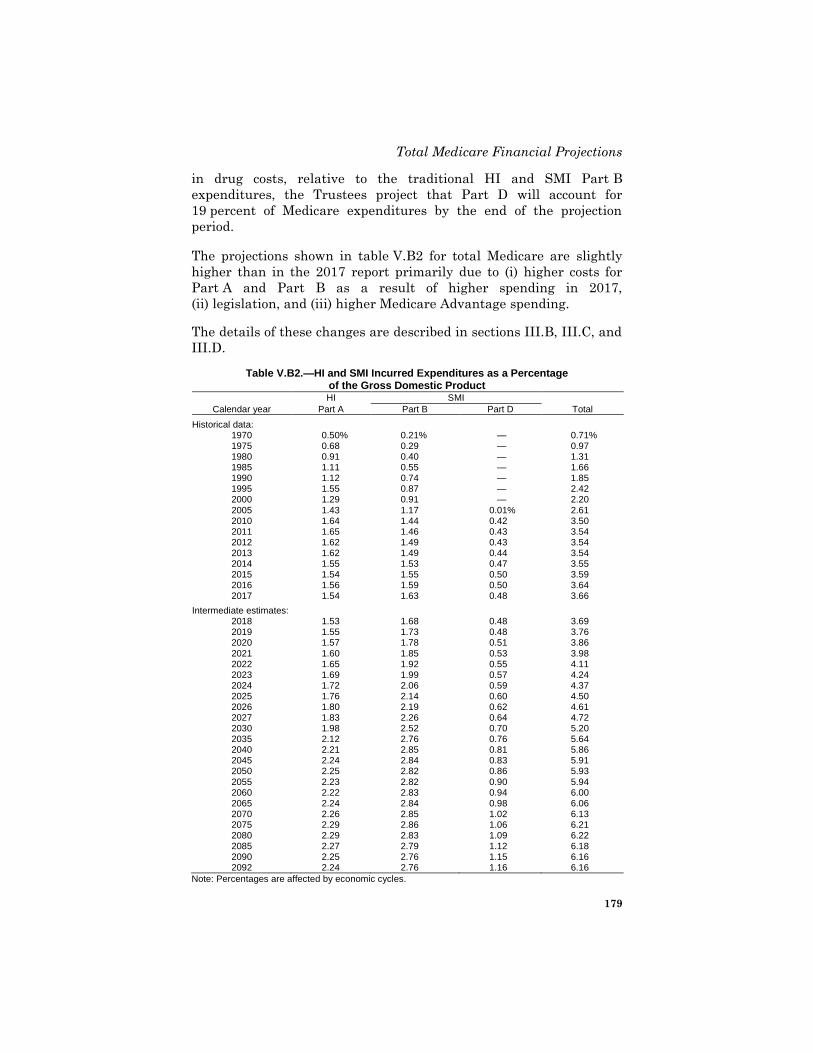
Total Medicare Financial Projections
179
in drug costs, relative to the traditional HI and SMI Part B
expenditures, the Trustees project that Part D will account for
19 percent of Medicare expenditures by the end of the projection
period.
The projections shown in table V.B2 for total Medicare are slightly
higher than in the 2017 report primarily due to (i) higher costs for
Part A and Part B as a result of higher spending in 2017,
(ii) legislation, and (iii) higher Medicare Advantage spending.
The details of these changes are described in sections III.B, III.C, and
III.D.
Table V.B2.—HI and SMI Incurred Expenditures as a Percentage of the Gross Domestic Product
HI SMI
Calendar year Part A Part B Part D Total
Historical data: 1970 0.50 % 0.21 % — 0.71 % 1975 0.68 0.29 — 0.97 1980 0.91 0.40 — 1.31 1985 1.11 0.55 — 1.66 1990 1.12 0.74 — 1.85 1995 1.55 0.87 — 2.42 2000 1.29 0.91 — 2.20 2005 1.43 1.17 0.01 % 2.61 2010 1.64 1.44 0.42 3.50 2011 1.65 1.46 0.43 3.54 2012 1.62 1.49 0.43 3.54 2013 1.62 1.49 0.44 3.54 2014 1.55 1.53 0.47 3.55 2015 1.54 1.55 0.50 3.59 2016 1.56 1.59 0.50 3.64 2017 1.54 1.63 0.48 3.66
Intermediate estimates: 2018 1.53 1.68 0.48 3.69 2019 1.55 1.73 0.48 3.76 2020 1.57 1.78 0.51 3.86 2021 1.60 1.85 0.53 3.98 2022 1.65 1.92 0.55 4.11 2023 1.69 1.99 0.57 4.24 2024 1.72 2.06 0.59 4.37 2025 1.76 2.14 0.60 4.50 2026 1.80 2.19 0.62 4.61 2027 1.83 2.26 0.64 4.72 2030 1.98 2.52 0.70 5.20 2035 2.12 2.76 0.76 5.64 2040 2.21 2.85 0.81 5.86 2045 2.24 2.84 0.83 5.91 2050 2.25 2.82 0.86 5.93 2055 2.23 2.82 0.90 5.94 2060 2.22 2.83 0.94 6.00 2065 2.24 2.84 0.98 6.06 2070 2.26 2.85 1.02 6.13 2075 2.29 2.86 1.06 6.21 2080 2.29 2.83 1.09 6.22 2085 2.27 2.79 1.12 6.18 2090 2.25 2.76 1.15 6.16 2092 2.24 2.76 1.16 6.16
Note: Percentages are affected by economic cycles.
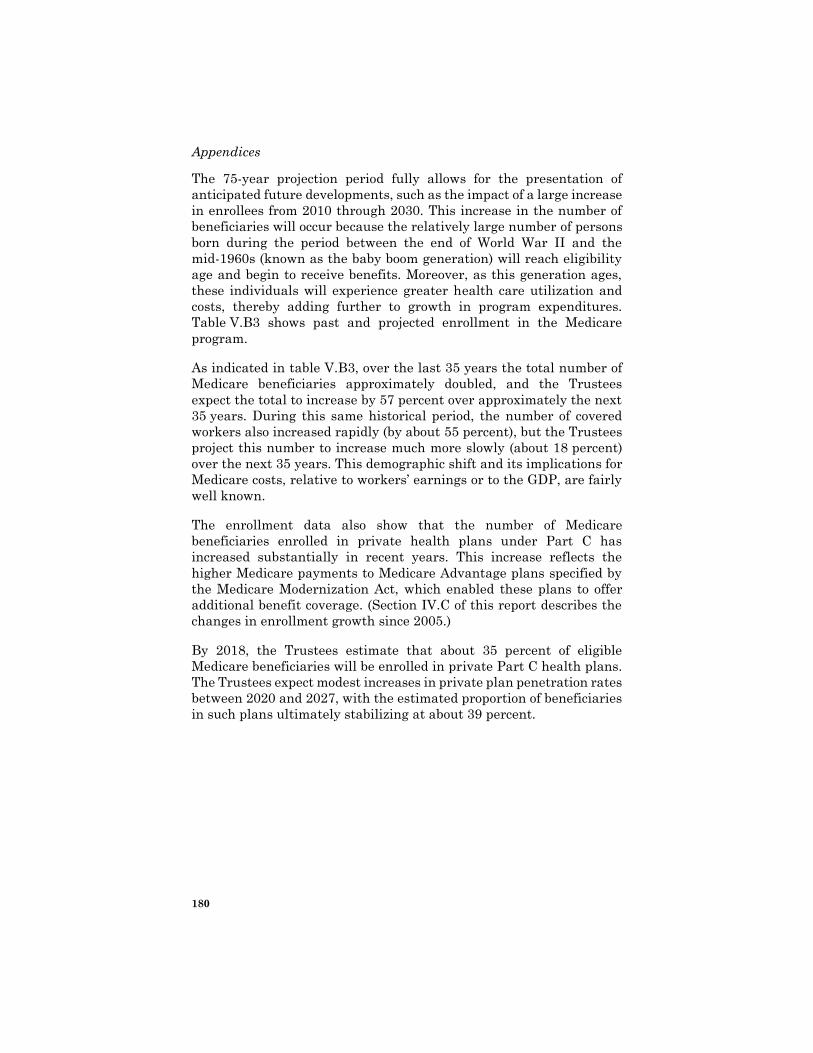
Appendices
180
The 75-year projection period fully allows for the presentation of
anticipated future developments, such as the impact of a large increase
in enrollees from 2010 through 2030. This increase in the number of
beneficiaries will occur because the relatively large number of persons
born during the period between the end of World War II and the
mid-1960s (known as the baby boom generation) will reach eligibility
age and begin to receive benefits. Moreover, as this generation ages,
these individuals will experience greater health care utilization and
costs, thereby adding further to growth in program expenditures.
Table V.B3 shows past and projected enrollment in the Medicare
program.
As indicated in table V.B3, over the last 35 years the total number of
Medicare beneficiaries approximately doubled, and the Trustees
expect the total to increase by 57 percent over approximately the next
35 years. During this same historical period, the number of covered
workers also increased rapidly (by about 55 percent), but the Trustees
project this number to increase much more slowly (about 18 percent)
over the next 35 years. This demographic shift and its implications for
Medicare costs, relative to workers’ earnings or to the GDP, are fairly
well known.
The enrollment data also show that the number of Medicare
beneficiaries enrolled in private health plans under Part C has
increased substantially in recent years. This increase reflects the
higher Medicare payments to Medicare Advantage plans specified by
the Medicare Modernization Act, which enabled these plans to offer
additional benefit coverage. (Section IV.C of this report describes the
changes in enrollment growth since 2005.)
By 2018, the Trustees estimate that about 35 percent of eligible
Medicare beneficiaries will be enrolled in private Part C health plans.
The Trustees expect modest increases in private plan penetration rates
between 2020 and 2027, with the estimated proportion of beneficiaries
in such plans ultimately stabilizing at about 39 percent.
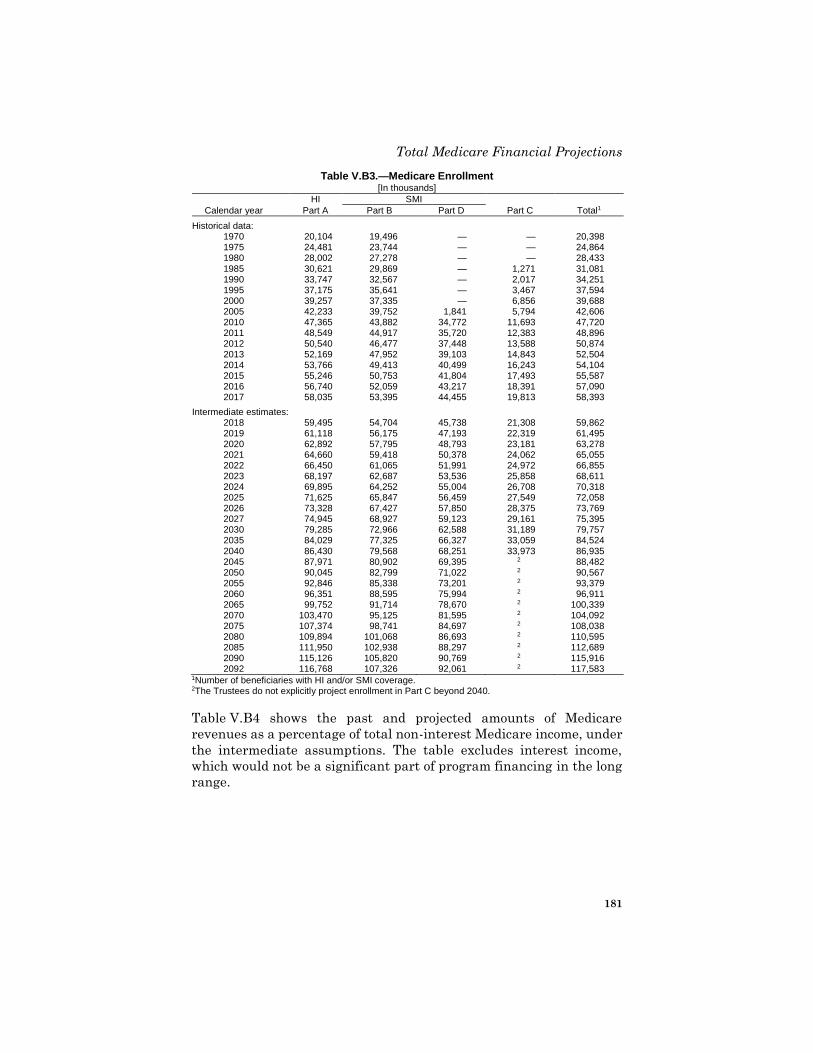
Total Medicare Financial Projections
181
Table V.B3.—Medicare Enrollment [In thousands]
HI SMI
Calendar year Part A Part B Part D Part C Total1
Historical data: 1970 20,104 19,496 — — 20,398 1975 24,481 23,744 — — 24,864 1980 28,002 27,278 — — 28,433 1985 30,621 29,869 — 1,271 31,081 1990 33,747 32,567 — 2,017 34,251 1995 37,175 35,641 — 3,467 37,594 2000 39,257 37,335 — 6,856 39,688 2005 42,233 39,752 1,841 5,794 42,606 2010 47,365 43,882 34,772 11,693 47,720 2011 48,549 44,917 35,720 12,383 48,896 2012 50,540 46,477 37,448 13,588 50,874 2013 52,169 47,952 39,103 14,843 52,504 2014 53,766 49,413 40,499 16,243 54,104 2015 55,246 50,753 41,804 17,493 55,587 2016 56,740 52,059 43,217 18,391 57,090 2017 58,035 53,395 44,455 19,813 58,393
Intermediate estimates: 2018 59,495 54,704 45,738 21,308 59,862 2019 61,118 56,175 47,193 22,319 61,495 2020 62,892 57,795 48,793 23,181 63,278 2021 64,660 59,418 50,378 24,062 65,055 2022 66,450 61,065 51,991 24,972 66,855 2023 68,197 62,687 53,536 25,858 68,611 2024 69,895 64,252 55,004 26,708 70,318 2025 71,625 65,847 56,459 27,549 72,058 2026 73,328 67,427 57,850 28,375 73,769 2027 74,945 68,927 59,123 29,161 75,395 2030 79,285 72,966 62,588 31,189 79,757 2035 84,029 77,325 66,327 33,059 84,524 2040 86,430 79,568 68,251 33,973 86,935 2045 87,971 80,902 69,395 2 88,482 2050 90,045 82,799 71,022 2 90,567 2055 92,846 85,338 73,201 2 93,379 2060 96,351 88,595 75,994 2 96,911 2065 99,752 91,714 78,670 2 100,339 2070 103,470 95,125 81,595 2 104,092 2075 107,374 98,741 84,697 2 108,038 2080 109,894 101,068 86,693 2 110,595 2085 111,950 102,938 88,297 2 112,689 2090 115,126 105,820 90,769 2 115,916 2092 116,768 107,326 92,061 2 117,583
1Number of beneficiaries with HI and/or SMI coverage. 2The Trustees do not explicitly project enrollment in Part C beyond 2040.
Table V.B4 shows the past and projected amounts of Medicare
revenues as a percentage of total non-interest Medicare income, under
the intermediate assumptions. The table excludes interest income,
which would not be a significant part of program financing in the long
range.
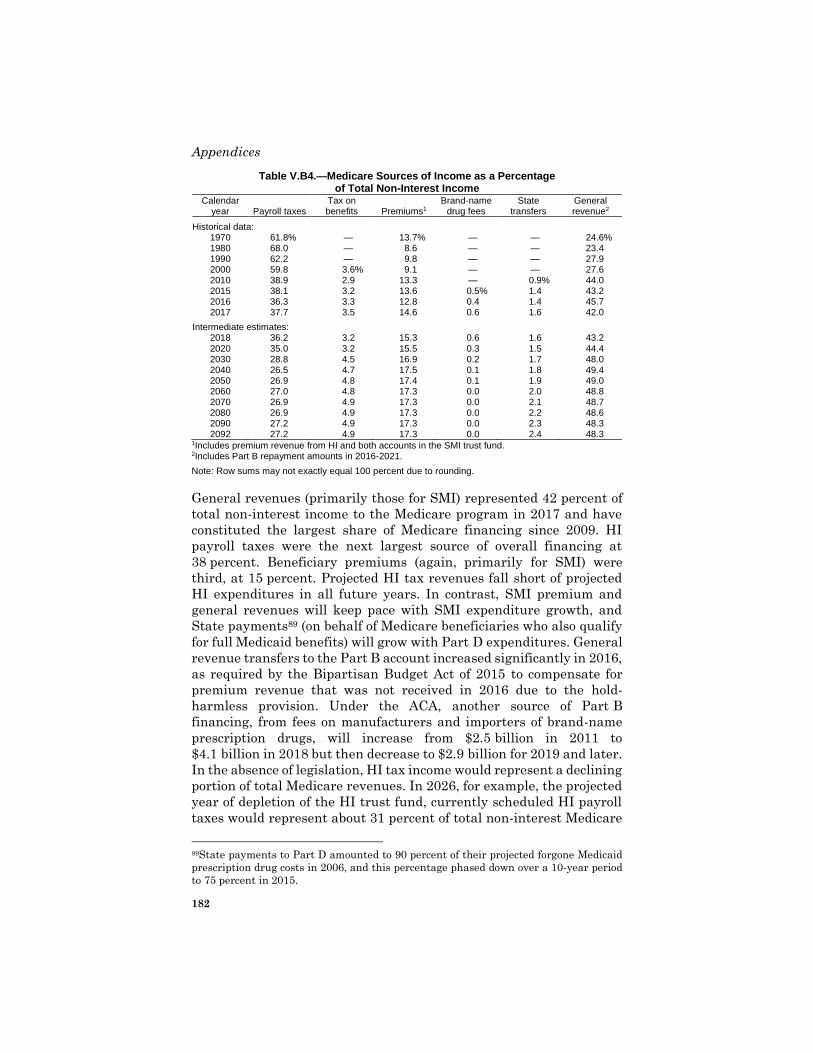
Appendices
182
Table V.B4.—Medicare Sources of Income as a Percentage of Total Non-Interest Income
Calendar year Payroll taxes
Tax on benefits Premiums1
Brand-name drug fees
State transfers
General revenue2
Historical data: 1970 61.8 % — 13.7 % — — 24.6 % 1980 68.0 — 8.6 — — 23.4 1990 62.2 — 9.8 — — 27.9 2000 59.8 3.6 % 9.1 — — 27.6 2010 38.9 2.9 13.3 — 0.9 % 44.0 2015 38.1 3.2 13.6 0.5 % 1.4 43.2 2016 36.3 3.3 12.8 0.4 1.4 45.7 2017 37.7 3.5 14.6 0.6 1.6 42.0
Intermediate estimates: 2018 36.2 3.2 15.3 0.6 1.6 43.2
2020 35.0 3.2 15.5 0.3 1.5 44.4 2030 28.8 4.5 16.9 0.2 1.7 48.0 2040 26.5 4.7 17.5 0.1 1.8 49.4 2050 26.9 4.8 17.4 0.1 1.9 49.0 2060 27.0 4.8 17.3 0.0 2.0 48.8 2070 26.9 4.9 17.3 0.0 2.1 48.7 2080 26.9 4.9 17.3 0.0 2.2 48.6 2090 27.2 4.9 17.3 0.0 2.3 48.3 2092 27.2 4.9 17.3 0.0 2.4 48.3
1Includes premium revenue from HI and both accounts in the SMI trust fund. 2Includes Part B repayment amounts in 2016-2021.
Note: Row sums may not exactly equal 100 percent due to rounding.
General revenues (primarily those for SMI) represented 42 percent of
total non-interest income to the Medicare program in 2017 and have
constituted the largest share of Medicare financing since 2009. HI
payroll taxes were the next largest source of overall financing at
38 percent. Beneficiary premiums (again, primarily for SMI) were
third, at 15 percent. Projected HI tax revenues fall short of projected
HI expenditures in all future years. In contrast, SMI premium and
general revenues will keep pace with SMI expenditure growth, and
State payments89 (on behalf of Medicare beneficiaries who also qualify
for full Medicaid benefits) will grow with Part D expenditures. General
revenue transfers to the Part B account increased significantly in 2016,
as required by the Bipartisan Budget Act of 2015 to compensate for
premium revenue that was not received in 2016 due to the hold-
harmless provision. Under the ACA, another source of Part B
financing, from fees on manufacturers and importers of brand-name
prescription drugs, will increase from $2.5 billion in 2011 to
$4.1 billion in 2018 but then decrease to $2.9 billion for 2019 and later.
In the absence of legislation, HI tax income would represent a declining
portion of total Medicare revenues. In 2026, for example, the projected
year of depletion of the HI trust fund, currently scheduled HI payroll
taxes would represent about 31 percent of total non-interest Medicare
89State payments to Part D amounted to 90 percent of their projected forgone Medicaid
prescription drug costs in 2006, and this percentage phased down over a 10-year period
to 75 percent in 2015.
Total Medicare Financial Projections
183
income. General revenues and beneficiary premiums would equal
about 47 and 16 percent, respectively.
The law requires an expanded analysis of the combined expenditures
and dedicated revenues of the HI and SMI trust funds. In particular,
the law requires a determination as to whether the difference between
total Medicare outlays and its dedicated financing sources is projected
to exceed 45 percent of total outlays within the next 7 fiscal years
(2018-2024). Dedicated Medicare financing sources include HI payroll
taxes; income from taxation of Social Security benefits; State transfers
for the prescription drug benefit; premiums paid under Parts A, B, and
D; fees on brand-name prescription drugs paid to Part B; and any gifts
received by the Medicare trust funds. The test uses expenditures
adjusted to avoid temporary distortions arising from the payment of
Medicare Advantage capitation amounts in September when the
normal October payment date is a Saturday or Sunday.
Lawmakers established the 45-percent test to help call attention to
Medicare’s impact on the Federal budget. The Trustees made
determinations of excess general revenue Medicare funding in each of
the reports for 2006 through 2013 and in the 2017 report. Two
consecutive such determinations trigger a Medicare funding warning.
The 2007 through 2013 reports thus prompted Medicare funding
warnings. Such findings require the President to submit to Congress,
within 15 days after the date of the Budget submission for the
succeeding year, proposed legislation to respond to the warning. The
law also requires Congress to consider the legislation proposed in
response to Medicare funding warnings on an expedited basis. To date,
elected officials have not enacted legislation responding to these
funding warnings.
Figure V.B1 displays, on a calendar-year basis, the historical and
projected ratio of the difference between total Medicare outlays and
dedicated financing sources to total Medicare outlays. As indicated,
this ratio exceeded 45 percent at the end of calendar years 2009
through 2012 and is expected to again exceed that level at the end of
calendar year 2021, the fourth year of the projection. Therefore, the
Board of Trustees is issuing a determination of excess general revenue
Medicare funding in this report. Since this is the second consecutive
such finding, a Medicare funding warning is triggered.
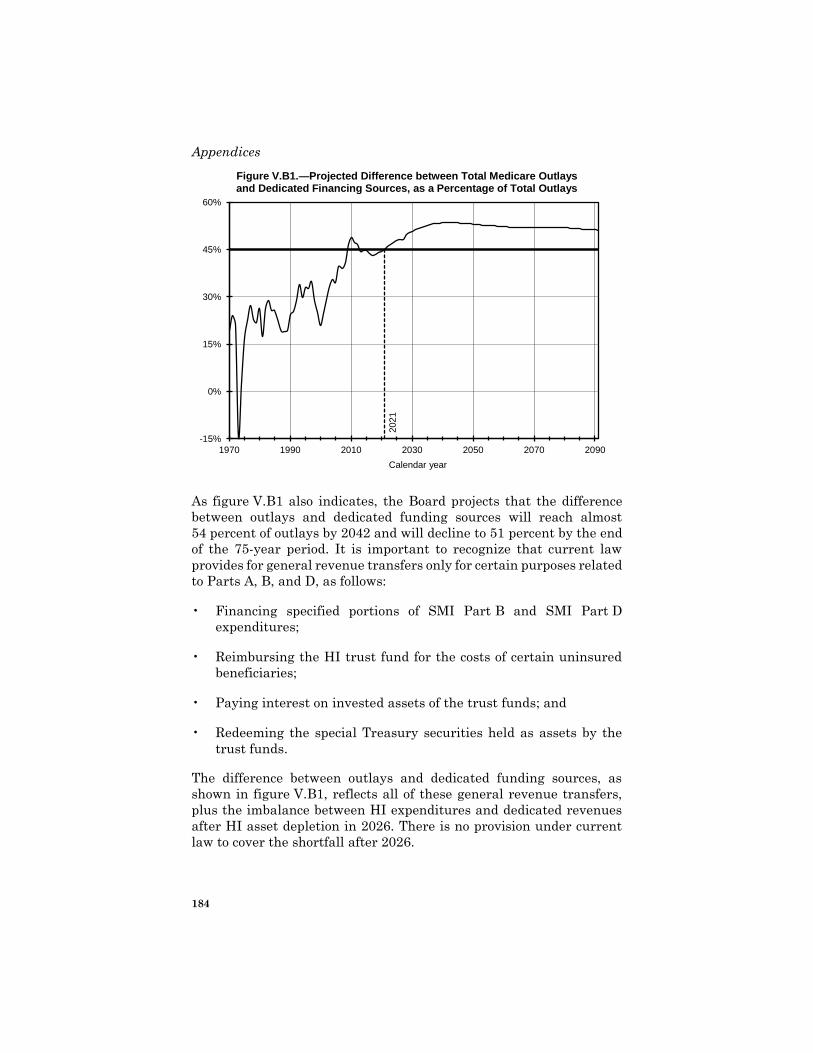
Appendices
184
Figure V.B1.—Projected Difference between Total Medicare Outlays and Dedicated Financing Sources, as a Percentage of Total Outlays
2021
-15%
0%
15%
30%
45%
60%
1970 1990 2010 2030 2050 2070 2090
Calendar year
As figure V.B1 also indicates, the Board projects that the difference
between outlays and dedicated funding sources will reach almost
54 percent of outlays by 2042 and will decline to 51 percent by the end
of the 75-year period. It is important to recognize that current law
provides for general revenue transfers only for certain purposes related
to Parts A, B, and D, as follows:
• Financing specified portions of SMI Part B and SMI Part D
expenditures;
• Reimbursing the HI trust fund for the costs of certain uninsured
beneficiaries;
• Paying interest on invested assets of the trust funds; and
• Redeeming the special Treasury securities held as assets by the
trust funds.
The difference between outlays and dedicated funding sources, as
shown in figure V.B1, reflects all of these general revenue transfers,
plus the imbalance between HI expenditures and dedicated revenues
after HI asset depletion in 2026. There is no provision under current
law to cover the shortfall after 2026.
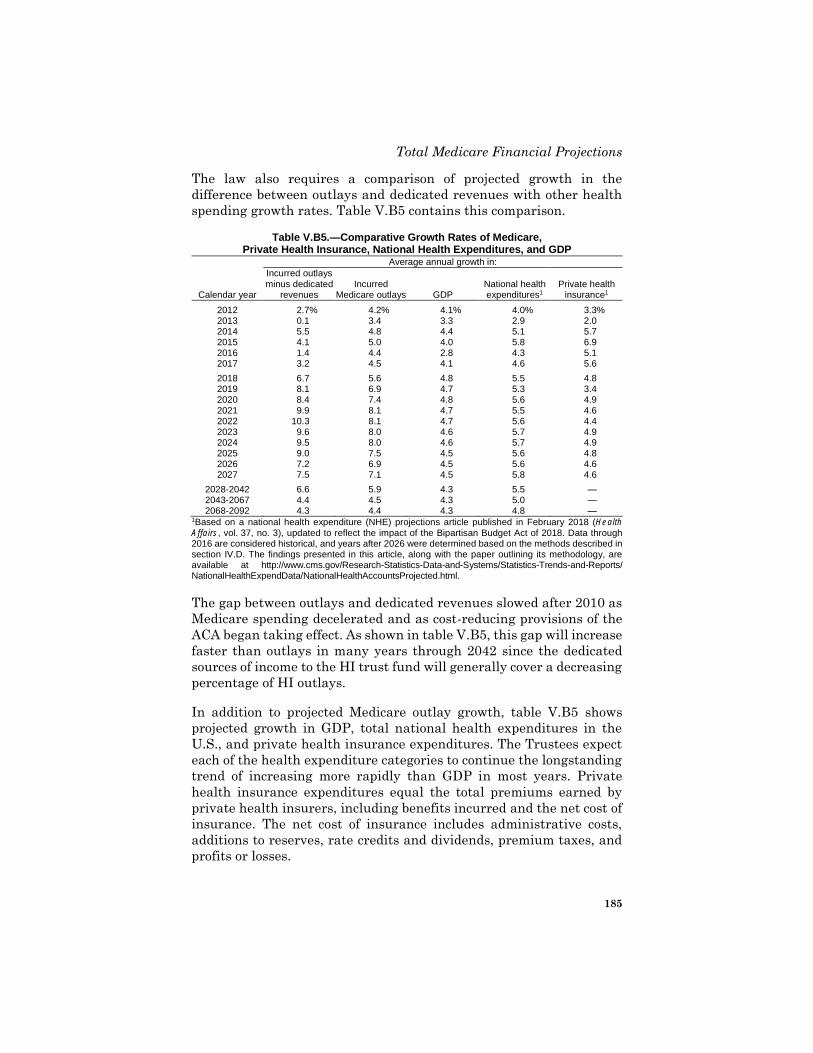
Total Medicare Financial Projections
185
The law also requires a comparison of projected growth in the
difference between outlays and dedicated revenues with other health
spending growth rates. Table V.B5 contains this comparison.
Table V.B5.—Comparative Growth Rates of Medicare, Private Health Insurance, National Health Expenditures, and GDP
Average annual growth in:
Calendar year
Incurred outlays minus dedicated
revenues Incurred
Medicare outlays GDP National health expenditures1
Private health insurance1
2012 2.7 % 4.2 % 4.1 % 4.0 % 3.3 % 2013 0.1 3.4 3.3 2.9 2.0 2014 5.5 4.8 4.4 5.1 5.7 2015 4.1 5.0 4.0 5.8 6.9 2016 1.4 4.4 2.8 4.3 5.1 2017 3.2 4.5 4.1 4.6 5.6
2018 6.7 5.6 4.8 5.5 4.8 2019 8.1 6.9 4.7 5.3 3.4 2020 8.4 7.4 4.8 5.6 4.9 2021 9.9 8.1 4.7 5.5 4.6 2022 10.3 8.1 4.7 5.6 4.4 2023 9.6 8.0 4.6 5.7 4.9 2024 9.5 8.0 4.6 5.7 4.9 2025 9.0 7.5 4.5 5.6 4.8 2026 7.2 6.9 4.5 5.6 4.6 2027 7.5 7.1 4.5 5.8 4.6
2028-2042 6.6 5.9 4.3 5.5 — 2043-2067 4.4 4.5 4.3 5.0 — 2068-2092 4.3 4.4 4.3 4.8 —
1Based on a national health expenditure (NHE) projections article published in February 2018 (Health
Affairs, vol. 37, no. 3), updated to reflect the impact of the Bipartisan Budget Act of 2018. Data through 2016 are considered historical, and years after 2026 were determined based on the methods described in section IV.D. The findings presented in this article, along with the paper outlining its methodology, are available at http://www.cms.gov/Research-Statistics-Data-and-Systems/Statistics-Trends-and-Reports/NationalHealthExpendData/NationalHealthAccountsProjected.html.
The gap between outlays and dedicated revenues slowed after 2010 as
Medicare spending decelerated and as cost-reducing provisions of the
ACA began taking effect. As shown in table V.B5, this gap will increase
faster than outlays in many years through 2042 since the dedicated
sources of income to the HI trust fund will generally cover a decreasing
percentage of HI outlays.
In addition to projected Medicare outlay growth, table V.B5 shows
projected growth in GDP, total national health expenditures in the
U.S., and private health insurance expenditures. The Trustees expect
each of the health expenditure categories to continue the longstanding
trend of increasing more rapidly than GDP in most years. Private
health insurance expenditures equal the total premiums earned by
private health insurers, including benefits incurred and the net cost of
insurance. The net cost of insurance includes administrative costs,
additions to reserves, rate credits and dividends, premium taxes, and
profits or losses.
Appendices
186
Several factors affect comparisons between aggregate Medicare and
private health insurance cost growth:
• The number of Medicare beneficiaries is currently increasing by
about 3 percent per year, and this growth rate will continue as
more of the post-World War II baby boom generation reaches
eligibility age. The number of individuals with private health
insurance is estimated to increase at slower rates than the growth
in the number of Medicare beneficiaries.
• Certain current-law provisions, such as the limitation on
maximum out-of-pocket costs in 2014 and later and the 40-percent
excise tax on high-cost employer-sponsored insurance plans in
2022 and later, will also affect the average actuarial value of
private health insurance benefits.
• The use of health care services differs significantly between
Medicare beneficiaries (who are generally over 65) and individuals
with private health insurance (who are predominantly below
age 65). The former group, for example, has a higher incidence of
hospitalization, skilled nursing care, and home health care. For the
latter group, physician services represent a greater proportion of
their total health care needs. Different cost growth trends by type
of service will affect overall growth rates and reflect the
distribution of services for each category of people.
• There is some overlap between people with Medicare and those
with private health insurance. For example, many Medicare
beneficiaries have supplemental health insurance coverage
through private Medigap insurance policies or employer-sponsored
retiree health benefits, and private health insurance includes both
of these categories. About 10 million Medicare beneficiaries receive
supplemental coverage through the Medicaid program; neither the
growth rates for Medicare nor those for private health insurance
reflect the Medicaid costs for these dual beneficiaries.
A number of research studies have attempted to control for some or all
of these differences in comparing growth trends. Over long historical
periods, average, demographically adjusted, per capita growth rates for
common benefits have been somewhat lower for Medicare than for
private health insurance. For shorter periods, however, the rates of
growth have often diverged substantially, and the differential has been
negative in some years and positive in others. More information on
past and projected national and private health expenditures, and on
comparisons to Medicare growth rates, is available in the sources cited
in table V.B5.
Alternative Projections
187
C. ILLUSTRATIVE ALTERNATIVE PROJECTIONS
The Social Security Act requires the Trustees to evaluate the financial
status of the Medicare trust funds. To comply with this mandate, the
Trustees must assess whether the financing provided under current
law is adequate to cover the benefit payments and other expenditures
required under current law. Accordingly, the estimates shown in this
report are based on all of the current statutory requirements, including
(i) the reductions in payment updates by the increase in economy-wide
productivity for most non-physician provider categories; (ii) the
physician payment updates specified by MACRA for all future years;
and (iii) the expiration in 2025 of the 5-percent bonuses for qualifying
physicians in advanced alternative payment models (advanced APMs)
and of the $500-million payments for physicians in the merit-based
incentive payment system (MIPS).
As discussed in the Introduction, there is substantial uncertainty
regarding the adequacy of future Medicare payment rates under
current law. This section illustrates the higher Medicare outlays that
would result if certain statutory Medicare payment provisions were not
fully implemented in all future years. A few changes have occurred
since last year’s report that affect the illustrative alternative and the
ways in which it differs from the current-law projections. In particular,
the Trustees have implemented a recommendation from the 2016-2017
Medicare Technical Review Panel that the transition from current law
to the ultimate illustrative alternative assumptions start at later dates
than assumed previously.90 In addition, the Independent Payment
Advisory Board (IPAB) and all related provisions were repealed as part
of the Bipartisan Budget Act of 2018. In prior reports, the IPAB
provisions reduced Medicare spending under current law, but they
were assumed to not take effect under the illustrative alternative
scenario. Therefore, the repeal of the IPAB increases current-law
spending in this year’s report but does not affect the illustrative
alternative scenario.
For all Part A services and some other (non-physician) Part B services,
payment updates will be reduced in all future years by the increase in
90The ultimate assumptions underlying the illustrative alternative are similar to those
in the 2017 report, which the 2016-2017 Medicare Technical Review Panel concluded
were reasonable (Finding 2-3). However, they are implemented over a later time frame,
based on a recommendation from the 2016-2017 Panel (Recommendation 2-4).
Appendices
188
economy-wide productivity.91 By the end of the long-range projection
period, payment rates for affected providers would be about 57 percent
lower than their level in the absence of these reductions. In 2014, the
Medicare payment rates for inpatient hospital services declined to
about 60 percent of those paid by private health insurance.92 If future
improvements in productivity were to remain similar to what providers
have achieved in the recent past (about 0.4 percent annually), then
Medicare payment levels for inpatient hospital services at the end of
the long-range projection period would be less than 37 percent of the
corresponding level paid by private health insurance. This comparison
assumes that private payer rate increases would continue to be set
through the same negotiation process used to date, independent of the
Medicare reductions or other health system changes. Specifically,
private payer rates would grow by 3.0 percent per year, or the increase
in the price of inputs to the provision of health care (3.4 percent) less
the assumed growth in hospital productivity (0.4 percent). By
comparison, Medicare payment rates would grow by 2.3 percent per
year, or 3.4 percent less the assumed growth in economy-wide
productivity (1.1 percent).
Simulations that take into account the lower Medicare payment rates,
other payment provisions, sequestration, changes to Medicare and
Medicaid disproportionate share hospital payments, and coverage
expansions collectively suggest a deterioration of facility margins for
hospitals, skilled nursing facilities, and home health agencies,
particularly over the long run. From 2011 through 2019, the
simulations suggest that up to 5 percent more hospitals would
experience negative total facility margins and that approximately
15 percent more would experience negative Medicare margins. Other
factors, such as efforts to improve efficiency in lower-performing
hospitals, could mitigate some of the impact of the ACA payment
provisions, though there is a wide range of uncertainty regarding these
types of behavioral changes. By 2040, simulations suggest that
approximately half of hospitals, roughly two-thirds of skilled nursing
facilities, and over 80 percent of home health agencies would have
negative total facility margins, raising the possibility of access and
91In addition to the productivity adjustments, current law requires certain other
reductions in payment updates for 2010 through 2019. For inpatient hospital services,
the cumulative impact of these adjustments is a further reduction of 3.6 percent in
payment levels. Also, Medicare payments to providers will be affected by the
sequestration of outlays in April 2013 through September 2027. 92See http://www.aha.org/research/reports/tw/chartbook/2015/table4-4.pdf. Private
payer hospital payments are roughly 44 percent above costs while Medicare hospital
payments are roughly 12 percent below costs.
Alternative Projections
189
quality-of-care issues for Medicare beneficiaries. A memorandum on
these provider margin simulations is available on the CMS website.93
Over time, unless providers could alter their use of inputs to reduce
their cost per service correspondingly, Medicare’s payments for health
services would fall increasingly below providers’ costs. Providers could
not sustain continuing negative margins and would have to withdraw
from serving Medicare beneficiaries or (if total facility margins
remained positive) shift substantial portions of Medicare costs to their
non-Medicare, non-Medicaid payers. Under such circumstances,
lawmakers might feel substantial pressure to override the productivity
adjustments, much as they did to prevent reductions in physician
payment rates while the sustainable growth rate (SGR) system was in
effect.
While the physician payment system put in place by MACRA avoided
the significant short-range physician payment issues resulting from
the SGR system approach, it nevertheless raises important long-range
concerns that will almost certainly need to be addressed by future
legislation. In particular, additional updates totaling $500 million per
year and 5-percent annual bonuses are scheduled to expire in 2025,
resulting in a payment reduction for most physicians. In addition, the
law specifies the physician payment updates for all years in the future,
and these updates do not vary based on underlying economic
conditions, nor are they expected to keep pace with the average rate of
physician cost increases. The specified rate updates could be an issue
in years when levels of inflation are high and would be problematic
when the cumulative gap between the price updates and physician
costs becomes large. The Trustees previously estimated that physician
payment rates under current law will be lower than they would have
been under the SGR formula by 2048 and will be about 30 percent
lower by the end of the projection period. Absent a change in the
delivery system or level of update by subsequent legislation, the
Trustees expect access to Medicare-participating physicians to become
a significant issue in the long term.
In view of these issues, it is important to note that the actual future
costs for Medicare may exceed the projections shown in this report,
possibly by substantial amounts. Use of an alternative projection can
illustrate the potential magnitude of this difference.
93See http://www.cms.gov/Research-Statistics-Data-and-Systems/Statistics-Trends-and-
Reports/ReportsTrustFunds/Downloads/ACAmarginsimulations2017.pdf.
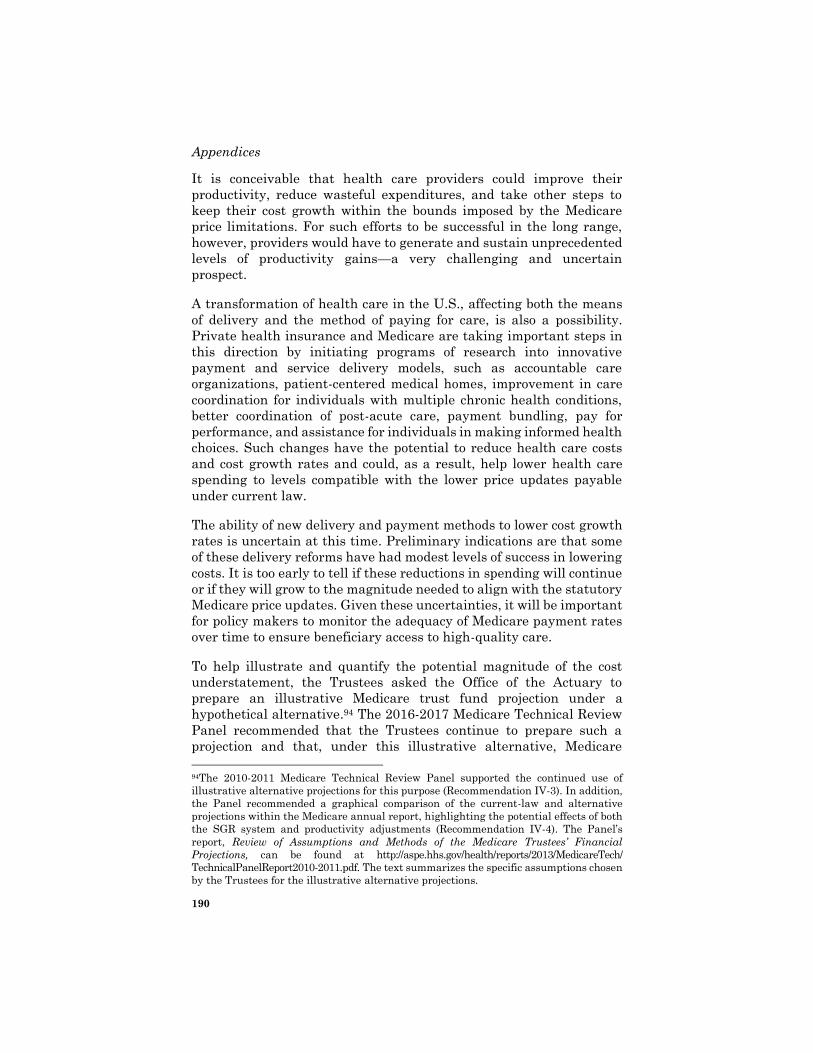
Appendices
190
It is conceivable that health care providers could improve their
productivity, reduce wasteful expenditures, and take other steps to
keep their cost growth within the bounds imposed by the Medicare
price limitations. For such efforts to be successful in the long range,
however, providers would have to generate and sustain unprecedented
levels of productivity gains—a very challenging and uncertain
prospect.
A transformation of health care in the U.S., affecting both the means
of delivery and the method of paying for care, is also a possibility.
Private health insurance and Medicare are taking important steps in
this direction by initiating programs of research into innovative
payment and service delivery models, such as accountable care
organizations, patient-centered medical homes, improvement in care
coordination for individuals with multiple chronic health conditions,
better coordination of post-acute care, payment bundling, pay for
performance, and assistance for individuals in making informed health
choices. Such changes have the potential to reduce health care costs
and cost growth rates and could, as a result, help lower health care
spending to levels compatible with the lower price updates payable
under current law.
The ability of new delivery and payment methods to lower cost growth
rates is uncertain at this time. Preliminary indications are that some
of these delivery reforms have had modest levels of success in lowering
costs. It is too early to tell if these reductions in spending will continue
or if they will grow to the magnitude needed to align with the statutory
Medicare price updates. Given these uncertainties, it will be important
for policy makers to monitor the adequacy of Medicare payment rates
over time to ensure beneficiary access to high-quality care.
To help illustrate and quantify the potential magnitude of the cost
understatement, the Trustees asked the Office of the Actuary to
prepare an illustrative Medicare trust fund projection under a
hypothetical alternative.94 The 2016-2017 Medicare Technical Review
Panel recommended that the Trustees continue to prepare such a
projection and that, under this illustrative alternative, Medicare
94The 2010-2011 Medicare Technical Review Panel supported the continued use of
illustrative alternative projections for this purpose (Recommendation IV-3). In addition,
the Panel recommended a graphical comparison of the current-law and alternative
projections within the Medicare annual report, highlighting the potential effects of both
the SGR system and productivity adjustments (Recommendation IV-4). The Panel’s
report, Review of Assumptions and Methods of the Medicare Trustees’ Financial
Projections, can be found at http://aspe.hhs.gov/health/reports/2013/MedicareTech/
TechnicalPanelReport2010-2011.pdf. The text summarizes the specific assumptions chosen
by the Trustees for the illustrative alternative projections.
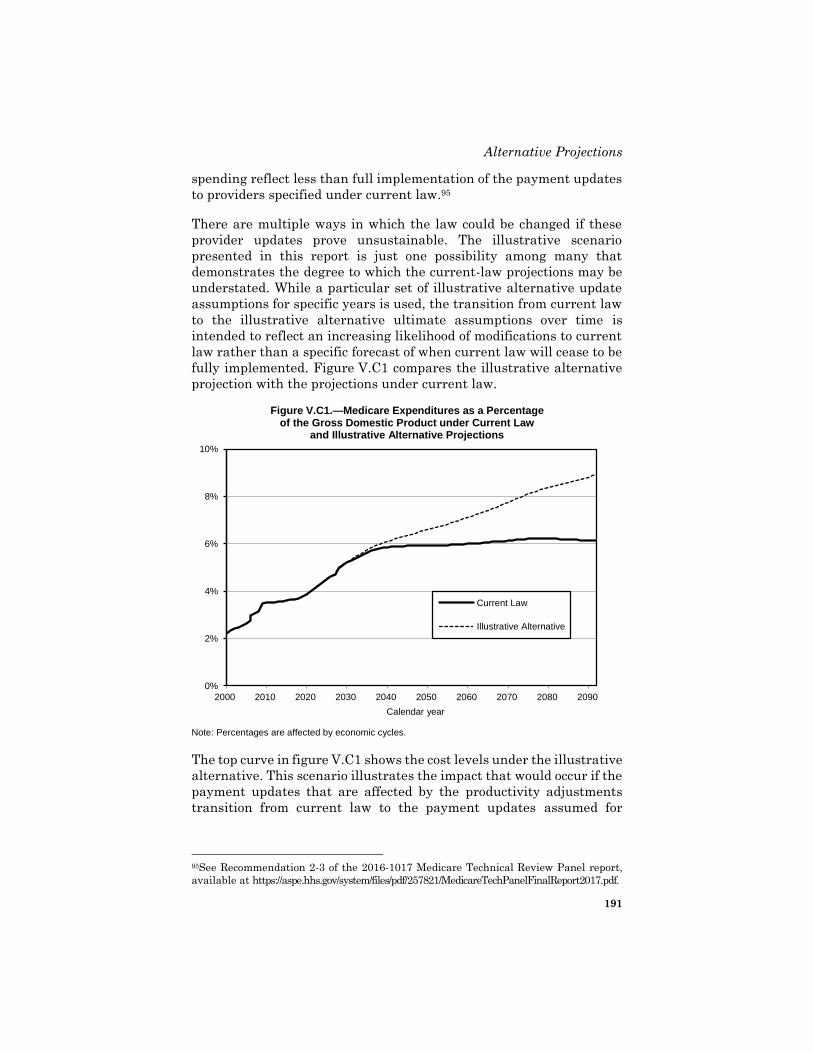
Alternative Projections
191
spending reflect less than full implementation of the payment updates
to providers specified under current law.95
There are multiple ways in which the law could be changed if these
provider updates prove unsustainable. The illustrative scenario
presented in this report is just one possibility among many that
demonstrates the degree to which the current-law projections may be
understated. While a particular set of illustrative alternative update
assumptions for specific years is used, the transition from current law
to the illustrative alternative ultimate assumptions over time is
intended to reflect an increasing likelihood of modifications to current
law rather than a specific forecast of when current law will cease to be
fully implemented. Figure V.C1 compares the illustrative alternative
projection with the projections under current law.
Figure V.C1.—Medicare Expenditures as a Percentage of the Gross Domestic Product under Current Law
and Illustrative Alternative Projections
0%
2%
4%
6%
8%
10%
2000 2010 2020 2030 2040 2050 2060 2070 2080 2090
Calendar year
Current Law
Illustrative Alternative
Note: Percentages are affected by economic cycles.
The top curve in figure V.C1 shows the cost levels under the illustrative
alternative. This scenario illustrates the impact that would occur if the
payment updates that are affected by the productivity adjustments
transition from current law to the payment updates assumed for
95See Recommendation 2-3 of the 2016-1017 Medicare Technical Review Panel report,
available at https://aspe.hhs.gov/system/files/pdf/257821/MedicareTechPanelFinalReport2017.pdf.
Appendices
192
private health plans over the period 2028 to 2042.96 It also reflects
physician payment updates that transition from current law to the
increase in the Medicare Economic Index over the same period. Finally,
the scenario assumes the continuation of the 5-percent bonuses for
physicians in advanced alternative payment models (advanced APMs)
and of the $500-million payments for physicians in the merit-based
incentive payment system (MIPS), which are set to expire in 2025.
Under this alternative, the average long-range per beneficiary growth
rate for all Medicare services would be similar to the long-range growth
rate assumed for the overall health sector.
Under the illustrative alternative scenario, Medicare costs as a
percentage of GDP continue to increase rapidly throughout the
projection period, reaching 6.2 percent of GDP in 2042 and 8.9 percent
in 2092—considerably higher than under current law (5.9 percent of
GDP in 2042 and 6.2 percent of GDP in 2092).
96Section IV.D of this report describes the price component of health care cost increases
for the overall health sector.
Per Beneficiary Cost
193
D. AVERAGE MEDICARE EXPENDITURES PER
BENEFICIARY
Table V.D1 shows historical average per beneficiary expenditures for
HI and SMI, as well as projected costs for calendar years 2018 through
2027 under the intermediate assumptions. Starting with the 2014
report, this section presents per beneficiary expenditures based on
when the service is performed rather than when payment for the
service is made.
For both HI and SMI Part B, costs increased very rapidly in the early
years, in part because the availability of Medicare coverage enabled
many beneficiaries to obtain the full range of health services they
needed. The rapid inflation of the 1970s and early 1980s also
contributed to rapid Medicare expenditure increases, and the cost-
based reimbursement mechanisms in place provided relatively little
incentive for efficiency in the provision of health care. Growth in
average HI expenditures moderated dramatically following the
introduction of the inpatient hospital prospective payment system in
fiscal year 1984, but it accelerated again in the late 1980s and early
1990s due to rapid growth in skilled nursing and home health
expenditures. During this same period, SMI Part B average costs
generally continued to increase at relatively fast rates but slowed
somewhat in the early 1990s with the implementation of physician fee
reform legislation.
Expenditure growth moderated again during the late 1990s due to the
effects of further legislation and efforts to control fraud and abuse. In
addition, historically low levels of general and medical inflation helped
reduce Medicare payment updates. The growth rates rebounded from
2001 through 2005 and then moderated somewhat for the remainder
of the decade.
For 2010 through 2015, HI and Part B of SMI experienced the lowest
5-year per beneficiary growth rates in the program’s history. This slow
growth, which continued in 2016 and 2017, was driven in part by
legislated update reductions, low provider payment updates caused by
the economic recession, and adjustments for documentation and coding
that did not reflect changes in real case mix. In addition, increased
enrollment resulting from eligibility of the baby boom generation has
decreased the average age of Medicare beneficiaries, thereby reducing
per beneficiary costs. The growth rates also reflect the impact of the
sequestration process, which is required under current law and
reduces Medicare expenditures by 2 percent per year beginning
April 1, 2013. Finally, growth in the volume and intensity of the
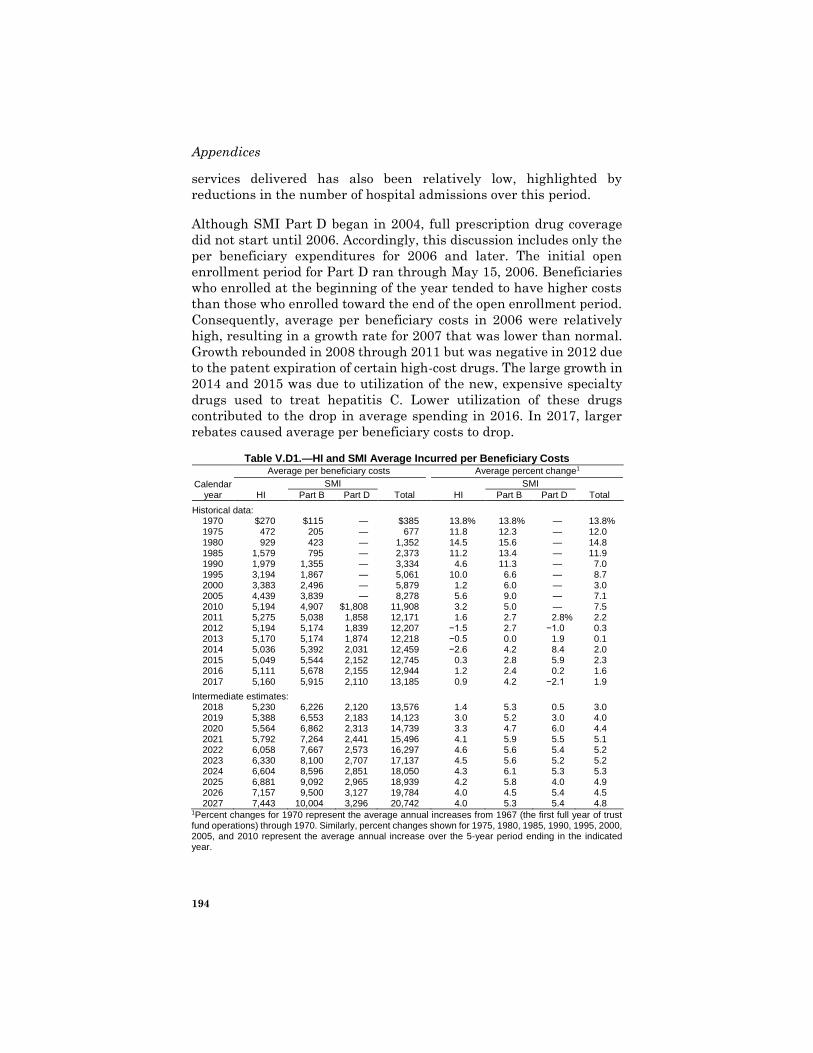
Appendices
194
services delivered has also been relatively low, highlighted by
reductions in the number of hospital admissions over this period.
Although SMI Part D began in 2004, full prescription drug coverage
did not start until 2006. Accordingly, this discussion includes only the
per beneficiary expenditures for 2006 and later. The initial open
enrollment period for Part D ran through May 15, 2006. Beneficiaries
who enrolled at the beginning of the year tended to have higher costs
than those who enrolled toward the end of the open enrollment period.
Consequently, average per beneficiary costs in 2006 were relatively
high, resulting in a growth rate for 2007 that was lower than normal.
Growth rebounded in 2008 through 2011 but was negative in 2012 due
to the patent expiration of certain high-cost drugs. The large growth in
2014 and 2015 was due to utilization of the new, expensive specialty
drugs used to treat hepatitis C. Lower utilization of these drugs
contributed to the drop in average spending in 2016. In 2017, larger
rebates caused average per beneficiary costs to drop.
Table V.D1.—HI and SMI Average Incurred per Beneficiary Costs
Average per beneficiary costs Average percent change1
Calendar year
SMI SMI
HI Part B Part D Total HI Part B Part D Total
Historical data: 1970 $270 $115 — $385 13.8 % 13.8 % — 13.8 % 1975 472 205 — 677 11.8 12.3 — 12.0 1980 929 423 — 1,352 14.5 15.6 — 14.8 1985 1,579 795 — 2,373 11.2 13.4 — 11.9 1990 1,979 1,355 — 3,334 4.6 11.3 — 7.0 1995 3,194 1,867 — 5,061 10.0 6.6 — 8.7 2000 3,383 2,496 — 5,879 1.2 6.0 — 3.0 2005 4,439 3,839 — 8,278 5.6 9.0 — 7.1 2010 5,194 4,907 $1,808 11,908 3.2 5.0 — 7.5 2011 5,275 5,038 1,858 12,171 1.6 2.7 2.8 % 2.2 2012 5,194 5,174 1,839 12,207 −1.5 2.7 −1.0 0.3 2013 5,170 5,174 1,874 12,218 −0.5 0.0 1.9 0.1 2014 5,036 5,392 2,031 12,459 −2.6 4.2 8.4 2.0 2015 5,049 5,544 2,152 12,745 0.3 2.8 5.9 2.3 2016 5,111 5,678 2,155 12,944 1.2 2.4 0.2 1.6 2017 5,160 5,915 2,110 13,185 0.9 4.2 −2.1 1.9
Intermediate estimates: 2018 5,230 6,226 2,120 13,576 1.4 5.3 0.5 3.0 2019 5,388 6,553 2,183 14,123 3.0 5.2 3.0 4.0 2020 5,564 6,862 2,313 14,739 3.3 4.7 6.0 4.4 2021 5,792 7,264 2,441 15,496 4.1 5.9 5.5 5.1 2022 6,058 7,667 2,573 16,297 4.6 5.6 5.4 5.2 2023 6,330 8,100 2,707 17,137 4.5 5.6 5.2 5.2 2024 6,604 8,596 2,851 18,050 4.3 6.1 5.3 5.3 2025 6,881 9,092 2,965 18,939 4.2 5.8 4.0 4.9 2026 7,157 9,500 3,127 19,784 4.0 4.5 5.4 4.5 2027 7,443 10,004 3,296 20,742 4.0 5.3 5.4 4.8
1Percent changes for 1970 represent the average annual increases from 1967 (the first full year of trust fund operations) through 1970. Similarly, percent changes shown for 1975, 1980, 1985, 1990, 1995, 2000, 2005, and 2010 represent the average annual increase over the 5-year period ending in the indicated year.
Per Beneficiary Cost
195
On average, annual increases in per beneficiary costs have been
greater for SMI Part B than for HI during the previous four decades—
by approximately 1.0 percent, 4.5 percent, 1.0 percent, and 2.6 percent
per year in the 1970s, 1980s, 1990s, and 2000s, respectively. The HI
increase remains lower than the SMI Part B increase over the next
10 years due to lower utilization of HI services.
Note that the rapid growth rates in the 1970s and 1980s are not
expected to recur for either HI or SMI Part B due to more moderate
inflation rates and the conversion of Medicare’s remaining cost-based
reimbursement mechanisms to prospective payment systems as part of
the Balanced Budget Act of 1997. In addition, the reduction in
Medicare price updates for most categories of providers that affected
the growth rates over the last several years will continue to reduce
growth rates throughout the projection period.
Appendices
196
E. MEDICARE COST-SHARING AND PREMIUM AMOUNTS
HI beneficiaries who use covered services may be subject to deductible
and coinsurance requirements. A beneficiary is responsible for an
inpatient hospital deductible amount, which is deducted from the
amount payable by the HI trust fund to the hospital, for inpatient
hospital services furnished in a spell of illness. When a beneficiary
receives such services for more than 60 days during a spell of illness,
he or she is responsible for a coinsurance amount equal to one-fourth
of the inpatient hospital deductible for each of days 61-90 in the
hospital. After 90 days in a spell of illness, each individual has
60 lifetime reserve days of coverage, for which the coinsurance amount
is equal to one-half of the inpatient hospital deductible. A beneficiary
is responsible for a coinsurance amount equal to one-eighth of the
inpatient hospital deductible for each of days 21-100 of skilled nursing
facility services furnished during a spell of illness. No cost sharing is
required for home health or hospice services.
Most persons aged 65 and older and many disabled individuals under
age 65 are insured for HI benefits without payment of any premium.
The Social Security Act provides that certain aged and disabled
persons who are not insured may voluntarily enroll, subject to the
payment of a monthly premium. In addition, since 1994, voluntary
enrollees may qualify for a reduced premium if they have at least
30 quarters of covered employment.
Table V.E1 shows the historical levels of the HI deductible,
coinsurance amounts, and premiums, as well as projected values for
future years based on the intermediate set of assumptions used in
estimating the operations of the trust funds. The values listed in the
table for future years are estimates, and the actual amounts are likely
to be somewhat different as experience emerges.
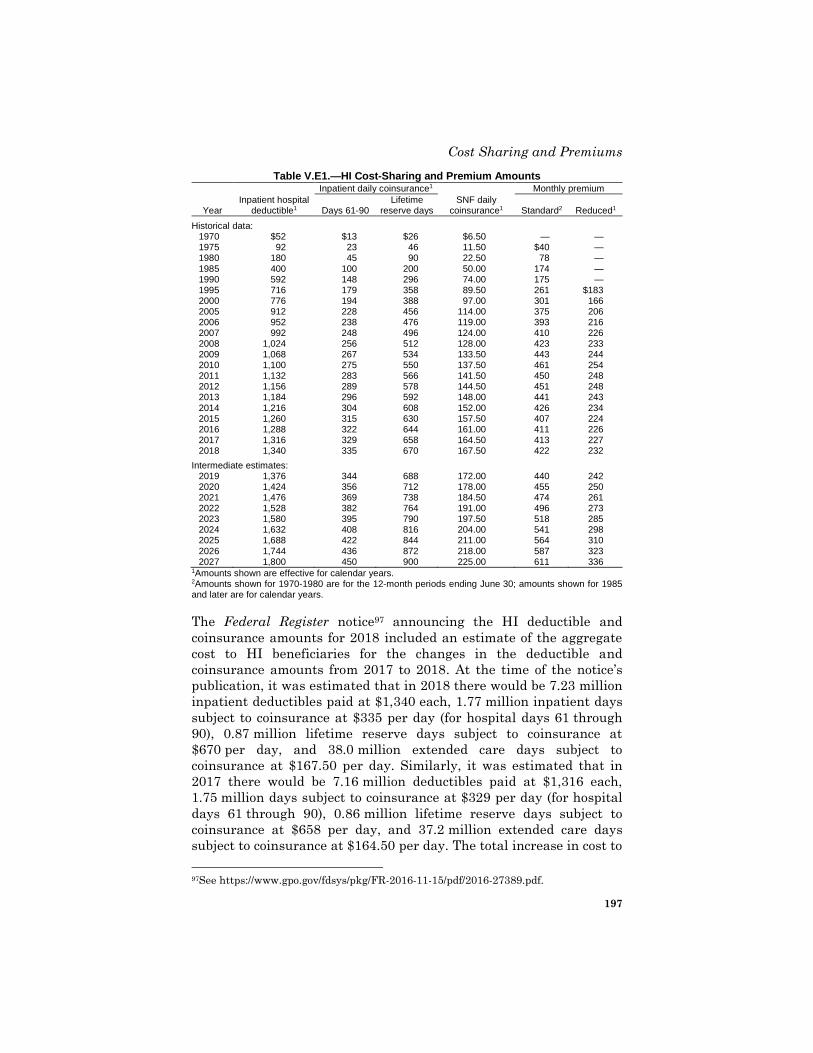
Cost Sharing and Premiums
197
Table V.E1.—HI Cost-Sharing and Premium Amounts Inpatient daily coinsurance1 Monthly premium
Year Inpatient hospital
deductible1 Days 61-90 Lifetime
reserve days SNF daily
coinsurance1 Standard2 Reduced1
Historical data: 1970 $52 $13 $26 $6.50 — — 1975 92 23 46 11.50 $40 — 1980 180 45 90 22.50 78 — 1985 400 100 200 50.00 174 — 1990 592 148 296 74.00 175 — 1995 716 179 358 89.50 261 $183 2000 776 194 388 97.00 301 166 2005 912 228 456 114.00 375 206 2006 952 238 476 119.00 393 216 2007 992 248 496 124.00 410 226 2008 1,024 256 512 128.00 423 233 2009 1,068 267 534 133.50 443 244 2010 1,100 275 550 137.50 461 254 2011 1,132 283 566 141.50 450 248 2012 1,156 289 578 144.50 451 248 2013 1,184 296 592 148.00 441 243 2014 1,216 304 608 152.00 426 234 2015 1,260 315 630 157.50 407 224 2016 1,288 322 644 161.00 411 226 2017 1,316 329 658 164.50 413 227 2018 1,340 335 670 167.50 422 232
Intermediate estimates: 2019 1,376 344 688 172.00 440 242 2020 1,424 356 712 178.00 455 250 2021 1,476 369 738 184.50 474 261 2022 1,528 382 764 191.00 496 273 2023 1,580 395 790 197.50 518 285 2024 1,632 408 816 204.00 541 298 2025 1,688 422 844 211.00 564 310 2026 1,744 436 872 218.00 587 323 2027 1,800 450 900 225.00 611 336
1Amounts shown are effective for calendar years. 2Amounts shown for 1970-1980 are for the 12-month periods ending June 30; amounts shown for 1985 and later are for calendar years.
The Federal Register notice97 announcing the HI deductible and
coinsurance amounts for 2018 included an estimate of the aggregate
cost to HI beneficiaries for the changes in the deductible and
coinsurance amounts from 2017 to 2018. At the time of the notice’s
publication, it was estimated that in 2018 there would be 7.23 million
inpatient deductibles paid at $1,340 each, 1.77 million inpatient days
subject to coinsurance at $335 per day (for hospital days 61 through
90), 0.87 million lifetime reserve days subject to coinsurance at
$670 per day, and 38.0 million extended care days subject to
coinsurance at $167.50 per day. Similarly, it was estimated that in
2017 there would be 7.16 million deductibles paid at $1,316 each,
1.75 million days subject to coinsurance at $329 per day (for hospital
days 61 through 90), 0.86 million lifetime reserve days subject to
coinsurance at $658 per day, and 37.2 million extended care days
subject to coinsurance at $164.50 per day. The total increase in cost to
97See https://www.gpo.gov/fdsys/pkg/FR-2016-11-15/pdf/2016-27389.pdf.
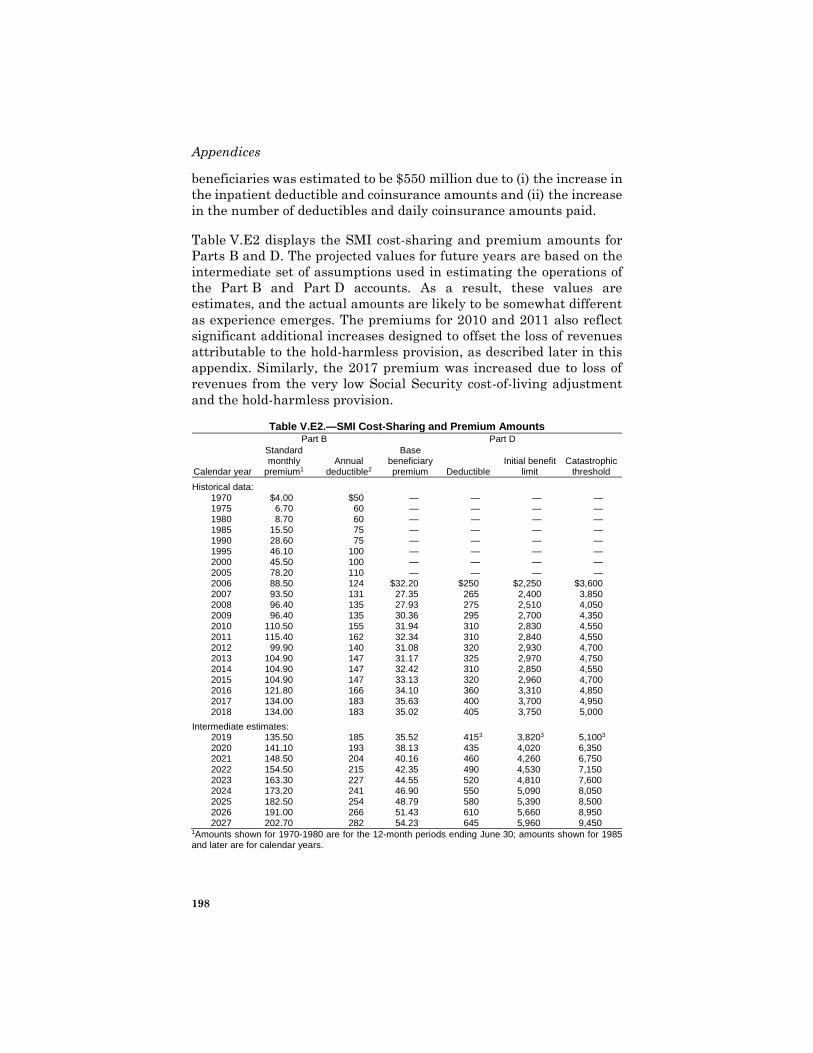
Appendices
198
beneficiaries was estimated to be $550 million due to (i) the increase in
the inpatient deductible and coinsurance amounts and (ii) the increase
in the number of deductibles and daily coinsurance amounts paid.
Table V.E2 displays the SMI cost-sharing and premium amounts for
Parts B and D. The projected values for future years are based on the
intermediate set of assumptions used in estimating the operations of
the Part B and Part D accounts. As a result, these values are
estimates, and the actual amounts are likely to be somewhat different
as experience emerges. The premiums for 2010 and 2011 also reflect
significant additional increases designed to offset the loss of revenues
attributable to the hold-harmless provision, as described later in this
appendix. Similarly, the 2017 premium was increased due to loss of
revenues from the very low Social Security cost-of-living adjustment
and the hold-harmless provision.
Table V.E2.—SMI Cost-Sharing and Premium Amounts
Part B Part D
Calendar year
Standard monthly
premium1 Annual
deductible2
Base beneficiary premium Deductible
Initial benefit limit
Catastrophic threshold
Historical data: 1970 $4.00 $50 — — — — 1975 6.70 60 — — — — 1980 8.70 60 — — — — 1985 15.50 75 — — — — 1990 28.60 75 — — — — 1995 46.10 100 — — — — 2000 45.50 100 — — — — 2005 78.20 110 — — — — 2006 88.50 124 $32.20 $250 $2,250 $3,600 2007 93.50 131 27.35 265 2,400 3,850 2008 96.40 135 27.93 275 2,510 4,050 2009 96.40 135 30.36 295 2,700 4,350 2010 110.50 155 31.94 310 2,830 4,550 2011 115.40 162 32.34 310 2,840 4,550 2012 99.90 140 31.08 320 2,930 4,700 2013 104.90 147 31.17 325 2,970 4,750 2014 104.90 147 32.42 310 2,850 4,550 2015 104.90 147 33.13 320 2,960 4,700 2016 121.80 166 34.10 360 3,310 4,850 2017 134.00 183 35.63 400 3,700 4,950 2018 134.00 183 35.02 405 3,750 5,000
Intermediate estimates: 2019 135.50 185 35.52 415 3 3,820 3 5,100 3 2020 141.10 193 38.13 435 4,020 6,350 2021 148.50 204 40.16 460 4,260 6,750 2022 154.50 215 42.35 490 4,530 7,150 2023 163.30 227 44.55 520 4,810 7,600 2024 173.20 241 46.90 550 5,090 8,050 2025 182.50 254 48.79 580 5,390 8,500 2026 191.00 266 51.43 610 5,660 8,950 2027 202.70 282 54.23 645 5,960 9,450
1Amounts shown for 1970-1980 are for the 12-month periods ending June 30; amounts shown for 1985 and later are for calendar years.
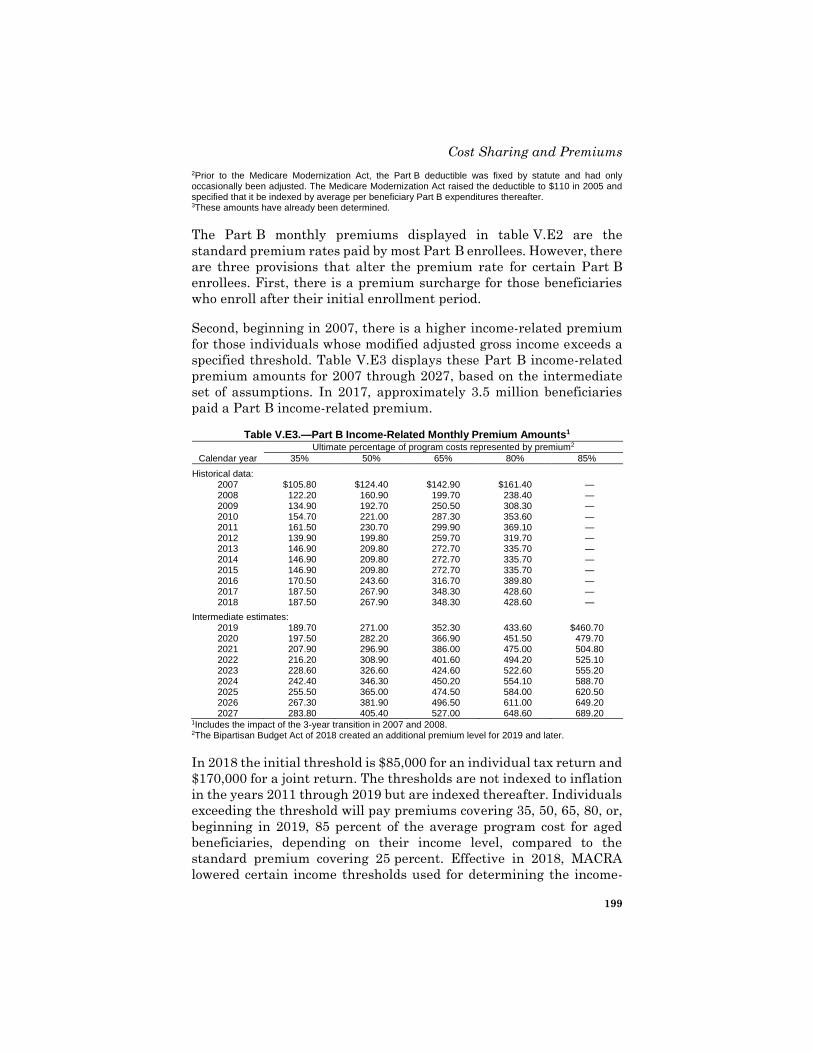
Cost Sharing and Premiums
199
2Prior to the Medicare Modernization Act, the Part B deductible was fixed by statute and had only occasionally been adjusted. The Medicare Modernization Act raised the deductible to $110 in 2005 and specified that it be indexed by average per beneficiary Part B expenditures thereafter. 3These amounts have already been determined.
The Part B monthly premiums displayed in table V.E2 are the
standard premium rates paid by most Part B enrollees. However, there
are three provisions that alter the premium rate for certain Part B
enrollees. First, there is a premium surcharge for those beneficiaries
who enroll after their initial enrollment period.
Second, beginning in 2007, there is a higher income-related premium
for those individuals whose modified adjusted gross income exceeds a
specified threshold. Table V.E3 displays these Part B income-related
premium amounts for 2007 through 2027, based on the intermediate
set of assumptions. In 2017, approximately 3.5 million beneficiaries
paid a Part B income-related premium.
Table V.E3.—Part B Income-Related Monthly Premium Amounts1
Calendar year
Ultimate percentage of program costs represented by premium2
35% 50% 65% 80% 85%
Historical data: 2007 $105.80 $124.40 $142.90 $161.40 — 2008 122.20 160.90 199.70 238.40 — 2009 134.90 192.70 250.50 308.30 — 2010 154.70 221.00 287.30 353.60 — 2011 161.50 230.70 299.90 369.10 — 2012 139.90 199.80 259.70 319.70 — 2013 146.90 209.80 272.70 335.70 — 2014 146.90 209.80 272.70 335.70 — 2015 146.90 209.80 272.70 335.70 — 2016 170.50 243.60 316.70 389.80 — 2017 187.50 267.90 348.30 428.60 — 2018 187.50 267.90 348.30 428.60 —
Intermediate estimates: 2019 189.70 271.00 352.30 433.60 $460.70 2020 197.50 282.20 366.90 451.50 479.70 2021 207.90 296.90 386.00 475.00 504.80 2022 216.20 308.90 401.60 494.20 525.10 2023 228.60 326.60 424.60 522.60 555.20 2024 242.40 346.30 450.20 554.10 588.70 2025 255.50 365.00 474.50 584.00 620.50 2026 267.30 381.90 496.50 611.00 649.20 2027 283.80 405.40 527.00 648.60 689.20
1Includes the impact of the 3-year transition in 2007 and 2008. 2The Bipartisan Budget Act of 2018 created an additional premium level for 2019 and later.
In 2018 the initial threshold is $85,000 for an individual tax return and
$170,000 for a joint return. The thresholds are not indexed to inflation
in the years 2011 through 2019 but are indexed thereafter. Individuals
exceeding the threshold will pay premiums covering 35, 50, 65, 80, or,
beginning in 2019, 85 percent of the average program cost for aged
beneficiaries, depending on their income level, compared to the
standard premium covering 25 percent. Effective in 2018, MACRA
lowered certain income thresholds used for determining the income-
Appendices
200
related monthly adjustment amounts to be paid by beneficiaries,
resulting in a greater number of beneficiaries paying the higher
amounts. In addition, beginning in 2020, the legislation adjusted the
methodology used to index the thresholds, and accordingly more
beneficiaries will be subject to the income-related premiums. The
Bipartisan Budget Act of 2018 (BBA 2018) established an additional
premium level beginning in 2019 for individuals with incomes at or
above $500,000 (and couples with incomes at or above $750,000), and
they will pay a premium covering 85 percent of the average program
cost. These new thresholds will not be indexed until 2028 and later.
Third, Part B premiums may also vary from the standard rate because
a hold-harmless provision can lower the premium rate for individuals
who have their premiums deducted from their Social Security benefits.
On an individual basis, this provision limits the dollar increase in the
Part B premium to the dollar increase in the individual’s Social
Security benefit. As a result, the person affected pays a lower Part B
premium, and the net amount of the individual’s Social Security
benefit does not decrease despite the greater increase in the premium.
Most services under Part B are subject to an annual deductible and
coinsurance. The annual deductible was set by statute through 2005.
Thereafter, it increases with the increase in the Part B aged actuarial
rate to approximate the growth in per capita Part B expenditures.98
After meeting the deductible, the beneficiary pays an amount equal to
the product of the coinsurance percentage and the remaining allowed
charges. The coinsurance percentage is 20 percent for most services.
For those services not subject to the deductible or coinsurance (clinical
laboratory tests, home health agency services, and most preventive
care services), the beneficiary pays nothing.
The Part D average premiums displayed in table V.E2 are the
estimated base beneficiary premiums. Starting in 2009, the national
average plan bid is based on the enrollment-weighted average. The
actual premium that a beneficiary pays varies according to the plan in
which the beneficiary enrolls. The average paid premium has always
been lower than the base beneficiary premium; the average paid
premium was about $34.61 in 2017 and decreased somewhat to $33.65
in 2018 primarily due to a significant increase in projected drug
98The current mechanism to index the Part B deductible has technical computational
issues mainly due to the timing of the calculation. The Part B deductible for any given
year is indexed by the increase in the monthly aged actuarial rate for that same year,
which represents estimated monthly per capita expenditures. However, these
expenditures are dependent on the Part B deductible, which is not known until the
actuarial rate is determined. The result is circularity in the modeling process.
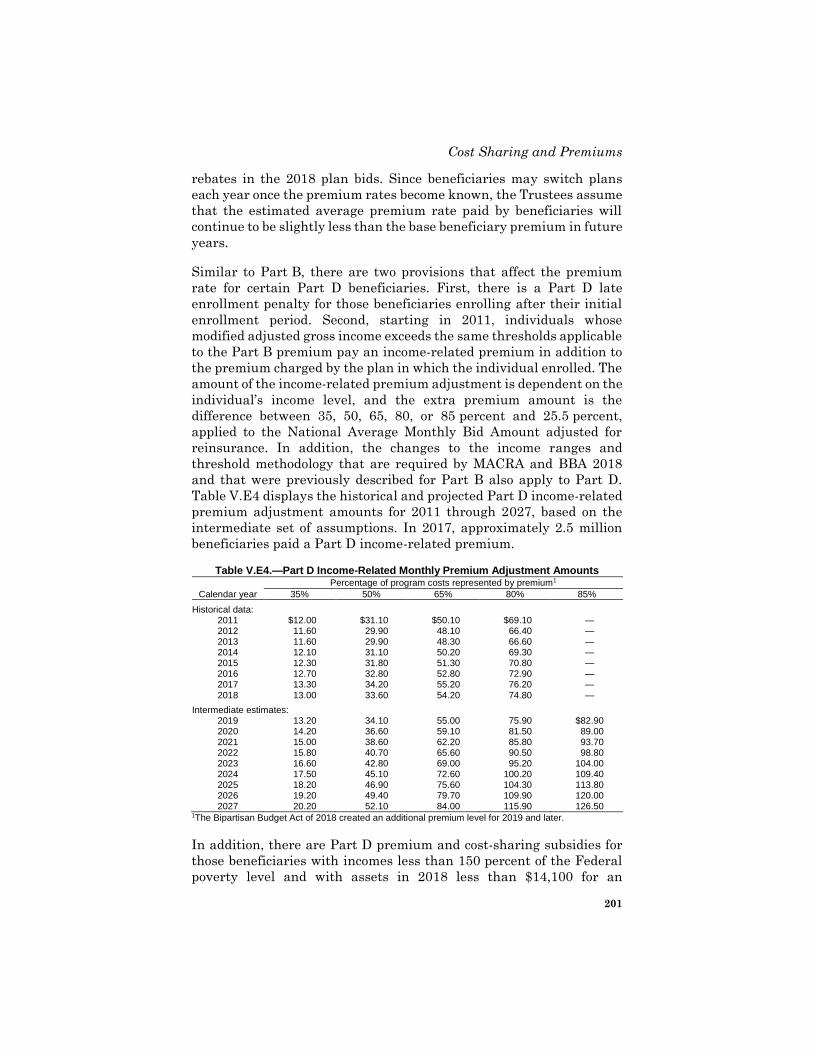
Cost Sharing and Premiums
201
rebates in the 2018 plan bids. Since beneficiaries may switch plans
each year once the premium rates become known, the Trustees assume
that the estimated average premium rate paid by beneficiaries will
continue to be slightly less than the base beneficiary premium in future
years.
Similar to Part B, there are two provisions that affect the premium
rate for certain Part D beneficiaries. First, there is a Part D late
enrollment penalty for those beneficiaries enrolling after their initial
enrollment period. Second, starting in 2011, individuals whose
modified adjusted gross income exceeds the same thresholds applicable
to the Part B premium pay an income-related premium in addition to
the premium charged by the plan in which the individual enrolled. The
amount of the income-related premium adjustment is dependent on the
individual’s income level, and the extra premium amount is the
difference between 35, 50, 65, 80, or 85 percent and 25.5 percent,
applied to the National Average Monthly Bid Amount adjusted for
reinsurance. In addition, the changes to the income ranges and
threshold methodology that are required by MACRA and BBA 2018
and that were previously described for Part B also apply to Part D.
Table V.E4 displays the historical and projected Part D income-related
premium adjustment amounts for 2011 through 2027, based on the
intermediate set of assumptions. In 2017, approximately 2.5 million
beneficiaries paid a Part D income-related premium.
Table V.E4.—Part D Income-Related Monthly Premium Adjustment Amounts
Calendar year
Percentage of program costs represented by premium1
35% 50% 65% 80% 85%
Historical data: 2011 $12.00 $31.10 $50.10 $69.10 — 2012 11.60 29.90 48.10 66.40 — 2013 11.60 29.90 48.30 66.60 — 2014 12.10 31.10 50.20 69.30 — 2015 12.30 31.80 51.30 70.80 — 2016 12.70 32.80 52.80 72.90 — 2017 13.30 34.20 55.20 76.20 — 2018 13.00 33.60 54.20 74.80 —
Intermediate estimates: 2019 13.20 34.10 55.00 75.90 $82.90 2020 14.20 36.60 59.10 81.50 89.00 2021 15.00 38.60 62.20 85.80 93.70 2022 15.80 40.70 65.60 90.50 98.80 2023 16.60 42.80 69.00 95.20 104.00 2024 17.50 45.10 72.60 100.20 109.40 2025 18.20 46.90 75.60 104.30 113.80 2026 19.20 49.40 79.70 109.90 120.00 2027 20.20 52.10 84.00 115.90 126.50
1The Bipartisan Budget Act of 2018 created an additional premium level for 2019 and later.
In addition, there are Part D premium and cost-sharing subsidies for
those beneficiaries with incomes less than 150 percent of the Federal
poverty level and with assets in 2018 less than $14,100 for an
Appendices
202
individual and $28,150 for a couple. The asset thresholds are indexed
in subsequent years by the Consumer Price Index (CPI-U). Under the
current statutory adjustment formula, the asset figures for 2018
increase for both an individual and a couple as a result of increases in
the CPI-U.
Under standard Part D coverage, there is an initial deductible. After
meeting the deductible, the beneficiary pays 25 percent of the
remaining costs up to the initial benefit limit. Beyond this limit, prior
to 2011, the beneficiary paid all the drug costs until his or her total out-
of-pocket expenditures reached the catastrophic threshold. (This total
includes the deductible and coinsurance payments for expenses up to
the initial benefit limit.) The ACA requires the coverage gap to be
gradually closed beginning in 2011 until 2020, and BBA 2018 requires
the coverage gap for brand-name drugs to close 1 year earlier, in 2019.
Starting in 2020, for all drugs, beneficiaries will pay 25 percent of the
costs between the deductible and the catastrophic threshold under the
standard coverage. In 2018, after reaching the catastrophic threshold,
the beneficiary pays the greater of (i) 5 percent of the drug cost or
(ii) $3.35 for generic or preferred multiple-source drugs or $8.35 for
preferred single-source drugs. The latter copayment amounts from
2018 are indexed annually by per enrollee Part D average costs.
Beneficiaries qualifying for the Part D low-income subsidy pay
substantially reduced premium and cost-sharing amounts. Many
Part D plans offer alternative coverage that differs from the standard
coverage described above. The majority of beneficiaries have not
enrolled in the standard benefit design but rather in plans with low or
no deductibles, flat copayments for covered drugs, and, in some cases,
partial coverage in the coverage gap.
Trust Funds and Federal Budget
203
F. MEDICARE AND SOCIAL SECURITY TRUST FUNDS AND
THE FEDERAL BUDGET
One can view the financial operations of Medicare and Social Security
in the context of the programs’ trust funds or in the context of the
overall Federal budget. The financial status of the trust funds differs
fundamentally from the impact of these programs on the budget, and
people often misunderstand the relationship between these two
perspectives. Each perspective is appropriate and important for its
intended purpose; this appendix attempts to clarify their roles and
relationship.
By law, the annual reports of the Medicare and Social Security Boards
of Trustees to Congress include a statement of the financial status of
the programs’ trust funds—that is, whether these funds have sufficient
revenues and assets to enable the payment of benefits and
administrative expenses. This trust fund perspective is important
because the existence of trust fund assets provides the statutory
authority to make such payments without the need for an
appropriation from Congress. Medicare and Social Security benefits
can be paid only if the relevant trust fund has sufficient income or
assets.
The trust fund perspective does not encompass the interrelationship
between the Medicare and Social Security trust funds and the overall
Federal budget. The budget is a comprehensive display of all Federal
activities, whether financed through trust funds or from the general
fund of the Treasury. This broader focus may appropriately be termed
the budget perspective or government-wide perspective and is officially
presented in the Budget of the United States Government and in the
Financial Report of the United States Government.
Payroll taxes, income taxes on Social Security benefits, Medicare
premiums, and special State payments to Medicare finance the
majority of Medicare and Social Security costs. In addition to these
earmarked receipts from workers, employers, beneficiaries, and States,
and interest payments on their accumulated assets, the trust funds
(principally the SMI trust fund) rely on Federal general fund revenues
for some of their financing. The financial status of a trust fund
appropriately considers all sources of financing provided for that fund,
including the availability of trust fund assets that Medicare or Social
Security can use to meet program expenditures. From a budget
perspective, however, general fund transfers represent a draw on other
Federal resources for which there is no earmarked source of revenue
from the public. For this appendix, interest payments to the trust funds
Appendices
204
and asset redemptions, both of which occur due to the postponed use of
earmarked revenues, are classified as draws on other Federal
resources, since they require payments from the Treasury general
fund. The budget perspective does not reflect that publicly held debt
and interest payments to the public are both lower because the trust
funds hold some of the debt.
In the past, general fund and interest payments for Medicare and
Social Security were relatively small. These amounts have increased
substantially over the last two decades, however, and the expected
future growth of Medicare and Social Security will make their
interaction with the Federal budget increasingly important. As the
difference between earmarked and total trust fund revenues grows, the
financial operations of Social Security and Medicare can appear
markedly different depending on which of the two perspectives one
uses.99
Illustration with Actual Data for 2017
Table V.F1 illustrates the trust fund and budget perspectives using
actual data on Federal financial operations for fiscal year (FY) 2017.
The first three columns show revenues and expenditures for HI, SMI,
and OASDI, respectively, and the fourth column is the sum of these
three columns. The fifth column shows total revenues and
expenditures for all other government programs (including the general
fund account of the Treasury), and the final column is the sum of the
“Combined” and “Other Government” columns. The table shows
earmarked revenues from the public separately from revenues from
other government accounts (general revenue transfers and interest
credits). Note that the transfers and interest credits received by the
trust funds appear in total as negative entries under the “Other
Government” column and are thus offsetting when summed for the
total budget in the final column. These two intragovernmental
transactions are key to the differences between the two perspectives.
99A more complete treatment of this topic appears in the 2017 Financial Report of the
United States Government at www.fms.treas.gov/fr/ and in a May 2009 Treasury report
titled “Social Security and Medicare Trust Funds and the Federal Budget” at
http://www.treasury.gov/resource-center/economic-policy/ss-medicare/Documents/
budget_trust_fund_perspectives_2009.pdf. Additional information is available in a
Health Care Financing Review article titled “Medicare Financial Status, Budget Impact,
and Sustainability: Which Concept Is Which?” at http://www.cms.gov/Research-
Statistics-Data-and-Systems/Research/HealthCareFinancingReview/Downloads/
05-06Winpg127.pdf and in a Social Security Bulletin article titled “Social Security Trust
Fund Cash Flows and Reserves” at https://www.ssa.gov/policy/docs/ssb/v75n1/
v75n1p1.html.
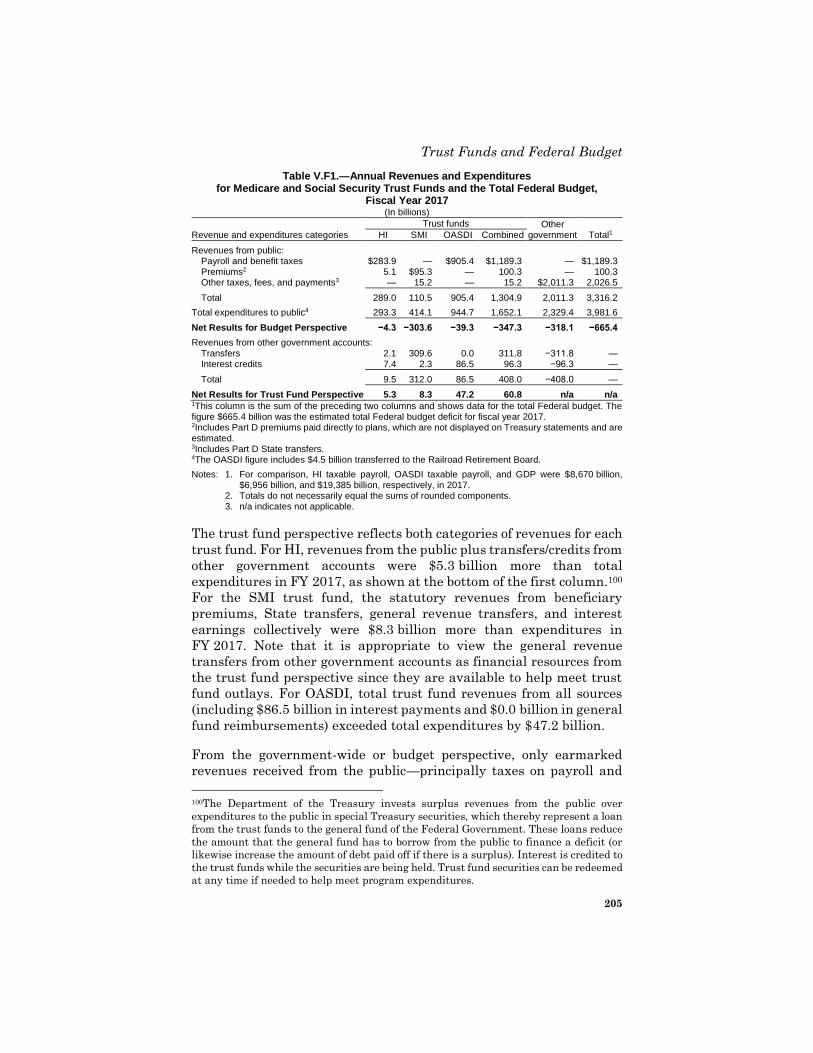
Trust Funds and Federal Budget
205
Table V.F1.—Annual Revenues and Expenditures for Medicare and Social Security Trust Funds and the Total Federal Budget,
Fiscal Year 2017 (In billions)
Trust funds Other government
Revenue and expenditures categories HI SMI OASDI Combined Total1
Revenues from public: Payroll and benefit taxes $283.9 — $905.4 $1,189.3 — $1,189.3 Premiums2 5.1 $95.3 — 100.3 — 100.3 Other taxes, fees, and payments3 — 15.2 — 15.2 $2,011.3 2,026.5
Total 289.0 110.5 905.4 1,304.9 2,011.3 3,316.2
Total expenditures to public4 293.3 414.1 944.7 1,652.1 2,329.4 3,981.6
Net Results for Budget Perspective −4.3 −303.6 −39.3 −347.3 −318.1 −665.4
Revenues from other government accounts: Transfers 2.1 309.6 0.0 311.8 −311.8 — Interest credits 7.4 2.3 86.5 96.3 −96.3 —
Total 9.5 312.0 86.5 408.0 −408.0 —
Net Results for Trust Fund Perspective 5.3 8.3 47.2 60.8 n/a n/a 1This column is the sum of the preceding two columns and shows data for the total Federal budget. The figure $665.4 billion was the estimated total Federal budget deficit for fiscal year 2017. 2Includes Part D premiums paid directly to plans, which are not displayed on Treasury statements and are estimated. 3Includes Part D State transfers. 4The OASDI figure includes $4.5 billion transferred to the Railroad Retirement Board.
Notes: 1. For comparison, HI taxable payroll, OASDI taxable payroll, and GDP were $8,670 billion, $6,956 billion, and $19,385 billion, respectively, in 2017.
2. Totals do not necessarily equal the sums of rounded components. 3. n/a indicates not applicable.
The trust fund perspective reflects both categories of revenues for each
trust fund. For HI, revenues from the public plus transfers/credits from
other government accounts were $5.3 billion more than total
expenditures in FY 2017, as shown at the bottom of the first column.100
For the SMI trust fund, the statutory revenues from beneficiary
premiums, State transfers, general revenue transfers, and interest
earnings collectively were $8.3 billion more than expenditures in
FY 2017. Note that it is appropriate to view the general revenue
transfers from other government accounts as financial resources from
the trust fund perspective since they are available to help meet trust
fund outlays. For OASDI, total trust fund revenues from all sources
(including $86.5 billion in interest payments and $0.0 billion in general
fund reimbursements) exceeded total expenditures by $47.2 billion.
From the government-wide or budget perspective, only earmarked
revenues received from the public—principally taxes on payroll and
100The Department of the Treasury invests surplus revenues from the public over
expenditures to the public in special Treasury securities, which thereby represent a loan
from the trust funds to the general fund of the Federal Government. These loans reduce
the amount that the general fund has to borrow from the public to finance a deficit (or
likewise increase the amount of debt paid off if there is a surplus). Interest is credited to
the trust funds while the securities are being held. Trust fund securities can be redeemed
at any time if needed to help meet program expenditures.
Appendices
206
benefits, plus premiums—and expenditures made to the public are
important for the final balance.101 For HI, the difference between such
revenues ($289.0 billion) and total expenditures made to the public
($293.3 billion) was $4.3 billion in FY 2017, indicating that HI had a
negative effect on the overall budget in FY 2017. For SMI, beneficiary
premiums, fees on brand-name prescription drugs to Part B, and State
payments to Part D of Medicare were the only sources of revenues from
the public in FY 2017 and represented only about 27 percent of total
expenditures. The remaining $303.6 billion in FY 2017 outlays
represented a substantial net draw on the Federal budget in that
year.102 For OASDI, the difference between revenues from the public
($905.4 billion) and total expenditures ($944.7 billion) was
$39.3 billion, indicating that OASDI also had a negative effect on the
overall budget last year if the effects of past trust fund cash flows on
interest payments from the Federal Government to the public are not
taken into account.
Thus, from the trust fund perspective, HI, SMI, and OASDI had annual
surpluses in FY 2017. From the budget perspective, HI, SMI, and
OASDI each required a net draw on the budget. HI, SMI, and OASDI
collectively had a trust fund surplus of $60.8 billion in FY 2017 but a
net draw of $347.3 billion on the budget.
It is important to recognize that each viewpoint is appropriate for its
intended purpose but that one perspective cannot be used to answer
questions related to the other. In the case of SMI, the trust fund will
always be in balance and there will always be a net draw on the Federal
budget. In the case of HI, trust fund surpluses in a given year may
occur with either a positive or negative direct impact on the budget for
that year. Conversely, a positive or negative budget impact from HI
offers minimal insight into whether its trust fund has sufficient total
revenues and assets to permit payment of benefits.
The next section illustrates the magnitude of the long-range difference
between projected expenditures and revenues for Medicare and Social
Security from both the trust fund and budget perspectives.
101For this purpose, the public includes State governments since they are outside of the
Federal Government. 102Three types of trust fund transactions constituted this net budget obligation:
$309.6 billion was drawn in the form of general revenue transfers, and another
$2.3 billion in interest payments, while $8.3 billion was transferred from the trust fund
to the general fund through the purchase of special-issue Treasury securities in an
amount equal to the trust fund surplus for the year.
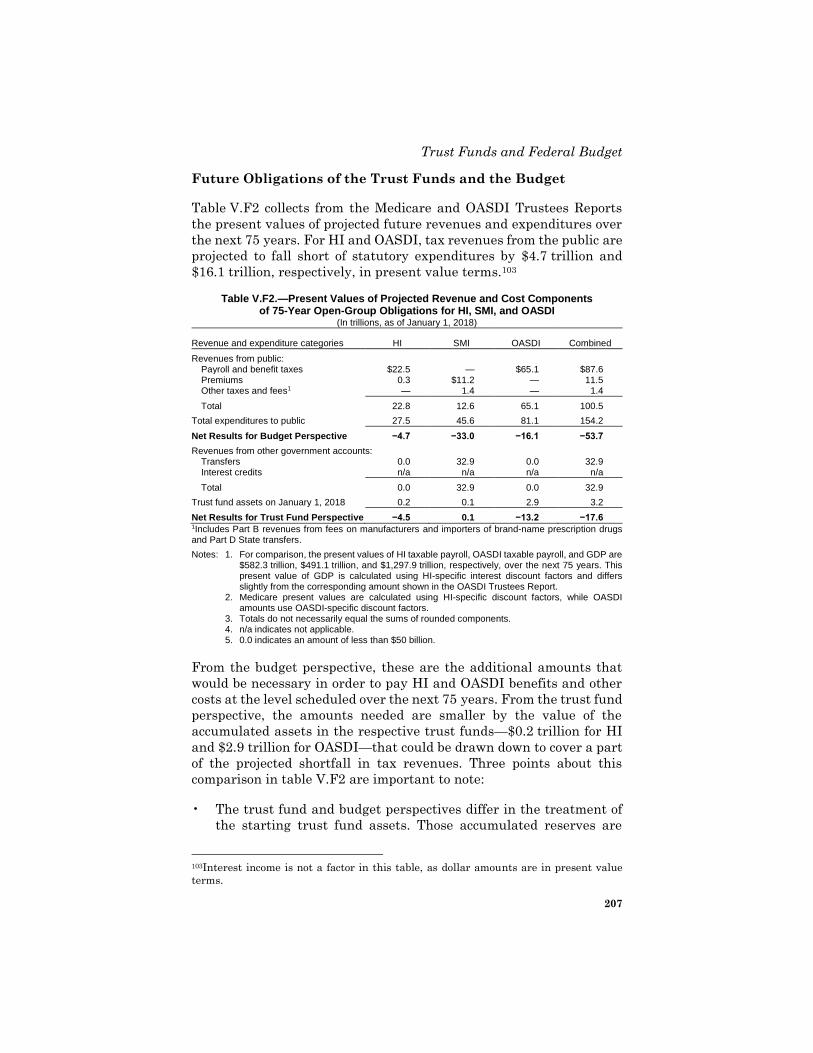
Trust Funds and Federal Budget
207
Future Obligations of the Trust Funds and the Budget
Table V.F2 collects from the Medicare and OASDI Trustees Reports
the present values of projected future revenues and expenditures over
the next 75 years. For HI and OASDI, tax revenues from the public are
projected to fall short of statutory expenditures by $4.7 trillion and
$16.1 trillion, respectively, in present value terms.103
Table V.F2.—Present Values of Projected Revenue and Cost Components of 75-Year Open-Group Obligations for HI, SMI, and OASDI
(In trillions, as of January 1, 2018)
Revenue and expenditure categories HI SMI OASDI Combined
Revenues from public: Payroll and benefit taxes $22.5 — $65.1 $87.6 Premiums 0.3 $11.2 — 11.5 Other taxes and fees1 — 1.4 — 1.4
Total 22.8 12.6 65.1 100.5
Total expenditures to public 27.5 45.6 81.1 154.2
Net Results for Budget Perspective −4.7 −33.0 −16.1 −53.7
Revenues from other government accounts: Transfers 0.0 32.9 0.0 32.9 Interest credits n/a n/a n/a n/a
Total 0.0 32.9 0.0 32.9
Trust fund assets on January 1, 2018 0.2 0.1 2.9 3.2
Net Results for Trust Fund Perspective −4.5 0.1 −13.2 −17.6 1Includes Part B revenues from fees on manufacturers and importers of brand-name prescription drugs and Part D State transfers.
Notes: 1. For comparison, the present values of HI taxable payroll, OASDI taxable payroll, and GDP are $582.3 trillion, $491.1 trillion, and $1,297.9 trillion, respectively, over the next 75 years. This present value of GDP is calculated using HI-specific interest discount factors and differs slightly from the corresponding amount shown in the OASDI Trustees Report.
2. Medicare present values are calculated using HI-specific discount factors, while OASDI amounts use OASDI-specific discount factors.
3. Totals do not necessarily equal the sums of rounded components. 4. n/a indicates not applicable. 5. 0.0 indicates an amount of less than $50 billion.
From the budget perspective, these are the additional amounts that
would be necessary in order to pay HI and OASDI benefits and other
costs at the level scheduled over the next 75 years. From the trust fund
perspective, the amounts needed are smaller by the value of the
accumulated assets in the respective trust funds—$0.2 trillion for HI
and $2.9 trillion for OASDI—that could be drawn down to cover a part
of the projected shortfall in tax revenues. Three points about this
comparison in table V.F2 are important to note:
• The trust fund and budget perspectives differ in the treatment of
the starting trust fund assets. Those accumulated reserves are
103Interest income is not a factor in this table, as dollar amounts are in present value
terms.
Appendices
208
credited to the trust fund programs under the trust fund
perspective but are not under the budget perspective.
• The amounts shown in table V.F2 assume payment of full
scheduled benefits, which is not permissible under current law
after trust fund depletion. For both the budget and trust fund
perspectives, the 75-year HI and OASDI deficits reflect the
financial imbalance after trust fund depletion. By law, however,
once assets are depleted, expenditures cannot be made except to
the extent covered by ongoing tax receipts and other trust fund
income.
• In practice, the long-range HI and OASDI deficits would likely be
addressed by future legislation to reduce expenditures, increase
payroll or other earmarked tax revenues, or some combination of
such measures. For Medicare, in particular, lawmakers have
frequently enacted legislation to slow the growth of expenditures.
The situation for SMI is somewhat different. SMI expenditures for
Part B and Part D are projected to exceed premium and other
dedicated revenues by $33.0 trillion. To keep the SMI trust fund
solvent for the next 75 years will require general fund transfers of this
amount, and these transfers represent a formal budget requirement.
From the trust fund perspective, the present value of projected total
premiums and general revenues is about equal to the present value of
future expenditures.
From the 75-year budget perspective, the present value of the
additional resources that would be necessary to meet projected
expenditures, for the three programs combined, is $53.7 trillion.104 To
put this very large figure in perspective, it would represent 4.1 percent
of the present value of projected GDP over the same period
($1,298 trillion). The components of the $53.7-trillion total are as
follows:
104As noted previously, the long-range HI and OASDI financial imbalances could instead
be partially addressed by expenditure reductions, thereby reducing the need for
additional revenues. Similarly, SMI expenditure reductions would reduce the need for
general fund transfers.
Trust Funds and Federal Budget
209
Unfunded Medicare and OASDI obligations
(trust fund perspective)105 ................................ $17.6 trillion (1.4% of GDP)
HI, SMI, and OASDI asset redemptions ........... 3.2 trillion (0.2% of GDP)
SMI general revenue financing ......................... 32.9 trillion (2.5% of GDP)
These resource needs would be in addition to the payroll taxes, benefit
taxes, and premium payments. As noted, the asset redemptions and
SMI general revenue transfers represent formal budget commitments,
but no provision exists for covering the HI and OASDI trust fund
deficits once assets are depleted.
As discussed throughout this report, the Medicare projections shown
here could be substantially understated as a result of other potentially
unsustainable elements of current law. Although this issue does not
affect the nature of the budget and trust fund perspectives described
in this appendix, it is important to note that actual long-range present
values for HI expenditures and SMI expenditures and revenues could
exceed the amounts shown in table V.F2 by a substantial margin.
105Additional revenues and/or expenditure reductions totaling $17.7 trillion, together
with $3.1 trillion in asset redemptions, would cover the projected financial imbalance
but would leave the HI and OASDI trust funds depleted at the end of the 75-year period.
The long-range actuarial deficits for HI and OASDI include a cost factor to allow for a
normal level of fund assets. See section III.B3 in this report, and section IV.B4 in the
OASDI Trustees Report, for the numerical relationship between the actuarial deficit and
the unfunded obligations of each program.
Appendices
210
G. INFINITE HORIZON PROJECTIONS
Consistent with the practice of previous reports, this report focuses on
the 75-year period from 2018 to 2092 for the evaluation of the long-
range financial status of the Medicare program. The estimates are for
the open-group population—all persons, some of whom are not yet
born, who will participate during the period as either taxpayers or
beneficiaries, or both—and consist of payments from, and on behalf of,
employees now in the workforce, as well as those who will enter the
workforce over the next 75 years.
Experts have noted that limiting the projections to 75 years
understates the magnitude of the long-range unfunded obligations
because summary measures (such as the actuarial balance and open-
group unfunded obligations) reflect the full amount of taxes paid by the
next two or three generations of workers, but not the full amount of
their benefits. One approach to addressing the limitations of 75-year
summary measures is to extend the projection horizon indefinitely, so
that the overall results reflect the projected costs and revenues after
the first 75 years.106 Such extended projections can also help indicate
whether the financial imbalance would be improving or continuing to
worsen beyond the normal 75-year period.
Table V.G1 presents estimates of HI unfunded obligations that extend
to the infinite horizon. The extension assumes that the HI program and
the demographic and economic trends used for the 75-year projection
continue indefinitely except that average HI expenditures per
beneficiary increase at the same rate as GDP per capita less the
productivity adjustments after 2092. If the slower HI price updates
under the ACA were able to continue indefinitely, then the HI financial
imbalance would actually improve beyond the 75-year period.
Specifically, under these assumptions, extending the calculations
beyond 2092 subtracts $6.7 trillion in unfunded obligations from the
amount estimated through 2092. Over the infinite horizon, the HI
program thus has a projected surplus of $2.16 trillion.
106The calculation of present values, in effect, applies successively less weight to future
amounts over time, through the process of interest discounting. For example, the weights
associated with the 25th, 75th, and 200th years of the projection would be about
33.5 percent, 2.5 percent, and 0.00399 percent, respectively, of the weight for the first
year. In this way, it is possible to calculate a finite summary measure for an infinite
projection period.
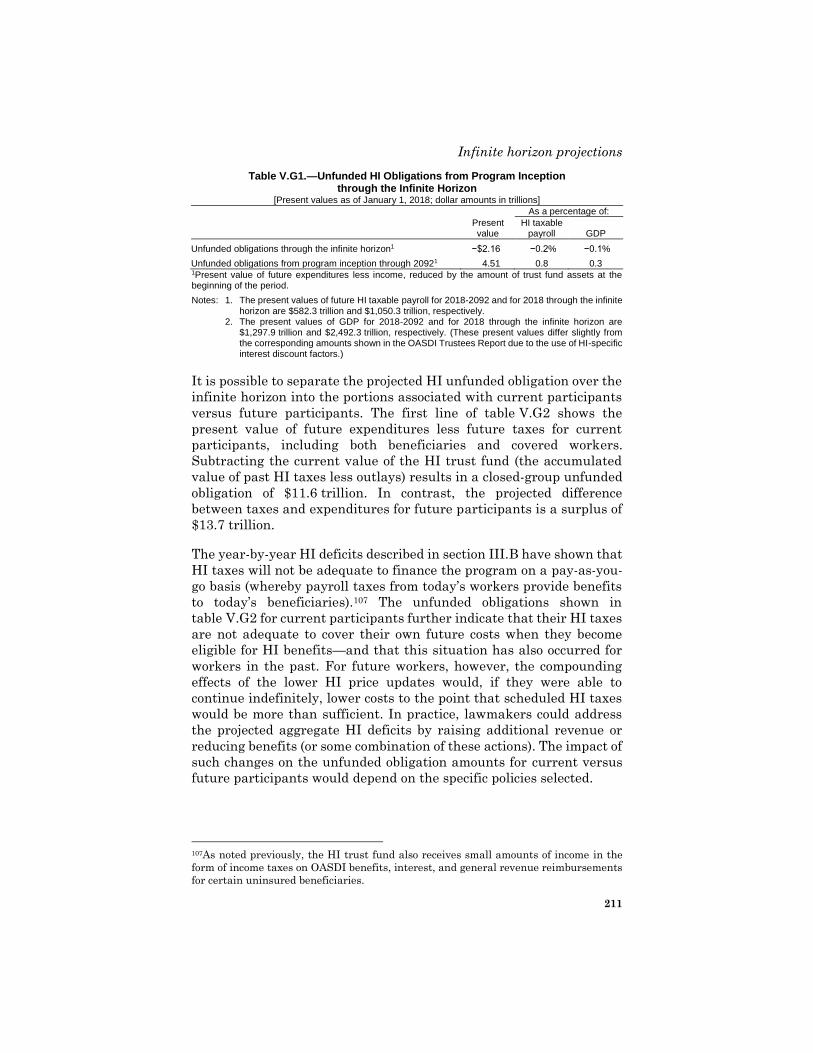
Infinite horizon projections
211
Table V.G1.—Unfunded HI Obligations from Program Inception through the Infinite Horizon
[Present values as of January 1, 2018; dollar amounts in trillions]
As a percentage of:
Present value
HI taxable payroll GDP
Unfunded obligations through the infinite horizon1 −$2.16 −0.2 % −0.1 %
Unfunded obligations from program inception through 20921 4.51 0.8 0.3 1Present value of future expenditures less income, reduced by the amount of trust fund assets at the beginning of the period.
Notes: 1. The present values of future HI taxable payroll for 2018-2092 and for 2018 through the infinite horizon are $582.3 trillion and $1,050.3 trillion, respectively.
2. The present values of GDP for 2018-2092 and for 2018 through the infinite horizon are $1,297.9 trillion and $2,492.3 trillion, respectively. (These present values differ slightly from the corresponding amounts shown in the OASDI Trustees Report due to the use of HI-specific interest discount factors.)
It is possible to separate the projected HI unfunded obligation over the
infinite horizon into the portions associated with current participants
versus future participants. The first line of table V.G2 shows the
present value of future expenditures less future taxes for current
participants, including both beneficiaries and covered workers.
Subtracting the current value of the HI trust fund (the accumulated
value of past HI taxes less outlays) results in a closed-group unfunded
obligation of $11.6 trillion. In contrast, the projected difference
between taxes and expenditures for future participants is a surplus of
$13.7 trillion.
The year-by-year HI deficits described in section III.B have shown that
HI taxes will not be adequate to finance the program on a pay-as-you-
go basis (whereby payroll taxes from today’s workers provide benefits
to today’s beneficiaries).107 The unfunded obligations shown in
table V.G2 for current participants further indicate that their HI taxes
are not adequate to cover their own future costs when they become
eligible for HI benefits—and that this situation has also occurred for
workers in the past. For future workers, however, the compounding
effects of the lower HI price updates would, if they were able to
continue indefinitely, lower costs to the point that scheduled HI taxes
would be more than sufficient. In practice, lawmakers could address
the projected aggregate HI deficits by raising additional revenue or
reducing benefits (or some combination of these actions). The impact of
such changes on the unfunded obligation amounts for current versus
future participants would depend on the specific policies selected.
107As noted previously, the HI trust fund also receives small amounts of income in the
form of income taxes on OASDI benefits, interest, and general revenue reimbursements
for certain uninsured beneficiaries.
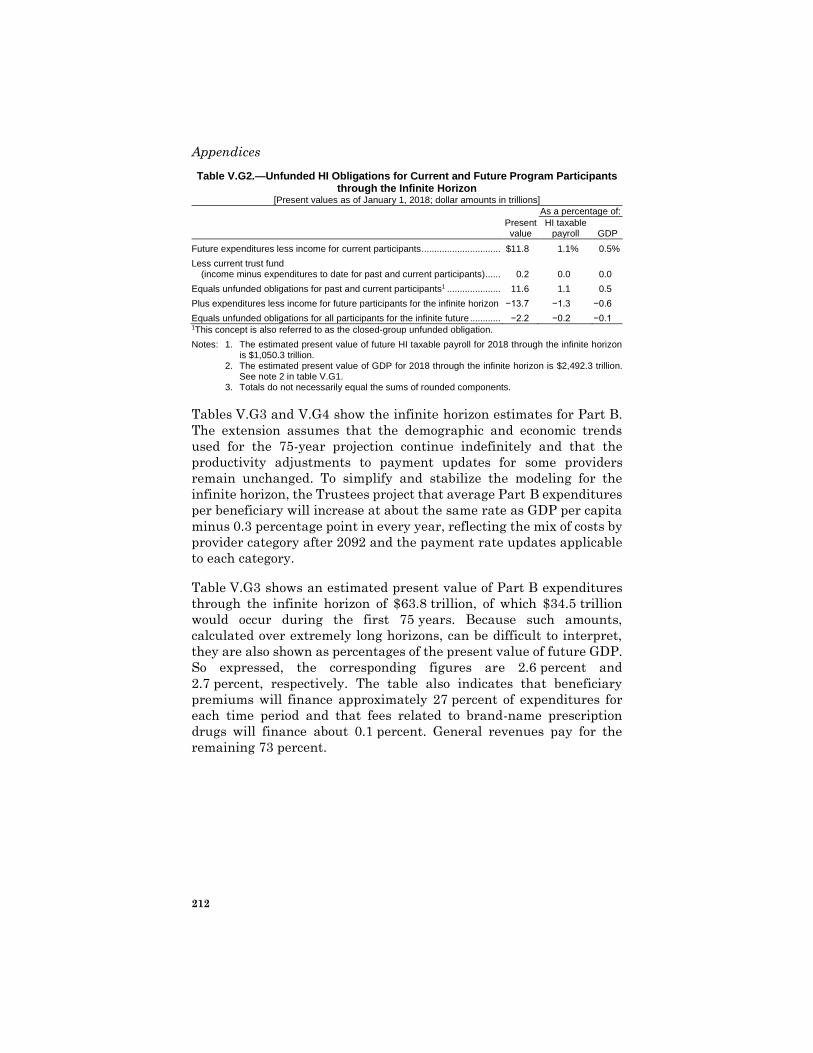
Appendices
212
Table V.G2.—Unfunded HI Obligations for Current and Future Program Participants through the Infinite Horizon
[Present values as of January 1, 2018; dollar amounts in trillions]
As a percentage of:
Present value
HI taxable payroll GDP
Future expenditures less income for current participants ............................... $11.8 1.1 % 0.5 %
Less current trust fund (income minus expenditures to date for past and current participants)...... 0.2 0.0 0.0
Equals unfunded obligations for past and current participants1 ..................... 11.6 1.1 0.5
Plus expenditures less income for future participants for the infinite horizon −13.7 −1.3 −0.6
Equals unfunded obligations for all participants for the infinite future ............ −2.2 −0.2 −0.1 1This concept is also referred to as the closed-group unfunded obligation.
Notes: 1. The estimated present value of future HI taxable payroll for 2018 through the infinite horizon is $1,050.3 trillion.
2. The estimated present value of GDP for 2018 through the infinite horizon is $2,492.3 trillion. See note 2 in table V.G1.
3. Totals do not necessarily equal the sums of rounded components.
Tables V.G3 and V.G4 show the infinite horizon estimates for Part B.
The extension assumes that the demographic and economic trends
used for the 75-year projection continue indefinitely and that the
productivity adjustments to payment updates for some providers
remain unchanged. To simplify and stabilize the modeling for the
infinite horizon, the Trustees project that average Part B expenditures
per beneficiary will increase at about the same rate as GDP per capita
minus 0.3 percentage point in every year, reflecting the mix of costs by
provider category after 2092 and the payment rate updates applicable
to each category.
Table V.G3 shows an estimated present value of Part B expenditures
through the infinite horizon of $63.8 trillion, of which $34.5 trillion
would occur during the first 75 years. Because such amounts,
calculated over extremely long horizons, can be difficult to interpret,
they are also shown as percentages of the present value of future GDP.
So expressed, the corresponding figures are 2.6 percent and
2.7 percent, respectively. The table also indicates that beneficiary
premiums will finance approximately 27 percent of expenditures for
each time period and that fees related to brand-name prescription
drugs will finance about 0.1 percent. General revenues pay for the
remaining 73 percent.
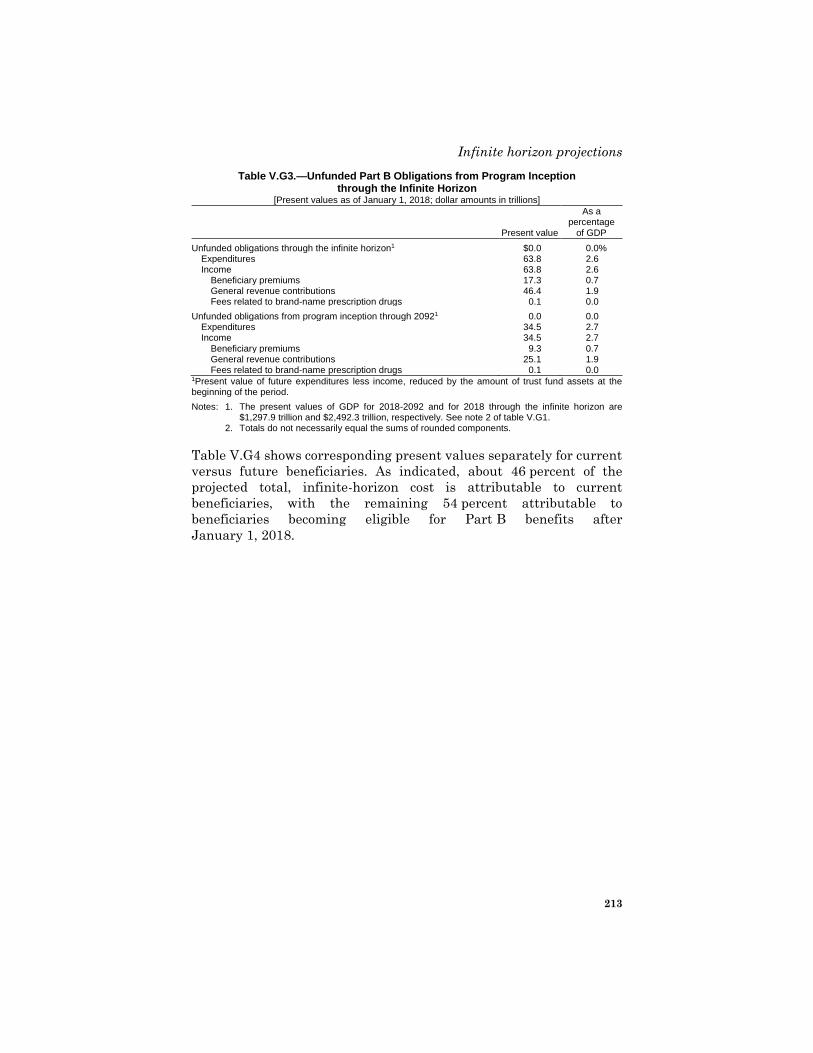
Infinite horizon projections
213
Table V.G3.—Unfunded Part B Obligations from Program Inception through the Infinite Horizon
[Present values as of January 1, 2018; dollar amounts in trillions]
Present value
As a percentage
of GDP
Unfunded obligations through the infinite horizon1 $0.0 0.0 % Expenditures 63.8 2.6 Income 63.8 2.6
Beneficiary premiums 17.3 0.7 General revenue contributions 46.4 1.9 Fees related to brand-name prescription drugs 0.1 0.0
Unfunded obligations from program inception through 20921 0.0 0.0 Expenditures 34.5 2.7 Income 34.5 2.7
Beneficiary premiums 9.3 0.7 General revenue contributions 25.1 1.9 Fees related to brand-name prescription drugs 0.1 0.0
1Present value of future expenditures less income, reduced by the amount of trust fund assets at the beginning of the period.
Notes: 1. The present values of GDP for 2018-2092 and for 2018 through the infinite horizon are $1,297.9 trillion and $2,492.3 trillion, respectively. See note 2 of table V.G1.
2. Totals do not necessarily equal the sums of rounded components.
Table V.G4 shows corresponding present values separately for current
versus future beneficiaries. As indicated, about 46 percent of the
projected total, infinite-horizon cost is attributable to current
beneficiaries, with the remaining 54 percent attributable to
beneficiaries becoming eligible for Part B benefits after
January 1, 2018.
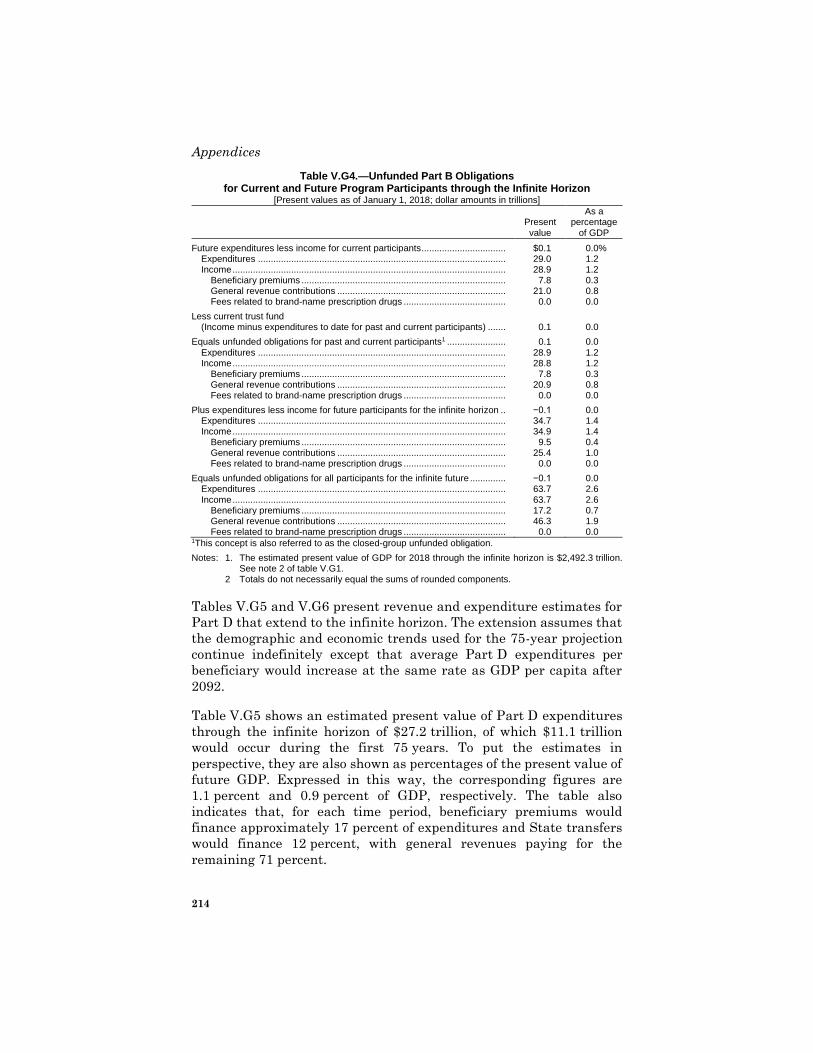
Appendices
214
Table V.G4.—Unfunded Part B Obligations for Current and Future Program Participants through the Infinite Horizon
[Present values as of January 1, 2018; dollar amounts in trillions]
Present value
As a percentage
of GDP
Future expenditures less income for current participants ................................. $0.1 0.0 % Expenditures ................................................................................................. 29.0 1.2 Income ........................................................................................................... 28.9 1.2
Beneficiary premiums ................................................................................ 7.8 0.3 General revenue contributions .................................................................. 21.0 0.8 Fees related to brand-name prescription drugs ........................................ 0.0 0.0
Less current trust fund (Income minus expenditures to date for past and current participants) ....... 0.1 0.0
Equals unfunded obligations for past and current participants1 ....................... 0.1 0.0
Expenditures ................................................................................................. 28.9 1.2 Income ........................................................................................................... 28.8 1.2
Beneficiary premiums ................................................................................ 7.8 0.3 General revenue contributions .................................................................. 20.9 0.8 Fees related to brand-name prescription drugs ........................................ 0.0 0.0
Plus expenditures less income for future participants for the infinite horizon .. −0.1 0.0 Expenditures ................................................................................................. 34.7 1.4 Income ........................................................................................................... 34.9 1.4
Beneficiary premiums ................................................................................ 9.5 0.4 General revenue contributions .................................................................. 25.4 1.0 Fees related to brand-name prescription drugs ........................................ 0.0 0.0
Equals unfunded obligations for all participants for the infinite future .............. −0.1 0.0 Expenditures ................................................................................................. 63.7 2.6 Income ........................................................................................................... 63.7 2.6
Beneficiary premiums ................................................................................ 17.2 0.7 General revenue contributions .................................................................. 46.3 1.9 Fees related to brand-name prescription drugs ........................................ 0.0 0.0
1This concept is also referred to as the closed-group unfunded obligation.
Notes: 1. The estimated present value of GDP for 2018 through the infinite horizon is $2,492.3 trillion. See note 2 of table V.G1.
2 Totals do not necessarily equal the sums of rounded components.
Tables V.G5 and V.G6 present revenue and expenditure estimates for
Part D that extend to the infinite horizon. The extension assumes that
the demographic and economic trends used for the 75-year projection
continue indefinitely except that average Part D expenditures per
beneficiary would increase at the same rate as GDP per capita after
2092.
Table V.G5 shows an estimated present value of Part D expenditures
through the infinite horizon of $27.2 trillion, of which $11.1 trillion
would occur during the first 75 years. To put the estimates in
perspective, they are also shown as percentages of the present value of
future GDP. Expressed in this way, the corresponding figures are
1.1 percent and 0.9 percent of GDP, respectively. The table also
indicates that, for each time period, beneficiary premiums would
finance approximately 17 percent of expenditures and State transfers
would finance 12 percent, with general revenues paying for the
remaining 71 percent.
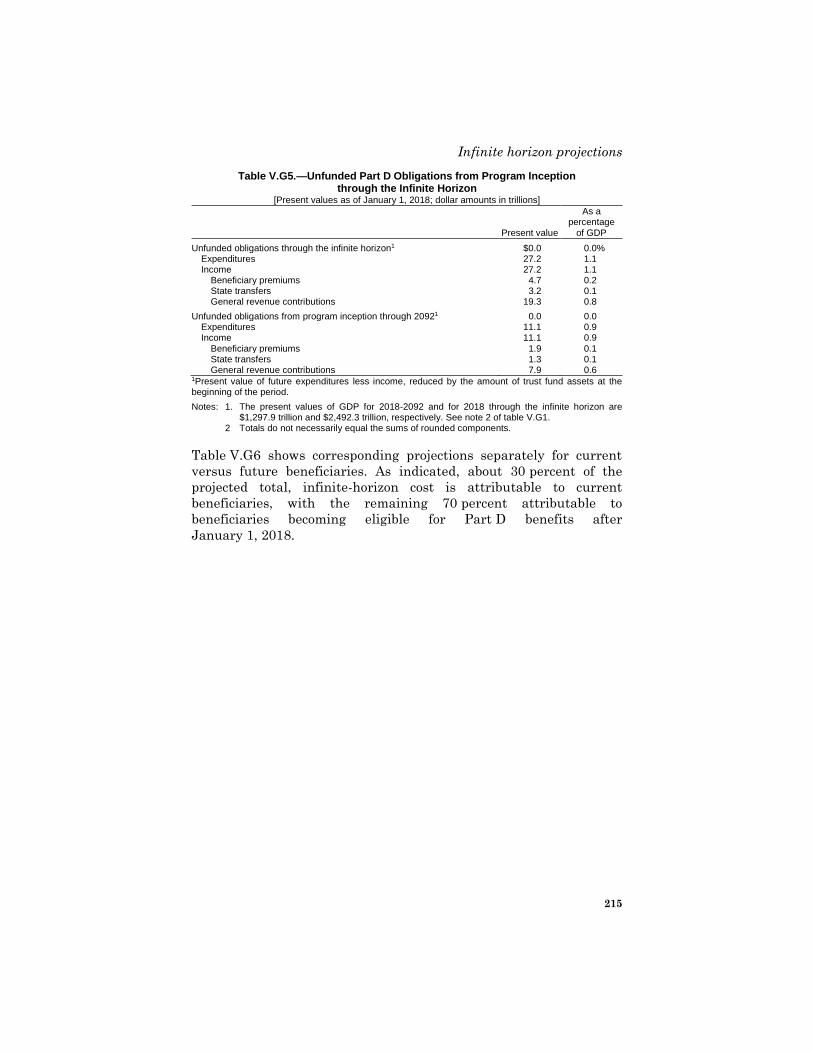
Infinite horizon projections
215
Table V.G5.—Unfunded Part D Obligations from Program Inception through the Infinite Horizon
[Present values as of January 1, 2018; dollar amounts in trillions]
Present value
As a percentage
of GDP
Unfunded obligations through the infinite horizon1 $0.0 0.0 % Expenditures 27.2 1.1 Income 27.2 1.1
Beneficiary premiums 4.7 0.2 State transfers 3.2 0.1 General revenue contributions 19.3 0.8
Unfunded obligations from program inception through 20921 0.0 0.0 Expenditures 11.1 0.9 Income 11.1 0.9
Beneficiary premiums 1.9 0.1 State transfers 1.3 0.1 General revenue contributions 7.9 0.6
1Present value of future expenditures less income, reduced by the amount of trust fund assets at the beginning of the period.
Notes: 1. The present values of GDP for 2018-2092 and for 2018 through the infinite horizon are $1,297.9 trillion and $2,492.3 trillion, respectively. See note 2 of table V.G1.
2 Totals do not necessarily equal the sums of rounded components.
Table V.G6 shows corresponding projections separately for current
versus future beneficiaries. As indicated, about 30 percent of the
projected total, infinite-horizon cost is attributable to current
beneficiaries, with the remaining 70 percent attributable to
beneficiaries becoming eligible for Part D benefits after
January 1, 2018.
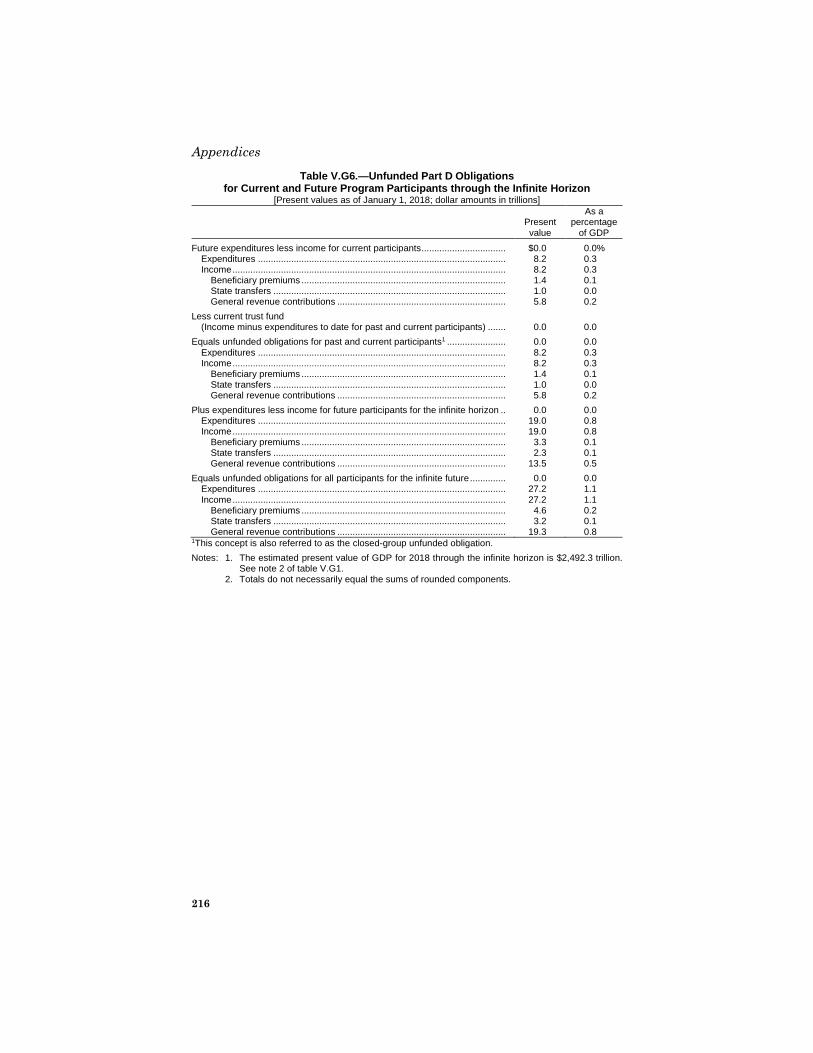
Appendices
216
Table V.G6.—Unfunded Part D Obligations for Current and Future Program Participants through the Infinite Horizon
[Present values as of January 1, 2018; dollar amounts in trillions]
Present value
As a percentage
of GDP
Future expenditures less income for current participants ................................. $0.0 0.0 % Expenditures ................................................................................................. 8.2 0.3 Income ........................................................................................................... 8.2 0.3
Beneficiary premiums ................................................................................ 1.4 0.1 State transfers ........................................................................................... 1.0 0.0 General revenue contributions .................................................................. 5.8 0.2
Less current trust fund (Income minus expenditures to date for past and current participants) ....... 0.0 0.0
Equals unfunded obligations for past and current participants1 ....................... 0.0 0.0
Expenditures ................................................................................................. 8.2 0.3 Income ........................................................................................................... 8.2 0.3
Beneficiary premiums ................................................................................ 1.4 0.1 State transfers ........................................................................................... 1.0 0.0 General revenue contributions .................................................................. 5.8 0.2
Plus expenditures less income for future participants for the infinite horizon .. 0.0 0.0 Expenditures ................................................................................................. 19.0 0.8 Income ........................................................................................................... 19.0 0.8
Beneficiary premiums ................................................................................ 3.3 0.1 State transfers ........................................................................................... 2.3 0.1 General revenue contributions .................................................................. 13.5 0.5
Equals unfunded obligations for all participants for the infinite future .............. 0.0 0.0 Expenditures ................................................................................................. 27.2 1.1 Income ........................................................................................................... 27.2 1.1
Beneficiary premiums ................................................................................ 4.6 0.2 State transfers ........................................................................................... 3.2 0.1 General revenue contributions .................................................................. 19.3 0.8
1This concept is also referred to as the closed-group unfunded obligation.
Notes: 1. The estimated present value of GDP for 2018 through the infinite horizon is $2,492.3 trillion. See note 2 of table V.G1.
2. Totals do not necessarily equal the sums of rounded components.
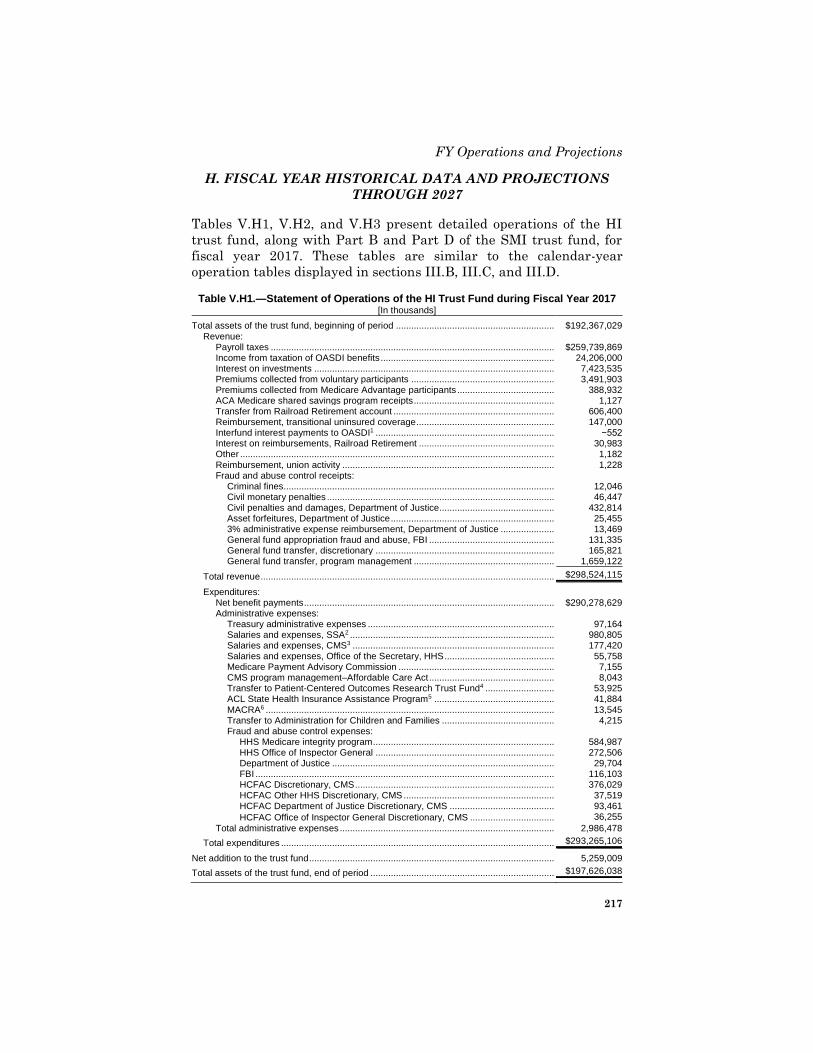
FY Operations and Projections
217
H. FISCAL YEAR HISTORICAL DATA AND PROJECTIONS
THROUGH 2027
Tables V.H1, V.H2, and V.H3 present detailed operations of the HI
trust fund, along with Part B and Part D of the SMI trust fund, for
fiscal year 2017. These tables are similar to the calendar-year
operation tables displayed in sections III.B, III.C, and III.D.
Table V.H1.—Statement of Operations of the HI Trust Fund during Fiscal Year 2017 [In thousands]
Total assets of the trust fund, beginning of period .............................................................. $192,367,029 Revenue:
Payroll taxes ............................................................................................................... $259,739,869 Income from taxation of OASDI benefits .................................................................... 24,206,000 Interest on investments .............................................................................................. 7,423,535 Premiums collected from voluntary participants ........................................................ 3,491,903 Premiums collected from Medicare Advantage participants ...................................... 388,932 ACA Medicare shared savings program receipts ....................................................... 1,127 Transfer from Railroad Retirement account ............................................................... 606,400 Reimbursement, transitional uninsured coverage ...................................................... 147,000 Interfund interest payments to OASDI1 ...................................................................... −552 Interest on reimbursements, Railroad Retirement ..................................................... 30,983 Other ........................................................................................................................... 1,182 Reimbursement, union activity ................................................................................... 1,228 Fraud and abuse control receipts:
Criminal fines.......................................................................................................... 12,046 Civil monetary penalties ......................................................................................... 46,447 Civil penalties and damages, Department of Justice............................................. 432,814 Asset forfeitures, Department of Justice ................................................................ 25,455 3% administrative expense reimbursement, Department of Justice ..................... 13,469 General fund appropriation fraud and abuse, FBI ................................................. 131,335 General fund transfer, discretionary ...................................................................... 165,821 General fund transfer, program management ....................................................... 1,659,122
Total revenue ................................................................................................................... $298,524,115
Expenditures: Net benefit payments .................................................................................................. $290,278,629 Administrative expenses:
Treasury administrative expenses ......................................................................... 97,164 Salaries and expenses, SSA2 ................................................................................ 980,805 Salaries and expenses, CMS3 ............................................................................... 177,420 Salaries and expenses, Office of the Secretary, HHS ........................................... 55,758 Medicare Payment Advisory Commission ............................................................. 7,155 CMS program management–Affordable Care Act ................................................. 8,043 Transfer to Patient-Centered Outcomes Research Trust Fund4 ........................... 53,925 ACL State Health Insurance Assistance Program5 ............................................... 41,884 MACRA6 ................................................................................................................. 13,545 Transfer to Administration for Children and Families ............................................ 4,215 Fraud and abuse control expenses:
HHS Medicare integrity program ....................................................................... 584,987 HHS Office of Inspector General ...................................................................... 272,506 Department of Justice ....................................................................................... 29,704 FBI ..................................................................................................................... 116,103 HCFAC Discretionary, CMS .............................................................................. 376,029 HCFAC Other HHS Discretionary, CMS ........................................................... 37,519 HCFAC Department of Justice Discretionary, CMS ......................................... 93,461
HCFAC Office of Inspector General Discretionary, CMS ................................. 36,255
Total administrative expenses .................................................................................... 2,986,478
Total expenditures ........................................................................................................... $293,265,106
Net addition to the trust fund ................................................................................................ 5,259,009
Total assets of the trust fund, end of period ........................................................................ $197,626,038
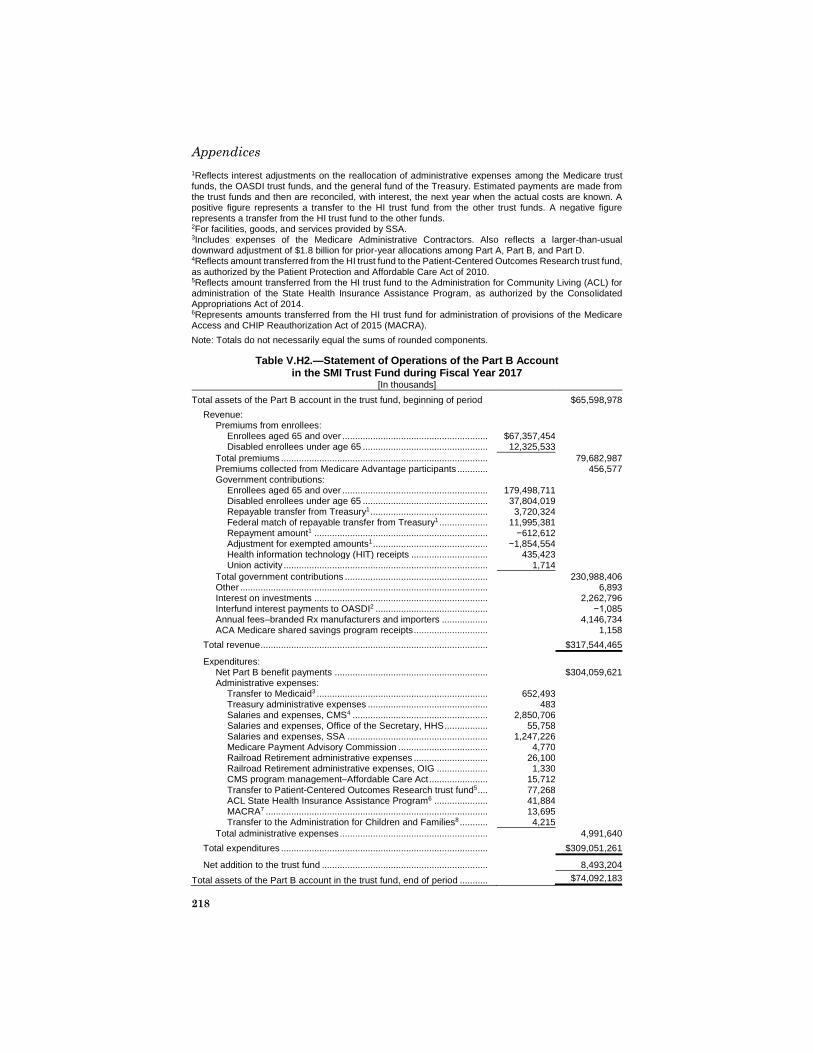
Appendices
218
1Reflects interest adjustments on the reallocation of administrative expenses among the Medicare trust funds, the OASDI trust funds, and the general fund of the Treasury. Estimated payments are made from the trust funds and then are reconciled, with interest, the next year when the actual costs are known. A positive figure represents a transfer to the HI trust fund from the other trust funds. A negative figure represents a transfer from the HI trust fund to the other funds. 2For facilities, goods, and services provided by SSA. 3Includes expenses of the Medicare Administrative Contractors. Also reflects a larger-than-usual downward adjustment of $1.8 billion for prior-year allocations among Part A, Part B, and Part D. 4Reflects amount transferred from the HI trust fund to the Patient-Centered Outcomes Research trust fund, as authorized by the Patient Protection and Affordable Care Act of 2010. 5Reflects amount transferred from the HI trust fund to the Administration for Community Living (ACL) for administration of the State Health Insurance Assistance Program, as authorized by the Consolidated Appropriations Act of 2014. 6Represents amounts transferred from the HI trust fund for administration of provisions of the Medicare Access and CHIP Reauthorization Act of 2015 (MACRA).
Note: Totals do not necessarily equal the sums of rounded components.
Table V.H2.—Statement of Operations of the Part B Account in the SMI Trust Fund during Fiscal Year 2017
[In thousands]
Total assets of the Part B account in the trust fund, beginning of period $65,598,978
Revenue: Premiums from enrollees:
Enrollees aged 65 and over ......................................................... $67,357,454 Disabled enrollees under age 65 ................................................. 12,325,533
Total premiums ................................................................................. 79,682,987 Premiums collected from Medicare Advantage participants ............ 456,577 Government contributions:
Enrollees aged 65 and over ......................................................... 179,498,711 Disabled enrollees under age 65 ................................................. 37,804,019 Repayable transfer from Treasury1 .............................................. 3,720,324 Federal match of repayable transfer from Treasury1 ................... 11,995,381 Repayment amount1 .................................................................... −612,612 Adjustment for exempted amounts1 ............................................. −1,854,554 Health information technology (HIT) receipts .............................. 435,423 Union activity ................................................................................ 1,714
Total government contributions ........................................................ 230,988,406 Other ................................................................................................. 6,893 Interest on investments .................................................................... 2,262,796 Interfund interest payments to OASDI2 ............................................ −1,085 Annual fees–branded Rx manufacturers and importers .................. 4,146,734 ACA Medicare shared savings program receipts ............................. 1,158
Total revenue ......................................................................................... $317,544,465
Expenditures: Net Part B benefit payments ............................................................ $304,059,621 Administrative expenses:
Transfer to Medicaid3 ................................................................... 652,493 Treasury administrative expenses ............................................... 483 Salaries and expenses, CMS4 ..................................................... 2,850,706 Salaries and expenses, Office of the Secretary, HHS ................. 55,758 Salaries and expenses, SSA ....................................................... 1,247,226 Medicare Payment Advisory Commission ................................... 4,770 Railroad Retirement administrative expenses ............................. 26,100 Railroad Retirement administrative expenses, OIG .................... 1,330 CMS program management–Affordable Care Act ....................... 15,712 Transfer to Patient-Centered Outcomes Research trust fund5 .... 77,268 ACL State Health Insurance Assistance Program6 ..................... 41,884 MACRA7 ....................................................................................... 13,695 Transfer to the Administration for Children and Families8 ........... 4,215
Total administrative expenses .......................................................... 4,991,640
Total expenditures ................................................................................. $309,051,261
Net addition to the trust fund ................................................................. 8,493,204
Total assets of the Part B account in the trust fund, end of period ........... $74,092,183
FY Operations and Projections
219
1The Bipartisan Budget Act of 2015 (BBA 2015) required a transfer of funds from the general fund to cover the premium income that was lost in 2016 as a result of the hold-harmless provision. BBA 2015 further requires that, starting in 2016, the Part B premium otherwise determined be increased by $3.00, which is to be collected and repaid to the general fund of the Treasury. The additional repayment premium amounts will continue until the balance due (defined as transfer to the Part B account from the general fund plus forgone income-related premiums) has been repaid. The additional repayment premium is not to be matched by general revenue contributions; however, since CMS is not able to separate it from the standard premium, the additional repayment premium is matched. An adjustment is therefore necessary to transfer this erroneous Federal matching amount back to the general fund. 2Reflects interest adjustments on the reallocation of administrative expenses among the Medicare trust funds, the OASDI trust funds, and the general fund of the Treasury. Estimated payments are made from the trust funds and then are reconciled, with interest, the next year when the actual costs are known. A positive figure represents a transfer to the Part B account of the SMI trust fund from the other trust funds. A negative figure represents a transfer from the Part B account in the SMI trust fund to the other funds. 3Represents amount transferred from the Part B account in the SMI trust fund to Medicaid to pay the Part B premium for certain qualified individuals, as legislated by the Balanced Budget Act of 1997. 4Includes expenses of the Medicare Administrative Contractors. Also reflects a larger-than-usual upward adjustment of $1.7 billion for prior-year allocations among Part A, Part B, and Part D. 5Reflects amount transferred from the Part B account of the SMI trust fund to the Patient-Centered Outcomes Research trust fund, as authorized by the Patient Protection and Affordable Care Act of 2010. 6Reflects amount transferred from the Part B account of the SMI trust fund to the Administration for Community Living (ACL) for administration of the State Health Insurance Assistance program, as authorized by the Consolidated Appropriations Act of 2014. 7Represents amounts transferred from the Part B account of the SMI trust fund for administration of provisions of the Medicare Access and CHIP Reauthorization Act of 2015 (MACRA). 8Reflects amount transferred from the Part B account of the SMI trust fund to the Administration for Children and Families as authorized by the Patient Protection and Affordable Care Act of 2010.
Note: Totals do not necessarily equal the sums of rounded components.
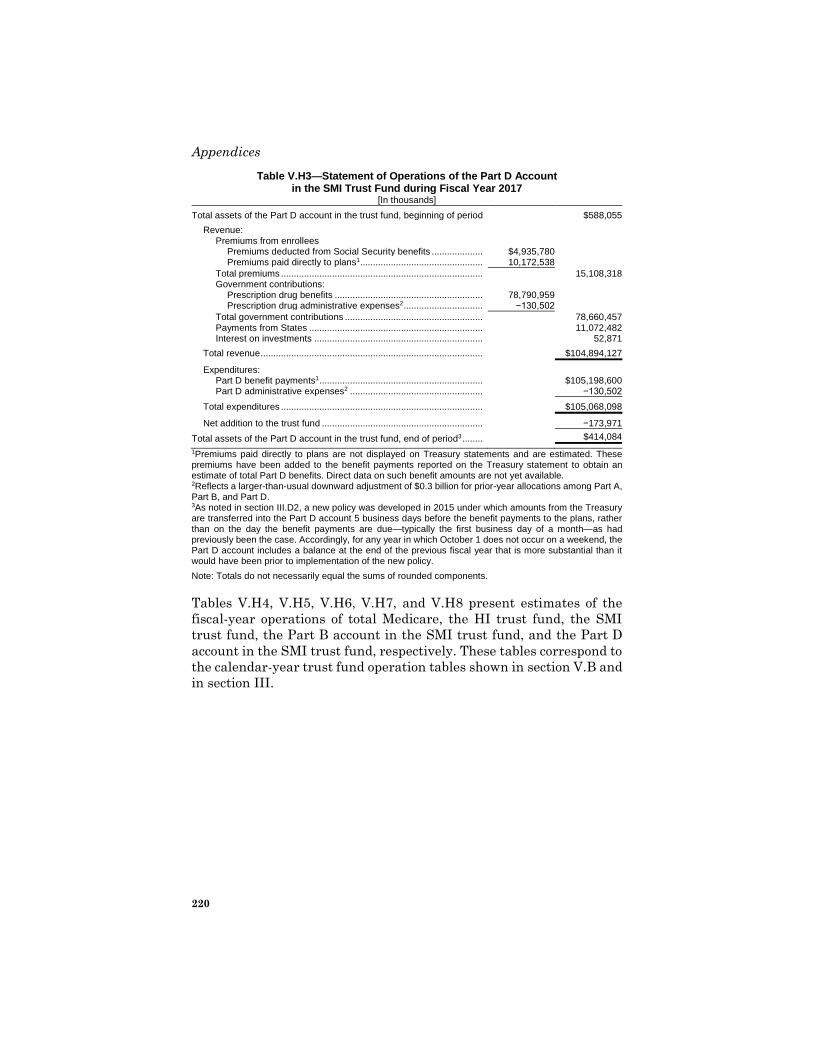
Appendices
220
Table V.H3—Statement of Operations of the Part D Account in the SMI Trust Fund during Fiscal Year 2017
[In thousands]
Total assets of the Part D account in the trust fund, beginning of period $588,055
Revenue: Premiums from enrollees
Premiums deducted from Social Security benefits .................... $4,935,780 Premiums paid directly to plans1 ................................................ 10,172,538
Total premiums ............................................................................... 15,108,318 Government contributions:
Prescription drug benefits .......................................................... 78,790,959 Prescription drug administrative expenses2 ............................... −130,502
Total government contributions ...................................................... 78,660,457 Payments from States .................................................................... 11,072,482 Interest on investments .................................................................. 52,871
Total revenue ....................................................................................... $104,894,127
Expenditures: Part D benefit payments1 ................................................................ $105,198,600 Part D administrative expenses2 .................................................... −130,502
Total expenditures ............................................................................... $105,068,098
Net addition to the trust fund ............................................................... −173,971
Total assets of the Part D account in the trust fund, end of period3 ........ $414,084
1Premiums paid directly to plans are not displayed on Treasury statements and are estimated. These premiums have been added to the benefit payments reported on the Treasury statement to obtain an estimate of total Part D benefits. Direct data on such benefit amounts are not yet available. 2Reflects a larger-than-usual downward adjustment of $0.3 billion for prior-year allocations among Part A, Part B, and Part D. 3As noted in section III.D2, a new policy was developed in 2015 under which amounts from the Treasury are transferred into the Part D account 5 business days before the benefit payments to the plans, rather than on the day the benefit payments are due—typically the first business day of a month—as had previously been the case. Accordingly, for any year in which October 1 does not occur on a weekend, the Part D account includes a balance at the end of the previous fiscal year that is more substantial than it would have been prior to implementation of the new policy.
Note: Totals do not necessarily equal the sums of rounded components.
Tables V.H4, V.H5, V.H6, V.H7, and V.H8 present estimates of the
fiscal-year operations of total Medicare, the HI trust fund, the SMI
trust fund, the Part B account in the SMI trust fund, and the Part D
account in the SMI trust fund, respectively. These tables correspond to
the calendar-year trust fund operation tables shown in section V.B and
in section III.
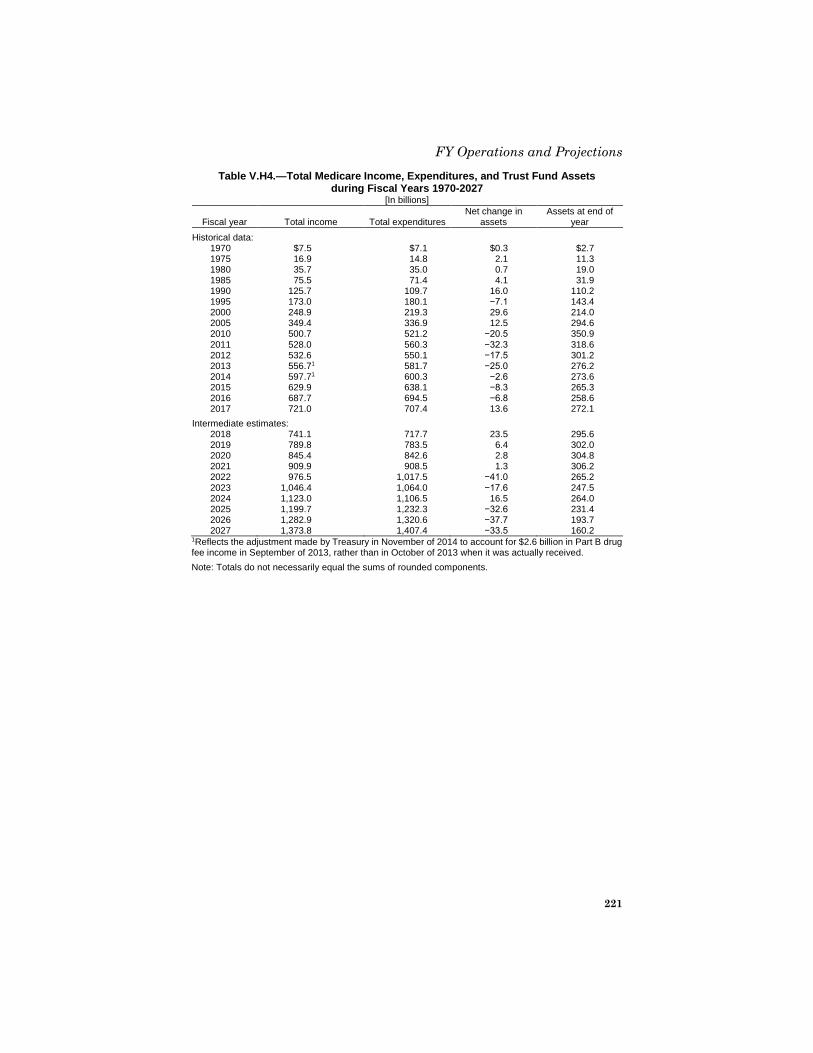
FY Operations and Projections
221
Table V.H4.—Total Medicare Income, Expenditures, and Trust Fund Assets during Fiscal Years 1970-2027
[In billions]
Fiscal year Total income Total expenditures Net change in
assets Assets at end of
year
Historical data: 1970 $7.5 $7.1 $0.3 $2.7 1975 16.9 14.8 2.1 11.3 1980 35.7 35.0 0.7 19.0 1985 75.5 71.4 4.1 31.9 1990 125.7 109.7 16.0 110.2 1995 173.0 180.1 −7.1 143.4 2000 248.9 219.3 29.6 214.0 2005 349.4 336.9 12.5 294.6 2010 500.7 521.2 −20.5 350.9
2011 528.0 560.3 −32.3 318.6 2012 532.6 550.1 −17.5 301.2 2013 556.7 1 581.7 −25.0 276.2 2014 597.7 1 600.3 −2.6 273.6 2015 629.9 638.1 −8.3 265.3 2016 687.7 694.5 −6.8 258.6 2017 721.0 707.4 13.6 272.1
Intermediate estimates: 2018 741.1 717.7 23.5 295.6 2019 789.8 783.5 6.4 302.0 2020 845.4 842.6 2.8 304.8 2021 909.9 908.5 1.3 306.2 2022 976.5 1,017.5 −41.0 265.2 2023 1,046.4 1,064.0 −17.6 247.5 2024 1,123.0 1,106.5 16.5 264.0 2025 1,199.7 1,232.3 −32.6 231.4 2026 1,282.9 1,320.6 −37.7 193.7 2027 1,373.8 1,407.4 −33.5 160.2
1Reflects the adjustment made by Treasury in November of 2014 to account for $2.6 billion in Part B drug fee income in September of 2013, rather than in October of 2013 when it was actually received.
Note: Totals do not necessarily equal the sums of rounded components.
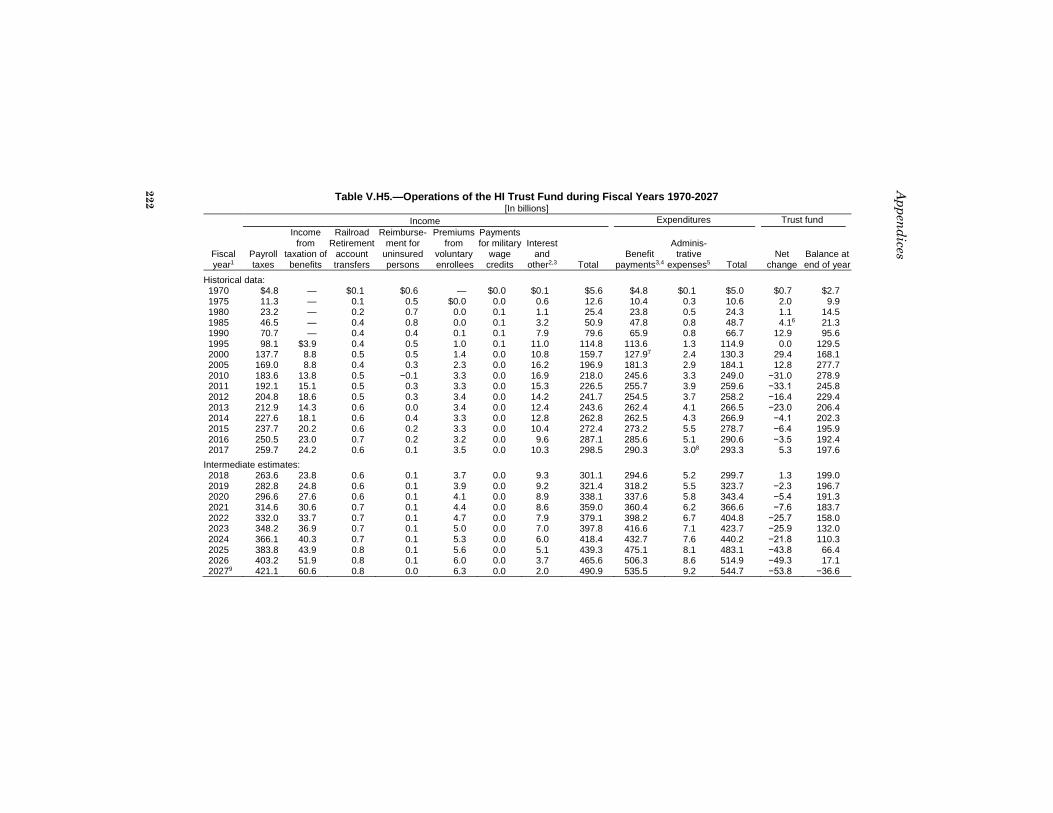
Table V.H5.—Operations of the HI Trust Fund during Fiscal Years 1970-2027 [In billions]
Income Expenditures Trust fund
Fiscal year1
Payroll taxes
Income from
taxation of benefits
Railroad Retirement
account transfers
Reimburse-ment for
uninsured persons
Premiums from
voluntary enrollees
Payments for military
wage credits
Interest and
other2,3 Total Benefit
payments3,4
Adminis-trative
expenses5 Total Net
change Balance at end of year
Historical data: 1970 $4.8 — $0.1 $0.6 — $0.0 $0.1 $5.6 $4.8 $0.1 $5.0 $0.7 $2.7 1975 11.3 — 0.1 0.5 $0.0 0.0 0.6 12.6 10.4 0.3 10.6 2.0 9.9 1980 23.2 — 0.2 0.7 0.0 0.1 1.1 25.4 23.8 0.5 24.3 1.1 14.5 1985 46.5 — 0.4 0.8 0.0 0.1 3.2 50.9 47.8 0.8 48.7 4.16 21.3 1990 70.7 — 0.4 0.4 0.1 0.1 7.9 79.6 65.9 0.8 66.7 12.9 95.6 1995 98.1 $3.9 0.4 0.5 1.0 0.1 11.0 114.8 113.6 1.3 114.9 0.0 129.5 2000 137.7 8.8 0.5 0.5 1.4 0.0 10.8 159.7 127.97 2.4 130.3 29.4 168.1 2005 169.0 8.8 0.4 0.3 2.3 0.0 16.2 196.9 181.3 2.9 184.1 12.8 277.7 2010 183.6 13.8 0.5 −0.1 3.3 0.0 16.9 218.0 245.6 3.3 249.0 −31.0 278.9 2011 192.1 15.1 0.5 0.3 3.3 0.0 15.3 226.5 255.7 3.9 259.6 −33.1 245.8 2012 204.8 18.6 0.5 0.3 3.4 0.0 14.2 241.7 254.5 3.7 258.2 −16.4 229.4 2013 212.9 14.3 0.6 0.0 3.4 0.0 12.4 243.6 262.4 4.1 266.5 −23.0 206.4 2014 227.6 18.1 0.6 0.4 3.3 0.0 12.8 262.8 262.5 4.3 266.9 −4.1 202.3 2015 237.7 20.2 0.6 0.2 3.3 0.0 10.4 272.4 273.2 5.5 278.7 −6.4 195.9 2016 250.5 23.0 0.7 0.2 3.2 0.0 9.6 287.1 285.6 5.1 290.6 −3.5 192.4 2017 259.7 24.2 0.6 0.1 3.5 0.0 10.3 298.5 290.3 3.08 293.3 5.3 197.6
Intermediate estimates: 2018 263.6 23.8 0.6 0.1 3.7 0.0 9.3 301.1 294.6 5.2 299.7 1.3 199.0 2019 282.8 24.8 0.6 0.1 3.9 0.0 9.2 321.4 318.2 5.5 323.7 −2.3 196.7 2020 296.6 27.6 0.6 0.1 4.1 0.0 8.9 338.1 337.6 5.8 343.4 −5.4 191.3 2021 314.6 30.6 0.7 0.1 4.4 0.0 8.6 359.0 360.4 6.2 366.6 −7.6 183.7 2022 332.0 33.7 0.7 0.1 4.7 0.0 7.9 379.1 398.2 6.7 404.8 −25.7 158.0 2023 348.2 36.9 0.7 0.1 5.0 0.0 7.0 397.8 416.6 7.1 423.7 −25.9 132.0 2024 366.1 40.3 0.7 0.1 5.3 0.0 6.0 418.4 432.7 7.6 440.2 −21.8 110.3 2025 383.8 43.9 0.8 0.1 5.6 0.0 5.1 439.3 475.1 8.1 483.1 −43.8 66.4 2026 403.2 51.9 0.8 0.1 6.0 0.0 3.7 465.6 506.3 8.6 514.9 −49.3 17.1 20279 421.1 60.6 0.8 0.0 6.3 0.0 2.0 490.9 535.5 9.2 544.7 −53.8 −36.6
222
Ap
pen
dices
1Fiscal years 1970 and 1975 consist of the 12 months ending on June 30 of each year; fiscal years 1980 and later consist of the 12 months ending on September 30 of each year. 2Other income includes recoveries of amounts reimbursed from the trust fund that are not obligations of the trust fund, receipts from the fraud and abuse control program, and a small amount of miscellaneous income. In 2008, includes an adjustment of −$0.9 billion for interest inadvertently earned as a result of Part A hospice costs that were misallocated to the Part B trust fund account. 3See footnote 2 of table III.B4. 4Includes costs of Peer Review Organizations from 1983 through 2001 (beginning with the implementation of the prospective payment system on
October 1, 1983) and costs of Quality Improvement Organizations beginning in 2002. 5Includes costs of experiments and demonstration projects. Beginning in 1997, includes fraud and abuse control expenses, as provided for by the Health Insurance Portability and Accountability Act of 1996 (Public Law 104-191). 6Includes repayment of loan principal, from the OASI trust fund, of $1.8 billion. 7For 1998 to 2003, includes monies transferred to the SMI trust fund for home health agency costs, as provided for by the Balanced Budget Act of 1997 (Public Law 105-33). 8Reflects a larger-than-usual downward adjustment of $1.8 billion for prior-year allocations among Part A, Part B, and Part D. 9Estimates for 2027 are hypothetical since the HI trust fund would be depleted in that year.
Note: Totals do not necessarily equal the sums of rounded components.
223
FY
Op
eratio
ns a
nd
Pro
jection
s
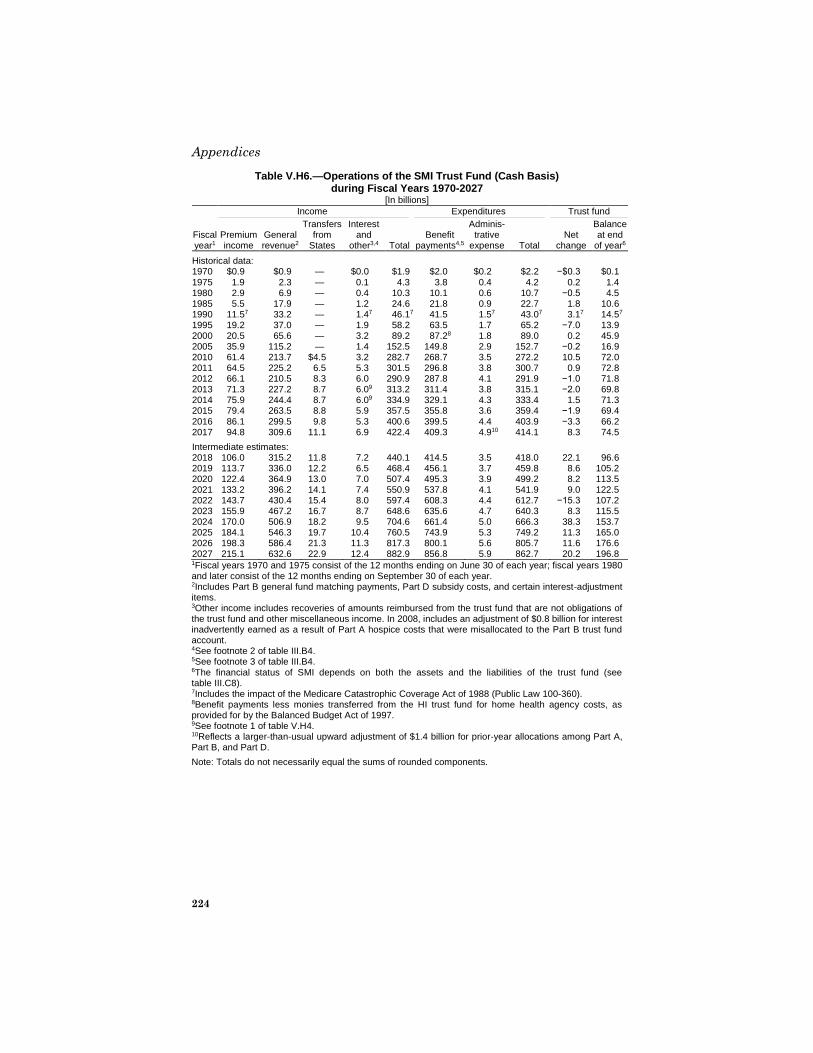
Appendices
224
Table V.H6.—Operations of the SMI Trust Fund (Cash Basis) during Fiscal Years 1970-2027
[In billions]
Income Expenditures Trust fund
Fiscal year1
Premium income
General revenue2
Transfers from
States
Interest and
other3,4 Total Benefit
payments4,5
Adminis-trative
expense Total Net
change
Balance at end
of year6
Historical data: 1970 $0.9 $0.9 — $0.0 $1.9 $2.0 $0.2 $2.2 −$0.3 $0.1 1975 1.9 2.3 — 0.1 4.3 3.8 0.4 4.2 0.2 1.4 1980 2.9 6.9 — 0.4 10.3 10.1 0.6 10.7 −0.5 4.5 1985 5.5 17.9 — 1.2 24.6 21.8 0.9 22.7 1.8 10.6 1990 11.5 7 33.2 — 1.4 7 46.1 7 41.5 1.5 7 43.0 7 3.1 7 14.5 7 1995 19.2 37.0 — 1.9 58.2 63.5 1.7 65.2 −7.0 13.9 2000 20.5 65.6 — 3.2 89.2 87.2 8 1.8 89.0 0.2 45.9 2005 35.9 115.2 — 1.4 152.5 149.8 2.9 152.7 −0.2 16.9 2010 61.4 213.7 $4.5 3.2 282.7 268.7 3.5 272.2 10.5 72.0 2011 64.5 225.2 6.5 5.3 301.5 296.8 3.8 300.7 0.9 72.8 2012 66.1 210.5 8.3 6.0 290.9 287.8 4.1 291.9 −1.0 71.8 2013 71.3 227.2 8.7 6.0 9 313.2 311.4 3.8 315.1 −2.0 69.8 2014 75.9 244.4 8.7 6.0 9 334.9 329.1 4.3 333.4 1.5 71.3 2015 79.4 263.5 8.8 5.9 357.5 355.8 3.6 359.4 −1.9 69.4 2016 86.1 299.5 9.8 5.3 400.6 399.5 4.4 403.9 −3.3 66.2 2017 94.8 309.6 11.1 6.9 422.4 409.3 4.9 10 414.1 8.3 74.5
Intermediate estimates: 2018 106.0 315.2 11.8 7.2 440.1 414.5 3.5 418.0 22.1 96.6 2019 113.7 336.0 12.2 6.5 468.4 456.1 3.7 459.8 8.6 105.2 2020 122.4 364.9 13.0 7.0 507.4 495.3 3.9 499.2 8.2 113.5 2021 133.2 396.2 14.1 7.4 550.9 537.8 4.1 541.9 9.0 122.5 2022 143.7 430.4 15.4 8.0 597.4 608.3 4.4 612.7 −15.3 107.2 2023 155.9 467.2 16.7 8.7 648.6 635.6 4.7 640.3 8.3 115.5 2024 170.0 506.9 18.2 9.5 704.6 661.4 5.0 666.3 38.3 153.7 2025 184.1 546.3 19.7 10.4 760.5 743.9 5.3 749.2 11.3 165.0 2026 198.3 586.4 21.3 11.3 817.3 800.1 5.6 805.7 11.6 176.6 2027 215.1 632.6 22.9 12.4 882.9 856.8 5.9 862.7 20.2 196.8 1Fiscal years 1970 and 1975 consist of the 12 months ending on June 30 of each year; fiscal years 1980 and later consist of the 12 months ending on September 30 of each year. 2Includes Part B general fund matching payments, Part D subsidy costs, and certain interest-adjustment items. 3Other income includes recoveries of amounts reimbursed from the trust fund that are not obligations of the trust fund and other miscellaneous income. In 2008, includes an adjustment of $0.8 billion for interest inadvertently earned as a result of Part A hospice costs that were misallocated to the Part B trust fund account. 4See footnote 2 of table III.B4. 5See footnote 3 of table III.B4. 6The financial status of SMI depends on both the assets and the liabilities of the trust fund (see table III.C8). 7Includes the impact of the Medicare Catastrophic Coverage Act of 1988 (Public Law 100-360). 8Benefit payments less monies transferred from the HI trust fund for home health agency costs, as provided for by the Balanced Budget Act of 1997. 9See footnote 1 of table V.H4. 10Reflects a larger-than-usual upward adjustment of $1.4 billion for prior-year allocations among Part A, Part B, and Part D.
Note: Totals do not necessarily equal the sums of rounded components.
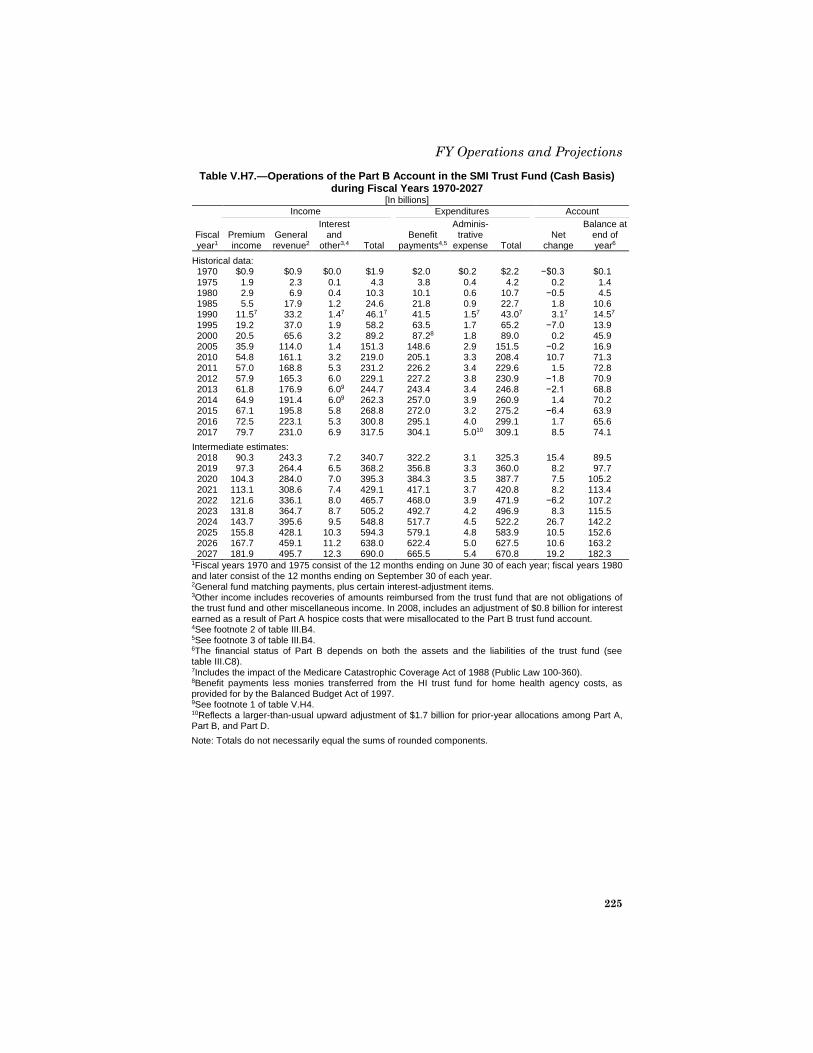
FY Operations and Projections
225
Table V.H7.—Operations of the Part B Account in the SMI Trust Fund (Cash Basis) during Fiscal Years 1970-2027
[In billions]
Income Expenditures Account
Fiscal year1
Premium income
General revenue2
Interest and
other3,4 Total Benefit
payments4,5
Adminis-trative
expense Total Net
change
Balance at end of year6
Historical data: 1970 $0.9 $0.9 $0.0 $1.9 $2.0 $0.2 $2.2 −$0.3 $0.1 1975 1.9 2.3 0.1 4.3 3.8 0.4 4.2 0.2 1.4 1980 2.9 6.9 0.4 10.3 10.1 0.6 10.7 −0.5 4.5 1985 5.5 17.9 1.2 24.6 21.8 0.9 22.7 1.8 10.6 1990 11.5 7 33.2 1.4 7 46.1 7 41.5 1.5 7 43.0 7 3.1 7 14.5 7 1995 19.2 37.0 1.9 58.2 63.5 1.7 65.2 −7.0 13.9 2000 20.5 65.6 3.2 89.2 87.2 8 1.8 89.0 0.2 45.9 2005 35.9 114.0 1.4 151.3 148.6 2.9 151.5 −0.2 16.9 2010 54.8 161.1 3.2 219.0 205.1 3.3 208.4 10.7 71.3 2011 57.0 168.8 5.3 231.2 226.2 3.4 229.6 1.5 72.8 2012 57.9 165.3 6.0 229.1 227.2 3.8 230.9 −1.8 70.9 2013 61.8 176.9 6.0 9 244.7 243.4 3.4 246.8 −2.1 68.8 2014 64.9 191.4 6.0 9 262.3 257.0 3.9 260.9 1.4 70.2 2015 67.1 195.8 5.8 268.8 272.0 3.2 275.2 −6.4 63.9 2016 72.5 223.1 5.3 300.8 295.1 4.0 299.1 1.7 65.6 2017 79.7 231.0 6.9 317.5 304.1 5.0 10 309.1 8.5 74.1
Intermediate estimates: 2018 90.3 243.3 7.2 340.7 322.2 3.1 325.3 15.4 89.5 2019 97.3 264.4 6.5 368.2 356.8 3.3 360.0 8.2 97.7 2020 104.3 284.0 7.0 395.3 384.3 3.5 387.7 7.5 105.2 2021 113.1 308.6 7.4 429.1 417.1 3.7 420.8 8.2 113.4 2022 121.6 336.1 8.0 465.7 468.0 3.9 471.9 −6.2 107.2 2023 131.8 364.7 8.7 505.2 492.7 4.2 496.9 8.3 115.5 2024 143.7 395.6 9.5 548.8 517.7 4.5 522.2 26.7 142.2 2025 155.8 428.1 10.3 594.3 579.1 4.8 583.9 10.5 152.6 2026 167.7 459.1 11.2 638.0 622.4 5.0 627.5 10.6 163.2 2027 181.9 495.7 12.3 690.0 665.5 5.4 670.8 19.2 182.3
1Fiscal years 1970 and 1975 consist of the 12 months ending on June 30 of each year; fiscal years 1980 and later consist of the 12 months ending on September 30 of each year. 2General fund matching payments, plus certain interest-adjustment items. 3Other income includes recoveries of amounts reimbursed from the trust fund that are not obligations of the trust fund and other miscellaneous income. In 2008, includes an adjustment of $0.8 billion for interest earned as a result of Part A hospice costs that were misallocated to the Part B trust fund account. 4See footnote 2 of table III.B4. 5See footnote 3 of table III.B4. 6The financial status of Part B depends on both the assets and the liabilities of the trust fund (see table III.C8). 7Includes the impact of the Medicare Catastrophic Coverage Act of 1988 (Public Law 100-360). 8Benefit payments less monies transferred from the HI trust fund for home health agency costs, as provided for by the Balanced Budget Act of 1997. 9See footnote 1 of table V.H4. 10Reflects a larger-than-usual upward adjustment of $1.7 billion for prior-year allocations among Part A, Part B, and Part D.
Note: Totals do not necessarily equal the sums of rounded components.
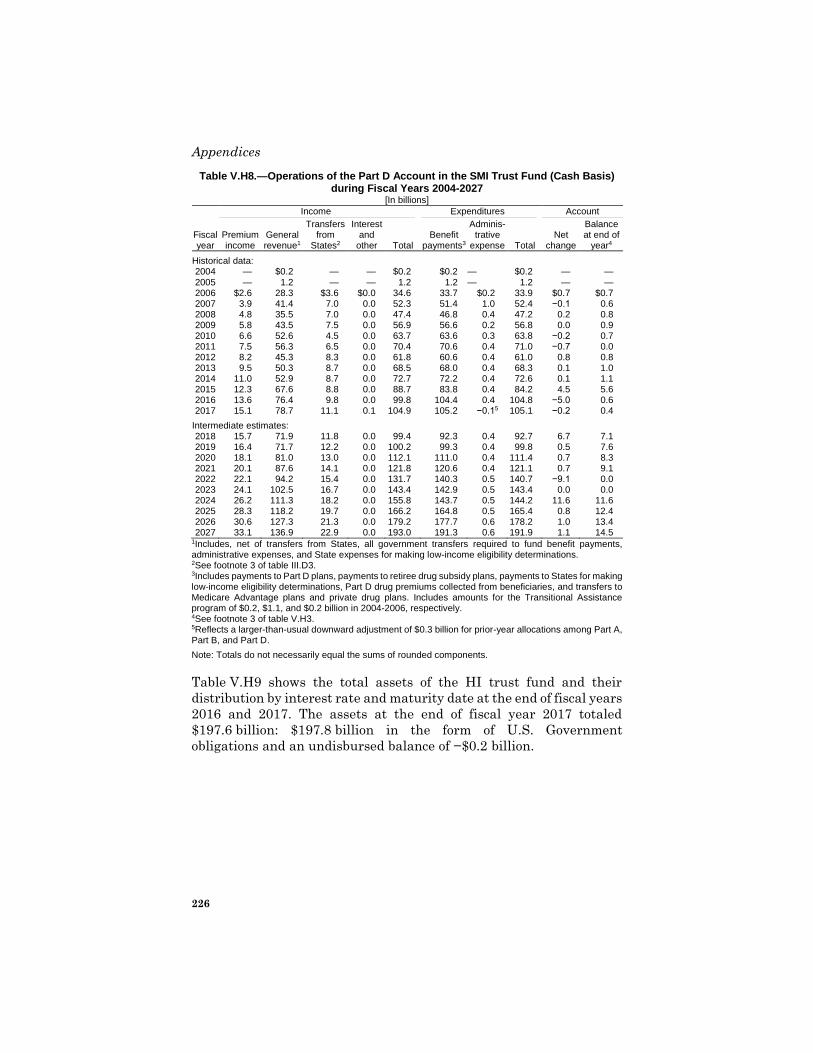
Appendices
226
Table V.H8.—Operations of the Part D Account in the SMI Trust Fund (Cash Basis) during Fiscal Years 2004-2027
[In billions]
Income Expenditures Account
Fiscal year
Premium income
General revenue1
Transfers from
States2
Interest and
other Total Benefit
payments3
Adminis-trative
expense Total Net
change
Balance at end of
year4
Historical data: 2004 — $0.2 — — $0.2 $0.2 — $0.2 — — 2005 — 1.2 — — 1.2 1.2 — 1.2 — — 2006 $2.6 28.3 $3.6 $0.0 34.6 33.7 $0.2 33.9 $0.7 $0.7 2007 3.9 41.4 7.0 0.0 52.3 51.4 1.0 52.4 −0.1 0.6 2008 4.8 35.5 7.0 0.0 47.4 46.8 0.4 47.2 0.2 0.8 2009 5.8 43.5 7.5 0.0 56.9 56.6 0.2 56.8 0.0 0.9 2010 6.6 52.6 4.5 0.0 63.7 63.6 0.3 63.8 −0.2 0.7 2011 7.5 56.3 6.5 0.0 70.4 70.6 0.4 71.0 −0.7 0.0 2012 8.2 45.3 8.3 0.0 61.8 60.6 0.4 61.0 0.8 0.8 2013 9.5 50.3 8.7 0.0 68.5 68.0 0.4 68.3 0.1 1.0 2014 11.0 52.9 8.7 0.0 72.7 72.2 0.4 72.6 0.1 1.1 2015 12.3 67.6 8.8 0.0 88.7 83.8 0.4 84.2 4.5 5.6 2016 13.6 76.4 9.8 0.0 99.8 104.4 0.4 104.8 −5.0 0.6 2017 15.1 78.7 11.1 0.1 104.9 105.2 −0.1 5 105.1 −0.2 0.4
Intermediate estimates: 2018 15.7 71.9 11.8 0.0 99.4 92.3 0.4 92.7 6.7 7.1 2019 16.4 71.7 12.2 0.0 100.2 99.3 0.4 99.8 0.5 7.6 2020 18.1 81.0 13.0 0.0 112.1 111.0 0.4 111.4 0.7 8.3 2021 20.1 87.6 14.1 0.0 121.8 120.6 0.4 121.1 0.7 9.1 2022 22.1 94.2 15.4 0.0 131.7 140.3 0.5 140.7 −9.1 0.0 2023 24.1 102.5 16.7 0.0 143.4 142.9 0.5 143.4 0.0 0.0 2024 26.2 111.3 18.2 0.0 155.8 143.7 0.5 144.2 11.6 11.6 2025 28.3 118.2 19.7 0.0 166.2 164.8 0.5 165.4 0.8 12.4 2026 30.6 127.3 21.3 0.0 179.2 177.7 0.6 178.2 1.0 13.4 2027 33.1 136.9 22.9 0.0 193.0 191.3 0.6 191.9 1.1 14.5
1Includes, net of transfers from States, all government transfers required to fund benefit payments, administrative expenses, and State expenses for making low-income eligibility determinations. 2See footnote 3 of table III.D3. 3Includes payments to Part D plans, payments to retiree drug subsidy plans, payments to States for making low-income eligibility determinations, Part D drug premiums collected from beneficiaries, and transfers to Medicare Advantage plans and private drug plans. Includes amounts for the Transitional Assistance program of $0.2, $1.1, and $0.2 billion in 2004-2006, respectively. 4See footnote 3 of table V.H3. 5Reflects a larger-than-usual downward adjustment of $0.3 billion for prior-year allocations among Part A, Part B, and Part D.
Note: Totals do not necessarily equal the sums of rounded components.
Table V.H9 shows the total assets of the HI trust fund and their
distribution by interest rate and maturity date at the end of fiscal years
2016 and 2017. The assets at the end of fiscal year 2017 totaled
$197.6 billion: $197.8 billion in the form of U.S. Government
obligations and an undisbursed balance of −$0.2 billion.
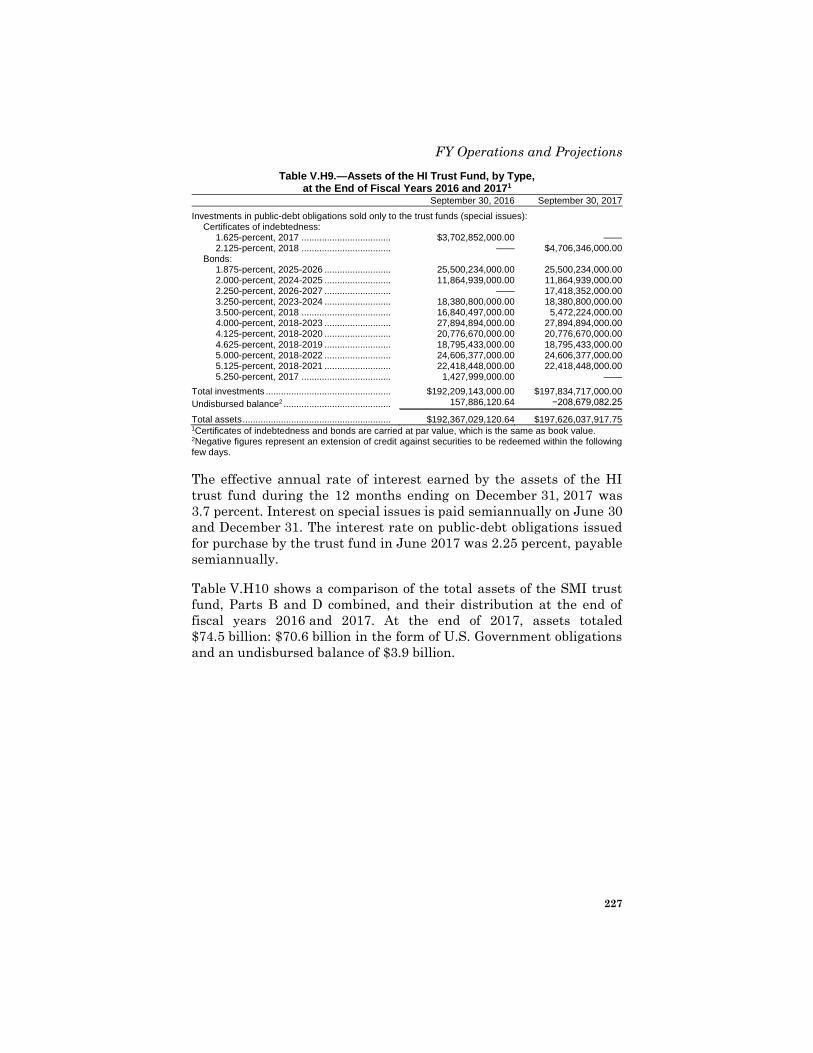
FY Operations and Projections
227
Table V.H9.—Assets of the HI Trust Fund, by Type, at the End of Fiscal Years 2016 and 20171
September 30, 2016 September 30, 2017
Investments in public-debt obligations sold only to the trust funds (special issues): Certificates of indebtedness:
1.625-percent, 2017 ................................... $3,702,852,000.00 —— 2.125-percent, 2018 ................................... —— $4,706,346,000.00
Bonds: 1.875-percent, 2025-2026 .......................... 25,500,234,000.00 25,500,234,000.00 2.000-percent, 2024-2025 .......................... 11,864,939,000.00 11,864,939,000.00 2.250-percent, 2026-2027 .......................... —— 17,418,352,000.00 3.250-percent, 2023-2024 .......................... 18,380,800,000.00 18,380,800,000.00 3.500-percent, 2018 ................................... 16,840,497,000.00 5,472,224,000.00 4.000-percent, 2018-2023 .......................... 27,894,894,000.00 27,894,894,000.00 4.125-percent, 2018-2020 .......................... 20,776,670,000.00 20,776,670,000.00
4.625-percent, 2018-2019 .......................... 18,795,433,000.00 18,795,433,000.00 5.000-percent, 2018-2022 .......................... 24,606,377,000.00 24,606,377,000.00 5.125-percent, 2018-2021 .......................... 22,418,448,000.00 22,418,448,000.00 5.250-percent, 2017 ................................... 1,427,999,000.00 ——
Total investments ................................................. $192,209,143,000.00 $197,834,717,000.00
Undisbursed balance2 .......................................... 157,886,120.64 −208,679,082.25
Total assets .......................................................... $192,367,029,120.64 $197,626,037,917.75 1Certificates of indebtedness and bonds are carried at par value, which is the same as book value. 2Negative figures represent an extension of credit against securities to be redeemed within the following few days.
The effective annual rate of interest earned by the assets of the HI
trust fund during the 12 months ending on December 31, 2017 was
3.7 percent. Interest on special issues is paid semiannually on June 30
and December 31. The interest rate on public-debt obligations issued
for purchase by the trust fund in June 2017 was 2.25 percent, payable
semiannually.
Table V.H10 shows a comparison of the total assets of the SMI trust
fund, Parts B and D combined, and their distribution at the end of
fiscal years 2016 and 2017. At the end of 2017, assets totaled
$74.5 billion: $70.6 billion in the form of U.S. Government obligations
and an undisbursed balance of $3.9 billion.
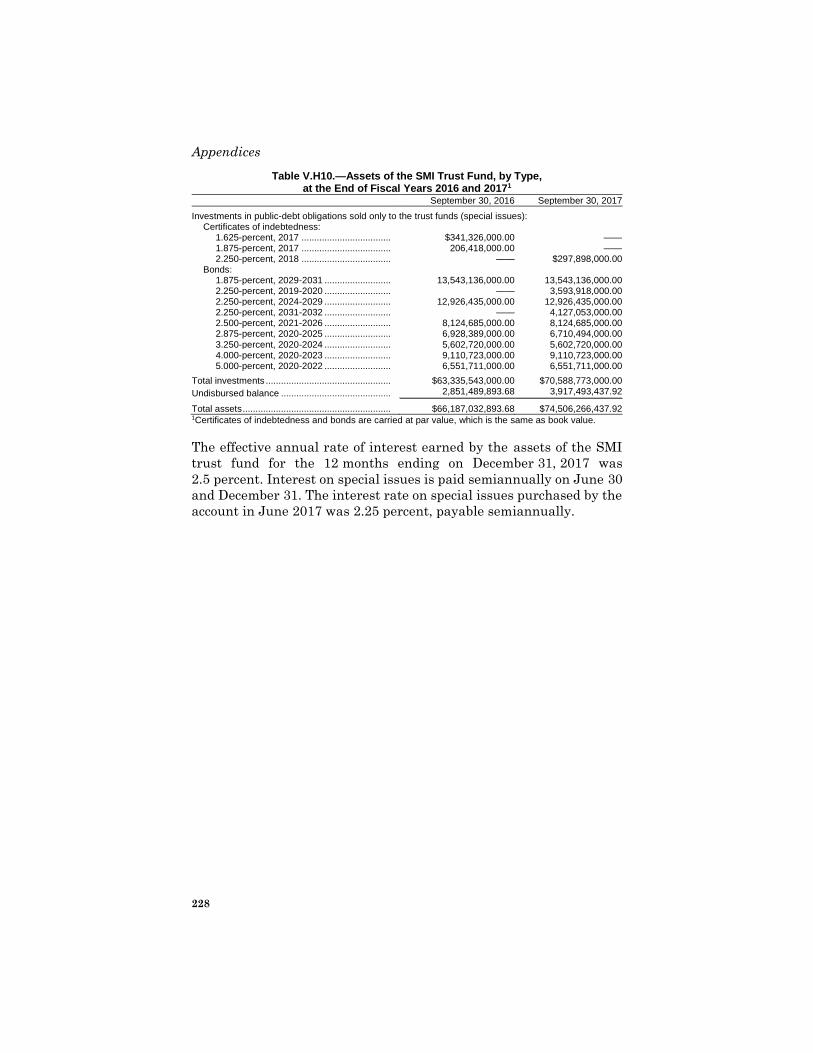
Appendices
228
Table V.H10.—Assets of the SMI Trust Fund, by Type, at the End of Fiscal Years 2016 and 20171
September 30, 2016 September 30, 2017
Investments in public-debt obligations sold only to the trust funds (special issues): Certificates of indebtedness:
1.625-percent, 2017 ................................... $341,326,000.00 —— 1.875-percent, 2017 ................................... 206,418,000.00 —— 2.250-percent, 2018 ................................... —— $297,898,000.00
Bonds: 1.875-percent, 2029-2031 .......................... 13,543,136,000.00 13,543,136,000.00 2.250-percent, 2019-2020 .......................... —— 3,593,918,000.00 2.250-percent, 2024-2029 .......................... 12,926,435,000.00 12,926,435,000.00 2.250-percent, 2031-2032 .......................... —— 4,127,053,000.00 2.500-percent, 2021-2026 .......................... 8,124,685,000.00 8,124,685,000.00 2.875-percent, 2020-2025 .......................... 6,928,389,000.00 6,710,494,000.00
3.250-percent, 2020-2024 .......................... 5,602,720,000.00 5,602,720,000.00 4.000-percent, 2020-2023 .......................... 9,110,723,000.00 9,110,723,000.00 5.000-percent, 2020-2022 .......................... 6,551,711,000.00 6,551,711,000.00
Total investments ................................................. $63,335,543,000.00 $70,588,773,000.00
Undisbursed balance ........................................... 2,851,489,893.68 3,917,493,437.92
Total assets .......................................................... $66,187,032,893.68 $74,506,266,437.92 1Certificates of indebtedness and bonds are carried at par value, which is the same as book value.
The effective annual rate of interest earned by the assets of the SMI
trust fund for the 12 months ending on December 31, 2017 was
2.5 percent. Interest on special issues is paid semiannually on June 30
and December 31. The interest rate on special issues purchased by the
account in June 2017 was 2.25 percent, payable semiannually.
Glossary
229
I. GLOSSARY
Accountable care organizations (ACOs). Groups of clinicians,
hospitals, and other health care providers that choose to come together
to deliver coordinated, high-quality care to the Medicare patients they
serve.
Actuarial balance. The difference between the summarized income
rate and the summarized cost rate over a given valuation period.
Actuarial deficit. A negative actuarial balance.
Actuarial rates. One-half of the Part B expected monthly benefit and
administrative costs for each aged enrollee adjusted for interest earned
on the Part B account assets attributable to aged enrollees and a
contingency margin (for the aged actuarial rate), and one-half of the
expected monthly benefit and administrative costs for each disabled
enrollee adjusted for interest earned on the Part B account assets
attributable to disabled enrollees and a contingency margin (for the
disabled actuarial rate), for the duration the rate is in effect.
Actuarial status. A measure of the adequacy of the financing as
determined by the difference between assets and liabilities at the end
of the periods for which financing was established.
Administrative expenses. Expenses incurred by the Department of
Health and Human Services and the Department of the Treasury in
administering HI and SMI and the provisions of the Internal Revenue
Code relating to the collection of contributions. Such administrative
expenses, which are paid from the HI and SMI trust funds, include
expenditures for contractors to determine costs of, and make payments
to, providers, as well as salaries and expenses of the Centers for
Medicare & Medicaid Services (CMS).
Advanced alternative payment model (advanced APM). An APM
that meets certain standards for risk-bearing, use of health
information technology, and quality.
Aged enrollee. An individual, aged 65 or over, who is enrolled in HI
or SMI.
Allowed charge. Individual charge determined by a Medicare
Administrative Contractor for a covered Part B medical service or
supply.
Appendices
230
Alternative payment model (APM). A program or model (except for
a health care innovation award model) implemented by the Center for
Medicare and Medicaid Innovation at CMS; a demonstration under the
Health Care Quality Demonstration Program; an ACO model
participating in the Medicare shared savings program; or a Medicare
demonstration required by law.
Annual out-of-pocket threshold. The amount of out-of-pocket
expenses that must be paid for prescription drugs before significantly
reduced Part D beneficiary cost sharing is effective. Amounts paid by
a third-party insurer are not included in testing this threshold, but
amounts paid by State or Federal assistance programs are included.
Assets. Treasury notes and bonds guaranteed by the Federal
Government, and cash held by the trust funds for investment purposes.
Assumptions. Values relating to future trends in certain key factors
that affect the balance in the trust funds. Demographic assumptions
include fertility, mortality, net immigration, marriage, divorce,
retirement patterns, disability incidence and termination rates, and
changes in the labor force. Economic assumptions include
unemployment, average earnings, inflation, interest rates, and
productivity. Three sets of economic assumptions are presented in the
Trustees Report:
(1) The low-cost alternative, with relatively rapid economic
growth, low inflation, and favorable (from the standpoint of
program financing) demographic conditions;
(2) The intermediate assumptions, which represent the
Trustees’ best estimates of likely future economic and
demographic conditions; and
(3) The high-cost alternative, with slow economic growth, more
rapid inflation, and financially disadvantageous
demographic conditions.
See also Hospital assumptions.
Average market yield. A computation that is made on all marketable
interest-bearing obligations of the United States. It is computed on the
basis of market quotations as of the end of the calendar month
immediately preceding the date of such issue.
Baby boom. The period from the end of World War II through the
mid-1960s marked by unusually high birth rates.
Base estimate. The updated estimate of the most recent historical
year.
Glossary
231
Beneficiary. A person enrolled in HI or SMI. See also Aged enrollee
and Disabled enrollee.
Benefit payments. The amounts disbursed for covered services after
the deductible and coinsurance amounts have been deducted.
Benefit period. An alternate name for spell of illness.
Board of Trustees. A Board established by the Social Security Act to
oversee the financial operations of the Federal Hospital Insurance
Trust Fund and the Federal Supplementary Medical Insurance Trust
Fund. The Board comprises six members, four of whom serve
automatically by virtue of their positions in the Federal Government:
the Secretary of the Treasury, who is the Managing Trustee; the
Secretary of Labor; the Secretary of Health and Human Services; and
the Commissioner of Social Security. Two other members are public
representatives whom the President appoints and the Senate confirms.
These positions are currently vacant. The Administrator of CMS serves
as Secretary of the Board of Trustees.
Bond. A certificate of ownership of a specified portion of a debt due by
the Federal Government to holders, bearing a fixed rate of interest.
Callable. Subject to redemption upon notice, as is a bond.
Case mix index. A relative weight that captures the average
complexity of certain Medicare services.
Cash basis. The costs of the service when payment was made rather
than when the service was performed.
Certificate of indebtedness. A short-term certificate of ownership
(12 months or less) of a specified portion of a debt due by the Federal
Government to individual holders, bearing a fixed rate of interest.
Closed-group population. Includes all persons currently
participating in the program as either taxpayers or beneficiaries, or
both. See also Open-group population.
Coinsurance. Portion of the costs for covered services paid by the
beneficiary after meeting the annual deductible. See also Hospital
coinsurance and SNF coinsurance.
Consumer Price Index (CPI). A measure of the average change in
prices over time in a fixed group of goods and services. In this report,
references to the CPI relate to the CPI for Urban Wage Earners and
Appendices
232
Clerical Workers (CPI-W), except for those cases in which the CPI for
All Urban Consumers—all items (CPI-U) is indicated.
Contingency. Funds included in the SMI Part B trust fund account
to serve as a cushion in case actual expenditures are higher than those
projected at the time financing was established. Since the financing is
set prospectively, actual experience may be different from the
estimates used in setting the financing.
Contingency margin. An amount included in the actuarial rates to
provide for changes in the contingency level in the SMI Part B trust
fund account. Positive margins increase the contingency level, and
negative margins decrease it.
Contribution base. See Maximum tax base.
Contributions. See Payroll taxes.
Cost rate. The ratio of HI cost (or outgo or expenditures) on an
incurred basis during a given year to the taxable payroll for the year.
Covered earnings. Earnings in employment covered by HI.
Covered employment. All employment and self-employment
creditable for Social Security purposes. Almost every kind of
employment and self-employment is covered under HI. In a few
employment situations—for example, religious orders under a vow of
poverty, foreign affiliates of American employers, or State and local
governments—coverage must be elected by the employer. However,
effective July 1991, coverage is mandatory for State and local
employees who are not participating in a public employee retirement
system. All new State and local employees have been covered since
April 1986. In a few situations—for instance, ministers or self-
employed members of certain religious groups—workers can opt out of
coverage. Covered employment for HI includes all Federal employees
(whereas covered employment for OASDI includes some, but not all,
Federal employees).
Covered Part D drugs. Prescription drugs covered under the
Medicaid program plus insulin-related supplies and smoking cessation
agents. Drugs covered in Parts A and B of Medicare will continue to be
covered there, rather than in Part D.
Covered services. Services for which HI or SMI pays, as defined and
limited by statute. Covered HI services are provided by hospitals
(inpatient care), skilled nursing facilities, home health agencies, and
Glossary
233
hospices. Covered SMI Part B services include most physician services,
care in outpatient departments of hospitals, diagnostic tests, durable
medical equipment, ambulance services, and other health services that
are not covered by HI. See Covered Part D drugs for SMI Part D.
Covered worker. A person who has earnings creditable for Social
Security purposes on the basis of services for wages in covered
employment and/or on the basis of income from covered
self-employment. The number of HI covered workers is slightly larger
than the number of OASDI covered workers because of different
coverage status for Federal employment. See Covered employment.
Creditable prescription drug coverage. Prescription drug
coverage that meets or exceeds the actuarial value of Part D coverage
provided through a group health plan or otherwise.
Dedicated financing sources. The sum of HI payroll taxes, HI share
of income taxes on Social Security benefits, Part D State transfers,
Part B drug fees, and beneficiary premiums. This amount is used in
the test of excess general revenue Medicare funding.
Deductible. The annual amount payable by the beneficiary for
covered services before Medicare makes reimbursement. See also
Inpatient hospital deductible.
Deemed wage credit. See Non-contributory or deemed wage credits.
Demographic assumptions. See Assumptions.
Diagnosis-related groups (DRGs). A classification system that
groups patients according to diagnosis, type of treatment, age, and
other relevant criteria. Under the inpatient hospital prospective
payment system, hospitals are paid a set fee for treating patients in a
single DRG category, regardless of the actual cost of care for the
individual.
Direct subsidy. The amount paid to the prescription drug plans
representing the difference between the plan’s risk-adjusted bid and
the beneficiary premium for basic coverage.
Disability. For Social Security purposes, the inability to engage in
substantial gainful activity by reason of any medically determinable
physical or mental impairment that can be expected to result in death
or to last for a continuous period of not less than 12 months. Special
rules apply for workers aged 55 or older whose disability is based on
blindness. The law generally requires that a person be disabled
Appendices
234
continuously for 5 months before he or she can qualify for a
disabled-worker cash benefit. An additional 24 months is necessary to
qualify for benefits under Medicare.
Disability Insurance (DI). See Old-Age, Survivors, and Disability
Insurance (OASDI).
Disabled enrollee. An individual under age 65 who has been entitled
to disability benefits under Title II of the Social Security Act or the
Railroad Retirement system for at least 2 years and who is enrolled in
HI or SMI.
Disproportionate share hospital (DSH). A hospital that serves a
significantly disproportionate number of low-income patients and
receives payments from Medicare to cover the costs of providing care
to uninsured patients.
DRG Coding. The DRG categories used by hospitals on discharge
billing. See also Diagnosis-related groups (DRGs).
Dual beneficiary. An individual who is eligible for both Medicare and
Medicaid.
Durable medical equipment (DME). Items such as iron lungs,
oxygen tents, hospital beds, wheelchairs, and seat lift mechanisms that
are used in the patient’s home and are either purchased or rented.
Earnings. Unless otherwise qualified, all wages from employment and
net earnings from self-employment, whether or not taxable or covered.
Economic assumptions. See Assumptions.
Economy-wide private nonfarm business multifactor
productivity. A measure of real output per combined unit of labor and
capital, reflecting the contributions of all factors of production for the
private nonfarm business sector of the economy.
End-stage renal disease (ESRD). Permanent kidney failure.
Excess general revenue Medicare funding. A determination that
occurs when the difference between outlays and dedicated funding
sources exceeds or is projected to exceed 45 percent of outlays.
Extended care services. In the context of this report, an alternate
name for skilled nursing facility services.
Glossary
235
Federal Insurance Contributions Act (FICA). Provision
authorizing taxes on the wages of employed persons to provide for
OASDI and HI. The tax is paid in equal amounts by covered workers
and their employers.
Financial interchange. Provisions of the Railroad Retirement Act
providing for transfers between the trust funds and the Social Security
Equivalent Benefit Account of the Railroad Retirement program in
order to place each trust fund in the same position as if railroad
employment had always been covered under Social Security.
Fiscal year. The accounting year of the U.S. Government. Since 1976,
each fiscal year has begun October 1 of the prior calendar year and
ended the following September 30. For example, fiscal year 2018 began
October 1, 2017 and will end September 30, 2018.
Fixed capital assets. The net worth of facilities and other resources.
Frequency distribution. An exhaustive list of possible outcomes for
a variable, and the associated probability of each outcome. The sum of
the probabilities of all possible outcomes from a frequency distribution
is 100 percent.
General fund of the Treasury. Funds held by the U.S. Treasury,
other than revenue collected for a specific trust fund (such as HI or
SMI) and maintained in a separate account for that purpose. The
majority of this fund is derived from individual and business income
taxes.
General revenue. Income to the HI and SMI trust funds from the
general fund of the Treasury. Only a very small percentage of total HI
trust fund income each year is attributable to general revenue.
Gross Domestic Product (GDP). The total dollar value of all goods
and services produced in a year in the United States, regardless of who
supplies the labor or property.
High-cost alternative. See Assumptions.
Hold-harmless provision. A provision limiting the dollar increase in
the Part B premium to the dollar increase in an individual’s Social
Security benefit. As a result, the person affected pays a lower Part B
premium, and the net amount of the individual’s Social Security
benefit does not decrease despite the greater increase in the premium.
Appendices
236
Home health agency (HHA). A public agency or private organization
that is primarily engaged in providing the following services in the
home: skilled nursing services, other therapeutic services (such as
physical, occupational, or speech therapy), and home health aide
services.
Hospice. A provider of care for the terminally ill; delivered services
generally include home health care, nursing care, physician services,
medical supplies, and short-term inpatient hospital care.
Hospital assumptions. These include differentials between hospital
labor and non-labor indices compared with general economy labor and
non-labor indices; rates of admission incidence; the trend toward
treating less complicated cases in outpatient settings; and continued
improvement in DRG coding.
Hospital coinsurance. For the 61st through 90th day of
hospitalization in a benefit period, a daily amount for which the
beneficiary is responsible, equal to one-fourth of the inpatient hospital
deductible; for lifetime reserve days, a daily amount for which the
beneficiary is responsible, equal to one-half of the inpatient hospital
deductible (see Lifetime reserve days).
Hospital input price index. An alternate name for hospital market
basket.
Hospital Insurance (HI). The Medicare trust fund that covers
specified inpatient hospital services, posthospital skilled nursing care,
home health services, and hospice care for aged and disabled
individuals who meet the eligibility requirements. Also known as
Medicare Part A.
Hospital market basket. The cost of the mix of goods and services
(including personnel costs but excluding nonoperating costs)
comprising routine, ancillary, and special care unit inpatient hospital
services.
Income rate. The ratio of HI income (including payroll taxes, income
from taxation of Social Security benefits, premiums, general revenue
transfers for uninsured beneficiaries, and monies from fraud and abuse
control activities, but excluding interest income) to taxable payroll for
the year.
Incurred basis. The costs based on when the service was performed
rather than when the payment was made.

Glossary
237
Infinite horizon. The period extending into the indefinite future.
Independent laboratory. A free-standing clinical laboratory
meeting conditions for participation in the Medicare program.
Initial coverage limit. The amount up to which the coinsurance
applies under the standard prescription drug benefit.
Inpatient hospital deductible. An amount of money that is
deducted from the amount payable by Medicare Part A for inpatient
hospital services furnished to a beneficiary during a spell of illness.
Inpatient hospital services. These services include bed and board,
nursing services, diagnostic or therapeutic services, and medical or
surgical services.
Interest. A payment for the use of money during a specified period.
Intermediate assumptions. See Assumptions.
Late enrollment penalty. Additional beneficiary premium amounts
for those who either do not enroll in Part D at the first opportunity or
fail to maintain other creditable coverage for more than 63 days.
Lifetime reserve days. Under HI, each beneficiary has 60 lifetime
reserve days that he or she may opt to use when regular inpatient
hospital benefits are exhausted. The beneficiary pays one-half of the
inpatient hospital deductible for each lifetime reserve day used.
Long range. The next 75 years.
Low-cost alternative. See Assumptions.
Low-income beneficiaries. Individuals meeting income and assets
tests who are eligible for prescription drug coverage subsidies to help
finance premiums and out-of-pocket payments.
Managed care. See Private Health Plans.
Market basket. See Hospital market basket.
Maximum tax base. Annual dollar amount above which earnings in
employment covered under HI are not taxable. In 1994, the maximum
tax base was eliminated under HI.
Maximum taxable amount of annual earnings. See Maximum tax
base.
Appendices
238
Medicare. A nationwide, federally administered health insurance
program authorized in 1965 under Title XVIII of the Social Security
Act to cover the cost of hospitalization, medical care, and some related
services for most people age 65 and over. In 1972, lawmakers extended
coverage to people receiving Social Security Disability Insurance
payments for 2 years and people with end-stage renal disease. (For
beneficiaries whose primary or secondary diagnosis is Amyotrophic
Lateral Sclerosis, the 2-year waiting period is waived.) In 2010, people
exposed to environmental health hazards within areas under a
corresponding emergency declaration became Medicare-eligible. In
2006, prescription drug coverage was added as well. Medicare consists
of two separate but coordinated trust funds: Hospital Insurance (HI, or
Part A) and Supplementary Medical Insurance (SMI). The SMI trust
fund comprises two separate accounts: the Part B account and the
Part D account. Almost all persons who are aged 65 and over or
disabled and who are entitled to HI are eligible to enroll in Part B and
Part D on a voluntary basis by paying monthly premiums.
Medicare Administrative Contractor (MAC). A private health
care insurer that processes Part A and Part B medical claims or DME
claims for fee-for-service beneficiaries.
Medicare Advantage (formerly called Medicare+Choice). An
expanded set of options, established by the Medicare Modernization
Act, for the delivery of health care under Medicare. Most Medicare
beneficiaries can choose to receive benefits through the original fee-for-
service program or through one of the following Medicare Advantage
plans: (i) coordinated care plans (such as health maintenance
organizations, provider-sponsored organizations, and preferred
provider organizations); (ii) medical savings account (MSA)/high-
deductible plans; (iii) private fee-for-service plans; or (iv) special needs
plans.
Medicare Advantage Prescription Drug Plan (MA-PD).
Prescription drug coverage provided by Medicare Advantage plans.
Medicare Advantage ratebook. A set of statutory capitation
payment rates, by county, originally used directly to establish
payments to private health insurance plans contracting with Medicare.
Under current law, the ratebook amounts are used as benchmarks,
against which plan costs are compared in the calculation of plan
payments.
Medicare Economic Index (MEI). An index often used in the
calculation of the increases in the prevailing charge levels that help to
Glossary
239
determine allowed charges for physician services. In 1992 and later,
this index is considered in connection with the update factor for the
physician fee schedule.
Medicare funding warning. A warning triggered when a
determination of excess general revenue Medicare funding has
occurred in 2 consecutive years. Such a warning requires the President
to submit to Congress, within 15 days after the date of the Budget
submission for the succeeding year, proposed legislation to respond to
the warning. The law also requires Congress to consider the legislation
proposed in response to Medicare funding warnings on an expedited
basis. See also Excess general revenue Medicare funding.
Medicare Payment Advisory Commission (MedPAC). A
commission established by Congress in the Balanced Budget Act of
1997 to replace the Prospective Payment Assessment Commission and
the Physician Payment Review Commission. MedPAC is directed to
provide the Congress with advice and recommendations on policies
affecting the Medicare program.
Medicare Prescription Drug Account. The separate account
within the SMI trust fund to manage revenues and expenditures of the
Part D drug benefit.
Medicare severity diagnosis-related groups (MS-DRGs). A
refinement of the diagnosis-related group classification system that
groups patients according to diagnosis, type of treatment, age, and
other relevant criteria. Under the inpatient hospital prospective
payment system, hospitals are paid a set fee for treating patients in a
single MS-DRG category, regardless of the actual cost of care for the
individual.
Merit-based incentive payment system (MIPS). A system for
adjusting payments under the Medicare physician fee schedule to non-
advanced APM providers based on metrics assessing provider quality,
resource use, meaningful use of electronic health records, and clinical
practice improvement activities.
Military service wage credits. Credits recognizing that military
personnel receive other cash payments and wages in kind (such as food
and shelter) in addition to their basic pay. Noncontributory wage
credits of $160 were provided for each month of active military service
from September 16, 1940 through December 31, 1956. For years after
1956, the basic pay of military personnel is covered under the Social
Security program on a contributory basis. In addition to contributory
Appendices
240
credits for basic pay, noncontributory wage credits of $300 were
granted for each calendar quarter in which a person received pay for
military service from January 1957 through December 1977. Deemed
wage credits of $100 were granted for each $300 of military wages, up
to a maximum of $1,200 per calendar year, from January 1978 through
December 2001. See also Quinquennial military service determinations
and adjustments.
National average monthly bid. The weighted average of all Part D
drug bids including all of the bids from PDPs and the drug portion of
bids from MA-PDs.
Noncontributory or deemed wage credits. Wages and wages in
kind that were not subject to the HI tax but are deemed as having been.
Deemed wage credits exist for the purposes of (i) determining HI
eligibility for individuals who might not be eligible for HI coverage
without payment of a premium were it not for the deemed wage credits
and (ii) calculating reimbursement due the HI trust fund from the
general fund of the Treasury. The first purpose applies in the case of
providing coverage to persons during the transitional periods when HI
began and when it was expanded to cover Federal employees; both
purposes apply in the cases of military service wage credits and
deemed wage credits granted for the internment of persons of Japanese
ancestry during World War II.
Old-Age, Survivors, and Disability Insurance (OASDI). The
Social Security programs that pay for (i) monthly cash benefits to
retired-worker (old-age) beneficiaries, their spouses and children, and
survivors of deceased insured workers (OASI); and (ii) monthly cash
benefits to disabled-worker beneficiaries and their spouses and
children, and for providing rehabilitation services to the disabled (DI).
Open-group population. Includes all persons who will ever
participate in the program as either taxpayers or beneficiaries, or both.
See also Closed-group population.
Outpatient hospital. Part of the hospital providing services covered
by SMI Part B, including, for example, services in an emergency room
or outpatient clinic, ambulatory surgical procedures, medical supplies
such as splints, and laboratory tests billed by the hospital.
Part A. The Medicare Hospital Insurance trust fund.
Part A premium. A monthly premium paid by or on behalf of
individuals who wish for and are entitled to voluntary enrollment in
Glossary
241
Medicare HI. These individuals are those who are aged 65 and older,
are uninsured for Social Security or Railroad Retirement, and do not
otherwise meet the requirements for entitlement to Part A. Disabled
individuals who have exhausted other entitlement are also qualified.
These individuals are those not now entitled but who have been
entitled under section 226(b) of the Social Security Act, who continue
to have the disabling impairment upon which their entitlement was
based, and whose entitlement ended solely because the individuals had
earnings that exceeded the substantial gainful activity amount (as
defined in section 223(d)(4) of the Social Security Act).
Part B. The account within the Medicare Supplementary Medical
Insurance trust fund that pays for a portion of the costs of physician
services, outpatient hospital services, and other related medical and
health services for voluntarily enrolled aged and disabled individuals.
Part B premium. The monthly amount paid by those individuals who
have voluntarily enrolled in Part B. Most enrollees pay the standard
premium amount, which currently represents approximately
25 percent of the average program costs for an aged beneficiary.
Beneficiaries with high income are also required to pay an income-
related monthly adjustment amount starting in 2007, and those who
enroll late are required to pay a penalty. In addition, beneficiaries who
are affected by the hold-harmless provision pay a lower premium. See
section V.E for more details about the Part B premium.
Part C. See Private health plans.
Part D. The account within the Medicare Supplementary Medical
Insurance trust fund that pays private plans to provide prescription
drug coverage.
Pay-as-you-go financing. A financing scheme in which taxes are
scheduled to produce just as much income as required to pay current
benefits, with trust fund assets built up only to the extent needed to
prevent depletion of the fund by random fluctuations.
Payroll taxes. Taxes levied on the gross wages of employees and net
earnings of self-employed workers.
PDP regions. Regional areas that are fully serviced by prescription
drug plans.
Peer Review Organization (PRO). A group of practicing physicians
and other health care professionals paid by the Federal Government to
Appendices
242
review the care given to Medicare patients. Starting in 2002, these
organizations are called Quality Improvement Organizations.
Percentile. A number that corresponds to one of the equal divisions
of the range of a variable in a given sample and that characterizes a
value of the variable as not exceeded by a specified percentage of all
the values in the sample. For example, a score higher than 97 percent
of those attained is said to be in the 97th percentile.
Prescription Drug Plans (PDPs). Stand-alone prescription drug
plans offered to beneficiaries in traditional fee-for-service Medicare
and to beneficiaries in Medicare Advantage plans that do not offer a
prescription drug benefit.
Present value. The present value of a future stream of payments is
the lump-sum amount that, if invested today, together with interest
earnings would be just enough to meet each of the payments as it fell
due. At the time of the last payment, the invested fund would be exactly
zero.
Private health plans. Plans offered by private companies that
contract with Medicare to provide coverage for Part A and Part B
services. Medicare Advantage plans, cost plans, and Program of All-
Inclusive Care for the Elderly (PACE) plans are all private health
plans.
Projection error. Degree of variation between estimated and actual
amounts.
Prospective payment system (PPS). A method of reimbursement in
which Medicare payment is made based on a predetermined, fixed
amount. The payment amount for a particular service is derived based
on the classification system of that service (for example, DRGs for
inpatient hospital services).
Provider. Any organization, institution, or individual who provides
health care services to Medicare beneficiaries. Hospitals (inpatient
services), skilled nursing facilities, home health agencies, and hospices
are the providers of services covered under Medicare Part A.
Physicians, ambulatory surgical centers, and outpatient clinics are
some of the providers of services covered under Medicare Part B.
Quality Improvement Organization (QIO). See Peer Review
Organization.
Glossary
243
Quinquennial military service determination and adjustments.
Prior to the Social Security Amendments of 1983, quinquennial
determinations (that is, estimates made once every 5 years) were made
of the costs arising from the granting of deemed wage credits for
military service prior to 1957; annual reimbursements were made from
the general fund of the Treasury to the HI trust fund for these costs.
The Social Security Amendments of 1983 provided for (i) a lump-sum
transfer in 1983 for (a) the costs arising from the pre-1957 wage credits
and (b) amounts equivalent to the HI taxes that would have been paid
on the deemed wage credits for military service for 1966 through 1983,
inclusive, if such credits had been counted as covered earnings;
(ii) quinquennial adjustments to the pre-1957 portion of the 1983
lump-sum transfer; (iii) general fund transfers equivalent to HI taxes
on military deemed wage credits for 1984 and later, to be credited to
the fund on July 1 of each year; and (iv) adjustments as deemed
necessary to any previously transferred amounts representing HI
taxes on military deemed wage credits.
Railroad Retirement. A Federal insurance program similar to Social
Security designed for workers in the railroad industry. The provisions
of the Railroad Retirement Act provide for a system of coordination and
financial interchange between the Railroad Retirement program and
the Social Security program.
Ratebook. See Medicare Advantage ratebook.
Real-wage differential. The difference between the percentage
increases, before rounding, in (i) the average annual wage in covered
employment and (ii) the average annual CPI.
Reasonable-cost basis. The calculation to determine the reasonable
cost incurred by individual providers when furnishing covered services
to beneficiaries. The reasonable cost is based on the actual cost of
providing such services, including direct and indirect costs of
providers, and excluding any costs that are unnecessary in the efficient
delivery of services covered by a health insurance program.
Reinsurance subsidy. Payments to the prescription drug plans in
the amount of 80 percent of drug expenses that exceed the annual out-
of-pocket threshold.
Residual factors. Factors other than price, including volume of
services, intensity of services, and age/sex changes.
Appendices
244
Risk corridor. Triggers that are set to protect Part D prescription
drug plans from unexpected losses and that allow the government to
share in unexpected gains.
Self-employment. Operation of a trade or business by an individual
or by a partnership in which an individual is a member.
Self-Employment Contributions Act (SECA). Provision
authorizing taxes on the net income of most self-employed persons to
provide for OASDI and HI.
Sequester. The reduction of funds to be used for benefits or
administrative costs from a Federal account, based on the legislated
requirements.
Short range. The next 10 years.
Skilled nursing facility (SNF). An institution that is primarily
engaged in providing skilled nursing care and related services for
residents who require medical or nursing care or that is engaged in the
rehabilitation of injured, disabled, or sick persons.
SNF coinsurance. For the 21st through 100th day of extended care
services in a benefit period, a daily amount for which the beneficiary is
responsible, equal to one-eighth of the inpatient hospital deductible.
Social Security Act. Public Law 74-271, enacted on August 14, 1935,
with subsequent amendments. The Social Security Act consists of
20 titles, four of which have been repealed. The HI and SMI trust funds
are authorized by Title XVIII of the Social Security Act.
Special public-debt obligation. Securities of the U.S. Government
issued exclusively to the OASI, DI, HI, and SMI trust funds and other
Federal trust funds. Sections 1817(c) and 1841(a) of the Social Security
Act provide that the public-debt obligations issued for purchase by the
HI and SMI trust funds, respectively, shall have maturities fixed with
due regard for the needs of the funds. The usual practice in the past
has been to spread the holdings of special issues, as of every June 30,
so that the amounts maturing in each of the next 15 years are
approximately equal. Special public-debt obligations are redeemable at
par at any time.
Spell of illness. A period of consecutive days, beginning with the first
day on which a beneficiary is furnished inpatient hospital or extended
care services, and ending with the close of the first period of
Glossary
245
60 consecutive days thereafter in which the beneficiary is in neither a
hospital nor a skilled nursing facility.
Standard prescription drug coverage. Part D prescription drug
coverage that includes a deductible, coinsurance up to an initial
coverage limit, and protection against high out-of-pocket expenditures
by having reduced coinsurance provisions for individuals exceeding the
out-of-pocket threshold.
Stochastic model. An analysis involving a random variable. For
example, a stochastic model may include a frequency distribution for
one assumption. From the frequency distribution, possible outcomes
for the assumption are selected randomly for use in an illustration.
Summarized cost rate. The ratio of the present value of expenditures
to the present value of the taxable payroll for the years in a given
period. The summarized cost rate includes the cost of reaching and
maintaining a target trust fund level, known as a contingency fund
ratio. Because a trust fund level of about 1 year’s expenditures is
considered to be an adequate reserve for unforeseen contingencies, the
targeted contingency fund ratio used in determining summarized cost
rates is 100 percent of annual expenditures. Accordingly, the
summarized cost rate is equal to the ratio of (i) the sum of the present
value of the outgo during the period, plus the present value of the
targeted ending trust fund level, plus the beginning trust fund amount,
to (ii) the present value of the taxable payroll during the period.
Summarized income rate. The ratio of the present value of HI
income (including payroll taxes, income from taxation of Social
Security benefits, premiums, general revenue transfers for uninsured
beneficiaries, and monies from fraud and abuse control activities, but
excluding interest income) incurred during a given period to the
present value of the taxable payroll for the years in the period.
Supplemental prescription drug coverage. Coverage in excess of
the standard prescription drug coverage.
Supplementary Medical Insurance (SMI). The Medicare trust
fund comprising the Part B account, the Part D account, and the
Transitional Assistance Account. The Part B account pays for a portion
of the costs of physician services, outpatient hospital services, and
other related medical and health services for voluntarily enrolled aged
and disabled individuals. The Part D account pays private plans to
provide prescription drug coverage, beginning in 2006. The
Appendices
246
Transitional Assistance Account paid for transitional assistance under
the prescription drug card program in 2004 and 2005.
Sustainable growth rate. A system for establishing goals for the rate
of growth in Medicare Part B expenditures for physician services. The
Medicare Access and CHIP Reauthorization Act of 2015 permanently
repealed the sustainable growth rate formula.
Tax rate. The percentage of taxable earnings, up to the maximum tax
base, that is paid for the HI tax. Currently, the percentages are 1.45
for employees and employers, each. The self-employed pay 2.9 percent.
There is an additional 0.9-percent tax on earnings above $200,000 (for
those who file an individual tax return) or $250,000 (for those who file
a joint income tax return).
Taxable earnings. Taxable wages and/or self-employment income
under the prevailing annual maximum taxable limit.
Taxable payroll. A weighted average of taxable wages and taxable
self-employment income. When multiplied by the combined employee-
employer tax rate, it yields the total amount of taxes incurred by
employees, employers, and the self-employed for work during the
period.
Taxable self-employment income. Net earnings from
self-employment—generally above $400 and below the annual
maximum taxable amount for a calendar or other taxable year—less
any taxable wages in the same taxable year.
Taxable wages. Wages paid for services rendered in covered
employment up to the annual maximum taxable amount.
Taxation of benefits. Beginning in 1994, up to 85 percent of an
individual’s or a couple’s OASDI benefits are potentially subject to
Federal income taxation under certain circumstances. The revenue
derived from taxation of benefits in excess of 50 percent, up to
85 percent, is allocated to the HI trust fund.
Taxes. See Payroll taxes.
Term insurance. A type of insurance that is in force for a specified
period of time.
Test of Long-Range Close Actuarial Balance. The conditions
required to meet this test are as follows: (i) The trust fund satisfies the
short-range test of financial adequacy; and (ii) the trust fund ratios
Glossary
247
stay above zero throughout the 75-year projection period, such that
benefits would be payable in a timely manner throughout the period.
This test is applied to HI trust fund projections made under the
intermediate assumptions.
Test of Short-Range Financial Adequacy. The conditions required
to meet this test are as follows: (i) If the trust fund ratio for a fund
exceeds 100 percent at the beginning of the projection period, then it
must be projected to remain at or above 100 percent throughout the
10-year projection period; (ii) alternatively, if the fund ratio is initially
less than 100 percent, it must be projected to reach a level of at least
100 percent within 5 years (and not be depleted at any time during this
period), and then remain at or above 100 percent throughout the rest
of the 10-year period. This test is applied to HI trust fund projections
made under the intermediate assumptions.
Transitional assistance. An interim benefit for 2004 and 2005 that
provided up to $600 per year to assist low-income beneficiaries who
had no drug insurance coverage with prescription drug purchases. This
benefit also paid the enrollment fee in the Medicare Prescription Drug
Discount Card program.
Transitional Assistance Account. The separate account within the
SMI trust fund that managed revenues and expenditures for the
transitional assistance drug benefit in 2004 and 2005.
Trust fund. Separate accounts in the U.S. Treasury, mandated by
Congress, whose assets may be used only for a specified purpose. For
the HI and SMI trust funds, monies not withdrawn for current benefit
payments and administrative expenses are invested in interest-
bearing Federal securities, as required by law; the interest earned is
also deposited in the trust funds.
Trust fund ratio. A short-range measure of the adequacy of the HI
and SMI trust fund level; defined as the assets at the beginning of the
year expressed as a percentage of the outgo during the year.
Uninsured beneficiaries. HI beneficiaries who do not have
40 quarters of covered earnings but are entitled to HI coverage either
because (i) they were deemed additional wage credits during the
transitional periods when the HI program began or when it was
expanded to cover Federal employees, or because (ii) they pay a
monthly premium that is intended to cover their full cost. See Part A
premium.
Appendices
248
Unit input intensity allowance. The amount added to, or subtracted
from, the hospital input price index to yield the prospective payment
system update factor.
Valuation period. A period of years that is considered as a unit for
purposes of calculating the status of a trust fund.
Voluntary enrollees. Certain individuals, aged 65 or older or
disabled, who are not otherwise entitled to Medicare and who opt to
obtain coverage under Part A by paying a monthly premium.
Year of depletion. The first year in which a trust fund is unable to
pay full benefits when due because the assets of the fund are depleted.
List of Tables
249
TABLES
II.B1.— Medicare Data for Calendar Year 2017 ............................... 11 II.C1.— Key Assumptions, 2042-2092 ............................................... 14 II.D1.— Components of Increase in Medicare Incurred
Expenditures by Part ............................................................ 21 II.E1.— Estimated Operations of the HI Trust Fund under
Intermediate Assumptions, Calendar Years 2017-2027 ..... 25 II.F1.— Estimated Operations of the SMI Trust Fund under
Intermediate Assumptions, Calendar Years 2017-2027 ..... 32 II.F2.— Average Annual Rates of Growth in SMI and the
Economy ................................................................................. 36 II.F3.— SMI General Revenues as a Percentage of Personal and
Corporate Federal Income Taxes ......................................... 39 III.B1.— Statement of Operations of the HI Trust Fund during
Calendar Year 2017 .............................................................. 45 III.B2.— Tax Rates and Maximum Tax Bases ................................... 47 III.B3.— Comparison of Actual and Estimated Operations of the
HI Trust Fund, Calendar Year 2017 .................................... 50 III.B4.— Operations of the HI Trust Fund during Calendar Years
1970-2027 ............................................................................... 54 III.B5.— Estimated Operations of the HI Trust Fund during
Calendar Years 2017-2027, under Alternative Sets of Assumptions .......................................................................... 57
III.B6.— Ratio of Assets at the Beginning of the Year to Expenditures during the Year for the HI Trust Fund ........ 59
III.B7.— HI Cost and Income Rates .................................................... 62 III.B8.— HI Actuarial Balances under Three Sets of Assumptions .. 67 III.B9.— Components of 75-Year HI Actuarial Balance under
Intermediate Assumptions (2018-2092) .............................. 68 III.B10.— Change in the 75-Year Actuarial Balance since the
2017 Report............................................................................ 72 III.B11.— Estimated HI Income Rates, Cost Rates, and Actuarial
Balances, Based on Intermediate Estimates with Various Real-Wage Assumptions ......................................... 74
III.B12.— Estimated HI Income Rates, Cost Rates, and Actuarial Balances, Based on Intermediate Estimates with Various CPI-Increase Assumptions ..................................... 75
III.B13.— Estimated HI Income Rates, Cost Rates, and Actuarial Balances, Based on Intermediate Estimates with Various Real-Interest Assumptions ..................................... 76
III.B14.— Estimated HI Income Rates, Cost Rates, and Actuarial Balances, Based on Intermediate Estimates with Various Health Care Cost Growth Rate Assumptions ....... 77
III.C1.— Statement of Operations of the Part B Account in the SMI Trust Fund during Calendar Year 2017 ...................... 78
III.C2.— Standard Part B Monthly Premium Rates, Actuarial Rates, and Premium Rates as a Percentage of Part B Cost ........................................................................................ 81
List of Tables
250
III.C3.— Comparison of Actual and Estimated Operations of the Part B Account in the SMI Trust Fund, Calendar Year 2017 ........................................................................................ 84
III.C4.— Operations of the Part B Account in the SMI Trust Fund (Cash Basis) during Calendar Years 1970-2027 ....... 87
III.C5.— Growth in Part B Benefits (Cash Basis) through December 31, 2027 ................................................................ 89
III.C6.— Estimated Operations of the Part B Account in the SMI Trust Fund during Calendar Years 2017-2027, under Alternative Sets of Assumptions .......................................... 90
III.C7.— Estimated Part B Income and Expenditures (Incurred Basis) for Financing Periods through December 31, 2018 ........................................................................................ 93
III.C8.— Summary of Estimated Part B Assets and Liabilities as of the End of the Financing Period, for Periods through December 31, 2018 ................................................................ 94
III.C9.— Actuarial Status of the Part B Account in the SMI Trust Fund under Three Cost Sensitivity Scenarios for Financing Periods through December 31, 2018 .................. 96
III.C10.— Part B Expenditures (Incurred Basis) as a Percentage of the Gross Domestic Product ............................................. 97
III.D1.— Statement of Operations of the Part D Account in the SMI Trust Fund during Calendar Year 2017 ...................... 99
III.D2.— Comparison of Actual and Estimated Operations of the Part D Account in the SMI Trust Fund, Calendar Year 2017 ...................................................................................... 102
III.D3.— Operations of the Part D Account in the SMI Trust Fund (Cash Basis) during Calendar Years 2004-2027 ..... 105
III.D4.— Growth in Part D Benefits (Cash Basis) through December 31, 2027 .............................................................. 107
III.D5.— Estimated Operations of the Part D Account in the SMI Trust Fund during Calendar Years 2017-2027, under Alternative Sets of Assumptions ........................................ 109
III.D6.— Part D Expenditures (Incurred Basis) as a Percentage of the Gross Domestic Product ........................................... 112
IV.A1.— Components of Historical and Projected Increases in HI Inpatient Hospital Payments ............................................. 116
IV.A2.— Relationship between Increases in HI Expenditures and Increases in Taxable Payroll .............................................. 120
IV.A3.— Aggregate Part A Reimbursement Amounts on an Incurred Basis ..................................................................... 123
IV.A4.— Summary of HI Alternative Projections ............................ 124 IV.B1.— Increases in Total Allowed Charges per Fee-for-Service
Enrollee for Practitioner Services ...................................... 129 IV.B2.— Incurred Reimbursement Amounts per Fee-for-Service
Enrollee for Practitioner Services ...................................... 130 IV.B3.— Increases Costs per Fee-for-Service Enrollee for
Institutional Services .......................................................... 133
List of Tables
251
IV.B4.— Incurred Reimbursement Amounts per Fee-for-Service Enrollee for Institutional Services ..................................... 134
IV.B5.— Fee-for-Service Enrollment and Incurred Reimbursement for Beneficiaries under Age 65 with End-Stage Renal Disease .................................................... 135
IV.B6.— Aggregate Part B Reimbursement Amounts on an Incurred Basis ..................................................................... 137
IV.B7.— Part D Enrollment .............................................................. 141 IV.B8.— Key Factors for Part D Expenditure Estimates ................ 143 IV.B9.— Incurred Reimbursement Amounts per Enrollee for
Part D Expenditures ........................................................... 145 IV.B10.— Aggregate Part D Reimbursements on an Incurred
Basis ..................................................................................... 145 IV.B11.— Part D Assumptions under Alternative Scenarios for
Calendar Years 2017-2027 ................................................. 147 IV.C1.— Private Health Plan Enrollment ........................................ 151 IV.C2.— Medicare Payments to Private Health Plans, by Trust
Fund ..................................................................................... 155 IV.C3.— Incurred Expenditures per Private Health Plan
Enrollee ................................................................................ 156 V.B1.— Total Medicare Income, Expenditures, and Trust Fund
Assets during Calendar Years 1970-2027 ......................... 177 V.B2.— Hl and SMI Incurred Expenditures as a Percentage of
the Gross Domestic Product ............................................... 179 V.B3.— Medicare Enrollment .......................................................... 181 V.B4.— Medicare Sources of Income as a Percentage of Total
Non-Interest Income ........................................................... 182 V.B5.— Comparative Growth Rates of Medicare, Private Health
Insurance, National Health Expenditures, and GDP ....... 185 V.D1.— HI and SMI Average per Beneficiary Costs ...................... 194 V.E1.— HI Cost-Sharing and Premium Amounts .......................... 197 V.E2.— SMI Cost-Sharing and Premium Amounts ....................... 198 V.E3.— Part B Income-Related Monthly Premium Amounts ........ 199 V.E4.— Part D Income-Related Monthly Premium Adjustment
Amounts ............................................................................... 201 V.F1.— Annual Revenues and Expenditures for Medicare and
Social Security Trust Funds and the Total Federal Budget, Fiscal Year 2017 .................................................... 205
V.F2.— Present Values of Projected Revenue and Cost Components of 75-Year Open-Group Obligations for HI, SMI, and OASDI ................................................................. 207
V.G1.— Unfunded HI Obligations from Program Inception through the Infinite Horizon .............................................. 211
V.G2.— Unfunded HI Obligations for Current and Future Program Participants through the Infinite Horizon ......... 212
V.G3.— Unfunded Part B Obligations from Program Inception through the Infinite Horizon .............................................. 213
V.G4.— Unfunded Part B Obligations for Current and Future Program Participants through the Infinite Horizon ......... 214
List of Tables
252
V.G5.— Unfunded Part D Obligations from Program Inception through the Infinite Horizon .............................................. 215
V.G6.— Unfunded Part D Obligations for Current and Future Program Participants through the Infinite Horizon ......... 216
V.H1.— Statement of Operations of the HI Trust Fund during Fiscal Year 2017 .................................................................. 217
V.H2.— Statement of Operations of the Part B Account in the SMI Trust Fund during Fiscal Year 2017 ......................... 218
V.H3.— Statement of Operations of the Part D Account in the SMI Trust Fund during Fiscal Year 2017 ......................... 220
V.H4.— Total Medicare Income, Expenditures, and Trust Fund Assets during Fiscal Years 1970-2027 ............................... 221
V.H5.— Operations of the HI Trust Fund during Fiscal Years 1970-2027 ............................................................................. 222
V.H6.— Operations of the SMI Trust Fund (Cash Basis) during Fiscal Years 1970-2027 ....................................................... 224
V.H7.— Operations of the Part B Account in the SMI Trust Fund (Cash Basis) during Fiscal Years 1970-2027 ........... 225
V.H8.— Operations of the Part D Account in the SMI Trust Fund (Cash Basis) during Fiscal Years 2004-2027 ........... 226
V.H9.— Assets of the HI Trust Fund, by Type, at the End of Fiscal Years 2016 and 2017 ................................................ 227
V.H10.— Assets of the SMI Trust Fund, by Type, at the End of Fiscal Years 2016 and 2017 ................................................ 228
List of Figures
253
FIGURES
I.1.— Medicare Expenditures as a Percentage of the Gross Domestic Product under Current Law and Illustrative Alternative Projections ........................................................... 5
II.D1.— Medicare Expenditures as a Percentage of the Gross Domestic Product .................................................................. 20
II.D2.— Medicare Sources of Non-Interest Income and Expenditures as a Percentage of the Gross Domestic Product ................................................................................... 22
II.E1.— HI Trust Fund Balance at Beginning of Year as a Percentage of Annual Expenditures .................................... 26
II.E2.— Long-Range HI Non-Interest Income and Cost as a Percentage of Taxable Payroll, Intermediate Assumptions .......................................................................... 29
II.F1.— SMI Expenditures and Premiums as a Percentage of the Gross Domestic Product ........................................................ 35
II.F2.— Comparison of Average Monthly SMI Benefits, Premiums, and Cost Sharing to the Average Monthly Social Security Benefit .......................................................... 37
III.B1.— HI Expenditures and Income ............................................... 51 III.B2.— HI Trust Fund Balance at the Beginning of the Year as
a Percentage of Annual Expenditures ................................. 60 III.B3.— Estimated HI Cost and Income Rates as a Percentage of
Taxable Payroll ..................................................................... 63 III.B4.— Workers per HI Beneficiary .................................................. 65 III.B5.— Present Value of Cumulative HI Taxes Less
Expenditures through Year Shown, Evaluated under Current-Law Tax Rates and Legislated Expenditures ....... 69
III.B6.— Comparison of HI Cost and Income Rate Projections: Current versus Prior Year’s Reports ................................... 70
III.C1.— Part B Aged and Disabled Monthly Per Capita Income ..... 82 III.C2.— Premium Income as a Percentage of Part B
Expenditures ......................................................................... 88 III.C3.— Actuarial Status of the Part B Account in the SMI Trust
Fund through Calendar Year 2018 ...................................... 96 III.C4.— Comparison of Part B Projections as a Percentage of the
Gross Domestic Product: Current versus Prior Year’s Reports ................................................................................... 98
III.D1.— Comparison of Part D Projections as a Percentage of the Gross Domestic Product: Current versus Prior Year’s Reports ................................................................................. 113
V.B1.— Projected Difference between Total Medicare Outlays and Dedicated Financing Sources, as a Percentage of Total Outlays ....................................................................... 184
V.C1.— Medicare Expenditures as a Percentage of the Gross Domestic Product under Current Law and Illustrative Alternative Projections ....................................................... 191
Appendices
254
J. STATEMENT OF ACTUARIAL OPINION
It is my opinion that (1) the techniques and methodology used herein to evaluate the financial status of the Federal Hospital Insurance Trust Fund and the Federal Supplementary Medical Insurance Trust Fund are based upon sound principles of actuarial practice and are generally accepted within the actuarial profession; and (2) with the important caveats noted below, the principal assumptions used and the resulting actuarial estimates are, individually and in the aggregate, reasonable for the purpose of evaluating the financial status of the trust funds under current law, taking into consideration the past experience and future expectations for the population, the economy, and the program. I am a member of the American Academy of Actuaries and I meet the Qualification Standards of the American Academy of Actuaries to render the actuarial opinion contained herein.
The annual reports of the Board of Trustees and the accompanying Actuarial Opinions have cautioned for a number of years about the challenges of adhering to current-law Medicare payment updates. For physician services, current law specifies payment rate updates that are expected to be lower than overall inflation and not keep up with underlying physician costs. For most categories of non-physician health services, current law specifies that annual price updates be adjusted downward each year by the growth in economy-wide productivity. Sustaining these price reductions will be challenging for health care providers, as the best available evidence indicates that most providers cannot improve their productivity to this degree for a prolonged period given the labor-intensive nature of these services. Should these price updates prove to be inadequate, beneficiaries’ access to and the quality of Medicare benefits would deteriorate over time, or future legislation would need to be enacted that would likely increase program costs beyond those projected under current law in this report.
For more information, I encourage readers to review the illustrative alternative projection, which provides the potential magnitude of the understatement of Medicare costs relative to the current-law projections.108
Paul Spitalnic
Associate, Society of Actuaries
Member, American Academy of Actuaries
Chief Actuary, Centers for Medicare & Medicaid Services
108See http://www.cms.gov/Research-Statistics-Data-and-Systems/Statistics-Trends-
and-Reports/ReportsTrustFunds/Downloads/2018TRAlternativeScenario.pdf.