Embed Size (px)
Citation preview
2017-18 School Accountability Report Card for Juan Cabrillo Middle School Page 1 of 12
Juan Cabrillo Middle School
School Accountability Report Card
Reported Using Data from the 2017-18 School Year
Published During 2018-19
By February 1 of each year, every school in California is required by state law to publish a School Accountability Report Card (SARC). The SARC contains information about the condition and performance of each California public school. Under the Local Control Funding Formula (LCFF) all local educational agencies (LEAs) are required to prepare a Local Control and Accountability Plan (LCAP), which describes how they intend to meet annual school-specific goals for all pupils, with specific activities to address state and local priorities. Additionally, data reported in an LCAP is to be consistent with data reported in the SARC. • For more information about SARC requirements, see the California Department of Education (CDE) SARC Web page at
http://www.cde.ca.gov/ta/ac/sa/. • For more information about the LCFF or LCAP, see the CDE LCFF Web page at http://www.cde.ca.gov/fg/aa/lc/. • For additional information about the school, parents/guardians and community members should contact the school principal or
the district office. DataQuest DataQuest is an online data tool located on the CDE DataQuest Web page at http://dq.cde.ca.gov/dataquest/ that contains additional information about this school and comparisons of the school to the district and the county. Specifically, DataQuest is a dynamic system that provides reports for accountability (e.g., test data, enrollment, high school graduates, dropouts, course enrollments, staffing, and data regarding English learners). Internet Access Internet access is available at public libraries and other locations that are publicly accessible (e.g., the California State Library). Access to the Internet at libraries and public locations is generally provided on a first-come, first-served basis. Other use restrictions may include the hours of operation, the length of time that a workstation may be used (depending on availability), the types of software programs available on a workstation, and the ability to print documents.
About This School Contact Information (School Year 2018-19)
School Contact Information
School Name------- Juan Cabrillo Middle School
Street------- 2550 Cabrillo Avenue
City, State, Zip------- Santa Clara CA, 95051
Phone Number------- (408) 423-3700
Principal------- Stan Garber
E-mail Address------- [email protected]
Web Site------- www.cabrillo-scusd-ca.schoolloop.com
CDS Code 43-69674-6048854
2017-18 School Accountability Report Card for Juan Cabrillo Middle School Page 2 of 12
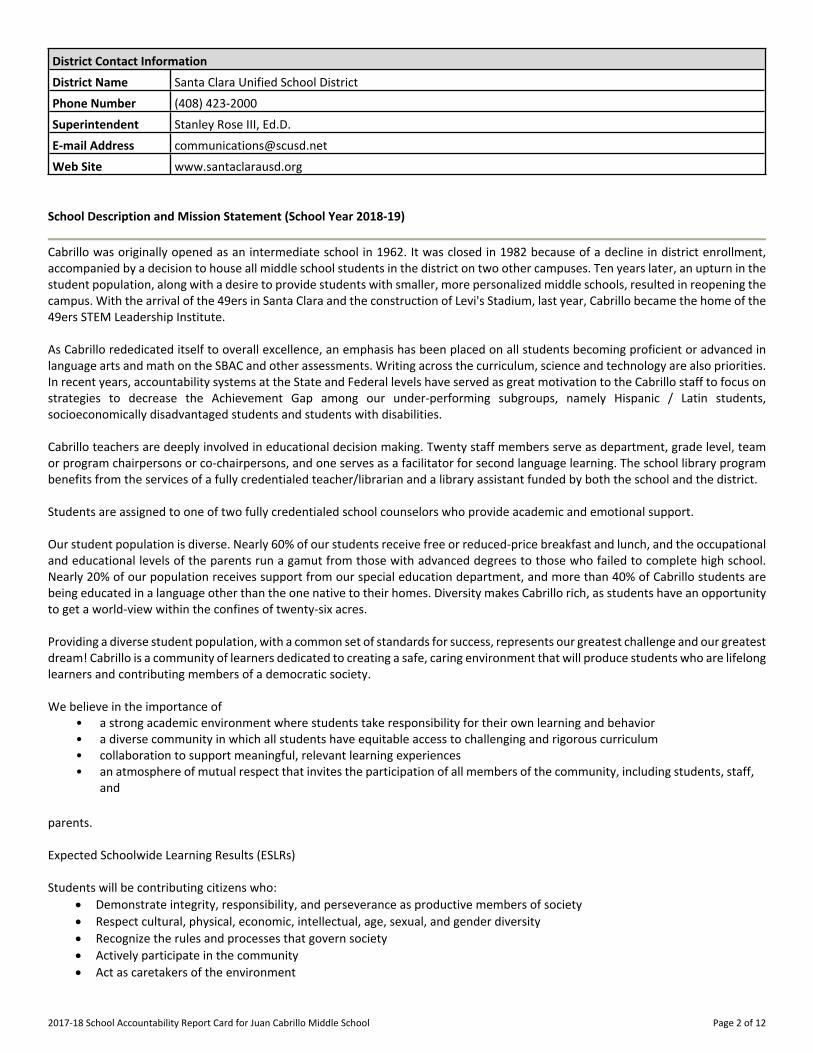
District Contact Information
District Name------- Santa Clara Unified School District
Phone Number------- (408) 423-2000
Superintendent-------
Stanley Rose III, Ed.D.
E-mail Address------- [email protected]
Web Site------- www.santaclarausd.org School Description and Mission Statement (School Year 2018-19)
Cabrillo was originally opened as an intermediate school in 1962. It was closed in 1982 because of a decline in district enrollment, accompanied by a decision to house all middle school students in the district on two other campuses. Ten years later, an upturn in the student population, along with a desire to provide students with smaller, more personalized middle schools, resulted in reopening the campus. With the arrival of the 49ers in Santa Clara and the construction of Levi's Stadium, last year, Cabrillo became the home of the 49ers STEM Leadership Institute. As Cabrillo rededicated itself to overall excellence, an emphasis has been placed on all students becoming proficient or advanced in language arts and math on the SBAC and other assessments. Writing across the curriculum, science and technology are also priorities. In recent years, accountability systems at the State and Federal levels have served as great motivation to the Cabrillo staff to focus on strategies to decrease the Achievement Gap among our under-performing subgroups, namely Hispanic / Latin students, socioeconomically disadvantaged students and students with disabilities. Cabrillo teachers are deeply involved in educational decision making. Twenty staff members serve as department, grade level, team or program chairpersons or co-chairpersons, and one serves as a facilitator for second language learning. The school library program benefits from the services of a fully credentialed teacher/librarian and a library assistant funded by both the school and the district. Students are assigned to one of two fully credentialed school counselors who provide academic and emotional support. Our student population is diverse. Nearly 60% of our students receive free or reduced-price breakfast and lunch, and the occupational and educational levels of the parents run a gamut from those with advanced degrees to those who failed to complete high school. Nearly 20% of our population receives support from our special education department, and more than 40% of Cabrillo students are being educated in a language other than the one native to their homes. Diversity makes Cabrillo rich, as students have an opportunity to get a world-view within the confines of twenty-six acres. Providing a diverse student population, with a common set of standards for success, represents our greatest challenge and our greatest dream! Cabrillo is a community of learners dedicated to creating a safe, caring environment that will produce students who are lifelong learners and contributing members of a democratic society. We believe in the importance of
• a strong academic environment where students take responsibility for their own learning and behavior • a diverse community in which all students have equitable access to challenging and rigorous curriculum • collaboration to support meaningful, relevant learning experiences • an atmosphere of mutual respect that invites the participation of all members of the community, including students, staff,
and
parents. Expected Schoolwide Learning Results (ESLRs) Students will be contributing citizens who:
Demonstrate integrity, responsibility, and perseverance as productive members of society Respect cultural, physical, economic, intellectual, age, sexual, and gender diversity Recognize the rules and processes that govern society Actively participate in the community Act as caretakers of the environment
2017-18 School Accountability Report Card for Juan Cabrillo Middle School Page 3 of 12
Students will be effective communicators who: Speak with clarity of meaning and listen to understand Read and comprehend a variety of materials Convey information and ideas in written and visual form
Students will be informed, productive thinkers who: Use creative and critical thinking skills Use diverse strategies in solving problems, making decisions and evaluating results and applying them in real life situations
Students will be self-directed learners who: Set priorities, plan and take action to accomplish goals Manage time and resources efficiently and independently Take on challenges and accept responsibility for making choices
Students will be collaborative workers who: Perform a variety of roles within a team Develop high-quality products and services Evaluate effectiveness and apply results to improve performance
Students will be information processors who: Select a variety of resources, including technology, to research and access information Choose the most effective tools to organize, evaluate and apply information
The Cabrillo staff seek to provide students with an education that addresses the more than one thousand middle school content standards that the State of California has established. Staff members have worked with other school district personnel in defining the subject area essentials and in developing instructional activities that have proven to be effective. Specific strategies for delivering instruction rely upon Gardner's identification of multiple intelligences, differentiated instruction, the identification of essential questions and enduring understandings, Blooms Taxonomy, the major elements of clinical supervision, and sequenced lessons. We strongly believe that the educational needs of students are best met in classrooms where students with varying educational abilities are able to share their strengths and interests. This heterogeneous approach to grouping poses challenges for all students and teachers, yet the benefits outweigh those challenges. Santa Clara Unified School District is a Program Improvement (PI) local educational agency (LEA) in Year 3, corrective action for the 2013-14 school year. The Elementary and Secondary Education Act (ESEA)/The No Child Left Behind (NCLB) Act of 2001 requires the California Department of Education (CDE) to annually review the student academic performance in English Language Arts (ELA) and Mathematics of each LEA that receives funds under Title I, Part A. An LEA is identified as PI if it fails to meet yearly student performance goals, known as Adequate Yearly Progress (AYP), for two consecutive years. SCUSD has been identified as requiring a “moderate” level or corrective action support for 2013-14. Corrective action is the collective name given to the steps an LEA must take that substantially and directly respond to instructional, managerial, and organizational challenges in the LEA and that will lead to students achieving proficiency in the core academic subjects of ELA and Mathematics. The California State Board of Education has determined that the Santa Clara Unified School District must take the following corrective actions, which we have already begun: * Institute and fully implement an SBE-adopted/standards-aligned curriculum in ELA and Mathematics * Access technical assistance to analyze the needs of the district and its schools * Revise the LEA Plan to document steps to fully implement the SBE assigned corrective action
2017-18 School Accountability Report Card for Juan Cabrillo Middle School Page 4 of 12
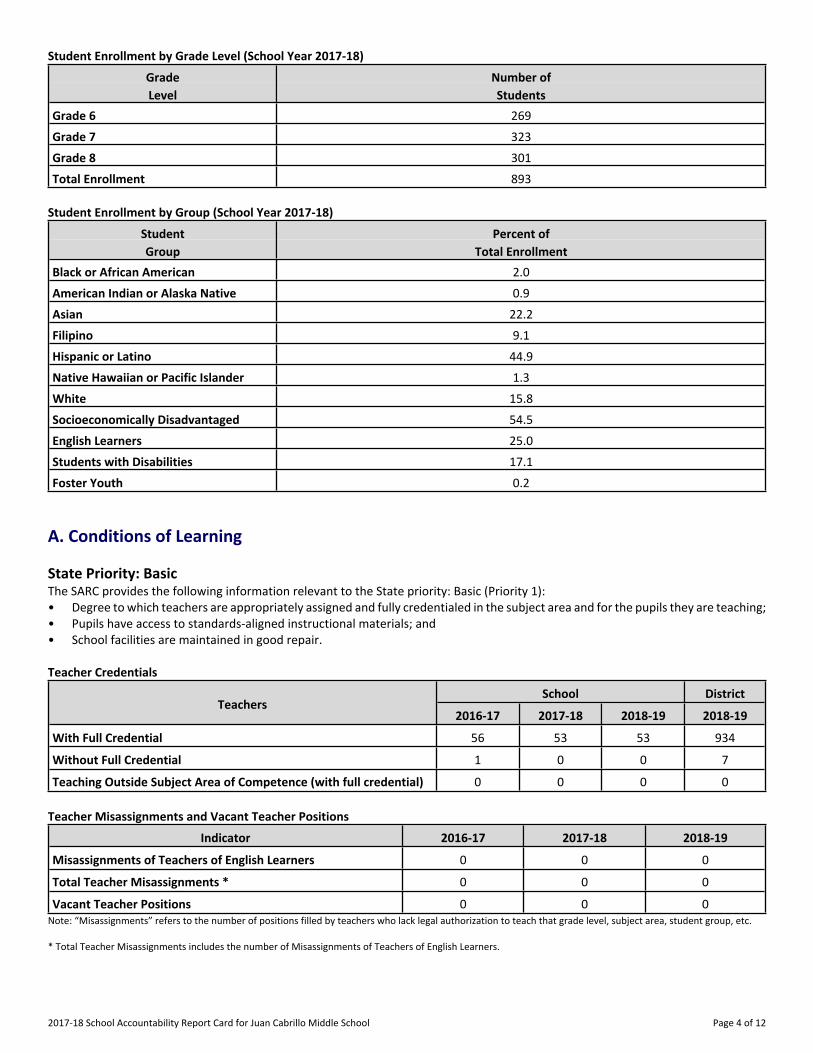
Student Enrollment by Grade Level (School Year 2017-18)
Grade Number of Level Students
Grade 6 269
Grade 7 323
Grade 8 301
Total Enrollment 893 Student Enrollment by Group (School Year 2017-18)
Student Percent of Group Total Enrollment
Black or African American 2.0
American Indian or Alaska Native 0.9
Asian 22.2
Filipino 9.1
Hispanic or Latino 44.9
Native Hawaiian or Pacific Islander 1.3
White 15.8
Socioeconomically Disadvantaged 54.5
English Learners 25.0
Students with Disabilities 17.1
Foster Youth 0.2
A. Conditions of Learning State Priority: Basic The SARC provides the following information relevant to the State priority: Basic (Priority 1): • Degree to which teachers are appropriately assigned and fully credentialed in the subject area and for the pupils they are teaching; • Pupils have access to standards-aligned instructional materials; and • School facilities are maintained in good repair. Teacher Credentials
School District Teachers
2016-17 2017-18 2018-19 2018-19
With Full Credential 56 53 53 934
Without Full Credential 1 0 0 7
Teaching Outside Subject Area of Competence (with full credential) 0 0 0 0 Teacher Misassignments and Vacant Teacher Positions
Indicator 2016-17 2017-18 2018-19
Misassignments of Teachers of English Learners 0 0 0
Total Teacher Misassignments * 0 0 0
Vacant Teacher Positions 0 0 0 Note: “Misassignments” refers to the number of positions filled by teachers who lack legal authorization to teach that grade level, subject area, student group, etc. * Total Teacher Misassignments includes the number of Misassignments of Teachers of English Learners.
2017-18 School Accountability Report Card for Juan Cabrillo Middle School Page 5 of 12
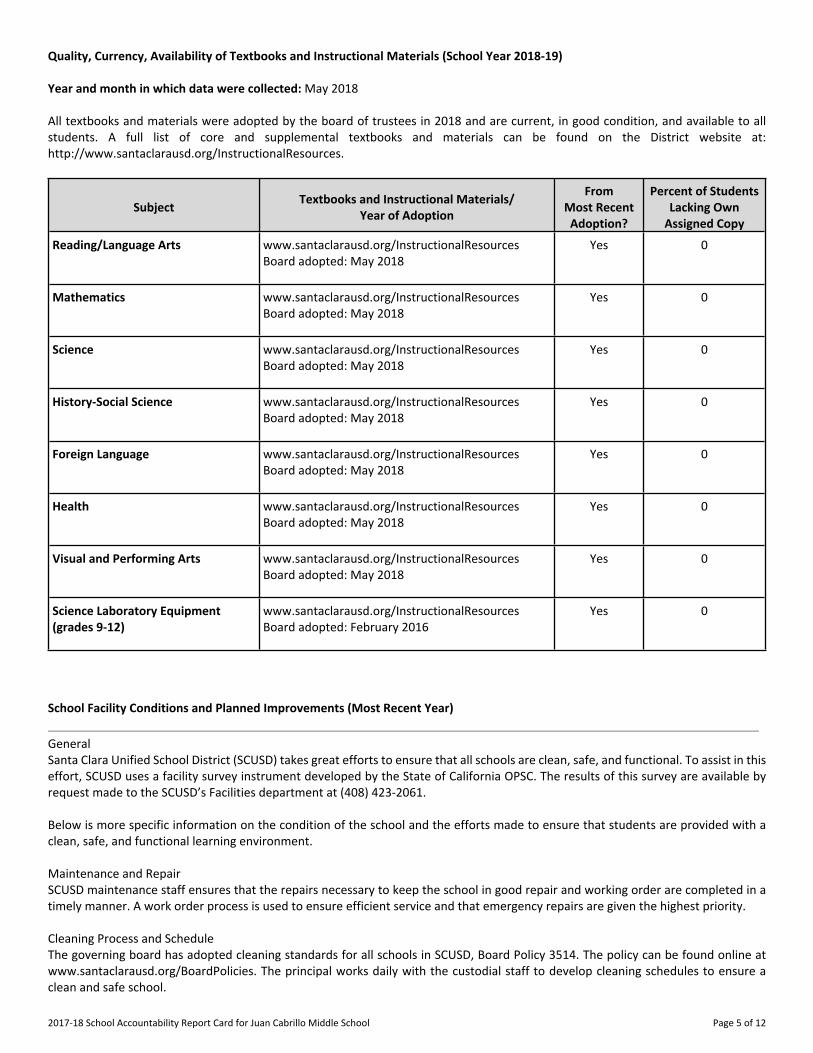
Quality, Currency, Availability of Textbooks and Instructional Materials (School Year 2018-19) Year and month in which data were collected: May 2018 All textbooks and materials were adopted by the board of trustees in 2018 and are current, in good condition, and available to all students. A full list of core and supplemental textbooks and materials can be found on the District website at: http://www.santaclarausd.org/InstructionalResources.
Subject Textbooks and Instructional Materials/ Year of Adoption
From Most Recent
Adoption?
Percent of Students Lacking Own
Assigned Copy
Reading/Language Arts www.santaclarausd.org/InstructionalResources Board adopted: May 2018
Yes 0
Mathematics www.santaclarausd.org/InstructionalResources Board adopted: May 2018
Yes 0
Science www.santaclarausd.org/InstructionalResources Board adopted: May 2018
Yes 0
History-Social Science www.santaclarausd.org/InstructionalResources Board adopted: May 2018
Yes 0
Foreign Language www.santaclarausd.org/InstructionalResources Board adopted: May 2018
Yes 0
Health www.santaclarausd.org/InstructionalResources Board adopted: May 2018
Yes 0
Visual and Performing Arts www.santaclarausd.org/InstructionalResources Board adopted: May 2018
Yes 0
Science Laboratory Equipment (grades 9-12)
www.santaclarausd.org/InstructionalResources Board adopted: February 2016
Yes 0
School Facility Conditions and Planned Improvements (Most Recent Year)
General Santa Clara Unified School District (SCUSD) takes great efforts to ensure that all schools are clean, safe, and functional. To assist in this effort, SCUSD uses a facility survey instrument developed by the State of California OPSC. The results of this survey are available by request made to the SCUSD’s Facilities department at (408) 423-2061. Below is more specific information on the condition of the school and the efforts made to ensure that students are provided with a clean, safe, and functional learning environment. Maintenance and Repair SCUSD maintenance staff ensures that the repairs necessary to keep the school in good repair and working order are completed in a timely manner. A work order process is used to ensure efficient service and that emergency repairs are given the highest priority. Cleaning Process and Schedule The governing board has adopted cleaning standards for all schools in SCUSD, Board Policy 3514. The policy can be found online at www.santaclarausd.org/BoardPolicies. The principal works daily with the custodial staff to develop cleaning schedules to ensure a clean and safe school.
2017-18 School Accountability Report Card for Juan Cabrillo Middle School Page 6 of 12
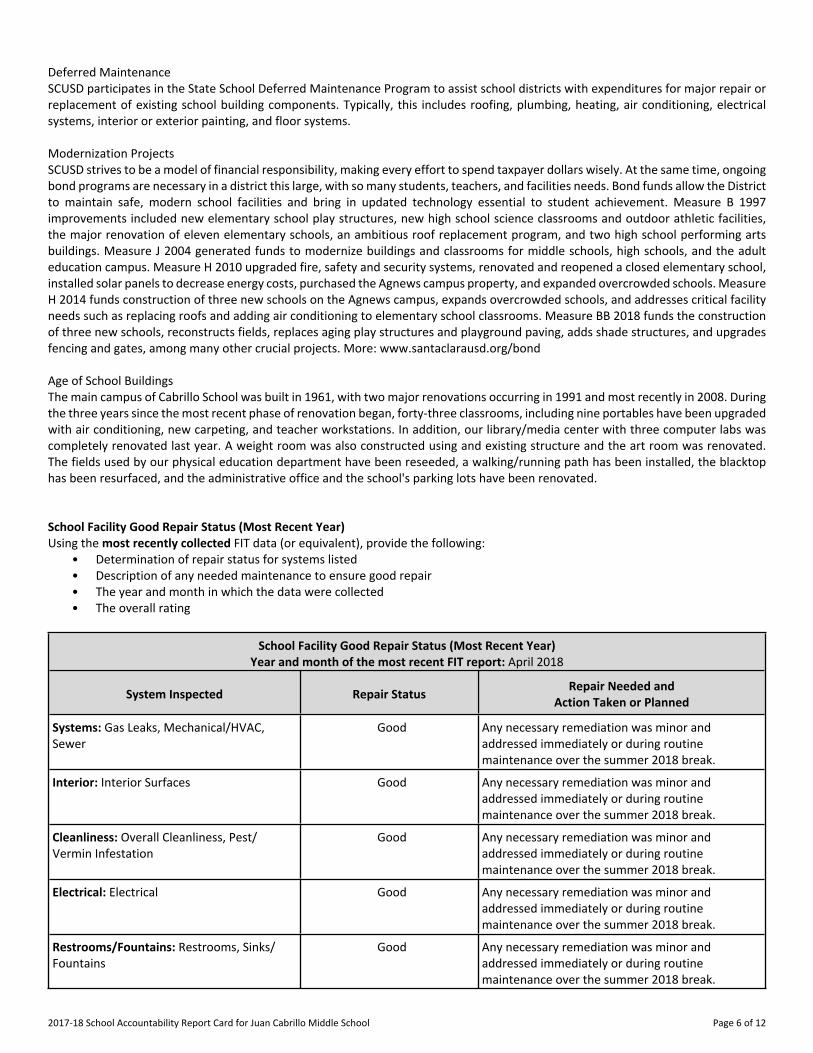
Deferred Maintenance SCUSD participates in the State School Deferred Maintenance Program to assist school districts with expenditures for major repair or replacement of existing school building components. Typically, this includes roofing, plumbing, heating, air conditioning, electrical systems, interior or exterior painting, and floor systems. Modernization Projects SCUSD strives to be a model of financial responsibility, making every effort to spend taxpayer dollars wisely. At the same time, ongoing bond programs are necessary in a district this large, with so many students, teachers, and facilities needs. Bond funds allow the District to maintain safe, modern school facilities and bring in updated technology essential to student achievement. Measure B 1997 improvements included new elementary school play structures, new high school science classrooms and outdoor athletic facilities, the major renovation of eleven elementary schools, an ambitious roof replacement program, and two high school performing arts buildings. Measure J 2004 generated funds to modernize buildings and classrooms for middle schools, high schools, and the adult education campus. Measure H 2010 upgraded fire, safety and security systems, renovated and reopened a closed elementary school, installed solar panels to decrease energy costs, purchased the Agnews campus property, and expanded overcrowded schools. Measure H 2014 funds construction of three new schools on the Agnews campus, expands overcrowded schools, and addresses critical facility needs such as replacing roofs and adding air conditioning to elementary school classrooms. Measure BB 2018 funds the construction of three new schools, reconstructs fields, replaces aging play structures and playground paving, adds shade structures, and upgrades fencing and gates, among many other crucial projects. More: www.santaclarausd.org/bond Age of School Buildings The main campus of Cabrillo School was built in 1961, with two major renovations occurring in 1991 and most recently in 2008. During the three years since the most recent phase of renovation began, forty-three classrooms, including nine portables have been upgraded with air conditioning, new carpeting, and teacher workstations. In addition, our library/media center with three computer labs was completely renovated last year. A weight room was also constructed using and existing structure and the art room was renovated. The fields used by our physical education department have been reseeded, a walking/running path has been installed, the blacktop has been resurfaced, and the administrative office and the school's parking lots have been renovated. School Facility Good Repair Status (Most Recent Year) Using the most recently collected FIT data (or equivalent), provide the following:
• Determination of repair status for systems listed • Description of any needed maintenance to ensure good repair • The year and month in which the data were collected • The overall rating
School Facility Good Repair Status (Most Recent Year) Year and month of the most recent FIT report: April 2018
System Inspected Repair Status Repair Needed and Action Taken or Planned
Systems: Gas Leaks, Mechanical/HVAC, Sewer
XGood Any necessary remediation was minor and addressed immediately or during routine maintenance over the summer 2018 break.
Interior: Interior Surfaces XGood Any necessary remediation was minor and addressed immediately or during routine maintenance over the summer 2018 break.
Cleanliness: Overall Cleanliness, Pest/ Vermin Infestation
XGood Any necessary remediation was minor and addressed immediately or during routine maintenance over the summer 2018 break.
Electrical: Electrical XGood Any necessary remediation was minor and addressed immediately or during routine maintenance over the summer 2018 break.
Restrooms/Fountains: Restrooms, Sinks/ Fountains
XGood Any necessary remediation was minor and addressed immediately or during routine maintenance over the summer 2018 break.
2017-18 School Accountability Report Card for Juan Cabrillo Middle School Page 7 of 12
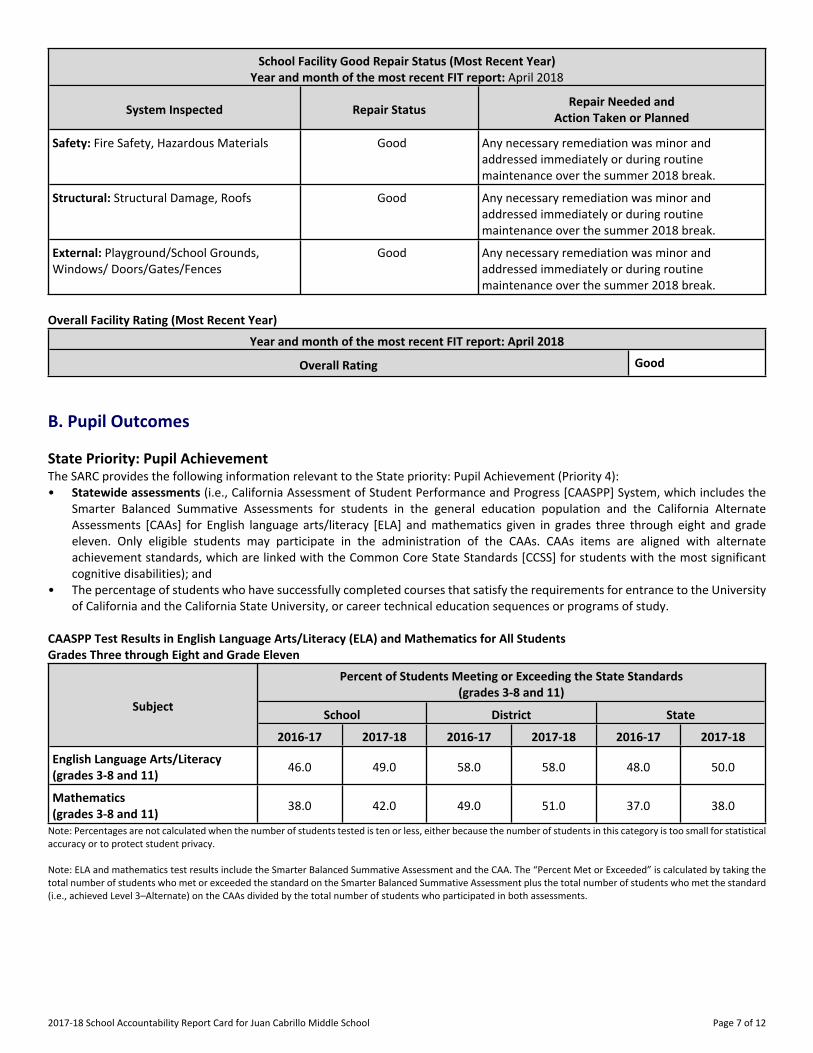
School Facility Good Repair Status (Most Recent Year) Year and month of the most recent FIT report: April 2018
System Inspected Repair Status Repair Needed and Action Taken or Planned
Safety: Fire Safety, Hazardous Materials XGood Any necessary remediation was minor and addressed immediately or during routine maintenance over the summer 2018 break.
Structural: Structural Damage, Roofs XGood Any necessary remediation was minor and addressed immediately or during routine maintenance over the summer 2018 break.
External: Playground/School Grounds, Windows/ Doors/Gates/Fences
XGood Any necessary remediation was minor and addressed immediately or during routine maintenance over the summer 2018 break.
Overall Facility Rating (Most Recent Year)
Year and month of the most recent FIT report: April 2018
Overall Rating X Good
B. Pupil Outcomes State Priority: Pupil Achievement The SARC provides the following information relevant to the State priority: Pupil Achievement (Priority 4): • Statewide assessments (i.e., California Assessment of Student Performance and Progress [CAASPP] System, which includes the
Smarter Balanced Summative Assessments for students in the general education population and the California Alternate Assessments [CAAs] for English language arts/literacy [ELA] and mathematics given in grades three through eight and grade eleven. Only eligible students may participate in the administration of the CAAs. CAAs items are aligned with alternate achievement standards, which are linked with the Common Core State Standards [CCSS] for students with the most significant cognitive disabilities); and
• The percentage of students who have successfully completed courses that satisfy the requirements for entrance to the University of California and the California State University, or career technical education sequences or programs of study.
CAASPP Test Results in English Language Arts/Literacy (ELA) and Mathematics for All Students Grades Three through Eight and Grade Eleven
Percent of Students Meeting or Exceeding the State Standards (grades 3-8 and 11)
School District State Subject
2016-17 2017-18 2016-17 2017-18 2016-17 2017-18
English Language Arts/Literacy (grades 3-8 and 11) 46.0 49.0 58.0 58.0 48.0 50.0
Mathematics (grades 3-8 and 11) 38.0 42.0 49.0 51.0 37.0 38.0
Note: Percentages are not calculated when the number of students tested is ten or less, either because the number of students in this category is too small for statistical accuracy or to protect student privacy. Note: ELA and mathematics test results include the Smarter Balanced Summative Assessment and the CAA. The “Percent Met or Exceeded” is calculated by taking the total number of students who met or exceeded the standard on the Smarter Balanced Summative Assessment plus the total number of students who met the standard (i.e., achieved Level 3–Alternate) on the CAAs divided by the total number of students who participated in both assessments.
2017-18 School Accountability Report Card for Juan Cabrillo Middle School Page 8 of 12
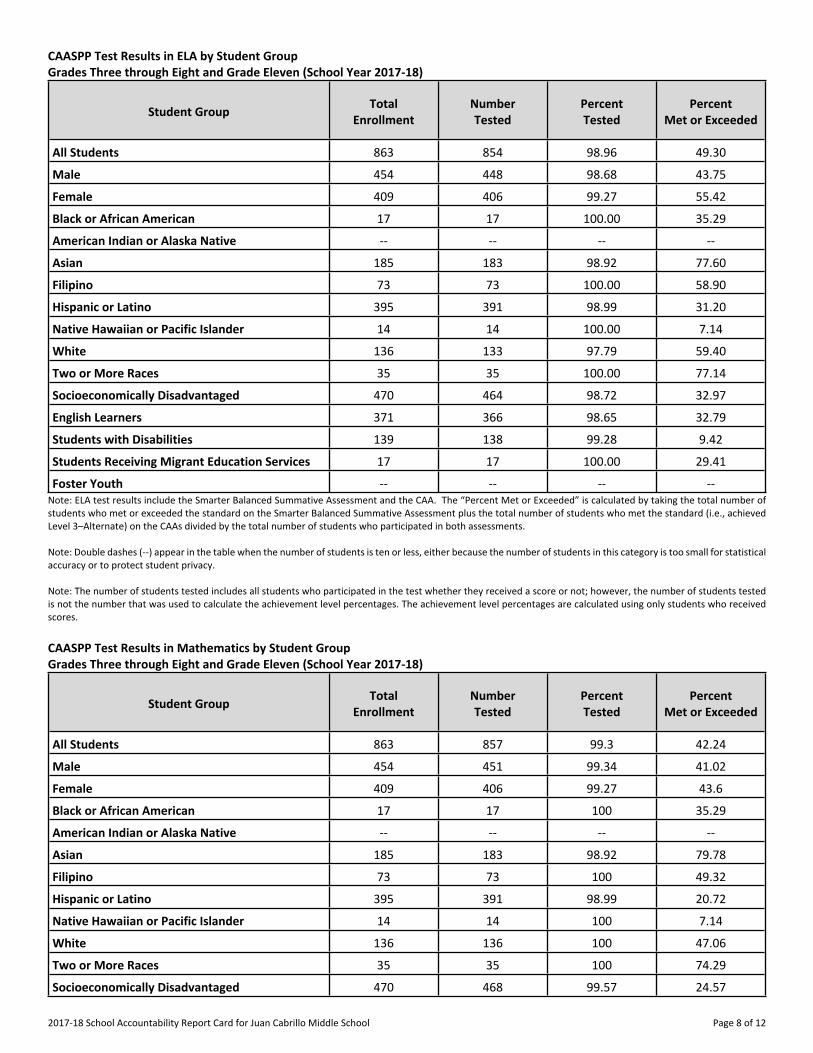
CAASPP Test Results in ELA by Student Group Grades Three through Eight and Grade Eleven (School Year 2017-18)
Student Group Total Enrollment
Number Tested
Percent Tested
Percent Met or Exceeded
All Students 863 854 98.96 49.30
Male 454 448 98.68 43.75
Female 409 406 99.27 55.42
Black or African American 17 17 100.00 35.29
American Indian or Alaska Native -- -- -- --
Asian 185 183 98.92 77.60
Filipino 73 73 100.00 58.90
Hispanic or Latino 395 391 98.99 31.20
Native Hawaiian or Pacific Islander 14 14 100.00 7.14
White 136 133 97.79 59.40
Two or More Races 35 35 100.00 77.14
Socioeconomically Disadvantaged 470 464 98.72 32.97
English Learners 371 366 98.65 32.79
Students with Disabilities 139 138 99.28 9.42
Students Receiving Migrant Education Services 17 17 100.00 29.41
Foster Youth -- -- -- -- Note: ELA test results include the Smarter Balanced Summative Assessment and the CAA. The “Percent Met or Exceeded” is calculated by taking the total number of students who met or exceeded the standard on the Smarter Balanced Summative Assessment plus the total number of students who met the standard (i.e., achieved Level 3–Alternate) on the CAAs divided by the total number of students who participated in both assessments. Note: Double dashes (--) appear in the table when the number of students is ten or less, either because the number of students in this category is too small for statistical accuracy or to protect student privacy. Note: The number of students tested includes all students who participated in the test whether they received a score or not; however, the number of students tested is not the number that was used to calculate the achievement level percentages. The achievement level percentages are calculated using only students who received scores. CAASPP Test Results in Mathematics by Student Group Grades Three through Eight and Grade Eleven (School Year 2017-18)
Student Group Total Enrollment
Number Tested
Percent Tested
Percent Met or Exceeded
All Students 863 857 99.3 42.24
Male 454 451 99.34 41.02
Female 409 406 99.27 43.6
Black or African American 17 17 100 35.29
American Indian or Alaska Native -- -- -- --
Asian 185 183 98.92 79.78
Filipino 73 73 100 49.32
Hispanic or Latino 395 391 98.99 20.72
Native Hawaiian or Pacific Islander 14 14 100 7.14
White 136 136 100 47.06
Two or More Races 35 35 100 74.29
Socioeconomically Disadvantaged 470 468 99.57 24.57
2017-18 School Accountability Report Card for Juan Cabrillo Middle School Page 9 of 12
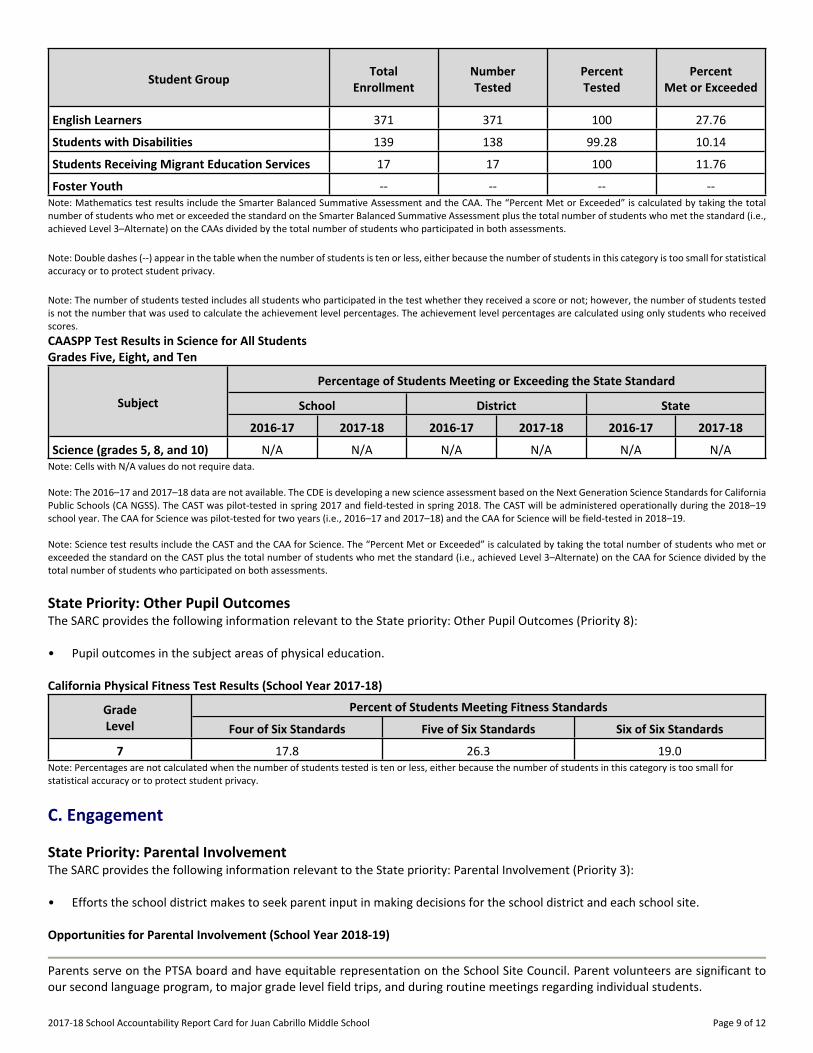
Student Group Total Enrollment
Number Tested
Percent Tested
Percent Met or Exceeded
English Learners 371 371 100 27.76
Students with Disabilities 139 138 99.28 10.14
Students Receiving Migrant Education Services 17 17 100 11.76
Foster Youth -- -- -- -- Note: Mathematics test results include the Smarter Balanced Summative Assessment and the CAA. The “Percent Met or Exceeded” is calculated by taking the total number of students who met or exceeded the standard on the Smarter Balanced Summative Assessment plus the total number of students who met the standard (i.e., achieved Level 3–Alternate) on the CAAs divided by the total number of students who participated in both assessments. Note: Double dashes (--) appear in the table when the number of students is ten or less, either because the number of students in this category is too small for statistical accuracy or to protect student privacy. Note: The number of students tested includes all students who participated in the test whether they received a score or not; however, the number of students tested is not the number that was used to calculate the achievement level percentages. The achievement level percentages are calculated using only students who received scores. CAASPP Test Results in Science for All Students Grades Five, Eight, and Ten
Percentage of Students Meeting or Exceeding the State Standard
School District State Subject
2016-17 2017-18 2016-17 2017-18 2016-17 2017-18
Science (grades 5, 8, and 10) N/A N/A N/A N/A N/A N/A Note: Cells with N/A values do not require data. Note: The 2016–17 and 2017–18 data are not available. The CDE is developing a new science assessment based on the Next Generation Science Standards for California Public Schools (CA NGSS). The CAST was pilot-tested in spring 2017 and field-tested in spring 2018. The CAST will be administered operationally during the 2018–19 school year. The CAA for Science was pilot-tested for two years (i.e., 2016–17 and 2017–18) and the CAA for Science will be field-tested in 2018–19. Note: Science test results include the CAST and the CAA for Science. The “Percent Met or Exceeded” is calculated by taking the total number of students who met or exceeded the standard on the CAST plus the total number of students who met the standard (i.e., achieved Level 3–Alternate) on the CAA for Science divided by the total number of students who participated on both assessments. State Priority: Other Pupil Outcomes The SARC provides the following information relevant to the State priority: Other Pupil Outcomes (Priority 8): • Pupil outcomes in the subject areas of physical education. California Physical Fitness Test Results (School Year 2017-18)
Percent of Students Meeting Fitness Standards Grade Level Four of Six Standards Five of Six Standards Six of Six Standards
---7--- 17.8 26.3 19.0 Note: Percentages are not calculated when the number of students tested is ten or less, either because the number of students in this category is too small for statistical accuracy or to protect student privacy.
C. Engagement State Priority: Parental Involvement The SARC provides the following information relevant to the State priority: Parental Involvement (Priority 3): • Efforts the school district makes to seek parent input in making decisions for the school district and each school site. Opportunities for Parental Involvement (School Year 2018-19)
Parents serve on the PTSA board and have equitable representation on the School Site Council. Parent volunteers are significant to our second language program, to major grade level field trips, and during routine meetings regarding individual students.
2017-18 School Accountability Report Card for Juan Cabrillo Middle School Page 10 of 12
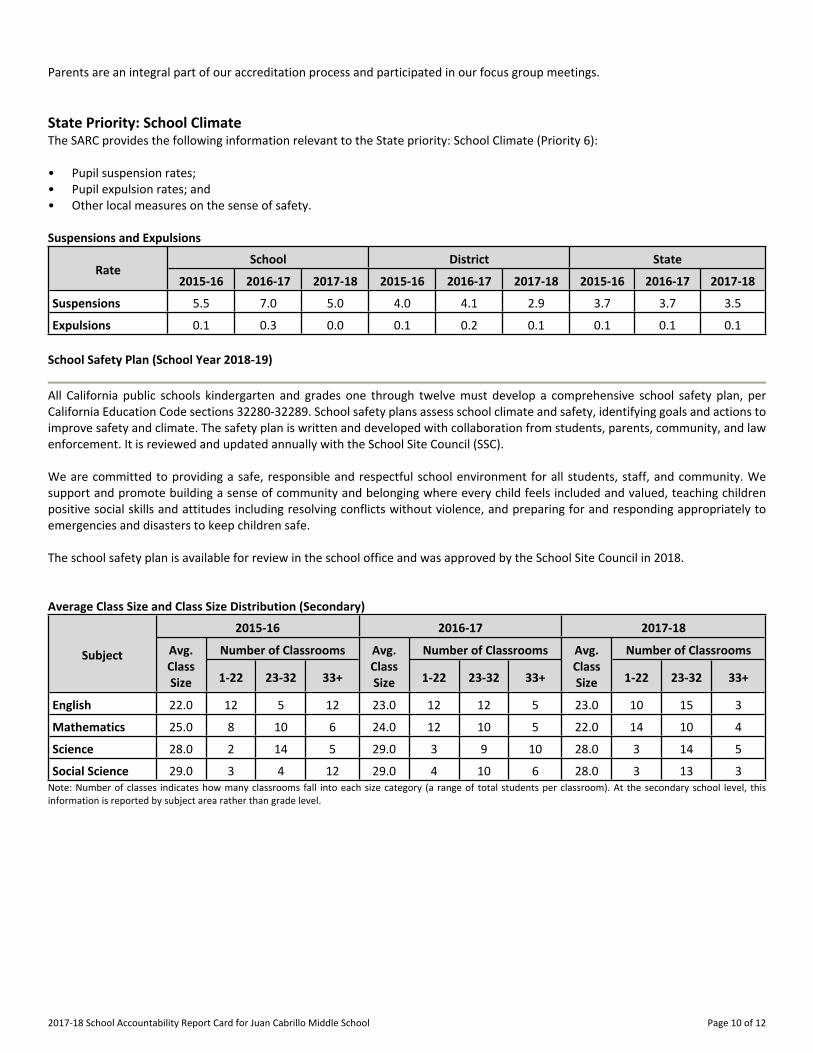
Parents are an integral part of our accreditation process and participated in our focus group meetings. State Priority: School Climate The SARC provides the following information relevant to the State priority: School Climate (Priority 6): • Pupil suspension rates; • Pupil expulsion rates; and • Other local measures on the sense of safety. Suspensions and Expulsions
School District State Rate
2015-16 2016-17 2017-18 2015-16 2016-17 2017-18 2015-16 2016-17 2017-18
Suspensions------- 5.5 7.0 5.0 4.0 4.1 2.9 3.7 3.7 3.5
Expulsions------- 0.1 0.3 0.0 0.1 0.2 0.1 0.1 0.1 0.1 School Safety Plan (School Year 2018-19)
All California public schools kindergarten and grades one through twelve must develop a comprehensive school safety plan, per California Education Code sections 32280-32289. School safety plans assess school climate and safety, identifying goals and actions to improve safety and climate. The safety plan is written and developed with collaboration from students, parents, community, and law enforcement. It is reviewed and updated annually with the School Site Council (SSC). We are committed to providing a safe, responsible and respectful school environment for all students, staff, and community. We support and promote building a sense of community and belonging where every child feels included and valued, teaching children positive social skills and attitudes including resolving conflicts without violence, and preparing for and responding appropriately to emergencies and disasters to keep children safe. The school safety plan is available for review in the school office and was approved by the School Site Council in 2018. Average Class Size and Class Size Distribution (Secondary)
2015-16 2016-17 2017-18
Number of Classrooms Number of Classrooms Number of Classrooms Subject Avg. Class Size 1-22 23-32 33+
Avg. Class Size 1-22 23-32 33+
Avg. Class Size 1-22 23-32 33+
English------- ----------
22.0 12 5 12 23.0 12 12 5 23.0 10 15 3
Mathematics ----------
25.0 8 10 6 24.0 12 10 5 22.0 14 10 4
Science------- ----------
28.0 2 14 5 29.0 3 9 10 28.0 3 14 5
Social Science ----------
29.0 3 4 12 29.0 4 10 6 28.0 3 13 3 Note: Number of classes indicates how many classrooms fall into each size category (a range of total students per classroom). At the secondary school level, this information is reported by subject area rather than grade level.
2017-18 School Accountability Report Card for Juan Cabrillo Middle School Page 11 of 12
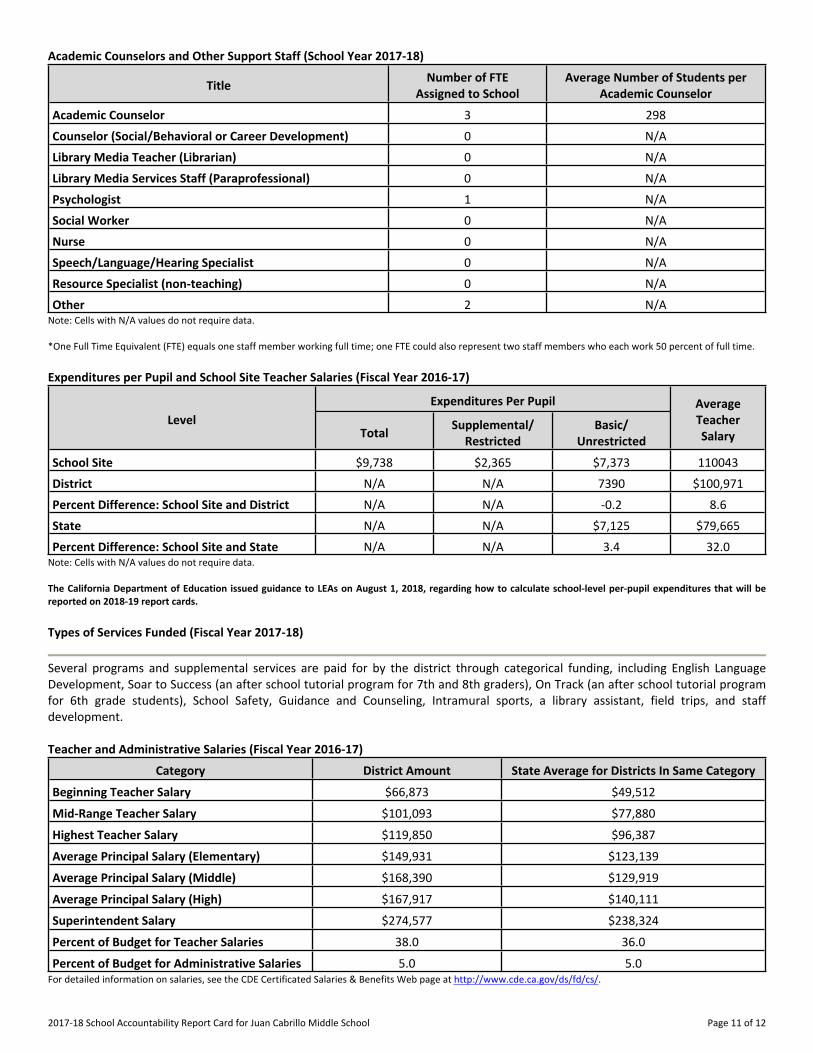
Academic Counselors and Other Support Staff (School Year 2017-18)
Title Number of FTE Assigned to School
Average Number of Students per Academic Counselor
Academic Counselor------- 3 298
Counselor (Social/Behavioral or Career Development) 0 N/A
Library Media Teacher (Librarian) 0 N/A
Library Media Services Staff (Paraprofessional) 0 N/A
Psychologist------- 1 N/A
Social Worker------- 0 N/A
Nurse------- 0 N/A
Speech/Language/Hearing Specialist 0 N/A
Resource Specialist (non-teaching)------- 0 N/A
Other------- 2 N/A Note: Cells with N/A values do not require data. *One Full Time Equivalent (FTE) equals one staff member working full time; one FTE could also represent two staff members who each work 50 percent of full time. Expenditures per Pupil and School Site Teacher Salaries (Fiscal Year 2016-17)
Expenditures Per Pupil Level
Total Supplemental/ Restricted
Basic/ Unrestricted
Average Teacher Salary
School Site------- $9,738 $2,365 $7,373 110043
District------- N/A N/A 7390 $100,971
Percent Difference: School Site and District N/A N/A -0.2 8.6
State------- N/A N/A $7,125 $79,665
Percent Difference: School Site and State N/A N/A 3.4 32.0 Note: Cells with N/A values do not require data. The California Department of Education issued guidance to LEAs on August 1, 2018, regarding how to calculate school-level per-pupil expenditures that will be reported on 2018-19 report cards. Types of Services Funded (Fiscal Year 2017-18)
Several programs and supplemental services are paid for by the district through categorical funding, including English Language Development, Soar to Success (an after school tutorial program for 7th and 8th graders), On Track (an after school tutorial program for 6th grade students), School Safety, Guidance and Counseling, Intramural sports, a library assistant, field trips, and staff development. Teacher and Administrative Salaries (Fiscal Year 2016-17)
Category District Amount State Average for Districts In Same Category
Beginning Teacher Salary $66,873 $49,512
Mid-Range Teacher Salary $101,093 $77,880
Highest Teacher Salary $119,850 $96,387
Average Principal Salary (Elementary) $149,931 $123,139
Average Principal Salary (Middle) $168,390 $129,919
Average Principal Salary (High) $167,917 $140,111
Superintendent Salary $274,577 $238,324
Percent of Budget for Teacher Salaries 38.0 36.0
Percent of Budget for Administrative Salaries 5.0 5.0 For detailed information on salaries, see the CDE Certificated Salaries & Benefits Web page at http://www.cde.ca.gov/ds/fd/cs/.
2017-18 School Accountability Report Card for Juan Cabrillo Middle School Page 12 of 12
Professional Development (Most Recent Three Years)
Staff development activities and expenditures are tied to District and school goals including the SPSA, WASC, LCAP, and District Strategic Plan. Staff development time continues to support teachers in self-reflection, analysis of student achievement data, and collaboration activities designed to help reach achievement goals. We believe in modeling lifelong learning for our students by engaging in collaborative sessions and professional development opportunities that align with the school’s Single Plan for Student Achievement (SPSA) goals and support student achievement in content standards and Expected Schoolwide Learning Results (ESLRs). District and school staff development programs support meeting the academic, social, and emotional needs of all students by providing opportunities for teachers to advance their skills, develop teaching strategies, and create curriculum. During staff in-service days, teachers share information about instructional practices, cognitive development and learning disabilities, and best practices for English Language Learners. These presentations and workshops help us understand who our students are so we can better support them with individual counseling, curriculum design, and instructional practices. There are five days dedicated to professional development in the 2018-2019 school year. There were eight days of professional development in the 2017-2018 school year and there were eight days of professional development in the 2016-2017 school year. In addition, there is professional development happening on the school campus through professional learning communities, where teachers meet to discuss best practices while assessing student work.