Embed Size (px)
Citation preview
Spring Turkey Harvest Survey
Report 2020
Neelam C. Poudyal and Clara
Shattuck, Department of Forestry
Wildlife & Fisheries, University of
Tennessee, Knoxville
TWRA Wildlife Technical Report 20-9, Nov. 2020

Equal opportunity to participate in and benefit from programs of the Tennessee Wildlife Resources Agency is
available to all persons without regard to their race, color, national origin, sex, age, disability, or military
service. TWRA is also an equal opportunity/equal access employer. Questions should be directed to TWRA,
Human Resources Office, 5107 Edmondson Pike, Nashville, TN 37211, (615) 781-6594 (TDD 781-6691), or
to the U.S. Fish and Wildlife Service, Office for Human Resources, 4401 N. Fairfax Dr., Arlington, VA 22203.
2020 Spring Turkey Harvest Survey Report
Submitted to: Roger Shields
Turkey Program Coordinator Tennessee Wildlife Resources Agency
5107 Edmondson Pike Nashville, TN
Submitted by: Neelam C. Poudyal and Clara Shattuck
Department of Forestry, Wildlife and Fisheries University of Tennessee
Knoxville, TN 37996
November 24, 2020
THIS PROJECT WAS SUPPORTED by Wildlife Restoration Grants administered by the U.S. Fish and Wildlife Service, Wildlife and Sport Fish Restoration Program: Partnering to fund conservation and connect people with nature.
1
Abstract
Following the 2020 spring turkey hunting season, a stratified random sample of
statewide big game hunting license holders (both resident and non-resident) was contacted by
a combination of email and mail surveys to estimate the turkey hunting participation, hunting
effort, and harvest in Tennessee. Of 17,045 total license-holders contacted, 5,384 responses
were received. During the spring 2020 turkey season, an estimated 90,015 hunters (65,429
adult and 24,586 youth) statewide participated in turkey hunting and spent 728,558 days afield.
Adult and youth hunters statewide harvested an estimated 57,633 turkeys (49,083 adult
gobblers, 7,946 jakes, and 604 bearded hens). An estimated 7,499 birds were shot but not killed
or recovered during the 2020 spring turkey season. Overall, 58% of the statewide respondents
were somewhat or very satisfied with their turkey hunting experience in the 2020 spring turkey
season. About half (51%) of the respondents perceived the turkey population in areas they hunt
to have decreased over the years. The three most frequently mentioned reasons behind a
perceived decline in turkey populations included predation of nests, predation of poults and/or
adult turkeys, and hunting pressure.
2
Table of Contents Abstract ........................................................................................................................................................ 1
List of Tables ................................................................................................................................................. 3
List of Figures ................................................................................................................................................ 4
Introduction .................................................................................................................................................. 5
Methods ........................................................................................................................................................ 5
Results........................................................................................................................................................... 8
Respondent characteristics ....................................................................................................................... 8
Statewide estimation of hunters, hunting days and harvest .................................................................... 8
Estimates of hunting effort and harvest by land type .............................................................................. 9
Regional estimates of hunting effort and harvest .................................................................................. 12
Turkeys shot but not killed or recovered by hunters.............................................................................. 15
Satisfaction with turkey hunting experience .......................................................................................... 15
Perceived change in turkey populations ................................................................................................. 17
References .................................................................................................................................................. 18
Appendix A: Survey questionnaire ............................................................................................................ 19
3
List of Tables Table 1: Estimated number of hunters, average hunting hours, and total days spent hunting during the
2020 spring turkey hunting season in Tennessee ......................................................................................... 8
Table 2: Estimated number of turkeys harvested by adult and youth hunters during the 2020 spring
turkey hunting season in Tennessee............................................................................................................. 9
Table 3: Estimated number of hunters, days afield and turkeys harvested by land type during the 2020
spring turkey hunting season in Tennessee ................................................................................................ 11
Table 4: Estimated average number of days afield and hunting hours per day for adult and youth hunters
during the 2020 spring turkey hunting season in Tennessee ..................................................................... 12
Table 5: Estimated harvest rates for adult and youth hunters by land types during the 2020 spring turkey
hunting season in Tennessee ...................................................................................................................... 12
Table 6: Estimated number of adult hunters, average days afield by land types, and birds harvested by
TWRA administrative region during the 2020 spring turkey hunting season in Tennessee ....................... 13
Table 7: Estimated number of youth hunters, average days afield by land types, and birds harvested by
TWRA administrative region during the 2020 spring turkey hunting season in Tennessee ....................... 14
Table 8: Estimated average number of hunting hours per day by TWRA administrative region for adult
and youth hunters during the 2020 spring turkey hunting season in Tennessee ...................................... 14
Table 9: Estimated harvest rates for adult and youth hunters by TWRA administrative region during the
2020 spring turkey hunting season in Tennessee ....................................................................................... 15
4
List of Figures Figure 1: Map of TWRA administrative regions (Source: Tennessee Wildlife Resources Agency) ............... 5
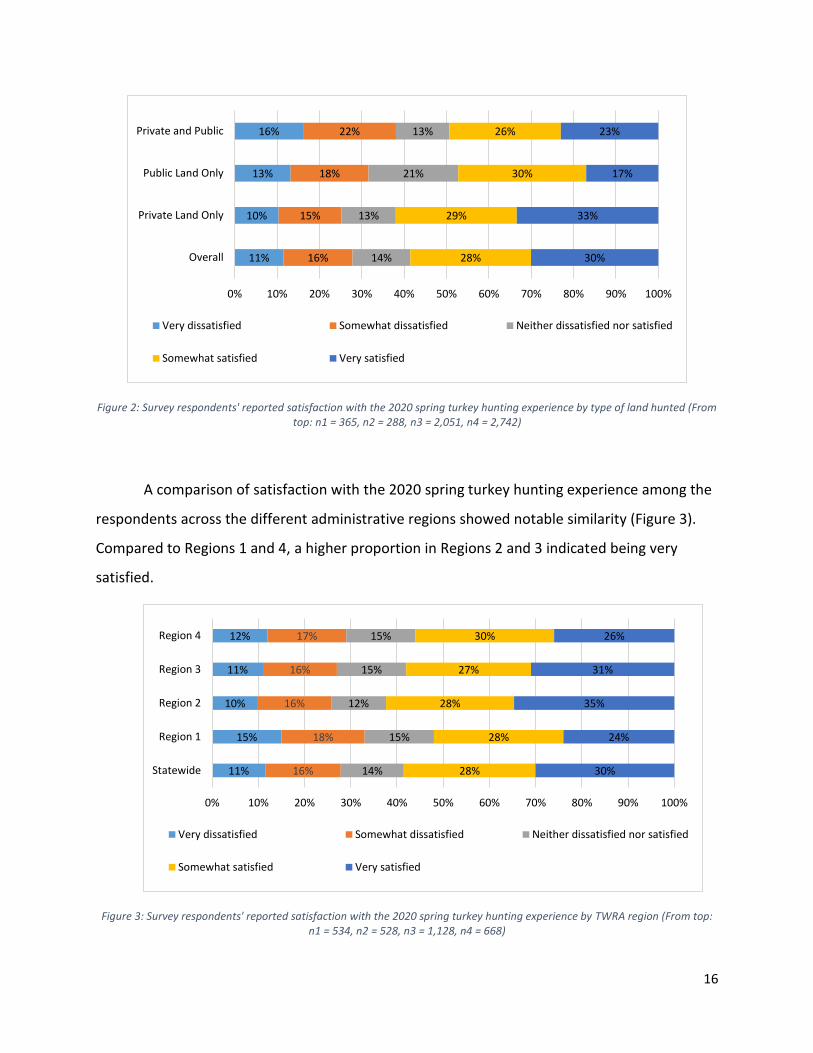
Figure 2: Survey respondents' reported satisfaction with the 2020 spring turkey hunting experience by
type of land hunted (From top: n1 = 365, n2 = 288, n3 = 2,051, n4 = 2,742) ............................................. 16
Figure 3: Survey respondents' reported satisfaction with the 2020 spring turkey hunting experience by
TWRA region (From top: n1 = 534, n2 = 528, n3 = 1,128, n4 = 668) .......................................................... 16
Figure 4: Survey respondents' perception of how turkey populations in the areas they hunt have
changed over the years (From top: n1 = 467, n2 = 465, n3 = 992, n4 = 590, n5 = 2,399) .......................... 17
Figure 5: Percentage of survey respondents indicating the reasons behind perceived decline in turkey
populations in the areas they hunt (n = 1,214) .......................................................................................... 18
5
Introduction
The Tennessee Wildlife Resources Agency (TWRA) is a state agency in Tennessee
responsible for the management of game species including turkey, deer, etc. For better
monitoring of the turkey population and harvest trends over time, the agency benefits from
understanding annual hunting participation, hunting effort, and harvest estimates for all game
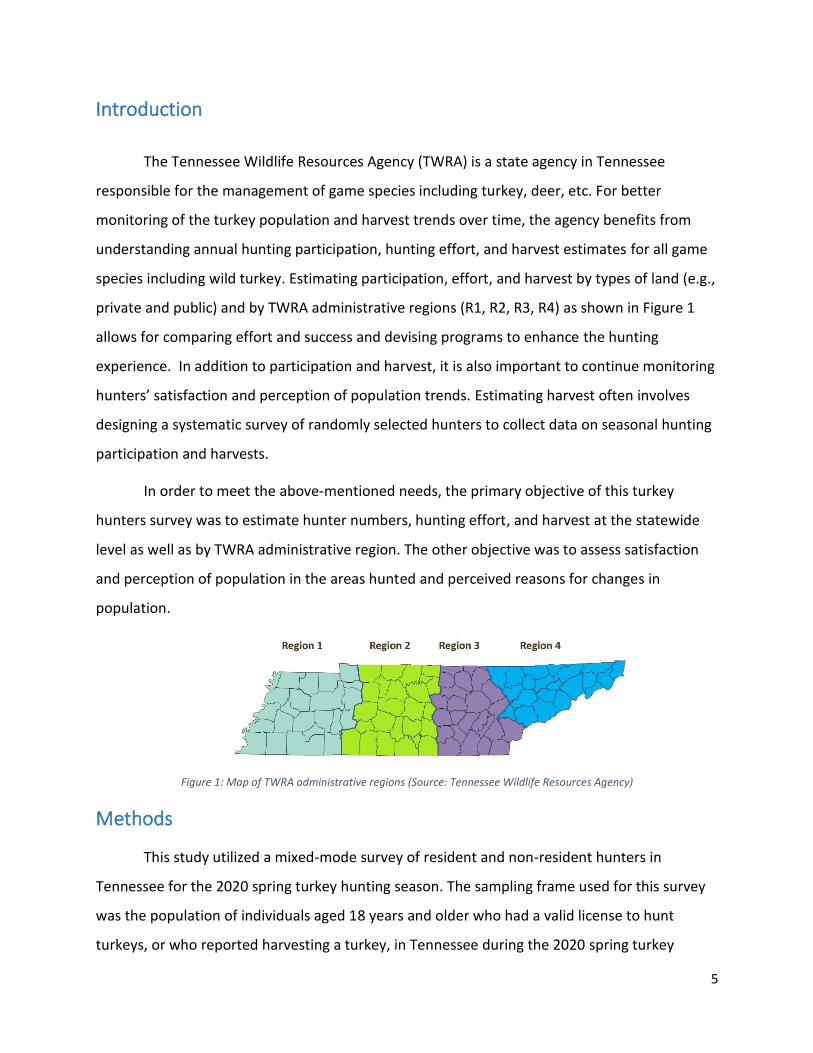
species including wild turkey. Estimating participation, effort, and harvest by types of land (e.g.,
private and public) and by TWRA administrative regions (R1, R2, R3, R4) as shown in Figure 1
allows for comparing effort and success and devising programs to enhance the hunting
experience. In addition to participation and harvest, it is also important to continue monitoring
hunters’ satisfaction and perception of population trends. Estimating harvest often involves
designing a systematic survey of randomly selected hunters to collect data on seasonal hunting
participation and harvests.
In order to meet the above-mentioned needs, the primary objective of this turkey
hunters survey was to estimate hunter numbers, hunting effort, and harvest at the statewide
level as well as by TWRA administrative region. The other objective was to assess satisfaction
and perception of population in the areas hunted and perceived reasons for changes in
population.
Figure 1: Map of TWRA administrative regions (Source: Tennessee Wildlife Resources Agency)
Methods
This study utilized a mixed-mode survey of resident and non-resident hunters in
Tennessee for the 2020 spring turkey hunting season. The sampling frame used for this survey
was the population of individuals aged 18 years and older who had a valid license to hunt
turkeys, or who reported harvesting a turkey, in Tennessee during the 2020 spring turkey
6
season. Because of the wide variety of license types that include turkey hunting privileges in
Tennessee, a stratified random sampling approach was adopted to ensure representation of all
license categories in the survey sample. Based on expected differences in response rate and a
general similarity in license types, license holders and hunters who reported to have harvested
a turkey during the 2020 spring season were assigned to one of six sampling strata (Annual,
Disability, Lifetime, Non-resident, Permanent Senior, and Harvest). Youth hunting license types
were not considered in the sampling because only hunters who were at least 18 years of age
were surveyed. The first stratum (Annual) included licenses that are annually renewable (types:
04, 09, 10, 11, 164, 167). The second stratum (Disability) included licenses that are available to
individuals with physical or intellectual disabilities (types: 169, 189, 198). The third stratum
(Lifetime) included all lifetime licenses that did not require annual renewal (types: 401, 402,
403, 404, 405, 406). Those under 18 years of age in lifetime license categories were excluded
from the study.
A separate question was asked of adult respondents in the sample to collect data on
turkeys harvested by youth guided or mentored during the turkey season. The fourth stratum
(Non-resident) included non-junior, non-resident licenses (types: 73, 74). The fifth stratum
(Permanent Senior) included the permanent senior citizen hunting license only available to
those 65 years and older (type: 166). The final stratum (Harvest) included the individuals who
reported to have harvested a turkey in Tennessee during the 2020 spring season.
A total of 17,045 contacts were selected for the mixed-mode survey that was
administered in May-June of 2020. Following a modified Tailored Design Method for mail and
internet surveys (Dillman et al. 2009), individuals who had an email address on file were first
invited to complete the online survey at Qualtrics.com, a secure online survey program housed
at University of Tennessee’s website. A two-page survey questionnaire (Appendix A) was
developed in collaboration with TWRA staff and then approved by the University of Tennessee’s
Institutional Review Board for human subjects research (Approval #: UTK IRB-20-05821-XM).
Those who did not respond to the initial email survey invitation were sent three follow-up
reminder emails during a period of two weeks. After the email survey concluded, non-
respondents, or those who did not have an email address on file, were contacted by mail. The
7
initial mail survey packet included a personalized cover letter, survey questionnaire, and a
business reply envelope. A week later, a final reminder packet including a copy of the survey
questionnaire and a business reply envelope was mailed to encourage participation.
Nineteen out of 17,045 hunters contacted for the survey were undeliverable. At the end
of survey administration, 5,384 responses (3,164 from email and 2,220 from mail) were
received. After adjusting for the undeliverable mails, the adjusted response rate for the survey
was 32%. Although less than ideal, this response rate is attributable to the nature of the
sampling frame used. In Tennessee, many sportsmen license types include turkey hunting rights
and, consequently, possessors of these licenses are considered as potential hunters in the
sampling design. However, many in the sample do not use the turkey hunting privilege included
in their license, and therefore, may not respond to a turkey harvest survey request.
Nevertheless, this response rate is higher than the range reported in several recent hunter
surveys in the southeastern U.S. (Watkins et al. 2018; Mingie et al. 2019; Poudyal et al. 2020).
Statewide number of hunters, days afield, and harvest were calculated separately for
adult and youth. In addition, estimates for these metrics were also calculated for the types of
land hunted (private, public, both) and the TWRA administrative region (e.g., R1, R2, R3, R4).
Any harvest reported without the location of the hunt was recorded in the “Unknown”
category. Estimates of harvest were also calculated separately by type of turkey harvested
(adult gobblers, jakes, bearded hens). Estimates for relevant variables of hunting effort and
harvest metrics were calculated following a stratified random sampling design (Chochran 1977).
As in any survey research, the estimates are subject to sampling error. Where
applicable, 95% confidence limits (CL) around the estimates were also reported. Theoretically,
the 95% confidence interval can be estimated by adding and subtracting the CL from the
estimate. It should be noted that many sources of errors that are beyond researchers’ control
can influence results in survey studies. Those could include participants failing to provide
complete or accurate answers, measurement error due to misinterpretation of question by
respondents, etc. However, we do not expect those issues to have substantial effect on the
results.
8
Results
Respondent characteristics
Of 5,384 survey recipients who responded, 91% were male and 96% were white. The
average age of the respondents was 52 years. It should be noted that only adults (18 or older)
were surveyed. These statistics are very similar to the key demographics of the original
sampling frame sample of 17,045 (male: 90%, white: 93%, average age: 50 years).
Statewide estimation of hunters, hunting days and harvest
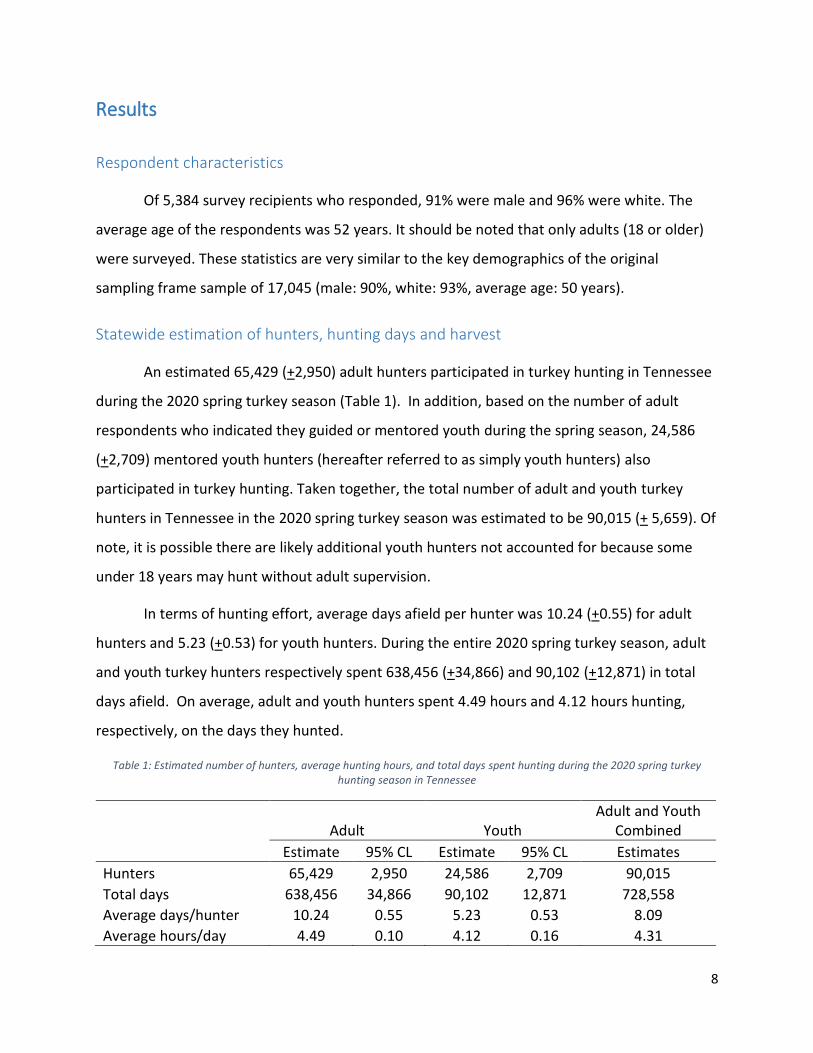
An estimated 65,429 (+2,950) adult hunters participated in turkey hunting in Tennessee
during the 2020 spring turkey season (Table 1). In addition, based on the number of adult
respondents who indicated they guided or mentored youth during the spring season, 24,586
(+2,709) mentored youth hunters (hereafter referred to as simply youth hunters) also
participated in turkey hunting. Taken together, the total number of adult and youth turkey
hunters in Tennessee in the 2020 spring turkey season was estimated to be 90,015 (+ 5,659). Of
note, it is possible there are likely additional youth hunters not accounted for because some
under 18 years may hunt without adult supervision.
In terms of hunting effort, average days afield per hunter was 10.24 (+0.55) for adult
hunters and 5.23 (+0.53) for youth hunters. During the entire 2020 spring turkey season, adult
and youth turkey hunters respectively spent 638,456 (+34,866) and 90,102 (+12,871) in total
days afield. On average, adult and youth hunters spent 4.49 hours and 4.12 hours hunting,
respectively, on the days they hunted.
Table 1: Estimated number of hunters, average hunting hours, and total days spent hunting during the 2020 spring turkey hunting season in Tennessee
Adult Youth
Adult and Youth Combined
Estimate 95% CL Estimate 95% CL Estimates
Hunters 65,429 2,950 24,586 2,709 90,015
Total days 638,456 34,866 90,102 12,871 728,558
Average days/hunter 10.24 0.55 5.23 0.53 8.09
Average hours/day 4.49 0.10 4.12 0.16 4.31
9
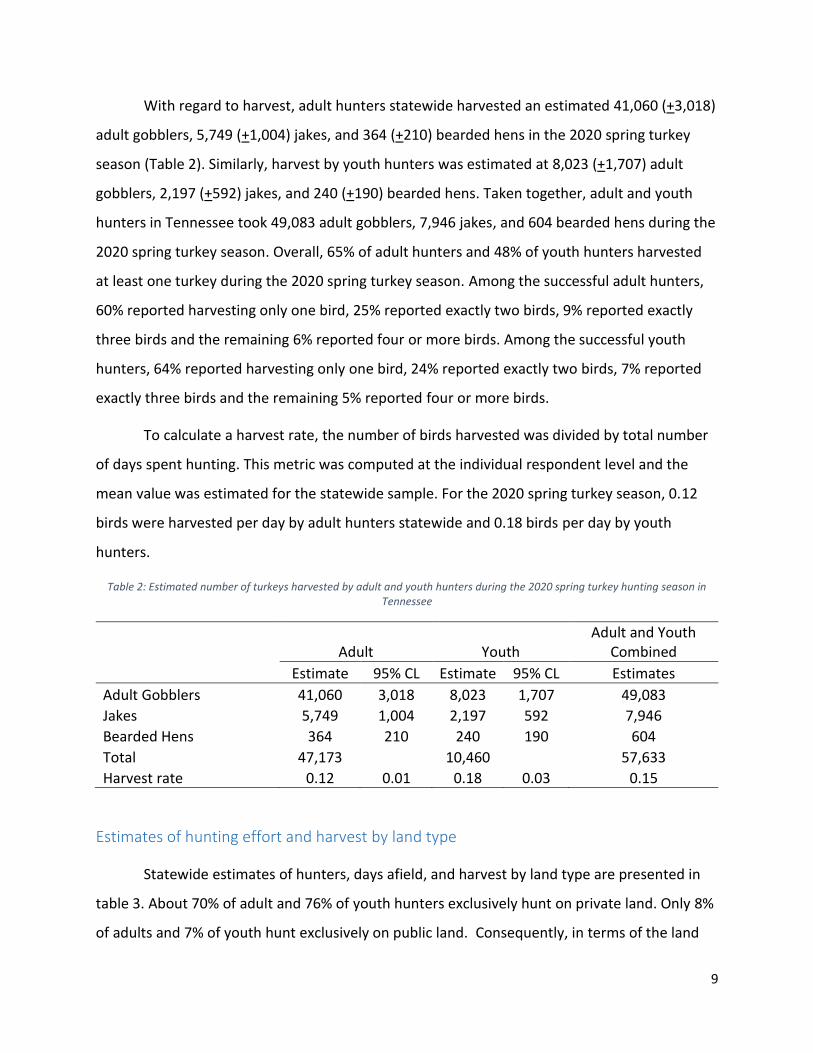
With regard to harvest, adult hunters statewide harvested an estimated 41,060 (+3,018)
adult gobblers, 5,749 (+1,004) jakes, and 364 (+210) bearded hens in the 2020 spring turkey
season (Table 2). Similarly, harvest by youth hunters was estimated at 8,023 (+1,707) adult
gobblers, 2,197 (+592) jakes, and 240 (+190) bearded hens. Taken together, adult and youth
hunters in Tennessee took 49,083 adult gobblers, 7,946 jakes, and 604 bearded hens during the
2020 spring turkey season. Overall, 65% of adult hunters and 48% of youth hunters harvested
at least one turkey during the 2020 spring turkey season. Among the successful adult hunters,
60% reported harvesting only one bird, 25% reported exactly two birds, 9% reported exactly
three birds and the remaining 6% reported four or more birds. Among the successful youth
hunters, 64% reported harvesting only one bird, 24% reported exactly two birds, 7% reported
exactly three birds and the remaining 5% reported four or more birds.
To calculate a harvest rate, the number of birds harvested was divided by total number
of days spent hunting. This metric was computed at the individual respondent level and the
mean value was estimated for the statewide sample. For the 2020 spring turkey season, 0.12
birds were harvested per day by adult hunters statewide and 0.18 birds per day by youth
hunters.
Table 2: Estimated number of turkeys harvested by adult and youth hunters during the 2020 spring turkey hunting season in Tennessee
Adult Youth
Adult and Youth Combined
Estimate 95% CL Estimate 95% CL Estimates
Adult Gobblers 41,060 3,018 8,023 1,707 49,083
Jakes 5,749 1,004 2,197 592 7,946
Bearded Hens 364 210 240 190 604
Total 47,173 10,460 57,633
Harvest rate 0.12 0.01 0.18 0.03 0.15
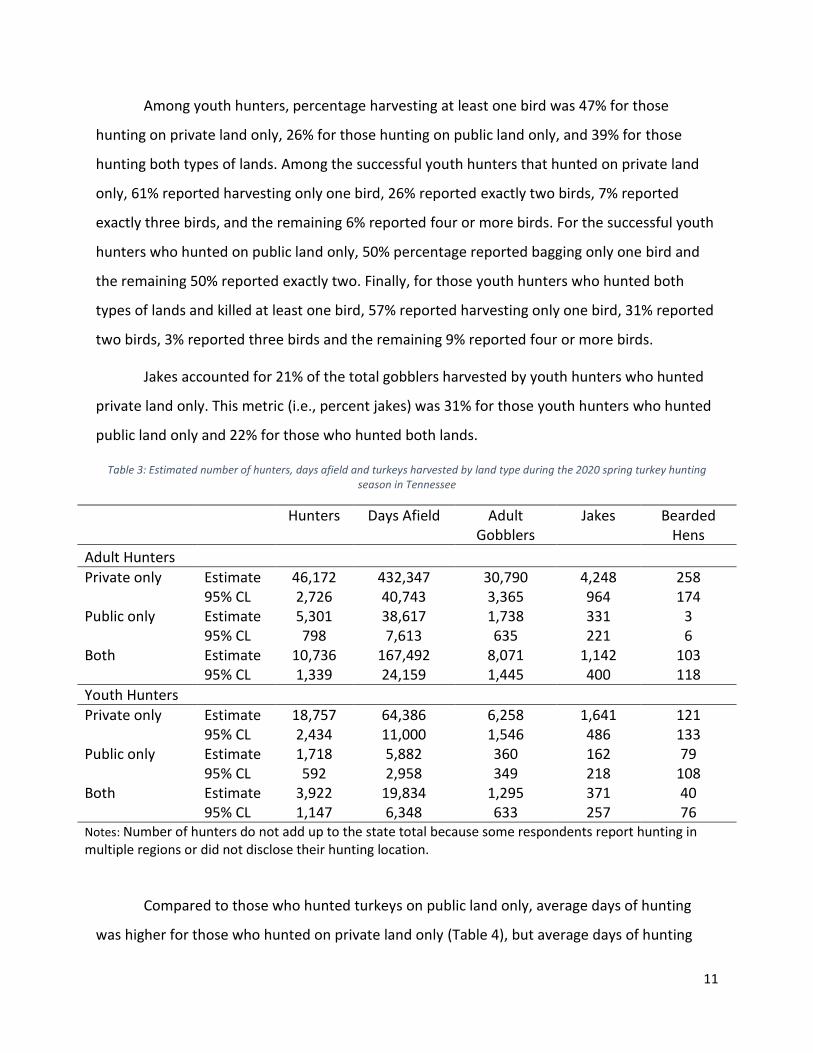
Estimates of hunting effort and harvest by land type
Statewide estimates of hunters, days afield, and harvest by land type are presented in
table 3. About 70% of adult and 76% of youth hunters exclusively hunt on private land. Only 8%
of adults and 7% of youth hunt exclusively on public land. Consequently, in terms of the land
10
types where hunting took place, respondents reported hunting more days on private lands.
Comparison of total hunting days by adult hunters between land types showed about two-
thirds (68%) of total hunting days were by those hunting on private lands only, 6% for those
hunting on public land only, and the remaining 26% of total days for those who hunted on both
land types. In terms of harvest, those hunting on only private land accounted for an estimated
75% of total birds harvested, 4% of total harvest was by those hunting on public land only and
20% of the total harvest was by those who hunted on both land types. The remaining 1% of
total birds harvested was represented by harvest on an unreported (i.e., unknown) land type.
Jakes accounted for 12% of the total gobblers harvested by adult hunters who hunted private
land only. This metric was slightly higher (16%) among adult hunters who hunted public land
only and 12% for those who hunted both lands.
Comparison of total hunting days and total bird harvest by youth hunters between land
types showed about 71% of total hunting days were estimated for those hunting on private
lands only, 7% for those hunting on public land only and the remaining 22% of total days for
those who hunted on both land types. In terms of harvest, 77% of total birds harvested was
estimated to have been taken by those hunting on private land only, 6% by those hunting on
public land only and 16% for those who hunted on both land types. The remaining 1% of total
birds harvest was estimated for unreported (i.e., unknown) land types.
Percentage of adult hunters that harvested at least one bird was 68% for those hunting
on private lands only, 42% for those hunting on public land only, and 66% for those hunting on
both land types. Among successful adult hunters that hunted on private land only, 62%
reported harvesting only one bird, 25% reported exactly two birds, 8% reported exactly three
birds and the remaining 5% reported four or more birds. Similarly, among the successful adult
hunters that hunted on public land only, 57% reported bagging only one bird, 25% reported two
birds, 7% reported three birds and the remaining 11% reported four or more birds. For those
who hunted both types of lands and successfully harvested, 55% reported bagging only one
bird, 23% reported two birds, 14% reported three birds and the remaining 7% reported four or
more birds.
11
Among youth hunters, percentage harvesting at least one bird was 47% for those
hunting on private land only, 26% for those hunting on public land only, and 39% for those
hunting both types of lands. Among the successful youth hunters that hunted on private land
only, 61% reported harvesting only one bird, 26% reported exactly two birds, 7% reported
exactly three birds, and the remaining 6% reported four or more birds. For the successful youth
hunters who hunted on public land only, 50% percentage reported bagging only one bird and
the remaining 50% reported exactly two. Finally, for those youth hunters who hunted both
types of lands and killed at least one bird, 57% reported harvesting only one bird, 31% reported
two birds, 3% reported three birds and the remaining 9% reported four or more birds.
Jakes accounted for 21% of the total gobblers harvested by youth hunters who hunted
private land only. This metric (i.e., percent jakes) was 31% for those youth hunters who hunted
public land only and 22% for those who hunted both lands.
Table 3: Estimated number of hunters, days afield and turkeys harvested by land type during the 2020 spring turkey hunting season in Tennessee
Hunters Days Afield Adult Gobblers
Jakes Bearded Hens
Adult Hunters
Private only Estimate 46,172 432,347 30,790 4,248 258 95% CL 2,726 40,743 3,365 964 174 Public only Estimate 5,301 38,617 1,738 331 3 95% CL 798 7,613 635 221 6 Both Estimate 10,736 167,492 8,071 1,142 103 95% CL 1,339 24,159 1,445 400 118
Youth Hunters Private only Estimate 18,757 64,386 6,258 1,641 121 95% CL 2,434 11,000 1,546 486 133 Public only Estimate 1,718 5,882 360 162 79 95% CL 592 2,958 349 218 108 Both Estimate 3,922 19,834 1,295 371 40 95% CL 1,147 6,348 633 257 76 Notes: Number of hunters do not add up to the state total because some respondents report hunting in multiple regions or did not disclose their hunting location.
Compared to those who hunted turkeys on public land only, average days of hunting
was higher for those who hunted on private land only (Table 4), but average days of hunting
12
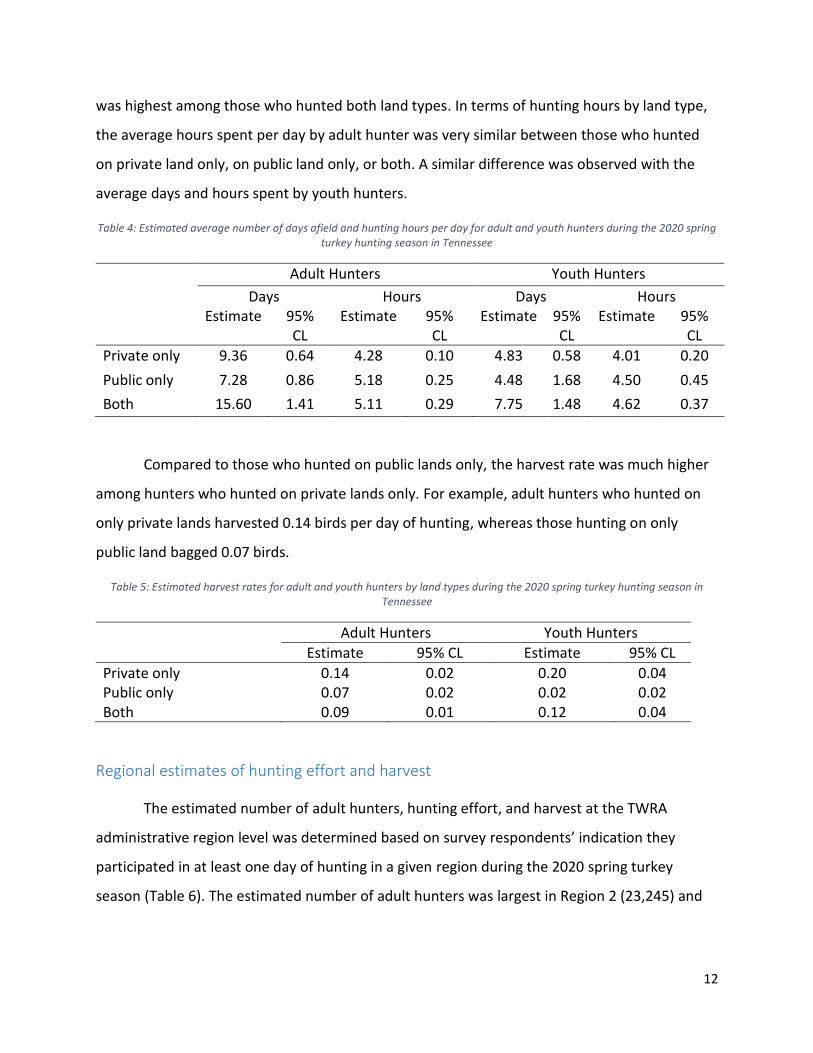
was highest among those who hunted both land types. In terms of hunting hours by land type,
the average hours spent per day by adult hunter was very similar between those who hunted
on private land only, on public land only, or both. A similar difference was observed with the
average days and hours spent by youth hunters.
Table 4: Estimated average number of days afield and hunting hours per day for adult and youth hunters during the 2020 spring turkey hunting season in Tennessee
Adult Hunters Youth Hunters
Days Hours Days Hours Estimate 95%
CL Estimate 95%
CL Estimate 95%
CL Estimate 95%
CL
Private only 9.36 0.64 4.28 0.10 4.83 0.58 4.01 0.20
Public only 7.28 0.86 5.18 0.25 4.48 1.68 4.50 0.45
Both 15.60 1.41 5.11 0.29 7.75 1.48 4.62 0.37
Compared to those who hunted on public lands only, the harvest rate was much higher
among hunters who hunted on private lands only. For example, adult hunters who hunted on
only private lands harvested 0.14 birds per day of hunting, whereas those hunting on only
public land bagged 0.07 birds.
Table 5: Estimated harvest rates for adult and youth hunters by land types during the 2020 spring turkey hunting season in Tennessee
Adult Hunters Youth Hunters
Estimate 95% CL Estimate 95% CL
Private only 0.14 0.02 0.20 0.04 Public only 0.07 0.02 0.02 0.02 Both 0.09 0.01 0.12 0.04
Regional estimates of hunting effort and harvest
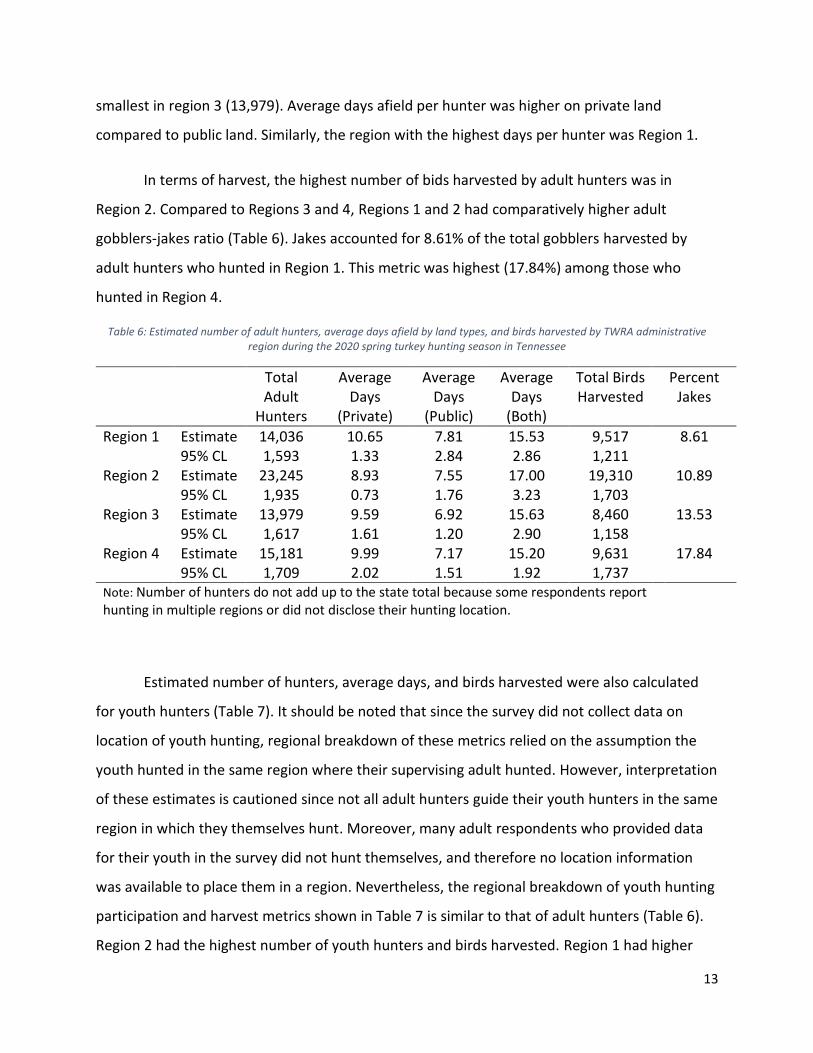
The estimated number of adult hunters, hunting effort, and harvest at the TWRA
administrative region level was determined based on survey respondents’ indication they
participated in at least one day of hunting in a given region during the 2020 spring turkey
season (Table 6). The estimated number of adult hunters was largest in Region 2 (23,245) and
13
smallest in region 3 (13,979). Average days afield per hunter was higher on private land
compared to public land. Similarly, the region with the highest days per hunter was Region 1.
In terms of harvest, the highest number of bids harvested by adult hunters was in
Region 2. Compared to Regions 3 and 4, Regions 1 and 2 had comparatively higher adult
gobblers-jakes ratio (Table 6). Jakes accounted for 8.61% of the total gobblers harvested by
adult hunters who hunted in Region 1. This metric was highest (17.84%) among those who
hunted in Region 4.
Table 6: Estimated number of adult hunters, average days afield by land types, and birds harvested by TWRA administrative region during the 2020 spring turkey hunting season in Tennessee
Total Adult
Hunters
Average Days
(Private)
Average Days
(Public)
Average Days
(Both)
Total Birds Harvested
Percent Jakes
Region 1 Estimate 14,036 10.65 7.81 15.53 9,517 8.61 95% CL 1,593 1.33 2.84 2.86 1,211 Region 2 Estimate 23,245 8.93 7.55 17.00 19,310 10.89 95% CL 1,935 0.73 1.76 3.23 1,703 Region 3 Estimate 13,979 9.59 6.92 15.63 8,460 13.53 95% CL 1,617 1.61 1.20 2.90 1,158 Region 4 Estimate 15,181 9.99 7.17 15.20 9,631 17.84 95% CL 1,709 2.02 1.51 1.92 1,737 Note: Number of hunters do not add up to the state total because some respondents report hunting in multiple regions or did not disclose their hunting location.
Estimated number of hunters, average days, and birds harvested were also calculated
for youth hunters (Table 7). It should be noted that since the survey did not collect data on
location of youth hunting, regional breakdown of these metrics relied on the assumption the
youth hunted in the same region where their supervising adult hunted. However, interpretation
of these estimates is cautioned since not all adult hunters guide their youth hunters in the same
region in which they themselves hunt. Moreover, many adult respondents who provided data
for their youth in the survey did not hunt themselves, and therefore no location information
was available to place them in a region. Nevertheless, the regional breakdown of youth hunting
participation and harvest metrics shown in Table 7 is similar to that of adult hunters (Table 6).
Region 2 had the highest number of youth hunters and birds harvested. Region 1 had higher
14
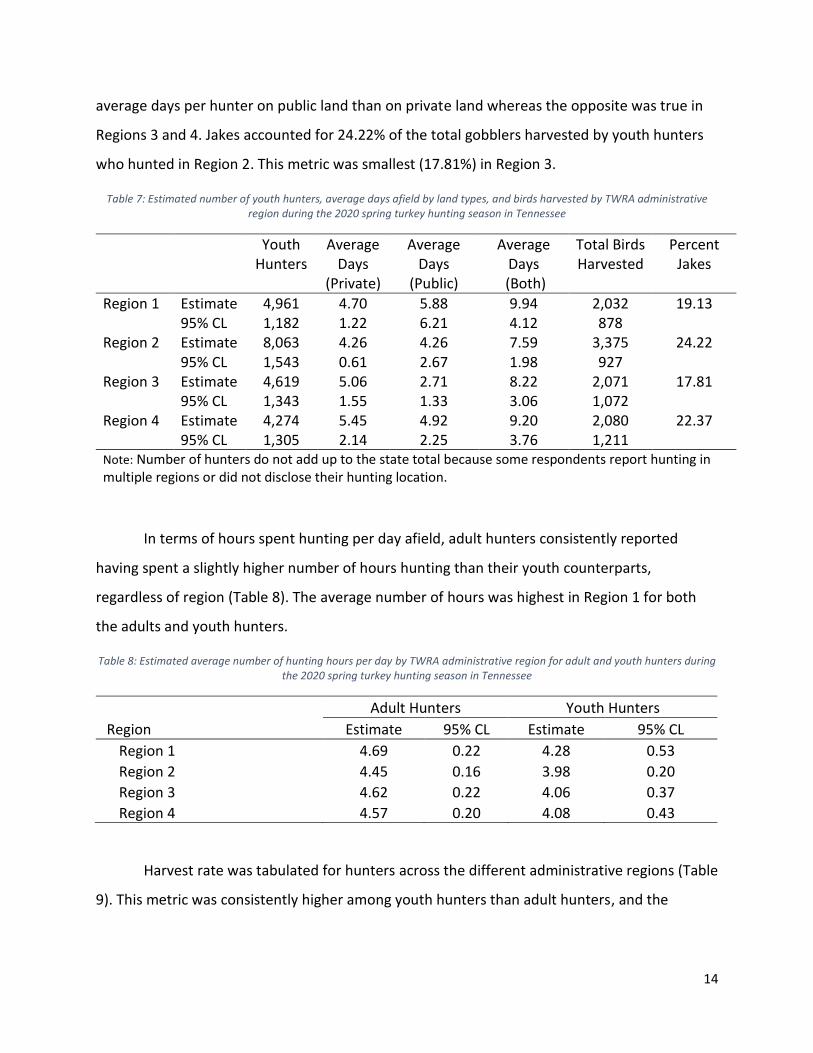
average days per hunter on public land than on private land whereas the opposite was true in
Regions 3 and 4. Jakes accounted for 24.22% of the total gobblers harvested by youth hunters
who hunted in Region 2. This metric was smallest (17.81%) in Region 3.
Table 7: Estimated number of youth hunters, average days afield by land types, and birds harvested by TWRA administrative region during the 2020 spring turkey hunting season in Tennessee
Youth Hunters
Average Days
(Private)
Average Days
(Public)
Average Days
(Both)
Total Birds Harvested
Percent Jakes
Region 1 Estimate 4,961 4.70 5.88 9.94 2,032 19.13 95% CL 1,182 1.22 6.21 4.12 878 Region 2 Estimate 8,063 4.26 4.26 7.59 3,375 24.22 95% CL 1,543 0.61 2.67 1.98 927 Region 3 Estimate 4,619 5.06 2.71 8.22 2,071 17.81 95% CL 1,343 1.55 1.33 3.06 1,072 Region 4 Estimate 4,274 5.45 4.92 9.20 2,080 22.37 95% CL 1,305 2.14 2.25 3.76 1,211 Note: Number of hunters do not add up to the state total because some respondents report hunting in multiple regions or did not disclose their hunting location.
In terms of hours spent hunting per day afield, adult hunters consistently reported
having spent a slightly higher number of hours hunting than their youth counterparts,
regardless of region (Table 8). The average number of hours was highest in Region 1 for both
the adults and youth hunters.
Table 8: Estimated average number of hunting hours per day by TWRA administrative region for adult and youth hunters during the 2020 spring turkey hunting season in Tennessee
Adult Hunters Youth Hunters
Region Estimate 95% CL Estimate 95% CL
Region 1 4.69 0.22 4.28 0.53
Region 2 4.45 0.16 3.98 0.20
Region 3 4.62 0.22 4.06 0.37
Region 4 4.57 0.20 4.08 0.43
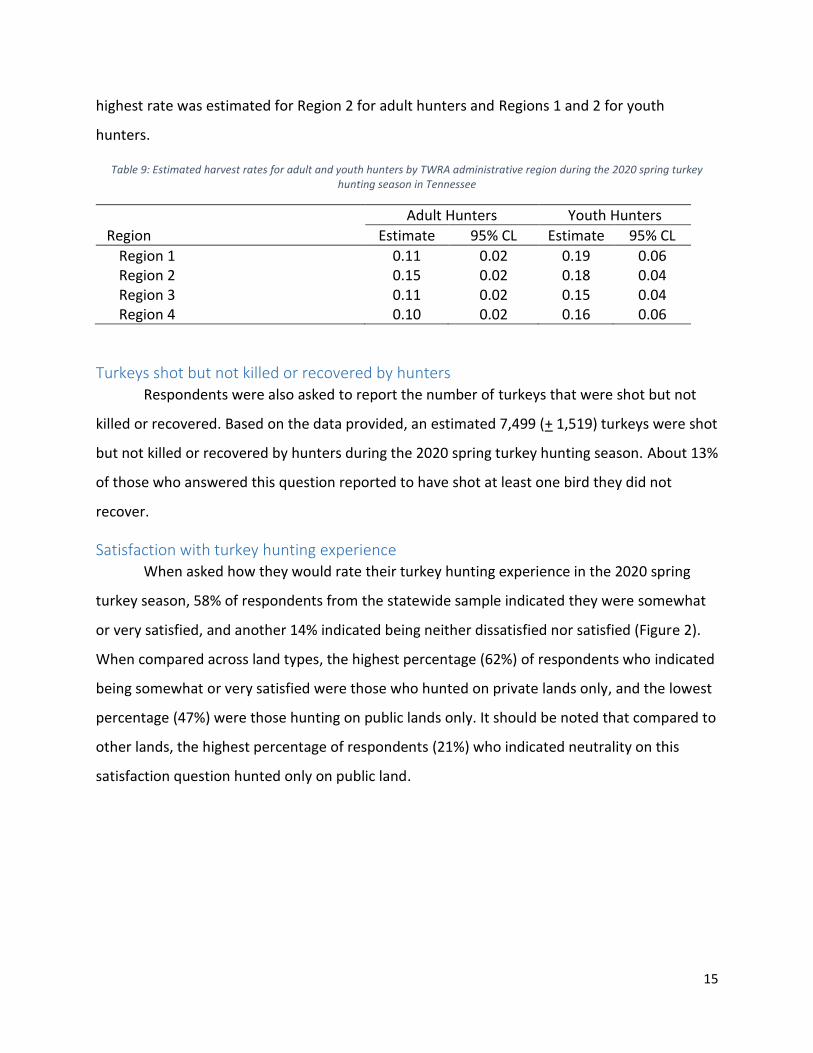
Harvest rate was tabulated for hunters across the different administrative regions (Table
9). This metric was consistently higher among youth hunters than adult hunters, and the
15
highest rate was estimated for Region 2 for adult hunters and Regions 1 and 2 for youth
hunters.
Table 9: Estimated harvest rates for adult and youth hunters by TWRA administrative region during the 2020 spring turkey hunting season in Tennessee
Adult Hunters Youth Hunters
Region Estimate 95% CL Estimate 95% CL
Region 1 0.11 0.02 0.19 0.06 Region 2 0.15 0.02 0.18 0.04 Region 3 0.11 0.02 0.15 0.04 Region 4 0.10 0.02 0.16 0.06
Turkeys shot but not killed or recovered by hunters Respondents were also asked to report the number of turkeys that were shot but not
killed or recovered. Based on the data provided, an estimated 7,499 (+ 1,519) turkeys were shot
but not killed or recovered by hunters during the 2020 spring turkey hunting season. About 13%
of those who answered this question reported to have shot at least one bird they did not
recover.
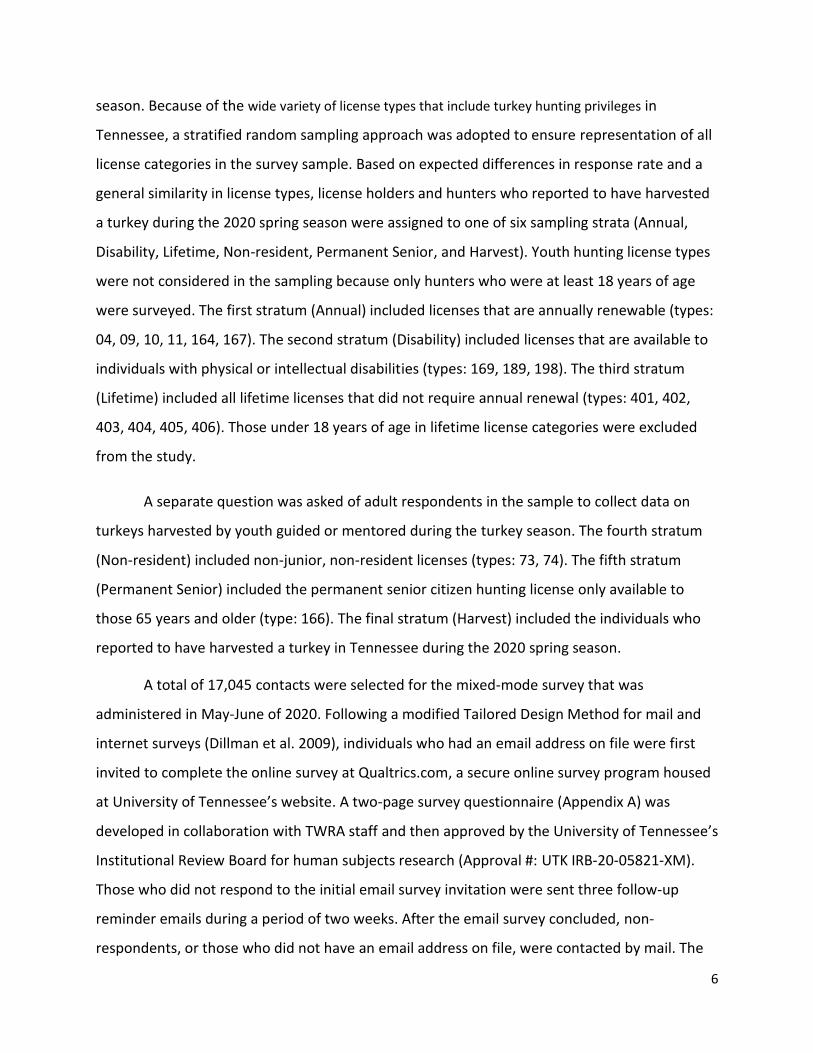
Satisfaction with turkey hunting experience When asked how they would rate their turkey hunting experience in the 2020 spring
turkey season, 58% of respondents from the statewide sample indicated they were somewhat
or very satisfied, and another 14% indicated being neither dissatisfied nor satisfied (Figure 2).
When compared across land types, the highest percentage (62%) of respondents who indicated
being somewhat or very satisfied were those who hunted on private lands only, and the lowest
percentage (47%) were those hunting on public lands only. It should be noted that compared to
other lands, the highest percentage of respondents (21%) who indicated neutrality on this
satisfaction question hunted only on public land.
16
Figure 2: Survey respondents' reported satisfaction with the 2020 spring turkey hunting experience by type of land hunted (From top: n1 = 365, n2 = 288, n3 = 2,051, n4 = 2,742)
A comparison of satisfaction with the 2020 spring turkey hunting experience among the
respondents across the different administrative regions showed notable similarity (Figure 3).
Compared to Regions 1 and 4, a higher proportion in Regions 2 and 3 indicated being very
satisfied.
Figure 3: Survey respondents' reported satisfaction with the 2020 spring turkey hunting experience by TWRA region (From top: n1 = 534, n2 = 528, n3 = 1,128, n4 = 668)
11%
10%
13%
16%
16%
15%
18%
22%
14%
13%
21%
13%
28%
29%
30%
26%
30%
33%
17%
23%
0% 10% 20% 30% 40% 50% 60% 70% 80% 90% 100%
Overall
Private Land Only
Public Land Only
Private and Public
Very dissatisfied Somewhat dissatisfied Neither dissatisfied nor satisfied
Somewhat satisfied Very satisfied
11%
15%
10%
11%
12%
16%
18%
16%
16%
17%
14%
15%
12%
15%
15%
28%
28%
28%
27%
30%
30%
24%
35%
31%
26%
0% 10% 20% 30% 40% 50% 60% 70% 80% 90% 100%
Statewide
Region 1
Region 2
Region 3
Region 4
Very dissatisfied Somewhat dissatisfied Neither dissatisfied nor satisfied
Somewhat satisfied Very satisfied
17
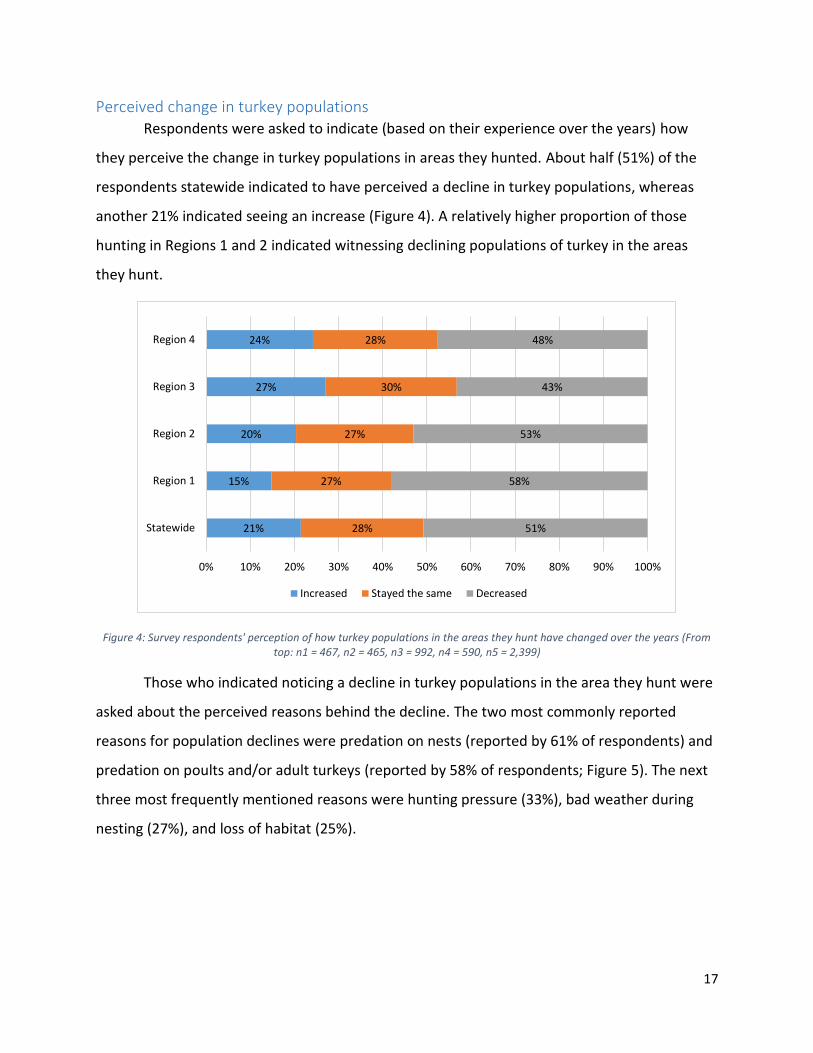
Perceived change in turkey populations Respondents were asked to indicate (based on their experience over the years) how
they perceive the change in turkey populations in areas they hunted. About half (51%) of the
respondents statewide indicated to have perceived a decline in turkey populations, whereas
another 21% indicated seeing an increase (Figure 4). A relatively higher proportion of those
hunting in Regions 1 and 2 indicated witnessing declining populations of turkey in the areas
they hunt.
Figure 4: Survey respondents' perception of how turkey populations in the areas they hunt have changed over the years (From top: n1 = 467, n2 = 465, n3 = 992, n4 = 590, n5 = 2,399)
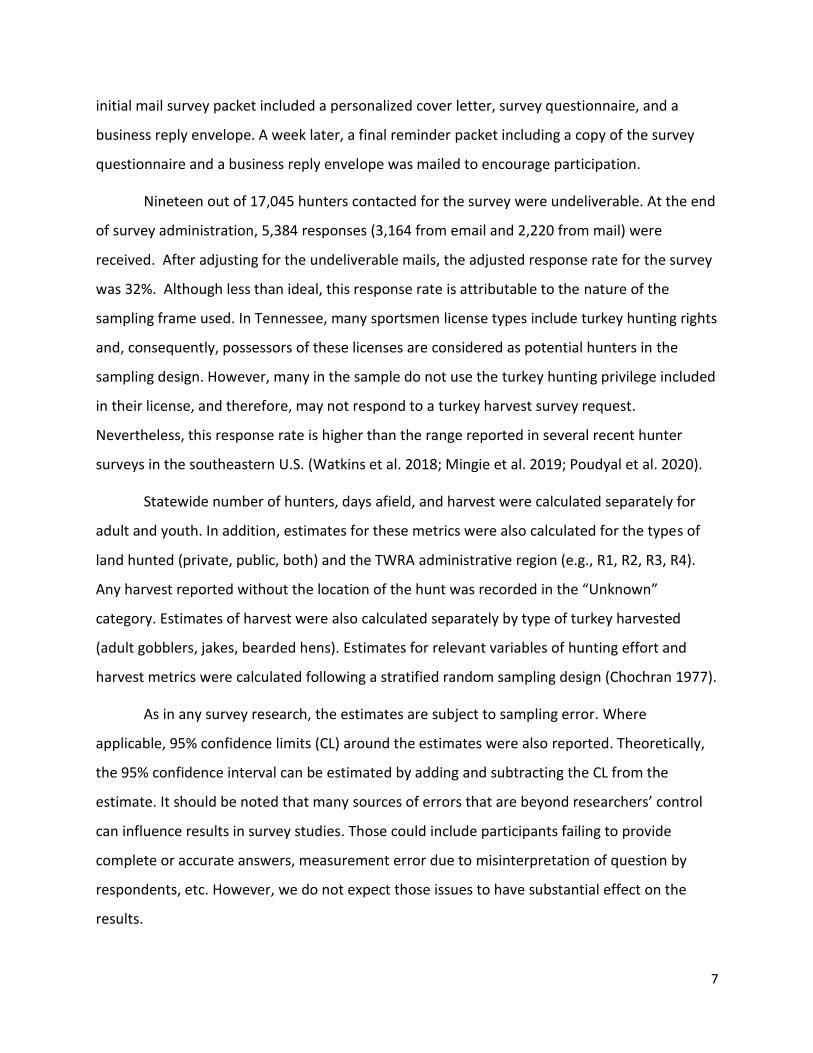
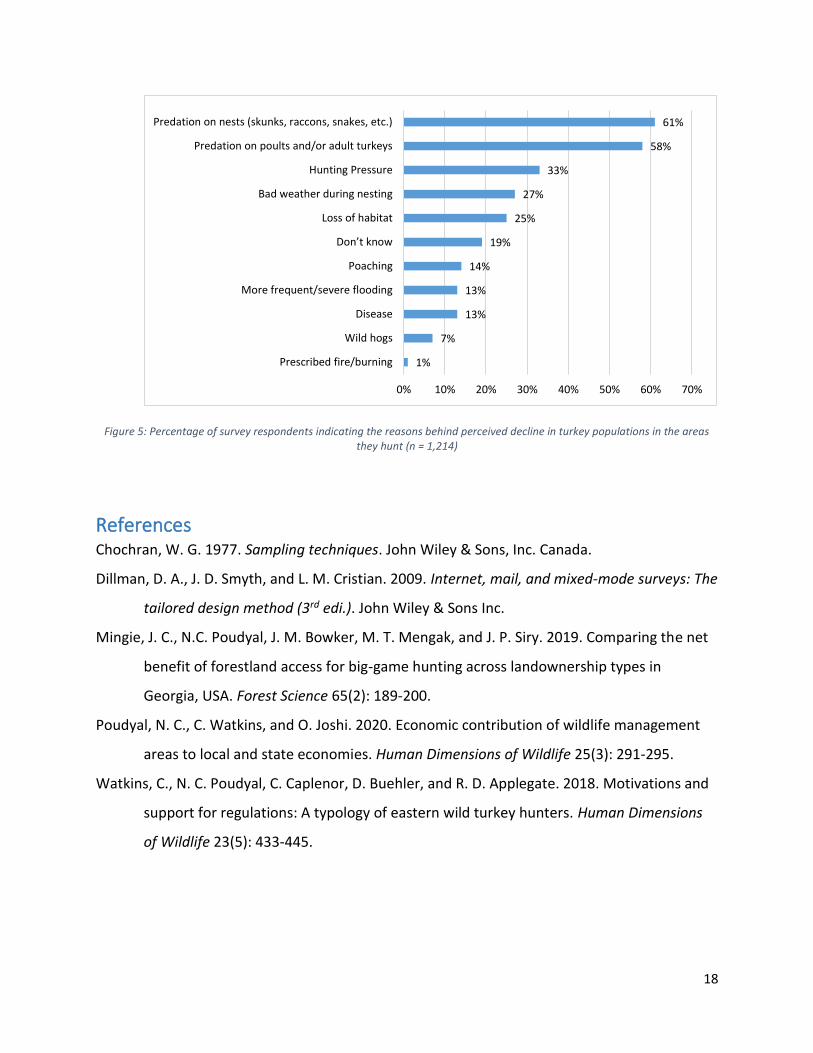
Those who indicated noticing a decline in turkey populations in the area they hunt were
asked about the perceived reasons behind the decline. The two most commonly reported
reasons for population declines were predation on nests (reported by 61% of respondents) and
predation on poults and/or adult turkeys (reported by 58% of respondents; Figure 5). The next
three most frequently mentioned reasons were hunting pressure (33%), bad weather during
nesting (27%), and loss of habitat (25%).
21%
15%
20%
27%
24%
28%
27%
27%
30%
28%
51%
58%
53%
43%
48%
0% 10% 20% 30% 40% 50% 60% 70% 80% 90% 100%
Statewide
Region 1
Region 2
Region 3
Region 4
Increased Stayed the same Decreased
18
Figure 5: Percentage of survey respondents indicating the reasons behind perceived decline in turkey populations in the areas they hunt (n = 1,214)
References Chochran, W. G. 1977. Sampling techniques. John Wiley & Sons, Inc. Canada.
Dillman, D. A., J. D. Smyth, and L. M. Cristian. 2009. Internet, mail, and mixed-mode surveys: The
tailored design method (3rd edi.). John Wiley & Sons Inc.
Mingie, J. C., N.C. Poudyal, J. M. Bowker, M. T. Mengak, and J. P. Siry. 2019. Comparing the net
benefit of forestland access for big-game hunting across landownership types in
Georgia, USA. Forest Science 65(2): 189-200.
Poudyal, N. C., C. Watkins, and O. Joshi. 2020. Economic contribution of wildlife management
areas to local and state economies. Human Dimensions of Wildlife 25(3): 291-295.
Watkins, C., N. C. Poudyal, C. Caplenor, D. Buehler, and R. D. Applegate. 2018. Motivations and
support for regulations: A typology of eastern wild turkey hunters. Human Dimensions
of Wildlife 23(5): 433-445.
1%
7%
13%
13%
14%
19%
25%
27%
33%
58%
61%
0% 10% 20% 30% 40% 50% 60% 70%
Prescribed fire/burning
Wild hogs
Disease
More frequent/severe flooding
Poaching
Don’t know
Loss of habitat
Bad weather during nesting
Hunting Pressure
Predation on poults and/or adult turkeys
Predation on nests (skunks, raccons, snakes, etc.)

19
Appendix A: Survey questionnaire
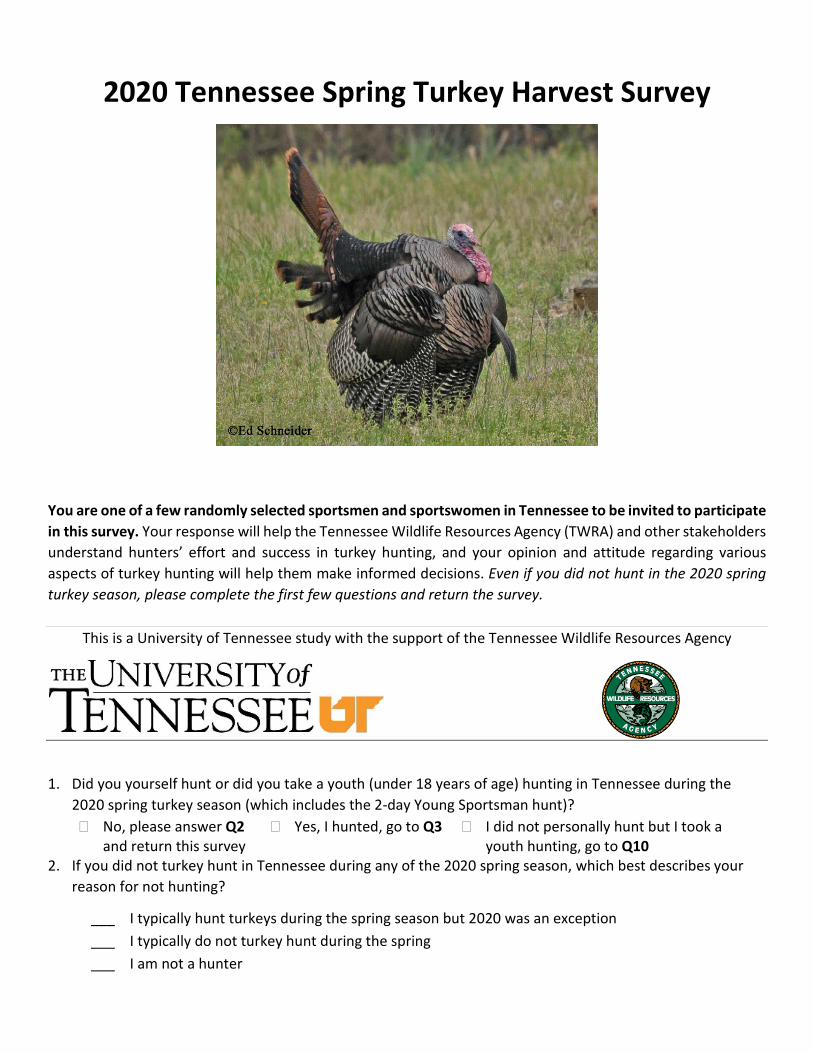
2020 Tennessee Spring Turkey Harvest Survey
You are one of a few randomly selected sportsmen and sportswomen in Tennessee to be invited to participate in this survey. Your response will help the Tennessee Wildlife Resources Agency (TWRA) and other stakeholders understand hunters’ effort and success in turkey hunting, and your opinion and attitude regarding various aspects of turkey hunting will help them make informed decisions. Even if you did not hunt in the 2020 spring turkey season, please complete the first few questions and return the survey.
This is a University of Tennessee study with the support of the Tennessee Wildlife Resources Agency
1. Did you yourself hunt or did you take a youth (under 18 years of age) hunting in Tennessee during the 2020 spring turkey season (which includes the 2-day Young Sportsman hunt)? � No, please answer Q2
and return this survey � Yes, I hunted, go to Q3 � I did not personally hunt but I took a
youth hunting, go to Q10 2. If you did not turkey hunt in Tennessee during any of the 2020 spring season, which best describes your
reason for not hunting?
___ I typically hunt turkeys during the spring season but 2020 was an exception ___ I typically do not turkey hunt during the spring ___ I am not a hunter
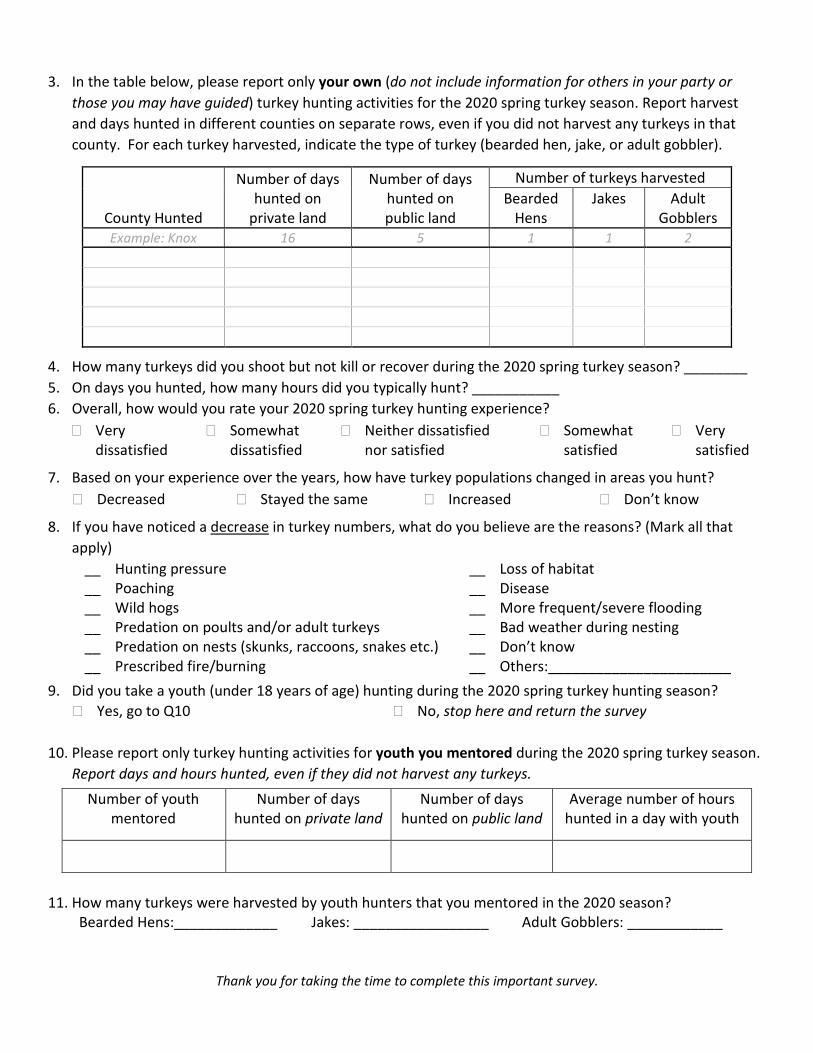
3. In the table below, please report only your own (do not include information for others in your party or those you may have guided) turkey hunting activities for the 2020 spring turkey season. Report harvest and days hunted in different counties on separate rows, even if you did not harvest any turkeys in that county. For each turkey harvested, indicate the type of turkey (bearded hen, jake, or adult gobbler).
County Hunted
Number of days hunted on
private land
Number of days hunted on public land
Number of turkeys harvested Bearded
Hens Jakes Adult
Gobblers Example: Knox 16 5 1 1 2
4. How many turkeys did you shoot but not kill or recover during the 2020 spring turkey season? ________ 5. On days you hunted, how many hours did you typically hunt? ___________ 6. Overall, how would you rate your 2020 spring turkey hunting experience?
� Very dissatisfied
� Somewhat dissatisfied
� Neither dissatisfied nor satisfied
� Somewhat satisfied
� Very satisfied
7. Based on your experience over the years, how have turkey populations changed in areas you hunt? � Decreased � Stayed the same � Increased � Don’t know
8. If you have noticed a decrease in turkey numbers, what do you believe are the reasons? (Mark all that apply)
__ Hunting pressure __ Loss of habitat __ Poaching __ Disease __ Wild hogs __ More frequent/severe flooding __ Predation on poults and/or adult turkeys __ Bad weather during nesting __ Predation on nests (skunks, raccoons, snakes etc.) __ Don’t know __ Prescribed fire/burning __ Others:_______________________
9. Did you take a youth (under 18 years of age) hunting during the 2020 spring turkey hunting season? � Yes, go to Q10 � No, stop here and return the survey
10. Please report only turkey hunting activities for youth you mentored during the 2020 spring turkey season. Report days and hours hunted, even if they did not harvest any turkeys.
Number of youth mentored
Number of days hunted on private land
Number of days hunted on public land
Average number of hours hunted in a day with youth
11. How many turkeys were harvested by youth hunters that you mentored in the 2020 season?
Bearded Hens:_____________ Jakes: _________________ Adult Gobblers: ____________
Thank you for taking the time to complete this important survey.