Embed Size (px)
DESCRIPTION
2nd GLOBE Natural Capital Accounting Study
Citation preview
2nd GLOBE Natural Capital Accounting StudyLegal and policy developments in twenty-one countries
INTERNATIONAL
Globe International – http://www.globeinternational.org/ UCL Institute for Sustainable Resources – http://www.bartlett.ucl.ac.uk/sustainable
THE GLOBE NATURAL CAPITAL ACCOUNTING STUDY
LEGAL AND POLICY DEVELOPMENTS IN TWENTY-ONE COUNTRIES
2ND EDITION
7TH JUNE 2014
Disclaimer and acknowledgements It would not have been possible to complete this publication without the contributions, advice and assistance provided by colleagues across the GLOBE and UCL networks. Financial support provided by the MAVA Foundation is also gratefully acknowledged. The views expressed, and accuracy of information documented, in this publication are not necessarily endorsed by or attributable to any organizations referred to herein.
This publication has been prepared for general guidance only, and is in no way intended as professional advice. No organization referred to in this publication represents or warrants, expressly or by implication, that the information contained herein is accurate or complete.
This publication is intended for public use and consumption. The authors encourage and authorize the free circulation of this publication as widely as possible. Users are welcome to download, save, or distribute this report electronically or in any other format, including in foreign language translation, without written permission of the authors. We do ask that if you do distribute this report, you credit the authors, cite the website <www.globeinternational.org> as the source and that you do not alter the text. An electronic copy of this report is available at <www.globeinternational.org> and at <www.bartlett.ucl.ac.uk/sustainable>.
The contributions of the authors of the 1st GLOBE Natural Capital Legislation Study, on which this publication builds, and the Report of the UCL Green Economy Policy Commission, are gratefully acknowledged.
The suggested citation for this report is: Ben Milligan, Emma Terama, Rafael Jiménez–Aybar, Paul Ekins (June 2014) GLOBE Natural Capital Accounting Study, 2nd Edition (GLOBE International and University College London, London).
© GLOBE International and University College London 2014.
Table of Contents
Summary and conclusions .............................................................................................................. 7
Progress in the featured countries .................................................................................................. 8
Legal and policy options for natural capital accounting .............................................................. 10
Key challenges to further progress ............................................................................................... 14
Foreword to the 2nd Edition .......................................................................................................... 15
Authors and contributors .............................................................................................................. 18
1. Introduction ............................................................................................................................ 20
2. Natural capital and accounting ............................................................................................. 23
2.1. Characteristics and components of natural capital............................................................. 23
2.2. Ecosystem services ............................................................................................................ 25
2.3. Natural capital accounting ................................................................................................. 27
3. International frameworks, strategies and standards .......................................................... 30
3.1. Legal and political commitments ....................................................................................... 30
3.2. Accounting standards ......................................................................................................... 36
3.3. Capacity-building partnerships .......................................................................................... 37
3.4. Research programs ............................................................................................................. 38
4. National legal and policy developments ............................................................................... 40
4.1. Botswana ............................................................................................................................ 41
4.2. Cameroon ........................................................................................................................... 46
4.3. Canada................................................................................................................................ 50
4.4. China .................................................................................................................................. 54
4.5. Colombia ............................................................................................................................ 56
4.6. Costa Rica .......................................................................................................................... 62
4.7. Democratic Republic of the Congo.................................................................................... 66
4.8. France ................................................................................................................................. 70
4.9. Georgia ............................................................................................................................... 74
4.10. Germany ........................................................................................................................... 79
4.11. Ghana ............................................................................................................................... 86
4.12. Guatemala ........................................................................................................................ 88
4.13. India ................................................................................................................................. 92
4.14. Japan ................................................................................................................................ 99
4.15. Mexico ........................................................................................................................... 103
4.16. Nigeria............................................................................................................................ 107
4.17. Peru ................................................................................................................................ 110
4.18. The Philippines .............................................................................................................. 116
4.19. Rwanda .......................................................................................................................... 123
4.20. Senegal ........................................................................................................................... 126
4.21. United Kingdom............................................................................................................. 129
5. Current progress and future action .................................................................................... 136
5.1. Legal and policy options for natural capital accounting .................................................. 136
5.2. Achievements, challenges and lessons learned ................................................................ 138
5.3. A vision for future action ................................................................................................. 140
Appendix 1: Questions for national contributors .................................................................... 142
List of Figures Figure 1 – Countries featured in the Study .................................................................................... 6 Figure 2 – Component stocks of natural capital and associated flows ........................................ 24 Figure 3 – Typology of ecosystem services ................................................................................. 25 Figure 4 – Main findings of the Millennium Ecosystem Assessment ......................................... 26 Figure 5 – Contributors to comprehensive wealth & scope of natural capital accounting .......... 28 Figure 6 – The UN–SEEA accounting framework ...................................................................... 36 Figure 7 – Legal and policy options for natural capital accounting: .......................................... 136 Figure 8 – Natural capital accounting: key implementation challenges .................................... 139 Figure 9 – Options for managing natural capital: improving the global knowledge-base ......... 141
List of Boxes Box 1 – Payments for ecosystem services schemes: Colombia ................................................... 61 Box 2 – Ecological compensation and ecosystem restoration: France ........................................ 73 Box 3 – Efficient water use: Germany ......................................................................................... 84 Box 4 – Protection of local habitat in the Lahn Valley: Germany ............................................... 85 Box 5 – Key frameworks for natural capital assessment: India ................................................... 94 Box 6 – State-level natural resources accounting studies: India .................................................. 96 Box 7 – Green accounting in Himachal Pradesh: India ............................................................... 98 Box 8 – Stork conservation in Hyogo Prefecture: Japan ........................................................... 102 Box 9 – Watershed funds: Northern Andes region .................................................................... 115 Box 10 – Key government agencies: The Philippines ............................................................... 118 Box 11 – Relevant policies and programs: The Philippines ...................................................... 119 Box 12 – Sibuyan Island payments for ecosystem services: The Philippines ........................... 122 Box 13 - Economic value of mangrove forests in Manila Bay: The Philippines ....................... 122 Box 14 – Osprey reintroduction project: United Kingdom ........................................................ 135 Box 15 – Peatland restoration: United Kingdom ....................................................................... 135
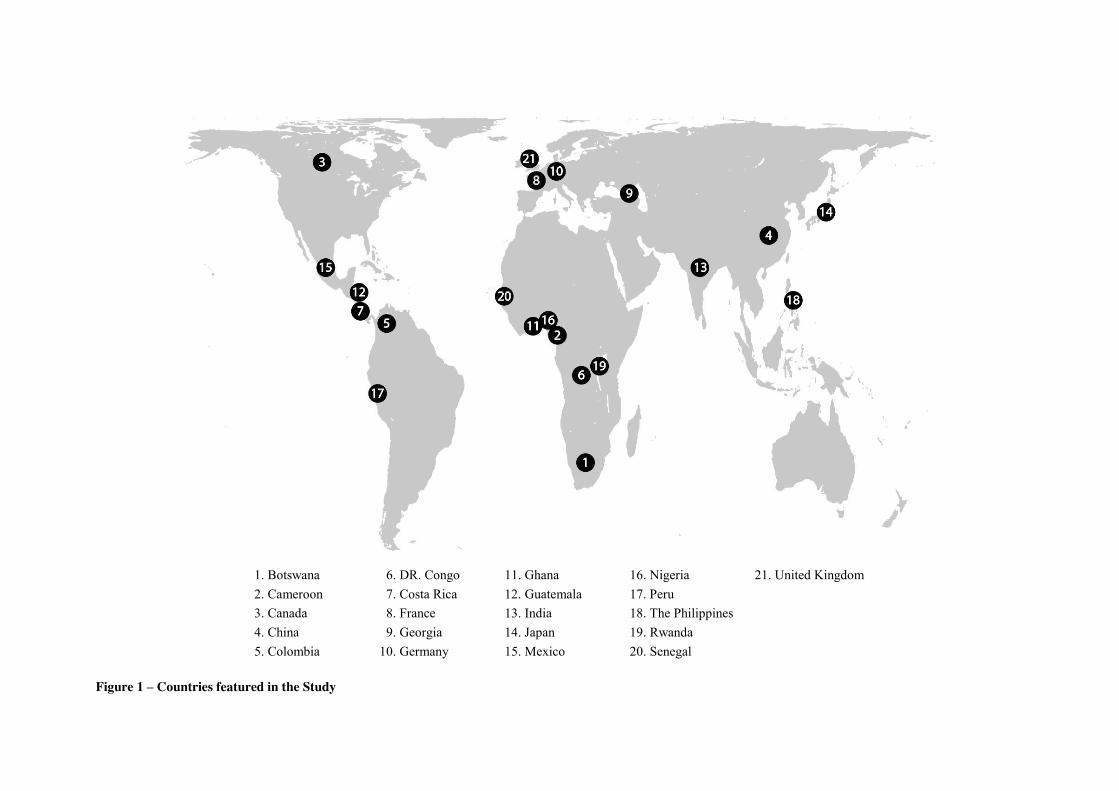
1. Botswana 06. DR. Congo 11. Ghana 16. Nigeria 21. United Kingdom 2. Cameroon 07. Costa Rica 12. Guatemala 17. Peru 3. Canada 08. France 13. India 18. The Philippines 4. China 09. Georgia 14. Japan 19. Rwanda 5. Colombia 10. Germany 15. Mexico 20. Senegal
Figure 1 – Countries featured in the Study
Page 7
Summary and conclusions
The natural environment provides goods and services that are essential for our well-being and development. Every part of the natural environment that is capable of contributing to human well-being is a capital asset – part of our ‘natural capital’. Natural capital includes renewable components such as ecosystems and solar energy, and non-renewable components such as mineral deposits and fossil fuels.
Human activity has substantially degraded the natural environment. The global stock of natural capital and valuable goods and services that it provides are being rapidly depleted, in some cases irreversibly. Conventional measures of wealth and economic development do not take this into account. The status of natural capital is not for example captured comprehensively by accounting frameworks such as the UN System of National Accounts, or by economic activity measures such as GDP.
There is an urgent need to develop effective methods and measures for natural capital accounting and to embed these within relevant legal and policy frameworks. This study is designed to inform efforts by legislators to address these needs. It summarizes key national and international efforts to develop legal and policy frameworks for natural capital accounting. We highlight experiences, challenges and lessons learned in twenty-one countries, and outline a vision for future action to improve the global knowledge-base concerning legal and policy options for managing natural capital. The three key conclusions of this study are as follows:
Efforts to develop laws and policies for natural capital accounting rely on continued cooperation and diverse forms of support. This entails international effort – accounting standards such as UN–SEEA; commitments and goals such as the post-2015 SDGs and Convention on Biological Diversity; capacity-building and research partnerships such as WAVES and TEEB. It also entails national efforts – involving various parts of government and diverse stakeholders, including communities and the private sector.
There is no ‘best practice’ approach to legal and policy reform for natural capital accounting. The task is complex and specific to national circumstances, cutting across many policies, institutions and sectors. Frameworks for natural capital accounting may involve combinations of new legislation, and new action under old laws. This study outlines practical approaches from several countries that may prove useful for others.
A key future challenge for legislators is to develop and share innovative approaches for sustainably managing natural capital. Accounting is an important step towards that goal – others are needed. This study highlights initial steps that countries have taken to link natural capital accounting with broader strategies for natural capital management.
Page 8
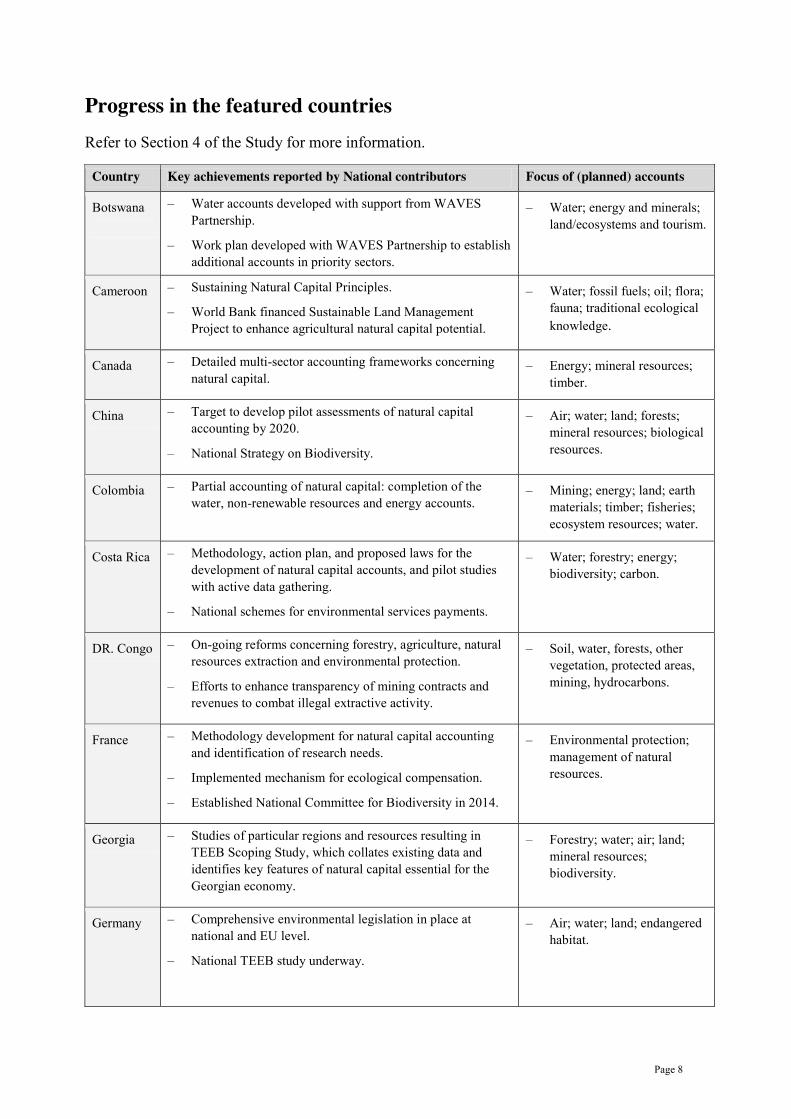
Progress in the featured countries
Refer to Section 4 of the Study for more information.
Country Key achievements reported by National contributors Focus of (planned) accounts
Botswana
– Water accounts developed with support from WAVES Partnership.
– Work plan developed with WAVES Partnership to establish additional accounts in priority sectors.
– Water; energy and minerals; land/ecosystems and tourism.
Cameroon – Sustaining Natural Capital Principles.
– World Bank financed Sustainable Land Management Project to enhance agricultural natural capital potential.
– Water; fossil fuels; oil; flora; fauna; traditional ecological knowledge.
Canada – Detailed multi-sector accounting frameworks concerning natural capital.
– Energy; mineral resources; timber.
China – Target to develop pilot assessments of natural capital accounting by 2020.
– National Strategy on Biodiversity.
– Air; water; land; forests; mineral resources; biological resources.
Colombia – Partial accounting of natural capital: completion of the water, non-renewable resources and energy accounts.
– Mining; energy; land; earth materials; timber; fisheries; ecosystem resources; water.
Costa Rica – Methodology, action plan, and proposed laws for the development of natural capital accounts, and pilot studies with active data gathering.
– National schemes for environmental services payments.
– Water; forestry; energy; biodiversity; carbon.
DR. Congo – On-going reforms concerning forestry, agriculture, natural resources extraction and environmental protection.
– Efforts to enhance transparency of mining contracts and revenues to combat illegal extractive activity.
– Soil, water, forests, other vegetation, protected areas, mining, hydrocarbons.
France – Methodology development for natural capital accounting and identification of research needs.
– Implemented mechanism for ecological compensation.
– Established National Committee for Biodiversity in 2014.
– Environmental protection; management of natural resources.
Georgia – Studies of particular regions and resources resulting in TEEB Scoping Study, which collates existing data and identifies key features of natural capital essential for the Georgian economy.
– Forestry; water; air; land; mineral resources; biodiversity.
Germany – Comprehensive environmental legislation in place at national and EU level.
– National TEEB study underway.
– Air; water; land; endangered habitat.
Page 9
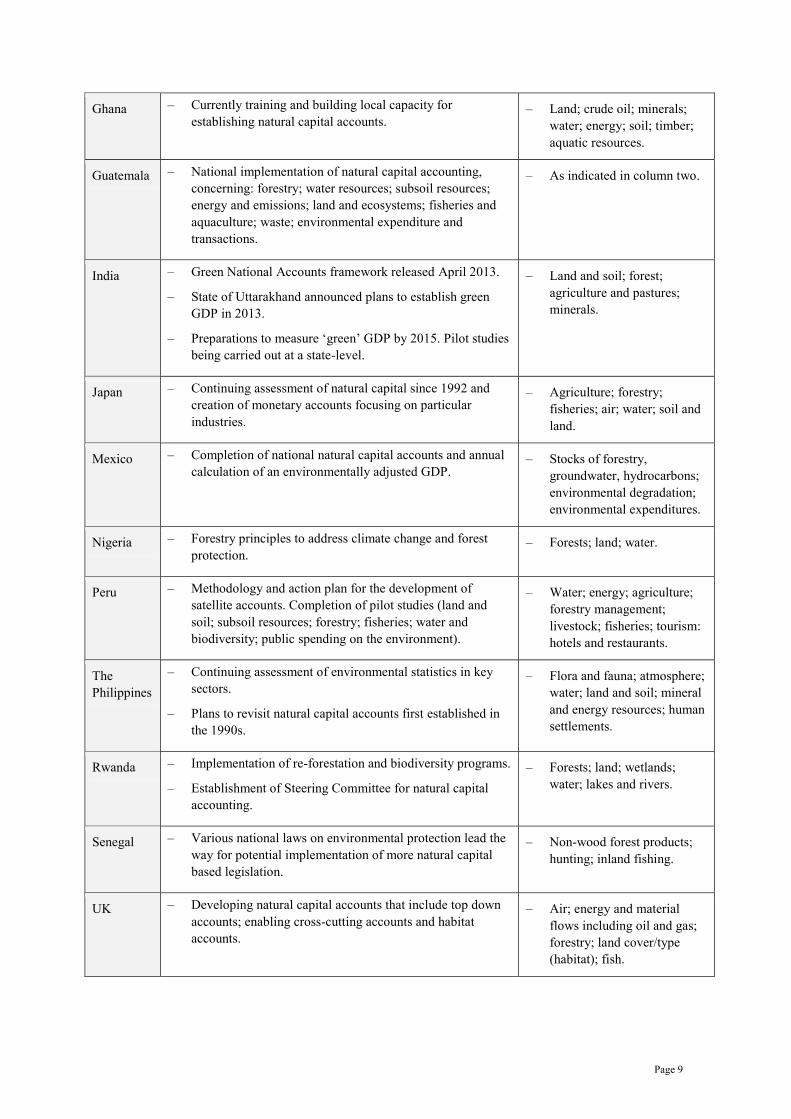
Ghana – Currently training and building local capacity for establishing natural capital accounts.
– Land; crude oil; minerals; water; energy; soil; timber; aquatic resources.
Guatemala – National implementation of natural capital accounting, concerning: forestry; water resources; subsoil resources; energy and emissions; land and ecosystems; fisheries and aquaculture; waste; environmental expenditure and transactions.
– As indicated in column two.
India – Green National Accounts framework released April 2013.
– State of Uttarakhand announced plans to establish green GDP in 2013.
– Preparations to measure ‘green’ GDP by 2015. Pilot studies being carried out at a state-level.
– Land and soil; forest; agriculture and pastures; minerals.
Japan – Continuing assessment of natural capital since 1992 and creation of monetary accounts focusing on particular industries.
– Agriculture; forestry; fisheries; air; water; soil and land.
Mexico – Completion of national natural capital accounts and annual calculation of an environmentally adjusted GDP.
– Stocks of forestry, groundwater, hydrocarbons; environmental degradation; environmental expenditures.
Nigeria – Forestry principles to address climate change and forest protection.
– Forests; land; water.
Peru – Methodology and action plan for the development of satellite accounts. Completion of pilot studies (land and soil; subsoil resources; forestry; fisheries; water and biodiversity; public spending on the environment).
– Water; energy; agriculture; forestry management; livestock; fisheries; tourism: hotels and restaurants.
The Philippines
– Continuing assessment of environmental statistics in key sectors.
– Plans to revisit natural capital accounts first established in the 1990s.
– Flora and fauna; atmosphere; water; land and soil; mineral and energy resources; human settlements.
Rwanda – Implementation of re-forestation and biodiversity programs.
– Establishment of Steering Committee for natural capital accounting.
– Forests; land; wetlands; water; lakes and rivers.
Senegal – Various national laws on environmental protection lead the way for potential implementation of more natural capital based legislation.
– Non-wood forest products; hunting; inland fishing.
UK – Developing natural capital accounts that include top down accounts; enabling cross-cutting accounts and habitat accounts.
– Air; energy and material flows including oil and gas; forestry; land cover/type (habitat); fish.
Page 10
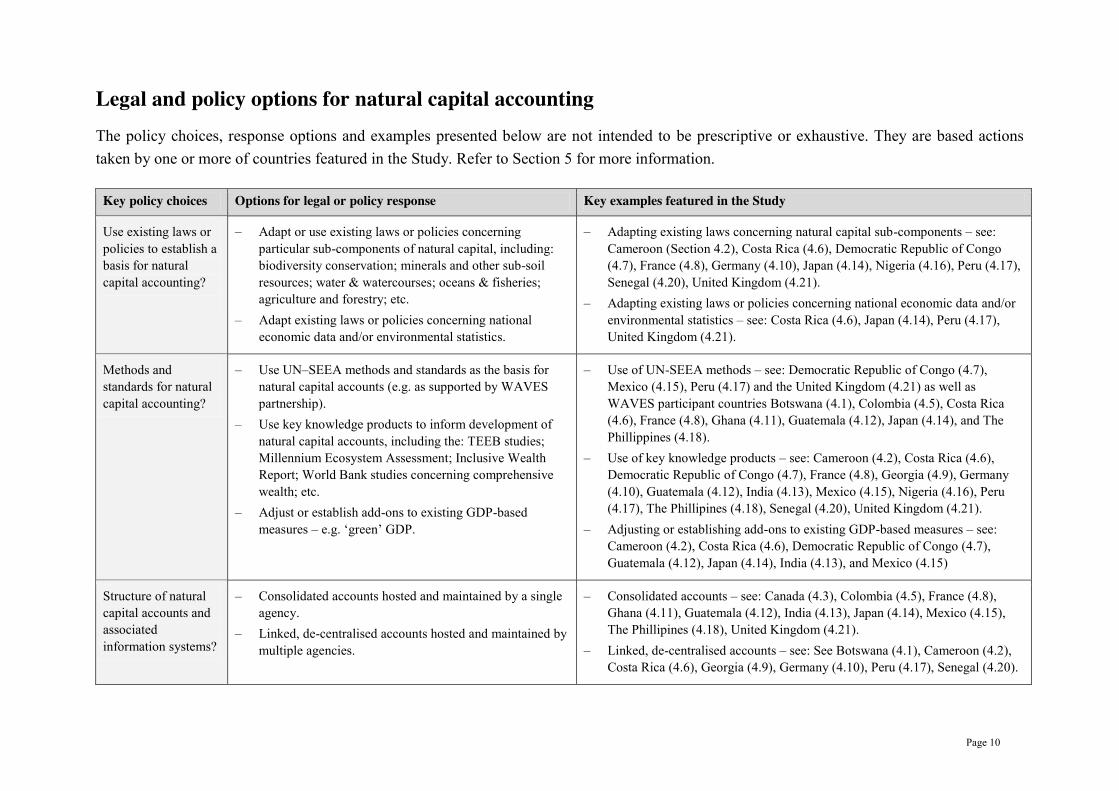
Legal and policy options for natural capital accounting
The policy choices, response options and examples presented below are not intended to be prescriptive or exhaustive. They are based actions taken by one or more of countries featured in the Study. Refer to Section 5 for more information.
Key policy choices Options for legal or policy response Key examples featured in the Study
Use existing laws or policies to establish a basis for natural capital accounting?
– Adapt or use existing laws or policies concerning particular sub-components of natural capital, including: biodiversity conservation; minerals and other sub-soil resources; water & watercourses; oceans & fisheries; agriculture and forestry; etc.
– Adapt existing laws or policies concerning national economic data and/or environmental statistics.
– Adapting existing laws concerning natural capital sub-components – see: Cameroon (Section 4.2), Costa Rica (4.6), Democratic Republic of Congo (4.7), France (4.8), Germany (4.10), Japan (4.14), Nigeria (4.16), Peru (4.17), Senegal (4.20), United Kingdom (4.21).
– Adapting existing laws or policies concerning national economic data and/or environmental statistics – see: Costa Rica (4.6), Japan (4.14), Peru (4.17), United Kingdom (4.21).
Methods and standards for natural capital accounting?
– Use UN–SEEA methods and standards as the basis for natural capital accounts (e.g. as supported by WAVES partnership).
– Use key knowledge products to inform development of natural capital accounts, including the: TEEB studies; Millennium Ecosystem Assessment; Inclusive Wealth Report; World Bank studies concerning comprehensive wealth; etc.
– Adjust or establish add-ons to existing GDP-based measures – e.g. ‘green’ GDP.
– Use of UN-SEEA methods – see: Democratic Republic of Congo (4.7), Mexico (4.15), Peru (4.17) and the United Kingdom (4.21) as well as WAVES participant countries Botswana (4.1), Colombia (4.5), Costa Rica (4.6), France (4.8), Ghana (4.11), Guatemala (4.12), Japan (4.14), and The Phillippines (4.18).
– Use of key knowledge products – see: Cameroon (4.2), Costa Rica (4.6), Democratic Republic of Congo (4.7), France (4.8), Georgia (4.9), Germany (4.10), Guatemala (4.12), India (4.13), Mexico (4.15), Nigeria (4.16), Peru (4.17), The Phillipines (4.18), Senegal (4.20), United Kingdom (4.21).
– Adjusting or establishing add-ons to existing GDP-based measures – see: Cameroon (4.2), Costa Rica (4.6), Democratic Republic of Congo (4.7), Guatemala (4.12), Japan (4.14), India (4.13), and Mexico (4.15)
Structure of natural capital accounts and associated information systems?
– Consolidated accounts hosted and maintained by a single agency.
– Linked, de-centralised accounts hosted and maintained by multiple agencies.
– Consolidated accounts – see: Canada (4.3), Colombia (4.5), France (4.8), Ghana (4.11), Guatemala (4.12), India (4.13), Japan (4.14), Mexico (4.15), The Phillipines (4.18), United Kingdom (4.21).
– Linked, de-centralised accounts – see: See Botswana (4.1), Cameroon (4.2), Costa Rica (4.6), Georgia (4.9), Germany (4.10), Peru (4.17), Senegal (4.20).
Page 11
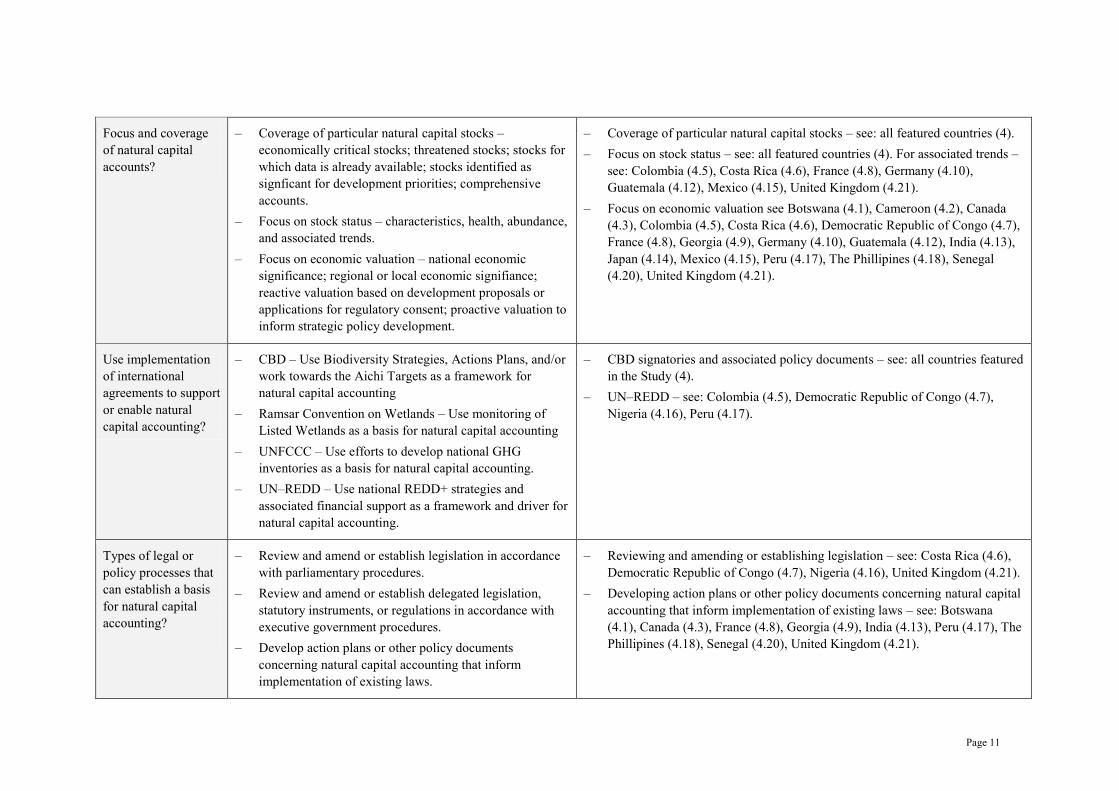
Focus and coverage of natural capital accounts?
– Coverage of particular natural capital stocks – economically critical stocks; threatened stocks; stocks for which data is already available; stocks identified as signficant for development priorities; comprehensive accounts.
– Focus on stock status – characteristics, health, abundance, and associated trends.
– Focus on economic valuation – national economic significance; regional or local economic signifiance; reactive valuation based on development proposals or applications for regulatory consent; proactive valuation to inform strategic policy development.
– Coverage of particular natural capital stocks – see: all featured countries (4). – Focus on stock status – see: all featured countries (4). For associated trends –
see: Colombia (4.5), Costa Rica (4.6), France (4.8), Germany (4.10), Guatemala (4.12), Mexico (4.15), United Kingdom (4.21).
– Focus on economic valuation see Botswana (4.1), Cameroon (4.2), Canada (4.3), Colombia (4.5), Costa Rica (4.6), Democratic Republic of Congo (4.7), France (4.8), Georgia (4.9), Germany (4.10), Guatemala (4.12), India (4.13), Japan (4.14), Mexico (4.15), Peru (4.17), The Phillipines (4.18), Senegal (4.20), United Kingdom (4.21).
Use implementation of international agreements to support or enable natural capital accounting?
– CBD – Use Biodiversity Strategies, Actions Plans, and/or work towards the Aichi Targets as a framework for natural capital accounting
– Ramsar Convention on Wetlands – Use monitoring of Listed Wetlands as a basis for natural capital accounting
– UNFCCC – Use efforts to develop national GHG inventories as a basis for natural capital accounting.
– UN–REDD – Use national REDD+ strategies and associated financial support as a framework and driver for natural capital accounting.
– CBD signatories and associated policy documents – see: all countries featured in the Study (4).
– UN–REDD – see: Colombia (4.5), Democratic Republic of Congo (4.7), Nigeria (4.16), Peru (4.17).
Types of legal or policy processes that can establish a basis for natural capital accounting?
– Review and amend or establish legislation in accordance with parliamentary procedures.
– Review and amend or establish delegated legislation, statutory instruments, or regulations in accordance with executive government procedures.
– Develop action plans or other policy documents concerning natural capital accounting that inform implementation of existing laws.
– Reviewing and amending or establishing legislation – see: Costa Rica (4.6), Democratic Republic of Congo (4.7), Nigeria (4.16), United Kingdom (4.21).
– Developing action plans or other policy documents concerning natural capital accounting that inform implementation of existing laws – see: Botswana (4.1), Canada (4.3), France (4.8), Georgia (4.9), India (4.13), Peru (4.17), The Phillipines (4.18), Senegal (4.20), United Kingdom (4.21).
Page 12
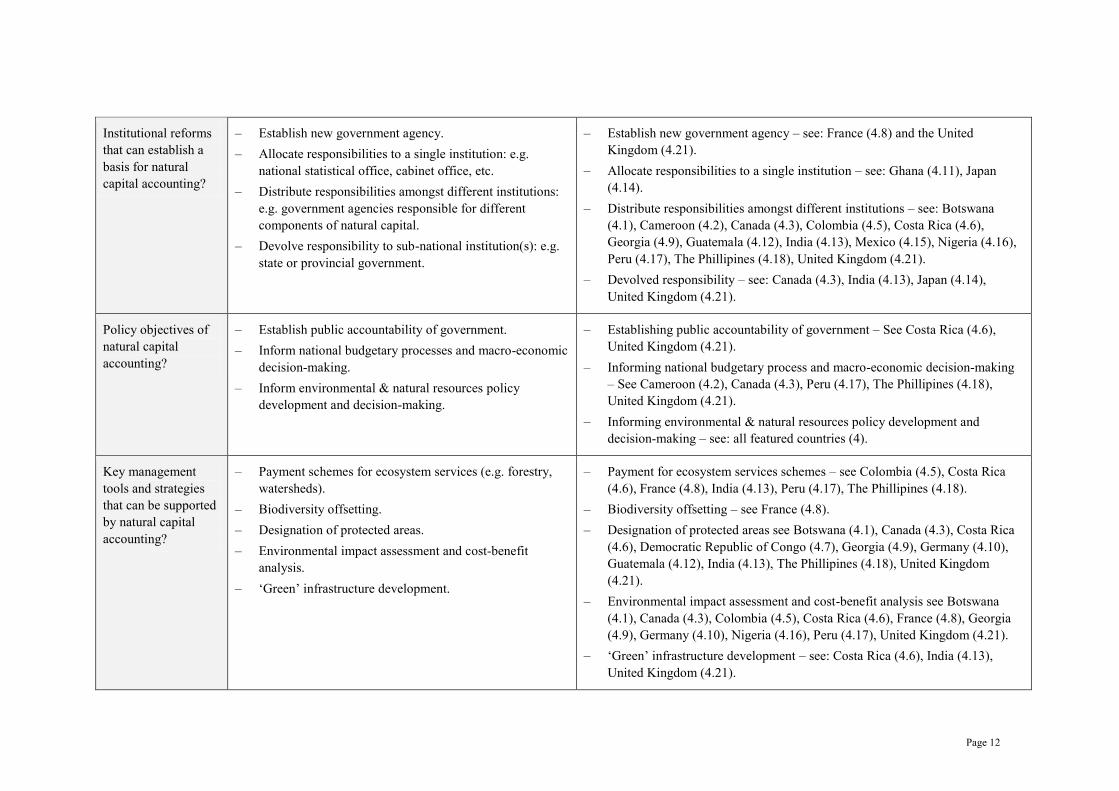
Institutional reforms that can establish a basis for natural capital accounting?
– Establish new government agency. – Allocate responsibilities to a single institution: e.g.
national statistical office, cabinet office, etc. – Distribute responsibilities amongst different institutions:
e.g. government agencies responsible for different components of natural capital.
– Devolve responsibility to sub-national institution(s): e.g. state or provincial government.
– Establish new government agency – see: France (4.8) and the United Kingdom (4.21).
– Allocate responsibilities to a single institution – see: Ghana (4.11), Japan (4.14).
– Distribute responsibilities amongst different institutions – see: Botswana (4.1), Cameroon (4.2), Canada (4.3), Colombia (4.5), Costa Rica (4.6), Georgia (4.9), Guatemala (4.12), India (4.13), Mexico (4.15), Nigeria (4.16), Peru (4.17), The Phillipines (4.18), United Kingdom (4.21).
– Devolved responsibility – see: Canada (4.3), India (4.13), Japan (4.14), United Kingdom (4.21).
Policy objectives of natural capital accounting?
– Establish public accountability of government. – Inform national budgetary processes and macro-economic
decision-making. – Inform environmental & natural resources policy
development and decision-making.
– Establishing public accountability of government – See Costa Rica (4.6), United Kingdom (4.21).
– Informing national budgetary process and macro-economic decision-making – See Cameroon (4.2), Canada (4.3), Peru (4.17), The Phillipines (4.18), United Kingdom (4.21).
– Informing environmental & natural resources policy development and decision-making – see: all featured countries (4).
Key management tools and strategies that can be supported by natural capital accounting?
– Payment schemes for ecosystem services (e.g. forestry, watersheds).
– Biodiversity offsetting. – Designation of protected areas. – Environmental impact assessment and cost-benefit
analysis. – ‘Green’ infrastructure development.
– Payment for ecosystem services schemes – see Colombia (4.5), Costa Rica (4.6), France (4.8), India (4.13), Peru (4.17), The Phillipines (4.18).
– Biodiversity offsetting – see France (4.8). – Designation of protected areas see Botswana (4.1), Canada (4.3), Costa Rica
(4.6), Democratic Republic of Congo (4.7), Georgia (4.9), Germany (4.10), Guatemala (4.12), India (4.13), The Phillipines (4.18), United Kingdom (4.21).
– Environmental impact assessment and cost-benefit analysis see Botswana (4.1), Canada (4.3), Colombia (4.5), Costa Rica (4.6), France (4.8), Georgia (4.9), Germany (4.10), Nigeria (4.16), Peru (4.17), United Kingdom (4.21).
– ‘Green’ infrastructure development – see: Costa Rica (4.6), India (4.13), United Kingdom (4.21).
Page 13
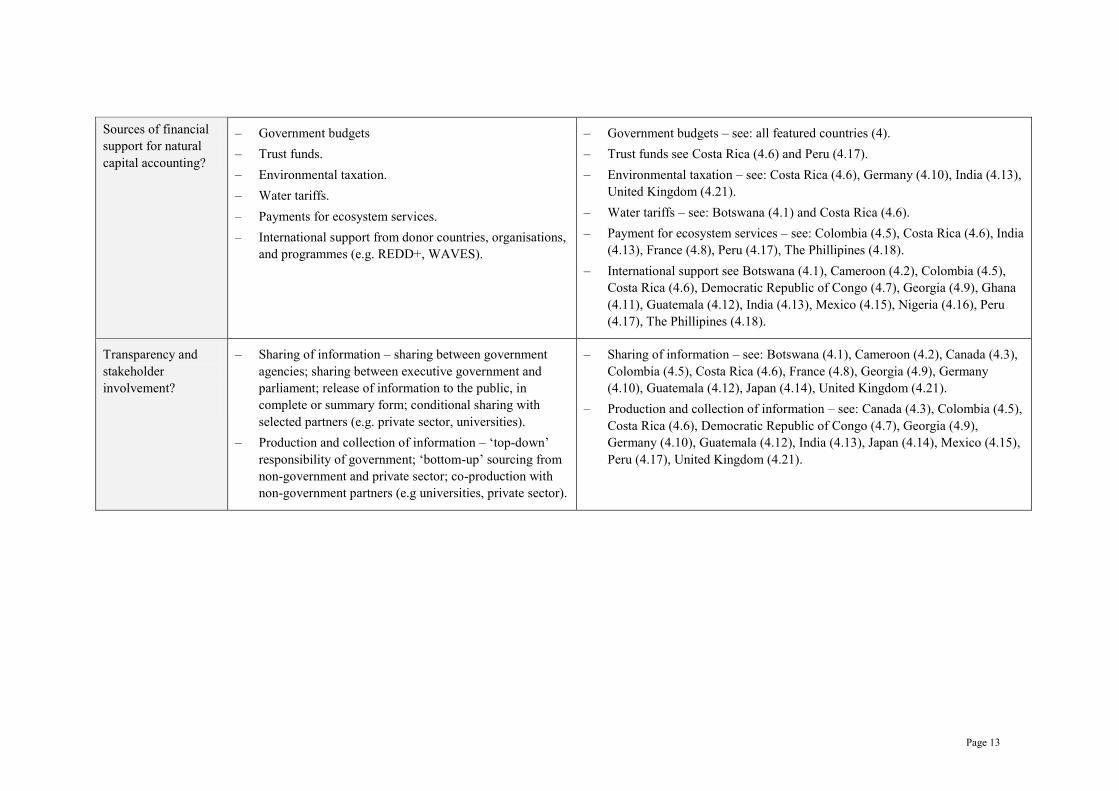
Sources of financial support for natural capital accounting?
– Government budgets – Trust funds. – Environmental taxation. – Water tariffs. – Payments for ecosystem services. – International support from donor countries, organisations,
and programmes (e.g. REDD+, WAVES).
– Government budgets – see: all featured countries (4). – Trust funds see Costa Rica (4.6) and Peru (4.17). – Environmental taxation – see: Costa Rica (4.6), Germany (4.10), India (4.13),
United Kingdom (4.21). – Water tariffs – see: Botswana (4.1) and Costa Rica (4.6). – Payment for ecosystem services – see: Colombia (4.5), Costa Rica (4.6), India
(4.13), France (4.8), Peru (4.17), The Phillipines (4.18). – International support see Botswana (4.1), Cameroon (4.2), Colombia (4.5),
Costa Rica (4.6), Democratic Republic of Congo (4.7), Georgia (4.9), Ghana (4.11), Guatemala (4.12), India (4.13), Mexico (4.15), Nigeria (4.16), Peru (4.17), The Phillipines (4.18).
Transparency and stakeholder involvement?
– Sharing of information – sharing between government agencies; sharing between executive government and parliament; release of information to the public, in complete or summary form; conditional sharing with selected partners (e.g. private sector, universities).
– Production and collection of information – ‘top-down’ responsibility of government;; ‘bottom-up’ sourcing from non-government and private sector; co-production with non-government partners (e.g universities, private sector).
– Sharing of information – see: Botswana (4.1), Cameroon (4.2), Canada (4.3), Colombia (4.5), Costa Rica (4.6), France (4.8), Georgia (4.9), Germany (4.10), Guatemala (4.12), Japan (4.14), United Kingdom (4.21).
– Production and collection of information – see: Canada (4.3), Colombia (4.5), Costa Rica (4.6), Democratic Republic of Congo (4.7), Georgia (4.9), Germany (4.10), Guatemala (4.12), India (4.13), Japan (4.14), Mexico (4.15), Peru (4.17), United Kingdom (4.21).
Page 14
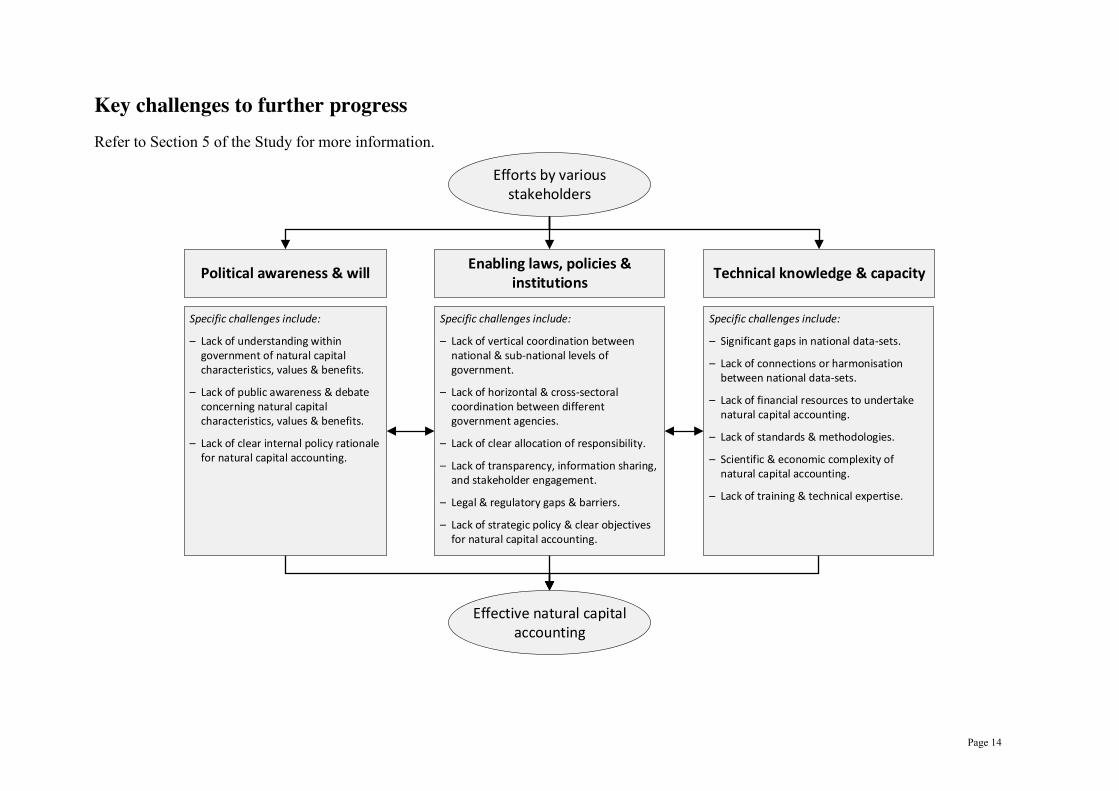
Key challenges to further progress
Refer to Section 5 of the Study for more information.
Political awareness & will Technical knowledge & capacityEnabling laws, policies &
institutions
Specific challenges include:
– Lack of understanding within government of natural capital characteristics, values & benefits.
– Lack of public awareness & debate concerning natural capital characteristics, values & benefits.
– Lack of clear internal policy rationale for natural capital accounting.
Specific challenges include:
– Lack of vertical coordination between national & sub-national levels of government.
– Lack of horizontal & cross-sectoral coordination between different government agencies.
– Lack of clear allocation of responsibility.
– Lack of transparency, information sharing, and stakeholder engagement.
– Legal & regulatory gaps & barriers.
– Lack of strategic policy & clear objectives for natural capital accounting.
Specific challenges include:
– Significant gaps in national data-sets.
– Lack of connections or harmonisation between national data-sets.
– Lack of financial resources to undertake natural capital accounting.
– Lack of standards & methodologies.
– Scientific & economic complexity of natural capital accounting.
– Lack of training & technical expertise.
Efforts by various stakeholders
Effective natural capital accounting
Page 15
Foreword to the 2nd Edition
The 1st edition of the GLOBE Natural Capital Study was launched in Berlin in June 2013 at the 1st GLOBE Natural Capital Legislators Summit, held at the German Bundestag. The launch of the Study provided input for a ground-breaking conversation between more than sixty legislators from twenty countries, about national efforts to advance the natural capital approach in their respective countries.
We noted how the Report of the High Level Panel of Eminent Persons on the Post-2015 Development Agenda had just proposed a fundamental rethink and a transformational change in mainstreaming a sustainable development vision informed by a ‘data revolution’, which ought to provide a more robust understanding of how human prosperity and well-being depend on nature.
In particular, we welcomed the proposed Goal 9 of the report, on the sustainable management of natural resources, as well as the recommendation that ‘the UN System of Environmental-Economic Accounting, the Wealth Accounting and Valuation of Ecosystem Services and the corporate sustainability accounting which have been piloted should be rolled out by 2030’.
We also agreed a Communiqué calling on our governments and governments everywhere, no later than 2020, to fully incorporate the value of natural capital into national accounting frameworks, and to regulate to ensure that businesses make transparent and open to public scrutiny their environmental externalities (such as their impacts upon natural capital) in their annual reports to shareholders. We did so because accounting and valuation of natural capital provide critical actionable information and transparency to the political decisions which legislators must make to balance human development and environmental protection in practical terms.
The strength of the Communiqué showed an extraordinary determination on the part of legislators to drive this agenda in their respective jurisdictions. We pledged unanimously to promote awareness and understanding of natural capital accounting in our legislatures and to hold our governments to account for the quality and quantity of support that they provide to international bodies such as the GEF, and to development banks and agencies. We also promised to scrutinise how natural capital is managed in our own countries, and to ensure that the appropriate policies, legislation and budgetary support are put in place.
The second edition of GLOBE's Study on Natural Capital Accounting, prepared in collaboration with the University College London Institute for Sustainable Resources, baselines efforts in twenty-one countries to advance environmental economic accounting. The expanded range of countries covered in this edition has enabled us to identify new champions, such as Mexico and Rwanda, and to confirm to what extent the ownership of the natural capital approach has extended in recent years across countries at all income levels.
However the Study also casts light on how advancement of the natural capital approach is hampered by large knowledge gaps, and how implementing the 2012 UN System of
Page 16
Environmental-Economic Accounting is a significant capacity challenge for National Statistical Offices and other government agencies. Investing in quality data for better decision-making is always a good idea, but the inability of many countries to allocate sufficient resources to this long-term endeavour amidst competing urgent short-term needs is a formidable challenge for the implementation of the natural capital approach in these countries – and for their ability to adopt economic development plans that are truly capable of increasing their national wealth, setting them on a course towards environmental, social and economic sustainability.
The support of donor countries and international institutions has been instrumental and very successful in spreading the seed of natural capital accounting as a key policy tool across the globe. However the capacity constraints reported in many of the countries surveyed reveal the extent to which this level of support is insufficient. Greater investment is needed to gather and analyse robust and regular data concerning the status and trends of ecosystems, associated ecosystem services, and underlying biodiversity, and to carry out corresponding economic valuations.
This is why GLOBE believes that by implementing a programme of National Ecosystem Assessments in just fifty countries around the planet, the Global Environment Facility could unfold a strategic vision for biodiversity that would materially change our capacity to meet the Aichi targets by 2020 and would place government accounting for Natural Capital at the heart of global understanding of the true nature of wealth.
It is equally critical that biodiversity and natural capital accounting receive appropriate recognition within the post 2015 United Nations Sustainable Development architecture. Natural capital accounting data capture our dependency on nature in actionable terms that can be incorporated into budgeting decision-making and national development plans. In other words, it is the tool that can enable decision-makers to operationalize the notion of sustainable development in particular cases, revealing the trade-offs of our political choices in the short and long term. This means that natural capital accounting would serve as the critical tool for delivery of not just the proposed Goal 9 of managing resources sustainably, but of all other Goals which depend on maintaining the Earth's capacity to provide the flow of environmental goods and services that sustain human life.
How could biodiversity and natural capital accounting be integrated as a cross-cutting issue in the post-2015 global development architecture?
The Central Framework of the 2012 SEEA will support a wider set of indicators related to sustainable development and green growth, linking poverty reduction and natural resource management, as one of many key issues that are central to pro-poor growth and social protection policies in developing countries. The 2012 SEEA, already implemented by initiatives such as the World Bank-led Wealth Accounting and Valuation Ecosystem Services (WAVES) partnership, ought to provide these integrated measurement frameworks and indicators to inform the post-2015 development agenda and the Sustainable Development Goals (SDGs).
Page 17
High-level political support should be mobilized to fund capacity development for institutional coordination and governance structures, statistical infrastructure and operations to improve the statistical production process of countries that are currently not able to produce the required data. The national strategies for development of statistics should be prioritized accordingly to meet the broader needs to inform decision-makers who shape macroeconomic developments.
The Aichi Biodiversity Targets and associated indicators can provide specific inputs for the SDGs, potential sub-targets and indicators. Aichi Biodiversity Target 2 calls for biodiversity values to be integrated into such national accounting systems, as well as into national and local development and poverty reduction strategies and planning processes.
Biodiversity should be integrated into overarching goals addressing broad concepts such as poverty eradication, an inclusive ‘green economy’, human well-being, and sustainable development. The integration of biodiversity into the SDG framework would be facilitated by improved environmental accounting data, and by the identification of suitable metrics, indicators and targets towards sustainable development, as alternatives to GDP, linking biodiversity to the various Goals of the framework.
Specific biodiversity-related targets and indicators should be integrated into Goals on food security and nutrition, water and health. Such goals, dealing with the physical constituents and determinants of human well-being, directly depend on, and directly impact, biodiversity and ecosystems. Biodiversity should also be included as a central component of goals for global “life support systems” such as goals relating to the protection of ecosystems, including land, forests and oceans, and their natural resources. Possible indicators could include trends in the provision of ecosystem services.
Finally, the SDGs framework should provide the enabling conditions for the conservation and sustainable use of biodiversity, and for the underlying drivers of biodiversity loss to be addressed. This implies Goals for improved governance, and institutions, at appropriate scales, from local to global, for the management of risks and the negotiation of trade-offs among stakeholder groups, where they exist, as well as for behavioural change. These goals do not depend directly on biodiversity, nor does their achievement directly involve the utilization of biodiversity. However, establishing SDGs of this type is needed to support the achievement of other SDGs.
Hon. Cedric Frolick MP President of GLOBE International President of GLOBE South Africa
Hon. David McGuinty MP Vice-President for Strategy, GLOBE International President of GLOBE Canada
Page 18
Authors and contributors
Lead authors
Ben MILLIGAN Centre for Law and Environment University College London
Emma TERAMA Institute for Sustainable Resources University College London
Rafael JIMÉNEZ-AYBAR Natural Capital Initiative Globe International
Paul EKINS Institute for Sustainable Resources University College London
National contributors Mattew ABABIO Ministry Lands and Forestry Ghana
Daniel ABUGATTÁS MAJLUF GLOBE Peru Peru
Shola ADEPOJU Federal College of Forestry, Jos Nigeria
Juan ALCÁZAR SOLÍS Congress of Guatemala Guatemala
Philipp BEHRENS Ministry for Environment … Germany
José Arturo BLANCAS ESPEJO National Institute for Statistics and Geography Mexico
Lina V. CASTRO Philippine Statistics Authority The Philippines
Marguerite CULOT-HORTH National Assembly France
David DARSAVELIDZE Ministry of Environment … Georgia
Edwin G. DOMINGO Department of Environment … The Philippines
Héctor R. GALINDO VANEGAS National Hydrocarbon Agency Colombia
Manuel D. GEROCHI Department of Environment … The Philippines
Bibiana GUEVARA ALDANA Ministry of the Environment Colombia
Jorge GUILLERMO ESCOBAR Ministry of Finance Guatemala
Roberto GUZMAN GUTIERREZ Ministry of the Environment … Costa Rica
Teresa S. HABITAN Department of Finance The Philippines
Helm HOLTZ Centre for Environmental Research Germany
Ruud JANSEN Office of the President Republic of Botswana
Ioseb KARTSIVADZE Ministry of Environment … Georgia
Jawed KHAN Office for National Statistics United Kingdom
Yuriko KOIKE President of Globe Japan Japan
Ursula LAUBER Federal Statistical Office Germany
Daniel Felipe LÓPEZ SIERRA National Planning Department Colombia
Tatiana MENDOZA LARA National Planning Department Colombia
Rose MUKANKOMEJE Environment Management Authority Rwanda
Bernice OFOSU-BAADU Ghana Statistical Service Ghana
Sibylle OPPEL–BRONIKOWSKI Federal Statistical Office Germany
Page 19
Mauricio OSPINA GÓMEZ President of Globe Colombia Colombia
Martin OYONO REPAR Cameroon
Michele PITTINI DEFRA United Kingdom
Romeo S. RECIDE Philippine Statistics Authority The Philippines
Luis RIVERA World Bank Costa Rica
L. H. SARMIENTO VILLAMIZAR Ministry of the Environment . . . Colombia
Pranav SINHA GLOBE India India
Robert SMITH Midsummer Analytics Canada
Carolina SOTO LOSADA Ministry of Finance Colombia
Ruperto TABODA DELGADO Ministry of the Environment Peru
Raymundo J. TALENTO Philippine Statistics Authority The Philippines
Alejandro VILCHEZ DE LOS RÍOS National Institute of Statistics … Peru
Mou WANG Academy of Social Sciences China
Mitasu YAMAMTO Otaru University of Commerce Japan
Joseph Ipalaka YOBWA Environment and Nature Conservation DRC
Parliamentary Network for Protection of the Environment National Assembly of Senegal
Academic contributors Raimund BLEISCHWITZ Institute for Sustainable Resources University College London
Simon DAMKJAER Institute for Sustainable Resources University College London
Louise GUIBRUNET Institute for Sustainable Resources University College London
Joel GUILBAUD Energy Institute University College London
Marie LONGNECKER Institute for Sustainable Resources University College London
Melissa C. LOTT Institute for Sustainable Resources University College London
Ruya PERINCEK Institute for Sustainable Resources University College London
Jemma QUEENBOROUGH Centre for Law and Environment University College London
Darshini RAVINDRANATH Institute for Sustainable Resources University College London
Bernard TEMBO Institute for Sustainable Resources University College London
Page 20 of 144
1. Introduction The natural environment provides goods and services that are essential for our well-being and development.1 Every part of the natural environment that is capable of contributing to human well-being is a capital asset – part of our ‘natural capital’. Natural capital includes renewable components such as ecosystems and solar energy, and non-renewable components such as mineral deposits and fossil fuels.2
Over the past 50 years, human activity has substantially degraded the natural environment.1 The global stock of natural capital and the valuable goods and services that it provides are being rapidly depleted, in some cases irreversibly.1 Conventional measures of wealth and economic development have not adequately taken this into account.3 As part of broader strategies to improve the way we manage natural capital, there is an urgent need to develop effective methods for natural capital accounting that are embedded in legal and policy frameworks at national and international levels.
The GLOBE Natural Capital Accounting Study is designed to inform efforts by legislators to address these needs. The specific objectives of the Study are to:
x Summarize current knowledge regarding the characteristics and components of natural capital, and their role as the foundation on which human economies, societies and prosperity are built.
x Summarize international efforts to develop strategies, frameworks and standards for natural capital accounting.
x Review national efforts in twenty-one countries (see Figure 1) to develop legal and policy frameworks for natural capital accounting – highlighting key experiences, challenges and lessons learned.
x Identify opportunities for future action to improve the global knowledge-base concerning legal and policy options for implementing natural capital accounting, and broader strategies for managing natural capital.
The Study is the product of a partnership between GLOBE International, the University College London (UCL) Institute for Sustainable Resources (ISR), and national contributors based in the countries referred to above. It forms part of the GLOBE Natural Capital Initiative (GNCI),
1 See: Millennium Ecosystem Assessment (2005) Ecosystems and Human Well-Being: Synthesis (Island Press, Washington, DC). UNEP (2012) Global Environmental Outlook 5: Environment for the Future We Want (Progress Press, Valetta, Malta). 2 See: Pushpam Kumar (ed) (2012) The Economics of Ecosystems and Biodiversity: Ecological and Economic Foundations (Routledge Press, Oxford, New York). European Commission (April 2013) Mapping and Assessment of Ecosystems and their Services: An analytical framework for ecosystem assessments under Action 5 of the EU Biodiversity Strategy to 2020 (Technical Report 2013-067). UK Natural Capital Committee (March 2014) The State of Natural Capital: Restoring our Natural Assets. 3 See: UNU-IHDP and UNEP (2012) Inclusive Wealth Report 2012: Measuring progress toward sustainability (Cambridge University Press, Cambridge). Joseph E. Stiglitz, Amartya Sen, Jean-Paul Fitoussi (September 2009) Report of the Commission on the Measurement of Economic Performance and Social Progress.
Page 21 of 144
which was launched in September 2012. The GNCI is designed to support implementation of several commitments included in the GLOBE Rio+20 Legislators’ Protocol, approved in June 2012 at the 1st World Summit of Legislators in Rio de Janeiro.4
The principal objective of the GNCI is to ensure that the concept of natural capital is understood and given appropriate expression through policy by national governments, and that this process takes place consistently and across all government departments.5 To that end, GNCI works towards establishing an international process for national legislators to support the development and implementation of natural capital accounting. The first phase of the Initiative was completed in June 2013, coinciding with the publication of the 1st Edition of the GLOBE Natural Capital Accounting Study,6 which reviewed legal and policy developments in eight countries. The 2nd Edition of the Study is organized as follows:
x Section 2 introduces the concepts of natural capital and natural capital accounting. It summarizes current knowledge regarding the characteristics and components of natural capital and their role as the foundation on which human economies, societies, and prosperity are built. Taking into account the findings of the Millennium Ecosystem Assessment,1 (MA) attention is also devoted to explaining the significant role of ecosystem services provided by natural capital.
x Section 3 focuses on international efforts to develop strategies, frameworks and standards for natural capital accounting. Particular attention is devoted to summarizing efforts that this Study is intended to complement, including the: United Nations System of Environmental–Economic Accounting (UN–SEEA);7 Partnership for Wealth Accounting and the Valuation of Ecosystem Services (WAVES);8 United Nations Collaborative Programme on Reducing Emissions from Deforestation and Forest Degradation in Developing Countries (UN–REDD);9 The Economics of Ecosystems and Biodiversity Initiative (TEEB),10 and processes associated with the United Nations post-2015 development agenda.11 Key features of relevant legal and political commitments are also discussed, including those established in accordance with the 1992 Convention on Biological Diversity (CBD),12 and 1992 United Nations Framework Convention on Climate Change (UNFCCC).13
4 See: <http://www.globeinternational.org/images/PDF/WSL2012/legislators-protocol.pdf>. 5 See: <http://www.globeinternational.org/the-globe-natural-capital-initiative>. 6 Sophie Allebone–Webb, Rafael Jiménez–Aybar, Adam Matthews, Danny Stevens (2013) The GLOBE Natural Capital Legislation Study: A Review of Efforts towards Natural Capital Legislation in Eight Countries . 7 See: <https://unstats.un.org/unsd/envaccounting/seea.asp>. 8 See: <http://www.wavespartnership.org/>. 9 See: <http://www.un-redd.org/>. 10 See: <http://www.teebweb.org/>. 11 See <http://sustainabledevelopment.un.org/> and < http://www.un.org/en/ecosoc/about/mdg.shtml>. 12 Convention on Biological Diversity. Adopted 5 June 1992, in force 29 December 1993, 1760 UNTS 79. See: <http://www.cbd.int/>. 13 United Nations Framework Convention on Climate Change. Adopted 9 May 1992, in force 21 March 1994, 31 ILM (1992). See: <http://www.unfccc.int/>.
Page 22 of 144
x Section 4 documents national efforts in the twenty-one countries listed in Figure 1 to develop legal and policy frameworks for natural capital accounting, and link these with broader approaches to natural capital management. It outlines the focus of relevant natural capital accounts, in addition to key national challenges and success stories identified by national contributors. The information presented in this Section is based on responses provided by national contributors to a detailed list of questions, which are set out in Appendix 1.
x Section 5 contains a preliminary cross-cutting analysis of the documented national legal and policy efforts. Drawing on the national efforts documented in Section 4, a diverse selection of legal and policy options for natural capital accounting are identified. Section 5 also discusses common achievements, challenges and lessons learned, including practical approaches from several countries that may prove useful or informative in others. The Study concludes by setting out a vision for future action to further develop the global knowledge-base concerning legal and policy options for: (1) implementing natural capital accounting, and (2) broader strategies for natural capital management.
Page 23 of 144
2. Natural capital and accounting This Section introduces the concepts of natural capital and natural capital accounting. It summarizes current knowledge regarding the characteristics and components of natural capital and their role as the foundation on which human economies, societies and prosperity are built. Attention is also devoted to explaining the significant role of ecosystem services provided by natural capital.
2.1. Characteristics and components of natural capital Capital is a concept originating from the field of economics. It refers to material or financial wealth that can be used to generate income, goods or services. ‘Natural capital’ is the extension of this concept to describe components of the natural environment that are generative of income, goods or services.14 Academic economists have characterized the natural environment as a capital asset since at least the 1970s.15 Only in recent years have governments and the private sector started to use the concept of natural capital to inform their research and decision-making. The advantage of this approach is that it enables the natural environment to be treated like other valuable capital assets – i.e. something that should be managed, valued and accounted for, and in respect of which damage to the asset may affect its ability to provide goods and services in the future.
Natural capital has always been the foundation on which human economies, societies, and prosperity are built. The goods and services it provides are essential for human well-being and development.16 Historically, decision-making by governments, communities and the private sector has failed adequately to take this into account. Two factors contributing to this failure are: First, the significant economic values of many environmental goods and services – such as clean air and clean water and production of seafood and timber – have been taken for granted, because they are freely available, with the result that they have either been given no, or an inadequate, economic value, or they have not been managed sustainably. Second, while the importance of natural capital is widely recognized in general terms, many specific aspects of the relationship between natural capital, how we use it, and how the use of natural capital affects our well-being, remain poorly understood.
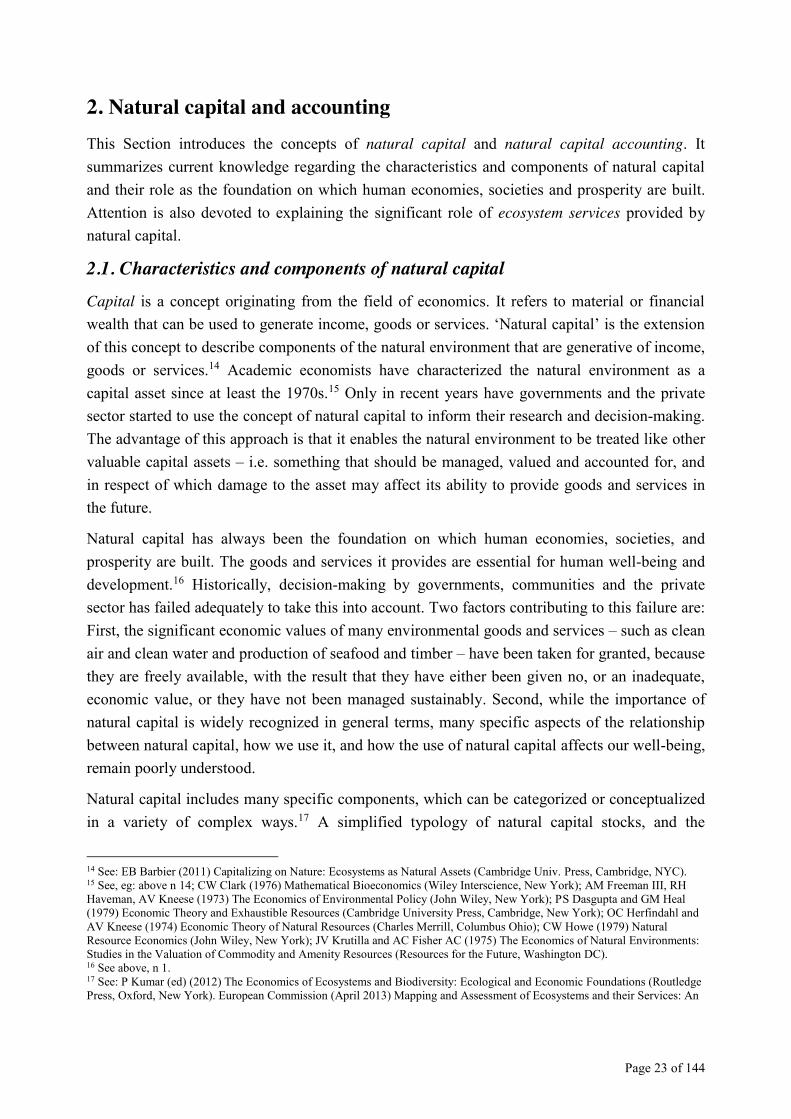
Natural capital includes many specific components, which can be categorized or conceptualized in a variety of complex ways.17 A simplified typology of natural capital stocks, and the
14 See: EB Barbier (2011) Capitalizing on Nature: Ecosystems as Natural Assets (Cambridge Univ. Press, Cambridge, NYC). 15 See, eg: above n 14; CW Clark (1976) Mathematical Bioeconomics (Wiley Interscience, New York); AM Freeman III, RH Haveman, AV Kneese (1973) The Economics of Environmental Policy (John Wiley, New York); PS Dasgupta and GM Heal (1979) Economic Theory and Exhaustible Resources (Cambridge University Press, Cambridge, New York); OC Herfindahl and AV Kneese (1974) Economic Theory of Natural Resources (Charles Merrill, Columbus Ohio); CW Howe (1979) Natural Resource Economics (John Wiley, New York); JV Krutilla and AC Fisher AC (1975) The Economics of Natural Environments: Studies in the Valuation of Commodity and Amenity Resources (Resources for the Future, Washington DC). 16 See above, n 1. 17 See: P Kumar (ed) (2012) The Economics of Ecosystems and Biodiversity: Ecological and Economic Foundations (Routledge Press, Oxford, New York). European Commission (April 2013) Mapping and Assessment of Ecosystems and their Services: An
Page 24 of 144
associated flow of goods and services, is set out below in Figure 2.
Figure 2 – Component stocks of natural capital and associated flows
This typology18 differentiates between two broad types of natural capital stocks and associated flows:
x Geophysical capital – consists of the geophysical properties and contents of the Earth,19 including geophysical cycles (daily, seasonal, lunar and tidal). Certain stocks of geophysical capital can be converted into valuable abiotic goods (e.g. minerals, fossil fuels). Geophysical capital stocks also provide several abiotic services including: energy generation (solar, wind, hydro, geo-thermal), enabling of transport (e.g. via watercourses and oceans [shipping] and the atmosphere [aviation]), and fresh water delivery (via precipitation).
x Ecosystem capital – consists of ecosystems, which are dynamic complexes of plant, animal and micro-organism communities and their non-living environment, including soils, interacting with each other as a functional unit.20 The structure and condition of ecosystems produces valuable biotic goods, (e.g. livestock, seafood, timber). Ecosystems also provide an array of valuable ecosystem services, which are discussed further below.
Distinctions can be drawn between ‘renewable’ components of natural capital, which are self-maintaining, and ‘non-renewable’ components, which are not.21 Natural capital can also be characterized as being capable or not capable of being depleted by use. Ecosystem capital is both renewable and depletable. Certain stocks of geophysical capital are non-renewable and depletable (e.g. fossil fuels); renewable and non-depletable (e.g. solar energy); or renewable and analytical framework for ecosystem assessments under Action 5 of the EU Biodiversity Strategy to 2020 (Technical Report 2013-067). UK Natural Capital Committee (March 2014) The State of Natural Capital: Restoring our Natural Assets. 18 Substantively modified version of figure in European Commission Technical Report 2013-067, above n 17. 19 See: W Lowrie (2007) Fundamentals of Geophysics, Second Edition (Cambridge Univ. Press, Cambridge, NYC). 20 See: CBD, Article 2; MEA Synthesis Report, above n 1. 21 Cf R Costanza and HE Daly (1992) ‘Natural Capital and Sustainable Development’ Conservation Biology 6(1):37–46.
Abiotic goods:
Minerals, earth elements, fossil fuels, gravel, salts,
etc.
Abiotic services:
Energy provision,medium for transport,
precipitation,etc.
Biotic goods:
Products of ecosystem structure & function
Ecosystem services:
– Supporting services – Provisioning services – Regulating services – Cultural services
Ecosystem capital:Ecological systems & processes
Natural Capital
Geophysical capital:Geophysical properties, contents & cycles
Page 25 of 144
depletable (e.g. fresh water aquifers).
The two types of natural capital outlined in Figure 2 are not discrete categories – several components of natural capital straddle both types. Water for example is used as an abiotic good (e.g. in industrial processes), provides abiotic services (e.g. enabling transport), and plays a critical role in the delivery of ecosystem services. Soils are also used as abiotic goods (e.g. peat fuel), provide abiotic services (e.g. shelter, building foundations), and are integral to the delivery of several ecosystem goods and services.
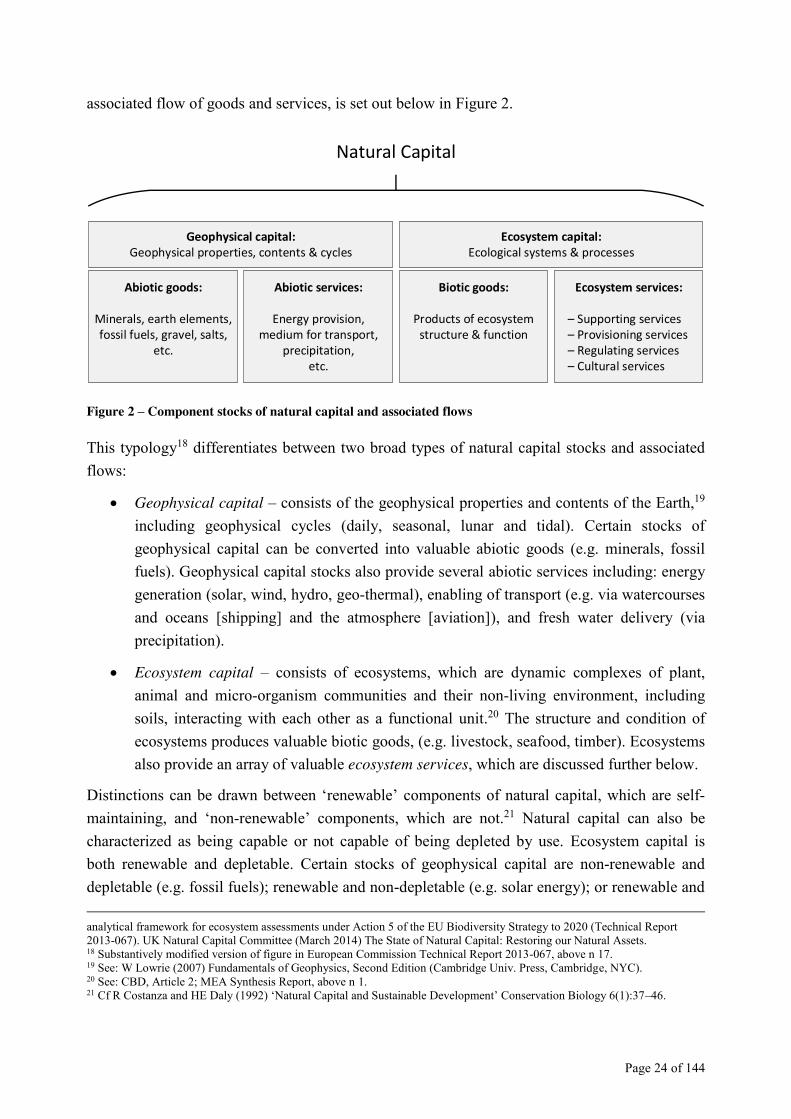
2.2. Ecosystem services The Millennium Ecosystem Assessment1 (MA) is the principal consolidation of global scientific knowledge concerning ecosystems and ecosystem services. It succinctly defines ecosystem services as ‘the benefits obtained by people from ecosystems’ and identifies four broad categories of ecosystem services, namely: provisioning, regulating, and cultural services that directly affect people, and supporting services needed to maintain other services. Figure 3 briefly describes each of these categories, and identifies an array of specific ecosystem services falling under each category.22 Background information concerning the MA is provided in Section 3.4.
Figure 3 – Typology of ecosystem services
These categories are not discrete – many specific ecosystem services listed in Figure 3 are closely interrelated. For example, as the MA explicitly notes:22 Primary production, photosynthesis, nutrient cycling, and water cycling all involve different aspects of the same
22Adapted from MA Synthesis Report, above n 1, 40.
Provisioning services: Regulating services: Cultural services: Supporting services:
Ecosystem services
Including:
– Food– Fibre– Fuel– Genetic resources– Biochemicals, natural ...medicines & pharmaceuticals– Ornamental resources– Fresh water.
Non-material benefits obtained from ecosystems.Regulate ecosystem processes.Products obtained from
ecosystems.Necessary for production of all
other ecosystem services.
Including:
– Air quality regulation– Climate regulation– Water regulation– Erosion regulation– Water purification & ...waste treatment– Disease regulation– Pest regulation – Pollination– Natural hazard regulation.
Including:
– Cultural diversity– Spiritual & religious values– Knowledge systems– Education values– Inspiration– Aesthetic values– Social relations– Sense of place– Cultural heritage values– Recreation & eco-tourism.
Including:
– Soil formation– Photosynthesis– Primary production– Nutrient cycling– Water cycling.
Page 26 of 144
underlying biological processes. Services such as erosion regulation could be categorized as a supporting or a regulating service, depending on the relevant time scale and immediacy of their impact on people. Note also that the MA’s definition of ecosystem services does not clearly distinguish between goods and services. The definition of provisioning services in particular does not clearly distinguish between biotic goods, and the ecosystem structure and condition that provide these goods.
The Millennium Ecosystem Assessment is a significant achievement because it confirms that:
x Ecosystem capital is an increasingly scarce resource; and
x This scarcity affects human well-being and development.
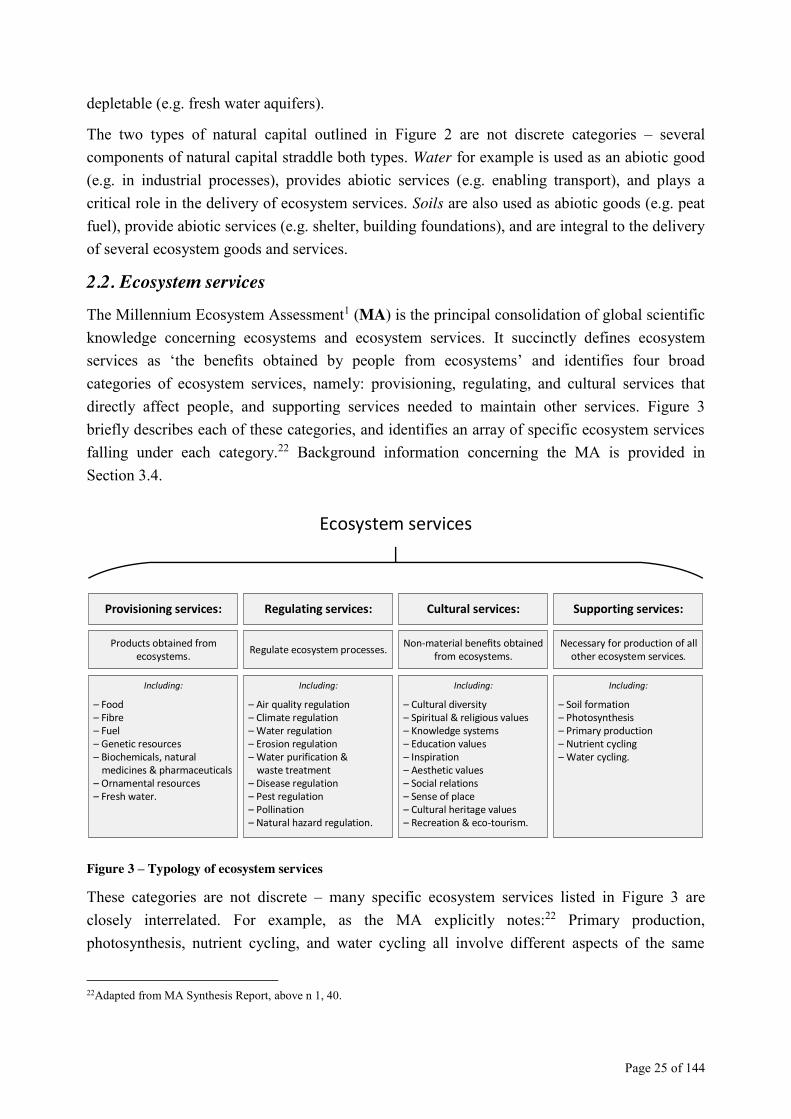
The main findings of the MA are summarized below in Figure 4.23
x Over the past 50 years, humans have changed ecosystems more rapidly and extensively than in any comparable period of time in human history, largely to meet rapidly growing demands for food, fresh water, timber, fibre and fuel. This has resulted in a substantial and largely irreversible loss in the diversity of life on Earth.
x The changes that have been made to ecosystems have contributed to substantial net gains in human well-being and economic development, but these gains have been achieved at growing costs in the form of the degradation of many ecosystem services, increased risks of nonlinear changes, and the exacerbation of poverty for some groups of people. These problems, unless addressed, will substantially diminish the benefits that future generations obtain from ecosystems.
x The degradation of ecosystem services could grow significantly worse during the first half of this century and is a barrier to achieving the Millennium Development Goals.
x The challenge of reversing the degradation of ecosystem while meeting increasing demands for services can be partially met under some scenarios considered by the MA, but will involve significant changes in policies, institutions and practices that are not currently under way. Many options exist to conserve or enhance specific ecosystem services in ways that reduce negative trade-offs or that provide positive synergies with other ecosystem services.
The bottom line of the MA findings is that human actions are depleting Earth’s natural capital, putting such strain on the environment that the ability of the planet’s ecosystems to sustain future generations can no longer be taken for granted. At the same time, the assessment shows that with appropriate actions it is possible to reverse the degradation of many ecosystem services over the next 50 years, but the necessary changes in policies, institutions and practices are substantial and have yet to be realised at the required scale.
Figure 4 – Main findings of the Millennium Ecosystem Assessment
23 Quoted from <http://www.maweb.org/en/About.aspx>. Last sentence has been modified to reflect specific MA findings.
Page 27 of 144
There is an urgent need to respond to these findings, and to the various subsequent studies that complement the MA,24 with actions to:
x Develop effective strategies for managing the increasing scarcity of natural capital; and
x Implement these strategies by embedding them within relevant legal and policy frameworks.
Natural capital accounting – introduced in Section 2.3 below – is an important component of natural capital management strategies. The implementation of natural capital accounting through development of legal and policy frameworks forms the primary focus of this Study.
2.3. Natural capital accounting During the 20th Century, countries developed sophisticated methods for measuring their incomes, wealth, development and well-being. Several of these methods are now consolidated by the UN System of National Accounts (UN–SNA) – an internationally agreed set of standards for how to compile national measures of economic activity.25
Incomes are most commonly measured through national income accounts. The headline indicator of these accounts is the Gross Domestic Product (GDP), which forms part of the UN–SNA. GDP measures the monetary flows through a national economy in a year, computed equivalently as the total income, expenditure or value added in that year.
Today most countries and international organizations use GDP as the primary measure of economic activity and performance.26 This has significant and well-known shortcomings:26 GDP is a measure of economic production – it is not, and was never intended to be, a measure of national wealth, development or well-being. It does not for example capture information concerning income inequality, and excludes non-monetary activities including household duties and caring responsibilities. Crucially for the purposes of this Study, GDP and other components of the UN–SNA do not adequately account for damage to, or the depletion of, natural capital as a consequence of economic activity.
In recent years several organizations have made concerted efforts to develop methods, measures and indices that provide a more comprehensive picture of national wealth, economic development or well-being.26 Development is a broad concept that seeks to capture the extent to which income and wealth are translated into social progress. The United Nations Development
24 For further details see Section 3. 25 See: <https://unstats.un.org/unsd/nationalaccount/sna.asp>; and European Commission, International Monetary Fund, Organisation for Economic Cooperation and Development, United Nations, and World Bank (2009) System of National Accounts 2008 (New York). 26 See: Stiglitz Commission Report, above n 3; European Commission: Beyond-GDP <http://ec.europa.eu/environment/beyond_gdp/index_en.html>.
Page 28 of 144
Programme (UNDP) Human Development Index is an influential approach for quantifying development, which combines into a headline index measures of income, health and education.27
Well-being, or welfare, is an even broader concept, the generation of which is widely regarded as the purpose of economic activity. There is no generally accepted measure of well-being in national accounting terms, although some statistical offices at a national level are starting to include it in their methodologies.28
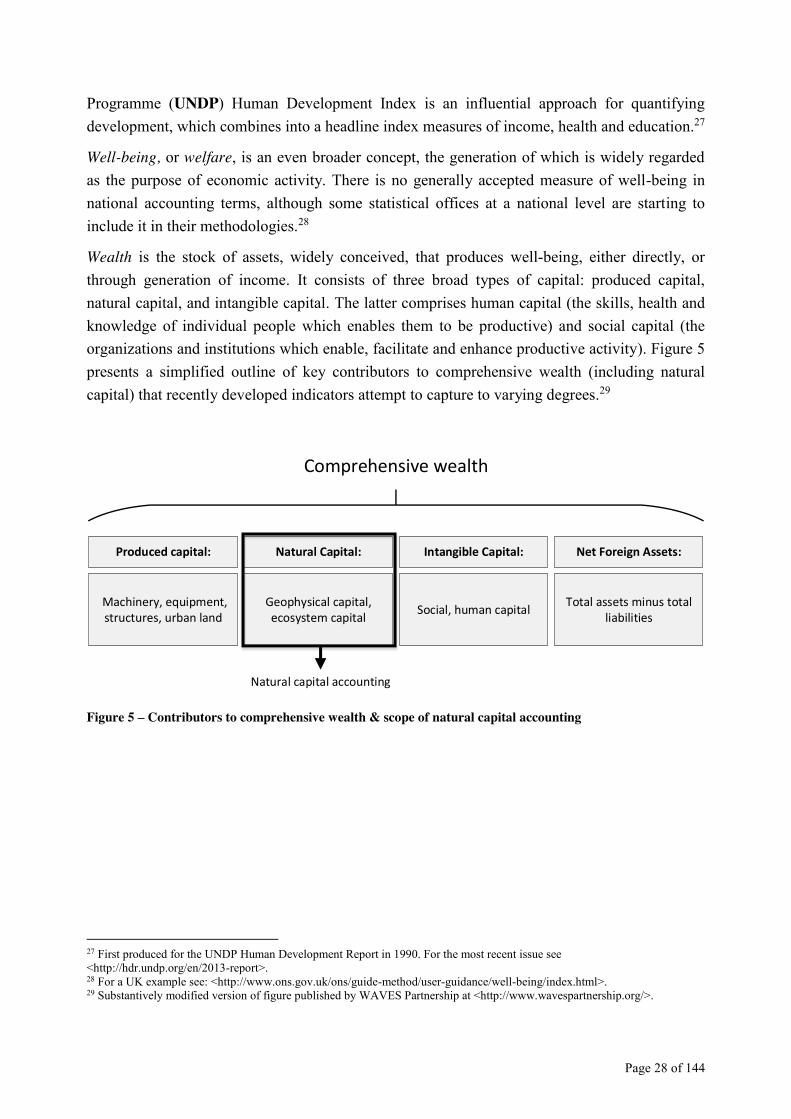
Wealth is the stock of assets, widely conceived, that produces well-being, either directly, or through generation of income. It consists of three broad types of capital: produced capital, natural capital, and intangible capital. The latter comprises human capital (the skills, health and knowledge of individual people which enables them to be productive) and social capital (the organizations and institutions which enable, facilitate and enhance productive activity). Figure 5 presents a simplified outline of key contributors to comprehensive wealth (including natural capital) that recently developed indicators attempt to capture to varying degrees.29
Figure 5 – Contributors to comprehensive wealth & scope of natural capital accounting
27 First produced for the UNDP Human Development Report in 1990. For the most recent issue see <http://hdr.undp.org/en/2013-report>. 28 For a UK example see: <http://www.ons.gov.uk/ons/guide-method/user-guidance/well-being/index.html>. 29 Substantively modified version of figure published by WAVES Partnership at <http://www.wavespartnership.org/>.
Produced capital: Natural Capital: Intangible Capital: Net Foreign Assets:
Comprehensive wealth
Social, human capitalGeophysical capital, ecosystem capital
Machinery, equipment, structures, urban land
Total assets minus total liabilities
Natural capital accounting
Page 29 of 144
Two influential approaches for measuring comprehensive wealth are:30
x The Inclusive Wealth Index (IWI) – featured in the Inclusive Wealth Report 2012,31 and developed with support from the United Nations University International Human Dimensions Programme (UNU–IHDP) and the United Nations Environment Programme (UNEP). The IWI is a ‘bottom–up’ measure that sums the economic value of individual capital asset classes (produced or manufactured capital, human capital, natural capital) to arrive at an estimate of total ‘inclusive’ wealth.32
x World Bank comprehensive wealth – featured in two flagship World Bank publications: Where is the Wealth of Nations (2006) and The Changing Wealth of Nations (2011).33 This is a ‘top–down’ measure which estimates total wealth taking into account economic theory, and separates this estimate into sub-estimates for specific capital asset classes (natural capital, and intangible capital comprised of human capital, social capital, and quality of institutions).34
Natural capital accounting is best understood as a subset of national wealth accounting that attempts to measure the extent to which natural capital contributes to comprehensive wealth. At a conceptual level it involves two broad groups of activities that seek to:
x Obtain, process and communicate scientific information concerning the status of natural capital and associated trends;
x Apply economic valuation methodologies to estimate how natural capital contributes to wealth and well-being; process and communicate the results.
In recent years efforts to develop international frameworks, strategies and standards concerning natural capital accounting have proliferated. Key efforts are summarized in Section 3 below.
30 For futher discussion see Jawed Khan, Towards Wealth Accounting – Natural Capital within Comprehensive Wealth (UK Office for National Statistics) <http://www.ons.gov.uk/ons/guide-method/user-guidance/index.html>. 31 Above n 3. 32 See: Inclusive Wealth Report 2012 above n 3. Arrow, K.J., P. Dusgupta. L.H. Goulder, K.J. Mumford, and K. Oleson (2012), ‘Sustainability and the measurement of wealth’, Environment and Development Economics 17(3): 317–353. 33 World Bank (2006) Where is the Wealth of Nations? Measuring Capital for the 21st Century; World Bank (2011) The Changing Wealth of Nations: Measuring Sustainable Development for the New Millennium; both available at <http://www.worldbank.org/reference/>. 34 Where is the Wealth of Nations, above n 33; Towards Wealth Accounting, above n 30. See also: D Pearce, G Atkinson (1993) ‘Capital Theory and the Measurement of Sustainable Development: An Indicator of Weak Sustainability’ Ecological Economics 8: 103–8;; K Hamilton, M Clemens (1999) ‘Genuine Savings Rates in Developing Countries’ World Bank Economic Review 13(2): 333–56.
Page 30 of 144
3. International frameworks, strategies and standards This Section summarizes international efforts to develop strategies, frameworks and standards for natural capital accounting. Relevant efforts are divided into four broad and interrelated categories:
x Legal and political commitments – treaties, declarations, agreements and other international instruments establishing normative and/or programmatic frameworks for natural capital accounting.
x Accounting standards – specified technical criteria, methods and processes intended to harmonize the practice of natural capital accounting.
x Capacity building partnerships – supporting the development of knowledge, expertise and strategies for natural capital accounting at a national level.
x Research programs – organized efforts to produce knowledge and knowledge products relating to natural capital accounting.
The summaries within each category in the sub-sections below are organized chronologically, and are not intended to be systematic. Particular attention is devoted to efforts supporting legal and policy development at a national level, that this Study is designed to complement.
3.1. Legal and political commitments Legal and political commitments relating to natural capital accounting have been established by a wide variety of international instruments, and under the auspices of several multilateral environmental agreements. Key commitments and associated implementation actions are outlined below:
x 1971 Ramsar Convention on Wetlands35 – An international agreement with 168 Parties. The Convention’s general objective is to stem the loss of wetlands and progressive encroachment on such areas. Parties are required inter alia to: designate at least one suitable wetland for inclusion on a ‘List of Wetlands’;; and take certain actions to promote conservation of listed wetlands, and the wise-use and conservation of wetlands generally. Ramsar Convention Parties are actively engaged in a program of work concerning the valuation of, and accounting for, the socio-economic and other benefits of wetlands. The Convention Secretariat is also a supporter of the Rio +20 Natural Capital Communiqué, which is discussed below.
35 See: <http://www.ramsar.org>.
Page 31 of 144
x 1972 World Heritage Convention36 – An international agreement with 190 Parties. The Convention defines categories of natural or cultural sites that can be considered for inclusion on a ‘World Heritage List’. It also sets out duties of the Parties concerning the: identification of potential World Heritage sites; and protection and preservation of World Heritage Sites situated in their territory, and national heritage more generally. A variety of research and monitoring programs concerning the status and benefits of natural World Heritage sites are coordinated and supported under the auspices of the Convention.
x 1992 United Nations Conference on Environment and Development, Agenda 2137 – is a detailed action plan for sustainable development, spread over four Sections and forty Chapters. It was adopted in Rio de Janeiro at the United Nations Conference on Environment and Development and has been re-endorsed on several occasions, including: by the UN General Assembly in 1997;38 at the 2002 ‘Rio+10’ World Summit on Sustainable Development in Johannesburg; and at the 2012 ‘Rio+20’ UN Conference on Sustainable Development in Rio de Janeiro.39 Agenda 21 was the first major international instrument to feature specific, explicit commitments concerning natural capital accounting. Chapter 4.6 emphasizes the importance of ‘pursuing economic objectives that take account of the full value of natural resources capital’. Chapter 8 contains detailed provisions devoted to ‘integrating environment and development in decision-making’. Particularly relevant for the present purposes are the action plans for ‘establishing systems for integrated environmental and economic accounting’, which motivated development of the first-edition UN–SEEA in 1993. Chapter 15, concerning the conservation of biological diversity, recognizes that ‘biological resources constitute a capital asset with great potential for yielding sustainable benefits.’
x 1992 Convention on Biological Diversity40 – An agreement with 193 Parties, which establishes an overarching framework and guiding principles for biodiversity-related action at a national level. The Convention’s objectives include: conservation of biological diversity, sustainable use of its components, and fair and equitable sharing of benefits arising out of utilization of genetic resources. Parties are obliged to submit periodic reports identifying measures taken to implement the Convention and meet its objectives. In October 2010, CBD States Parties adopted a revised and updated Strategic Plan for Biodiversity, including the Aichi Biodiversity Targets, for the 2011–2020 period. States Parties have agreed and commenced efforts to translate the Strategic Plan for Biodiversity into national biodiversity strategies and action plans.41 The Aichi
36 See: <http://whc.unesco.org/en/convention>. 37 See: <http://sustainabledevelopment.un.org/>. 38 See: UN Doc. A/RES/S-19/2 <http://www.un.org/documents/ga/res/spec/aress19-2.htm>. 39 See: <http://www.uncsd2012.org/>. 40 See: <http://www.cbd.int/>. 41 Several national biodiversity strategies and action plans are discussed in Section 4 below.
Page 32 of 144
Targets establish specific commitments concerning natural capital accounting – Target 2 states that:
By 2020, at the latest, biodiversity values have been integrated into national and local development and poverty reduction strategies and planning processes and are being incorporated into national accounting, as appropriate, and reporting systems.
Consistent with the broad scope of the CBD’s objectives, the Convention and its Conference of the Parties currently function as a focal point for announcements, discussions and capacity building regarding natural capital accounting.
x 1992 United Nations Framework Convention on Climate Change and 1997 Kyoto Protocol42 – With 194 Parties and 191 Parties respectively, the UNFCCC and supplementary Kyoto Protocol are the principal international agreements concerning management of climate change. Their core objective is to stabilize greenhouse gas concentrations in the atmosphere at a level that can prevent dangerous anthropogenic interference with the global climate system. Taking into account their common but differentiated responsibilities (CBDR) and regional development priorities and circumstances, UNFCCC Parties are required to promote the sustainable management, conservation and enhancement of sinks and reservoirs of all greenhouse gases. Subject to CBDR, Parties are also obliged to undertake a broad and complex range of activities of relevance to natural capital accounting, including: development of national inventories of emissions sources and sinks; and implementation of monitoring, reporting and verification linked to climate change mitigation and adaptation measures.
x 2007 Potsdam Initiative on Biological Diversity43 – An agreement between Environment Ministers from the G8+5 group of countries in Potsdam, Germany. The Ministers agreed, inter alia, to ‘initiate the process of analyzing the global economic benefit of biological diversity, the costs of the loss of biodiversity and the failure to take protective measures versus the costs of effective conservation.’ The agreement motivated efforts by the German Government and European Commission to establish the TEEB Initiative, which is discussed below.
x 2009 Jakarta Charter on Business and Biodiversity44 – An agreement between participants attending the Third Business and the 2010 Biodiversity Challenge Conference, held in Jakarta in 2009. The participants included representatives from over 200 companies, non-government organizations and national governments. The agreement recognizes, inter alia, that the:
42 See: <http://www.unfccc.int>. 43 See: <http://www.g8.utoronto.ca/environment/>. 44 See: <https://www.cbd.int/doc/business/jakarta-charter-busissness-en.pdf>. Note that the spelling ‘busissness’ is as it appears in the URL at the time of writing. In due course it may be changed to the correct spelling ‘business’.
Page 33 of 144
[V]alue of biodiversity and ecosystem services needs to be better reflected in economic models and policies, bearing in mind that sustainable management of biodiversity and ecosystem services are a source for future business operations as well as a condition for new business opportunities and markets.
x 2010 Nagoya Declaration on Parliamentarians and Biodiversity45 – Supported by national parliamentarians participating in the Globe International and CBD Forum on Biological Diversity, convened at the 10th CBD Conference of the Parties in Nagoya, Japan. The declaration calls for ‘a transition to a new global economy where the true values of biodiversity, ecosystem services and natural capital are carefully integrated into policy making processes at all levels of government, the private sector and civil society.’ It also expresses support for several strategic goals concerning natural capital management and accounting.
x 2011 European Union Regulation on European Environmental Economic Accounts46 –Requires EU Member States to establish environmental–economic accounts focused initially on three modules: air emissions; environmentally related taxes by economic activity; and economy-wide material flows. The Regulation establishes a legal framework for a harmonized collection of comparable data from the EU Member States, and provides for the development of additional modules.
x 2012 United Nations Conference on Sustainable Development, The future we want47 – A document setting out the agreed outcomes of the Rio+20 Conference, which inter alia reaffirms international commitments to Agenda 21 and the Aichi Biodiversity Targets, and recognizes the importance of ecosystem services as ‘critical foundations for sustainable development and well-being’. Concerning natural capital accounting, paragraph 38 of the document provides as follows:
We recognize the need for broader measures of progress to complement gross domestic product in order to better inform policy decisions, and in this regard we request the United Nations Statistical Commission, in consultation with relevant United Nations system entities and other relevant organizations, to launch a programme of work in this area building on existing initiatives.
The Future we want also documents commitments to develop, through an inclusive and transparent intergovernmental process, a set of sustainable development goals (SDGs) that are coherent with and integrated in the UN development agenda beyond 2015. Discussions concerning natural capital accounting taking place as part of the UN post-2015 development agenda are summarised below.
45 See: <http://www.cbd.int/doc/meetings/biodiv/parli-nagoya/official/parli-nagoya-declaration-en.pdf>. 46 See: <http://epp.eurostat.ec.europa.eu/portal/page/portal/environmental_accounts/introduction>. 47 See: U.N. Doc A/CONF.216/L.1 <https://rio20.un.org/>; <http://sustainabledevelopment.un.org/>.
Page 34 of 144
x 2012 Natural Capital Communiqué48 – Launched at Rio+20 and supported by over fifty countries and 86 private companies. The Communiqué invites national governments and several international organizations to work in partnership with other stakeholders to: (1) develop institutional arrangements to strengthen implementation of natural capital accounting; (2) develop science-based methodologies on an experimental basis for ecosystem accounting as a complement to GDP and corporate performance; (3) pilot and demonstrate the economic, social and environmental aspects of scaled up and integrated approaches to natural capital accounting. The Communiqué also invites the United Nations Statistical Commission to provide assistance concerning implementation of the UN–SEEA; and associated training of national experts.
x 2012 Natural Capital Declaration49 – Launched at Rio+20 and currently supported by 43 financial institutions and several other stakeholders. The Declaration is intended to reflect the commitment of its supporters to work towards integrating natural capital into financial accounting, disclosure and reporting processes. A ‘Natural Capital Declaration Roadmap and Business Plan’ has been developed to that end. The UNEP Finance Initiative and Global Canopy Programme jointly coordinate the Declaration’s Secretariat.
x 2012 GLOBE Rio+20 Legislators Protocol – Agreed by legislators from 85 countries at the 1st World Summit of Legislators in Rio de Janeiro.50 The Protocol recognizes, inter alia, the role of legislators in ‘advancing the natural capital approach within their respective countries’. It also sets out a commitment of legislators to:
In the context of sustainable development to consider and, as nationally appropriate: Push for the inclusion of natural capital in our respective countries’ national accounts; Advance legislation that integrates the Natural Capital approach into policy analysis and decision-making.
The Protocol is supplemented by the GLOBE Natural Capital Action Plan, first endorsed in 2010 and revised in 2012. As noted in Section 1, efforts to implement the Legislators Protocol and Action Plan are supported by the GLOBE Natural Capital Initiative.
x 2012 Gaborone Declaration for Sustainability in Africa51 – Launched at the Summit for Sustainability in Africa in Gaborone, Botswana, and supported by ten African national governments and several non-government stakeholders. The Declaration sets out several commitments concerning natural capital and natural capital accounting, including an overarching commitment to:
48 See: <http://www.wavespartnership.org/sites/waves/files/images/Final%20NCA%20Communique.pdf>. 49 See <http://www.naturalcapitaldeclaration.org/>. 50 See: <http://www.globeinternational.org/images/PDF/WSL2012/legislators-protocol.pdf>. 51 See: <https://www.cbd.int/doc/champions/gaborone-declaration-botswana-en.pdf>.
Page 35 of 144
[E]nsure that the contributions of natural capital to sustainable economic growth, maintenance and improvement of social capital and human well-being are quantified and integrated into development and business practice.
x 2010–present: UN Post-2015 development agenda52 – In September 2010 the UN General Assembly convened a High-level Plenary Meeting on the Millennium Development Goals (MDGs). The outcome document of this meeting requested the UN Secretary-General to make certain recommendations for further steps to advance the UN development agenda beyond the 2015 target date of the MDGs. As noted above, the Rio+20 outcome document initiated a process to develop a set of SDGs that are coherent with and integrated in this post-2015 development agenda. Negotiating processes associated with the MDGs and SDGs have become progressively intertwined, in order to establish an integrated global post-2015 development agenda with sustainable development at its core. The process to develop this new agenda currently involves various work-streams, including an Open Working Group, High-Level Panel of Eminent Persons; UN System Task Team; and several national, regional, global and thematic consultations. The United Nations plays a key facilitating role and has provided various evidence-based inputs to the process. Natural capital accounting has featured in a wide variety of discussions and documents associated with the post-2015 development agenda. Its status within the agenda and formative post-2015 integrated SDGs is not yet clear. For example: the concepts of natural capital and natural capital accounting are not explicitly recognised in the draft ‘chapeau’ for the post-2015 SDGs released in May 2014 following the 11th Session of the Open Working Group;53 and do not represent a focus area of Open Working Group negotiations and discussions. Natural capital accounting has however been proposed by various stakeholders for inclusion as a target accompanying the post-2015 SDGs, in particular within the focus areas of economic growth, and ecosystems and biodiversity. It has also been proposed as an indicator, providing a means to achieve measurable outcomes. The fate of these proposals will be decided during negotiations leading up to a UN Summit in September 2015 – when the post-2015 development agenda is scheduled for adoption by member States.
52 See <http://sustainabledevelopment.un.org/> and < http://www.un.org/en/ecosoc/about/mdg.shtml>. 53 The chapeau does however indirectly acknowledge key commitments concering natural capital accounting with the following language: ‘We reaffirm our commitment to fully implement the Rio Declaration on Environment and Development, Agenda 21, the Programme for the Further Implementation of Agenda 21, the Plan of Implementation of the World Summit on Sustainable Development (Johannesburg Plan of Implementation) and the Johannesburg Declaration on Sustainable Development of the World Summit on Sustainable Development …’
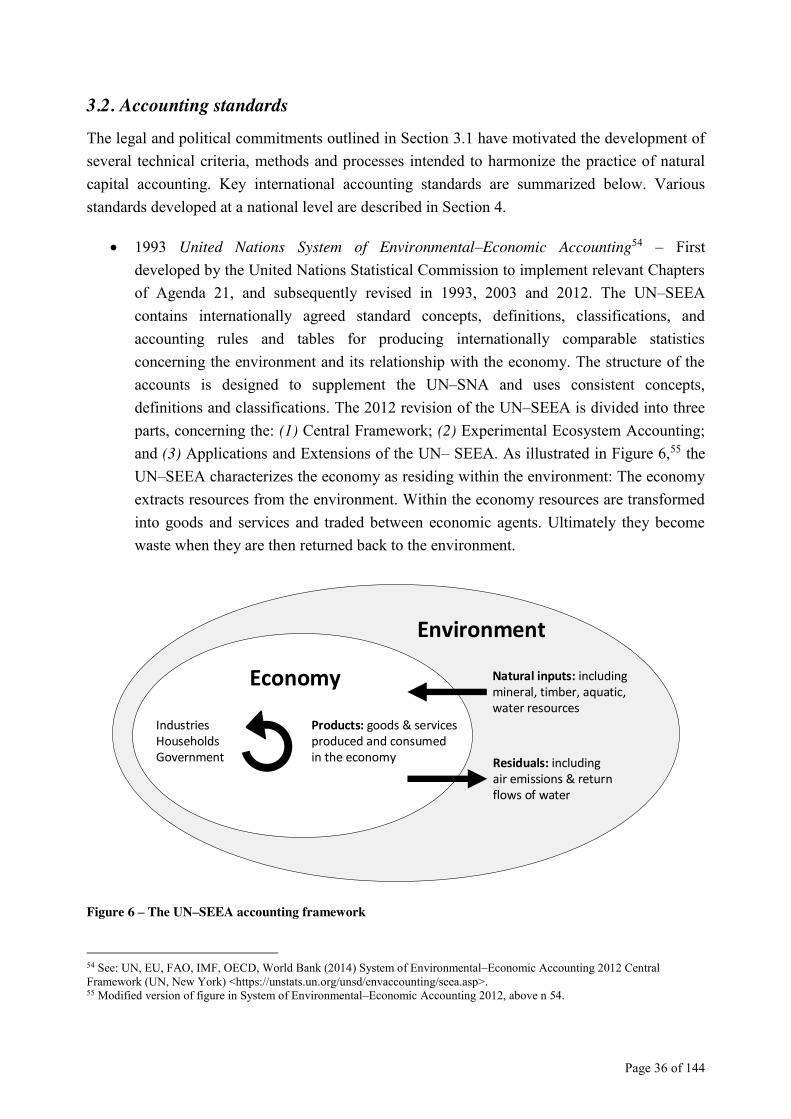
Page 36 of 144
3.2. Accounting standards The legal and political commitments outlined in Section 3.1 have motivated the development of several technical criteria, methods and processes intended to harmonize the practice of natural capital accounting. Key international accounting standards are summarized below. Various standards developed at a national level are described in Section 4.
x 1993 United Nations System of Environmental–Economic Accounting54 – First developed by the United Nations Statistical Commission to implement relevant Chapters of Agenda 21, and subsequently revised in 1993, 2003 and 2012. The UN–SEEA contains internationally agreed standard concepts, definitions, classifications, and accounting rules and tables for producing internationally comparable statistics concerning the environment and its relationship with the economy. The structure of the accounts is designed to supplement the UN–SNA and uses consistent concepts, definitions and classifications. The 2012 revision of the UN–SEEA is divided into three parts, concerning the: (1) Central Framework; (2) Experimental Ecosystem Accounting; and (3) Applications and Extensions of the UN– SEEA. As illustrated in Figure 6,55 the UN–SEEA characterizes the economy as residing within the environment: The economy extracts resources from the environment. Within the economy resources are transformed into goods and services and traded between economic agents. Ultimately they become waste when they are then returned back to the environment.
Figure 6 – The UN–SEEA accounting framework
54 See: UN, EU, FAO, IMF, OECD, World Bank (2014) System of Environmental–Economic Accounting 2012 Central Framework (UN, New York) <https://unstats.un.org/unsd/envaccounting/seea.asp>. 55 Modified version of figure in System of Environmental–Economic Accounting 2012, above n 54.
Economy
Environment
Natural inputs: including mineral, timber, aquatic, water resources
Residuals: including air emissions & return flows of water
Products: goods & services produced and consumed in the economy
IndustriesHouseholdsGovernment
Page 37 of 144
x 2011 EU Framework for Ecosystem Capital Accounting in Europe56 – Forms part of efforts to implement the UN–SEEA in EU Member States. The Framework was developed as an experimental project to implement simplified ecosystem capital accounts based on the use of existing data and statistics. It also contains candidate indicators and aggregates for delivery into national accounts.
x 2012 International Finance Corporation Revised Policy and Performance Standards on Social and Environmental Sustainability57 – These inform World Bank lending to private sector ventures and projects in developing countries. The revised standards require clients to maintain ‘continuous benefits from ecosystem services’ and set out methodologies for integrating ecosystem services into environmental and social impact assessments.
3.3. Capacity-building partnerships In recent years several partnerships have been established to supporting the development at a national level of knowledge, expertise and strategies for natural capital accounting. Significant capacity building partnerships include:
x 2008 United Nations Collaborative Programme on Reducing Emissions from Deforestation and Forest Degradation in Developing Countries58 – Is coordinated by the Food and Agriculture Organization of the United Nations; United Nations Development Programme and UNEP. Alongside the Forest Carbon Partnership Facility59 and Forest Investment Programme60 (both hosted by the World Bank), UN–REDD supports national ‘REDD+’ projects. These projects aim to support efforts in developing countries to: reduce emissions from deforestation and forest degradation; foster conservation and sustainable management of forests; and enhance forest carbon stocks. They are also a significant feature of on-going climate change negotiations under the UNFCCC.61 A key design feature of REDD+ projects is that they attempt to create a financial value for carbon stored in forests, and offer associated financial incentives to developing countries. REDD+ projects also involve monitoring, valuation and assessment processes that can be used as a basis for natural capital accounting.
x 2010 Partnership for Wealth Accounting and the Valuation of Ecosystem Services62 – Launched at the 10th CBD Conference of the Parties in Nagoya, Japan. The WAVES
56 See: European Environment Agency (2011) An experimental framework for ecosystem capital accounting in Europe (EEA Technical Report No 13/2011) <http://www.eea.europa.eu/publications/an-experimental-framework-for-ecosystem>. 57 See: International Finance Corporation (2012) Performance Standards on Environmental and Social Sustainability (World Bank Group, Washington DC) <http://www.ifc.org/>. 58 See: <http://www.un-redd.org/>. 59 See: <https://www.forestcarbonpartnership.org/>. 60 See: <https://www.climateinvestmentfunds.org/cif/node/5>. 61 See: <http://unfccc.int/methods/redd/items/7377.php>. 62 See: <http://www.wavespartnership.org/ >.
Page 38 of 144
Partnership is coordinated by the World Bank and involves several partners including UN Agencies, civil society representatives and national governments. The four key objectives of the Partnership are to: (1) assist countries to implement natural capital accounts and associated policies, building a body of experience; (2) develop ecosystem accounting methodologies; (3) establish a global platform for training and knowledge sharing; (4) build international consensus concerning natural capital accounting. The Partnership currently provides technical support to several ‘Core Implementing Countries’ including: Botswana, Colombia, Costa Rica, Guatemala, Indonesia, Madagascar, the Philippines and Rwanda. The Partnership’s national capacity building activities generally consist of three components: (1) working with key government agencies and other stakeholders to establish an institutional framework for natural capital accounting; (2) a feasibility study to identify critical natural resources policy issues, key entry points for policy-making and relevant components of natural capital accounts; (3) development of a four-year work plan for natural capital accounting, taking into account results of the feasibility study. More information concerning the WAVES Partnership activities in several of these countries is provided in Section 4.
x 2012 Inter-governmental Platform on Biodiversity and Ecosystem Services63 – An independent body open to all United Nations member countries, designed to facilitate: assessment of the global status of biodiversity, ecosystems and ecosystem services; exchange of information within and between scientific and policy communities; and effective use of science in decision-making.
x 2012 Global Environment Facility Project for Ecosystem Services64 – A framework project funded by GEF, which aims inter alia to integrate ecosystem assessment, scenario development and economic valuation of ecosystem services into national sustainable development planning. The project has to date supported pilot projects countries including Chile, Lesotho, South Africa, Trinidad & Tobago, and Vietnam.
3.4. Research programs In addition to the efforts summarized above, there has also been a proliferation in recent years of organized efforts to produce knowledge and knowledge products relevant to natural capital accounting. Several significant research programs and their associated outputs are:
x 2005 Millennium Ecosystem Assessment65 – As discussed in Section 2.2, the MA is the principal consolidation of global scientific knowledge concerning ecosystems and ecosystem services. The MA was initiated in 2001 in response to a call by United Nations Secretary General Kofi Annan to undertake a comprehensive assessment of
63 See: <http://www.ipbes.net>. 64 See: <http://www.proecoserv.org/>. 65 See: <http://www.maweb.org/>.
Page 39 of 144
global ecosystems.66 The Assessment’s core objective was to assess the consequences of ecosystem change for human well-being, and the scientific basis for action needed to enhance the conservation and sustainable use of those systems and their contribution to human well-being. The MA is the product of work by more than 1,360 scientific experts worldwide. Its findings are reported in five lengthy technical volumes and six synthesis reports.
x 2008 Commission on Measuring Economic Performance and Social Progress67 – Established by the French Government to: (1) identify the limits of GDP as an indicator of economic performance and social progress; (2) consider additional information required for the production of a more relevant picture; (3) discuss how to present this information in the most appropriate way, and (4) check the feasibility of measurement tools proposed by the Commission. The Commission held its first plenary meeting in April 2008 and published its final report in September 2009.68
x 2010 The Economics of Ecosystems and Biodiversity Initiative69 – As noted in Section 3.1 above, TEEB was initiated as a response to the 2007 Potsdam Initiative on Biological Diversity, and currently involves a wide variety of government, non-government and corporate sector donors and partners. The initiative has developed in three phases: The first phase produced an interim evidence-base report for the High-Level Segment of the 9th CBD Conference of the Parties in 2008. The second phase produced five key publications, presented at the 10th CBD Conference of the Parties in 2010. These focused respectively on: ecological and economic foundations; national and international policy-making; local and regional policy; business and enterprise; and synthesis of relevant approaches and recommendations. TEEB has also undertaken several studies focused on the economics of ecosystems and biodiversity for specific sectors and biomes, including: water and wetlands; cities; climate issues; and oceans. The third phase of TEEB is focused on national implementation and capacity building, responding to requests by interested governments.
x 2012 Inclusive Wealth Report70 – As noted in Section 2.3, this Report developed with support from UNU–IHDP and UNEP presents an Inclusive Wealth Index as a bottom–up measure of comprehensive wealth. The Report also uses the IWI to investigate changes in inclusive wealth for an initial group of twenty countries from 1990–2008.
66 Kofi Annan (2000) ‘We the Peoples’ The Role of the United Nations in the 21st Century (United Nations, New York) <http://www.un.org/en/events/pastevents/pdfs/We_The_Peoples.pdf>. 67 See: <http://www.stiglitz-sen-fitoussi.fr/en/index.htm>. 68 Report of the Commission, above n 3. 69 See: <http://www.teebweb.org/>. 70 See: Inclusive Wealth Report 2012 above n 3.
Page 40 of 144
4. National legal and policy developments The international frameworks, strategies and standards discussed in Section 3 are accompanied by – and closely inter-linked with – concerted efforts at a national level concerning natural capital accounting. This Section presents concise summaries of national efforts in a diverse group of twenty-one countries to:
x develop legal and policy frameworks for natural capital accounting, and
x link these frameworks with broader strategies concerning natural capital management.
The summaries are based on responses provided by national contributors to a list of twenty-five (25) questions, which were translated where relevant from English into Spanish and French (see Appendix 1). The questions focused on the following six cross-cutting themes:
1. content and focus of natural capital accounts;
2. frameworks and processes for natural capital accounting;
3. use of natural capital accounts in decision-making;
4. legal and policy development concerning natural capital;
5. success stories, challenges and lessons learned;
6. improvement of the GLOBE Natural Capital Accounting Study & other comments.
Consistent with the objectives of the Study (see Section 1), the questions were designed to provide a flexible and open platform for the in-country contributors, enabling them to provide a broad range of information and primary source documents concerning national efforts and circumstances. The questions were also designed to establish a baseline for assessing future progress concerning the implementation of natural capital accounting, and its use as a component of legal processes, policy development, and government decision–making. To accommodate the content and wide variety of responses received, each summary of national efforts set out below is structured to address a consolidated set of three cross-cutting themes:
x Legal and policy frameworks for natural capital accounting – including plans to develop these frameworks; institutional responsibilities for natural capital; and linkages with frameworks, strategies and standards at an international level.
x Focus of natural capital accounts – including the content, structure and trends captured by relevant natural capital accounts; and policy challenges informing their development.
x Challenges and success stories – concerning natural capital accounting specifically; natural capital management more broadly; and the use of natural capital accounting as a tool to achieve relevant policy objectives.
Each summary is introduced with a snapshot of key national achievements concerning natural capital accounting, and the focus of associated natural capital accounts.
Page 41 of 144
4.1. Botswana
Key achievements: Water accounts developed with support from WAVES Partnership. Work plan developed with WAVES Partnership to establish additional accounts in priority sectors.
Focus of natural capital accounts: Water; energy and minerals; land/ecosystems and tourism.
4.1.1. Legal and policy frameworks for natural capital accounting
Botswana is a party to the CBD and a supporter of the Rio+20 Natural Capital Communiqué. It has developed and submitted to the CBD Secretariat a Biodiversity Strategy and Action Plan 2007,71 and a 4th CBD National Report.72 The Action Plan recognizes the need to value and otherwise appreciate biodiversity. It specifically recognizes the need for economic valuation of certain actions such as developing cost calculations for restoration and rehabilitation of destroyed habitats, including an Environmental Impact Assessment – Cost Benefit Analysis (Action 2.7.2). The 4th National Report provides details concerning the status of Botswana’s biodiversity, associated trends, and implementation of the 2007 Strategy and Action Plan.
Botswana is actively involved in the WAVES Partnership. The Botswana Steering Committee for WAVES has been established and is chaired by the Socio-economic Policy Section of the Ministry of Finance and Development. WAVES operates in Botswana under a joint national Steering Committee with the UNDP–UNEP Poverty Environment Initiative – the PEI–WAVES Steering Committee. The first phase of activity supported by WAVES focused on Water Accounting with direction from the Business and Economic Advisory Council (BEAC). Currently, the WAVES Phase 2 (2012–2015) work plan has been developed in collaboration with the PEI–WAVES Steering Committee and has identified the following priority sectors for natural capital accounting: energy and minerals; land/ecosystems and tourism; four regional ecosystems; and water.
There is high-level political support for natural capital accounting in Botswana. In May 2002 Botswana and nine other African countries endorsed a plan to put natural capital at the center of sustainable development under the Gaborone Declaration73 pledging:
To ensure that the contributions of natural capital to sustainable economic growth, maintenance and improvement of social capital and human well-being are quantified and integrated into development and business practice.
71 Ministry of Wildlife and Tourism (2007) Botswana Biodiversity Strategy and Action Plan. Revised (2007). 72 Botswana Government (2009) Botswana Fourth National Report to the Convention of Biological Diversity, (May 2009). 73 See: <http://www.conservation.org/conferences/africa_sustainability_summit/Documents/Gaborone-Declaration-HoS-endorsed_5-30-2012_Govt-of-Botswana_CI_Summit-for-Sustainability-in-Africa.pdf>.
Page 42 of 144
His Excellency Seretse Khama Ian Khama, the President of the Republic of Botswana and co-host of the Summit, has also announced Botswana’s endorsement of the Gaborone Declaration. The National Office of the President has stated that Botswana is interested in accrual accounting (i.e. where revenues are recognized the moment that goods or services are provided, as opposed to cash accounting where revenues and expenses are taken into account only when cash has been received/paid) and to add accumulated value to the balance sheet.
A number of government agencies are involved in developing natural capital accounts in Botswana. These include: Office of the President, Poverty-Environment Initiative (PEI); Ministry of Finance and Development Planning, lead WAVES agency; Central Statistics Office; Environment Statistics Unit; Ministry of Environment, Wildlife and Tourism; Department of Environmental Affairs; Ministry of Minerals, Energy and Water Resources (MMEWA); Department of Water Affairs Water Utilities Corporation and Ministry of Agriculture. The Government of Botswana has recognized the importance of natural capital to achieve the development objectives set out in its long-term ‘Vision 2016.’74 Together with the medium-term National Development Plan 10 (NDP10)75 and the BEAC Strategy Vision 201676 the documents have targeted several natural capital based sectors for a role in economic diversification including:
x New mining activities – special focus on coal reserves
x Expanded ecotourism with greater participation from local communities
x Expansion of commercial agriculture through irrigation
x More efficient use of water resources.
The 11th National Development Plan, scheduled for implementation in 2016, is expected to make reference to natural capital accounting. The Keynote Policy Paper for the mid-term review (MTR) of the NDP10 also makes special reference to natural capital accounting. The MTR was endorsed in May 2013 and now constitutes an official document guiding the implementation of NDP10 for the remaining period.
More broadly, information from environmental valuations has been used to inform policy and management. For example, environmental accounting for the mining sector has long been used to inform rent collection, allowing a large share of the rents from mining to be recovered and invested into Botswana’s long-term development. In addition, regional ecosystem services valuation studies have been used to inform management options in protected areas.
74 See: <http://www.vision2016.co.bw/>. 75 See: <http://www.finance.gov.bw/index.php?option=com_content1&parent_id=334&id=338>. 76 World Bank (2011) The changing Wealth of Nations: Measuring Sustainable Development in the New Millennium. In Environment and Development, The World Bank.
Page 43 of 144
In summary, a range of policies and legislation exist relating to management of natural capital, but there is no current legislation specifically regarding natural capital accounting.
4.1.2. Focus of natural capital accounts
Natural capital makes up more than a third of Botswana’s total wealth. The diamond mining sector alone account for one third of GDP, a majority of export earnings, and half of government revenues. Botswana introduced environmental and natural resource accounting in the 1990s and 2000s. Pilot natural capital accounts were constructed for selected sectors, with monetary accounts constructed for minerals and physical accounts constructed for minerals, water and livestock.77 Wealth accounts were also constructed for produced capital and net foreign financial assets, but data were insufficient to construct human capital accounts. The WAVES Phase 2 (2012–2015)78 work plan has identified the following priority sectors for natural capital accounting:
x Energy and minerals – Detailed accounts concerning Botswana’s mineral resources are particularly important given the high contribution of these resources to GDP and the expected decline in diamond production over the next 15 to 20 years.79 In addition, for the sustainable diversification of Botswana’s mining industry (a stated aim in the NDP10), it will be necessary to understand potential impacts and benefits of other mining sectors, such as coal mining and mineral mining, (e.g. copper, nickel and gold).
x Land/ecosystems and tourism – Tourism accounts to inform ecotourism management are planned in four key ecosystems, Okavango, Chobe, Makgadikgadi Pans and Central Kalahari.
x Water – Compiling water accounts, including how much water each sector of the economy is consuming will allow the government to identify any overuse of water, create incentives for water efficiency and contribute to the national water tariff policy. Work on pilot water accounts, building on previous work, is currently underway.
Between 1995 and 2005 Botswana increased its per capita wealth by 35%. This has largely been attributed to careful management of its natural resources. Botswana has recognized the contribution of ecosystem services and biodiversity to natural capital and the importance of their valuation and protection, as evidenced by various initiatives.
77 Lange, G.M. (2004) Wealth, Natural Capital and Sustainable Development: Contrasting Examples from Botswana and Namibia. Environmental and Resource Economics 29:257-283. 78 Botswana PEI-WAVES Steering Committee (2012) Wealth Accounting and Valuation of Ecosystem Services in Botswana. Priority Policy Objectives v3. (March 2012). 79 Kojo, N.C. (2010) Diamonds are Not Forever: Botswana Medium-term Fiscal Sustainability. World Bank. <https://openknowledge.worldbank.org/handle/10986/3962>.
Page 44 of 144
The Southern African Millennium Ecosystem Assessment (SAfMA)80, which includes Botswana, concluded that freshwater; food-producing ecosystems and biodiversity provide the most important ecosystem services for Botswana, and may contribute to food security. Furthermore, two regional ecosystem valuation studies for Okavango Delta, Makgadikgadi Pan and the Kgalagado drylands have been undertaken. The Economic Value of the Okavango Delta, Botswana, 200681 used the Total Economic Valuation framework (TEV) and a national accounting framework to consider the direct use value from tourism and natural resource use, indirect use values and non-use values (option and existence values). The 2010 Makgadikgadi framework management plan (MFMP)82 incorporated previous data83 and used TEV methods to assess the economic value of goods and services provided by the MFMP area (direct use, indirect use and option value and tourism potential. The economic value of Kgaladi dryland goods and services (direct use, indirect use and asset values) were also assessed in 2007.84
Of special interest is the Okavango Delta, which is in the process of being confirmed as a World Heritage Site. The Delta is also protected under the Ramsar Convention and a number of sites including Zambesi-flooded savannahs and Central and Eastern Miombo woodland are categorized as National Heritage sites and thereby protected by law.
Botswana has 20 years of experience with community-based natural resource management (CBNRM). A recent feasibility study has investigated using payments for ecosystem services (PES) as an incentive-based policy instrument in the Okavango Delta.85 It concluded there is potential to establish a PES market in Botswana, particularly harnessing tourist willingness to pay, but that no programs are currently in action.
4.1.3. Challenges and success stories: Botswana water accounts
Botswana presented the first phase of its water accounts in November 2012. The country has long relied on diamonds for economic growth and is looking to other sectors to provide a new growth model. One possible limiting factor is water, a scarce resource. Water accounts help governments identify sectors which are less water-intensive and can be targeted for growth, opportunities to increase water efficiency, and options for decoupling growth from water consumption. Some of the main findings include:
80 Biggs, R. et al., (2004) Nature Supporting People: The Southern African Millennium Ecosystem Assessment Integrated Report, Council for Scientific and Industrial Research. A Contribution to the Millennium Ecosystem Assessment, Pretoria, South Africa. 81 Turpie, J. et al. (2006) Economic Value of the Okavango Delta, Botswana, and Implications for Management. Botswana: IUCN, (October 2006). 82 Department of environmental Affairs and Centre for Applied research (2010) The Makgadikgadi Frramework Management Plan. Gabarone: Government of Botswana. 83 Setlhogile T. (2010) Economic Valuation of Selected direct and Indirect Use Values of the Makgadikgadi Wetland, Botswana. Department for Civil Engineering, university of Zimbabwe. Setlhogile T. et al., (2010) Economic Valuation of Selected Direct and Indirect Use Values of the Makgadikgadi Wetland System, Botswana. In 11th Waternet-WARFSA-GWP Symposium. Victoria Falls, Zimbabwe. 84 Madzwamuse, M., B. Schuster and B. Nherera (2007) The Real Jewels of the Kalahari. IUCN. 85 Molosiwa, K. (2011) Payment for Ecosystem Services: Potential of Establishing a Payment for Wildlife Ecosystem Services Market in the Okavango Delta. Botswana: Lap Lambert Academic Publishing.
Page 45 of 144
x Botswana has increased its water use efficiency but needs to stimulate more-efficient water allocation to boost economic growth and diversification. Both the irrigation and mining sectors should use water more efficiently and maximize the use of treated wastewater.
x GDP contributions per unit of water vary greatly by sector. Agriculture has high water consumption but low contribution to both GDP and formal employment. The service sectors use little water but make relatively high contributions to GDP and employment.
x Sectoral water efficiency should be considered as one of the factors in targeting sectors to drive economic growth and diversification.
x The operating costs of water supply are growing to the point of exceeding revenues. The situation will become unsustainable if it follows the current trajectory.
Botswana also faces a number of environmental challenges that may ultimately impact its natural capital stock. The country contains seven distinct eco-regions, four of which are classified as vulnerable.86 Many of the threats to ecosystems are water-related – Botswana is susceptible to droughts, desertification and limited freshwater access. The scarcity of water is expected to limit economic growth unless water resources are used efficiently. In addition, land use change, degradation (including deforestation), fires, unsustainable use (e.g. overgrazing, water extraction, habitat change, poaching), species competition due to elephant population pressures, wind erosion and invasive alien species all pose significant threats.
Climate change is expected to exacerbate these problems, resulting in water stress, and reduced land productivity. Climate change models predict that Southern Africa will be on average 2–5oC warmer and drier by 2050 compared to 1990, particularly in interior countries such as Botswana.
86 Botswana Government (2009) Botswana Fourth National Report to the Convention of Biological Diversity, (May 2009).
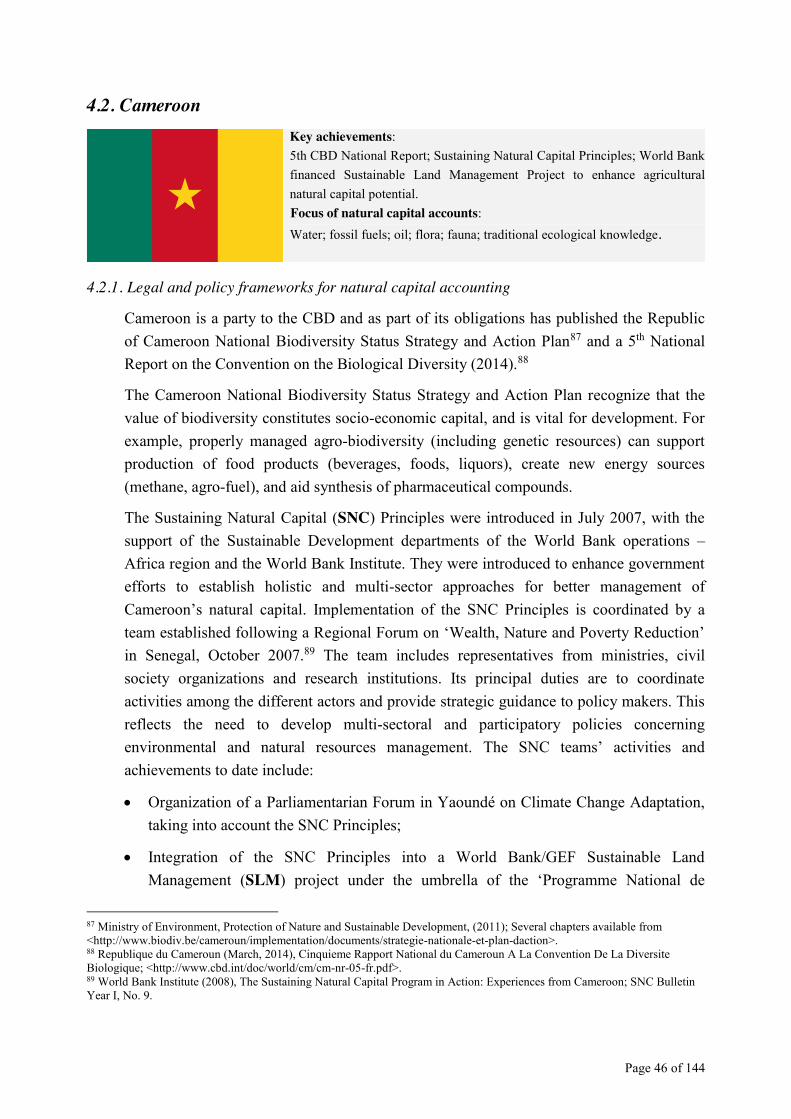
Page 46 of 144
4.2. Cameroon
Key achievements: 5th CBD National Report; Sustaining Natural Capital Principles; World Bank financed Sustainable Land Management Project to enhance agricultural natural capital potential.
Focus of natural capital accounts: Water; fossil fuels; oil; flora; fauna; traditional ecological knowledge.
4.2.1. Legal and policy frameworks for natural capital accounting
Cameroon is a party to the CBD and as part of its obligations has published the Republic of Cameroon National Biodiversity Status Strategy and Action Plan87 and a 5th National Report on the Convention on the Biological Diversity (2014).88
The Cameroon National Biodiversity Status Strategy and Action Plan recognize that the value of biodiversity constitutes socio-economic capital, and is vital for development. For example, properly managed agro-biodiversity (including genetic resources) can support production of food products (beverages, foods, liquors), create new energy sources (methane, agro-fuel), and aid synthesis of pharmaceutical compounds.
The Sustaining Natural Capital (SNC) Principles were introduced in July 2007, with the support of the Sustainable Development departments of the World Bank operations – Africa region and the World Bank Institute. They were introduced to enhance government efforts to establish holistic and multi-sector approaches for better management of Cameroon’s natural capital. Implementation of the SNC Principles is coordinated by a team established following a Regional Forum on ‘Wealth, Nature and Poverty Reduction’ in Senegal, October 2007.89 The team includes representatives from ministries, civil society organizations and research institutions. Its principal duties are to coordinate activities among the different actors and provide strategic guidance to policy makers. This reflects the need to develop multi-sectoral and participatory policies concerning environmental and natural resources management. The SNC teams’ activities and achievements to date include:
x Organization of a Parliamentarian Forum in Yaoundé on Climate Change Adaptation, taking into account the SNC Principles;
x Integration of the SNC Principles into a World Bank/GEF Sustainable Land Management (SLM) project under the umbrella of the ‘Programme National de
87 Ministry of Environment, Protection of Nature and Sustainable Development, (2011); Several chapters available from <http://www.biodiv.be/cameroun/implementation/documents/strategie-nationale-et-plan-daction>. 88 Republique du Cameroun (March, 2014), Cinquieme Rapport National du Cameroun A La Convention De La Diversite Biologique; <http://www.cbd.int/doc/world/cm/cm-nr-05-fr.pdf>. 89 World Bank Institute (2008), The Sustaining Natural Capital Program in Action: Experiences from Cameroon; SNC Bulletin Year I, No. 9.
Page 47 of 144
Développement Participatif’ (PNDP) / Community Driven Development Programme, which puts special focus on the involvement of local communities in the natural capital development process;
x Review of Cameroon’s Poverty Reduction Strategy Paper (PRSP) according to the SNC Principles.90
In 2008/2009 the SNC Cameroon team participated in a regional training session on Economics of Natural Resources and Environmental Services, offered by the SNC core team. The overall purpose of the session was to mainstream SNC Principles into Natural Resource Management policies and programs, and to promote its outreach to stakeholders and development partners. The SNC Principles have become an integral part of the agenda of parliamentarians and the PNDP. The 4th CBD National Report also highlights that natural capital (minerals and biodiversity) is managed through the PNDP, with financial support provided by the World Bank.91
The two most relevant ministries in Cameroon charged with collecting, managing and processing information regarding the country’s natural capital are the Ministry of Environment and the Protection of Nature, and the Department of Forest and Wildlife. Dedicated sessions and outcome publications are used to disseminate information regarding natural capital between the different parts of the national government. The status, economic value and opportunities for natural resources development are shared with the commercial sector. Civil society organizations are recognized as playing an important role in providing information regarding natural capital to parliamentarians, which in collaboration with policy-makers decide whether it is feasible to integrate the findings into national legislation.
Cameroon has become increasingly aware of the economic value of minerals; oil; the potential of streams for hydropower; and production capacity of timber. A countrywide comprehensive economic valuation of natural capital still remains to be fully undertaken. However, information on natural capital is currently being used in the calculation of the country’s growth and GDP, and informs Cameroon’s budgetary process.
The Constitution recognizes the importance of a healthy environment, which in combination with environmental protection plays a key role in future development of natural capital in the country. Key legislation concerning natural capital management includes: the Act of 29 December 1989 on toxic waste; and the Act of January 19, 1994 on forests, wildlife and fishing; and supplementary decrees regarding the creation of a National Consultative Committee on Environment and Sustainable Development. Act No. 96/12 provides a framework for environmental management. It is supported by the 1998
90 BNPP Trust Fund (2010) Sustaining Natural Capital Capacity Enhancement Program in Sub-Saharan Africa 91 Vision 2035 of Agricultural and Pasture Land Development in Cameroun Republic of Cameroon, Fourth National Report on the Convention of Biological Diversity.
Page 48 of 144
Act plan for Water which deals with the sustainable management of water and the 2004 Mining Code, which deals with measures to limit the negative impacts of mining on land.
Forests have been identified as a particularly important component of biodiversity. National Law No. 94-0 of January 1994 was implemented to support forest, fauna and fish systems. Article 22(1) emphasizes that permanent forests must cover a minimum of 30% of the national territory. Decree 222 on Forest Inventories also supports national initiatives regarding the country’s forests. Various national action plans concerning components of natural capital have been developed including the: Tropical Forestry Action Plan (1985–1988); National Forestry Action Plan (1992–1993); National Plan of Environmental Management (1996); PRSP (2003); National Action Plan for the Fight against Desertification; Strategy of Rural Sector Development (2006); Integrated Financing Strategy for sustainable management (2010); and Growth and Employment Strategy Paper (2010).
In summary, Cameroon has established several legal and policy frameworks concerning environmental and natural capital management, but is yet to integrate natural capital accounting into national legislation.
4.2.2. Focus of natural capital accounts
Cameroon identifies three types of capital: physical, biological and socio-cultural capital. Physical capital is partially concerned with the quality and quantity of water resources. Water filtration of upstream ecosystems is crucial for providing clean water to downstream agriculture and cities.92 Fresh water resources are estimated to be 17,312 cubic meters per capita, of which less than 0.1% is currently used. Current consumption uses less than 5% for irrigation, which suggests that Cameroon can improve agricultural productivity through investing in irrigation. The country’s streams also provide a vast potential for hydropower. Cameroon’s strategic growth plan for the next decades – Vision 2035 – identifies priority natural capital exploration to include sustainable rates of development of minerals including: bauxite, alumina, aluminium, iron-steel and nickel-cobalt. The plan was prepared by the Ministry of Planning, Development Programming and Regional Development.
Concerning biological capital, Cameroon has developed an inventory of the genetic species of the country’s flora and fauna. With over 8,000 plant and 250 mammal species the country’s genetic heritage is amongst the richest on the continent. Cameroon’s forests perform a significant carbon sequestration function – the country’s tropical forest ecosystems contain 150–500 tons of carbon per hectare.93 Cameroon’s socio-cultural
92 Grieber, T. and S. Schiele ed.s (2011) Governance of Ecosystem Services: Lessons learned from Cameroon, China, Costa Rica and Ecuador. IUCN Environmental Policy and Law Paper. Gland, Switzerland. 93 Lescuyer, G. and Locatelli, B., Rôle et valeur des forêts tropicales dans le changement climatique, Bois et Forêts des Tropiques, Vol. 260:5-17, (1999).
Page 49 of 144
capital relates to different ethnic groups, their lifestyles and techniques and how this knowledge relates to plants, especially their medicinal use.
4.2.3. Challenges and success stories
The main challenges to the sustainability of natural resources identified in Vision 2035 include: soil degradation (23% of Cameroon soils are degraded); uncontrolled bush-fires; decreasing forest cover at an annual rate of 1%; and water shortages in the dry season. Climate change and human pressures through land use change, deforestation and migration are expected to exacerbate these challenges. There is also a widespread misperception that natural resources are infinite, and little incentive to invest in sustainable land management.
With less than 5% of water consumed for irrigation, Cameroon can improve agricultural productivity, which will require the reversal of current land degradation trends. The SLM project component, supported by the World Bank and Global Environment Facility, is one area under Vision 2035 that has yielded positive performances in relation to managing natural capital. The SLM project is an operation implemented as part of the PNDP in four of the ten regions of Cameroon. It aims to enable communities to contribute to the fight against land degradation in critical areas through adoption of best practices for sustainable land management and capacity development. This has helped to enhance the overall impacts of PNDP, which recognizes the importance of natural capital.
The SLM Project is an integral part of national initiatives for sustainable land management, and the fight against desertification. Almost all of the indicators investigated by the World Bank have been achieved.94 A variety of SLM technologies have been popularized, which include agro-forestry, reforestation, and hedges to restore the system of farmland, grass strip and stone bunds to control erosion. Over 70% of the farms benefitting from the project are under SLM. Of the multiple activities undertaken, crop agriculture contributes the largest proportion to household income (71%) followed by livestock production (14.9%). Remittance and transfers are also important, accounting for 5% and 6.5% for beneficiaries and non-beneficiaries of the SLM Project respectively.
A breakdown of farm revenues after employing the techniques of sustainable soil and crop production reveals that farms supported by the SLM Project generate the highest profits. The perceived increase in production is substantially greater than the decrease among the beneficiaries. The average net farm income among beneficiaries has increased compared to non-beneficiaries. This performance may fall in the long run if limiting factors such as access to markets, improving land tenure, selection of gender sensitive SLM technologies, and adaptation to climate change are not taken into account.
94 See above n 90.
Page 50 of 144
4.3. Canada
Key achievements: Detailed multi-sector accounting frameworks concerning natural capital.
Focus of natural capital accounts: Energy; mineral resources; timber.
4.3.1. Legal and policy frameworks for natural capital accounting
Canada is a party to the CBD, and has achieved progress towards the Aichi Biodiversity Targets on several fronts, including:
x Increase in protected areas coverage of approximately 9.4%;
x Protection of ecologically sensitive lands through acquisition, conservation covenants, easements and agreements with private landowners;
x Improved legislation, investment and tax incentives;
x Integrated, ecosystem-based initiatives, restoration of degraded ecosystems, legislation for protection of species at risk.
The Canadian Biodiversity Strategy and Action from 1995 sets five goals.95 Goal one relates to nature conservation and sustainable use of natural capital. Canada focuses on the following measures to achieve this goal: protection of protected areas for wild flora and fauna and other wild organisms; the restoration and rehabilitation of areas and assets used for economic activity; biosafety, i.e. the protection of biological resources from harmful alien organisms; the protection of the atmosphere; and control of human population and settlement. Goal number two refers to ecological management and includes measures such as improving ecological management capability; increasing resource management capability or monitoring. The last three goals outlined in the strategy are complementary to the first two goals and relate to education and awareness; incentives and legislation; and international cooperation to preserve biodiversity.
In 2008, the federal government passed the Federal Sustainable Development Act and the Federal Sustainable Development Strategy. The latter is a set of actions across government to achieve environmental sustainability by making it a crosscutting issue across all institutional bodies and activities at the federal level. The strategy also contains environmental reporting and monitoring as obligations. In 2013, the most recent progress report was released demonstrating the progress of federal departments and agencies in achieving the goals outlined in the strategy, i.e. reducing greenhouse gas emissions;
95 Canadian Biodiversity Strategy: Doing our part to conserve biodiversity and sustainably use biological resources (accessed on 15 April 2014): <http://www.biodivcanada.ca/default.asp?lang=En&n=560ED58E-1>.
Page 51 of 144
enhancing water quality and availability; conserving lands and waters; or the sustainable use of biological resources.
Statistics Canada is the lead agency for the compilation of natural capital accounts. All data are made publicly available. Measurement of natural capital assets and associated flows of provisioning, regulation and cultural goods and services is also carried out by Environment Canada; Natural Resources Canada; Agriculture and Agrifood Canada; and Fisheries and Oceans Canada. Besides federal actors, provincial and territorial governments are also an important source of information. Under Canada’s federal system, most of the responsibility for managing the environment lies constitutionally with provincial and territorial governments.
All information concerning Canada’s natural capital is made available to Parliamentarians and the public on Statistics Canada’s website. However, it is not fully disclosed whether, how and to what extent the information is used by the Parliament in the legislative process. It is not clear either, whether the Department of Finance uses capital accounting data or indicators as part of the budgetary process.
4.3.2. Focus of natural capital accounts
Concerning the status of Canada’s natural capital, the federal government has access to annual accounts on the quantity of sub-soil assets and the monetary value of fossil fuels and commercially important raw materials. Monthly data is available concerning electric power produced from hydro, tidal, solar and wind sources in physical and monetary terms. In order to assess ecosystem capital, periodic land use accounts in physical units and periodic water stock accounts are produced. There is biennial data on water use for drinking, agriculture, mining and manufacturing; annual data in physical and monetary units concerning the use of timber, minerals, fossil fuels and renewable energy; and annual data on harvest of commercial marine resources. The government has also access to data concerning regulating services, which include annual or biennial physical data on emissions; land use; weather and climate; water quality; real time air quality data for cities; and data on cultural services, which include annual data on hunting and fishing; annual data on visits to national parks;; and periodic data on Canadians’ use of nature illustrating these services in physical and monetary terms. The country’s accounting for natural capital includes material flows through the economy, which also relates to the value added of different sectors or the output of the economy as a whole, i.e. GDP.
The Canadian government has access to information on the economic value of the country’s natural capital. Statistics Canada measures the value of timber, fossil fuel, metals and minerals, and land assets. These assets account for about 40% of national
Page 52 of 144
wealth in Canada.96 Statistics Canada’s environmental accounts are broadly consistent with the UN–SEEA framework.
Statistics Canada’s current wealth estimates do not include fish and fresh water due to lack of data and methods to assign value to these renewable resources. In terms of physical data, there are important gaps in regularly updated data on marine resource stocks. Despite the recent increased attention on marine protected areas, under 1% of Canada’s ocean area is protected. Comprehensive, regular and detailed land use data are not compiled for the whole country. A national inventory of wetlands does not exist. The national inventory of forests is updated in time intervals of about ten years. Some aspects of environmental quality, water quality in particular, are not regularly and comprehensively monitored whereas the air quality in major cities is monitored consistently and regularly, with the exception of some pollutant flows. Some natural capital data are collected every second year, such as solid waste, and water use. In terms of monetary data, only timber, fossil fuels and minerals are valued. In terms of flows, only the value of provisioning flows is measured. Hence, there is no consistent measurement of the value of other natural capital goods and services. In sum, monitoring ecosystem data is not as well established as data relating to commercially exploited natural resources.
4.3.3. Challenges and success stories
Some natural capital stocks have been increasing over time while others have been decreasing. According to Statistics Canada, timber stocks remained generally stable between 1997 and 2006. A weighted volume index of minerals, timber and fossil fuels were sustainable over that time. An index update has not been carried out yet. A recent study by Statistics Canada97 shows different trends in Canada’s ecosystem assets and describes cropland as one area of potential concern. The report notes that, for instance, between 2000–2011, 3,158 km2 of natural land was converted from agricultural land to settled areas: the largest increase in settled landscapes occurred in Ontario and Quebec.
The same report from 2013 highlights in a boreal forest case study the regulating service of forest ecosystems, namely water purification (filtration and decomposition of wastes and pollutants) affecting water quality. The study notes a decline from 2000–2010 in some regions of forest cover caused by increase of settlements and infrastructure such as roads or power lines.
Besides challenges, there are also some notable improvements. The Ministry of Foreign Affairs and International Trade has made use of the Statistics Canada data in modeling of the environmental implications of Canadian trade. The Ministry of the Environment has similarly made use of the data in its annual emissions forecasting report and for policy
96 Definition of national wealth: the sum of the value of all produced and non-produced non-financial assets. 97 Statistics Canada (2013): Human Activity and the Environment: Measuring Ecosystem Goods and Services in Canada.
Page 53 of 144
analysis purposes. At the sub-national level, the Ministry of Finance of the province of Ontario also makes use of the data in a model used for policy analysis.
Two decades ago, the Canadian Ministry of Finance began integrating energy use and greenhouse gas emissions into existing macroeconomic models. The intent was to use a model in the process of developing policy options for addressing climate change. The focus of much of the work of the Ministry of Finance was on tax policy options. The data required came from Statistics Canada’s Energy Use and Greenhouse Gas Emissions accounts. The use of integrated modeling to address climate change policy was a cornerstone of the ministry’s sustainable development objectives.
Page 54 of 144
4.4. China
Key achievements: Target to develop pilot assessments of natural capital accounting by 2020. 5th CBD National Report and National Strategy on Biodiversity.
Focus of natural capital accounts: Air; water; land; forest; mineral resources; biological resources.
4.4.1. Legal and policy frameworks for natural capital accounting
China is a party to the CBD (since 1993) and a supporter of the Rio+20 Natural Capital Communiqué. The State Council of China has released its first Biodiversity Conservation Action Plan in 1994. In 2010, the National Biodiversity Strategy and Action Plan (NBSAP) was updated for the next two decades (2011–2030).98 The overall aim of the NBSAP is to achieve conservation and sustainable use of China’s biodiversity through the development of institutions and mechanisms that can strengthen the capacities associated with ecosystem management and biodiversity conservation. This new strategy is structured around 3 goals, 8 strategic tasks, 30 priority actions, 35 priority areas for conservation, and 39 projects for implementations.
In 2014, the China’s Coordinating Group for the CBD implementation has released China's Fifth National Report on the Implementation of the Convention on Biological Diversity.99 This report indicates that, while considerable progress has been made, many more policies and measures need to be taken to achieve the biodiversity targets.
The Ministry of Environmental Protection of China (MEP) is in charge of carrying out the regulatory tasks associated with air, water, and land conservation. Placed directly under the State Council, the MEP is empowered to develop and implement environmental policies, enforce environmental laws and regulations, and organize research and development. The MEP is also in charge of China’s nuclear safety agency. 100
4.4.2. Focus of natural capital accounts
The economic evaluation of resource consumption, environmental damage, and ecological benefits will be included in future natural capital accounts of China. Currently, as part of the NBSAP, a target is set for the economic valuation of the natural capital in China by 2020. This target is currently limited to pilot assessments of the economic value of biodiversity.
98 China National Biodiversity Conservation Strategy and Action Plan 2011-2030, (2010) <http://www.cbd.int/doc/world/cn/cn-nbsap-v2-en.pdf>. 99 China's Fifth National Report on the Implementation of the Convention on Biological Diversity, (March 2014), < http://www.cbd.int/doc/world/cn/cn-nr-05-en.pdf>. 100 See: < http://english.mep.gov.cn/About_SEPA/Mission/200707/t20070704_106099.htm>.
Page 55 of 144
So far, China has established a number of regulatory policies for biodiversity conservation, compensation, and restoration. For instance, the State Council has approved several plans for promoting the conservation of biodiversity, including:
x Conservation and Use of Biological Resources (2011–2030)
x Conservation of Aquatic Biological Resources (2011–2030)
x Water Area Zoning of Important Rivers and Lakes (2011–2030)
x Zoning of Marine Areas (2011–2020)
x Wetland Conservation Projects (2011–2015)
x Island Conservation (2011–2020)
x Conservation and Use of Livestock Genetic Resources
x Protection of Natural Forest.
To support these initiatives, the capacity for biodiversity identification has been improved through various species surveys at national and regional scales. Specifically, the inventories of species have been published for Flora of China, Fauna of China, Spore of China, and China Red Data Book of endangered animals. China has also created a number of clearing-house mechanisms for biodiversity and biosafety.
In 2004, China established a compensation mechanism of ecological forest benefits, which focuses on plantation, nurturing, conservation and management of national-level public forests. The funding for this mechanism was allocated from the central government budget. In 2006, China established a mechanism of ecological restoration and environmental improvement of the mining sector. This guidance requires that mining companies provide guarantee funds to finance ecological restoration. By the end of 2012, this fund was totaling 61.2 billion Yuan RMB (approximately USD 10 billion) – which accounted for 62% of the payment due. A subsidizing mechanism was implemented in 2009 to encourage households to return their cultivated lands to forests. By the end of 2012, this mechanism was used by 124 million farmers in 2,279 counties – with an average of 7,000 Yuan RMB (USD 1135) being subsidized per household. Projects on natural forest protection are also subject to a subsidizing mechanism – initiated in 2000 in 17 provinces. This initiative covers forest management, conservation, and reforestation. A second phase of this project was implemented in 2010 with 11 more counties for the years 2011 to 2020. Additional subsidizing mechanisms have also been implemented for the conservation and restoration of grasslands and wetland.
4.4.3. Challenges and success stories
The public awareness of the value of natural capital is yet to be improved. As a result, the economic development is often promoted at the cost of biodiversity when there is a conflict between both objectives. Finally, there is no accounting system that can economically value the natural capital at a national scale at present.
Page 56 of 144
4.5. Colombia
Key achievements: Partial accounting of natural capital. Completion of the water, non-renewable resources and energy accounts.
Focus of natural capital accounts: Mining; energy; land; earth materials; timber; fisheries; ecosystem resources; water.
4.5.1. Legal and policy frameworks for natural capital accounting
Colombia is a party to the CBD and a supporter of the Rio+20 Natural Capital Communiqué. Colombia has submitted its CBD National Biodiversity Strategy and Action Plan in 2012,101 and the 5th National Report on Biodiversity in 2014.102 The country has been a core member of the WAVES Partnership since 2011, which provides the government with technical, political and institutional expertise. The WAVES Technical Committee has permanent staff in Colombia who serve as facilitators and participants in government projects contributing to the valuation of natural capital. The Committee carries out pilot projects under the direction of the National Administrative Department of Statistics (DANE), which involve the economic valuation of the country’s watersheds, which provide key ecosystem services in the country.103
Colombia’s commitment to natural capital accounting can be explained through two goals: (1) long term stability and economic growth; and (2) protection of the environment and ecosystem services to maintain their economic contribution as well as their regulating and cultural services. Natural capital is the basis for many economic activities and is not perfectly substitutable with other types of capital. Natural capital accounting is consequently seen as a methodology that is essential both for environmental protection and management, and for planning long-term economic growth and stability.
The government has been working on the implementation of Environmental Satellite Accounts (Cuenta Satélite Ambiental) since 1992 through the Inter-institutional Committee for Environmental Accounts in the COLSCEA Project.104 The Colombian Environmental and Economic Accounting System is structured according to three main topics as presented in the UN–SEEA93: accounting of stocks of natural resources, natural resources valuation, and environmental sustainability accounts.105 MAVDT (former
101 See: <http://www.cbd.int/doc/world/co/co-nbsap-v2-es.pdf>. 102 See: <http://www.cbd.int/doc/world/co/co-nr-05-es.pdf>. 103 See: <http://www.wavespartnership.org/en/colombia>. 104 Proyecto Piloto de Contabilidad Económico Ambiental Integrada para Colombia 105 United Nations Committee of Experts on Environmental-Economic Accounting (UN CEEA). Part I: Questionnaire for Coutry Participants. Copenhagen, (20-21 September 2004). See: <http://unstats.un.org/unsd/envaccounting/ceea/meetings/Colombia_DANE_E.pdf>.
Page 57 of 144
Ministry of the Environment) Resolution 1478 established a legal foundation for natural capital valuation in 2003.
DANE is responsible for Colombia’s official statistics program, including environmental satellite accounts. Their work is supported by the National Planning Department, a cross-sectorial governmental organization, in managing the environmental accounts and evaluating policy. The environmental satellite accounts are populated by information gathered by a variety of government bodies, such as the National Hydrocarbon Agency in the case of non-renewable carbon-based resources.
The Ministry of Environment and Sustainable Development is responsible for establishing natural capital valuation methods, and for evaluating the costs of environmental degradation and conservation in Colombia. The Ministry is aided in this work by the Institute of Hydrology, Meteorology and Environmental Studies and the Comptroller General of the Republic (CGR). The CGR in particular quantifies the impact of natural resource use and degradation, and evaluates management of these resources. The information produced by the two agencies is compiled in the Reports on the State of the Environment and of Natural Resources, published periodically on different topics (such as waste, air quality, renewable resources or forestry) and in particular about the cost of the potential loss or degradation of natural capital.106
The information presented in the Environmental Satellite Accounts is supplemented by intermittent local quantifications of ecosystem services that take place as part of project-specific Environmental Impact Assessments (EIA). One requirement for the completion of an EIA is the quantification of ecosystem services degradation that can potentially result from a given project. This entails the calculation of a baseline of ecosystem services in the relevant area. The valuation is designed to fulfill three key objectives:
x long-term analysis of the state of ecosystem services in particular areas;
x evaluation of projects in order to grant licences and authorizations;
x establishing the basis for quantification of costs associated with preventive and corrective measures including mitigation, reparation, and restoration of ecosystem services.
Colombia’s National Development Plan 2010–2014 includes a chapter on environmental sustainability and risk prevention107 that sets out fourteen strategies for the protection of ecosystem services and natural capital, including the promotion of environmental accounts. Emphasis is placed on the valuation of ecosystem services associated with human wellbeing and economic growth. The 2010 Colombia Natural Capital Strategy was developed with the support of Conservation International and the Fund for Environmental
106 See: <https://www.siac.gov.co/contenido/contenido.aspx?catID=822&conID=1259>. 107 See: <https://www.dnp.gov.co/LinkClick.aspx?fileticket=pWe6xuYO5b0%3d&tabid=1238>.
Page 58 of 144
Action and Youth, and joined by the Colombian Presidency and the Office of the Comptroller General in 2011. The strategy aims to: support natural capital conservation in Colombia; acknowledge the importance of ecosystem services in all economic and social sectors; and develop mechanisms to integrate the value of Colombia’s natural capital into decision-making processes.108 Influenced by strategies and objectives discussed above, several schemes involving payments for ecosystem services have been established in Colombia (see Box 1).
4.5.2. Focus of natural capital accounts
Colombia’s environmental satellite accounts are to be produced for mining, energy, land, earth materials, timber, fisheries, ecosystem resources and water. The valuation of natural capital is still in an experimental phase with preliminary results for some categories only. DANE is currently working on pilot projects to generate ecosystem as well as forestry output (timber and firewood) accounts. The methodology used by DANE for the environmental satellite accounts is based on the UN–SEEA.109
DANE satellite accounts110 aim to represent annual contributions of natural capital to the economy (including stocks and flows) as well as natural capital degradation. They also provide an account of public sector expenditures on environmental protection, which includes data on government actions to protect and recover natural resources and the environment. The private sector also produces information related to industrial sector actions and expenditures. The Department of National Statistics has produced reports on this topic including the ‘Special Section for Investment and Expenditures on Environmental Protection and the Annual Survey of the Manufacturing Sector’.111
Colombia has large deposits of coal that are decreasing. Stocks of oil and natural gas increased between 2011–2012 due to new discoveries. Stocks of nickel and copper are also increasing due to new discoveries. The extraction of iron and nickel (which represent 88% of the country’s metal extraction) also increased between 2011 and 2012.
A decrease in water extraction for household and industrial use was observed between 2009 and 2010. Groundwater extraction also decreased, while rainwater harvesting and ocean water use increased over this period. Most of the public investment in environmental protection is dedicated to water treatment as well as to the protection of biodiversity and landscapes. In 2012 the Colombian government spent 0.33% of national
108 Cesar Augusto Ruiz Agudelo. Colombia – National Program: Accounting for Ecosystem Services – Colombian Pilot Study. WAVES Global Partnership Meeting. (2–4 April 2012). See: <http://www.wavespartnership.org/sites/waves/files/documents/Second%20Partnership%20Meeting/WAVES_CRUIZ_APRIL_2012_CI_COLOMBIA.pdf>. 109 See: <https://unstats.un.org/unsd/envaccounting/seea.asp>. 110 See: <http://www.dane.gov.co/index.php/medio-ambiente/cuentas-ambientales#fqlws_1>. 111 United Nations Committee of Experts on Environmental-Economic Accounting (UN CEEA). Part I: Questionnaire for Coutry Participants. Copenhagen, (20-21 September 2004). See: <http://unstats.un.org/unsd/envaccounting/ceea/meetings/Colombia_DANE_E.pdf>.
Page 59 of 144
GDP on environmental protection. In the industrial sector, investments have been made to reduce air and water pollution, as well as to recycle metals, paper and cardboard and glass. DANE has estimated in a pilot project that ecosystem services represent 6.5% of the national GDP on average for the period 2000–2010.
In addition to the accounts generated by DANE, there are various local and regional studies related to natural capital accounts that originate from the academic sector and international organizations. These address specific ecosystem services and valuations.112
The 2012 Inclusive Wealth Report also provides a comprehensive assessment of the economic value of capital (natural, human, produced) in Colombia. The Report states that Colombia’s natural capital as of 1996 is worth USD 446,710 million, which represents more than twice the produced capital of that year, and 44% of the inclusive wealth index (which is the sum of the produced, human, and natural capitals). Recent studies have shown a decline in Colombia’s natural capital. In particular, despite gains in the produced and human capitals, Colombia’s natural capital stocks steadily decreased from 1990–2008.113
4.5.3. Challenges and success stories
According to the WAVES Technical Committee, the implementation of natural capital accounting requires the completion of three steps: (1) development of an internationally agreed methodology for ecosystem valuation, (2) incorporation of natural capital in the national accounts along with human and produced capital, and (3) the active participation of all economic actors and stakeholders.
There are several challenges to the implementation of natural capital accounts and the involvement of all stakeholders in Colombia. First, there is a necessity to consolidate a baseline for the state and stock of Colombia’s natural capital. This is a data-intensive process that requires financial capacity as well as inter-institutional cooperation. In particular, further work is required to create a national methodology that can be applied uniformly in local project-based valuation studies. Further work is also required to establish formal mechanisms to improve the transfer and integration of information, including within the environmental satellite accounts, and within public policy more generally.
112 Examples are: Millenium Ecosystem Assessment sub-global report on the Colombian Andean Coffee-growing Region. See: <http://www.unep.org/maweb/en/SGA.Colombia.aspx>. UNDP (2010) Latin America and the Caribbean: A Biodiversity Super Power. In Policy Brief. World Bank (2008) Integrated Silvopastoral Approaches to Ecosystem Management, Colombia, Costa Rica, Nicaragua. See: <http://www.worldbank.org/projects/P072979/integrated-silvopastoral-approaches-ecosystem-management?lang=en>. Conservation International also provides ecosystem services assessments based inter alia on the willingness to pay. 113 Balvenera et al. calculate that natural resources are being depleted by 7.75% of GNI annually: Balvanera et al. (2012) ‘Ecosystem services research in Latin America: The state of the art’ Ecosystem Services. See: <http://dx.doi.org/10.1016/j.ecoser.2012.09.006>.
Page 60 of 144
The second key challenge is the lack of political will, and its reflection in the decreasing portion of the national budget that is allocated to environmental management. Related to this is the need to strengthen socialization of the SEEA methodology, and improve institutional capacity concerning environmental management and enforcement of relevant laws and policies.
One important step towards protection of Colombia’s natural capital is the preparation of a National REDD+ strategy.114 This strategy is currently being prepared under the supervision of MADS and in collaboration with other government entities. Once completed in 2015, it will form part of the National Development Plan, and as such will be integrated to the wider national strategy for sustainable development. The strategy will enable Colombia to fulfill its international commitments to reduce CO2 emissions, manage its forests sustainably, and promote local and regional development. The Forest Carbon Partnership Facility, pursuant to a formal partnership with the World Bank, provided funding to support development of the Strategy.
The project has already had some success: In particular, efforts have been made towards the generation of information concerning the state of Colombia’s forests. This has entailed the creation of mechanisms such as the Forest and Carbon Monitoring System. This system provides information regarding carbon stocks within forests and the impacts of deforestation and ecosystem degradation in terms of carbon emissions. It also identifies the areas under major threat of deforestation. The completion of the National Strategy and participation in the REDD+ project can be considered essential steps towards better policy and planning for forestry management.
114See: <http://www.minambiente.gov.co>.
Page 61 of 144
Box 1 – Payments for ecosystem services schemes: Colombia
A scheme for payment for ecosystem services has been set up as a part of the East Cauca Valley Water Fund. Under this scheme, water users pay a tariff, which is deposited into a long-term trust fund. The money is then invested into conservation schemes in watershed areas with the highest potential for reducing sediment and maintaining water yield. Priority areas are identified using a mapping and modeling software tool called Integrated Valuation of Ecosystem Services and Trade-offs (InVEST). This free, downloadable model allows for the spatial representation of relationships between multiple ecosystem services and the cost associated with losses of ecosystem services.115
In an effort to reduce pressure on primary forest from ranching-induced deforestation, the World Bank Silvopastoral Scheme was established to introduce payment incentives for farmers adopting integrated silvopastoral farming systems in degraded pasture lands in three countries; Costa Rica, Colombia and Nicaragua. The project developed technologies to help control livestock-induced deforestation, addressed socio-economic issues linked to livestock grazing and identified means to overcome barriers (e.g. financial, knowledge or policy) to the adoption of these integrated systems.116
The change to silvopastoral systems allowed farmers to increase productivity (and associated socioeconomic benefits) and reclaim degraded soils. This change also provided improvements to ecosystem function and global conservation benefits. Between 2003–2008, the accumulated payment for ecosystem services per farm was USD 2,500 (Costa Rica), USD 2,400 (Nicaragua) and USD 2,300 (Colombia), resulting in 12,262 hectares with improved biodiversity and carbon sequestration indices. The project also demonstrated improvements to other ecosystem services, including better water infiltration; soil retention; soil productivity; reduction of fossil fuel dependence (e.g. substitution of inorganic fertilizer with nitrogen fixing plants); diversification of farm benefits; scenic beauty enhancement and land rehabilitation. One innovative element of the project was that payments varied depending on the degree of environmental service being provided. This eliminated inefficiencies and allowed farmers to decide the degree of conservation effort they were willing to make.117
115 See: <http://www.naturalcapitalproject.org/pubs/NatCap_InVEST_and_Case_Study_Summary_TEEB_2010.pdf>. 116 World Bank (2008) Integrated Silvopastoral Approaches to Ecosystem Management Project in Colombia, Costa Rica and Nicaragua. Centro Agronomico Tropical de Investigación y enseñanza (CATIE), (November 2008). 117 Murgueitio, E., et al. (2003) Usos de la tierra en fincas Ganaderas. Guía para el Pagos de Servicios Ambientales en el proyecto Enfoques Silvopastoriles Integrados para el Manejo de Ecosistemas. 2d ed., Cali, Colombia: CIPAV.
Page 62 of 144
4.6. Costa Rica
Key achievements: Methodology, action plan, and proposed laws for the development of natural capital accounts, and pilot studies with active data gathering. National schemes for environmental services payments.
Focus of natural capital accounts: Water; forestry; energy; biodiversity; carbon.
4.6.1. Legal and policy frameworks for natural capital accounting
Costa Rica is a party to the CBD and a supporter of the Rio+20 Natural Capital Communiqué. As part of its CBD obligations Costa Rica has submitted its 4th National Report and created a National Biodiversity Strategy and Action Plan. Supported by the WAVES Partnership, the Government of Costa Rica government is currently working on pilot natural capital accounts with an initial focus on water and forestry. Preliminary reports are expected in 2014.118
Costa Rica has compiled natural resources account information for forestry, soil erosion and fisheries since as early as 1991.119 In 1997 the country became the first to establish a national scheme for environmental services payments (Pago por Servicios Ambientales, or PSA), and to adopt environmental services terminology. Under the PSA scheme landowners are compensated for activities identified as contributing to ecosystem services or a sustainable environment including reforestation, sustainable forest management, forest conservation and regeneration activities.120 Landowners are under contract to manage or protect their forests for 20 years and are obliged to follow a management plan that applies to all future purchasers of the land.
Forestry is recognized as a critical type of natural capital in Costa Rica. In 1996, the country adopted Forestry Law No. 7575, which legally recognizes four critical services provided by forest ecosystems, namely: (1) carbon sequestration; (2) hydrological services, including provision of water for human consumption, irrigation and energy production; (3) biodiversity protection and (4) scenic beauty for recreation and tourism.121 The law also established a framework for payments to landowners for these ecosystem services, and established the National Fund for Forestry Financing (FONAFIFO) to manage the national PSA. It also prohibits forest conversion and requires all working forests to be placed under an approved management plan.
118 See: <http://www.wavespartnership.org/en/costa-rica> 119 Solorzano, R., et al. (1991) Accounts Overdue: Natural Resource Depreciation in Costa Rica. Washington, D.C.: World Resources Institute. Hamilton, K., and E. Lutz (1996) Green National Accounts: Policy Uses and Empirical Experience. In Environmental Economics Series, Paper No. 039, Environmentally Sustainable Development, World Bank. 120
See: <http://www.fonafifo.com/paginas_english/environmental_services/servicios_ambientales>. 121 Pagiola, S. (2006) Payments for Environmental Services in Costa Rica. Washington, D.C.: Environment Department, World Bank.
Page 63 of 144
In 2005, a compulsory water tariff was adopted in Costa Rica, a portion of which is channeled through the PSA program. The remaining tariff revenues are allocated to the Ministry of Environment and to protected areas. Funds are used for national water management, specific conservation projects and for the conservation, maintenance and ecosystem restoration including water resource protection.122 FONAFIFO receives funds from this water tariff and uses it to provide an additional payment for watershed protection to PSA contractors. Only a small percentage of contractors receive this payment.
A strategic point in Costa Rica’s National Biodiversity Strategy and Action Plan is the
internalization of costs for environmental services and incentives.123 A Biodiversity Conservation Trust Fund (Fondo para la Biodiversidad Sostenible or FBS) provides long-term conservation payments for the 1.4 million hectares of biodiversity priority conserva-tion areas located outside designated protected areas.
There is currently no law on natural capital accounting in Costa Rica and natural capital accounts information is not directly incorporated into the budget process. However, ecosystems are recognized as providing critical services and the country has committed to pursuing green growth, carbon neutrality, increasing the share of hydropower for power generation, expanding eco-tourism and the sustainable management of forest and marine resources.124 Data relating to environmental indicators are collected and put into a National System of Environmental Information (Sistema Nacional de Información Ambiental or SINIA). These data act as a base from which to determine the state of the environment and natural resources in Costa Rica. The organizations that collect, manage, and process information relating to natural capital accounts include:
x Forestry – National Forestry Financing Fund and The National System of Conservation Areas (SINAC) of the Ministry of Environment and Energy, National Forestry Office, The National Statistics Agency (INEC), Central Bank of Costa Rica (BCCR)
x Water – Ministry of Environment and Energy (MINAE), DWP MINAE, Costa Rican Institute of Aqueducts and Sewers, Instituto Costarricense de Electricidad, Rural Aqueduct Association Manager, University of Costa Rica (ProGAI), INEC
x Energy – Instituto Costarricense de Electricidad, Energy Sector Directorate, MINAE, INEC, BCCR
x Other – Ministry of Finance, Ministry of Planning and Economic Policy.
122 Burchi, S. (2007) Balancing Development and Environmental Conservation and Protection of the Water Resource Base – the ‘Greening’ of Water Laws. FAO Legal Papers Online No. 66. Development Law Service. 123 Convention on Biodiversity (2014) Country Profile – Costa Rica. See: <http://www.cbd.int/countries/>. 124
See National Development Strategies on energy, tourism, water, forest and marine resources.
Page 64 of 144
The lead agencies for environmental accounting in Costa Rica are MINAE and the Central Bank with contributions from INEC, the Ministry of Finance, and the Ministry of Planning. Furthermore, INEC and MINAE are responsible for collecting information on
environmental statistics and indicators.125
The government takes an active role in training professionals to maintain and analyze this statistical information. All lawfully public information is available online126 and the Costa Rica Open Government initiative promotes transparency and institutional accountability. Furthermore, MINAE has created the Technical Group on Water and Forests, which provides, debugs, evaluates and verifies data collected and ensure that it is accessible.
INEC directly channels information to parliamentarians and the MINAE in order to deliver a consolidated and verifiable overview of environmental accounts. Parliamentarians use this information for technical and professional development, review and research projects in these areas.
Costa Rica’s proposed Draft Law No. 18996 would add an article to the country’s 1995 Organic Environmental Law. This article would introduce natural capital assessment and the integration of green accounting in development planning. Included in the proposed Law are requirements for private and public sector project proposals to prepare environmental impact statements that incorporate ecosystem service analysis. In May 2014, this proposal included ecosystem services including provisioning services (food, water, timber and fiber); regulating services that affect climate, floods, disease, waste and water quality; cultural services that provide aesthetic, recreational and spiritual benefits; and supporting services such as soil formation, photosynthesis and nutrient cycling. These values would then be used in Costa Rica’s GDP calculations in order to estimate the percentage of GDP that comes from these assets and the economic impact of development on GDP. Provisions concerning natural capital accounting are also included under File No. 18660 – the Framework Law on Climate Change.
4.6.2. Focus of natural capital accounts
Costa Rica collects data related to natural capital assets (i.e. forests and water) and other related components (i.e. biodiversity, energy, carbon). MINAE and BCCR collaborate to strengthen statistical capacity on a range of subjects, including: air quality and emissions, hydrological resources, forest cover, biodiversity, climate, energy, sustainable development indicators and institutional management of the environment.
125
Instituto Nacional de Estadistica y Censos de Costa Rica (INEC) Costa Rica <http://www.inec.go.cr>. 126 Instituto Nacional de Estadistica y Censos de Costa Rica (INEC) Costa Rica. Accessed 27 March 2014 <http://www.inec.go.cr>.
Page 65 of 144
An estimated 52% of Costa Rica’s total land area is forested, while agricultural land makes up 35.2%.127 Total converted land is 49.4%, while terrestrial protected areas make up around 20% of total land area, including national parks, biological reserves, protected areas, forest reserves, wildlife refuges and wetlands. These data reveal that Costa Rica has reversed its previous trend of environmental degradation growing its reported forest cover from 51% to over 52%.128 This resource is viewed as a potential carbon offset to help the country achieve effective carbon neutrality by its 2021 target.
4.6.3. Challenges and success stories
Population growth, urbanization, increasing energy demand and agricultural developments put pressure on Costa Rica’s natural resources. Soil erosion and water pollution are threatening ecosystems, particularly marine and coastal resources. The Millennium Ecosystem Assessment sub-global assessment of Costa Rica’s Chirripó River basin identified logging, poaching, pollution and ecosystem fragmentation due to the unsustainable agricultural practices of non-indigenous people as current threats to the forested study area.129 From a biodiversity standpoint, Costa Rica contains an estimated 13,680 species currently recorded in seven eco-regions. Climate change is predicted to have a negative impact on biodiversity and ecosystem services in Costa Rica, in particular through increased flood and drought risk.
The main source of finance (~80%) for the national PSA scheme has been revenue
allocated from a 3.5% tax on fossil fuel sales (about USD 10 million per year in 2006).130 Additional funds supporting the project have come from forestry tax revenues; a World Bank loan and the Bank’s Mainstreaming Market Based Instruments for Environmental
Management (MMBIEM) project; grants from the Global Environment Facility (GEF);131 the German government (for forest protection); the Norwegian government (for carbon sequestration); and Conservation International (for agroforestry contracts and tree planting).
127 WAVES Costa Rica. See <https://www.wavespartnership.org/en/costa-rica> 128 Balvanera, P., et al. (2012) Ecosystem Services Research in Latin America: The State of the Art. Ecosystem Services 2(December 2012): 56-70. 129 MA Sub-global Assessment (2005) Local Ecosystem Assessment of the Higher and Middle Chirripó River Sub-basins, Cabécar Indigenous Territory, Costa Rica. Available from <http://www.unep.org/maweb/en/SGA.CostaRica.aspx>. 130
Fondo Nacional de Financiamiento Forestal (FONAFIFO) Accessed 25 March 2014. Available from <http://www.fonafifo.com>. 131
Grants for PES schemes from International donors such as GEF are sometimes considered as payments from the global community for the biodiversity services provided by Costa Rica’s forests.
Page 66 of 144
4.7. Democratic Republic of the Congo
Key achievements: Reforms in relation to forestry, agriculture, natural resources extraction and environmental protection are on-going; enhanced transparency in mining contracts and combatting illegal extractive industry initiatives through the EITI.
Focus of natural capital accounts: Soil, water, forest, other vegetation, protected areas, mining, hydrocarbons
4.7.1. Legal and policy frameworks for natural capital accounting
The Democratic Republic of Congo (DRC) is a party to the CBD. It has submitted a 4th CBD National Report,132 and established a National Biodiversity Strategy and Action Plan in 2002.133 Both of these documents are used as a basis for conservation, management and sustainable use of biological resources.
Information relevant to natural capital accounting is compiled and published by several government departments and the DRC Extractive Industries Transparency Initiative (EITI).134 There have been on-going attempts to establish an Agency for the Development of Environmental Information; a regional initiative for the Forests in the Congo Basin; and a National Centre for Environmental Information within the Ministry of Environment.
DRC does not currently have access to standardized and accessible data concerning the economic value of natural capital. However, previous attempts to undertake economic valuation of natural capital have used as a basis frameworks developed by the UN Statistical Commission and WAVES Partnership. Decree No. 09/45 of 2009 assists the National Statistics Institute to collect and analyse information needed for demographic, economic and social policy formulation.
The main actors involved in work done on natural capital in the DRC are the: Ministries responsible for Environment, Nature Conservation and Tourism, Energy, Mines, and Oil; Central Bank of Congo; and several other public agencies including The Mining Cadastre; Directorate of Geology; Centre of Expertise for Evaluation and Certification of Minerals; Congolese Institute for the Conservation of Nature; National Centre for Environmental Information; and National Water Commission.
A broad set of guidelines concerning management of natural resources in DRC are defined in the Strategy Document for Growth and Poverty Reduction, for the period 2012–2016.135 DRC has developed the following programs, plans and strategies concerning environmental and nature conservation:
132 See: <http://www.cbd.int/doc/world/cd/cd-nr-04-fr.pdf>. 133 See: <http://www.cbd.int/doc/world/cd/cd-nbsap-v2-fr.pdf>. 134 See: <http://eiti.org/>. 135 DSCRP 2, Vol. 2. Issue. 2, October, 2011 <www.plan.gouv.cd>.
Page 67 of 144
x National Environmental Action Plan (1998);
x National Strategy and Action Plan Biodiversity (1999);
x Forests and Conservation National Program;
x Second National Communication on Climate Change;
x National Strategy for the Conservation of Biodiversity in protected areas (2012) and;
x National Strategy Framework for REDD+ in the Democratic Republic of Congo (2012).
The following laws have also been enacted in order to facilitate environmental protection:
x Act No. 11 /009 of 9 July 2011 on the Basic Principles Relating to the Protection of the Environment;
x Law No. 11/2002 of 29 August 2002 on the Forest Code;
x Law No. 14 /003 of 11 February 2011 on the Conservation of Nature.
These laws include provisions on accounting for natural capital, such as forest inventories and identification of components of biological diversity conservation and its sustainable use. The laws also link natural resources management objectives to economic growth, rural development, poverty reduction and combatting climate change.
The national Government’s strategic objectives regarding the forestry sector are to: increase the sector’s contribution to the country’s economic growth through sustainable land and forest management; ensure economic and social benefits, particularly for local people living in the forests; and obtain fair compensation for environmental services provided by forests. As parts of its efforts to combat deforestation and forest degradation, the DRC developed a National REDD+ Strategy in 2012. Improving forest governance and reforming the Forest Code to support implementation of REDD+ processes is a legislative priority. Through a ‘Forest Law Enforcement Governance and Trade’ process, DRC continues negotiations with the EU to sign a Voluntary Partnership Agreement to improve forest governance and efforts to combat illegal logging and associated trade.
Land management is governed by Law No. 73/021 of 20 July 1973. Agriculture is governed by Law No. 11/022 of 24 December 2011. The provisions of the latter cover agricultural activities, training and research; financing of agricultural activities and the marketing of agricultural products; environmental protection; and customs regimes and tax. Law 11/022 also requires the Government to define and implement national agricultural policy for the promotion and growth of agricultural production, rural development and food security
The Mining Sector in DRC is governed by Act No. 007/2002 of 11 July 2002 on the Mining Code, and Decree 038 /2003 of 26 March 203. In recent years the main priorities
Page 68 of 144
of the Government regarding mining have been to: review and enhance transparency of mining contracts; circulate the International Conference of the Great Lakes Region certificate to combat illegal logging and mineral trades; and progressively implement EITI principles through continuous revision of the Mining Code.136
The oil sector in DRC is currently governed by Ordinance Law No. 81–013 (1981) on the General Legislation on Mines and Hydrocarbons. Further exploration and exploitation of hydrocarbon reserves are among the top priorities of the DRC Government. DRC has not yet established legislation regarding water resources, however Parliament is considering a Bill on the issue.
4.7.2. Focus of natural capital accounts
Key natural capital stocks in DRC include: arable land for agriculture, water, forests and other vegetation, minerals and hydrocarbons.
DRC features an extensive network of rivers (e.g. the Congo River), lakes (e.g. Albert, Edward, Kivu Tanganyika, Mweru, Bangweulu, Upemba Mukamba, Fwa, Tumba, Mai-Ndombe) and other water bodies. These water bodies cover approximately 3.5% of DRC’s total area. The DRC Parliament has recognised that its water resources possess vast economic, social and environmental values. Forests cover approximately 60% of DRC’s total land area with over 700 identified species of trees. The forestry sector represents currently approximately 2% of DRC’s GDP.
The DRC also has an abundance of mineral resources, including copper, cobalt, zinc, iron, cadmium, silver, gold, tin, cassiterite, slag tantalite, columbite, tantalite, wolframite, manganese, and diamonds. According to the Central Bank of Congo the share of extractive industries in 2010 represented 45% of GDP, of which 38.91 % was attributed to the mining sector. A 2013 study for the period of 2007–2012 by the DRC Senate estimated that the mining sector contributes 19.6% to the State Budget. These resources, however, remain underutilised – only 14% of the land area has been geologically mapped. In 2010 only 12% of exploration permits were under operation.
Within the mining sector the main objectives of the Government are to boost oil production to support economic growth, increase tax revenues in the short term, and improve social and environmental conditions in the mining areas. To achieve this the Government has committed to:
x Strengthen the institutional capacity of the mining sector by tightening the legal and regulatory framework, modernizing the administration and organization of strategic planning;
136 Guidelines on mining, as set out by the Ministry of Mining and PRSP2 <www.mines-rdc.cd>.
Page 69 of 144
x Intensify geological and mining research to improve knowledge of the soil and subsoil;
x Improve management of the sector for sustainable development, including social and environmental aspects of mining.
Oil exploration companies mainly operate in sedimentary basins in the DRC. Areas for future exploitation include: the Western zone, the inner central area of the Central Basin; the Eastern Zone and three basins in the East African Rift Valley; the Albertine Graben; Tanganiyika, Mweru and Bangweulu Lakes. The DRC is also engaged in offshore shale gas production.
4.7.3. Challenges and success stories
Increasing deforestation as a result of population pressure is a major challenge for the DRC. The Congolese forests represent 66% of the entire forest area of the Congo Basin. DRC had a population of almost 70 million in 2010, which is expected to approach 100 million by 2020. Levels of deforestation and forest degradation are highly variable depending on the area, and the density of people who live there. Pressures on forest resources are mainly due to agricultural clearing (e.g. the practice of slash and burn agriculture), sampling timber, and clearing for firewood as an energy source.
Other key challenges in DRC are the underutilization of: wood species; wood processing plant capacities;; and the country’s mining potential. Sustainable use of these resources has the potential to be a significant driver of social well-being and economic growth. Factors contributing to underutilization of these resources include poor governance and transparency in the mining sector, and the non-payment of duties and taxes by mining corporations.
DRC also has significant groundwater resources, which are easily exploitable and are found mainly in alluvium and sandstone and limestone formations across the country. Proper management of these remains important as more countries are turning to the use of groundwater to mitigate water scarcity. Another societal challenge is the illegal exploitation of natural resources by uncontrolled armed groups.
DRC identifies several legislative gaps concerning natural capital accounting and management, including the need for further legislative reforms to implement REDD+, and establish a framework for payments for ecosystem services.
DRC has invested significant effort towards improving transparency and good governance concerning management of its natural capital. Key efforts have focused on: combatting activities of armed groups in the eastern part of the DRC; membership and progressive implementation of the EITI principles to achieve transparency, governance of natural resources (in particular mining) and increased state revenue.
Page 70 of 144
4.8. France
Key achievements: Methodology development for natural capital accounting and identification of research needs; implementation of a mechanism of ecological compensation; creation of the National Committee for Biodiversity in 2014.
Focus of natural capital accounts: Environmental protection; management of natural resources
4.8.1. Legal and policy frameworks for natural capital accounting
At the international level, France is a financial and technical supporter of the WAVES Partnership. Together with 35 other countries France has agreed to develop an action plan for natural capital accounting, including: work across ministries to ensure full government support; engagement across the public and private sector; and support for the exchange of information and challenges through gathering of regional and annual data. France is also a supporter of the Rio+20 Natural Capital Communiqué and a party to the CBD. It has submitted the 4th CBD National Report and National Biodiversity Strategy and Action Plan.
At the European level, specific targets have been developed for a number of key themes associated with natural capital. Those targets have been initially developed by Eurostat137 (the Statistical Office of the European Union) in order to harmonize the key indicators across countries under several common themes (healthcare, climate change, biodiversity, transportation, etc.). On this basis, France has developed metrics that currently include 12 key indicators and 45 sub-metrics.138
At the national level, the Grenelle laws (I and II) have proposed an action plan for the use of natural capital accounts in decision-making.139 These laws stipulate that the government must implement the necessary steps leading to the evaluation of the ecosystem services that bring value to the community and the socio-economic actors. Following the ratification of these laws, the National Observatory on Biodiversity (ONB) was created in order to take into consideration the economic value of natural capital accounts in decision-making.
The key objectives of the ONB as detailed in the National Strategy for Biodiversity (SNB) are to:
137 Commissariat général au Développement durable, ‘Les Indicateurs De La Stratégie Nationale De Développement Durable 2010-2013’ <http://www.statistiques.developpement-durable.gouv.fr/developpement-durable/1328.html>. 138 Odile Bovar, M Demotes-Mainard, C Dormoy, L Gasnier, V Marcus, and B Tregouët, 'Les Indicateurs De Développement Durable', (2008). 139 Loi Grenelle, '1/Loi N 2009-967 Du 3 Aout 2009', Programmation relative à la mise en œuvre du Grenelle de l’environnement.
Page 71 of 144
x Generate the willingness to act in favor of biodiversity;
x Preserve life and its ability to evolve;
x Invest in a common good: our ecological capital;
x Ensure sustainable and equitable use of biodiversity;
x Ensure consistency across policies and the effectiveness of action;
x Develop, share, and promote knowledge.140
To achieve these objectives, the SNB aims to involve key stakeholders from all economic sectors (water, land, sea, climate, energy, agriculture, forest, urban planning, infrastructures, tourism, commerce, education, research, and healthcare). The French Prime Minister is ultimately responsible for the progress of this strategy.
Whereas the SNB provides a comprehensive framework for preserving the value of French natural capital, a supplementary mechanism was implemented in 2008 to balance the negative impacts that new construction projects have on biodiversity. This mechanism of ecological compensation is managed by the CDC Biodiversité and is based on the 1976 law on environmental responsibility and compensation methods (LRE law). Under this framework, the CDC Biodiversité takes into account the economic value of natural capital when determining the appropriate level of ecological compensation. Compensation actions must adhere to the principle of ‘ecological equivalence’. The ultimate goal is to ensure that there is no net loss of biodiversity and no time lag between the negative impacts and compensation provided.141
In a more recent development, a National Committee for Biodiversity (CNB) will be established following ratification of the 2014 law on biodiversity.142 This new committee will be in charge of expanding and implementing the National Strategy for Biodiversity (SNB). Among other key responsibilities, this committee will ensure that biological processes and ecosystem services are preserved and rehabilitated to their initial states. In addition, the CNB will provide support to policy-makers in terms of knowledge and scientific expertise, on potential future policies and laws related to biodiversity and ecosystem services.
The Department of Observation and Statistics (SOeS) is in charge of organizing the observation and the statistical reporting of all costs related to environmental protection and enhancement. This department also provides environmental data to the general public
140 Observatoire National de la Biodiversité, 'Stratégie Nationale Pour La Biodiversité', in Ministère de l’écologie, du développement durable, des transports et du logement (2011). 141 Philippe THIEVENT, and Brice QUENOUILLE, 'Cdc Biodiversité: Un Moyen De Compensation Pour Maintenir La Biodiversité', Liaison énergie francophonie (2008), 53-57. 142 Conseil national de la transition écologique (CNTE), 'Délibération N°2013-02 : Avis Sur Le Projet De Loi Relative À La Biodiversité', (2013) <http://www.developpement-durable.gouv.fr/IMG/pdf/avis_loi_biodiversite_CNTE_141213_adopte-2.pdf>.

Page 72 of 144
taking into account requirements of the Aarhus convention, and develops key indicators associated with sustainable development in France.143
Concerning methodology, the Service of Strategic Analysis (SAS) has published in 2009 a ministerial report on the economic value of natural capital in France. It presents a number of methods related to the economic valuation of ecosystem services for public decisions.144 The main objectives of this public report are to critically analyze the current state-of-the-art methods that can be used to value natural capital, and determine the necessary research and policy needs for the future. The report, requested by the French Prime Minister and written by a scientific team led by Bernard Chevassus-au-Louis, has contributed to sensitize policy-makers to the various advantages and challenges associated with the economic valuation of ecosystem services. It constitutes one of the most comprehensive methodological documents for natural capital accounting in France.
4.8.2. Focus of natural capital accounts
SOeS produces an annual report on environmental economics. This report provides data on a number of environmental accounts related to the cost of environmental protection and enhancement. The Audit Commission on Environmental Accounting (CCEE) is in charge of reviewing and approving this report. These environmental accounts have been designed in accordance with the UN–SEEA framework.
Specifically, two types of accounts are reported: the cost of environmental protection (CDPE) and the cost of managing natural resources. The latter aims to describe all the monetary flows associated with the management of natural resources such as water, forest, ecosystem, raw materials, and energy resources. Both accounts are established according to international and national accounting standards.145
The first section of the report on environmental accounts has been present since its first release in 1999 and follows the international reporting standards called Cepa 2000. It provides data on the yearly costs associated with a number of key accounts, such as water quality, air quality, waste management and biodiversity. In 2011, more than 80% of the total yearly budget was attributed to waste management and water quality. By contrast, the budget related to the protection of biodiversity represented only 1% of the total budget on environmental protection. While this is relatively small in comparison to other environmental accounts, this budget has increased by 12% between 2010 and 2011.
The second section of the report relates to all environmental costs that are not related to environmental protection. The main focus is on the evolution of year-on-year costs of
143 ‘Commissariat Général Au Développement Durable’ (2009) <http://www.developpement-durable.gouv.fr/IMG/spipwwwmedad/pdf/Commissariat_general_au_Developpement_durable_cle2e4f45.pdf>. 144 Bernard Chevassus-au-Louis, Jean-Michel Salles, and Jean-Luc Pujol, ‘Approche Économique De La Biodiversité Et Des Services Liés Aux Écosystèmes’, Contribution à la décision publique. (2009). 145 Olivier Diel, Cyril Gicquiaux, Herve Louis, Sophie Margontier, Isabelle Pasquier, and Celine Randriambolona, ‘L’économie De L’environnement En 2011.’ (Rapport de la Commission des comptes et de l’économie de l’environnement, 2013).
Page 73 of 144
water management (e.g. infrastructure for water treatment and water storage). Finally, the third part of the report focuses on a number of other relevant issues such as green areas, renewable energies, eco-employment, and green growth.
France has also made available an extensive set of indicators, based on the European framework developed by Eurostat that provides quantitative information on specific aspects of natural capital including carbon emissions, renewable energy, resource productivity, evolution of populations of common birds, and fishing limits. These indicators are published by SOeS in a triennial report.137
4.8.3. Challenges and Success Stories
The implementation and development of a natural capital accounting framework in France has been faced with a number of challenges. These include: raising political awareness regarding the economic value of biodiversity; definition and implementation of accounting tools; and definition of an efficient policy to reduce the alteration and pollution of soils. While some of these challenges have been addressed by recent legal developments, the issue of political awareness remains a key challenge for natural capital accounting.
While France has made significant progress on natural capital accounting (Grenelle laws; CDC Biodiversité), it is currently limited to the costs of environmental protection and enhancement. It is however expected that the ‘National Committee for Biodiversity’ (planned for 2014) will significantly expand the national accounts on biodiversity and ecosystem services.
Box 2 – Ecological compensation and ecosystem restoration: France
The Intervention Fund for the Natural Capital (FIPAN) is a funding mechanism managed by a not-for-profit organization that aims to coordinate ecological compensation and enhancement of ecosystem services.146 In this mechanism, the subscribers pay a fee to FIPAN in order to value an ecological impact and subsequently implement the compensation measures. This scheme also aims at developing and enhancing the existing ecosystem services - so as to bring economic value to the socio-economic actors (subscribers). In particular, FIPAN aims to cooperate with the local authorities in order to help implement the National Strategy for Biodiversity.
FIPAN is currently working on two projects: ecological compensation for the construction of a new high speed rail line; and enhancement of ecosystem services (water in particular) for local agriculture. Both projects aim to deliver economic value to the local communities and the FIPAN subscribers through the use and enhancement of natural capital.
FIPAN has received the 2011 Enterprises and Environment Award from the Minister of Ecology under the category of ‘Initiatives and Biodiversity’.
146 Fonds d’Intervention pour le Patrimoine Naturel, (2014) from <http://www.fipan.fr/>.
Page 74 of 144
4.9. Georgia
Key achievements: Studies of particular regions and resources resulting in TEEB Scoping Study which collates existing data and identifies key features of natural capital essential for the Georgian economy.
Focus of natural capital accounts: Forestry; water; air; land; mineral resources; biodiversity.
4.9.1. Legal and policy frameworks for natural capital accounting
Georgia is a party to the CBD and has undertaken a number of initial studies including TEEB in 2013.147 The country identified five core sectors of its economy that are applicable for the TEEB initiative: energy, tourism, agriculture, mining, and forestry. The TEEB study highlights the dependence of the Georgian economy on natural capital and the associated ecosystem services. The study was an important step in valuing natural capital in Georgia and demonstrated a commitment to studying the relationship between the economy and the environment, as well as the integration of the value of natural capital into national economic policies.
The Ministry of Environment and Natural Resources Protection of Georgia (MoENRP) together with the National Statistics Office of Georgia (NSO) collects and publishes available data concerning natural capital in Georgia. The MoENRP collects data concerning the physical environment on an annual basis. This information is primarily obtained from consumers of natural capital. Consumers report their use of natural resources based on forms that have been approved by the NSO. The information obtained from consumers is complemented by automated and manual monitoring stations, and supplementary monitoring systems. The obtained information on the state of the environment is sent to the NSO where additional information concerning the trade of natural capital is incorporated.
The final, annual publication is available online or by request. MoENRP directly publishes additional information and reports, including natural resource maps, the State of Environment Report (updated every three years), the National Environmental Action Plan (updated every five years), the Environmental Performance Review (the third EPR is currently under development), and the National Biodiversity Strategic Action Plan (the second NBSAP is also under development).148 All natural capital information, except that where security is a concern, is available to both the public and private sectors by means of regular publications or online. In 2014, the MoENRP and NSO signed a Memorandum of
147 TEEB Scoping Study for Georgia: Main Findings and Way Forward, (2013). Available at: <http://www.teebweb.org/wp-content/uploads/2014/01/TEEBScoping-study-for-Georgia-main-findings7wayforward-2013.pdf>. 148 National Statistics Office of Georgia. Environment. Available at: <http://www.geostat.ge/index.php?action=page&p_id=431&lang=eng>.
Page 75 of 144
Cooperation to improve the exchange and availability of environmental statistical information.
Natural capital information is sometimes used as part of the decision-making process in Georgia. The country has increased efforts on the study of and threats to natural capital. The government is improving the supervision of the use of natural capital, building on improvements in legislation and the enhanced institutional capacity of the MoENRP. The latter is improving the availability of natural capital information in order to support decision-making. Other ministries use natural capital data to highlight economic opportunities concerning Georgia’s natural capital. Data are frequently used when developing business opportunities relating to tourism, use of hydro resources, and mineral resources. These data are less frequently used in justifying sustainable development, or in assessing the wealth of the natural capital of Georgia.
The NSO of Georgia and Statistics Sweden, with the support of Swedish International Development Cooperation Agency, have initiated a project to promote the availability of environmental statistics. The project intends to assess the current availability of environmental statistics and identify areas to improve cooperation and sharing of the statistics in Georgia. The Shared Environmental Information System initiative, led by the European Environmental Agency, provides assistance in order to develop environmental accounting. The main purpose of this initiative is to improve the collection, exchange and use of environmental data and information across Europe. The MoENRP plans to develop online databases and reporting systems for several sectors in order to simplify the reporting and data mining process.
Georgia has also enhanced its development strategy, the Social-economic Development Strategy of Georgia 2020 to include a national commitment to promoting the rational use of natural resources and greening the economy by supporting the implementation of the best available technologies and development practices. The strategy stresses the importance of consideration and minimization of negative environmental impacts when pursuing extensive infrastructural development. It also highlights the need to address climate change and the sustainable use of forest resources. The Second National Biodiversity Strategic Action Plan, to be adopted soon, emphasizes the sustainable use of biodiversity, ecosystem services, and the protection and conservation of nature.
4.9.2. Focus of natural capital accounts
Information regarding the status of Georgia’s natural capital exists for forest, water, air, land, mineral resources, and biodiversity along with supplementary information for additional natural resources. Information is presented in aggregated, physical units. Research indicates that pollution, unsustainable development practices, habitat degradation / destruction, and climate all threaten ecosystems, though the exact status of Georgia’s natural capital is unknown.
Page 76 of 144
A comprehensive economic valuation of Georgia’s natural capital is not currently available. The TEEB study identified several priority areas: forestry, energy, tourism, mining and agriculture.147 The study also assessed relationships between production and ecosystem services according to Business as Usual (BAU) and Sustainable Ecosystem Management (SEM) scenarios. The findings are predominantly qualitative. The scoping study shows the critical importance of healthy ecosystems to the functioning of four of Georgia’s important economic sectors. The analyses also highlight that if today’s production practices are not changed, the sustainability of these sectors is questionable. While the scoping study presents analyses of four sectors, the scope of the full TEEB study has been extended to cover five sectors to account for stakeholder inputs.147 A full TEEB study is planned as a next step to value Georgia’s natural capital. This project is expected to require international support in order to be completed.
Several protected areas in Georgia have undergone economic evaluation in 2010. The UNDP/GEF project, ‘Catalyzing the Financial Sustainability of Georgian Protected Areas System: Economic Valuation of the Tusheti National Park and the Network of Georgian Protected Areas’, was conducted. In 2011, under the WWF Caucasus Program, ‘Valuation of the Contribution of Borjomi-Kharagauli and Mtirala National Parks Ecosystem Services to Economic Growth and Human Well-being in the Republic of Georgia’ was undertaken. In 2012, with UNDP/GEF financial support the ‘Economic Valuation of the Contribution of Ecosystems in Protected Areas to Economic Growth and Human Well-Being in Georgia’ report was completed.
Further economic evaluation of Georgia’s natural capital is also planned. In 2014–2015, the World Bank, in cooperation with the MoENRP, plans to conduct a Country Environmental Analysis. This aims to provide a useful mechanism to rank the relative social costs of various forms of degradation, offer policymakers an instrument to integrate environmental considerations into economic decision-making and express damage costs as a percentage of GDP for comparison with other economic indicators. The analysis looks to provide the environment ministry with a tool for discussing the importance of environmental protection in economic terms, with the Ministry of Finance and Economic Development, to prioritize and manage the allocation of resources.
Building on the success of the initial scoping study, UNEP, the MoENRP of Georgia and the WWF are conducting negotiations with the EU to further develop the TEEB process in the framework of the Eastern Partnership (EaP) including Armenia, Azerbaijan, Belarus, Georgia, Moldova and Ukraine. The project will focus on identifying green economy priorities and the difficulty of applying green priorities in specific countries, as well as outlining a roadmap to harmonize the Green Process in the EaP countries with EU development standards and requirements. In 2014, by means of the USAID funded project Integrated Management of Natural Resources in Watersheds of Georgia Program, a valuation of ecosystems goods and services in the pilot watershed of the Rioni basins will
Page 77 of 144
be completed. In 2014, with the support of the regional project Support Development of Biodiversity Conservation Policies and Practices in Mountain Regions of the South Caucasus, a valuation of ecosystems services and biodiversity in the Oni Municipality will be undertaken. The project is financed by the Government of Norway and implemented by the Regional Environmental Centre for the Caucasus.
4.9.3. Challenges and success stories
There are still challenges with natural capital accounting in Georgia. These include: the need to raise awareness amongst executives and legislators in order to effect the more frequent use of economic valuation of natural capital in decision-making processes; gaps in legislation; as well as inadequate enforcement tools to ensure consumers report use of natural resources; and weak reporting and monitoring systems. This results in an incomplete picture of the state and value of natural capital. Additional finances are necessary to further develop and improve the system.
Statistical reporting as well as monitoring systems and processes need further development in order to capture the larger picture of national natural capital. There are few statistical indicators for water, forest, air, land, biodiversity and supplementary sectors. Resource use is studied in terms of total quantity but not assessed in terms of economic values. Supplementary studies, while useful, are often narrowly focused and do not fully cover national natural capital.
The monetization of natural capital is another major challenge in Georgia. There is currently no single, widely accepted methodology for natural capital accounting. The country’s GDP, by definition, encapsulates the added value created by the use of natural capital. However, it is difficult to assess how much natural capital contributes to the GDP due to a lack of data related to fees paid for the use of natural resources.
Georgia’s economy relies heavily on its natural capital. Ecosystem services are essential for hydropower, tourism, agriculture, industry, mining, fuel wood, NTFPs and watershed services: all are vital for the sustainable development of the country. Georgia has a diverse landscape with a wide variety of biomes and habitat types. The Kolkheti forest refugium, along with the limestone and high mountain vegetation complexes, are all ecologically and biogeographically distinct and noteworthy in terms of species composition. Regarding biodiversity, a component of natural capital, Georgia is one of 34 globally recognized ‘biodiversity hotspots’ identified by Conservation International. It is also a part of the Caucasus Eco-Region, which is registered as one of 200 Eco-regions of Global Importance as ranked by WWF.
The unsustainable use of natural capital as a result of economic growth is considered the greatest threat to the status and economic value of Georgia’s natural capital. According to
Page 78 of 144
World Bank estimations, GDP growth in Georgia was approximately 2.5% in 2013, but is expected to increase to a greater than 6% annual growth rate in 2014–2017.149 This puts pressure on natural resources, as Georgia’s economic growth is dependent upon sectors that are intensive consumers of natural capital. These sectors include hydroelectric power generation, irrigation for agriculture/industry, mineral extraction (including gold, ferrous metals, and mineral water), and infrastructure construction resulting in the need for building materials and land development.
In spite of challenges, there have been successes as well. In 2013, 16 nature monuments in eight different locations in Georgia received Protected Area status.150 This demonstrates Georgia’s commitment to protection of its natural capital as well as to provide various opportunities for its sustainable use by promoting tourism and the recreation industry.
149 The World Bank. Global Economic Prospects. Available at: <http://www.worldbank.org/en/publication/global-economic-prospects/data?region=ECA>. 150 The relevant areas are: Goderdzi Fossil Forest Nature Monument (Adigeni Municipality); Dashbashi Canyon Nature Monument (Tsalka Municipality); Samshvilde Canyon Nature Monument (Tetritskaro Municipality); Mukhuri Waterfall Nature Monument (Tkibuli Municipality); Bodorna Rock Pillars Nature Monument (Dusheti Municipality); Jvari Pass Travertine Nature Monument (Kazbegi Municipality); Keterisi Mineral Vokluz Nature Monument (Kazbegi Municipality); The complex of Nature Monuments of Samegrelo – includes 8 nature monuments (Chkorotsku and Martvili Municipalities).
Page 79 of 144
4.10. Germany
Key achievements: Comprehensive environmental legislation in place at national and EU level; TEEB study underway.
Focus of natural capital accounts: Air; water; land; endangered habitat.151
4.10.1. Legal and policy frameworks for natural capital accounting
Germany supports several environmental initiatives domestically and internationally, demonstrating the country’s commitment to the evaluation of natural capital and acknowledgement that natural capital is an integral part of sustainable economic growth. It is a party to the CBD and has developed a 5th CBD National Report and National Biodiversity Strategy and Action Plan. Germany is also a supporter of the Rio+20 Natural Capital Accounting Communiqué.
In 2007, at a summit of environmental ministers from G8+5 countries in Potsdam, Germany initiated the TEEB studies project together with the European Commission. The main aim was to understand and demonstrate the global economic benefit of biological diversity and the costs of biodiversity loss. The Potsdam Initiative on Biological Diversity was introduced targeting various stakeholders from civil society, business, policy and the scientific community. While independent scientific institutions deliver inputs for policy-makers on how to design and implement natural capital accounting, regional planning and legislation are important tools for regulators and policy makers. Economic measures, i.e. certification and the evaluation of monitoring of protected areas are also used.
As a member of the European Union (EU), Germany is also obliged to fulfil the sustainability related criteria, practices and processes set at EU level. These include the mapping and assessment of the ecosystem and its services by 2014; the assessment of the economic value of such services and support for integrating these values into accounting and reporting systems at the EU and national level by 2020. Germany needs to implement ‘The EU 2020 Biodiversity Strategy’ and meet six targets. The 2020 headline targets aim at halting the loss of biodiversity and the degradation of ecosystem services in the EU by 2020, and supporting the global ambition to stop biodiversity loss. The six targets are as follows:
1. Fully implement the Birds152 and Habitats153 Directives, which regulate Europe’s nature conservation in order to protect over 1,000 animals and plants and over 200 habitat types, such as forests, meadows, and wetlands.
151 German Red Data Book on Endangered Habitats, short version, (July 2009) 152 Council Directive 2009/147/EC on the Conservation of Wild Birds.
Page 80 of 144
2. Maintain and restore ecosystems and their services.
3. Increase the contribution of agriculture and forestry to biodiversity.
4. Ensure the sustainable use of fisheries resources.
5. Combat invasive alien species.
6. Step-up action to tackle the global biodiversity crisis.
Germany contributes through development cooperation to projects on the maintenance of ecosystem functions and services globally. The Federal Ministry for Economic Cooperation and Development (BMZ) develops the guidelines and concepts of German development policy. It determines the long-term strategies for cooperation with the various stakeholders and defines the rules for implementation. The ‘Deutsche Gesellschaft für Internationale Zusammenarbeit’ (GIZ), the Reconstruction Credit Institute (KfW) and its subsidiary DEG are government-owned agencies implementing development policies of the Federal Government. GIZ is an international development agency owned by the German Federal Government, operating in many fields across more than 130 countries. Sustainable development is among the guiding principles of GIZ. The government-owned development bank KfW supports developing countries by providing financing to governments, banks and supporting SMEs. DEG – the German Investment and Development Company promotes private entrepreneurship in developing and transition countries. Germany continues to support sustainable development through development cooperation by increasing the share of aid in GNI from 0.51% (2010) to 0.7% by 2015154.
In 2012, Germany officially launched the national project in the context of the TEEB process, with which the economic value of nature in Germany is to be assessed. The aim of the project is to provide a scientifically sound description of the various services provided by ecosystems (such as wetlands, marshes, grasslands, forests or urban green spaces) for climate protection, flood protection, clean air, water and recreation. Scientists will also deliver recommendations on how these benefits or ‘functions’ of nature can also be maintained in the future.
The Federal Statistics Office and the statistical offices of the ‘Länder’ conduct Environmental-Economic Accounting (EEA) annually. EEA is not a stand-alone account yet but an extended version of the conventional national account system. The Federal Statistics Office plays an important role in assessing natural capital and illustrating the interaction between economy and nature.
Based on regular national reporting on sustainable development in Germany (most recently with the Sustainable Development Indicator Report in Germany in 2012),
153 Council Directive 1992/43/EEC on the Conservation of Natural Habitats and of Wild Fauna and Flora. 154 National Sustainable Development Strategy Progress Report 2012, 71.
Page 81 of 144
sustainability indicators set out in the National Sustainable Development Strategy of the Federal Government are presented and updated.155 In 2002, the Federal Government released a national strategy named ‘Perspectives for Germany – A National Strategy for Sustainable Development’.156 This was updated two years ago with the progress report. The main part of the initial report was ‘21 Indicators for the 21st Century’, with which the government defined issue and problem areas. The indicators relate to quantified targets in order to make the successes or failures of sustainability policies measurable. In this context, the Federal Statistical Office releases progress reports on sustainable development indicators every two years.
This policy is in line with the framework of the European Statistical System (ESS). Priorities for the development of statistics in the EU were set and it was recommended that sustainability indictors should be developed based on national accounts. In 2011, the European Parliament agreed on a regulation157 to implement EEA in all member states. In order to achieve harmonization across the European Union regarding national reporting, three modules for data sets were suggested: air emissions, material flows, and environmental taxation.
While the Federal Statistical Office is the main body responsible for EEA, the Federal Environment Ministry (BMU) is in charge of developing national environmental policies. The German Federal Agency for Nature Conservation (BfN) is the scientific authority of the Federal Government on national and international nature conservation, supporting BMU with technical and scientific advice. BMU and BfN launched the ‘Unternehmen Biologische Vielfalt 2020’ initiative in March 2014, which is a dialogue and action platform on the conservation of nature for policy, business and civil society actors. Further topics are the integration of biological diversity into business processes, challenges regarding property management and the commitment to nature conservation projects outside firm operations. The platform encourages businesses to take initiative in nature conservation and make this topic an integral part of every-day business operations. Nature conservation can be beneficial for businesses: benefits include cost savings, a better reputation, or the maintenance of environmental functions158 the nature performs and on which all economic activity depends.
4.10.2. Focus of natural capital accounts
The Federal Statistics Office examines the effects of economic activities on the environment based on EEA and also the role of the environment for the economy. Since
155 Statistisches Bundesamt, Umwelt und Wirtschaft, (2013), 14. 156The National Strategy for Sustainable Development makes sustainable development the core principle of policy-making in Germany. It builds on economic development, social development and environmental protection, complemented by four guidelines, i.e. equity, quality of life, social cohesion, and international responsibility. 157 Regulation (EU) No 691/2011 of the European Parliament and of the Council European environmental economic accounts, (July 2011). 158 Ekins, Paul (2000): Environmental Sustainability, 79.
Page 82 of 144
not only labour and capital play a crucial role for the economy but also the environment, the ‘nature’ component was added to the conventional national accounts. The environment provides resources for economic activity; absorbs waste (sink function); and provides human welfare and support for quality of life. EEA takes three aspects into consideration: (1) environmental impact of economic activity, (2) the current state of the environment, and (3) environmental protection measures to maintain or improve the state of the environment. EEA is organized as follows:
1. Environmental burden: material and energy flow analysis of water use; resource and material use; energy consumption; air emissions; waste water; waste statistics; and total waste count
2. Land use
3. Environmental protection measures and taxation
4. Sectors: private households; transport; agriculture; forestry.
The national EEA practice in Germany already fulfils the obligations outlined in the EU regulation from 2011 and goes beyond to some extent. It takes a global perspective in material flow analysis into consideration. Germany aims at extending the global perspective when conducting national EEA by considering the global dimension of resource use and environmental pressures as well as sharing data with international partners.159
TEEB DE’s mandate is to implement the global TEEB study at the national level. Germany is still in the process of producing scientific input for policy and decision-makers for the project duration between 2012 and 2015. It is coordinated by the Helmholtz Centre for Environmental Research and funded by the Federal Ministry of Environment and the Federal Agency for Nature Conservation. By 2015, four scientific reports are expected:
1. Natural Capital and Climate Policies: Synergies and Conflicts – The first thematic report deals with climate change, climate policy, the use of ecosystem services and nature conservation. Given the fact that climate change is considered to be one of the major threats to ecosystem health and the maintenance of its functions, this report addresses, among others, these questions: What are the challenges for biodiversity and ecosystems regarding climate change and the German ‘Energiewende’ (energy transition)? To what extent can biodiversity preserving land use help mitigate climate change? It is currently predicted that climate change without global preventive action would cost Germany up to 800 billion euros by 2050.160
159 Statistisches Bundesamt, Umwelt und Wirtschaft (2013) 14. 160 Kemfert, Claudia: Klimawandel kostet die deutsche Volkswirtschaft Milliarden, DIW Berlin Wochenbericht (11/2007).
Page 83 of 144
2. Ecosystem Services and Rural Development – The second thematic report deals with the multi-functionality of the nature of rural areas with the focus on an economic perspective. The report will summarize the current state of research, and demonstrate the identification, evaluation and integration of the values of ecosystem services in rural areas.
3. Ecosystem Services in the City: Protect Health and Enhance Quality of Life – The third thematic report relates to a variety of urban ecosystem services and demonstrates their qualitative and quantitative economic importance. Proposals will be developed on how to include urban ecosystem services in private and public decision-making processes.
4. Natural Capital Germany: Take New Course of Action: A Synthesis – The last report addresses more general questions, such as how the values of biodiversity and ecosystem services can be integrated into decision-making. What added value do an economic perspective and the concept of ecosystem services create for dealing with competing goals? What successful practices exist and how can they be duplicated? What conclusions can be drawn for existing instruments and the further development of instruments?
4.10.3. Challenges and Success Stories
In the context of relevant accounts and critical issues, Germany faces challenges in three areas: water, endangered habitats and land. There is permanent nutrient input from industrial production and burning of fossil fuels, while transport and agriculture cause a high burden for soils, groundwater, surface water as well as oceans through nitrogen and phosphate output. Certain industrial and agricultural activities cause serious environmental pressures for coastal regions and inner coastal waters. Almost three quarters of habitats in Germany are classified as endangered and a third of vertebrate species are considered extinct, lost or currently endangered.
The conversion of semi-natural and agricultural land into areas for settlement and transport is a challenge for Germany. The consequences of such land conversion are manifold: soil sealing, soil loss, fragmentation of landscapes, negative effects on water flows and microclimate. The costs of long-term maintenance of public infrastructure for these areas are often under-estimated by decision-makers.
Increase in land use for settlement and transport purposes
Monitoring and control of land use for settlement and transport purposes plays an important role in the country’s National Strategy for Sustainable Development adopted in 2002 by the Federal Government. The national strategy aims at reducing the average daily increase of land for settlement and transport from 81 ha/day to 30 ha/day by 2020. If the current trend continues, Germany will not achieve the reduction target by 2020.
Page 84 of 144
In 2011, 52.3% of German land was used for agricultural purposes, followed by 30.2% of forest area. 13.4% were needed for settlement and transport purposes. In terms of long-term development, the largest increase can be observed in land used for settlement and transport, 14.1% between 1996 and 2011. During the same period, population growth stagnated. The Federal Statistical Office explains this with the increase in GDP per capita and in income leading to an increasing individual demand for land.161
Despite the challenges, the Inclusive Wealth Report 2012 highlights that change has been slow for natural capital in Germany.162 There are a few examples illustrating successful social and economic valuations of natural capital. The efficient use of water and protection of local habitat are examples.
Box 3 – Efficient water use: Germany
According to the report of the Federal Statistical Office titled The Use of the Environment and the Economy published in 2013, approximately 38.1 billion m3 of water from nature was used for economic purposes in the year 2010. 64.6% of the total amount of water removed from nature was used as cooling water. Between 2001 and 2010, water extraction supply went down by 13.2% (5.8 billion m3).163 The decrease in water abstraction from nature was accompanied by an increase in economic performance in 2010 compared to 2000, measured as the development of the price-adjusted gross domestic product, which increased by 10.2%. This means that water has been used more efficiently. This positive trend was supported in particular by the development of water and wastewater prices, combined with new technologies for household appliances and manufacturing.
Different data sources were used for the calculation of water extraction from nature, mainly from the official environmental statistics (survey of public water supply and public sewage disposal and collection of non-public water supply and the non-public sewage disposal). In order to fill data gaps, further data from the official statistics were used including agricultural statistics or surveys of the manufacturing industry, as well as other sources, such as publications of scientific institutes, associations and organizations.164
161 Statistisches Bundesamt, Umwelt und Wirtschaft, (2013) 78–80. 162 Inclusive Wealth Report (2012) 13. 163Statistisches Bundesamt, Umwelt und Wirtschaft (2013) 34. 164 Statistisches Bundesamt, Umwelt und Wirtschaft (2013) 33.
Page 85 of 144
Box 4 – Protection of local habitat in the Lahn Valley: Germany
The Lahn Valley is a hot spot for nature-loving tourists. Hikers and cyclists choose Lahn Valley for its long trails and others are intrigued by the canoeing possibilities. In 2011, 2.5 million overnight stays were registered, bringing in a turnover of 1.16 billion euros and employing approximately 10,000 people. The river Lahn and the pastureland provide living space for many endangered animal and plant species. In order to preserve its beauty and uniqueness, parts of the valley are under protection as the area is threatened by fast-growing tourism.
At the time of adoption of a landscape conservation regulation in 1993, the Lahn Valley Tourism Association suggested a plan for the coexistence of regional development, tourism and nature conservation. Since then, canoeing has been limited to 40 km of a possible distance of about 160 km. A factor of success was to integrate the conservation organizations and authorities alike in the initial phase. With their expertise, the most sensitive areas have been identified and classified as 'no-go' areas.
The Lahn Valley Tourism Association put up entry and exit signs for canoeists and resting places as well as information boards with rules of behavior in the environment. The head of the Association notes that many tourists themselves call for these environmental standards. The infrastructure concepts for walking, cycling and canoeing tourists as well as cities and cultural tourism are continuously developing in the Lahn valley. Meanwhile, the number of canoeists remained at about 140,000 per year.
Page 86 of 144
4.11. Ghana
Key achievements: Currently training and building local capacity for establishing natural capital accounts.
Focus of natural capital accounts: Land; crude oil; minerals; water; energy; soil; timber; aquatic resources.
4.11.1. Legal and policy frameworks for natural capital accounting
Ghana is a supporter of Rio+20 Communiqué on Natural Capital Accounting and a party to the CBD. It has submitted its 4th CBD National Report and developed a National Biodiversity Strategy and Action Plan. Ghana is collaborating with the United Nations Statistics Division and the World Bank under the WAVES Partnership, working towards building local capacity to carry out a natural capital stock survey. The capacity development aims to link natural capital accounting with existing programs on statistical capacity building, and with existing policy loans for green growth development.165
The capacity being developed is in line with the UN–SEEA framework, which will be linked to other frameworks already in use such as the SNA and the International Standard Industrial Classification, revision 4. The collection, management and processing of information with regards to natural capital is handled by the Ghana Statistical Service.
The use of natural capital information in the decision-making process of Ghana is currently limited to forestry and wildlife policy, mining and land policy. These policies cover the laws, institutions, systems, organizations and individuals, and how they interact to enable conservation and sustainable development of natural resources. These three policies are overseen by the Ministry of Lands and Natural Resources. The ministry aims to ensure the efficient management of the nation’s mineral resources and promote their judicious exploration, exploitation and processing with minimal harm to the environment, and for optimal benefit to society.
4.11.2. Focus of natural capital accounts
There are currently no specific natural capital accounts in Ghana’s statistical system since the country is still in the process of developing local capacity. Nevertheless, the key natural capital resources are land, crude oil, mineral, water, energy, soil, timber and aquatic resources. The accounting system being developed will help track the use and management of their mineral and energy resources.166 Although not all natural capital stock is currently captured in the economic system, some material flows between economic sectors are captured.
165 WAVES Annual Report 2013. 166 WAVES Annual Report 2013.
Page 87 of 144
Information on production, and statistics concerning water, energy, crude oil, land, forestry, minerals, timber and fishing are shared among the government departments, commercial and public sectors. Economic valuation of the natural stock has not yet been determined in Ghana because of limited information. However, in the past five years, there have been discoveries of more crude oil and natural gas reserves, and more exploration is underway. Estimated oil reserves exceed 3 billion barrels.
With some work already on-going regarding climate change related themes, there is general eagerness to learn how natural capital accounting can be implemented and incorporated into the nation’s economic system. This eagerness has been enhanced by the general concern that natural capital is being unsustainably used.
4.11.3. Challenges and success stories
The main challenges in Ghana concerning natural capital accounting have been the absence of reliable information, lack of legislation and limited capacity and skills to carry out inventory. Absent reliable information, there is limited sharing of natural capital information. These challenges notwithstanding, Ghana has to ensure that protected areas such as the Oworbi Water Resources are well managed and guarded to ensure perpetual flow of water.
Page 88 of 144
4.12. Guatemala
Key achievements: National implementation of natural capital accounting.
Focus of natural capital accounts: Forestry; water resources; subsoil resources; energy and emissions; land and ecosystems; fisheries and aquaculture; waste; environmental expenditure and transactions.
4.12.1. Legal and policy frameworks for natural capital accounting
Guatemala is a party to the CBD and has submitted its 4th CBD National Report and National Biodiversity Strategy and Action Plan. It has also developed natural capital accounts, with data starting from 2001. The Guatemalan government joined the WAVES Partnership and held their first steering committee meeting in October 2013. The primary objectives of this work are to expand upon the country’s existing natural capital accounts and to increase the use of these accounts in policy development.
The use of natural capital accounting in Guatemala started in 2006. These accounts were initiated by the Institute of Agriculture, Natural Resources and Environment at the Rafael Landívar University. The Institute initiated a public-private partnership that included participation from several government ministries including the Ministry of the Environment and Natural Resources (MARN), the Presidency’s Ministry for Planning and Programming (SEGEPLAN), the Presidency’s Ministry for Women, the National Institute of Statistics and the Guatemalan Bank. The partnership is funded by the Dutch government and follows the UN–SEEA. This accounting method is used to account for material natural resources including minerals, timber and fisheries in Guatemala’s economic accounts.
The natural capital accounts in Guatemala are used in the policy and legislative processes. In particular, they are utilized for policy analysis and prioritization of national strategies, which in turn are used as input for the attribution of the country’s general budget. The inclusion of these accounts in the budget results in formal strategies and governmental commitments.
Indicators of the state of the environment, as well as other sector-specific indicators are considered in the framework of the ‘Covenants Government’, under the Ministry of Planning and Programming of the Presidency, in coordination with the Ministry of Finance in Guatemala. This interagency process is used in the analysis and prioritization of environmental outcomes, which are linked to the strategic policy guidelines. For the fiscal year 2013, the results of this analysis were included in the General budget of revenues and expenditures. The accounts are also used as a basis for various laws and programs including the Law on Vulnerability Reduction, Adaptation to Climate Change
Page 89 of 144
and Mitigation of Greenhouse Gases Emissions,167 and the national policy for conservation, protection and improvement of the environment and natural resources.168
SEGEPLAN is in charge of realizing the Millennium Development Goals, in particular guaranteeing environmental sustainability (Goal 7). Furthermore, under goal 7B the ministry works to reverse the loss of natural resources. In order to measure progress in meeting this goal, SEGEPLAN has created indicators including the proportion of the total of hydric resources consumed and the amount of forest in the country. These indicators are measured and published on an annual basis.169
4.12.2. Focus of natural capital accounts
The flagship project of the partnership started at Rafael Landívar University is known as ‘Cuente con ambiente’ (Count on/count with the environment).170 Its objective is to produce integrated economic-environmental accounts. These natural capital accounts are generated by the University based on information provided by national and regional government entities, and academic sources. The accounts are available annually for the years 2001–2006 and a report for subsequent years is currently being prepared.
The accounts incorporate eight sector accounts: forestry; water resources; subsoil resources; energy and emissions; land and ecosystems; fisheries and aquaculture; waste; environmental expenditure and transactions. These accounts are generated separately and then compiled into four categories:
x Stocks – natural goods such as land, water, ecosystems
x Flows – movements between the natural and the economic sphere
x Expenditures and transactions – investments in protection and restoration of the environment
x Added accounts.
Guatemala has a total estimated natural capital value of USD 142 billion, which is equivalent to USD 16,691 per capita. Forests are estimated to have contributed 2.5% of the Guatemala’s GDP. However, this value is currently 1% in Guatemala’s national
167 Legal frameworks for reducing climate change vulnerability via compulsory adaptation and greenhouse gas mitigation 168 Política Nacional de Conservación, Protección y Mejoramiento del Ambiente y los Recursos Naturales 169 SEGEPLAN. ‘Tercer informe de avances en el cumplimiento de los Objetivos de desarrollo del milenio. Objetivo 7: Garantizar la sostenibilidad del medio ambiente’ (Guatemala: Serviprensa, 2010) Accessible online on: <http://www.segeplan.gob.gt/downloads/ODM/III%20informe/ODM7.pdf>. 170 BANGUAT. ‘Sistema de Contabilidad Ambiental y Económica de Guatemala’. Accessible online on: http://www.banguat.gob.gt/inveco/notas/articulos/envolver.asp?karchivo=8701&kdisc=si; BANGUAT and IARNA. ‘Compendio de cuadros estadísticos del Sistema de Contabilidad Ambiental y Económica Integrada de Guatemala (SCAEI). Periodo 2001-2006’ 2009. Accessible online on: <http://biblio3.url.edu.gt/IARNA/BANGUAT/Pub_comp_coed_24.pdf>; IARNA. Elementos esenciales para la compilación del Sistema de Contabilidad Ambiental y Económica Integrada de Guatemala. (Guatemala: Universidad Rafael Landívar / Instituto de Agricultura, Recursos Naturales y Ambiente, 2010) Documento 25, Serie técnica No. 23. Accessible online on: <http://biblio3.url.edu.gt/IARNA/SERIETECNINCA/25.pdf>.
Page 90 of 144
accounts. Annual taxes and fees resulting from the use of the environment in the country exceed USD 390 million and expenditures are approximately USD 182 million. Depreciation of natural capital in Guatemala is estimated at USD 455 million, with the forest stock declining at a rate exceeding 1.5%. The vast majority (96%) of timber extractions in the country are uncontrolled, which has prompted development of a new national forest management strategy in the country.
Guatemala’s ‘added accounts’ category is used to calculate an environmentally adjusted GDP (PIBA), where degradation of the environment and depletion of its resources are deducted from the national GDP. In 2006, the PIBA amounted to 94% of the national GDP. This figure is fairly static in the years presented in the country’s natural capital accounts, which include the years 2001–2006.
MARN produces the Guatemalan Annual Environmental Report,171 which discusses the state of the environment based on the ‘Pressure- State- Impact- Response’ (PSIR) methodology developed by the UNEP.172 The report presents the social and economic drivers of environmental change in Guatemala, as well as information on various natural resources systems, in particular hydric, atmospheric, biotic, lytic and edaphic.
There are also several regional and sectorial attempts to value ecosystem services in Guatemala. The National Council of Protected Areas produced an assessment of the economic value of environmental services provided by protected areas.173 This assessment uses its own methodology, which is explained in the report, in order to calculate the actual and potential value of ecosystem services. These services include: timber, agricultural, tourism, carbon absorption, regulation of water flows and soil protection (including erosion and nutrients cycling). The conclusion of the study is that the ecosystem services produced by protected areas represent 2.5% of the national GDP.
4.12.3. Challenges and success stories
A primary challenge faced by Guatemala in the construction and use of their natural capital accounts is the lack of heterogeneity, harmonization and standardization. This is largely due to the variety of actors and methodologies used.
In terms of the state of the environment, deforestation and unplanned use of water and land are significant challenges. Additional stress on the country’s biomass resources comes from the burning of wood for fuel, which represents a significant fraction of the Guatemalan energy supply and leads to increased carbon emissions. As a result, the
171 MARN. ‘Presentación del informe ambiental del estado de Guatemala 2011’, (2012). Accessible online on: <http://marn.gob.gt/documentos/informe_ambiental_del_estado_de_guatemala_2011.pdf>. 172 UNEP. ‘Metodología para la elaboración de los informes GEO ciudades. Manual de Aplicación. Versión 1, (2003). Accessible online on: <http://www.pnuma.org/geociudades/PDFs/Manual%20GEO%20Ciudades.pdf>. 173 Consejo Nacional de Áreas Protegidas. ‘Sistema Guatemalteco de Áreas Protegidas: una Aproximación al Valor Económico de los Bienes y Servicios Ambientales’, (1999). Accessible online on: <http://www.chmguatemala.gob.gt/Members/esolorzano/mis-documentos-2011/documentos/Estudio%20sobre%20Valoracion%20Economica%20del%20SIGAP_vf.pdf>.
Page 91 of 144
country is engaged in opening a dialogue focused on: greenhouse gas emission controls in climate change policies; strategies for increasing wood use efficiently; environmental protection related to maintaining forest productivity; and the other environmental and community services that forests provide.
In 2006, the United States and Costa Rica participated in a debt-for-nature swap, as outlined in the Tropical Forest Conservation Act of 1988. This Act allows eligible countries to use their debt payments to finance domestic tropical forest conservation projects. In this 2006 agreement, the United States government forgave USD 24 million in debt owed by Guatemala. American Electric Power, the Nature Conservancy’s Maine Program, and Conservation International also contributed additional funding for these projects. Together, these funds were placed in a conservation trust fund and redirected to forest conservation projects in Guatemala to be completed over a 15-year period. These funds are now being used for forest conservation projects in three regions:
x Maya biosphere reserve – including both Sierra del Lacandon National Park and Tikal National Park. This reserve represents 10% of Guatemala’s total land area
x Motagua/Polochic System – including the Sierra de Las Minas Biosphere Reserve
x Sierra Madre Volcanic Chain – including Lake Atitlan.
These areas are appreciated in Guatemala because of their ecological, cultural and commercial value. The natural capital found in these areas is primarily at risk of decline because of development, unsustainable levels of natural resource extraction, ranching and agricultural activities, as well as pollution.
Page 92 of 144
4.13. India
Key achievements: Green National Accounts framework released in April 2013. Preparations to measure ‘green’ GDP by 2015. Pilot studies being carried out at a state-level. State of Uttarakhand announced plans to establish green GDP in 2013. Focus of natural capital accounts: Land and soil; forest; agriculture and pastures; minerals.
4.13.1. Legal and policy frameworks for natural capital accounting
India has participated in a variety of global initiatives to assess natural capital and was one of the countries to commit to publishing natural capital accounts in 2011.174 India is party to the CBD and has produced its 4th CBD National Report and National Biodiversity Strategy and Action Plan. It has also engaged with the TEEB Initiative to support further work concerning natural capital accounting. The Ministry of Environment and Forests (MoEF) along with TEEB India, conducted an initial scoping assessment. All these projects have helped initiate the process of valuing natural capital and ecosystem services in India. Current efforts aim to bring policy relevance to further investigations for natural capital accounting in India, and increase its technical scope from economic valuation to a broader recognition of natural capital.175
Although India is not one of the core World Bank WAVES Partnership countries, WAVES is providing technical support for work on natural capital accounting in the Indian state of Himachal Pradesh.176
On a national level, a number of institutions work in bringing together information on natural capital and include:
x Ministry of Statistics and Programme Implementation (MoSPI) and its Central Statistical Organisation (CSO)
x Ministry of Environment & Forest (MoEF)
x Planning Commission
x 13th Finance Commission (2010–2015)
x States/Regional Institutions
The CSO of India developed a Framework for the Development of Environmental Statistics in the early 1990s. The first issue of a compendium of environmental statistics
174 Jowit, J (2010), India Set to Publish World’s First ‘Natural Wealth’ Accounts, Development and Society, The Observer, Available at: <http://ourworld.unu.edu/en/india-publishes-natural-wealth-accounts-first>. 175 The Economics of Ecosystems and Biodiversity (TEEB) (2014), Country Profile – India, Available at: <http://www.teebweb.org/countryprofile/india/>. 176 WAVES (2012) Moving Beyond GDP: Factoring Natural Capital into Economic Decision Making. Wealth Accounting and the Valuation of Ecosystem Services (WAVES), World Bank.
Page 93 of 144
was released in 1997. Since then the CSO has regularly been publishing the compendium and organises national workshops, seminars and training workshops for state/union territories governments and data compilers. A number of important recommendations of UN–SNA 1993 have been implemented by India. While introducing the new series of National Accounts Statistics (NAS) in January 2010, the CSO attempted to implement some of the recommendations of the 2008 UN–SNA.
The CSO in the MoSPI also estimates national accounts and disseminates information on several macro-economic aggregates such as GDP, final consumption expenditure, savings, capital formation, capital stock, and consumption of fixed capital every quarter. The MoSPI commissioned a pilot project in 1999–2000 through The Energy and Resources Institute that was undertaken in the state of Goa. Additionally, in order to develop uniform methodologies for sector-specific resource accounting, the MoSPI commissioned a set of studies on land, forests, air, water, and sub-soil resources in eight Indian states between 2000 and 2006.177 All studies have used UN–SEEA prescribed methods for valuing changes in the environment.
In parallel, National Environmental Engineering Research Institute in Nagpur, conducted a study entitled ‘Post Clearance Environmental Impacts and Cost Benefit Analysis of Power Generation in India’, through the CSO. A synthesis report based on those studies was developed under the technical guidance of a Technical Advisory Committee. The report recommended the preparation of a National Accounting Matrix that would include environmental accounts.178 As a result, an expert group was constituted in August, 2011 to examine and recommend a suitable framework for green national accounts, identify data gaps and prepare a road map to implement the framework with the approval of Prime Minister Dr. Manmohan Singh.
The Union Government of India, the country’s federal government, has since released a framework for adopting a broader measure of economic progress, taking into account the value of natural resources, human capital and infrastructure. The report, released in April, 2013 was titled: Green National Accounts in India – A Framework Report of the Expert Group.
India’s engagement on natural capital also receives high-level political support through a number of major initiatives and planning policies, which have contributed significantly to the development of green national accounts. Implementation of such legislation has taken place through the Planning Commission and various internal ministries.
177 Ministry of Statistics and Programme Implementation (MoSPI) (2006). Central Statistical Organisation, Available at: <http://mospi.nic.in/mospi_new/upload/arep_chapter3_2006.pdf>. 178 MoSPI (2013), Green National Accounts in India – A Framework, March 2013, Government of India. Available at: <http://mospi.nic.in/mospi_new/upload/Green_National_Accouts_in_India_1may13.pdf>.
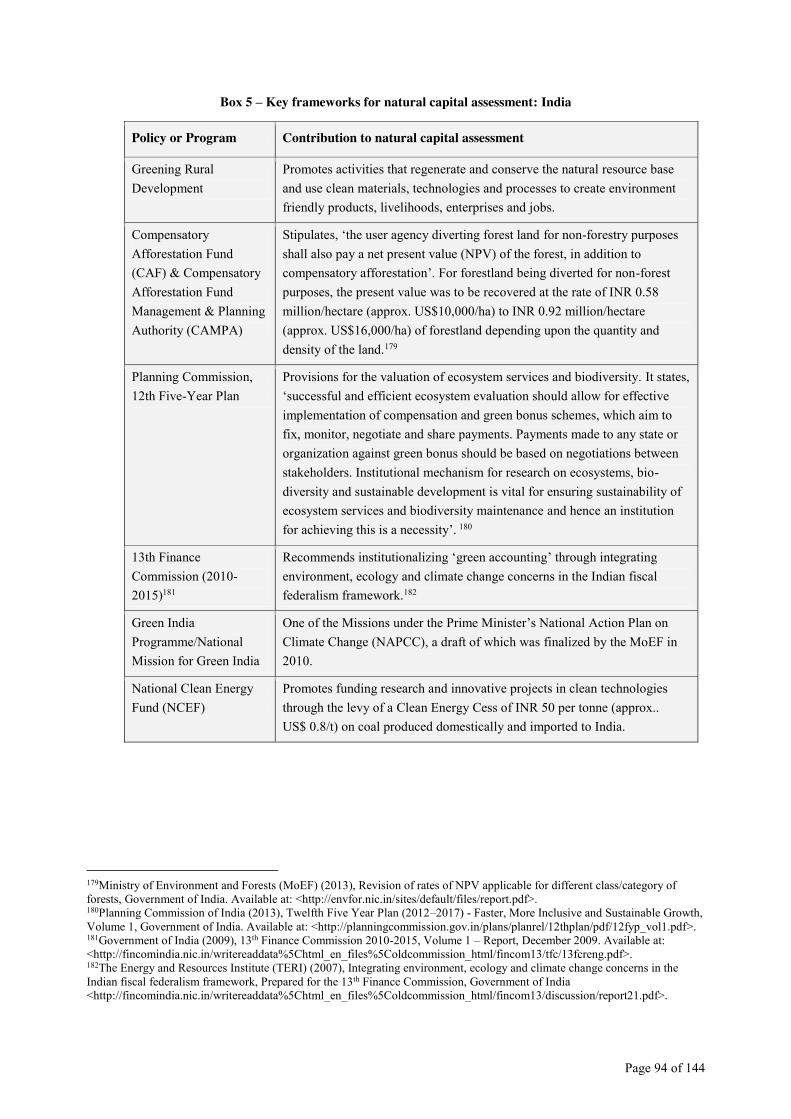
Page 94 of 144
Box 5 – Key frameworks for natural capital assessment: India
Policy or Program Contribution to natural capital assessment
Greening Rural Development
Promotes activities that regenerate and conserve the natural resource base and use clean materials, technologies and processes to create environment friendly products, livelihoods, enterprises and jobs.
Compensatory Afforestation Fund (CAF) & Compensatory Afforestation Fund Management & Planning Authority (CAMPA)
Stipulates, ‘the user agency diverting forest land for non-forestry purposes shall also pay a net present value (NPV) of the forest, in addition to compensatory afforestation’. For forestland being diverted for non-forest purposes, the present value was to be recovered at the rate of INR 0.58 million/hectare (approx. US$10,000/ha) to INR 0.92 million/hectare (approx. US$16,000/ha) of forestland depending upon the quantity and density of the land.179
Planning Commission, 12th Five-Year Plan
Provisions for the valuation of ecosystem services and biodiversity. It states, ‘successful and efficient ecosystem evaluation should allow for effective implementation of compensation and green bonus schemes, which aim to fix, monitor, negotiate and share payments. Payments made to any state or organization against green bonus should be based on negotiations between stakeholders. Institutional mechanism for research on ecosystems, bio-diversity and sustainable development is vital for ensuring sustainability of ecosystem services and biodiversity maintenance and hence an institution for achieving this is a necessity’. 180
13th Finance Commission (2010-2015)181
Recommends institutionalizing ‘green accounting’ through integrating environment, ecology and climate change concerns in the Indian fiscal federalism framework.182
Green India Programme/National Mission for Green India
One of the Missions under the Prime Minister’s National Action Plan on Climate Change (NAPCC), a draft of which was finalized by the MoEF in 2010.
National Clean Energy Fund (NCEF)
Promotes funding research and innovative projects in clean technologies through the levy of a Clean Energy Cess of INR 50 per tonne (approx.. US$ 0.8/t) on coal produced domestically and imported to India.
179Ministry of Environment and Forests (MoEF) (2013), Revision of rates of NPV applicable for different class/category of forests, Government of India. Available at: <http://envfor.nic.in/sites/default/files/report.pdf>. 180Planning Commission of India (2013), Twelfth Five Year Plan (2012–2017) - Faster, More Inclusive and Sustainable Growth, Volume 1, Government of India. Available at: <http://planningcommission.gov.in/plans/planrel/12thplan/pdf/12fyp_vol1.pdf>. 181Government of India (2009), 13th Finance Commission 2010-2015, Volume 1 – Report, December 2009. Available at: <http://fincomindia.nic.in/writereaddata%5Chtml_en_files%5Coldcommission_html/fincom13/tfc/13fcreng.pdf>. 182The Energy and Resources Institute (TERI) (2007), Integrating environment, ecology and climate change concerns in the Indian fiscal federalism framework, Prepared for the 13th Finance Commission, Government of India <http://fincomindia.nic.in/writereaddata%5Chtml_en_files%5Coldcommission_html/fincom13/discussion/report21.pdf>.
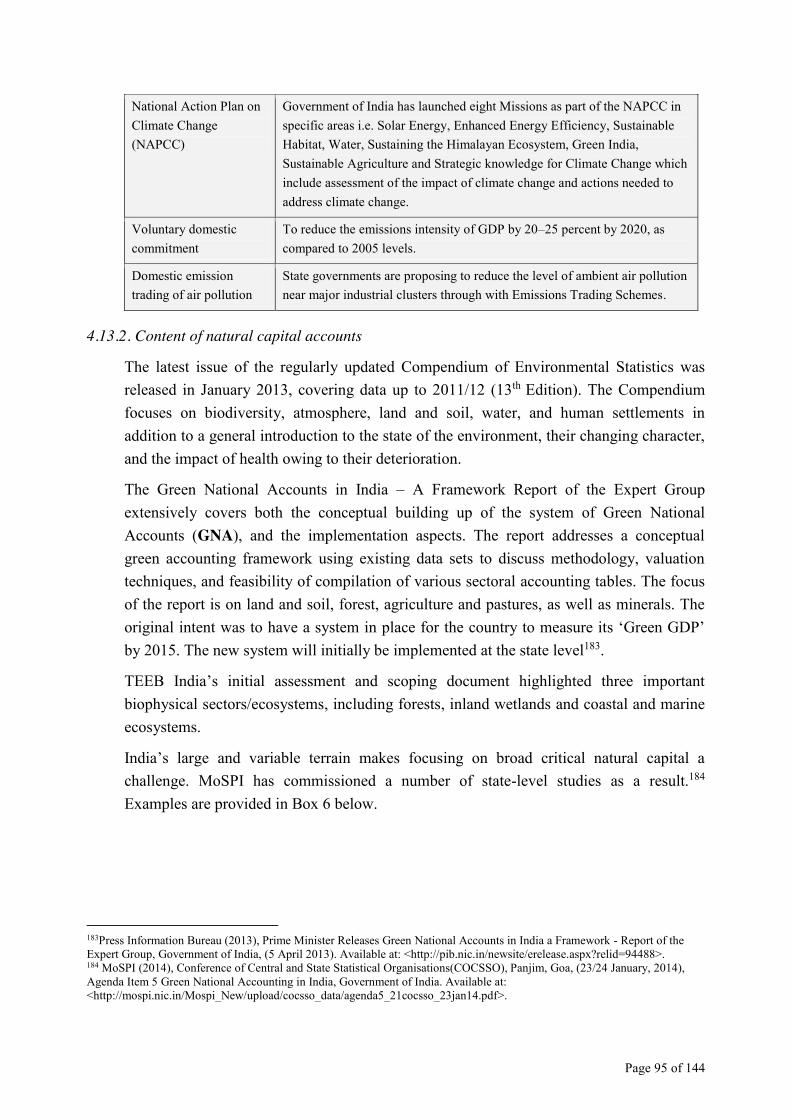
Page 95 of 144
National Action Plan on Climate Change (NAPCC)
Government of India has launched eight Missions as part of the NAPCC in specific areas i.e. Solar Energy, Enhanced Energy Efficiency, Sustainable Habitat, Water, Sustaining the Himalayan Ecosystem, Green India, Sustainable Agriculture and Strategic knowledge for Climate Change which include assessment of the impact of climate change and actions needed to address climate change.
Voluntary domestic commitment
To reduce the emissions intensity of GDP by 20–25 percent by 2020, as compared to 2005 levels.
Domestic emission trading of air pollution
State governments are proposing to reduce the level of ambient air pollution near major industrial clusters through with Emissions Trading Schemes.
4.13.2. Content of natural capital accounts
The latest issue of the regularly updated Compendium of Environmental Statistics was released in January 2013, covering data up to 2011/12 (13th Edition). The Compendium focuses on biodiversity, atmosphere, land and soil, water, and human settlements in addition to a general introduction to the state of the environment, their changing character, and the impact of health owing to their deterioration.
The Green National Accounts in India – A Framework Report of the Expert Group extensively covers both the conceptual building up of the system of Green National Accounts (GNA), and the implementation aspects. The report addresses a conceptual green accounting framework using existing data sets to discuss methodology, valuation techniques, and feasibility of compilation of various sectoral accounting tables. The focus of the report is on land and soil, forest, agriculture and pastures, as well as minerals. The original intent was to have a system in place for the country to measure its ‘Green GDP’ by 2015. The new system will initially be implemented at the state level183.
TEEB India’s initial assessment and scoping document highlighted three important biophysical sectors/ecosystems, including forests, inland wetlands and coastal and marine ecosystems.
India’s large and variable terrain makes focusing on broad critical natural capital a challenge. MoSPI has commissioned a number of state-level studies as a result.184 Examples are provided in Box 6 below.
183Press Information Bureau (2013), Prime Minister Releases Green National Accounts in India a Framework - Report of the Expert Group, Government of India, (5 April 2013). Available at: <http://pib.nic.in/newsite/erelease.aspx?relid=94488>. 184 MoSPI (2014), Conference of Central and State Statistical Organisations(COCSSO), Panjim, Goa, (23/24 January, 2014), Agenda Item 5 Green National Accounting in India, Government of India. Available at: <http://mospi.nic.in/Mospi_New/upload/cocsso_data/agenda5_21cocsso_23jan14.pdf>.
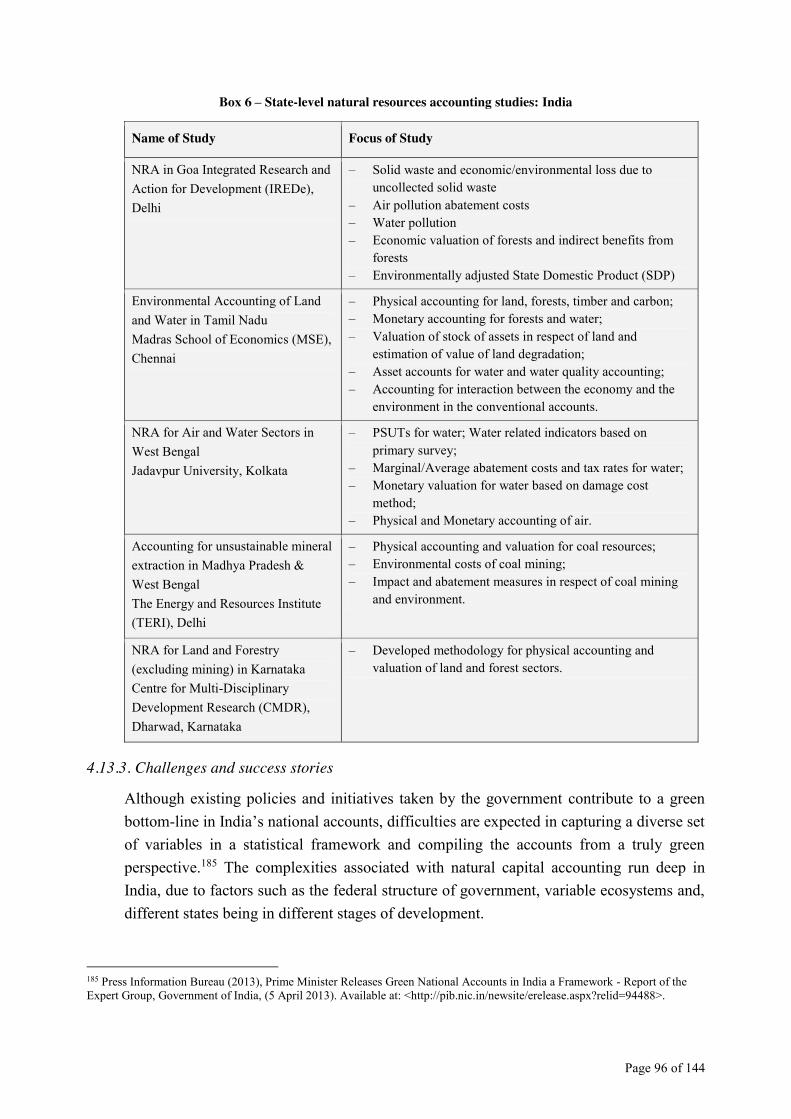
Page 96 of 144
Box 6 – State-level natural resources accounting studies: India
Name of Study Focus of Study
NRA in Goa Integrated Research and Action for Development (IREDe), Delhi
– Solid waste and economic/environmental loss due to uncollected solid waste
– Air pollution abatement costs – Water pollution – Economic valuation of forests and indirect benefits from
forests – Environmentally adjusted State Domestic Product (SDP)
Environmental Accounting of Land and Water in Tamil Nadu Madras School of Economics (MSE), Chennai
– Physical accounting for land, forests, timber and carbon; – Monetary accounting for forests and water; – Valuation of stock of assets in respect of land and
estimation of value of land degradation; – Asset accounts for water and water quality accounting; – Accounting for interaction between the economy and the
environment in the conventional accounts.
NRA for Air and Water Sectors in West Bengal Jadavpur University, Kolkata
– PSUTs for water; Water related indicators based on primary survey;
– Marginal/Average abatement costs and tax rates for water; – Monetary valuation for water based on damage cost
method; – Physical and Monetary accounting of air.
Accounting for unsustainable mineral extraction in Madhya Pradesh & West Bengal The Energy and Resources Institute (TERI), Delhi
– Physical accounting and valuation for coal resources; – Environmental costs of coal mining; – Impact and abatement measures in respect of coal mining
and environment.
NRA for Land and Forestry (excluding mining) in Karnataka Centre for Multi-Disciplinary Development Research (CMDR), Dharwad, Karnataka
– Developed methodology for physical accounting and valuation of land and forest sectors.
4.13.3. Challenges and success stories
Although existing policies and initiatives taken by the government contribute to a green bottom-line in India’s national accounts, difficulties are expected in capturing a diverse set of variables in a statistical framework and compiling the accounts from a truly green perspective.185 The complexities associated with natural capital accounting run deep in India, due to factors such as the federal structure of government, variable ecosystems and, different states being in different stages of development.
185 Press Information Bureau (2013), Prime Minister Releases Green National Accounts in India a Framework - Report of the Expert Group, Government of India, (5 April 2013). Available at: <http://pib.nic.in/newsite/erelease.aspx?relid=94488>.
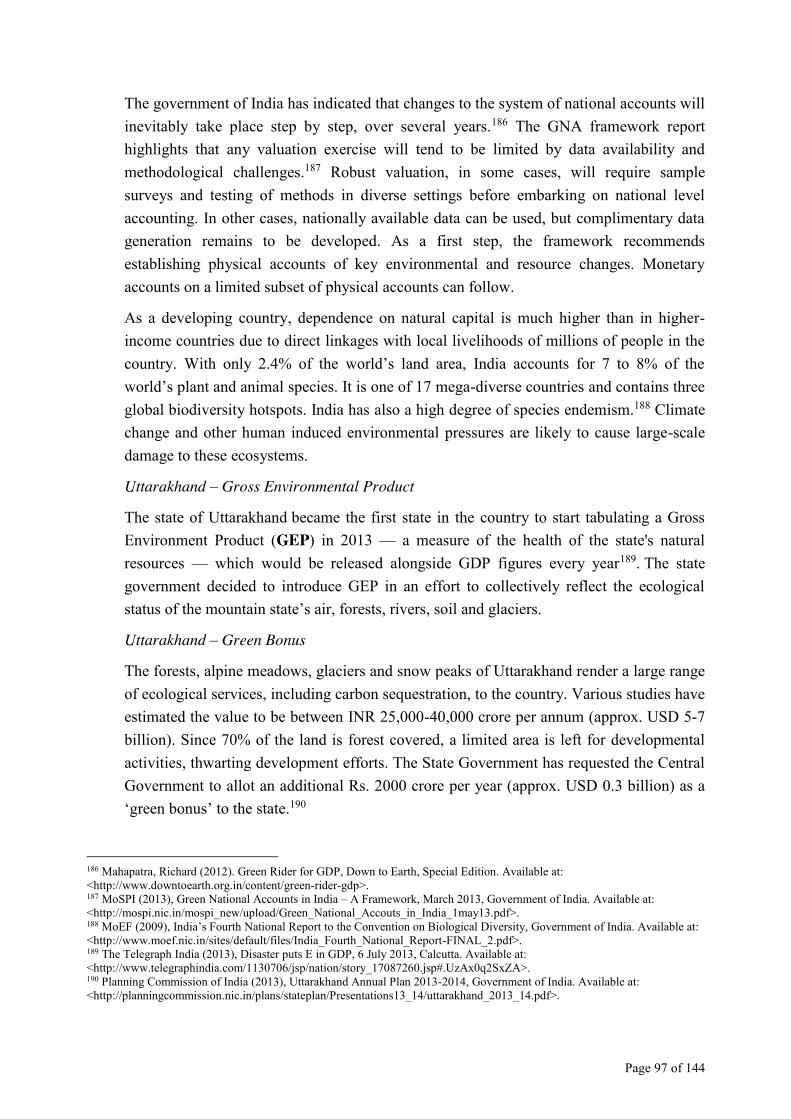
Page 97 of 144
The government of India has indicated that changes to the system of national accounts will inevitably take place step by step, over several years.186 The GNA framework report highlights that any valuation exercise will tend to be limited by data availability and methodological challenges.187 Robust valuation, in some cases, will require sample surveys and testing of methods in diverse settings before embarking on national level accounting. In other cases, nationally available data can be used, but complimentary data generation remains to be developed. As a first step, the framework recommends establishing physical accounts of key environmental and resource changes. Monetary accounts on a limited subset of physical accounts can follow.
As a developing country, dependence on natural capital is much higher than in higher-income countries due to direct linkages with local livelihoods of millions of people in the country. With only 2.4% of the world’s land area, India accounts for 7 to 8% of the world’s plant and animal species. It is one of 17 mega-diverse countries and contains three global biodiversity hotspots. India has also a high degree of species endemism.188 Climate change and other human induced environmental pressures are likely to cause large-scale damage to these ecosystems.
Uttarakhand – Gross Environmental Product
The state of Uttarakhand became the first state in the country to start tabulating a Gross Environment Product (GEP) in 2013 — a measure of the health of the state's natural resources — which would be released alongside GDP figures every year189. The state government decided to introduce GEP in an effort to collectively reflect the ecological status of the mountain state’s air, forests, rivers, soil and glaciers.
Uttarakhand – Green Bonus
The forests, alpine meadows, glaciers and snow peaks of Uttarakhand render a large range of ecological services, including carbon sequestration, to the country. Various studies have estimated the value to be between INR 25,000-40,000 crore per annum (approx. USD 5-7 billion). Since 70% of the land is forest covered, a limited area is left for developmental activities, thwarting development efforts. The State Government has requested the Central Government to allot an additional Rs. 2000 crore per year (approx. USD 0.3 billion) as a ‘green bonus’ to the state.190
186 Mahapatra, Richard (2012). Green Rider for GDP, Down to Earth, Special Edition. Available at: <http://www.downtoearth.org.in/content/green-rider-gdp>. 187 MoSPI (2013), Green National Accounts in India – A Framework, March 2013, Government of India. Available at: <http://mospi.nic.in/mospi_new/upload/Green_National_Accouts_in_India_1may13.pdf>. 188 MoEF (2009), India’s Fourth National Report to the Convention on Biological Diversity, Government of India. Available at: <http://www.moef.nic.in/sites/default/files/India_Fourth_National_Report-FINAL_2.pdf>. 189 The Telegraph India (2013), Disaster puts E in GDP, 6 July 2013, Calcutta. Available at: <http://www.telegraphindia.com/1130706/jsp/nation/story_17087260.jsp#.UzAx0q2SxZA>. 190 Planning Commission of India (2013), Uttarakhand Annual Plan 2013-2014, Government of India. Available at: <http://planningcommission.nic.in/plans/stateplan/Presentations13_14/uttarakhand_2013_14.pdf>.
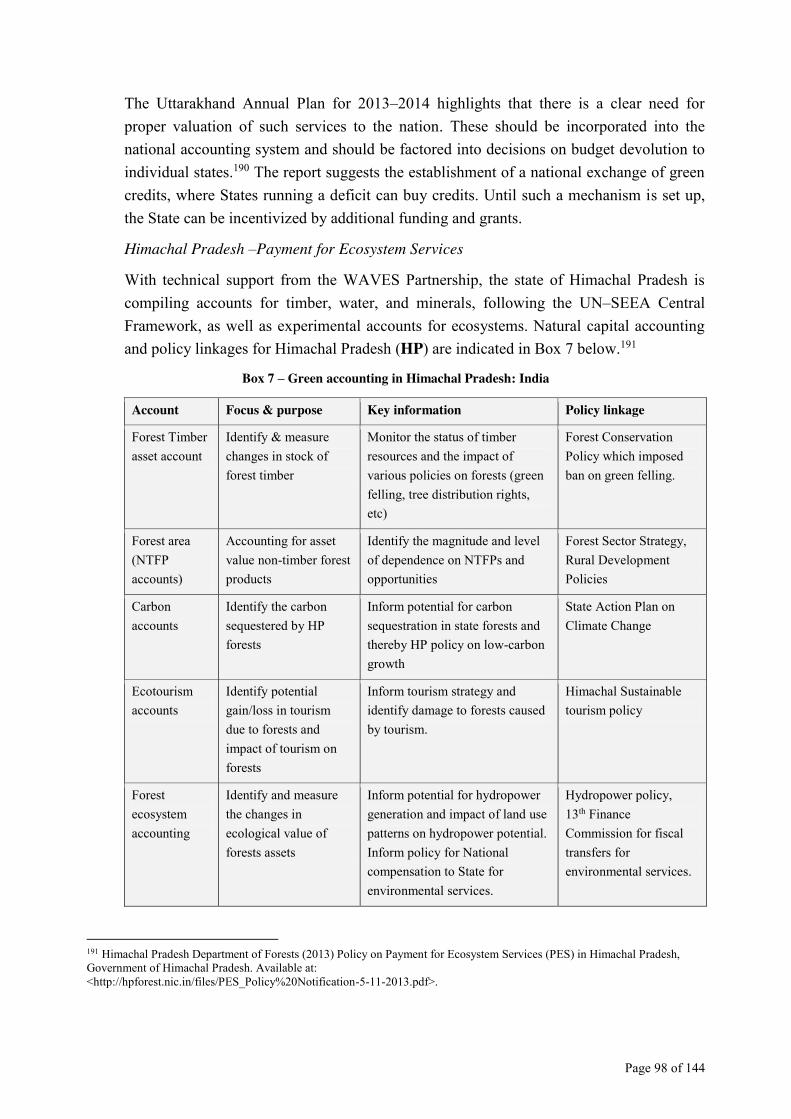
Page 98 of 144
The Uttarakhand Annual Plan for 2013–2014 highlights that there is a clear need for proper valuation of such services to the nation. These should be incorporated into the national accounting system and should be factored into decisions on budget devolution to individual states.190 The report suggests the establishment of a national exchange of green credits, where States running a deficit can buy credits. Until such a mechanism is set up, the State can be incentivized by additional funding and grants.
Himachal Pradesh –Payment for Ecosystem Services
With technical support from the WAVES Partnership, the state of Himachal Pradesh is compiling accounts for timber, water, and minerals, following the UN–SEEA Central Framework, as well as experimental accounts for ecosystems. Natural capital accounting and policy linkages for Himachal Pradesh (HP) are indicated in Box 7 below.191
Box 7 – Green accounting in Himachal Pradesh: India
Account Focus & purpose Key information Policy linkage
Forest Timber asset account
Identify & measure changes in stock of forest timber
Monitor the status of timber resources and the impact of various policies on forests (green felling, tree distribution rights, etc)
Forest Conservation Policy which imposed ban on green felling.
Forest area (NTFP accounts)
Accounting for asset value non-timber forest products
Identify the magnitude and level of dependence on NTFPs and opportunities
Forest Sector Strategy, Rural Development Policies
Carbon accounts
Identify the carbon sequestered by HP forests
Inform potential for carbon sequestration in state forests and thereby HP policy on low-carbon growth
State Action Plan on Climate Change
Ecotourism accounts
Identify potential gain/loss in tourism due to forests and impact of tourism on forests
Inform tourism strategy and identify damage to forests caused by tourism.
Himachal Sustainable tourism policy
Forest ecosystem accounting
Identify and measure the changes in ecological value of forests assets
Inform potential for hydropower generation and impact of land use patterns on hydropower potential. Inform policy for National compensation to State for environmental services.
Hydropower policy, 13th Finance Commission for fiscal transfers for environmental services.
191 Himachal Pradesh Department of Forests (2013) Policy on Payment for Ecosystem Services (PES) in Himachal Pradesh, Government of Himachal Pradesh. Available at: <http://hpforest.nic.in/files/PES_Policy%20Notification-5-11-2013.pdf>.
Page 99 of 144
4.14. Japan
Key achievements: Continuing assessment of natural capital since 1992 and creation of monetary accounts focusing on particular industries. Focus of natural capital accounts: Agriculture; forestry; fisheries; air; water; soil and land.
4.14.1. Legal and policy frameworks for natural capital accounting
Japan is a party to the CBD and has developed its 5th National Report and National Biodiversity Strategy and Action Plan.
The Cabinet Office (former Economic Planning Agency) and the Ministry of the Environment (MoE) gather information for environmental accounting. The information is collected in accordance with the Statistics Act and the Environment Basic Act. The majority of environmental accounting created in Japan conforms to the methodology of the UN–SEEA. The Cabinet Office and the MoE, along with supplementary government bodies, have been researching and assessing natural capital since 1992. Administrative agencies, including the central government, the prefectures, the ordinance-designated cities and affiliated public research institutions collect, manage and process natural capital information. This information is supplemented with information collected by independent researchers.
Natural capital information is predominantly available as statistical information. The MoE releases information on the environment and natural capital in the Annual Report on Environmental Statistics.192 The MoE owns the information related to the environment. The Cabinet Office owns the framework for environmental accounting and economic information. Information sharing between organizations has been historically infrequent though recently there have been improvements.
Monetary accounts were produced from 1992 through 2000 under the framework of the 1993 UN–SEEA (Version IV.2). The environmental accounts included an evaluation of environmental burden in the category of environmental costs. Sub-accounts of the environmental burden also encapsulated waste accounts and environmental protection expenditure estimates.
Japan has carried out three major revisions of the national accounts framework.193 The first revision was made in 1966 to meet the requirements of a System of National Accounts and Supporting Tables of 1953 (53SNA). The second revision was made in
192 See: Ministry of the Environment of Japan <http://www.env.go.jp/en/statistics/>. 193 See: National Accounts, Statistics Bureau, Ministry of Internal Affairs and Communications of Japan <http://www.stat.go.jp/english/data/chouki/03exp.htm>.
Page 100 of 144
response to the revision of the international standards decided in 1968. The UN Statistical commission revised the 53SNA extensively into the System of National Accounts of 1968 (68SNA). Consequently, in 1978 the Japanese government shifted its system completely to the 68SNA. In the 68SNA, five economic accounts were consolidated: national income accounts, input-output table, flow of funds accounts, national balance sheet and balance of international payments. Accounts were produced every five years from 1970 to 1990 based on the 68SNA framework. The third revision was effected on the basis of the System of National Accounts 1993 (93SNA), in which the 68SNA was extensively revised through the recommendations of five international organizations including the United Nations. Its purpose was threefold: to meet structural changes in the economy, to elucidate further various concepts and to improve consistency with other statistical systems. In 2000 the 93SNA was implemented in Japan, and the figures were revised retroactively to 1990, whereas main accounts pertaining to expenditure were revised retroactively to 1980.
The UN–SEEA was revised during the period of 2001–2003 and the Japanese version ‘NAMEA’ was created using the framework of integrated flow accounting. NAMEA is a combination of monetary accounting and material accounting. NAMEA records economic flows as NAM (National Accounting Matrix) in monetary terms and environmental pressures caused by economic activities as EA (Environmental Accounts) in physical terms.194 A national account was created using the NAMEA framework for the period of 2004 to 2007 based on historical information. Separate versions of the NAMEA were made for Hyogo, Gunma, and Osaka prefectures based on information from the national version of the NAMEA. Prior to that, university researchers had created regional accounts for Toyama, Hokkaido, and Nagasaki Prefectures as well as other regions of the country using the framework of either UN–SEEA or NAMEA. There are separate estimations for specific sectors: analysis of the agriculture-forestry sector is conducted by researchers while the fishery sector is carried out by the Fisheries Agency.
Integrated environmental and economic accounting was applied to environmental policies in 2008. SMA multiplier analysis was improved and a sustainability index (stock index) developed. The Japanese version of the UN–SEEA was created in the period from 2009–2011. This focused on water resources. Recently, the central framework of the SEEA (SEEA–CF) has been revised.
The economic value of market goods and supply services, obtained based on statistical data of the value of production, is well documented in Japan. Nonmarket goods, such as regulating services and cultural services are less well documented, as the economic value differs depending on evaluation method. The majority of ecosystem services are evaluated on the basis of preference-dependent measures, that is, the preferences of society. When
194 Ariyoshi, Noritoshi, (2006), The Development of Japanese NAMEA. Paper prepared for International Workshop for Interactive Analysis on Economy and Environment, Cabinet Office, the Government of Japan. Available at: <http://www.esri.go.jp/jp/prj/hou/hou020/hou20-2a-1.pdf>.
Page 101 of 144
considering a preference-independent measure, the economic value is determined on the basis of market value. Preference-dependent measures are based on revealed preferences such as the travel cost method or the hedonic price method, but also consider the market value of properties, travel cost, and wages. These are determined by the analysis of statistical data. Additional ecosystem services (to which previously mentioned evaluation methods are not applicable) employ stated preferences to estimate economic value using techniques such CVM (contingent valuation method) or conjoint analysis. A questionnaire survey is employed when using preference-dependent measures. Different evaluation methods are frequently employed for similar ecosystem services, which renders making generalized evaluations difficult. There is now a movement towards the introduction of comprehensive methods at the level of private companies. This will facilitate the assessment of the economic value of nonmarket goods within the framework of microscopic natural capital accounting, which integrates the value of natural capital into management evaluation.
Natural capital information has been utilized for the development of policies related to recycling and environmental conservation, though it is not yet used consistently across the legislative spectrum.
4.14.2. Focus of natural capital accounts
The information available concerning the stock of natural capital is primarily determined for natural resources that contribute to industrial production. Data assembly and analysis is restricted to resources that are considered important such as select marine species. Limited information is available regarding inland waters, marine algae, or shellfish.
Natural capital information is collected from a variety of industries including agriculture, forestry, and fisheries. Data is also collected on the state of environmental features including air, water, soil, and land. The majority of statistics from the fishing industry are in the form of flow data. The Ministry of Agriculture, Forestry and Fisheries and the related prefectures assess the quantity of stocks of selected important fish species and release periodic reports on the current conditions. The most recent statistics include the conditions of 52 fish species and 84 marine areas. The conditions of international marine resources, including tuna and whales, have also been assessed and reported by Japanese organizations.
Material flows through the economy are included in natural capital information. The MoE produces a national estimation. An additional estimation is made using the framework of the UN–SEEA. The relationship of material flow to GDP or supplementary indices is also analyzed in order to evaluate the efficiency of the circulation of material goods in Japan.
4.14.3. Challenges and success stories
The major challenges to implementing natural capital legislation in Japan are to identify specific uses of environmental accounting, to enhance public awareness of the importance
Page 102 of 144
and necessity of environmental accounting, and to promote the dissemination of information between government bodies.
The condition of natural capital is deteriorating. Society is recognizing that the environment is a finite resource. As such, the value placed on environmental goods is rising. The major threats to natural capital are increasing energy consumption, increasing emissions of greenhouse gases, nuclear contamination as a result of the accident at Fukushima Daiichi Nuclear Power Plant, and waste management, particularly with regards to decommissioned structures. The threats are growing. This is compounded by difficulties caused by Japan’s long history of earthquakes and seismic activity.
Despite these challenges, Japan has shown progress in recognizing the significance of ecosystem conservation, especially in relation to its economic activities.
Box 8 – Stork conservation in Hyogo Prefecture: Japan
The Toyooka Municipal Government in Hyogo Prefecture has been promoting tourism by focusing its efforts on stork conservation. A large number of tourists have visited Toyooka to see the storks. Farms in Toyooka are growing rice in a way that contributes to the conservation of creatures on which storks feed. The rice grown by these farms has obtained recognition as a brand and has sold at higher prices than rice grown in many other regions. Japan is committed to promoting initiatives where ecosystem conservation and economic activities positively influence one another.
Page 103 of 144
4.15. Mexico
Key achievements: Completion of national natural capital accounts and annual calculation of an environmentally adjusted GDP.
Focus of natural capital accounts: Stocks of forestry, groundwater, hydrocarbons; environmental degradation; environmental expenditures.
4.15.1. Legal and policy frameworks for natural capital accounting
Mexico is a Party to the Convention on Biological Diversity and has submitted its 4th CBD National Report and National Biodiversity Strategy and Action Plan. It is also a supporter of the Natural Capital Communiqué. Mexico takes part in international expert panels including the UN London Group on Environmental Accounting195 and the Ulaanbaatar City Group on Statistics for Economies based on Natural Resources.196 These commitments have formalized the Mexican government’s engagement with international discussions on natural capital accounting recommendations and the implementation of this type of accounting in national policy.
Since 1991, Mexico’s National Institute for Statistics and Geography (INEGI) has published economic and environmental accounts on an annual basis. Environmental accounts have been published with a range of primary focuses including the exhaustion of natural resources (groundwater, forestry, hydrocarbons), environmental degradation (contamination of the water and air, and soil erosion), and environmental expenditure (at the federal, state and local levels of government). Environmental expenditures information is used in the calculations of costs incurred by climate change, including in the report ‘Estimations of the impacts of climate change, from the System of Economic and Environmental Accounting for Mexico 2010–2011.’
Under Mexican law, the INEGI is responsible for the generation of natural capital accounts, which serve as bases for the calculation of an adjusted gross domestic product (GDP). The INEGI is aided in this task by government entities including the Mexican National Institute for Ecology and Climate Change. The methodology used is that of the UN–SEEA. It also draws from the UN’s 2008 System of National Accounts, European Union’s statistical office methodology for Material Flow Accounts, and the Frascati Manual by the OECD.197
The data used to populate Mexico’s economic and environmental accounts are produced at the federal level by relevant government ministries and commissions including the
195 See: <https://unstats.un.org/unsd/envaccounting/londongroup/>. 196 See: <http://web.nso.mn/ub_city_group/about-us>. 197 WAVES (June 2012) Moving Beyond GDP <http://www.wavespartnership.org/>.
Page 104 of 144
National Water Commission and the National Forests Commission. These entities are each a part of cross-sectorial Specialized Technical Committees that review both the methodologies of data collection and the quality of the data collected.
Mexico’s national water accounts are compiled by the National Water Commission and INEGI and are used for calculating the efficiency of inland water resource use across agriculture, drinking water, thermoelectric cooling, and industry.198 The country also incorporates international recommendations for natural capital accounting for fisheries, forestry, and economy-wide material flows.199
All accounts are produced both in physical and monetary terms so that they can be used in comparing the cost of environmental impacts with the economic processes that produce them. The monetary units are used in Mexico’s assessments of the economic costs of environmental impacts, and in comparing the alternatives of prevention, mitigation and remediation. In particular, the Environmental Protection Expenditure Account focuses on tracking expenditures for environmental damage control and prevention.
SEEA–Mexico disseminates recurrent and updated information relating to the impact of economic activities on the environment and on quality of life. Synthesis indicators are used to communicate the magnitude of these impacts, the current level of effort to remedy or avoid environmental damage, and the estimated additional expenditures required to resolve existing challenges. Included in these synthesis indicators are the following indicators and corresponding stated objectives or purposes:200
x Ecological Gross Domestic Product (EGDP) – measures economic production, discounting the negative environmental effects arising from activities of production, consumption, and distribution of goods and services.
x Ratio of EGDP and GDP – indicates progress toward sustainability, as the indicator approaches the value ‘1’.
x Total Cost of Depletion and Environmental Degradation (TCDED) – reflects environmental damage in monetary terms and represents the minimum amount of expenditure needed to remedy or restore the depletion or degradation of natural resources and the environment.
x Ratio of TCDED and GDP – displays the environmental impact of depletion of degradation in GDP. Decreases in this indicator represent progress towards environmental sustainability.
198 Above n 197. 199 Raúl Figeroa Díaz, Mexico’s environmental accounts and derived indicators, National Institute of Statistics and Geography, <http://www.statistics.gov.hk/wsc/STS085-P3-S.pdf>. 200 Above n 199.
Page 105 of 144
x Environmental Protection Expenditure (EPE) – displays monetary expenditures for the benefit of the environment as current expenditure and investment.
x Ratio of EPE and GDP - allows positioning of economic efforts in favor of the environment in relation to the country's production.
An annual EGDP has been produced since 1991 and has been used in Mexico’s National Development Plan since 2001, where it serves as an indicator to measure sustainable development progress. It is also used to promote the protection of essential ecosystem services and is incorporated into the statements of Article 15 of the General Law of Ecological Equilibrium and Environmental Protection in Mexico. The Sectoral Plan for the Environment and Natural Resources 2013–2018 also refers to the environmental accounts, and use them as a baseline to measure the loss of natural capital and pollution of water, air and soil. These accounts are a factor in Mexico’s National Environmental and Natural Resources Program, which is issued every six years as well as the country’s Program to Promote Sustainable Development in the Federal Government.
The National Program of Environment and Natural Resources 2007–2012, considers the results of natural capital accounts. The Environmental Performance Evaluation of Mexico highlights the country’s environmental indicators including the EGDP. The Global Environmental Outlook of Mexico highlighted these accounts, stating that ‘the relevance of national accounts to include the ecological approach, [allows them] to reconsider the importance of economic activities in the generation of national wealth.’201
Mexico is currently working to create physical and monetary accounts for ecosystem services in collaboration with the UN London Group. The generation of these accounts is under discussion, with participation from the country’s Ministry of the Environment and Natural Resources, the National Commission for the Knowledge and Use of Biodiversity, and the INEGI.
4.15.2. Focus of natural capital accounts
Mexico currently produces three accounts that are particularly relevant to natural capital: natural resource exhaustion, environmental degradation, and environmental expenditure. Data are available for these accounts on an annual basis starting from 2003 (data for 2011 and 2012 are preliminary).
In terms of natural resource exhaustion, hydrocarbon resources are decreasing the fastest, with an average annual growth rate of -0.84% in the stock of crude oil barrels. Forests represent approximately one-third of the country’s land area. Forest stocks are measured in cubic meters of wood available in the national forests and show overall decline at a rate
201 Above n 199.
Page 106 of 144
of 0.39% per year. Over-exploitation of groundwater is increasing at a rate of 0.45% per year.
Mexico’s environmental degradation accounts show that air pollution emissions have been declining overall. However, emissions from transport are increasing. Solid waste generation is rising at an annual rate of 2.24%. Water pollution is measured as the amount of wastewater that is not treated. These pollution levels have has increased by 10.15% per year since 2003. Soil erosion is increasing at an annual rate of 0.31%.
Mexico’s EGDP is calculated by subtracting the value of both the costs associated with environmental degradation (including the depletion of oil, forests and groundwater) and natural resources exhaustion (including soil degradation, water and air pollution, and solid waste generation) combined with environmental expenditure from the national GDP. This calculation shows that the ratio of the EGDP to national GDP rose from 91.5% in 2003 to 93.7% in 2012. Currently, 1% of the national GDP is spent on environmental expenditures, comparable to and at times higher than other OECD countries.
4.15.3. Challenges and success stories
As Mexico works to balance its economic growth with social and environmental goals, it has encountered a wide range of environment-related challenges. For example: Increasing wood production has put a strain on Mexico’s forests. This has resulted in a consistent decline in total forested areas, although the rate of deforestation is itself decreasing due to governmental programs. Water use is also increasing, especially due to domestic water demand. Water pollution is increasing as a larger percentage of this water goes untreated and is instead directly discharged into the environment. Furthermore, the increase in the use of private transport has an adverse impact on local air quality.
International collaboration is cited as being crucial in the development of economic-environmental accounts in Mexico. The Mexican government has used international recommendations to update their national accounts since they were first published in 1991. In particular, recommendations in the 1993, 2008, and 2012 in UN System of National Accounts publications have been adopted where warranted and possible.
Additionally, cooperation at the national level, with stakeholders and end-users is noted as being important for the consolidation of the accounts and to guarantee the quality of the information. The cooperation between government agencies is required for the construction of the accounts, as well as for the diffusion of information and for the cross-evaluation of methodologies.
Page 107 of 144
4.16. Nigeria Key achievements: Sustainable forestry principles to address climate change and forest protection.
Focus of natural capital accounts: Forests; land; water.
4.16.1. Legal and Policy Frameworks for Natural Capital Accounting
Nigeria is a party to the CBD and has developed its 5th CBD National Report and National Biodiversity Strategy and Action Plan. The country is a developing economy in Africa acknowledging the importance of evaluating natural capital for environmental protection, human economic development and poverty eradication.
Nigeria collaborates with international organizations in order to develop and improve existing natural capital accounting frameworks. It receives technical and financial assistance from the World Health Organization and the UNDP. Nigeria needs further support on monitoring and evaluation in addition to help in conducting a comprehensive capacity needs assessment for sustainable management.
Nigeria has made efforts to integrate natural capital information into the formulation of national environmental policies and laws. Given the urgency of protecting forest resources, natural capital accounting has become an integral part of national laws and policies on sustainable forest management. Based on natural capital accounting, Nigeria managed to design and apply a regulatory basis for private sector forest management agreements. This was achieved through setting the framework for technical standards for private sector forestry in order to ensure better legal provisions and to also encourage long-term investment. Based on sustainable forestry principles, Nigeria aims at regulating reforestation and forest protection.
There are five different organizations which collect, manage and process information on Nigeria’s natural capital, namely the Forestry Research Institute of Nigeria; Federal Ministry of Environment; Nigeria Bureau of Statistics; Central Bank of Nigeria; and the Federal Environmental Protection Agency. Nigeria is currently undertaking a multi-stakeholder project to strengthen the documentation, communication and dissemination of information related to the physical impact of climate change, adaptation and mitigation. Civil society organizations and local communities are an important part of enhanced cooperation regarding information sharing. Additional information is also shared with the public and commercial sector. This includes information on REDD+ mechanisms; the ‘Green Great Wall’ initiative on desertification;; and environmental impact assessment.
4.16.2. Focus of Natural Capital Accounts
Page 108 of 144
Even though there is willingness in Nigeria to integrate natural capital accounting into policy and decision-making, the accounts do not include material flows through the economy. Tracing back these material flows is an important tool to assess the physical consequences of human activities and needs, a way to quantify flows of stocks of materials and other substances. Despite the involvement of the Nigeria Bureau of Statistics and the Central Bank of Nigeria, natural capital accounting data and indicators are not used in the country’s budgetary processes. There is currently no document outlining practical and technical information on international standard methodologies. Nigeria still lacks functional environmental statistics on continued environmental degradation.
Re-forestation and the fight against desertification are the most pressing environmental challenges. Economic values of natural capital are therefore particularly important in the formulation of forest policies. Nigeria introduced, based on natural capital accounts, sustainable forestry principles for private forest management. The country’s policies aim at ensuring the rational use of forest resources by promoting non-timber forest products. Nigeria is aware of the importance of community participation in forest resource management. Hence, national programs also focus on increasing public awareness and community engagement.
Despite the legal and policy framework Nigeria put in place, implementation needs to be improved. Current policies and laws do not sufficiently address the challenges arising from rapid population and consumption growth. Currently, natural capital accounts do not capture the full complex interactions between the environment and economy. While timber resources, for example, are accounted for, other resources of forests such as carbon sequestration and air filtration are not taken into substantial consideration. This leads to incomplete information about the consequences of economic activity, performance and wellbeing.
4.16.3. Challenges and Success Stories
According to the Inclusive Wealth Report 2012,202 there has been a significant change in Nigeria’s natural capital. The country has experienced a significant decline in natural resources since the early 1990s. In the past two decades, 41% of the country’s forest resources were destroyed, which led to increased desertification, gully erosion, and coastal erosion.
The depletion of non-renewable resources accounted for about 25% of its GDP in 2013, i.e. the country is particularly reliant on its non-renewable resources. Energy-intensive economic growth causes environmental pressures on the country’s natural capital base. Such pressures lead eventually to risks for human health, the environment and the livelihoods of local communities in general. Nigeria is close to total economic dependence
202 Inclusive Wealth Report 2012, 11–14.
Page 109 of 144
on oil resources, potentially leading to systemic economic risks for the country. Nigeria is keen on diversifying its economy in order to reduce the dependence on global fossil fuel demand and to protect the local environment endangered by national oil production. The ecosystem’s health and resilience are put at risk by uncontrolled deforestation, and the environmental impacts of the extraction of non-renewable resources. These kind of impacts may reduce the country’s overall wealth and competitiveness.
Environmental pressures have changed over recent years as the population of the country continues to grow, while the total area of natural habitat decreases and the range of wildlife becomes increasingly restricted. These are pressures generated mainly at the country level. However, the country also faces threats generated externally, such as climate change. Climate change affects the availability of water resources in particular, affecting power generation and agriculture.
Despite remaining challenges, Nigeria supports regional initiatives to find common solutions to common problems. Under the direction of Nigeria, a feasibility study about the potential contribution of re-channeling the Ubangi River in Central Africa into the Chad basin under the Inter-basin Water Transfer Scheme was conducted, to which Nigeria contributed USD 5 million out of USD 6 million required for the study.
The entire geographical basin of the Lake Chad is a crucial part of natural capital in the region as it covers 8% of the surface area of the African continent shared between the countries Algeria, Cameroon, Central African Republic, Chad, Libya, Niger, Nigeria and Sudan. In recent decades, the open water surface of Lake Chad has reduced from approximately 25,000 km2 in 1963, to less than 2,000 km2 in the 1990s heavily impacting the Basin’s habitats, economic activities and food security. The shrinkage of the Lake has been driven by both global and local causes: climate change and vastly increased competing demands on the Lake and its surrounding land have accelerated its shrinkage over the past years.
The feasibility study Nigeria funded concludes that transfer of water from the Congo basin via the Ubangi River to Lake Chad is technically feasible.203 This project is promising as it would increase the water level and enlarge the size of the lake. Besides technical feasibility, this project would also be economically beneficial for the region. Two more in-depth studies are needed to contribute to the final decision of all parties involved.
203 Seminar report: Adaptive Water Management in the Lake Chad Basin: Addressing current challenges and adapting to future needs, World Water Week, Stockholm, (August 18-22, 2009).
Page 110 of 144
4.17. Peru Key achievements: Methodology and action plan for development of satellite accounts. Completion of pilot studies (land and soil; subsoil resources; forestry; fisheries; water and biodiversity; public spending on the environment). Focus of natural capital accounts: Water; energy; agriculture; forestry management; livestock; fisheries; tourism: hotels and restaurants.
4.17.1. Legal and policy frameworks for natural capital accounting
Peru’s progress in natural capital accounting can in part be attributed to the country’s wider commitment to the protection of biodiversity. Peru is a signatory to the CBD, and has submitted its 4th National Report in 2010204 and its National Biodiversity Strategy and Action Plan.205 The Action Plan aims for Peru to be the first country in the world to have the most benefits for its population from the conservation and sustainable use of biodiversity and the restoration of all its biodiversity components by 2021. Peru is also included in the Northern Andes and Southern Central America Natural Capital Project, which maps ecosystem services in parts of Latin America.206
One key study about the state of Peru’s natural capital is the National Report on the State of the Environment207, produced by the National System for Environmental Information. This is a body that organizes the systematization and access to information within the Ministry of Environment (MINAM).
According to national law, the government must report on the state of the environment and more specifically to include the value of natural capital into national accounts.208 This has to be done through the creation of environmental satellite accounts, which is the joint responsibility of the National Institute for Statistics and Informatics (INEI) and MINAM.
INEI is responsible for producing the environmental statistics as well as the National Accounts, including the satellite environmental accounts. The National System for Environmental Information (which is part of MINAM) produces indicators and reports about the state of the environment.
MINAM is the institution in charge of protecting natural resources and the environment and of producing natural capital information for policy-makers. Within MINAM is the Vice Ministry for Strategic Management of Natural Resources (VMDERN), whose
204 MINAM. ‘Cuarto informe nacional sobre la aplicación del convenio de diversidad biologica años 2006–2009’. (Peru: Dirección General de Diversidad Biológica, 2010) Accessible online on: <http://www.cbd.int/doc/world/pe/pe-nr-04-es.pdf>. 205 Consejo Nacional del Ambiente ‘Peru: Estrategia Nacional sobre Diversidad Biológica’ (2001). Accessible online on: <http://www.sernanp.gob.pe/sernanp/archivos/biblioteca/publicaciones/DOC_VARIOS/ENDB.pdf>. 206 Natural Capital Project. Northern Andes and Southern Central America. Accessible online on: <http://www.naturalcapitalproject.org/delete/nasca_team.html>. 207 See;: <http://sinia.minam.gob.pe/index.php?accion=verElemento&idElementoInformacion=1262>. 208 See: <http://www.minam.gob.pe/wp-content/uploads/2013/06/ley-general-del-ambiente.pdf>.
Page 111 of 144
mandate includes developing the national strategy for the integrated management of natural resources, and overseeing its implementation.
Within VMDERN is the General Directorate of Natural Heritage Assessment, Valuation and Financing, which is primarily responsible for natural resource valuation and provision of data for National Environmental Accounts. It is responsible for the following activities:
x Natural heritage inventory and valuation methodologies
x Capacity building for economic valuation of natural heritage (composing natural resources, environmental services, and biodiversity) at sector, regional and local levels209
x Studies on economic valuation
x Studies of public spending on natural resources and biodiversity
x Compensation mechanisms for environmental services.
In March 2010, the congress of Peru passed a new set of regulations for the 2001 Law No. 27446 on the National Environmental Impact Assessment System.210 This requires all environmental impact assessments (EIA) to include an ecosystem service valuation by 2011. This has been in place for hydrocarbons since 2006 and for mining since 2010. Article 25211 includes the requirement for the assessment, conservation and valuation of Peru’s natural heritage, including natural resources, genetic, species and ecosystem biodiversity, and the environmental services that they provide. Article 26212 includes the need for EIAs to consider environmental impact, including the costs of mitigation, monitoring, remediation or rehabilitation, as well as the cost of other conservation or management measures that may be applicable, such as compensation. MINAM together with Earth Economics (a US based non-profit agency) has developed a framework to help implement the new law.213
In 2011 MINAM produced the first version of a guide on implementing Environmental Satellite Accounts in Peru.214 This is intended to establish the basis for implementing
209 Capacity building has been carried out partly through the creation of a diploma on environmental-economic valuation: <http://www.ecomilenio.es/desarrollo-del-diplomado-valoracion-economica-de-la-biodiversidad-y-los-servicios-de-los-ecosistemas-en-peru/2222>. 210 MINAM ‘Ley del Sistema Nacional de Evaluación de Impacto Ambiental y su Reglamento’. (San Isidro, Peru, 2009). Accessible online on: <http://cdam.minam.gob.pe/novedades/leyseiareglamento.pdf>. 211 Article 25 of the amendment: Assessment, conservation and valuation of natural heritage, Evaluación, Conservación y Valoración del Patrimonio Natural. 212 Article 26 of the amendment: Economic appraisal of environmental impact of projects, Valorización económica del impacto ambiental de proyectos de inversión. 213 Earth Economics. ‘Global Ecosystem Services Partnership Proposal: A National Ecosystem Service Valuation System for Peru’. (2011). Accessible online on: <http://www.pdx.edu/sites/www.pdx.edu.sustainability/files/ESPA-Peru%20Project%20Summary%20v%20.10.pdf>. 214 Vice Ministerio de Desarrollo Estratégico de Recursos Naturales. ‘Una Primera Approximación de la Cuenta Satélite Ambiental’, Dirección General de Evaluación, Valoración y Financiamiento del Patrimonio Natural. (San Isidro, Peru 2011). Accessible online on: <http://www.minam.gob.pe/patrimonio-natural/wp-content/uploads/sites/6/2013/09/cuenta_satelite_ambiental.pdf>.
Page 112 of 144
environmental accounting at a national level. The guide is based on the UN–SEEA, and includes:
x Pilot physical accounts for land and soil, subsoil resources, forestry, fisheries, water and biodiversity;
x Pilot accounts for spending on environmental protection;
x Pilot environmental-economic integrated accounts;
x Methodologies;
x Information on data gaps for other accounts such as energy and mining;
x A set of 324 environmental indicators;
x An action plan on implementing the satellite environmental accounts.
MINAM and INEI have also created an inter-institutional technical commission for statistics and environmental accounting to help towards the national standardization of studies and their methodologies.
Peru’s entity for strategic planning (CEPLAN) aims to complete the inventory and valuation of national natural capital by 2021. This forms a part of the ‘national plan for environmental action’. The inventory will serve as an input in decision-making and planning for the rational use and protection of natural resources.
4.17.2. Focus of natural capital accounts
In Peru, the focus of natural capital accounts is integrally linked to economic valuation, as natural capital is valued in relation to its participation in the creation of economic wealth. In other words, the value of the ecosystem amounts to the proportion of GDP that can be attributed to exploitation of its natural capital.
The results are partial, but various preliminary conclusions can be drawn. MINAM estimates that economic activities that are based on extraction of natural capital represent 13.6% of the national GDP. The total value of selected ecosystem services in 2009 amount to USD 15.3 billion.215 This includes:
x USD 2.5 billion from energy and water
x USD 8.0 billion from agriculture, forestry and livestock
x USD 4.9 billion from hotels and restaurants
x USD 864 million from fisheries.
Additionally, natural capital-based exports amounted to USD 9.0 million in 2009. 215 MINAM ‘Peru: Economía y Diversidad Biológica’ (2009). Accessible online on: <http://www.sernanp.gob.pe/sernanp/archivos/imagenes/vida/perueconomia.pdf>.
Page 113 of 144
The Millennium Ecosystem Assessment sub-global assessment in the Peruvian Andes includes assessments of cultural services (spirituality), provisioning services (water and food), supporting services (soil and primary production) and agro-biodiversity.
4.17.3. Challenges and success stories
Peru is in the initial stages of natural capital valuation. As such, the main challenge to the application of natural capital accounting is to produce a national inventory of natural capital with standardized methodology. The methodological guide for the valuation of natural capital has yet to be finished by MINAM. A further difficulty to these tasks is to engage the legislative power to promote the creation of satellite accounts by recognizing their importance for the protection of natural resources. At the same time, Peru is required to comply with its international and regional commitments, including the UNFCCC obligation to establish a national inventory of greenhouse gas (GHG) emissions. Peru is also implementing REDD+ projects, and participates in the WAVES Partnership as a core member country.
The vulnerability of ecosystems is of particular concern as ecosystem services are the productive base for industries such as fisheries, agriculture, manufacturing, tourism and pharmaceuticals. Peru is a lead exporter of organic bananas, coffee and cocoa; is one of the top fish producers in the world; and utilizes over 4,400 traditional plant species for a variety of medicinal, consumptive and cultural uses. 71% of tourists visiting Peru participate in nature-related activities, and around 65% of agriculture depends on local biodiversity resources. Conservation International has identified Peru as a mega-diverse country. This means that it is one of the seventeen countries that have within their borders more than two thirds of our planet's biological wealth.216 It is estimated that biodiversity is contributing 22% of Peru’s GDP.217 Peru also relies significantly on ecosystem services for soil fertility, air quality and water supply.
A regional Millennium Ecosystem Assessment was undertaken in the Vilcanota sub-region of the Peruvian Andes, a regional biodiversity hotspot with a large number of endemic species.218 It identified mass tourism and mining as threats to biodiversity and cultural diversity. The Ministry of Environment also identify deforestation, particularly due to illegal mining operations and logging,219 urban expansion and agricultural development, and the resulting pollution as major threats to the national natural capital. Hydrological services are particularly threatened, with reported high levels of urban water
216 Conservation International. Accessible online on: <http://www.conservation.org/documentaries/Pages/megadiversity.aspx>. 217 MINAM ‘Peru: Economía y Diversidad Biológica’ (2009). <http://www.sernanp.gob.pe/sernanp/archivos/imagenes/vida/perueconomia.pdf>. 218 MEA. ‘Millenium subglobal assessment: Vilcanota Sub-region’. <http://www.millenniumassessment.org/en/SGA.Peru.html>. 219 MINAM and MINAG ‘El Perú de los bosques’ (2010). <http://cdam.minam.gob.pe/novedades/elperudelosbosques2011.pdf>.
Page 114 of 144
consumption compared to other South American cities,220 and high levels of watershed degradation and water pollution.
A study by Peru’s national bank shows the negative impact of climate change on the national agriculture, public health, fisheries, hydropower and economic growth.221 Peru’s fisheries are ranked the tenth most vulnerable in the world to climate-induced disasters.222 De-glaciation is already occurring, and its acceleration will have a critical impact on the hydrological cycle, which will in turn affect water supply for people, agriculture and hydropower.223
An important success identified by the government towards the valuation of natural capital is the modification of categorizations of public spending in the national budget.224 In Peru, the budget is divided into different categories, one of which is the environment. This category is itself made up of subcategories, including various topics such as Fauna and Flora Protection, Forestation, Hydrological Resources, Pollution Control among others. However, in the latest version of this categorization there was no mention of public spending relating to the creation of information and databases on the state of the environment. As a result, no money could be attributed to these activities in the budget. The new categorization (drafted in 2010) proposed the following activities: evaluation, monitoring, valuation, analysis, investigation, development of information, and diffusion of information among others,225 as an addition to the existing activities of management, control, planning, and administration or regulation of the environment. The validation of the new categories has been considered an important step towards redefining what can be considered public spending in the protection of the environment, to be included in the exercise of natural capital accounting. Additionally, it has helped Peru align its budget categorization to those of international organizations, so that Peru’s public spending on the environment can be compared across regions but also with other countries in the world.
220 Estimated 66 gallons of water consumed/day/person in Lima, compared to 40 gallons/day/person in Bogotá or Santiago de Chile. See: <http://www.nature.org/ourinitiatives/regions/southamerica/peru/explore/aquafondo-the-water-fund-for-lima.xml>. 221 Vargas, P. ‘El Cambio Climático y Sus Efectos en el Perú’. In Working Paper Series, Banco Central de Reserva del Perú, 2009. <http://www.bcrp.gob.pe/docs/Publicaciones/Documentos-de-Trabajo/2009/Documento-de-Trabajo-14-2009.pdf>. 222 Allison et al. ‘Vulnerability of national economies to the impacts of climate change on fisheries’. Fish and Fisheries, 10. (2009). DOI: 10.1111/j.1467-2979.2008.00310.x 223 Consejo Nacional del Ambiente, http://www.comunidadandina.org/desarrollo/cl_LuisGeng.pdf 224 See: <http://www.minam.gob.pe/patrimonio-natural/wp-content/uploads/sites/6/2013/09/Propuesta_Tecnico_Legal-_Clasificador_Funcional.pdf>. 225 See: <http://www.mef.gob.pe/contenidos/presu_publ/anexos/FUNCIONAL_PROGRAMATICO_MODIFICATORIA.pdf>.
Page 115 of 144
Box 9 – Watershed funds: Northern Andes region
Watershed funds are a type of payment for ecosystem services focusing on delivery of hydrological services through the creation of a trust fund financial governing structure. They are based on the premise that practices taken to help conserve ecosystems by people living upstream in a watershed can help maintain a clean, regular supply of water paid for by downstream users (including water utility companies, hydropower companies, irrigation systems and other industries) who depend on these services. Water users pay money to a water fund, usually a multi-institutional governing body with public and private partners. The water fund invests in the conservation of watersheds, generally aiming to improve or maintain water quality, quantity and regularity of flow for downstream users; improve or maintain human well-being for upstream users; and maintain or enhance ecosystem function and biodiversity of the watershed. This creates a long-term, sustainable source of funding and a decision-making body for long-term conservation efforts, and can help to avoid the costs of infrastructure for water treatment. Water funds are increasingly popular in Latin America, particularly in Colombia and Ecuador. In 2011, seven water funds were operational in the Northern Andes alone, serving over 11 million people and helping to conserve 1.6 million hectares of watershed.226 At the time of the study, six additional water funds were under development, which once operational, would serve a further 4 million people and add nearly 1 million hectares of protected watershed. One such water fund, the Lima water fund called Aquafondo, is supported by The Nature Conservancy, Grupo GEA and the Fondo de Las Américas. It will use contributions from major water users in Lima to finance watershed restoration and conservation activities.227 Other watershed projects include the Watershed Services Incubator project launched by the Environment Ministry228 and the Andean Watershed Project in the Jequelepeque and Piura micro-watersheds of Alto Mayo-Moyobamba, San Martín Department, supported by the German Agency for Technical Cooperation (GTZ) and the Consortium for the Sustainable Development of the Andean Ecoregion (CONDESAN). A fee charged to Moyobamba’s water consumers by the municipal water company was used to subsidize upstream farmers willing to change sediment-prone land use, such as planting shade-grown coffee in previous slash-and-burn areas, which would also improve incomes for these farmers.
226 Goldman, R.L., et al. ‘Water Funds: Protecting Watersheds for Nature and People’. (Arlington, Virginia: The Nature Conservancy, 2011). Accessible online on: <http://www.naturalcapitalproject.org/pubs/TNC_Water_Funds_Report.pdf>. 227 See: <http://www.nature.org/ourinitiatives/regions/southamerica/peru/explore/aquafondo-the-water-fund-for-lima.xml>. 228 Stanton, T., et al. ‘State of Watershed Payments: An Emerging Marketplace’. Ecosystem Marketplace. 2010. Accessible online on: <http://www.forest-trends.org/documents/files/doc_2438.pdf>.
Page 116 of 144
4.18. The Philippines
Key achievements: Continuing assessment of environmental statistics in key sectors; Plans to revisit natural capital accounts first established in the 1990s. Focus of natural capital accounts: Flora and fauna; atmosphere; water; land and soil; mineral and energy resources; human settlements.
4.18.1. Legal and policy frameworks for natural capital accounting
The Philippines is party to the CBD and has submitted its 4th National Report in 2009.229 Its associated National Biodiversity Strategy and Action Plan (NBSAP) went through a second revision in 2006230 and an update is currently under way. The NBSAP aims to incorporate Philippines’ obligations under the CBD into its national development and sectoral planning frameworks through a renewed and participatory ‘biodiversity planning and strategizing process’.
In addition to supporting the Rio+20 Natural Capital Accounting Communiqué, the Philippines is also one of the pilot countries for the WAVES Partnership. The government has indicated its intention to use Philippines Wealth Accounting and Valuation of Ecosystem Services (Phil-WAVES), to serve as a starting point to revisit earlier work on environmental accounting. Lead agencies for the implementation of the program are Philippine Statistics Authority, formerly, the National Statistical Coordination Board (PSA-NSCB), National Economic and Development Authority (NEDA), and the Department of Environment and Natural Resources (DENR). The Phil-WAVES initiative provides the government with the following opportunity for an enhanced green accounting approach:231
x Development of a macro-level indicator of long term sustainability of economic growth, the Adjusted Net Savings (ANS) inclusive of valuating natural capital;
x Development of national accounts for prioritized natural resources - minerals and mangroves – this will be based on the 2012 UN–SEEA and analyze the impact of different natural resource management and revenue sharing scenarios on income and economic development;
229 Republic of the Philippines (2009) Assessing Progress Towards the 2010 Biodiversity Target: The 4th National Report to the Convention on Biological Diversity. Available at: <http://www.cbd.int/doc/world/ph/ph-nr-04-en.pdf>. 230 Ong, P.S., L.E. Afuang and Rosell-Ambal (2002) Philippine Biodiversity Conservation Priorities: A Second Iteration of the National Biodiversity Strategy and Action Plan, Department of Environment and Natural Resources-Protected Areas and Wildlife Bureau, Conservation International Philippines, Biodiversity Conservation Program-University of the Philippines Centre for Integrative and Development Studies, and Foundation for the Philippine Environment. Quzon City, Philippines, Available at: <http://www.cbd.int/doc/world/ph/ph-nbsap-v2-en.pdf>. 231 World Bank (2014), Philippines – WAVES. Availabe at: <http://go.worldbank.org/V3ST0HIQK0>.
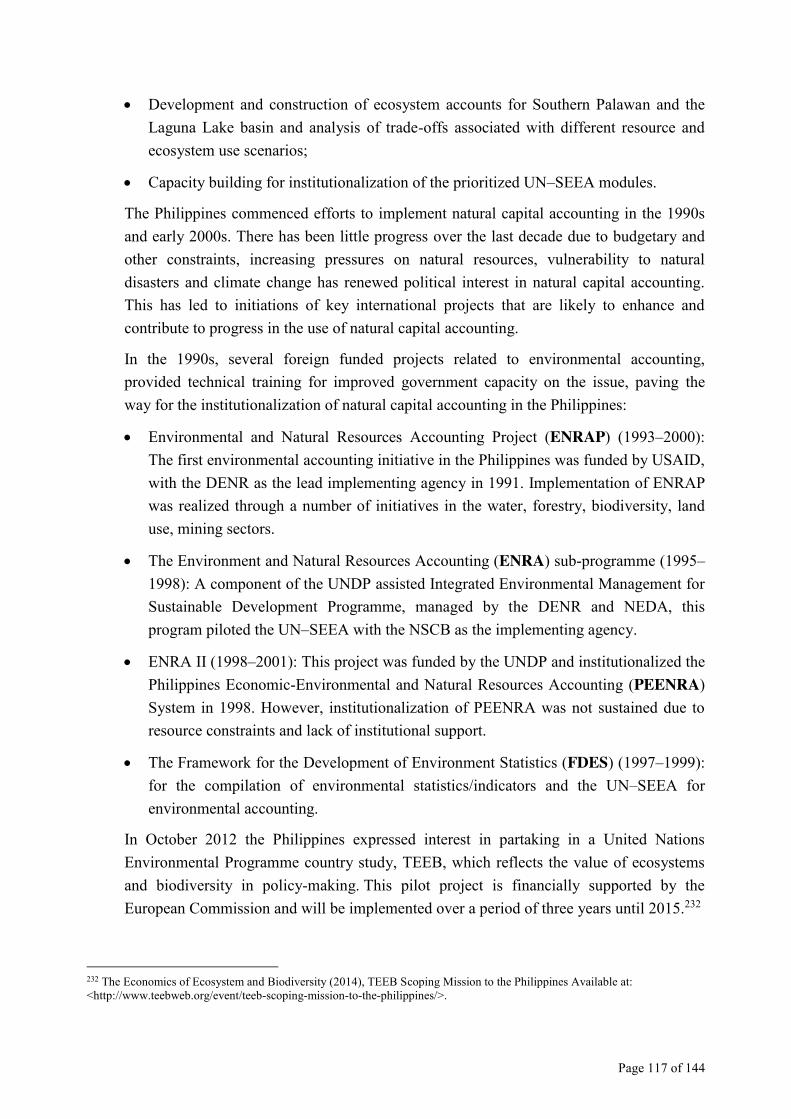
Page 117 of 144
x Development and construction of ecosystem accounts for Southern Palawan and the Laguna Lake basin and analysis of trade-offs associated with different resource and ecosystem use scenarios;
x Capacity building for institutionalization of the prioritized UN–SEEA modules.
The Philippines commenced efforts to implement natural capital accounting in the 1990s and early 2000s. There has been little progress over the last decade due to budgetary and other constraints, increasing pressures on natural resources, vulnerability to natural disasters and climate change has renewed political interest in natural capital accounting. This has led to initiations of key international projects that are likely to enhance and contribute to progress in the use of natural capital accounting.
In the 1990s, several foreign funded projects related to environmental accounting, provided technical training for improved government capacity on the issue, paving the way for the institutionalization of natural capital accounting in the Philippines:
x Environmental and Natural Resources Accounting Project (ENRAP) (1993–2000): The first environmental accounting initiative in the Philippines was funded by USAID, with the DENR as the lead implementing agency in 1991. Implementation of ENRAP was realized through a number of initiatives in the water, forestry, biodiversity, land use, mining sectors.
x The Environment and Natural Resources Accounting (ENRA) sub-programme (1995–1998): A component of the UNDP assisted Integrated Environmental Management for Sustainable Development Programme, managed by the DENR and NEDA, this program piloted the UN–SEEA with the NSCB as the implementing agency.
x ENRA II (1998–2001): This project was funded by the UNDP and institutionalized the Philippines Economic-Environmental and Natural Resources Accounting (PEENRA) System in 1998. However, institutionalization of PEENRA was not sustained due to resource constraints and lack of institutional support.
x The Framework for the Development of Environment Statistics (FDES) (1997–1999): for the compilation of environmental statistics/indicators and the UN–SEEA for environmental accounting.
In October 2012 the Philippines expressed interest in partaking in a United Nations Environmental Programme country study, TEEB, which reflects the value of ecosystems and biodiversity in policy-making. This pilot project is financially supported by the European Commission and will be implemented over a period of three years until 2015.232
232 The Economics of Ecosystem and Biodiversity (2014), TEEB Scoping Mission to the Philippines Available at: <http://www.teebweb.org/event/teeb-scoping-mission-to-the-philippines/>.
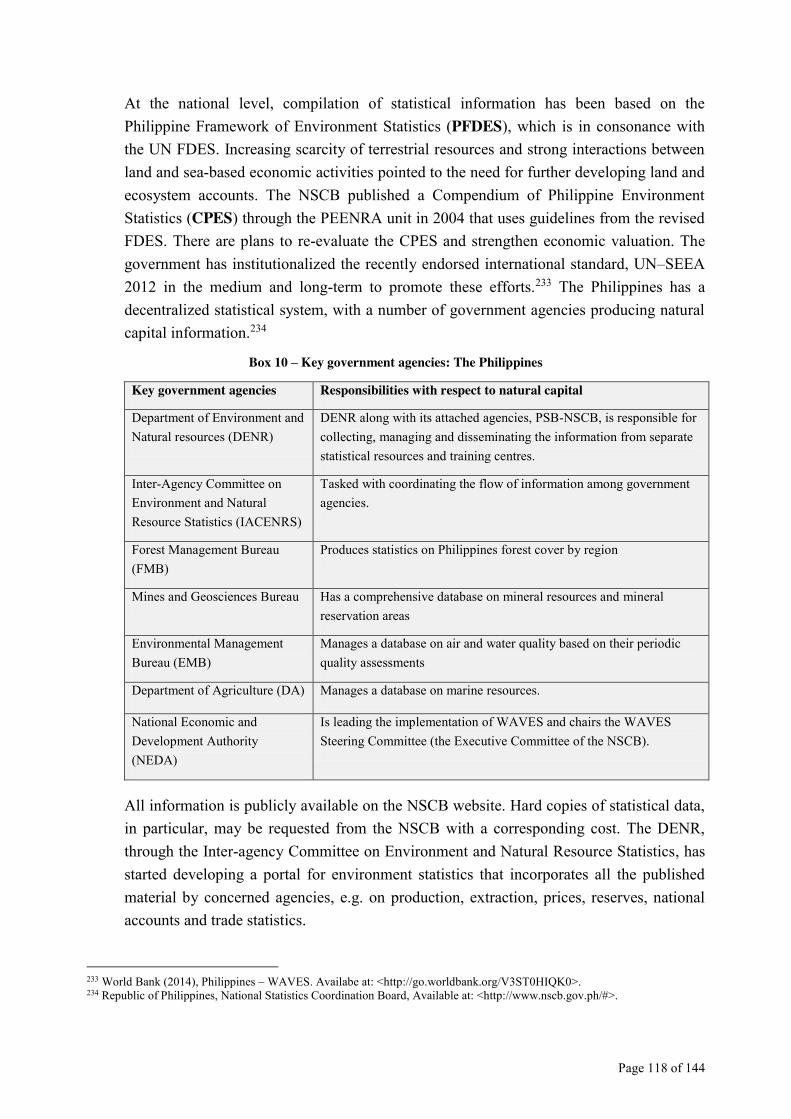
Page 118 of 144
At the national level, compilation of statistical information has been based on the Philippine Framework of Environment Statistics (PFDES), which is in consonance with the UN FDES. Increasing scarcity of terrestrial resources and strong interactions between land and sea-based economic activities pointed to the need for further developing land and ecosystem accounts. The NSCB published a Compendium of Philippine Environment Statistics (CPES) through the PEENRA unit in 2004 that uses guidelines from the revised FDES. There are plans to re-evaluate the CPES and strengthen economic valuation. The government has institutionalized the recently endorsed international standard, UN–SEEA 2012 in the medium and long-term to promote these efforts.233 The Philippines has a decentralized statistical system, with a number of government agencies producing natural capital information.234
Box 10 – Key government agencies: The Philippines
Key government agencies Responsibilities with respect to natural capital
Department of Environment and Natural resources (DENR)
DENR along with its attached agencies, PSB-NSCB, is responsible for collecting, managing and disseminating the information from separate statistical resources and training centres.
Inter-Agency Committee on Environment and Natural Resource Statistics (IACENRS)
Tasked with coordinating the flow of information among government agencies.
Forest Management Bureau (FMB)
Produces statistics on Philippines forest cover by region
Mines and Geosciences Bureau Has a comprehensive database on mineral resources and mineral reservation areas
Environmental Management Bureau (EMB)
Manages a database on air and water quality based on their periodic quality assessments
Department of Agriculture (DA) Manages a database on marine resources.
National Economic and Development Authority (NEDA)
Is leading the implementation of WAVES and chairs the WAVES Steering Committee (the Executive Committee of the NSCB).
All information is publicly available on the NSCB website. Hard copies of statistical data, in particular, may be requested from the NSCB with a corresponding cost. The DENR, through the Inter-agency Committee on Environment and Natural Resource Statistics, has started developing a portal for environment statistics that incorporates all the published material by concerned agencies, e.g. on production, extraction, prices, reserves, national accounts and trade statistics.
233 World Bank (2014), Philippines – WAVES. Availabe at: <http://go.worldbank.org/V3ST0HIQK0>. 234 Republic of Philippines, National Statistics Coordination Board, Available at: <http://www.nscb.gov.ph/#>.
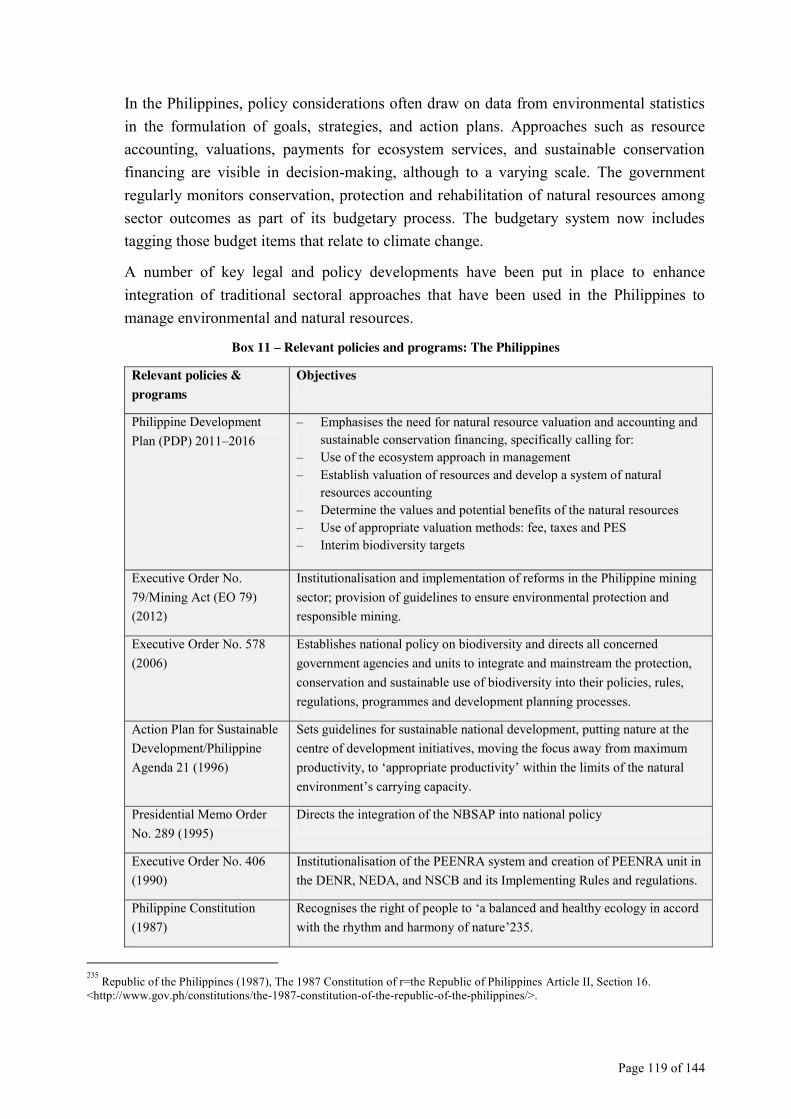
Page 119 of 144
In the Philippines, policy considerations often draw on data from environmental statistics in the formulation of goals, strategies, and action plans. Approaches such as resource accounting, valuations, payments for ecosystem services, and sustainable conservation financing are visible in decision-making, although to a varying scale. The government regularly monitors conservation, protection and rehabilitation of natural resources among sector outcomes as part of its budgetary process. The budgetary system now includes tagging those budget items that relate to climate change.
A number of key legal and policy developments have been put in place to enhance integration of traditional sectoral approaches that have been used in the Philippines to manage environmental and natural resources.
Box 11 – Relevant policies and programs: The Philippines
Relevant policies & programs
Objectives
Philippine Development Plan (PDP) 2011–2016
– Emphasises the need for natural resource valuation and accounting and sustainable conservation financing, specifically calling for:
– Use of the ecosystem approach in management – Establish valuation of resources and develop a system of natural
resources accounting – Determine the values and potential benefits of the natural resources – Use of appropriate valuation methods: fee, taxes and PES – Interim biodiversity targets
Executive Order No. 79/Mining Act (EO 79) (2012)
Institutionalisation and implementation of reforms in the Philippine mining sector; provision of guidelines to ensure environmental protection and responsible mining.
Executive Order No. 578 (2006)
Establishes national policy on biodiversity and directs all concerned government agencies and units to integrate and mainstream the protection, conservation and sustainable use of biodiversity into their policies, rules, regulations, programmes and development planning processes.
Action Plan for Sustainable Development/Philippine Agenda 21 (1996)
Sets guidelines for sustainable national development, putting nature at the centre of development initiatives, moving the focus away from maximum productivity, to ‘appropriate productivity’ within the limits of the natural environment’s carrying capacity.
Presidential Memo Order No. 289 (1995)
Directs the integration of the NBSAP into national policy
Executive Order No. 406 (1990)
Institutionalisation of the PEENRA system and creation of PEENRA unit in the DENR, NEDA, and NSCB and its Implementing Rules and regulations.
Philippine Constitution (1987)
Recognises the right of people to ‘a balanced and healthy ecology in accord with the rhythm and harmony of nature’235.
235
Republic of the Philippines (1987), The 1987 Constitution of r=the Republic of Philippines Article II, Section 16. <http://www.gov.ph/constitutions/the-1987-constitution-of-the-republic-of-the-philippines/>.
Page 120 of 144
Philippine Environmental Policy, Presidential Decree No. 1151 (1977)
Exploitation of natural resources only to be done on the condition that it shall not degrade the resource, or endanger human life, health and safety, and not negatively impact agriculture, commerce and industry.
4.18.2. Content of natural capital accounts
The 2004 CPES was a compilation of statistical information collected from data produced by various government agencies and from data available in different statistical publications. The focus of the compendium was on the six main environmental themes under threat in the Philippines: flora and fauna, atmosphere, water, land and soil, mineral and energy resources, and human settlements. WAVES Phase 1 in the Philippines was piloted with a primary focus on fisheries, and coastal and marine ecosystems. WAVES plans also highlight the development of national accounts as a priority for mineral resources and mangroves.
The World Bank report, ‘The Philippines: Country Environmental Analysis in 2009’,236 assessed the state of the environment, linking issues of human welfare and sustainability, the monetary cost of environmental degradation, priority areas for action and governmental capacity for environmental management to challenges identified. High priority subject areas were chosen for the study, including: outdoor and indoor air pollution; water pollution; sanitation and hygiene; coastal and marine resources; forestry; land management and climate change. This followed an ecosystem service assessment on the Laguna de Bay basin237 conducted as part of the Millennium Ecosystem Assessment. There are also many reports on ecosystems and biodiversity in the Philippines, which include mangroves,238 coastal and marine resources,239 forests,240 and biodiversity.241
4.18.3. Challenges and success stories
Comprehensive economic valuation of natural capital has not yet been undertaken in the Philippines. Some information, mostly as a result of work carried out in the 1990s and early 2000s, relates to: production data (volume and value); pilot estimates of asset accounts by type of resources (based on 1993 UN–SEEA); GVA estimate of national accounts; and foreign trade statistics and price statistics.
236 World Bank (2009) The Philippines: Country Environmental Analysis, Sustainable Development Department, East Asia and Pacific Region: Washington D.C., Available at: <https://openknowledge.worldbank.org/handle/10986/3178>. 237 Lasco, R.D. and M.V.O. Espaldon (2005) Ecosystems and People: The Philippines Millennium Ecosystem Assessment (MA), Sub-global Assessment, Environmental Forestry Programme, College of Forestry and Natural Resources, University of the Philippines Los Baños, in collaboration with the Department of Environmental and Natural Resources and Laguna Lake Development Authority, Available at: <http://www.unep.org/maweb/documents_sga/philippine sga report.pdf>. 238 Farley, J., et al. (2010) Conserving Mangrove Ecosystems in the Philippines: Transcending Disciplinary and Institutional Borders. Environmental Management 45: 39-51. 239 World Bank (2005) Philippines Environment Monitor 2005: Coastal and Marine Resource Management 240 Forest Management Bureau (2009) Philippines Forestry Outlook Study. In Asia-Pacific Forestry Sector Outlook Study II. Bangkok: Food and Agriculture Organisation. 241 Republic of the Philippines (2009) Assessing Progress Towards the 2010 Biodiversity Target: The 4th National Report to the Convention on Biological Diversity.
Page 121 of 144
Although the organized use of natural capital accounting in policy decision-making is currently limited; the ENRAP and ENRA projects and current engagement in projects such as WAVES, TEEB, and to some extent, in the various REDD+ and PES studies, are all designed to factor in and enhance the use of natural capital accounting in policy development and various decision-making processes. The key challenges to the advancement and implementation of natural capital accounting in the Philippines are:
x Addressing the data gaps in environment statistics/indicatorsand improving timeliness of data
x Improving communication and coordination among concerned agencies
x Provision of greater technical and logistical capacities of implementing agencies
x Provision of financial and resources (institutional and personnel) dedicated to data and knowledge management for the institutionalization of natural capital accounting
x Absence of strong leadership and support from higher levels of government.
The Philippines also faces a number of environmental challenges that are likely to impact its natural capital. The country is one of 17 mega-diverse countries in the world.242 The country has some 1,196 known species of amphibians, birds, mammals and reptiles, of which, 45.8% are endemic. The Philippines is home to a wide-ranging species of vascular plants, of which 39.2% are endemic. It is also one of the world’s hotspots, with a large number of endangered and threatened species, making it one of the top global conservation priority areas.243 This rich biodiversity is supported by a large variety of ecosystems, including forests, which make up roughly 24% of the total land area.244
Natural calamities and human activities leading to deforestation, land conversions, unsustainable exploitation of natural resources (mineral extractions), illegal loggings, and invasive alien species have all been identified as serious threats to the status and economic value of the country’s natural capital. These threats have intensified over the last five years, inflicting serious damage and loss to lives and property. Around 80% of the population and half its total area are considered vulnerable to natural disasters and extreme climatic events.245
242Conservation International (1998), Available at: <http://www.conservation.org/documentaries/Pages/megadiversity.aspx>. 243 Food and Agriculture Organisation (FAO), Country Profiles - Philippines. Available at: <http://www.fao.org/countryprofiles/index/en/?lang=en&iso3=PHL>. 244 IUFRO (2007) Keep Asia Green – Volume 1, South-east Asia. Available at: <http://www.iufro.org/science/special/spdc/actpro/keep/sea/>. 245 World Bank (2009) The Philippines: Country Environmental Analysis, Sustainable Development Department, East Asia and Pacific Region: Washington D.C., Available at: <https://openknowledge.worldbank.org/handle/10986/3178>.
Page 122 of 144
Box 12 – Sibuyan Island payments for ecosystem services: The Philippines
Sibuyan Island is home to around 330 indigenous Sibuyan Mangyan families dependent on swidden agriculture (temporary plots produced by cutting and burning off vegetative cover), hunting, and gathering of forest products. Over time, forests have been cleared to make way for new swidden farms, while the need for cash income has led some to resort to cutting and hauling timber for lowland traders. A study by the World Wide Fund (WWF) showed that with the rate of current forest loss, two vital watersheds, Cantigas and Palangcalan, and their services – Cantigas and Palangcalan - could potentially disappear. An economic evaluation conducted showed that the degradation would mean higher costs of USD 152 per year to each of the 696 domestic consumer households. In this case PES was looked at to facilitate conservation activities. Sibuyan Mangyan Tagabukid, the Local Government Unit (LGU) of San Fernando, WWF, PANLIPI (an indigenous legal support group), DENR, and Park Office and National Commission on Indigenous Peoples signed a watershed co-management agreement in 2005. When the PES incomes were compared with the incomes of the indigenous people from logging and hauling activities, it showed that incomes from PES made up 81% of the total gross incomes. The crucial role of upland and indigenous communities in promoting non-destructive land uses in watersheds has placed them in the center of upland strategies to address landslides, floods and droughts.
Box 13 - Economic value of mangrove forests in Manila Bay: The Philippines
In 2008, the Philippine Supreme Court acted on environmental accounting information to initiate a massive clean-up in the heavily degraded Manila Bay. The Supreme Court issued Metro Manila Development Authority an order to ‘demolish illegal structures and dwellings along riverbanks and waterways connected to Manila Bay by 2015’. This was an effort to curb large-scale water pollution in the area. Support was also shown for community-level programs such as the ‘Manila Bay Clean-up Run’. The reason for quick action was based on data estimating the costs of no action at USD 7 million due to the impacts of illness and USD 29 million due to reduced fish exports (as a result of algal blooms).246 Action was also taken to protect local mangroves, whose direct benefits were estimated at USD 150 million in the early 2000s, a figure four times greater than shrimp aquaculture ponds, conversion to which is one of the main threats to mangroves in the Philippines.247
246 Farley, J., et al. (2010) Conserving Mangrove Ecosystems in the Philippines: Transcending Disciplinary and Institutional Borders. Environmental Management 45: 39-51. 247 WAVES (2012) Moving Beyond GDP: Factoring Natural Capital into Economic Decision Making. Wealth Accounting and the Valuation of Ecosystem Services (WAVES), facilitated by the World Bank
Page 123 of 144
4.19. Rwanda
Key achievements: Implementation of re-forestation and biodiversity programs. Steering Committee overseeing natural capital accounting (NCA) has been put in place. Focus of natural capital accounts: Terrestrial ecosystems: forests; land; wetlands; water: lakes and rivers.
4.19.1. Legal and policy frameworks for natural capital accounting
Rwanda is a supporter of the Rio+20 Communiqué on Natural Capital Accounting248 as well as signatory of the Gaborone Declaration and a party to the CBD. It has submitted its 5th CBD National Report and developed a National Biodiversity Strategy and Action Plan. In the 5th CBD National Report, they provide analysis and indicators to inform decisions on enhancing bio-diversity in the country. Firstly, the report gives an update on the status, trends and threats of bio-diversity, and implications for human well-being in the country. Secondly, it provides recommendations on how bio-diversity can be implemented and mainstreamed into different sectors. Thirdly, it provides an analysis of how the country could contribute to the 2020 CBD Aichi Targets.249
The country is collaborating with the World Bank under the WAVES initiative which provides technical assistance to build local capacity enable natural capital accounting processes. This technical assistance focuses on the integration of natural capital accounts into the National Standards Accounts, aiming to include natural capital material flows to the economy. However, the country needs to develop its local capacity to be able collect data and enable monitoring. Furthermore, capacity on how the collected natural capital information can be integrated into a standardized statistical framework such as the UN-SEEA framework is yet to be developed. There are a number of organizations and agencies that collect, manage and process information with regards to natural capital. These are the Ministry of Natural Resources; Rwanda Natural Resources Authority; Rwanda Development Board; Tourism and Conservation Department; National Institute of Statistics of Rwanda; Rwanda National Bank; Rwanda Agriculture Board; Energy, Water and Sanitation Authority; and Rwanda Environment Management Authority. Surveys, assessments and Statistical year books are used to collect natural capital information. This information acts as input into policy development and also for the setting of policy priorities.
Collected information and statistics is shared with relevant stakeholders, through publication on government and institutional websites; TV and radio broadcasts;
248 WAVES Annual Report 2013. 249 Rwanda Fifth National Report to the Convention on Biological Diversity (2014).
Page 124 of 144
newsletters; dissemination of electronic and printed reports; public launching events; as well as through training, workshops and conferences. This information is also shared with parliamentarians to aid in decision-making.
Besides the information on natural capital available to parliamentarians, the country has laws and policies that guide decision-making in this area. The environment, forestry and bio-diversity policies focus on fostering sustainable use and protection of ecosystems and natural resources; water policy provides guidelines on management and monitoring of water resources. The land policy gives guidance on proper land use practices, administration and development, while the agriculture policy calls for proper management of aqueous resources for irrigation. The country also has policies that govern mining and energy assets; most people in Rwanda are dependent on fuel-wood for their energy provision. The country also has laws that promote disclosure of the sources of funding that support environmental sustainability.
Ever though the country does not have specific laws concerning natural capital accounting, Rwanda has key strategies that focus on integrating these accounts into the overall economy such as National Biodiversity Strategy and Action Plan, Green Growth and Climate Resilience Strategy and Environment and Natural Resources Strategic Plan. In additional, as a signatory of the Gaborone Declaration, the country is mandated to undertake natural capital accounting and integrate it a part of national accounting system.
4.19.2. Focus of natural capital accounts
There are currently no standardized statistical frameworks that are used to capture natural capital information in Rwanda’s statistical system since the country is still in the process of developing local capacity. Nevertheless, the country keeps a number of inventories as listed below:
x Inventory and mapping of threatened remnant terrestrial ecosystems outside protected areas (2011);
x Inventory of biodiversity in critical wetlands (2011);
x Inventory of biodiversity in islands (2011–2012);
x Image-based inventory of forests (2012),
x Inventory of wetlands (2008);
x Inventory of lakes and rivers (2008);
x Land titling/database and administration system;
x Pilot Integrated Ecosystem Assessment of Bugesera (2007).
The country has not yet established the comprehensive economic evaluation of the status and value of its natural capital. However, an economic valuation of Ecosystem Services of
Page 125 of 144
Nyungwe (Forest) National Park has been done. Some important information gaps with regards to natural capital have be identified, such as water quantity and quality; equitable water use and monitoring of the effects of watershed management on water supply; mineral resource assets, and their depletion and contribution to economic development; contribution of forests to productivity and national wealth; monitoring of land use trends and analysis of trade-offs between different uses (notably between forestry, agriculture and mining activities) as well as analysis of future land use options; and other ecosystem services valuations. These gaps notwithstanding, Rwanda identified land degradation, land-use changes, deforestation, climate change and water pollution as the major threats to the status and economic value of natural capital.
Some critical lessons learned as the country is preparing to implement natural capital accounting are: the essential roles that good governance and political commitment plays; beneficial knowledge exchange from a country that has been through this process; and having a Ministry to own the process are pre-requisites for success.
4.19.3. Challenges and success stories
The three important challenges to the advancement and implementation of natural capital accounting in the country are: (1) insufficient expertise in environmental economics and natural capital accounting methodologies, (2) insufficient financial means for regular data collection to support natural capital accounts system and (3) identifying priorities for development (managing trade-offs) and ownership by all development sectors.
Besides these challenges, Rwanda has made significant strides in restoring forest cover and protection of bio-diversity. Having realized how forest cover and bio-diversity was reducing due to other competing land uses in 2006, Rwanda developed key performance indicators that were included in the first Economic Development and Poverty Reduction Strategy (EDPRS) (2008–2012). These indicators focused on increasing the area protected to maintain biological diversity, and increase forest cover, and on ensuring that these areas are prioritized in the national budgets. These targets were also incorporated in the national economic development and poverty reduction programs. These strategies helped improve forest cover from 20% to 24% while increasing bio-diversity from 8% to 10%. This can be compared against the fact that over 80% and 86% of the population rely on agriculture for their livelihood and using fuel-wood as their source of energy respectively. It is therefore a significant achievement considering Rwanda’s size and population density (445 inhabitants per sq. km).
Page 126 of 144
4.20. Senegal Key achievements: Various national laws on environmental protection lead the way for potential implementation of more natural capital based legislation Focus of natural capital accounts: Non-wood forest products; hunting; inland fishing.
4.20.1. Legal and Policy Frameworks for Natural Capital Accounting
Senegal is a party to the CBD and has developed a Senegal National Biodiversity Strategy Action Plan (NBSAP) and a 5th National Report of the State of Biodiversity. The NBSAP focuses on the following: conservation of biodiversity in high-density sites; the integration of the conservation of biodiversity in programs and activities related to production; and the education and awareness-raising of all stakeholders concerning the importance of biodiversity and the need to conserve its components. The NBSAP lists nine types of priority biodiversity sites, including national parks and reserves, marine and coastal ecosystems, and inland water ecosystems. Other priority sites include mangroves and many types of forests, notably sacred forests and woods.
In Senegal the main institutions concerned with collection, management and processing of information on the country’s natural capital are the Centre for Ecological Monitoring, the Senegalese Agricultural Research Institute and the National Agency of Meteorology.
The main framework used to collect information is the Supreme Council for Environment and Natural Resources. A permanent mechanism dedicated to the exchange of information on natural capital between state structures does not currently exist. During parliamentary sessions, members of parliament are, however, free to communicate with the relevant ministers on the state of natural capital.
A series of country-based pilot studies on ecosystem services assessment have been carried out under the Valuation and Accounting of Natural Capital for Green Economy program (2013).250 The studies test scientific findings by applying valuation and accounting methodologies. In Senegal this has been done through the Spanish Government sponsored Millennium Development Goals Achievement Fund Project for the Improvement and Valuation of Forest Ecosystems Services (PASEF).251 PASEF aims to reduce poverty through a better knowledge base on forest ecosystem services, including their economic values.
250See: <http://www.ese-valuation.org/index.php/ese-unit/vantage>. 251 See: <http://www.ese-valuation.org/index.php/ese-unit/42-project-for-the-improvement-and-valorization-of-forest-ecosystem-services-pasef/67-project-for-the-improvement-and-valorization-of-forest-ecosystem-services-pasef>.
Page 127 of 144
Senegal has also participated in the World Bank initiative ‘Sustaining Natural Capital (SNC) for Growth and Poverty Reduction in Sub-Saharan Africa’, which is funded by BNPP. The SNC capacity building program’s objective is to establish a critical mass of human resources, tools and approaches, and communication channels to build capacity in and implement the principles of sound and efficient environmental management. The output of the first 15 months of the program were discussed in a regional forum entitled ‘Nature, Wealth and Poverty Reduction in Africa’, which was hosted by Senegal in October 2007. One of the outcomes was the establishment of a Natural Capital Forum and the drafting of Sustaining Natural Capital principles for participating countries and how to implement these principles into Poverty reduction strategy papers. Senegal has also been involved in efforts under the United Nations Collaborative Programme on Reducing Emissions from Deforestation and Forest Degradation in Developing Countries.
At the national level, Senegal has identified a number of laws and policies that concern natural capital accounting, which include the Code on Hunting and Protection of Fauna (1986);252 the Forest Code;253 the Code of Marine Fisheries;254 the Water Code;255 the Mining Code256 and the National Wetlands Policy. The Code on Town Planning and Habitats257 requires economic values of natural capital to be considered during government decision-making. Given the country’s rich biodiversity, species, such as elephants, sea turtles, Derby élans, and bamboo benefit from being under strict protection.
4.20.2. Focus of Natural Capital Accounts
While it is acknowledged that there is no existing system in place for providing accurate data on the status and trends of natural capital in Senegal, the country has done preliminary economic assessments of some natural resources. These assessments have focused on non-wood forest products; hunting; and inland fishing. The annual value added from these natural resources is estimated at around 14 billion CFA Franc, with a maximum estimated value of over 25 billion CFA Franc (USD 19–35 million) per year.
252 Ministere de L’environnement et de la Protection de la Nature: Direction des Eaux, Forests, Chasses et de la conservation des sol (1986) Loi No. 86-04 ; Decret No. 86-844, Code de la Chasse et de la Protection de la Faune, <http://www.environnement.gouv.sn/IMG/pdf/code-chasse.pdf>. 253 Ministere de L’environnement et de la Protection de la Nature: Direction des Eaux, Forests, Chasses et de la conservation des sol (1998) Loi No. 98/03, Decret No. 98/164, Code Forestier, <http://www.environnement.gouv.sn/IMG/pdf/code-forestier-2.pdf>. 254 Code de la Peche Maritime (1998), Loi no. 98-32, <http://www.droit-afrique.com/images/textes/Senegal/Senegal%20-%20Code%20peche%20maritime.pdf. 255 Code de L’eau (1981) Loi No. 81-13, <http://www.droit-afrique.com/images/textes/Senegal/Senegal%20-%20Code%20de%20l%20eau.pdf>. 256 Gouvernement du Senegal (2003) Loi no. 2003-36 portant Code Minier, <http://www.gouv.sn/Code-minier.html> 257 Ministere de l’Urbanisme, de l’Habitat, de la Construction et de l’Hydraulique (2010) Decret No. 2009-1450 portant partie reglementaire du Code de l’Urbanisme, <http://www.jo.gouv.sn/spip.php?article7995>.
Page 128 of 144
4.20.3. Challenges and Success Stories
Senegal is currently in the process of developing a draft law regarding the coastline, which the country considers a great success. Stakeholder meetings and consultations held in seven coastal regions have allowed for greater participation and consensus building.
At present, Senegal’s wild fauna can only be found in national parks and reserves such as the The Niokolo Koba National Park. In total, 10% of the country’s territory is currently under protection. The Senegal River Delta, another highly interesting site with respect to biodiversity, is the only ecosystem affected by invasive alien species issues. In addition, mangroves, niayes, and the Djoudj area are of particular interest because of their important biodiversity, ecological role and fragility. Senegal comprises 2,500 species of flower plants. Insects account for the greatest number of animals with 2,000 species, followed by molluscs, which, combined with fish species, amount to more than 1,000 in variety. This illustrates the significance of a marine biodiversity that remains largely unknown.
Senegal identifies the management of protected areas; conservation and land management; and the management of natural resources as important challenges to the advancement and implementation of natural capital accounting in the country. Further environmental challenges identified include droughts; rising temperatures; floods; coastal erosion; winds and bushfires.
Page 129 of 144
4.21. United Kingdom Key achievements: Developing natural capital accounts that include top down accounts; enabling cross-cutting accounts and habitat accounts
Focus of natural capital accounts: Air; energy and material flows including oil and gas; forestry; land cover/type (habitat); fish.
4.21.1. Legal and policy framework for natural capital accounting
The United Kingdom is a party to the CBD and a supporter of the Rio+20 Natural Capital Communiqué. The UK is also currently developing natural capital accounts in conjunction with its international commitments, including regulations on natural capital accounting and the EU 2020 Biodiversity Strategy. The devolved nations have each developed their own strategies to respond to the Nagoya Agreement and the Aichi Targets, as outlined in the UK Post-2010 Biodiversity Framework.258 To date, the UK has met its commitments to the CBD new Strategic Plan for Biodiversity 2011–2020,259 including the production of a National Biodiversity Strategy and Action Plan.
Since the late 1990s, the UK Office for National Statistics (ONS) has regularly published national Environmental Accounts. These satellite accounts are extensions to the National Accounts and facilitate analysis of the wider impact of economic change. The Environmental Accounts are based on data from a variety of sources, including the National Atmospheric Emissions Inventory (air and accounts), the UK Greenhouse Gas Inventory (air and energy accounts), the Department for Environment, Food and Rural Affairs (DEFRA) (environmental protection expenditure, water and waste accounts), the Joint Nature Conservation Committee (nature conservation), and the Forestry Commission (forestry).
Prior to the UN–SEEA 2012, these accounts were compiled in accordance with the 2003 Handbook of National Accounting SEEA.260 The accounts measure what impacts the economy has on the environment, and how the environment contributes to the economy. They are used to inform policy and to evaluate the impacts of fiscal or monetary measures on the environment and the impact of changes in the environment on different sectors of
258 JNCC and DEFRA (on behalf of the Four Countries’ Biodiversity Group) (2012) UK Post-2010 Biodiversity Framework. (July 2012), <http://jncc.defra.gov.uk/page-6189>. 259 CBD (2010) Strategic Plan for Biodiversity 2011–2020 and the Aichi Biodiversity Targets, Convention on Biological Diversity, Tenth Conference of the Parties: Nagoya, Japan. (October 2010). 260 SEEA (2003) Handbook of National Accounting: Integrated Environmental and Economic Accounting 2003, System of Environmental-Economic Accounting. United Nations Statistical Division, <http://unstats.un.org/unsd/envaccounting/seea2003.pdf>. ONS (2012) UK Environmental Accounts 2012, UK Office for National Statistics. (27 June 2012), <http://www.ons.gov.uk/ons/dcp171778_267211.pdf.2020>.
Page 130 of 144
the economy. Most data are provided in physical units, although where it is the only available or most relevant measure, monetary units are used.
The ONS published a roadmap in 2012261 that outlines plans to develop UK natural capital accounts and a number of initial accounts were published in June 2013. In June 2013, the ONS published the monetary estimates for UK Continental Shelf Oil & Gas reserves and experimental statistics on monetary estimates on UK timber resources. The ONS will be publishing the initial estimates of UK natural capital in economic terms in April 2014.
The Natural Environment White Paper, The Natural Choice: Securing the Value of Nature (NEWP), initially published by DEFRA in 2011 is intended to outline the government’s vision for the natural environment over the next 50 years and the actions that will be taken to deliver it. It states that it is essential to properly value the economic and social benefits of a healthy natural environment while continuing to recognize nature’s intrinsic value to enhance the environment, economic growth and personal wellbeing. The creation of the Natural Capital Committee was also announced along with the intention to include natural capital within the UK Environmental Accounts. Support for the creation of new markets for green goods and services was also included. The NEWP applies only to England as Northern Ireland, Scotland and Wales have yet to legislate specifically on natural capital, which is an area of devolved responsibility.
Biodiversity is recognized as a key component of natural capital in the UK. The Four Countries’ Biodiversity Group is the lead governance body for the UK Biodiversity Framework. This group provides a forum for policy development issues common to all four countries of the UK in order to respond effectively to UK commitments made at Nagoya in 2010, and to meet other EU and international biodiversity targets.
Legislation regarding biodiversity is devolved within the UK. England’s biodiversity strategy, entitled Biodiversity 2020: A Strategy for England’s Wildlife and Ecosystem Services, was published in 2011.262 It builds on the NEWP, stressing that nature is often under-valued in decision-making and that many ecosystem services are in decline. In order to address this, it strives to ensure that the value of biodiversity is reflected in decision making in the public and private sector including through the development of new financing mechanisms to direct more funding towards protecting or improving biodiversity. An outcome-focused set of indicators is annually published by DEFRA in order to assess the progress of the strategy on biodiversity. 263
261 ONS (2012) Accounting for the Value of Nature in the UK: A Roadmap for the Development of Natural Capital Accounts within the UK Environmental Accounts. Office for National Statistics, (December 2012). 262 DEFRA (2011) Biodiversity 2020: A Strategy for England’s Wildlife and Ecosystem Services, Department for Environment, Food and Rural Affairs. 19 August 2011, <http://www.defra.gov.uk/publications/files/pb13583-biodiversity-strategy-2020-111111.pdf>. 263 DEFRA (2013) England Natural Environment Indicators, <https://www.gov.uk/government/uploads/system/uploads/attachment_data/file/194720/England_Natural_Environment_Indicators.pdf>.
Page 131 of 144
The Natural Capital Committee was created following the NEWP. It reports to the Economic Affairs Committee and provides independent, expert advice on the state of English natural capital.264 It aims to ensure that Government has a better informed understanding of the value of natural capital, and assists it to prioritize actions to support and improve the UK’s natural assets.
The Northern Ireland Environment Agency (NIEA) is an executive department within the Department for the Environment. The NIEA Strategic Priorities265 recognize the importance of valuing natural capital. The Valuing Our Environment report266 recognizes the, as yet, uncalculated economic value of ecosystem services in Northern Ireland. However, in 2008, the Northern Ireland Department of the Environment published its first State of the Environment Report267, providing baseline indicators for various environmental measures, including indicators for air and climate, water, land, biodiversity, waste and other resources.
Scotland’s Biodiversity Strategy268 was updated in 2013, recognizing that biodiversity impacts the prosperity of Scotland in that it supports the tourism, farming, forestry, aquaculture, and fishing industries, and the marketing of food and drink, as well as attracting investment. The 2020 Challenge is Scotland’s response to the Aichi Targets set by the CBD and the European Union’s Biodiversity Strategy for 2020, calling for a step change in efforts to halt the loss of biodiversity and to restore ecosystem services.269 Scotland’s first land use strategy was launched in 2011270 and included ten principles for Sustainable Land Use to reflect government policies. This land use strategy was followed by the Land Use Strategy Action Plan, which includes aims to investigate the relationship between land management changes and ecosystem processes.271
264 Natural Capital Committee (2014) The State of Natural Capital: Restoring our Natural Assets, Second report to the Economic Affairs Committee, <http://nebula.wsimg.com/b34b945ccada11d4e11a23441245d600?AccessKeyId=68F83A8E994328D64D3D&disposition=0&alloworigin=1>. 265 NIEA (2012) NIEA Strategic Priorities 2012–2020: Our Passion, Our Place. Northern Ireland Environment Agency, (July 2012). 266 Environment & Heritage Service (2007) Valuing Our Environment: The Economic Impact of the Environment in Northern Ireland, Commission by the Northern Ireland Green NGOs and the Environment & Heritage Service of Northern Ireland. April 2007 <http://www.doeni.gov.uk/niea/valuing_our_environment_summary_report.pdf>. 267 Environment & Heritage Service (2008) Our Environment, Our Heritage, Our Future: State of the Environment Report for Northern Ireland, Department of the Environment. (March 2008) <http://www.doeni.gov.uk/niea/stateoftheenvironmentreportfornorthernirelandsummarydocument.pdf>. 268 Scottish Executive (2004) Scotland’s Biodiversity – It’s In Your Hands: A Strategy for the Conservation and Enhancement of Biodiversity in Scotland. 269 Challenge for Scotland’s Biodiversity, <http://www.scotland.gov.uk/Resource/0042/00425276.pdf>. 270 Natural Scotland (2011) Getting the Best from our Land: A Land Use Strategy for Scotland, Scottish Government. March 2011, <http://www.scotland.gov.uk/Resource/Doc/345946/0115155.pdf>. 271 Natural Scotland (2011) Getting the Best from Our Land: A Land Use Strategy for Scotland – Action Plan. Edinburgh, Scotland: The Scottish Government, December 2011, <http://www.scotland.gov.uk/Resource/Doc/365706/0124378.pdf>.
Page 132 of 144
Scotland developed and published its Natural Capital Asset (NCA) Index in 2010.272 This index is a detailed effort to measure annual changes in its natural capital based on an evaluation of ecosystem service potential. This data was not based on accounting frameworks, but on an index derived from ecosystem area multiplied by ecosystem quality. The findings suggest that Scotland’s natural capital fell significantly from the 1950s to the 1990s, but has seen a slow partial recovery since then, marking a shift towards sustainability.
The Welsh government published a State of the Environment Report in 2010 outlining progress on 102 State of the Environment Indicators.273 In 2011, the Welsh Government brought together the Natural Environment Framework and the Single Environment Body into a combined program, known as Living Wales. In January 2012, the Green Paper, Sustaining a Living Wales, was launched to outline the proposed changes.274 The proposed framework moves to an ecosystem approach. Current work includes improving the understanding of ecosystems and their services and how they are valued, in order to inform current policies and future decision-making.
In 2010, the Government Economic Service Review of the Economics of Sustainable Development recommended that a natural asset check should be investigated for use in the appraisal of public policy options and their potential impact on the stock of specific environmental assets.275 The UK government also began building on an action plan laying out a strategic approach to embed ecosystem services into policy-related decision making.276, 277 This included a framework for payments for ecosystem services (PES) and an Ecosystem Markets Task Force. The following year, the UK National Ecosystem Assessment (NEA) was released278 on the recommendation of the House of Commons Environmental Audit.279, 280 The NEA provided the first national, independent, and peer-reviewed assessment of the state and value of the UK’s natural environment and
272 Scottish Natural Heritage (2012) Scotland’s Natural Capital Asset (NCA) Index, <http://www.snh.gov.uk/docs/B814140.pdf>. 273 National Statistics for Wales (2010) State of the Environment, Statistical Bulletin. 274 Welsh Government (2012) Consultation Document: Sustaining a Living Wales: A Green Paper on a New Approach to Natural Resource Management in Wales, WG13943. Date of issue: 30 January 2012. 275 Price, R., C. Durham and J. Chan (2010) Government Economic Service Review of the Economics of Sustainable Development. London: Government Economic Service and Department for Environment, Food and Rural Affairs. July 2010, <http://archive.defra.gov.uk/evidence/economics/susdev/documents/esd-review-report.pdf>. 276 DEFRA (2010) Delivering a Healthy Natural Environment: An Update to ‘Securing a Healthy Natural Environment: An Action Plan for Embedding an Ecosystems Approach’. London: Department for Food, Environment and Rural Affairs (UK), <http://archive.defra.gov.uk/environment/policy/natural-environ/documents/healthy-nat-environ.PDF>. 277 DEFRA (2007) Securing a Healthy Natural Environment: An Action Plan for Embedding an Ecosystems Approach. London: Department for Environment, Food and Rural Affairs (UK). 278 UK National Ecosystem Assessment (2011) The UK National Ecosystem Assessment: Synthesis of the Key Findings. Cambridge, UK: UNEP-WCMC, <http://uknea.unep-wcmc.org/Resources/tabid/82/Default.aspx>. 279 House of Commons Environmental Audit Committee (2006) The UN Millennium Ecosystem Assessment, <http://www.publications.parliament.uk/pa/cm200607/cmselect/cmenvaud/77/77.pdf>. 280 House of Commons Environmental Audit Committee (2007) Government Response to the Committee’s First Report of Session 2006-0: The UN Millennium Ecosystem Assessment.
Page 133 of 144
ecosystem services in terms of the benefits it brings to society and future economic prosperity.
A UK natural capital asset check scoping study,281 was published in 2012,282 giving a working definition of a natural capital asset check. The UK NEA follow-on project Working Package 1 ‘Natural Capital Asset Check’ laid out a first elaborated version of the asset check that continues to be developed by the UK NEA follow-on project.
Following the 2011 NEWP,283 the business-led Ecosystem Markets Task Force was launched and charged with reviewing opportunities for UK businesses to ‘drive green growth.’ Their Interim Report was published in 2012284 and the final report in 2013,285 making recommendations to government and business on where interventions would assist in the creation and development of new markets, enhancing opportunities for growth that also benefit the environment. One of the studies commissioned by the Task Force used the UK NEA evidence in assessing business-related ecosystem market opportunities in the UK.286 This identified eight main ‘types’ of business opportunity based on nature’s services, namely (1) product markets, (2) offsetting, (3) Payments for Ecosystem Services (PES), (4) environmental technology, (5) markets for cultural services, (6) financial and legal services, (7) ecosystem knowledge economy and (8) corporate ecosystem initiatives. Following these recommendations, DEFRA published a number of reports providing an analytical background, evidence base, and best-practice guide on PES.
In February 2012, DEFRA and HM Treasury published a supplementary guidance to HM Treasury’s Green Book on valuing the natural environment. This guidance provides recommendations on the use of the ecosystem services framework to ensure that the full range of environmental impacts is considered in policy appraisal by all government departments.287
281 Defined as an assessment of the current and future performance of natural capital assets, with performance measured in terms of their ability to support human well-being. HM Government (2011) The Natural Choice: Securing the Value of Nature, F.a.R.A. Department of Environment, Editor, Presented to UK Parliament by the Secretary of State for Environment, Food and Rural Affairs CM8082, <http://www.defra.gov.uk/environment/natural/whitepaper/>. 282 Dickie, I., et al. (2012) Scoping Study to Develop Understanding of a Natural Capital Asset Check: Revised Final Report for DEFRA. London: EFTEC, Fabis Consulting & CEH, <http://nora.nerc.ac.uk/21296/1/N021296CR.pdf>. 283 DEFRA (2011) The Natural Choice: Securing the Value of Nature, Presented to Parliament by the Secretary of State for Environment, Food and Rural Affairs CM8082. <http://www.defra.gov.uk/environment/natural/whitepaper/>. 284 Ecosystem Markets Task Force (2012) Interim Report, <http://www.defra.gov.uk/ecosystem-markets/files/Ecosystem-Markets-Task-Force-Interim-Report.pdf>. 285 Ecosystem Markets Task Force (2013) Realising Nature’s Value: The Final Report of the Ecosystem Markets Task Force. March 2013, http://www.defra.gov.uk/ecosystem-markets/files/Ecosystem-Markets-Task-Force-Final-Report.pdf. 286 Duke, G., et al. (2012) Opportunities for UK Business that Value and/or Protect Nature’s Services: Elaboration of Proposals for Potential Business Opportunities. Attachment 1 to final report to the Ecosystem Markets Task Force and Valuing Nature Network. London: GHK. 287 HM Tresury-DEFRA (2012), Accounting for environmental impacts: Supplementary Green Book guidance, <https://www.gov.uk/government/uploads/system/uploads/attachment_data/file/191500/Accounting_for_enviornomental_impacts.pdf>.
Page 134 of 144
4.21.2. Focus of natural capital accounts
The UK Environmental Accounts include a number of physical flow and natural resource asset accounts. These accounts are relevant to the development of natural capital accounts but the accounts are not currently aligned with ecosystem accounting and do not provide a fully integrated account of the stocks and flows. The most recent UK Environmental Accounts were released in 2012,288 following some methodological changes in 2011.289 The UK Environmental Accounts include physical flow accounts covering: atmospheric emissions, energy use, material flow, waste, water use, natural resources, land use and cover, and fish stocks. These accounts also include monetary accounts that detail information on government revenue from environmental taxes, and a breakdown of environmental protection expenditure by General Government and Industry.
In November 2011, ONS published a paper ‘Towards a Sustainable Environment – UK Natural Capital and Ecosystem Economic Accounting’290 to outline its approach for including natural capital in the Asset Accounts. The ONS prioritized the delivery of the UN–SEEA Central Framework for physical and monetary accounts during the development of this pilot study focusing on woodlands and including: a forestry physical asset account, a provisioning services capacity – timber resources asset account, a monetary valuation for timber resources, an assessment of cultural and regulatory services (non-monetary flow accounts) for woodlands, a monetary valuation of cultural, regulatory and other provisioning services and a woodlands monetary asset account based on provisioning, cultural and regulatory services.
Following the NEWP commitments, in December 2012 the ONS released ‘Accounting for the value of nature, a roadmap on the development of natural capital accounts within the UK Environmental Accounts’.291 This outlined key proposals for the production of natural capital accounts over the period of 2013–2015 to include: top-down accounts for improving natural capital estimates within the framework of comprehensive wealth accounts and to provide an overview of the value of natural capital within the UK, cross-cutting accounts to provide a framework for the development of specific habitat accounts and cross-cutting carbon accounts, habitat-based accounts, enclosed farmland accounts, wetlands ecosystems accounts, and initial marine ecosystem accounts.
288 ONS (2012) UK Environmental Accounts, 2012, UK Office for National Statistics. (27 June 2012). <http://www.ons.gov.uk/ons/dcp171778_267211.pdf.2020>. 289 Livesey, D. (2011) Methodological Developments to the UK Environmental Accounts, Office for National Statistics. May 2011, <http://www.ons.gov.uk/ons/rel/environmental/environmental-accounts/methodological-developments-to-the-uk-environmental-accounts/methodological-developments-to-the-uk-environmental-accounts-article.pdf>. 290 Khan, J. (2011) Towards a Sustainable Environment: UK Natural Capital and Ecosystem Economic Accounting, Measuring National Well-being. Office for National Statistics, <http://www.ons.gov.uk/ons/rel/environmental/uk-environmental-accounts/2011---blue-book-update/artnaturalcapital.html>. 291 ONS (2012) Accounting for the Value of Nature in the UK: A Roadmap for the Development of Natural Capital Accounts within the UK Environmental Accounts. Office for National Statistics, (December 2012).
Page 135 of 144
4.21.3. Challenges and Success Stories
The UK is the third largest economy in Europe after Germany and France. Enclosed farmland accounts for around 40% of the UK land area – the most extensive form of land use.292 The UK has large but declining coal, natural gas and oil resources. Though not considered to be exceptionally rich in biodiversity at a global scale, there is still a wide range of species including 1,500 native higher plants, and over 200 breeding bird species.
The UK NEA identified the primary drivers of change to UK ecosystem services over the last 60 years as habitat change, overexploitation, pollution, climate change and invasive species. It concludes that, over the last 60 years, ecosystem services with a market value such as timber and the production of food from agriculture, have dramatically increased. Conversely, other ecosystem services, particularly those related to air, water and soil quality, have declined. Others are in a reduced or degraded state, including marine fisheries, wild species diversity and some of the services provided by soils. The reduction in soil quality across all habitat types is of particular concern as are continuing decreases in biodiversity, especially the variety and abundance of pollinators. While some drivers of change, such as air and aquatic pollution, have had previously large impacts on ecosystems services, recent legislation has gone some way to limit the impacts of the drivers in the last few years. In contrast, drivers such as climate change have had a lower impact on ecosystem services over the last 60 years, but are expected to have a greater impact in the future.
Box 14 – Osprey reintroduction project: United Kingdom
It is generally considered that Ospreys (a bird species) were absent from the UK from 1916. However, in 1954 they very slowly started to re-colonize naturally, and a reintroduction project in the 1990s brought the numbers up to an estimated 250-300 nesting pairs in 2011. This has resulted in significant local economic and recreational benefits, with an estimated 290,000 people visiting osprey nesting sites every year. Visitors bring in around £3.5 million per year to local areas resulting in increases in local incomes and employment.
Box 15 – Peatland restoration: United Kingdom
In England, an estimated 10% (3,800 ha) of the original area of lowland bogs remain. In Northwest England, United Utilities and the Royal Society for Protection of Birds are working towards peatland restoration, to improve local drinking water quality in microbiology and water color, and to help prevent soil erosion. The value of these benefits has been estimated at between €1.8 million and €3.6 million per year – a total discounted benefit of between €5.5 million and €12 million.293
292 UK National Ecosystem Assessment (2011) The UK National Ecosystem Assessment: Synthesis of the Key Findings. Cambridge, UK: UNEP-WCMC, <http://uknea.unep-wcmc.org/Resources/tabid/82/Default.aspx>. 293 Kettunen, M., and P. ten Brink (2006) Value of Biodiversity – Documenting EU Examples Where Biodiversity Loss Has Led to the Loss of Ecosystem Services: Final Report for the European Commission. Brussels, Belgium: Institute for European Environmental Policy (IEEP), <http://ieep.org.uk/assets/284/Value_of_biodiversity-June_06.pdf>.
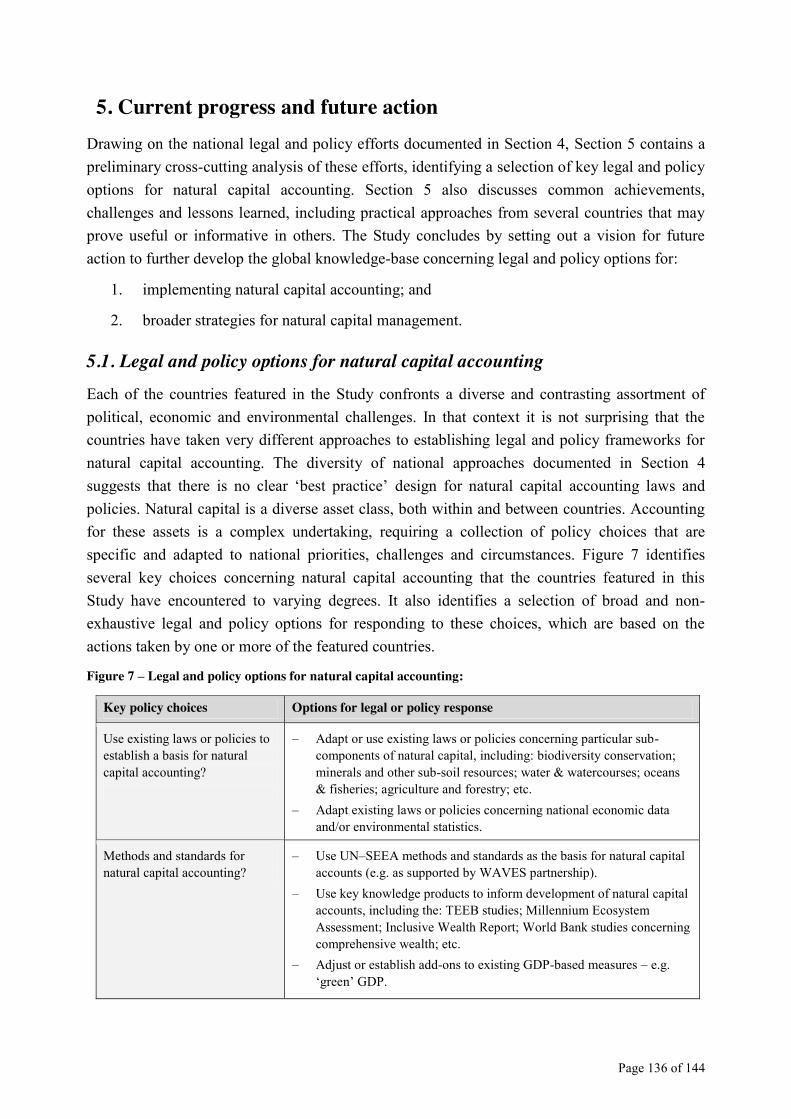
Page 136 of 144
5. Current progress and future action Drawing on the national legal and policy efforts documented in Section 4, Section 5 contains a preliminary cross-cutting analysis of these efforts, identifying a selection of key legal and policy options for natural capital accounting. Section 5 also discusses common achievements, challenges and lessons learned, including practical approaches from several countries that may prove useful or informative in others. The Study concludes by setting out a vision for future action to further develop the global knowledge-base concerning legal and policy options for:
1. implementing natural capital accounting; and
2. broader strategies for natural capital management.
5.1. Legal and policy options for natural capital accounting Each of the countries featured in the Study confronts a diverse and contrasting assortment of political, economic and environmental challenges. In that context it is not surprising that the countries have taken very different approaches to establishing legal and policy frameworks for natural capital accounting. The diversity of national approaches documented in Section 4 suggests that there is no clear ‘best practice’ design for natural capital accounting laws and policies. Natural capital is a diverse asset class, both within and between countries. Accounting for these assets is a complex undertaking, requiring a collection of policy choices that are specific and adapted to national priorities, challenges and circumstances. Figure 7 identifies several key choices concerning natural capital accounting that the countries featured in this Study have encountered to varying degrees. It also identifies a selection of broad and non-exhaustive legal and policy options for responding to these choices, which are based on the actions taken by one or more of the featured countries.
Figure 7 – Legal and policy options for natural capital accounting:
Key policy choices Options for legal or policy response
Use existing laws or policies to establish a basis for natural capital accounting?
– Adapt or use existing laws or policies concerning particular sub-components of natural capital, including: biodiversity conservation; minerals and other sub-soil resources; water & watercourses; oceans & fisheries; agriculture and forestry; etc.
– Adapt existing laws or policies concerning national economic data and/or environmental statistics.
Methods and standards for natural capital accounting?
– Use UN–SEEA methods and standards as the basis for natural capital accounts (e.g. as supported by WAVES partnership).
– Use key knowledge products to inform development of natural capital accounts, including the: TEEB studies; Millennium Ecosystem Assessment; Inclusive Wealth Report; World Bank studies concerning comprehensive wealth; etc.
– Adjust or establish add-ons to existing GDP-based measures – e.g. ‘green’ GDP.
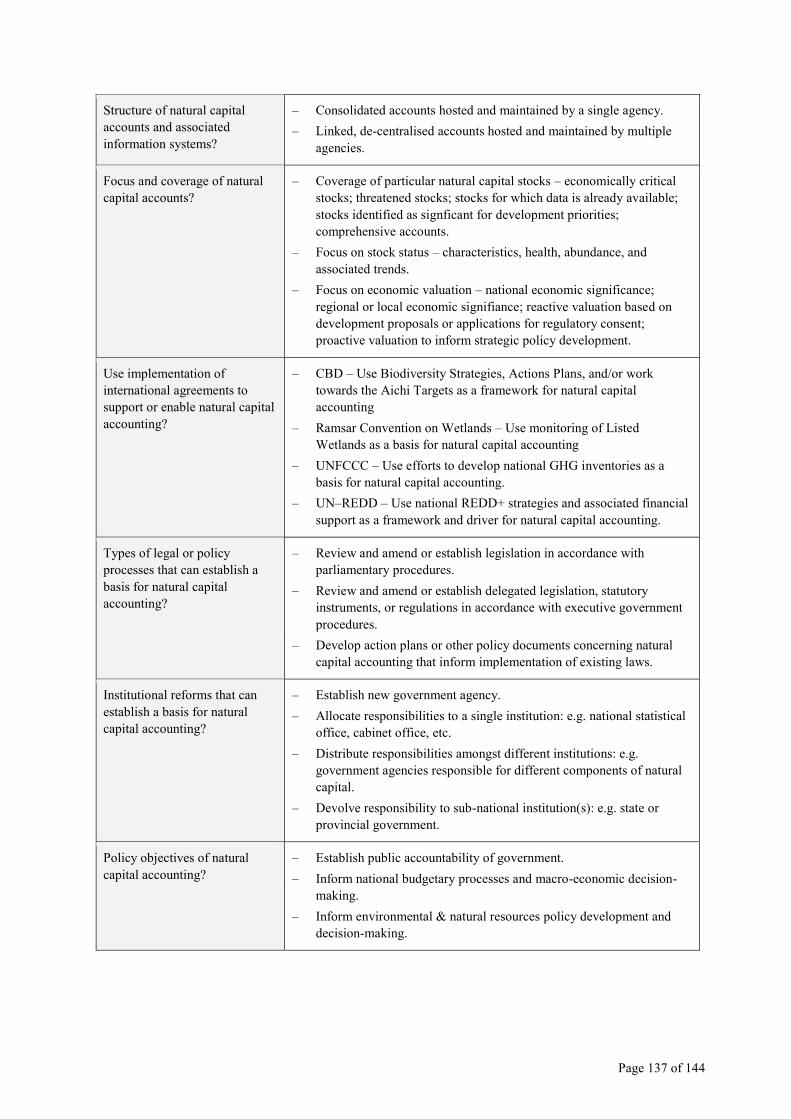
Page 137 of 144
Structure of natural capital accounts and associated information systems?
– Consolidated accounts hosted and maintained by a single agency. – Linked, de-centralised accounts hosted and maintained by multiple
agencies.
Focus and coverage of natural capital accounts?
– Coverage of particular natural capital stocks – economically critical stocks; threatened stocks; stocks for which data is already available; stocks identified as signficant for development priorities; comprehensive accounts.
– Focus on stock status – characteristics, health, abundance, and associated trends.
– Focus on economic valuation – national economic significance; regional or local economic signifiance; reactive valuation based on development proposals or applications for regulatory consent; proactive valuation to inform strategic policy development.
Use implementation of international agreements to support or enable natural capital accounting?
– CBD – Use Biodiversity Strategies, Actions Plans, and/or work towards the Aichi Targets as a framework for natural capital accounting
– Ramsar Convention on Wetlands – Use monitoring of Listed Wetlands as a basis for natural capital accounting
– UNFCCC – Use efforts to develop national GHG inventories as a basis for natural capital accounting.
– UN–REDD – Use national REDD+ strategies and associated financial support as a framework and driver for natural capital accounting.
Types of legal or policy processes that can establish a basis for natural capital accounting?
– Review and amend or establish legislation in accordance with parliamentary procedures.
– Review and amend or establish delegated legislation, statutory instruments, or regulations in accordance with executive government procedures.
– Develop action plans or other policy documents concerning natural capital accounting that inform implementation of existing laws.
Institutional reforms that can establish a basis for natural capital accounting?
– Establish new government agency. – Allocate responsibilities to a single institution: e.g. national statistical
office, cabinet office, etc. – Distribute responsibilities amongst different institutions: e.g.
government agencies responsible for different components of natural capital.
– Devolve responsibility to sub-national institution(s): e.g. state or provincial government.
Policy objectives of natural capital accounting?
– Establish public accountability of government. – Inform national budgetary processes and macro-economic decision-
making. – Inform environmental & natural resources policy development and
decision-making.
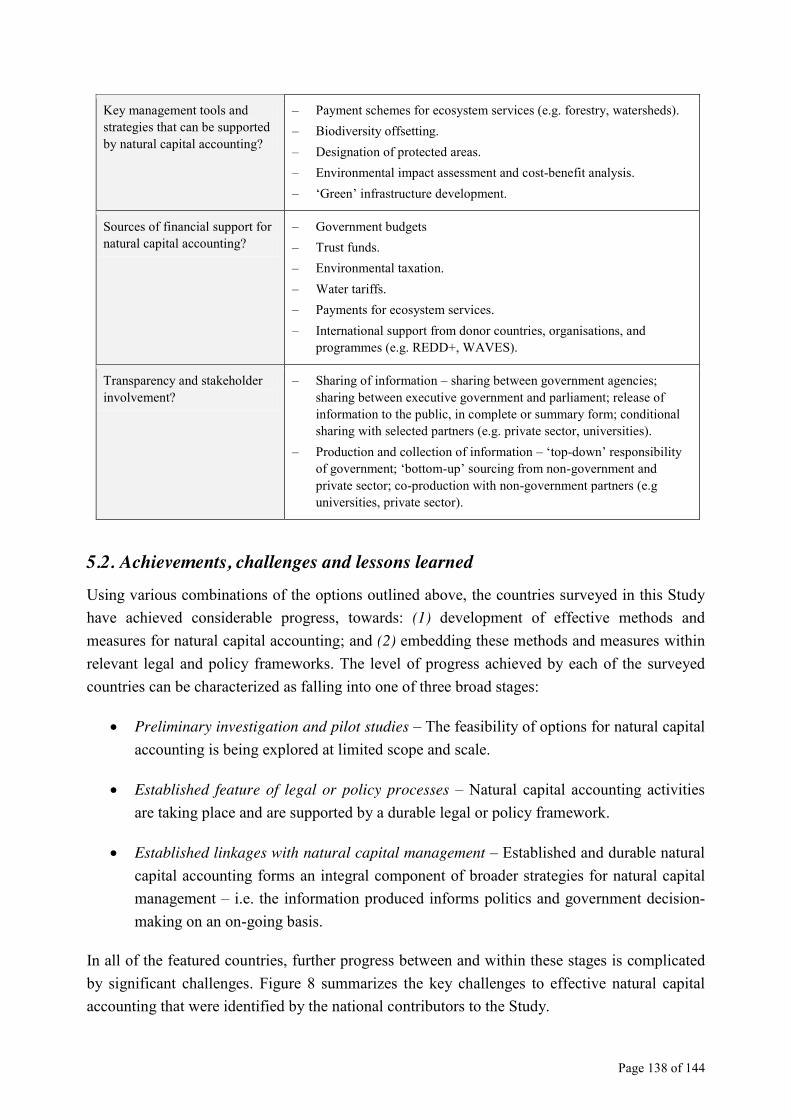
Page 138 of 144
Key management tools and strategies that can be supported by natural capital accounting?
– Payment schemes for ecosystem services (e.g. forestry, watersheds). – Biodiversity offsetting. – Designation of protected areas. – Environmental impact assessment and cost-benefit analysis. – ‘Green’ infrastructure development.
Sources of financial support for natural capital accounting?
– Government budgets – Trust funds. – Environmental taxation. – Water tariffs. – Payments for ecosystem services. – International support from donor countries, organisations, and
programmes (e.g. REDD+, WAVES).
Transparency and stakeholder involvement?
– Sharing of information – sharing between government agencies; sharing between executive government and parliament; release of information to the public, in complete or summary form; conditional sharing with selected partners (e.g. private sector, universities).
– Production and collection of information – ‘top-down’ responsibility of government;; ‘bottom-up’ sourcing from non-government and private sector; co-production with non-government partners (e.g universities, private sector).
5.2. Achievements, challenges and lessons learned Using various combinations of the options outlined above, the countries surveyed in this Study have achieved considerable progress, towards: (1) development of effective methods and measures for natural capital accounting; and (2) embedding these methods and measures within relevant legal and policy frameworks. The level of progress achieved by each of the surveyed countries can be characterized as falling into one of three broad stages:
x Preliminary investigation and pilot studies – The feasibility of options for natural capital accounting is being explored at limited scope and scale.
x Established feature of legal or policy processes – Natural capital accounting activities are taking place and are supported by a durable legal or policy framework.
x Established linkages with natural capital management – Established and durable natural capital accounting forms an integral component of broader strategies for natural capital management – i.e. the information produced informs politics and government decision-making on an on-going basis.
In all of the featured countries, further progress between and within these stages is complicated by significant challenges. Figure 8 summarizes the key challenges to effective natural capital accounting that were identified by the national contributors to the Study.
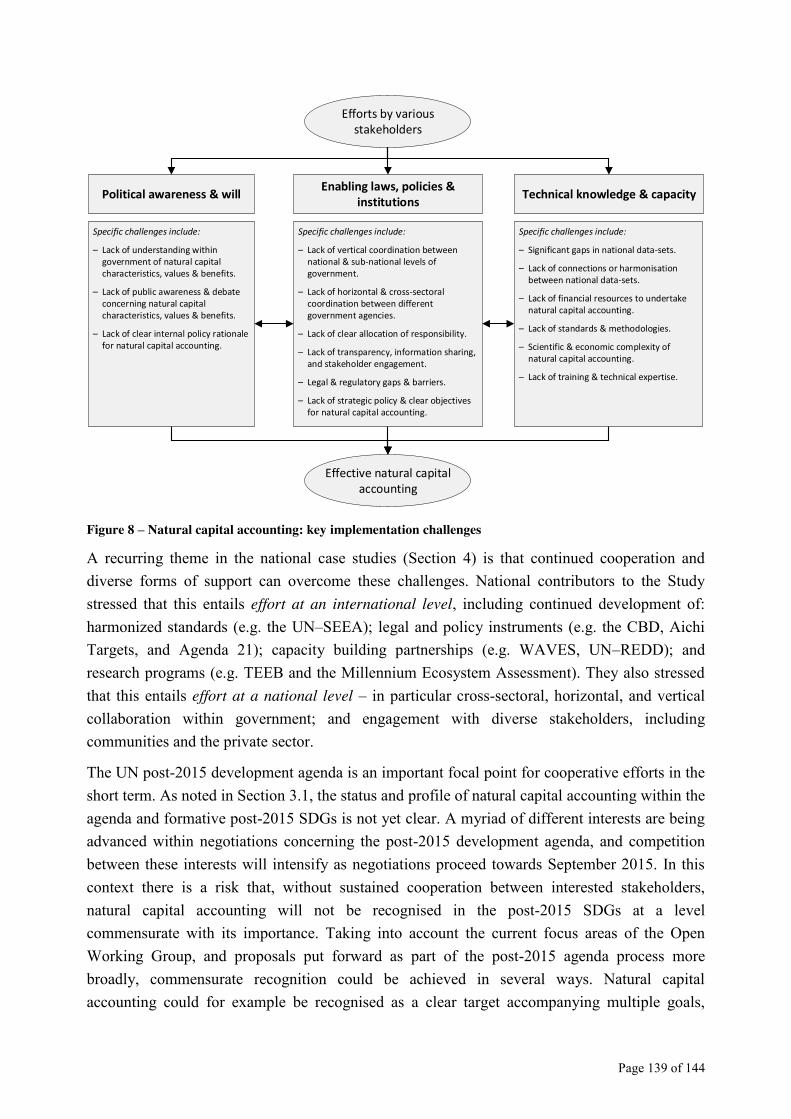
Page 139 of 144
Figure 8 – Natural capital accounting: key implementation challenges
A recurring theme in the national case studies (Section 4) is that continued cooperation and diverse forms of support can overcome these challenges. National contributors to the Study stressed that this entails effort at an international level, including continued development of: harmonized standards (e.g. the UN–SEEA); legal and policy instruments (e.g. the CBD, Aichi Targets, and Agenda 21); capacity building partnerships (e.g. WAVES, UN–REDD); and research programs (e.g. TEEB and the Millennium Ecosystem Assessment). They also stressed that this entails effort at a national level – in particular cross-sectoral, horizontal, and vertical collaboration within government; and engagement with diverse stakeholders, including communities and the private sector.
The UN post-2015 development agenda is an important focal point for cooperative efforts in the short term. As noted in Section 3.1, the status and profile of natural capital accounting within the agenda and formative post-2015 SDGs is not yet clear. A myriad of different interests are being advanced within negotiations concerning the post-2015 development agenda, and competition between these interests will intensify as negotiations proceed towards September 2015. In this context there is a risk that, without sustained cooperation between interested stakeholders, natural capital accounting will not be recognised in the post-2015 SDGs at a level commensurate with its importance. Taking into account the current focus areas of the Open Working Group, and proposals put forward as part of the post-2015 agenda process more broadly, commensurate recognition could be achieved in several ways. Natural capital accounting could for example be recognised as a clear target accompanying multiple goals,
Political awareness & will Technical knowledge & capacityEnabling laws, policies &
institutions
Specific challenges include:
– Lack of understanding within government of natural capital characteristics, values & benefits.
– Lack of public awareness & debate concerning natural capital characteristics, values & benefits.
– Lack of clear internal policy rationale for natural capital accounting.
Specific challenges include:
– Lack of vertical coordination between national & sub-national levels of government.
– Lack of horizontal & cross-sectoral coordination between different government agencies.
– Lack of clear allocation of responsibility.
– Lack of transparency, information sharing, and stakeholder engagement.
– Legal & regulatory gaps & barriers.
– Lack of strategic policy & clear objectives for natural capital accounting.
Specific challenges include:
– Significant gaps in national data-sets.
– Lack of connections or harmonisation between national data-sets.
– Lack of financial resources to undertake natural capital accounting.
– Lack of standards & methodologies.
– Scientific & economic complexity of natural capital accounting.
– Lack of training & technical expertise.
Efforts by various stakeholders
Effective natural capital accounting
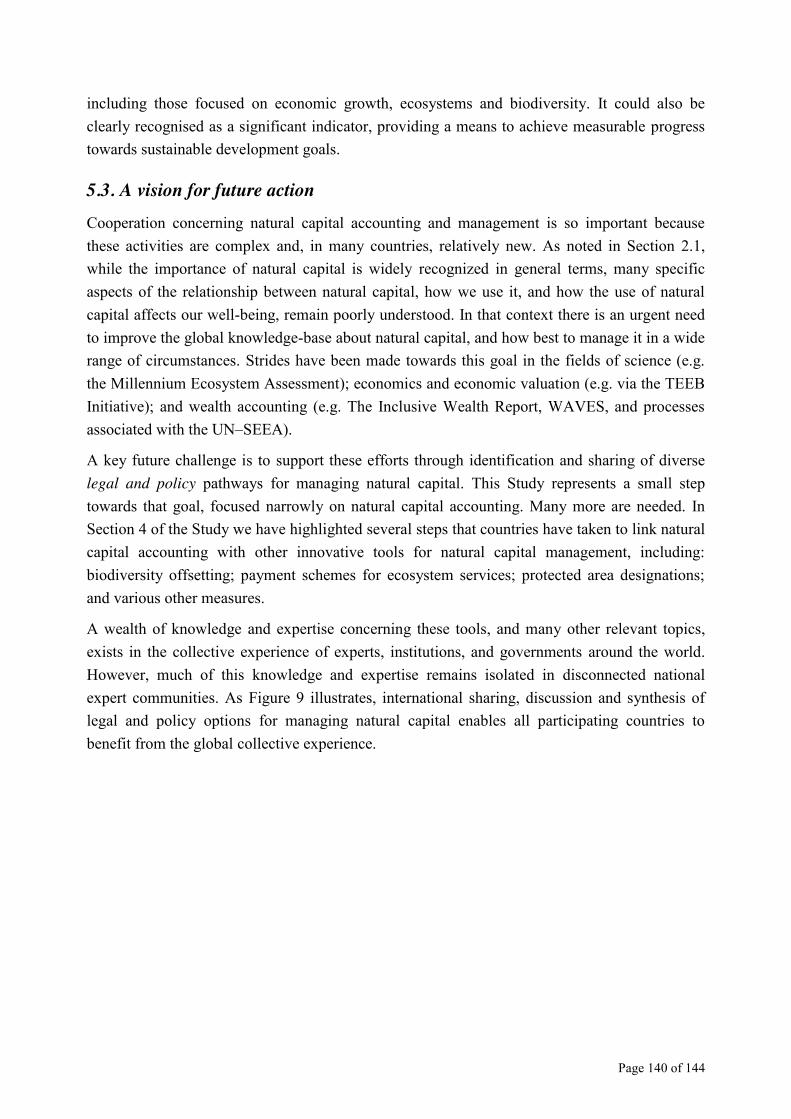
Page 140 of 144
including those focused on economic growth, ecosystems and biodiversity. It could also be clearly recognised as a significant indicator, providing a means to achieve measurable progress towards sustainable development goals.
5.3. A vision for future action Cooperation concerning natural capital accounting and management is so important because these activities are complex and, in many countries, relatively new. As noted in Section 2.1, while the importance of natural capital is widely recognized in general terms, many specific aspects of the relationship between natural capital, how we use it, and how the use of natural capital affects our well-being, remain poorly understood. In that context there is an urgent need to improve the global knowledge-base about natural capital, and how best to manage it in a wide range of circumstances. Strides have been made towards this goal in the fields of science (e.g. the Millennium Ecosystem Assessment); economics and economic valuation (e.g. via the TEEB Initiative); and wealth accounting (e.g. The Inclusive Wealth Report, WAVES, and processes associated with the UN–SEEA).
A key future challenge is to support these efforts through identification and sharing of diverse legal and policy pathways for managing natural capital. This Study represents a small step towards that goal, focused narrowly on natural capital accounting. Many more are needed. In Section 4 of the Study we have highlighted several steps that countries have taken to link natural capital accounting with other innovative tools for natural capital management, including: biodiversity offsetting; payment schemes for ecosystem services; protected area designations; and various other measures.
A wealth of knowledge and expertise concerning these tools, and many other relevant topics, exists in the collective experience of experts, institutions, and governments around the world. However, much of this knowledge and expertise remains isolated in disconnected national expert communities. As Figure 9 illustrates, international sharing, discussion and synthesis of legal and policy options for managing natural capital enables all participating countries to benefit from the global collective experience.
Page 141 of 144
Figure 9 – Options for managing natural capital: improving the global knowledge-base
GLOBE International is uniquely positioned to facilitate this process, and thereby to help countries around the world unlock pathways for internalizing and preserving their natural capital. Future editions of this Study will document progress made in these areas, for these and a wider group of countries, as the importance of the related issues for human economies, societies and well-being becomes increasingly recognized.
National efforts & experiences re: natural
capital management
International sharing, discussion & synthesis
Knowledge & expertise
Knowledge & expertise
Page 142 of 144
Appendix 1: Questions for national contributors
Questions for contributors:
1. Content of natural capital accounts:
1.1. What types of information does your national government have access to regarding the status of your country's natural capital?
1.2. What types of information does your national government have access to regarding the economic value of your country's natural capital?
1.3. Are there important gaps in the natural capital information that your national government can access?
1.4. Is the natural capital information that your national government can access standardized in any way? (For example: using the United Nations Statistical Commission System of Environmental-Economic Accounting.)
1.5. Based on the information available to your national government, what is the status and economic value of your country's natural capital?
1.6. How has the status and economic value of your country's natural capital changed over the previous 5 years?
1.7. Based on the information available to your national government, what are the major threats to the status and economic value of your country's natural capital?
1.8. How have the threats to your country's natural capital changed over the previous 5 years?
2. Frameworks & processes for natural capital accounting:
2.1. What organizations in your country collect, manage and process information concerning your country's natural capital?
2.2. What frameworks or processes are used in your country to collect information concerning your country's natural capital?
2.3. How is natural capital information shared between different parts of your national government?
2.4. What types of natural capital information does your national government share with the public and commercial sector?
2.5. Does your national government receive assistance to develop frameworks or processes for natural capital accounting? What forms of assistance do you receive and how could they be improved?
Page 143 of 144
2.6. Does your country’s accounting for natural capital include material flows through the economy and, if so, does it relate these flows to the value added of different sectors or to the output of the economy as a whole (GDP)?
3. Use of natural capital accounts in decision-making:
3.1. How is natural capital information used by your country's national government during policy development?
3.2. How is natural capital information made available to parliamentarians, and used by your country's parliament or legislature during the development and drafting of legislation?
3.3. Are natural capital accounting data or indicators used in your country's budgetary process, i.e. in the budget, the estimates or supplementary estimates? Is the Minister of Finance including them in the Budget speech?
4. Legal and policy development concerning natural capital:
4.1. Please identify any relevant national laws or policies concerning natural capital accounting. What are the key features of these laws or legislation?
4.2. Please identify any national laws or policies that require economic values of natural capital to be considered during government decision-making. What are the key features of these laws?
4.3. Please identify any national strategies to develop new laws regarding natural capital and natural capital accounting. What are the key features of these strategies?
5. Success stories, challenges & lessons learned
5.1. For the benefit of the international community, please describe at least one success story from your country regarding management of natural capital. Examples could include: investment in ecological infrastructure, payments and markets for ecosystem services, REDD+ projects, use of natural capital accounts in decision-making, or expansion and administration of protected areas.
5.2. For the benefit of the international community, please identify three (3) important challenges to the advancement and implementation of natural capital accounting in your country.
5.3. For the benefit of the international community, please identify three (3) important lessons learned regarding readiness for implementation of natural capital accounting in your country.
Page 144 of 144
6. Improving the Study & other comments
6.1. How can we improve on the 1st edition of the Natural Capital Legislation Study? Please recommend any changes that would make the Study more useful for national governments and decision makers.
6.2. Do you have any other comments?