Embed Size (px)
Citation preview
2Q14 Results 1
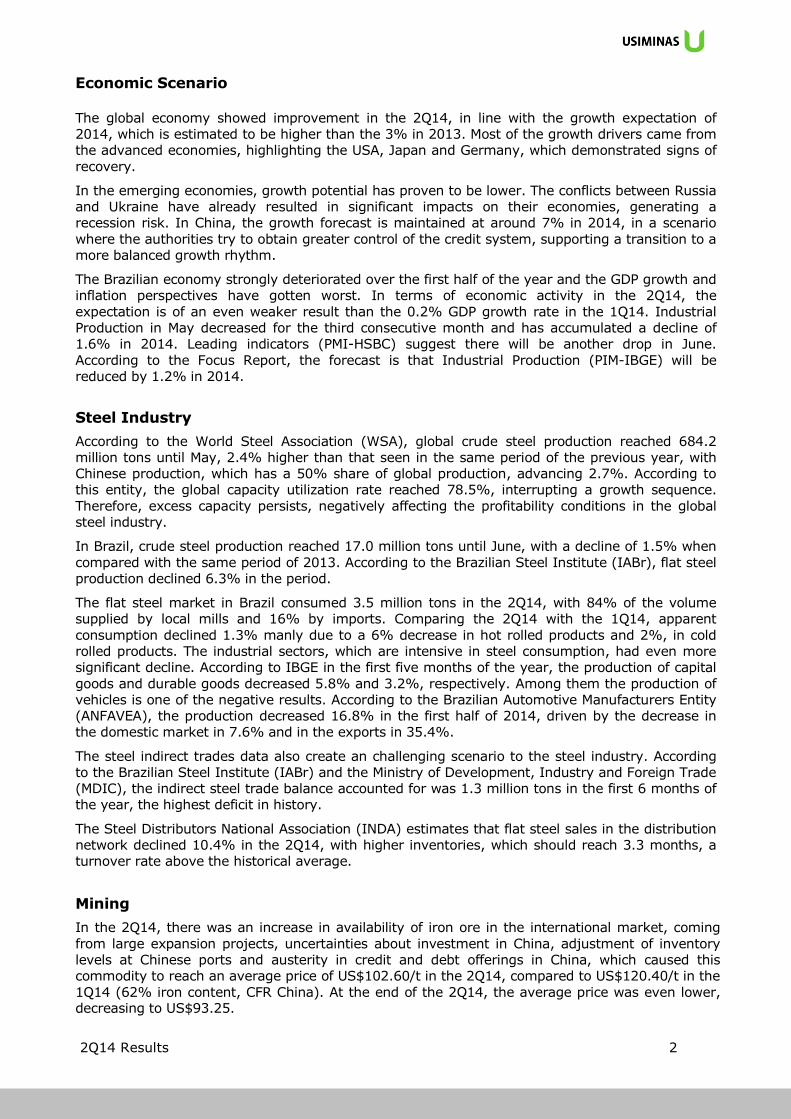
Release of the 2Q14 Results The main operational and financial indicators were:
Total steel sales volume of 1.5 million tons;
Consolidated net revenue of R$3.1 billion;
Consolidated Adjusted EBITDA of R$549.4 million;
Consolidated Adjusted EBITDA Margin of 17.7%;
Investments in Capex of R$260.9 million;
Net debt / EBITDA ratio of 1.7x.
BM&FBOVESPA: USIM5 R$7.58/ share
USIM3 R$6.92/ share
EUA/OTC: USNZY US$3.45/ADR
Latibex: XUSI €2.72/ share XUSIO €2.40/share
• Consolidated Results
• Performance of the Business Units: - Siderurgia - Mining - Steel - Steel Processing - Capital Goods • Highlights
• Capital Markets
• Balance Sheet, Income, Cash Flow Statements
3T11
Market Data – 06/30/14 Index
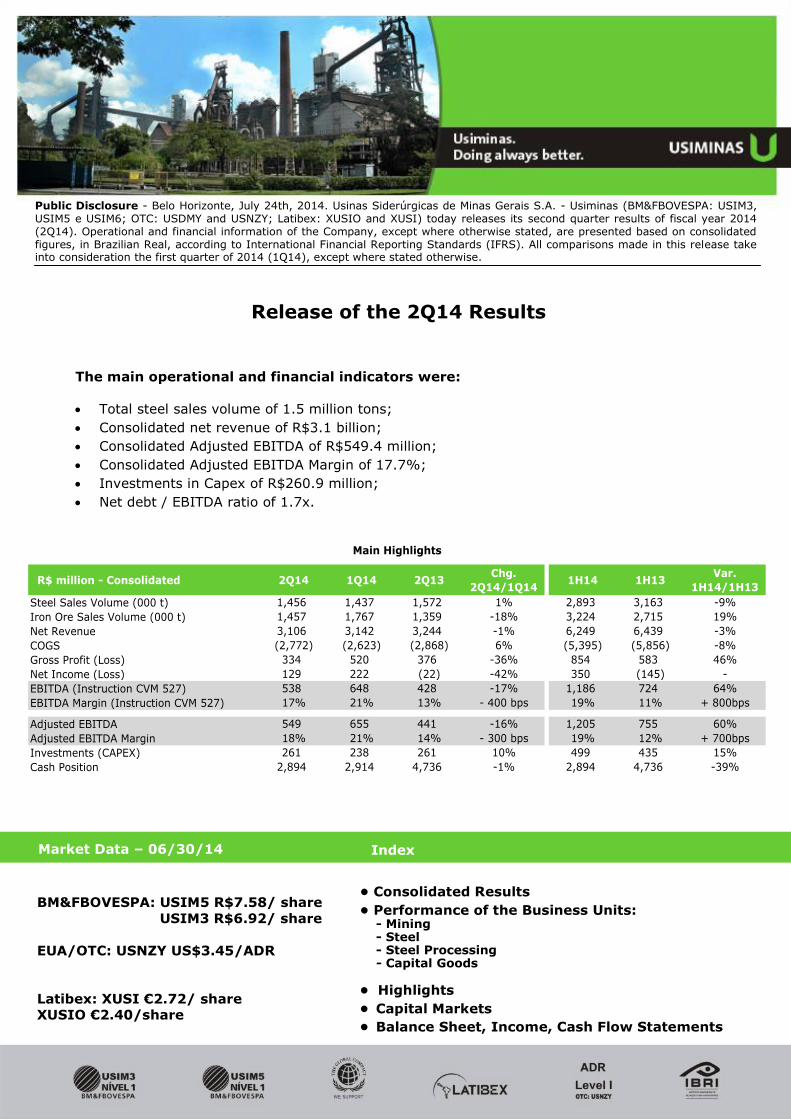
Public Disclosure - Belo Horizonte, July 24th, 2014. Usinas Siderúrgicas de Minas Gerais S.A. - Usiminas (BM&FBOVESPA: USIM3, USIM5 e USIM6; OTC: USDMY and USNZY; Latibex: XUSIO and XUSI) today releases its second quarter results of fiscal year 2014 (2Q14). Operational and financial information of the Company, except where otherwise stated, are presented based on consolidated figures, in Brazilian Real, according to International Financial Reporting Standards (IFRS). All comparisons made in this release take into consideration the first quarter of 2014 (1Q14), except where stated otherwise.
R$ million - Consolidated 2Q14 1Q14 2Q13Chg.
2Q14/1Q141H14 1H13
Var.
1H14/1H13
Steel Sales Volume (000 t) 1,456 1,437 1,572 1% 2,893 3,163 -9%
Iron Ore Sales Volume (000 t) 1,457 1,767 1,359 -18% 3,224 2,715 19%
Net Revenue 3,106 3,142 3,244 -1% 6,249 6,439 -3%
COGS (2,772) (2,623) (2,868) 6% (5,395) (5,856) -8%
Gross Profit (Loss) 334 520 376 -36% 854 583 46%
Net Income (Loss) 129 222 (22) -42% 350 (145) -
EBITDA (Instruction CVM 527) 538 648 428 -17% 1,186 724 64%
EBITDA Margin (Instruction CVM 527) 17% 21% 13% - 400 bps 19% 11% + 800bps
Adjusted EBITDA 549 655 441 -16% 1,205 755 60%
Adjusted EBITDA Margin 18% 21% 14% - 300 bps 19% 12% + 700bps
Investments (CAPEX) 261 238 261 10% 499 435 15%
Cash Position 2,894 2,914 4,736 -1% 2,894 4,736 -39%
Main Highlights
2Q14 Results 2
Economic Scenario
The global economy showed improvement in the 2Q14, in line with the growth expectation of
2014, which is estimated to be higher than the 3% in 2013. Most of the growth drivers came from
the advanced economies, highlighting the USA, Japan and Germany, which demonstrated signs of
recovery.
In the emerging economies, growth potential has proven to be lower. The conflicts between Russia
and Ukraine have already resulted in significant impacts on their economies, generating a
recession risk. In China, the growth forecast is maintained at around 7% in 2014, in a scenario
where the authorities try to obtain greater control of the credit system, supporting a transition to a
more balanced growth rhythm.
The Brazilian economy strongly deteriorated over the first half of the year and the GDP growth and
inflation perspectives have gotten worst. In terms of economic activity in the 2Q14, the
expectation is of an even weaker result than the 0.2% GDP growth rate in the 1Q14. Industrial
Production in May decreased for the third consecutive month and has accumulated a decline of
1.6% in 2014. Leading indicators (PMI-HSBC) suggest there will be another drop in June.
According to the Focus Report, the forecast is that Industrial Production (PIM-IBGE) will be
reduced by 1.2% in 2014.
Steel Industry
According to the World Steel Association (WSA), global crude steel production reached 684.2
million tons until May, 2.4% higher than that seen in the same period of the previous year, with
Chinese production, which has a 50% share of global production, advancing 2.7%. According to
this entity, the global capacity utilization rate reached 78.5%, interrupting a growth sequence.
Therefore, excess capacity persists, negatively affecting the profitability conditions in the global
steel industry.
In Brazil, crude steel production reached 17.0 million tons until June, with a decline of 1.5% when
compared with the same period of 2013. According to the Brazilian Steel Institute (IABr), flat steel
production declined 6.3% in the period.
The flat steel market in Brazil consumed 3.5 million tons in the 2Q14, with 84% of the volume
supplied by local mills and 16% by imports. Comparing the 2Q14 with the 1Q14, apparent
consumption declined 1.3% manly due to a 6% decrease in hot rolled products and 2%, in cold
rolled products. The industrial sectors, which are intensive in steel consumption, had even more
significant decline. According to IBGE in the first five months of the year, the production of capital
goods and durable goods decreased 5.8% and 3.2%, respectively. Among them the production of
vehicles is one of the negative results. According to the Brazilian Automotive Manufacturers Entity
(ANFAVEA), the production decreased 16.8% in the first half of 2014, driven by the decrease in
the domestic market in 7.6% and in the exports in 35.4%.
The steel indirect trades data also create an challenging scenario to the steel industry. According
to the Brazilian Steel Institute (IABr) and the Ministry of Development, Industry and Foreign Trade
(MDIC), the indirect steel trade balance accounted for was 1.3 million tons in the first 6 months of
the year, the highest deficit in history.
The Steel Distributors National Association (INDA) estimates that flat steel sales in the distribution
network declined 10.4% in the 2Q14, with higher inventories, which should reach 3.3 months, a
turnover rate above the historical average.
Mining
In the 2Q14, there was an increase in availability of iron ore in the international market, coming
from large expansion projects, uncertainties about investment in China, adjustment of inventory
levels at Chinese ports and austerity in credit and debt offerings in China, which caused this
commodity to reach an average price of US$102.60/t in the 2Q14, compared to US$120.40/t in the
1Q14 (62% iron content, CFR China). At the end of the 2Q14, the average price was even lower, decreasing to US$93.25.
2Q14 Results 3
Economic and Financial Performance
Comments on Consolidated Results
Net Revenue
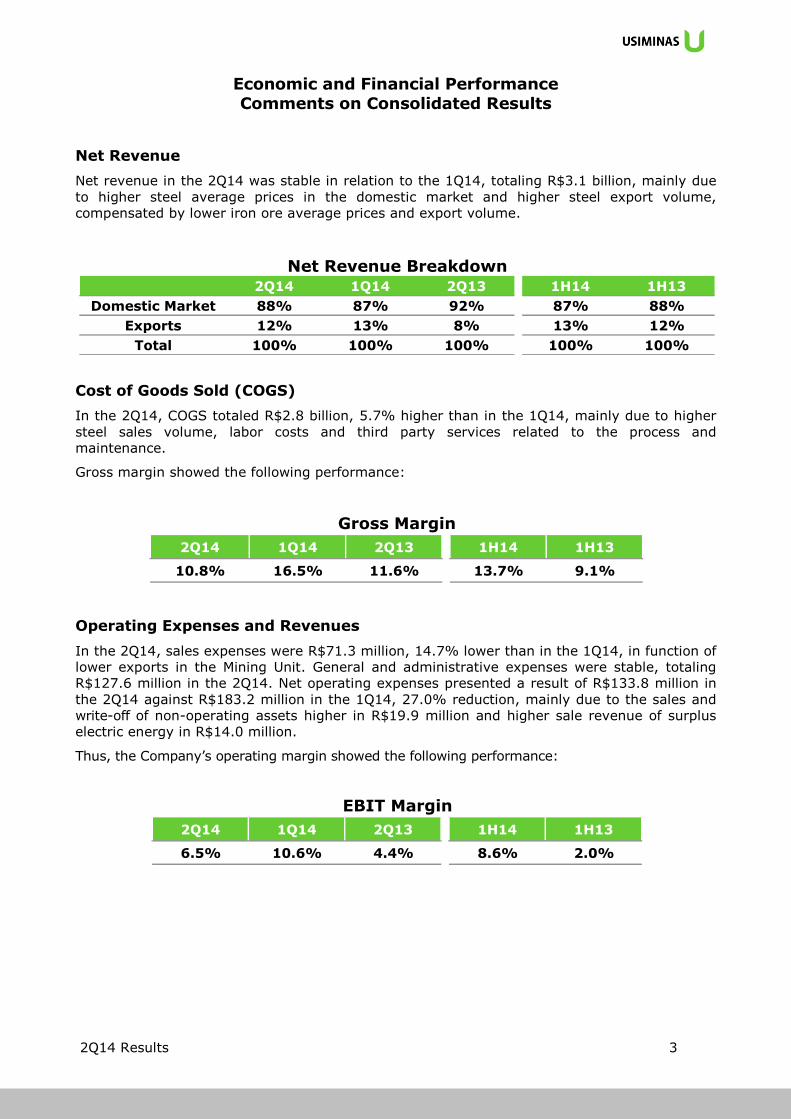
Net revenue in the 2Q14 was stable in relation to the 1Q14, totaling R$3.1 billion, mainly due
to higher steel average prices in the domestic market and higher steel export volume,
compensated by lower iron ore average prices and export volume.
Cost of Goods Sold (COGS)
In the 2Q14, COGS totaled R$2.8 billion, 5.7% higher than in the 1Q14, mainly due to higher
steel sales volume, labor costs and third party services related to the process and
maintenance.
Gross margin showed the following performance:
Operating Expenses and Revenues
In the 2Q14, sales expenses were R$71.3 million, 14.7% lower than in the 1Q14, in function of
lower exports in the Mining Unit. General and administrative expenses were stable, totaling
R$127.6 million in the 2Q14. Net operating expenses presented a result of R$133.8 million in
the 2Q14 against R$183.2 million in the 1Q14, 27.0% reduction, mainly due to the sales and
write-off of non-operating assets higher in R$19.9 million and higher sale revenue of surplus
electric energy in R$14.0 million.
Thus, the Company’s operating margin showed the following performance:
2011
2Q14 1Q14 2Q13 1H14 1H13
Domestic Market 88% 87% 92% 87% 88%
Exports 12% 13% 8% 13% 12%
Total 100% 100% 100% 100% 100%
Net Revenue Breakdown
2Q14 1Q14 2Q13 1H14 1H13
10.8% 16.5% 11.6% 13.7% 9.1%
Gross Margin
2Q14 1Q14 2Q13 1H14 1H13
6.5% 10.6% 4.4% 8.6% 2.0%
EBIT Margin
2Q14 Results 4
Adjusted EBITDA
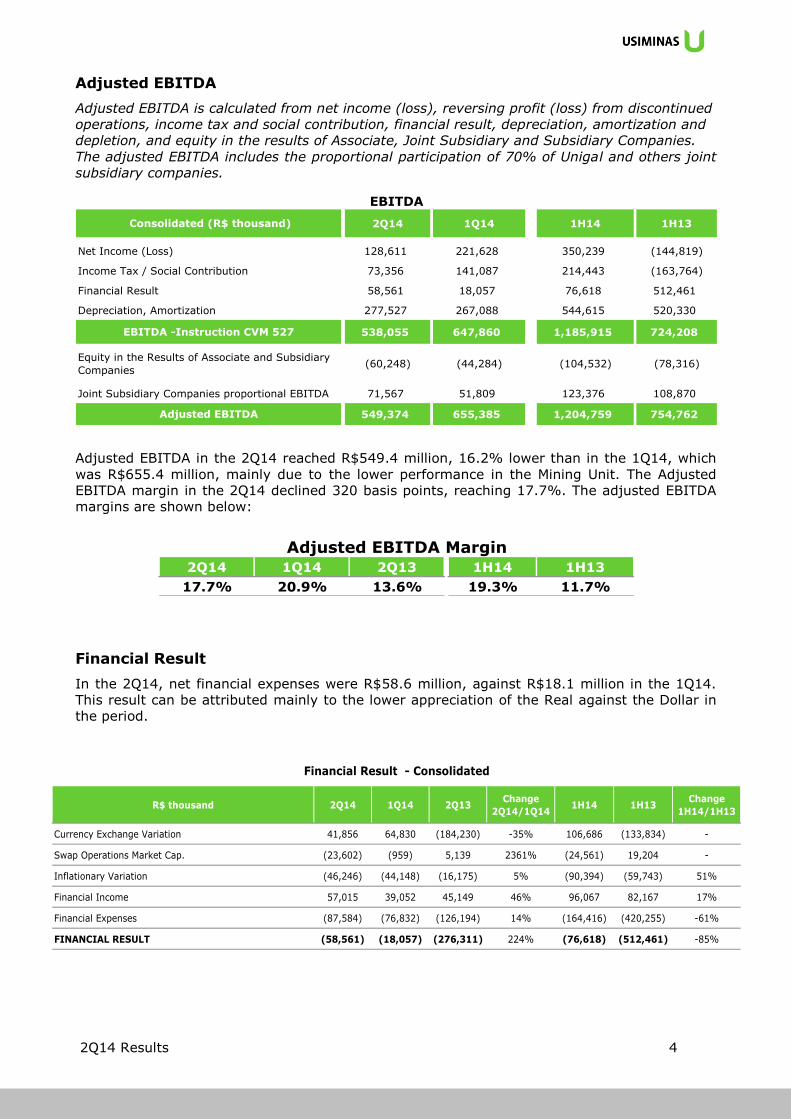
Adjusted EBITDA is calculated from net income (loss), reversing profit (loss) from discontinued
operations, income tax and social contribution, financial result, depreciation, amortization and
depletion, and equity in the results of Associate, Joint Subsidiary and Subsidiary Companies.
The adjusted EBITDA includes the proportional participation of 70% of Unigal and others joint
subsidiary companies.
Adjusted EBITDA in the 2Q14 reached R$549.4 million, 16.2% lower than in the 1Q14, which
was R$655.4 million, mainly due to the lower performance in the Mining Unit. The Adjusted
EBITDA margin in the 2Q14 declined 320 basis points, reaching 17.7%. The adjusted EBITDA
margins are shown below:
Financial Result
In the 2Q14, net financial expenses were R$58.6 million, against R$18.1 million in the 1Q14.
This result can be attributed mainly to the lower appreciation of the Real against the Dollar in
the period.
2Q14 1Q14 1H14 1H13
Net Income (Loss) 128,611 221,628 350,239 (144,819)
Income Tax / Social Contribution 73,356 141,087 214,443 (163,764)
Financial Result 58,561 18,057 76,618 512,461
Depreciation, Amortization 277,527 267,088 544,615 520,330
538,055 647,860 1,185,915 724,208
Joint Subsidiary Companies proportional EBITDA 71,567 51,809 123,376 108,870
549,374 655,385 1,204,759 754,762
(104,532)
EBITDA
(78,316)
Adjusted EBITDA
Consolidated (R$ thousand)
Equity in the Results of Associate and Subsidiary
Companies(60,248) (44,284)
EBITDA -Instruction CVM 527
2Q14 1Q14 2Q13 1H14 1H13
17.7% 20.9% 13.6% 19.3% 11.7%
Adjusted EBITDA Margin
R$ thousand 2Q14 1Q14 2Q13Change
2Q14/1Q141H14 1H13
Change
1H14/1H13
Currency Exchange Variation 41,856 64,830 (184,230) -35% 106,686 (133,834) -
Swap Operations Market Cap. (23,602) (959) 5,139 2361% (24,561) 19,204 -
Inflationary Variation (46,246) (44,148) (16,175) 5% (90,394) (59,743) 51%
Financial Income 57,015 39,052 45,149 46% 96,067 82,167 17%
Financial Expenses (87,584) (76,832) (126,194) 14% (164,416) (420,255) -61%
FINANCIAL RESULT (58,561) (18,057) (276,311) 224% (76,618) (512,461) -85%
Financial Result - Consolidated
2Q14 Results 5
Equity in the Results of Associate and Subsidiary Companies
Equity in the results of associate and subsidiary companies was R$60.2 million in the 2Q14,
against R$44.3 million, higher by 36.0% when compared with the 1Q14, mainly due to higher
contribution of Unigal and MRS Logística in the period.
Net Income (Loss)
The Company presented net income of R$128.6 million in the 2Q14 against R$221.6 million in
the 1Q14.
Investments (CAPEX)
Investments totaled R$260.9 million in the 2Q14, a 9.7% increase in relation to the 1Q14,
mainly in function of maintenance CAPEX and the Coke Plant II revamp in Ipatinga, in the
Steel Unit.
Out of the total investments in the 2Q14, 86% were applied to the Steel Unit, 11% to the
Mining Unit, 2% to the Steel Transformation Unit and 1% to the Capital Goods Unit.
Indebtedness
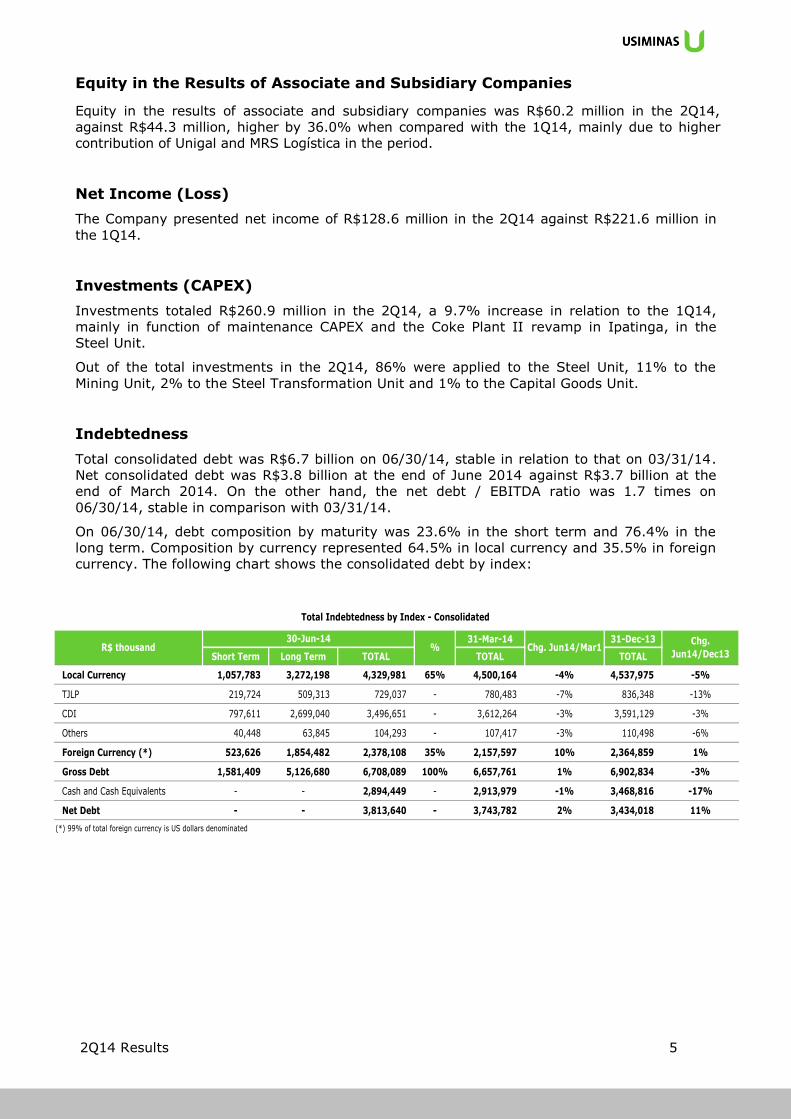
Total consolidated debt was R$6.7 billion on 06/30/14, stable in relation to that on 03/31/14.
Net consolidated debt was R$3.8 billion at the end of June 2014 against R$3.7 billion at the
end of March 2014. On the other hand, the net debt / EBITDA ratio was 1.7 times on
06/30/14, stable in comparison with 03/31/14.
On 06/30/14, debt composition by maturity was 23.6% in the short term and 76.4% in the
long term. Composition by currency represented 64.5% in local currency and 35.5% in foreign
currency. The following chart shows the consolidated debt by index:
31-Mar-14 31-Dec-13
Short Term Long Term TOTAL TOTAL TOTAL
Local Currency 1,057,783 3,272,198 4,329,981 65% 4,500,164 -4% 4,537,975 -5%
TJLP 219,724 509,313 729,037 - 780,483 -7% 836,348 -13%
CDI 797,611 2,699,040 3,496,651 - 3,612,264 -3% 3,591,129 -3%
Others 40,448 63,845 104,293 - 107,417 -3% 110,498 -6%
Foreign Currency (*) 523,626 1,854,482 2,378,108 35% 2,157,597 10% 2,364,859 1%
Gross Debt 1,581,409 5,126,680 6,708,089 100% 6,657,761 1% 6,902,834 -3%
Cash and Cash Equivalents - - 2,894,449 - 2,913,979 -1% 3,468,816 -17%
Net Debt - - 3,813,640 - 3,743,782 2% 3,434,018 11%
(*) 99% of total foreign currency is US dollars denominated
Total Indebtedness by Index - Consolidated
R$ thousand30-Jun-14
% Chg. Jun14/Mar1Chg.
Jun14/Dec13
2Q14 Results 6
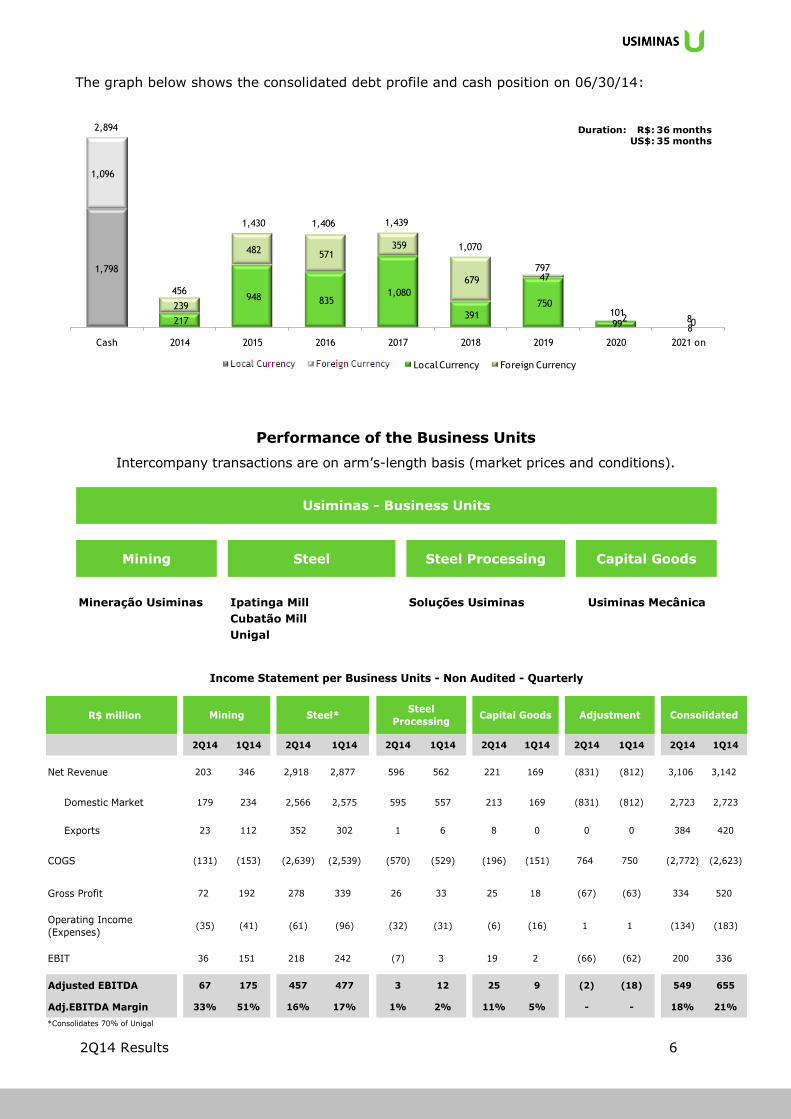
The graph below shows the consolidated debt profile and cash position on 06/30/14:
Performance of the Business Units
Intercompany transactions are on arm’s-length basis (market prices and conditions).
Mining Steel Steel Processing Capital Goods
Mineração Usiminas Ipatinga Mill Soluções Usiminas Usiminas Mecânica
Cubatão Mill
Unigal
Usiminas - Business Units
R$ million
2Q14 1Q14 2Q14 1Q14 2Q14 1Q14 2Q14 1Q14 2Q14 1Q14 2Q14 1Q14
Net Revenue 203 346 2,918 2,877 596 562 221 169 (831) (812) 3,106 3,142
Domestic Market 179 234 2,566 2,575 595 557 213 169 (831) (812) 2,723 2,723
Exports 23 112 352 302 1 6 8 0 0 0 384 420
COGS (131) (153) (2,639) (2,539) (570) (529) (196) (151) 764 750 (2,772) (2,623)
Gross Profit 72 192 278 339 26 33 25 18 (67) (63) 334 520
Operating Income
(Expenses)(35) (41) (61) (96) (32) (31) (6) (16) 1 1 (134) (183)
EBIT 36 151 218 242 (7) 3 19 2 (66) (62) 200 336
Adjusted EBITDA 67 175 457 477 3 12 25 9 (2) (18) 549 655
Adj.EBITDA Margin 33% 51% 16% 17% 1% 2% 11% 5% - - 18% 21%
*Consolidates 70% of Unigal
Income Statement per Business Units - Non Audited - Quarterly
ConsolidatedMining Steel*Steel
ProcessingCapital Goods Adjustment
1,798
217
948 835 1,080
391
750
99 8
1,096
239
482 571 359
679 47
2 0
Cash 2014 2015 2016 2017 2018 2019 2020 2021 on
Debt Profile
Local Currency Foreign Currency
2,894
456
1,430 1,439
1,070
797
8101
1,406
Duration: R$: 36 monthsUS$: 35 months
2Q14 Results 7
I) M I N I N G
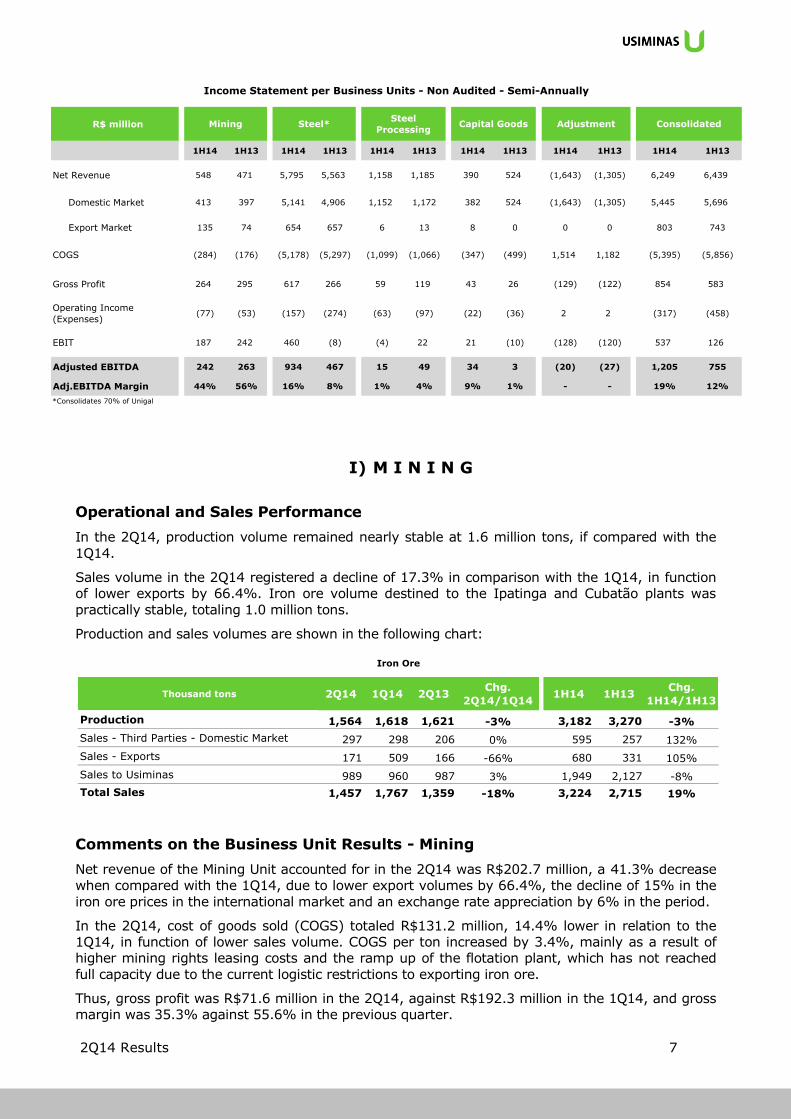
Operational and Sales Performance
In the 2Q14, production volume remained nearly stable at 1.6 million tons, if compared with the
1Q14.
Sales volume in the 2Q14 registered a decline of 17.3% in comparison with the 1Q14, in function
of lower exports by 66.4%. Iron ore volume destined to the Ipatinga and Cubatão plants was
practically stable, totaling 1.0 million tons.
Production and sales volumes are shown in the following chart:
Comments on the Business Unit Results - Mining
Net revenue of the Mining Unit accounted for in the 2Q14 was R$202.7 million, a 41.3% decrease
when compared with the 1Q14, due to lower export volumes by 66.4%, the decline of 15% in the
iron ore prices in the international market and an exchange rate appreciation by 6% in the period.
In the 2Q14, cost of goods sold (COGS) totaled R$131.2 million, 14.4% lower in relation to the
1Q14, in function of lower sales volume. COGS per ton increased by 3.4%, mainly as a result of
higher mining rights leasing costs and the ramp up of the flotation plant, which has not reached
full capacity due to the current logistic restrictions to exporting iron ore.
Thus, gross profit was R$71.6 million in the 2Q14, against R$192.3 million in the 1Q14, and gross
margin was 35.3% against 55.6% in the previous quarter.
Thousand tons 2Q14 1Q14 2Q13Chg.
2Q14/1Q141H14 1H13
Chg.
1H14/1H13
Production 1,564 1,618 1,621 -3% 3,182 3,270 -3%
Sales - Third Parties - Domestic Market 297 298 206 0% 595 257 132%
Sales - Exports 171 509 166 -66% 680 331 105%
Sales to Usiminas 989 960 987 3% 1,949 2,127 -8%
Total Sales 1,457 1,767 1,359 -18% 3,224 2,715 19%
Iron Ore
R$ million
1H14 1H13 1H14 1H13 1H14 1H13 1H14 1H13 1H14 1H13 1H14 1H13
Net Revenue 548 471 5,795 5,563 1,158 1,185 390 524 (1,643) (1,305) 6,249 6,439
Domestic Market 413 397 5,141 4,906 1,152 1,172 382 524 (1,643) (1,305) 5,445 5,696
Export Market 135 74 654 657 6 13 8 0 0 0 803 743
COGS (284) (176) (5,178) (5,297) (1,099) (1,066) (347) (499) 1,514 1,182 (5,395) (5,856)
Gross Profit 264 295 617 266 59 119 43 26 (129) (122) 854 583
Operating Income
(Expenses)(77) (53) (157) (274) (63) (97) (22) (36) 2 2 (317) (458)
EBIT 187 242 460 (8) (4) 22 21 (10) (128) (120) 537 126
Adjusted EBITDA 242 263 934 467 15 49 34 3 (20) (27) 1,205 755
Adj.EBITDA Margin 44% 56% 16% 8% 1% 4% 9% 1% - - 19% 12%
*Consolidates 70% of Unigal
Income Statement per Business Units - Non Audited - Semi-Annually
Mining Steel*Steel
ProcessingCapital Goods ConsolidatedAdjustment
2Q14 Results 8
In the 2Q14, selling expenses were R$20.2 million, against R$39.8 million in the 1Q14, a reduction
of 49.2%, due to lower export volume. General and administrative expenses were R$12.6 million
in the 2Q14, stable in relation to the 1Q14. Total operating expenses in the 2Q14 were R$35.2
million, while in the 1Q14, they were R$41.3 million, representing a decrease of 14.7%, mainly
due to lower export volume partially compensated by the write-off of an operational asset in the
amount of R$10.3 million and lower sales revenue of surplus electric energy. In the 2Q14, energy
sale totaled R$8.3 million, against R$16.2 million in the 1Q14.
In the 2Q14, Adjusted EBITDA was R$67.0 million, 61.8% lower than in the 1Q14, that was
R$175.2 million, and corresponded to a 33.0% EBITDA margin.
Investments (CAPEX)
Investments in the 2Q14 reached R$27.8 million, mainly related to the Friables Project, in line
with that accounted for in the 1Q14.
Stake in MRS Logística
Mineração Usiminas holds a stake in the MRS Logística through its subsidiary UPL – Usiminas
Participações e Logística S.A.
MRS Logística is a concession that controls, operates and monitors the Brazilian Southeastern
Federal Railroad Network (Malha Sudeste da Rede Ferroviária Federal). The company operates
in the railway transportation segment, connecting the states of Rio de Janeiro, Minas Gerais
and São Paulo, and its core business is transporting with integrated logistics of cargo in
general, such as iron ore, steel products, cement, bauxite, agricultural projects, pet coke and
containers.
MRS transported a total volume of 41.4 million tons in the 2Q14, a 14.5% increase in relation
to the 1Q14, which was a record volume for a second quarter.
II) S T E E L
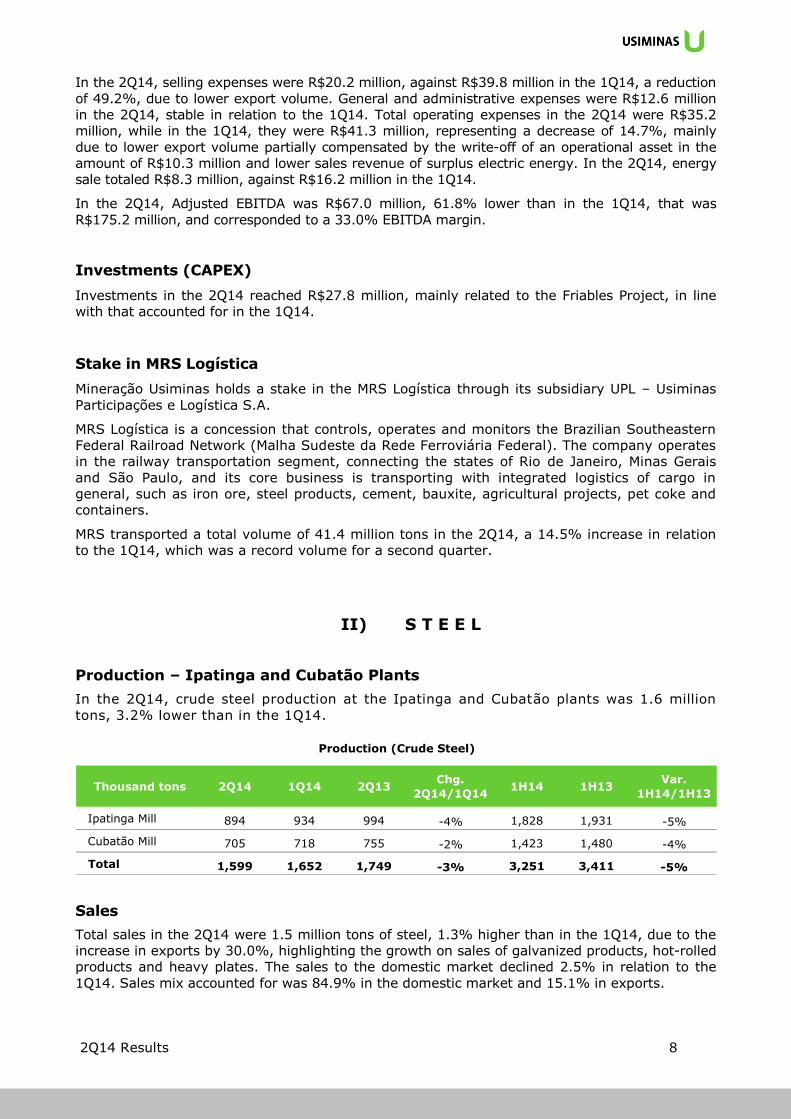
Production – Ipatinga and Cubatão Plants
In the 2Q14, crude steel production at the Ipatinga and Cubatão plants was 1.6 million
tons, 3.2% lower than in the 1Q14.
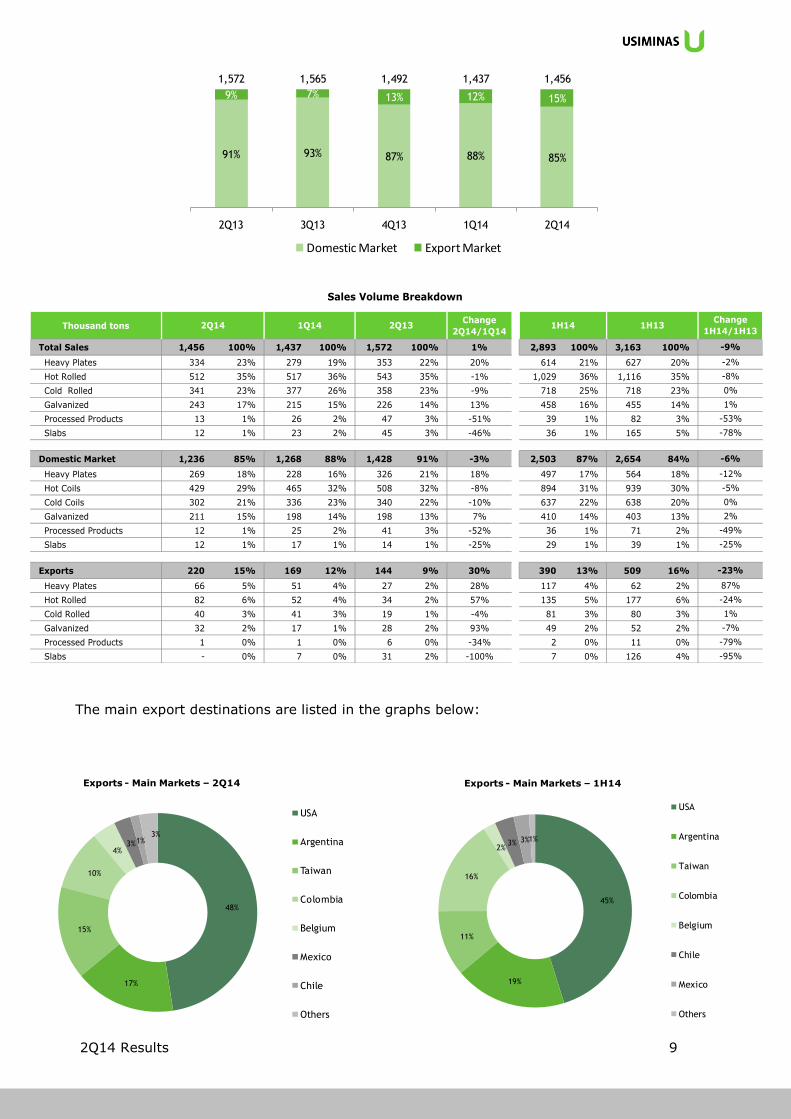
Sales
Total sales in the 2Q14 were 1.5 million tons of steel, 1.3% higher than in the 1Q14, due to the
increase in exports by 30.0%, highlighting the growth on sales of galvanized products, hot-rolled
products and heavy plates. The sales to the domestic market declined 2.5% in relation to the
1Q14. Sales mix accounted for was 84.9% in the domestic market and 15.1% in exports.
Thousand tons 2Q14 1Q14 2Q13Chg.
2Q14/1Q141H14 1H13
Var.
1H14/1H13
Ipatinga Mill 894 934 994 -4% 1,828 1,931 -5%
Cubatão Mill 705 718 755 -2% 1,423 1,480 -4%
Total 1,599 1,652 1,749 -3% 3,251 3,411 -5%
Production (Crude Steel)
2Q14 Results 9
The main export destinations are listed in the graphs below:
48%
17%
15%
10%
4%3%1%
3%
Exports - Main Markets – 2Q14
USA
Argentina
Taiwan
Colombia
Belgium
Mexico
Chile
Others
45%
19%
11%
16%
2%3% 3%1%
Exports - Main Markets – 1H14
USA
Argentina
Taiwan
Colombia
Belgium
Chile
Mexico
Others
91% 93% 87% 88% 85%
9% 7% 13% 12% 15%
1,572 1,565 1,492 1,437 1,456
2Q13 3Q13 4Q13 1Q14 2Q14
Domestic Market Export Market
Thousand tons Change
2Q14/1Q14
Total Sales 1,456 100% 1,437 100% 1,572 100% 1% 2,893 100% 3,163 100%
Heavy Plates 334 23% 279 19% 353 22% 20% 614 21% 627 20%
Hot Rolled 512 35% 517 36% 543 35% -1% 1,029 36% 1,116 35%
Cold Rolled 341 23% 377 26% 358 23% -9% 718 25% 718 23%
Galvanized 243 17% 215 15% 226 14% 13% 458 16% 455 14%
Processed Products 13 1% 26 2% 47 3% -51% 39 1% 82 3%
Slabs 12 1% 23 2% 45 3% -46% 36 1% 165 5%
Domestic Market 1,236 85% 1,268 88% 1,428 91% -3% 2,503 87% 2,654 84%
Heavy Plates 269 18% 228 16% 326 21% 18% 497 17% 564 18%
Hot Coils 429 29% 465 32% 508 32% -8% 894 31% 939 30%
Cold Coils 302 21% 336 23% 340 22% -10% 637 22% 638 20%
Galvanized 211 15% 198 14% 198 13% 7% 410 14% 403 13%
Processed Products 12 1% 25 2% 41 3% -52% 36 1% 71 2%
Slabs 12 1% 17 1% 14 1% -25% 29 1% 39 1%
Exports 220 15% 169 12% 144 9% 30% 390 13% 509 16%
Heavy Plates 66 5% 51 4% 27 2% 28% 117 4% 62 2%
Hot Rolled 82 6% 52 4% 34 2% 57% 135 5% 177 6%
Cold Rolled 40 3% 41 3% 19 1% -4% 81 3% 80 3%
Galvanized 32 2% 17 1% 28 2% 93% 49 2% 52 2%
Processed Products 1 0% 1 0% 6 0% -34% 2 0% 11 0%
Slabs - 0% 7 0% 31 2% -100% 7 0% 126 4%
Sales Volume Breakdown
-95%
-49%
-25%
-23%
87%
1%
-7%
-79%
-24%
2%
0%
1%
-53%
-9%
-2%
-8%
-6%
-12%
-78%
1H14 1H13Change
1H14/1H13
-5%
0%
1Q142Q14 2Q13
2Q14 Results 10
Comments on the Business Unit Results - Steel
In the 2Q14, the Steel Unit registered net revenue of R$2.9 billion, 1.4% higher than in the
1Q14, as a result of the increase of steel average price by 2.3% in the domestic market and
the increase in exports by 30.0%.
In the 2Q14, cost of goods sold (COGS) was R$2.6 billion, 4.0% higher than in the 1Q14.
COGS per ton raised 2.6% in comparison with the 1Q14, mainly in function of the increase of
5.82% in the payroll referring to the Collective Labor Agreement at the Cubatão plant in May
2014, and the sale of steel products produced in prior periods with higher raw materials costs.
In the 2Q14, sales expenses were 24.3% greater than in the 1Q14, in function of higher export
volumes. General and administrative expenses were 3.2% lower than those in the 1Q14. Total
operating expenses accounted for in the 2Q14 were R$60.8 million, 37.0% lower than those in
the 1Q14, which were R$96.5 million, mainly due to the sale of surplus electric energy, which
totaled R$80.7 million in the 2Q14 against R$58.8 million in the 1Q14, and sale of non-
operational assets in the amount of R$21.5 million.
Thus, Adjusted EBITDA was R$456.7 million in the 2Q14, 4.3% lower than in the 1Q14, and
the Adjusted EBITDA margin was 15.7%.
Investments (CAPEX)
Investments in the 2Q14 totaled R$225.1 million, mainly with maintenance CAPEX and the Coke
Plant II revamp in Ipatinga. The Coke Plant revamp will increase coke self-generation and is
forecast to start up in the 4Q14.
III) S T E E L P R O C E S S I N G
Soluções Usiminas
Soluções Usiminas operates in the distribution, services and small-diameter tubes markets
nationwide, offering its customers high-value added products and services. It serves several
economic segments, such as automotive, autoparts, civil construction, distribution, electro-
electronics, machinery and equipment and household appliances, among others.
Sales of the Distribution, Just in Time Services and Tubes’ Business Units were responsible for
57%, 34% and 9% of the volume sold in the 2Q14, respectively.
Comments on the Business Unit Results – Steel Processing
Net revenue in the 2Q14 was R$595.7 million, 5.9% higher than in the 1Q14, mainly due to
higher average prices and better sales mix.
In the 2Q14, cost of goods sold (COGS) was R$570.1 million, 7.8% higher if compared with the
1Q14, in function of higher raw materials costs.
Total operating expenses were R$32.2 million in the 2Q14, against R$30.7 million in the 1Q14.
Thus, in the 2Q14, Adjusted EBITDA totaled R$3.1 million against R$12.3 million in the 1Q14.
Adjusted EBITDA margin showed a decrease of 170 basis points in relation to the 1Q14, reaching
0.5% in the 2Q14.
2Q14 Results 11
IV) C A P I T A L G O O D S
Usiminas Mecânica
Usiminas Mecânica is a capital goods company in Brazil, which operates in the following
business areas: steel structures, shipbuilding and offshore, oil and gas, industrial assembly
and equipment and foundry and railcars.
Main Signed Contracts
In the 2Q14, the main contracts signed were for the supply of metallic structures for Vale, for
the replacement of a cooling system for Usiminas in Ipatinga and for a furnace revamp for
Anglo American.
Comments on the Business Unit Results – Capital Goods
Net revenue accounted for in the 2Q14 was R$220.7 million, 30.5% higher when compared
with the 1Q14, which was R$169.2 million, due to the increase in revenue related to the
industrial assembly and equipment segments.
In the 2Q14, gross profit was R$25.1 million, 39.8% higher than in the 1Q14, in function of
the positive results accounted for in the industrial assembly and equipment segments.
Total operating expenses in the 2Q14 were R$6.5 million, 58.6% lower than those in the 1Q14,
positively impacted by the sale of non-operating assets in the amount of R$12.2 million.
Adjusted EBITDA in the 2Q14 was R$24.9 million, against R$8.8 million in the 1Q14, and
Adjusted EBITDA margin was 11.3%.
Consolidated Highlights
The Usiminas Investor Relations team was nominated for the “Best Evolution in
Investor Relations” award in the large cap category by the IR Magazine. Usiminas is
among the five best companies in this category among the public-traded companies in
Brazil with revenues above R$3 billion.
Usiminas received a special award by PSA Peugeot Citroën during the “Suppliers Awards
Latin America 2014” in recognition of its contribution and commitment to Peugeot’s
demands and needs.
Usiminas received the “Low Carbon seal” by the Ministry of Environment for
compensating CO2 emissions in the World Cup, 2014. The Company donated carbon
credits, along with ten other companies, to compensate emissions in the Cup. This is
the first time that a host country of the Cup has concerns about mitigating the effect of
greenhouse emissions regarding the mega event.
Usiminas was the best place steel company in the Autodata Magazine’s “Ranking of
Quality and Partnership 2014”, the main publication about the Brazilian auto industry.
The ranking reflects the quality of services rendered by suppliers that serve the
automotive chain.
2Q14 Results 12
Mineração Usiminas is the second best company in the rank of the mining segment in
Brazil, according to the annual publication “The Best and The Biggest” (“Melhores e
Maiores”) by Exame Magazine. To achieve this result, a detailed survey was made with
around 3,000 companies in the country. The project evaluated several issues, such as
Return on Capital, Current Liquidity, Wealth Creation per Employee, Sales Growth and
Market Leadership, for which companies that had the best results in 18 different sectors
were chosen.
On 06/09/2014, Usiminas contracted a revolving credit facility in the amount of US$300
million, which can be drawdown up to 3 years. Such agreement strengthens the
liquidity position of Usiminas, allowing greater efficiency in cash management,
consistent with the financial strategy of the company.
Capital Markets
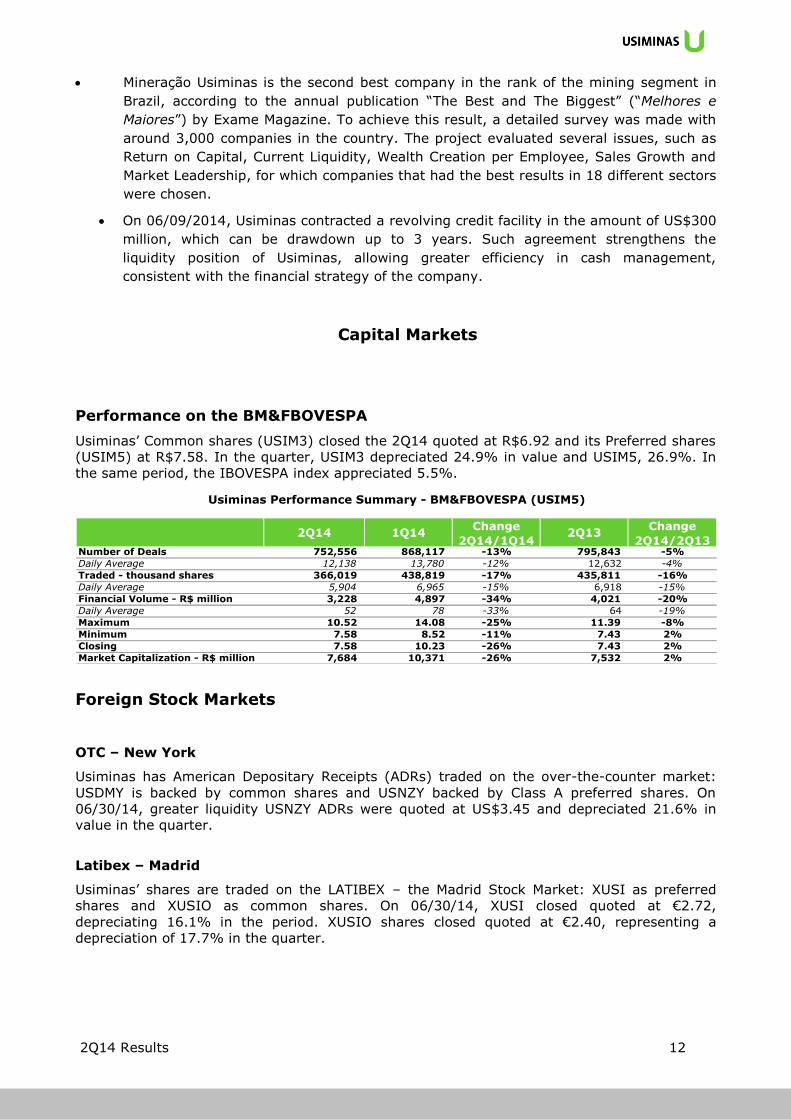
Performance on the BM&FBOVESPA
Usiminas’ Common shares (USIM3) closed the 2Q14 quoted at R$6.92 and its Preferred shares
(USIM5) at R$7.58. In the quarter, USIM3 depreciated 24.9% in value and USIM5, 26.9%. In
the same period, the IBOVESPA index appreciated 5.5%.
Foreign Stock Markets
OTC – New York
Usiminas has American Depositary Receipts (ADRs) traded on the over-the-counter market:
USDMY is backed by common shares and USNZY backed by Class A preferred shares. On
06/30/14, greater liquidity USNZY ADRs were quoted at US$3.45 and depreciated 21.6% in
value in the quarter.
Latibex – Madrid
Usiminas’ shares are traded on the LATIBEX – the Madrid Stock Market: XUSI as preferred
shares and XUSIO as common shares. On 06/30/14, XUSI closed quoted at €2.72,
depreciating 16.1% in the period. XUSIO shares closed quoted at €2.40, representing a
depreciation of 17.7% in the quarter.
2Q14 1Q14Change
2Q14/1Q142Q13
Change
2Q14/2Q13Number of Deals 752,556 868,117 -13% 795,843 -5%
Daily Average 12,138 13,780 -12% 12,632 -4%
Traded - thousand shares 366,019 438,819 -17% 435,811 -16%
Daily Average 5,904 6,965 -15% 6,918 -15%
Financial Volume - R$ million 3,228 4,897 -34% 4,021 -20%
Daily Average 52 78 -33% 64 -19%
Maximum 10.52 14.08 -25% 11.39 -8%
Minimum 7.58 8.52 -11% 7.43 2%
Closing 7.58 10.23 -26% 7.43 2%
Market Capitalization - R$ million 7,684 10,371 -26% 7,532 2%
Usiminas Performance Summary - BM&FBOVESPA (USIM5)
2Q14 Results 13
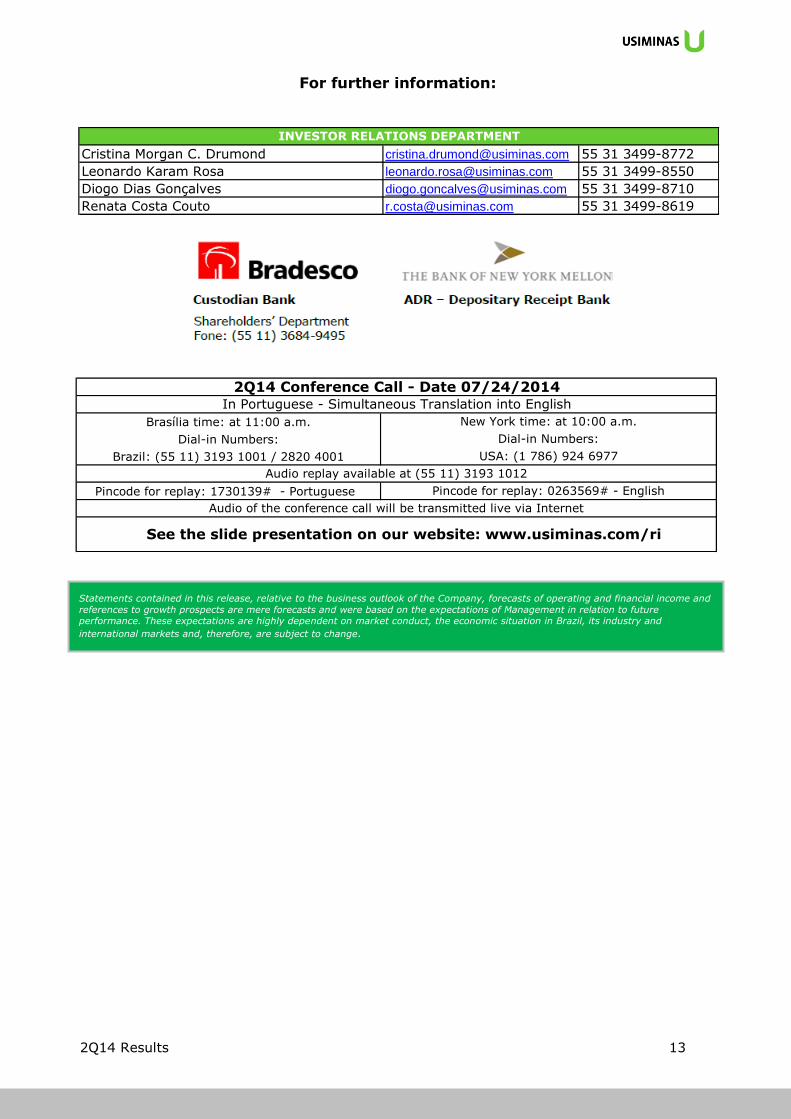
For further information:
Cristina Morgan C. Drumond [email protected] 55 31 3499-8772
Leonardo Karam Rosa [email protected] 55 31 3499-8550
Diogo Dias Gonçalves [email protected] 55 31 3499-8710
Renata Costa Couto [email protected] 55 31 3499-8619
INVESTOR RELATIONS DEPARTMENT
Statements contained in this release, relative to the business outlook of the Company, forecasts of operating and financial income and
references to growth prospects are mere forecasts and were based on the expectations of Management in relation to future performance. These expectations are highly dependent on market conduct, the economic situation in Brazil, its industry and
international markets and, therefore, are subject to change.
Brasília time: at 11:00 a.m.
Dial-in Numbers:
Brazil: (55 11) 3193 1001 / 2820 4001
Pincode for replay: 1730139# - Portuguese
USA: (1 786) 924 6977
Pincode for replay: 0263569# - English
Audio of the conference call will be transmitted live via Internet
See the slide presentation on our website: www.usiminas.com/ri
2Q14 Conference Call - Date 07/24/2014
New York time: at 10:00 a.m.
Dial-in Numbers:
In Portuguese - Simultaneous Translation into English
Audio replay available at (55 11) 3193 1012
2Q14 Results 14
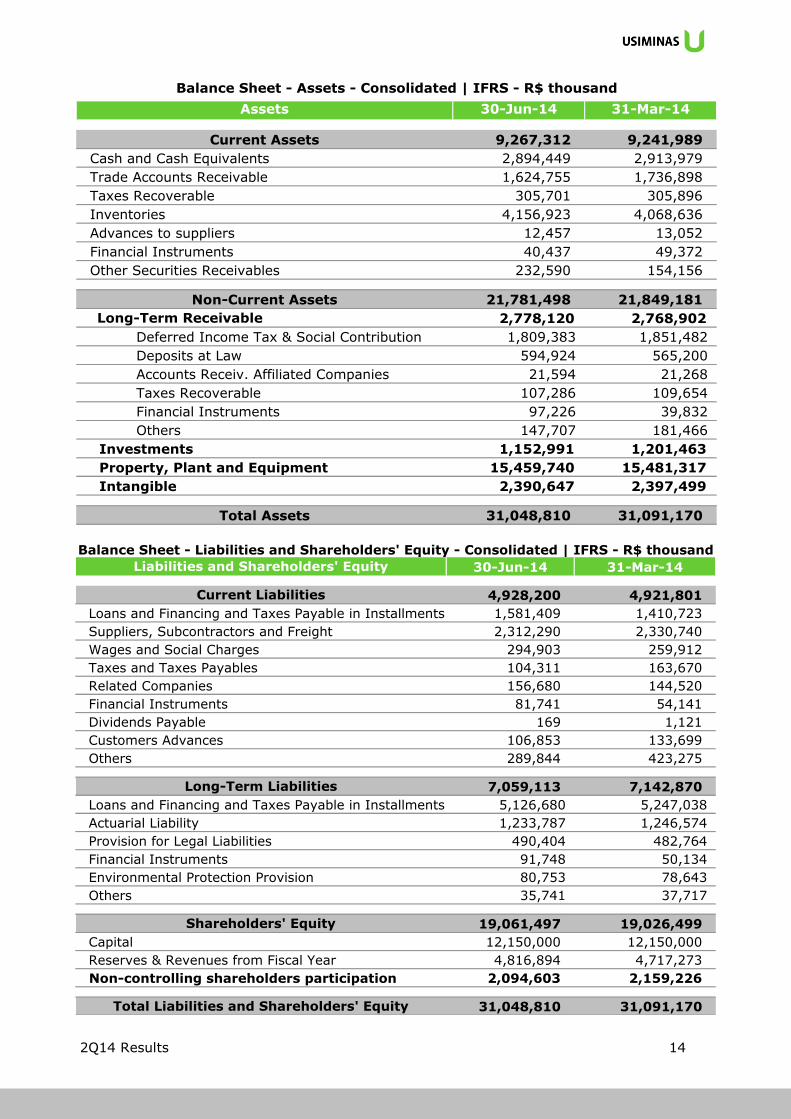
30-Jun-14 31-Mar-14
4,928,200 4,921,801
Loans and Financing and Taxes Payable in Installments 1,581,409 1,410,723
Suppliers, Subcontractors and Freight 2,312,290 2,330,740
Wages and Social Charges 294,903 259,912
Taxes and Taxes Payables 104,311 163,670
Related Companies 156,680 144,520
Financial Instruments 81,741 54,141
Dividends Payable 169 1,121
Customers Advances 106,853 133,699
Others 289,844 423,275
7,059,113 7,142,870
Loans and Financing and Taxes Payable in Installments 5,126,680 5,247,038
Actuarial Liability 1,233,787 1,246,574
Provision for Legal Liabilities 490,404 482,764
Financial Instruments 91,748 50,134
Environmental Protection Provision 80,753 78,643
Others 35,741 37,717
19,061,497 19,026,499
Capital 12,150,000 12,150,000
Reserves & Revenues from Fiscal Year 4,816,894 4,717,273
Non-controlling shareholders participation 2,094,603 2,159,226
31,048,810 31,091,170
Long-Term Liabilities
Total Liabilities and Shareholders' Equity
Shareholders' Equity
Current Liabilities
Balance Sheet - Liabilities and Shareholders' Equity - Consolidated | IFRS - R$ thousand
Liabilities and Shareholders' Equity
Assets 30-Jun-14 31-Mar-14
Current Assets 9,267,312 9,241,989
Cash and Cash Equivalents 2,894,449 2,913,979
Trade Accounts Receivable 1,624,755 1,736,898
Taxes Recoverable 305,701 305,896
Inventories 4,156,923 4,068,636
Advances to suppliers 12,457 13,052
Financial Instruments 40,437 49,372
Other Securities Receivables 232,590 154,156
Non-Current Assets 21,781,498 21,849,181
Long-Term Receivable 2,778,120 2,768,902
Deferred Income Tax & Social Contribution 1,809,383 1,851,482
Deposits at Law 594,924 565,200
Accounts Receiv. Affiliated Companies 21,594 21,268
Taxes Recoverable 107,286 109,654
Financial Instruments 97,226 39,832
Others 147,707 181,466
Investments 1,152,991 1,201,463
Property, Plant and Equipment 15,459,740 15,481,317
Intangible 2,390,647 2,397,499
Total Assets 31,048,810 31,091,170
Balance Sheet - Assets - Consolidated | IFRS - R$ thousand
2Q14 Results 15
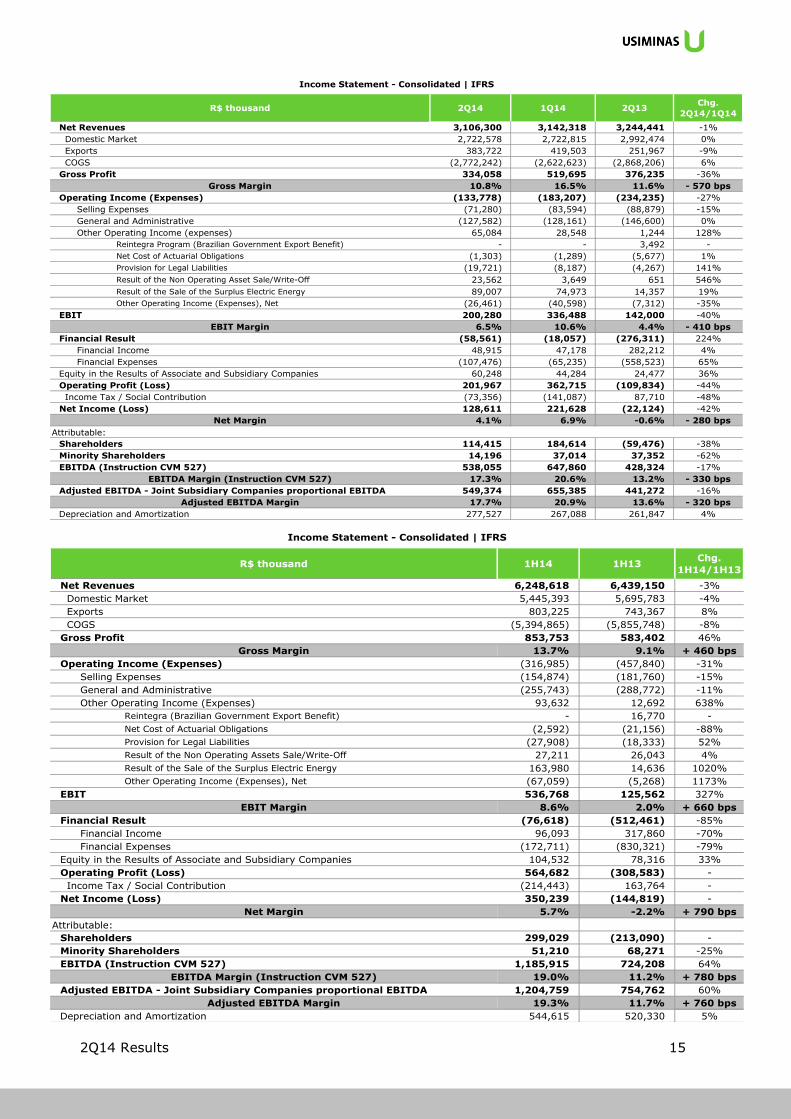
R$ thousand 2Q14 1Q14 2Q13Chg.
2Q14/1Q14
Net Revenues 3,106,300 3,142,318 3,244,441 -1%
Domestic Market 2,722,578 2,722,815 2,992,474 0%
Exports 383,722 419,503 251,967 -9%
COGS (2,772,242) (2,622,623) (2,868,206) 6%
Gross Profit 334,058 519,695 376,235 -36%
Gross Margin 10.8% 16.5% 11.6% - 570 bps
Operating Income (Expenses) (133,778) (183,207) (234,235) -27%
Selling Expenses (71,280) (83,594) (88,879) -15%
General and Administrative (127,582) (128,161) (146,600) 0%
Other Operating Income (expenses) 65,084 28,548 1,244 128%
Reintegra Program (Brazilian Government Export Benefit) - - 3,492 -
Net Cost of Actuarial Obligations (1,303) (1,289) (5,677) 1%
Provision for Legal Liabilities (19,721) (8,187) (4,267) 141%
Result of the Non Operating Asset Sale/Write-Off 23,562 3,649 651 546%
Result of the Sale of the Surplus Electric Energy 89,007 74,973 14,357 19%
Other Operating Income (Expenses), Net (26,461) (40,598) (7,312) -35%
EBIT 200,280 336,488 142,000 -40%
EBIT Margin 6.5% 10.6% 4.4% - 410 bps
Financial Result (58,561) (18,057) (276,311) 224%
Financial Income 48,915 47,178 282,212 4%
Financial Expenses (107,476) (65,235) (558,523) 65%
Equity in the Results of Associate and Subsidiary Companies 60,248 44,284 24,477 36%
Operating Profit (Loss) 201,967 362,715 (109,834) -44%
Income Tax / Social Contribution (73,356) (141,087) 87,710 -48%
Net Income (Loss) 128,611 221,628 (22,124) -42%
Net Margin 4.1% 6.9% -0.6% - 280 bps
Attributable:
Shareholders 114,415 184,614 (59,476) -38%
Minority Shareholders 14,196 37,014 37,352 -62%
EBITDA (Instruction CVM 527) 538,055 647,860 428,324 -17%
EBITDA Margin (Instruction CVM 527) 17.3% 20.6% 13.2% - 330 bps
Adjusted EBITDA - Joint Subsidiary Companies proportional EBITDA 549,374 655,385 441,272 -16%
Adjusted EBITDA Margin 17.7% 20.9% 13.6% - 320 bps
Depreciation and Amortization 277,527 267,088 261,847 4%
Income Statement - Consolidated | IFRS
R$ thousand 1H14 1H13Chg.
1H14/1H13
Net Revenues 6,248,618 6,439,150 -3%
Domestic Market 5,445,393 5,695,783 -4%
Exports 803,225 743,367 8%
COGS (5,394,865) (5,855,748) -8%
Gross Profit 853,753 583,402 46%
Gross Margin 13.7% 9.1% + 460 bps
Operating Income (Expenses) (316,985) (457,840) -31%
Selling Expenses (154,874) (181,760) -15%
General and Administrative (255,743) (288,772) -11%
Other Operating Income (Expenses) 93,632 12,692 638%
Reintegra (Brazilian Government Export Benefit) - 16,770 -
Net Cost of Actuarial Obligations (2,592) (21,156) -88%
Provision for Legal Liabilities (27,908) (18,333) 52%
Result of the Non Operating Assets Sale/Write-Off 27,211 26,043 4%
Result of the Sale of the Surplus Electric Energy 163,980 14,636 1020%
Other Operating Income (Expenses), Net (67,059) (5,268) 1173%
EBIT 536,768 125,562 327%
EBIT Margin 8.6% 2.0% + 660 bps
Financial Result (76,618) (512,461) -85%
Financial Income 96,093 317,860 -70%
Financial Expenses (172,711) (830,321) -79%
Equity in the Results of Associate and Subsidiary Companies 104,532 78,316 33%
Operating Profit (Loss) 564,682 (308,583) -
Income Tax / Social Contribution (214,443) 163,764 -
Net Income (Loss) 350,239 (144,819) -
Net Margin 5.7% -2.2% + 790 bps
Attributable:
Shareholders 299,029 (213,090) -
Minority Shareholders 51,210 68,271 -25%
EBITDA (Instruction CVM 527) 1,185,915 724,208 64%
EBITDA Margin (Instruction CVM 527) 19.0% 11.2% + 780 bps
Adjusted EBITDA - Joint Subsidiary Companies proportional EBITDA 1,204,759 754,762 60%
Adjusted EBITDA Margin 19.3% 11.7% + 760 bps
Depreciation and Amortization 544,615 520,330 5%
Income Statement - Consolidated | IFRS
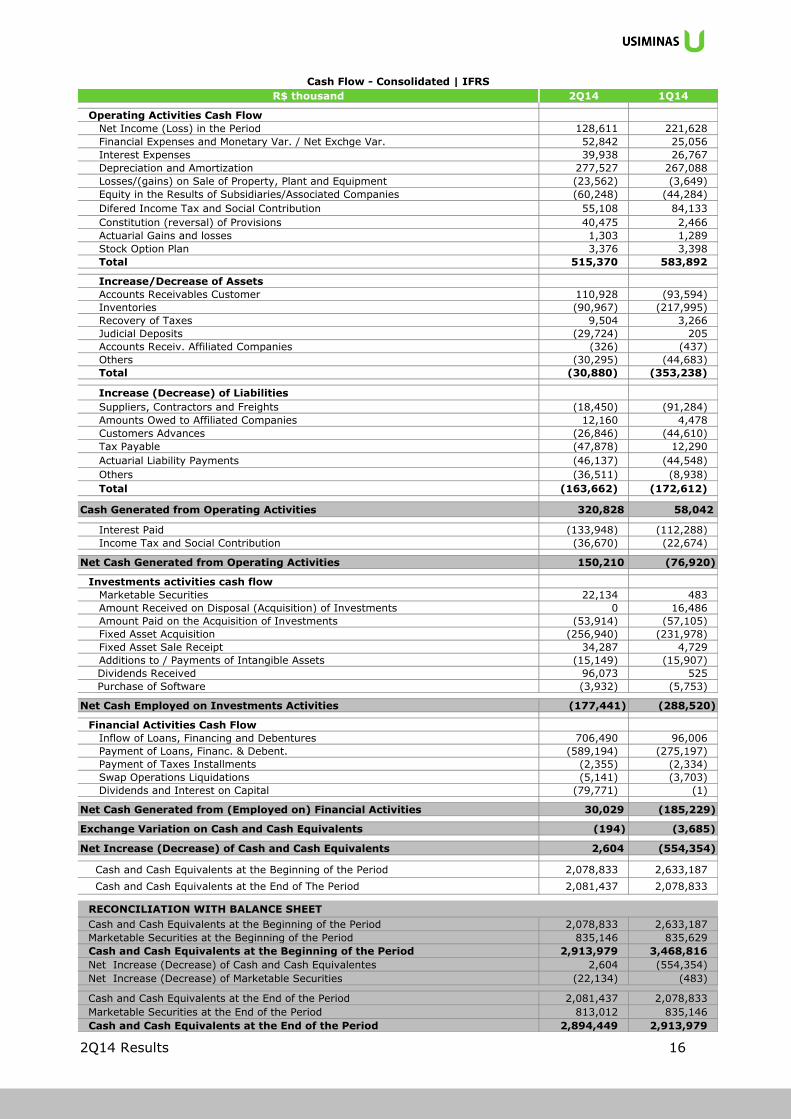
2Q14 Results 16
R$ thousand 2Q14 1Q14
Operating Activities Cash Flow
Net Income (Loss) in the Period 128,611 221,628
Financial Expenses and Monetary Var. / Net Exchge Var. 52,842 25,056
Interest Expenses 39,938 26,767
Depreciation and Amortization 277,527 267,088
Losses/(gains) on Sale of Property, Plant and Equipment (23,562) (3,649)
Equity in the Results of Subsidiaries/Associated Companies (60,248) (44,284)
Difered Income Tax and Social Contribution 55,108 84,133
Constitution (reversal) of Provisions 40,475 2,466
Actuarial Gains and losses 1,303 1,289
Stock Option Plan 3,376 3,398
Total 515,370 583,892
Increase/Decrease of Assets
Accounts Receivables Customer 110,928 (93,594)
Inventories (90,967) (217,995)
Recovery of Taxes 9,504 3,266
Judicial Deposits (29,724) 205
Accounts Receiv. Affiliated Companies (326) (437)
Others (30,295) (44,683)
Total (30,880) (353,238)
Increase (Decrease) of Liabilities
Suppliers, Contractors and Freights (18,450) (91,284)
Amounts Owed to Affiliated Companies 12,160 4,478
Customers Advances (26,846) (44,610)
Tax Payable (47,878) 12,290
Actuarial Liability Payments (46,137) (44,548)
Others (36,511) (8,938)
Total (163,662) (172,612)
Cash Generated from Operating Activities 320,828 58,042
Interest Paid (133,948) (112,288)
Income Tax and Social Contribution (36,670) (22,674)
Net Cash Generated from Operating Activities 150,210 (76,920)
Investments activities cash flow
Marketable Securities 22,134 483
Amount Received on Disposal (Acquisition) of Investments 0 16,486
Amount Paid on the Acquisition of Investments (53,914) (57,105)
Fixed Asset Acquisition (256,940) (231,978)
Fixed Asset Sale Receipt 34,287 4,729
Additions to / Payments of Intangible Assets (15,149) (15,907)
Dividends Received 96,073 525
Purchase of Software (3,932) (5,753)
Net Cash Employed on Investments Activities (177,441) (288,520)
Financial Activities Cash Flow
Inflow of Loans, Financing and Debentures 706,490 96,006
Payment of Loans, Financ. & Debent. (589,194) (275,197)
Payment of Taxes Installments (2,355) (2,334)
Swap Operations Liquidations (5,141) (3,703)
Dividends and Interest on Capital (79,771) (1)
Net Cash Generated from (Employed on) Financial Activities 30,029 (185,229)
Exchange Variation on Cash and Cash Equivalents (194) (3,685)
Net Increase (Decrease) of Cash and Cash Equivalents 2,604 (554,354)
Cash and Cash Equivalents at the Beginning of the Period 2,078,833 2,633,187
Cash and Cash Equivalents at the End of The Period 2,081,437 2,078,833
RECONCILIATION WITH BALANCE SHEET
Cash and Cash Equivalents at the Beginning of the Period 2,078,833 2,633,187
Marketable Securities at the Beginning of the Period 835,146 835,629
Cash and Cash Equivalents at the Beginning of the Period 2,913,979 3,468,816
Net Increase (Decrease) of Cash and Cash Equivalentes 2,604 (554,354)
Net Increase (Decrease) of Marketable Securities (22,134) (483)
Cash and Cash Equivalents at the End of the Period 2,081,437 2,078,833
Marketable Securities at the End of the Period 813,012 835,146
Cash and Cash Equivalents at the End of the Period 2,894,449 2,913,979
Cash Flow - Consolidated | IFRS
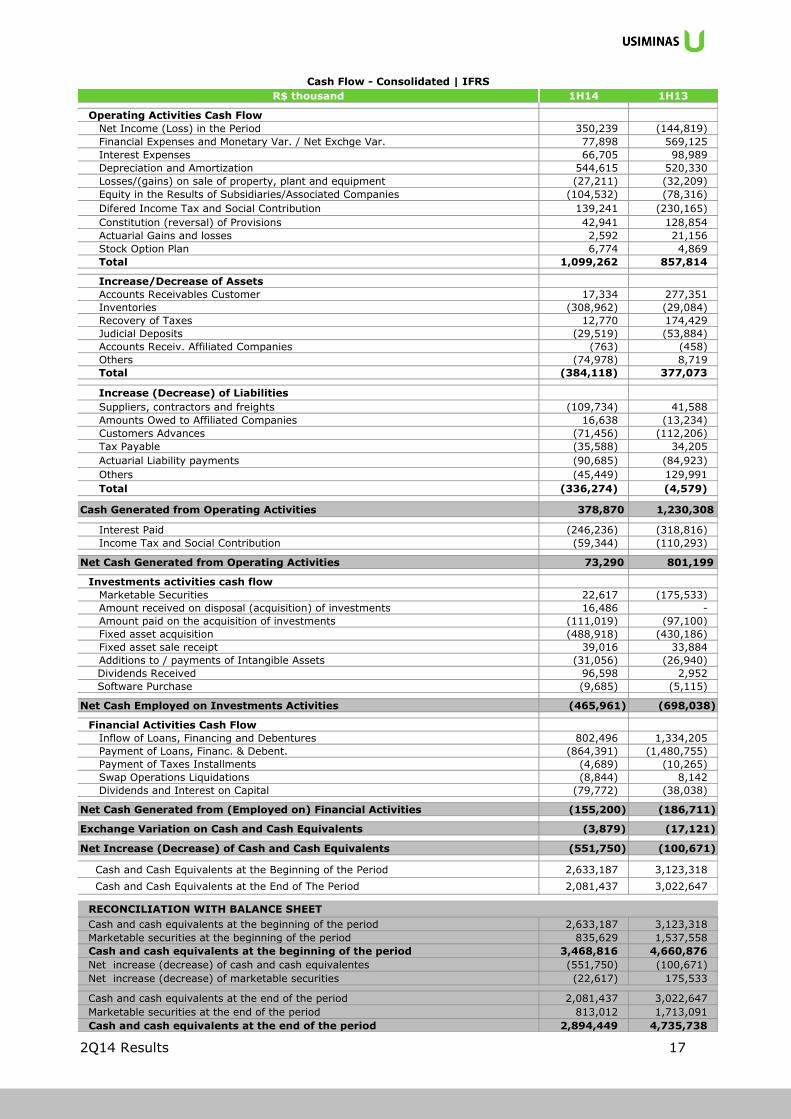
2Q14 Results 17
R$ thousand 1H14 1H13
Operating Activities Cash Flow
Net Income (Loss) in the Period 350,239 (144,819)
Financial Expenses and Monetary Var. / Net Exchge Var. 77,898 569,125
Interest Expenses 66,705 98,989
Depreciation and Amortization 544,615 520,330
Losses/(gains) on sale of property, plant and equipment (27,211) (32,209)
Equity in the Results of Subsidiaries/Associated Companies (104,532) (78,316)
Difered Income Tax and Social Contribution 139,241 (230,165)
Constitution (reversal) of Provisions 42,941 128,854
Actuarial Gains and losses 2,592 21,156
Stock Option Plan 6,774 4,869
Total 1,099,262 857,814
Increase/Decrease of Assets
Accounts Receivables Customer 17,334 277,351
Inventories (308,962) (29,084)
Recovery of Taxes 12,770 174,429
Judicial Deposits (29,519) (53,884)
Accounts Receiv. Affiliated Companies (763) (458)
Others (74,978) 8,719
Total (384,118) 377,073
Increase (Decrease) of Liabilities
Suppliers, contractors and freights (109,734) 41,588
Amounts Owed to Affiliated Companies 16,638 (13,234)
Customers Advances (71,456) (112,206)
Tax Payable (35,588) 34,205
Actuarial Liability payments (90,685) (84,923)
Others (45,449) 129,991
Total (336,274) (4,579)
Cash Generated from Operating Activities 378,870 1,230,308
Interest Paid (246,236) (318,816)
Income Tax and Social Contribution (59,344) (110,293)
Net Cash Generated from Operating Activities 73,290 801,199
Investments activities cash flow
Marketable Securities 22,617 (175,533)
Amount received on disposal (acquisition) of investments 16,486 -
Amount paid on the acquisition of investments (111,019) (97,100)
Fixed asset acquisition (488,918) (430,186)
Fixed asset sale receipt 39,016 33,884
Additions to / payments of Intangible Assets (31,056) (26,940)
Dividends Received 96,598 2,952
Software Purchase (9,685) (5,115)
Net Cash Employed on Investments Activities (465,961) (698,038)
Financial Activities Cash Flow
Inflow of Loans, Financing and Debentures 802,496 1,334,205
Payment of Loans, Financ. & Debent. (864,391) (1,480,755)
Payment of Taxes Installments (4,689) (10,265)
Swap Operations Liquidations (8,844) 8,142
Dividends and Interest on Capital (79,772) (38,038)
Net Cash Generated from (Employed on) Financial Activities (155,200) (186,711)
Exchange Variation on Cash and Cash Equivalents (3,879) (17,121)
Net Increase (Decrease) of Cash and Cash Equivalents (551,750) (100,671)
Cash and Cash Equivalents at the Beginning of the Period 2,633,187 3,123,318
Cash and Cash Equivalents at the End of The Period 2,081,437 3,022,647
RECONCILIATION WITH BALANCE SHEET
Cash and cash equivalents at the beginning of the period 2,633,187 3,123,318
Marketable securities at the beginning of the period 835,629 1,537,558
Cash and cash equivalents at the beginning of the period 3,468,816 4,660,876
Net increase (decrease) of cash and cash equivalentes (551,750) (100,671)
Net increase (decrease) of marketable securities (22,617) 175,533
Cash and cash equivalents at the end of the period 2,081,437 3,022,647
Marketable securities at the end of the period 813,012 1,713,091
Cash and cash equivalents at the end of the period 2,894,449 4,735,738
Cash Flow - Consolidated | IFRS