Embed Size (px)
Citation preview
3
ADP-ribosyl Transferase
NAD+
N
O
NH2
nicotinamide
Acceptor
C
CC
NC
NN
O
OHHO
O
P OHO
O
P OHO
O OAdenine
OHOH
Arg
ADP-ribose
Acceptor
Arg
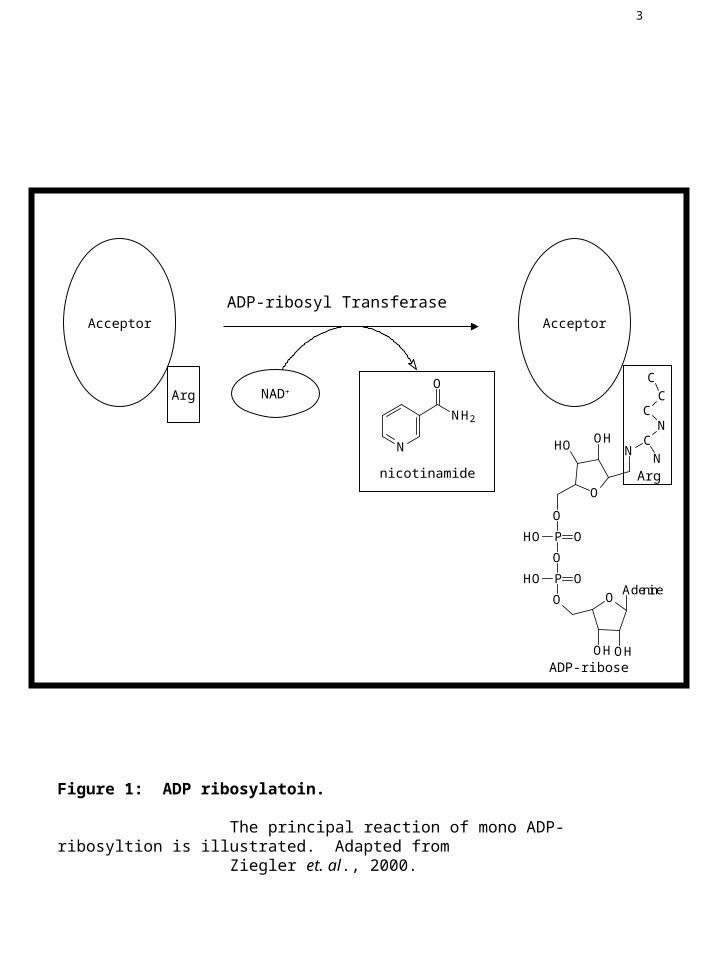
Figure 1: ADP ribosylatoin.
The principal reaction of mono ADP-ribosyltion is illustrated. Adapted from Ziegler et. al., 2000.
5
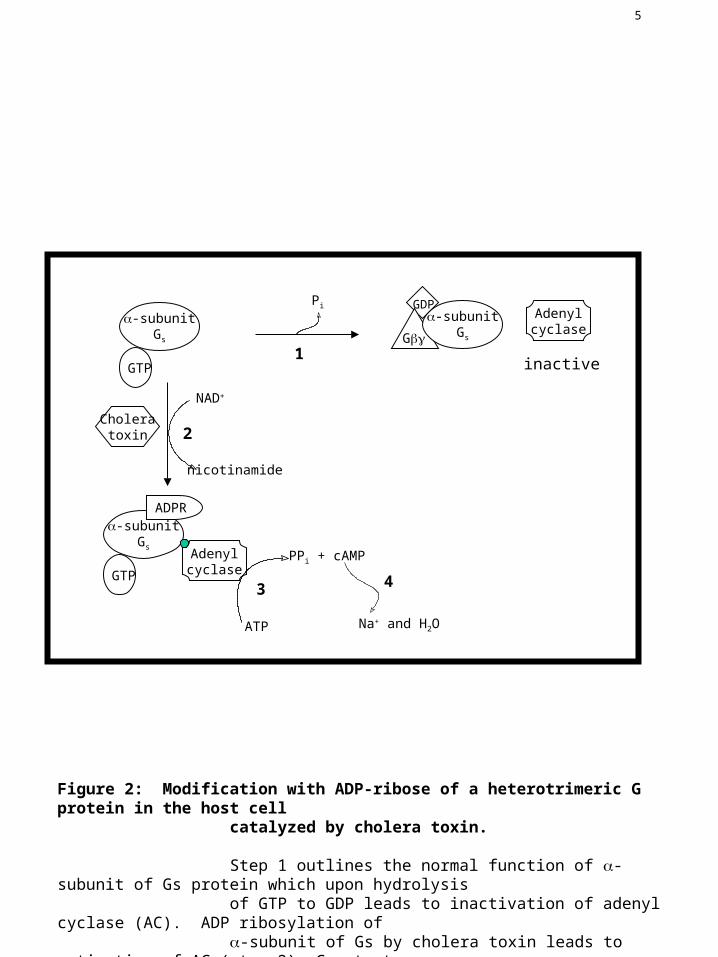
Figure 2: Modification with ADP-ribose of a heterotrimeric G protein in the host cell catalyzed by cholera toxin.
Step 1 outlines the normal function of -subunit of Gs protein which upon hydrolysis of GTP to GDP leads to inactivation of adenyl cyclase (AC). ADP ribosylation of -subunit of Gs by cholera toxin leads to activation of AC (step 2). Constant stimulation of AC leads to accumulation of cAMP levels in the cell (step 3) resulting in loss of sodium and water (step 4).
GDPPi
-subunitGs
GTP
-subunitGsG
Adenylcyclase
inactive1
NAD+
Choleratoxin
nicotinamide
-subunitGs
GTP
ADPR
Adenylcyclase
ATP
PPi + cAMP
2
3 4
Na+ and H2O
7
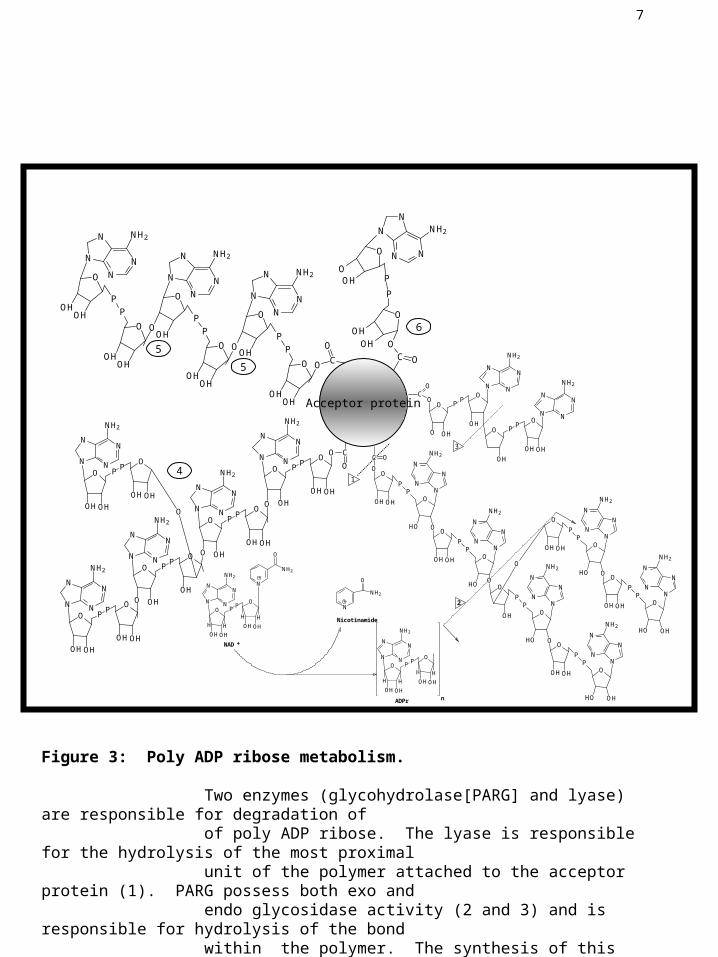
Figure 3: Poly ADP ribose metabolism.
Two enzymes (glycohydrolase[PARG] and lyase) are responsible for degradation of of poly ADP ribose. The lyase is responsible for the hydrolysis of the most proximal unit of the polymer attached to the acceptor protein (1). PARG possess both exo and endo glycosidase activity (2 and 3) and is responsible for hydrolysis of the bond within the polymer. The synthesis of this polymer is accomplished by PARP which catalyzes the initiation (6), elongation (5), and branching(4) reactions.
O
N
NN
N
NH2
O
OH
P
OH
PO
O P
OH
P
OH
O
NH2
N
NN
N
ON
NN
N
NH2
O
OHOH
P
OHOH
PO
O
O P
OH
P
OH
O
NH2
N
NN
N
OH
OH
O C
O
O
O P
OH OH
P
OH OH
O
NH2
N
NN
N
N
N
N
N
NH2
OHOH
O
P
P
OHOH
O O
OO
OHOH
P
P
O
OH
NH2
N
N
N
N
OO
OHOH
P
P
O
OH
NH2
N
N
N
N
C
O
Acceptor protein
O
O
OHOH
P
P
O
OH
NH2
N N
N
N
OC O
O
PP
O
NH2
N
N
N
N
OHOH
HO OO
PP
O
NH2
N
N
N
N
OHOH
HOO
OHHO
OH OH
N
N
N
N
NH2
OP
P
OOHO
OH
N
N
N
N
NH2
OP
P
O
O
O
PP
O
NH2
N
N
N
N
OH
HO OO
PP
O
NH2
N
N
N
N
OHOH
HO OH
OH
O
C O
2
NH2
N
NN
N
OH
O
OH
P
OH
POO
O
OH
P
OH
PO
N
NN
N
NH2
OC
O
3
N
NN
N
NH2
O
OHOH
P
OHOH
PO
N
O
NH2
H
HH
H
NAD+
N
O
NH2
Nicotinamide
N
NN
N
NH2
O
OHOH
P
OHOH
PO
H
HH
H
nADPr
4
5
5
6
1
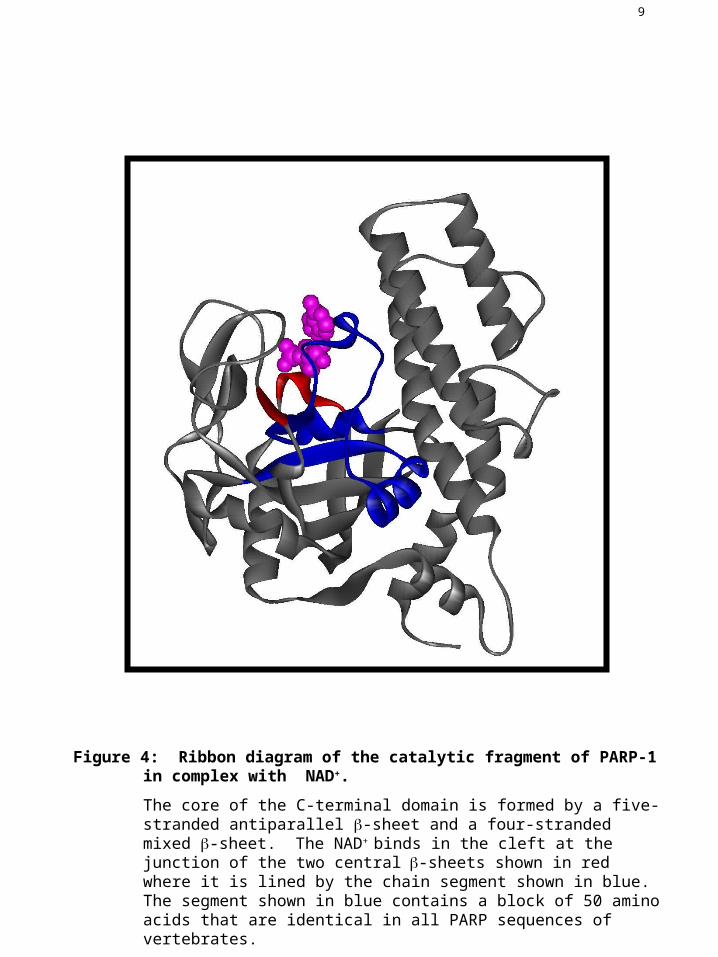
Figure 4: Ribbon diagram of the catalytic fragment of PARP-1 in complex with NAD+.
The core of the C-terminal domain is formed by a five-stranded antiparallel -sheet and a four-stranded mixed -sheet. The NAD+ binds in the cleft at the junction of the two central-sheets shown in red where it is lined by the chain segment shown in blue. The segment shown in blue contains a block of 50 amino acids that are identical in all PARP sequences of vertebrates.
9
10
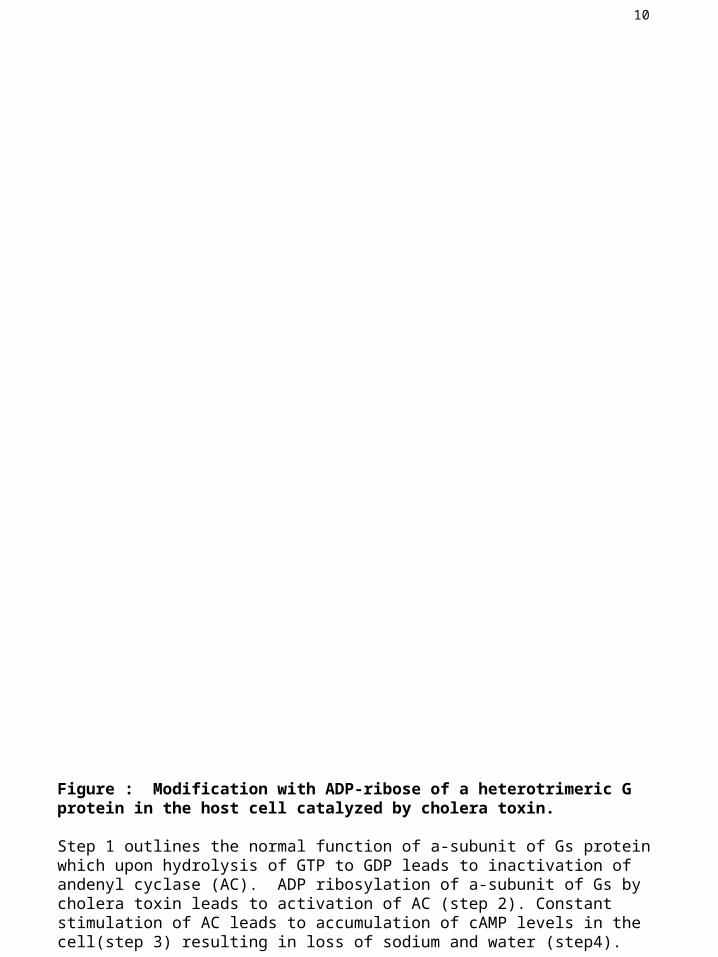
Figure : Modification with ADP-ribose of a heterotrimeric G protein in the host cell catalyzed by cholera toxin.
Step 1 outlines the normal function of a-subunit of Gs protein which upon hydrolysis of GTP to GDP leads to inactivation of andenyl cyclase (AC). ADP ribosylation of a-subunit of Gs by cholera toxin leads to activation of AC (step 2). Constant stimulation of AC leads to accumulation of cAMP levels in the cell(step 3) resulting in loss of sodium and water (step4).
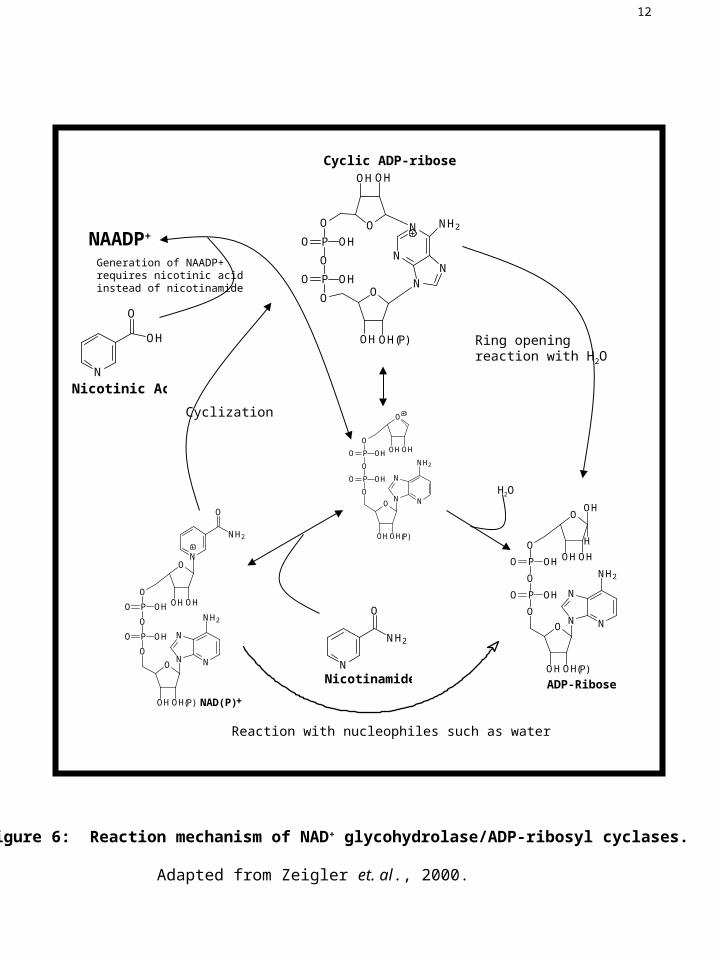
Figure 6: Reaction mechanism of NAD+ glycohydrolase/ADP-ribosyl cyclases.
Adapted from Zeigler et. al., 2000.
NN
N
NH2
O
OHOH
O
PO OH
O
PO OH
OOH OH
O
(P)
N
O
NH2
NAD(P)+
NN
N
NH2
O
OHOH
O
PO OH
O
PO OH
OOH OH
OOH
H
(P)
ADP-Ribose
N
O
NH2
Nicotinamide
Reaction with nucleophiles such as water
OO
PO OH
O
PO OH
O O NH2
NN
N
N
OHOH
OH(P)OH
Cyclic ADP-ribose
NN
N
NH2
O
OHOH
O
PO OH
O
PO OH
OOH OH
O
(P)
N
O
OH
Nicotinic Acid
NAADP+
Cyclization
Ring openingreaction with H2O
Generation of NAADP+requires nicotinic acid instead of nicotinamide
12
H2O
14
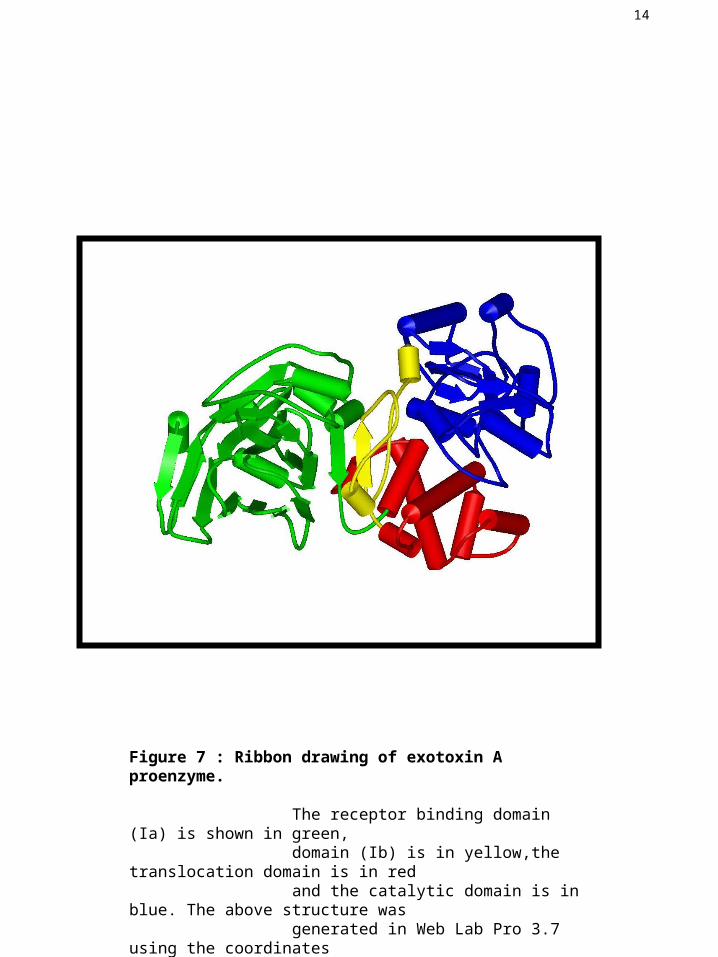
Figure 7 : Ribbon drawing of exotoxin A proenzyme.
The receptor binding domain (Ia) is shown in green, domain (Ib) is in yellow,the translocation domain is in red and the catalytic domain is in blue. The above structure was generated in Web Lab Pro 3.7 using the coordinates provided kindly by Dr. D. McKay.
Figure 9. Intoxication pathway of Pseudomonas aeruginosa exotoxin A.
The intoxication starts with binding of the toxin to specific receptors on the target cell and ends with the translocation of the catalytic fragment of the toxin to the cytoplasm where the toxin acts on its target. For details of the steps involved see text: step 1, binding and internalization of the toxin; step 2, partial unfolding and cleavage of whole toxin in the endosome; step 3, translocation from endosomes to the Gogi apparatus; step 4, translocation to ER through retrograde pathway; step 5 reduction of disulfide bond; and step 6 release of catalytic fragment into the cytoplasm.
1
2
3
4
5
6
19
22
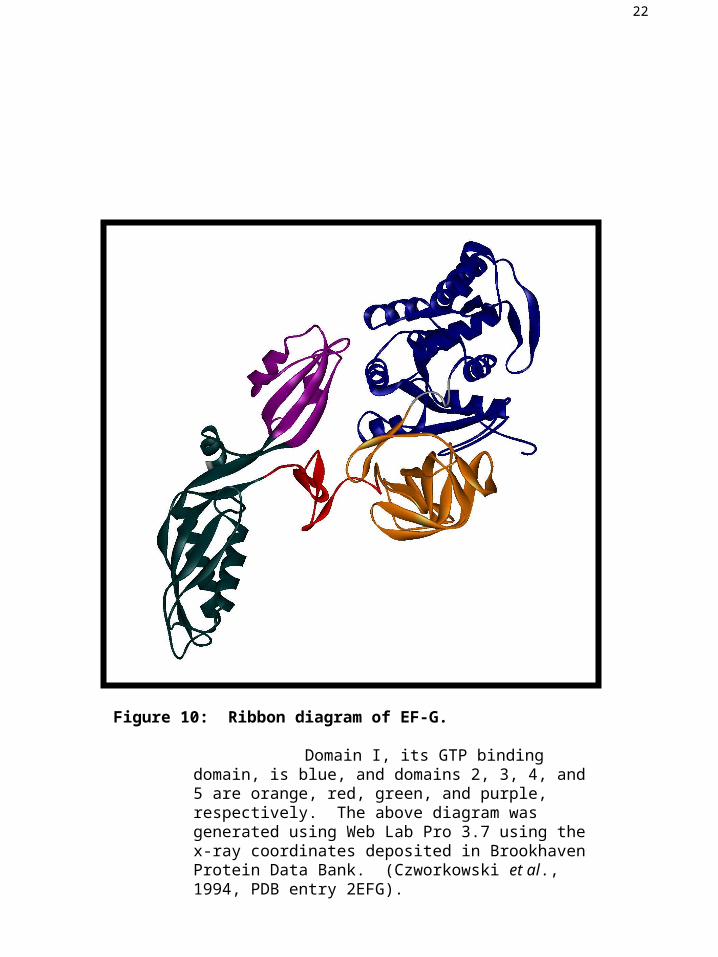
Figure 10: Ribbon diagram of EF-G.
Domain I, its GTP binding domain, is blue, and domains 2, 3, 4, and 5 are orange, red, green, and purple, respectively. The above diagram was generated using Web Lab Pro 3.7 using the x-ray coordinates deposited in Brookhaven Protein Data Bank. (Czworkowski et al., 1994, PDB entry 2EFG).
24
G r o u p C o m p o u n d S t r u c t u r e % i n h i b i t i o n
I . N i c o t i n a m i d e a n a l o g s N i c o t i n a m i d e 8 9
1 -M e t h y l n i c o t i n a m i d e
2 9
N i c o t i n i c a c i d 0
I I . B e n z a m i d e a n a l o g s 3 - A m i n o b e n z a m i d e 9 6
2 - A m i n o b e n z a m i d e 7 5
B e n z o i c a c i d 0
I I I . P u r i n e a n a l o g s T h e o p h y l l i n e 8 9
C a f f e i n e 3 5
6 - m e r c a p t o p u r i n e 1 6
N
O
N H 2
N
O
N H 2
C H 3
N
O
O H
O
N H 2
H 2 N
O
N H 2
N H 2
O
O H
N
N
N
N
O
O
C H 3
HH 3 C
N
N
N
N
O
O
C H 3
C H 3
H 3 C
N
N
N
N
HS HH 3 C
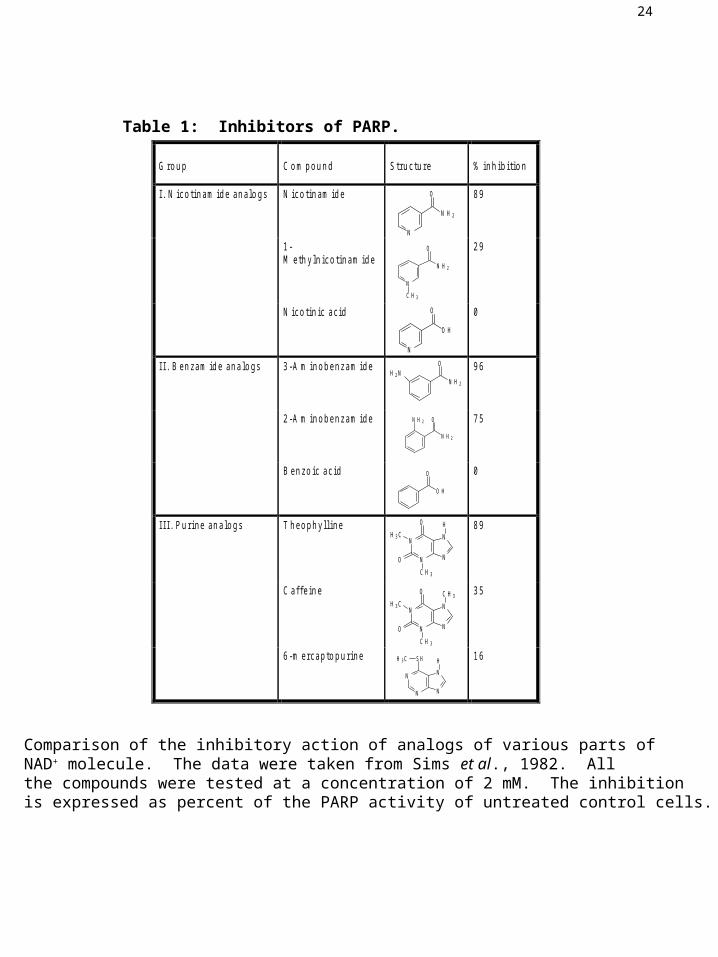
Table 1: Inhibitors of PARP.
Comparison of the inhibitory action of analogs of various parts ofNAD+ molecule. The data were taken from Sims et al., 1982. All the compounds were tested at a concentration of 2 mM. The inhibitionis expressed as percent of the PARP activity of untreated control cells.
25
N OO
H
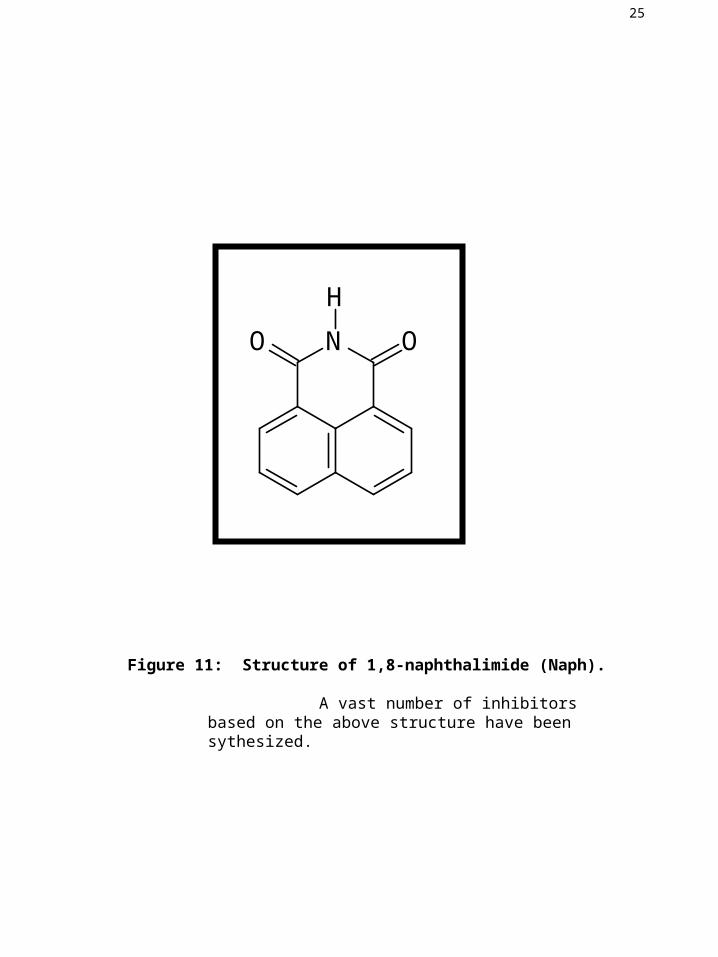
Figure 11: Structure of 1,8-naphthalimide (Naph).
A vast number of inhibitors based on the above structure have been sythesized.
26
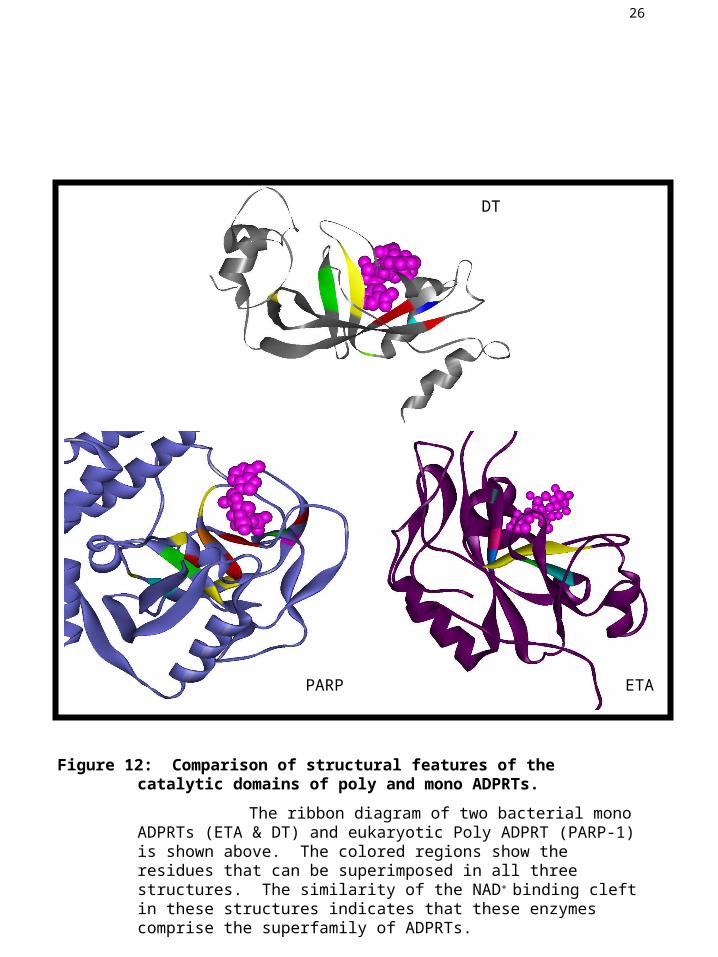
Figure 12: Comparison of structural features of the catalytic domains of poly and mono ADPRTs.
The ribbon diagram of two bacterial mono ADPRTs (ETA & DT) and eukaryotic Poly ADPRT (PARP-1) is shown above. The colored regions show the residues that can be superimposed in all three structures. The similarity of the NAD+ binding cleft in these structures indicates that these enzymes comprise the superfamily of ADPRTs.
DT
PARP ETA
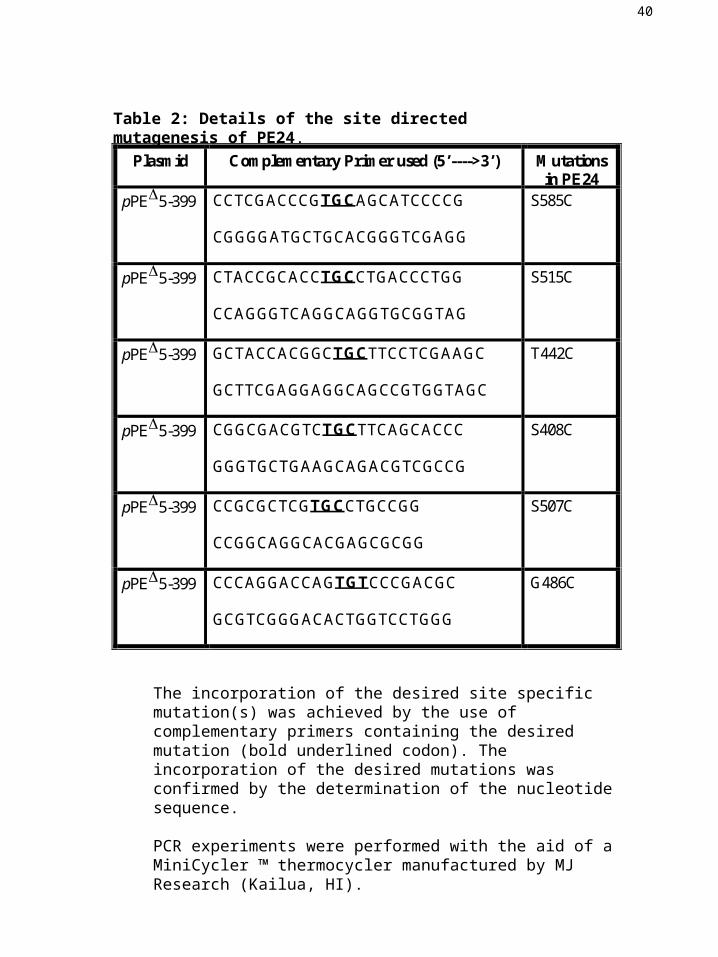
The incorporation of the desired site specific mutation(s) was achieved by the use of complementary primers containing the desired mutation (bold underlined codon). The incorporation of the desired mutations was confirmed by the determination of the nucleotide sequence.
PCR experiments were performed with the aid of a MiniCycler ™ thermocycler manufactured by MJ Research (Kailua, HI).
Plasmid Complementary Primer used (5’---->3’) Mutationsin PE24
pPE5-399 CCTCGACCCGTGCAGCATCCCCG
CGGGGATGCTGCACGGGTCGAGG
S585C
pPE5-399 CTACCGCACCTGCCTGACCCTGG
CCAGGGTCAGGCAGGTGCGGTAG
S515C
pPE5-399 GCTACCACGGCTGCTTCCTCGAAGC
GCTTCGAGGAGGCAGCCGTGGTAGC
T442C
pPE5-399 CGGCGACGTCTGCTTCAGCACCC
GGGTGCTGAAGCAGACGTCGCCG
S408C
pPE5-399 CCGCGCTCGTGCCTGCCGG
CCGGCAGGCACGAGCGCGG
S507C
pPE5-399 CCCAGGACCAGTGTCCCGACGC
GCGTCGGGACACTGGTCCTGGG
G486C
Table 2: Details of the site directed mutagenesis of PE24.
40
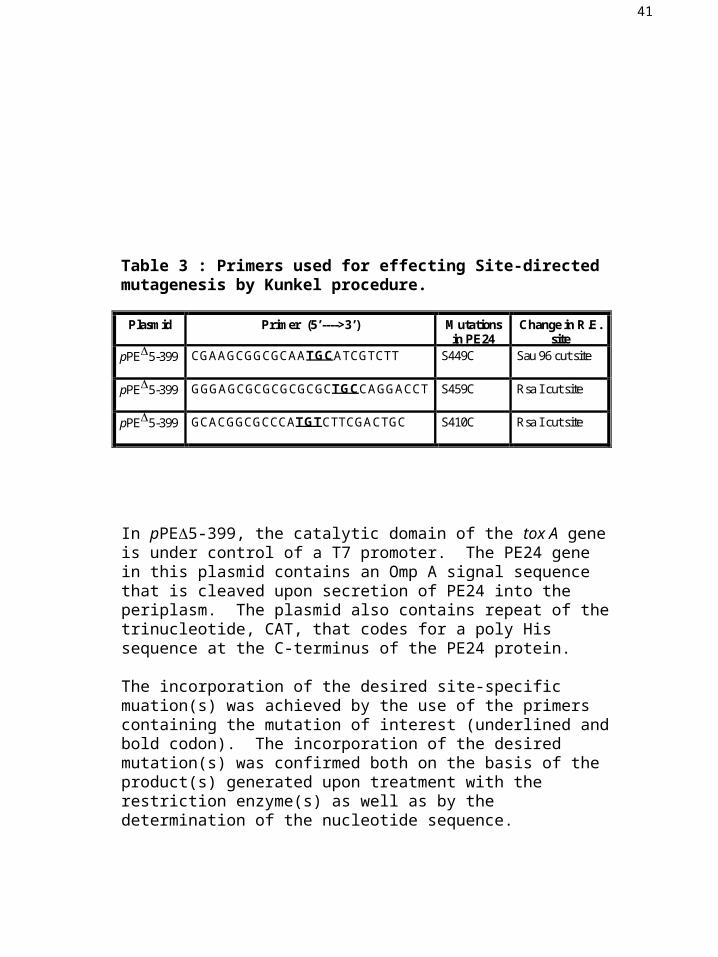
Plasmid Primer (5’---->3’) Mutationsin PE24
Change in R.E.site
pPE5-399 CGAAGCGGCGCAATGCATCGTCTT S449C Sau 96 cut site
pPE5-399 GGGAGCGCGCGCGCGCTGCCAGGACCT S459C Rsa I cut site
pPE5-399 GCACGGCGCCCATGTCTTCGACTGC S410C Rsa I cut site
In pPE5-399, the catalytic domain of the tox A gene is under control of a T7 promoter. The PE24 gene in this plasmid contains an Omp A signal sequence that is cleaved upon secretion of PE24 into the periplasm. The plasmid also contains repeat of the trinucleotide, CAT, that codes for a poly His sequence at the C-terminus of the PE24 protein.
The incorporation of the desired site-specific muation(s) was achieved by the use of the primers containing the mutation of interest (underlined and bold codon). The incorporation of the desired mutation(s) was confirmed both on the basis of the product(s) generated upon treatment with the restriction enzyme(s) as well as by the determination of the nucleotide sequence.
Table 3 : Primers used for effecting Site-directed mutagenesis by Kunkel procedure.
41
Each of the protein preparations were incubated in 200 mM Tris, pH 8.1 with the indicated excess of DTT (mol DTT: mol PE24) at 4 ºC. A concentrated solution of IAEDANS was added to the reaction mixture to give a molar excess as indicated above (IAEDANS: PE24 variant + DTT). The reaction mixture was gently mixed on a nutator for specified amount of time at room temperature.
* indicates the reaction mixtures that were incubated at r.t. with DTT.
Protein DTT
Molar excess
Reaction
Time with DTT
1,5-IAEDANS
Molar excess
Reaction
Time with IAEDANS
S408C* 50 2 hrs 100 2 hrs
S410C 10 30 min 30 25 min
T442C 10 30 min 30 25 min
S449C 10 30 min 30 25 min
S459C 10 30 min 30 25 min
G486C 10 30 min 30 25 min
S507C 10 30 min 30 25 min
S515C* 20 1 hr 50 1.5 hrs
S585C 10 30 min 20 15 min
Table 4: Reaction conditions for chemical modification of PE24 variants.
48
*
*