Embed Size (px)
Citation preview
INTERNATIONAL JOURNAL OF ENERGY RESEARCHInt. J. Energy Res. 2010; 34:716–735Published online 30 July 2009 in Wiley InterScience(www.interscience.wiley.com). DOI: 10.1002/er.1593
3-E analysis of advanced power plants based on high ash coal
M. V. J. J. Suresh, K. S. Reddy�,y and Ajit Kumar Kolar
Heat Transfer and Thermal Power Laboratory, Department of Mechanical Engineering, Indian Institute of Technology Madras,Chennai-600 036, India
SUMMARY
The objective of the study is to identify the ‘best’ possible power plant configuration based on 3-E (namely energy,exergy, and environmental) analysis of coal-based thermal power plants involving conventional (subcritical (SubC)) andadvanced steam parameters (supercritical (SupC) and ultrasupercritical (USC)) in Indian climatic conditions using highash (HA) coal. The analysis is made for unit configurations of three power plants, specifically, an operating SubC steampower plant, a SupC steam power plant, and the AD700 (advanced 7001C) power plant involving USC steamconditions. In particular, the effect of HA Indian coal and low ash (LA) reference coal on the performance of thesepower plants is studied. The environmental impact of the power plants is estimated in terms of specific emissions ofCO2, SOx, NOx, and particulates. From the study, it is concluded that the maximum possible plant energy efficiencyunder the Indian climatic conditions using HA Indian coal is about 42.3% with USC steam conditions. The resultsdisclose that the major energy loss is associated with the heat rejection in the cooling water, whereas the maximumexergy destruction takes place in the combustor. Further, the sliding pressure control technique of load following resultsin higher plant energy and exergy efficiencies compared to throttle control in part-load operation. Copyright r 2009John Wiley & Sons, Ltd.
KEY WORDS: coal; energy; exergy; emissions; subcritical; supercritical; ultrasupercritical
1. INTRODUCTION
India has substantial amounts of proven reservesof coal of about 98.5 billion tonnes [1] and thuscoal-based thermal power plants dominate thesource-wise mix with 52.5% installed capacity of atotal of about 147.5GWe [2]. The total electricitygeneration in 2007–2008 from conventional powerresources like coal/lignite, large hydro, naturalgas, nuclear, and diesel was 705 billion units
(1 unit5 1 kWh) and among these resources coalalone contributed about two-thirds to the total [2].Further, the coal-based power plants in Indiaoperate on sub-critical steam conditions. However,the Indian coal is of low grade with a very highmineral matter content of 45% but it is also ofhigh quality with sulfur content of less than 0.6%.In order to address increasing electricity demandand concern for environmental safety, it isimperative to install power plants based on
*Correspondence to: K. S. Reddy, Faculty of Mechanical Engineering, Indian Institute of Technology Madras, Chennai-600 036,India.yE-mail: [email protected]
Received 8 March 2009
Revised 26 May 2009
Accepted 11 June 2009Copyright r 2009 John Wiley & Sons, Ltd.
advanced coal technologies that are (more) energyefficient, environmentally acceptable, and econom-ically viable.
Thermodynamic analysis based on energy andexergy provides insight into losses in various com-ponents of a system [3–6]. Unlike energy, the exergyis not generally conserved but is destroyed. So, themajority of the causes of irreversibilities like heattransfer through a finite temperature difference,chemical reactions, friction, and mixing are ac-counted by exergy analysis [7]. The design and part-load performance of a 400MWe thermal powerplant based on energy and exergy analysis has beenstudied by Habib et al. [8]. Dincer and Al-Muslim[9] carried out the thermodynamic analysis of reheatcycle steam power plant. Energy and exergy effi-ciencies were analyzed by varying system para-meters such as temperature and pressure at theboiler outlet, and the work output. Rosen [10] re-ported energy- and exergy-based comparisons ofcoal-fired and nuclear power plant of unit size ofapproximately 500MWe. Sengupta et al. [11] car-ried out the exergy analysis of a 210MWe coal-based thermal power plant. The major source ofirreversibility in the power plant cycle was identifiedas the boiler. It was shown that the sliding pressuremode improves the exergy efficiencies in part-loadoperation. During part-load operation, the powerplant is required to generate a lower output than thedesign capacity to meet the reduced demand. Thepower output is reduced using suitable pressurecontrol techniques. The two widely used pressurecontrol techniques during part-load operation aresliding pressure control and throttling control. Inthe case of sliding pressure control, the pressure inthe steam generator is reduced in order to get alower power output, whereas in the case of throt-tling control, a pressure-reducing valve is used in themain steam line before the turbine. Rosen and Tang[12] studied the effect of altering combustion airflow on a steam power plant through energy andexergy analysis. Kopac and Hilalci [13] reported theeffect of ambient temperature on the efficiency of apower plant using energy and exergy analysis.Ameri et al. [14] performed the energy, exergy, andexergoeconomic analysis of a steam power plant.The effects of load variations and ambient tem-perature were calculated to obtain insight into the
analysis. Bugge et al. [15] presented the status andperspectives for the AD700 (advanced 7001C)technology that involves the development of a coal-fired power plant with steam temperature of 7001C.Energy and exergy analysis of combined cyclepower plants has also been widely reported in theliterature [16–18]. Over 60% of the installed thermalpower capacity in India is accounted by 200/210 and500MWe units based on pulverized coal-fired boi-lers [19]. The plant energy efficiencies of old powerplants in India are still around 30% and the modernsubcritical (SubC) cycles (500MWe unit size) haveattained plant energy efficiencies of about 35–37%based on higher heating value (HHV) of fuel [20].Migrating to higher steam parameters is one of themethods to improve the plant energy efficiency andreduce specific emissions (emissions/kWh). Makinga beginning in this direction, the first power plantbased on supercritical (SupC) steam conditions inIndia is being installed at Sipat by National Ther-mal Power Corporation Limited (NTPC) [20].
There is a dearth of literature dealing with thethermodynamic analysis of power plants based onhigh ash (HA) coal and advanced steam para-meters in Indian climatic conditions where the de-sign ambient temperature is taken as 331C. Such ananalysis attains utmost importance in selecting theappropriate technologies for future capacity addi-tion. The objective of this paper is to analyze the3-E performance of the coal power plants based onconventional and advanced steam parameters andpredict the improvement, if any, in plant energyand exergy efficiencies and specific emissions inIndian climatic conditions for Indian HA coalusing the design data of the power plant config-urations. The specific emissions of CO2, SOx, NOx,and particulates were calculated to quantify theenvironmental impact. The part-load performanceanalysis has also been carried out to find the var-iation of plant energy and exergy efficiencies.
2. POWER PLANT CONFIGURATIONS ANDFUEL CHARACTERISTICS
2.1. SubC power plant
A 500MWe pulverized coal combustion powerplant based on SubC steam parameters and run by
3-E ANALYSIS OF ADVANCED POWER PLANTS 717
Copyright r 2009 John Wiley & Sons, Ltd. Int. J. Energy Res. 2010; 34:716–735
DOI: 10.1002/er
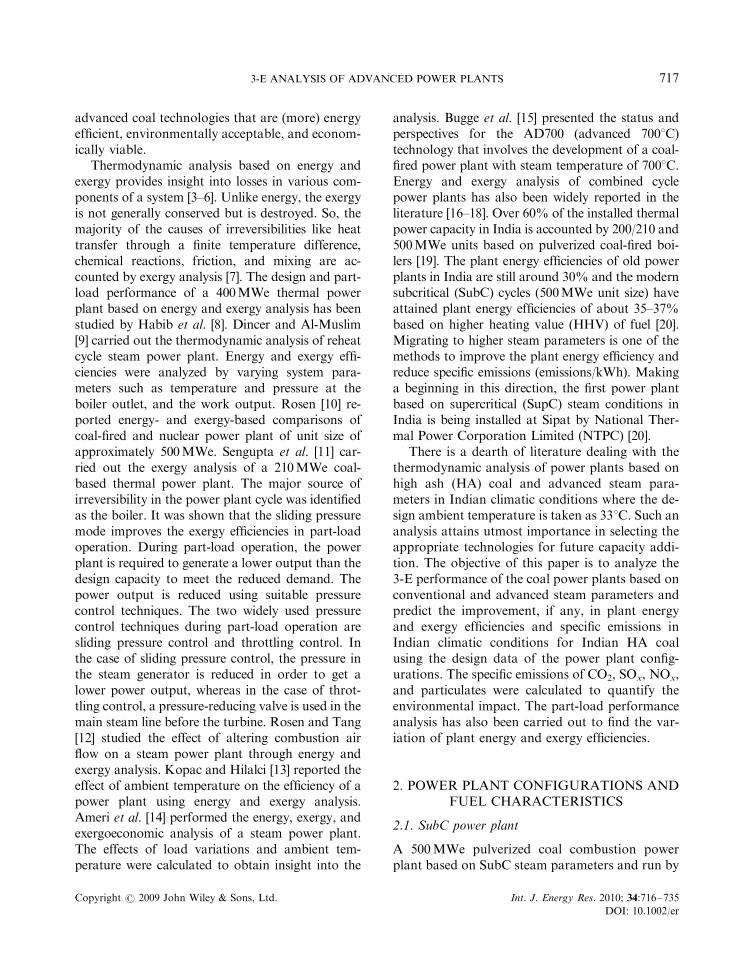
NTPC, India was chosen as a reference [20]. Theconfiguration of the SubC power plant with steamparameters of 166.7 bar/5371C/5371C is shown inFigure 1. It has one single-flow high-pressurecylinder, one double-flow intermediate-pressurecylinder, and one double-flow low-pressure cylin-der. It has three low-pressure feed water heaters(LPFWHs) and two high-pressure feed waterheaters (HPFWHs). The plant uses a single stagereheating with the final feed water temperature ofabout 2531C.
2.2. SupC power plant
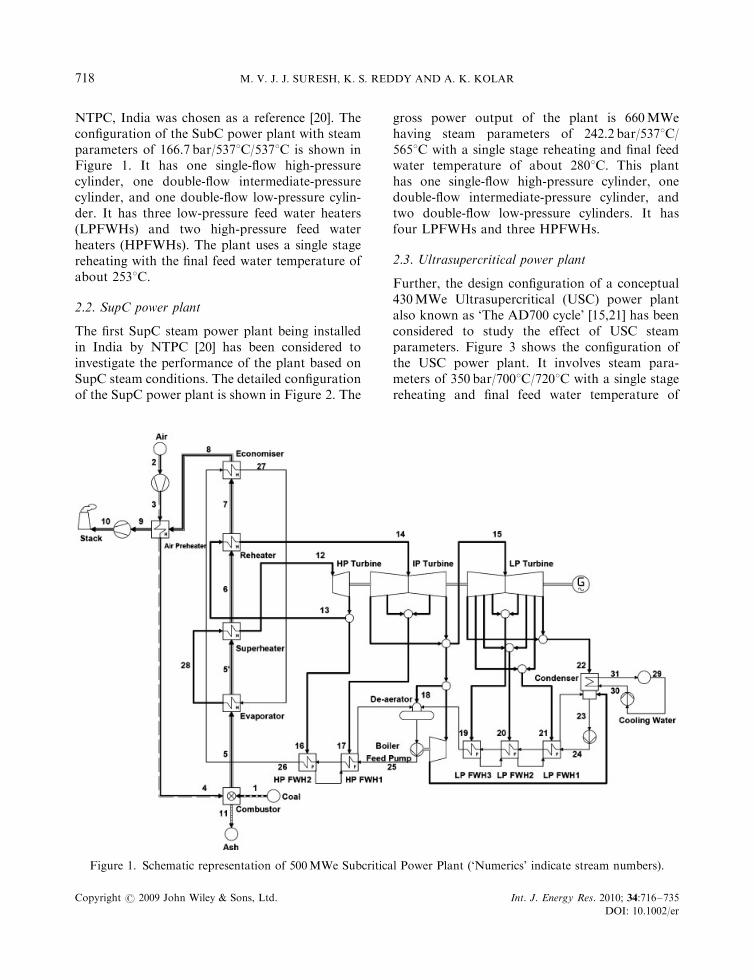
The first SupC steam power plant being installedin India by NTPC [20] has been considered toinvestigate the performance of the plant based onSupC steam conditions. The detailed configurationof the SupC power plant is shown in Figure 2. The
gross power output of the plant is 660MWehaving steam parameters of 242.2 bar/5371C/5651C with a single stage reheating and final feedwater temperature of about 2801C. This planthas one single-flow high-pressure cylinder, onedouble-flow intermediate-pressure cylinder, andtwo double-flow low-pressure cylinders. It hasfour LPFWHs and three HPFWHs.
2.3. Ultrasupercritical power plant
Further, the design configuration of a conceptual430MWe Ultrasupercritical (USC) power plantalso known as ‘The AD700 cycle’ [15,21] has beenconsidered to study the effect of USC steamparameters. Figure 3 shows the configuration ofthe USC power plant. It involves steam para-meters of 350 bar/7001C/7201C with a single stagereheating and final feed water temperature of
Figure 1. Schematic representation of 500MWe Subcritical Power Plant (‘Numerics’ indicate stream numbers).
M. V. J. J. SURESH, K. S. REDDY AND A. K. KOLAR718
Copyright r 2009 John Wiley & Sons, Ltd. Int. J. Energy Res. 2010; 34:716–735
DOI: 10.1002/er
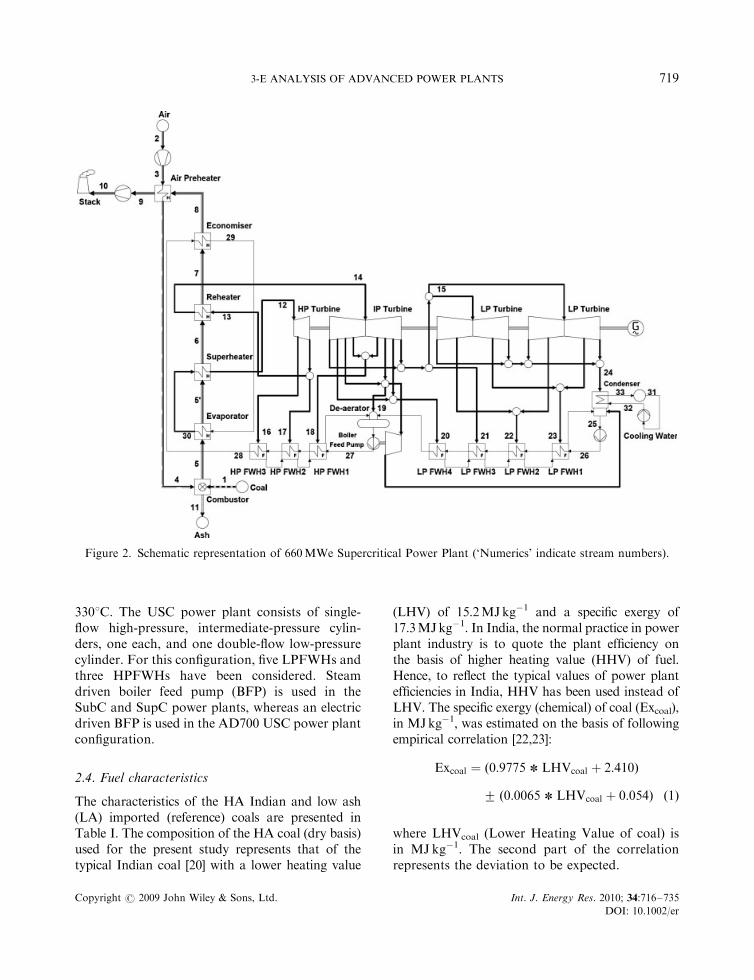
3301C. The USC power plant consists of single-flow high-pressure, intermediate-pressure cylin-ders, one each, and one double-flow low-pressurecylinder. For this configuration, five LPFWHs andthree HPFWHs have been considered. Steamdriven boiler feed pump (BFP) is used in theSubC and SupC power plants, whereas an electricdriven BFP is used in the AD700 USC power plantconfiguration.
2.4. Fuel characteristics
The characteristics of the HA Indian and low ash(LA) imported (reference) coals are presented inTable I. The composition of the HA coal (dry basis)used for the present study represents that of thetypical Indian coal [20] with a lower heating value
(LHV) of 15.2MJkg�1 and a specific exergy of17.3MJkg�1. In India, the normal practice in powerplant industry is to quote the plant efficiency onthe basis of higher heating value (HHV) of fuel.Hence, to reflect the typical values of power plantefficiencies in India, HHV has been used instead ofLHV. The specific exergy (chemical) of coal (Excoal),in MJkg�1, was estimated on the basis of followingempirical correlation [22,23]:
Excoal ¼ ð0:9775 n LHVcoal þ 2:410Þ
� ð0:0065 n LHVcoal þ 0:054Þ ð1Þ
where LHVcoal (Lower Heating Value of coal) isin MJ kg�1. The second part of the correlationrepresents the deviation to be expected.
Figure 2. Schematic representation of 660MWe Supercritical Power Plant (‘Numerics’ indicate stream numbers).
3-E ANALYSIS OF ADVANCED POWER PLANTS 719
Copyright r 2009 John Wiley & Sons, Ltd. Int. J. Energy Res. 2010; 34:716–735
DOI: 10.1002/er
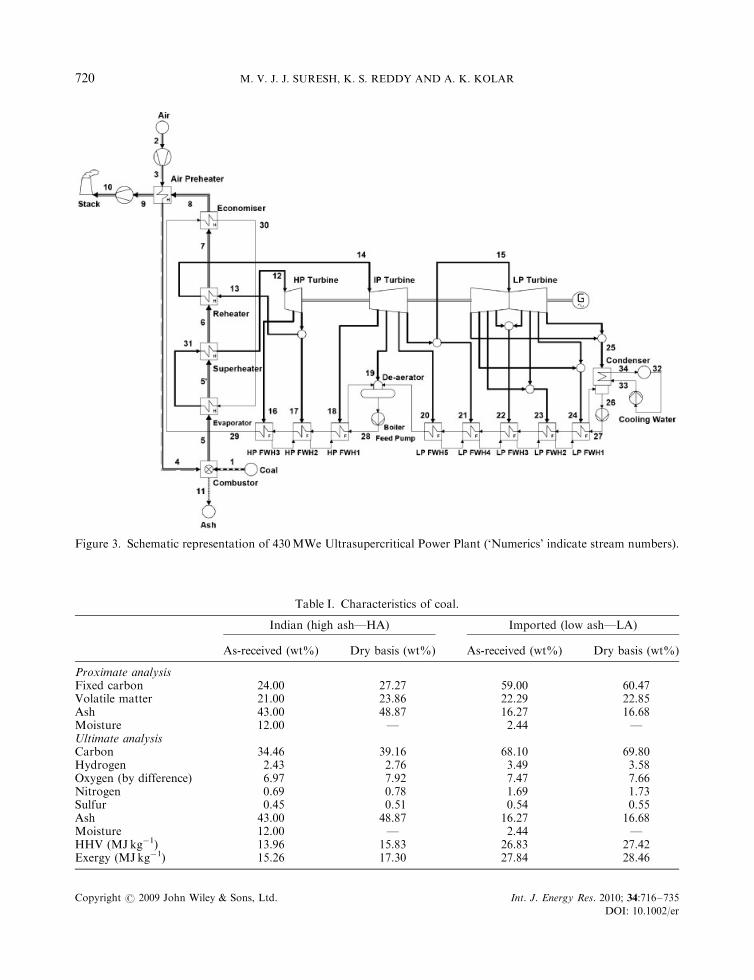
Figure 3. Schematic representation of 430MWe Ultrasupercritical Power Plant (‘Numerics’ indicate stream numbers).
Table I. Characteristics of coal.
Indian (high ash—HA) Imported (low ash—LA)
As-received (wt%) Dry basis (wt%) As-received (wt%) Dry basis (wt%)
Proximate analysisFixed carbon 24.00 27.27 59.00 60.47Volatile matter 21.00 23.86 22.29 22.85Ash 43.00 48.87 16.27 16.68Moisture 12.00 — 2.44 —Ultimate analysisCarbon 34.46 39.16 68.10 69.80Hydrogen 2.43 2.76 3.49 3.58Oxygen (by difference) 6.97 7.92 7.47 7.66Nitrogen 0.69 0.78 1.69 1.73Sulfur 0.45 0.51 0.54 0.55Ash 43.00 48.87 16.27 16.68Moisture 12.00 — 2.44 —HHV (MJkg�1) 13.96 15.83 26.83 27.42Exergy (MJkg�1) 15.26 17.30 27.84 28.46
M. V. J. J. SURESH, K. S. REDDY AND A. K. KOLAR720
Copyright r 2009 John Wiley & Sons, Ltd. Int. J. Energy Res. 2010; 34:716–735
DOI: 10.1002/er
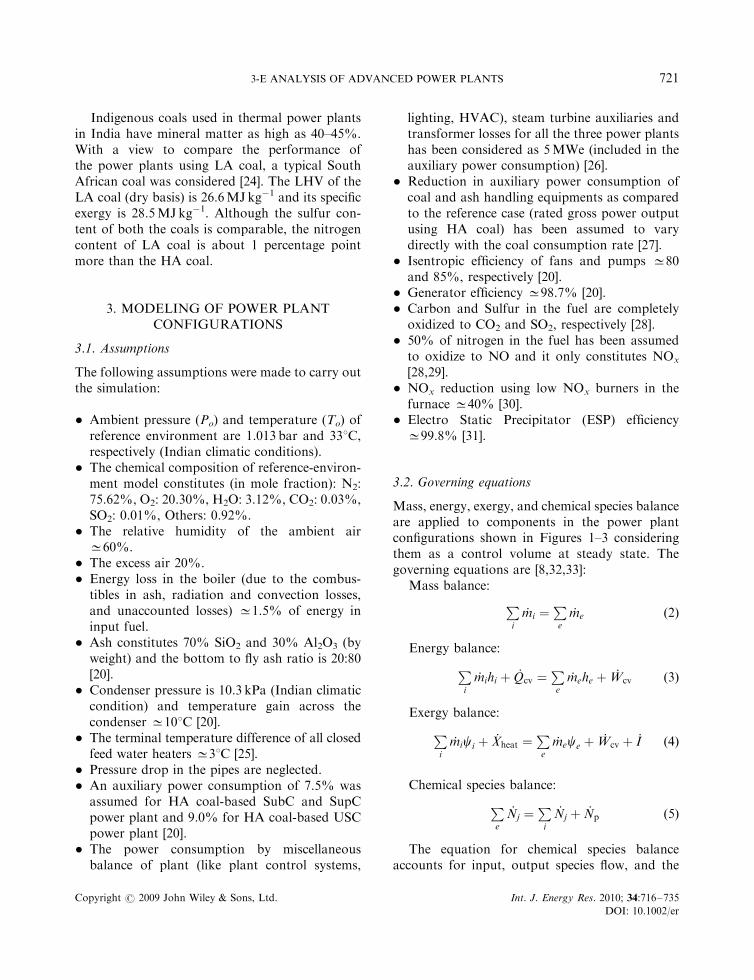
Indigenous coals used in thermal power plantsin India have mineral matter as high as 40–45%.With a view to compare the performance ofthe power plants using LA coal, a typical SouthAfrican coal was considered [24]. The LHV of theLA coal (dry basis) is 26.6MJkg�1 and its specificexergy is 28.5MJkg�1. Although the sulfur con-tent of both the coals is comparable, the nitrogencontent of LA coal is about 1 percentage pointmore than the HA coal.
3. MODELING OF POWER PLANTCONFIGURATIONS
3.1. Assumptions
The following assumptions were made to carry outthe simulation:
� Ambient pressure (Po) and temperature (To) ofreference environment are 1.013 bar and 331C,respectively (Indian climatic conditions).
� The chemical composition of reference-environ-ment model constitutes (in mole fraction): N2:75.62%, O2: 20.30%, H2O: 3.12%, CO2: 0.03%,SO2: 0.01%, Others: 0.92%.
� The relative humidity of the ambient airC60%.
� The excess air 20%.� Energy loss in the boiler (due to the combus-
tibles in ash, radiation and convection losses,and unaccounted losses) C1.5% of energy ininput fuel.
� Ash constitutes 70% SiO2 and 30% Al2O3 (byweight) and the bottom to fly ash ratio is 20:80[20].
� Condenser pressure is 10.3 kPa (Indian climaticcondition) and temperature gain across thecondenser C101C [20].
� The terminal temperature difference of all closedfeed water heaters C31C [25].
� Pressure drop in the pipes are neglected.� An auxiliary power consumption of 7.5% was
assumed for HA coal-based SubC and SupCpower plant and 9.0% for HA coal-based USCpower plant [20].
� The power consumption by miscellaneousbalance of plant (like plant control systems,
lighting, HVAC), steam turbine auxiliaries andtransformer losses for all the three power plantshas been considered as 5MWe (included in theauxiliary power consumption) [26].
� Reduction in auxiliary power consumption ofcoal and ash handling equipments as comparedto the reference case (rated gross power outputusing HA coal) has been assumed to varydirectly with the coal consumption rate [27].
� Isentropic efficiency of fans and pumps C80and 85%, respectively [20].
� Generator efficiency C98.7% [20].� Carbon and Sulfur in the fuel are completely
oxidized to CO2 and SO2, respectively [28].� 50% of nitrogen in the fuel has been assumed
to oxidize to NO and it only constitutes NOx
[28,29].� NOx reduction using low NOx burners in the
furnace C40% [30].� Electro Static Precipitator (ESP) efficiency
C99.8% [31].
3.2. Governing equations
Mass, energy, exergy, and chemical species balanceare applied to components in the power plantconfigurations shown in Figures 1–3 consideringthem as a control volume at steady state. Thegoverning equations are [8,32,33]:
Mass balance:
P
i
_mi ¼P
e
_me ð2Þ
Energy balance:
P
i
_mihi þ _Qcv ¼P
e
_mehe þ _Wcv ð3Þ
Exergy balance:
P
i
_mici þ _Xheat ¼P
e
_mece þ _Wcv þ _I ð4Þ
Chemical species balance:
P
e
_Nj ¼P
i
_Nj þ _Np ð5Þ
The equation for chemical species balanceaccounts for input, output species flow, and the
3-E ANALYSIS OF ADVANCED POWER PLANTS 721
Copyright r 2009 John Wiley & Sons, Ltd. Int. J. Energy Res. 2010; 34:716–735
DOI: 10.1002/er
rate of production of species due to chemicalreactions in a control volume. This equation isapplicable throughout the air/flue gas circuit, andin particular, the combustor, where the chemicalreactions take place.
3.3. Simulation procedure
The power plant configuration constitutes variousinterconnected circuits each of which consists ofdifferent components. These components are inturn connected by pipes involving appropriatemedia, thus forming a complex network of massand energy flows. A comprehensive thermody-namic analysis of such system involves the solutionof a large number of equations necessitating theneed for an efficient code with an extensivedatabase of thermodynamic properties. Hence, aflow-sheet computer program, ‘Cycle-Tempo’, asoftware package for the steady-state thermody-namic modeling and analysis of systems for theproduction of electricity, heat and refrigeration,was used for this study [23,34]. Part-load perfor-mance can also be carried out as correlationsgoverning the equipment performance are in-cluded in the package. The performance of thestate-of-the-art power plants has been estimatedby a detailed component-wise modeling followedby a system simulation. It involves the prepara-tion of the process flow diagrams of the system(power plant configurations) to be analyzed.Then the required operating conditions forindividual components like one or more inlet oroutlet pressure, temperature, and efficiencies ofpumps and motors are specified. Based on theinput data, the flow rates and state conditions ofstreams, composition, and heat/work outputs arecalculated.
3.4. Performance parameters
The performance of the power plants is evaluatedin terms of plant energy efficiency, Z, and exergyefficiency, e as follows [10,12]:
Plant energy efficiency,
Z ¼Net energy output with electricity
Energy inputð6Þ
or
Z ¼Net work output rate
Mass flow rate of coal�HHV of the coal
Plant exergy efficiency,
e ¼Net exergy output with electricity
Exergy inputð7Þ
or
e¼Network output rate
Mass flow rate of coal�Specific exergy of the coal
4. RESULTS AND DISCUSSION
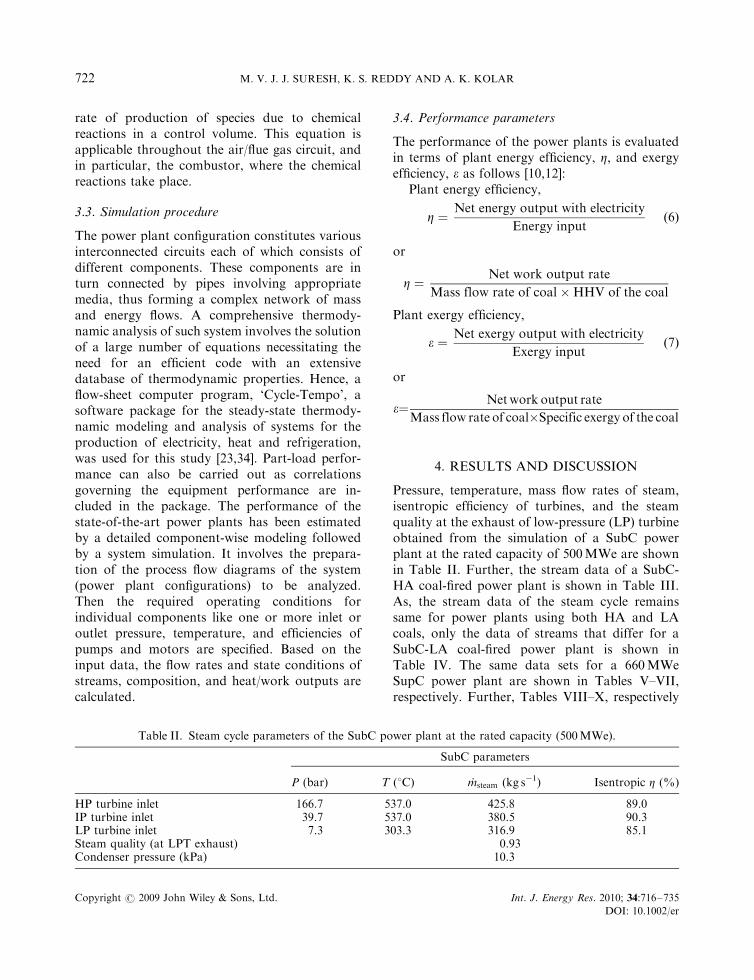
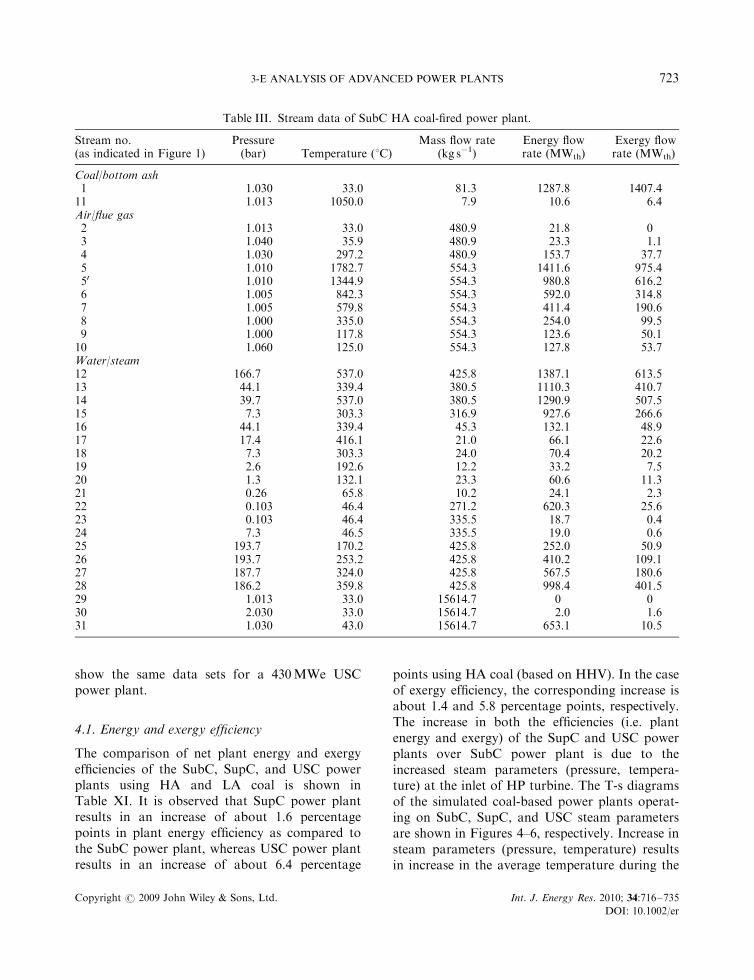
Pressure, temperature, mass flow rates of steam,isentropic efficiency of turbines, and the steamquality at the exhaust of low-pressure (LP) turbineobtained from the simulation of a SubC powerplant at the rated capacity of 500MWe are shownin Table II. Further, the stream data of a SubC-HA coal-fired power plant is shown in Table III.As, the stream data of the steam cycle remainssame for power plants using both HA and LAcoals, only the data of streams that differ for aSubC-LA coal-fired power plant is shown inTable IV. The same data sets for a 660MWeSupC power plant are shown in Tables V–VII,respectively. Further, Tables VIII–X, respectively
Table II. Steam cycle parameters of the SubC power plant at the rated capacity (500MWe).
SubC parameters
P (bar) T (1C) _msteam (kg s�1) Isentropic Z (%)
HP turbine inlet 166.7 537.0 425.8 89.0IP turbine inlet 39.7 537.0 380.5 90.3LP turbine inlet 7.3 303.3 316.9 85.1Steam quality (at LPT exhaust) 0.93Condenser pressure (kPa) 10.3
M. V. J. J. SURESH, K. S. REDDY AND A. K. KOLAR722
Copyright r 2009 John Wiley & Sons, Ltd. Int. J. Energy Res. 2010; 34:716–735
DOI: 10.1002/er
show the same data sets for a 430MWe USCpower plant.
4.1. Energy and exergy efficiency
The comparison of net plant energy and exergyefficiencies of the SubC, SupC, and USC powerplants using HA and LA coal is shown inTable XI. It is observed that SupC power plantresults in an increase of about 1.6 percentagepoints in plant energy efficiency as compared tothe SubC power plant, whereas USC power plantresults in an increase of about 6.4 percentage
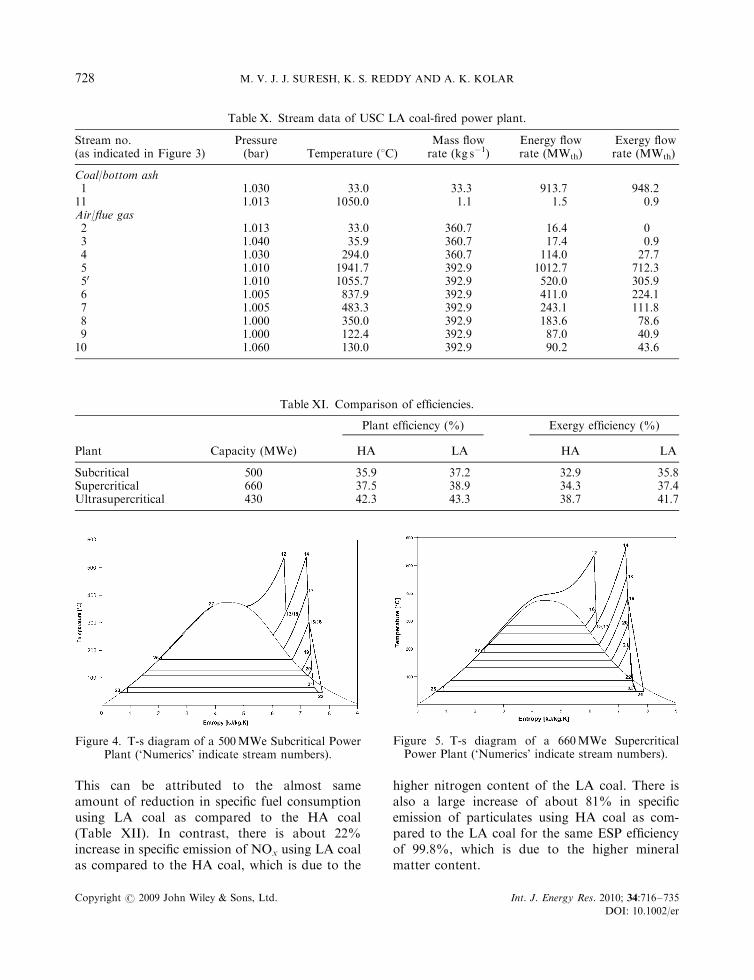
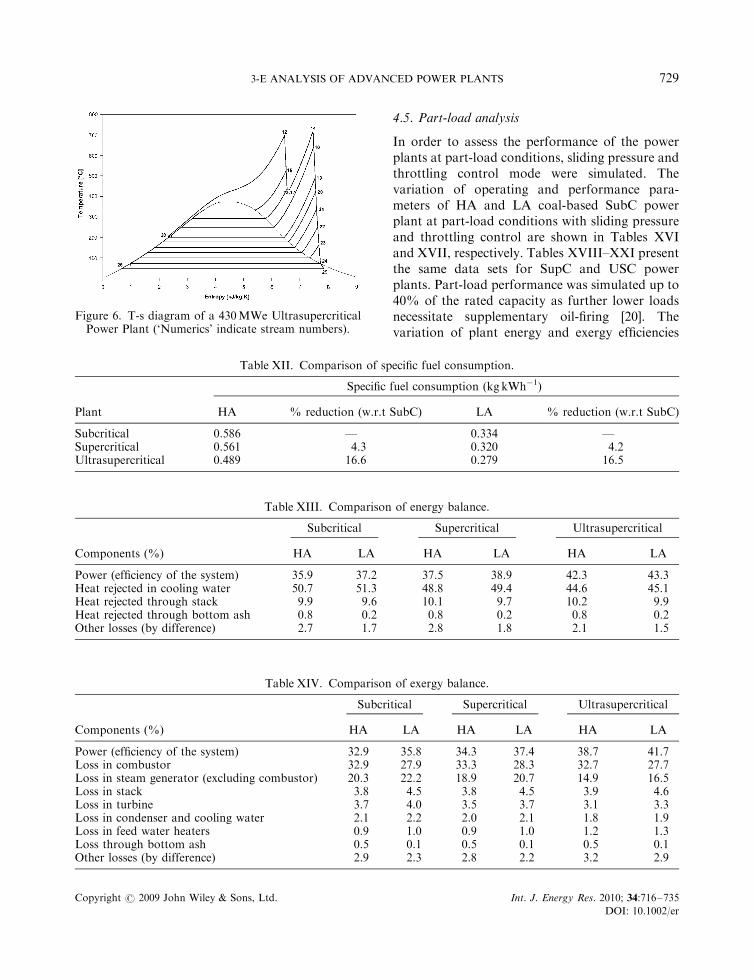
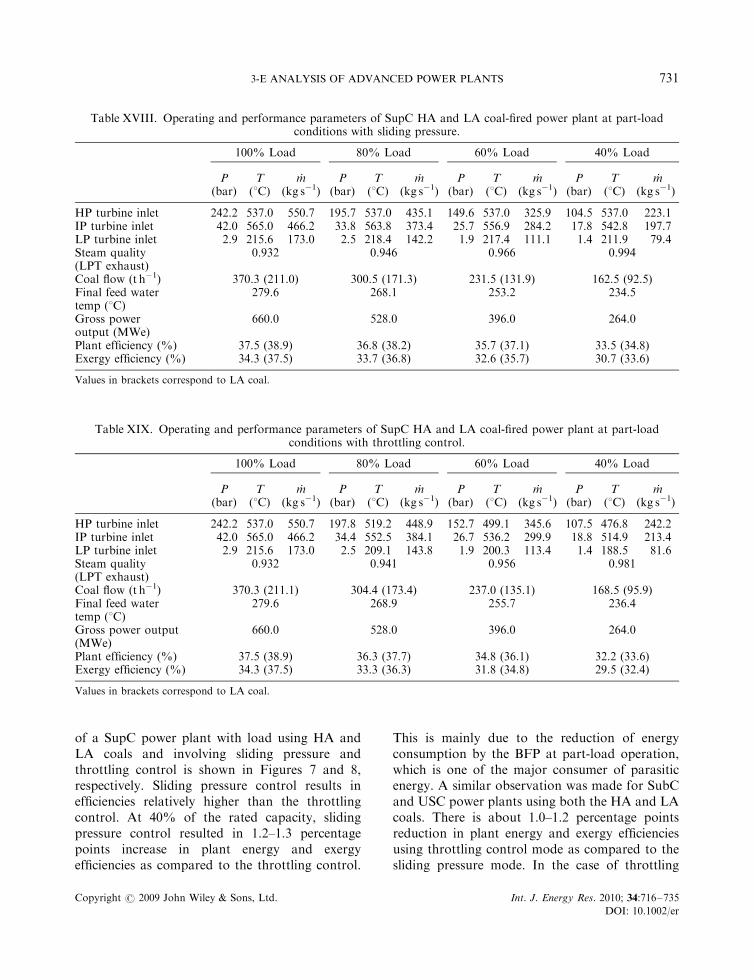
points using HA coal (based on HHV). In the caseof exergy efficiency, the corresponding increase isabout 1.4 and 5.8 percentage points, respectively.The increase in both the efficiencies (i.e. plantenergy and exergy) of the SupC and USC powerplants over SubC power plant is due to theincreased steam parameters (pressure, tempera-ture) at the inlet of HP turbine. The T-s diagramsof the simulated coal-based power plants operat-ing on SubC, SupC, and USC steam parametersare shown in Figures 4–6, respectively. Increase insteam parameters (pressure, temperature) resultsin increase in the average temperature during the
Table III. Stream data of SubC HA coal-fired power plant.
Stream no.(as indicated in Figure 1)
Pressure(bar) Temperature (1C)
Mass flow rate(kg s�1)
Energy flowrate (MWth)
Exergy flowrate (MWth)
Coal/bottom ash1 1.030 33.0 81.3 1287.8 1407.411 1.013 1050.0 7.9 10.6 6.4Air/flue gas2 1.013 33.0 480.9 21.8 03 1.040 35.9 480.9 23.3 1.14 1.030 297.2 480.9 153.7 37.75 1.010 1782.7 554.3 1411.6 975.450 1.010 1344.9 554.3 980.8 616.26 1.005 842.3 554.3 592.0 314.87 1.005 579.8 554.3 411.4 190.68 1.000 335.0 554.3 254.0 99.59 1.000 117.8 554.3 123.6 50.110 1.060 125.0 554.3 127.8 53.7Water/steam12 166.7 537.0 425.8 1387.1 613.513 44.1 339.4 380.5 1110.3 410.714 39.7 537.0 380.5 1290.9 507.515 7.3 303.3 316.9 927.6 266.616 44.1 339.4 45.3 132.1 48.917 17.4 416.1 21.0 66.1 22.618 7.3 303.3 24.0 70.4 20.219 2.6 192.6 12.2 33.2 7.520 1.3 132.1 23.3 60.6 11.321 0.26 65.8 10.2 24.1 2.322 0.103 46.4 271.2 620.3 25.623 0.103 46.4 335.5 18.7 0.424 7.3 46.5 335.5 19.0 0.625 193.7 170.2 425.8 252.0 50.926 193.7 253.2 425.8 410.2 109.127 187.7 324.0 425.8 567.5 180.628 186.2 359.8 425.8 998.4 401.529 1.013 33.0 15614.7 0 030 2.030 33.0 15614.7 2.0 1.631 1.030 43.0 15614.7 653.1 10.5
3-E ANALYSIS OF ADVANCED POWER PLANTS 723
Copyright r 2009 John Wiley & Sons, Ltd. Int. J. Energy Res. 2010; 34:716–735
DOI: 10.1002/er
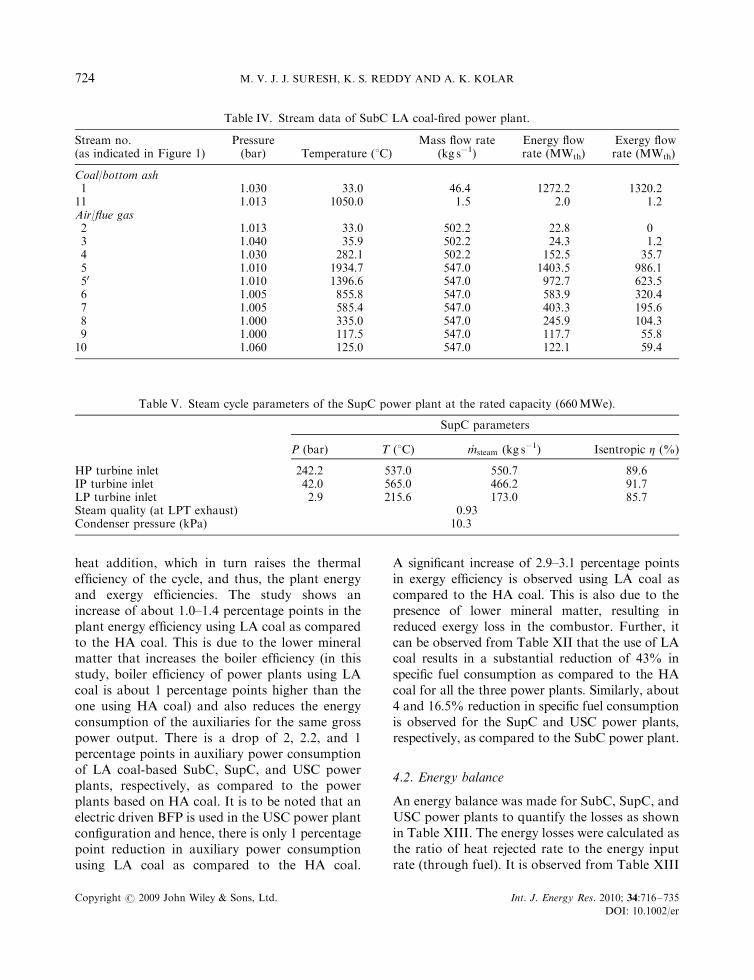
heat addition, which in turn raises the thermalefficiency of the cycle, and thus, the plant energyand exergy efficiencies. The study shows anincrease of about 1.0–1.4 percentage points in theplant energy efficiency using LA coal as comparedto the HA coal. This is due to the lower mineralmatter that increases the boiler efficiency (in thisstudy, boiler efficiency of power plants using LAcoal is about 1 percentage points higher than theone using HA coal) and also reduces the energyconsumption of the auxiliaries for the same grosspower output. There is a drop of 2, 2.2, and 1percentage points in auxiliary power consumptionof LA coal-based SubC, SupC, and USC powerplants, respectively, as compared to the powerplants based on HA coal. It is to be noted that anelectric driven BFP is used in the USC power plantconfiguration and hence, there is only 1 percentagepoint reduction in auxiliary power consumptionusing LA coal as compared to the HA coal.
A significant increase of 2.9–3.1 percentage pointsin exergy efficiency is observed using LA coal ascompared to the HA coal. This is also due to thepresence of lower mineral matter, resulting inreduced exergy loss in the combustor. Further, itcan be observed from Table XII that the use of LAcoal results in a substantial reduction of 43% inspecific fuel consumption as compared to the HAcoal for all the three power plants. Similarly, about4 and 16.5% reduction in specific fuel consumptionis observed for the SupC and USC power plants,respectively, as compared to the SubC power plant.
4.2. Energy balance
An energy balance was made for SubC, SupC, andUSC power plants to quantify the losses as shownin Table XIII. The energy losses were calculated asthe ratio of heat rejected rate to the energy inputrate (through fuel). It is observed from Table XIII
Table IV. Stream data of SubC LA coal-fired power plant.
Stream no.(as indicated in Figure 1)
Pressure(bar) Temperature (1C)
Mass flow rate(kg s�1)
Energy flowrate (MWth)
Exergy flowrate (MWth)
Coal/bottom ash1 1.030 33.0 46.4 1272.2 1320.211 1.013 1050.0 1.5 2.0 1.2Air/flue gas2 1.013 33.0 502.2 22.8 03 1.040 35.9 502.2 24.3 1.24 1.030 282.1 502.2 152.5 35.75 1.010 1934.7 547.0 1403.5 986.150 1.010 1396.6 547.0 972.7 623.56 1.005 855.8 547.0 583.9 320.47 1.005 585.4 547.0 403.3 195.68 1.000 335.0 547.0 245.9 104.39 1.000 117.5 547.0 117.7 55.810 1.060 125.0 547.0 122.1 59.4
Table V. Steam cycle parameters of the SupC power plant at the rated capacity (660MWe).
SupC parameters
P (bar) T (1C) _msteam (kg s�1) Isentropic Z (%)
HP turbine inlet 242.2 537.0 550.7 89.6IP turbine inlet 42.0 565.0 466.2 91.7LP turbine inlet 2.9 215.6 173.0 85.7Steam quality (at LPT exhaust) 0.93Condenser pressure (kPa) 10.3
M. V. J. J. SURESH, K. S. REDDY AND A. K. KOLAR724
Copyright r 2009 John Wiley & Sons, Ltd. Int. J. Energy Res. 2010; 34:716–735
DOI: 10.1002/er
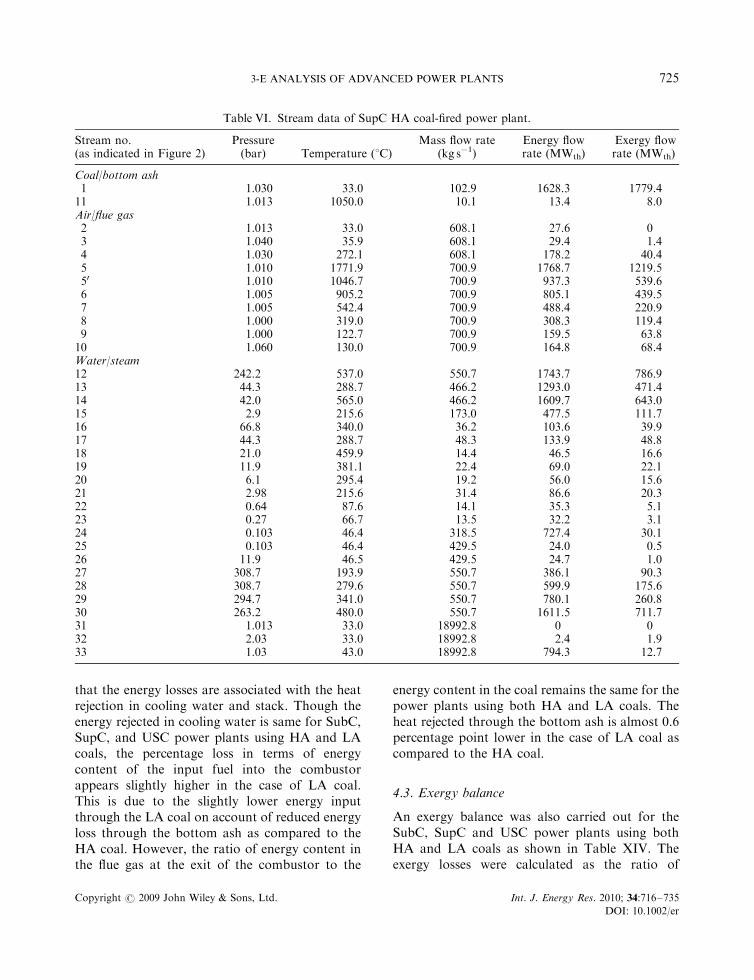
that the energy losses are associated with the heatrejection in cooling water and stack. Though theenergy rejected in cooling water is same for SubC,SupC, and USC power plants using HA and LAcoals, the percentage loss in terms of energycontent of the input fuel into the combustorappears slightly higher in the case of LA coal.This is due to the slightly lower energy inputthrough the LA coal on account of reduced energyloss through the bottom ash as compared to theHA coal. However, the ratio of energy content inthe flue gas at the exit of the combustor to the
energy content in the coal remains the same for thepower plants using both HA and LA coals. Theheat rejected through the bottom ash is almost 0.6percentage point lower in the case of LA coal ascompared to the HA coal.
4.3. Exergy balance
An exergy balance was also carried out for theSubC, SupC and USC power plants using bothHA and LA coals as shown in Table XIV. Theexergy losses were calculated as the ratio of
Table VI. Stream data of SupC HA coal-fired power plant.
Stream no.(as indicated in Figure 2)
Pressure(bar) Temperature (1C)
Mass flow rate(kg s�1)
Energy flowrate (MWth)
Exergy flowrate (MWth)
Coal/bottom ash1 1.030 33.0 102.9 1628.3 1779.411 1.013 1050.0 10.1 13.4 8.0Air/flue gas2 1.013 33.0 608.1 27.6 03 1.040 35.9 608.1 29.4 1.44 1.030 272.1 608.1 178.2 40.45 1.010 1771.9 700.9 1768.7 1219.550 1.010 1046.7 700.9 937.3 539.66 1.005 905.2 700.9 805.1 439.57 1.005 542.4 700.9 488.4 220.98 1.000 319.0 700.9 308.3 119.49 1.000 122.7 700.9 159.5 63.810 1.060 130.0 700.9 164.8 68.4Water/steam12 242.2 537.0 550.7 1743.7 786.913 44.3 288.7 466.2 1293.0 471.414 42.0 565.0 466.2 1609.7 643.015 2.9 215.6 173.0 477.5 111.716 66.8 340.0 36.2 103.6 39.917 44.3 288.7 48.3 133.9 48.818 21.0 459.9 14.4 46.5 16.619 11.9 381.1 22.4 69.0 22.120 6.1 295.4 19.2 56.0 15.621 2.98 215.6 31.4 86.6 20.322 0.64 87.6 14.1 35.3 5.123 0.27 66.7 13.5 32.2 3.124 0.103 46.4 318.5 727.4 30.125 0.103 46.4 429.5 24.0 0.526 11.9 46.5 429.5 24.7 1.027 308.7 193.9 550.7 386.1 90.328 308.7 279.6 550.7 599.9 175.629 294.7 341.0 550.7 780.1 260.830 263.2 480.0 550.7 1611.5 711.731 1.013 33.0 18992.8 0 032 2.03 33.0 18992.8 2.4 1.933 1.03 43.0 18992.8 794.3 12.7
3-E ANALYSIS OF ADVANCED POWER PLANTS 725
Copyright r 2009 John Wiley & Sons, Ltd. Int. J. Energy Res. 2010; 34:716–735
DOI: 10.1002/er
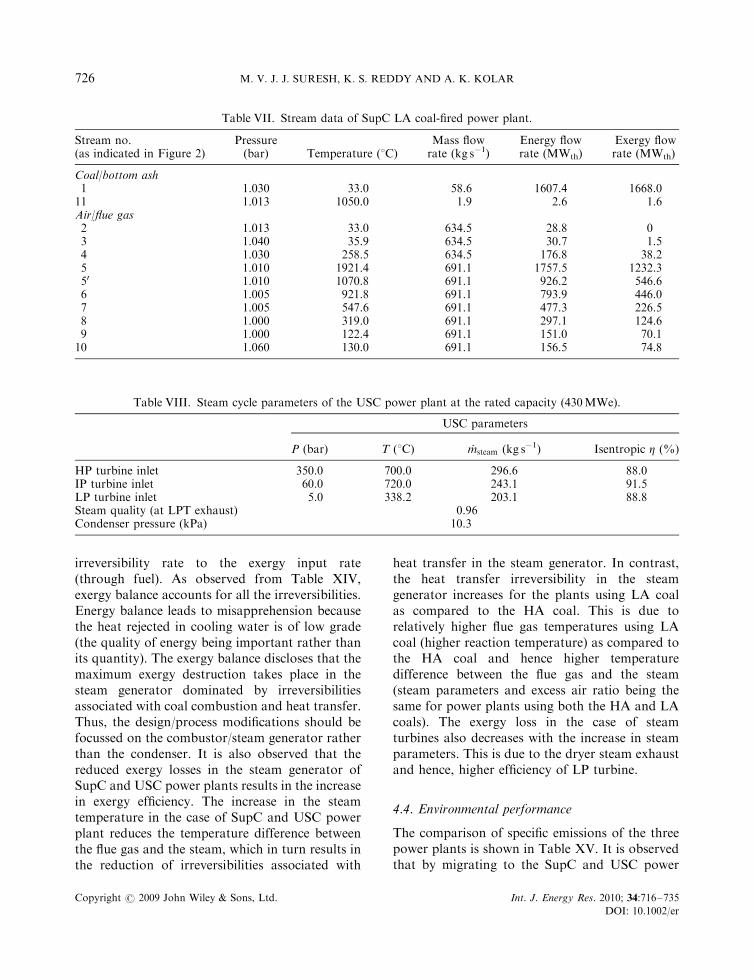
irreversibility rate to the exergy input rate(through fuel). As observed from Table XIV,exergy balance accounts for all the irreversibilities.Energy balance leads to misapprehension becausethe heat rejected in cooling water is of low grade(the quality of energy being important rather thanits quantity). The exergy balance discloses that themaximum exergy destruction takes place in thesteam generator dominated by irreversibilitiesassociated with coal combustion and heat transfer.Thus, the design/process modifications should befocussed on the combustor/steam generator ratherthan the condenser. It is also observed that thereduced exergy losses in the steam generator ofSupC and USC power plants results in the increasein exergy efficiency. The increase in the steamtemperature in the case of SupC and USC powerplant reduces the temperature difference betweenthe flue gas and the steam, which in turn results inthe reduction of irreversibilities associated with
heat transfer in the steam generator. In contrast,the heat transfer irreversibility in the steamgenerator increases for the plants using LA coalas compared to the HA coal. This is due torelatively higher flue gas temperatures using LAcoal (higher reaction temperature) as compared tothe HA coal and hence higher temperaturedifference between the flue gas and the steam(steam parameters and excess air ratio being thesame for power plants using both the HA and LAcoals). The exergy loss in the case of steamturbines also decreases with the increase in steamparameters. This is due to the dryer steam exhaustand hence, higher efficiency of LP turbine.
4.4. Environmental performance
The comparison of specific emissions of the threepower plants is shown in Table XV. It is observedthat by migrating to the SupC and USC power
Table VII. Stream data of SupC LA coal-fired power plant.
Stream no.(as indicated in Figure 2)
Pressure(bar) Temperature (1C)
Mass flowrate (kg s�1)
Energy flowrate (MWth)
Exergy flowrate (MWth)
Coal/bottom ash1 1.030 33.0 58.6 1607.4 1668.011 1.013 1050.0 1.9 2.6 1.6Air/flue gas2 1.013 33.0 634.5 28.8 03 1.040 35.9 634.5 30.7 1.54 1.030 258.5 634.5 176.8 38.25 1.010 1921.4 691.1 1757.5 1232.350 1.010 1070.8 691.1 926.2 546.66 1.005 921.8 691.1 793.9 446.07 1.005 547.6 691.1 477.3 226.58 1.000 319.0 691.1 297.1 124.69 1.000 122.4 691.1 151.0 70.110 1.060 130.0 691.1 156.5 74.8
Table VIII. Steam cycle parameters of the USC power plant at the rated capacity (430MWe).
USC parameters
P (bar) T (1C) _msteam (kg s�1) Isentropic Z (%)
HP turbine inlet 350.0 700.0 296.6 88.0IP turbine inlet 60.0 720.0 243.1 91.5LP turbine inlet 5.0 338.2 203.1 88.8Steam quality (at LPT exhaust) 0.96Condenser pressure (kPa) 10.3
M. V. J. J. SURESH, K. S. REDDY AND A. K. KOLAR726
Copyright r 2009 John Wiley & Sons, Ltd. Int. J. Energy Res. 2010; 34:716–735
DOI: 10.1002/er
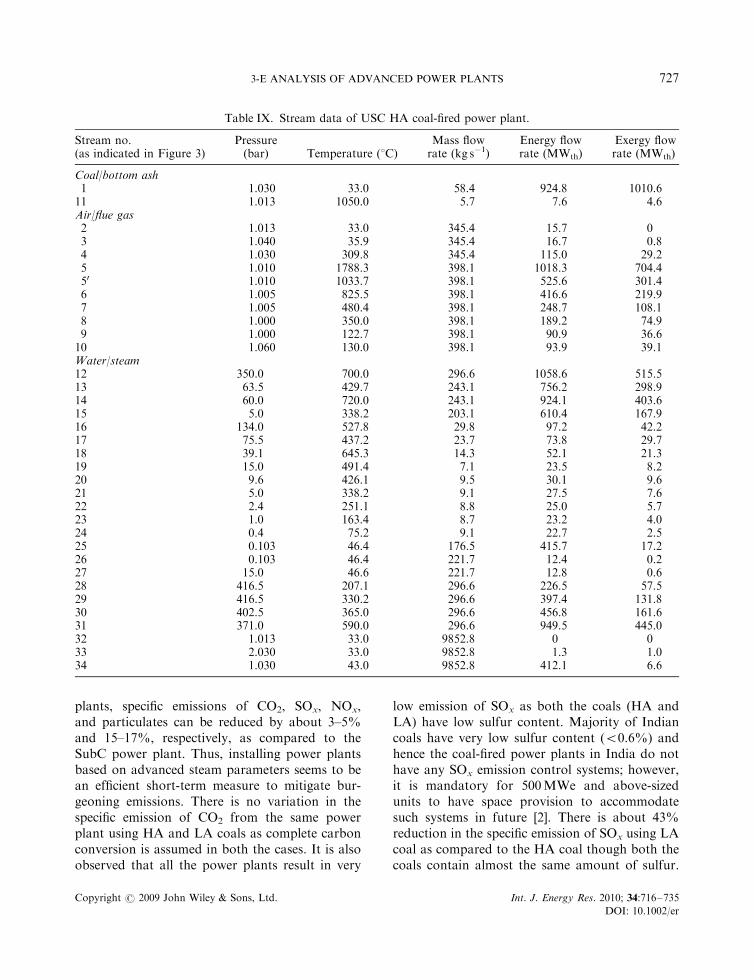
plants, specific emissions of CO2, SOx, NOx,and particulates can be reduced by about 3–5%and 15–17%, respectively, as compared to theSubC power plant. Thus, installing power plantsbased on advanced steam parameters seems to bean efficient short-term measure to mitigate bur-geoning emissions. There is no variation in thespecific emission of CO2 from the same powerplant using HA and LA coals as complete carbonconversion is assumed in both the cases. It is alsoobserved that all the power plants result in very
low emission of SOx as both the coals (HA andLA) have low sulfur content. Majority of Indiancoals have very low sulfur content (o0.6%) andhence the coal-fired power plants in India do nothave any SOx emission control systems; however,it is mandatory for 500MWe and above-sizedunits to have space provision to accommodatesuch systems in future [2]. There is about 43%reduction in the specific emission of SOx using LAcoal as compared to the HA coal though both thecoals contain almost the same amount of sulfur.
Table IX. Stream data of USC HA coal-fired power plant.
Stream no.(as indicated in Figure 3)
Pressure(bar) Temperature (1C)
Mass flowrate (kg s�1)
Energy flowrate (MWth)
Exergy flowrate (MWth)
Coal/bottom ash1 1.030 33.0 58.4 924.8 1010.611 1.013 1050.0 5.7 7.6 4.6Air/flue gas2 1.013 33.0 345.4 15.7 03 1.040 35.9 345.4 16.7 0.84 1.030 309.8 345.4 115.0 29.25 1.010 1788.3 398.1 1018.3 704.450 1.010 1033.7 398.1 525.6 301.46 1.005 825.5 398.1 416.6 219.97 1.005 480.4 398.1 248.7 108.18 1.000 350.0 398.1 189.2 74.99 1.000 122.7 398.1 90.9 36.610 1.060 130.0 398.1 93.9 39.1Water/steam12 350.0 700.0 296.6 1058.6 515.513 63.5 429.7 243.1 756.2 298.914 60.0 720.0 243.1 924.1 403.615 5.0 338.2 203.1 610.4 167.916 134.0 527.8 29.8 97.2 42.217 75.5 437.2 23.7 73.8 29.718 39.1 645.3 14.3 52.1 21.319 15.0 491.4 7.1 23.5 8.220 9.6 426.1 9.5 30.1 9.621 5.0 338.2 9.1 27.5 7.622 2.4 251.1 8.8 25.0 5.723 1.0 163.4 8.7 23.2 4.024 0.4 75.2 9.1 22.7 2.525 0.103 46.4 176.5 415.7 17.226 0.103 46.4 221.7 12.4 0.227 15.0 46.6 221.7 12.8 0.628 416.5 207.1 296.6 226.5 57.529 416.5 330.2 296.6 397.4 131.830 402.5 365.0 296.6 456.8 161.631 371.0 590.0 296.6 949.5 445.032 1.013 33.0 9852.8 0 033 2.030 33.0 9852.8 1.3 1.034 1.030 43.0 9852.8 412.1 6.6
3-E ANALYSIS OF ADVANCED POWER PLANTS 727
Copyright r 2009 John Wiley & Sons, Ltd. Int. J. Energy Res. 2010; 34:716–735
DOI: 10.1002/er
This can be attributed to the almost sameamount of reduction in specific fuel consumptionusing LA coal as compared to the HA coal(Table XII). In contrast, there is about 22%increase in specific emission of NOx using LA coalas compared to the HA coal, which is due to the
higher nitrogen content of the LA coal. There isalso a large increase of about 81% in specificemission of particulates using HA coal as com-pared to the LA coal for the same ESP efficiencyof 99.8%, which is due to the higher mineralmatter content.
Table X. Stream data of USC LA coal-fired power plant.
Stream no.(as indicated in Figure 3)
Pressure(bar) Temperature (1C)
Mass flowrate (kg s�1)
Energy flowrate (MWth)
Exergy flowrate (MWth)
Coal/bottom ash1 1.030 33.0 33.3 913.7 948.211 1.013 1050.0 1.1 1.5 0.9Air/flue gas2 1.013 33.0 360.7 16.4 03 1.040 35.9 360.7 17.4 0.94 1.030 294.0 360.7 114.0 27.75 1.010 1941.7 392.9 1012.7 712.350 1.010 1055.7 392.9 520.0 305.96 1.005 837.9 392.9 411.0 224.17 1.005 483.3 392.9 243.1 111.88 1.000 350.0 392.9 183.6 78.69 1.000 122.4 392.9 87.0 40.910 1.060 130.0 392.9 90.2 43.6
Table XI. Comparison of efficiencies.
Plant efficiency (%) Exergy efficiency (%)
Plant Capacity (MWe) HA LA HA LA
Subcritical 500 35.9 37.2 32.9 35.8Supercritical 660 37.5 38.9 34.3 37.4Ultrasupercritical 430 42.3 43.3 38.7 41.7
Figure 5. T-s diagram of a 660MWe SupercriticalPower Plant (‘Numerics’ indicate stream numbers).
Figure 4. T-s diagram of a 500MWe Subcritical PowerPlant (‘Numerics’ indicate stream numbers).
M. V. J. J. SURESH, K. S. REDDY AND A. K. KOLAR728
Copyright r 2009 John Wiley & Sons, Ltd. Int. J. Energy Res. 2010; 34:716–735
DOI: 10.1002/er
4.5. Part-load analysis
In order to assess the performance of the powerplants at part-load conditions, sliding pressure andthrottling control mode were simulated. Thevariation of operating and performance para-meters of HA and LA coal-based SubC powerplant at part-load conditions with sliding pressureand throttling control are shown in Tables XVIand XVII, respectively. Tables XVIII–XXI presentthe same data sets for SupC and USC powerplants. Part-load performance was simulated up to40% of the rated capacity as further lower loadsnecessitate supplementary oil-firing [20]. Thevariation of plant energy and exergy efficiencies
Figure 6. T-s diagram of a 430MWe UltrasupercriticalPower Plant (‘Numerics’ indicate stream numbers).
Table XIII. Comparison of energy balance.
Subcritical Supercritical Ultrasupercritical
Components (%) HA LA HA LA HA LA
Power (efficiency of the system) 35.9 37.2 37.5 38.9 42.3 43.3Heat rejected in cooling water 50.7 51.3 48.8 49.4 44.6 45.1Heat rejected through stack 9.9 9.6 10.1 9.7 10.2 9.9Heat rejected through bottom ash 0.8 0.2 0.8 0.2 0.8 0.2Other losses (by difference) 2.7 1.7 2.8 1.8 2.1 1.5
Table XII. Comparison of specific fuel consumption.
Specific fuel consumption (kg kWh�1)
Plant HA % reduction (w.r.t SubC) LA % reduction (w.r.t SubC)
Subcritical 0.586 — 0.334 —Supercritical 0.561 4.3 0.320 4.2Ultrasupercritical 0.489 16.6 0.279 16.5
Table XIV. Comparison of exergy balance.
Subcritical Supercritical Ultrasupercritical
Components (%) HA LA HA LA HA LA
Power (efficiency of the system) 32.9 35.8 34.3 37.4 38.7 41.7Loss in combustor 32.9 27.9 33.3 28.3 32.7 27.7Loss in steam generator (excluding combustor) 20.3 22.2 18.9 20.7 14.9 16.5Loss in stack 3.8 4.5 3.8 4.5 3.9 4.6Loss in turbine 3.7 4.0 3.5 3.7 3.1 3.3Loss in condenser and cooling water 2.1 2.2 2.0 2.1 1.8 1.9Loss in feed water heaters 0.9 1.0 0.9 1.0 1.2 1.3Loss through bottom ash 0.5 0.1 0.5 0.1 0.5 0.1Other losses (by difference) 2.9 2.3 2.8 2.2 3.2 2.9
3-E ANALYSIS OF ADVANCED POWER PLANTS 729
Copyright r 2009 John Wiley & Sons, Ltd. Int. J. Energy Res. 2010; 34:716–735
DOI: 10.1002/er
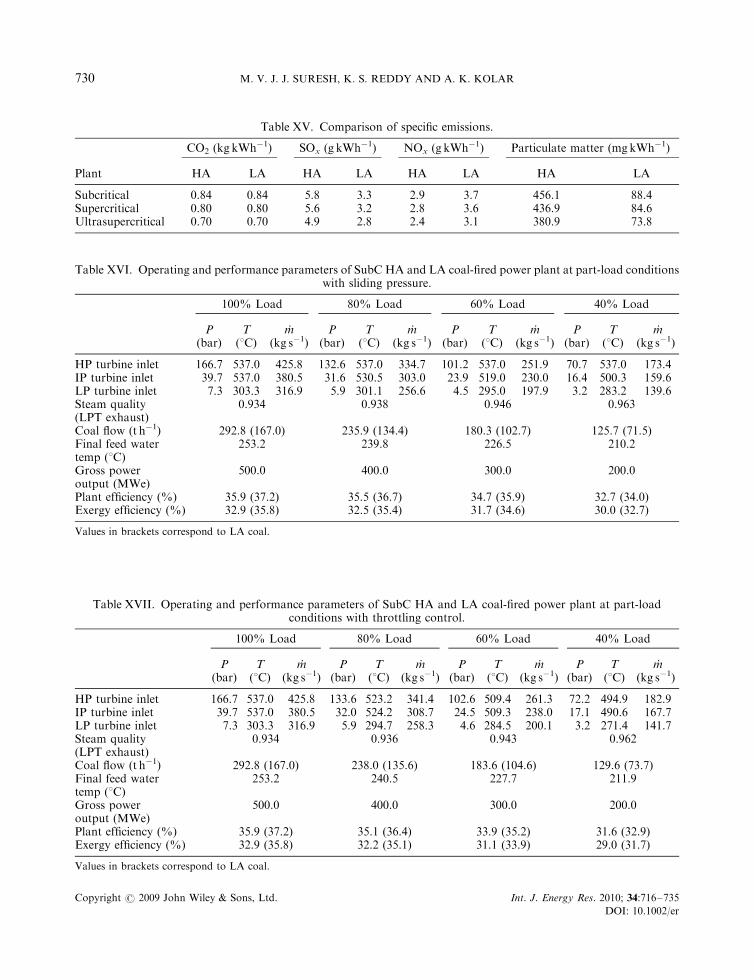
Table XV. Comparison of specific emissions.
CO2 (kg kWh�1) SOx (g kWh�1) NOx (g kWh�1) Particulate matter (mg kWh�1)
Plant HA LA HA LA HA LA HA LA
Subcritical 0.84 0.84 5.8 3.3 2.9 3.7 456.1 88.4Supercritical 0.80 0.80 5.6 3.2 2.8 3.6 436.9 84.6Ultrasupercritical 0.70 0.70 4.9 2.8 2.4 3.1 380.9 73.8
Table XVI. Operating and performance parameters of SubC HA and LA coal-fired power plant at part-load conditionswith sliding pressure.
100% Load 80% Load 60% Load 40% Load
P(bar)
T(1C)
_m(kg s�1)
P(bar)
T(1C)
_m(kg s�1)
P(bar)
T(1C)
_m(kg s�1)
P(bar)
T(1C)
_m(kg s�1)
HP turbine inlet 166.7 537.0 425.8 132.6 537.0 334.7 101.2 537.0 251.9 70.7 537.0 173.4IP turbine inlet 39.7 537.0 380.5 31.6 530.5 303.0 23.9 519.0 230.0 16.4 500.3 159.6LP turbine inlet 7.3 303.3 316.9 5.9 301.1 256.6 4.5 295.0 197.9 3.2 283.2 139.6Steam quality(LPT exhaust)
0.934 0.938 0.946 0.963
Coal flow (t h�1) 292.8 (167.0) 235.9 (134.4) 180.3 (102.7) 125.7 (71.5)Final feed watertemp (1C)
253.2 239.8 226.5 210.2
Gross poweroutput (MWe)
500.0 400.0 300.0 200.0
Plant efficiency (%) 35.9 (37.2) 35.5 (36.7) 34.7 (35.9) 32.7 (34.0)Exergy efficiency (%) 32.9 (35.8) 32.5 (35.4) 31.7 (34.6) 30.0 (32.7)
Values in brackets correspond to LA coal.
Table XVII. Operating and performance parameters of SubC HA and LA coal-fired power plant at part-loadconditions with throttling control.
100% Load 80% Load 60% Load 40% Load
P(bar)
T(1C)
_m(kg s�1)
P(bar)
T(1C)
_m(kg s�1)
P(bar)
T(1C)
_m(kg s�1)
P(bar)
T(1C)
_m(kg s�1)
HP turbine inlet 166.7 537.0 425.8 133.6 523.2 341.4 102.6 509.4 261.3 72.2 494.9 182.9IP turbine inlet 39.7 537.0 380.5 32.0 524.2 308.7 24.5 509.3 238.0 17.1 490.6 167.7LP turbine inlet 7.3 303.3 316.9 5.9 294.7 258.3 4.6 284.5 200.1 3.2 271.4 141.7Steam quality(LPT exhaust)
0.934 0.936 0.943 0.962
Coal flow (t h�1) 292.8 (167.0) 238.0 (135.6) 183.6 (104.6) 129.6 (73.7)Final feed watertemp (1C)
253.2 240.5 227.7 211.9
Gross poweroutput (MWe)
500.0 400.0 300.0 200.0
Plant efficiency (%) 35.9 (37.2) 35.1 (36.4) 33.9 (35.2) 31.6 (32.9)Exergy efficiency (%) 32.9 (35.8) 32.2 (35.1) 31.1 (33.9) 29.0 (31.7)
Values in brackets correspond to LA coal.
M. V. J. J. SURESH, K. S. REDDY AND A. K. KOLAR730
Copyright r 2009 John Wiley & Sons, Ltd. Int. J. Energy Res. 2010; 34:716–735
DOI: 10.1002/er
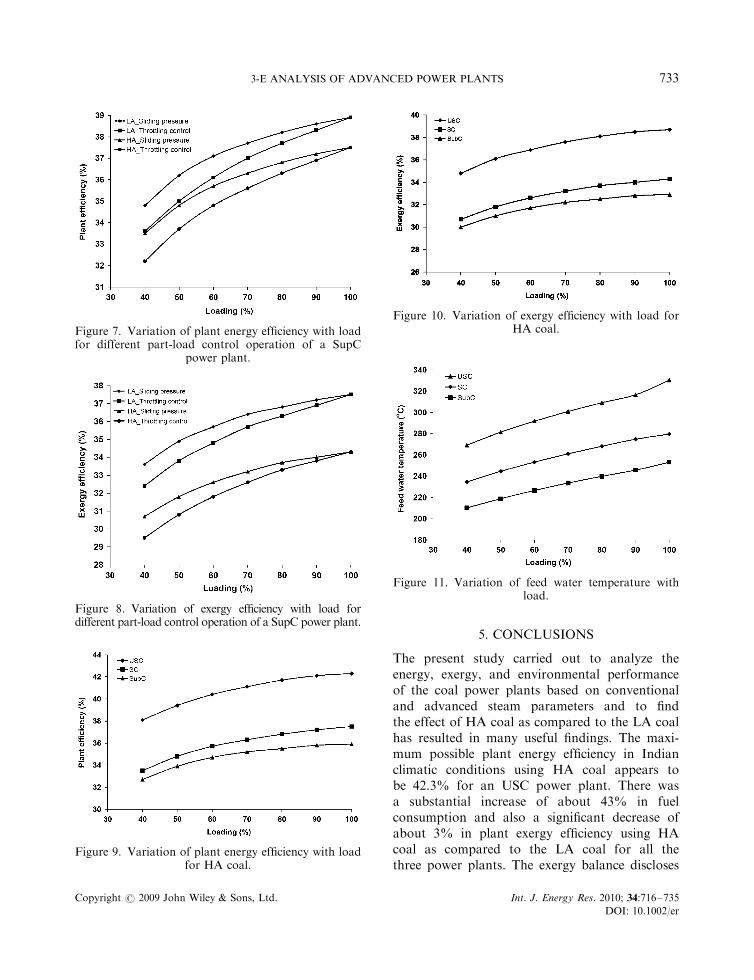
of a SupC power plant with load using HA andLA coals and involving sliding pressure andthrottling control is shown in Figures 7 and 8,respectively. Sliding pressure control results inefficiencies relatively higher than the throttlingcontrol. At 40% of the rated capacity, slidingpressure control resulted in 1.2–1.3 percentagepoints increase in plant energy and exergyefficiencies as compared to the throttling control.
This is mainly due to the reduction of energyconsumption by the BFP at part-load operation,which is one of the major consumer of parasiticenergy. A similar observation was made for SubCand USC power plants using both the HA and LAcoals. There is about 1.0–1.2 percentage pointsreduction in plant energy and exergy efficienciesusing throttling control mode as compared to thesliding pressure mode. In the case of throttling
Table XVIII. Operating and performance parameters of SupC HA and LA coal-fired power plant at part-loadconditions with sliding pressure.
100% Load 80% Load 60% Load 40% Load
P(bar)
T(1C)
_m(kg s�1)
P(bar)
T(1C)
_m(kg s�1)
P(bar)
T(1C)
_m(kg s�1)
P(bar)
T(1C)
_m(kg s�1)
HP turbine inlet 242.2 537.0 550.7 195.7 537.0 435.1 149.6 537.0 325.9 104.5 537.0 223.1IP turbine inlet 42.0 565.0 466.2 33.8 563.8 373.4 25.7 556.9 284.2 17.8 542.8 197.7LP turbine inlet 2.9 215.6 173.0 2.5 218.4 142.2 1.9 217.4 111.1 1.4 211.9 79.4Steam quality(LPT exhaust)
0.932 0.946 0.966 0.994
Coal flow (t h�1) 370.3 (211.0) 300.5 (171.3) 231.5 (131.9) 162.5 (92.5)Final feed watertemp (1C)
279.6 268.1 253.2 234.5
Gross poweroutput (MWe)
660.0 528.0 396.0 264.0
Plant efficiency (%) 37.5 (38.9) 36.8 (38.2) 35.7 (37.1) 33.5 (34.8)Exergy efficiency (%) 34.3 (37.5) 33.7 (36.8) 32.6 (35.7) 30.7 (33.6)
Values in brackets correspond to LA coal.
Table XIX. Operating and performance parameters of SupC HA and LA coal-fired power plant at part-loadconditions with throttling control.
100% Load 80% Load 60% Load 40% Load
P(bar)
T(1C)
_m(kg s�1)
P(bar)
T(1C)
_m(kg s�1)
P(bar)
T(1C)
_m(kg s�1)
P(bar)
T(1C)
_m(kg s�1)
HP turbine inlet 242.2 537.0 550.7 197.8 519.2 448.9 152.7 499.1 345.6 107.5 476.8 242.2IP turbine inlet 42.0 565.0 466.2 34.4 552.5 384.1 26.7 536.2 299.9 18.8 514.9 213.4LP turbine inlet 2.9 215.6 173.0 2.5 209.1 143.8 1.9 200.3 113.4 1.4 188.5 81.6Steam quality(LPT exhaust)
0.932 0.941 0.956 0.981
Coal flow (t h�1) 370.3 (211.1) 304.4 (173.4) 237.0 (135.1) 168.5 (95.9)Final feed watertemp (1C)
279.6 268.9 255.7 236.4
Gross power output(MWe)
660.0 528.0 396.0 264.0
Plant efficiency (%) 37.5 (38.9) 36.3 (37.7) 34.8 (36.1) 32.2 (33.6)Exergy efficiency (%) 34.3 (37.5) 33.3 (36.3) 31.8 (34.8) 29.5 (32.4)
Values in brackets correspond to LA coal.
3-E ANALYSIS OF ADVANCED POWER PLANTS 731
Copyright r 2009 John Wiley & Sons, Ltd. Int. J. Energy Res. 2010; 34:716–735
DOI: 10.1002/er
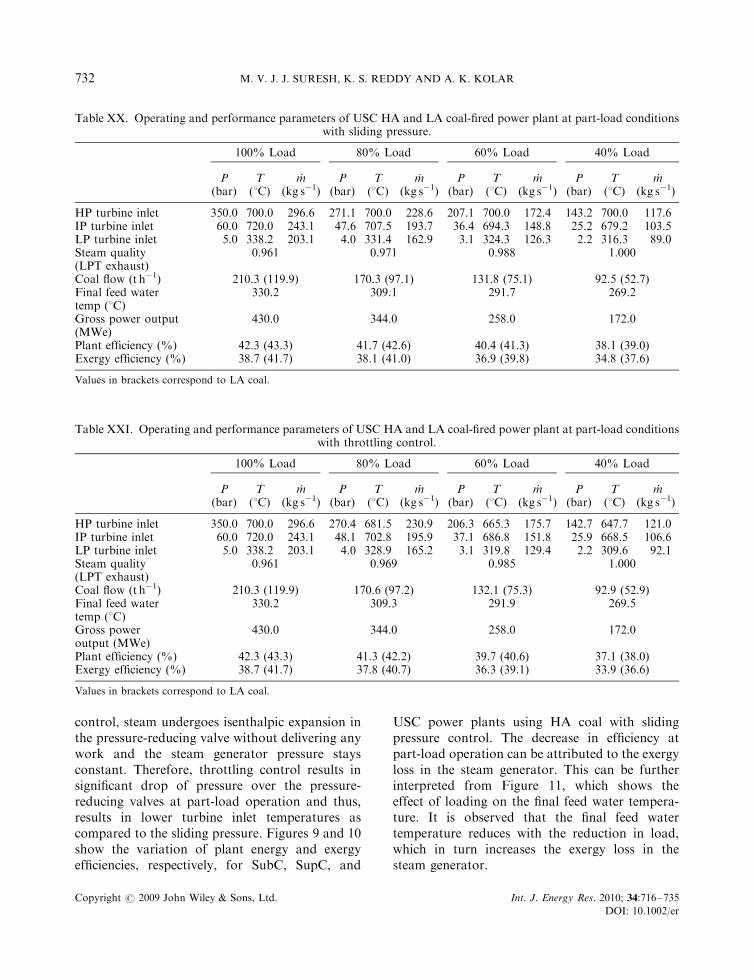
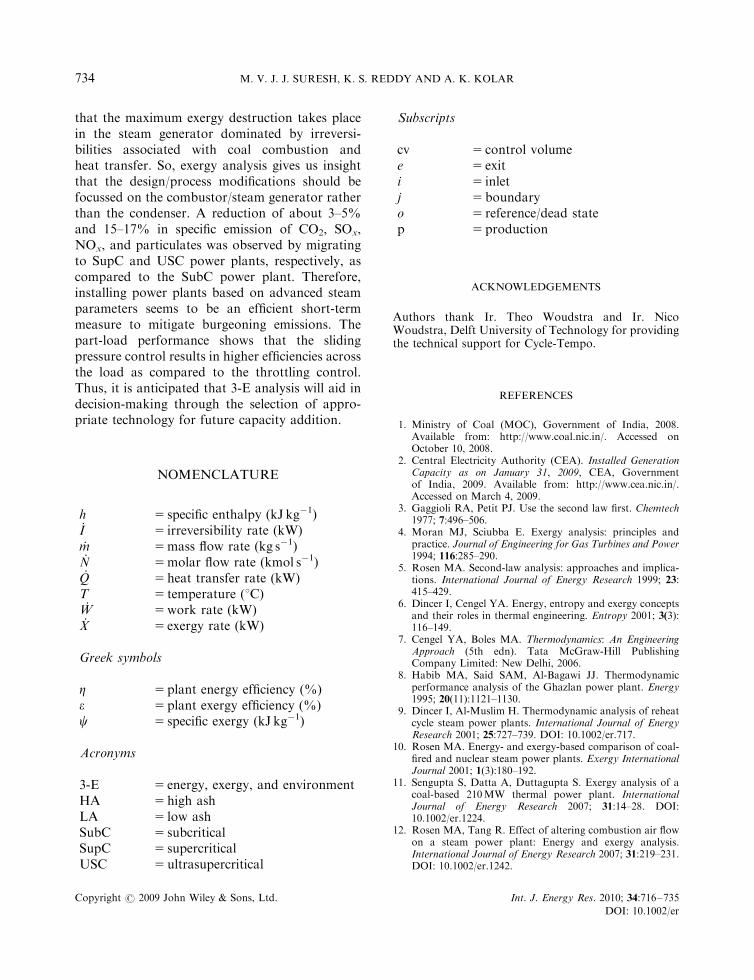
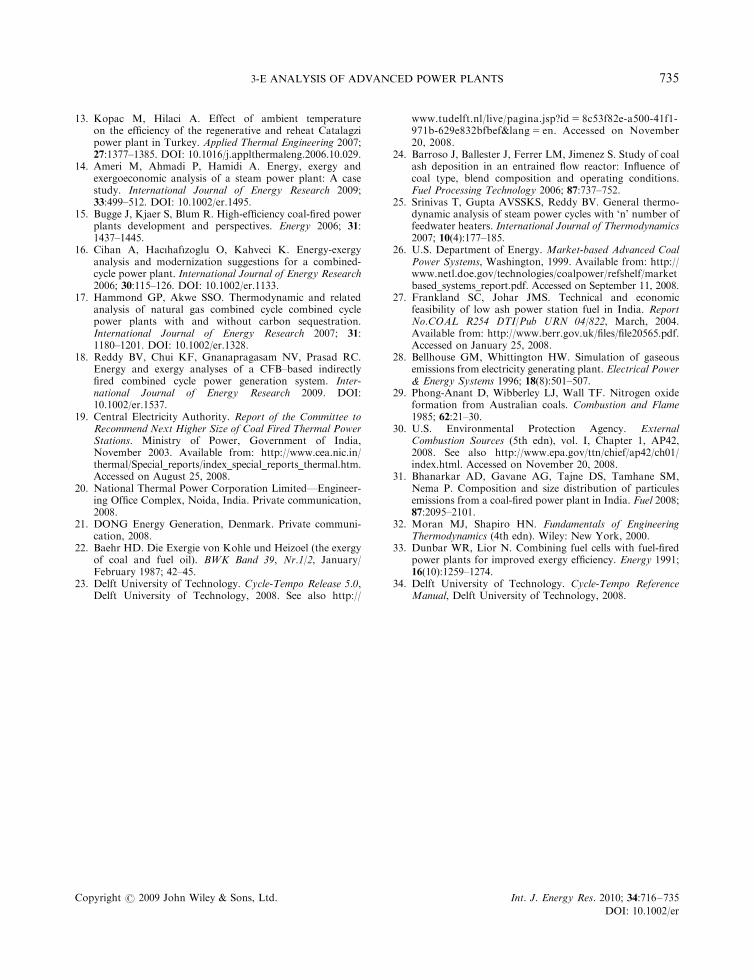
control, steam undergoes isenthalpic expansion inthe pressure-reducing valve without delivering anywork and the steam generator pressure staysconstant. Therefore, throttling control results insignificant drop of pressure over the pressure-reducing valves at part-load operation and thus,results in lower turbine inlet temperatures ascompared to the sliding pressure. Figures 9 and 10show the variation of plant energy and exergyefficiencies, respectively, for SubC, SupC, and
USC power plants using HA coal with slidingpressure control. The decrease in efficiency atpart-load operation can be attributed to the exergyloss in the steam generator. This can be furtherinterpreted from Figure 11, which shows theeffect of loading on the final feed water tempera-ture. It is observed that the final feed watertemperature reduces with the reduction in load,which in turn increases the exergy loss in thesteam generator.
Table XX. Operating and performance parameters of USC HA and LA coal-fired power plant at part-load conditionswith sliding pressure.
100% Load 80% Load 60% Load 40% Load
P(bar)
T(1C)
_m(kg s�1)
P(bar)
T(1C)
_m(kg s�1)
P(bar)
T(1C)
_m(kg s�1)
P(bar)
T(1C)
_m(kg s�1)
HP turbine inlet 350.0 700.0 296.6 271.1 700.0 228.6 207.1 700.0 172.4 143.2 700.0 117.6IP turbine inlet 60.0 720.0 243.1 47.6 707.5 193.7 36.4 694.3 148.8 25.2 679.2 103.5LP turbine inlet 5.0 338.2 203.1 4.0 331.4 162.9 3.1 324.3 126.3 2.2 316.3 89.0Steam quality(LPT exhaust)
0.961 0.971 0.988 1.000
Coal flow (t h�1) 210.3 (119.9) 170.3 (97.1) 131.8 (75.1) 92.5 (52.7)Final feed watertemp (1C)
330.2 309.1 291.7 269.2
Gross power output(MWe)
430.0 344.0 258.0 172.0
Plant efficiency (%) 42.3 (43.3) 41.7 (42.6) 40.4 (41.3) 38.1 (39.0)Exergy efficiency (%) 38.7 (41.7) 38.1 (41.0) 36.9 (39.8) 34.8 (37.6)
Values in brackets correspond to LA coal.
Table XXI. Operating and performance parameters of USC HA and LA coal-fired power plant at part-load conditionswith throttling control.
100% Load 80% Load 60% Load 40% Load
P(bar)
T(1C)
_m(kg s�1)
P(bar)
T(1C)
_m(kg s�1)
P(bar)
T(1C)
_m(kg s�1)
P(bar)
T(1C)
_m(kg s�1)
HP turbine inlet 350.0 700.0 296.6 270.4 681.5 230.9 206.3 665.3 175.7 142.7 647.7 121.0IP turbine inlet 60.0 720.0 243.1 48.1 702.8 195.9 37.1 686.8 151.8 25.9 668.5 106.6LP turbine inlet 5.0 338.2 203.1 4.0 328.9 165.2 3.1 319.8 129.4 2.2 309.6 92.1Steam quality(LPT exhaust)
0.961 0.969 0.985 1.000
Coal flow (t h�1) 210.3 (119.9) 170.6 (97.2) 132.1 (75.3) 92.9 (52.9)Final feed watertemp (1C)
330.2 309.3 291.9 269.5
Gross poweroutput (MWe)
430.0 344.0 258.0 172.0
Plant efficiency (%) 42.3 (43.3) 41.3 (42.2) 39.7 (40.6) 37.1 (38.0)Exergy efficiency (%) 38.7 (41.7) 37.8 (40.7) 36.3 (39.1) 33.9 (36.6)
Values in brackets correspond to LA coal.
M. V. J. J. SURESH, K. S. REDDY AND A. K. KOLAR732
Copyright r 2009 John Wiley & Sons, Ltd. Int. J. Energy Res. 2010; 34:716–735
DOI: 10.1002/er
5. CONCLUSIONS
The present study carried out to analyze theenergy, exergy, and environmental performanceof the coal power plants based on conventionaland advanced steam parameters and to findthe effect of HA coal as compared to the LA coalhas resulted in many useful findings. The maxi-mum possible plant energy efficiency in Indianclimatic conditions using HA coal appears tobe 42.3% for an USC power plant. There wasa substantial increase of about 43% in fuelconsumption and also a significant decrease ofabout 3% in plant exergy efficiency using HAcoal as compared to the LA coal for all thethree power plants. The exergy balance discloses
Figure 9. Variation of plant energy efficiency with loadfor HA coal.
Figure 7. Variation of plant energy efficiency with loadfor different part-load control operation of a SupC
power plant.
Figure 10. Variation of exergy efficiency with load forHA coal.
Figure 8. Variation of exergy efficiency with load fordifferent part-load control operation of a SupC power plant.
Figure 11. Variation of feed water temperature withload.
3-E ANALYSIS OF ADVANCED POWER PLANTS 733
Copyright r 2009 John Wiley & Sons, Ltd. Int. J. Energy Res. 2010; 34:716–735
DOI: 10.1002/er
that the maximum exergy destruction takes placein the steam generator dominated by irreversi-bilities associated with coal combustion andheat transfer. So, exergy analysis gives us insightthat the design/process modifications should befocussed on the combustor/steam generator ratherthan the condenser. A reduction of about 3–5%and 15–17% in specific emission of CO2, SOx,NOx, and particulates was observed by migratingto SupC and USC power plants, respectively, ascompared to the SubC power plant. Therefore,installing power plants based on advanced steamparameters seems to be an efficient short-termmeasure to mitigate burgeoning emissions. Thepart-load performance shows that the slidingpressure control results in higher efficiencies acrossthe load as compared to the throttling control.Thus, it is anticipated that 3-E analysis will aid indecision-making through the selection of appro-priate technology for future capacity addition.
NOMENCLATURE
h 5 specific enthalpy (kJ kg�1)_I 5 irreversibility rate (kW)_m 5mass flow rate (kg s�1)_N 5molar flow rate (kmol s�1)_Q 5 heat transfer rate (kW)T 5 temperature (1C)_W 5work rate (kW)_X 5 exergy rate (kW)
Greek symbols
Z 5 plant energy efficiency (%)e 5 plant exergy efficiency (%)c 5 specific exergy (kJ kg�1)
Acronyms
3-E 5 energy, exergy, and environmentHA 5 high ashLA 5 low ashSubC 5 subcriticalSupC 5 supercriticalUSC 5 ultrasupercritical
Subscripts
cv 5 control volumee 5 exiti 5 inletj 5 boundaryo 5 reference/dead statep 5 production
ACKNOWLEDGEMENTS
Authors thank Ir. Theo Woudstra and Ir. NicoWoudstra, Delft University of Technology for providingthe technical support for Cycle-Tempo.
REFERENCES
1. Ministry of Coal (MOC), Government of India, 2008.Available from: http://www.coal.nic.in/. Accessed onOctober 10, 2008.
2. Central Electricity Authority (CEA). Installed GenerationCapacity as on January 31, 2009, CEA, Governmentof India, 2009. Available from: http://www.cea.nic.in/.Accessed on March 4, 2009.
3. Gaggioli RA, Petit PJ. Use the second law first. Chemtech1977; 7:496–506.
4. Moran MJ, Sciubba E. Exergy analysis: principles andpractice. Journal of Engineering for Gas Turbines and Power1994; 116:285–290.
5. Rosen MA. Second-law analysis: approaches and implica-tions. International Journal of Energy Research 1999; 23:415–429.
6. Dincer I, Cengel YA. Energy, entropy and exergy conceptsand their roles in thermal engineering. Entropy 2001; 3(3):116–149.
7. Cengel YA, Boles MA. Thermodynamics: An EngineeringApproach (5th edn). Tata McGraw-Hill PublishingCompany Limited: New Delhi, 2006.
8. Habib MA, Said SAM, Al-Bagawi JJ. Thermodynamicperformance analysis of the Ghazlan power plant. Energy1995; 20(11):1121–1130.
9. Dincer I, Al-Muslim H. Thermodynamic analysis of reheatcycle steam power plants. International Journal of EnergyResearch 2001; 25:727–739. DOI: 10.1002/er.717.
10. Rosen MA. Energy- and exergy-based comparison of coal-fired and nuclear steam power plants. Exergy InternationalJournal 2001; 1(3):180–192.
11. Sengupta S, Datta A, Duttagupta S. Exergy analysis of acoal-based 210MW thermal power plant. InternationalJournal of Energy Research 2007; 31:14–28. DOI:10.1002/er.1224.
12. Rosen MA, Tang R. Effect of altering combustion air flowon a steam power plant: Energy and exergy analysis.International Journal of Energy Research 2007; 31:219–231.DOI: 10.1002/er.1242.
M. V. J. J. SURESH, K. S. REDDY AND A. K. KOLAR734
Copyright r 2009 John Wiley & Sons, Ltd. Int. J. Energy Res. 2010; 34:716–735
DOI: 10.1002/er
13. Kopac M, Hilaci A. Effect of ambient temperatureon the efficiency of the regenerative and reheat Catalagzipower plant in Turkey. Applied Thermal Engineering 2007;27:1377–1385. DOI: 10.1016/j.applthermaleng.2006.10.029.
14. Ameri M, Ahmadi P, Hamidi A. Energy, exergy andexergoeconomic analysis of a steam power plant: A casestudy. International Journal of Energy Research 2009;33:499–512. DOI: 10.1002/er.1495.
15. Bugge J, Kjaer S, Blum R. High-efficiency coal-fired powerplants development and perspectives. Energy 2006; 31:1437–1445.
16. Cihan A, Hac�haf�zoglu O, Kahveci K. Energy-exergyanalysis and modernization suggestions for a combined-cycle power plant. International Journal of Energy Research2006; 30:115–126. DOI: 10.1002/er.1133.
17. Hammond GP, Akwe SSO. Thermodynamic and relatedanalysis of natural gas combined cycle combined cyclepower plants with and without carbon sequestration.International Journal of Energy Research 2007; 31:1180–1201. DOI: 10.1002/er.1328.
18. Reddy BV, Chui KF, Gnanapragasam NV, Prasad RC.Energy and exergy analyses of a CFB–based indirectlyfired combined cycle power generation system. Inter-national Journal of Energy Research 2009. DOI:10.1002/er.1537.
19. Central Electricity Authority. Report of the Committee toRecommend Next Higher Size of Coal Fired Thermal PowerStations. Ministry of Power, Government of India,November 2003. Available from: http://www.cea.nic.in/thermal/Special_reports/index_special_reports_thermal.htm.Accessed on August 25, 2008.
20. National Thermal Power Corporation Limited—Engineer-ing Office Complex, Noida, India. Private communication,2008.
21. DONG Energy Generation, Denmark. Private communi-cation, 2008.
22. Baehr HD. Die Exergie von Kohle und Heizoel (the exergyof coal and fuel oil). BWK Band 39, Nr.1/2, January/February 1987; 42–45.
23. Delft University of Technology. Cycle-Tempo Release 5.0,Delft University of Technology, 2008. See also http://
www.tudelft.nl/live/pagina.jsp?id 5 8c53f82e-a500-41f1-971b-629e832bfbef&lang 5 en. Accessed on November20, 2008.
24. Barroso J, Ballester J, Ferrer LM, Jimenez S. Study of coalash deposition in an entrained flow reactor: Influence ofcoal type, blend composition and operating conditions.Fuel Processing Technology 2006; 87:737–752.
25. Srinivas T, Gupta AVSSKS, Reddy BV. General thermo-dynamic analysis of steam power cycles with ‘n’ number offeedwater heaters. International Journal of Thermodynamics2007; 10(4):177–185.
26. U.S. Department of Energy. Market-based Advanced CoalPower Systems, Washington, 1999. Available from: http://www.netl.doe.gov/technologies/coalpower/refshelf/marketbased_systems_report.pdf. Accessed on September 11, 2008.
27. Frankland SC, Johar JMS. Technical and economicfeasibility of low ash power station fuel in India. ReportNo.COAL R254 DTI/Pub URN 04/822, March, 2004.Available from: http://www.berr.gov.uk/files/file20565.pdf.Accessed on January 25, 2008.
28. Bellhouse GM, Whittington HW. Simulation of gaseousemissions from electricity generating plant. Electrical Power& Energy Systems 1996; 18(8):501–507.
29. Phong-Anant D, Wibberley LJ, Wall TF. Nitrogen oxideformation from Australian coals. Combustion and Flame1985; 62:21–30.
30. U.S. Environmental Protection Agency. ExternalCombustion Sources (5th edn), vol. I, Chapter 1, AP42,2008. See also http://www.epa.gov/ttn/chief/ap42/ch01/index.html. Accessed on November 20, 2008.
31. Bhanarkar AD, Gavane AG, Tajne DS, Tamhane SM,Nema P. Composition and size distribution of particulesemissions from a coal-fired power plant in India. Fuel 2008;87:2095–2101.
32. Moran MJ, Shapiro HN. Fundamentals of EngineeringThermodynamics (4th edn). Wiley: New York, 2000.
33. Dunbar WR, Lior N. Combining fuel cells with fuel-firedpower plants for improved exergy efficiency. Energy 1991;16(10):1259–1274.
34. Delft University of Technology. Cycle-Tempo ReferenceManual, Delft University of Technology, 2008.
3-E ANALYSIS OF ADVANCED POWER PLANTS 735
Copyright r 2009 John Wiley & Sons, Ltd. Int. J. Energy Res. 2010; 34:716–735
DOI: 10.1002/er