Embed Size (px)
Citation preview
3 STEPS TO BECOMING AN ANALYTICS-DRIVEN ORGANIZATIONWhite paper
2
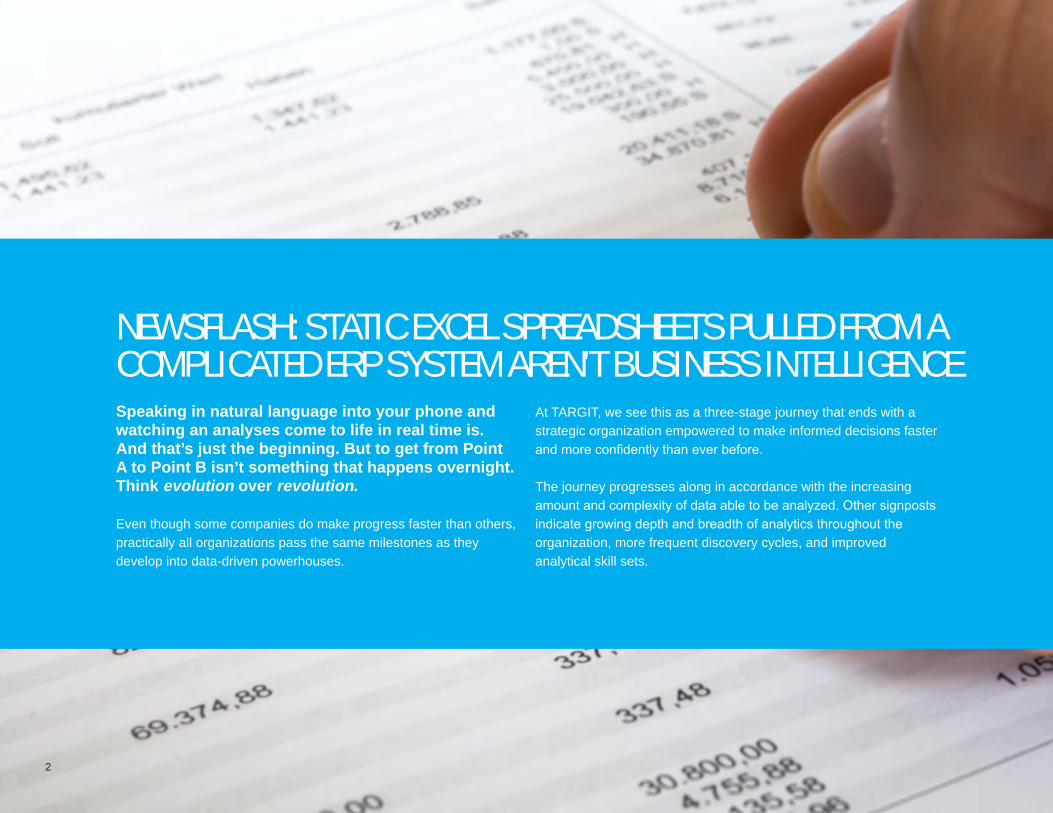
Speaking in natural language into your phone and watching an analyses come to life in real time is. And that’s just the beginning. But to get from Point A to Point B isn’t something that happens overnight. Think evolution over revolution.
Even though some companies do make progress faster than others, practically all organizations pass the same milestones as they develop into data-driven powerhouses.
At TARGIT, we see this as a three-stage journey that ends with a strategic organization empowered to make informed decisions faster and more confidently than ever before.
The journey progresses along in accordance with the increasing amount and complexity of data able to be analyzed. Other signposts indicate growing depth and breadth of analytics throughout the organization, more frequent discovery cycles, and improved analytical skill sets.
NEWSFLASH: STATIC EXCEL SPREADSHEETS PULLED FROM A COMPLICATED ERP SYSTEM AREN’T BUSINESS INTELLIGENCE
3
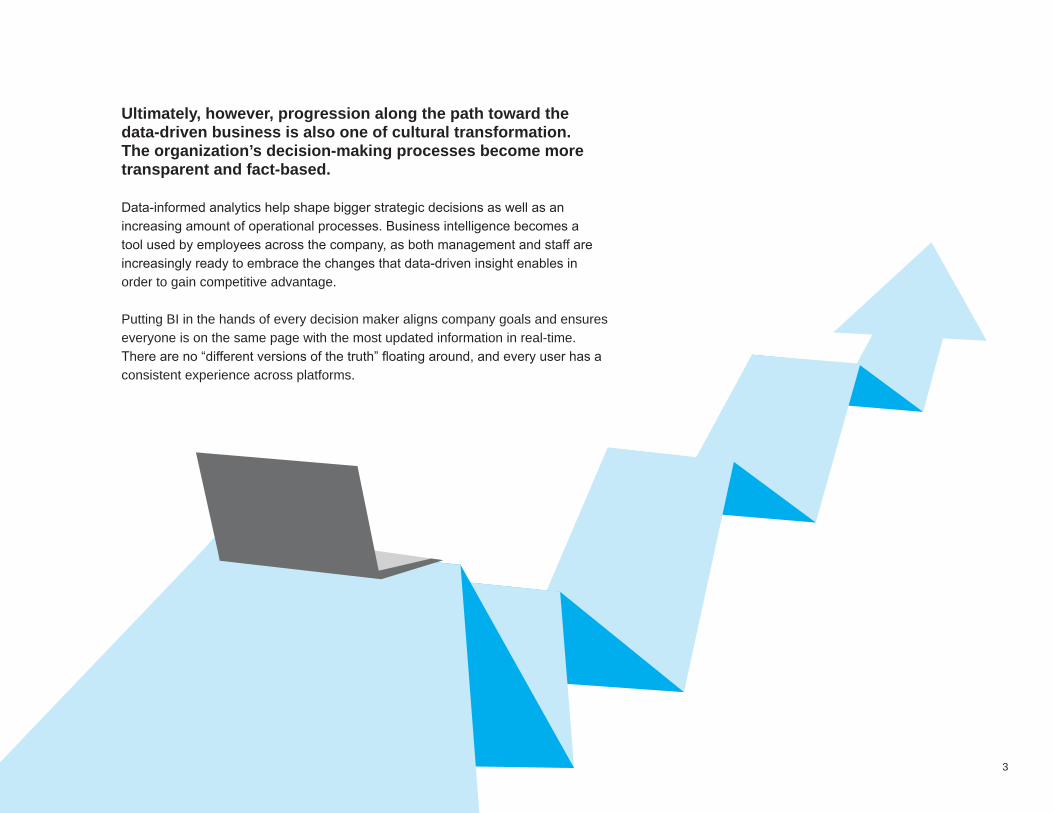
Ultimately, however, progression along the path toward the data-driven business is also one of cultural transformation. The organization’s decision-making processes become more transparent and fact-based.
Data-informed analytics help shape bigger strategic decisions as well as an increasing amount of operational processes. Business intelligence becomes a tool used by employees across the company, as both management and staff are increasingly ready to embrace the changes that data-driven insight enables in order to gain competitive advantage.
Putting BI in the hands of every decision maker aligns company goals and ensures everyone is on the same page with the most updated information in real-time. There are no “different versions of the truth” floating around, and every user has a consistent experience across platforms.

4
BEFORE THE JOURNEY
The startling fact is, there are more businesses who don’t yet use a comprehensive Business Intelligence solution than those who do.
While mom and pops and other small businesses make up the obvious majority in terms of sheer numbers, we believe there are still plenty of multi-million dollar companies here as well. We consider this a Pre-Analytic stage because these companies have not yet entered into the BI journey.
Pre-analytic companies aren’t necessarily clueless or underperformers. Many large, international companies are at this stage. Rather, they’re using the same sorts of management information systems today as they did 20 years ago: standard reports produced via their ERP systems and static analyses created in Excel.
“Many large, international companies areat this stage.
5
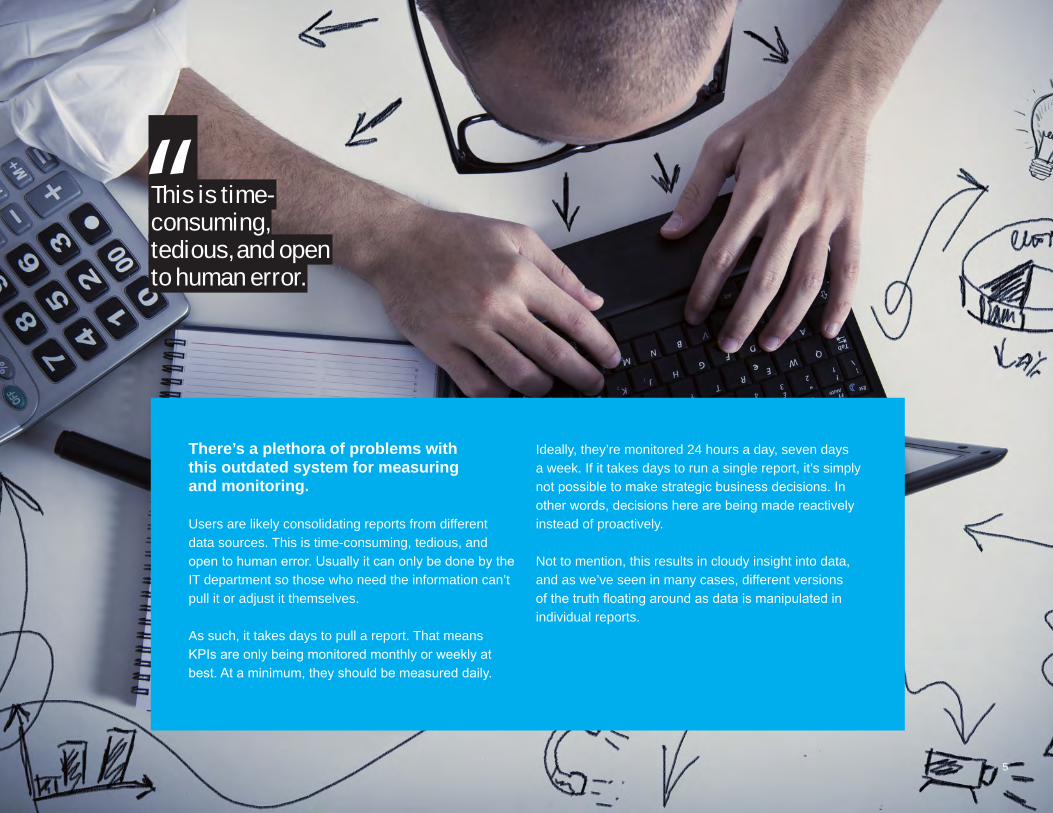
There’s a plethora of problems with this outdated system for measuring and monitoring.
Users are likely consolidating reports from different data sources. This is time-consuming, tedious, and open to human error. Usually it can only be done by the IT department so those who need the information can’t pull it or adjust it themselves.
As such, it takes days to pull a report. That means KPIs are only being monitored monthly or weekly at best. At a minimum, they should be measured daily.
Ideally, they’re monitored 24 hours a day, seven days a week. If it takes days to run a single report, it’s simply not possible to make strategic business decisions. In other words, decisions here are being made reactively instead of proactively.
Not to mention, this results in cloudy insight into data, and as we’ve seen in many cases, different versions of the truth floating around as data is manipulated in individual reports.
“This is time-consuming, tedious, and opento human error.
6
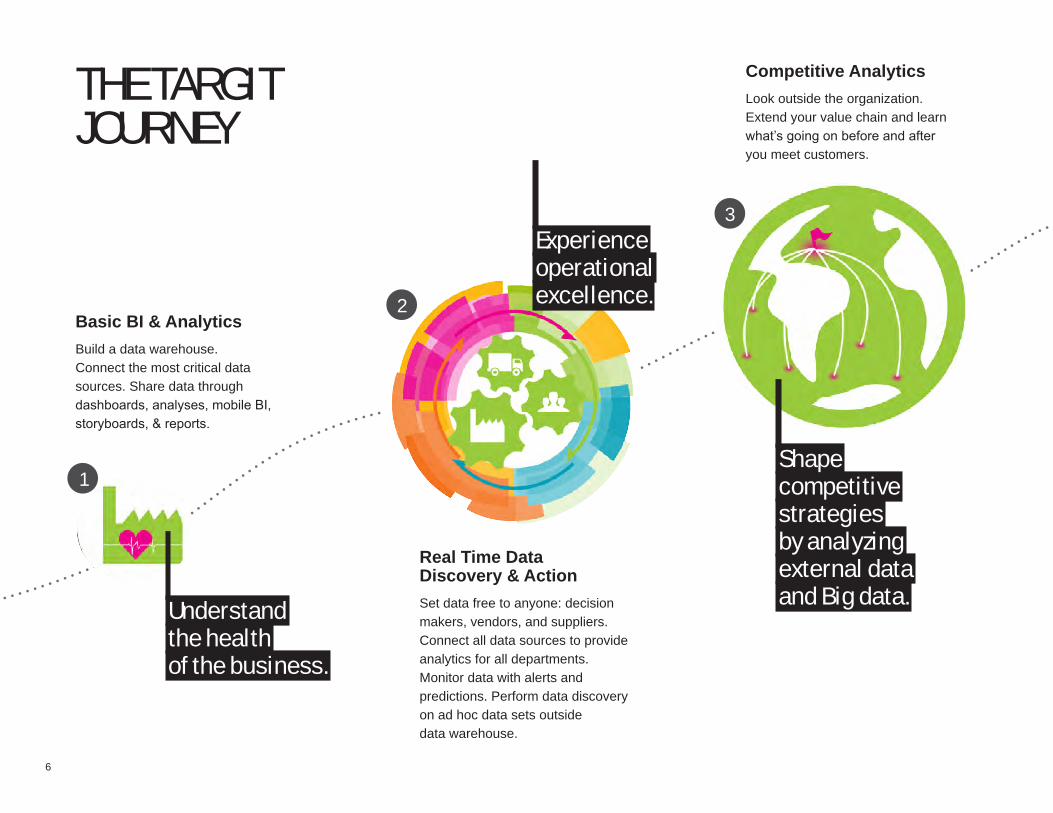
THE TARGIT JOURNEY
Real Time Data Discovery & ActionSet data free to anyone: decision makers, vendors, and suppliers. Connect all data sources to provide analytics for all departments. Monitor data with alerts and predictions. Perform data discovery on ad hoc data sets outside data warehouse.
Experience operational excellence.
Competitive AnalyticsLook outside the organization. Extend your value chain and learn what’s going on before and after you meet customers.
Understand the health of the business.
Shape competitive strategies by analyzing external data and Big data.
1
2
3
Basic BI & Analytics Build a data warehouse. Connect the most critical data sources. Share data through dashboards, analyses, mobile BI, storyboards, & reports.

BEGINNING BI
The first step on the journey toward data-driven performance is a significant one. With a BI solution like TARGIT, users can get up and running almost instantly with BI Accelerators.
Pre-built data stores come standard and users experience easy adoption with pre-defined reports, dashboards, and analyses.
The company is taking BI baby steps, incorporating first the data sources that are most critical to the business. This is the operational level of BI. Basic reports and analytics are pulled easily. Management has committed to a unified version of the truth based on approved data sources, and starts to dig into internal data to reveal new kinds of actionable insight.
Whereas most reports and analyses used to be limited to two dimensions, users become fluent in creating multi-dimensional analytics. It’s at this point that users have entered what we at TARGIT call the Action Loop, in which they travel through the cycle of observation, orientation, decision, and action.
1
7
8
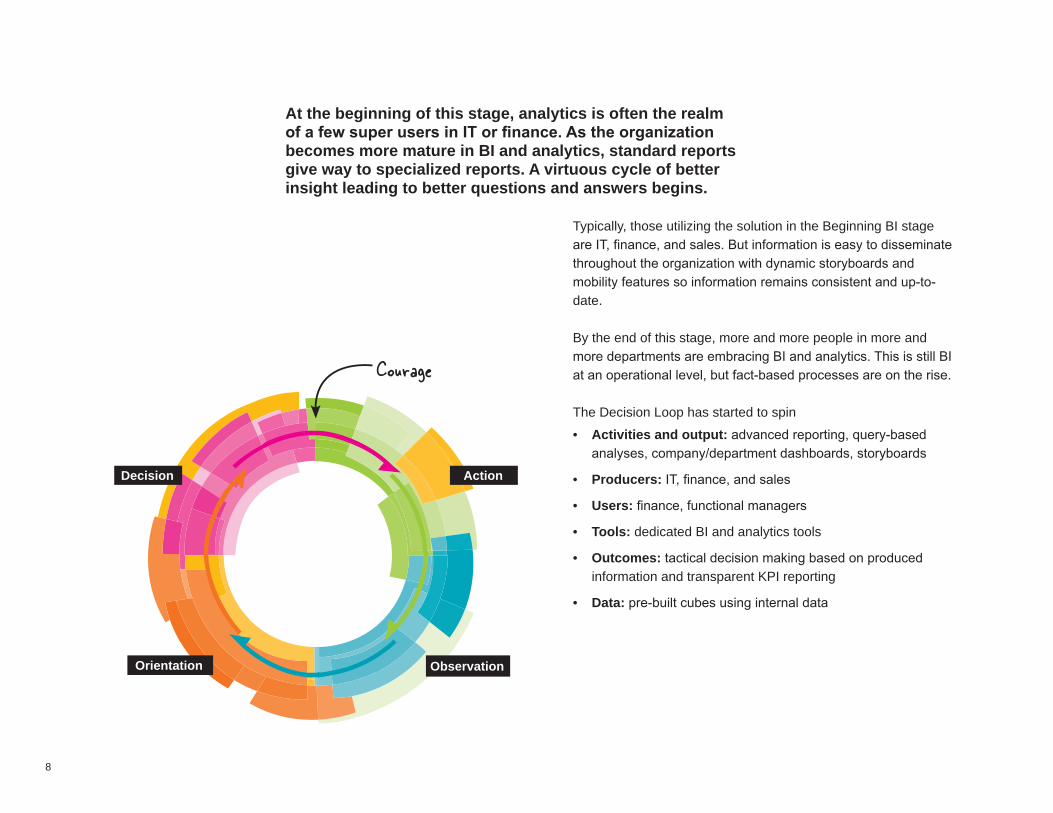
ActionDecision
Orientation Observation
Typically, those utilizing the solution in the Beginning BI stage are IT, finance, and sales. But information is easy to disseminate throughout the organization with dynamic storyboards and mobility features so information remains consistent and up-to-date.
By the end of this stage, more and more people in more and more departments are embracing BI and analytics. This is still BI at an operational level, but fact-based processes are on the rise.
The Decision Loop has started to spin
• Activities and output: advanced reporting, query-based analyses, company/department dashboards, storyboards
• Producers: IT, finance, and sales
• Users: finance, functional managers
• Tools: dedicated BI and analytics tools
• Outcomes: tactical decision making based on produced information and transparent KPI reporting
• Data: pre-built cubes using internal data
At the beginning of this stage, analytics is often the realm of a few super users in IT or finance. As the organization becomes more mature in BI and analytics, standard reports give way to specialized reports. A virtuous cycle of better insight leading to better questions and answers begins.
9
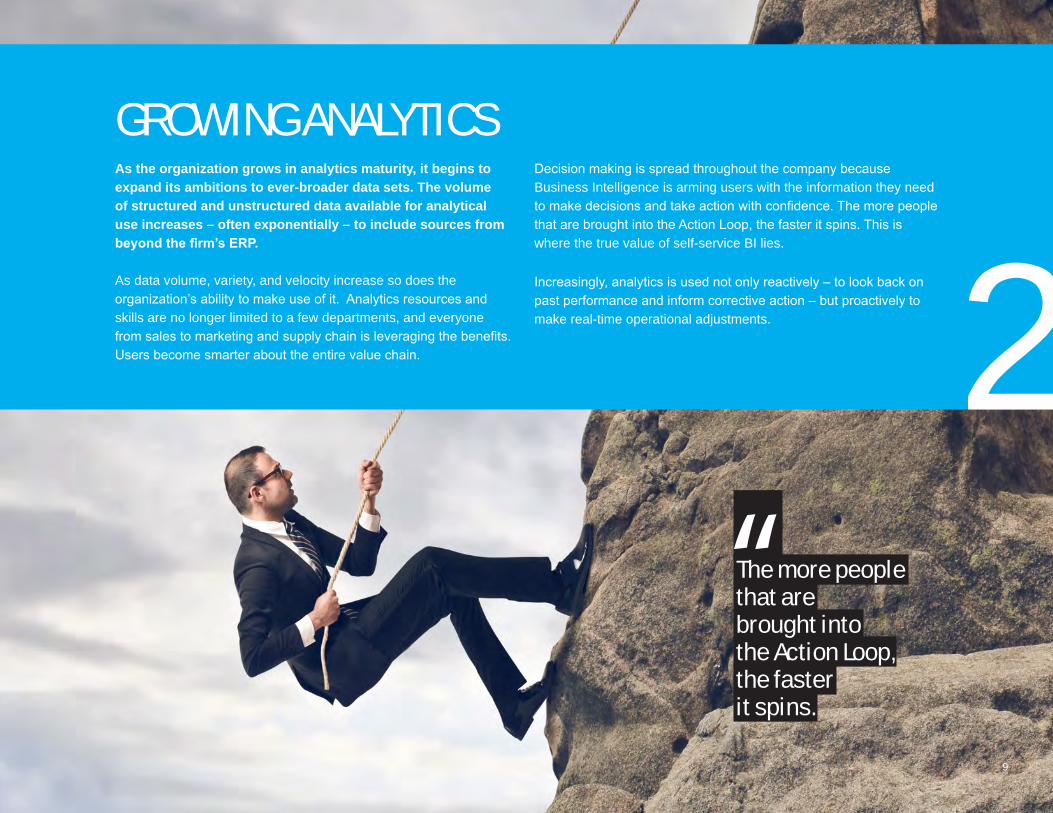
As the organization grows in analytics maturity, it begins to expand its ambitions to ever-broader data sets. The volume of structured and unstructured data available for analytical use increases – often exponentially – to include sources from beyond the firm’s ERP.
As data volume, variety, and velocity increase so does the organization’s ability to make use of it. Analytics resources and skills are no longer limited to a few departments, and everyone from sales to marketing and supply chain is leveraging the benefits. Users become smarter about the entire value chain.
Decision making is spread throughout the company because Business Intelligence is arming users with the information they need to make decisions and take action with confidence. The more people that are brought into the Action Loop, the faster it spins. This is where the true value of self-service BI lies.
Increasingly, analytics is used not only reactively – to look back on past performance and inform corrective action – but proactively to make real-time operational adjustments.
GROWING ANALYTICS
2 “The more people that are brought into the Action Loop, the faster it spins.
10
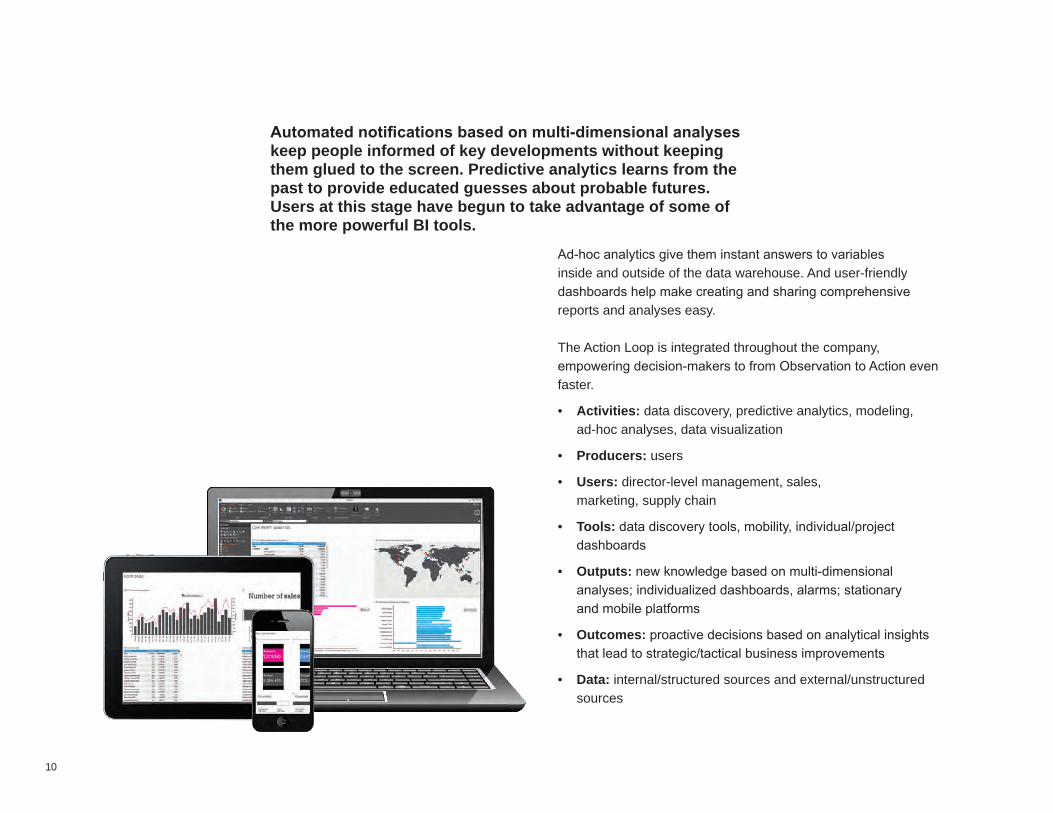
Ad-hoc analytics give them instant answers to variables inside and outside of the data warehouse. And user-friendly dashboards help make creating and sharing comprehensive reports and analyses easy.
The Action Loop is integrated throughout the company, empowering decision-makers to from Observation to Action even faster.
• Activities: data discovery, predictive analytics, modeling, ad-hoc analyses, data visualization
• Producers: users
• Users: director-level management, sales, marketing, supply chain
• Tools: data discovery tools, mobility, individual/project dashboards
• Outputs: new knowledge based on multi-dimensional analyses; individualized dashboards, alarms; stationary and mobile platforms
• Outcomes: proactive decisions based on analytical insights that lead to strategic/tactical business improvements
• Data: internal/structured sources and external/unstructured sources
Automated notifications based on multi-dimensional analyses keep people informed of key developments without keeping them glued to the screen. Predictive analytics learns from the past to provide educated guesses about probable futures.Users at this stage have begun to take advantage of some of the more powerful BI tools.
11
ADVANCED ANALYTICS
Although we propose this stage as the last of three for the learning organization, there’s nothing final about it. The leading edge of analytics is constantly moving ahead and changing whatever game it’s playing in.
Companies operating at this level of maturity use data disruptively. They employ the most highly skilled analytics resources they can find – and they often can’t find enough of them.
This is when ad-hoc analytics with external data sources come into play. External data is the vast amount of data that you cannot control, or big data. With resources like Twitter, Facebook, Google, and blogs at every consumer’s fingertips, it won’t be long before a company’s external data far exceeds their internal data.
3
12
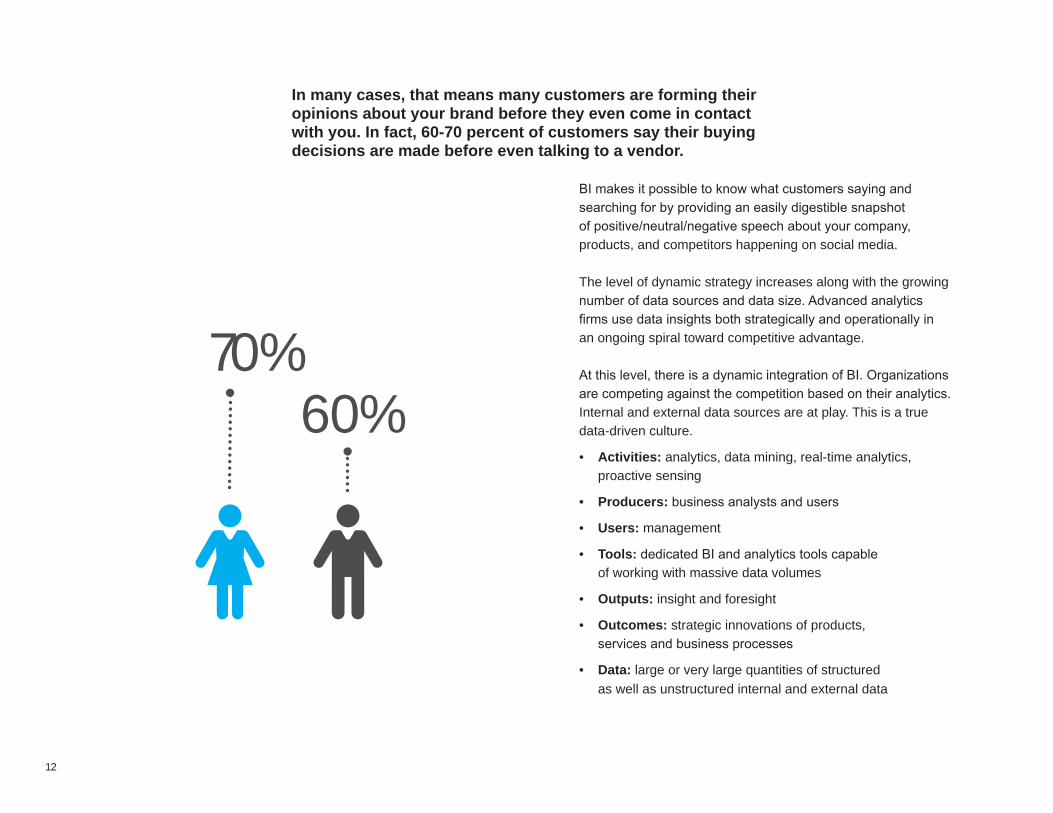
BI makes it possible to know what customers saying and searching for by providing an easily digestible snapshot of positive/neutral/negative speech about your company, products, and competitors happening on social media.
The level of dynamic strategy increases along with the growing number of data sources and data size. Advanced analytics firms use data insights both strategically and operationally in an ongoing spiral toward competitive advantage.
At this level, there is a dynamic integration of BI. Organizations are competing against the competition based on their analytics. Internal and external data sources are at play. This is a true data-driven culture.
• Activities: analytics, data mining, real-time analytics, proactive sensing
• Producers: business analysts and users
• Users: management
• Tools: dedicated BI and analytics tools capable of working with massive data volumes
• Outputs: insight and foresight
• Outcomes: strategic innovations of products, services and business processes
• Data: large or very large quantities of structured as well as unstructured internal and external data
In many cases, that means many customers are forming their opinions about your brand before they even come in contact with you. In fact, 60-70 percent of customers say their buying decisions are made before even talking to a vendor.
70%60%
13
Our three-stage approach is a model, not an exact representation of reality. The stages are clearly not pure states.
Nonetheless, we believe organizations can use the roadmap to their advantage. Based on our decades of experience turning customers into data-driven organizations, we know that companies don’t progress from stage one to three without spending time in between.
Most importantly, a company should evolve along an axis that gives them better customer insight and market agility. It’s critical to strive for incremental, evolutionary improvements that are achievable,
rather than revolutionary leaps that promise fantastic results but also require significant shifts in corporate culture. Another lesson learned is that moving from one stage to another requires organizations to change. And as we all know, change isn’t easy. We see too many companies evolve from level one to level two only to see inertia regain control. Instead of continuing to push for greater analytics power throughout the organization, they level off in what becomes a new comfort zone.
Adaptation is the key to survival in the business jungle. The courage to act is also the courage to change old habits – and keep progressing on the path toward the data-driven business.
MISTAKING THE MAP FOR THE TERRITORY – AND INERTIA FOR PROGRESS
“Adaptation is the key to survival in the business jungle.
14
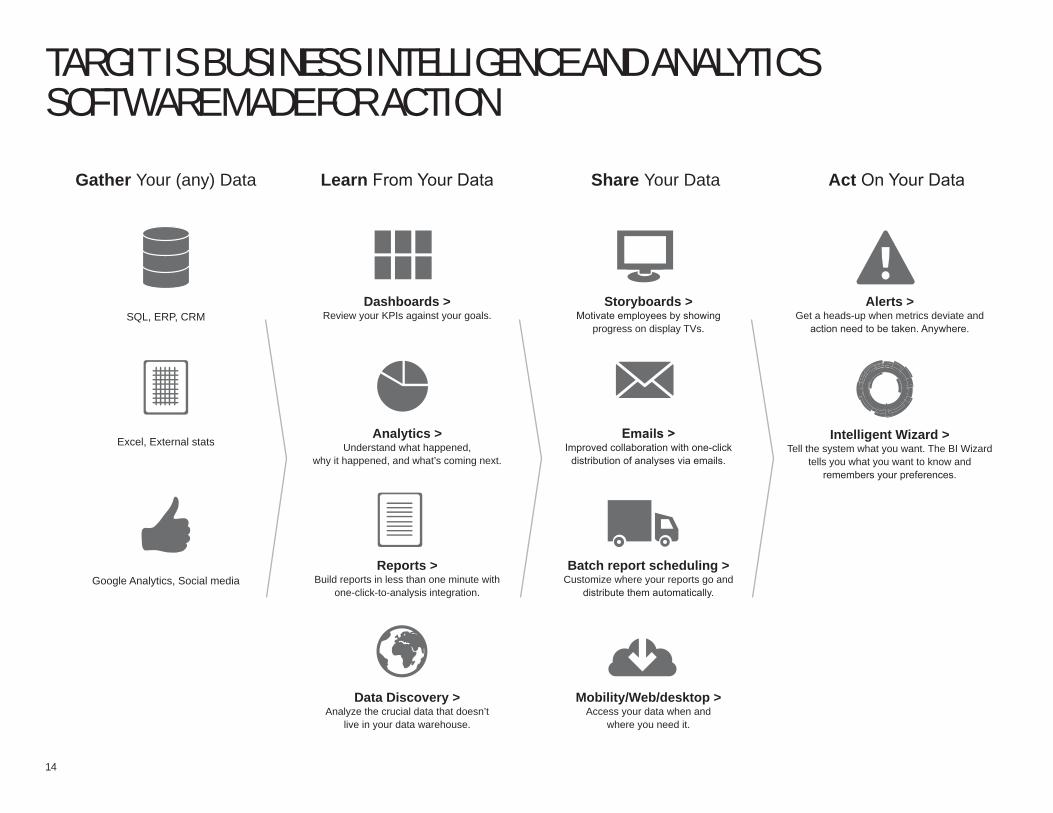
TARGIT IS BUSINESS INTELLIGENCE AND ANALYTICS SOFTWARE MADE FOR ACTION
Gather Your (any) Data Learn From Your Data Share Your Data Act On Your Data
SQL, ERP, CRMDashboards >
Review your KPIs against your goals.Storyboards >
Motivate employees by showing progress on display TVs.
Alerts >Get a heads-up when metrics deviate and
action need to be taken. Anywhere.
Excel, External statsAnalytics >
Understand what happened, why it happened, and what’s coming next.
Emails >Improved collaboration with one-click
distribution of analyses via emails.
Intelligent Wizard > Tell the system what you want. The BI Wizard
tells you what you want to know and remembers your preferences.
Google Analytics, Social mediaReports >
Build reports in less than one minute with one-click-to-analysis integration.
Batch report scheduling >Customize where your reports go and
distribute them automatically.
Data Discovery >Analyze the crucial data that doesn’t
live in your data warehouse.
Mobility/Web/desktop >Access your data when and
where you need it.
TARGIT is designed for your entire organization -- from the CEO who follows the key metrics, to financial workers who need accurate reports, to sales managers who need performance analytics and customer insights, to marketing who cares about the cost of leads, to IT who wants data security and smoothly integrated data processes. TARGIT has everybody covered.
In fact, TARGIT is the most widely deployed solution in the market, and customers rate TARGIT higher in usability than any other solution. We believe that data should be connected and available to decision makers when and where they need it. There is always one more question to ask of the data you see, and if the answer is not immediately available you run the risk of making decisions without the full picture.
That’s why TARGIT is designed to get you from dashboards and reports to analyses with only one click.
Add to that the integration tools that prepare your data for analysis in less than a day and the intelligence that lets you use natural language to ask for the report or analysis you want. TARGIT takes you from observation to action faster than any other tool on the market.
TARGIT gives you the courage to act.
www.targit.com
ONE SOLUTION TO COVER ALL ANALYTICS AND REPORTING NEEDS