Embed Size (px)
Citation preview
USER INTERFACE CREATION WITH Node-RED
Prerequisites
1) Have an account on Bluemix
2) Have created an Internet of Things Platform on Bluemix
3) Have created a device on Internet of Things Platform, and have its Device ID and its Authentication Token
4) Have generated an API KEY on Internet of Things Platform, and have its API Authentication Token
5) Have configured SS10680 gateway correctly
Procedure
1) Login on Bluemix (http://www.bluemix.net/)with your credentials
2) Go to ‘Catalog’ following this link: https://console.ng.bluemix.net/catalog/
3) From left menu, select ‘Platform’ and then click on ‘Node-RED Starter’
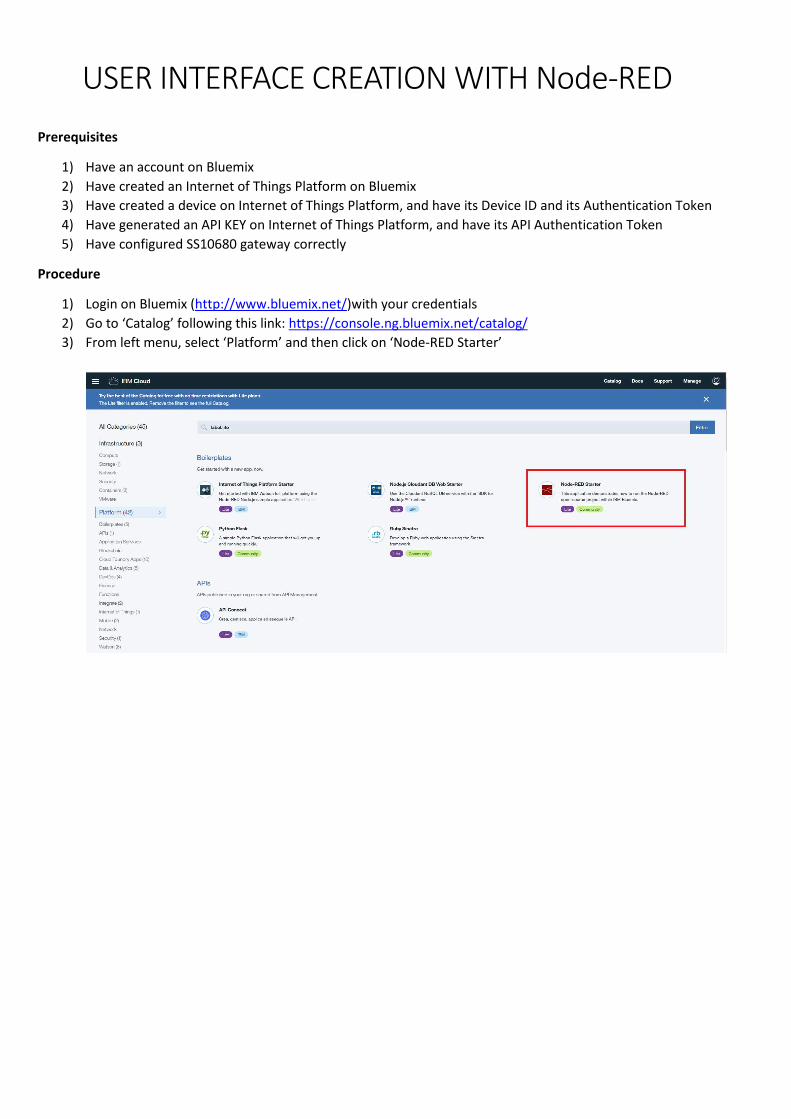
4) Fill the requested fields and then click on ‘Create’ button for create a Node-RED instance
So, now, Node-RED instance creation starts.
At the end of the procedure, the following page is shown to you
5) Click in ‘Visit application URL’
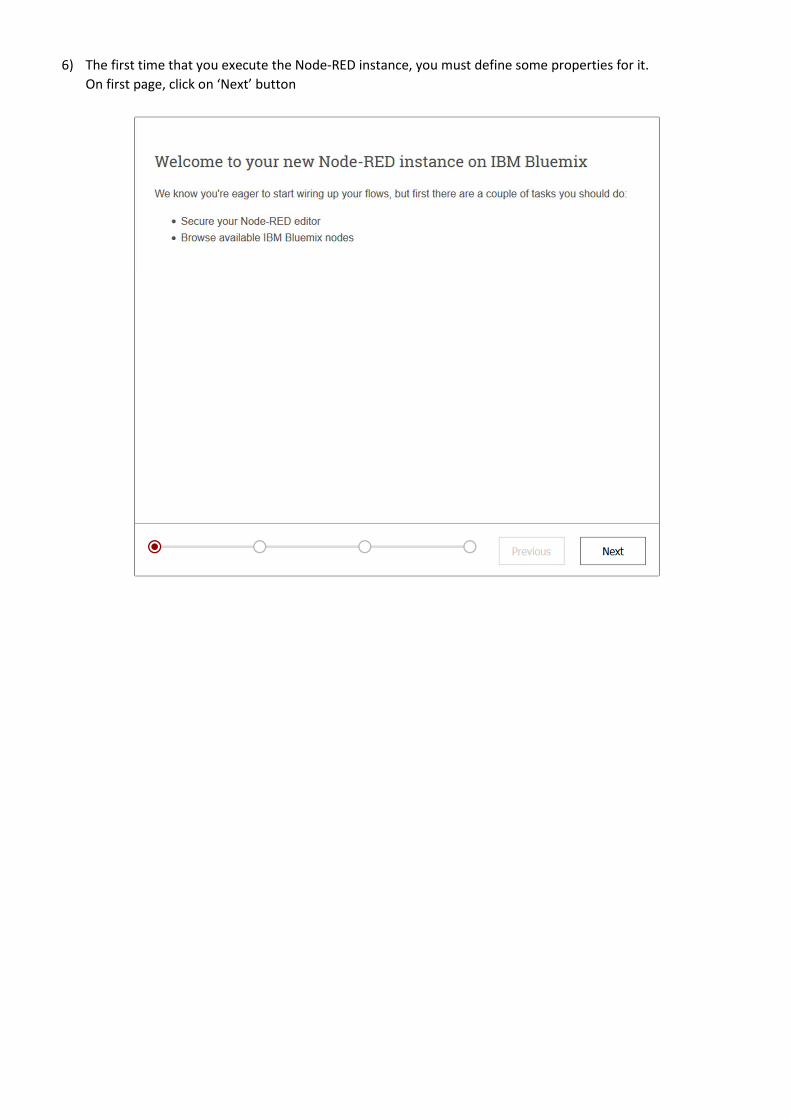
6) The first time that you execute the Node-RED instance, you must define some properties for it.
On first page, click on ‘Next’ button
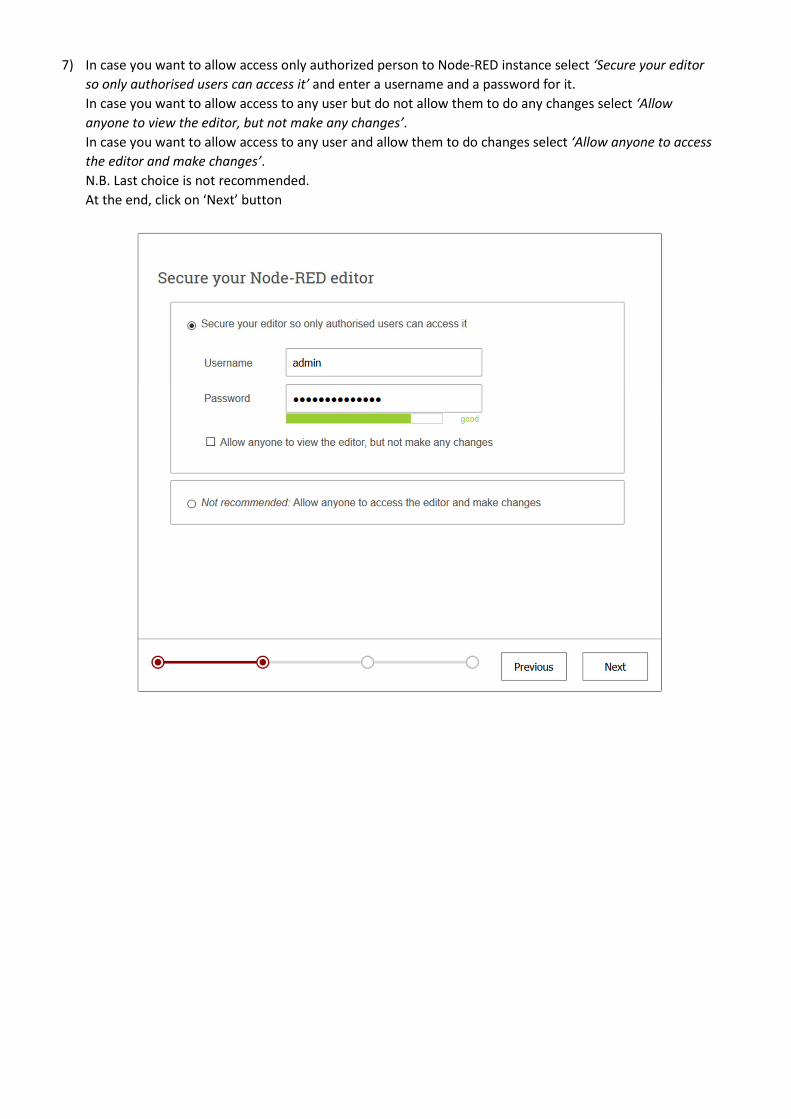
7) In case you want to allow access only authorized person to Node-RED instance select ‘Secure your editor
so only authorised users can access it’ and enter a username and a password for it.
In case you want to allow access to any user but do not allow them to do any changes select ‘Allow
anyone to view the editor, but not make any changes’.
In case you want to allow access to any user and allow them to do changes select ‘Allow anyone to access
the editor and make changes’.
N.B. Last choice is not recommended.
At the end, click on ‘Next’ button
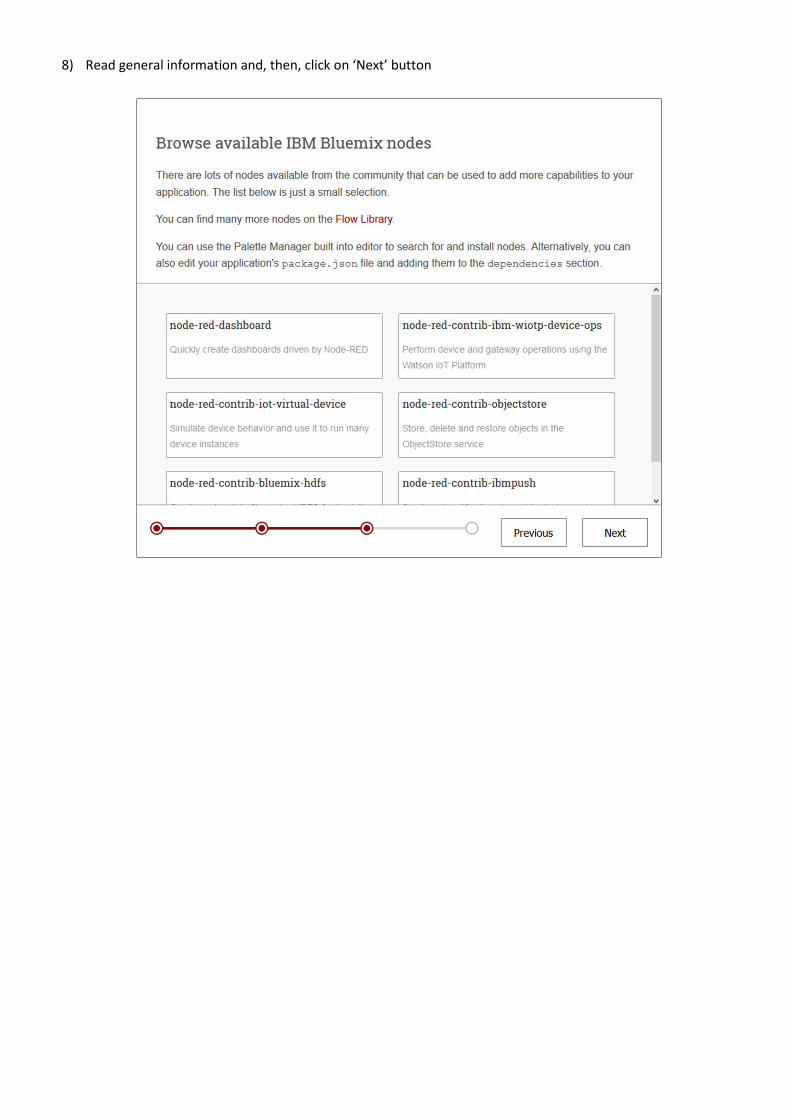
8) Read general information and, then, click on ‘Next’ button
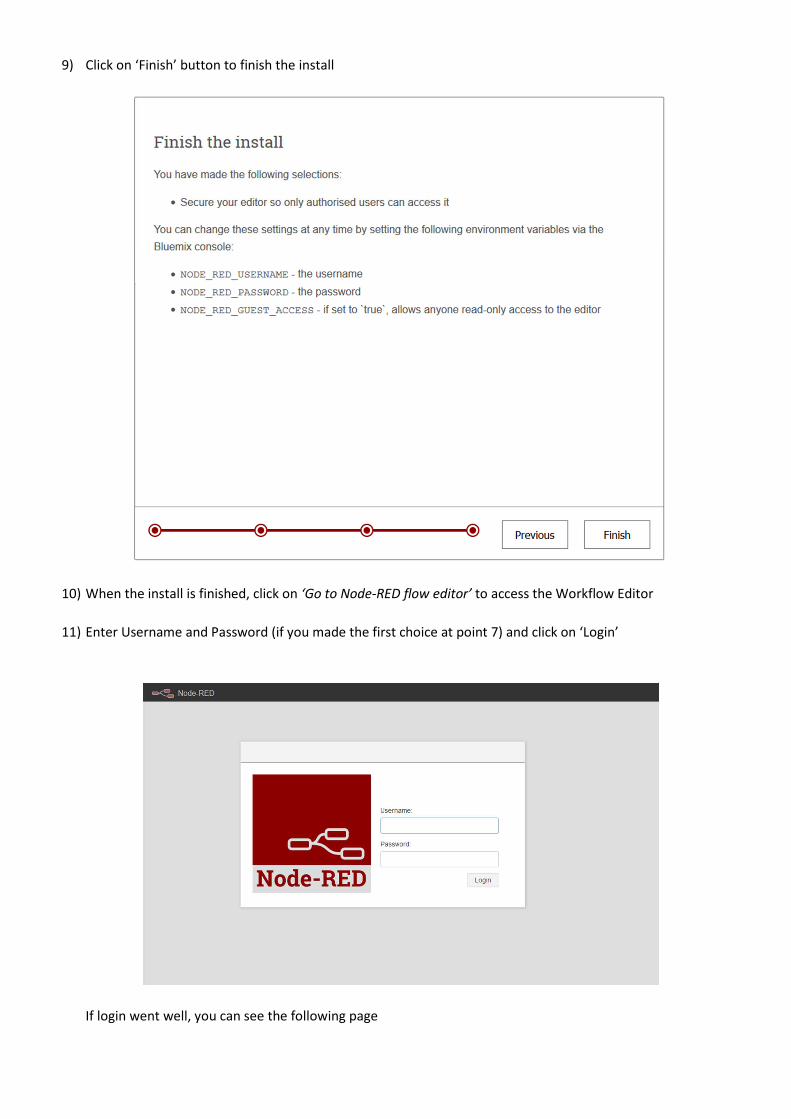
9) Click on ‘Finish’ button to finish the install
10) When the install is finished, click on ‘Go to Node-RED flow editor’ to access the Workflow Editor
11) Enter Username and Password (if you made the first choice at point 7) and click on ‘Login’
If login went well, you can see the following page
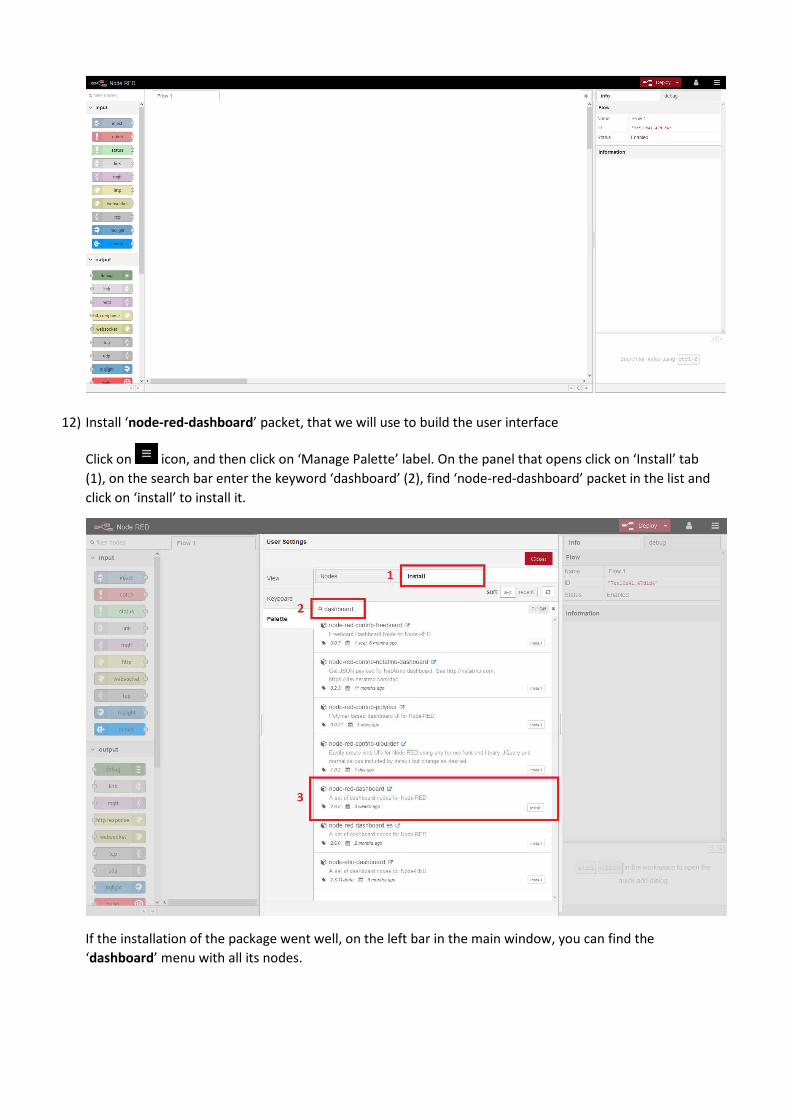
12) Install ‘node-red-dashboard’ packet, that we will use to build the user interface
Click on icon, and then click on ‘Manage Palette’ label. On the panel that opens click on ‘Install’ tab
(1), on the search bar enter the keyword ‘dashboard’ (2), find ‘node-red-dashboard’ packet in the list and
click on ‘install’ to install it.
If the installation of the package went well, on the left bar in the main window, you can find the
‘dashboard’ menu with all its nodes.
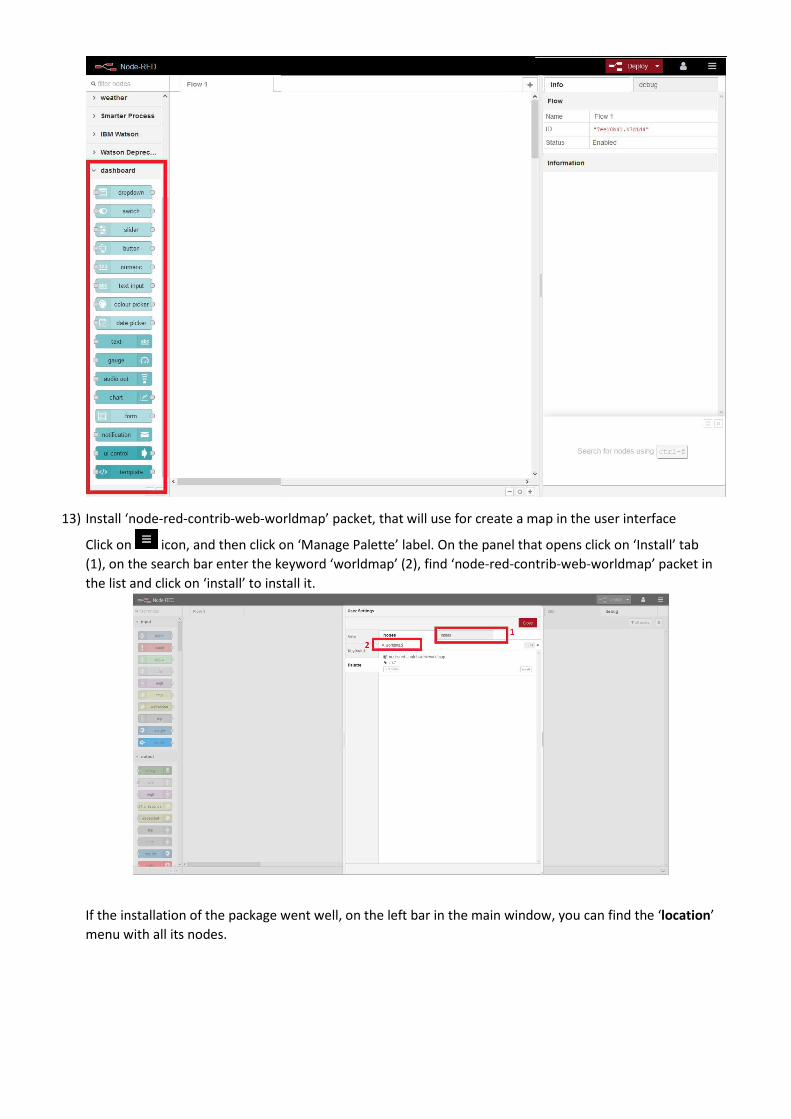
13) Install ‘node-red-contrib-web-worldmap’ packet, that will use for create a map in the user interface
Click on icon, and then click on ‘Manage Palette’ label. On the panel that opens click on ‘Install’ tab
(1), on the search bar enter the keyword ‘worldmap’ (2), find ‘node-red-contrib-web-worldmap’ packet in
the list and click on ‘install’ to install it.
If the installation of the package went well, on the left bar in the main window, you can find the ‘location’
menu with all its nodes.
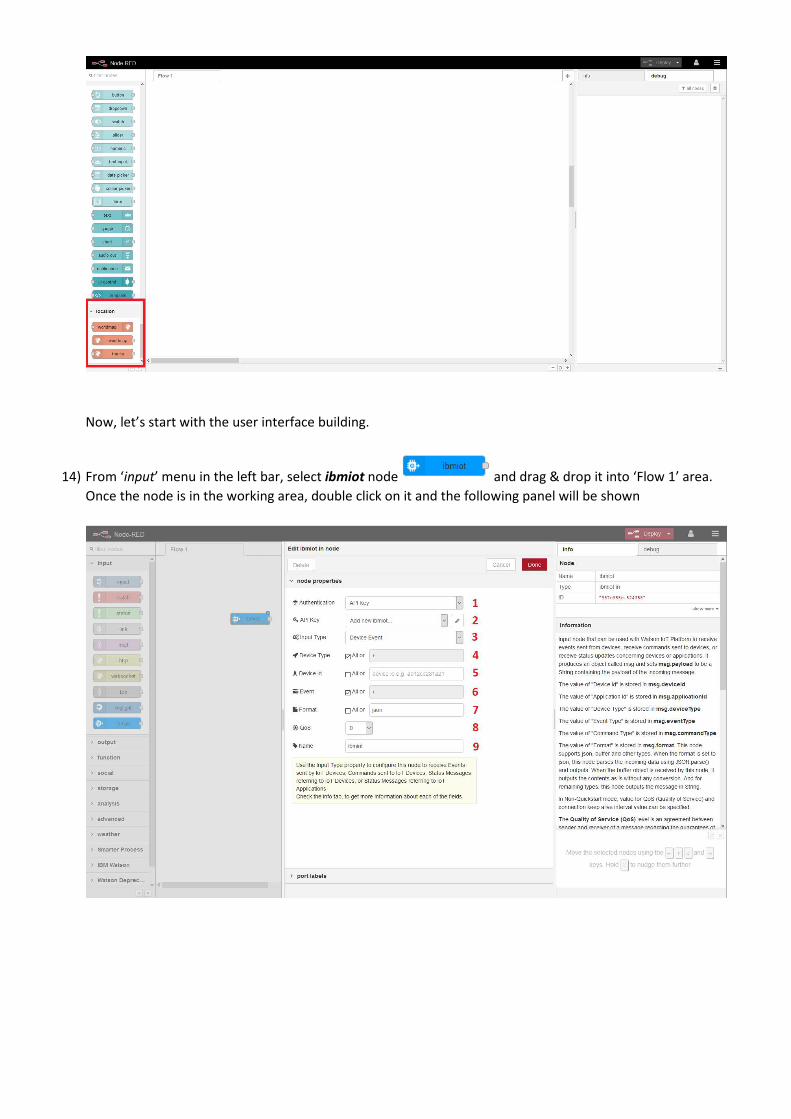
Now, let’s start with the user interface building.
14) From ‘input’ menu in the left bar, select ibmiot node and drag & drop it into ‘Flow 1’ area.
Once the node is in the working area, double click on it and the following panel will be shown
Enter the following parameter:
1. Authentication: select ‘API KEY’
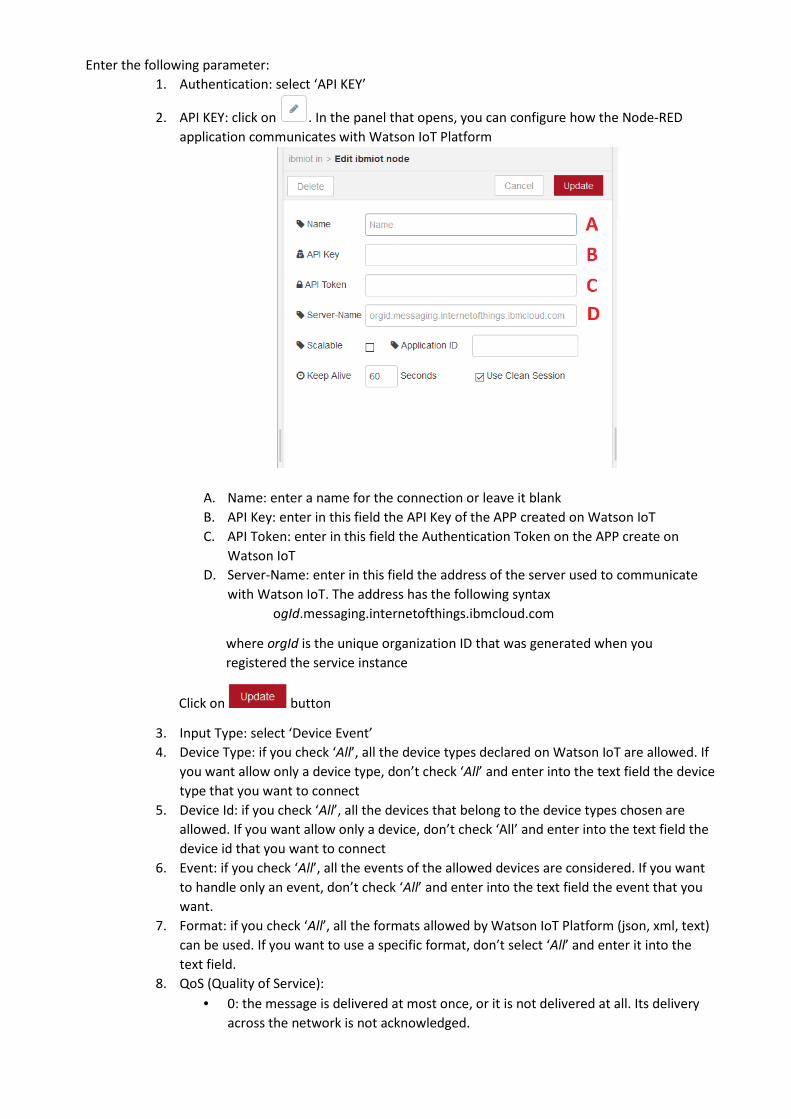
2. API KEY: click on . In the panel that opens, you can configure how the Node-RED
application communicates with Watson IoT Platform
A. Name: enter a name for the connection or leave it blank
B. API Key: enter in this field the API Key of the APP created on Watson IoT
C. API Token: enter in this field the Authentication Token on the APP create on
Watson IoT
D. Server-Name: enter in this field the address of the server used to communicate
with Watson IoT. The address has the following syntax
ogId.messaging.internetofthings.ibmcloud.com
where orgId is the unique organization ID that was generated when you
registered the service instance
Click on button
3. Input Type: select ‘Device Event’
4. Device Type: if you check ‘All’, all the device types declared on Watson IoT are allowed. If
you want allow only a device type, don’t check ‘All’ and enter into the text field the device
type that you want to connect
5. Device Id: if you check ‘All’, all the devices that belong to the device types chosen are
allowed. If you want allow only a device, don’t check ‘All’ and enter into the text field the
device id that you want to connect
6. Event: if you check ‘All’, all the events of the allowed devices are considered. If you want
to handle only an event, don’t check ‘All’ and enter into the text field the event that you
want.
7. Format: if you check ‘All’, all the formats allowed by Watson IoT Platform (json, xml, text)
can be used. If you want to use a specific format, don’t select ‘All’ and enter it into the
text field.
8. QoS (Quality of Service):
• 0: the message is delivered at most once, or it is not delivered at all. Its delivery
across the network is not acknowledged.
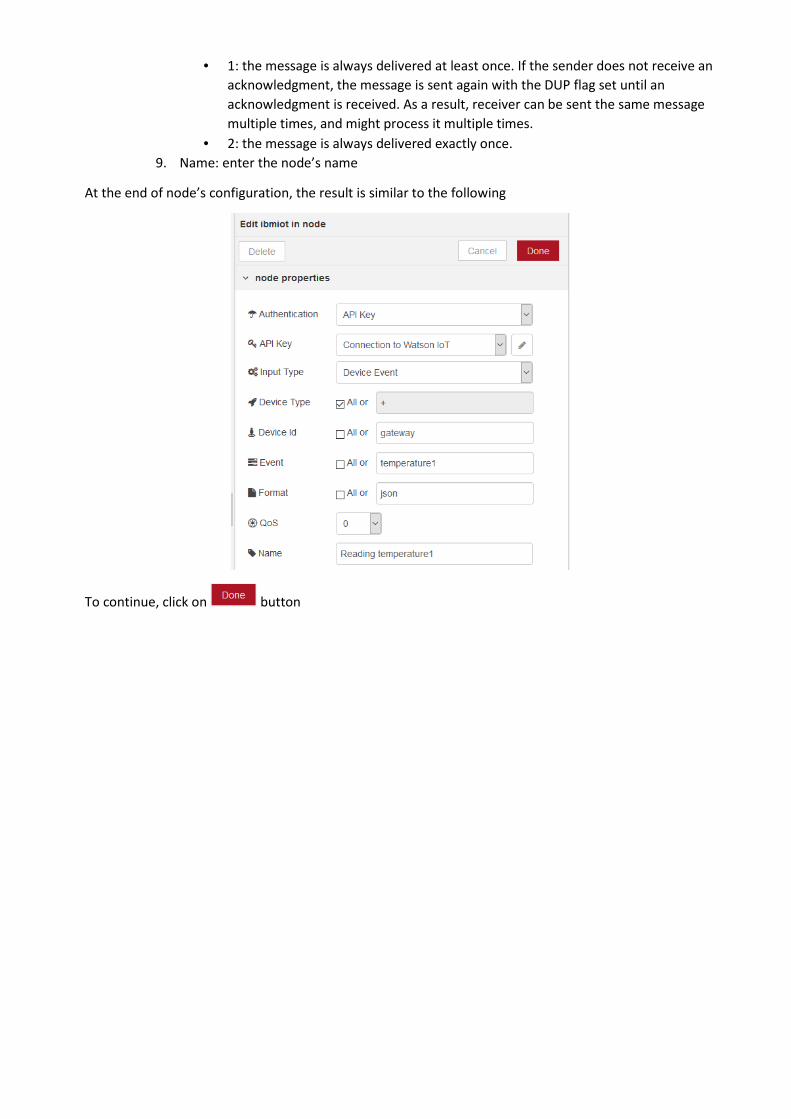
• 1: the message is always delivered at least once. If the sender does not receive an
acknowledgment, the message is sent again with the DUP flag set until an
acknowledgment is received. As a result, receiver can be sent the same message
multiple times, and might process it multiple times.
• 2: the message is always delivered exactly once.
9. Name: enter the node’s name
At the end of node’s configuration, the result is similar to the following
To continue, click on button
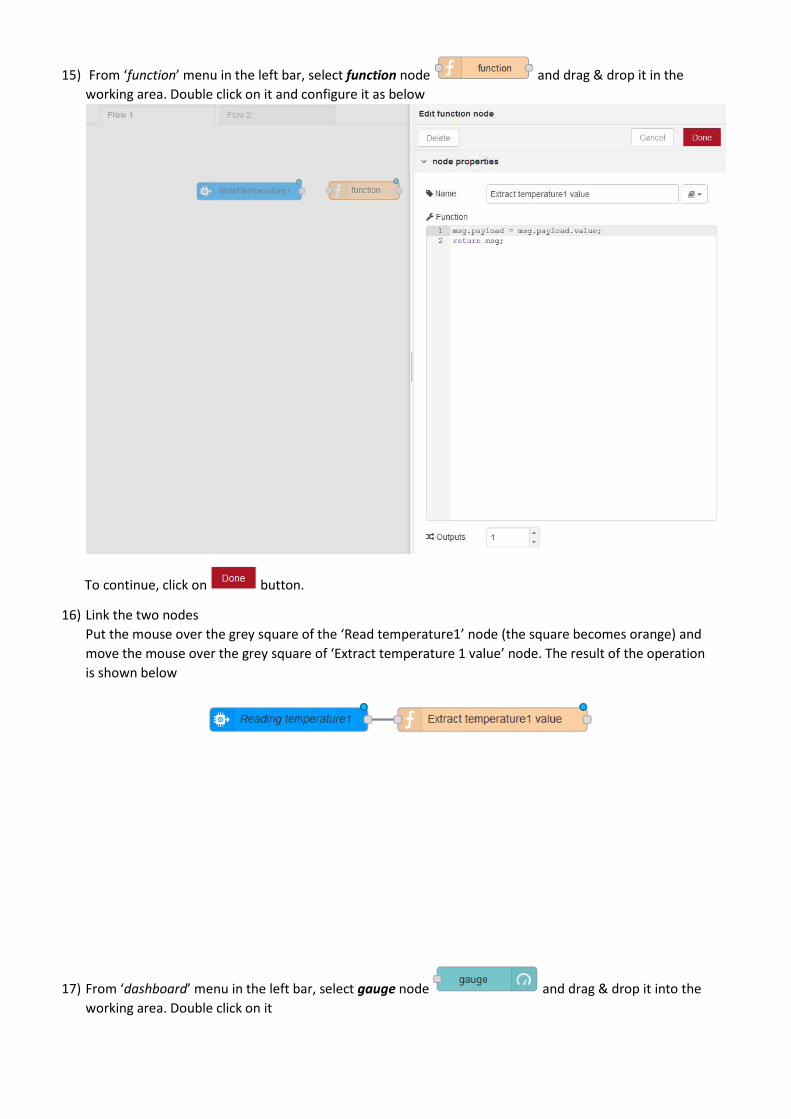
15) From ‘function’ menu in the left bar, select function node and drag & drop it in the
working area. Double click on it and configure it as below
To continue, click on button.
16) Link the two nodes
Put the mouse over the grey square of the ‘Read temperature1’ node (the square becomes orange) and
move the mouse over the grey square of ‘Extract temperature 1 value’ node. The result of the operation
is shown below
17) From ‘dashboard’ menu in the left bar, select gauge node and drag & drop it into the
working area. Double click on it
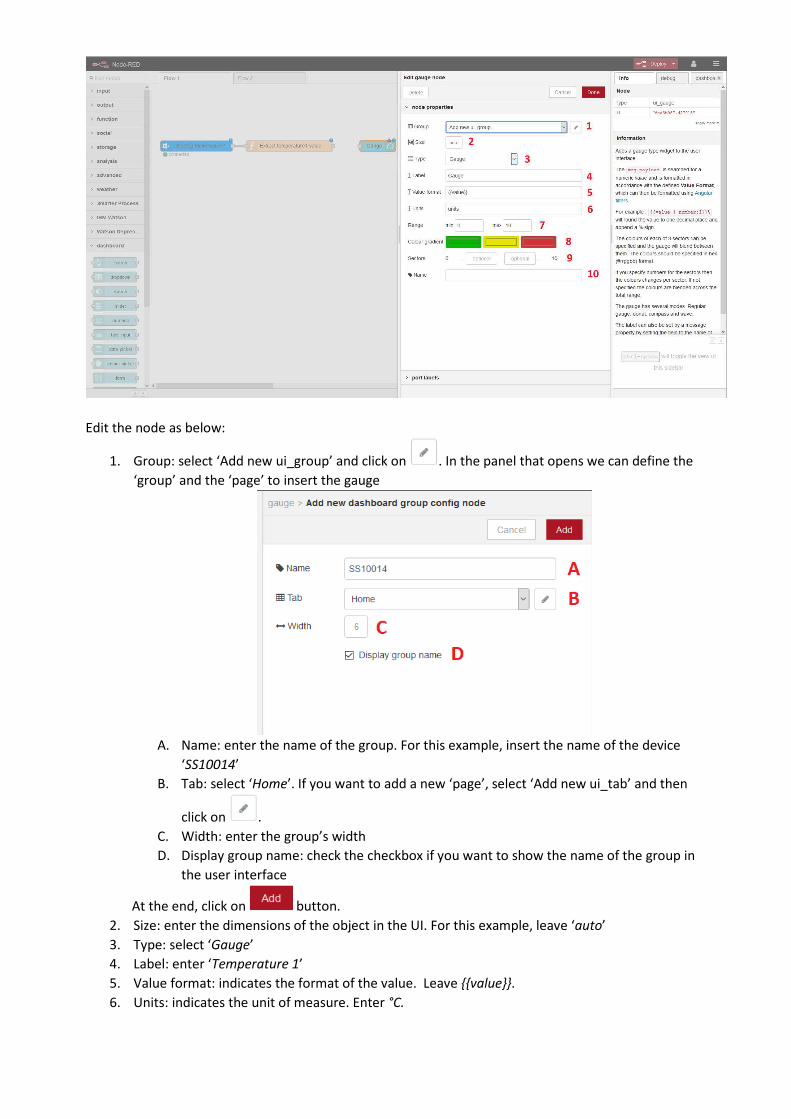
Edit the node as below:
1. Group: select ‘Add new ui_group’ and click on . In the panel that opens we can define the
‘group’ and the ‘page’ to insert the gauge
A. Name: enter the name of the group. For this example, insert the name of the device
‘SS10014’
B. Tab: select ‘Home’. If you want to add a new ‘page’, select ‘Add new ui_tab’ and then
click on .
C. Width: enter the group’s width
D. Display group name: check the checkbox if you want to show the name of the group in
the user interface
At the end, click on button.
2. Size: enter the dimensions of the object in the UI. For this example, leave ‘auto’
3. Type: select ‘Gauge’
4. Label: enter ‘Temperature 1’
5. Value format: indicates the format of the value. Leave {{value}}.
6. Units: indicates the unit of measure. Enter °C.
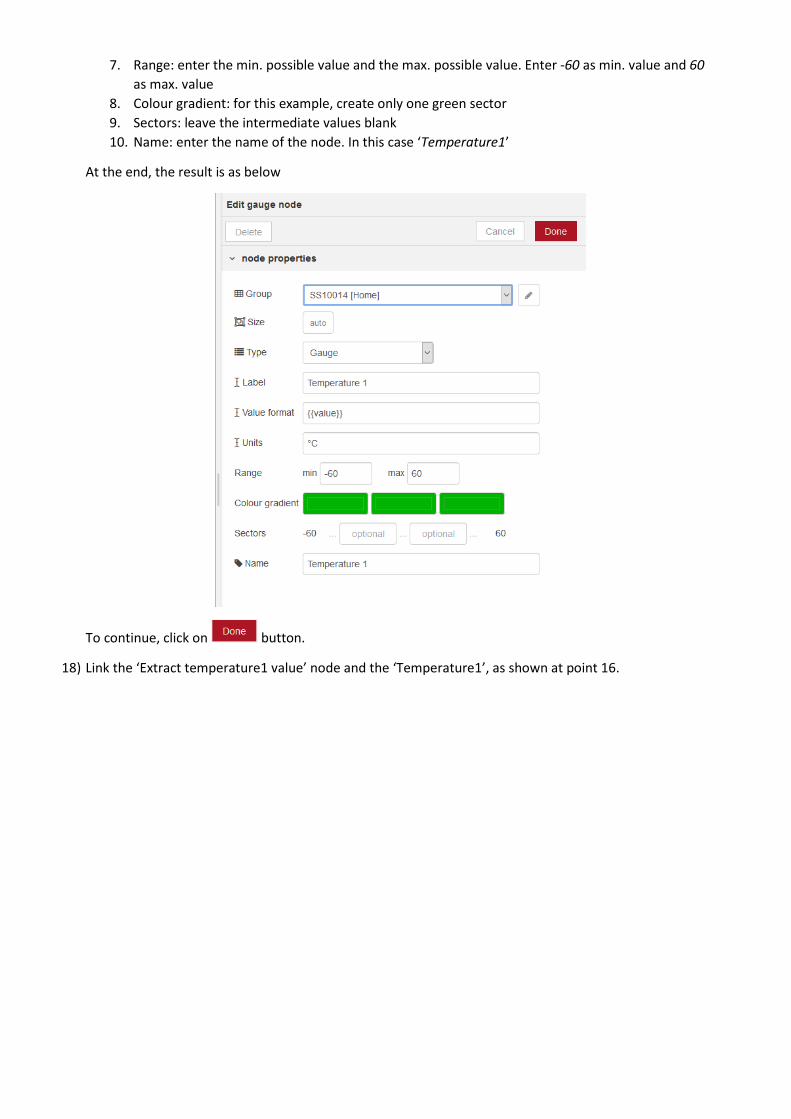
7. Range: enter the min. possible value and the max. possible value. Enter -60 as min. value and 60
as max. value
8. Colour gradient: for this example, create only one green sector
9. Sectors: leave the intermediate values blank
10. Name: enter the name of the node. In this case ‘Temperature1’
At the end, the result is as below
To continue, click on button.
18) Link the ‘Extract temperature1 value’ node and the ‘Temperature1’, as shown at point 16.
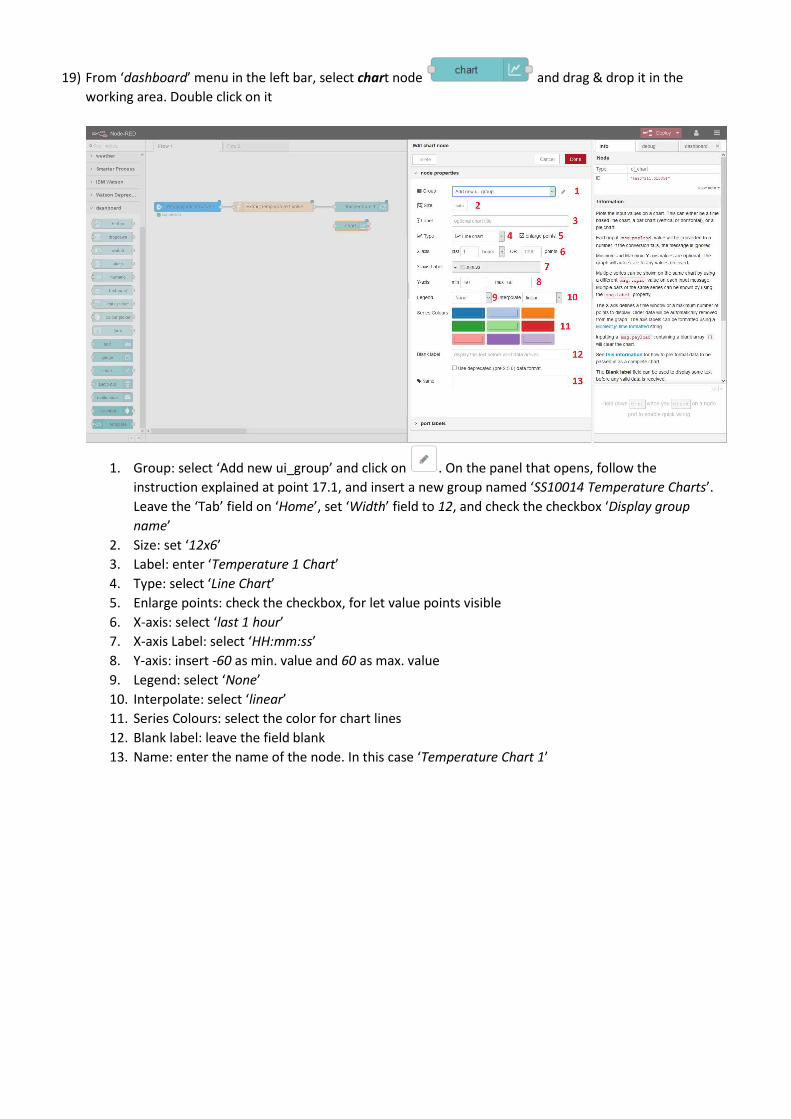
19) From ‘dashboard’ menu in the left bar, select chart node and drag & drop it in the
working area. Double click on it
1. Group: select ‘Add new ui_group’ and click on . On the panel that opens, follow the
instruction explained at point 17.1, and insert a new group named ‘SS10014 Temperature Charts’.
Leave the ‘Tab’ field on ‘Home’, set ‘Width’ field to 12, and check the checkbox ‘Display group
name’
2. Size: set ‘12x6’
3. Label: enter ‘Temperature 1 Chart’
4. Type: select ‘Line Chart’
5. Enlarge points: check the checkbox, for let value points visible
6. X-axis: select ‘last 1 hour’
7. X-axis Label: select ‘HH:mm:ss’
8. Y-axis: insert -60 as min. value and 60 as max. value
9. Legend: select ‘None’
10. Interpolate: select ‘linear’
11. Series Colours: select the color for chart lines
12. Blank label: leave the field blank
13. Name: enter the name of the node. In this case ‘Temperature Chart 1’
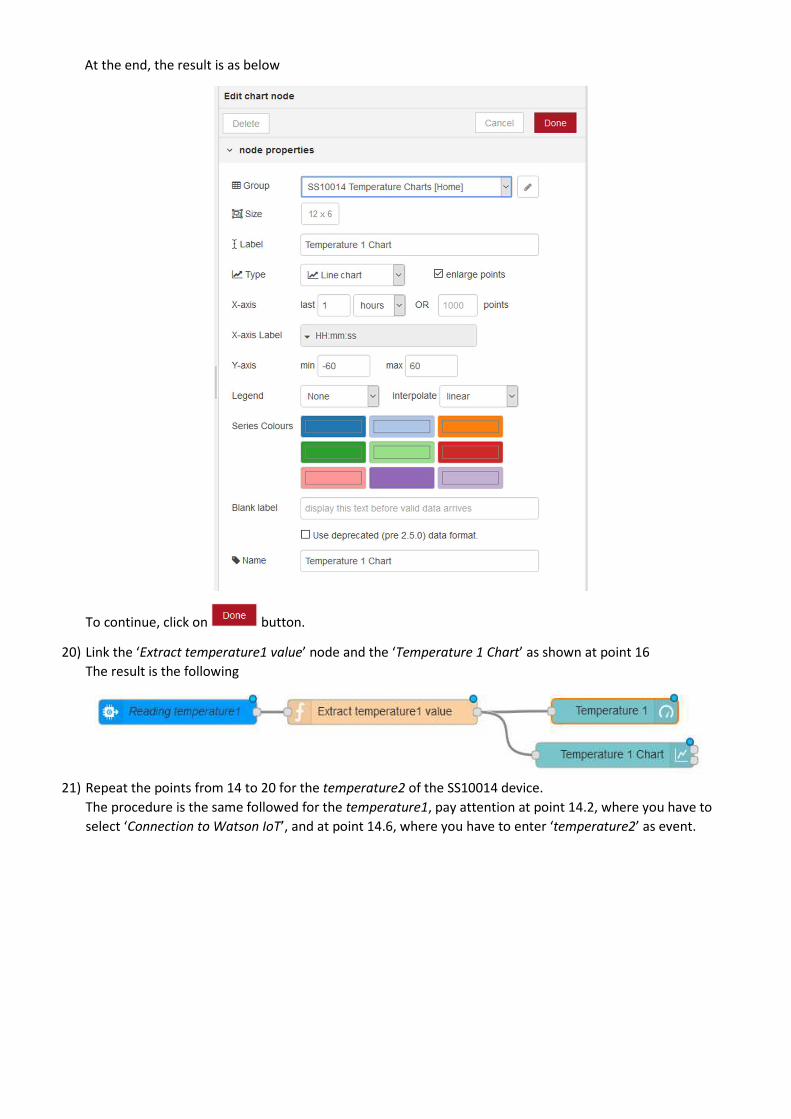
At the end, the result is as below
To continue, click on button.
20) Link the ‘Extract temperature1 value’ node and the ‘Temperature 1 Chart’ as shown at point 16
The result is the following
21) Repeat the points from 14 to 20 for the temperature2 of the SS10014 device.
The procedure is the same followed for the temperature1, pay attention at point 14.2, where you have to
select ‘Connection to Watson IoT’, and at point 14.6, where you have to enter ‘temperature2’ as event.
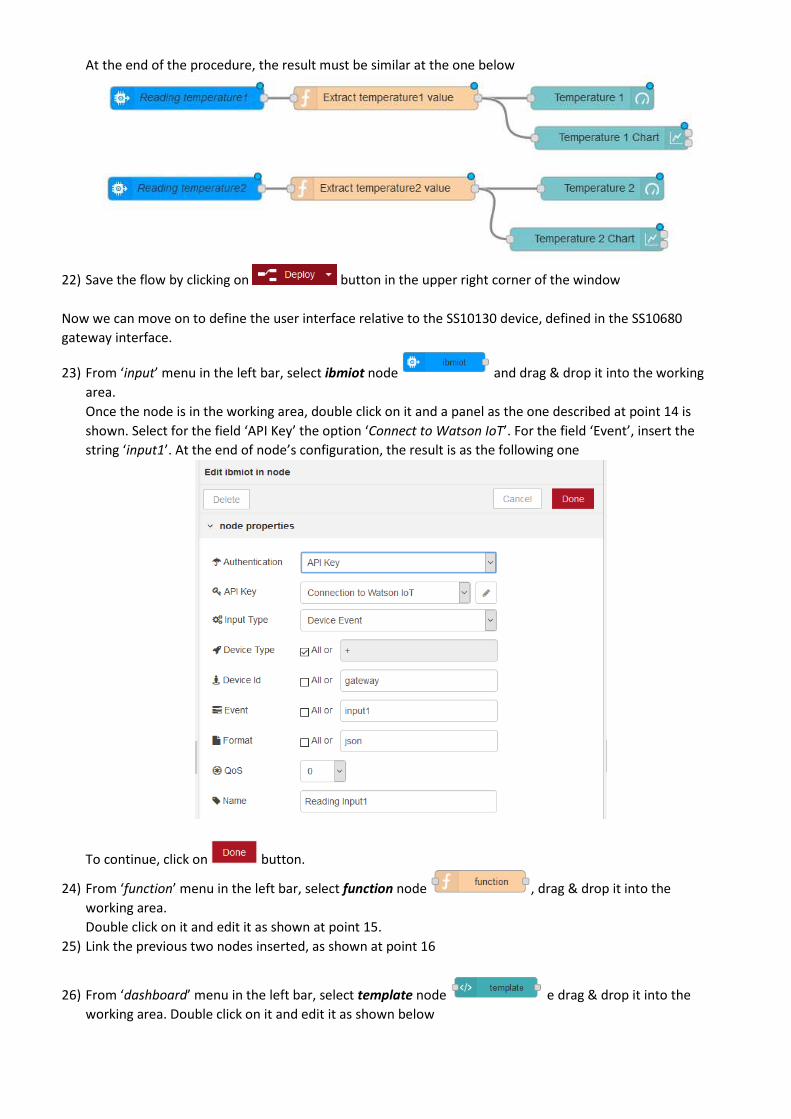
At the end of the procedure, the result must be similar at the one below
22) Save the flow by clicking on button in the upper right corner of the window
Now we can move on to define the user interface relative to the SS10130 device, defined in the SS10680
gateway interface.
23) From ‘input’ menu in the left bar, select ibmiot node and drag & drop it into the working
area.
Once the node is in the working area, double click on it and a panel as the one described at point 14 is
shown. Select for the field ‘API Key’ the option ‘Connect to Watson IoT’. For the field ‘Event’, insert the
string ‘input1’. At the end of node’s configuration, the result is as the following one
To continue, click on button.
24) From ‘function’ menu in the left bar, select function node , drag & drop it into the
working area.
Double click on it and edit it as shown at point 15.
25) Link the previous two nodes inserted, as shown at point 16
26) From ‘dashboard’ menu in the left bar, select template node e drag & drop it into the
working area. Double click on it and edit it as shown below
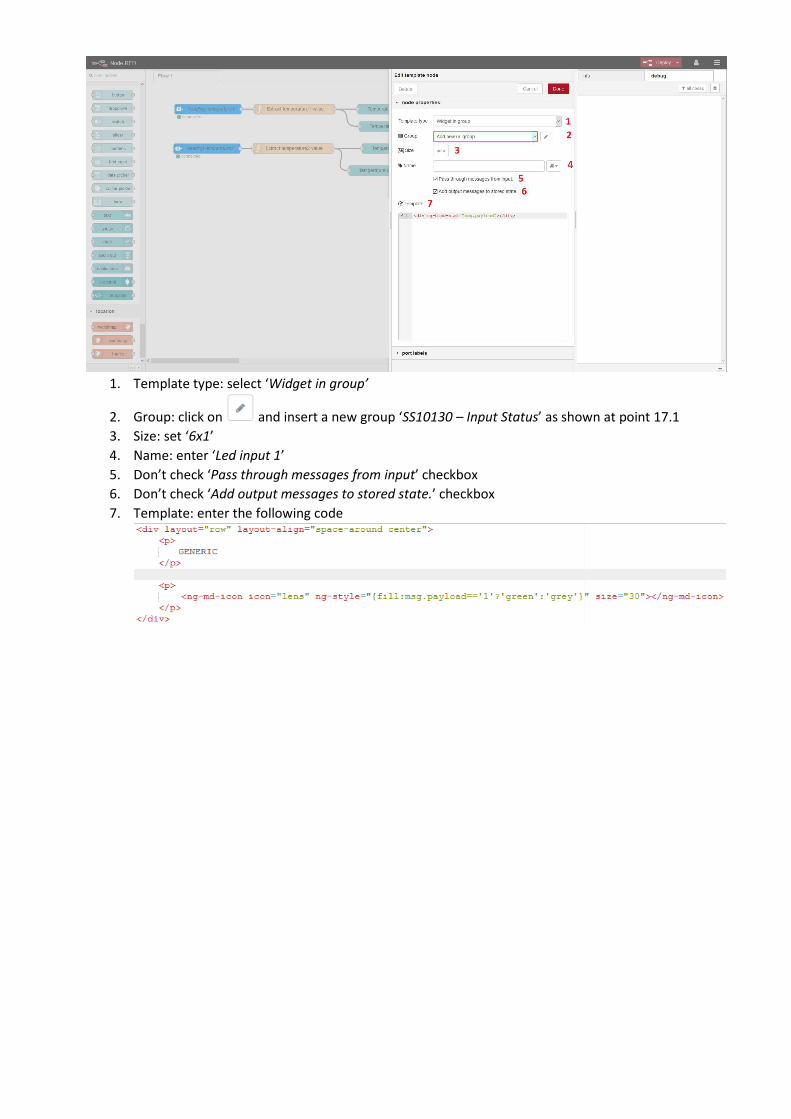
1. Template type: select ‘Widget in group’
2. Group: click on and insert a new group ‘SS10130 – Input Status’ as shown at point 17.1
3. Size: set ‘6x1’
4. Name: enter ‘Led input 1’
5. Don’t check ‘Pass through messages from input’ checkbox
6. Don’t check ‘Add output messages to stored state.’ checkbox
7. Template: enter the following code
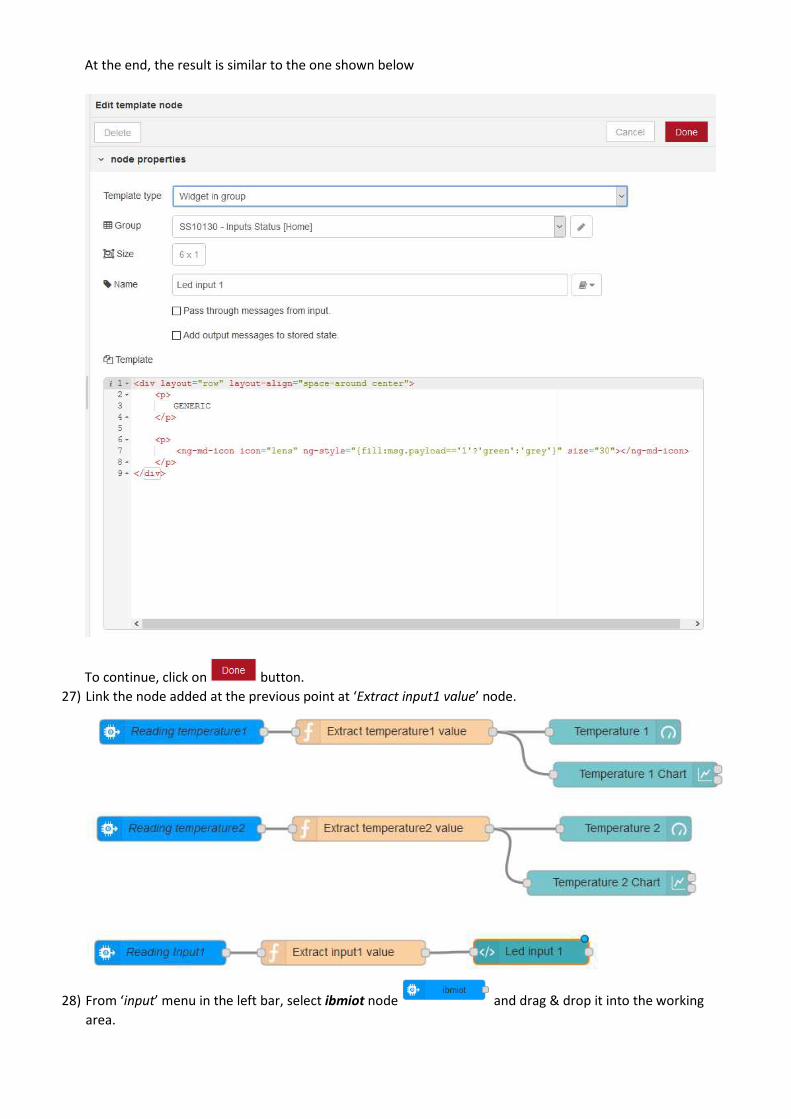
At the end, the result is similar to the one shown below
To continue, click on button.
27) Link the node added at the previous point at ‘Extract input1 value’ node.
28) From ‘input’ menu in the left bar, select ibmiot node and drag & drop it into the working
area.
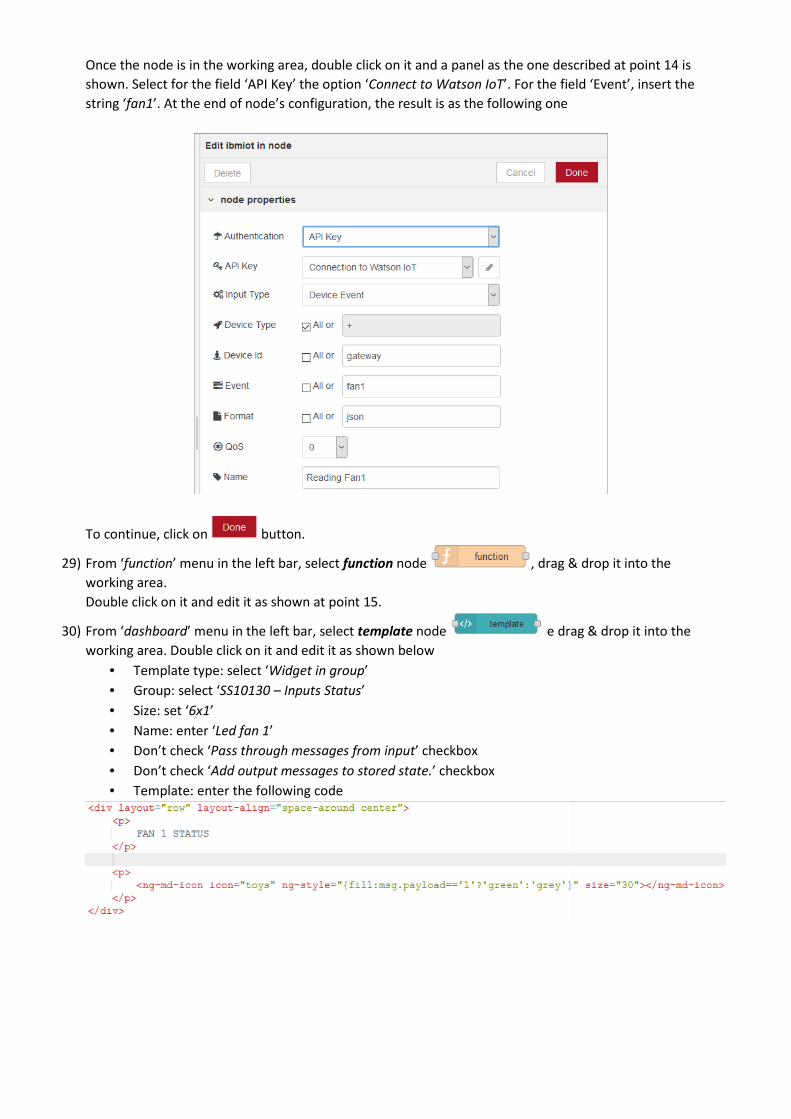
Once the node is in the working area, double click on it and a panel as the one described at point 14 is
shown. Select for the field ‘API Key’ the option ‘Connect to Watson IoT’. For the field ‘Event’, insert the
string ‘fan1’. At the end of node’s configuration, the result is as the following one
To continue, click on button.
29) From ‘function’ menu in the left bar, select function node , drag & drop it into the
working area.
Double click on it and edit it as shown at point 15.
30) From ‘dashboard’ menu in the left bar, select template node e drag & drop it into the
working area. Double click on it and edit it as shown below
• Template type: select ‘Widget in group’
• Group: select ‘SS10130 – Inputs Status’
• Size: set ‘6x1’
• Name: enter ‘Led fan 1’
• Don’t check ‘Pass through messages from input’ checkbox
• Don’t check ‘Add output messages to stored state.’ checkbox
• Template: enter the following code
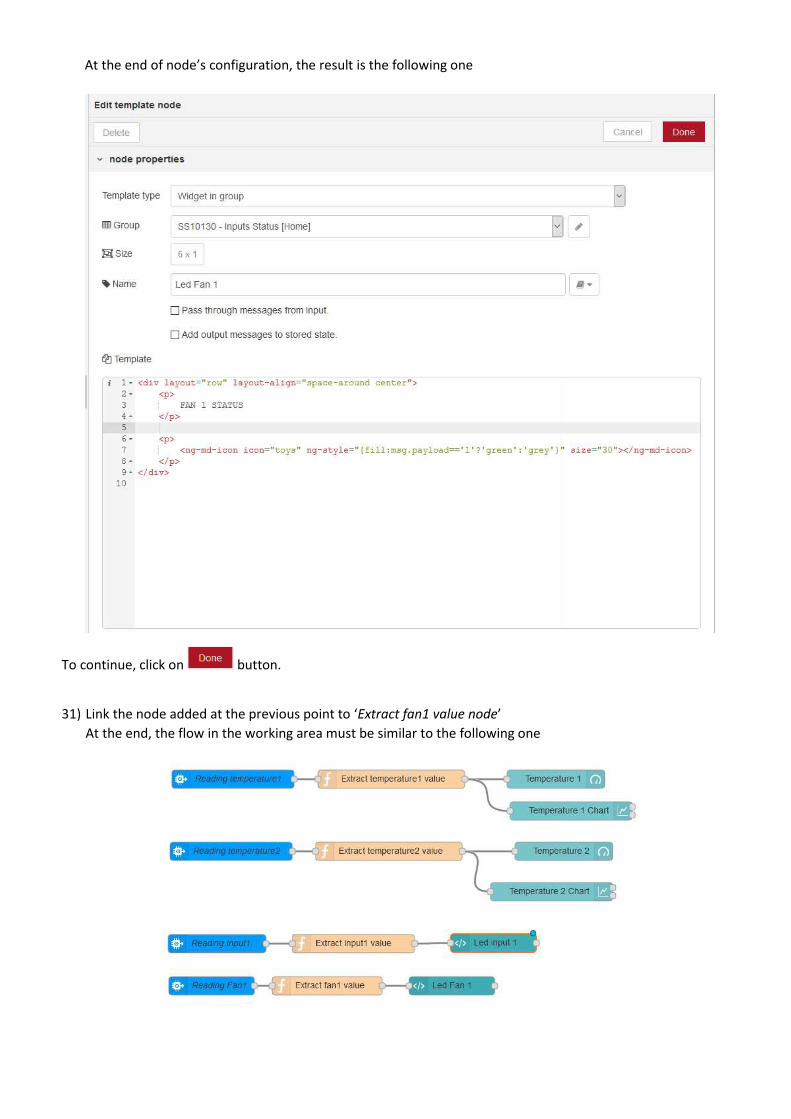
At the end of node’s configuration, the result is the following one
To continue, click on button.
31) Link the node added at the previous point to ‘Extract fan1 value node’
At the end, the flow in the working area must be similar to the following one
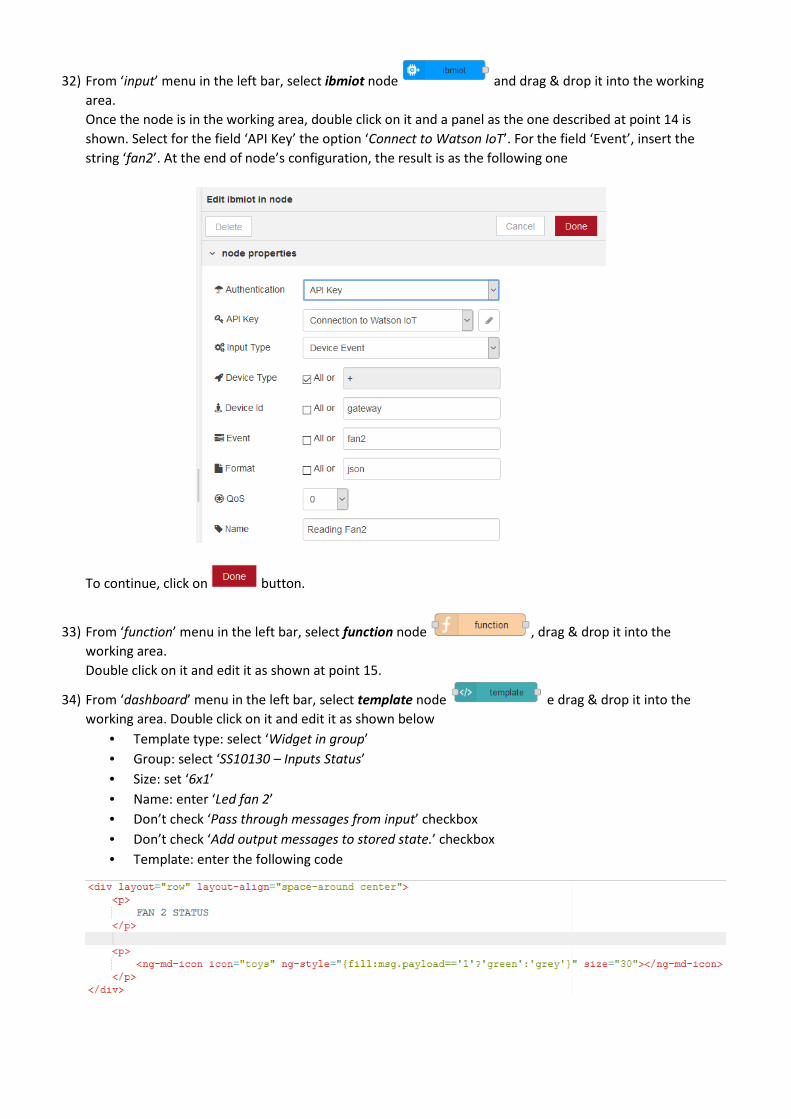
32) From ‘input’ menu in the left bar, select ibmiot node and drag & drop it into the working
area.
Once the node is in the working area, double click on it and a panel as the one described at point 14 is
shown. Select for the field ‘API Key’ the option ‘Connect to Watson IoT’. For the field ‘Event’, insert the
string ‘fan2’. At the end of node’s configuration, the result is as the following one
To continue, click on button.
33) From ‘function’ menu in the left bar, select function node , drag & drop it into the
working area.
Double click on it and edit it as shown at point 15.
34) From ‘dashboard’ menu in the left bar, select template node e drag & drop it into the
working area. Double click on it and edit it as shown below
• Template type: select ‘Widget in group’
• Group: select ‘SS10130 – Inputs Status’
• Size: set ‘6x1’
• Name: enter ‘Led fan 2’
• Don’t check ‘Pass through messages from input’ checkbox
• Don’t check ‘Add output messages to stored state.’ checkbox
• Template: enter the following code
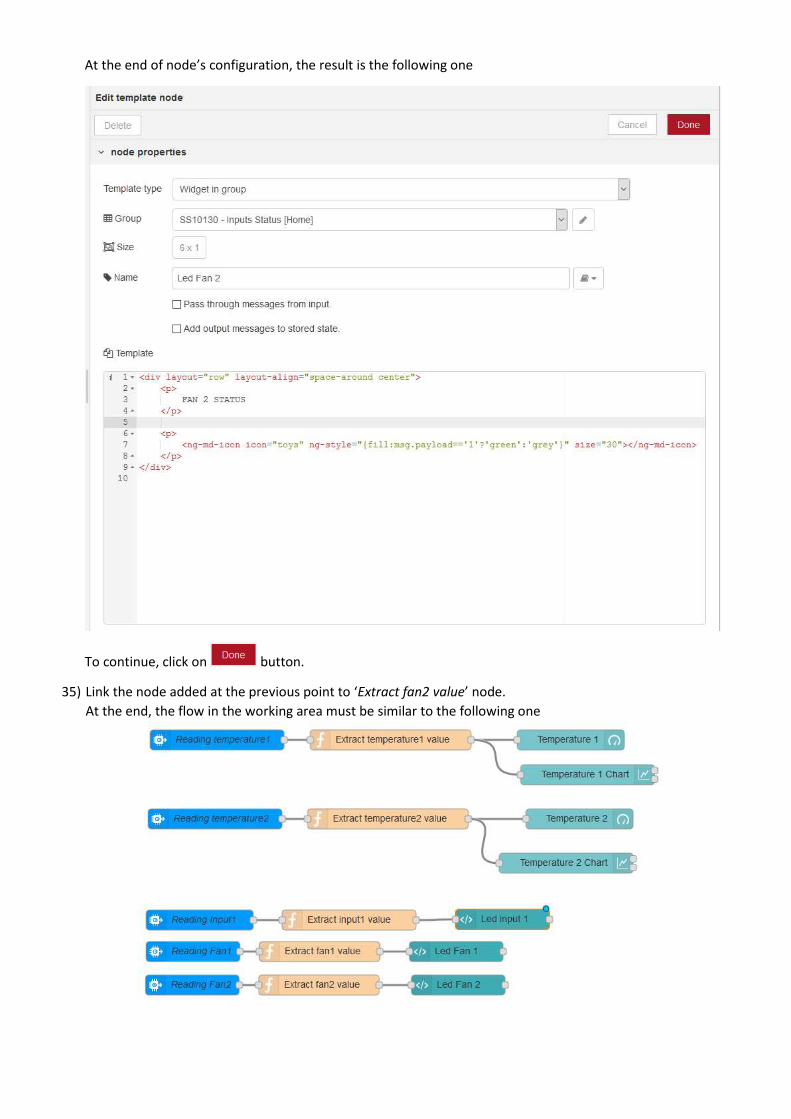
At the end of node’s configuration, the result is the following one
To continue, click on button.
35) Link the node added at the previous point to ‘Extract fan2 value’ node.
At the end, the flow in the working area must be similar to the following one
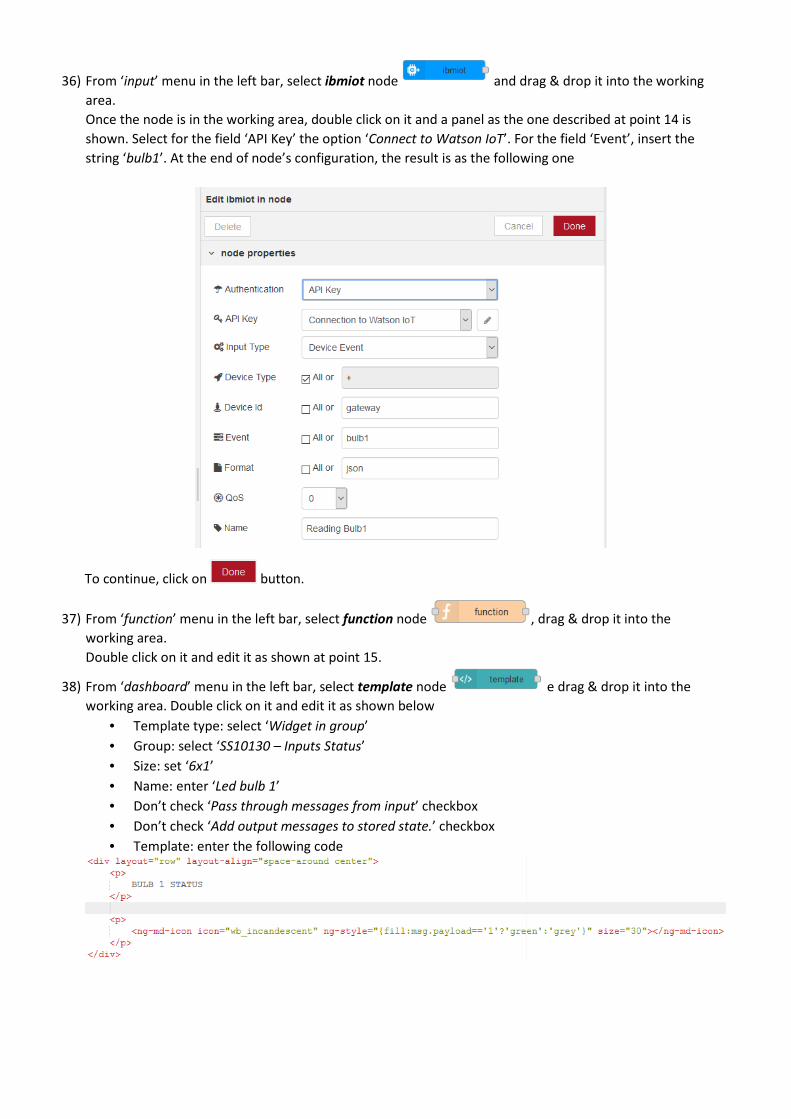
36) From ‘input’ menu in the left bar, select ibmiot node and drag & drop it into the working
area.
Once the node is in the working area, double click on it and a panel as the one described at point 14 is
shown. Select for the field ‘API Key’ the option ‘Connect to Watson IoT’. For the field ‘Event’, insert the
string ‘bulb1’. At the end of node’s configuration, the result is as the following one
To continue, click on button.
37) From ‘function’ menu in the left bar, select function node , drag & drop it into the
working area.
Double click on it and edit it as shown at point 15.
38) From ‘dashboard’ menu in the left bar, select template node e drag & drop it into the
working area. Double click on it and edit it as shown below
• Template type: select ‘Widget in group’
• Group: select ‘SS10130 – Inputs Status’
• Size: set ‘6x1’
• Name: enter ‘Led bulb 1’
• Don’t check ‘Pass through messages from input’ checkbox
• Don’t check ‘Add output messages to stored state.’ checkbox
• Template: enter the following code
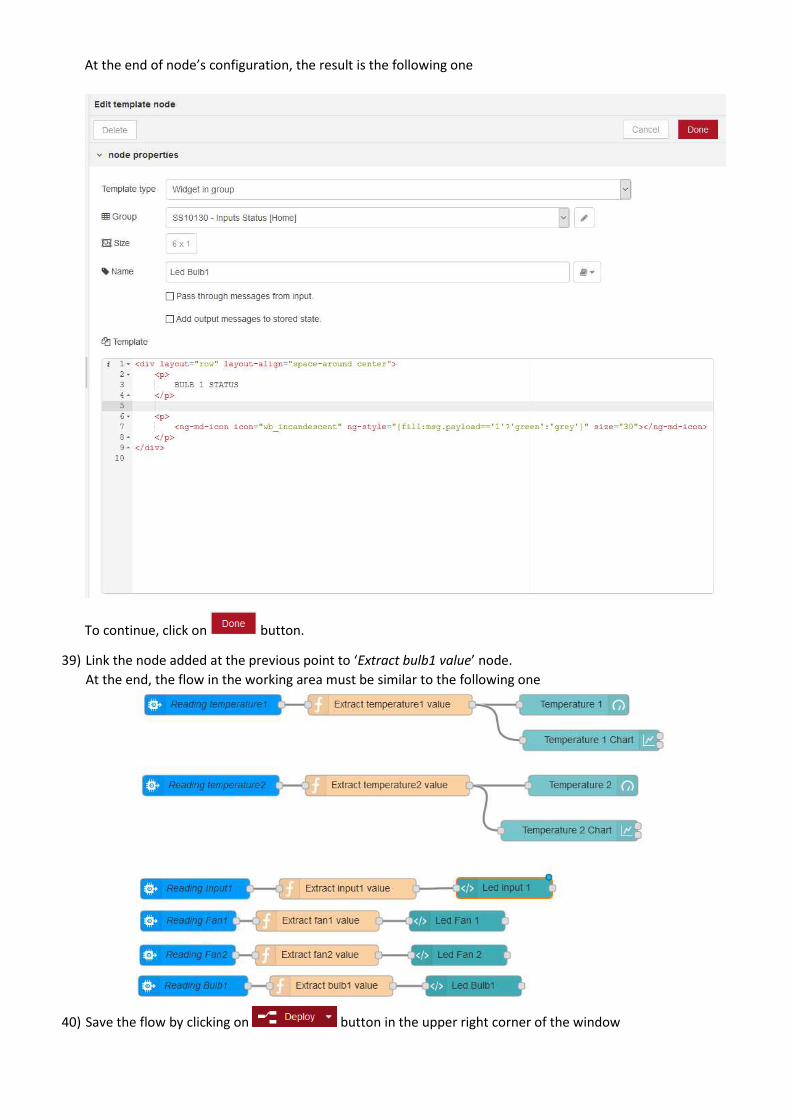
At the end of node’s configuration, the result is the following one
To continue, click on button.
39) Link the node added at the previous point to ‘Extract bulb1 value’ node.
At the end, the flow in the working area must be similar to the following one
40) Save the flow by clicking on button in the upper right corner of the window
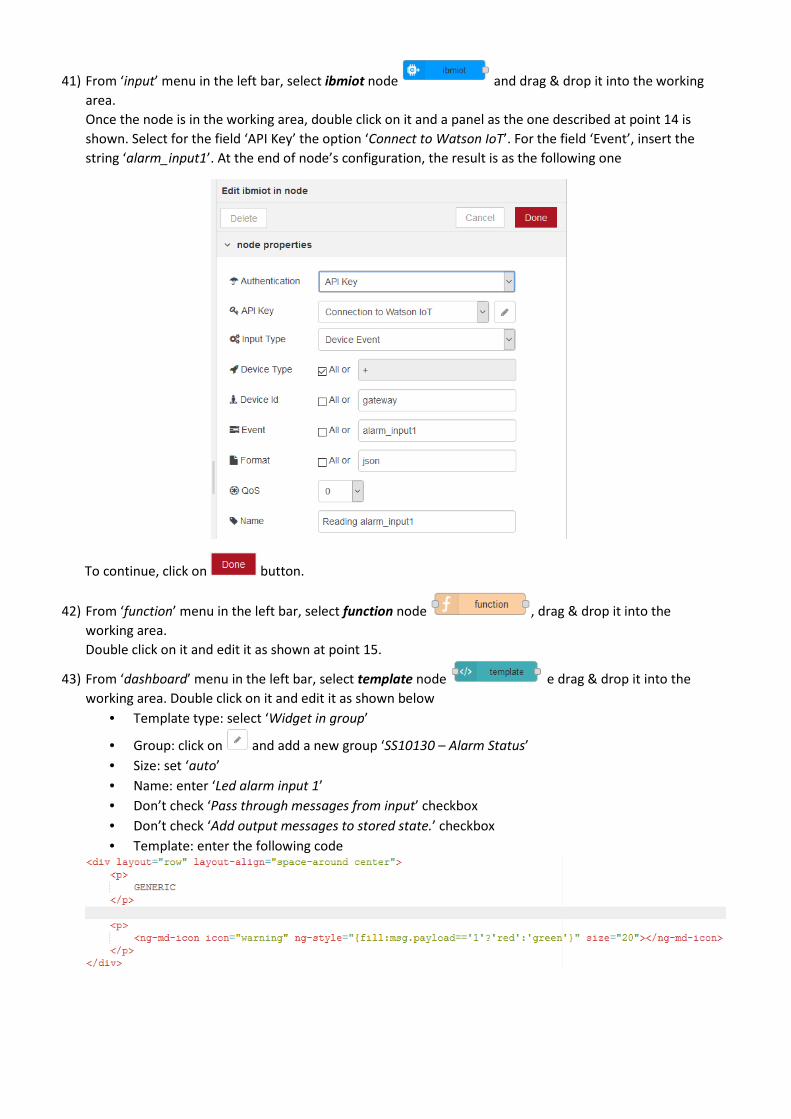
41) From ‘input’ menu in the left bar, select ibmiot node and drag & drop it into the working
area.
Once the node is in the working area, double click on it and a panel as the one described at point 14 is
shown. Select for the field ‘API Key’ the option ‘Connect to Watson IoT’. For the field ‘Event’, insert the
string ‘alarm_input1’. At the end of node’s configuration, the result is as the following one
To continue, click on button.
42) From ‘function’ menu in the left bar, select function node , drag & drop it into the
working area.
Double click on it and edit it as shown at point 15.
43) From ‘dashboard’ menu in the left bar, select template node e drag & drop it into the
working area. Double click on it and edit it as shown below
• Template type: select ‘Widget in group’
• Group: click on and add a new group ‘SS10130 – Alarm Status’
• Size: set ‘auto’
• Name: enter ‘Led alarm input 1’
• Don’t check ‘Pass through messages from input’ checkbox
• Don’t check ‘Add output messages to stored state.’ checkbox
• Template: enter the following code
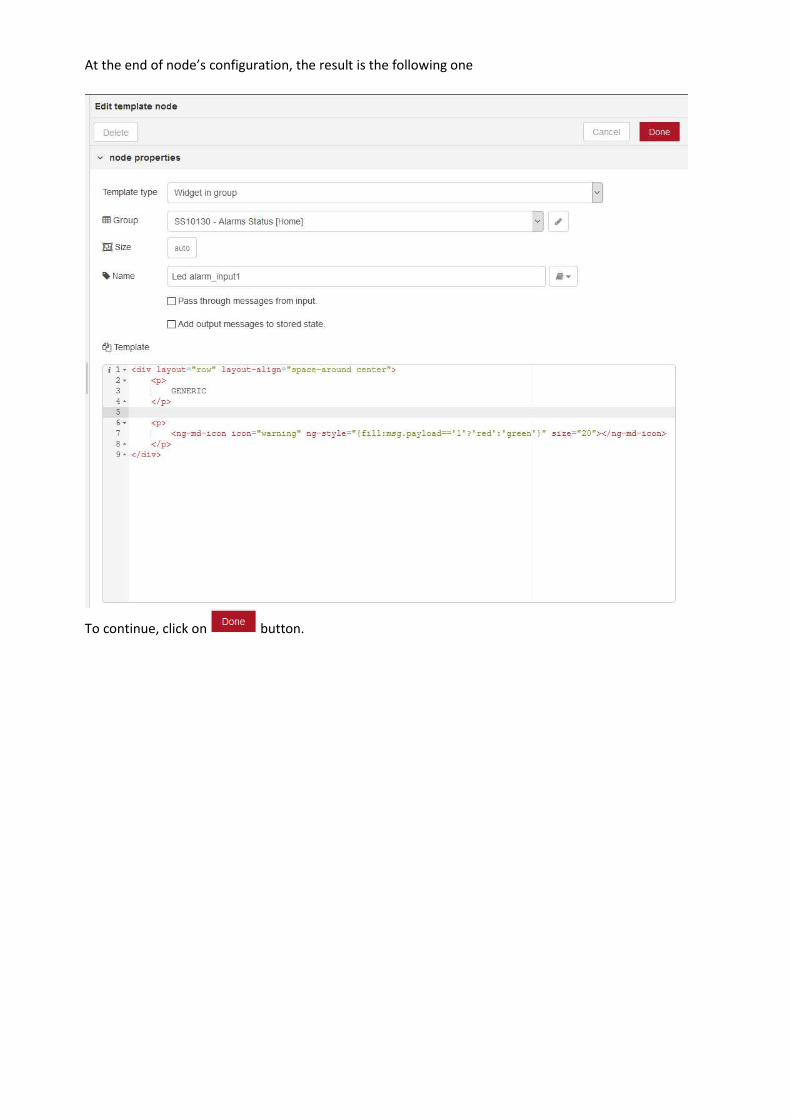
At the end of node’s configuration, the result is the following one
To continue, click on button.
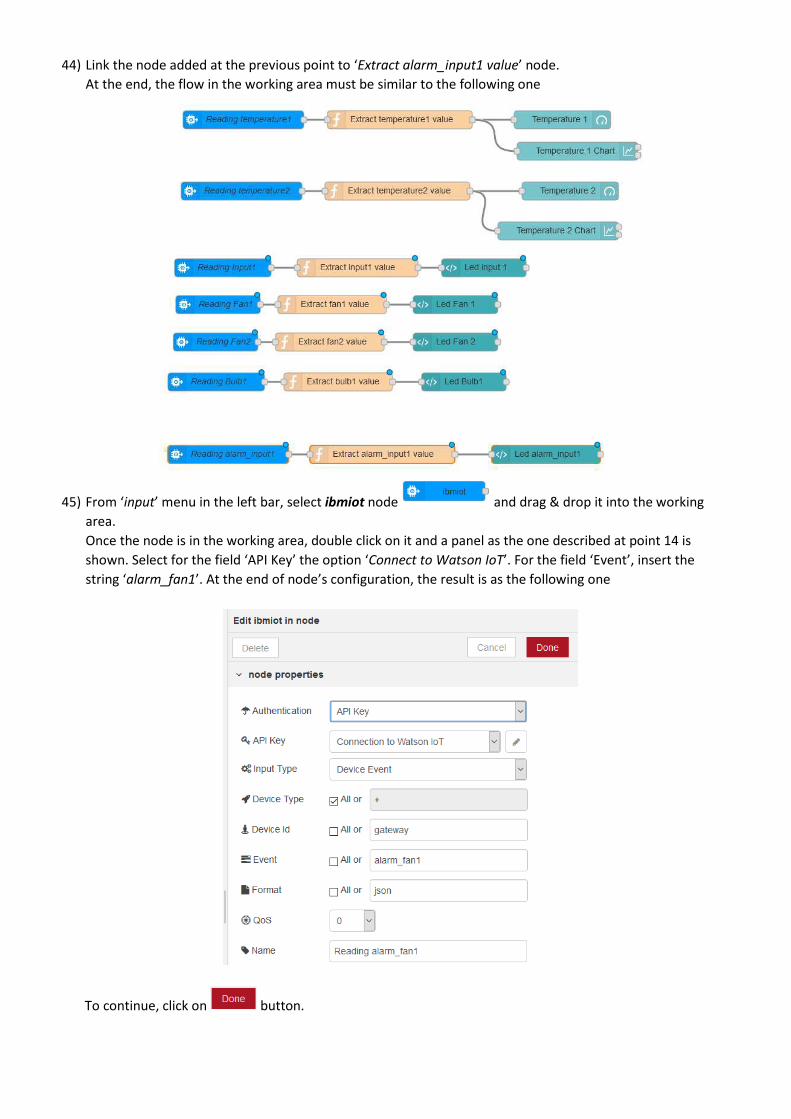
44) Link the node added at the previous point to ‘Extract alarm_input1 value’ node.
At the end, the flow in the working area must be similar to the following one
45) From ‘input’ menu in the left bar, select ibmiot node and drag & drop it into the working
area.
Once the node is in the working area, double click on it and a panel as the one described at point 14 is
shown. Select for the field ‘API Key’ the option ‘Connect to Watson IoT’. For the field ‘Event’, insert the
string ‘alarm_fan1’. At the end of node’s configuration, the result is as the following one
To continue, click on button.
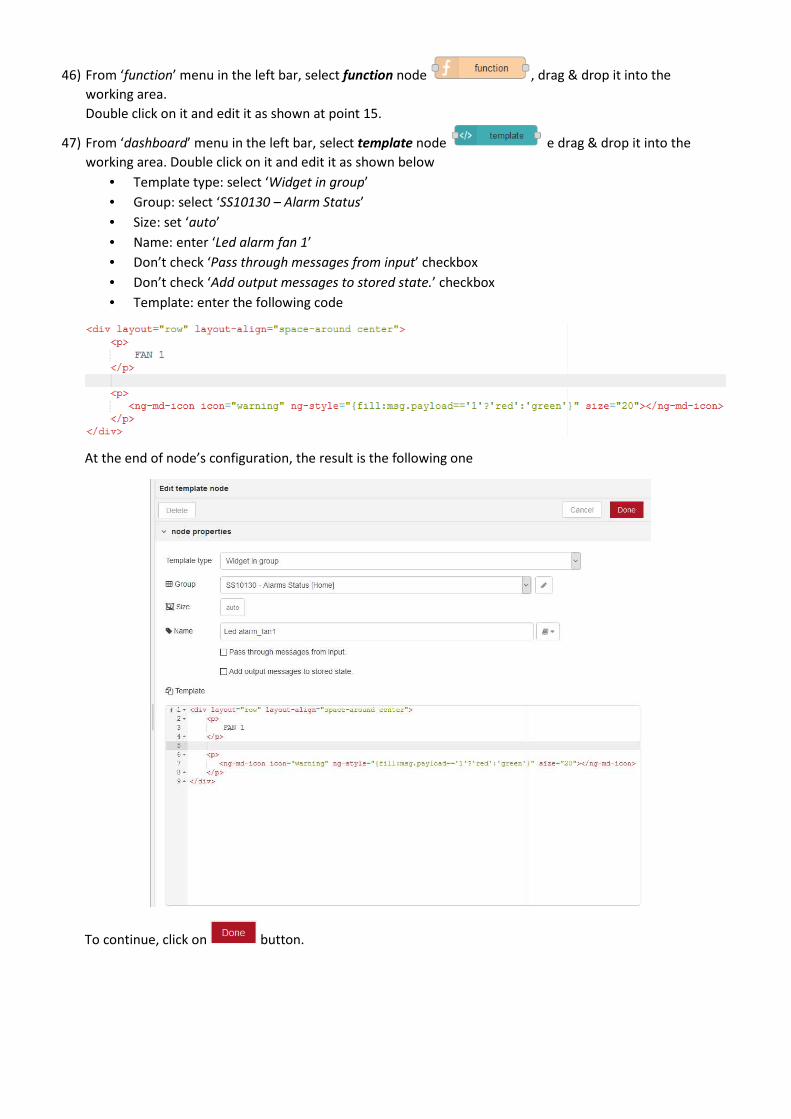
46) From ‘function’ menu in the left bar, select function node , drag & drop it into the
working area.
Double click on it and edit it as shown at point 15.
47) From ‘dashboard’ menu in the left bar, select template node e drag & drop it into the
working area. Double click on it and edit it as shown below
• Template type: select ‘Widget in group’
• Group: select ‘SS10130 – Alarm Status’
• Size: set ‘auto’
• Name: enter ‘Led alarm fan 1’
• Don’t check ‘Pass through messages from input’ checkbox
• Don’t check ‘Add output messages to stored state.’ checkbox
• Template: enter the following code
At the end of node’s configuration, the result is the following one
To continue, click on button.
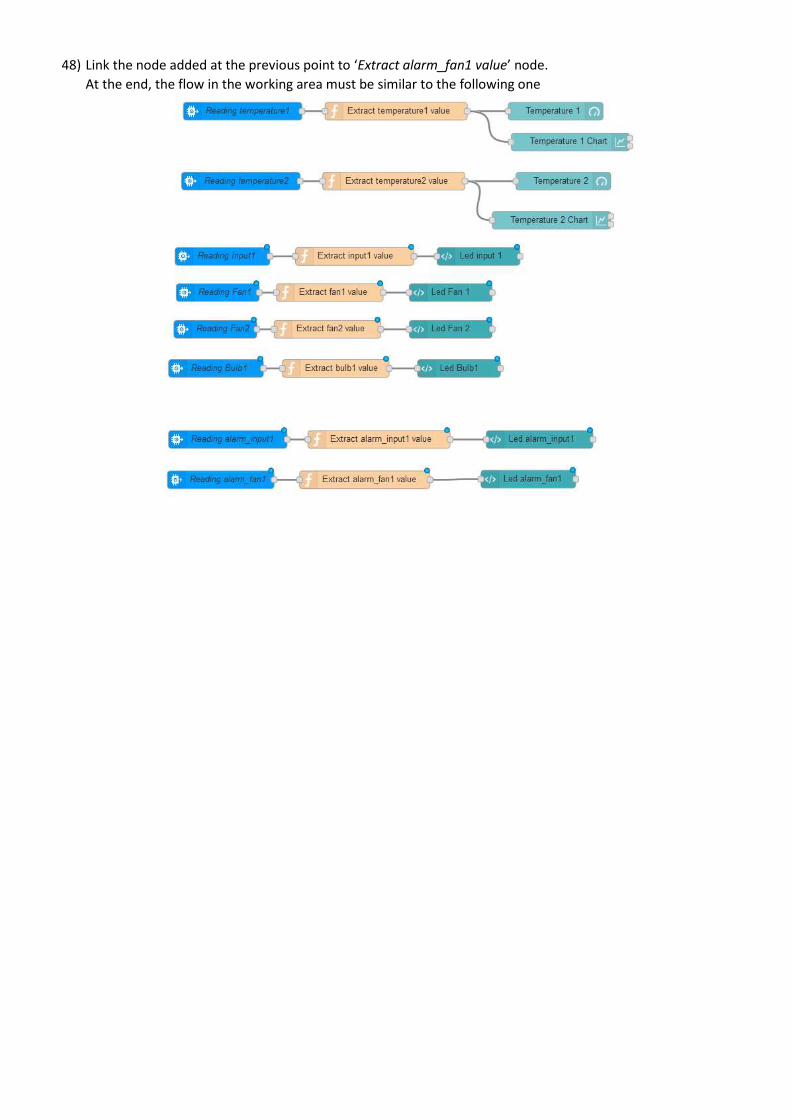
48) Link the node added at the previous point to ‘Extract alarm_fan1 value’ node.
At the end, the flow in the working area must be similar to the following one

49) From ‘input’ menu in the left bar, select ibmiot node and drag & drop it into the working
area.
Once the node is in the working area, double click on it and a panel as the one described at point 14 is
shown. Select for the field ‘API Key’ the option ‘Connect to Watson IoT’. For the field ‘Event’, insert the
string ‘alarm_fan2’. At the end of node’s configuration, the result is as the following one
To continue, click on button.
50) From ‘function’ menu in the left bar, select function node , drag & drop it into the
working area.
Double click on it and edit it as shown at point 15.
51) From ‘dashboard’ menu in the left bar, select template node e drag & drop it into the
working area. Double click on it and edit it as shown below
• Template type: select ‘Widget in group’
• Group: select ‘SS10130 – Alarm Status’
• Size: set ‘auto’
• Name: enter ‘Led alarm fan 2’
• Don’t check ‘Pass through messages from input’ checkbox
• Don’t check ‘Add output messages to stored state.’ checkbox
• Template: enter the following code
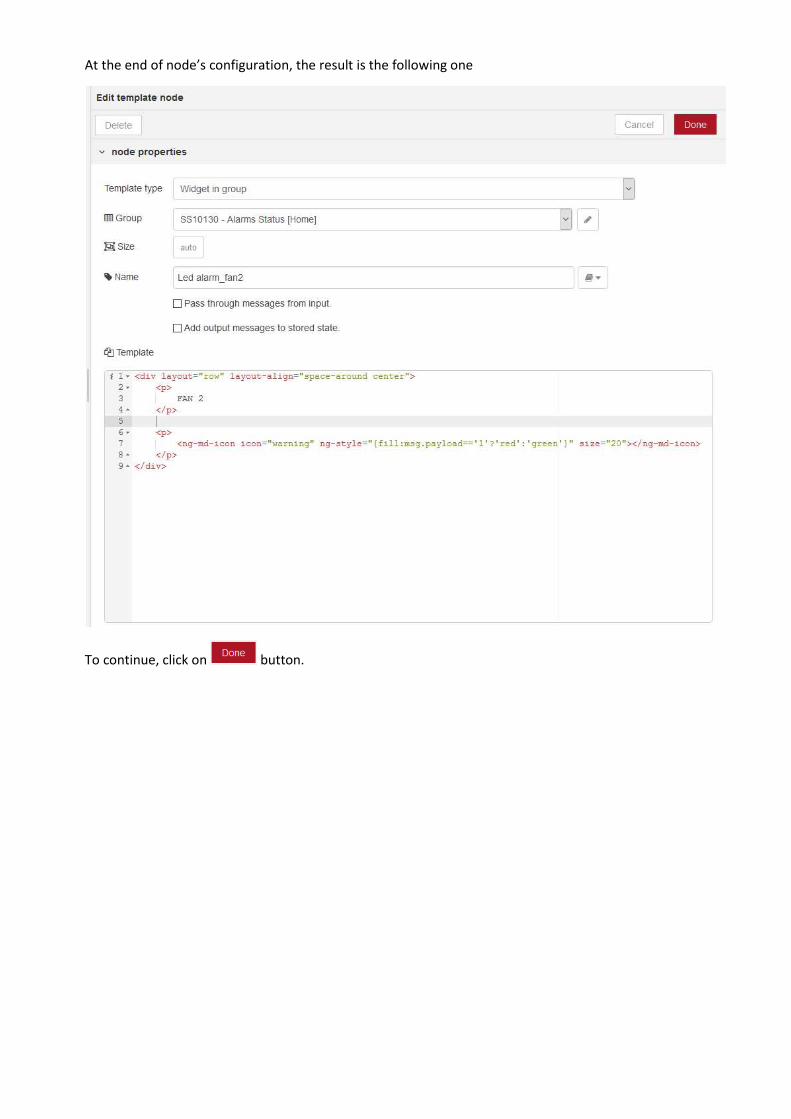
At the end of node’s configuration, the result is the following one
To continue, click on button.
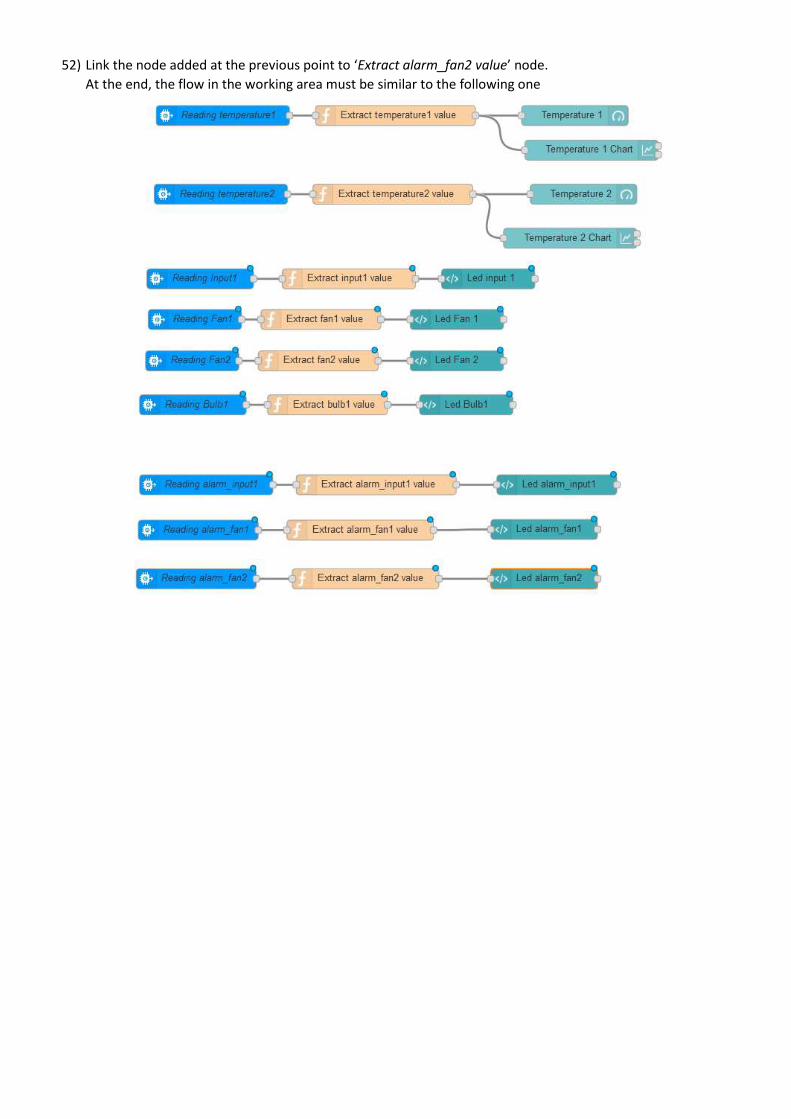
52) Link the node added at the previous point to ‘Extract alarm_fan2 value’ node.
At the end, the flow in the working area must be similar to the following one
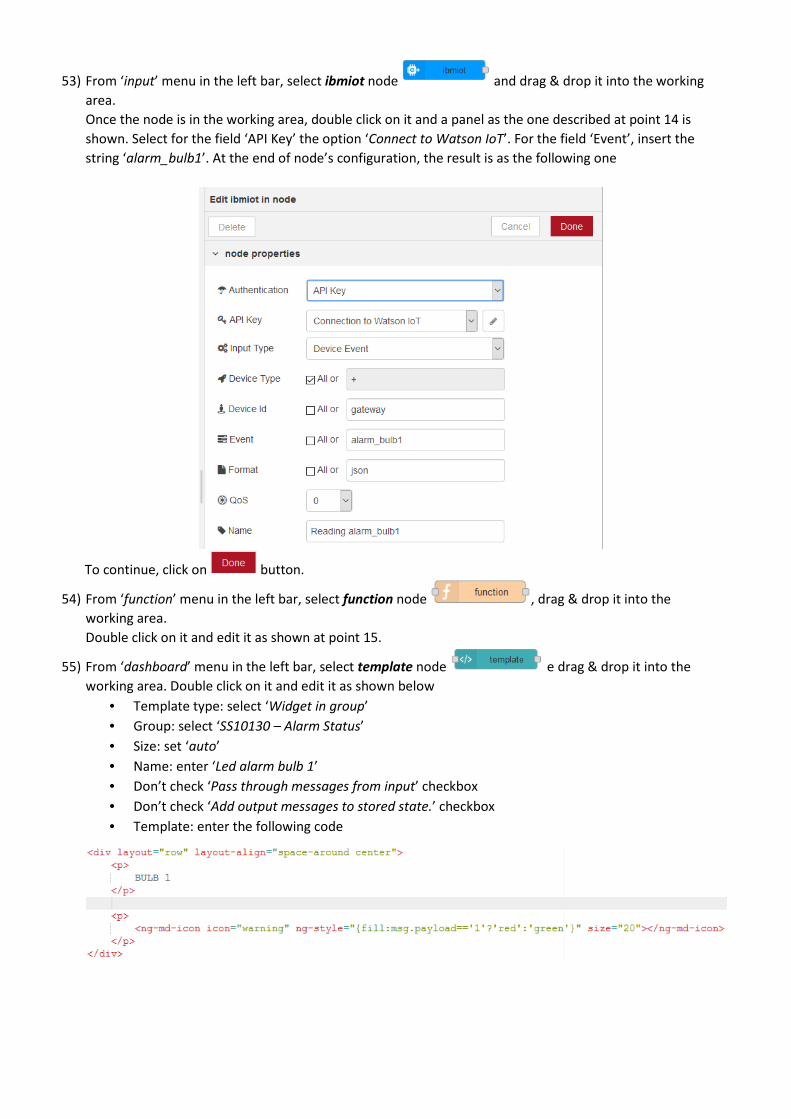
53) From ‘input’ menu in the left bar, select ibmiot node and drag & drop it into the working
area.
Once the node is in the working area, double click on it and a panel as the one described at point 14 is
shown. Select for the field ‘API Key’ the option ‘Connect to Watson IoT’. For the field ‘Event’, insert the
string ‘alarm_bulb1’. At the end of node’s configuration, the result is as the following one
To continue, click on button.
54) From ‘function’ menu in the left bar, select function node , drag & drop it into the
working area.
Double click on it and edit it as shown at point 15.
55) From ‘dashboard’ menu in the left bar, select template node e drag & drop it into the
working area. Double click on it and edit it as shown below
• Template type: select ‘Widget in group’
• Group: select ‘SS10130 – Alarm Status’
• Size: set ‘auto’
• Name: enter ‘Led alarm bulb 1’
• Don’t check ‘Pass through messages from input’ checkbox
• Don’t check ‘Add output messages to stored state.’ checkbox
• Template: enter the following code
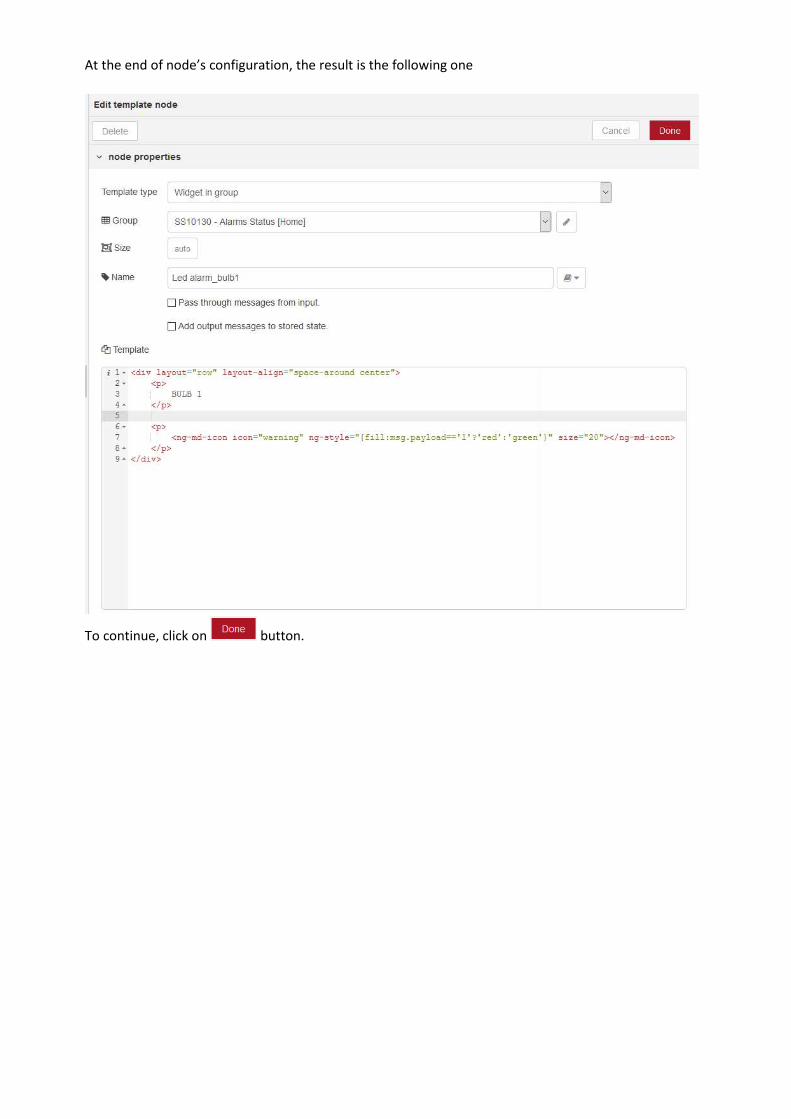
At the end of node’s configuration, the result is the following one
To continue, click on button.
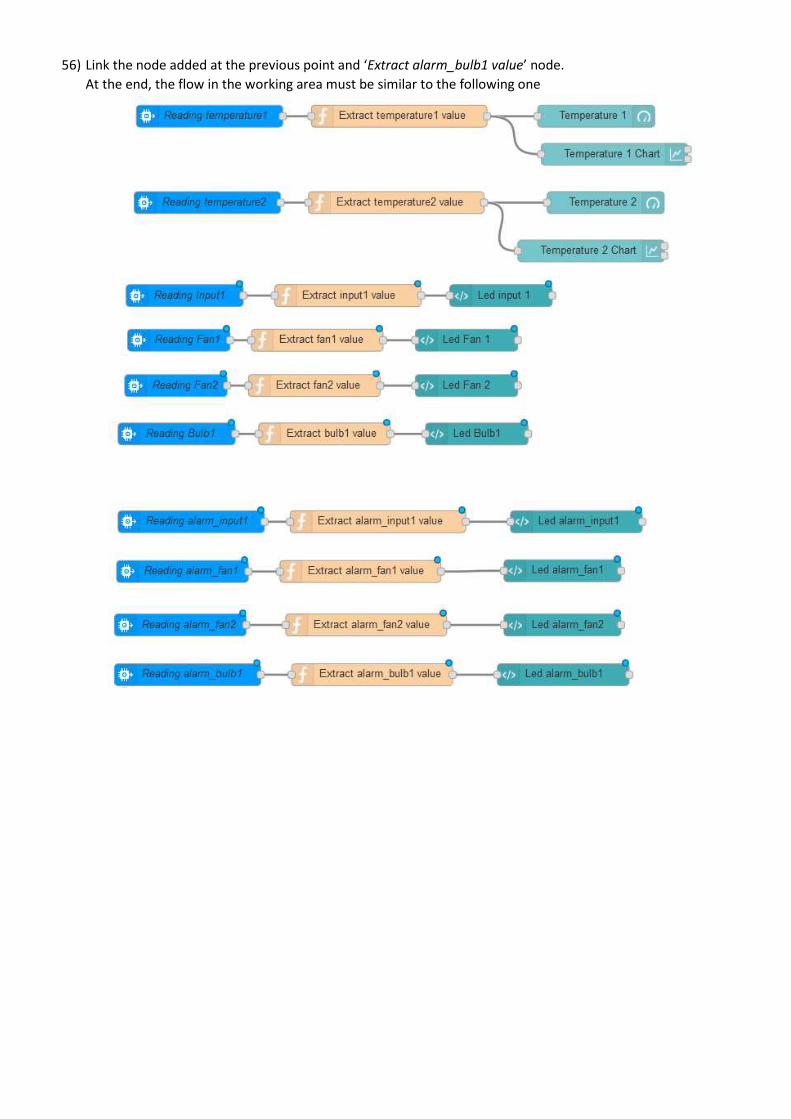
56) Link the node added at the previous point and ‘Extract alarm_bulb1 value’ node.
At the end, the flow in the working area must be similar to the following one
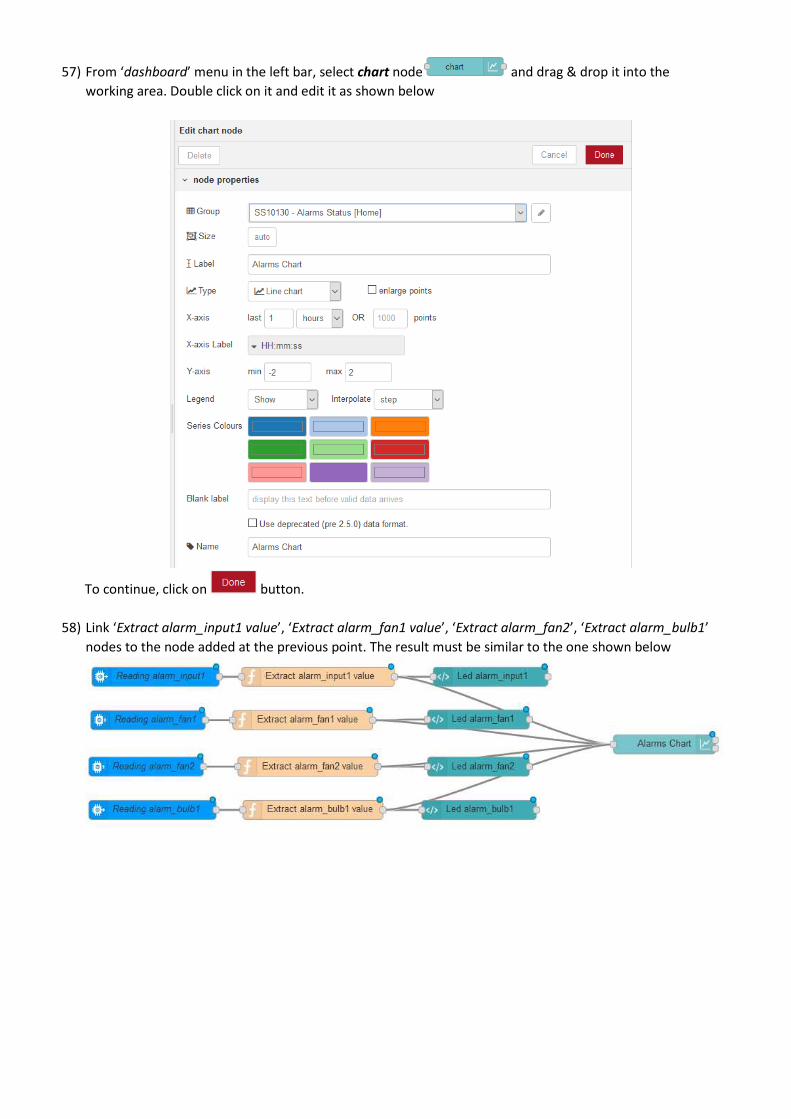
57) From ‘dashboard’ menu in the left bar, select chart node and drag & drop it into the
working area. Double click on it and edit it as shown below
To continue, click on button.
58) Link ‘Extract alarm_input1 value’, ‘Extract alarm_fan1 value’, ‘Extract alarm_fan2’, ‘Extract alarm_bulb1’
nodes to the node added at the previous point. The result must be similar to the one shown below
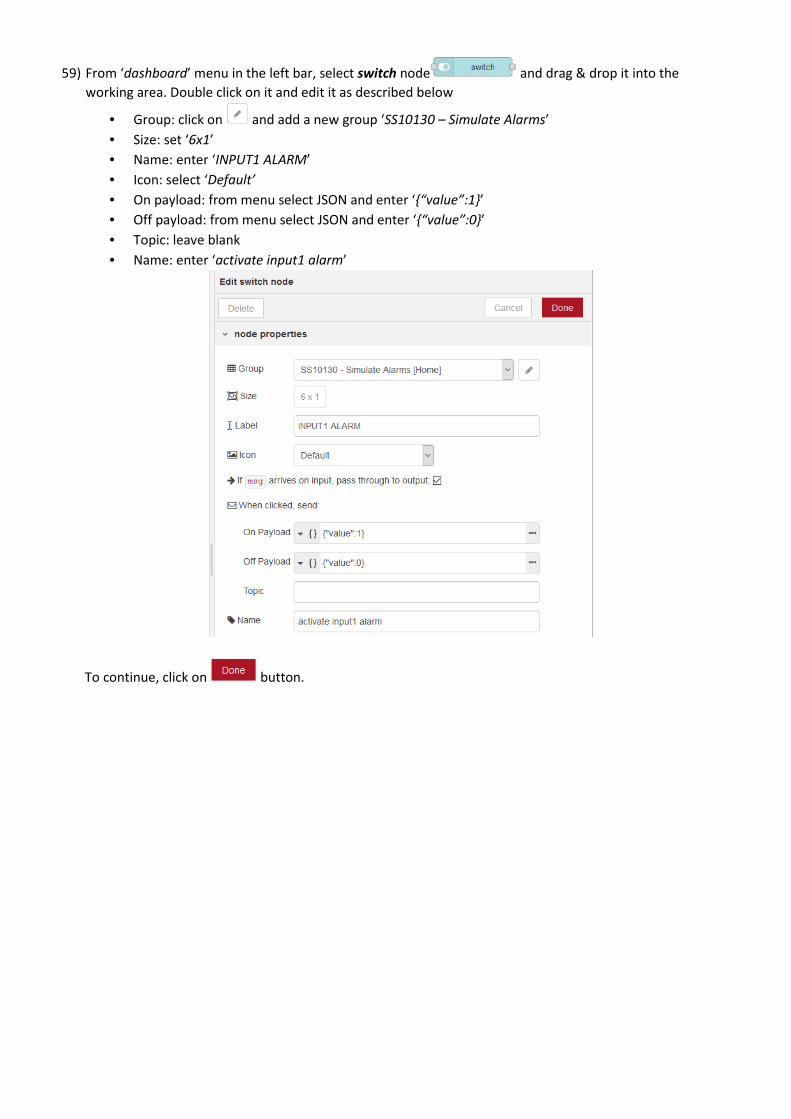
59) From ‘dashboard’ menu in the left bar, select switch node and drag & drop it into the
working area. Double click on it and edit it as described below
• Group: click on and add a new group ‘SS10130 – Simulate Alarms’
• Size: set ‘6x1’
• Name: enter ‘INPUT1 ALARM’
• Icon: select ‘Default’
• On payload: from menu select JSON and enter ‘{“value”:1}’
• Off payload: from menu select JSON and enter ‘{“value”:0}’
• Topic: leave blank
• Name: enter ‘activate input1 alarm’
To continue, click on button.
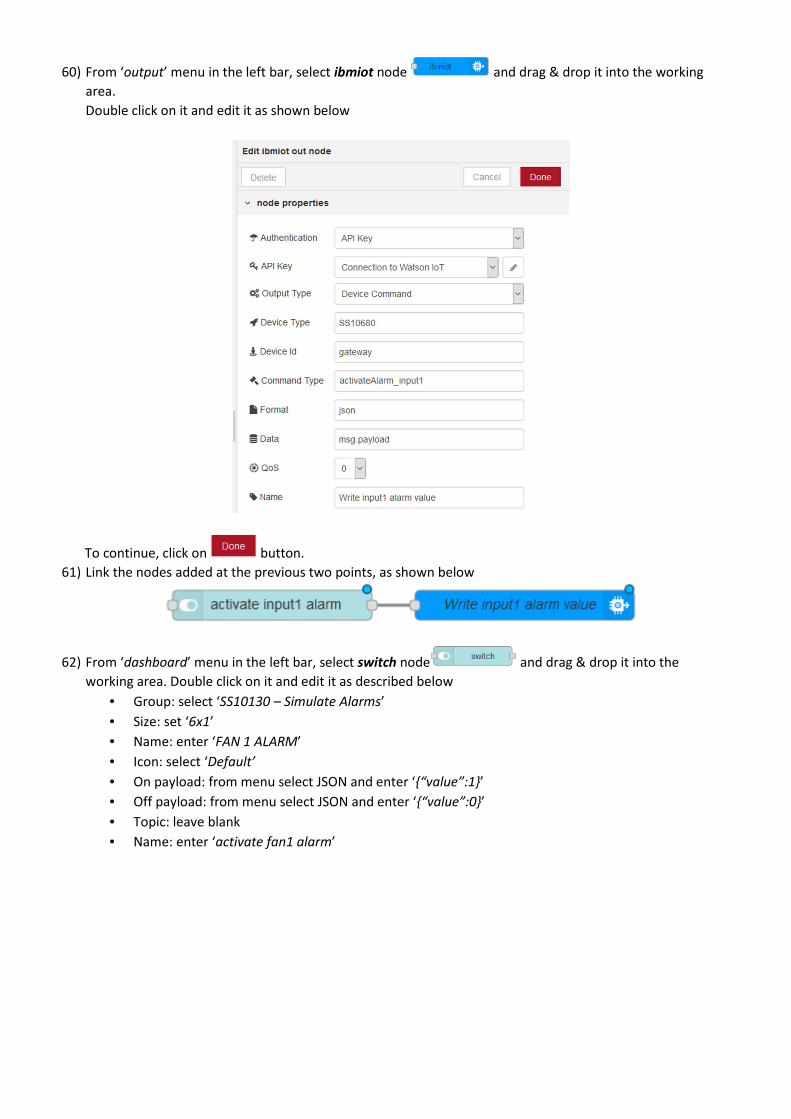
60) From ‘output’ menu in the left bar, select ibmiot node and drag & drop it into the working
area.
Double click on it and edit it as shown below
To continue, click on button.
61) Link the nodes added at the previous two points, as shown below
62) From ‘dashboard’ menu in the left bar, select switch node and drag & drop it into the
working area. Double click on it and edit it as described below
• Group: select ‘SS10130 – Simulate Alarms’
• Size: set ‘6x1’
• Name: enter ‘FAN 1 ALARM’
• Icon: select ‘Default’
• On payload: from menu select JSON and enter ‘{“value”:1}’
• Off payload: from menu select JSON and enter ‘{“value”:0}’
• Topic: leave blank
• Name: enter ‘activate fan1 alarm’
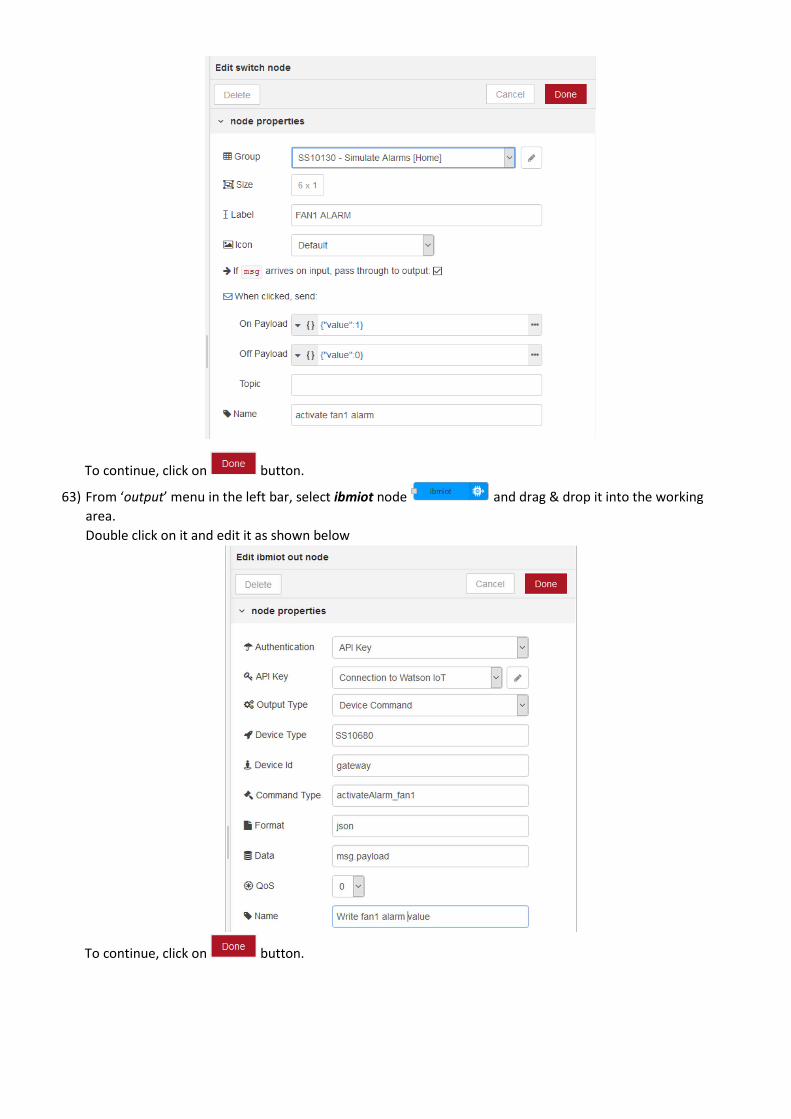
To continue, click on button.
63) From ‘output’ menu in the left bar, select ibmiot node and drag & drop it into the working
area.
Double click on it and edit it as shown below
To continue, click on button.
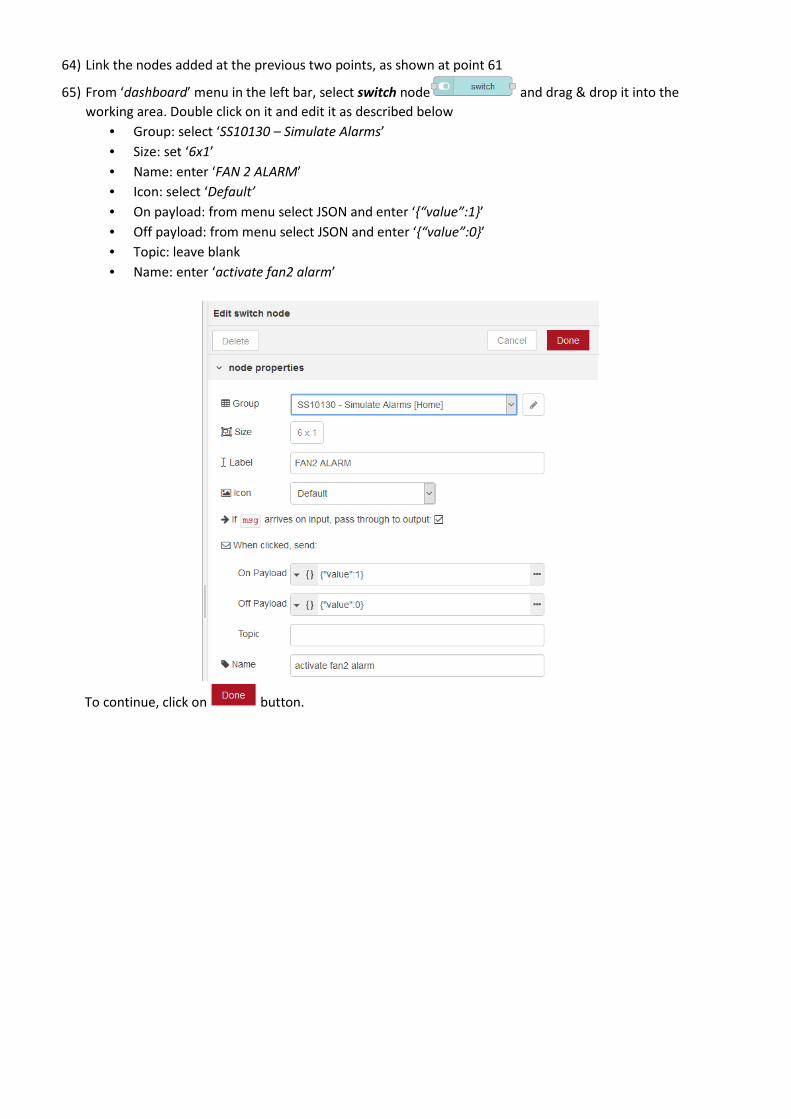
64) Link the nodes added at the previous two points, as shown at point 61
65) From ‘dashboard’ menu in the left bar, select switch node and drag & drop it into the
working area. Double click on it and edit it as described below
• Group: select ‘SS10130 – Simulate Alarms’
• Size: set ‘6x1’
• Name: enter ‘FAN 2 ALARM’
• Icon: select ‘Default’
• On payload: from menu select JSON and enter ‘{“value”:1}’
• Off payload: from menu select JSON and enter ‘{“value”:0}’
• Topic: leave blank
• Name: enter ‘activate fan2 alarm’
To continue, click on button.
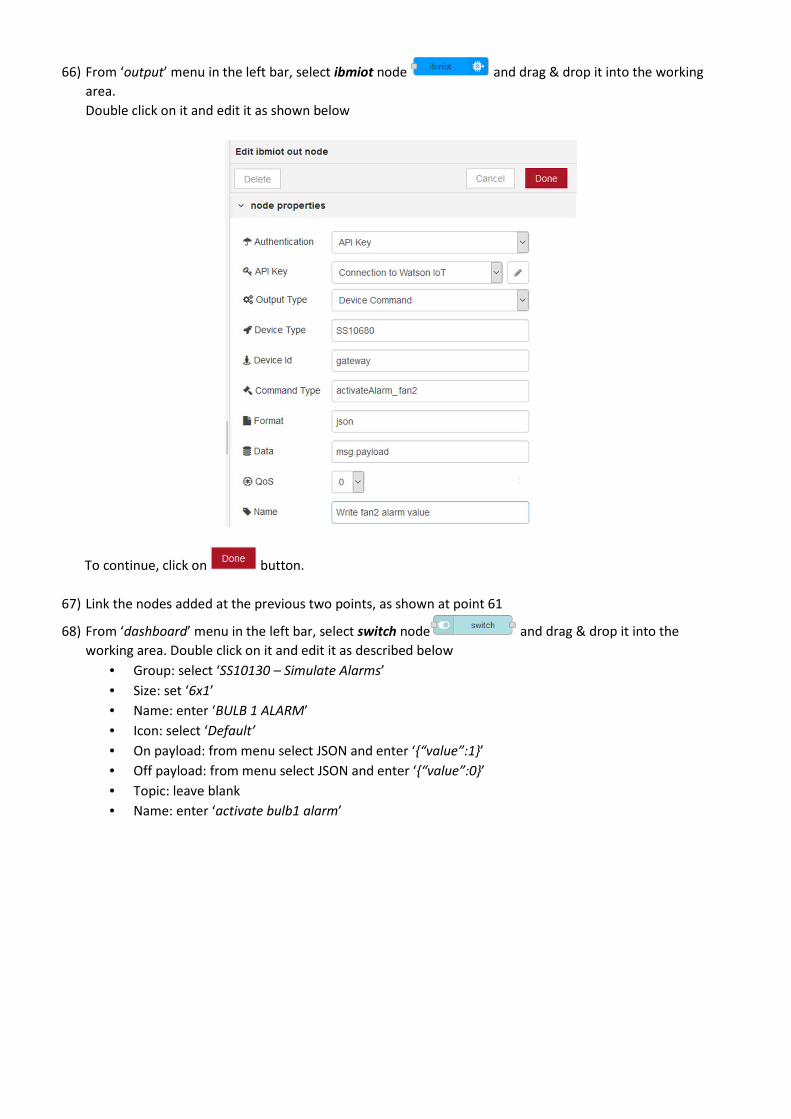
66) From ‘output’ menu in the left bar, select ibmiot node and drag & drop it into the working
area.
Double click on it and edit it as shown below
To continue, click on button.
67) Link the nodes added at the previous two points, as shown at point 61
68) From ‘dashboard’ menu in the left bar, select switch node and drag & drop it into the
working area. Double click on it and edit it as described below
• Group: select ‘SS10130 – Simulate Alarms’
• Size: set ‘6x1’
• Name: enter ‘BULB 1 ALARM’
• Icon: select ‘Default’
• On payload: from menu select JSON and enter ‘{“value”:1}’
• Off payload: from menu select JSON and enter ‘{“value”:0}’
• Topic: leave blank
• Name: enter ‘activate bulb1 alarm’
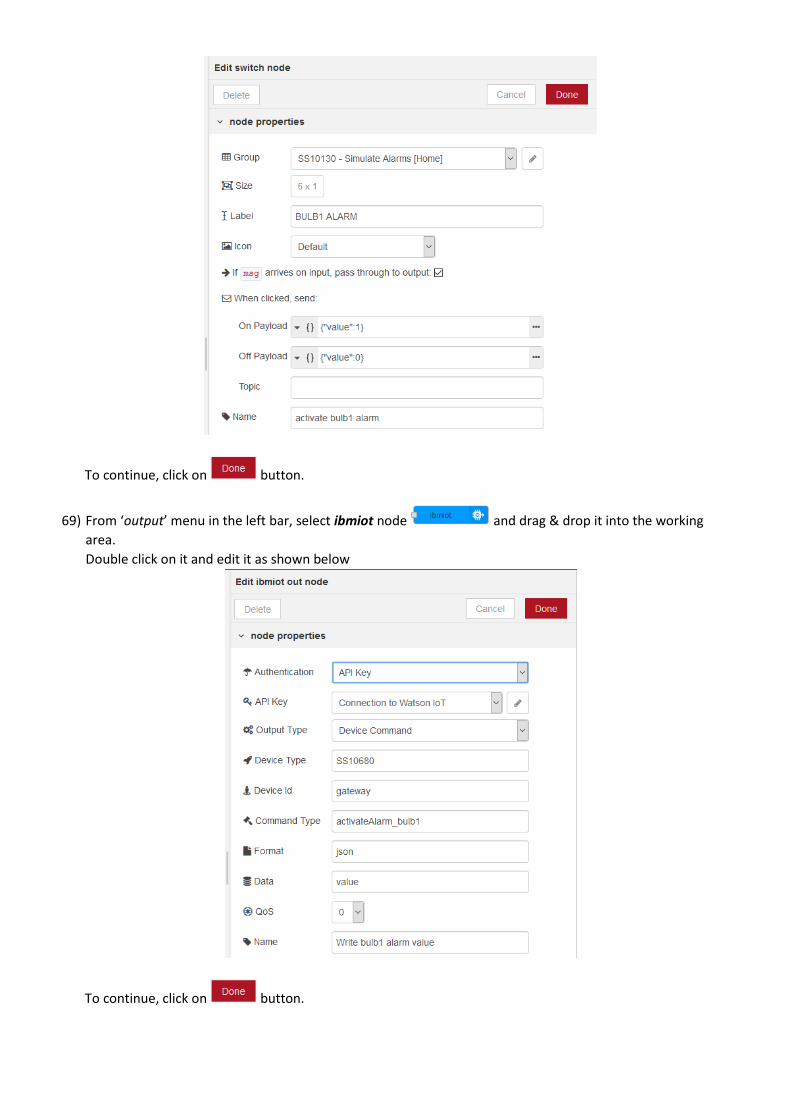
To continue, click on button.
69) From ‘output’ menu in the left bar, select ibmiot node and drag & drop it into the working
area.
Double click on it and edit it as shown below
To continue, click on button.
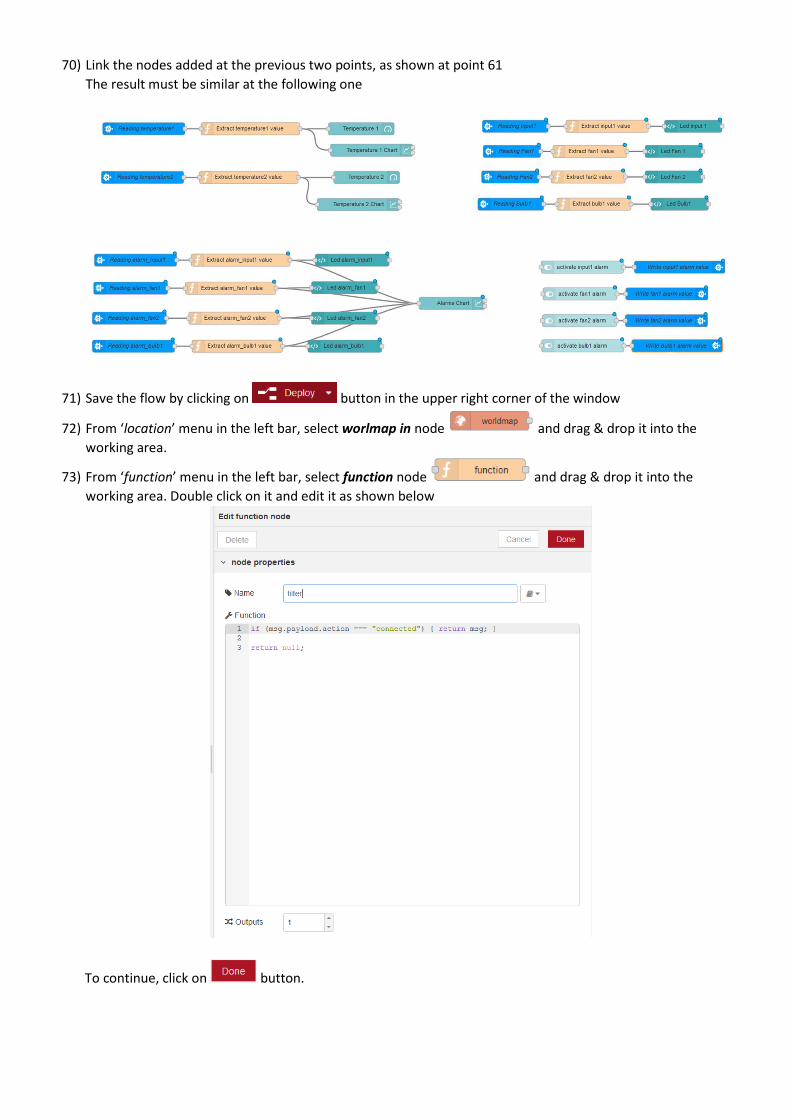
70) Link the nodes added at the previous two points, as shown at point 61
The result must be similar at the following one
71) Save the flow by clicking on button in the upper right corner of the window
72) From ‘location’ menu in the left bar, select worlmap in node and drag & drop it into the
working area.
73) From ‘function’ menu in the left bar, select function node and drag & drop it into the
working area. Double click on it and edit it as shown below
To continue, click on button.
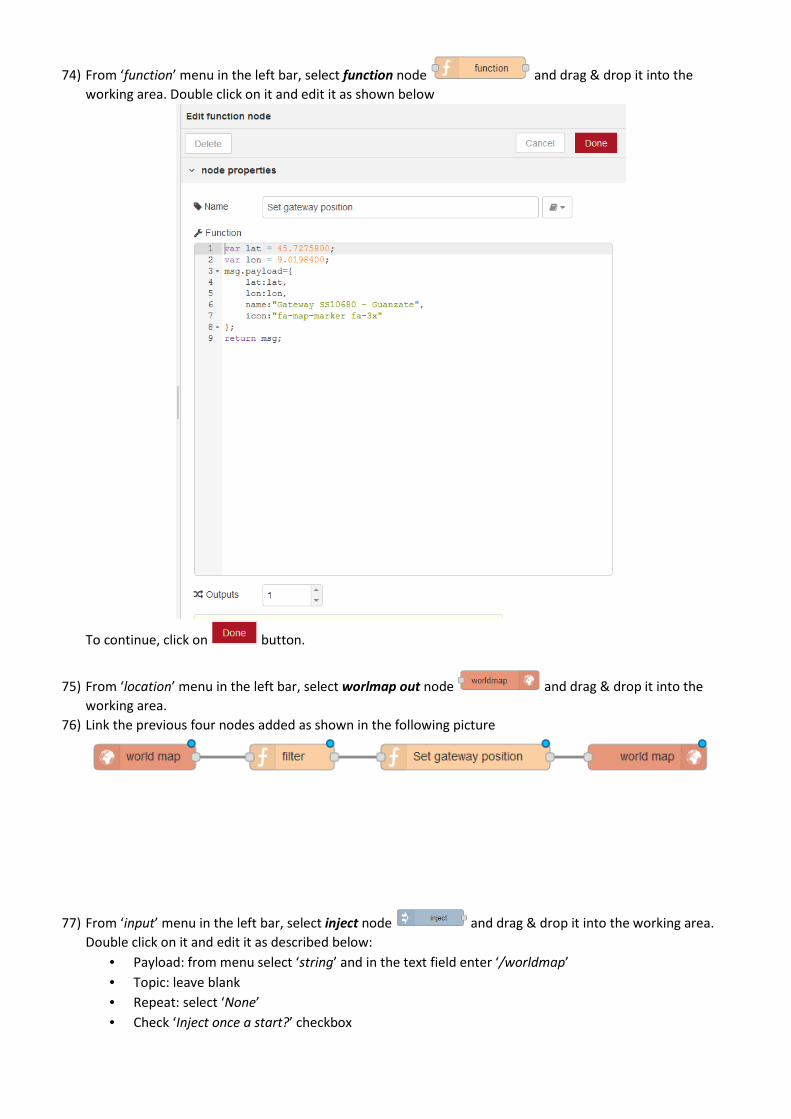
74) From ‘function’ menu in the left bar, select function node and drag & drop it into the
working area. Double click on it and edit it as shown below
To continue, click on button.
75) From ‘location’ menu in the left bar, select worlmap out node and drag & drop it into the
working area.
76) Link the previous four nodes added as shown in the following picture
77) From ‘input’ menu in the left bar, select inject node and drag & drop it into the working area.
Double click on it and edit it as described below:
• Payload: from menu select ‘string’ and in the text field enter ‘/worldmap’
• Topic: leave blank
• Repeat: select ‘None’
• Check ‘Inject once a start?’ checkbox
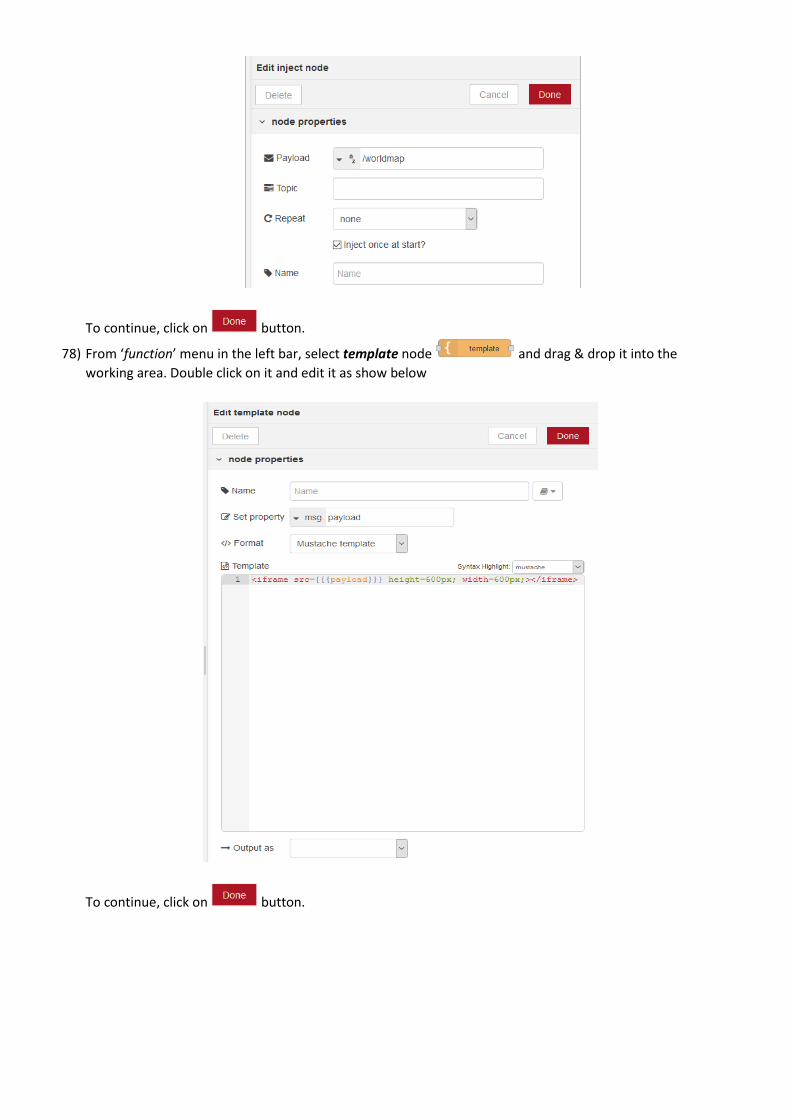
To continue, click on button.
78) From ‘function’ menu in the left bar, select template node and drag & drop it into the
working area. Double click on it and edit it as show below
To continue, click on button.
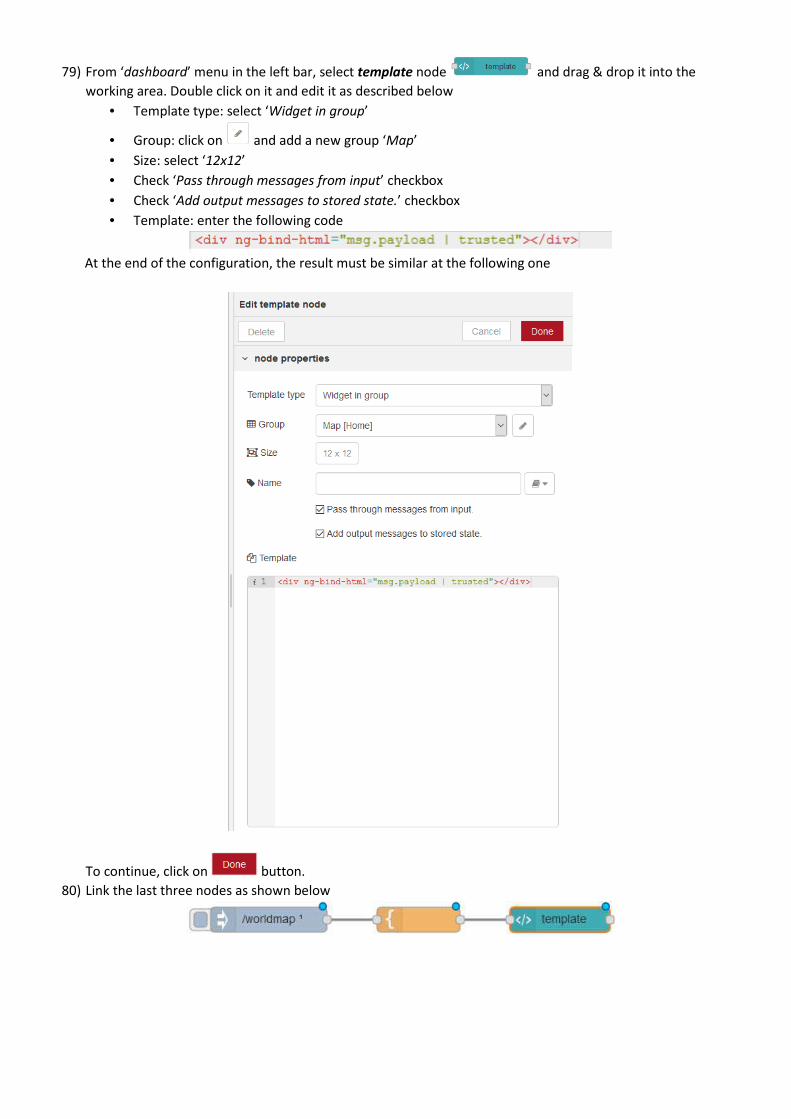
79) From ‘dashboard’ menu in the left bar, select template node and drag & drop it into the
working area. Double click on it and edit it as described below
• Template type: select ‘Widget in group’
• Group: click on and add a new group ‘Map’
• Size: select ‘12x12’
• Check ‘Pass through messages from input’ checkbox
• Check ‘Add output messages to stored state.’ checkbox
• Template: enter the following code
At the end of the configuration, the result must be similar at the following one
To continue, click on button.
80) Link the last three nodes as shown below
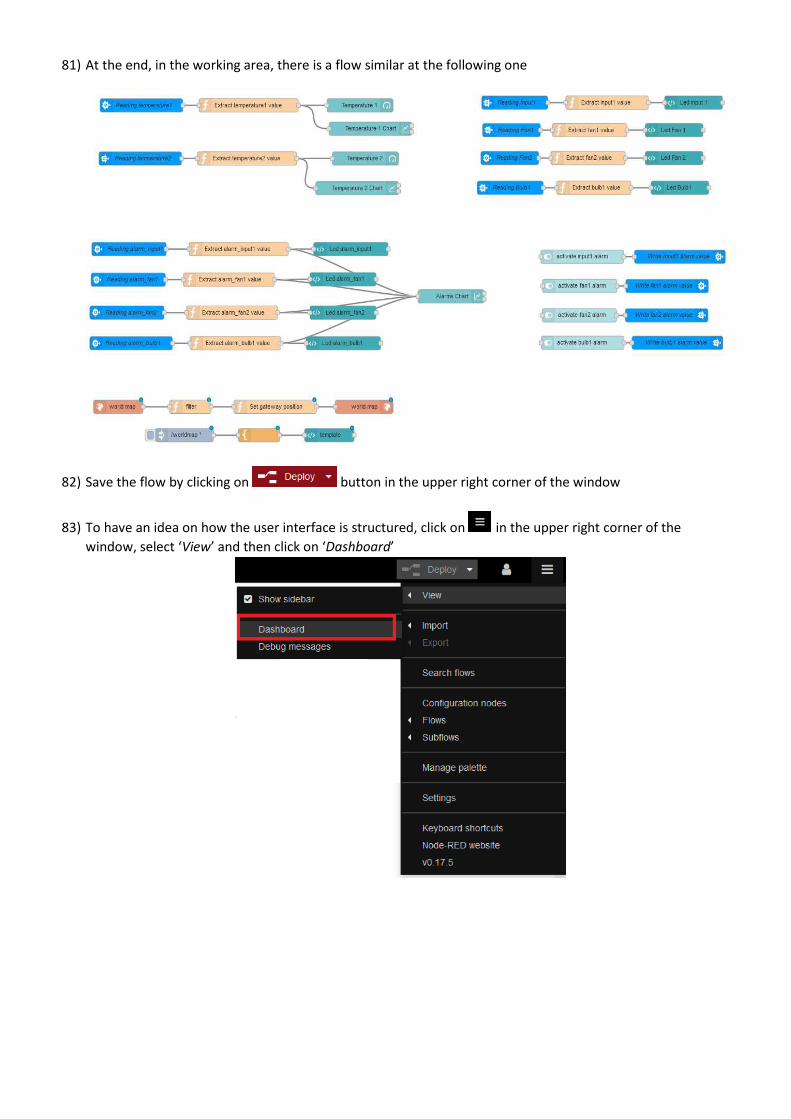
81) At the end, in the working area, there is a flow similar at the following one
82) Save the flow by clicking on button in the upper right corner of the window
83) To have an idea on how the user interface is structured, click on in the upper right corner of the
window, select ‘View’ and then click on ‘Dashboard’
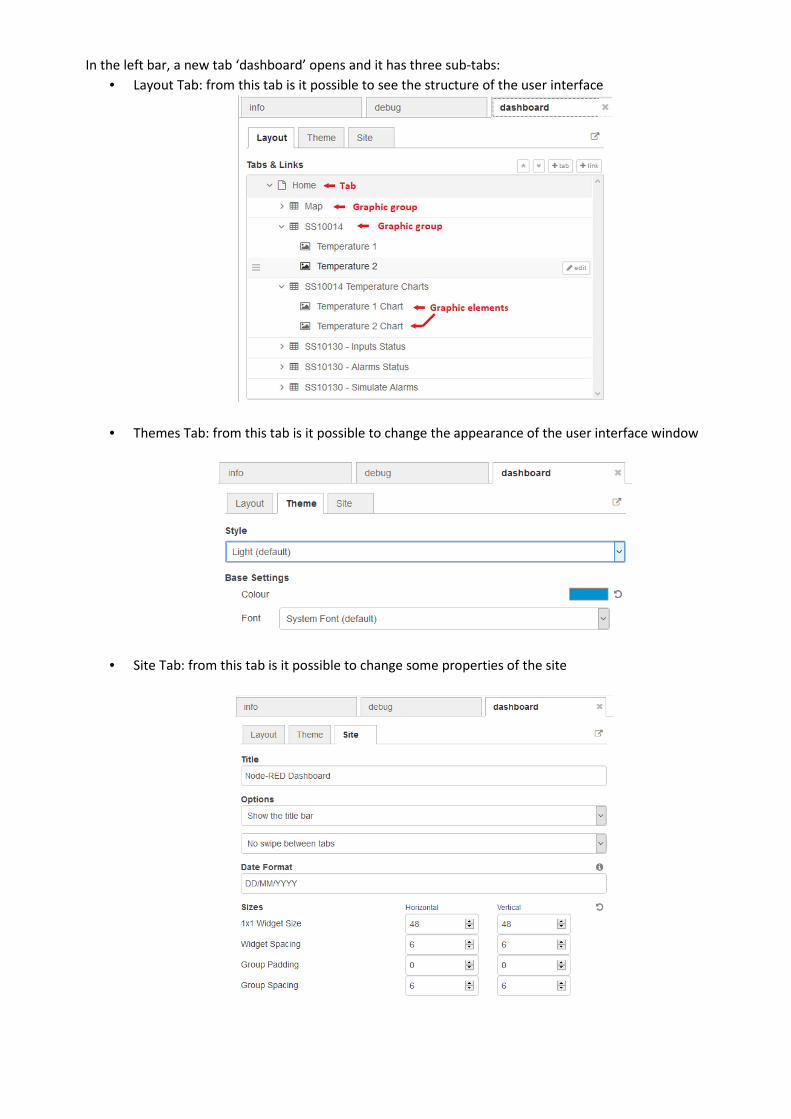
In the left bar, a new tab ‘dashboard’ opens and it has three sub-tabs:
• Layout Tab: from this tab is it possible to see the structure of the user interface
• Themes Tab: from this tab is it possible to change the appearance of the user interface window
• Site Tab: from this tab is it possible to change some properties of the site
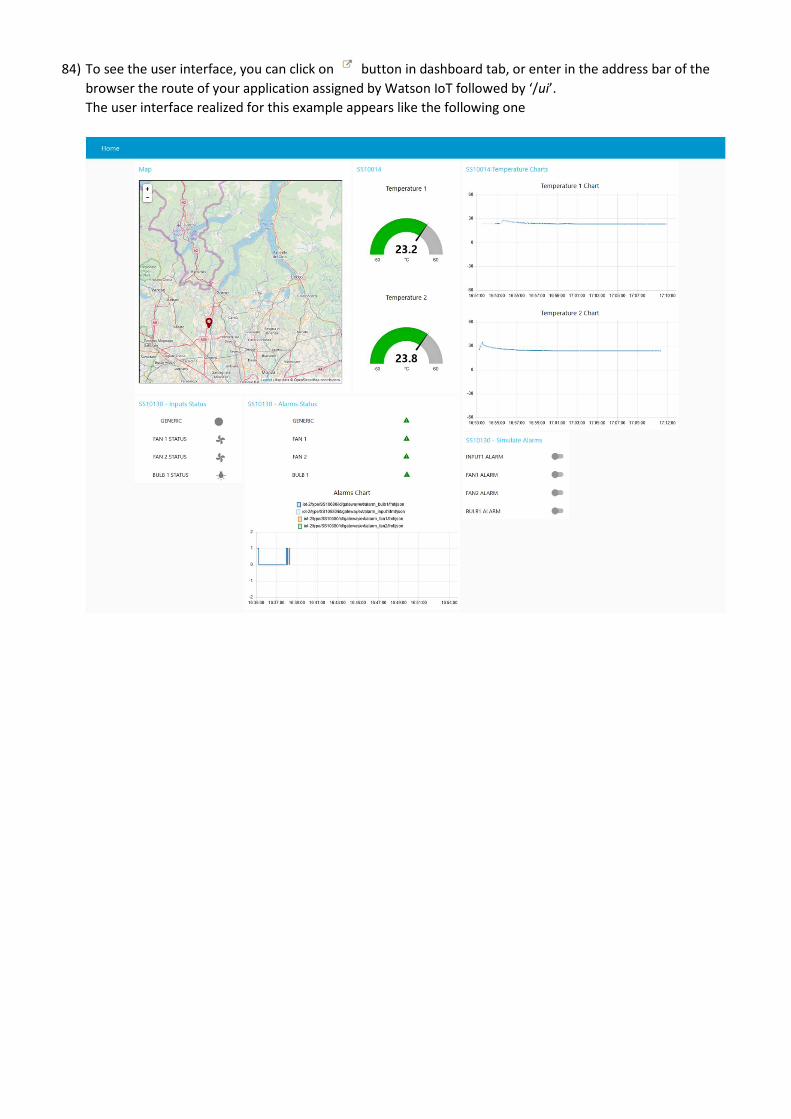
84) To see the user interface, you can click on button in dashboard tab, or enter in the address bar of the
browser the route of your application assigned by Watson IoT followed by ‘/ui’.
The user interface realized for this example appears like the following one