Embed Size (px)
Citation preview
1
Paper 346-2012
Deep Dive into the PIM and DDI Data
Michelle Hopkins, Stratis Health, Bloomington, MN
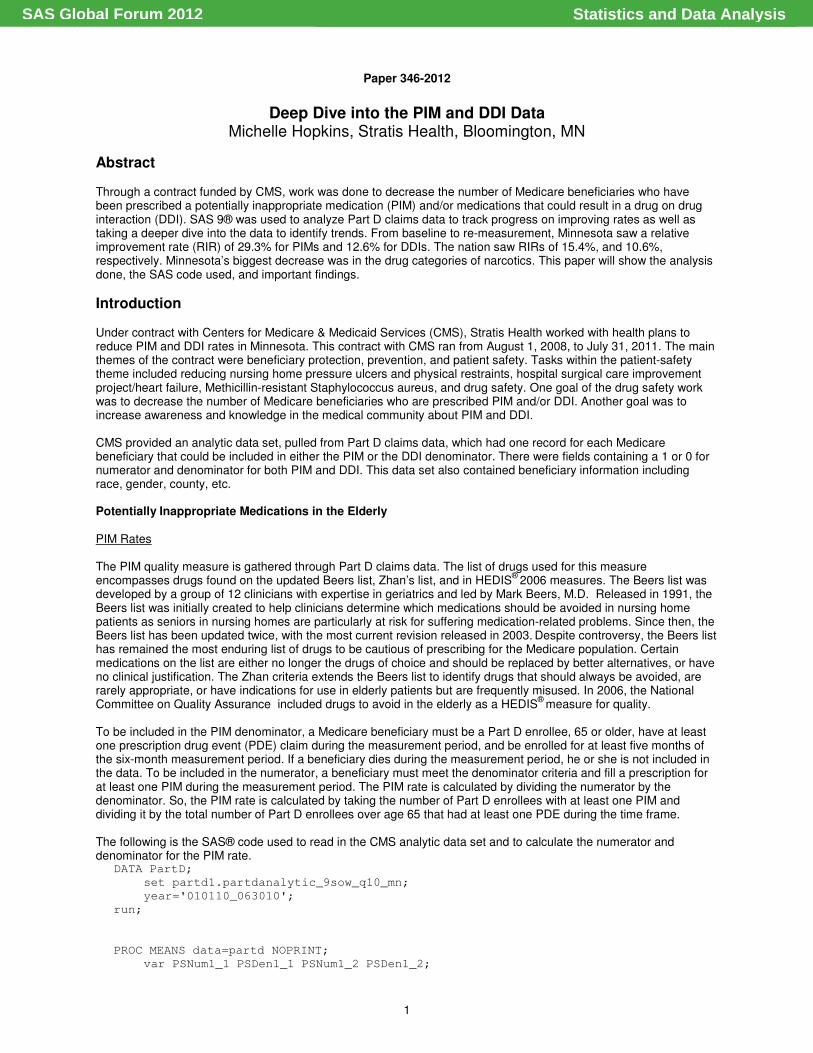
Abstract Through a contract funded by CMS, work was done to decrease the number of Medicare beneficiaries who have been prescribed a potentially inappropriate medication (PIM) and/or medications that could result in a drug on drug interaction (DDI). SAS 9® was used to analyze Part D claims data to track progress on improving rates as well as taking a deeper dive into the data to identify trends. From baseline to re-measurement, Minnesota saw a relative improvement rate (RIR) of 29.3% for PIMs and 12.6% for DDIs. The nation saw RIRs of 15.4%, and 10.6%, respectively. Minnesota’s biggest decrease was in the drug categories of narcotics. This paper will show the analysis done, the SAS code used, and important findings.
Introduction Under contract with Centers for Medicare & Medicaid Services (CMS), Stratis Health worked with health plans to reduce PIM and DDI rates in Minnesota. This contract with CMS ran from August 1, 2008, to July 31, 2011. The main themes of the contract were beneficiary protection, prevention, and patient safety. Tasks within the patient-safety theme included reducing nursing home pressure ulcers and physical restraints, hospital surgical care improvement project/heart failure, Methicillin-resistant Staphylococcus aureus, and drug safety. One goal of the drug safety work was to decrease the number of Medicare beneficiaries who are prescribed PIM and/or DDI. Another goal was to increase awareness and knowledge in the medical community about PIM and DDI. CMS provided an analytic data set, pulled from Part D claims data, which had one record for each Medicare beneficiary that could be included in either the PIM or the DDI denominator. There were fields containing a 1 or 0 for numerator and denominator for both PIM and DDI. This data set also contained beneficiary information including race, gender, county, etc. Potentially Inappropriate Medications in the Elderly PIM Rates The PIM quality measure is gathered through Part D claims data. The list of drugs used for this measure encompasses drugs found on the updated Beers list, Zhan’s list, and in HEDIS
® 2006 measures. The Beers list was
developed by a group of 12 clinicians with expertise in geriatrics and led by Mark Beers, M.D. Released in 1991, the Beers list was initially created to help clinicians determine which medications should be avoided in nursing home patients as seniors in nursing homes are particularly at risk for suffering medication-related problems. Since then, the Beers list has been updated twice, with the most current revision released in 2003.
Despite controversy, the Beers list
has remained the most enduring list of drugs to be cautious of prescribing for the Medicare population. Certain medications on the list are either no longer the drugs of choice and should be replaced by better alternatives, or have no clinical justification. The Zhan criteria extends the Beers list to identify drugs that should always be avoided, are rarely appropriate, or have indications for use in elderly patients but are frequently misused. In 2006, the National Committee on Quality Assurance included drugs to avoid in the elderly as a HEDIS
® measure for quality.
To be included in the PIM denominator, a Medicare beneficiary must be a Part D enrollee, 65 or older, have at least one prescription drug event (PDE) claim during the measurement period, and be enrolled for at least five months of the six-month measurement period. If a beneficiary dies during the measurement period, he or she is not included in the data. To be included in the numerator, a beneficiary must meet the denominator criteria and fill a prescription for at least one PIM during the measurement period. The PIM rate is calculated by dividing the numerator by the denominator. So, the PIM rate is calculated by taking the number of Part D enrollees with at least one PIM and dividing it by the total number of Part D enrollees over age 65 that had at least one PDE during the time frame. The following is the SAS® code used to read in the CMS analytic data set and to calculate the numerator and denominator for the PIM rate.
DATA PartD;
set partd1.partdanalytic_9sow_q10_mn;
year='010110_063010';
run;
PROC MEANS data=partd NOPRINT;
var PSNum1_1 PSDen1_1 PSNum1_2 PSDen1_2;
Statistics and Data AnalysisSAS Global Forum 2012
2
output out=partd2.stateDDIandPIM_010110_063010
sum=DDInum DDIden PIMnum PIMden;
run;
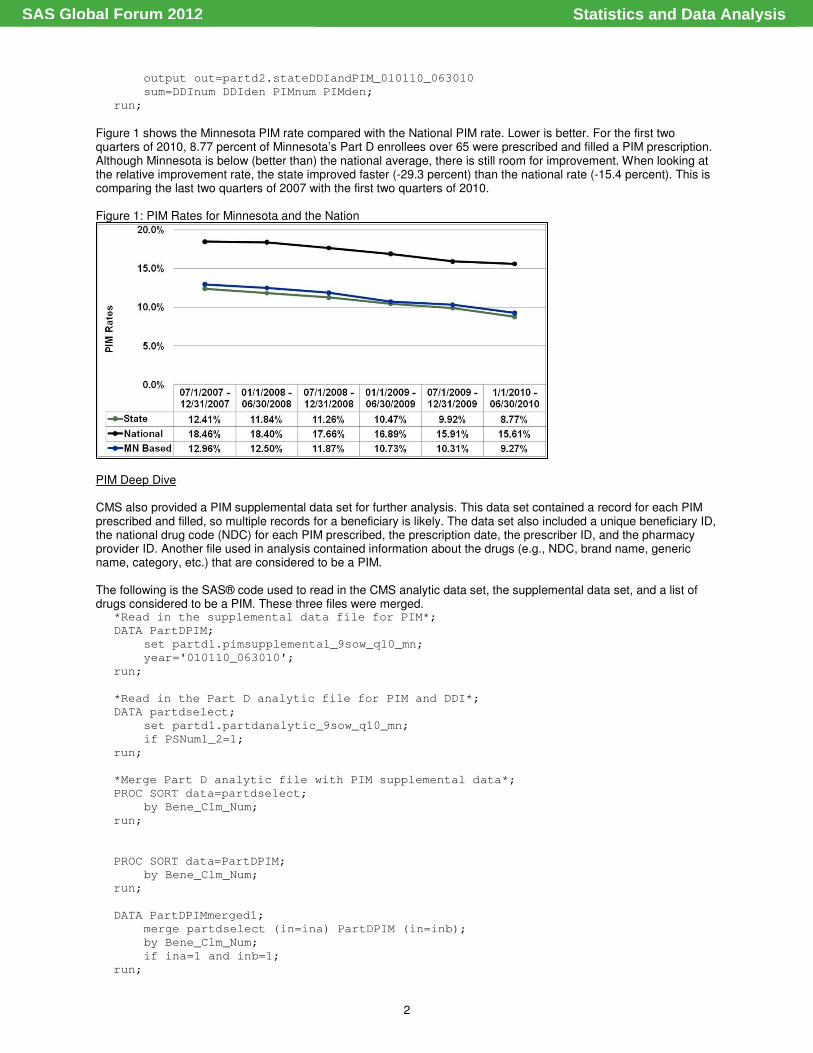
Figure 1 shows the Minnesota PIM rate compared with the National PIM rate. Lower is better. For the first two quarters of 2010, 8.77 percent of Minnesota’s Part D enrollees over 65 were prescribed and filled a PIM prescription. Although Minnesota is below (better than) the national average, there is still room for improvement. When looking at the relative improvement rate, the state improved faster (-29.3 percent) than the national rate (-15.4 percent). This is comparing the last two quarters of 2007 with the first two quarters of 2010. Figure 1: PIM Rates for Minnesota and the Nation
PIM Deep Dive CMS also provided a PIM supplemental data set for further analysis. This data set contained a record for each PIM prescribed and filled, so multiple records for a beneficiary is likely. The data set also included a unique beneficiary ID, the national drug code (NDC) for each PIM prescribed, the prescription date, the prescriber ID, and the pharmacy provider ID. Another file used in analysis contained information about the drugs (e.g., NDC, brand name, generic name, category, etc.) that are considered to be a PIM. The following is the SAS® code used to read in the CMS analytic data set, the supplemental data set, and a list of drugs considered to be a PIM. These three files were merged.
*Read in the supplemental data file for PIM*;
DATA PartDPIM;
set partd1.pimsupplemental_9sow_q10_mn;
year='010110_063010';
run;
*Read in the Part D analytic file for PIM and DDI*;
DATA partdselect;
set partd1.partdanalytic_9sow_q10_mn;
if PSNum1_2=1;
run;
*Merge Part D analytic file with PIM supplemental data*;
PROC SORT data=partdselect;
by Bene_Clm_Num;
run;
PROC SORT data=PartDPIM;
by Bene_Clm_Num;
run;
DATA PartDPIMmerged1;
merge partdselect (in=ina) PartDPIM (in=inb);
by Bene_Clm_Num;
if ina=1 and inb=1;
run;
Statistics and Data AnalysisSAS Global Forum 2012
3
*Read in the NDC file*;
PROC IMPORT OUT= WORK.NDClist
DATAFILE= "S:\9SOW\PS_DrugSafety\From_CMS_NDC_2007_CMS.xls"
DBMS=EXCEL REPLACE;
SHEET="HEDIS_DAE_PIM";
GETNAMES=YES;
MIXED=NO;
SCANTEXT=YES;
USEDATE=YES;
SCANTIME=YES;
RUN;
*Merge PartDPIMmerged1 with NDC list*;
PROC SORT data=PartDPIMmerged1;
by Product_Service_Id;
run;
PROC SORT data=NDClist;
by Product_Service_Id;
run;
DATA PartDPIMmerged;
merge PartDPIMmerged1 (in=ina) NDClist (in=inb);
by Product_Service_Id;
if ina=1 and inb=1;
run;
The following is the SAS® code used to calculate the frequencies of PIM by brand name. *PIM frequencies by Brand Name*;
PROC SORT data=PartDPIMmerged out=PartDPIMmerged2 nodupkey;
by contract_number bene_clm_num Brand_Name;
run;
PROC FREQ data=PartDPIMmerged2 order=freq;
table Brand_Name / out=Brand_Name_freq;
run;
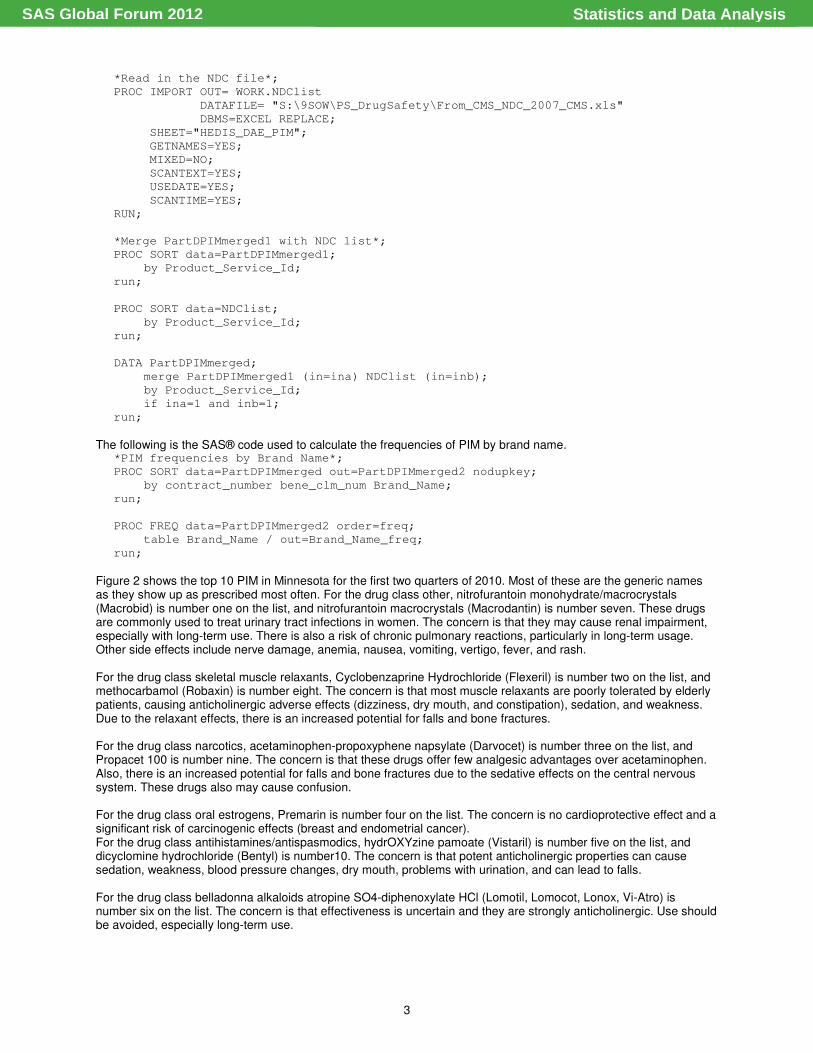
Figure 2 shows the top 10 PIM in Minnesota for the first two quarters of 2010. Most of these are the generic names as they show up as prescribed most often. For the drug class other, nitrofurantoin monohydrate/macrocrystals (Macrobid) is number one on the list, and nitrofurantoin macrocrystals (Macrodantin) is number seven. These drugs are commonly used to treat urinary tract infections in women. The concern is that they may cause renal impairment, especially with long-term use. There is also a risk of chronic pulmonary reactions, particularly in long-term usage. Other side effects include nerve damage, anemia, nausea, vomiting, vertigo, fever, and rash. For the drug class skeletal muscle relaxants, Cyclobenzaprine Hydrochloride (Flexeril) is number two on the list, and methocarbamol (Robaxin) is number eight. The concern is that most muscle relaxants are poorly tolerated by elderly patients, causing anticholinergic adverse effects (dizziness, dry mouth, and constipation), sedation, and weakness. Due to the relaxant effects, there is an increased potential for falls and bone fractures. For the drug class narcotics, acetaminophen-propoxyphene napsylate (Darvocet) is number three on the list, and Propacet 100 is number nine. The concern is that these drugs offer few analgesic advantages over acetaminophen. Also, there is an increased potential for falls and bone fractures due to the sedative effects on the central nervous system. These drugs also may cause confusion. For the drug class oral estrogens, Premarin is number four on the list. The concern is no cardioprotective effect and a significant risk of carcinogenic effects (breast and endometrial cancer). For the drug class antihistamines/antispasmodics, hydrOXYzine pamoate (Vistaril) is number five on the list, and dicyclomine hydrochloride (Bentyl) is number10. The concern is that potent anticholinergic properties can cause sedation, weakness, blood pressure changes, dry mouth, problems with urination, and can lead to falls. For the drug class belladonna alkaloids atropine SO4-diphenoxylate HCl (Lomotil, Lomocot, Lonox, Vi-Atro) is number six on the list. The concern is that effectiveness is uncertain and they are strongly anticholinergic. Use should be avoided, especially long-term use.
Statistics and Data AnalysisSAS Global Forum 2012
4
Figure 2: Top 10 PIM in Minnesota by Brand Name
The following SAS® code calculates the frequencies of PIM by drug category.
*PIM frequency by drug category*;
PROC SORT data=PartDPIMmerged out=PartDPIMmerged3 nodupkey;
by contract_number bene_clm_num category;
run;
PROC FREQ data=PartDPIMmerged3 order=freq;
table category/out=PIMcategoryCount;
run;
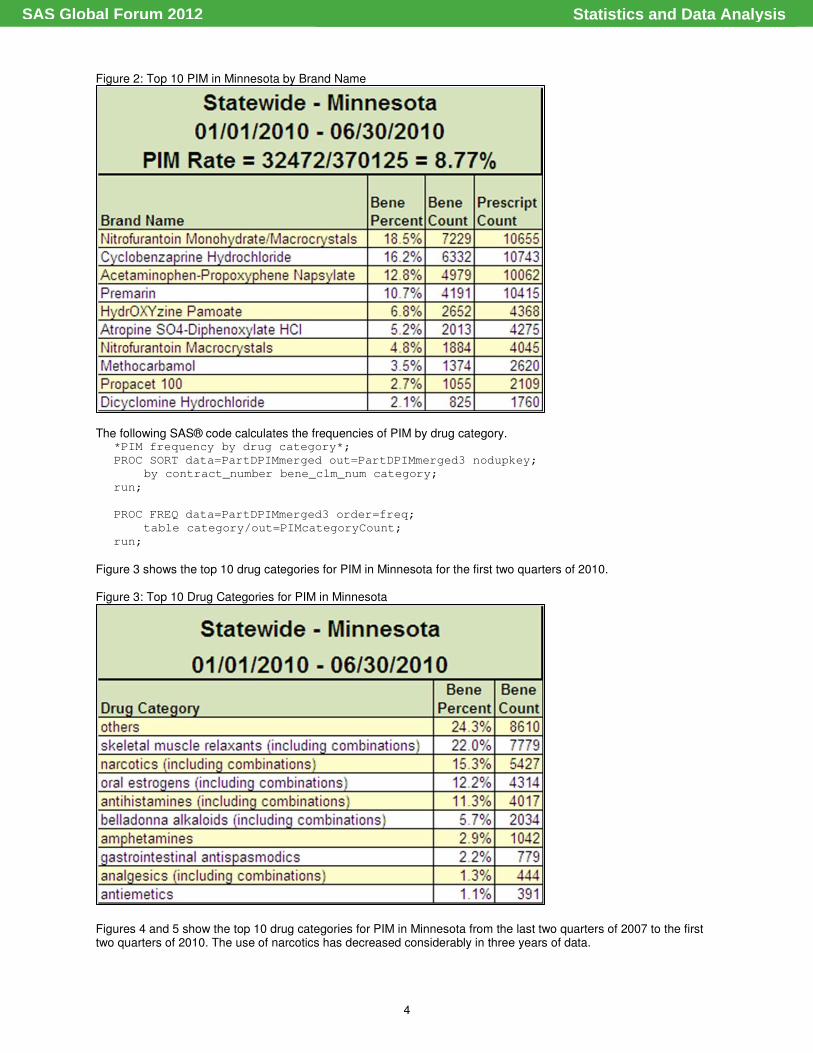
Figure 3 shows the top 10 drug categories for PIM in Minnesota for the first two quarters of 2010. Figure 3: Top 10 Drug Categories for PIM in Minnesota
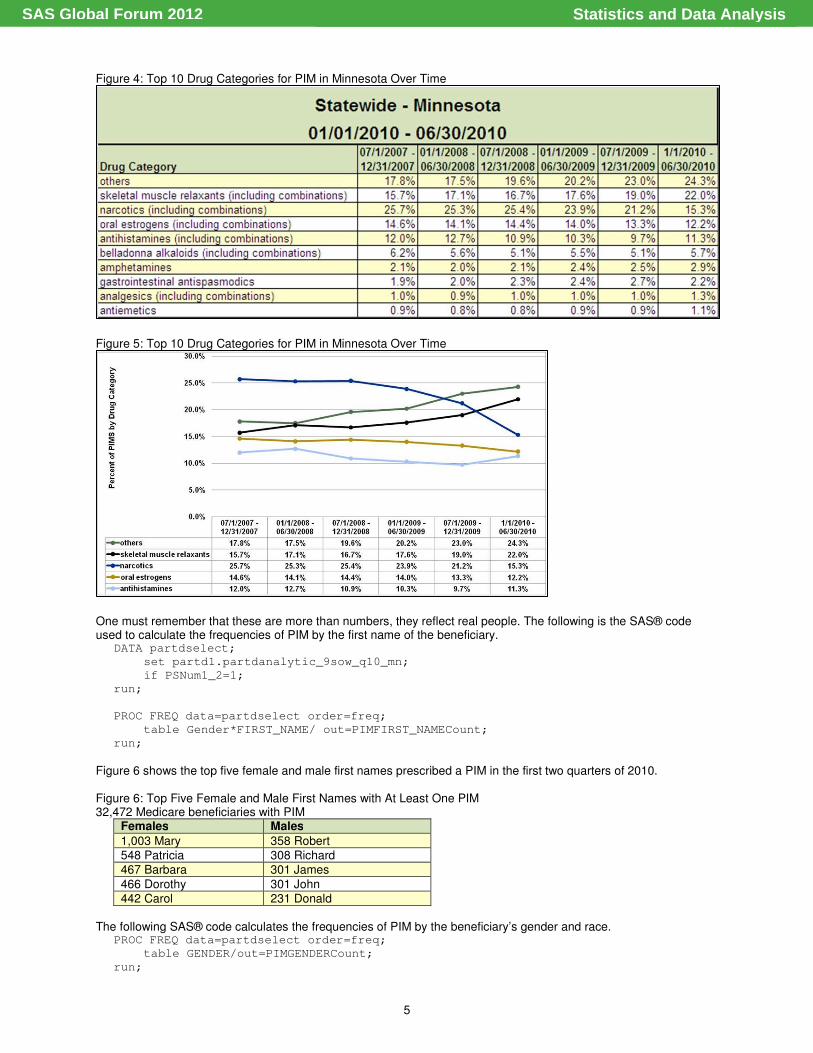
Figures 4 and 5 show the top 10 drug categories for PIM in Minnesota from the last two quarters of 2007 to the first two quarters of 2010. The use of narcotics has decreased considerably in three years of data.
Statistics and Data AnalysisSAS Global Forum 2012
5
Figure 4: Top 10 Drug Categories for PIM in Minnesota Over Time
Figure 5: Top 10 Drug Categories for PIM in Minnesota Over Time
One must remember that these are more than numbers, they reflect real people. The following is the SAS® code used to calculate the frequencies of PIM by the first name of the beneficiary.
DATA partdselect;
set partd1.partdanalytic_9sow_q10_mn;
if PSNum1_2=1;
run;
PROC FREQ data=partdselect order=freq;
table Gender*FIRST_NAME/ out=PIMFIRST_NAMECount;
run;
Figure 6 shows the top five female and male first names prescribed a PIM in the first two quarters of 2010. Figure 6: Top Five Female and Male First Names with At Least One PIM 32,472 Medicare beneficiaries with PIM
Females Males
1,003 Mary 358 Robert 548 Patricia 308 Richard
467 Barbara 301 James
466 Dorothy 301 John 442 Carol 231 Donald
The following SAS® code calculates the frequencies of PIM by the beneficiary’s gender and race. PROC FREQ data=partdselect order=freq;
table GENDER/out=PIMGENDERCount;
run;
Statistics and Data AnalysisSAS Global Forum 2012
6
PROC FREQ data=partdselect order=freq;
table RACE/out=PIMRACECount;
run;
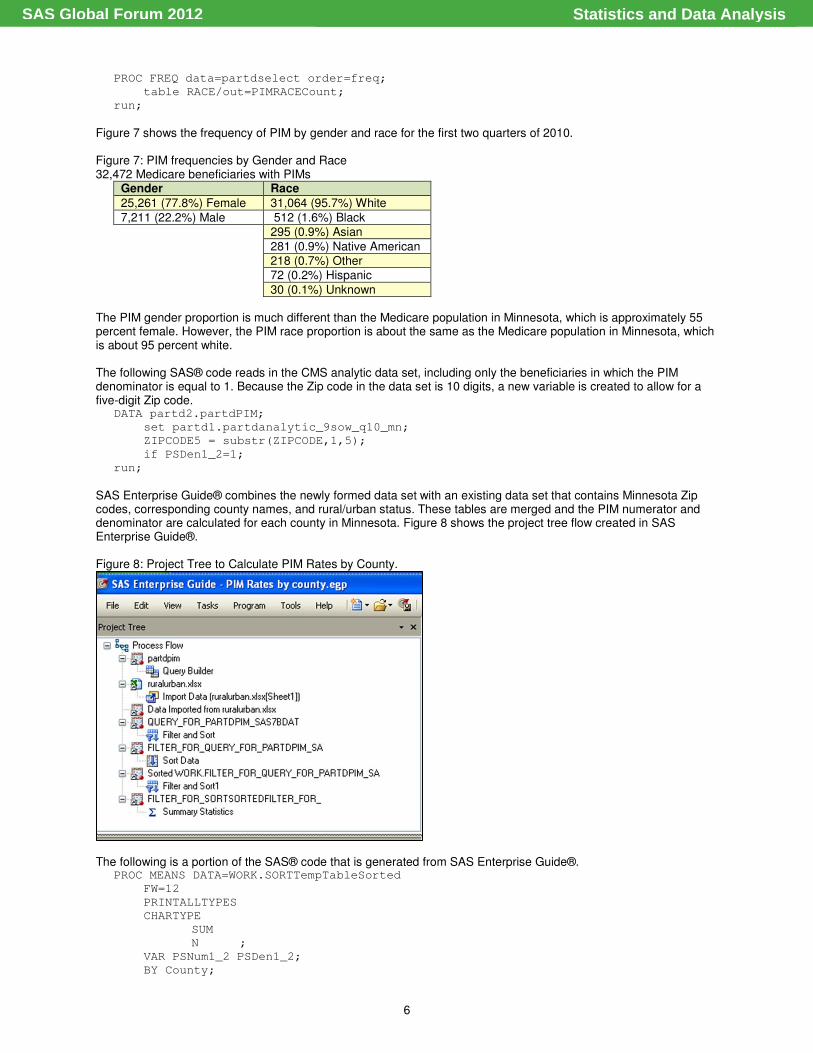
Figure 7 shows the frequency of PIM by gender and race for the first two quarters of 2010. Figure 7: PIM frequencies by Gender and Race 32,472 Medicare beneficiaries with PIMs
Gender Race
25,261 (77.8%) Female 31,064 (95.7%) White
7,211 (22.2%) Male 512 (1.6%) Black 295 (0.9%) Asian
281 (0.9%) Native American 218 (0.7%) Other 72 (0.2%) Hispanic
30 (0.1%) Unknown
The PIM gender proportion is much different than the Medicare population in Minnesota, which is approximately 55 percent female. However, the PIM race proportion is about the same as the Medicare population in Minnesota, which is about 95 percent white. The following SAS® code reads in the CMS analytic data set, including only the beneficiaries in which the PIM denominator is equal to 1. Because the Zip code in the data set is 10 digits, a new variable is created to allow for a five-digit Zip code.
DATA partd2.partdPIM;
set partd1.partdanalytic_9sow_q10_mn;
ZIPCODE5 = substr(ZIPCODE,1,5);
if PSDen1_2=1;
run;
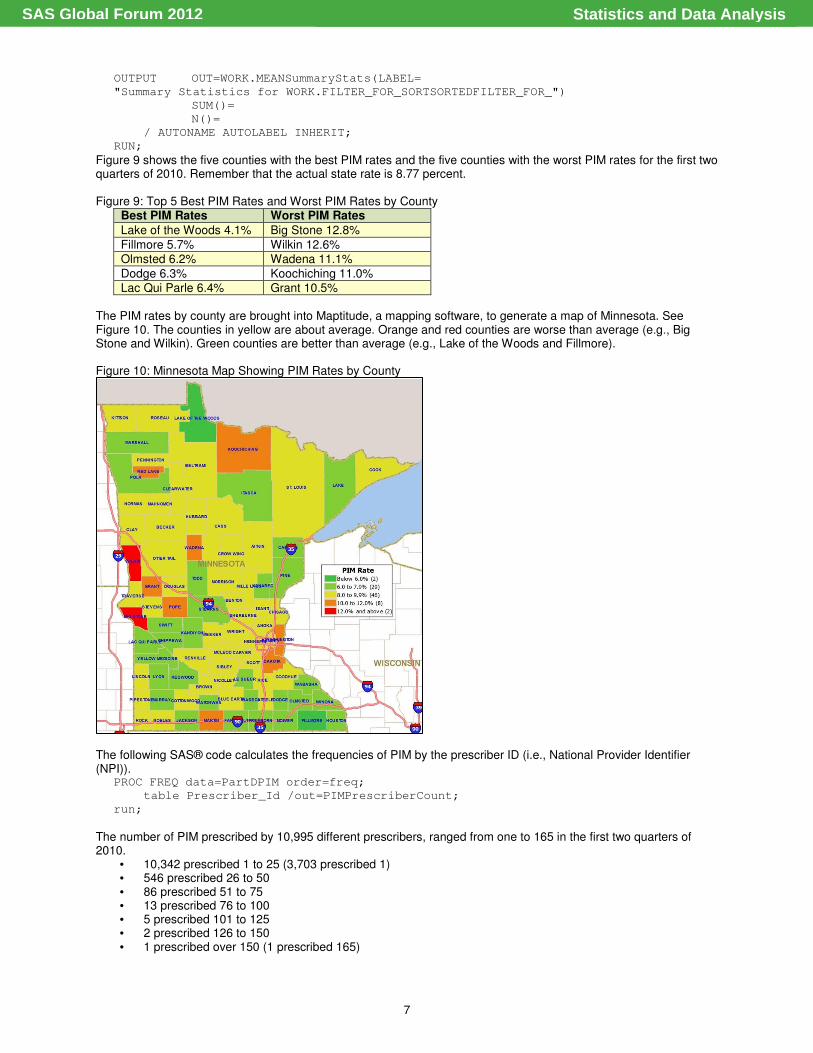
SAS Enterprise Guide® combines the newly formed data set with an existing data set that contains Minnesota Zip codes, corresponding county names, and rural/urban status. These tables are merged and the PIM numerator and denominator are calculated for each county in Minnesota. Figure 8 shows the project tree flow created in SAS Enterprise Guide®.
Figure 8: Project Tree to Calculate PIM Rates by County.
The following is a portion of the SAS® code that is generated from SAS Enterprise Guide®. PROC MEANS DATA=WORK.SORTTempTableSorted
FW=12
PRINTALLTYPES
CHARTYPE
SUM
N ;
VAR PSNum1_2 PSDen1_2;
BY County;
Statistics and Data AnalysisSAS Global Forum 2012
7
OUTPUT OUT=WORK.MEANSummaryStats(LABEL=
"Summary Statistics for WORK.FILTER_FOR_SORTSORTEDFILTER_FOR_")
SUM()=
N()=
/ AUTONAME AUTOLABEL INHERIT;
RUN;
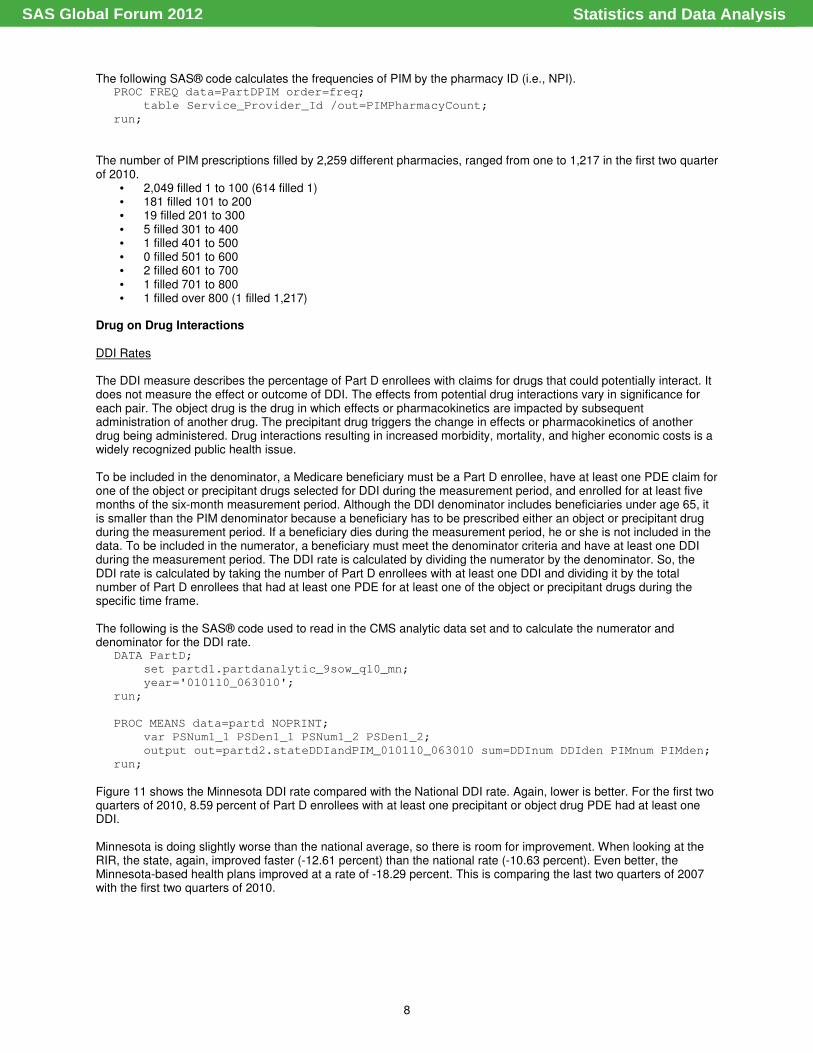
Figure 9 shows the five counties with the best PIM rates and the five counties with the worst PIM rates for the first two quarters of 2010. Remember that the actual state rate is 8.77 percent. Figure 9: Top 5 Best PIM Rates and Worst PIM Rates by County
Best PIM Rates Worst PIM Rates
Lake of the Woods 4.1% Big Stone 12.8%
Fillmore 5.7% Wilkin 12.6% Olmsted 6.2% Wadena 11.1%
Dodge 6.3% Koochiching 11.0% Lac Qui Parle 6.4% Grant 10.5%
The PIM rates by county are brought into Maptitude, a mapping software, to generate a map of Minnesota. See Figure 10. The counties in yellow are about average. Orange and red counties are worse than average (e.g., Big Stone and Wilkin). Green counties are better than average (e.g., Lake of the Woods and Fillmore).
Figure 10: Minnesota Map Showing PIM Rates by County
The following SAS® code calculates the frequencies of PIM by the prescriber ID (i.e., National Provider Identifier (NPI)).
PROC FREQ data=PartDPIM order=freq;
table Prescriber_Id /out=PIMPrescriberCount;
run;
The number of PIM prescribed by 10,995 different prescribers, ranged from one to 165 in the first two quarters of 2010.
• 10,342 prescribed 1 to 25 (3,703 prescribed 1) • 546 prescribed 26 to 50 • 86 prescribed 51 to 75 • 13 prescribed 76 to 100 • 5 prescribed 101 to 125 • 2 prescribed 126 to 150 • 1 prescribed over 150 (1 prescribed 165)
Statistics and Data AnalysisSAS Global Forum 2012
8
The following SAS® code calculates the frequencies of PIM by the pharmacy ID (i.e., NPI). PROC FREQ data=PartDPIM order=freq;
table Service_Provider_Id /out=PIMPharmacyCount;
run;
The number of PIM prescriptions filled by 2,259 different pharmacies, ranged from one to 1,217 in the first two quarter of 2010.
• 2,049 filled 1 to 100 (614 filled 1) • 181 filled 101 to 200 • 19 filled 201 to 300 • 5 filled 301 to 400 • 1 filled 401 to 500 • 0 filled 501 to 600 • 2 filled 601 to 700 • 1 filled 701 to 800 • 1 filled over 800 (1 filled 1,217)
Drug on Drug Interactions DDI Rates The DDI measure describes the percentage of Part D enrollees with claims for drugs that could potentially interact. It does not measure the effect or outcome of DDI. The effects from potential drug interactions vary in significance for each pair. The object drug is the drug in which effects or pharmacokinetics are impacted by subsequent administration of another drug. The precipitant drug triggers the change in effects or pharmacokinetics of another drug being administered. Drug interactions resulting in increased morbidity, mortality, and higher economic costs is a widely recognized public health issue. To be included in the denominator, a Medicare beneficiary must be a Part D enrollee, have at least one PDE claim for one of the object or precipitant drugs selected for DDI during the measurement period, and enrolled for at least five months of the six-month measurement period. Although the DDI denominator includes beneficiaries under age 65, it is smaller than the PIM denominator because a beneficiary has to be prescribed either an object or precipitant drug during the measurement period. If a beneficiary dies during the measurement period, he or she is not included in the data. To be included in the numerator, a beneficiary must meet the denominator criteria and have at least one DDI during the measurement period. The DDI rate is calculated by dividing the numerator by the denominator. So, the DDI rate is calculated by taking the number of Part D enrollees with at least one DDI and dividing it by the total number of Part D enrollees that had at least one PDE for at least one of the object or precipitant drugs during the specific time frame.
The following is the SAS® code used to read in the CMS analytic data set and to calculate the numerator and denominator for the DDI rate.
DATA PartD;
set partd1.partdanalytic_9sow_q10_mn;
year='010110_063010';
run;
PROC MEANS data=partd NOPRINT;
var PSNum1_1 PSDen1_1 PSNum1_2 PSDen1_2;
output out=partd2.stateDDIandPIM_010110_063010 sum=DDInum DDIden PIMnum PIMden;
run;
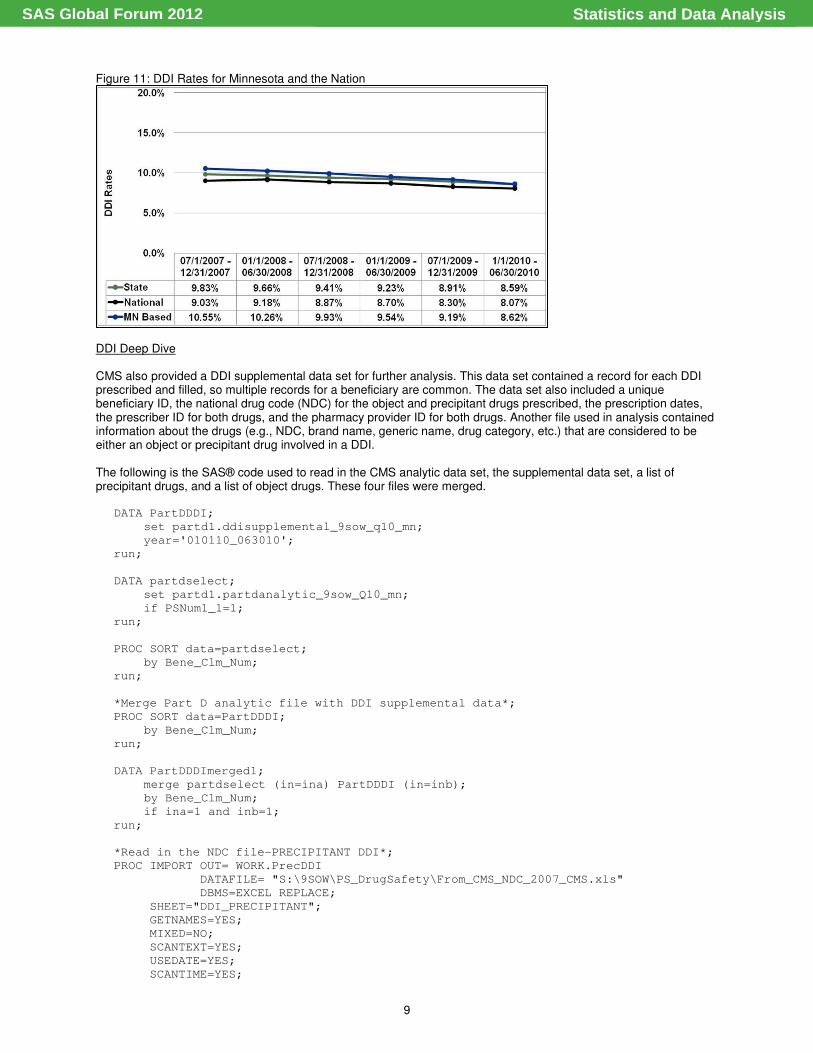
Figure 11 shows the Minnesota DDI rate compared with the National DDI rate. Again, lower is better. For the first two quarters of 2010, 8.59 percent of Part D enrollees with at least one precipitant or object drug PDE had at least one DDI. Minnesota is doing slightly worse than the national average, so there is room for improvement. When looking at the RIR, the state, again, improved faster (-12.61 percent) than the national rate (-10.63 percent). Even better, the Minnesota-based health plans improved at a rate of -18.29 percent. This is comparing the last two quarters of 2007 with the first two quarters of 2010.
Statistics and Data AnalysisSAS Global Forum 2012
9
Figure 11: DDI Rates for Minnesota and the Nation
DDI Deep Dive CMS also provided a DDI supplemental data set for further analysis. This data set contained a record for each DDI prescribed and filled, so multiple records for a beneficiary are common. The data set also included a unique beneficiary ID, the national drug code (NDC) for the object and precipitant drugs prescribed, the prescription dates, the prescriber ID for both drugs, and the pharmacy provider ID for both drugs. Another file used in analysis contained information about the drugs (e.g., NDC, brand name, generic name, drug category, etc.) that are considered to be either an object or precipitant drug involved in a DDI. The following is the SAS® code used to read in the CMS analytic data set, the supplemental data set, a list of precipitant drugs, and a list of object drugs. These four files were merged.
DATA PartDDDI;
set partd1.ddisupplemental_9sow_q10_mn;
year='010110_063010';
run;
DATA partdselect;
set partd1.partdanalytic_9sow_Q10_mn;
if PSNum1_1=1;
run;
PROC SORT data=partdselect;
by Bene_Clm_Num;
run;
*Merge Part D analytic file with DDI supplemental data*;
PROC SORT data=PartDDDI;
by Bene_Clm_Num;
run;
DATA PartDDDImerged1;
merge partdselect (in=ina) PartDDDI (in=inb);
by Bene_Clm_Num;
if ina=1 and inb=1;
run;
*Read in the NDC file-PRECIPITANT DDI*;
PROC IMPORT OUT= WORK.PrecDDI
DATAFILE= "S:\9SOW\PS_DrugSafety\From_CMS_NDC_2007_CMS.xls"
DBMS=EXCEL REPLACE;
SHEET="DDI_PRECIPITANT";
GETNAMES=YES;
MIXED=NO;
SCANTEXT=YES;
USEDATE=YES;
SCANTIME=YES;
Statistics and Data AnalysisSAS Global Forum 2012
10
RUN;
*Merge PartDPIMmerged1 with Precipitant NDC list*;
PROC SORT data=PartDDDImerged1;
by Prec_NDC;
run;
PROC SORT data=PrecDDI;
by Prec_NDC;
run;
DATA PartDDDImerged2;
merge PartDDDImerged1 (in=ina) PrecDDI (in=inb);
by Prec_NDC;
if ina=1 and inb=1;
run;
*Read in the NDC file-Object DDI*;
PROC IMPORT OUT= WORK.ObjDDI
DATAFILE= "S:\9SOW\PS_DrugSafety\From_CMS_NDC_2007_CMS.xls"
DBMS=EXCEL REPLACE;
SHEET="DDI_OBJECT";
GETNAMES=YES;
MIXED=NO;
SCANTEXT=YES;
USEDATE=YES;
SCANTIME=YES;
RUN;
PROC SORT data=PartDDDImerged2;
by Obj_NDC;
run;
PROC SORT data=ObjDDI;
by Obj_NDC;
run;
DATA PartDDDImerged;
merge PartDDDImerged2 (in=ina) ObjDDI (in=inb);
by Obj_NDC;
if ina=1 and inb=1;
DDI_Prec_Obj_Brand_Name=Prec_Brand_Name||Obj_Brand_Name;
run;
The following is the SAS® code use to calculate the frequencies of DDI by precipitant and object drug brand names.
*DDI frequencies by Brand Name*;
PROC SORT data=PartDDDImerged out=PartDDDImerged3 nodupkey;
by contract_number bene_clm_num DDI_Prec_Obj_Brand_Name;
run;
PROC FREQ data=PartDDDImerged3 order=freq;
table DDI_Prec_Obj_Brand_Name /out=Brandcount;
run;
PROC SORT data=Brandcount;
by DDI_Prec_Obj_Brand_Name;
run;
PROC SORT data=PartDDDImerged3;
by DDI_Prec_Obj_Brand_Name;
run;
DATA Brandcount2 (keep=DDI_Prec_Obj_Brand_Name COUNT PERCENT prec_brand_name
Obj_brand_name);
merge Brandcount (in=ina) PartDDDImerged3 (in=inb);
by DDI_Prec_Obj_Brand_Name;
Statistics and Data AnalysisSAS Global Forum 2012
11
if ina=1;
run;
PROC SORT data=Brandcount2 out=partd2.State_DDIxBrand_bene_fixed nodupkey;
by prec_brand_name Obj_brand_name;
Run;
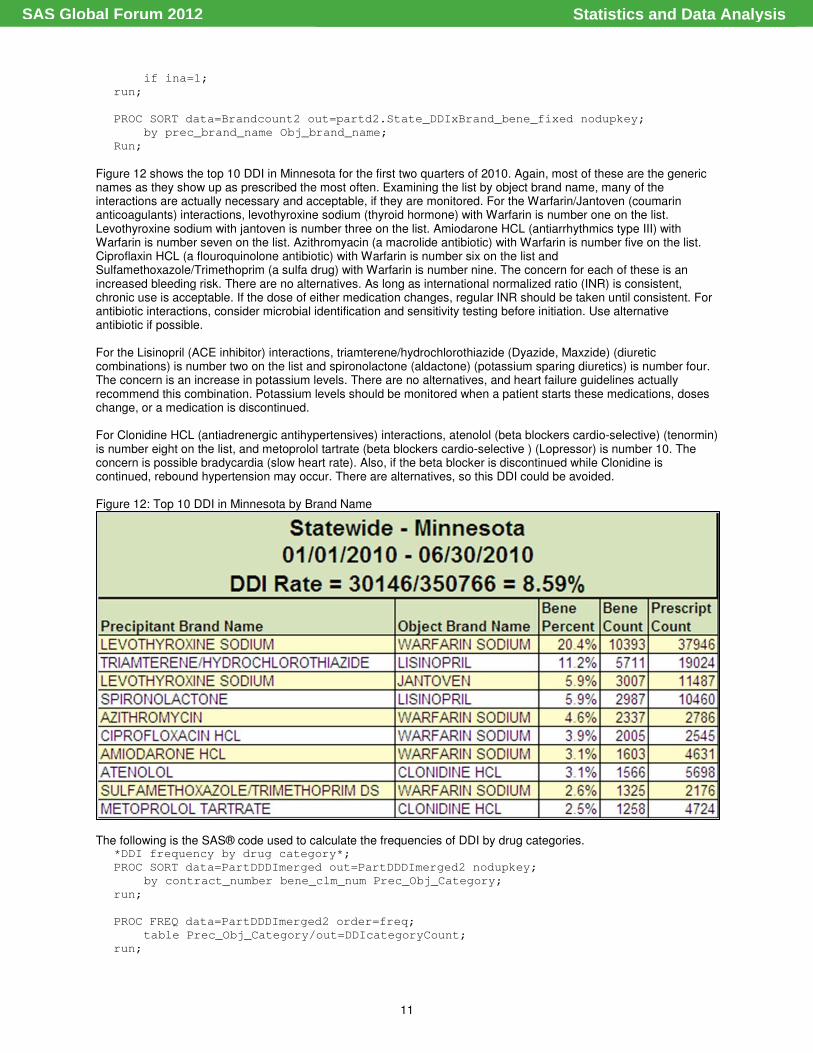
Figure 12 shows the top 10 DDI in Minnesota for the first two quarters of 2010. Again, most of these are the generic names as they show up as prescribed the most often. Examining the list by object brand name, many of the interactions are actually necessary and acceptable, if they are monitored. For the Warfarin/Jantoven (coumarin anticoagulants) interactions, levothyroxine sodium (thyroid hormone) with Warfarin is number one on the list. Levothyroxine sodium with jantoven is number three on the list. Amiodarone HCL (antiarrhythmics type III) with Warfarin is number seven on the list. Azithromyacin (a macrolide antibiotic) with Warfarin is number five on the list. Ciproflaxin HCL (a flouroquinolone antibiotic) with Warfarin is number six on the list and Sulfamethoxazole/Trimethoprim (a sulfa drug) with Warfarin is number nine. The concern for each of these is an increased bleeding risk. There are no alternatives. As long as international normalized ratio (INR) is consistent, chronic use is acceptable. If the dose of either medication changes, regular INR should be taken until consistent. For antibiotic interactions, consider microbial identification and sensitivity testing before initiation. Use alternative antibiotic if possible. For the Lisinopril (ACE inhibitor) interactions, triamterene/hydrochlorothiazide (Dyazide, Maxzide) (diuretic combinations) is number two on the list and spironolactone (aldactone) (potassium sparing diuretics) is number four. The concern is an increase in potassium levels. There are no alternatives, and heart failure guidelines actually recommend this combination. Potassium levels should be monitored when a patient starts these medications, doses change, or a medication is discontinued. For Clonidine HCL (antiadrenergic antihypertensives) interactions, atenolol (beta blockers cardio-selective) (tenormin) is number eight on the list, and metoprolol tartrate (beta blockers cardio-selective ) (Lopressor) is number 10. The concern is possible bradycardia (slow heart rate). Also, if the beta blocker is discontinued while Clonidine is continued, rebound hypertension may occur. There are alternatives, so this DDI could be avoided. Figure 12: Top 10 DDI in Minnesota by Brand Name
The following is the SAS® code used to calculate the frequencies of DDI by drug categories. *DDI frequency by drug category*;
PROC SORT data=PartDDDImerged out=PartDDDImerged2 nodupkey;
by contract_number bene_clm_num Prec_Obj_Category;
run;
PROC FREQ data=PartDDDImerged2 order=freq;
table Prec_Obj_Category/out=DDIcategoryCount;
run;
Statistics and Data AnalysisSAS Global Forum 2012
12
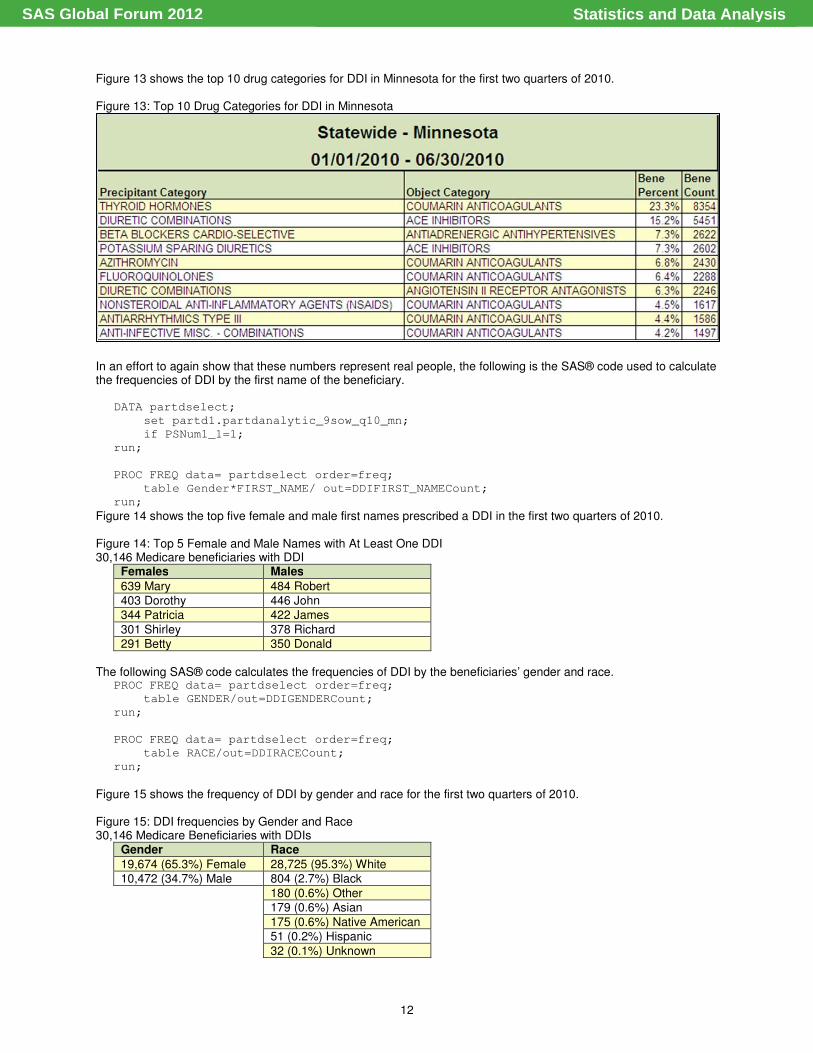
Figure 13 shows the top 10 drug categories for DDI in Minnesota for the first two quarters of 2010. Figure 13: Top 10 Drug Categories for DDI in Minnesota
In an effort to again show that these numbers represent real people, the following is the SAS® code used to calculate the frequencies of DDI by the first name of the beneficiary.
DATA partdselect;
set partd1.partdanalytic_9sow_q10_mn;
if PSNum1_1=1;
run;
PROC FREQ data= partdselect order=freq;
table Gender*FIRST_NAME/ out=DDIFIRST_NAMECount;
run;
Figure 14 shows the top five female and male first names prescribed a DDI in the first two quarters of 2010. Figure 14: Top 5 Female and Male Names with At Least One DDI 30,146 Medicare beneficiaries with DDI
Females Males
639 Mary 484 Robert
403 Dorothy 446 John 344 Patricia 422 James
301 Shirley 378 Richard 291 Betty 350 Donald
The following SAS® code calculates the frequencies of DDI by the beneficiaries’ gender and race. PROC FREQ data= partdselect order=freq;
table GENDER/out=DDIGENDERCount;
run;
PROC FREQ data= partdselect order=freq;
table RACE/out=DDIRACECount;
run;
Figure 15 shows the frequency of DDI by gender and race for the first two quarters of 2010. Figure 15: DDI frequencies by Gender and Race 30,146 Medicare Beneficiaries with DDIs
Gender Race
19,674 (65.3%) Female 28,725 (95.3%) White 10,472 (34.7%) Male 804 (2.7%) Black
180 (0.6%) Other 179 (0.6%) Asian
175 (0.6%) Native American
51 (0.2%) Hispanic
32 (0.1%) Unknown
Statistics and Data AnalysisSAS Global Forum 2012
13
Although not as big a difference as PIM, the DDI gender proportion is different than the Medicare population in Minnesota, which is approximately 55 percent female. The DDI race proportion is similar to the Medicare population in Minnesota, which is also about 95 percent white. The following SAS® code reads in the CMS analytic data set, includes only the beneficiaries in which the DDI denominator is equal to one. Since the Zip code in the data set is 10 digits, a new variable is created to allow for a five-digit Zip code.
DATA partd2.partdDDI;
set partd1.partdanalytic_9sow_q10_mn;
ZIPCODE5 = substr(ZIPCODE,1,5);
if PSDen1_1=1;
run;
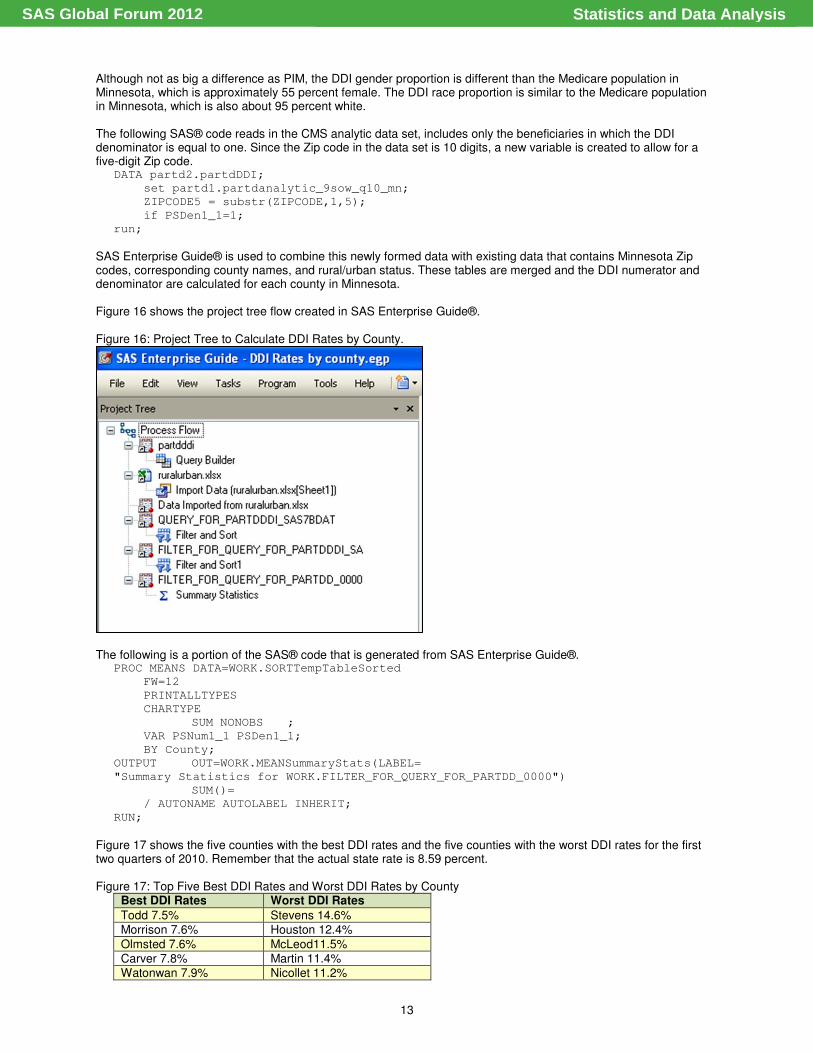
SAS Enterprise Guide® is used to combine this newly formed data with existing data that contains Minnesota Zip codes, corresponding county names, and rural/urban status. These tables are merged and the DDI numerator and denominator are calculated for each county in Minnesota. Figure 16 shows the project tree flow created in SAS Enterprise Guide®. Figure 16: Project Tree to Calculate DDI Rates by County.
The following is a portion of the SAS® code that is generated from SAS Enterprise Guide®.
PROC MEANS DATA=WORK.SORTTempTableSorted
FW=12
PRINTALLTYPES
CHARTYPE
SUM NONOBS ;
VAR PSNum1_1 PSDen1_1;
BY County;
OUTPUT OUT=WORK.MEANSummaryStats(LABEL=
"Summary Statistics for WORK.FILTER_FOR_QUERY_FOR_PARTDD_0000")
SUM()=
/ AUTONAME AUTOLABEL INHERIT;
RUN;
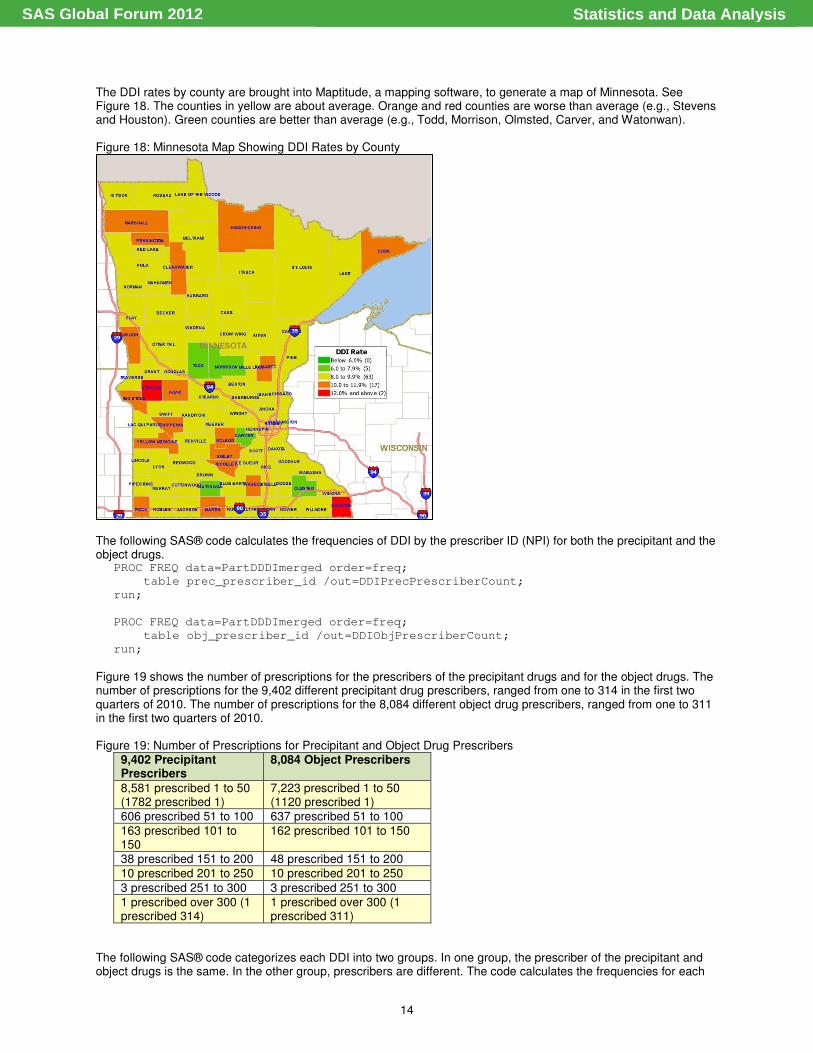
Figure 17 shows the five counties with the best DDI rates and the five counties with the worst DDI rates for the first two quarters of 2010. Remember that the actual state rate is 8.59 percent. Figure 17: Top Five Best DDI Rates and Worst DDI Rates by County
Best DDI Rates Worst DDI Rates
Todd 7.5% Stevens 14.6% Morrison 7.6% Houston 12.4%
Olmsted 7.6% McLeod11.5% Carver 7.8% Martin 11.4% Watonwan 7.9% Nicollet 11.2%
Statistics and Data AnalysisSAS Global Forum 2012
14
The DDI rates by county are brought into Maptitude, a mapping software, to generate a map of Minnesota. See Figure 18. The counties in yellow are about average. Orange and red counties are worse than average (e.g., Stevens and Houston). Green counties are better than average (e.g., Todd, Morrison, Olmsted, Carver, and Watonwan).
Figure 18: Minnesota Map Showing DDI Rates by County
The following SAS® code calculates the frequencies of DDI by the prescriber ID (NPI) for both the precipitant and the object drugs.
PROC FREQ data=PartDDDImerged order=freq;
table prec_prescriber_id /out=DDIPrecPrescriberCount;
run;
PROC FREQ data=PartDDDImerged order=freq;
table obj_prescriber_id /out=DDIObjPrescriberCount;
run;
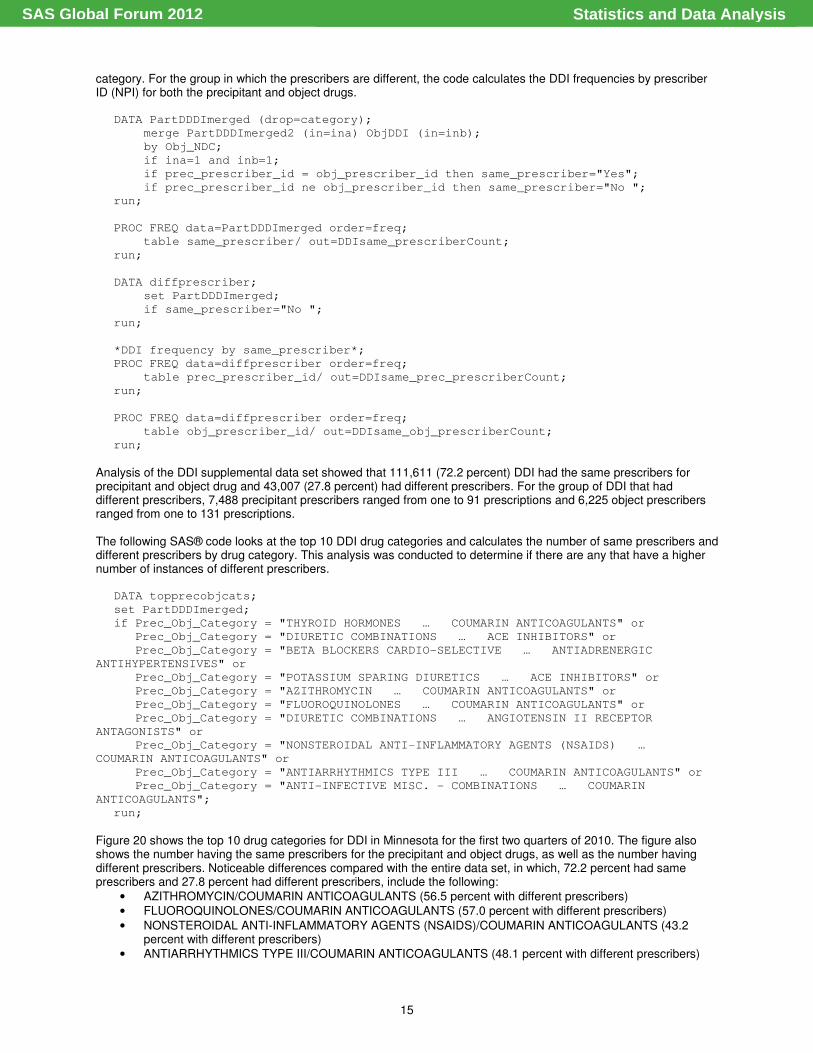
Figure 19 shows the number of prescriptions for the prescribers of the precipitant drugs and for the object drugs. The number of prescriptions for the 9,402 different precipitant drug prescribers, ranged from one to 314 in the first two quarters of 2010. The number of prescriptions for the 8,084 different object drug prescribers, ranged from one to 311 in the first two quarters of 2010. Figure 19: Number of Prescriptions for Precipitant and Object Drug Prescribers
9,402 Precipitant Prescribers
8,084 Object Prescribers
8,581 prescribed 1 to 50 (1782 prescribed 1)
7,223 prescribed 1 to 50 (1120 prescribed 1)
606 prescribed 51 to 100 637 prescribed 51 to 100 163 prescribed 101 to 150
162 prescribed 101 to 150
38 prescribed 151 to 200 48 prescribed 151 to 200
10 prescribed 201 to 250 10 prescribed 201 to 250
3 prescribed 251 to 300 3 prescribed 251 to 300 1 prescribed over 300 (1 prescribed 314)
1 prescribed over 300 (1 prescribed 311)
The following SAS® code categorizes each DDI into two groups. In one group, the prescriber of the precipitant and object drugs is the same. In the other group, prescribers are different. The code calculates the frequencies for each
Statistics and Data AnalysisSAS Global Forum 2012
15
category. For the group in which the prescribers are different, the code calculates the DDI frequencies by prescriber ID (NPI) for both the precipitant and object drugs.
DATA PartDDDImerged (drop=category);
merge PartDDDImerged2 (in=ina) ObjDDI (in=inb);
by Obj_NDC;
if ina=1 and inb=1;
if prec_prescriber_id = obj_prescriber_id then same_prescriber="Yes";
if prec_prescriber_id ne obj_prescriber_id then same_prescriber="No ";
run;
PROC FREQ data=PartDDDImerged order=freq;
table same_prescriber/ out=DDIsame_prescriberCount;
run;
DATA diffprescriber;
set PartDDDImerged;
if same_prescriber="No ";
run;
*DDI frequency by same_prescriber*;
PROC FREQ data=diffprescriber order=freq;
table prec_prescriber_id/ out=DDIsame_prec_prescriberCount;
run;
PROC FREQ data=diffprescriber order=freq;
table obj_prescriber_id/ out=DDIsame_obj_prescriberCount;
run;
Analysis of the DDI supplemental data set showed that 111,611 (72.2 percent) DDI had the same prescribers for precipitant and object drug and 43,007 (27.8 percent) had different prescribers. For the group of DDI that had different prescribers, 7,488 precipitant prescribers ranged from one to 91 prescriptions and 6,225 object prescribers ranged from one to 131 prescriptions. The following SAS® code looks at the top 10 DDI drug categories and calculates the number of same prescribers and different prescribers by drug category. This analysis was conducted to determine if there are any that have a higher number of instances of different prescribers.
DATA topprecobjcats;
set PartDDDImerged;
if Prec_Obj_Category = "THYROID HORMONES … COUMARIN ANTICOAGULANTS" or
Prec_Obj_Category = "DIURETIC COMBINATIONS … ACE INHIBITORS" or
Prec_Obj_Category = "BETA BLOCKERS CARDIO-SELECTIVE … ANTIADRENERGIC
ANTIHYPERTENSIVES" or
Prec_Obj_Category = "POTASSIUM SPARING DIURETICS … ACE INHIBITORS" or
Prec_Obj_Category = "AZITHROMYCIN … COUMARIN ANTICOAGULANTS" or
Prec_Obj_Category = "FLUOROQUINOLONES … COUMARIN ANTICOAGULANTS" or
Prec_Obj_Category = "DIURETIC COMBINATIONS … ANGIOTENSIN II RECEPTOR
ANTAGONISTS" or
Prec_Obj_Category = "NONSTEROIDAL ANTI-INFLAMMATORY AGENTS (NSAIDS) …
COUMARIN ANTICOAGULANTS" or
Prec_Obj_Category = "ANTIARRHYTHMICS TYPE III … COUMARIN ANTICOAGULANTS" or
Prec_Obj_Category = "ANTI-INFECTIVE MISC. - COMBINATIONS … COUMARIN
ANTICOAGULANTS";
run;
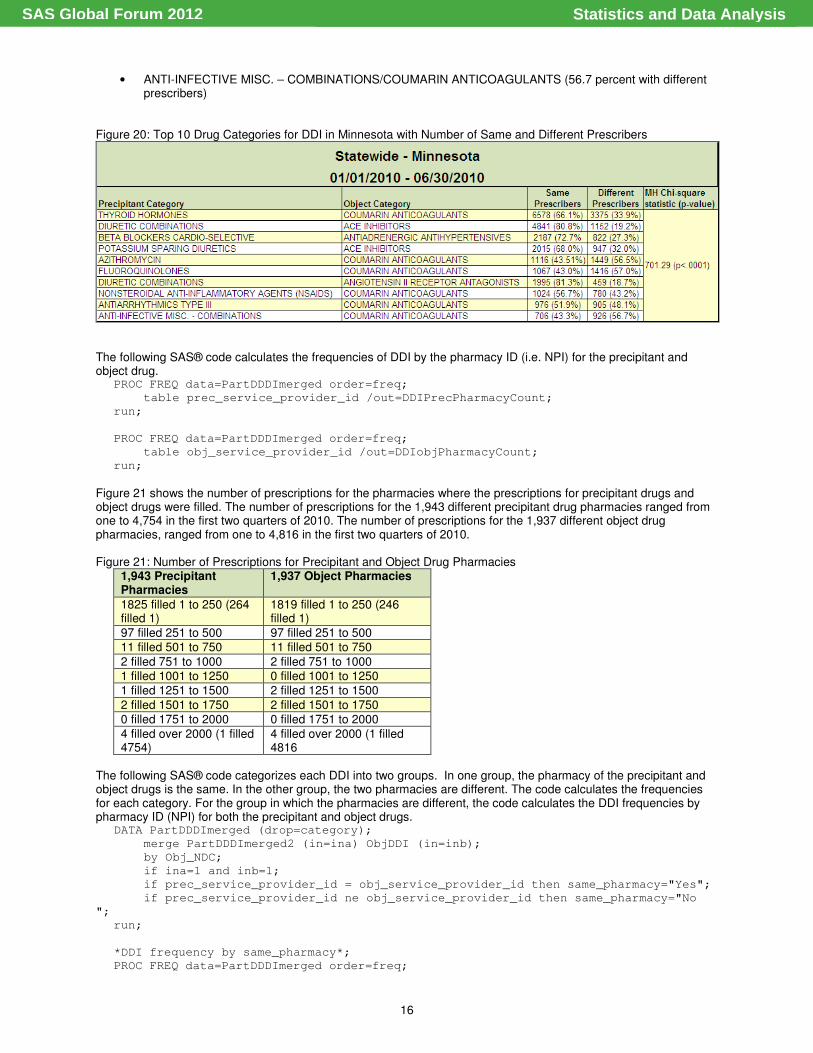
Figure 20 shows the top 10 drug categories for DDI in Minnesota for the first two quarters of 2010. The figure also shows the number having the same prescribers for the precipitant and object drugs, as well as the number having different prescribers. Noticeable differences compared with the entire data set, in which, 72.2 percent had same prescribers and 27.8 percent had different prescribers, include the following:
• AZITHROMYCIN/COUMARIN ANTICOAGULANTS (56.5 percent with different prescribers)
• FLUOROQUINOLONES/COUMARIN ANTICOAGULANTS (57.0 percent with different prescribers)
• NONSTEROIDAL ANTI-INFLAMMATORY AGENTS (NSAIDS)/COUMARIN ANTICOAGULANTS (43.2 percent with different prescribers)
• ANTIARRHYTHMICS TYPE III/COUMARIN ANTICOAGULANTS (48.1 percent with different prescribers)
Statistics and Data AnalysisSAS Global Forum 2012
16
• ANTI-INFECTIVE MISC. – COMBINATIONS/COUMARIN ANTICOAGULANTS (56.7 percent with different prescribers)
Figure 20: Top 10 Drug Categories for DDI in Minnesota with Number of Same and Different Prescribers
The following SAS® code calculates the frequencies of DDI by the pharmacy ID (i.e. NPI) for the precipitant and object drug.
PROC FREQ data=PartDDDImerged order=freq;
table prec_service_provider_id /out=DDIPrecPharmacyCount;
run;
PROC FREQ data=PartDDDImerged order=freq;
table obj_service_provider_id /out=DDIobjPharmacyCount;
run;
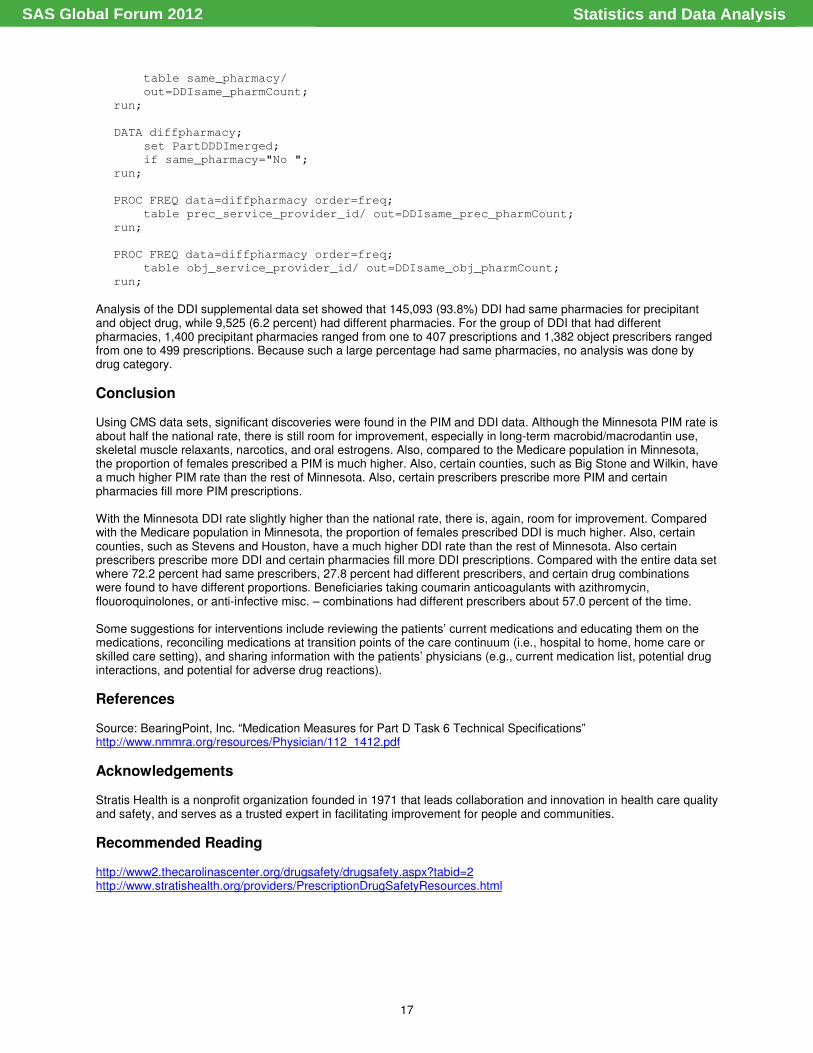
Figure 21 shows the number of prescriptions for the pharmacies where the prescriptions for precipitant drugs and object drugs were filled. The number of prescriptions for the 1,943 different precipitant drug pharmacies ranged from one to 4,754 in the first two quarters of 2010. The number of prescriptions for the 1,937 different object drug pharmacies, ranged from one to 4,816 in the first two quarters of 2010. Figure 21: Number of Prescriptions for Precipitant and Object Drug Pharmacies
1,943 Precipitant Pharmacies
1,937 Object Pharmacies
1825 filled 1 to 250 (264 filled 1)
1819 filled 1 to 250 (246 filled 1)
97 filled 251 to 500 97 filled 251 to 500 11 filled 501 to 750 11 filled 501 to 750
2 filled 751 to 1000 2 filled 751 to 1000 1 filled 1001 to 1250 0 filled 1001 to 1250
1 filled 1251 to 1500 2 filled 1251 to 1500
2 filled 1501 to 1750 2 filled 1501 to 1750 0 filled 1751 to 2000 0 filled 1751 to 2000
4 filled over 2000 (1 filled 4754)
4 filled over 2000 (1 filled 4816
The following SAS® code categorizes each DDI into two groups. In one group, the pharmacy of the precipitant and object drugs is the same. In the other group, the two pharmacies are different. The code calculates the frequencies for each category. For the group in which the pharmacies are different, the code calculates the DDI frequencies by pharmacy ID (NPI) for both the precipitant and object drugs.
DATA PartDDDImerged (drop=category);
merge PartDDDImerged2 (in=ina) ObjDDI (in=inb);
by Obj_NDC;
if ina=1 and inb=1;
if prec_service_provider_id = obj_service_provider_id then same_pharmacy="Yes";
if prec_service_provider_id ne obj_service_provider_id then same_pharmacy="No
";
run;
*DDI frequency by same_pharmacy*;
PROC FREQ data=PartDDDImerged order=freq;
Statistics and Data AnalysisSAS Global Forum 2012
17
table same_pharmacy/
out=DDIsame_pharmCount;
run;
DATA diffpharmacy;
set PartDDDImerged;
if same_pharmacy="No ";
run;
PROC FREQ data=diffpharmacy order=freq;
table prec_service_provider_id/ out=DDIsame_prec_pharmCount;
run;
PROC FREQ data=diffpharmacy order=freq;
table obj_service_provider_id/ out=DDIsame_obj_pharmCount;
run;
Analysis of the DDI supplemental data set showed that 145,093 (93.8%) DDI had same pharmacies for precipitant and object drug, while 9,525 (6.2 percent) had different pharmacies. For the group of DDI that had different pharmacies, 1,400 precipitant pharmacies ranged from one to 407 prescriptions and 1,382 object prescribers ranged from one to 499 prescriptions. Because such a large percentage had same pharmacies, no analysis was done by drug category.
Conclusion Using CMS data sets, significant discoveries were found in the PIM and DDI data. Although the Minnesota PIM rate is about half the national rate, there is still room for improvement, especially in long-term macrobid/macrodantin use, skeletal muscle relaxants, narcotics, and oral estrogens. Also, compared to the Medicare population in Minnesota, the proportion of females prescribed a PIM is much higher. Also, certain counties, such as Big Stone and Wilkin, have a much higher PIM rate than the rest of Minnesota. Also, certain prescribers prescribe more PIM and certain pharmacies fill more PIM prescriptions. With the Minnesota DDI rate slightly higher than the national rate, there is, again, room for improvement. Compared with the Medicare population in Minnesota, the proportion of females prescribed DDI is much higher. Also, certain counties, such as Stevens and Houston, have a much higher DDI rate than the rest of Minnesota. Also certain prescribers prescribe more DDI and certain pharmacies fill more DDI prescriptions. Compared with the entire data set where 72.2 percent had same prescribers, 27.8 percent had different prescribers, and certain drug combinations were found to have different proportions. Beneficiaries taking coumarin anticoagulants with azithromycin, flouoroquinolones, or anti-infective misc. – combinations had different prescribers about 57.0 percent of the time. Some suggestions for interventions include reviewing the patients’ current medications and educating them on the medications, reconciling medications at transition points of the care continuum (i.e., hospital to home, home care or skilled care setting), and sharing information with the patients’ physicians (e.g., current medication list, potential drug interactions, and potential for adverse drug reactions).
References Source: BearingPoint, Inc. “Medication Measures for Part D Task 6 Technical Specifications” http://www.nmmra.org/resources/Physician/112_1412.pdf
Acknowledgements Stratis Health is a nonprofit organization founded in 1971 that leads collaboration and innovation in health care quality and safety, and serves as a trusted expert in facilitating improvement for people and communities.
Recommended Reading http://www2.thecarolinascenter.org/drugsafety/drugsafety.aspx?tabid=2 http://www.stratishealth.org/providers/PrescriptionDrugSafetyResources.html
Statistics and Data AnalysisSAS Global Forum 2012
18
Contact Information Your comments and questions are valued and encouraged. Contact the author at: Michelle Hopkins Stratis Health 2901 Metro Drive, Suite 400 Bloomington, MN 55425 Phone: 952-853-8573 Fax: 952-853-8503 E-mail: [email protected] Web: www.stratishealth.org SAS and all other SAS Institute Inc. product or service names are registered trademarks or trademarks of SAS Institute Inc. in the USA and other countries. ® indicates USA registration. Other brand and product names are trademarks of their respective companies.
Statistics and Data AnalysisSAS Global Forum 2012