Embed Size (px)
Citation preview
3700 West Sam Houston Parkway South, Suite 250, Houston, Texas 77042(713) 260-9000 (800) 262-6631 (713) 260-9050(Fax)
Scott Frakes, Regional Vice PresidentScott Wynant, Executive Vice President
October 2011
2
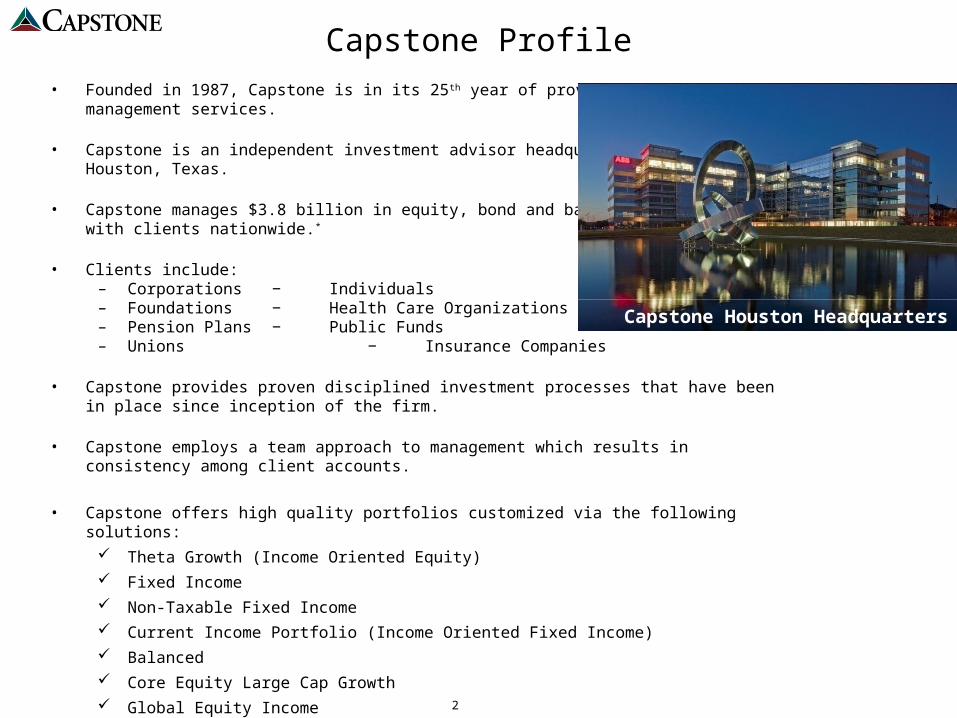
Capstone Profile• Founded in 1987, Capstone is in its 25th year of providing investment
management services.
• Capstone is an independent investment advisor headquartered in Houston, Texas.
• Capstone manages $3.8 billion in equity, bond and balanced accounts with clients nationwide.*
• Clients include:– Corporations − Individuals– Foundations − Health Care Organizations– Pension Plans − Public Funds– Unions − Insurance Companies
• Capstone provides proven disciplined investment processes that have been in place since inception of the firm.
• Capstone employs a team approach to management which results in consistency among client accounts.
• Capstone offers high quality portfolios customized via the following solutions:
Theta Growth (Income Oriented Equity)
Fixed Income
Non-Taxable Fixed Income
Current Income Portfolio (Income Oriented Fixed Income)
Balanced
Core Equity Large Cap Growth
Global Equity Income
* Capstone Financial Services, Inc. and it’s subsidiary companies.
Capstone Houston Headquarters

3
4
What are Retirees Thinking
• Their expectations are higher
• They’re going to be in retirement longer
• They’ll be responsible for more
• Their family situations are more complex
5
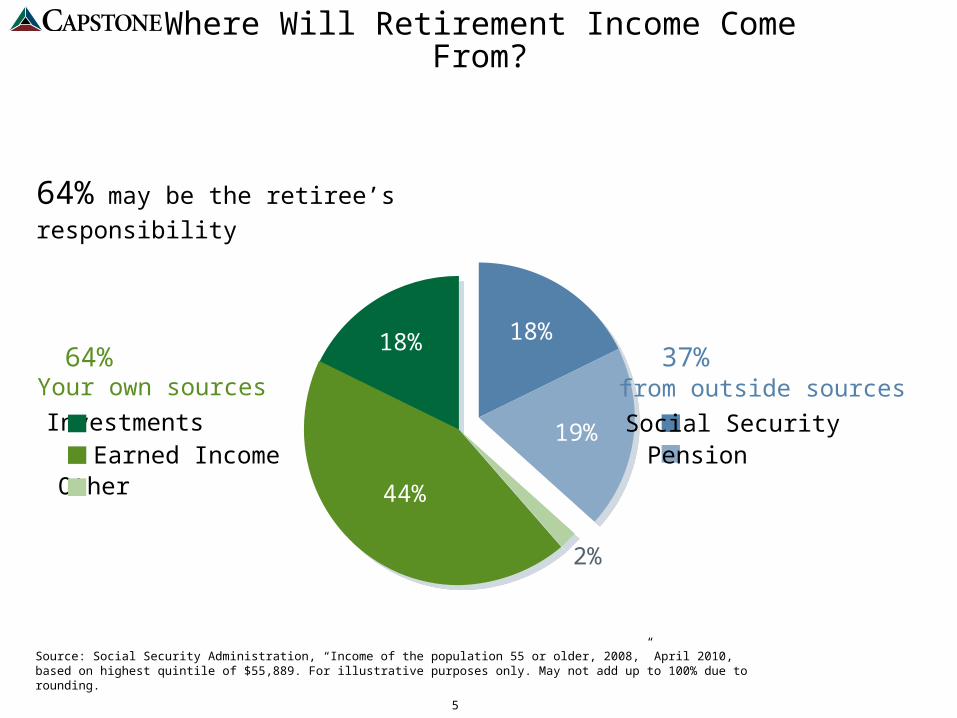
Where Will Retirement Income Come From?
Source: Social Security Administration, “Income of the population 55 or older, 2008,” April 2010, based on highest quintile of $55,889. For illustrative purposes only. May not add up to 100% due to rounding.
64% may be the retiree’s responsibility
18%64%
2%
44%
InvestmentsEarned Income
Other
Your own sources37%
18%
19% Social SecurityPension
from outside sources

6
Source: Annuity 2000 Mortality Table; Society of Actuaries. Figure assumes a person is in good health.
65 70 75 80 85 90 95 100
50% chance of one spouse surviving
25% chance of one spouse surviving
Male age 65
Female age 65
Couple (both age 65)
85
92
88
94
92
97
7
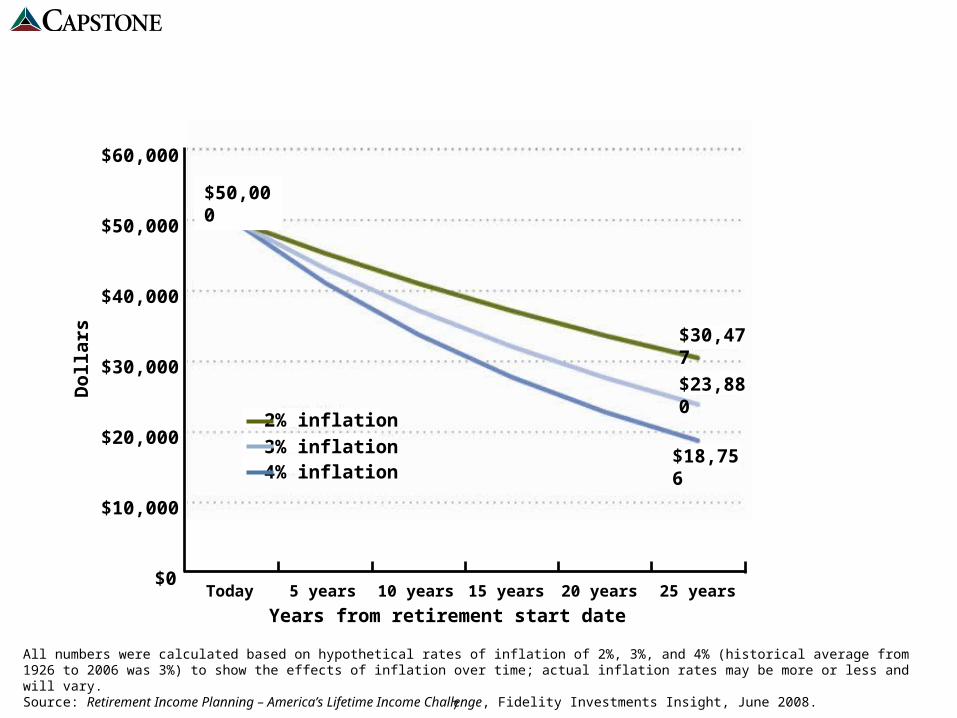
All numbers were calculated based on hypothetical rates of inflation of 2%, 3%, and 4% (historical average from 1926 to 2006 was 3%) to show the effects of inflation over time; actual inflation rates may be more or less and will vary.Source: Retirement Income Planning – America’s Lifetime Income Challenge, Fidelity Investments Insight, June 2008.
Dol
lars
$60,000
$50,000
$40,000
$30,000
$20,000
$10,000
$0Today 5 years 10 years 15 years 20 years 25 years
Years from retirement start date
$50,000
$18,756
$23,880
$30,477
2% inflation
3% inflation4% inflation
8
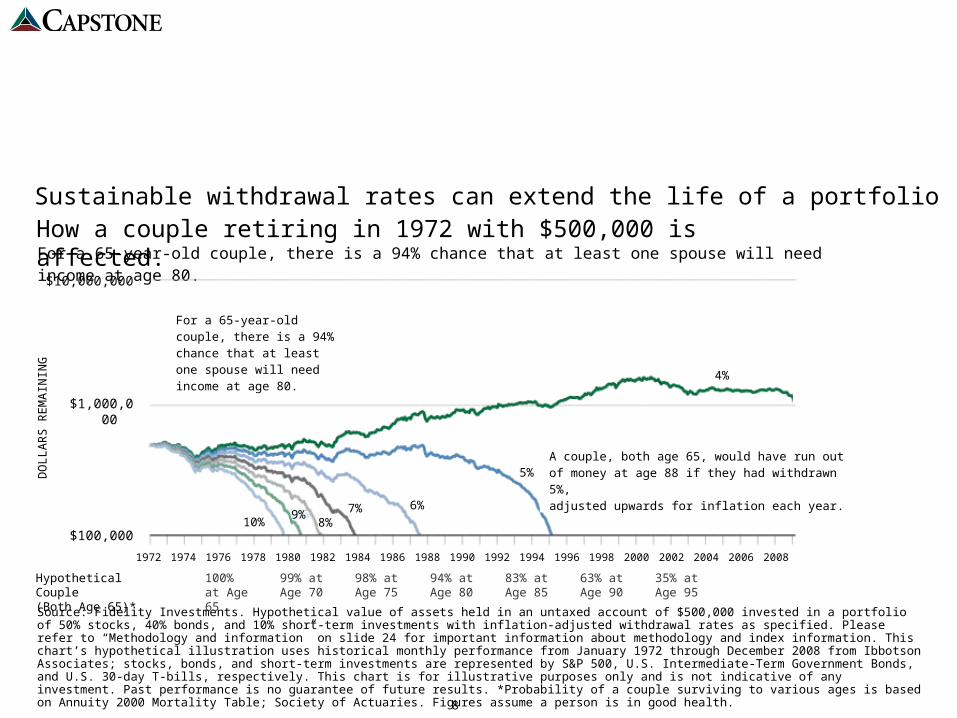
Sustainable withdrawal rates can extend the life of a portfolioHow a couple retiring in 1972 with $500,000 is affected.For a 65-year-old couple, there is a 94% chance that at least one spouse will need income at age 80.
Source: Fidelity Investments. Hypothetical value of assets held in an untaxed account of $500,000 invested in a portfolio of 50% stocks, 40% bonds, and 10% short-term investments with inflation-adjusted withdrawal rates as specified. Please refer to “Methodology and information” on slide 24 for important information about methodology and index information. This chart’s hypothetical illustration uses historical monthly performance from January 1972 through December 2008 from Ibbotson Associates; stocks, bonds, and short-term investments are represented by S&P 500, U.S. Intermediate-Term Government Bonds, and U.S. 30-day T-bills, respectively. This chart is for illustrative purposes only and is not indicative of any investment. Past performance is no guarantee of future results. *Probability of a couple surviving to various ages is based on Annuity 2000 Mortality Table; Society of Actuaries. Figures assume a person is in good health.
4%
5%
6%7%8%
9%
100% at Age 65
99% at Age 70
98% at Age 75
94% at Age 80
83% at Age 85
63% at Age 90
35% at Age 95
A couple, both age 65, would have run out of money at age 88 if they had withdrawn 5%,adjusted upwards for inflation each year.
$100,000
DO
LL
AR
S R
EM
AIN
ING
$1,000,000
Hypothetical Couple(Both Age 65)*
$10,000,000
For a 65-year-old couple, there is a 94% chance that at least one spouse will need income at age 80.
1972 1974 1976 1978 1980 1982 1984 1986 1988 1990 1992 1994 1996 1998 2000 2002 2004 2006 2008
10%
9
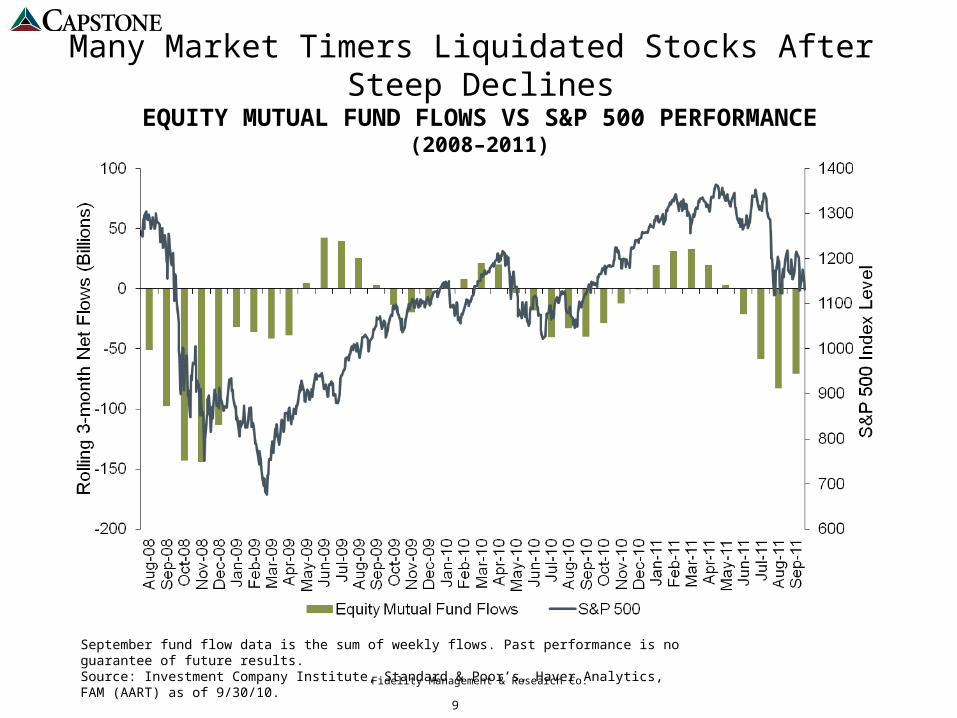
Many Market Timers Liquidated Stocks After Steep Declines
Fidelity Management & Research Co.
September fund flow data is the sum of weekly flows. Past performance is no guarantee of future results. Source: Investment Company Institute, Standard & Poor’s, Haver Analytics, FAM (AART) as of 9/30/10.
EQUITY MUTUAL FUND FLOWS VS S&P 500 PERFORMANCE(2008–2011)
10
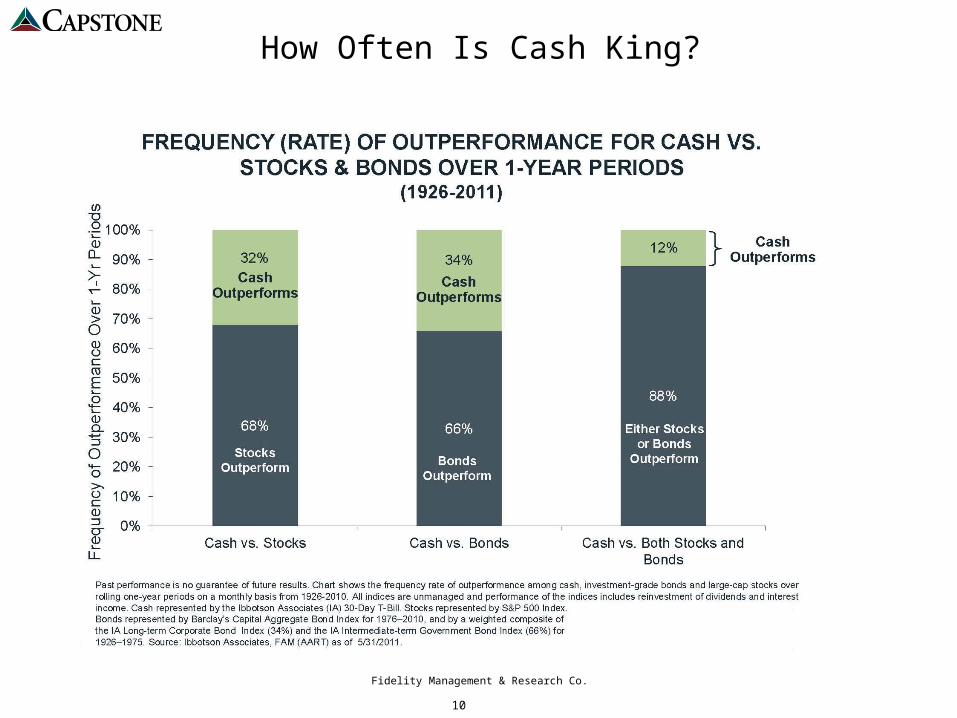
How Often Is Cash King?
Fidelity Management & Research Co.
11
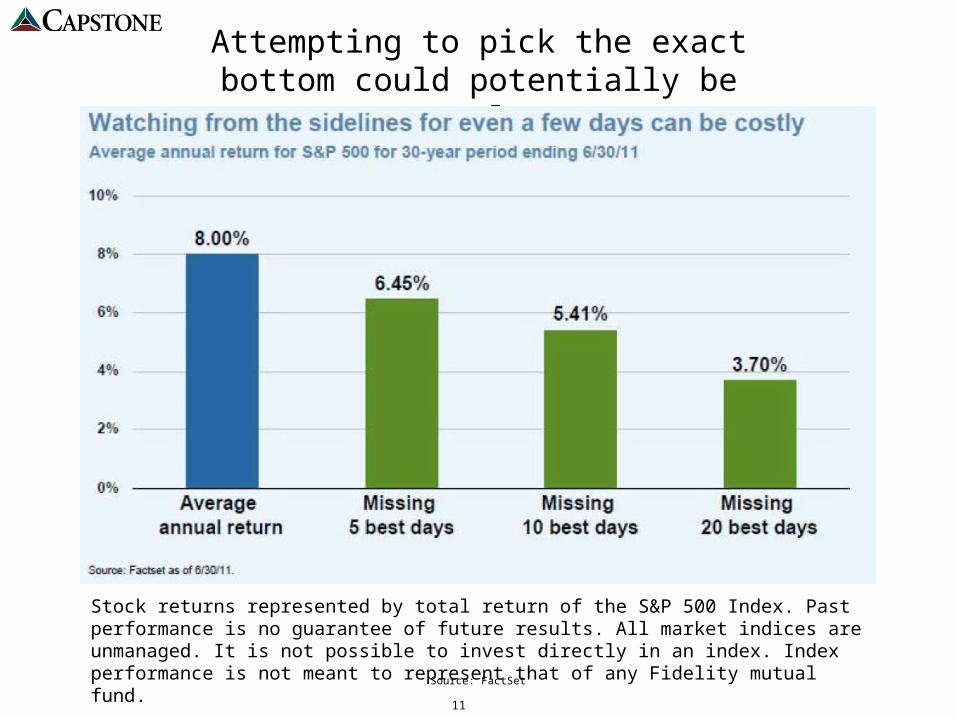
Source: FactSet
Attempting to pick the exact bottom could potentially be costly.
Stock returns represented by total return of the S&P 500 Index. Past performance is no guarantee of future results. All market indices are unmanaged. It is not possible to invest directly in an index. Index performance is not meant to represent that of any Fidelity mutual fund.
12
Current Income Portfolio “CIP”
13
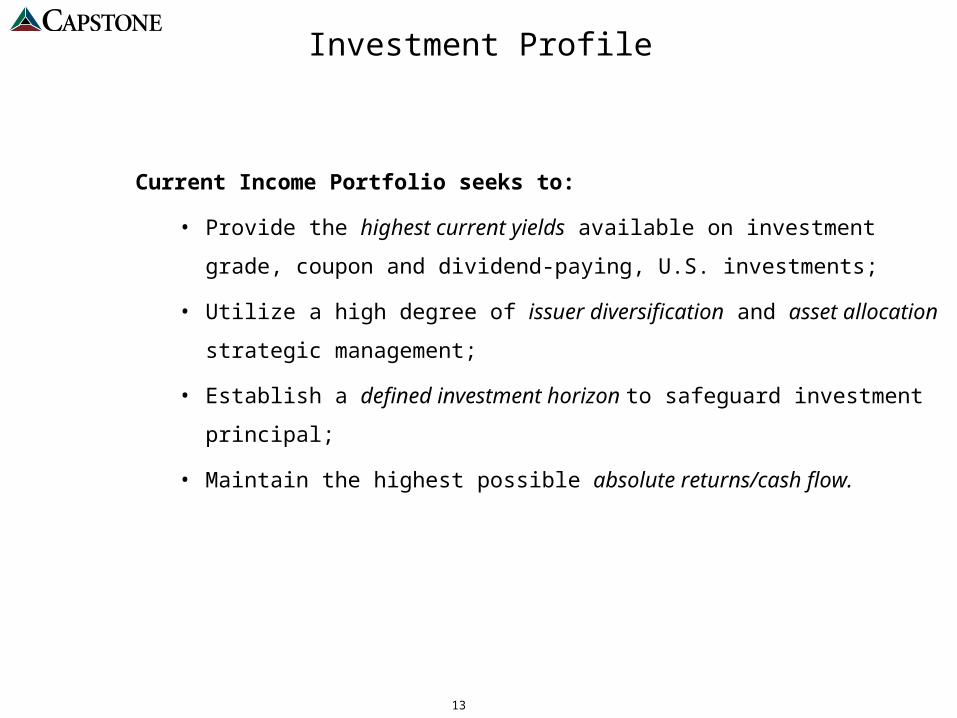
Investment Profile
Current Income Portfolio seeks to:
• Provide the highest current yields available on investment grade, coupon
and dividend-paying, U.S. investments;
• Utilize a high degree of issuer diversification and asset allocation strategic
management;
• Establish a defined investment horizon to safeguard investment principal;
• Maintain the highest possible absolute returns/cash flow.
14
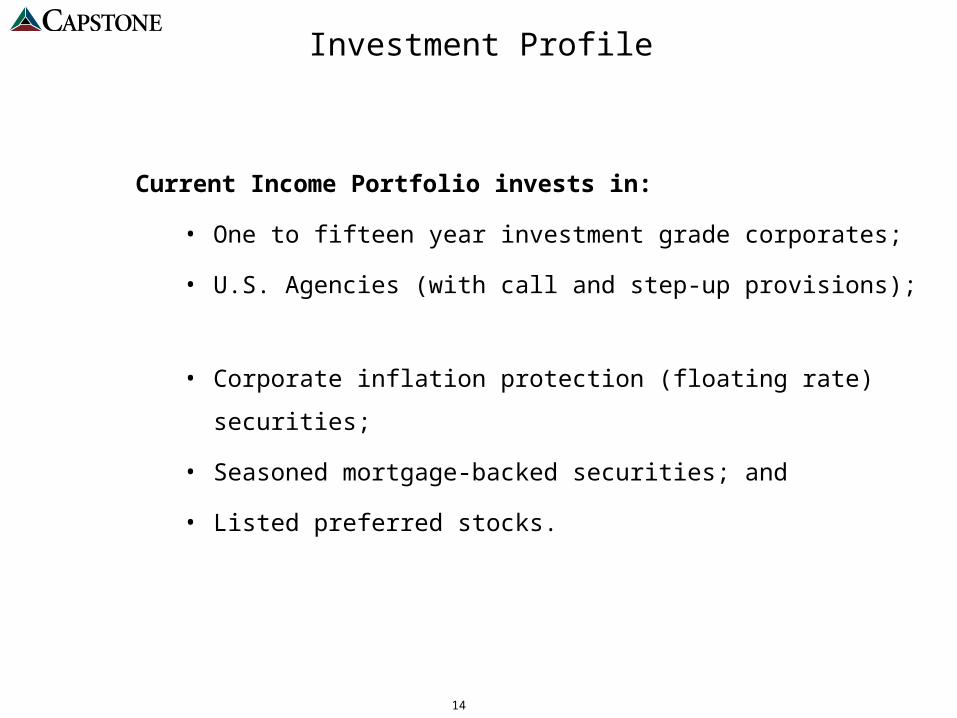
Current Income Portfolio invests in:
• One to fifteen year investment grade corporates;
• U.S. Agencies (with call and step-up provisions);
• Corporate inflation protection (floating rate) securities;
• Seasoned mortgage-backed securities; and
• Listed preferred stocks.
Investment Profile
15
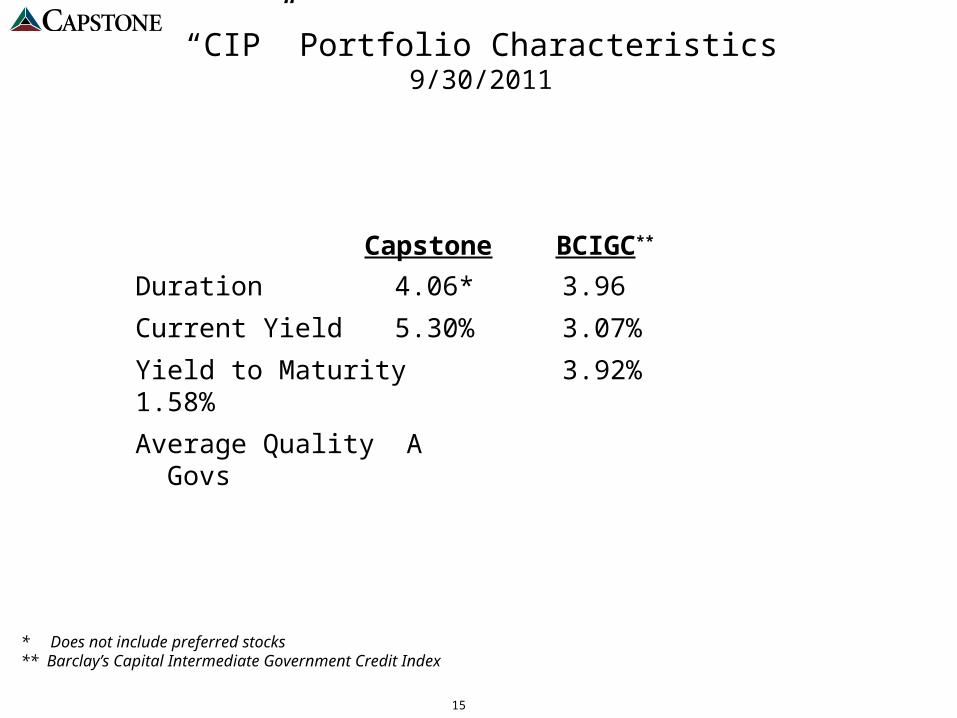
“CIP” Portfolio Characteristics9/30/2011
* Does not include preferred stocks** Barclay’s Capital Intermediate Government Credit Index
Capstone BCIGC**
Duration 4.06* 3.96
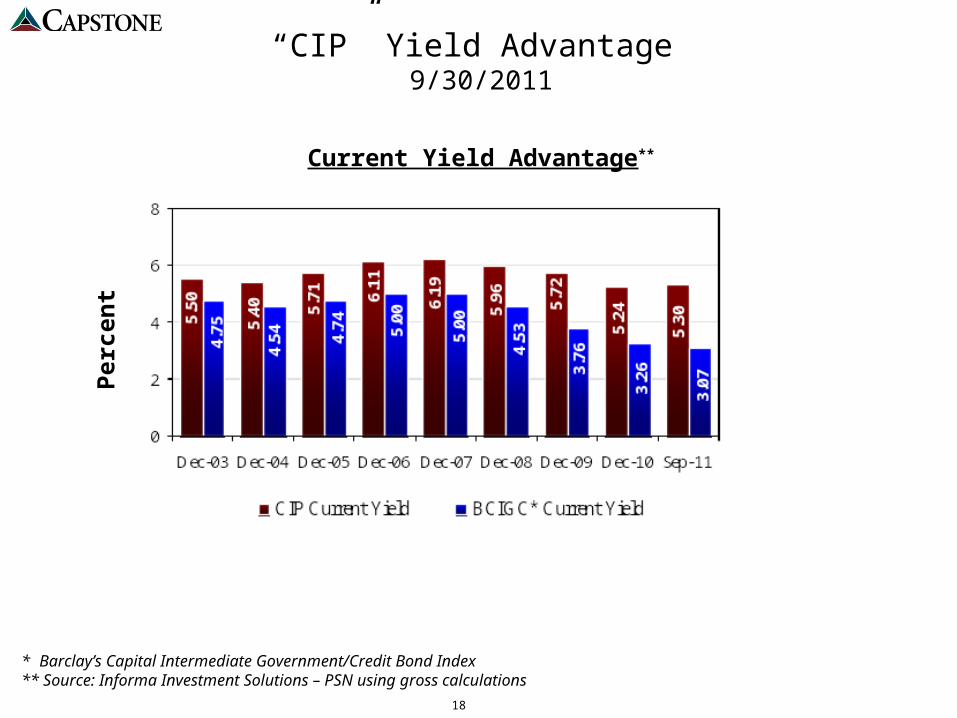
Current Yield 5.30% 3.07%
Yield to Maturity 3.92% 1.58%
Average Quality A Govs
16
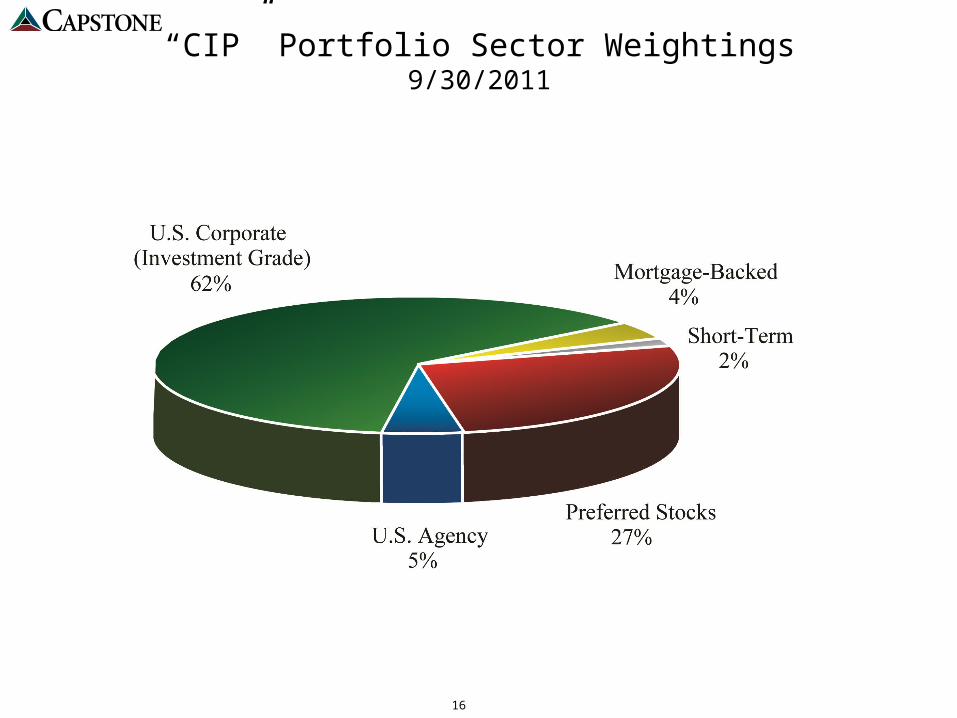
“CIP” Portfolio Sector Weightings9/30/2011
17
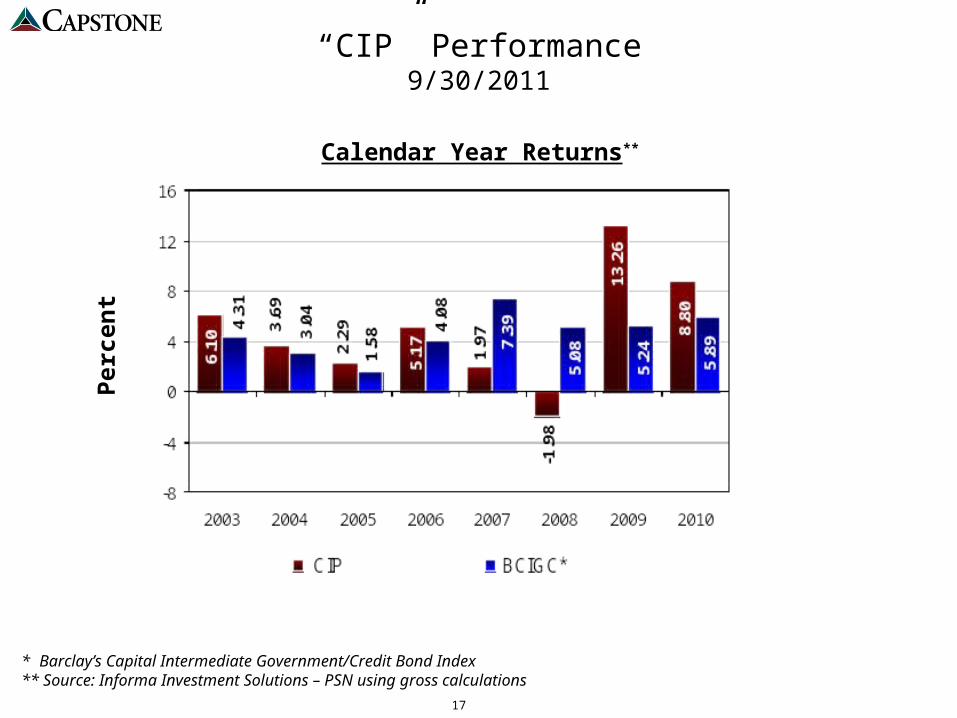
“CIP” Performance9/30/2011
* Barclay’s Capital Intermediate Government/Credit Bond Index** Source: Informa Investment Solutions – PSN using gross calculations
Per
cent
Calendar Year Returns**
18
“CIP” Yield Advantage 9/30/2011
Per
cent
Current Yield Advantage**
* Barclay’s Capital Intermediate Government/Credit Bond Index** Source: Informa Investment Solutions – PSN using gross calculations
19
Global Equity Income
20
Global Equity Income Goals And Strategy
Objective:
Seeks to generate current income and long-term growth of capital.
The Global Equity Income Strategy offers investors a privately managed stock portfolio designed to provide dividend income, the potential for long-term capital appreciation and exposure to International Markets.
Investment Universe
S&P 1500S&P ADR
21
Global Equity Income Strategy
In addition to income, dividend paying stocks provide the portfolio with these positive attributes:
Risk Reduction
- Dividend paying stocks are less volatile than non dividend paying stocks and provide investors with steady cash flow.
Dividends are an important sign of corporate strength
- Companies must generate consistent significant earnings in order to pay dividends- Dividend growth is a signal of improving profitability- Dividend reductions signal corporate distress
Dividend policy imposes discipline on management
- Companies are reluctant to change dividend policy due to signaling effects- Dividends force a discipline on capital spending reducing the probability of unwise investments
22
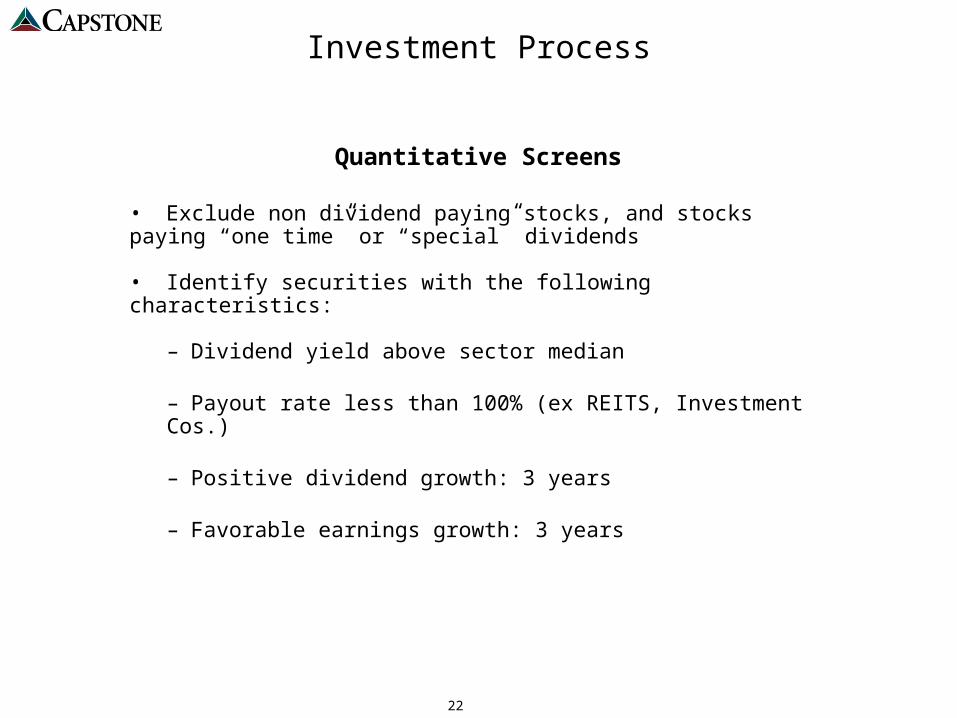
Investment Process
• Exclude non dividend paying stocks, and stocks paying “one time” or “special” dividends • Identify securities with the following characteristics:
– Dividend yield above sector median
– Payout rate less than 100% (ex REITS, Investment Cos.)
– Positive dividend growth: 3 years
– Favorable earnings growth: 3 years
Quantitative Screens
23
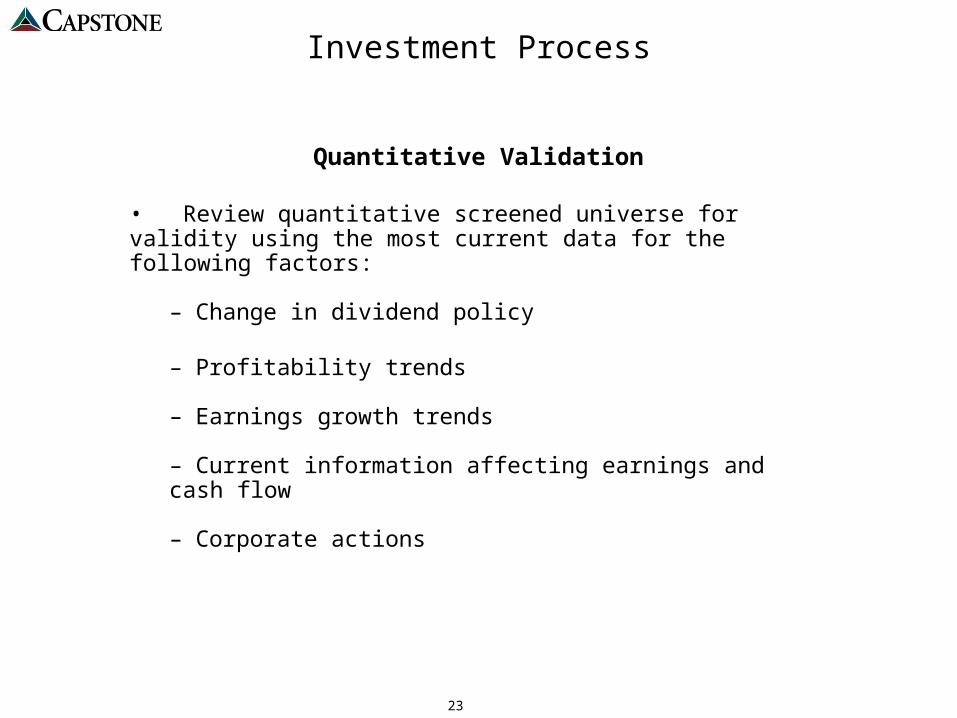
Investment Process
• Review quantitative screened universe for validity using the most current data for the following factors:
– Change in dividend policy
– Profitability trends – Earnings growth trends – Current information affecting earnings and cash flow – Corporate actions
Quantitative Validation
24
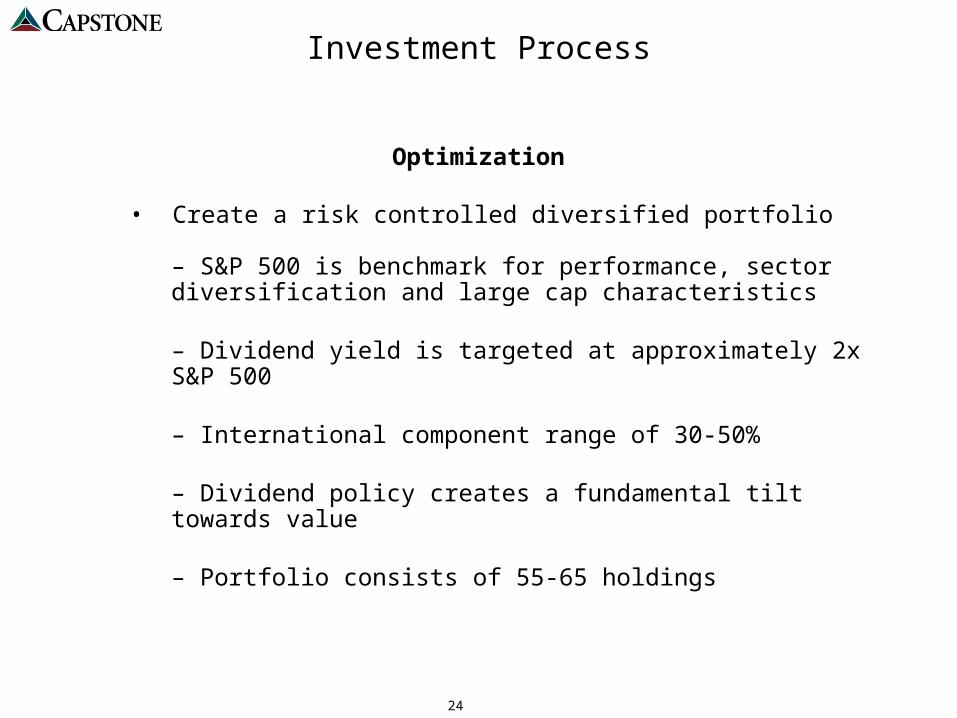
Investment Process
• Create a risk controlled diversified portfolio
– S&P 500 is benchmark for performance, sector diversification and large cap characteristics
– Dividend yield is targeted at approximately 2x S&P 500
– International component range of 30-50%
– Dividend policy creates a fundamental tilt towards value
– Portfolio consists of 55-65 holdings
Optimization
25
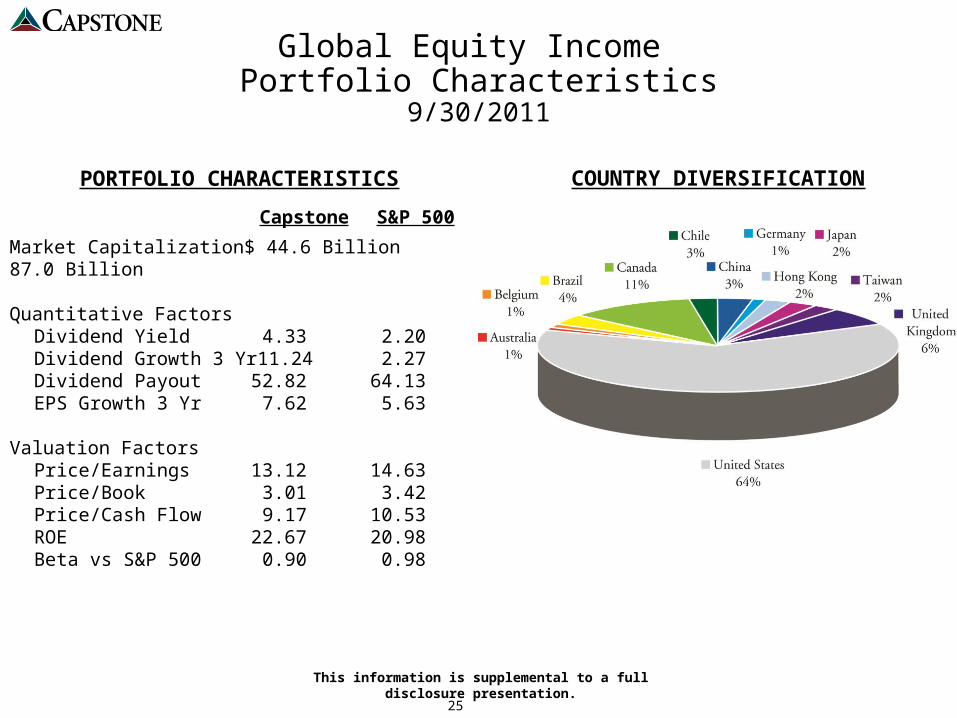
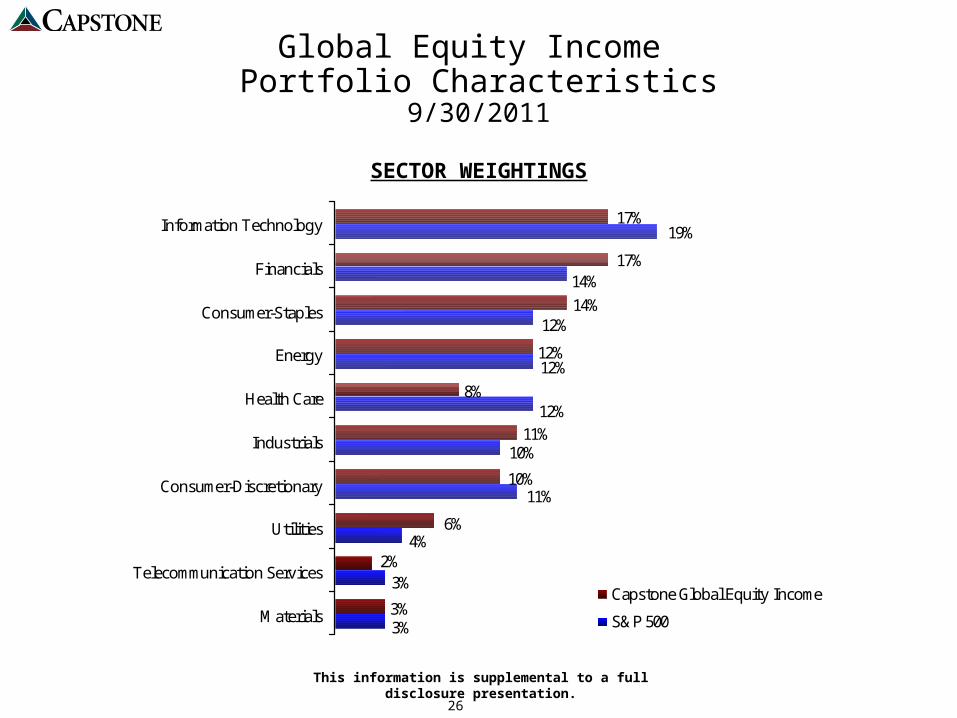
Global Equity Income Portfolio Characteristics
9/30/2011
This information is supplemental to a full disclosure presentation.
COUNTRY DIVERSIFICATION
Market Capitalization $ 44.6 Billion $ 87.0 Billion
Quantitative FactorsDividend Yield 4.33 2.20Dividend Growth 3 Yr 11.24 2.27Dividend Payout 52.82 64.13EPS Growth 3 Yr 7.62 5.63
Valuation FactorsPrice/Earnings 13.12 14.63Price/Book 3.01 3.42Price/Cash Flow 9.17 10.53ROE 22.67 20.98Beta vs S&P 500 0.90 0.98
PORTFOLIO CHARACTERISTICS
Capstone S&P 500
26
Global Equity Income Portfolio Characteristics
9/30/2011
SECTOR WEIGHTINGS
3%
10%
11%
19%
4%
3%
12%
12%
12%
3%
14%
2%
17%
14%
6%
10%
12%
17%
11%
8%
Materials
Telecommunication Services
Utilities
Consumer-Discretionary
Industrials
Health Care
Energy
Consumer-Staples
Financials
Information Technology
Capstone Global Equity Income
S&P 500
This information is supplemental to a full disclosure presentation.
27
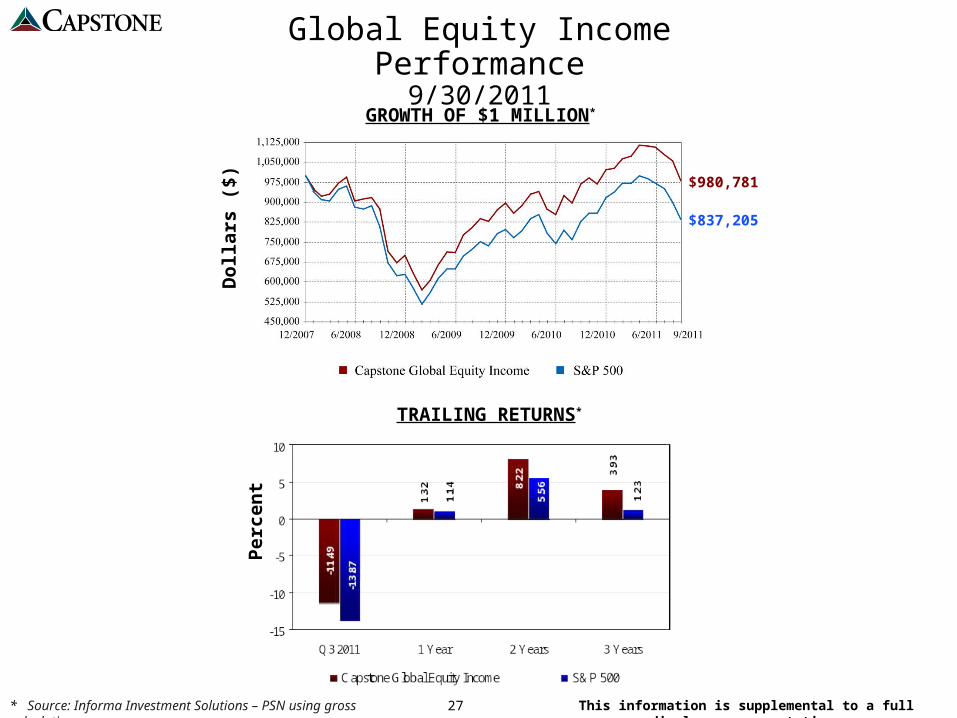
Global Equity Income Performance9/30/2011
* Source: Informa Investment Solutions – PSN using gross calculations
GROWTH OF $1 MILLION*
Per
cen
t
$837,205
$980,781
Dol
lars
($)
TRAILING RETURNS*
This information is supplemental to a full disclosure presentation.
28
Why Capstone ?
• Disciplined Investment Process
• Consistently Applied Investment Process
• Customization
• Active Client Communications

29
30
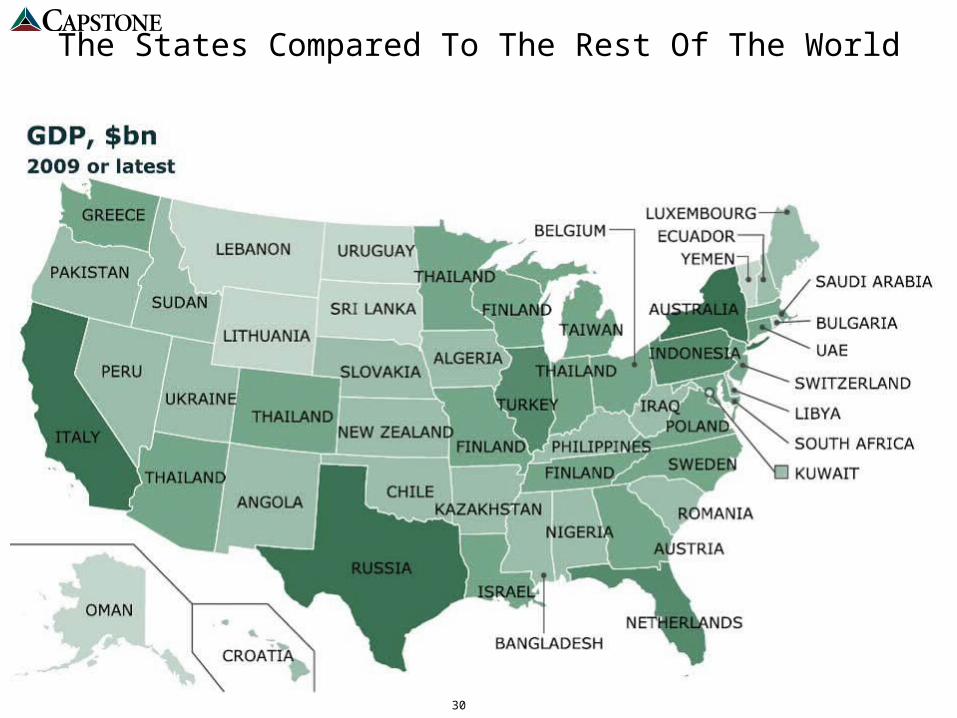
The States Compared To The Rest Of The World

3700 West Sam Houston Parkway South, Suite 250Houston, Texas 77042
(713) 260-9000 / (800) 262-6631www.capstonefinancial.com
©2011