Embed Size (px)
Citation preview
3M Health Information Systems
APR-DRGs: A Practical Update
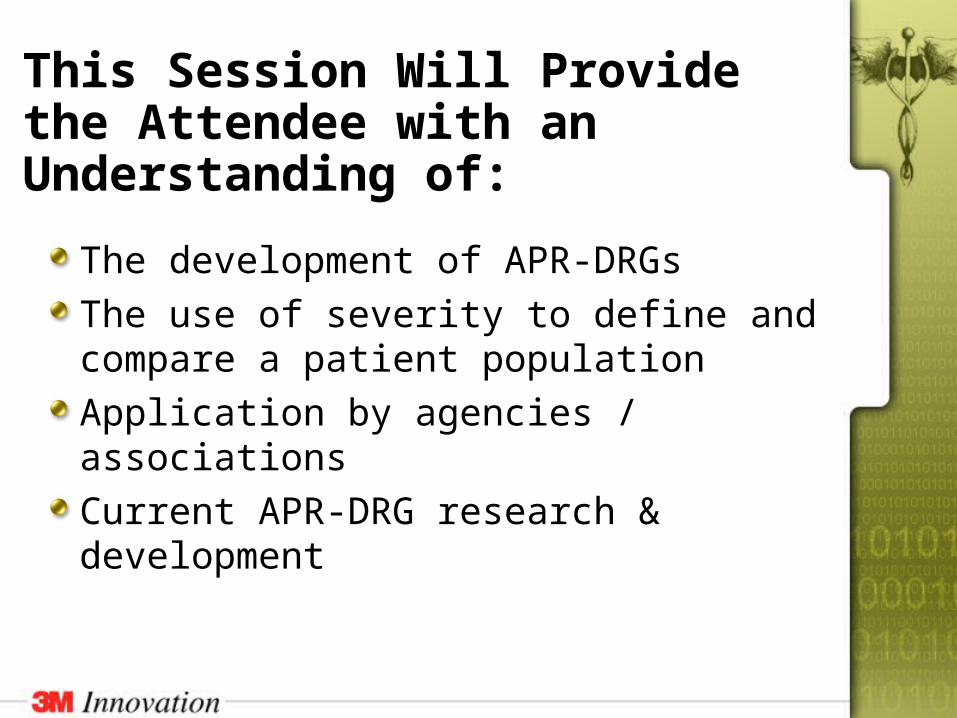
This Session Will Provide the Attendee with an Understanding of:
The development of APR-DRGs
The use of severity to define and compare a patient population
Application by agencies / associations
Current APR-DRG research & development
APR-DRGsAPR-DRGs
A tool to help analyze and report severity adjusted inpatient data
Developed by Healthcare Professionals for Healthcare Professionals
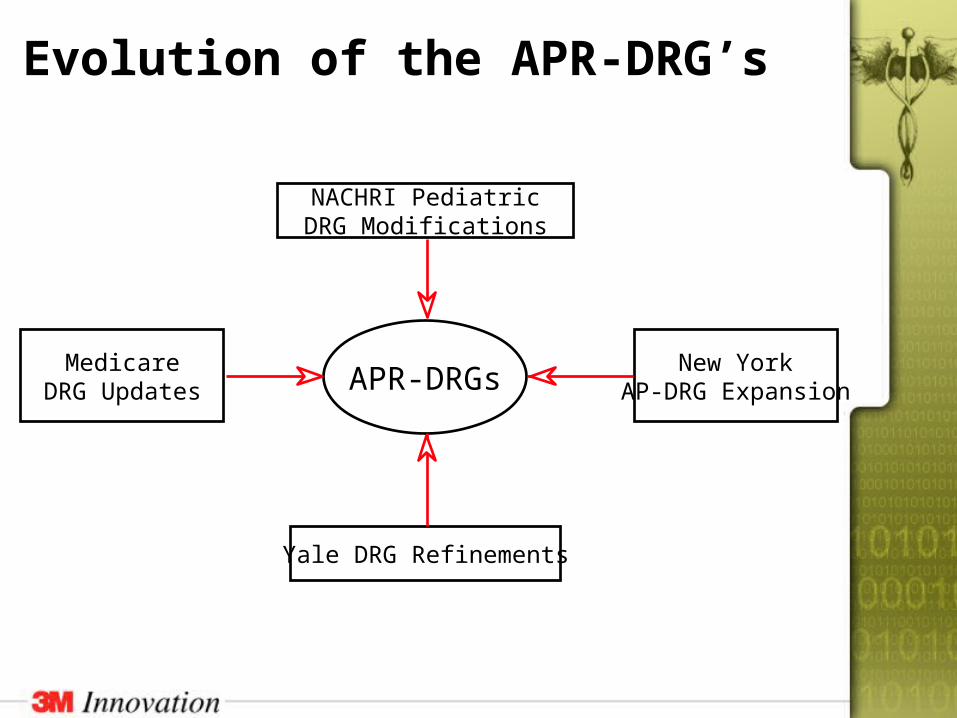
NACHRI PediatricDRG Modifications
MedicareDRG Updates
New YorkAP-DRG Expansion
Yale DRG Refinements
APR-DRGs
Evolution of the APR-DRG’s
The Use Of Inpatient Claims Data For Outcomes / Profiling studies
There are advantages to using of inpatient claims data for QI & UM management purposes:
With the implementation of Diagnosis Related Groups (DRGs) there is an extended period of experience with inpatient coding
As there are significant financial issues at stake for the hospital, there typically is considerable effort to code as accurately as possible
3M™ APR-DRG Assignment is Driven by:
Principal diagnosis
Procedures performed
All secondary diagnoses
Age, sex
Discharge disposition
DefinitionsDefinitions
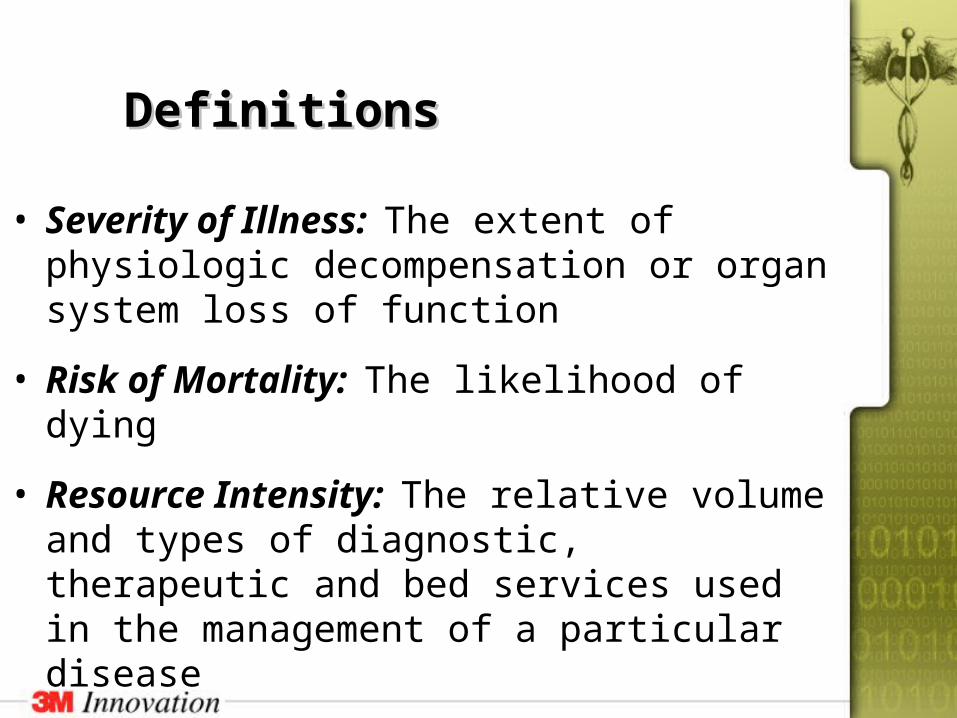
• Severity of Illness: The extent of physiologic decompensation or organ system loss of function
• Risk of Mortality: The likelihood of dying
• Resource Intensity: The relative volume and types of diagnostic, therapeutic and bed services used in the management of a particular disease
APR-DRGAPR-DRG DescriptorsDescriptors
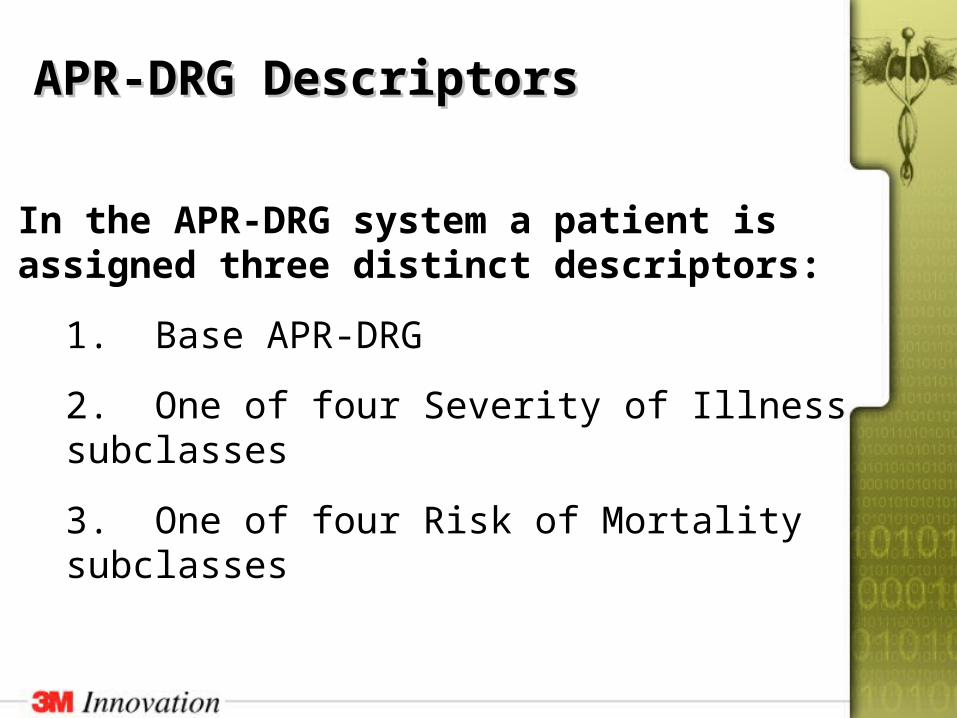
In the APR-DRG system a patient is assigned three distinct descriptors:
1. Base APR-DRG
2. One of four Severity of Illness subclasses
3. One of four Risk of Mortality subclasses
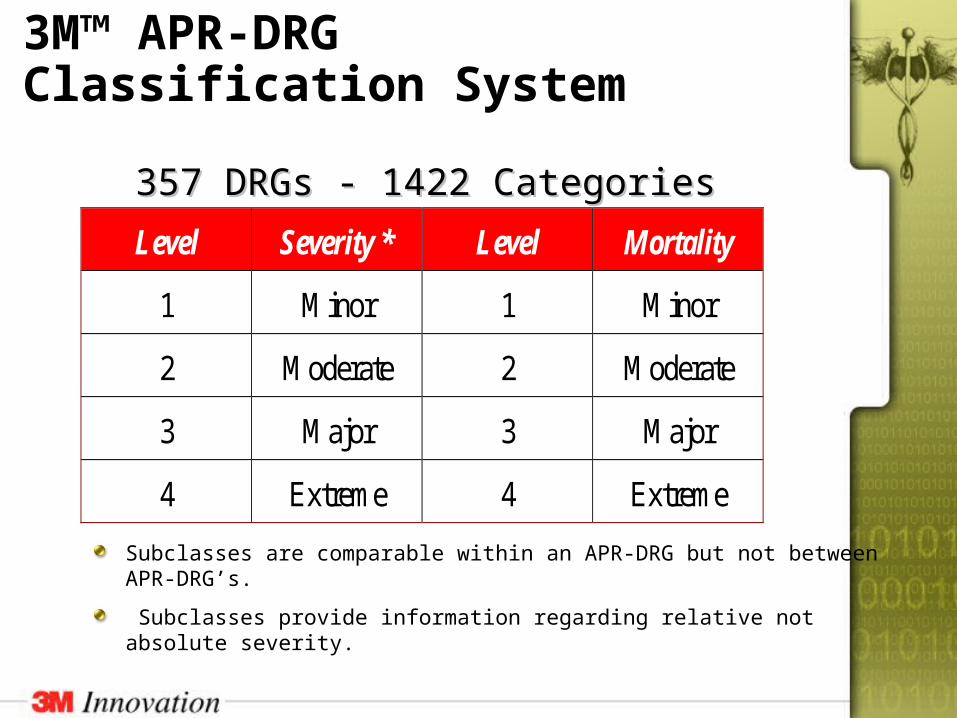
357 DRGs - 1422 Categories357 DRGs - 1422 Categories
3M™ APR-DRG Classification System
Subclasses are comparable within an APR-DRG but not betweenAPR-DRG’s.
Subclasses provide information regarding relative not absolute severity.
Level Severity * Level Mortality
1 Minor 1 Minor
2 Moderate 2 Moderate
3 Major 3 Major
4 Extreme 4 Extreme
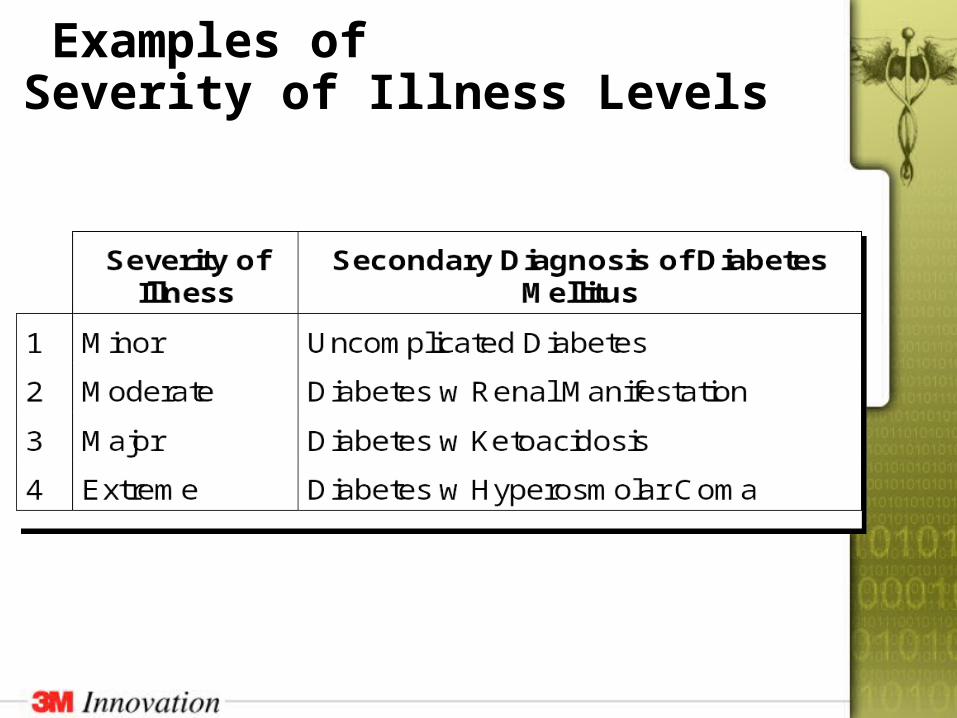
Examples of Severity of Illness Levels
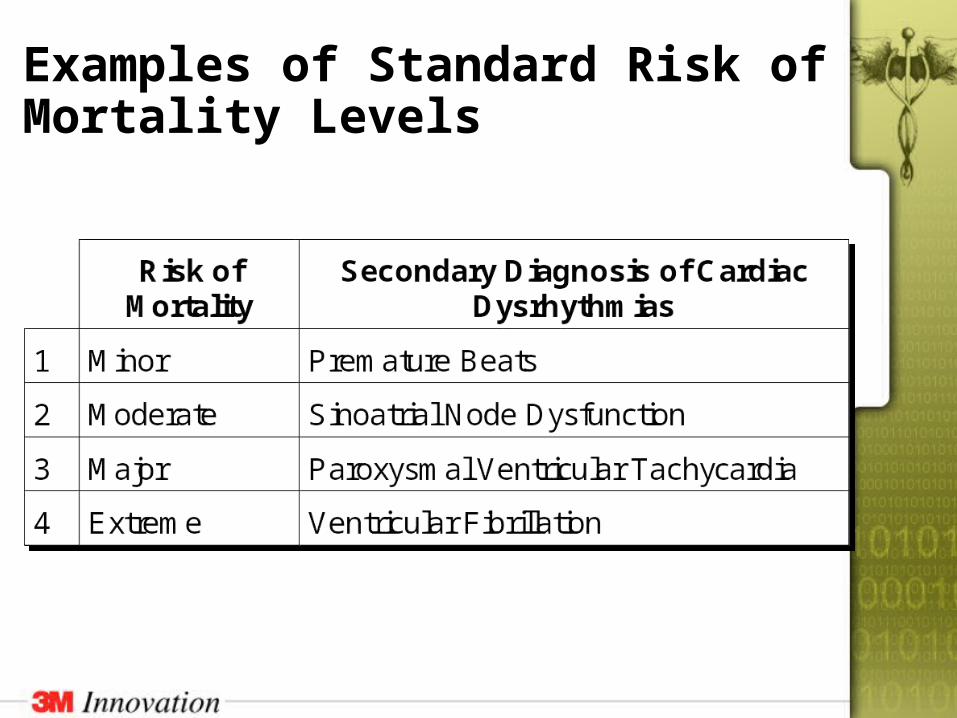
Examples of Standard Risk of Mortality Levels
APR-DRGs Are A Categorical Clinical Model
APR-DRGs are a clinical model that has been extensively refined with historical data
Different clinical models are developed for 355 different types of patients
Clinical models verified with data
Final decisions were always clinical
APR-DRGs are a Categorical Clinical Model (Cont’d.)
Expected values are computed using APR-DRG norms
Norms are average values of resource use or mortality for each APR-DRG subclass
An extensive set of APR-DRG norms are produced and updated annually
National / Regional / Hospital Type / Payer Specific
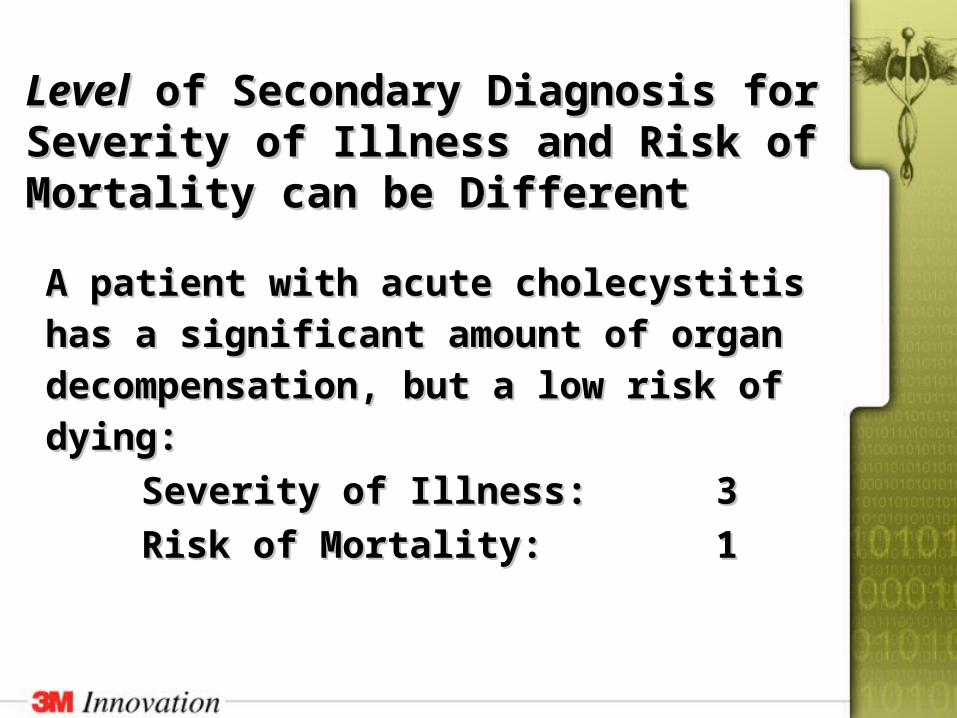
LevelLevel of Secondary Diagnosis for of Secondary Diagnosis for Severity of Illness and Risk of Mortality Severity of Illness and Risk of Mortality can be Differentcan be Different
A patient with acute cholecystitis has a A patient with acute cholecystitis has a
significant amount of organ decompensation, significant amount of organ decompensation,
but a low risk of dying:but a low risk of dying:
Severity of Illness:Severity of Illness: 33
Risk of Mortality:Risk of Mortality: 11
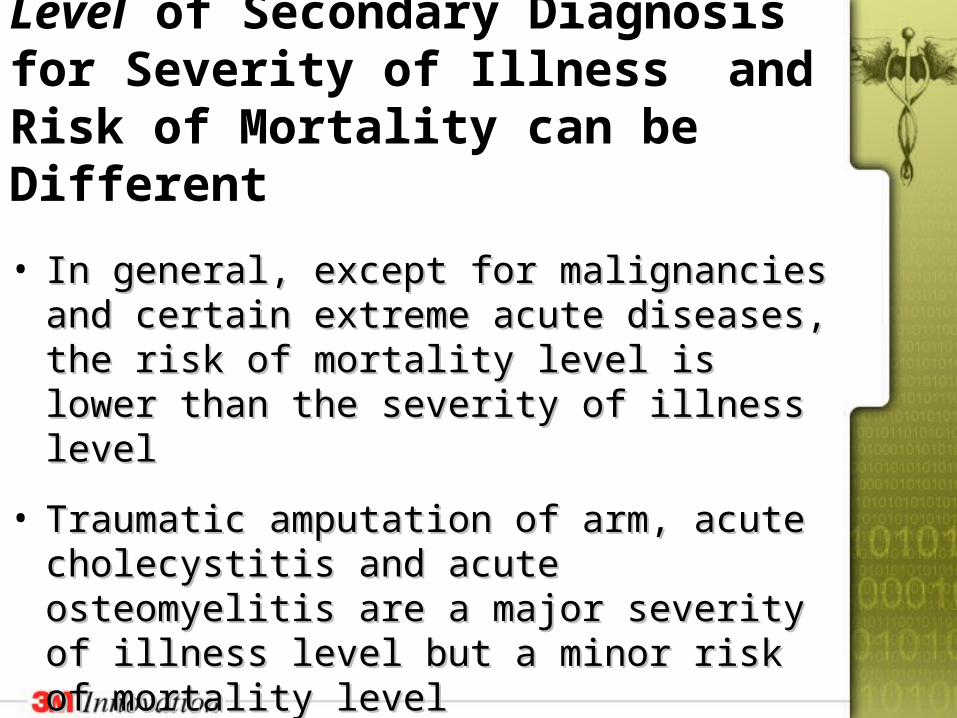
Level of Secondary Diagnosis for Severity of Illness and Risk of Mortality can be Different
• In general, except for malignancies and certain In general, except for malignancies and certain extreme acute diseases, the risk of mortality extreme acute diseases, the risk of mortality level is lower than the severity of illness levellevel is lower than the severity of illness level
• Traumatic amputation of arm, acute Traumatic amputation of arm, acute cholecystitis and acute osteomyelitis are a cholecystitis and acute osteomyelitis are a major severity of illness level but a minor risk of major severity of illness level but a minor risk of mortality levelmortality level
• Death is a relatively rare outcomeDeath is a relatively rare outcome
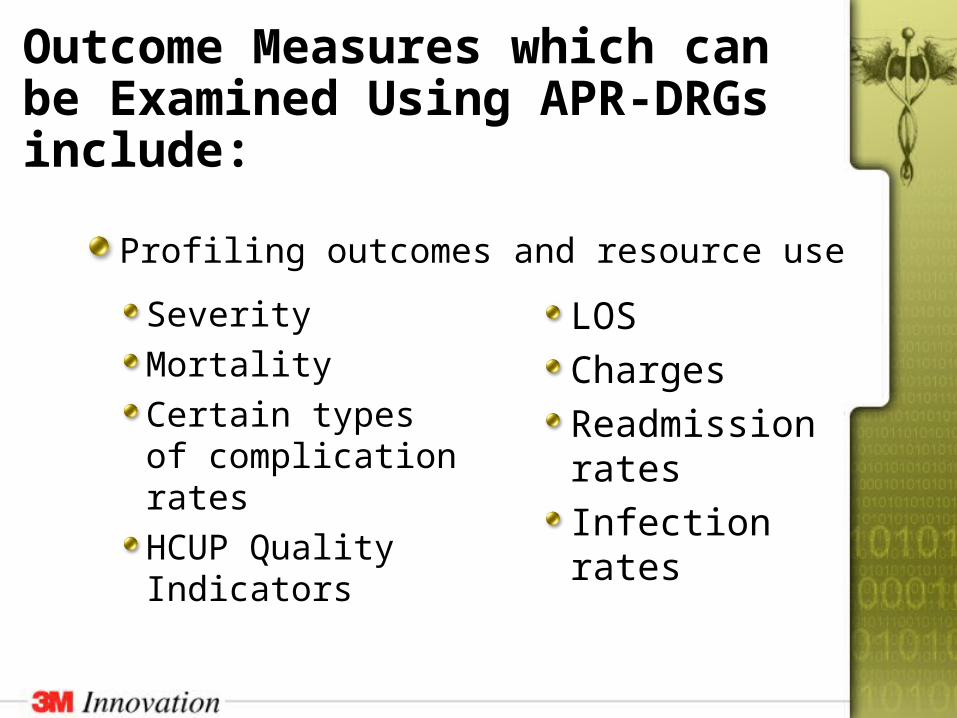
Outcome Measures which can be Examined Using APR-DRGs include:
Severity
Mortality
Certain types of complication rates
HCUP Quality Indicators
LOS
Charges
Readmission rates
Infection rates
Profiling outcomes and resource use
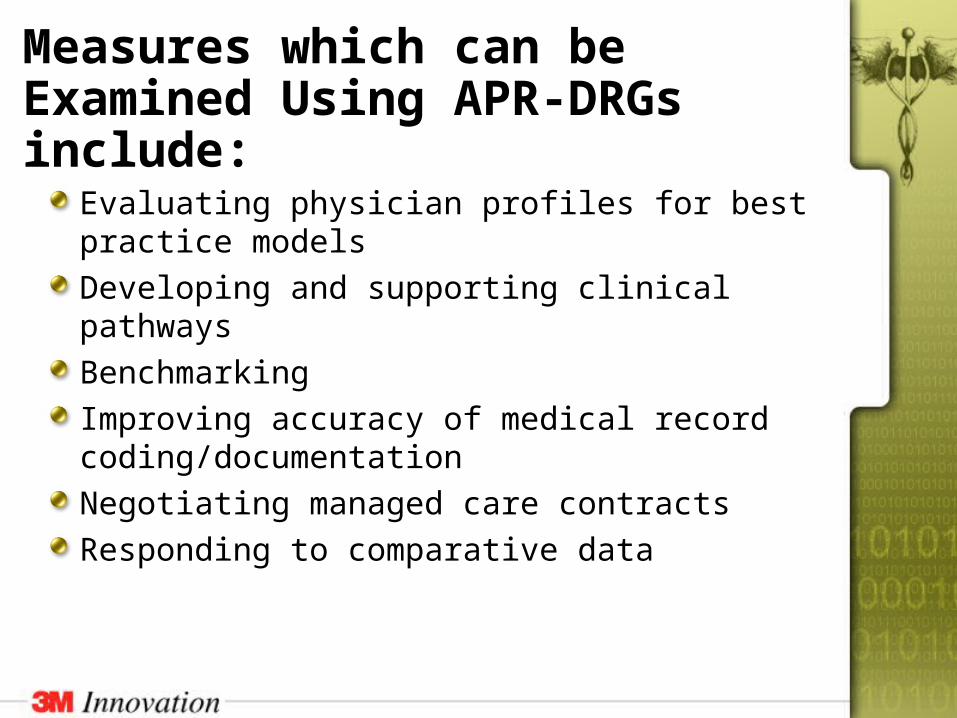
Measures which can be Examined Using APR-DRGs include:
Evaluating physician profiles for best practice models
Developing and supporting clinical pathways
Benchmarking
Improving accuracy of medical record coding/documentation
Negotiating managed care contracts
Responding to comparative data
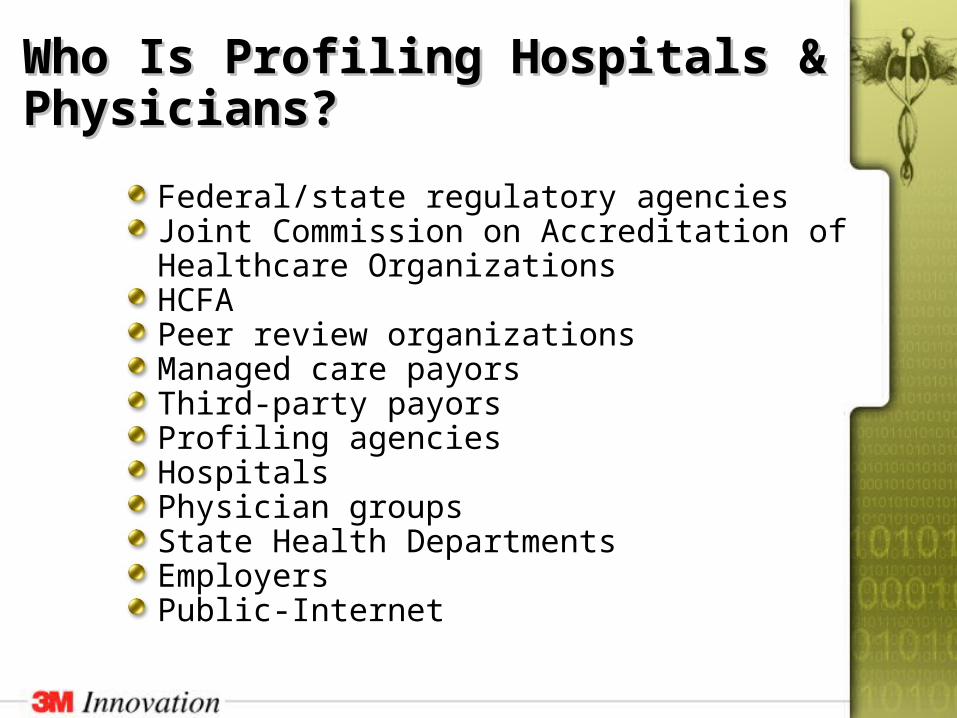
Who Is Profiling Hospitals & Who Is Profiling Hospitals & Physicians?Physicians?
Federal/state regulatory agenciesJoint Commission on Accreditation of Healthcare OrganizationsHCFAPeer review organizationsManaged care payorsThird-party payorsProfiling agenciesHospitalsPhysician groupsState Health DepartmentsEmployersPublic-Internet
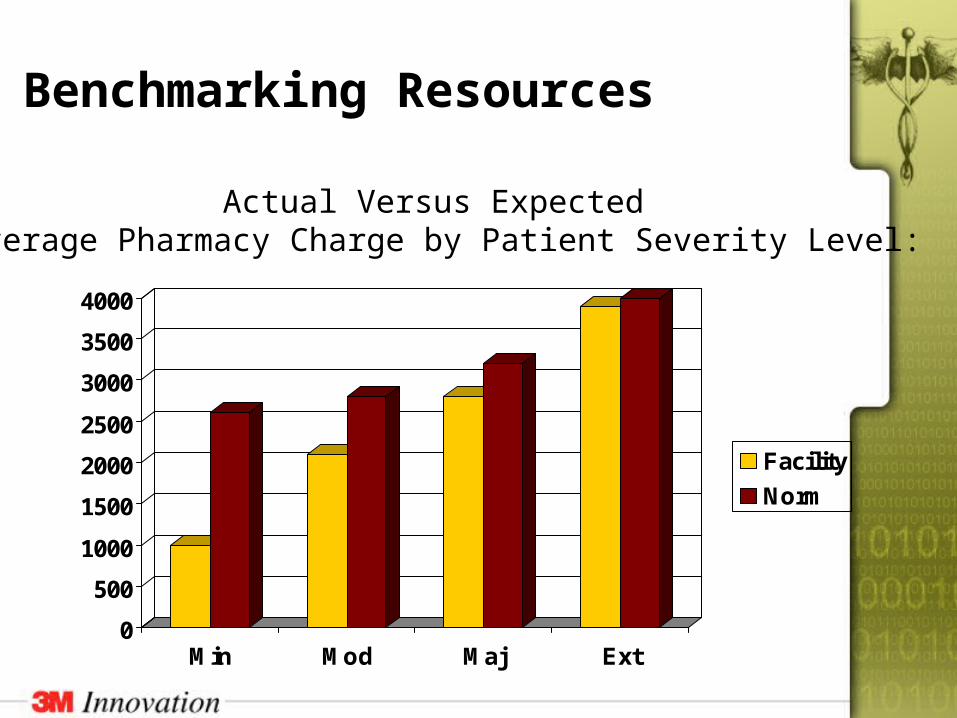
Actual Versus Expected Average Pharmacy Charge by Patient Severity Level:
Benchmarking Resources
0
500
1000
1500
2000
2500
3000
3500
4000
Min Mod Maj Ext
Facility
Norm
Determining Severity / Mortality Determining Severity / Mortality SubclassSubclass
• Determining the of subclass values uses a Determining the of subclass values uses a three phase processthree phase process
• The base APR-DRGs for severity of illness The base APR-DRGs for severity of illness and risk of mortality are the sameand risk of mortality are the same
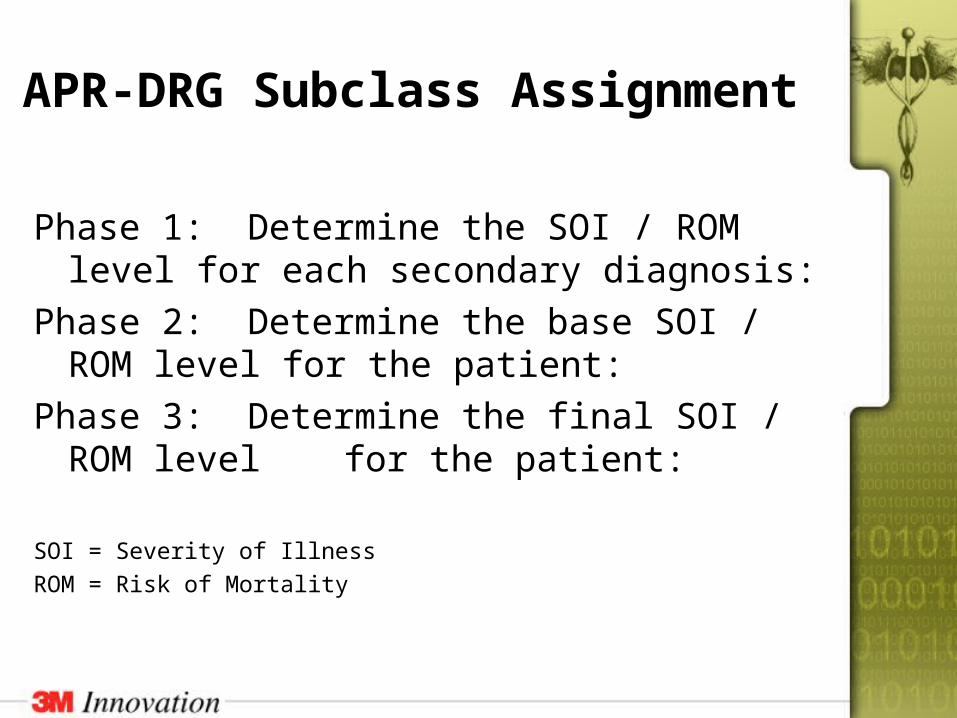
APR-DRG Subclass Assignment
Phase 1: Determine the SOI / ROM level for each secondary diagnosis:
Phase 2: Determine the base SOI / ROM level for the patient:
Phase 3: Determine the final SOI / ROM level for the patient:
SOI = Severity of Illness
ROM = Risk of Mortality
Number of APR-DRGsNumber of APR-DRGs
• There are 355 base APR-DRGsThere are 355 base APR-DRGs
• Each APR-DRG is subdivided into four severity Each APR-DRG is subdivided into four severity of illness subclasses and four risk of mortality of illness subclasses and four risk of mortality subclassessubclasses
• In addition there are two error APR-DRGs In addition there are two error APR-DRGs (955,956) that are not subdivided into (955,956) that are not subdivided into subclassessubclasses
• The combination of APR-DRG and subclasses The combination of APR-DRG and subclasses results in 1422 APR-DRGsresults in 1422 APR-DRGs
APR-DRGs are the Most Widely Used Severity of Illness System
Agency for Research & Quality – HCUP II quality indicatorsSeveral payers evaluating for payment purposes22 states use APR-DRGs for public dissemination of provider profiles1400 individual hospitals have APR-DRG softwareMany major hospital groups and vendors have standardized on APR-DRGs
APR – DRG Clinical Research
Secondary DiagnosisComplication vs
Co-morbidity
UpdatesCode updates every October
Grouper update 2-3 years
Version 19 – scheduled release summer 2001
SummarySummary
• APR-DRGs can be used to identify utilization patterns
• APR-DRGs can be used to begin continuous quality improvement and outcome studies
• APR-DRGs provide a more effective basis for communicating with medical staffs
• APR-DRGs are an effective means of evaluating resources and outcomes data
• APR-DRGs are used in public release of data• APR-DRGs are continually being evaluated
and improved
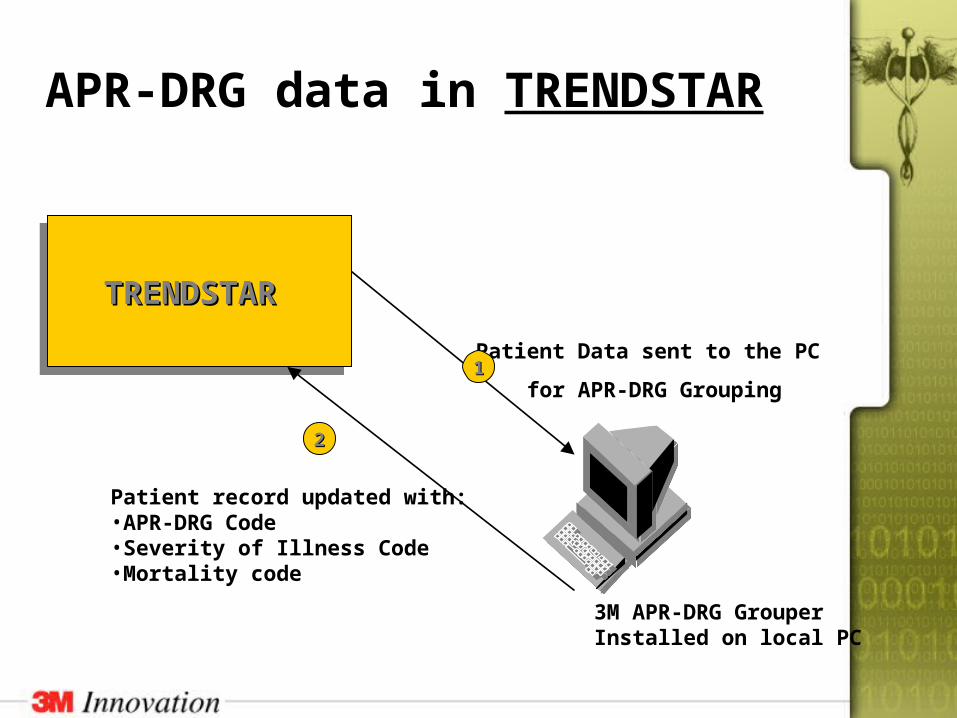
APR-DRG data in TRENDSTAR
TRENDSTARTRENDSTAR TRENDSTARTRENDSTAR
Patient Data sent to the PC
for APR-DRG Grouping
22
11
Patient record updated with: •APR-DRG Code•Severity of Illness Code •Mortality code
3M APR-DRG Grouper Installed on local PC
Uses of APR-DRG Information
Patients adjusted for severity
Comparative data among hospitals
Examine mortality rates based on mortality risk assignment
Development of clinical pathways
Quality improvement initiatives
Contract negotiation
Identification of disproportionate share of major and extreme severity levels
Analysis of net income for APR-DRGs based on severity levels