Embed Size (px)
Citation preview
/ 2
2015/2016
ANNUAL REPORT

3 /
ICSC 2015/2016
ANNUAL REPORT
/ 3
ICSC 2015/2016
ANNUAL REPORT
4 Letter from the CEO
5 Letter from the Chairman
8 ICSC 2015/2016 Overview
20 Financials
4 /
Dear Valued Members,
It is a privilege to serve as only the fourth CEO in ICSC’s history. I was drawn to an industry that is central to economic development and opportunity yet is in the midst of navigating a changing landscape. I was excited about helping to ensure the industry receives the recognition and respect it deserves and maximizing the possibilities presented by the broader technological, demographic, and other shifts taking place. ICSC has an opportunity to lead by collaborating with our members and serving as a strategic partner to our industry. We have made positive progress on that journey over the past seven months and I am enthusiastic about the future.
Since September, we have worked together to develop and begin the implementation of our As One strategy. Our strategic ambition is that “The retail real estate industry is broadly recognized for the integral role it plays in the social, civic, and economic vibrancy of communities across the globe.” This clearly is aspirational; however, it is attainable by focusing on three clear strategic priorities:
1. Pre-eminent Voice – To become recognized as a pre-eminent voice in the marketplace by redefining the role of our industry in the public consciousness through enhanced public relations and advocacy strategies.
2. World Class Service – To serve as a strategic partner to our members by embracing a service mentality in all that we do including the delivery of our numerous programs that focus on networking, research, education, and more.
3. High-Performance Culture – To become best in class by responsibly investing in people, systems, and processes.
ICSC has embarked on an ambitious public relations campaign to tell the story of our industry and its impact. The first step was the development of a new master narrative, or themes, under which we will focus our messaging: The retail real estate industry Builds Communities, Fuels Economies, and Inspires Innovation. Our narrative aims to debunk the misconceptions about the industry and to shape a dialogue with external constituents in the media, analyst community, and in the halls of
government. We’ve had some early wins and will continue to be diligent in making our voice heard for the benefit of our industry.
Last year, nearly 116,000 people attended ICSC meetings around the world. Whether a regional deal making event in the U.S. or an international conference, our programs aspire to meet the needs of our members. With this in mind, we are undertaking critical activities to better serve your interests. We initiated a formal process to measure the quality and effectiveness of our existing events in order to develop best practices for 2017 and beyond. We are reviewing our volunteer leadership structure to simplify and clarify roles and responsibilities and to introduce enhanced training. ICSC is reliant upon, and appreciative of, the thousands of active and passionate volunteers who help drive our success.
Finally, we simplified our organizational structure and recruited several new leaders to ICSC. We realigned our teams under well-defined business verticals including the new area of Membership and Volunteer Engagement, which was established in support of our priority to deliver World Class Service. Over the next year, we will begin the modernization of our operational, legal, and financial processes, systems, and practices to position ICSC to best serve all of you.
While much has been accomplished already, I know we have hard work yet to do. My goal is that you are always as proud of ICSC as I am to lead it. Thank you for your continued support of our vibrant industry and ICSC. I am confident that we will meet the opportunities in front of us as we accelerate into the future As One.
Sincerely,
Tom McGeePresident and CEO
/ 5
Dear Fellow ICSC Members,
It has been my great honor to serve as ICSC’s 56th Chairman this year. While it has been a time of tremendous change, I believe we are stronger than ever and positioned for even greater success in the years to come.
My involvement with ICSC began as a volunteer for the New England Idea Exchange over 25 years ago. Through the years, I served in various capacities at the local, state, division, and national level. I helped plan Idea Exchanges, worked on government relations issues, participated in education programs, and served in various officer positions. Based on all of my experience, I am convinced that ICSC’s greatest strength is the passion and commitment of its volunteers and members.
My year as Chairman has further confirmed that this dedication is the key to ICSC’s success. I have traveled extensively within the United States and around the world attending ICSC programs and events, meeting with our volunteer leaders and members and seeing retail properties. I can tell you with 100 percent certainty that we are all fortunate to be part of one of the greatest industries on the planet.
Shopping is not just a national pastime in the United States. It is truly a global phenomenon. In addition to sports, it is an activity that transcends political divisions and boundaries. Our industry is prospering around the world, with new development exploding in underserved locations. We are the largest employer and taxpayer in a myriad of markets and are integral to communities in countless ways. We are innovating to meet customer demand and attracting customers through engaging and authentic experiences in addition to traditional retail offerings. Technology is playing a major role as well, with smartphones permitting a new wave of offerings that allow for more direct communication with customers, driving traffic and sales.
ICSC is leading the way as the global association representing our industry. This year, Tom McGee became only the fourth President and CEO to lead our organization. Tom is off to a
stellar start. His 26 years with Deloitte ideally qualified him to bring best practices to ICSC in the areas of member services and talent development. He is committed to ensuring ICSC’s advocacy for the shopping center industry and that its interests are second to none; that we provide world class service for our members; true support and engagement for our volunteers; and a positive, learning culture for ICSC’s staff. Tom will be a tremendous leader for ICSC and I am proud to have had the opportunity to bring him into our organization.
Over the course of the year, I have seen tremendous projects around the world ranging from the oldest enclosed malls, the Grand Bazaar in Istanbul and the Galleria Vittorio Emanuele in Milan, to the largest properties, the Mall of the Emirates and the Dubai Mall in Dubai, to some of the newest and most innovative urban projects such as Ponce City Marketplace in Atlanta. Our industry includes a wide range of retail formats, and our membership reflects the various constituencies that are responsible for their success. I have been fortunate to enjoy a front row seat to our thriving industry and have witnessed firsthand the enormous talent and energy being devoted to ICSC.
Thank you again for this once in a lifetime opportunity. After my year as Chairman, I am more confident than ever in the future of our industry globally and the important role ICSC will play in shaping the journey ahead. I look forward to ongoing involvement with ICSC for many years to come.
Sincerely,
Stephen D. LebovitzICSC Chairman, 2015 – 2016President and CEOCBL & Associates Properties, Inc.
6 /
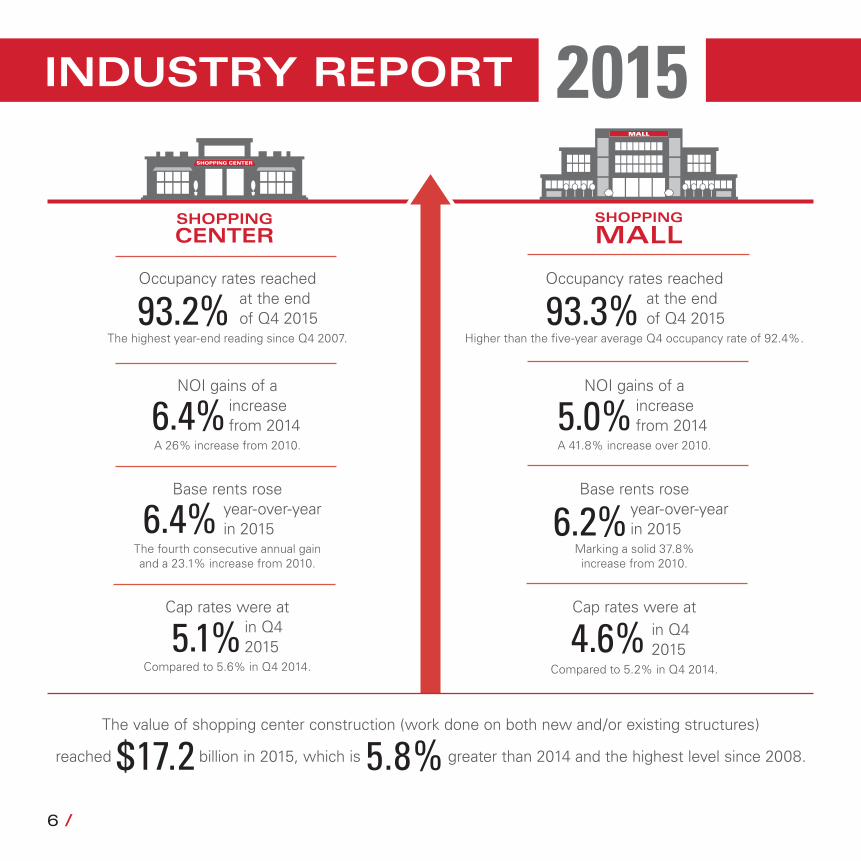
INDUSTRY REPORT 2015SHOPPING CENTER
SHOPPING CENTER
MALL
SHOPPING
MALL
The value of shopping center construction (work done on both new and/or existing structures)
reached $17.2 billion in 2015, which is 5.8% greater than 2014 and the highest level since 2008.
Occupancy rates reached at the end
of Q4 2015The highest year-end reading since Q4 2007.
Occupancy rates reached at the end
of Q4 2015Higher than the five-year average Q4 occupancy rate of 92.4%.
93.2% 93.3%
NOI gains of a increase
from 2014A 26% increase from 2010.
NOI gains of a increase
from 2014A 41.8% increase over 2010.
6.4% 5.0%
Cap rates were at in Q4
2015 Compared to 5.6% in Q4 2014.
Cap rates were at in Q4
2015 Compared to 5.2% in Q4 2014.
5.1% 4.6%
Base rents rose year-over-year
in 2015The fourth consecutive annual gain and a 23.1% increase from 2010.
Base rents rose year-over-year
in 2015Marking a solid 37.8% increase from 2010.
6.4% 6.2%
/ 7
INDUSTRY REPORT
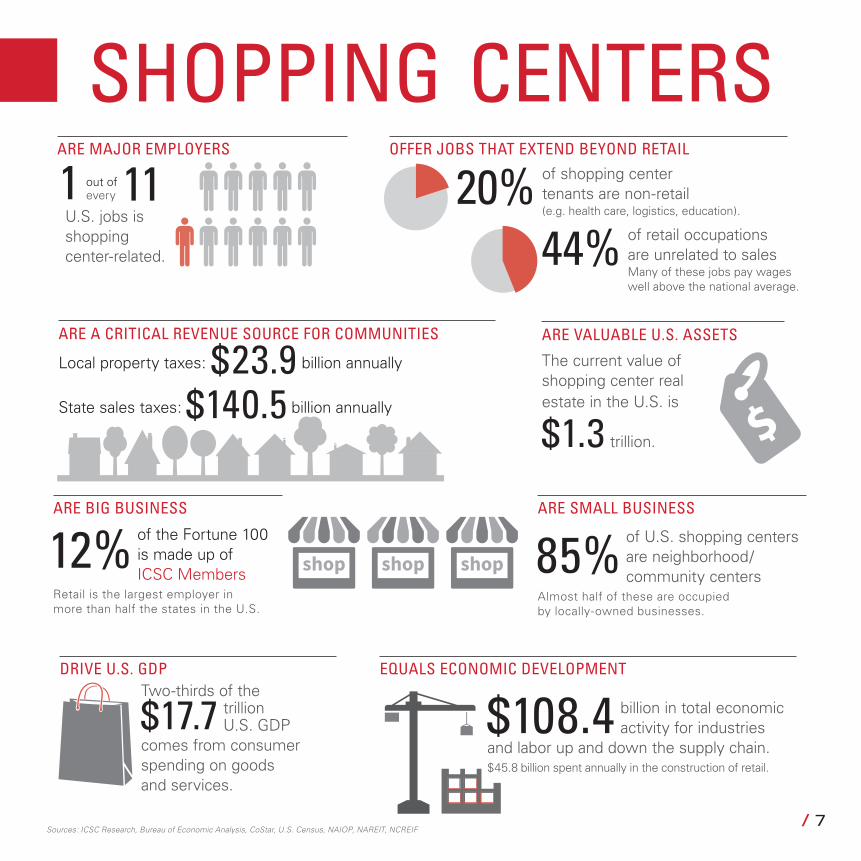
OFFER JOBS THAT EXTEND BEYOND RETAILARE MAJOR EMPLOYERS
ARE A CRITICAL REVENUE SOURCE FOR COMMUNITIES ARE VALUABLE U.S. ASSETS
ARE BIG BUSINESS
DRIVE U.S. GDP EQUALS ECONOMIC DEVELOPMENT
ARE SMALL BUSINESS
1 out of
every
11
U.S. jobs is shopping center-related.
20% of shopping center tenants are non-retail (e.g. health care, logistics, education).
44% of retail occupations are unrelated to sales Many of these jobs pay wages well above the national average.
Local property taxes: $23.9 billion annually
State sales taxes: $140.5 billion annually
The current value of shopping center real estate in the U.S. is
$1.3 trillion.
12% of the Fortune 100 is made up of ICSC Members
Retail is the largest employer in more than half the states in the U.S.
85% of U.S. shopping centers are neighborhood/ community centers
Almost half of these are occupied by locally-owned businesses.
Two-thirds of the
$17.7 trillion U.S. GDP
comes from consumer spending on goods and services.
$108.4 billion in total economic activity for industries
and labor up and down the supply chain. $45.8 billion spent annually in the construction of retail.
SHOPPING CENTERS
Sources: ICSC Research, Bureau of Economic Analysis, CoStar, U.S. Census, NAIOP, NAREIT, NCREIF
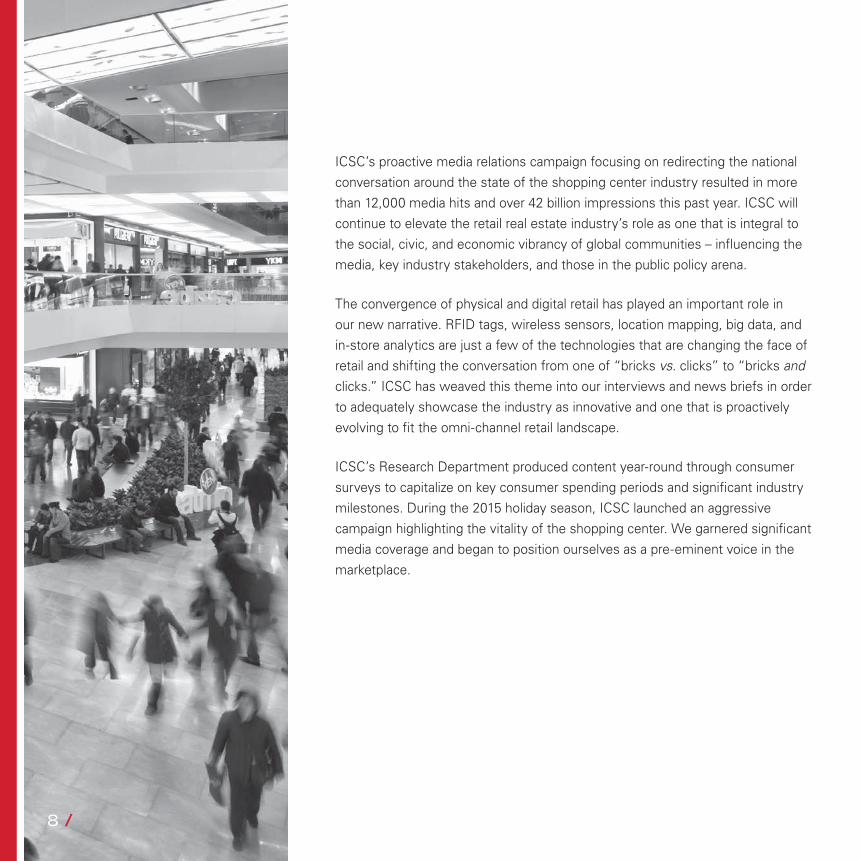
ICSC’s proactive media relations campaign focusing on redirecting the national conversation around the state of the shopping center industry resulted in more than 12,000 media hits and over 42 billion impressions this past year. ICSC will continue to elevate the retail real estate industry’s role as one that is integral to the social, civic, and economic vibrancy of global communities – influencing the media, key industry stakeholders, and those in the public policy arena.
The convergence of physical and digital retail has played an important role in our new narrative. RFID tags, wireless sensors, location mapping, big data, and in-store analytics are just a few of the technologies that are changing the face of retail and shifting the conversation from one of “bricks vs. clicks” to “bricks and clicks.” ICSC has weaved this theme into our interviews and news briefs in order to adequately showcase the industry as innovative and one that is proactively evolving to fit the omni-channel retail landscape.
ICSC’s Research Department produced content year-round through consumer surveys to capitalize on key consumer spending periods and significant industry milestones. During the 2015 holiday season, ICSC launched an aggressive campaign highlighting the vitality of the shopping center. We garnered significant media coverage and began to position ourselves as a pre-eminent voice in the marketplace.
8 /
2015 – 2016 The Industry is Innovating for the Future
“ High-End Malls Get Boost
from High-Tech Stores”
The Wall Street Journal, January ‘15
“ Against all the odds,
malls are thriving again”
Fortune, March ‘15
“ Five trends that will
change the future of
shopping centers” Las Vegas Business Press, May ‘15
“ Doubling Down on
the Rebirth of the
American Shopping Mall” CNBC, June ‘15
“ Mall Operators Begin
Cultivating Startups”
The Wall Street Journal, July ‘15
“ A Stronger – and Longer –
Holiday Shopping Season”
Reuters, October ‘15
“ The Future of E-commerce:
Bricks and Mortar”
The Guardian, January ‘16
“ Retailers blend
‘bricks’ and ‘clicks’”
Argus Leader, March ‘16
ICSC launched its first aggregated content website to provide a dedicated location for industry, news, research, and blog posts. With more than 125,000 followers on social media, ICSC has established its presence across all mediums, and continues to expand its reach and influence. Leveraging positive storylines through ICSC’s editorial department has been of paramount importance for ICSC as well. Shopping Centers Today, Value Retail News, International Outlet Journal, and Specialty Retail Report, in addition to five professional books, both print and digital formats, were produced this year to provide members with timely content.
ICSC’s mobile app, which surpassed 25,000 downloads, is in the beginning stages of being revamped to include even more features for members looking to take the ICSC experience with them wherever they go.
“The story around digital is less about either or, and more about the omni-channel environment. Consumers are using digital to not only buy things, but also to research products before they go into a store and to pick up things that they ordered online. I think as the industry matures around the use of digital, you’ll see it to be additive to
the physical retail environment.”
Tom McGee – Fortune Live
10 /
Playing offense with our size and scale while increasing the prominence of our public policy voice in the U.S. and internationally is a key strategic priority of ICSC. The retail real estate industry is a major driver of economic prosperity for the communities it serves and ICSC’s office of Global Public Policy will continue to strive to make sure our industry’s voice is heard at the Federal, State, and Provincial level in the U.S. and Canada, as well as in the European Union’s legislative, regulatory, and political processes. This past year, ICSC Global Public Policy made great strides on e-fairness and other policies that affect the industry, such as aiding in the blocking of the Waters of the U.S. (WOTUS) Rulemaking, facilitating beneficial ADA Reform Legislation, and improving the Partnership Audit reform.
Senate Deal Struck on E-fairness Consideration ICSC has promoted e-fairness for more than 20 years and will continue to fight for the legislation that will level the playing field and support the 21st century retail marketplace. Follow-on benefits from ICSC’s e-fairness efforts in the U.S. have been felt in Europe, where ICSC is the only voice speaking at the EU on behalf of our industry.
In February 2016 as part of negotiations to advance the Permanent Internet Tax Freedom Act (PITFA), Majority Leader Mitch McConnell (R-KY) publicly committed to holding a vote on legislation (H.R. 2775) to close the online sales tax loophole by the end of the year.
President Obama Signs TRIAEarly in January 2015, President Obama signed into law H.R. 26, the “Terrorism Risk Insurance Program Reauthorization Act of 2015.” The reauthorization, which was advocated heavily by ICSC and others in the real estate community, extends the terrorism insurance program till 2020. The extension ensures the continued availability and affordability of insurance coverage for terrorism risk in the commercial marketplace.
ICSC PAC Sets New Fundraising RecordWith the help of special events at RECon and the New York National Deal Making conference, the ICSC PAC set a new fundraising record of $575,000 in contributions, which translates into more campaign disbursements to key ICSC constituents on Capitol Hill. In 2015, the ICSC PAC contributed more than $550,000 to 180 Members of Congress.
“To me, I think the
concept is right… It’s
only fair that the local
brick-and-mortar retailer
be treated the same as
the big-box online sales
company out of state.”
– Representative Paul Ryan (R-WI-1)
“I think the chances are
very good that the House
will consider and pass a
Marketplace Fairness Act,
and that the Senate will
as well.”
– Senator Lamar Alexander (R-TN)
State Advocacy
/ 11
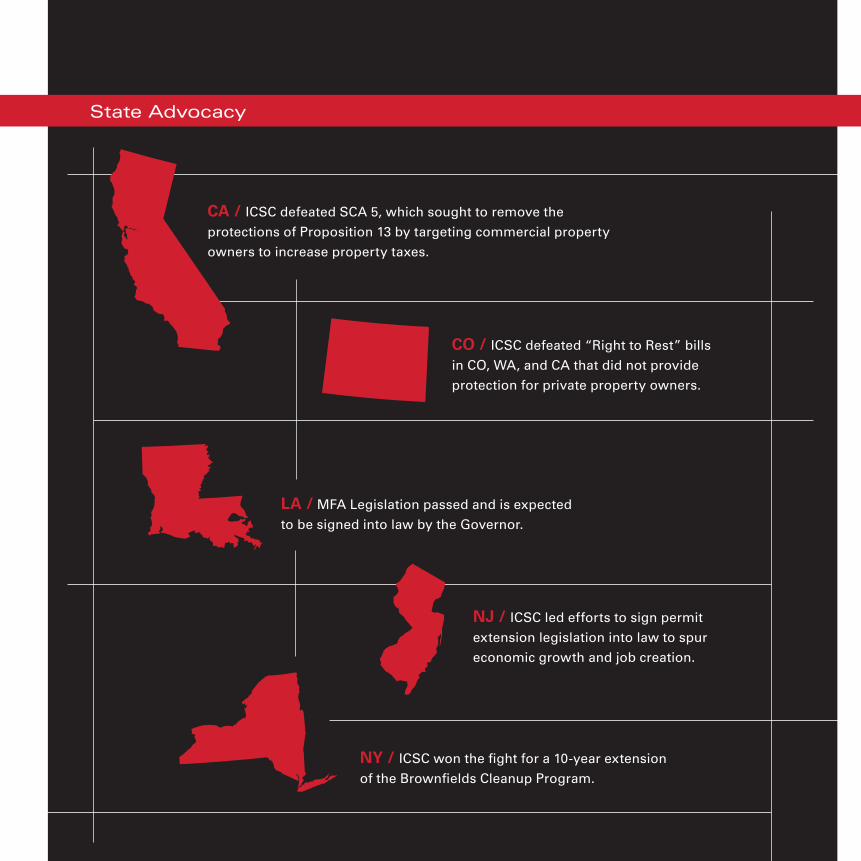
State Advocacy
CA / ICSC defeated SCA 5, which sought to remove the
protections of Proposition 13 by targeting commercial property
owners to increase property taxes.
CO / ICSC defeated “Right to Rest” bills
in CO, WA, and CA that did not provide
protection for private property owners.
LA / MFA Legislation passed and is expected
to be signed into law by the Governor.
NJ / ICSC led efforts to sign permit
extension legislation into law to spur
economic growth and job creation.
NY / ICSC won the fight for a 10-year extension
of the Brownfields Cleanup Program.
12 /
Over the past six months, ICSC has set out to deliver world class service to our members and act as a strategic partner to our industry.
Part of this world class service is provided through our conferences and educational offerings. These offerings are designed to help our members further their careers by gaining valuable insights from the best and brightest the industry has to offer.
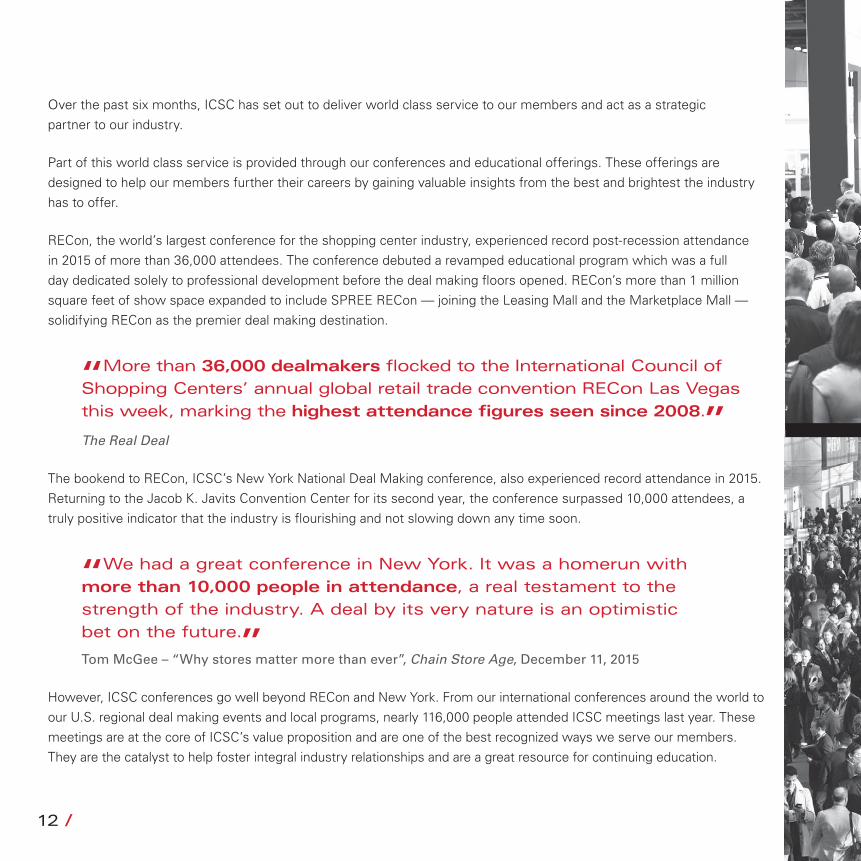
RECon, the world’s largest conference for the shopping center industry, experienced record post-recession attendance in 2015 of more than 36,000 attendees. The conference debuted a revamped educational program which was a full day dedicated solely to professional development before the deal making floors opened. RECon’s more than 1 million square feet of show space expanded to include SPREE RECon — joining the Leasing Mall and the Marketplace Mall — solidifying RECon as the premier deal making destination.
“More than 36,000 dealmakers flocked to the International Council of Shopping Centers’ annual global retail trade convention RECon Las Vegas this week, marking the highest attendance figures seen since 2008.”
The Real Deal
The bookend to RECon, ICSC’s New York National Deal Making conference, also experienced record attendance in 2015. Returning to the Jacob K. Javits Convention Center for its second year, the conference surpassed 10,000 attendees, a truly positive indicator that the industry is flourishing and not slowing down any time soon.
“We had a great conference in New York. It was a homerun with more than 10,000 people in attendance, a real testament to the strength of the industry. A deal by its very nature is an optimistic bet on the future.”Tom McGee – “Why stores matter more than ever”, Chain Store Age, December 11, 2015
However, ICSC conferences go well beyond RECon and New York. From our international conferences around the world to our U.S. regional deal making events and local programs, nearly 116,000 people attended ICSC meetings last year. These meetings are at the core of ICSC’s value proposition and are one of the best recognized ways we serve our members. They are the catalyst to help foster integral industry relationships and are a great resource for continuing education.
/ 13
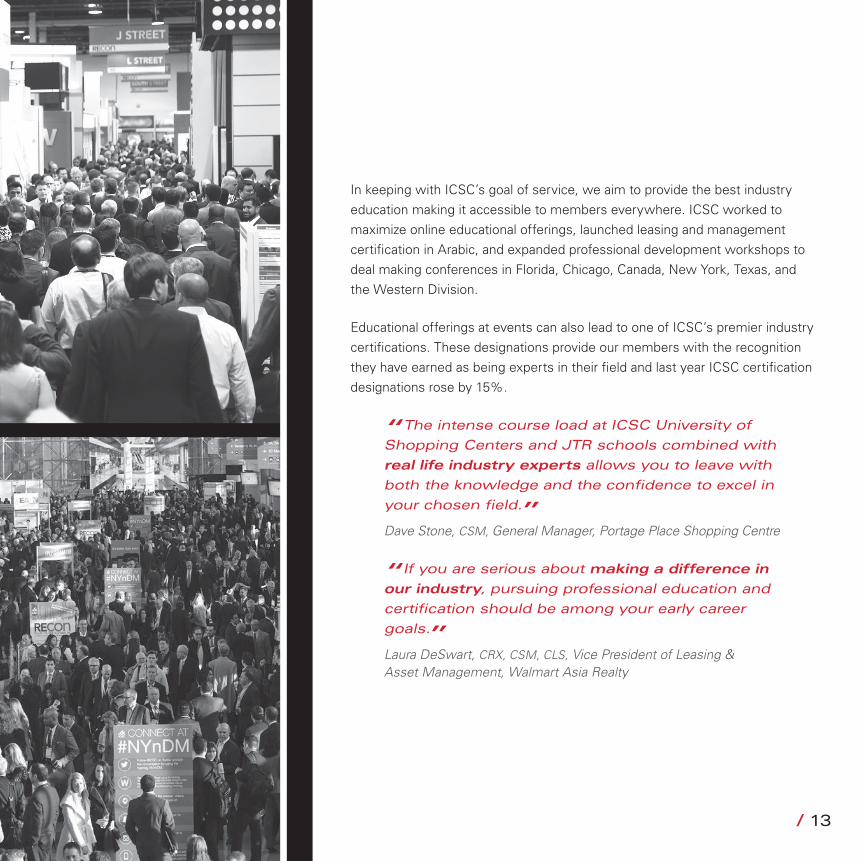
In keeping with ICSC’s goal of service, we aim to provide the best industry education making it accessible to members everywhere. ICSC worked to maximize online educational offerings, launched leasing and management certification in Arabic, and expanded professional development workshops to deal making conferences in Florida, Chicago, Canada, New York, Texas, and the Western Division.
Educational offerings at events can also lead to one of ICSC’s premier industry certifications. These designations provide our members with the recognition they have earned as being experts in their field and last year ICSC certification designations rose by 15%.
“The intense course load at ICSC University of
Shopping Centers and JTR schools combined with
real life industry experts allows you to leave with
both the knowledge and the confidence to excel in
your chosen field.”Dave Stone, CSM, General Manager, Portage Place Shopping Centre
“ If you are serious about making a difference in
our industry, pursuing professional education and
certification should be among your early career
goals.”Laura DeSwart, CRX, CSM, CLS, Vice President of Leasing & Asset Management, Walmart Asia Realty
14 /
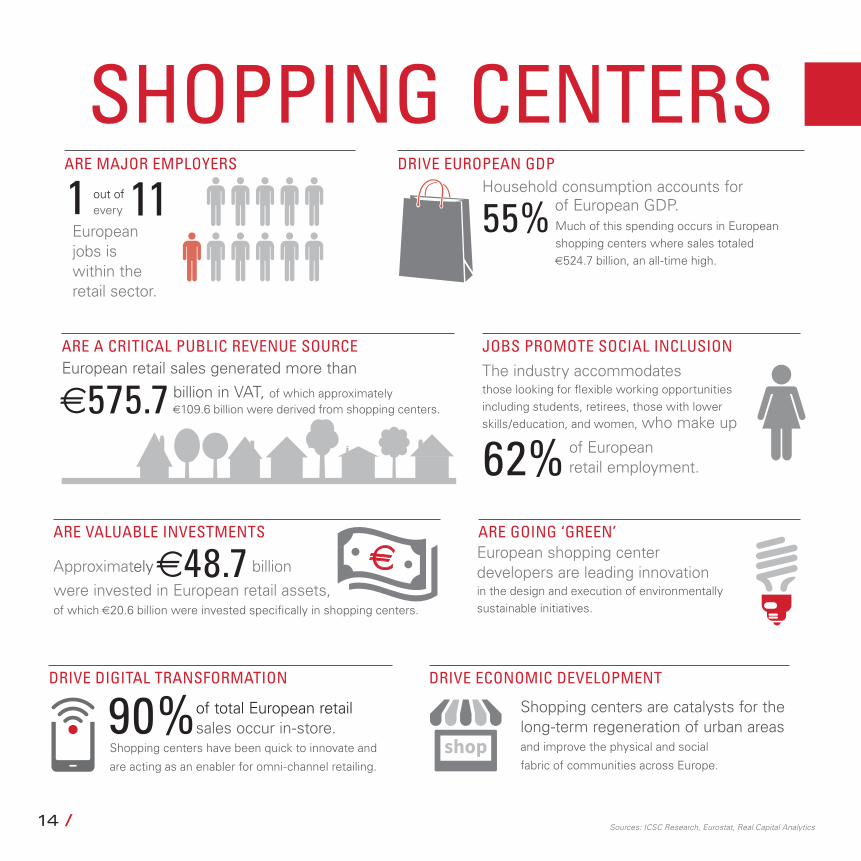
INTERNATIONALLYSHOPPING CENTERS
Sources: ICSC Research, Eurostat, Real Capital Analytics
ARE MAJOR EMPLOYERS
1 out of
every
11
European jobs is within the retail sector.
DRIVE EUROPEAN GDPHousehold consumption accounts for
55% of European GDP. Much of this spending occurs in European shopping centers where sales totaled €524.7 billion, an all-time high.
DRIVE ECONOMIC DEVELOPMENT
Shopping centers are catalysts for the long-term regeneration of urban areas and improve the physical and social
fabric of communities across Europe.
DRIVE DIGITAL TRANSFORMATION
90% of total European retail sales occur in-store.
Shopping centers have been quick to innovate and
are acting as an enabler for omni-channel retailing.
ARE A CRITICAL PUBLIC REVENUE SOURCEEuropean retail sales generated more than
€575.7 billion in VAT, of which approximately €109.6 billion were derived from shopping centers.
JOBS PROMOTE SOCIAL INCLUSION The industry accommodates those looking for flexible working opportunities including students, retirees, those with lower skills/education, and women, who make up
62% of European retail employment.
ARE VALUABLE INVESTMENTS
Approximately €48.7 billion were invested in European retail assets, of which €20.6 billion were invested specifically in shopping centers.
ARE GOING ‘GREEN’ European shopping center developers are leading innovation in the design and execution of environmentally sustainable initiatives.
/ 15
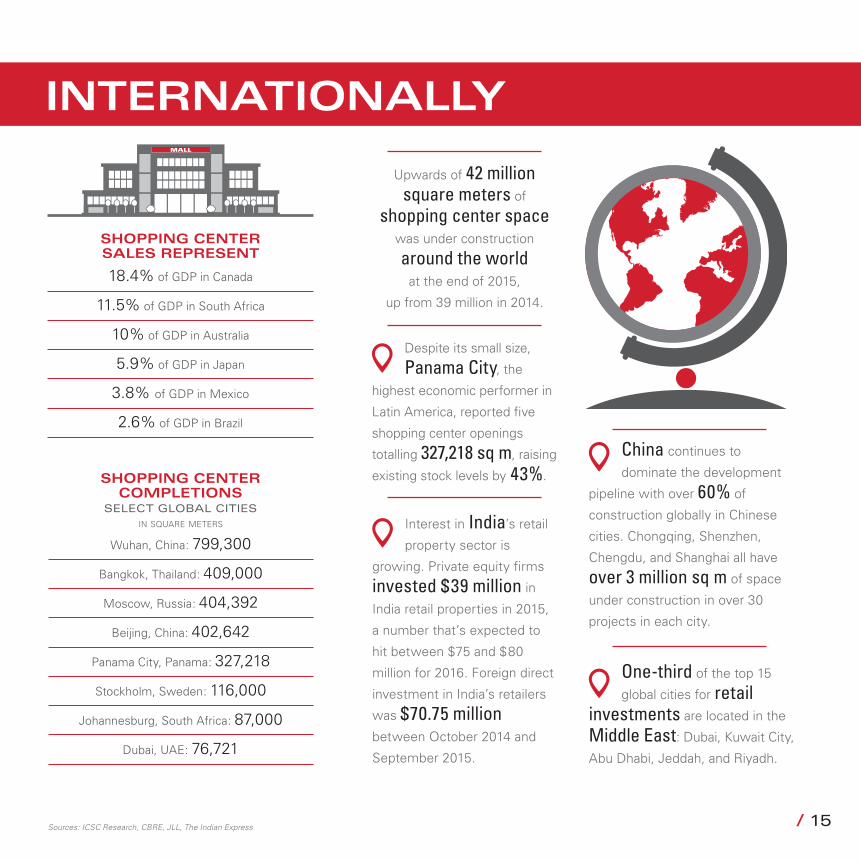
INTERNATIONALLYMALL
Sources: ICSC Research, CBRE, JLL, The Indian Express
18.4% of GDP in Canada
11.5% of GDP in South Africa
10% of GDP in Australia
5.9% of GDP in Japan
3.8% of GDP in Mexico
2.6% of GDP in Brazil
SHOPPING CENTER SALES REPRESENT
in square meters
Wuhan, China: 799,300
Bangkok, Thailand: 409,000
Moscow, Russia: 404,392
Beijing, China: 402,642
Panama City, Panama: 327,218
Stockholm, Sweden: 116,000
Johannesburg, South Africa: 87,000
Dubai, UAE: 76,721
SHOPPING CENTER COMPLETIONS
SELECT GLOBAL CITIES
China continues to
dominate the development
pipeline with over 60% of
construction globally in Chinese
cities. Chongqing, Shenzhen,
Chengdu, and Shanghai all have
over 3 million sq m of space
under construction in over 30
projects in each city.
Despite its small size,
Panama City, the
highest economic performer in
Latin America, reported five
shopping center openings
totalling 327,218 sq m, raising
existing stock levels by 43%.
Interest in India’s retail
property sector is
growing. Private equity firms
invested $39 million in
India retail properties in 2015,
a number that’s expected to
hit between $75 and $80
million for 2016. Foreign direct
investment in India’s retailers
was $70.75 million
between October 2014 and
September 2015.
One-third of the top 15
global cities for retail investments are located in the
Middle East: Dubai, Kuwait City,
Abu Dhabi, Jeddah, and Riyadh.
Upwards of 42 million square meters of
shopping center space
was under construction
around the world
at the end of 2015,
up from 39 million in 2014.
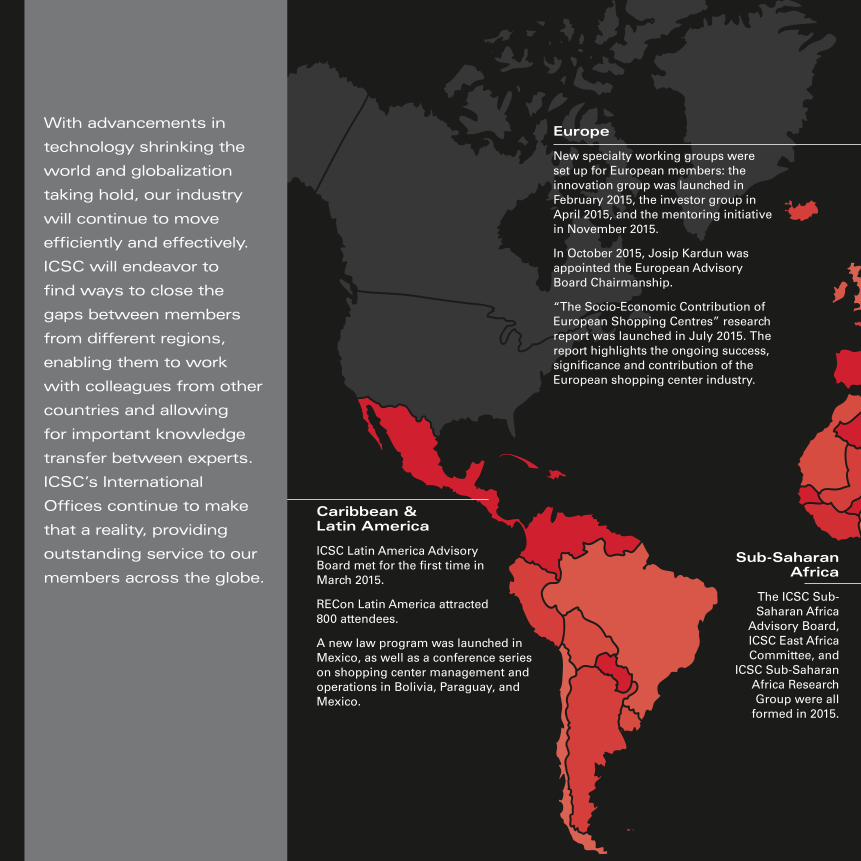
With advancements in
technology shrinking the
world and globalization
taking hold, our industry
will continue to move
efficiently and effectively.
ICSC will endeavor to
find ways to close the
gaps between members
from different regions,
enabling them to work
with colleagues from other
countries and allowing
for important knowledge
transfer between experts.
ICSC’s International
Offices continue to make
that a reality, providing
outstanding service to our
members across the globe.
Caribbean & Latin America
ICSC Latin America Advisory Board met for the first time in March 2015.
RECon Latin America attracted 800 attendees.
A new law program was launched in Mexico, as well as a conference series on shopping center management and operations in Bolivia, Paraguay, and Mexico.
Sub-Saharan Africa
The ICSC Sub-Saharan Africa
Advisory Board, ICSC East Africa Committee, and
ICSC Sub-Saharan Africa Research Group were all
formed in 2015.
Europe
New specialty working groups were set up for European members: the innovation group was launched in February 2015, the investor group in April 2015, and the mentoring initiative in November 2015.
In October 2015, Josip Kardun was appointed the European Advisory Board Chairmanship.
“The Socio-Economic Contribution of European Shopping Centres” research report was launched in July 2015. The report highlights the ongoing success, significance and contribution of the European shopping center industry.
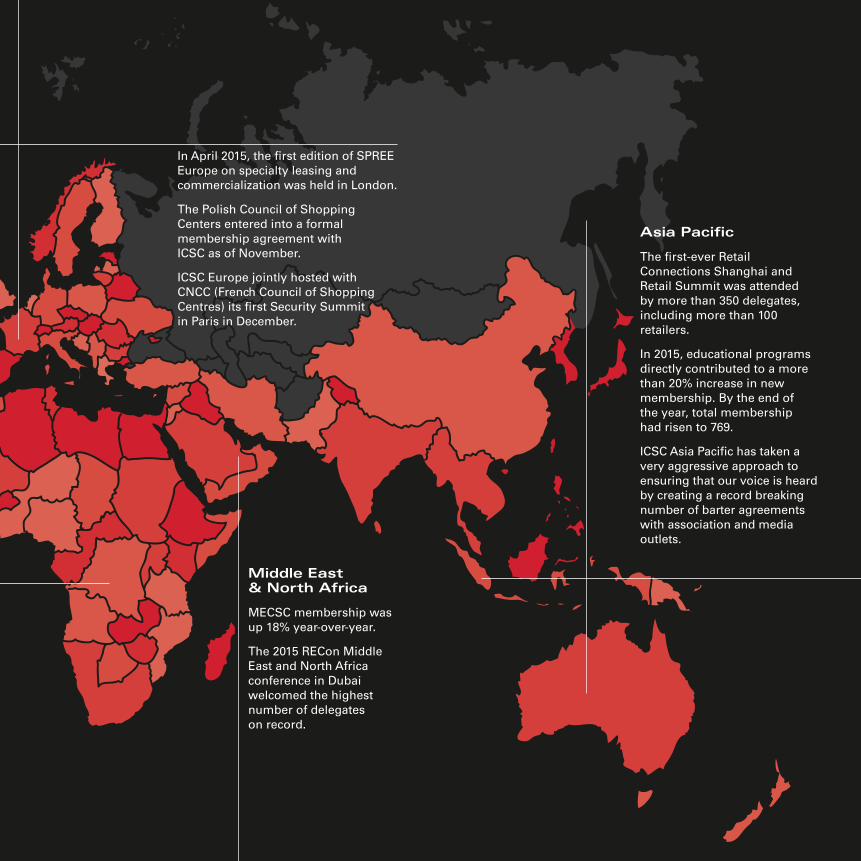
Middle East & North Africa
MECSC membership was up 18% year-over-year.
The 2015 RECon Middle East and North Africa conference in Dubai welcomed the highest number of delegates on record.
Asia Pacific
The first-ever Retail Connections Shanghai and Retail Summit was attended by more than 350 delegates, including more than 100 retailers.
In 2015, educational programs directly contributed to a more than 20% increase in new membership. By the end of the year, total membership had risen to 769.
ICSC Asia Pacific has taken a very aggressive approach to ensuring that our voice is heard by creating a record breaking number of barter agreements with association and media outlets.
In April 2015, the first edition of SPREE Europe on specialty leasing and commercialization was held in London.
The Polish Council of Shopping Centers entered into a formal membership agreement with ICSC as of November.
ICSC Europe jointly hosted with CNCC (French Council of Shopping Centres) its first Security Summit in Paris in December.
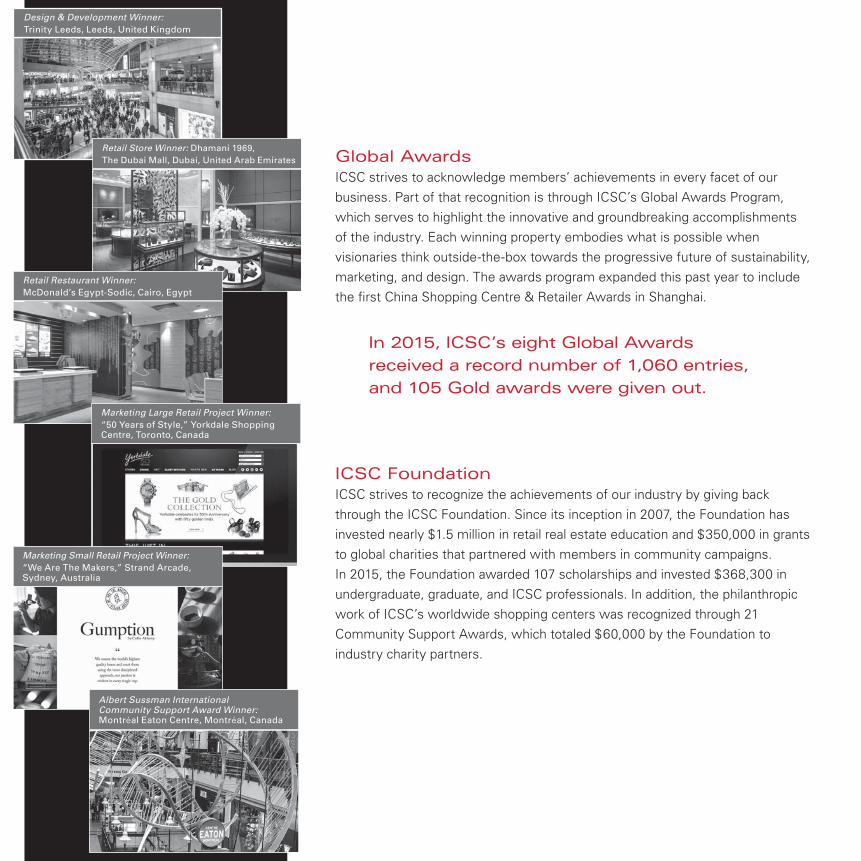
Global AwardsICSC strives to acknowledge members’ achievements in every facet of our business. Part of that recognition is through ICSC’s Global Awards Program, which serves to highlight the innovative and groundbreaking accomplishments of the industry. Each winning property embodies what is possible when visionaries think outside-the-box towards the progressive future of sustainability, marketing, and design. The awards program expanded this past year to include the first China Shopping Centre & Retailer Awards in Shanghai.
In 2015, ICSC’s eight Global Awards received a record number of 1,060 entries, and 105 Gold awards were given out.
ICSC FoundationICSC strives to recognize the achievements of our industry by giving back through the ICSC Foundation. Since its inception in 2007, the Foundation has invested nearly $1.5 million in retail real estate education and $350,000 in grants to global charities that partnered with members in community campaigns. In 2015, the Foundation awarded 107 scholarships and invested $368,300 in undergraduate, graduate, and ICSC professionals. In addition, the philanthropic work of ICSC’s worldwide shopping centers was recognized through 21 Community Support Awards, which totaled $60,000 by the Foundation to industry charity partners.
Design & Development Winner: Trinity Leeds, Leeds, United Kingdom
Retail Store Winner: Dhamani 1969, The Dubai Mall, Dubai, United Arab Emirates
Retail Restaurant Winner: McDonald’s Egypt-Sodic, Cairo, Egypt
Marketing Large Retail Project Winner: “50 Years of Style,” Yorkdale Shopping Centre, Toronto, Canada
Marketing Small Retail Project Winner: “We Are The Makers,” Strand Arcade, Sydney, Australia
Albert Sussman International Community Support Award Winner: Montréal Eaton Centre, Montréal, Canada
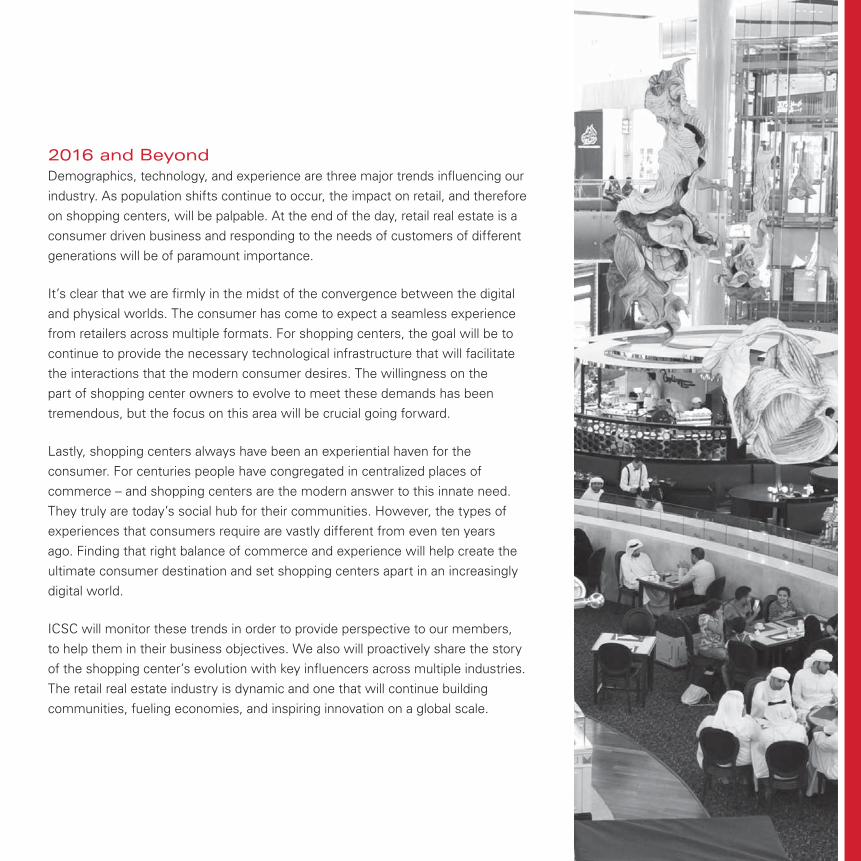
2016 and BeyondDemographics, technology, and experience are three major trends influencing our industry. As population shifts continue to occur, the impact on retail, and therefore on shopping centers, will be palpable. At the end of the day, retail real estate is a consumer driven business and responding to the needs of customers of different generations will be of paramount importance.
It’s clear that we are firmly in the midst of the convergence between the digital and physical worlds. The consumer has come to expect a seamless experience from retailers across multiple formats. For shopping centers, the goal will be to continue to provide the necessary technological infrastructure that will facilitate the interactions that the modern consumer desires. The willingness on the part of shopping center owners to evolve to meet these demands has been tremendous, but the focus on this area will be crucial going forward.
Lastly, shopping centers always have been an experiential haven for the consumer. For centuries people have congregated in centralized places of commerce – and shopping centers are the modern answer to this innate need. They truly are today’s social hub for their communities. However, the types of experiences that consumers require are vastly different from even ten years ago. Finding that right balance of commerce and experience will help create the ultimate consumer destination and set shopping centers apart in an increasingly digital world.
ICSC will monitor these trends in order to provide perspective to our members, to help them in their business objectives. We also will proactively share the story of the shopping center’s evolution with key influencers across multiple industries. The retail real estate industry is dynamic and one that will continue building communities, fueling economies, and inspiring innovation on a global scale.

20 /
2015 FIN
ANCIAL REPORT
/ 21
2015 FIN
ANCIAL REPORT
22 / / 23
Report of the Audit and Finance Committee
The Audit and Finance Committee consists of five to seven eligible committee members appointed by Nominating and Governance Committee and approved by the Executive Board. The members of the Committee for 2015-2016 are Kenneth Bernstein - Chairman, Peter Ballon, Michael Graziano, Kenneth McIntyre, Mark Myers and Kathleen Nelson. The contact information for any of the Committee members can be obtained by visiting the membership directory at ICSC.org. The Audit and Finance Committee is governed by a written charter adopted by the Executive Board.
The Audit and Finance Committee is charged with reviewing the integrity of the financial statements, auditor selection and oversight, legal and regulatory compliance and oversight of ICSC’s internal accounting function. Management is responsible for establishing and maintaining adequate internal control over financial reporting, for preparing the consolidated financial statements and for the reporting process. The independent auditors, Citrin Cooperman, are engaged to audit and report on the conformity of the ICSC’s consolidated financial statements with accounting principles generally accepted in the United States of America. The Audit Committee monitors and oversees these processes. The Audit and Finance Committee members do not serve as professional accountants or auditors, and their functions are not intended to duplicate or certify the activities of management and the independent public accounting firm.
In this context, the Audit and Finance Committee reviewed and discussed with management and the independent auditors the audited consolidated financial statements and the related footnotes for the year ended December 31, 2015, and the independent auditor’s report on those consolidated financial statements. Citrin Cooperman discussed the matters required to be communicated by applicable professional standards (Auditor’s Communication with Those Charged
with Governance). These items included, but were not limited to, accounting practices and estimates used, sensitive disclosures, audit adjustments and consultations with other accountants. The Audit and Finance Committee held a separate executive session with the independent auditors, in addition to meeting with the groups collectively.
Based on the review and oversight functions described above, the Audit and Finance Committee recommends to the Executive Board that the audited consolidated financial statements be included in ICSC’s annual report for the year ended December 31, 2015.
Audit CommitteeKenneth Bernstein (Chairperson)Peter BallonMichael Graziano Kenneth McIntyreMark MyersKathleen Nelson
Independent Auditor’s Report
To the Board of Trustees International Council of Shopping Centers, Inc. New York, New York
We have audited the accompanying consolidated financial statements of International Council of Shopping Centers, Inc. (“ICSC”), The International Council of Shopping Centers Foundation (the “Foundation”), ICSC Foundation Canada (the “Canadian Foundation”) and the ICSC Political Action Committee (the “PAC”) (collectively referred to as the “Council”), which comprise the consolidated balance sheet as of December 31, 2015, and the related consolidated statements of revenue and expenses, and cash flows for the
22 / / 23
year then ended, and the related notes to the consolidated financial statements.
Management’s Responsibility for the Financial StatementsManagement is responsible for the preparation and fair presentation of these consolidated financial statements in accordance with accounting principles generally accepted in the United States of America; this includes the design, implementation, and maintenance of internal control relevant to the preparation and fair presentation of the consolidated financial statements that are free from material misstatement, whether due to fraud or error.
Auditor’s ResponsibilityOur responsibility is to express an opinion on these consolidated financial statements based on our audit. We conducted our audit in accordance with auditing standards generally accepted in the United States of America. Those standards require that we plan and perform the audit to obtain reasonable assurance about whether the consolidated financial statements are free from material misstatement.
An audit involves performing procedures to obtain audit evidence about the amounts and disclosures in the consolidated financial statements. The procedures selected depend on the auditors’ judgment, including the assessment of the risks of material misstatement of the consolidated financial statements, whether due to fraud or error. In making those risk assessments, the auditor considers internal control relevant to the entity’s preparation and fair presentation of the consolidated financial statements in order to design audit procedures that are appropriate in the circumstances, but not for the purpose of expressing an opinion on the effectiveness of the entity’s internal control. Accordingly, we express no such opinion. An audit also includes evaluating the appropriateness of accounting policies used and the reasonableness of significant accounting estimates made by
management, as well as evaluating the overall presentation of the consolidated financial statements.
We believe that the audit evidence we have obtained is sufficient and appropriate to provide a basis for our audit opinion.
OpinionIn our opinion, the consolidated financial statements referred to above present fairly, in all material respects, the consolidated financial position of the Council as of December 31, 2015, and the changes in its net assets and its cash flows for the year then ended in accordance with accounting principles generally accepted in the United States of America.
Report on Summarized Comparative InformationWe have previously audited the consolidated financial statements of the Council as of December 31, 2014, and we expressed an unmodified audit opinion on those audited consolidated financial statements in our report dated April 29, 2015. In our opinion, the summarized comparative information presented herein on pages 24 and 25 for the year ended December 31, 2014, is consistent in all material respects, with the audited consolidated financial statements from which it has been derived.
_________________________________
CERTIFIED PUBLIC ACCOUNTANTS
New York, New York April 7, 2016
24 / / 25
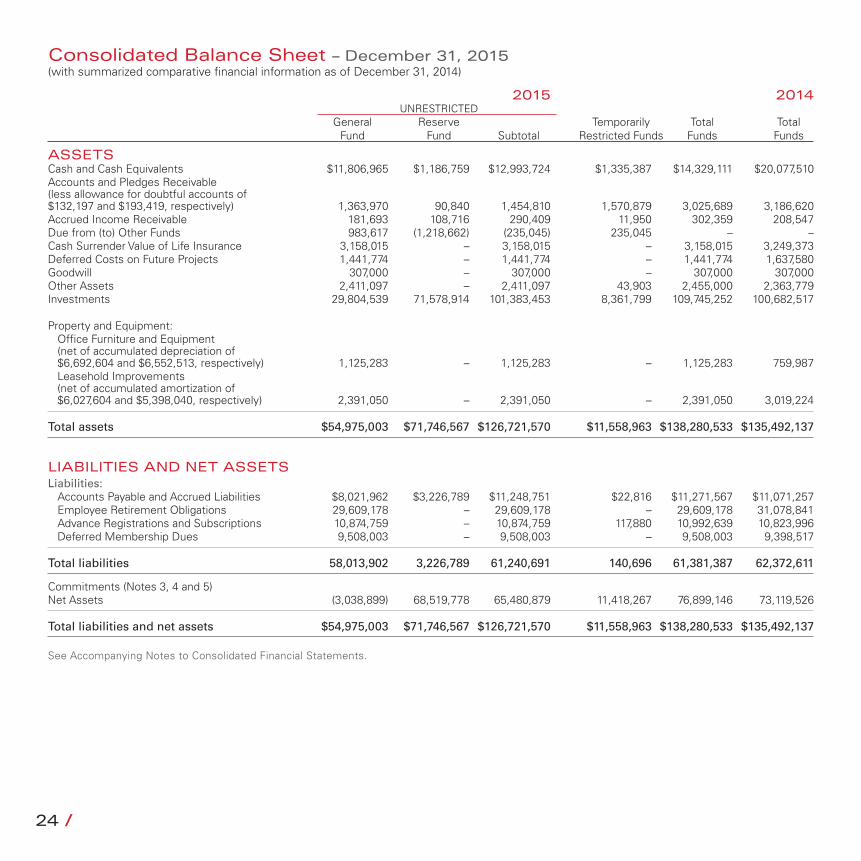
Consolidated Balance Sheet – December 31, 2015 (with summarized comparative financial information as of December 31, 2014)
2015 2014 UNRESTRICTED General Reserve Temporarily Total Total Fund Fund Subtotal Restricted Funds Funds Funds
ASSETSCash and Cash Equivalents $11,806,965 $1,186,759 $12,993,724 $1,335,387 $14,329,111 $20,077,510 Accounts and Pledges Receivable (less allowance for doubtful accounts of $132,197 and $193,419, respectively) 1,363,970 90,840 1,454,810 1,570,879 3,025,689 3,186,620 Accrued Income Receivable 181,693 108,716 290,409 11,950 302,359 208,547 Due from (to) Other Funds 983,617 (1,218,662) (235,045) 235,045 – – Cash Surrender Value of Life Insurance 3,158,015 – 3,158,015 – 3,158,015 3,249,373 Deferred Costs on Future Projects 1,441,774 – 1,441,774 – 1,441,774 1,637,580Goodwill 307,000 – 307,000 – 307,000 307,000 Other Assets 2,411,097 – 2,411,097 43,903 2,455,000 2,363,779 Investments 29,804,539 71,578,914 101,383,453 8,361,799 109,745,252 100,682,517
Property and Equipment:Office Furniture and Equipment(net of accumulated depreciation of$6,692,604 and $6,552,513, respectively) 1,125,283 – 1,125,283 – 1,125,283 759,987 Leasehold Improvements (net of accumulated amortization of$6,027,604 and $5,398,040, respectively) 2,391,050 – 2,391,050 – 2,391,050 3,019,224
Total assets $54,975,003 $71,746,567 $126,721,570 $11,558,963 $138,280,533 $135,492,137
LIABILITIES AND NET ASSETS Liabilities:
Accounts Payable and Accrued Liabilities $8,021,962 $3,226,789 $11,248,751 $22,816 $11,271,567 $11,071,257 Employee Retirement Obligations 29,609,178 – 29,609,178 – 29,609,178 31,078,841 Advance Registrations and Subscriptions 10,874,759 – 10,874,759 117,880 10,992,639 10,823,996 Deferred Membership Dues 9,508,003 – 9,508,003 – 9,508,003 9,398,517
Total liabilities 58,013,902 3,226,789 61,240,691 140,696 61,381,387 62,372,611
Commitments (Notes 3, 4 and 5)Net Assets (3,038,899) 68,519,778 65,480,879 11,418,267 76,899,146 73,119,526
Total liabilities and net assets $54,975,003 $71,746,567 $126,721,570 $11,558,963 $138,280,533 $135,492,137
See Accompanying Notes to Consolidated Financial Statements.
24 / / 25
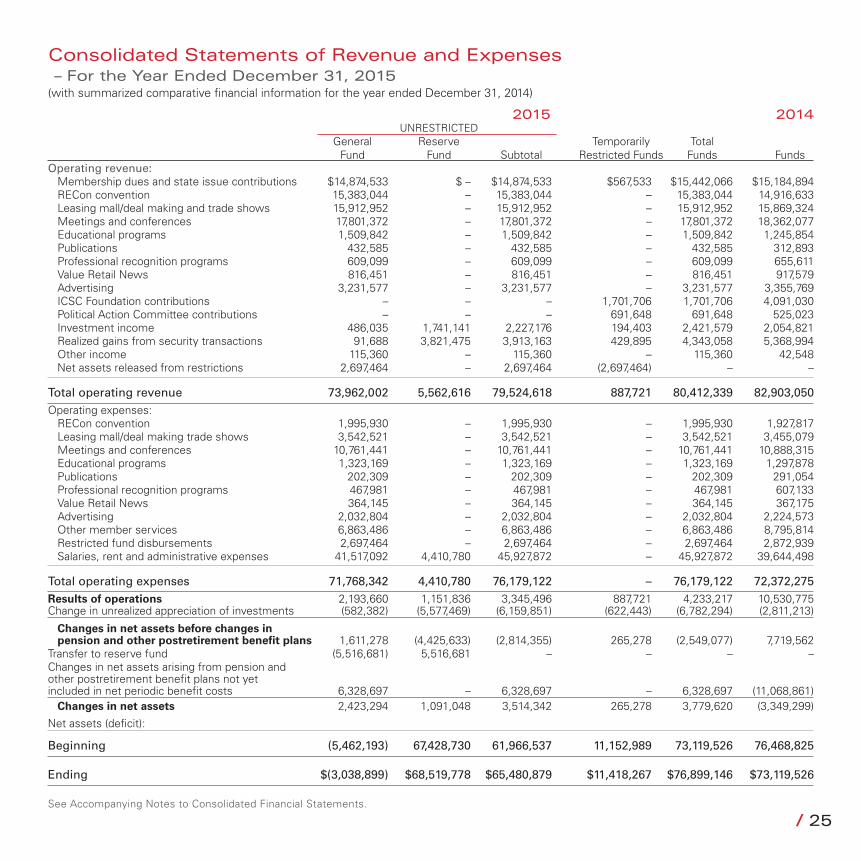
Consolidated Statements of Revenue and Expenses – For the Year Ended December 31, 2015(with summarized comparative financial information for the year ended December 31, 2014)
2015 2014 UNRESTRICTED General Reserve Temporarily Total Fund Fund Subtotal Restricted Funds Funds FundsOperating revenue:
Membership dues and state issue contributions $14,874,533 $ – $14,874,533 $567,533 $15,442,066 $15,184,894 RECon convention 15,383,044 – 15,383,044 – 15,383,044 14,916,633 Leasing mall/deal making and trade shows 15,912,952 – 15,912,952 – 15,912,952 15,869,324 Meetings and conferences 17,801,372 – 17,801,372 – 17,801,372 18,362,077 Educational programs 1,509,842 – 1,509,842 – 1,509,842 1,245,854 Publications 432,585 – 432,585 – 432,585 312,893 Professional recognition programs 609,099 – 609,099 – 609,099 655,611 Value Retail News 816,451 – 816,451 – 816,451 917,579 Advertising 3,231,577 – 3,231,577 – 3,231,577 3,355,769 ICSC Foundation contributions – – – 1,701,706 1,701,706 4,091,030 Political Action Committee contributions – – – 691,648 691,648 525,023 Investment income 486,035 1,741,141 2,227,176 194,403 2,421,579 2,054,821Realized gains from security transactions 91,688 3,821,475 3,913,163 429,895 4,343,058 5,368,994Other income 115,360 – 115,360 – 115,360 42,548Net assets released from restrictions 2,697,464 – 2,697,464 (2,697,464) – –
Total operating revenue 73,962,002 5,562,616 79,524,618 887,721 80,412,339 82,903,050 Operating expenses:
RECon convention 1,995,930 – 1,995,930 – 1,995,930 1,927,817Leasing mall/deal making trade shows 3,542,521 – 3,542,521 – 3,542,521 3,455,079Meetings and conferences 10,761,441 – 10,761,441 – 10,761,441 10,888,315 Educational programs 1,323,169 – 1,323,169 – 1,323,169 1,297,878Publications 202,309 – 202,309 – 202,309 291,054Professional recognition programs 467,981 – 467,981 – 467,981 607,133Value Retail News 364,145 – 364,145 – 364,145 367,175Advertising 2,032,804 – 2,032,804 – 2,032,804 2,224,573Other member services 6,863,486 – 6,863,486 – 6,863,486 8,795,814Restricted fund disbursements 2,697,464 – 2,697,464 – 2,697,464 2,872,939Salaries, rent and administrative expenses 41,517,092 4,410,780 45,927,872 – 45,927,872 39,644,498
Total operating expenses 71,768,342 4,410,780 76,179,122 – 76,179,122 72,372,275Results of operations 2,193,660 1,151,836 3,345,496 887,721 4,233,217 10,530,775 Change in unrealized appreciation of investments (582,382) (5,577,469) (6,159,851) (622,443) (6,782,294) (2,811,213)
Changes in net assets before changes in pension and other postretirement benefit plans 1,611,278 (4,425,633) (2,814,355) 265,278 (2,549,077) 7,719,562
Transfer to reserve fund (5,516,681) 5,516,681 – – – – Changes in net assets arising from pension and other postretirement benefit plans not yet included in net periodic benefit costs 6,328,697 – 6,328,697 – 6,328,697 (11,068,861)
Changes in net assets 2,423,294 1,091,048 3,514,342 265,278 3,779,620 (3,349,299)
Net assets (deficit):
Beginning (5,462,193) 67,428,730 61,966,537 11,152,989 73,119,526 76,468,825
Ending $(3,038,899) $68,519,778 $65,480,879 $11,418,267 $76,899,146 $73,119,526
See Accompanying Notes to Consolidated Financial Statements.
26 / / 27
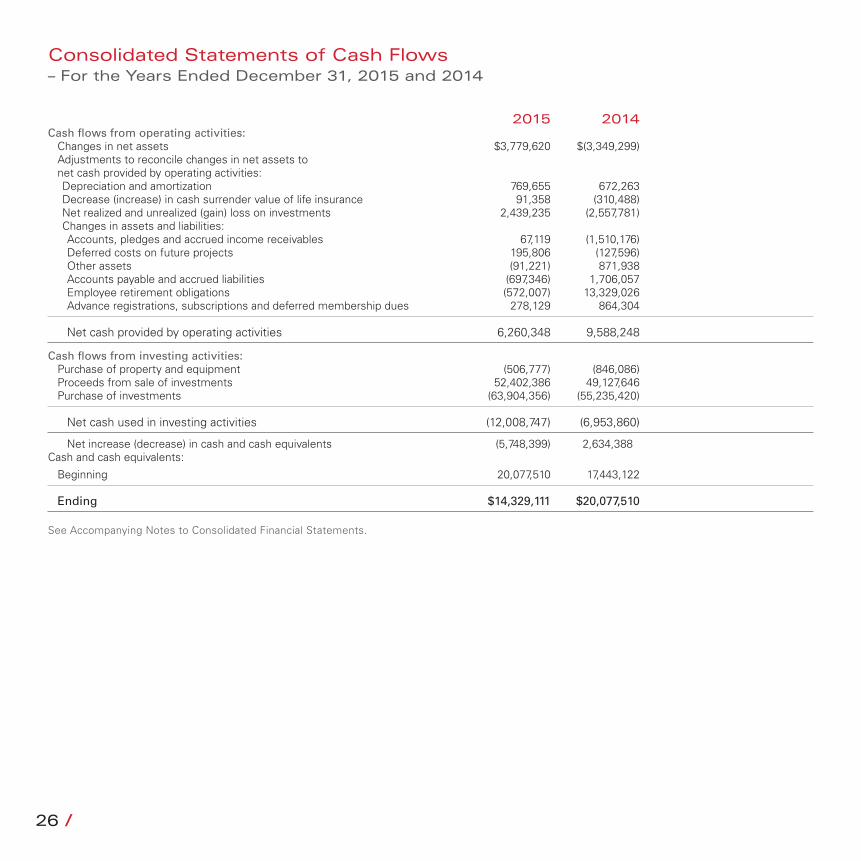
Consolidated Statements of Cash Flows – For the Years Ended December 31, 2015 and 2014
2015 2014 Cash flows from operating activities:
Changes in net assets $3,779,620 $(3,349,299)Adjustments to reconcile changes in net assets to net cash provided by operating activities:Depreciation and amortization 769,655 672,263Decrease (increase) in cash surrender value of life insurance 91,358 (310,488)Net realized and unrealized (gain) loss on investments 2,439,235 (2,557,781)Changes in assets and liabilities:Accounts, pledges and accrued income receivables 67,119 (1,510,176)Deferred costs on future projects 195,806 (127,596)Other assets (91,221) 871,938Accounts payable and accrued liabilities (697,346) 1,706,057Employee retirement obligations (572,007) 13,329,026Advance registrations, subscriptions and deferred membership dues 278,129 864,304
Net cash provided by operating activities 6,260,348 9,588,248
Cash flows from investing activities:Purchase of property and equipment (506,777) (846,086)Proceeds from sale of investments 52,402,386 49,127,646Purchase of investments (63,904,356) (55,235,420)
Net cash used in investing activities (12,008,747) (6,953,860)
Net increase (decrease) in cash and cash equivalents (5,748,399) 2,634,388 Cash and cash equivalents:
Beginning 20,077,510 17,443,122
Ending $14,329,111 $20,077,510
See Accompanying Notes to Consolidated Financial Statements.
26 / / 27
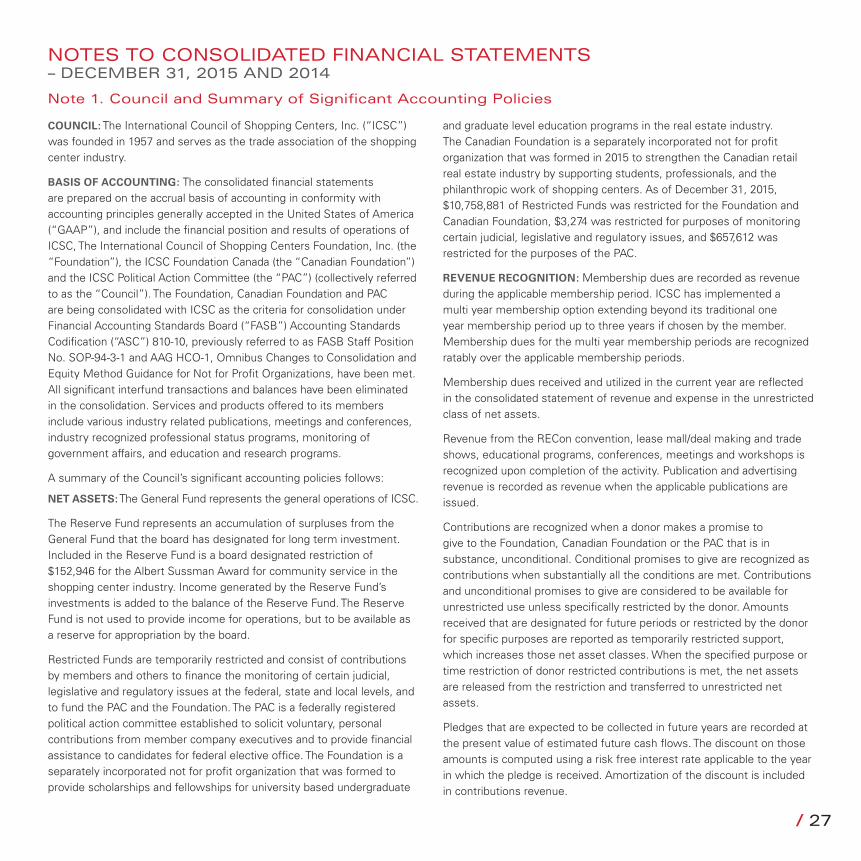
COUNCIL: The International Council of Shopping Centers, Inc. (“ICSC”) was founded in 1957 and serves as the trade association of the shopping center industry.
BASIS OF ACCOUNTING: The consolidated financial statements are prepared on the accrual basis of accounting in conformity with accounting principles generally accepted in the United States of America (“GAAP”), and include the financial position and results of operations of ICSC, The International Council of Shopping Centers Foundation, Inc. (the “Foundation”), the ICSC Foundation Canada (the “Canadian Foundation”) and the ICSC Political Action Committee (the “PAC”) (collectively referred to as the “Council”). The Foundation, Canadian Foundation and PAC are being consolidated with ICSC as the criteria for consolidation under Financial Accounting Standards Board (“FASB”) Accounting Standards Codification (“ASC”) 810-10, previously referred to as FASB Staff Position No. SOP-94-3-1 and AAG HCO-1, Omnibus Changes to Consolidation and Equity Method Guidance for Not for Profit Organizations, have been met. All significant interfund transactions and balances have been eliminated in the consolidation. Services and products offered to its members include various industry related publications, meetings and conferences, industry recognized professional status programs, monitoring of government affairs, and education and research programs.
A summary of the Council’s significant accounting policies follows:
NET ASSETS: The General Fund represents the general operations of ICSC.
The Reserve Fund represents an accumulation of surpluses from the General Fund that the board has designated for long term investment. Included in the Reserve Fund is a board designated restriction of $152,946 for the Albert Sussman Award for community service in the shopping center industry. Income generated by the Reserve Fund’s investments is added to the balance of the Reserve Fund. The Reserve Fund is not used to provide income for operations, but to be available as a reserve for appropriation by the board.
Restricted Funds are temporarily restricted and consist of contributions by members and others to finance the monitoring of certain judicial, legislative and regulatory issues at the federal, state and local levels, and to fund the PAC and the Foundation. The PAC is a federally registered political action committee established to solicit voluntary, personal contributions from member company executives and to provide financial assistance to candidates for federal elective office. The Foundation is a separately incorporated not for profit organization that was formed to provide scholarships and fellowships for university based undergraduate
and graduate level education programs in the real estate industry. The Canadian Foundation is a separately incorporated not for profit organization that was formed in 2015 to strengthen the Canadian retail real estate industry by supporting students, professionals, and the philanthropic work of shopping centers. As of December 31, 2015, $10,758,881 of Restricted Funds was restricted for the Foundation and Canadian Foundation, $3,274 was restricted for purposes of monitoring certain judicial, legislative and regulatory issues, and $657,612 was restricted for the purposes of the PAC.
REVENUE RECOGNITION: Membership dues are recorded as revenue during the applicable membership period. ICSC has implemented a multi year membership option extending beyond its traditional one year membership period up to three years if chosen by the member. Membership dues for the multi year membership periods are recognized ratably over the applicable membership periods.
Membership dues received and utilized in the current year are reflected in the consolidated statement of revenue and expense in the unrestricted class of net assets.
Revenue from the RECon convention, lease mall/deal making and trade shows, educational programs, conferences, meetings and workshops is recognized upon completion of the activity. Publication and advertising revenue is recorded as revenue when the applicable publications are issued.
Contributions are recognized when a donor makes a promise to give to the Foundation, Canadian Foundation or the PAC that is in substance, unconditional. Conditional promises to give are recognized as contributions when substantially all the conditions are met. Contributions and unconditional promises to give are considered to be available for unrestricted use unless specifically restricted by the donor. Amounts received that are designated for future periods or restricted by the donor for specific purposes are reported as temporarily restricted support, which increases those net asset classes. When the specified purpose or time restriction of donor restricted contributions is met, the net assets are released from the restriction and transferred to unrestricted net assets.
Pledges that are expected to be collected in future years are recorded at the present value of estimated future cash flows. The discount on those amounts is computed using a risk free interest rate applicable to the year in which the pledge is received. Amortization of the discount is included in contributions revenue.
NOTES TO CONSOLIDATED FINANCIAL STATEMENTS – DECEMBER 31, 2015 AND 2014
Note 1. Council and Summary of Significant Accounting Policies
28 / / 29
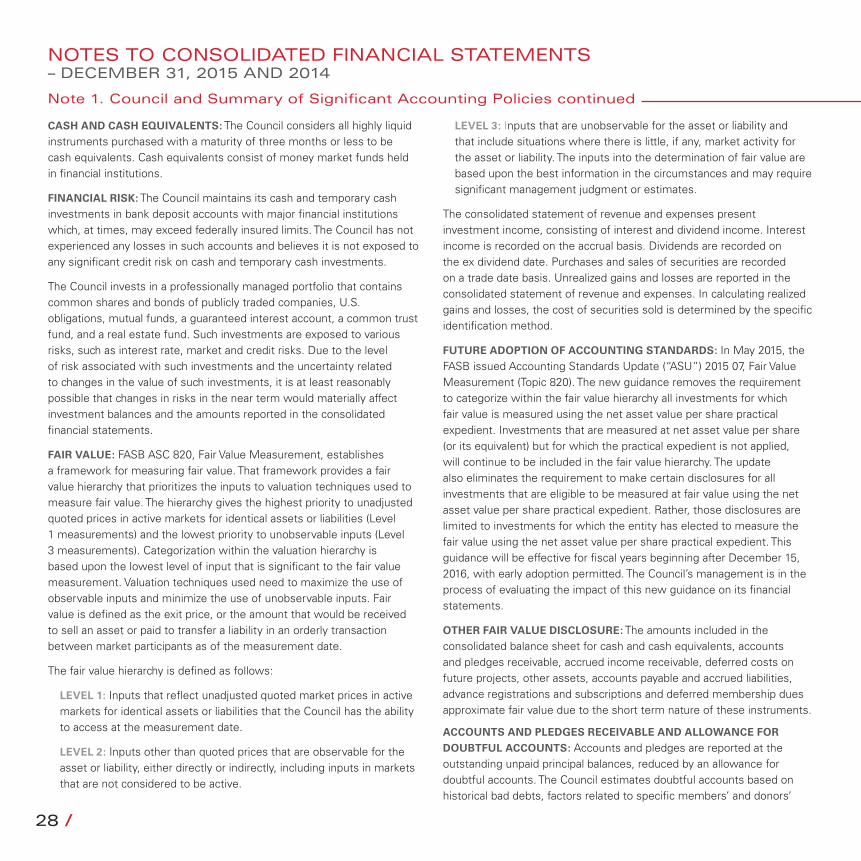
CASH AND CASH EQUIVALENTS: The Council considers all highly liquid instruments purchased with a maturity of three months or less to be cash equivalents. Cash equivalents consist of money market funds held in financial institutions.
FINANCIAL RISK: The Council maintains its cash and temporary cash investments in bank deposit accounts with major financial institutions which, at times, may exceed federally insured limits. The Council has not experienced any losses in such accounts and believes it is not exposed to any significant credit risk on cash and temporary cash investments.
The Council invests in a professionally managed portfolio that contains common shares and bonds of publicly traded companies, U.S. obligations, mutual funds, a guaranteed interest account, a common trust fund, and a real estate fund. Such investments are exposed to various risks, such as interest rate, market and credit risks. Due to the level of risk associated with such investments and the uncertainty related to changes in the value of such investments, it is at least reasonably possible that changes in risks in the near term would materially affect investment balances and the amounts reported in the consolidated financial statements.
FAIR VALUE: FASB ASC 820, Fair Value Measurement, establishes a framework for measuring fair value. That framework provides a fair value hierarchy that prioritizes the inputs to valuation techniques used to measure fair value. The hierarchy gives the highest priority to unadjusted quoted prices in active markets for identical assets or liabilities (Level 1 measurements) and the lowest priority to unobservable inputs (Level 3 measurements). Categorization within the valuation hierarchy is based upon the lowest level of input that is significant to the fair value measurement. Valuation techniques used need to maximize the use of observable inputs and minimize the use of unobservable inputs. Fair value is defined as the exit price, or the amount that would be received to sell an asset or paid to transfer a liability in an orderly transaction between market participants as of the measurement date.
The fair value hierarchy is defined as follows:
LEVEL 1: Inputs that reflect unadjusted quoted market prices in active markets for identical assets or liabilities that the Council has the ability to access at the measurement date.
LEVEL 2: Inputs other than quoted prices that are observable for the asset or liability, either directly or indirectly, including inputs in markets that are not considered to be active.
LEVEL 3: Inputs that are unobservable for the asset or liability and that include situations where there is little, if any, market activity for the asset or liability. The inputs into the determination of fair value are based upon the best information in the circumstances and may require significant management judgment or estimates.
The consolidated statement of revenue and expenses present investment income, consisting of interest and dividend income. Interest income is recorded on the accrual basis. Dividends are recorded on the ex dividend date. Purchases and sales of securities are recorded on a trade date basis. Unrealized gains and losses are reported in the consolidated statement of revenue and expenses. In calculating realized gains and losses, the cost of securities sold is determined by the specific identification method.
FUTURE ADOPTION OF ACCOUNTING STANDARDS: In May 2015, the FASB issued Accounting Standards Update (“ASU”) 2015 07, Fair Value Measurement (Topic 820). The new guidance removes the requirement to categorize within the fair value hierarchy all investments for which fair value is measured using the net asset value per share practical expedient. Investments that are measured at net asset value per share (or its equivalent) but for which the practical expedient is not applied, will continue to be included in the fair value hierarchy. The update also eliminates the requirement to make certain disclosures for all investments that are eligible to be measured at fair value using the net asset value per share practical expedient. Rather, those disclosures are limited to investments for which the entity has elected to measure the fair value using the net asset value per share practical expedient. This guidance will be effective for fiscal years beginning after December 15, 2016, with early adoption permitted. The Council’s management is in the process of evaluating the impact of this new guidance on its financial statements.
OTHER FAIR VALUE DISCLOSURE: The amounts included in the consolidated balance sheet for cash and cash equivalents, accounts and pledges receivable, accrued income receivable, deferred costs on future projects, other assets, accounts payable and accrued liabilities, advance registrations and subscriptions and deferred membership dues approximate fair value due to the short term nature of these instruments.
ACCOUNTS AND PLEDGES RECEIVABLE AND ALLOWANCE FOR
DOUBTFUL ACCOUNTS: Accounts and pledges are reported at the outstanding unpaid principal balances, reduced by an allowance for doubtful accounts. The Council estimates doubtful accounts based on historical bad debts, factors related to specific members’ and donors’
NOTES TO CONSOLIDATED FINANCIAL STATEMENTS – DECEMBER 31, 2015 AND 2014
Note 1. Council and Summary of Significant Accounting Policies continued
28 / / 29
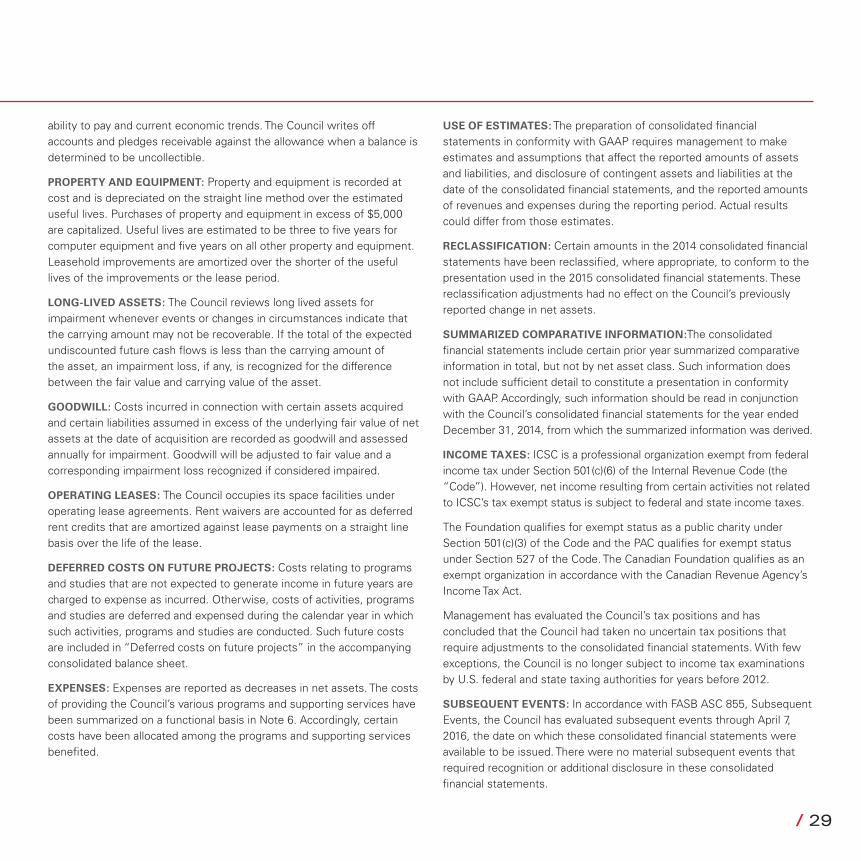
ability to pay and current economic trends. The Council writes off accounts and pledges receivable against the allowance when a balance is determined to be uncollectible.
PROPERTY AND EQUIPMENT: Property and equipment is recorded at cost and is depreciated on the straight line method over the estimated useful lives. Purchases of property and equipment in excess of $5,000 are capitalized. Useful lives are estimated to be three to five years for computer equipment and five years on all other property and equipment. Leasehold improvements are amortized over the shorter of the useful lives of the improvements or the lease period.
LONG-LIVED ASSETS: The Council reviews long lived assets for impairment whenever events or changes in circumstances indicate that the carrying amount may not be recoverable. If the total of the expected undiscounted future cash flows is less than the carrying amount of the asset, an impairment loss, if any, is recognized for the difference between the fair value and carrying value of the asset.
GOODWILL: Costs incurred in connection with certain assets acquired and certain liabilities assumed in excess of the underlying fair value of net assets at the date of acquisition are recorded as goodwill and assessed annually for impairment. Goodwill will be adjusted to fair value and a corresponding impairment loss recognized if considered impaired.
OPERATING LEASES: The Council occupies its space facilities under operating lease agreements. Rent waivers are accounted for as deferred rent credits that are amortized against lease payments on a straight line basis over the life of the lease.
DEFERRED COSTS ON FUTURE PROJECTS: Costs relating to programs and studies that are not expected to generate income in future years are charged to expense as incurred. Otherwise, costs of activities, programs and studies are deferred and expensed during the calendar year in which such activities, programs and studies are conducted. Such future costs are included in “Deferred costs on future projects” in the accompanying consolidated balance sheet.
EXPENSES: Expenses are reported as decreases in net assets. The costs of providing the Council’s various programs and supporting services have been summarized on a functional basis in Note 6. Accordingly, certain costs have been allocated among the programs and supporting services benefited.
USE OF ESTIMATES: The preparation of consolidated financial statements in conformity with GAAP requires management to make estimates and assumptions that affect the reported amounts of assets and liabilities, and disclosure of contingent assets and liabilities at the date of the consolidated financial statements, and the reported amounts of revenues and expenses during the reporting period. Actual results could differ from those estimates.
RECLASSIFICATION: Certain amounts in the 2014 consolidated financial statements have been reclassified, where appropriate, to conform to the presentation used in the 2015 consolidated financial statements. These reclassification adjustments had no effect on the Council’s previously reported change in net assets.
SUMMARIZED COMPARATIVE INFORMATION:The consolidated financial statements include certain prior year summarized comparative information in total, but not by net asset class. Such information does not include sufficient detail to constitute a presentation in conformity with GAAP. Accordingly, such information should be read in conjunction with the Council’s consolidated financial statements for the year ended December 31, 2014, from which the summarized information was derived.
INCOME TAXES: ICSC is a professional organization exempt from federal income tax under Section 501(c)(6) of the Internal Revenue Code (the “Code”). However, net income resulting from certain activities not related to ICSC’s tax exempt status is subject to federal and state income taxes.
The Foundation qualifies for exempt status as a public charity under Section 501(c)(3) of the Code and the PAC qualifies for exempt status under Section 527 of the Code. The Canadian Foundation qualifies as an exempt organization in accordance with the Canadian Revenue Agency’s Income Tax Act.
Management has evaluated the Council’s tax positions and has concluded that the Council had taken no uncertain tax positions that require adjustments to the consolidated financial statements. With few exceptions, the Council is no longer subject to income tax examinations by U.S. federal and state taxing authorities for years before 2012.
SUBSEQUENT EVENTS: In accordance with FASB ASC 855, Subsequent Events, the Council has evaluated subsequent events through April 7, 2016, the date on which these consolidated financial statements were available to be issued. There were no material subsequent events that required recognition or additional disclosure in these consolidated financial statements.
30 / / 31
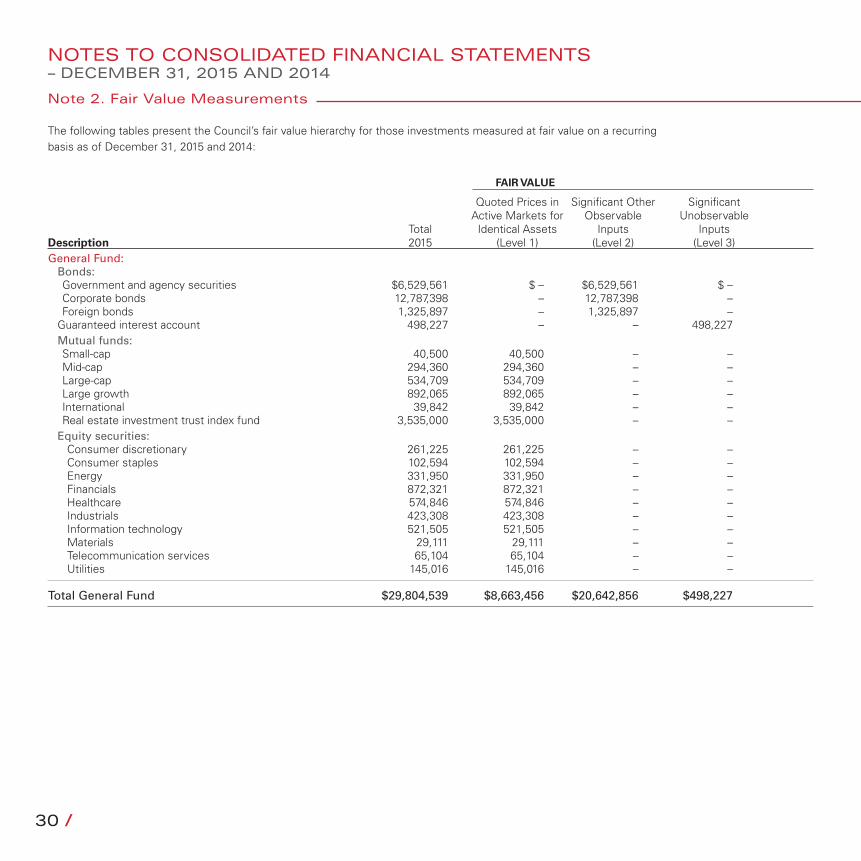
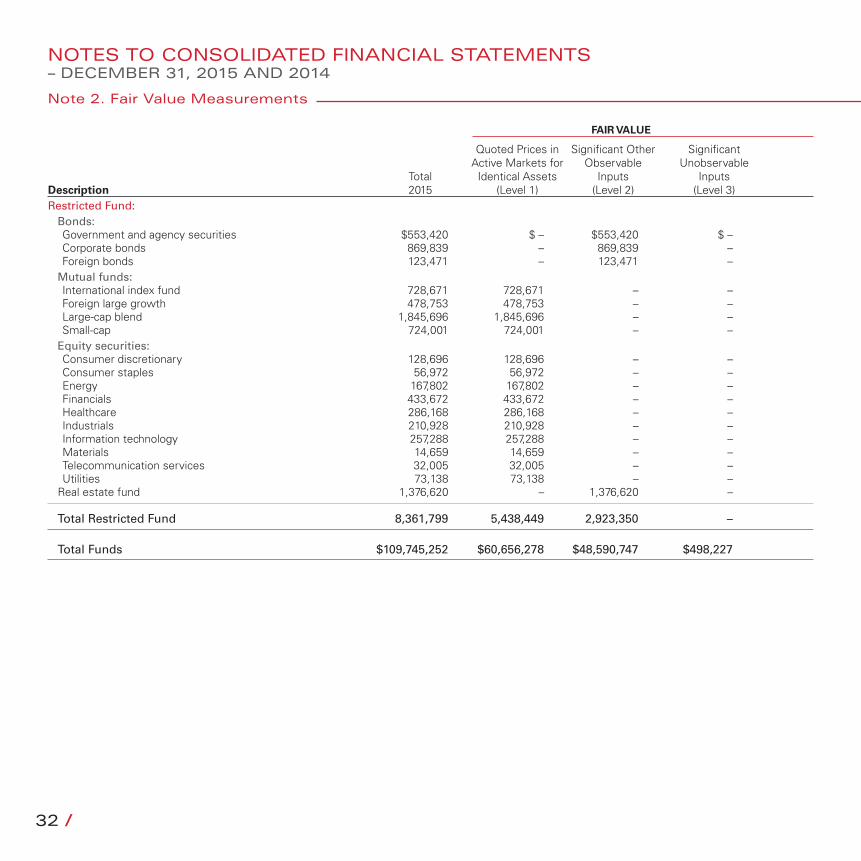
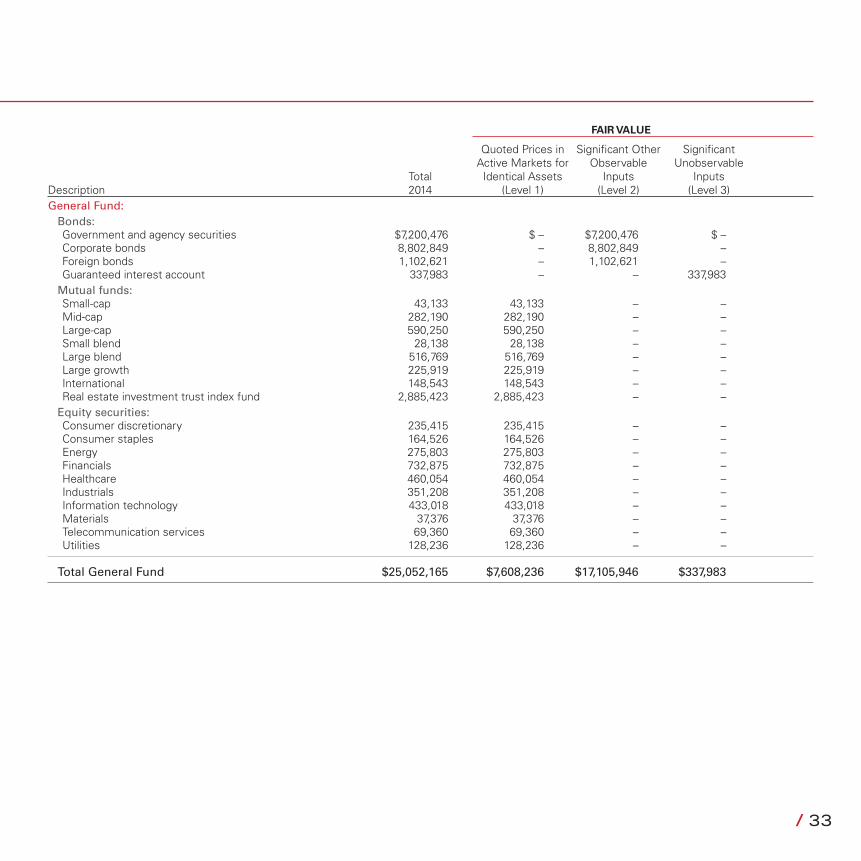
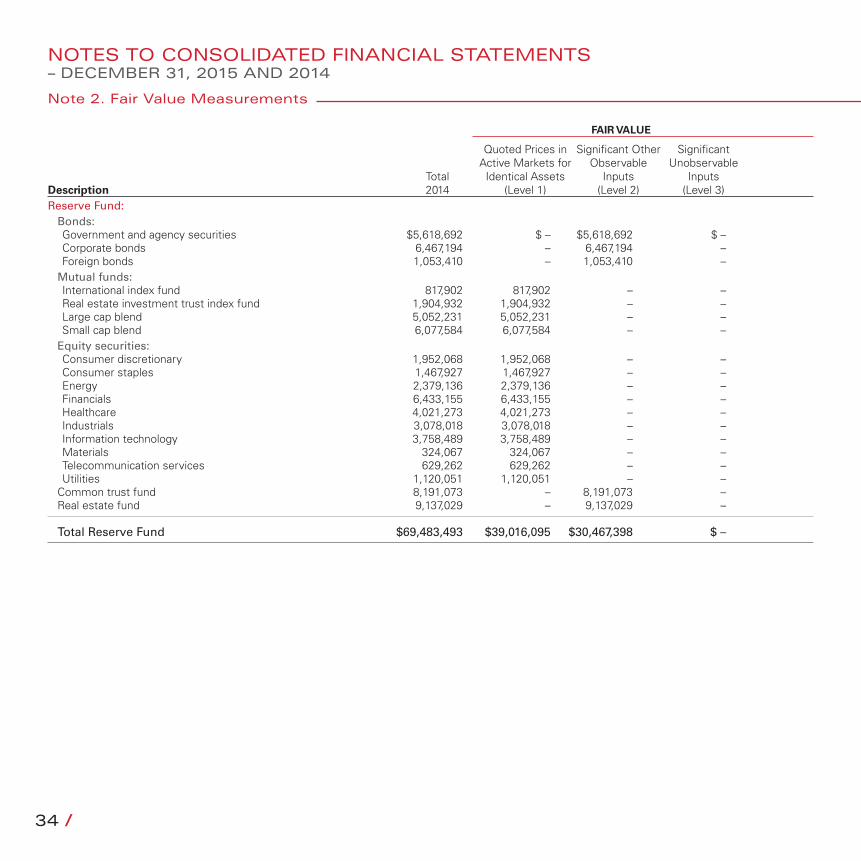
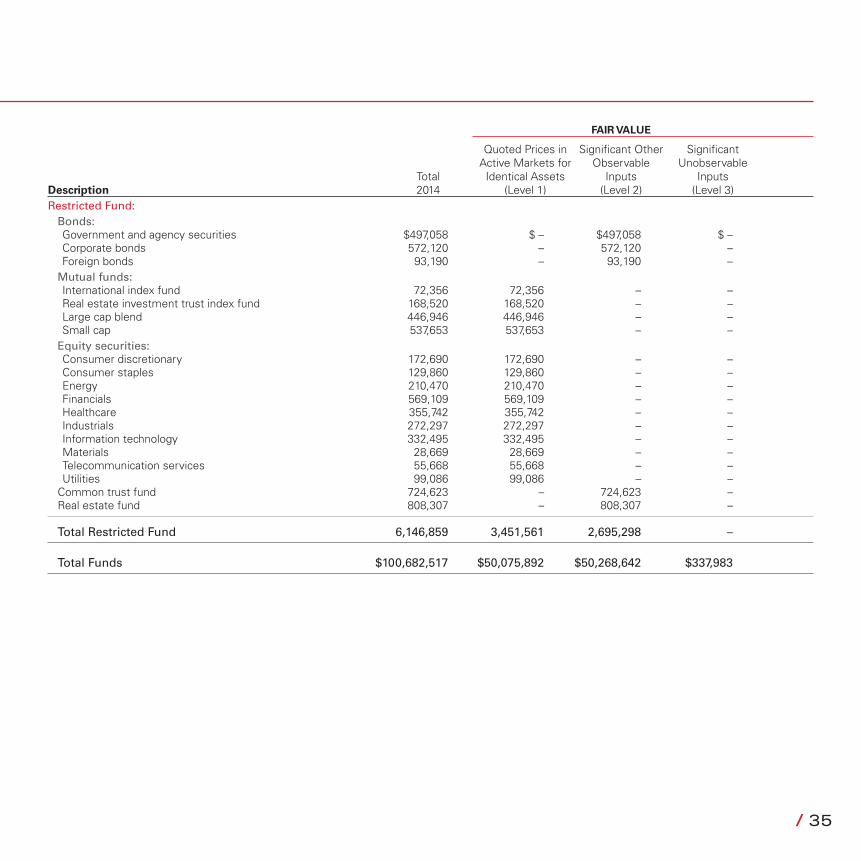
The following tables present the Council’s fair value hierarchy for those investments measured at fair value on a recurring basis as of December 31, 2015 and 2014:
FAIR VALUE
Quoted Prices in Significant Other Significant Active Markets for Observable Unobservable Total Identical Assets Inputs Inputs Description 2015 (Level 1) (Level 2) (Level 3)General Fund:
Bonds:Government and agency securities $6,529,561 $ – $6,529,561 $ – Corporate bonds 12,787,398 – 12,787,398 – Foreign bonds 1,325,897 – 1,325,897 –
Guaranteed interest account 498,227 – – 498,227Mutual funds:Small-cap 40,500 40,500 – – Mid-cap 294,360 294,360 – – Large-cap 534,709 534,709 – – Large growth 892,065 892,065 – – International 39,842 39,842 – – Real estate investment trust index fund 3,535,000 3,535,000 – –
Equity securities:Consumer discretionary 261,225 261,225 – – Consumer staples 102,594 102,594 – – Energy 331,950 331,950 – – Financials 872,321 872,321 – – Healthcare 574,846 574,846 – – Industrials 423,308 423,308 – – Information technology 521,505 521,505 – – Materials 29,111 29,111 – – Telecommunication services 65,104 65,104 – – Utilities 145,016 145,016 – –
Total General Fund $29,804,539 $8,663,456 $20,642,856 $498,227
NOTES TO CONSOLIDATED FINANCIAL STATEMENTS – DECEMBER 31, 2015 AND 2014
Note 2. Fair Value Measurements
30 / / 31
FAIR VALUE
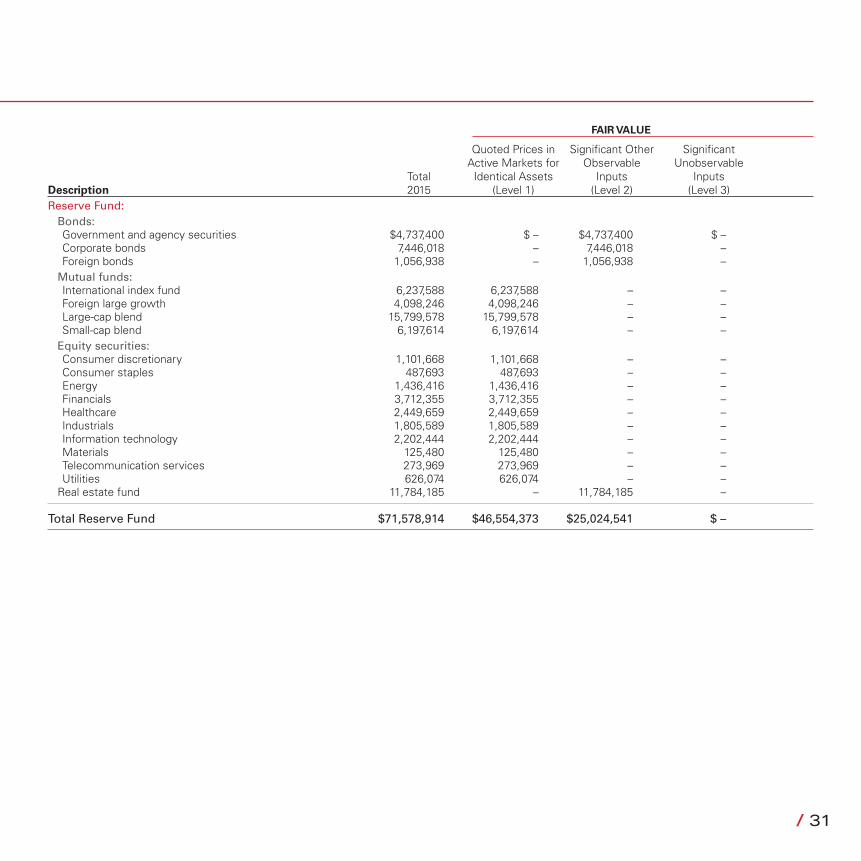
Quoted Prices in Significant Other Significant Active Markets for Observable Unobservable Total Identical Assets Inputs Inputs Description 2015 (Level 1) (Level 2) (Level 3)Reserve Fund:
Bonds:Government and agency securities $4,737,400 $ – $4,737,400 $ – Corporate bonds 7,446,018 – 7,446,018 – Foreign bonds 1,056,938 – 1,056,938 –
Mutual funds:International index fund 6,237,588 6,237,588 – – Foreign large growth 4,098,246 4,098,246 – – Large-cap blend 15,799,578 15,799,578 – – Small-cap blend 6,197,614 6,197,614 – –
Equity securities:Consumer discretionary 1,101,668 1,101,668 – – Consumer staples 487,693 487,693 – – Energy 1,436,416 1,436,416 – – Financials 3,712,355 3,712,355 – – Healthcare 2,449,659 2,449,659 – – Industrials 1,805,589 1,805,589 – – Information technology 2,202,444 2,202,444 – – Materials 125,480 125,480 – – Telecommunication services 273,969 273,969 – – Utilities 626,074 626,074 – –
Real estate fund 11,784,185 – 11,784,185 –
Total Reserve Fund $71,578,914 $46,554,373 $25,024,541 $ –
32 / / 33
FAIR VALUE
Quoted Prices in Significant Other Significant Active Markets for Observable Unobservable Total Identical Assets Inputs Inputs Description 2015 (Level 1) (Level 2) (Level 3)Restricted Fund:
Bonds:Government and agency securities $553,420 $ – $553,420 $ – Corporate bonds 869,839 – 869,839 – Foreign bonds 123,471 – 123,471 –
Mutual funds:International index fund 728,671 728,671 – – Foreign large growth 478,753 478,753 – – Large-cap blend 1,845,696 1,845,696 – – Small-cap 724,001 724,001 – –
Equity securities:Consumer discretionary 128,696 128,696 – – Consumer staples 56,972 56,972 – – Energy 167,802 167,802 – – Financials 433,672 433,672 – – Healthcare 286,168 286,168 – – Industrials 210,928 210,928 – – Information technology 257,288 257,288 – – Materials 14,659 14,659 – – Telecommunication services 32,005 32,005 – – Utilities 73,138 73,138 – –
Real estate fund 1,376,620 – 1,376,620 –
Total Restricted Fund 8,361,799 5,438,449 2,923,350 –
Total Funds $109,745,252 $60,656,278 $48,590,747 $498,227
NOTES TO CONSOLIDATED FINANCIAL STATEMENTS – DECEMBER 31, 2015 AND 2014
Note 2. Fair Value Measurements
32 / / 33
FAIR VALUE
Quoted Prices in Significant Other Significant Active Markets for Observable Unobservable Total Identical Assets Inputs Inputs Description 2014 (Level 1) (Level 2) (Level 3)General Fund:
Bonds:Government and agency securities $7,200,476 $ – $7,200,476 $ – Corporate bonds 8,802,849 – 8,802,849 – Foreign bonds 1,102,621 – 1,102,621 – Guaranteed interest account 337,983 – – 337,983
Mutual funds:Small-cap 43,133 43,133 – – Mid-cap 282,190 282,190 – – Large-cap 590,250 590,250 – – Small blend 28,138 28,138 – – Large blend 516,769 516,769 – – Large growth 225,919 225,919 – – International 148,543 148,543 – – Real estate investment trust index fund 2,885,423 2,885,423 – –
Equity securities:Consumer discretionary 235,415 235,415 – – Consumer staples 164,526 164,526 – – Energy 275,803 275,803 – – Financials 732,875 732,875 – – Healthcare 460,054 460,054 – – Industrials 351,208 351,208 – – Information technology 433,018 433,018 – – Materials 37,376 37,376 – – Telecommunication services 69,360 69,360 – – Utilities 128,236 128,236 – –
Total General Fund $25,052,165 $7,608,236 $17,105,946 $337,983
34 / / 35
FAIR VALUE
Quoted Prices in Significant Other Significant Active Markets for Observable Unobservable Total Identical Assets Inputs Inputs Description 2014 (Level 1) (Level 2) (Level 3)Reserve Fund:
Bonds:Government and agency securities $5,618,692 $ – $5,618,692 $ –Corporate bonds 6,467,194 – 6,467,194 – Foreign bonds 1,053,410 – 1,053,410 –
Mutual funds:International index fund 817,902 817,902 – – Real estate investment trust index fund 1,904,932 1,904,932 – – Large cap blend 5,052,231 5,052,231 – – Small cap blend 6,077,584 6,077,584 – –
Equity securities:Consumer discretionary 1,952,068 1,952,068 – – Consumer staples 1,467,927 1,467,927 – – Energy 2,379,136 2,379,136 – – Financials 6,433,155 6,433,155 – – Healthcare 4,021,273 4,021,273 – – Industrials 3,078,018 3,078,018 – – Information technology 3,758,489 3,758,489 – – Materials 324,067 324,067 – – Telecommunication services 629,262 629,262 – – Utilities 1,120,051 1,120,051 – –
Common trust fund 8,191,073 – 8,191,073 – Real estate fund 9,137,029 – 9,137,029 –
Total Reserve Fund $69,483,493 $39,016,095 $30,467,398 $ –
NOTES TO CONSOLIDATED FINANCIAL STATEMENTS – DECEMBER 31, 2015 AND 2014
Note 2. Fair Value Measurements
34 / / 35
FAIR VALUE
Quoted Prices in Significant Other Significant Active Markets for Observable Unobservable Total Identical Assets Inputs Inputs Description 2014 (Level 1) (Level 2) (Level 3)Restricted Fund:
Bonds: Government and agency securities $497,058 $ – $497,058 $ – Corporate bonds 572,120 – 572,120 – Foreign bonds 93,190 – 93,190 –
Mutual funds:International index fund 72,356 72,356 – – Real estate investment trust index fund 168,520 168,520 – – Large cap blend 446,946 446,946 – – Small cap 537,653 537,653 – –
Equity securities:Consumer discretionary 172,690 172,690 – – Consumer staples 129,860 129,860 – – Energy 210,470 210,470 – – Financials 569,109 569,109 – – Healthcare 355,742 355,742 – – Industrials 272,297 272,297 – – Information technology 332,495 332,495 – – Materials 28,669 28,669 – – Telecommunication services 55,668 55,668 – – Utilities 99,086 99,086 – –
Common trust fund 724,623 – 724,623 – Real estate fund 808,307 – 808,307 –
Total Restricted Fund 6,146,859 3,451,561 2,695,298 –
Total Funds $100,682,517 $50,075,892 $50,268,642 $337,983
36 / / 37
NOTES TO CONSOLIDATED FINANCIAL STATEMENTS – DECEMBER 31, 2015 AND 2014
Note 2. Fair Value Measurements
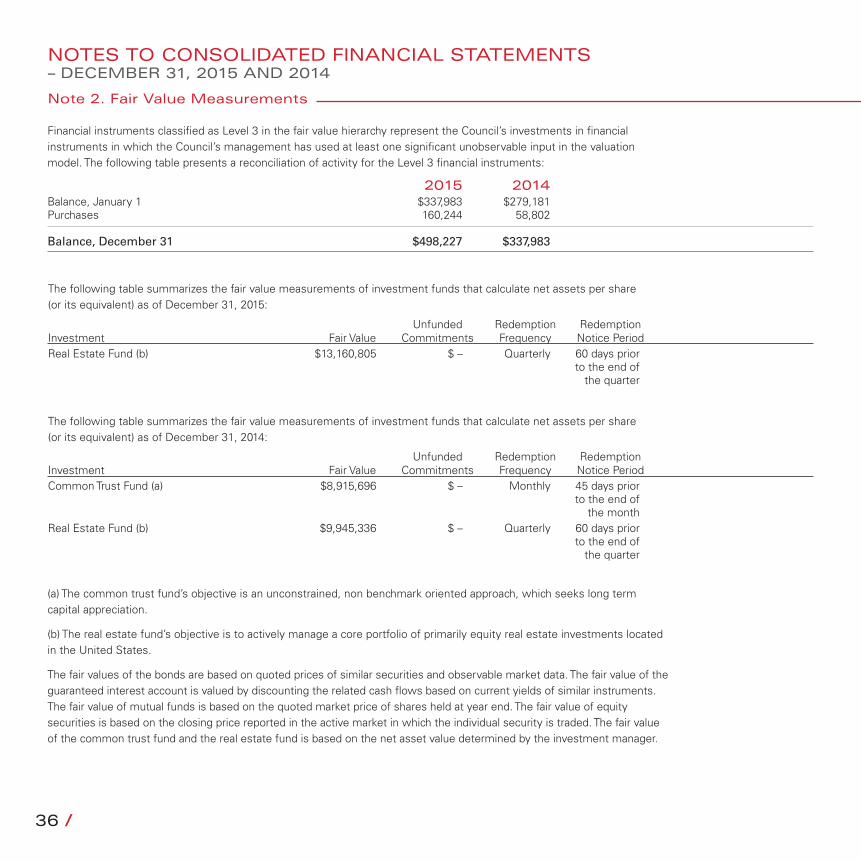
Financial instruments classified as Level 3 in the fair value hierarchy represent the Council’s investments in financial instruments in which the Council’s management has used at least one significant unobservable input in the valuation model. The following table presents a reconciliation of activity for the Level 3 financial instruments:
Unfunded Redemption Redemption Investment Fair Value Commitments Frequency Notice PeriodReal Estate Fund (b) $13,160,805 $ – Quarterly 60 days prior to the end of the quarter
The following table summarizes the fair value measurements of investment funds that calculate net assets per share (or its equivalent) as of December 31, 2015:
(a) The common trust fund’s objective is an unconstrained, non benchmark oriented approach, which seeks long term capital appreciation.
(b) The real estate fund’s objective is to actively manage a core portfolio of primarily equity real estate investments located in the United States.
The fair values of the bonds are based on quoted prices of similar securities and observable market data. The fair value of the guaranteed interest account is valued by discounting the related cash flows based on current yields of similar instruments. The fair value of mutual funds is based on the quoted market price of shares held at year end. The fair value of equity securities is based on the closing price reported in the active market in which the individual security is traded. The fair value of the common trust fund and the real estate fund is based on the net asset value determined by the investment manager.
2015 2014Balance, January 1 $337,983 $279,181Purchases 160,244 58,802
Balance, December 31 $498,227 $337,983
The following table summarizes the fair value measurements of investment funds that calculate net assets per share (or its equivalent) as of December 31, 2014:
Unfunded Redemption Redemption Investment Fair Value Commitments Frequency Notice PeriodCommon Trust Fund (a) $8,915,696 $ – Monthly 45 days prior to the end of the monthReal Estate Fund (b) $9,945,336 $ – Quarterly 60 days prior to the end of the quarter
36 / / 37
Note 3. Employee Benefits
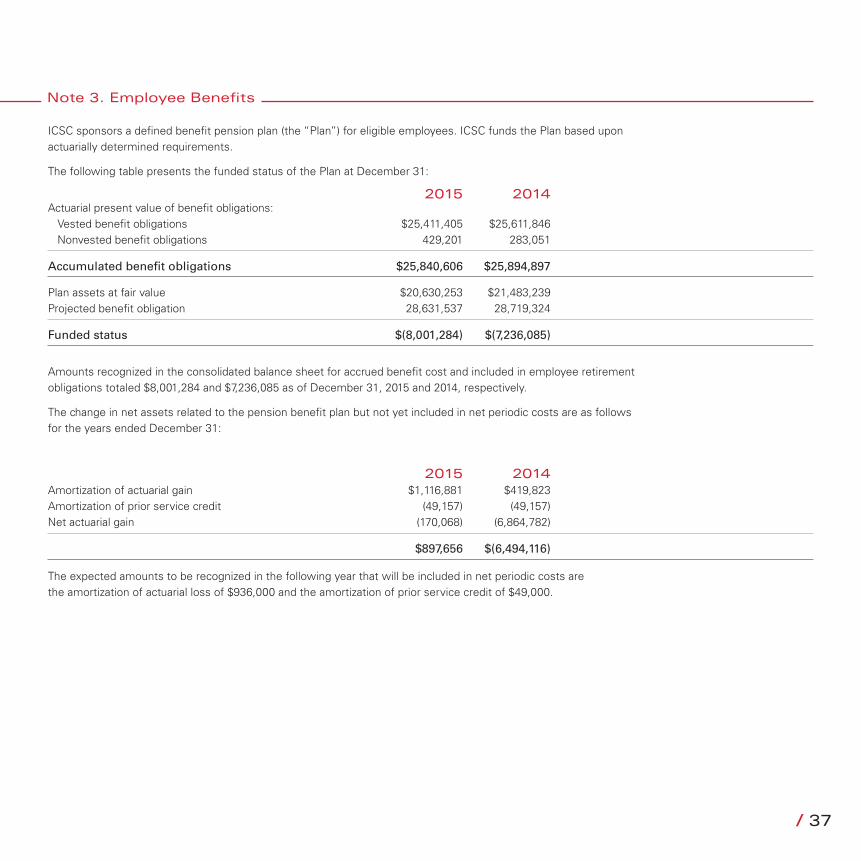
ICSC sponsors a defined benefit pension plan (the “Plan”) for eligible employees. ICSC funds the Plan based upon actuarially determined requirements.
The following table presents the funded status of the Plan at December 31:
2015 2014Actuarial present value of benefit obligations:
Vested benefit obligations $25,411,405 $25,611,846Nonvested benefit obligations 429,201 283,051
Accumulated benefit obligations $25,840,606 $25,894,897
Plan assets at fair value $20,630,253 $21,483,239Projected benefit obligation 28,631,537 28,719,324
Funded status $(8,001,284) $(7,236,085)
Amounts recognized in the consolidated balance sheet for accrued benefit cost and included in employee retirement obligations totaled $8,001,284 and $7,236,085 as of December 31, 2015 and 2014, respectively.
The change in net assets related to the pension benefit plan but not yet included in net periodic costs are as follows for the years ended December 31:
2015 2014Amortization of actuarial gain $1,116,881 $419,823Amortization of prior service credit (49,157) (49,157)Net actuarial gain (170,068) (6,864,782)
$897,656 $(6,494,116)
The expected amounts to be recognized in the following year that will be included in net periodic costs are the amortization of actuarial loss of $936,000 and the amortization of prior service credit of $49,000.
38 / / 39
NOTES TO CONSOLIDATED FINANCIAL STATEMENTS – DECEMBER 31, 2015 AND 2014
Note 3. Employee Benefits
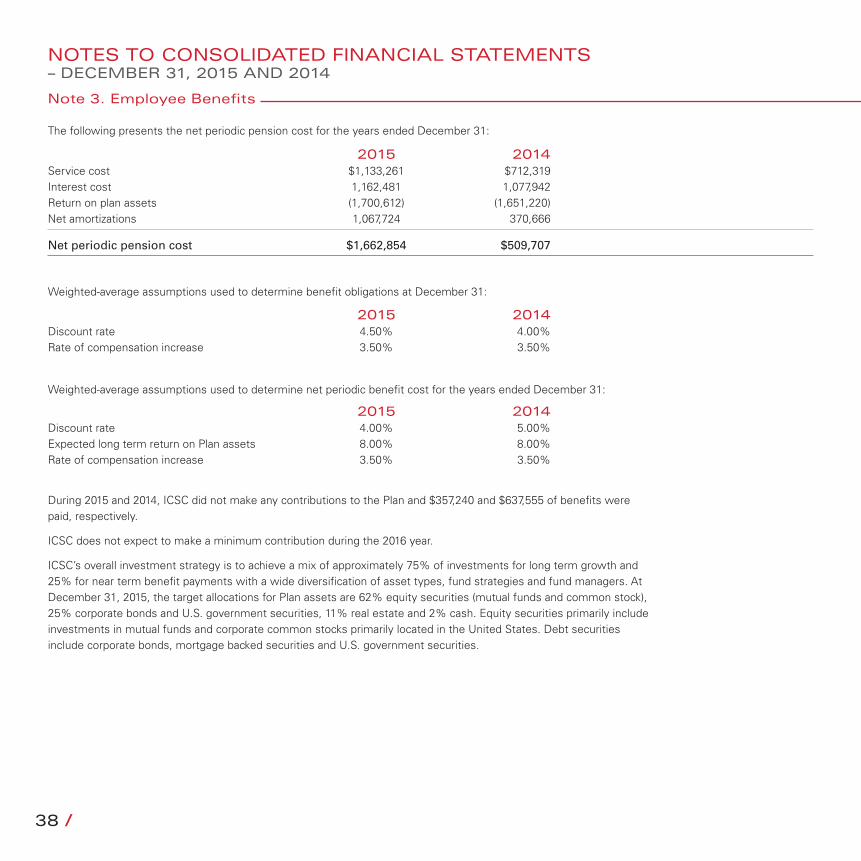
2015 2014Service cost $1,133,261 $712,319Interest cost 1,162,481 1,077,942Return on plan assets (1,700,612) (1,651,220)Net amortizations 1,067,724 370,666
Net periodic pension cost $1,662,854 $509,707
The following presents the net periodic pension cost for the years ended December 31:
Weighted-average assumptions used to determine benefit obligations at December 31:
Weighted-average assumptions used to determine net periodic benefit cost for the years ended December 31:
2015 2014Discount rate 4.50% 4.00%Rate of compensation increase 3.50% 3.50%
2015 2014Discount rate 4.00% 5.00%Expected long term return on Plan assets 8.00% 8.00%Rate of compensation increase 3.50% 3.50%
During 2015 and 2014, ICSC did not make any contributions to the Plan and $357,240 and $637,555 of benefits were paid, respectively.
ICSC does not expect to make a minimum contribution during the 2016 year.
ICSC’s overall investment strategy is to achieve a mix of approximately 75% of investments for long term growth and 25% for near term benefit payments with a wide diversification of asset types, fund strategies and fund managers. At December 31, 2015, the target allocations for Plan assets are 62% equity securities (mutual funds and common stock), 25% corporate bonds and U.S. government securities, 11% real estate and 2% cash. Equity securities primarily include investments in mutual funds and corporate common stocks primarily located in the United States. Debt securities include corporate bonds, mortgage backed securities and U.S. government securities.
38 / / 39
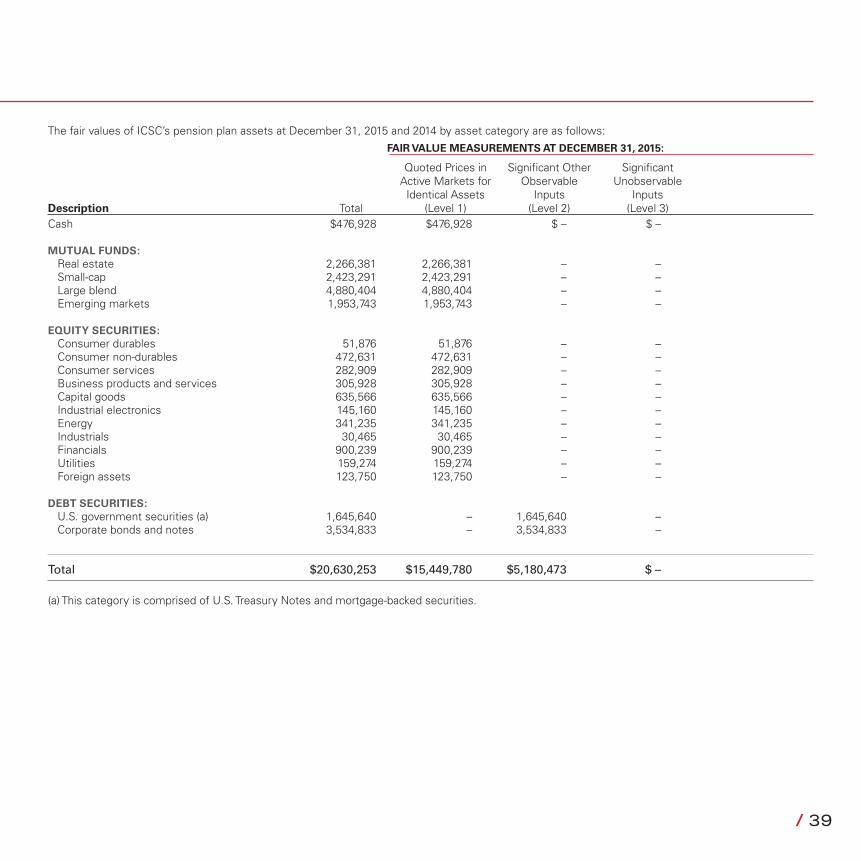
The fair values of ICSC’s pension plan assets at December 31, 2015 and 2014 by asset category are as follows:
FAIR VALUE MEASUREMENTS AT DECEMBER 31, 2015:
Quoted Prices in Significant Other Significant Active Markets for Observable Unobservable Identical Assets Inputs Inputs Description Total (Level 1) (Level 2) (Level 3)Cash $476,928 $476,928 $ – $ –
MUTUAL FUNDS:Real estate 2,266,381 2,266,381 – – Small-cap 2,423,291 2,423,291 – – Large blend 4,880,404 4,880,404 – – Emerging markets 1,953,743 1,953,743 – –
EQUITY SECURITIES:Consumer durables 51,876 51,876 – – Consumer non-durables 472,631 472,631 – – Consumer services 282,909 282,909 – – Business products and services 305,928 305,928 – – Capital goods 635,566 635,566 – – Industrial electronics 145,160 145,160 – – Energy 341,235 341,235 – – Industrials 30,465 30,465 – – Financials 900,239 900,239 – – Utilities 159,274 159,274 – – Foreign assets 123,750 123,750 – –
DEBT SECURITIES:U.S. government securities (a) 1,645,640 – 1,645,640 – Corporate bonds and notes 3,534,833 – 3,534,833 –
Total $20,630,253 $15,449,780 $5,180,473 $ –
(a) This category is comprised of U.S. Treasury Notes and mortgage-backed securities.
40 / / 41
NOTES TO CONSOLIDATED FINANCIAL STATEMENTS – DECEMBER 31, 2015 AND 2014
Note 3. Employee Benefits
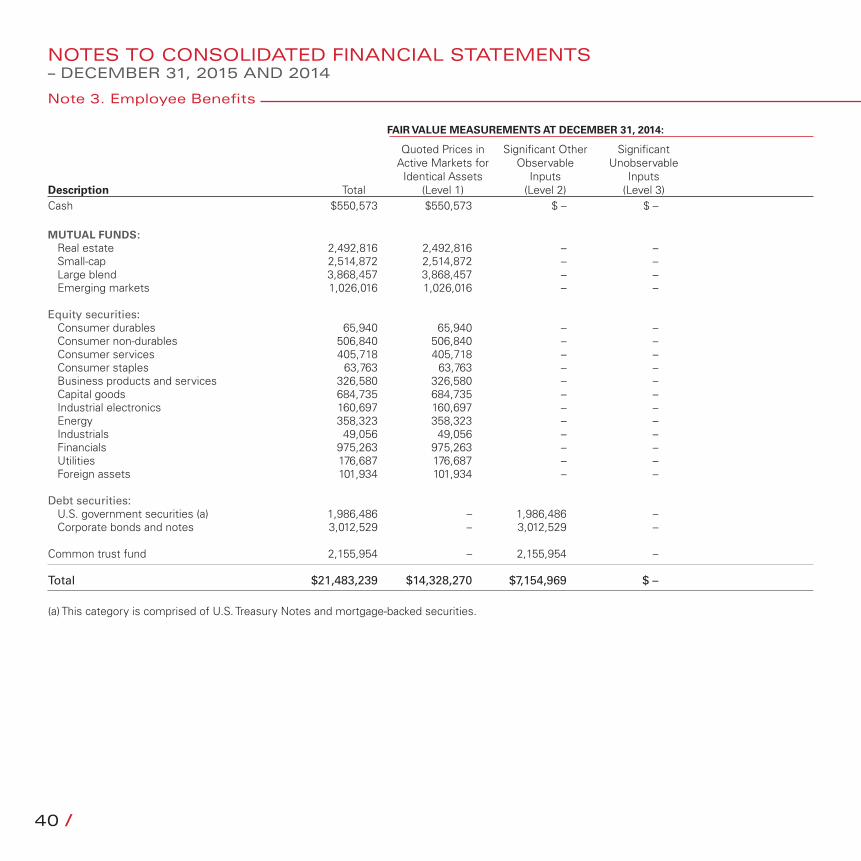
FAIR VALUE MEASUREMENTS AT DECEMBER 31, 2014:
Quoted Prices in Significant Other Significant Active Markets for Observable Unobservable Identical Assets Inputs Inputs Description Total (Level 1) (Level 2) (Level 3)Cash $550,573 $550,573 $ – $ –
MUTUAL FUNDS:Real estate 2,492,816 2,492,816 – – Small-cap 2,514,872 2,514,872 – – Large blend 3,868,457 3,868,457 – – Emerging markets 1,026,016 1,026,016 – –
Equity securities:Consumer durables 65,940 65,940 – – Consumer non-durables 506,840 506,840 – – Consumer services 405,718 405,718 – – Consumer staples 63,763 63,763 – – Business products and services 326,580 326,580 – – Capital goods 684,735 684,735 – – Industrial electronics 160,697 160,697 – – Energy 358,323 358,323 – – Industrials 49,056 49,056 – – Financials 975,263 975,263 – – Utilities 176,687 176,687 – – Foreign assets 101,934 101,934 – –
Debt securities:U.S. government securities (a) 1,986,486 – 1,986,486 – Corporate bonds and notes 3,012,529 – 3,012,529 –
Common trust fund 2,155,954 – 2,155,954 –
Total $21,483,239 $14,328,270 $7,154,969 $ –
(a) This category is comprised of U.S. Treasury Notes and mortgage-backed securities.
40 / / 41
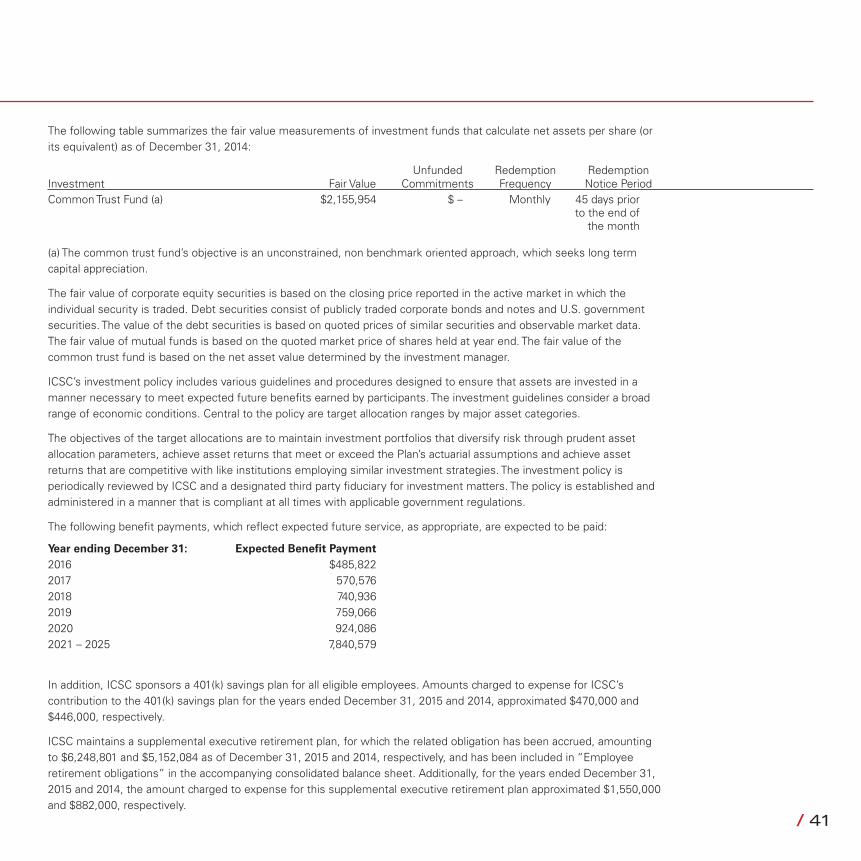
The following table summarizes the fair value measurements of investment funds that calculate net assets per share (or its equivalent) as of December 31, 2014:
Unfunded Redemption Redemption Investment Fair Value Commitments Frequency Notice PeriodCommon Trust Fund (a) $2,155,954 $ – Monthly 45 days prior to the end of the month
(a) The common trust fund’s objective is an unconstrained, non benchmark oriented approach, which seeks long term capital appreciation.
The fair value of corporate equity securities is based on the closing price reported in the active market in which the individual security is traded. Debt securities consist of publicly traded corporate bonds and notes and U.S. government securities. The value of the debt securities is based on quoted prices of similar securities and observable market data. The fair value of mutual funds is based on the quoted market price of shares held at year end. The fair value of the common trust fund is based on the net asset value determined by the investment manager.
ICSC’s investment policy includes various guidelines and procedures designed to ensure that assets are invested in a manner necessary to meet expected future benefits earned by participants. The investment guidelines consider a broad range of economic conditions. Central to the policy are target allocation ranges by major asset categories.
The objectives of the target allocations are to maintain investment portfolios that diversify risk through prudent asset allocation parameters, achieve asset returns that meet or exceed the Plan’s actuarial assumptions and achieve asset returns that are competitive with like institutions employing similar investment strategies. The investment policy is periodically reviewed by ICSC and a designated third party fiduciary for investment matters. The policy is established and administered in a manner that is compliant at all times with applicable government regulations.
The following benefit payments, which reflect expected future service, as appropriate, are expected to be paid:
Year ending December 31: Expected Benefit Payment2016 $485,8222017 570,5762018 740,9362019 759,0662020 924,0862021 – 2025 7,840,579
In addition, ICSC sponsors a 401(k) savings plan for all eligible employees. Amounts charged to expense for ICSC’s contribution to the 401(k) savings plan for the years ended December 31, 2015 and 2014, approximated $470,000 and $446,000, respectively.
ICSC maintains a supplemental executive retirement plan, for which the related obligation has been accrued, amounting to $6,248,801 and $5,152,084 as of December 31, 2015 and 2014, respectively, and has been included in “Employee retirement obligations” in the accompanying consolidated balance sheet. Additionally, for the years ended December 31, 2015 and 2014, the amount charged to expense for this supplemental executive retirement plan approximated $1,550,000 and $882,000, respectively.
42 / / 43
NOTES TO CONSOLIDATED FINANCIAL STATEMENTS – DECEMBER 31, 2015 AND 2014
Note 4. Post-retirement Medical Plan
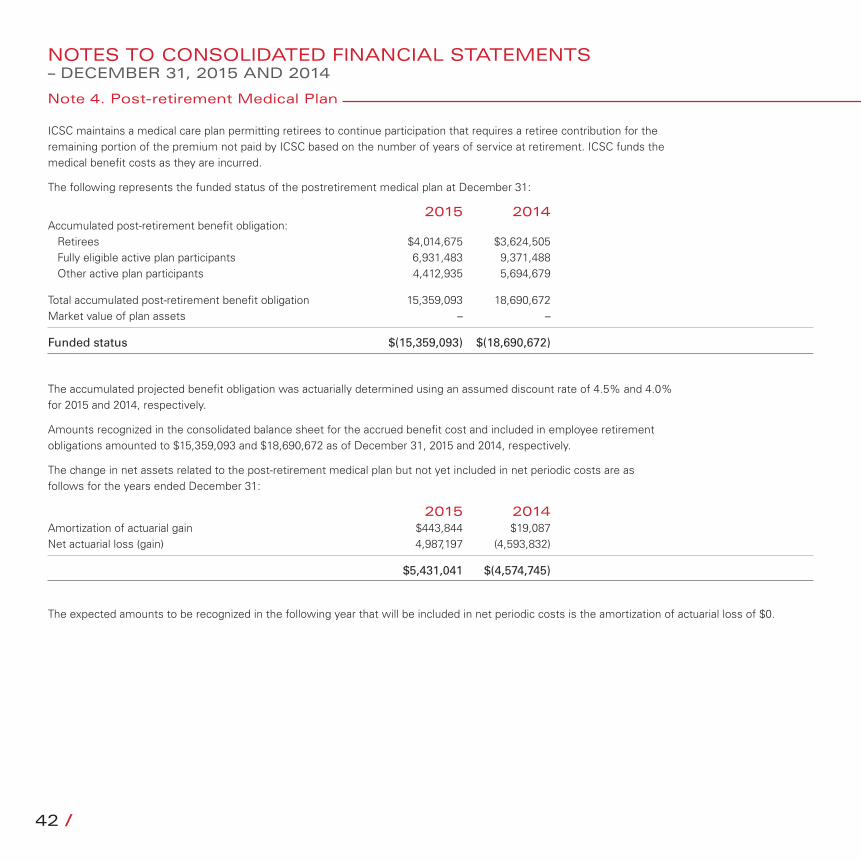
ICSC maintains a medical care plan permitting retirees to continue participation that requires a retiree contribution for the remaining portion of the premium not paid by ICSC based on the number of years of service at retirement. ICSC funds the medical benefit costs as they are incurred.
The following represents the funded status of the postretirement medical plan at December 31:
2015 2014Accumulated post-retirement benefit obligation:
Retirees $4,014,675 $3,624,505 Fully eligible active plan participants 6,931,483 9,371,488 Other active plan participants 4,412,935 5,694,679
Total accumulated post-retirement benefit obligation 15,359,093 18,690,672 Market value of plan assets – –
Funded status $(15,359,093) $(18,690,672)
The accumulated projected benefit obligation was actuarially determined using an assumed discount rate of 4.5% and 4.0% for 2015 and 2014, respectively.
Amounts recognized in the consolidated balance sheet for the accrued benefit cost and included in employee retirement obligations amounted to $15,359,093 and $18,690,672 as of December 31, 2015 and 2014, respectively.
The change in net assets related to the post-retirement medical plan but not yet included in net periodic costs are as follows for the years ended December 31:
2015 2014Amortization of actuarial gain $443,844 $19,087Net actuarial loss (gain) 4,987,197 (4,593,832)
$5,431,041 $(4,574,745)
The expected amounts to be recognized in the following year that will be included in net periodic costs is the amortization of actuarial loss of $0.
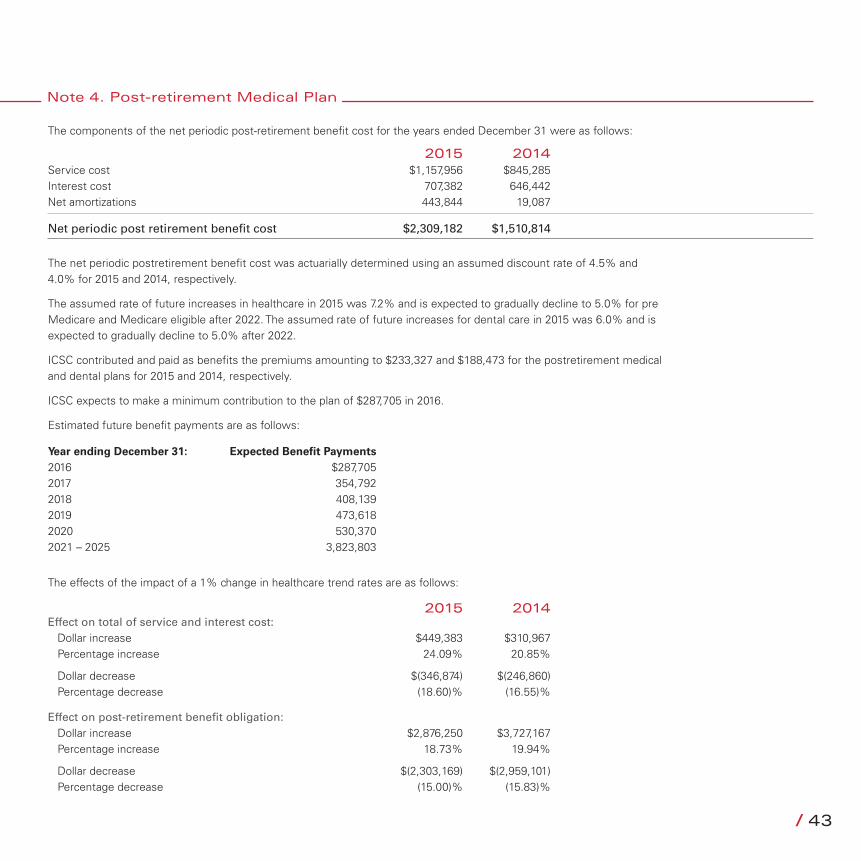
42 / / 43
Note 4. Post-retirement Medical Plan
The components of the net periodic post-retirement benefit cost for the years ended December 31 were as follows:
2015 2014Service cost $1,157,956 $845,285Interest cost 707,382 646,442Net amortizations 443,844 19,087
Net periodic post retirement benefit cost $2,309,182 $1,510,814
The net periodic postretirement benefit cost was actuarially determined using an assumed discount rate of 4.5% and 4.0% for 2015 and 2014, respectively.
The assumed rate of future increases in healthcare in 2015 was 7.2% and is expected to gradually decline to 5.0% for pre Medicare and Medicare eligible after 2022. The assumed rate of future increases for dental care in 2015 was 6.0% and is expected to gradually decline to 5.0% after 2022.
ICSC contributed and paid as benefits the premiums amounting to $233,327 and $188,473 for the postretirement medical and dental plans for 2015 and 2014, respectively.
ICSC expects to make a minimum contribution to the plan of $287,705 in 2016.
Estimated future benefit payments are as follows:
Year ending December 31: Expected Benefit Payments2016 $287,7052017 354,7922018 408,1392019 473,6182020 530,3702021 – 2025 3,823,803
The effects of the impact of a 1% change in healthcare trend rates are as follows:
2015 2014Effect on total of service and interest cost:
Dollar increase $449,383 $310,967Percentage increase 24.09% 20.85%
Dollar decrease $(346,874) $(246,860)Percentage decrease (18.60)% (16.55)%
Effect on post-retirement benefit obligation: Dollar increase $2,876,250 $3,727,167Percentage increase 18.73% 19.94%
Dollar decrease $(2,303,169) $(2,959,101)Percentage decrease (15.00)% (15.83)%
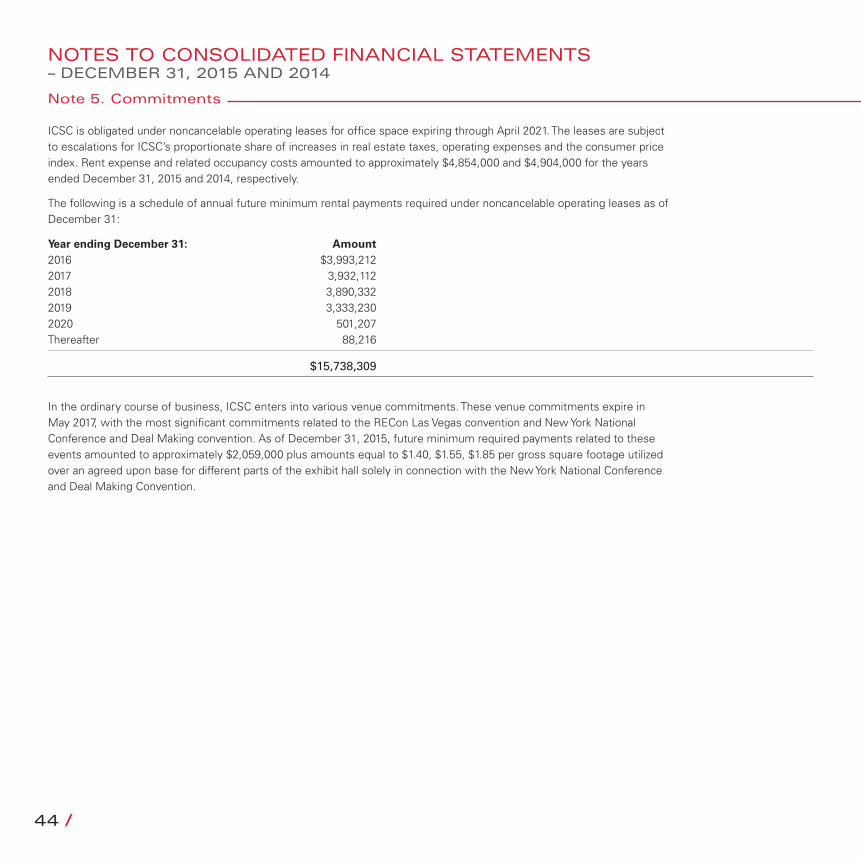
44 / / 45
NOTES TO CONSOLIDATED FINANCIAL STATEMENTS – DECEMBER 31, 2015 AND 2014
Note 5. Commitments
ICSC is obligated under noncancelable operating leases for office space expiring through April 2021. The leases are subject to escalations for ICSC’s proportionate share of increases in real estate taxes, operating expenses and the consumer price index. Rent expense and related occupancy costs amounted to approximately $4,854,000 and $4,904,000 for the years ended December 31, 2015 and 2014, respectively.
The following is a schedule of annual future minimum rental payments required under noncancelable operating leases as of December 31:
Year ending December 31: Amount2016 $3,993,2122017 3,932,1122018 3,890,3322019 3,333,2302020 501,207Thereafter 88,216
$15,738,309
In the ordinary course of business, ICSC enters into various venue commitments. These venue commitments expire in May 2017, with the most significant commitments related to the RECon Las Vegas convention and New York National Conference and Deal Making convention. As of December 31, 2015, future minimum required payments related to these events amounted to approximately $2,059,000 plus amounts equal to $1.40, $1.55, $1.85 per gross square footage utilized over an agreed upon base for different parts of the exhibit hall solely in connection with the New York National Conference and Deal Making Convention.
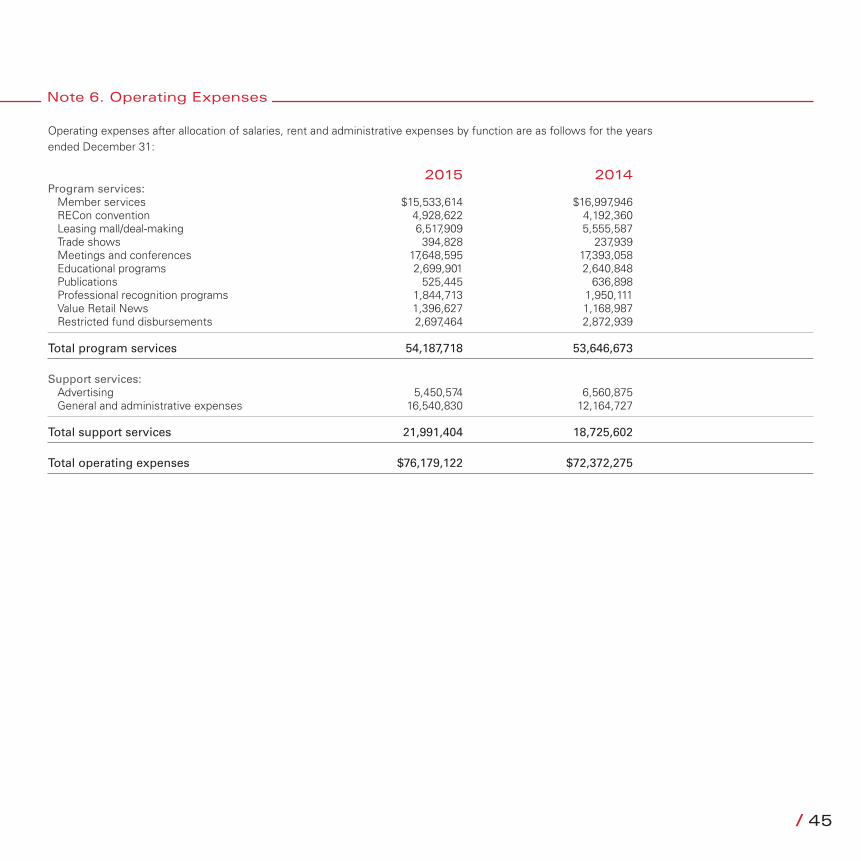
44 / / 45
Note 6. Operating Expenses
Operating expenses after allocation of salaries, rent and administrative expenses by function are as follows for the years ended December 31:
2015 2014Program services:
Member services $15,533,614 $16,997,946 RECon convention 4,928,622 4,192,360 Leasing mall/deal-making 6,517,909 5,555,587 Trade shows 394,828 237,939 Meetings and conferences 17,648,595 17,393,058 Educational programs 2,699,901 2,640,848 Publications 525,445 636,898 Professional recognition programs 1,844,713 1,950,111 Value Retail News 1,396,627 1,168,987 Restricted fund disbursements 2,697,464 2,872,939
Total program services 54,187,718 53,646,673
Support services: Advertising 5,450,574 6,560,875 General and administrative expenses 16,540,830 12,164,727
Total support services 21,991,404 18,725,602
Total operating expenses $76,179,122 $72,372,275
46 / / 47
NOTES TO CONSOLIDATED FINANCIAL STATEMENTS – DECEMBER 31, 2015 AND 2014
Note 7. Cash Surrender Value of Life Insurance
The Council is the sole beneficiary of a life insurance policy on a certain key employee. The cash surrender value of this policy is $3,158,015 and $3,249,373 at December 31, 2015 and 2014, respectively, and is reflected as an asset on the consolidated balance sheet.

46 / / 47

1 /
2015/2016
ANNUAL REPORT
www.icsc.org